Cytolytic Score Current or Reformed (<15 yr) Smoker Never or Reformed (>15 yr) Smoker Current or Reformed (<15 yr) Smoker Never or Reformed (>15 yr) Smoker Immune Infiltration Score Current or Reformed (<15 yr) Smoker Never or Reformed (>15 yr) Smoker T-Cell Infiltration Score p=.066 p=.034 p=.022 Supplemental Figure 1. Clinical Smoking History and Tumor Immune Infiltration. Patient clinical smoking history divided as current or recently reformed smokers (active smoker within last 15 years) vs. never or long-standing reformed smokers (active smoker greater than 15 years prior) correlated with T-cell infiltration (TIS), immune cell infiltration (IIS), and immune cytolytic score (CYT). All box-whisker plots represent values within the interquartile range (IQR) (boxes) and 1.5xIQR (whiskers). Outliers are plotted as values >1.5xIQR (circles) and >3xIQR (stars). All p-values for significance (<.05) represent comparisons via two-tailed t-tests. n=280.

Welcome message from author
This document is posted to help you gain knowledge. Please leave a comment to let me know what you think about it! Share it to your friends and learn new things together.
Transcript
Cyto
lytic
Sco
re
Current or Reformed (<15 yr)Smoker
Never or Reformed (>15 yr)Smoker
Current or Reformed (<15 yr)Smoker
Never or Reformed (>15 yr)Smoker
Imm
une
In�l
trat
ion
Scor
e
Current or Reformed (<15 yr)Smoker
Never or Reformed (>15 yr)Smoker
T-Ce
ll In
�ltr
atio
n Sc
ore
p=.066
p=.034
p=.022
Supplemental Figure 1. Clinical Smoking History and Tumor Immune In�ltration. Patient clinical smoking history divided as current or recently reformed smokers (active smokerwithin last 15 years) vs. never or long-standing reformed smokers (active smoker greater than 15 years prior) correlated with T-cell in�ltration (TIS), immune cell in�ltration (IIS), and immune cytolytic score (CYT). All box-whisker plots represent values within the interquartile range (IQR) (boxes) and 1.5xIQR (whiskers). Outliers are plotted as values >1.5xIQR (circles) and >3xIQR (stars). All p-values for signi�cance (<.05) represent comparisons via two-tailed t-tests. n=280.
Molecular Smoking Signature (Transversions High/Low)
Molecular Smoking Signature (Transversions High/Low)
Molecular Smoking Signature (Transversions High/Low)
HPV(-) HNSCC
HPV(+) HNSCC
HPV(-) HNSCC
HPV(+) HNSCC
HPV(-) HNSCC
HPV(+) HNSCC
T-Ce
ll In
�ltr
atio
n Sc
ore
Imm
une
In�l
trat
ion
Scor
e
Inte
rfer
on-γ
Expr
essi
on S
core
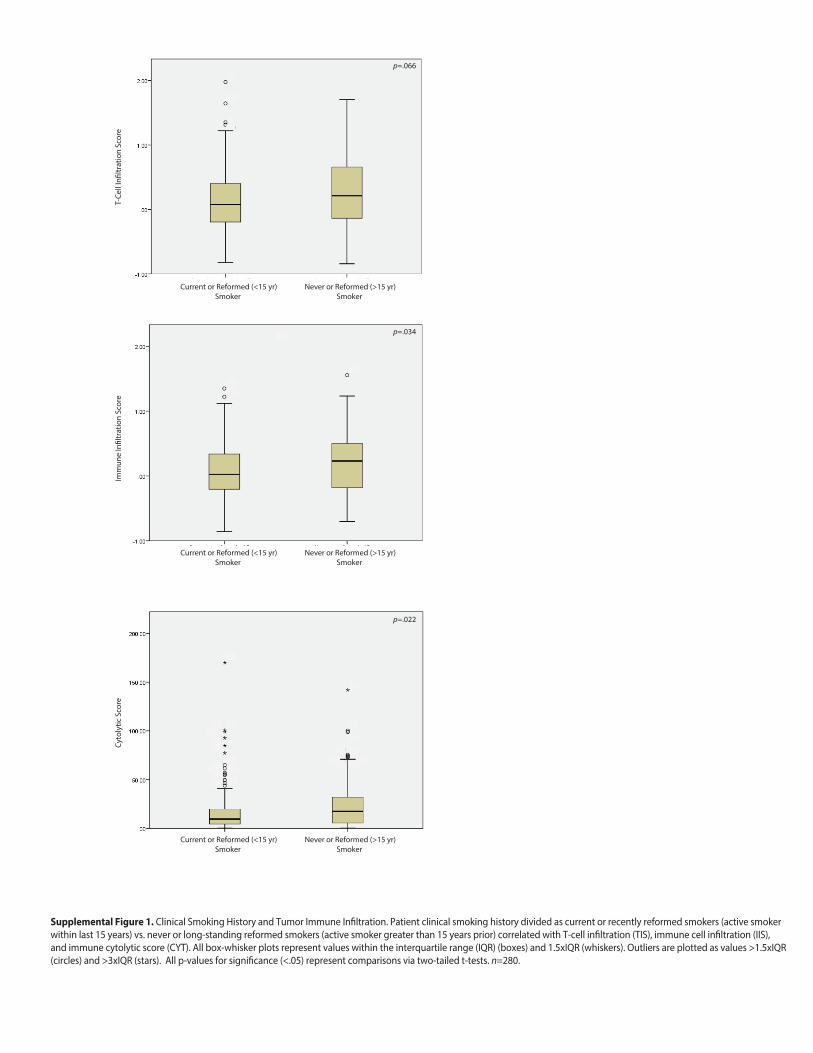
Supplemental Figure 2. Nucleotide Transversion Molecular Smoking Signature and Immune In�ltration. Clinical Smoking History and Tumor Immune In�ltration. T-cell in�ltration (TIS), immune cell in�ltration (IIS), and interferon-γ expression scores correlated with nucleotide transversion high/low molecular smoking signatures in HPV positive and negative HNSCC tumors. All box-whisker plots represent values within the interquartile range (IQR) (boxes) and 1.5xIQR (whiskers). Outliers are plotted as values >1.5xIQR (circles) and >3xIQR (stars). n=280.
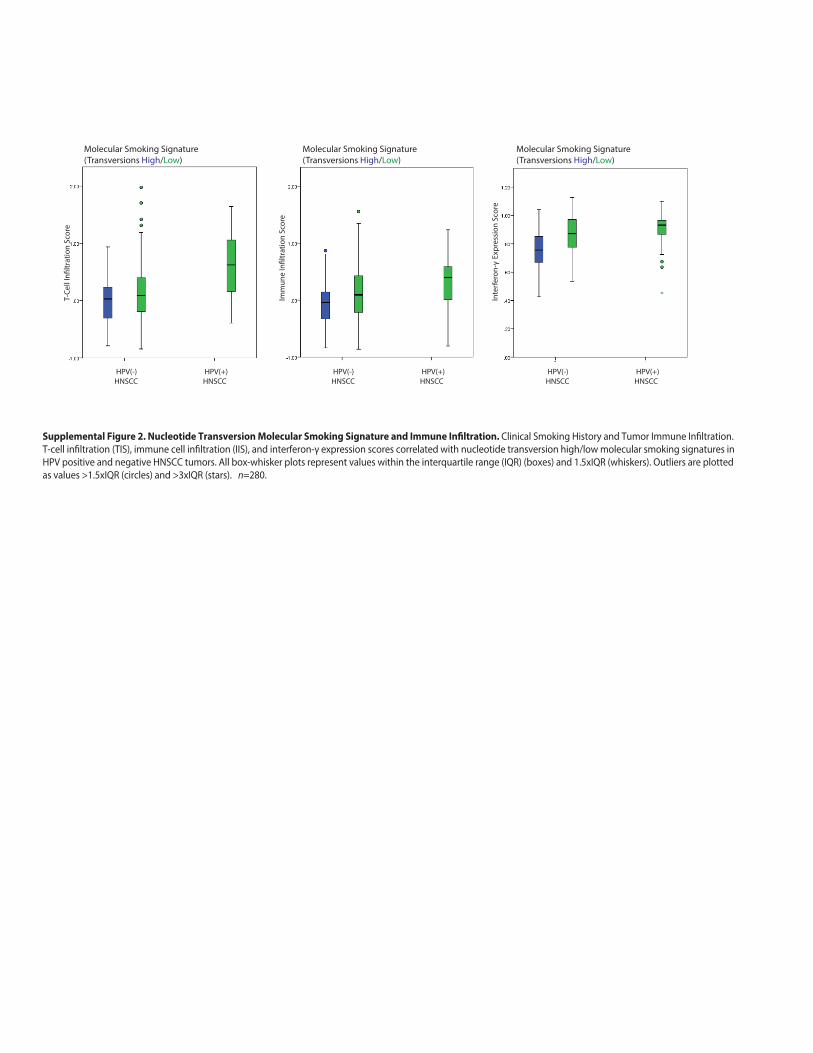
Supplemental Figure 3. Correlations between PD-L1 Expression and Immune In�ltraton and Activation Metrics. Correlations between CTLA-4 gene expression and regulatory T-cell in�ltration. All r values represent Pearson correlation coe�cients. Two-tailed p-values are presented for signi�cance (<.05). n=280.
Rela
tive
CTL
A-4
Gen
e Ex
pres
sion
Relative Treg In�ltration
CTLA-4 Expression vs. Treg In�ltration (HPV+/HPV-)
r=.86p<.00001

Supplemental Figure 4. Correlations between PD-L1 Expression and Immune In�ltraton and Activation Metrics. Correlations between PD-L1 (CD274) expression and T-cell in�ltration (TIS), overall immune cell in�ltration (IIS), interferon-γ expression score, and cytolytic score. All r values represent Spearman correlation coe�cients. Two-tailed p-values are presented for signi�cance (<.05). n=280.
PD-L1 vs. TIS (HPV+/HPV-) PD-L1 vs. IIS (HPV+/HPV-)
PD-L1 vs. INF-γ (HPV+/HPV-) PD-L1 vs. Cytolytic Score (HPV+/HPV-)
ρ=.54p<.00001
Rela
tive
PD-L
1 G
ene
Expr
essi
on
Rela
tive
PD-L
1 G
ene
Expr
essi
on
Rela
tive
PD-L
1 G
ene
Expr
essi
on
Rela
tive
PD-L
1 G
ene
Expr
essi
onT-Cell In�ltration Score Immune In�ltration Score
Interferon-γ Expression Score Cytolytic Score
ρ=.56p<.00001
ρ=.67p<.00001
ρ=.57p<.00001

Supplemental Figure 5. Comparison of CTLA-4 and PD-1 Expression in Normal and Tumor Matched Samples. Gene expression of CTLA-4 and PDCD1 (PD-1) measured byRPKM (Reads Per Kilobase of transcript per Million mapped) of head and neck squamous tumors and patient matched normal tissue controls in 34 patients available from the TCGA HNSCC dataset. n=34. Paired Wilcoxon ranked test, p<.01.
p<.01
Normal Tumor
Paired Tissue Type
CTL
A-4
Gen
e Ex
pres
sion
(RPK
M)
Normal Tumor
Paired Tissue Type
PDCD
1 G
ene
Expr
essi
on (R
PKM
)
CTLA-4 Expression in Normal/Tumor Paired Samples
PD-1 Expression in Normal/Tumor Paired Samples
p<.01

Blad
der
Cerv
ical
/En
dom
etria
l
Pros
trat
e
Lung
Sq
uam
ous
HPV
(-) H
NSC
Mel
anom
a
Brea
st
Thyr
oid
HPV
(+) H
NSC
Kidn
eyCl
ear C
ell
Lung
Ade
no
Non-Synonymous Mutational Burden
Ten Most Immune In�ltrated Tumors
Imm
une
In�l
trat
ion
Sco
re
Supplemental Figure 6. Immune In�ltration and Mutational Burden. Relative median immune in�ltration across the ten most immune in�ltrated tumors in increasingorder including HPV positive and negative HNSCC tumors with corresponding levels non-synonymous mutational burden below.

Years
Cum
ulat
ive
Surv
ival
TIS High-Smoking Signature HighTIS High-Smoking Signature LowTIS Low-Smoking Signature HighTIS Low-Smoking Signature Low
p=.016
Supplemental Figure 7. Impact of T-cell In�ltration and Smoking Status on HPV-Adjusted Overall Survival. Correlations with patient cumulative survival and tumor T-cell in�ltration (TIS) above/below median (high/low) and molecular smoking signature above/below median (high/low). n=280.

T-Cell In�ltration Score
% C
opy
Num
ber A
ltere
d G
enom
e
Immune In�ltration Score
Interferon-γ Expression Score
r= -.44 p<1x10⁻⁴
% C
opy
Num
ber A
ltere
d G
enom
e%
Cop
y N
umbe
r Alte
red
Gen
ome
0.2
0.4
0.6
0.8
1.0
0.2
0.4
0.6
0.8
1.0
0.2
0.4
0.6
0.8
1.0
r= -.46 p<1x10⁻⁴
r= -.51 p<1x10⁻⁴
CNA vs. TIS (HPV+/HPV-)
CNA vs. IIS (HPV+/HPV-)
CNA vs. INF-γ (HPV+/HPV-)
Supplemental Figure 8. Percent Copy Number Altered Genome and Immune In�ltration Metrics. Correlations between copy number alteration (the fraction of a tumor’s genome copy number-altered with log2 copy number ratio <-.2 or >.2) and T-cell in�ltration (TIS), overall immune cell in�ltration (IIS), and interferon-γ expressionscore. All r values represent Pearson correlation coe�cients. Two-tailed p-values are presented for signi�cance (<.05). n=280.

Anatomical Subsite
Supplemental Figure 9. Tumor Purity by Anatomical Subsite. Relative tumor purity and t-cell in�ltration (TIS) strati�ed by head and neck anatomical subsite. Relative tumorpurity quanti�ed with two independent computational tools (SNP6 copy-number based ASCAT and expression-based ESTIMATE) to infer tumor purity. All box-whisker plots represent values within the interquartile range (IQR) (boxes) and 1.5xIQR (whiskers). Outliers are plotted as values >1.5xIQR (circles) and >3xIQR (stars). n=280.
ASC
AT T
umor
Pur
ity S
core
Tumor Purity (ASCAT) by Anatomical Subsite
Anatomical SubsiteES
TIM
ATE
Tum
or P
urity
Sco
re
Tumor Purity (ESTIMATE) by Anatomical Subsite
Anatomical Subsite
ASC
AT T
umor
Pur
ity S
core
Tumor Purity (ASCAT) by Anatomical Subsite (HPV+/HPV-)
Anatomical Subsite
T-cell In�ltration (TIS) by Anatomical Subsite (HPV+/HPV-)
T-ce
ll In
�ltr
atio
n Sc
ore
(TIS
)
Anatomical Subsite

C-class (copy number alteration-dominated)
Cum
ulat
ive
Surv
ival
Years
M-class (mutation-dominated) HR 1.26 p=.024
Supplemental Figure 10. C-class (Copy Number Alteration-dominated) vs. M-class (Mutation-Dominated) Tumors and Patient Survival. Correlations with patient cumulative survival and copy number alteration dominated tumors as compared to mutation dominated tumors. P values for signi�cance (<.05) calculated using multivariable Cox regression analysis. n=280.

−1
−0.8
−0.6
−0.4
−0.2
0
0.2
0.4
0.6
0.8
1CIBER.T.cells.CD8
CIBER.T.cells.CD8
CIBER.T.cells.regulatory..Tregs.
CIBER.NK.cells.activated
CIBER.T.cells.follicular.helper
CIBER.B.cells.naive
CIBER.B.cells.memory
CIBER.Macrophages.M0
CIBER.Neutrophils
CD8.T.cells
Cytotoxic.cells
Treg.cells
NK.CD56dim.cells
Tfh.cells
B.cells
B.cells
Macrophages
Neutrophils
0.47
0.53
0.27
0.35
0.3
0.33
0.33
−0.06
−0.23
0.47
0.53
0.27
0.35
0.3
0.33
0.33
−0.06
−0.23
0.13
0.12
0.32
0
0.19
0.31
0.31
−0.07
−0.27
0.11
0.21
−0.01
0.23
0.04
−0.01
−0.01
−0.14
−0.24
0.29
0.33
0.2
0.14
0.33
0.3
0.3
−0.15
−0.36
0.04
0.03
0.01
−0.07
0.12
0.33
0.33
−0.1
−0.14
0.24
0.15
0.18
0
0.32
0.54
0.54
−0.03
−0.12
−0.27
−0.31
−0.19
−0.15
−0.21
−0.27
−0.27
0.23
0.17
−0.1
−0.1
−0.03
−0.08
−0.11
−0.03
−0.03
0.07
0.41
Immune Cell Score Comparison Groups Pearson r-coefficient p-value (n=242)
CD8+ T-cell vs. CD8+ T-cell (CIBERSORT) 0.47 <0.00001
CD8+ CTL T-cell vs. CD8+ T-cell (CIBERSORT) 0.53 <0.00001
T-Regulatory Cell vs. T-Regulatory Cell (CIBERSORT) 0.32 <0.00001
CD56dim NK Cell vs. Activated NK Cell (CIBERSORT) 0.23 0.0003
Follicular T-Helper Cell vs. Follicular T-Helper Cell (CIBERSORT)
0.33 <0.00001
B Cell vs. Naïve B Cell (CIBERSORT) 0.33 <0.00001
B Cell vs. Memory B Cell (CIBERSORT) 0.54 <0.00001
Macrophages vs. M0 Macrophages (CIBERSORT) 0.23 0.0003
Neutrophils vs. Neutrophils (CIBERSORT) 0.41 <0.00001
Supplemental Figure 11. Correlations between Immune Deconvolution (this Analysis) and CIBERSORT in HNSCC. Correlations demonstrated between immune subpopulation single sample gene set enrichment analysis (ssGSEA) used in this study (vertical axis) and an additional validated immune deconvolution algorithm, CIBERSORT, which uses an independent leukocyte gene signature matrix (LM22) (horizontal axis), using the shared available gene expression data between the two data sets. Pearson r-coe�cient values are depicted in the �gure and table with corresponding p values. n=242.
Related Documents