Annual Report 2009 2009 Year ended March 31,2009 This annual report was printed in Japan with soy-oil-based ink.

Welcome message from author
This document is posted to help you gain knowledge. Please leave a comment to let me know what you think about it! Share it to your friends and learn new things together.
Transcript

Annual Report 2009
2009Year ended March 31,2009
This annual report was printed in Japan with soy-oil-based ink.

JAPAN POST BANK Annual Report 2009 1
With over 130 years of experience in providing the most accessible financial services in Japan, we have become the most “grass-roots” bank among Japan’s leading banks. The trust we have earned from virtually all the nation’s citizens has been cultivated based on our ever-lasting commitment to serve the needs of each and every customer regardless of age, occupation, wealth, and location, and the Group’s extensive network that extends to every corner in the country.
We understand that our customers’ needs and expectations change over time.
Going forward, the only way to keep up with what our customers truly need, we believe, is to carefully listen to each and every customer through close and continuous dialogues. Through these ongoing dialogues, we hope to be able to come up with unique, tailored products and services for our customers and become a trusted partner that they can turn to in the future.

Contents
Financial Highlights 7
Corporate History 8
Message from Management 14
Business Overview 20
Corporate Social Responsibility 29
Corporate Governance 32
Financial Information 41
- Management’s Discussion & Analysis 42
- Financial Statements 64
- Financial Data 88
This publication contains forward-looking statements. Please note that actual developments may differ from suchstatements depending on changes in the management environment.

JAPAN POST BANK Annual Report 20094 5JAPAN POST BANK Annual Report 2009
We make a lifetime
commitment to our
customers, forming
a mutual bond of trust.
Dependability
54

JAPAN POST BANK Annual Report 20096 7
1. Statements of IncomeMillions of yen
Thousands of U.S. dollars
Years ended March 31 2009 2008 2009Gross operating profit: ¥1,746,765 ¥920,548 $17,782,401
Net interest income 1,655,330 871,211 16,851,573
Net fees and commissions 91,096 49,852 927,379
Net other operating income 338 (515) 3,449
General and administrative expenses (excluding non-recurring losses) (1,266,162) (617,738) (12,889,778)
Operating profit (before provision for (reversal of) general reserve for possible loan losses) 480,602 302,859 4,892,623
Ordinary income 385,243 256,171 3,921,854
Net income 229,363 152,180 2,334,960 Notes: 1. All figures, excluding those related to gross operating profit, for the fiscal year ended March 31, 2008 essentially derive banking operations for the six-
month period following privatization on October 1, 2007. In addition, gains and losses (including a net loss of ¥731 million) of the preparatory planning company for privatization during the first half of the fiscal period have been included.
2. Gross operating profit figures for the fiscal year ended March 31, 2008 are for the six-month period from October 1, 2007 to March 31, 2008.
3. General and administrative expenses exclude employees’ retirement benefits (non-recurring losses) and others.
2. Balance SheetsMillions of yen
Thousands of U.S. dollars
As of March 31 2009 2008 2009Total assets: ¥196,480,796 ¥212,149,182 $2,000,211,714
Securities 173,551,137 172,532,116 1,766,783,447
Loans 4,031,587 3,771,527 41,042,326
Total liabilities: 188,301,222 204,072,327 1,916,942,096
Deposits 177,479,840 181,743,807 1,806,778,383
Net assets 8,179,574 8,076,855 83,269,618
3. Key Indicators and Others%
Years ended March 31 2009 2008Net income to assets (ROA) 0.11 0.14Net income to equity (ROE) 2.82 3.85Overhead ratio (OHR) 72.48 67.11Deposit-to-expense ratio 0.70 0.66Capital adequacy ratio (non-consolidated, domestic standard) 92.09 85.90Tier I capital ratio 92.08 85.89Employees 11,675 11,201
Notes: 1. Overhead ratio (OHR) = General and administrative expenses / Gross operating profit x 100
2. Deposit-to-expense ratio = General and administrative expenses / average deposit balances x 100
3. The non-consolidated capital adequacy ratio is calculated based on standards stipulated by Article 14-2 of the Banking Law (Financial Services Agency Notification No. 19, March 27, 2006) for the purpose of determining whether banks have sufficient equity capital given their holdings of assets and other instruments. The Japan Post Bank adheres to capital adequacy standards applicable in Japan.
4. The number of employees excludes Japan Post Bank employees assigned to other companies by the Bank but includes employees assigned to the Japan Post Bank by other companies. The figures do not include short-term contract and part-time employees.
Financial Highlights

JAPAN POST BANK Annual Report 20098 9
The Beginning of Postal Savings Services in Japan
Began money transfers between postal accounts nationwide.
Started postal money order service for overseas remittances.
Commenced postal money order and postal savings services. Began handling overseas mail.
Postal service started. Postal Law drafted by Hisoka Maejima enforced, marking the start of postal services. Japan’s first postal stamp issued. Post boxes set up and service made available to general citizens.
The first ministry for transport and communications established.
U.K.’s Queen Victoria made Empress of India.
Decree banning the wearing of swords issued.
Wright brothers successfully made the world’s �rst piloted and powered airplane �ight.
Constitution of the Empire of Japan promulgated.
Third Republic of France proclaimed.
Bismarck became Minister-President of Prussia (Germany Empire).
Meiji Restoration took place and the last Edo Shogun returned political power to the Emperor.
1860
Event
1870 1880 1890 1900
HistoricalBackdrop
World
Japan
1868
1862
1867 1876 1889
1870German Empire formed.
1871 19031877Paris Exposition held (Eiffel Tower built to mark the 100th anniversary of the French revolution).
1889
1871 1875 1880 1906Postal savings reached ¥100 million.
1908
Postal money order and postal savings services were established in Japan in 1875 by Hisoka Maejima, now known as the founding
father of Japan’s modern postal services.
Prior to implementing a postal system in Japan, Maejima spent time in the United Kingdom to study its long-standing postal
system, which was implemented in 1840. During his studies, he found that the post offices in the United Kingdom were not
involved solely in the postal business but also were carrying out postal money order and savings services. When he returned to
Japan to establish the country’s first postal system, he also introduced postal money order and savings services.
Postal transfer service (also known as the postal giro service), a money transfer service between postal savings accounts, was also
introduced in 1906. After its introduction, further progress, including the development of a national network of post offices and
improvement in service, was made in order to make our banking services more accessible to the Japanese people. Since then, postal
savings services have become increasingly popular in Japan, making Japan one of the countries with largest number of deposit
holders in the world.
Poster advocating saving money for the future
A postal savings bank passbook circa 1875
A lobby where postal savings are being accepted, circa 1890Hisoka Maejima, the founding father of modern postal services in Japan
View of the central postal government office and a map of post offices
A postman in Meiji era (far right)
Corporate History

JAPAN POST BANK Annual Report 200910 11
Road to PrivatizationAdministrative Reforms and Postal ServicesUntil recent years, post offices have provided postal money orders, savings, and transfer services (collectively, “postal savings
services”), together with traditional mail and postal life insurance businesses as the three main public businesses. Government
bodies managing and operating these post offices have gone through various changes over the years.
In 2001, the Japanese government reorganized its ministries and agencies to make the system more simple, transparent, and
efficient. Also, the Postal Services Agency was established as an external agency to actually carry out the postal services
business. On April 1, 2003, the government reorganized the Postal Services Agency into a public corporation called Postal
Public.
1945 2010 2020
as of March 31, 2009 by September 30, 2017
Full privatization(plan)
Privatization (Transition) PeriodPublic Corporation Period
Japanese Government
Ownership of all shares
Ownership of all shares
Ownership of all shares
Ownership of all shares Ownership of all shares
Japan Post Bank Co., Ltd. Japan Post Service Co., Ltd.Japan Post Insurance Co., Ltd.
Commissioned Operations Agreement(Banking Business Agency Contract)
Commissioned Operations Agreement(Insurance Business Agency Contract)
Commissioned Operations Agreement(Commissioning of counter operations, such as sales of stamps, etc.)
Japan Post Holdings Co., Ltd.
Japan Post Network Co., Ltd.
Post OfficesPost Offices
Japanese Government
Ownership of more than one-third of all shares
Ownership of all shares
Ownership of all shares
Japan Post Bank Co., Ltd. Japan Post Service Co., Ltd.Japan Post Insurance Co., Ltd.
Commissioned Operations Agreement(Banking Business Agency Contract)
Commissioned Operations Agreement(Insurance Business Agency Contract)
Commissioned Operations Agreement(Commissioning of counter operations, such as sales of stamps and postcards and acceptance of postal packages and courier mail)
Japan Post Holdings Co., Ltd.
Japan Post Network Co., Ltd.
Branches BranchesBranches Branches
Postal savings reached¥10 billion
1949
¥1 trillion
1960
¥100 trillion
1985 Japan Post Bank Co., Ltd. and other three operational companies related postal services established.
2007 A public corporation, Postal Public,established.
2003
2000
Apollo 11 mission landed on moon.
1969Introduction of the Euro decided under the Maastricht Treaty.
1992Barack Obama, the �rst African-American president, inaugurated.
2009Cold War ended.
1989
The Constitution of Japan made public.
HistoricalBackdrop
World
Japan
1946The Emperor Showa, Hirohito, passed away. The Emperor Heisei, Akihito, ascended the imperial throne.
1989
The Koizumi Administration, after its inauguration in 2001, unveiled a new economic reform policy called “Structural Reform
of the Japanese Economy: Basic Policies for Macroeconomic Management.” One of the major focuses of the policy was reform
of national investments and loans. Privatization of postal services was identified as one specific measure in bringing forward the
reformation. The underlying concept of the privatization was “whatever that can be done by the private sector should be done
by the private sector.”
In January 2006, under the Postal Service Privatization Law (publicly announced in October 2005), Japan Post Holdings Co.,
Ltd. (“Japan Post Holdings”) was separately founded to prepare and plan for the privatization of postal services. In October
2007, Postal Public transferred its businesses to four separate companies, Japan Post Network Co., Ltd., Japan Post Service Co.,
Ltd., Japan Post Bank Co., Ltd., and Japan Post Insurance Co., Ltd., under the unbrella of Japan Post Holdings.
The Postal Service Privatization Law also requires Japan Post Holdings to dispose of all of its shares in Japan Post Bank and
Japan Post Insurance over a 10-year period running from October 1, 2007 to September 30, 2017.

JAPAN POST BANK Annual Report 200912 13
Life is constantly changing.
We always strive to fully
understand those changes and
to be able to appropriately meet
our customers’ changing needs
going forward.
Innovation
JAPAN POST BANK Annual Report 2009 1312

JAPAN POST BANK Annual Report 200914 15
Withstanding the Recent CrisisThe subprime mortgage crisis was becoming a serious problem just as Japan Post Bank entered its privatization process. The financial and economic climate suddenly changed drastically from what we had originally been expecting. We believe, however, that this financial crisis has only helped us prove the capability of our business model and highlight our commitment to safe and reliable investments.
We suffered no losses from investments in subprime-related securitized products, and the non-performing loan ratio of our relatively small corporate loan balance remained at zero. Even after the collapse of Lehman Brothers and other subsequent defaults both in Japan and globally, we had no direct exposure to losses because none of our investments were linked to any bankrupt firms. Although we were exposed to sharp declines in stock prices, causing us to report losses of ¥100.2 billion from money held in trust, stringent risk management and diligent investment processes have prevented Japan Post Bank from being seriously damaged by the market and economic downturn. Emerging from the financial crisis as one of the least affected banks has enabled us to demonstrate two qualities we highly value: “security” and “dependability.” By withstanding this tough financial environment, we believe we have been able to reaffirm the soundness of the Bank’s operations and strength of its business model in a socio-economic infrastructure.
Commitment to Our Historical Mission and Expanding Our Future RoleEven after a full privatization, we believe that there will be no change in our historical mission as a financial institution that provides basic financial services to nationwide customers. Through secure and reliable investments, the Bank will continue to maintain a sound financial base and high quality of earnings. Our extensive, nationwide network of approximately 24,000 post offices will ensure convenience for our customers as it has for the past 130 years.
We would like to, however, go far beyond expectations and further expand our future roles. As we move into the private sector, we will make efforts to remove restrictions on our business from our previous existence as a public institution, in which we were not able to provide full banking services to our customers. We hope to be able to offer even wider services that are better suited to our customers’ needs.
We believe that this commitment to our historical mission and future growth will enhance our corporate value and further improve our presence in Japan.
Message from Management
Koji Furukawa Chairman & CEO
Shokichi Takagi President & COO

JAPAN POST BANK Annual Report 200916 17
Recent Developments – Implementation of Key Strategies
Efforts to increase depositsPreviously, our deposit levels had been falling by about ¥10 trillion annually. Being in the public sector, we had avoided running campaigns and putting pressure on the private sector.
But now, as we transition into the private sector, we have started to run interest and pension marketing campaigns. This has helped us to secure fixed deposits, slow down the rate of decline, and bring deposit levels back to an almost stable state. We look at this trend positively and will continue to campaign and make other efforts to attract deposits in the year ended March 31, 2009.
Since January 5, 2009, we have joined the Zengin Data Telecommunication System, Japan’s major payment and inter-bank settlement system for depository institutions. The system has enabled Japan Post Bank to make fund transfers with other financial institutions that are members of the Zengin System. Many of our customers have already found it convenient to use this service, which we believe contributes to enhancing our corporate value.
Start of new businessesWe have expanded our business portfolio to include loan intermediary services, credit card issuance (JP BANK CARD), and sale of variable annuities for individuals. We intend to continue to expand our business portfolio to better cater
to customer needs. We received approval to participate in syndicated loans and began providing credit to major corporations in January 2008. As a result, the outstanding balance of syndicated loans and loans purchased on secondary markets substantially increased by ¥582 billion in fiscal 2008.
Diversification of our investment strategiesWe set investment strategies to achieve consistent income and
to hedge interest rate and other risks. Specifically, in terms of securities investments, we reduced allocations to Japanese Government Bonds and increased investments in corporate bonds and other securities; in our loan portfolio, we reduced the amount of institutional loans (i.e., loans to local public
agencies) while increasing the amount of syndicated loans. Going forward, we will continue to gradually
diversify our investment strategies to establish a more stable profit structure that can consistently generate income within appropriate risk levels.
Looking AheadAlthough Japan is facing an ageing society and a maturing economy, Japan Post Bank is well-positioned for growth in that it is well-known among senior citizens and ready to seek and develop new markets. Once completely privatized and after all legacy restrictions from when the Bank was government-owned are finally lifted, the Bank will have more flexibility to look for potential new businesses and opportunities.
At the same time, we realize the importance of our historical role in the public sector. We interpret the large amount of savings deposited by our customers until now as a sign of trust. We would like to reward their trust in the Bank by exceeding their expectations while at the same time appropriately managing risks. To accurately understand their needs, we will make full efforts to engage in direct and frequent dialogues. Based on those communications, we will introduce a robust array of securely managed products and services in which our customers can have full confidence.
We also believe that it is necessary to shift the awareness and mindset of our employees as we transform into a private corporation. We will implement measures to further improve profitability and reduce costs that are more in line with our customers’ perspectives.
Our responsibility and commitment extend to all other current and prospective stakeholders. The best way to meet their expectations, we believe, is to commit to our historical mission as a secure and dependable bank and our unique 130-year business model that has withstood many difficult economic times. To further improve beyond our stakeholders’ expectations, we will explore future opportunities. In response to the trust that we have established until now and to further trust-based relationships, we will continue to engage in ongoing dialogues with all current and future stakeholders.

JAPAN POST BANK Annual Report 200918 19
We are responsible for
providing products
and services to our
customers in an efficient
and timely manner.
Efficiency
JAPAN POST BANK Annual Report 2009 1918

JAPAN POST BANK Annual Report 200920 21
At March 31, 2008
Year 2008
Household Financial AssetsAt approximately US$15.8 trillion (¥1,433.5 trillion), Japan’s household financial assets are
the second largest in the world after the United States (US$40.8 trillion), Germany (US$6.2
trillion or €4.4 trillion), the United Kingdom (US$5.4 trillion or £3.7 trillion), and France
(US$4.8 trillion or €3.5 trillion). (as of December 31, 2008)
Cash and deposits represent approximately 55% of Japan’s household financial assets,
an extremely high level even by international standards. It has been said for many years
that Japan is making the shift from savings to investments, but in actual fact there are no
significant signs of such a shift happening.
Looking at individual deposits in Japan by type of bank, Japan Post Bank’s dominant presence
in the market is signified by its 25% share. This overwhelming share of individual deposits
can be seen as a sign of the 130 years of history behind the postal savings system and the high
degree of trust built up with depositors over the years.
Others11.0%
Credit unions and associations
15.6%
Japan Post Bank25.0%
Regional banks25.3%
Trust banks3.3%
Major city banks (8 banks)19.8%
¥727 Trillion
Cash and deposits Bonds Investment trusts Stocks and other equities Insurance and pension Others
0.0 20.0 40.0 60.0 80.0 100.0(%)
United States
France
United Kingdom
Germany
Japan 55.2
39.5 6.9 11.3 7.8 28.6 5.9
15.0 9.2 11.8 31.9 28.0 4.0
32.21.1
3.6 8.4 51.2 3.7
31.01.8
7.8 14.3 39.8 5.2
3.16.1 28.0 4.33.3
‣Asset Allocation of Household Financial Assets by Country
‣Japanese Household Deposits Held by Financial Institutions
Source: Bank of Japan “Flow of Funds,” FRB “Flow of Funds Account,” ONS “United Kingdom Economic Accounts,”
Deutsche Bundesbank “Households’ financial assets and liabilities 1991-2008,” Banque de France “Financial Accounts”
Source: Bank of Japan “Flow of Funds,” The Japan Financial News “Annual Report 2009”
Business Overview
Hokkaido RegionBranches: 5Post offices: 1,479ATMs: 1,680
Tohoku RegionBranches: 10Post offices: 2,554ATMs: 2,275
Chubu RegionBranches: 34Post offices: 4,696ATMs: 4,744
Chugoku RegionBranches: 11Post officess: 2,217ATMs: 2,165
Shikoku RegionBranches: 6Post offices: 1,150ATMs: 1,156
Kyushu RegionBranches: 13Post offices: 3,406ATMs: 3,081
Okinawa RegionBranches: 1Post offices: 200ATMs: 246
Kinki RegionBranches: 44Post offices: 3,412ATMs: 4,046
Kanto RegionBranches: 110Post offices: 4,738ATMs: 6,743
At March 31, 2009‣Japan Post Bank's National Network
Japan Post Bank:
234 branches, 23,852 post offices,
Total 24,086 outlets
and 26,136 ATMs
At September 30, 2008
Other Banks Branches Sales Agency Offices TotalMajor city banks (8 banks) 2,539 963 3,502Regional banks (109 banks) 10,703 593 11,296Trust banks (7 banks) 292 194 486Credit unions (279 banks) 7,679 — 7,679Credit associations (164 banks) 1,812 — 1,812Total 23,025 1,750 24,775Source: Japanese Bankers Association “Nationwide bank data”
Note: The number of post offices above refers to those having a banking agency function.
Note: Figures are based on publicly released data and hearing results.
‣Reference

JAPAN POST BANK Annual Report 200922 23
Our Nationwide Network—ATMs and Internet Banking
Japan Post Bank has the nation’s largest ATM network with 26,136 machines spread
throughout the country. Our goal is to make ATMs easy for anybody to use, and we have
already received positive feedback from our customers.
Aiming for the Most User-Friendly ATMsOur ATMs are designed to be at a comfortable height with ramps for our customers in
wheelchairs and have Braille operating instructions, keyboards, and ATM cards for our
visually impaired customers. Also, through interphones attached to the ATMs or earphones,
customers are able to receive instructions and information on operations, remittance amounts,
or account balances.
Providing Convenience for Foreign VisitorsWe accept foreign credit and ATM cards for visitors to be able to conveniently take out local
currency. Moreover, operating instructions are available in English, making it easy for foreign
visitors to use the machines.
Accepted cardsVISA, VISAELECTRON, PLUS, MasterCard, Maestro, Cirrus, American Express, Diners
Club, JCB, China Unionpay
Highly Convenient ATMsWe provide document readable ATMs, which enable our customers to make payments using
handwritten information to remittees, which is an unique service in Japan. Nationwide access
also makes ATMs a highly convenient service.
INTERNET BANKING Boosting Customer ConvenienceBased on its lack of time and space restrictions, we consider Internet banking to have the
potential to supplement or replace our branches, agency offices, and ATMs in the future. We
intend to progressively enhance the functions and convenience of these Internet services,
which many of our customers already enjoy using.
Our Nationwide Network —Japan Post Bank’s Branches and Post Offices
BRANCH NETWORK Extending Throughout JapanJapan Post Bank has a total of 24,086 outlets, comprising 234 branches and 23,852 post
offices spread throughout Japan. At the end of March 2009, the banking network was also
providing customers with services through 26,136 ATMs. The post offices are operated by
Japan Post Network Co., Ltd., a member of the Japan Post Group. Located throughout the
length and breadth of Japan and closely connected to people’s daily lives, we commission
these post offices to handle bank agency operations.
ADMINISTRATION SERVICE CENTERS Reducing the Burden of Back Office Operations at OutletsOur administration service centers provide data processing services for the administrative
functions of our outlets. The centers check and organize the many documents used by our
branches and post offices, issue and renew bank passbooks and ATM cards, input direct
deposits of employee wages and automatic transfer data, and compile settlement and
statistical data. Playing an important role in reducing the burden of back office operations of
all our outlets, we currently have 11 administration service centers.
OPERATION SUPPORT CENTERS Contributing to Quality Control and Improvement of Agencies’ OperationsWe have 49 operation support centers set up throughout Japan. Their primary responsibility
is to provide support in maintaining and improving the quality of each agencies’ operations.
In addition to responding to inquiries about administrative processing methods from agencies
the centers keep track of agencies’ administrative processing and provide guidance. We have
made 13 of our operation support centers regional representatives responsible for managing
the centers in their areas.
COMPUTER CENTERS Managing Transaction ProcessingWe have two computer centers that provide online services in real time such as storage of
transaction data and interest calculations. As part of our business contingency plan, we have
a backup center in a different location to prevent interruption of service during a major
earthquake or similar events.

JAPAN POST BANK Annual Report 200924 25
Developing Our Retail Business ModelBy taking advantage of the nationwide network of post offices, Japan Post Bank aims to
offer comprehensive financial services to a wide range of individuals, thereby achieving a
retail business model that makes us “the most convenient and dependable bank in Japan.”
Our business model is structured to achieve stable growth through our main interest income
business and our recently launched non-interest income business. Our interest income business
is founded on the secure and careful investment of customer deposits and our non-interest
income business provides an enhanced range of financial products and services to meet the
diverse needs of our customers.
Interest Income BusinessHeavily Weighed in Our Business PortfolioInterest income accounts for 95% of the Bank’s earnings as of March 31, 2009 and is an
overwhelming part of our business portfolio. Most of our interest income comes from
investments in Japanese Government Bonds.
In order to ensure sound business management and stable, periodic income, we understand
that an investment model that controls interest rate risks and diversifies business risks and
revenue sources is important. To achieve this, we believe we need to diversify investments,
further improve risk management, and introduce a more-advanced asset liability management
(ALM) system. We are taking measures such as forming partnerships with asset management
companies, recruiting and training skilled employees, and maintaining an advanced IT
infrastructure.
Investment Diversification and Further Improvement of Risk ManagementAs its operating policy, the Bank carefully controls risk while achieving earnings. More
specifically, under reasonable interest rate scenarios with existing liabilities considered, we
appropriately manage the duration of invested assets and hedge interest rates through swaps
and other financial instruments in order to ensure a stable interest rate spread between assets
and liabilities. Also, in addition to investing in Japanese local government bonds, corporate
bonds, yen-denominated foreign bonds (samurai bonds), and syndicated loans, we are starting
to invest in investment trusts in order to diversify risks and revenue sources.
To better address risks, particularly market risks, we are also improving ways to measure and
manage risk.
More Advanced ALM SystemAs of March 31, 2009, 88% of the Bank’s assets are composed of securities. Japanese
Government Bonds, corporate bonds, and Japanese local government bonds account for 90%,
6%, and 4% of securities, respectively. While managing our asset composition, we are seeking
to further diversify risk and revenue sources while applying different investment methods
and carefully controlling exposure to interest rate risk. At the same time, our ALM system
manages the overall asset and liability portfolios, ensuring stable periodical income and
comprehensively managing market fluctuation risk, in order to improve equity value and gain
market and customer confidence.

JAPAN POST BANK Annual Report 200926 27
Non-Interest Income BusinessApproximately half of the Bank’s non-interest income is generated by commissions on
fund transfers and the rest mostly comes from ATM transaction fees from the use of our
machines by non-customers. Other non-interest income businesses include sales of Japanese
Government Bonds, investment trusts, and variable annuities and intermediary services of
mortgage loans. Many of these businesses are new and have only been approved since the
start of the Bank’s privatization process.
We have strived to recommend portfolios that cater to our customer needs and are appropriately
suited to our customers’ risk tolerance, emphasizing our fundamental investment styles focused
on “longevity,” “diversification,” and “accumulation.” Although Japan has experienced a major
drain of capital from cancellations and redemptions in the open-ended equity investments market
excluding Exchange-Traded Funds (ETFs) since the “Lehman Shock” of September 2008, Japan
Post Bank has consistently maintained cash inflows since the Bank first started its investment
trust sales business in October 2005 until the end of March 2009.
Going forward, we will strive to expand and enhance our non-interest income products and
services in response to our customers’ needs.
New Businesses —Approved During Privatization Process
New businesses approved or started after Japan Post Bank entered the privatization process in
October 2007 are as follows:
New Investment Methods Approved in December 2007• Syndicated loans (participation type) and loans to special purpose companies (SPCs)
▷ Initiated syndicated loans (participation type) in January 2008
• Dealing of public bonds
• Buying and selling of trust beneficiary certificates, equities, and other instruments
▷ Began purchasing trust beneficiary certificates of asset backed securities in March 2008
▷ Started acquiring investment trusts (yen-denominated) in September 2008
▷ Commenced purchasing non-listed foreign bonds in February 2009
• Buying and transferring of credit assets
▷ Initiated purchasing of credit assets in February 2008
• Trading of interest rate swaps and interest rate futures transactions
▷ Began interest rate swaps transactions in February 2008
• Trading of reverse repos
▷ Commenced reverse repo transactions in June 2008
New Retail Products and Services Approved in April 2008• Credit cards
▷ Launched in May 2008
• Agency business of sales of life insurance products such as variable annuities for individuals
▷ Launched in May 2008
• Intermediary services of mortgage loans, specific-purpose loans, and card loans
▷ Launched in May 2008

JAPAN POST BANK Annual Report 200928 29
Corporate Social ResponsibilityJapan Post Bank seeks to become “the most convenient and dependable bank in Japan” and
is committed to offering universal services to everyone, contributing to society and regional
communities, and protecting the environment.
Offering Accessible Services to EveryoneAt Japan Post Bank, we have enhanced our facilities to better accommodate our senior
and physically challenged customers. For customers who are unable to physically visit the
branches or post offices, we have made it possible so that pensions and other payments can be
directly submitted to their homes.
For persons with disabilities, we have savings accounts with preferential interest rates as well
as other benefits. All of our ATMs have built-in voice speakers and Braille keyboards so as to
make them user friendly for the blind. We also have Braille versions of our ATM cash cards,
savings books, and other statements.
Contributing to Society and Regional CommunitiesAs a part of our social contribution activities, we allow money transfers of natural disaster
donations free of charge. In fiscal 2008, 71,640 donations totaling ¥1,041 million were made
through this service.
Utilizing 20% of our customers’ interest (after-tax) from savings, the “Japan Post Bank
Deposits for International Aid” has been set up to support non-governmental organizations
(NGOs) and other charitable organizations in reducing poverty and improving quality of life in
developing countries.
We regularly hold a “piggy bank contest,” where children create their own piggy banks, and
encourage children to gain an interest in saving money. Started in 1975 to celebrate the 100th
anniversary of Japan’s postal savings services, the contest was held for the 33rd time in 2008,
receiving 802,194 entries from 12, 948 elementary schools throughout Japan. In the previous
contest, we donated ¥30 for each contest entry submitted, or a total of ¥24,065,820, to the
Japan Committee for UNICEF in the hopes that this donation would give Japanese children
the opportunity to become more aware of the living conditions of children of their own age in
developing countries and to think about international charitable activities.
In addition, as a community-based bank, we actively participate in local cleanups and other
community events.
Protecting the EnvironmentJapan Post Group has formulated an “Environmental Vision” that identifies global warming
and sustainable forests as two key environmental issues to be addressed as a Group. We have
implemented a variety of energy conservation measures, participated in “Team Minus 6%” (a
national project to achieve a 6% reduction in greenhouse gas emissions), participated in tree-
planting activities, and actively promoted other initiatives that contribute to the reduction of
greenhouse gas emissions, such as by using electric vehicles.
Improvement of Business ModelEfforts to Improve Customer Satisfaction LevelsJapan Post Bank has transformed its operational business model in order to effectively respond
to customer needs and to ensure this model is appropriately suited to the ever-changing
business environment.
The Bank is guided by the management philosophy of becoming “the most convenient and
dependable bank in Japan,” listening to customer feedback while striving on a daily basis to
raise the level of customer satisfaction.
Applying Customer Feedback to the Business ModelJapan Post Bank has a system that manages overall customer feedback, shares this information
within the company, and analyzes such customer input to improve the business model
accordingly.
‣Approach to Raising Customer Satisfaction Levels
Head Office
Customer evaluation Review for improvement
Improvement measures Executive Committee
Database
Branches Call center Customer Feedback Cards
Japan Post NetworkPost offices
Customers
Tree-planting activity
Piggy bank contest prize-winning works
Corporate Social Responsibility

JAPAN POST BANK Annual Report 200930 31JAPAN POST BANK Annual Report 200930
We value your expertise –
and provide you with ours.
Together we can make the
world a better place.
Expertise
31

JAPAN POST BANK Annual Report 200932 33
Corporate GovernanceJapan Post Bank adopts the “company with committees system” for faster decision-making
and improvement of management transparency. Three statutory committees have been
established, namely, the Nomination Committee, the Audit Committee, and the Compensation
Committee, so that the committees and the Board of Directors together provide reliable
oversight of the management of the Bank.
Board of Directors and Three Statutory Committees Japan Post Bank’s Board of Directors, which monitors and makes the final operational
decisions, is comprised of six directors. Two of the directors also serve as executive officers
and the other four directors are external directors. A majority of directors sitting on the three
statutory committees set up under the Board are external directors, and these three statutory
committees oversee the Bank’s operations together with the Board.
Representative Executive Officers, the Executive Committee, and Four Special Committees The Executive Officers, who are selected by the Board of Directors, are responsible for
conducting business operations.
Representative Executive Officers, namely, the CEO and the COO, conduct business
operations by making full use of their authority and responsibility delegated by the Board
of Directors. Discussions on important business execution matters are held by the Executive
Committee, acting as an advisory body to the Representative Executive Officers. To assist
the Executive Committee regarding subjects requiring specialized discussions, there are the
Compliance Committee, the Risk Management Committee, the Asset Liability Management
(ALM) Committee, and the Corporate Social Responsibility (CSR) Committee.
Business Management and Operational Execution
Shareholders’ Meeting
Board of Directors Representative Executive Officers Internal Audit Division
Audits
Audit Committee Office
Nomination Committee
Compliance Committee
Risk Management Committee
ALM Committee
CSR Committee
Investment Division
Corporate Service Division
Corporate Staff Division
Compliance DivisionExecutive Committee
Compensation Committee
Audit Committee
Marketing Division
Management Supervision
‣Corporate Governance Structure

JAPAN POST BANK Annual Report 200934 35
Risk ManagementBasic Policy Towards Risk ManagementAs risk management in financial institutions becomes increasingly important, Japan Post Bank
positions risk control as a top management priority. In order to better monitor and control
various risks, the Bank is taking steps to continually improve its risk management systems.
Our fundamental risk management policy is to utilize capital productively by managing risk
appropriately based on our management strategies and the characteristics of individual risk
categories. Our policy objective is to enhance corporate value while preserving the Bank’s
financial soundness and the appropriateness of business activities. We divide our risks into
the five categories of market risk, market liquidity risk, funding liquidity risk, credit risk,
and operational risk, thereby better facilitating risk management, allowing us to analyze risks
in a quantitative manner, and to assess those risks in qualitative manner in line with each
category’s respective characteristics.
We also have established a framework of effective “checks and balances” functions for
our risk management organization. This system is designed to prevent conflicts of interest
within the organization while giving adequate authority and responsibility to executives and
employees.
Risk Management MethodsWe employ an integrated risk management method to monitor and control risks in a
quantitative manner. Our system measures and aggregates different risks associated with
our business activities and ensures that the aggregate total of those risks does not exceed the
maximum of management’s prescribed limits on the Bank’s capacity to handle risks. At the
Bank, this process involves determining a limit for the total risk amount in light of the Bank’s
equity capital, and sub-dividing that amount into smaller units of risk capital allocated in
accordance with each of the five prescribed risk categories and the characteristics of business
operations. The allocation of risk capital is determined by the Representative Executive
Officers, namely, the CEO and the COO, following discussions among the ALM Committee
and the Executive Committee. The actual calculation of market and credit risk is performed
using a value at risk (VaR) model, which provides a uniform measuring system that ensures
objectivity and consistency across different risks. VaR is a statistical method that estimates the
possible maximum loss amount that assets or liabilities may incur over a given period of time.
We also review and analyze risks in a qualitative manner to reflect management’s views and
market conditions in quantitative risk management measures.
Risk Management OrganizationOur risk management departments and offices, which are independent of our front office
departments, carry out daily risk monitoring and management and regularly report on the
status of risk management to the Board of Directors, the Executive Committee, and its
advisory committees (the ALM Committee and the Risk Management Committee). These
advisory committees discuss risk management policies and systems. Whenever a new product
or business process is introduced, the Bank conducts a risk investigation in advance to
establish a suitable risk management system.
Stress TestingBecause VaR calculations are based on historical data, the model does not properly reflect
risk under conditions of extreme market volatility or when the underlying assumptions are no
longer valid. For this reason, we periodically conduct stress testing to determine the magnitude
of losses that could result from market volatility exceeding the range of assumptions used by
our VaR model. These stress-testing results are reported to the ALM Committee and other risk
management-related organizations. We run multiple scenarios for each risk category in our
stress testing, including the largest fluctuations in financial markets or the highest loan default
rates experienced over the past decade.
Back TestingIn recognition of the limitations of our risk measurement model, we regularly conduct back
testing against historical data to confirm the continued validity of the risk model. The results
of these tests are periodically reported to the Executive Committee, ALM Committee, and
Risk Management Committee.
Basel IIThe Basel Committee on Banking Supervision of the Bank for International Settlements
originally established its international standard for capital adequacy regulations to ensure the
overall soundness of banks. This standard was later revised to make capital requirements more
sensitive to the actual risks that banks face, resulting in a new capital adequacy framework
called Basel II. Japanese banks adopted this revised capital adequacy framework at the end of
March 2007.
The Basel II Accord is built on three pillars: minimum capital adequacy ratio requirements,
internal and regulatory agency reviews, and additional information disclosure rules. Japan
Post Bank complies with all provisions of Basel II.
Of the various methods permitted under Basel II for the calculation of the capital adequacy
ratio, Japan Post Bank uses the standardized approach to determine credit risk-weighted
assets and provides a measurement of operational risk using the basic indicator approach. In
calculating the capital adequacy ratio, the Bank excludes a figure for market risk based on a
special exemption.

JAPAN POST BANK Annual Report 200936 37
Risk Management SystemsMarket RiskJapan Post Bank manages market risk using a system that reflects the characteristics of our
business activities and risk profile. The major features of our operations are that market
investments (Japanese Government Bonds) comprise the principal component of our assets
while TEIGAKU deposits (our main product: longest deposit maturity is 10 years and can be
withdrawn after 6 months) account for the large part of our liabilities.
Our market risk management system begins by estimating market risk using a VaR statistical
approach. We then assess that risk estimate with the boundaries set by the total risk capital
allocated to market risk as determined by our equity capital and other indicators of our
financial resources. We do so by establishing, monitoring, and managing ceilings on market
risk, losses, and other items.
We also have a process for appropriately monitoring interest rate risks from many
perspectives, including those beyond statistical estimates. Our methods include running
earnings simulations for a variety of scenarios and stress testing to prepare for sudden market
movements that exceed the assumptions of our statistical model.
Market Liquidity RiskJapan Post Bank monitors the quality of portfolio assets and market conditions and takes
appropriate actions to ensure adequate market liquidity management.
Funding Liquidity RiskOur principle for funding liquidity risk management consists of a two-pronged approach
to ensure the Bank’s funding needs are met. First, we constantly monitor the funding
environment, responding to changes as required in a timely and appropriate manner.
At the same time, we maintain an appropriate level of liquid assets at all times as a reserve for
unexpected cash outflows and other events.
To secure stable cash flows, we also monitor and analyze our cash flows using cash
management indicators and other measurements. Furthermore, we have established the three
operating phases of “normal,” “concerned,” and “emergency” in accordance with the status of
cash flows and trends in fund procurement, and have further laid out the major procedures to
follow during “concerned” and “emergency” phases.
Credit RiskJapan Post Bank uses the VaR method to estimate credit risk. We establish, monitor, and
manage credit risk, credit extension, and other limits to maintain credit risk within its assigned
risk capital determined in accordance with our equity capital and other indicators of our
financial resources. Moreover, we perform stress testing to be prepared for any deterioration in
the creditworthiness of borrowers that may result from a major change in economic conditions
that exceeds our statistical assumptions.
To avoid excessive concentrations of credit risk within our loan portfolio, we establish credit
limits for individual companies and corporate groups and review them during every fiscal
period. We will continue to further upgrade the risk management methods for our loan portfolio.
Operational RiskJapan Post Bank subdivides operational risk into seven categories: processing risk,
information systems risk, information property risk, legal risk, human resources risk, tangible
assets risk, and reputational risk. Our approach to managing these operational risks and
maintaining sound operations is to identify, evaluate, control, monitor, and mitigate risks in
each category. The risk management process encompasses identifying risks associated with
business operations and assessing them based on the frequency of occurrence and the severity
of their impact on operations. We establish controls suitable to our assessments, monitor risks,
and take actions as required.
We regularly implement Risk & Control Self-Assessment (RCSA) reviews to evaluate the
effectiveness of our management systems for reducing exposure to identified operational
risks. RCSA points out areas that require improvement and aspects of our risk management
activities that need to be reinforced. Based on the results, we form improvement plans,
examine measures to further reduce risk exposure, and take required actions.
Japan Post Bank has a reporting framework that utilizes computer systems to flag occurrences
of operational mistakes and any accidents of all types. We analyze the contents of these reports
to determine the causes of these incidents and identify trends. This process yields fundamental
data for formulating and executing effective countermeasures.
(Core capital)
Risk capital
Risk buffer
Risk capital for allocation
Operational risk
Operational risk
Operational risk
Market risk
Credit risk
PortfolioⅠ
PortfolioⅡ
PortfolioⅠ
PortfolioⅡ
Market Risk from PortfolioⅠ
Market Risk from PortfolioⅡ
Credit Risk from PortfolioⅠ
Credit Risk from PortfolioⅡ
Unit of Portfolios
Allocate to smaller units of risk capital
Monitoring
Risk being taken
Total risk capital Allocation of risk capital
Determine the amount of risk
capital that can be safely allocated
‣Process of Risk Management and Risk Capital Allocation

JAPAN POST BANK Annual Report 200938 39
Internal AuditingBasic PolicyThe main purpose of internal auditing is to ensure that the Bank is able to conduct its
operations in a sound and appropriate manner by having its daily business operations and
internal management undergo thorough inspections and assessments of the independently
managed Internal Audit Division.
Methods of Internal AuditingIn principle, all operations and employees are subject to inspection, and operating activities
and internal management including compliance and risk control are assessed in terms of their
appropriateness and effectiveness. Auditors are authorized to ask all Directors, Executive
Officers, and employees to submit documentation of facts and explanations, observe
operations, and examine the contents of money safes and filing cabinets. Furthermore, auditors
have the right to attend and voice their opinions at all business meetings and other important
proceedings.
Internal Audit ReportingThe results of internal audits are compiled into a report focusing on any problems discovered
and related recommendations. The report is submitted to the Representative Executive
Officers, namely, the CEO and the COO, and to the Audit Committee. As an early warning
system, the Internal Audit Division immediately reports any items that are deemed to have a
potential serious impact on business to the Representative Executive Officers and the Audit
Committee.
Follow-Up InspectionIn cases where there were major issues in the internal management system, the Internal Audit
Division performs follow-up inspections in order to confirm plans and monitor progress of
improvements.
The Internal Audit Division carries out similar follow-up inspections of issues that have
been flagged by external audits, the Financial Services Agency (FSA), and/or other related
government authorities.
In addition to its regular inspections, the Internal Audit Division periodically compiles
inspection results of measures that require improvement and reports to the Representative
Executive Officers and the Audit Committee.
ComplianceBasic PolicyWe regard compliance as the adherence to laws and regulations as well as internal rules,
social standards of behavior, and corporate ethics by all executives and employees. In order to
become the most dependable bank in Japan, we view compliance as one of the most important
management missions, and therefore conduct rigorous compliance activities.
Specific MeasuresFor our annual compliance program, we produce compliance manuals that give operational
guidance in promoting compliance. We also set up training programs for our employees
and appoint a Compliance Manager in each department or branch, who is responsible for
mentoring employees and promoting compliance.
In addition, we have established a “whistle-blower system for compliance,” so that when
situations of (potential) non-compliance arise, these can be reported directly to management,
thereby promoting awareness and preventing any escalation of potential problems at an early
stage.
Regular ReviewsCompliance Officers, who are independent of business operations, are assigned to certain
departments and branches for the purpose of monitoring the status of compliance activities.
Compliance Officers should be fully aware of whether compliance is being appropriately
promoted in each of the Bank’s departments or branches, examine the programs in detail, and
assess the quality of the programs. Furthermore, Compliance Officers must regularly review
compliance guidelines in light of changes in or to business activities, business methods, and
the regulatory and corporate environment.
We keep track of our overall compliance status through various monitoring systems. Based on
examination and assessment of the feedback from these systems, we strive to further improve
our compliance system.
Responses to Compliance ViolationsIn the event of a compliance violation, a thorough investigation will be conducted in order
to determine the cause of the violation and to prevent it from happening again. The results
of the investigation will be reported to the department or branch under investigation, and the
depertment or branch will be instructed to come up with concrete measures for improvement.
Depending on the circumstances, the Compliance Officer will ask for the submission of
progress reports in order to remain apprised of the status..

INDEX
Management's Discussion and Analysis of Financial Condition and Results of Operations Business Overview .................................................................................................................................................. 42
Business Initiatives .................................................................................................................................................. 42
Business Environment ............................................................................................................................................. 43
Results of Operations .............................................................................................................................................. 44
Financial Condition .................................................................................................................................................. 48
Capital Resource Management ............................................................................................................................... 55
Off-Balance Sheet Arrangements & Contractual Cash Obligations ......................................................................... 56
Critical Accounting Policies and Estimates .............................................................................................................. 57
Risk Management .................................................................................................................................................... 59
Market Risk Management / Market Liquidity Risk Management .............................................................................. 60
Funding Liquidity Risk Management ........................................................................................................................ 62
Credit Risk Management ......................................................................................................................................... 62
Operational Risk Management ................................................................................................................................ 63
Financial Statements Balance Sheets ........................................................................................................................................................ 64
Statements of Income .............................................................................................................................................. 66
Statements of Changes in Net Assets ..................................................................................................................... 67
Statement of Cash Flows ......................................................................................................................................... 68
Notes to Financial Statements ................................................................................................................................. 69
Independent Auditors' Report .................................................................................................................................. 87
Financial Data Key Financial Indicators .................................................................................................................................................. 88
Earnings .......................................................................................................................................................................... 89
Deposits .......................................................................................................................................................................... 93
Loans .............................................................................................................................................................................. 95
Securities ........................................................................................................................................................................ 98
Ratios ............................................................................................................................................................................ 103
Others ........................................................................................................................................................................... 105
Capital Position ............................................................................................................................................................. 107
Instruments for Raising Capital ..................................................................................................................................... 108
Assessment of Capital Adequacy .................................................................................................................................. 108
Credit Risk ......................................................................................................................................................................111
Credit Risk Mitigation Methodology ................................................................................................................................116
Derivative Transactions and Transactions with Long-Term Settlements ........................................................................117
Securitization Exposure .................................................................................................................................................118
Operational Risk ............................................................................................................................................................ 120
Investments, Stock, and Other Exposure in Banking Account ...................................................................................... 120
Interest Rate Risk in Banking Account .......................................................................................................................... 121
JAPAN POST BANK Annual Report 200940 41
All numbers in this Annual Report are rounded down except where noted.

JAPAN POST BANK Annual Report 200942 43
MD
&A
Financial Statem
entsFinancial D
ata
Business Overview
Business Initiatives
Business Environment
The fiscal year ended at March 31, 2009 (“fiscal 2009”) was our first full fiscal year since we began operations. During fiscal 2009, we implemented several initiatives aimed at becoming “the most convenient and dependable bank in Japan.”
As part of our promotional efforts, we launched aggressive marketing campaigns such as offering premium interest rates on deposits. While deposit balances declined by approximately ¥4 trillion during fiscal 2009, the pace of decline appears to have slowed, with a drop of approximately ¥3 trillion in the first half of fiscal 2009 followed by a ¥1 trillion decline in the second half. Our time deposit balances remained broadly stable during the same period. Although declining deposit balances were also experienced prior to our incorporation, we consider the rate of decline to have leveled off.
We launched a number of new businesses in fiscal 2009 after receiving government approval. The new businesses included the credit card business, the life insurance sales agency services for individual variable annuity products, and the mortgage intermediary operations. Given the recent slowdown in the market environment, the performance of these new businesses is still
developing. We continue to seek to expand our product line-up and lay a solid foundation on which to create future earning opportunities by taking advantage of our nationwide network.
In January 2009, we became a member of the Zengin Data Telecommunication System (the “Zengin System”), an on-line network system linking private depository institutions on a nationwide basis. The connection to the Zengin System allows our depositors to transfer funds to and receive funds from approximately 1,400 other financial institutions affiliated with the Zengin System. We believe our participation in the Zengin System has significantly enhanced customer convenience.
To improve efficiency of investment operations, we are aiming to diversify our risks and income sources by expanding our range of products in our investment portfolio while closely monitoring and carefully managing interest rate risk. Although a large majority of our investment portfolio continues to consist of Japanese Government Bonds, we have also invested in Japanese corporate bonds, yen-denominated domestic bonds of foreign issuers (Samurai bonds), syndicated loans, and other interest-bearing instruments. In addition, we have begun investing in investment
trusts and other securities. As a result, the proportion of Japanese corporate bonds and other securities (i.e., Samurai bonds and others) in our portfolio has increased. Despite our diversified investment methods, we have maintained the high quality of our assets and liabilities and have continued to build a financial strength that generates stable earnings even amid the ongoing
financial crisis.Since the establishment of Japan Post Bank, our management
has placed its highest priority on ensuring a comprehensive internal system of controls, with particular emphasis on thoroughly meeting compliance and implementing customer protection measures.
In the first half of fiscal 2009, economic growth in Japan slowed further compared to the prior year amid inflation concerns triggered by rapidly rising commodity prices. In the second half, the financial crisis in the United States and Europe, stemming from the subprime loan problem, further deepened following the bankruptcy of Lehman Brothers in September 2008. While the United States government initiated measures to stabilize financial markets, including passage of the Emergency Economic Stabilization Act in October 2008, the impact of the financial crisis began to adversely affect the real economy of the United States and Europe. Consumer spending, capital investment, housing starts, and other major components of domestic demand in the United States dropped sharply. Combined with the deepened economic recession in Europe and Asia, these decreases in demand have led to what might be viewed as a truly global economic recession. Japan was also hit by this sudden deterioration in the global economy, and a sharp drop in external demand led to a broad decline in domestic production. In the October-December 2008 quarter, the Japanese economy contracted by double-digits, surpassing the economic declines in the United States and Europe.
Financial and capital markets saw a downward trend in long-term interest rates, reflecting the economic recession. The 10-year Japanese Government Bond yields, which once hit as high as around 1.85-1.89% in mid-June 2008, declined to a box-range of 1.20-1.39%, as Japan, the United States, and European countries successively eased their monetary policy in reaction to the drastic deterioration of the economic situation. Amid these events, stock markets of major industrial countries began to decline from October 2008 and onward and the Nikkei Stock Average plunged to ¥6,995 on October 28, setting a record low for the first time since October 1982. The index regained its ¥8,000 mark, reflecting a rise in U.S. stock prices and anticipation of an economic recovery supported by government stimulus packages by the end of March 2009. In December 2008, the Japanese yen appreciated to ¥87 per U.S. dollar and ¥114 per euro, as a result of the easing monetary policy by central banks in major countries followed by the unwinding of yen carry trade positions and a more risk averse attitude of investors. Towards the end of fiscal 2009, the yen began to weaken and traded at around ¥95-99 per U.S. dollar, reflecting a rise in U.S. stock prices.
The Bank began operating on October 1, 2007, but its operations trace back to 1875 when Japanese postal savings services commenced. The Bank was established to succeed the operations of Japanese postal savings services as part of the privatization and spin-off plan for Japan Post’s four businesses – postal savings services, insurance services, postal services, and over-the-counter services – under the Postal Service Privatization Law.
Through a retail network of 233 directly operated branches and nearly 24,000 post offices extending throughout Japan, the Bank provides individual customers with savings account, settlement, and other basic banking products and services and boasts a deposit base of approximately ¥180 trillion as of March 31, 2009. In addition, the Bank has an ATM network of approximately 26,000 machines. Supported by its extensive
network of branches and ATMs, the Bank offers its customers a level of convenience unparalleled by any other financial institution in Japan.
The Bank has developed a proprietary business model. Utilizing a sophisticated risk management framework, it generates stable flows of income by investing customer deposits, gathered through its nationwide channels, in secure and quality financial instruments – primarily Japanese Government Bonds.
The Bank enjoys a remarkably sound financial condition. As of March 31, 2009, retail deposits accounted for approximately 90% of total liabilities, while Japanese Government Bonds accounted for about 80% of total assets. As of the same date, the Bank’s BIS capital adequacy ratio was approximately 90%, underpinned by its proprietary business model.
The following section of Japan Post Bank’s (the “Bank,” “we,” “us,” “our,” and similar terms) Annual Report for the year ended March 31, 2009 (“Annual Report”) provides management’s discussion and analysis of the financial condition and results of operations (“MD&A”) of Japan Post Bank. This MD&A highlights selected information and may not contain all of the information that is important to readers
of this Annual Report. For a more complete description of events, trends, and uncertainties, as well as the capital, liquidity, and credit and market risks affecting the Bank and its operations, readers should refer to other sections in this Annual Report. This section should be read in conjunction with the non-consolidated financial statements and notes included elsewhere in this Annual Report.
Management’s Discussion and Analysis of Financial Condition and Results of Operations

JAPAN POST BANK Annual Report 200944 45
MD
&A
Financial Statem
entsFinancial D
ata
Results of Operations
Financial Performance of Japan Post Bank
Millions of yen
Fiscal 2009 Fiscal 2008 Fiscal 2008 (pro forma)Gross operating profit: ¥1,746,765 ¥920,548 ¥1,841,097 Interest income 1,655,330 871,211 1,742,423 Fees and commissions 91,096 49,852 99,705 Other operating income (loss) 338 (515) (1,031)General and administrative expenses (excluding non-recurring losses): 1,266,162 617,738 1,235,476 Personnel expenses 109,562 53,567 107,134 Non-personnel expenses 1,082,643 519,392 1,038,784 Taxes 73,956 44,778 89,557Operating profit (before provision for (reversal of) general reserve for possible loan losses) 480,602 302,859 605,719
Net operating profit 480,602 301,945 603,890Non-recurring gain (loss) (95,358) (45,773) (91,546)Net ordinary income 385,243 256,171 512,343Extraordinary income (loss) (1,030) (331) (663)Income before income taxes 384,213 255,840 511,680Net income 229,363 152,180 304,361
Net Interest IncomeMillions of yen
Fiscal 2009 Fiscal 2008 Fiscal 2008 (pro forma)
Net interest income: ¥1,655,330 ¥871,211 ¥1,742,423
Interest income 2,309,926 1,265,037 2,530,075
Interest expenses 654,596 393,826 787,652
Notes: 1. Interest expenses exclude expenses corresponding to money held in trust (fiscal 2009: ¥2,425 million; fiscal 2008: ¥1,036 million).2. Fiscal 2008 figures are for the six-month period from October 1, 2007 to March 31, 2008.
Yields on Interest-Bearing Assets and Interest Rates on Interest-Bearing LiabilitiesMillions of yen, %
Fiscal 2009 Fiscal 2008
Average balance Interest Earnings yield Average balance Interest Earnings yield
Interest-earning assets: ¥201,253,306 ¥2,309,926 1.14 ¥212,590,632 ¥1,265,037 1.19
Loans 3,820,816 45,185 1.18 3,908,239 22,847 1.16
Securities 174,294,416 1,940,865 1.11 172,423,811 936,932 1.08
Deposits (to the fiscal loan fund) 14,606,904 254,746 1.74 31,221,950 273,865 1.75
Due from banks 7,905,353 40,455 0.51 4,998,835 15,515 0.62
Interest-bearing liabilities: 193,530,970 654,596 0.33 207,409,851 393,826 0.37
Deposits 179,573,276 373,863 0.20 185,626,493 181,412 0.19
Borrowed money 14,606,904 255,091 1.74 22,329,234 197,357 1.76
Notes: 1. The average balance of money held in trust is excluded from interest-earning assets, and the average balance of expenses corresponding to money held in trust and the corresponding interest are excluded from interest-bearing liabilities.
2. Fiscal 2008 figures are for the six-month period from October 1, 2007 to March 31, 2008.
Net Operating Profit
In fiscal 2009, gross operating profit was ¥1,746.7 billion, a decrease of 5.12% from the pro forma number of ¥1,841.0 billion (¥920.5 billion x 2) in fiscal 2008. The decrease was attributable to the repayment of deposits entrusted to the former Ministry of Finance, Trust Fund Bureau (currently, the Fiscal Loan Fund Special Account) which contributed to earnings in the previous fiscal year. Meanwhile, the yield spread, which is the difference between the rate of interest earned on average interest-earning assets, primarily securities, and the rate of interest paid on average interest-bearing liabilities, primarily deposits, improved in fiscal 2009 compared with the prior fiscal year. Net operating profit was ¥480.6 billion, a decrease of 20.41% from the pro forma number of ¥603.8 billion (¥301.9 billion x 2) in fiscal 2008. The figure declined as gross operating profit fell by 5.12% while general and administrative expenses increased by 2.48%.
Net income was ¥229.3 billion, a decline of 24.64% from the pro forma number of ¥304.3 billion (¥152.1 billion x 2) in fiscal 2008. The figure dropped as a result of the decrease in net operating profit by 20.41% and losses on investments in equities through money held in trust reflecting the deteriorating financial markets. As a result, return on equity (ROE) for fiscal 2009 was 2.82%, down from 3.85% in fiscal 2008.
Net Interest Income
Net interest income was ¥1,655.3 billion, a decrease of 4.99% from the pro forma number of ¥1,742.4 billion (¥871.2 billion x 2) in fiscal 2008. In fiscal 2008, net interest income included ¥76.5 billion which represents the difference between the interest on deposits to the fiscal loan fund* and that on borrowed money*. In fiscal 2009, there was no contribution to net interest income from the difference between interest on deposits (to the fiscal loan fund) and on borrowed money.
Interest income was ¥2,309.9 billion, a decrease of 8.70% from the pro forma number of ¥2,530.0 billion (¥1,265.0 billion x 2) in fiscal 2008. The figure dropped as the interest on deposits (to the fiscal loan fund) declined to ¥254.7 billion in fiscal 2009, from ¥273.8 billion in fiscal 2008. Meanwhile, the interest on securities was ¥1,940.8 billion, a growth of 3.57% from the pro forma number in fiscal 2008. The average balance of interest-earning assets was ¥201,253.3 billion, a decrease of ¥11,337.3 billion from fiscal 2008. The decrease was attributable to a reduction in deposits (to the fiscal loan fund), which was partially offset by an increase in the average balance of securities. The earnings yield on interest-earning assets was 1.14%, down by 5 basis points from fiscal 2008. The decline reflects a contraction in deposits (to the fiscal loan fund), which generated a higher yield than that for securities. However, the yields on both securities and loans increased: the yield on securities was 1.11%, an increase of 3 basis points from 1.08% in fiscal 2008, and that on loans was 1.18%, an increase of 2 basis points from 1.16% in fiscal 2008. Interest expenses were ¥654.5 billion, a decrease of 16.89% from the pro forma number of ¥787.6 billion (¥393.8 billion x 2) in fiscal 2008. The decline was attributable to a decline in interest
costs reflecting a reduction in borrowed money. The average balance of interest-bearing liabilities was ¥193,530.9 billion, a drop of ¥13,878.8 billion from fiscal 2008. The decrease was attributable to a decline in the balances of borrowed money and deposits. The interest rate on interest-bearing liabilities was 0.33%, down by 4 basis points from fiscal 2008. The major factor behind the decline was a contraction in the balance of borrowed money, which bears a higher interest rate than deposits. This decline was partially offset from an increase in the interest rate on deposits to 0.20%, from 0.19% in fiscal 2008. The interest rate on deposits was revised down from 0.21% as at the end of the first half of fiscal 2009 due to cuts in deposit rates through the second half of the fiscal year. As a result of the foregoing, the spread between interest-earning assets and interest bearing liabilities was 0.80%, down by 2 basis points from fiscal 2008. The decline was attributable to redemption of deposits (to the fiscal loan fund), excluding the amount equivalent to borrowed money. However, the yield spread between securities and deposits, which are respectively the major components of the Bank’s assets and liabilities, improved to 0.91%, up by 2 basis points from fiscal 2008.
* Prior to the reforms to the government’s fiscal investment and loan program in fiscal 2002, all postal savings had to be deposited with the Ministry of Finance, which managed those funds. Deposits to the fiscal loan fund were funds that had been deposited for a term of seven years (mainly) and ten years. In addition, the interest rates on the deposits to the fiscal loan fund were higher than Japanese Government Bond yields (10-year Japanese Government Bond + 20 basis points). The deposits with a term of seven years were redeemed in fiscal 2008. Meanwhile, borrowed money represented funds that post offices chose to manage on their own and borrowed back from the Ministry of Finance for a 10-year term with the same interest rates as deposits to the fiscal loan fund. The balance of deposits to the fiscal loan fund and borrowed money was equivalent in fiscal 2009 and will fall to zero in fiscal 2011.
This section compares our results of operations for fiscal 2009 against our results of operations for fiscal 2008. Fiscal 2008 began on October 1, 2007. Thus, our financial performance for fiscal 2008 essentially reflects the six-month results for what in ordinary circumstances would represent the second half of fiscal 2008, although additional gains and losses, including a net loss of ¥731 million, preparatory to the commencement of our operations have been recorded in fiscal 2008.
For the convenience of readers, we present data for fiscal 2008 on both an actual and pro forma annualized basis. Unless otherwise indicated, the data for fiscal 2008 is presented on a pro forma basis. Pro forma annualized data for fiscal 2008 has been prepared by simply doubling the actual results for fiscal 2008 that reflected only six-month results. We believe the pro forma annualized figures for fiscal 2008 provide a useful comparison for purposes of this section.

JAPAN POST BANK Annual Report 200946 47
MD
&A
Financial Statem
entsFinancial D
ata
Net Fees and CommissionsMillions of yen
Fiscal 2009 Fiscal 2008 Fiscal 2008 (pro forma)
Net fees and commissions: ¥ 91,096 ¥49,852 ¥ 99,705
Fees and commissions received 112,334 59,556 119,113
Fees and commissions paid 21,238 9,703 19,407
Note: Fiscal 2008 figures are for the six-month period from October 1, 2007 to March 31, 2008.
Net Other Operating Income (Loss)Millions of yen
Fiscal 2009 Fiscal 2008 Fiscal 2008 (pro forma)
Net other operating income (loss): ¥ 338 ¥ (515) ¥ (1,031)
Other operating income 53,791 703 1,406
Other operating expenses 53,452 1,218 2,437
Note: Fiscal 2008 figures are for the six-month period from October 1, 2007 to March 31, 2008.
General and Administrative ExpensesMillions of yen
Fiscal 2009 Fiscal 2008 Fiscal 2008 (pro forma)
Personnel expenses: ¥ 109,605 ¥ 53,616 ¥ 107,232
Salary and allowances 101,590 49,510 99,021
Others 8,014 4,105 8,211
Non-personnel expenses: 1,082,643 519,392 1,038,784
Payments on commissioned services for Japan Post Network Co., Ltd. 648,147 301,046 602,092
Deposit insurance premiums to Japan Post Holdings Co., Ltd. 97,732 51,185 102,371
Deposit insurance expenses paid to Deposit Insurance Corporation of Japan 54,768 25,034 50,069
Rent expenses on land, buildings, and others 10,960 5,114 10,228
Expenses on consigned businesses 90,100 38,283 76,566
Depreciation and amortization 54,797 30,908 61,817
Communication and transportation expenses 23,809 10,939 21,879
Maintenance expenses 10,023 2,320 4,640
Others 92,303 54,559 109,118
Taxes and dues 73,956 44,778 89,557
Total ¥1,266,205 ¥ 617,787 ¥ 1,235,574
Note: Fiscal 2008 figures are substantially for the six-month period from October 1, 2007 to March 31, 2008, but include expenses related to the operations of the preparatory planning company, which occurred from April 1 to September 30, 2007.
Net Fees and Commissions
Net fees and commissions were ¥91.0 billion, a decrease of 8.63% from the pro forma number of ¥99.7 billion (¥49.8 billion x 2) in fiscal 2008. The decline was attributable to a drop in fees and commissions on domestic exchanges, a weaker growth in investment trust-related fees and commissions, and limited contributions from new businesses, given the fact that they remained in a start-up stage despite their promising potential. Fees and commissions were ¥112.3 billion, a decrease of 5.69% from the pro forma number of ¥119.1 billion (¥59.5 billion x 2) in fiscal 2008. Fees and commissions on domestic and foreign exchanges were ¥66.5 billion, a decrease of 5.66% from the pro forma number of ¥70.5 billion (¥35.2 billion x 2) in fiscal 2008. The number declined as fees and commissions on transfer deposits dropped, reflecting a reduction in commissions on utility and tax payments. The Bank’s participation in the Zengin System from January 2009 had limited impact on fees and commissions on domestic exchanges. However, the volume and value of transactions increased from fiscal 2008.
From fiscal 2009, the Bank enjoyed fees and commissions from new businesses launched in fiscal 2009, such as the credit card, variable annuities, and mortgage loan businesses, in addition to those fees and commissions earned from investment trust related operations, remittances and postal orders, ATM transaction services, and sale of over-the-counter Japanese Government Bonds. Other fees and commissions were ¥45.7 billion, a decrease of 5.72% from the pro forma number of ¥48.5 billion (¥24.2 billion x 2) in fiscal 2008. The decline was attributable to weaker investment trusts related fees and commissions. Contributions from new businesses launched in fiscal 2009 remained limited, as these businesses remain at a start-up stage. Although still small, the other fees and commissions contributed by these businesses in the second half of the fiscal period improved over the first half, and these businesses are expected to make large contributions in the near future. Fees and commissions paid were ¥21.2 billion, an increase of 9.42% from the pro forma number of ¥19.4 billion (¥9.7 billion x 2) in fiscal 2008. The growth was attributable to higher ATM transaction fees.
Net Other Operating Income (Loss)
Net other operating income was ¥338 million, an improvement from fiscal 2008’s net operating loss of ¥515 million. Other operating income was ¥53.7 billion, including gains on sales of Japanese Government Bonds and other bonds
of ¥53.0 billion. Other operating expenses were ¥53.4 billion, as losses on sales of Japanese Government Bonds and other bonds totaled ¥52.9 billion on sales of foreign currency denominated bonds.
General and Administrative Expenses
General and administrative expenses (including non-recurring losses) were ¥1,266.2 billion, an increase of 2.47% from the pro forma number of ¥1,235.5 billion (¥617.7 billion x 2) in fiscal 2008. The increase was due to higher personnel expenses and non-personnel expenses. Personnel expenses were ¥109.6 billion, an increase of 2.21% from the pro forma number of ¥107.2 billion (¥53.6 billion x 2) in fiscal 2008. The acceptance of employees, mainly from Japan Post Network Co., Ltd. (“Japan Post Network”), which boosted our total number of employees. Non-personnel expenses were ¥1,082.6 billion, an increase of 4.22% from the pro forma number of ¥1,038.7 billion (¥519.3 billion x 2) in fiscal 2008. Non-personnel expenses account for 85.5% of general and administrative expenses. Payments on commissioned services for Japan Post Network were ¥648.1 billion, an increase of 7.64% from the pro forma number of ¥602.0 billion (¥301.0 billion x 2) in fiscal 2008. The number is determined mainly by deposit balances, fees and commissions, and incentives. Although deposit balances and fees and commissions declined, the number increased because of an increase in fees related to sales and administrative incentives,
such as the fees related to the Bank’s participation in the Zengin System. The Bank pays subsidies to Japan Post Holdings Co., Ltd. (“Japan Post Holdings”) in accordance with Article 122 of the Postal Service Privatization Law. The subsidies paid to Japan Post Holdings are a type of deposit insurance expenses for special deposits. In addition, the Bank insures deposits other than special deposits. Total deposit insurance expenses were ¥152.5 billion, an increase of 0.03% from the pro forma number of ¥152.4 billion (¥76.2 billion x 2) in fiscal 2008. Non-personnel expenses other than the above (including rent for land, buildings, and machinery, expenses on consigned businesses, depreciation and amortization, communication and transportation expenses, maintenance expenses and others) were ¥281.9 billion, a decrease of 0.79% from the pro forma number of ¥284.2 billion (¥142.1 billion x 2) in fiscal 2008. The Bank has enhanced its efforts to reduce costs. Taxes and dues were ¥73.9 billion, a decrease of 17.42% from the pro forma number of ¥89.5 billion (¥44.7billion x 2) in fiscal 2008. The figure includes mainly consumption, stamp, enterprise, and fixed asset taxes, in addition to consumption taxes related to payments on commissioned services for Japan Post Network.

JAPAN POST BANK Annual Report 200948 49
MD
&A
Financial Statem
entsFinancial D
ata
Non-Recurring Gains (Losses)Millions of yen
Fiscal 2009 Fiscal 2008 Fiscal 2008 (pro forma)
Non-recurring gains (losses): ¥ (95,358) ¥ (45,773) ¥ (91,546)
Non-recurring income 12,500 3,557 7,114
Non-recurring expenses 107,858 49,330 98,660
Note: Fiscal 2008 figures are substantially for the six-month period from October 1, 2007 to March 31, 2008, but include gains related to the operations of the preparatory planning company, which occurred from April 1 to September 30, 2007.
Financial Condition
AssetsMillions of yen
As of March 31, 2009
As of March 31, 2008 Y-o-Y change
Cash and due from banks ¥ 5,999,116 ¥ 8,835,055 ¥ (2,835,939)
Call loans 51,184 3,655,000 (3,603,816)
Receivables under resale agreements – 149,803 (149,803)
Receivables under securities borrowing transactions 725,786 – 725,786
Monetary claims bought 66,409 20,908 45,501
Trading account securities 159 172 (13)
Money held in trust 1,224,742 412,570 812,172
Securities 173,551,137 172,532,116 1,019,021
Loans 4,031,587 3,771,527 260,060
Foreign exchanges 9,872 13,453 (3,581)
Other assets 10,480,635 22,514,239 (12,033,603)
Tangible fixed assets 170,392 186,469 (16,077)
Intangible fixed assets 29,586 27,106 2,480
Deferred tax assets 141,273 32,269 109,004
Reserve for possible loan losses (1,087) (1,510) 422
Total assets ¥196,480,796 ¥212,149,182 ¥ (15,668,386)
Unrealized Gains (Losses) on Money Held in TrustOther money held in trust (excluding those classified for trading purposes and held to maturity)
Millions of yen
As of March 31, 2009 As of March 31, 2008Acquisition costs (A) Balance sheet amount (B) Change (B) — (A) Acquisition costs (A) Balance sheet amount (B) Change (B) — (A)
¥1,418,878 ¥1,224,742 ¥(194,135) ¥515,188 ¥412,570 ¥(102,618)
Note: The balance sheet amount as of March 31, 2009 (end of fiscal 2009) is stated at the average market price of the final month (March) of fiscal 2009 for equity securities and at the market price at the balance sheet date for other securities. The balance sheet amount as of March 31, 2008 (end of fiscal 2008) is stated at the average market price of the final month of fiscal 2008 for all securities.
SecuritiesMillions of yen
As of March 31, 2009
As of March 31, 2008 Y-o-Y change
Securities: ¥173,551,137 ¥172,532,116 ¥ 1,019,021
Japanese Government Bonds 155,490,155 156,773,157 (1,283,001)
Japanese local government bonds 6,177,212 7,499,247 (1,322,035)
Commercial paper 542,904 – 542,904
Japanese corporate bonds 9,880,462 7,801,698 2,078,763
Stocks 900 – 900
Other securities 1,459,503 458,012 1,001,490
Securities
The balance of securities at the end of fiscal 2009 was ¥173,551.1 billion, up by ¥1,019.0 billion, or 0.5%, from the end of fiscal 2008. The balance of Japanese Government Bonds was ¥155,490.1 billion, a decline of ¥1,283.0 billion, or 0.8%, from the end of fiscal 2008. Although the number declined slightly, Japanese Government Bonds account for an extremely high proportion of the Bank’s investment operations. Japanese local government bonds amounted to ¥6,177.2 billion, a decline of ¥1,322.0 billion, or 17.6%, from the end of fiscal 2008. Japanese corporate bonds were ¥9,880.4 billion, increasing by ¥2,078.7 billion, or 26.6%, from the end of fiscal 2008. Other securities, mainly consisting of foreign securities,
were ¥1,459.5 billion, increasing by ¥1,001.4 billion, or 218.6%, from the end of fiscal 2008. While the balances of Japanese government and local government bonds decreased, investments in Japanese corporate bonds and foreign securities increased in an effort by the Bank to diversify its sources of income and ensure higher returns. Foreign securities investments consist primarily of yen-denominated domestic bonds of foreign issuers. In fiscal 2009, the Bank began investing in investment trusts and other securities. The ¥900 million investment in stocks consists of an in SDP Center Co., Ltd., an affiliated company to which the Bank started outsourcing mortgage intermediary operations in fiscal 2009.
Total Assets
At the end of fiscal 2009, total assets were ¥196,480.7 billion, a decline of ¥15,668.3 billion, or 7.3%, from the end of fiscal 2008. The decrease can be attributed to the ¥12 trillion decline from fiscal 2008 in deposits (to the fiscal loan fund) included in “Other assets.”
Cash and Due from Banks, Call Loans, and Others
Cash was ¥124.6 billion, a decline of ¥67.8 billion, or 35.2%,
from the end of fiscal 2008. Due from banks was ¥5,874.4 billion, representing a decrease by ¥2,768.1 billion, or 32.0%, from the end of fiscal 2008. The decrease was attributable to a reduction in deposits with the Bank of Japan (BOJ), which had increased due to redemptions of deposits (to the fiscal loan fund) at the end of fiscal 2008. The balance of call loans was ¥51.1 billion, a decline of ¥3,603.8 billion, or 98.6%, from the end of fiscal 2008. The balance of call loans declined as we shrank
Non-Recurring Gains (Losses)
In fiscal 2009, non-recurring losses were ¥95.3 billion, up by 4.16% from the pro forma number of ¥91.5 billion (¥45.7 billion x 2) in fiscal 2008. Losses on money held in trust rose to ¥100.2 billion (including ¥56.1 billion of impairment losses) from ¥14.9 billion in fiscal 2008, as performances of equities invested through money
held in trust deteriorated reflecting the depressed stock markets. In fiscal 2008, non-recurring expenses included a ¥32.6 billion write-down of certain software assets following a thorough review of an integrated information processing system for the Japan Post group companies that the Bank inherited from Japan Post.
our investment operations amid a contraction in market transaction volume, reflecting a rise in credit risks caused by the subprime loan crisis. In fiscal 2009, the Bank began conducting repurchase transactions.
Money Held in Trust
Money held in trust amounted to ¥1,224.7 billion, an increase of ¥812.1 billion, or 196.8%, from the end of fiscal 2008. Investments in equities through money held in trust were aimed at diversifying income sources and associated risk. Unrealized losses on money held in trust were ¥194.1 billion, deteriorating by ¥91.5 billion from the end of fiscal 2008, reflecting declines in stock prices associated with the adverse economic developments.

JAPAN POST BANK Annual Report 200950 51
MD
&A
Financial Statem
entsFinancial D
ata
Unrealized gains on held-to-maturity securities (off-balance sheet items) were ¥2,447.5 billion, down by ¥104.7 billion from the end of fiscal 2008. Unrealized gains on available-for-sale securities were ¥165.6 billion, down by ¥61.7 billion from the end of fiscal 2008 reflecting a slight increase in interest rates.
Unrealized Gains (Losses) on SecuritiesHeld-to-maturity securities whose fair value is available at end of fiscal period
Millions of yen
As of March 31, 2009 As of March 31, 2008
Balance sheet amount (A)
Fair value (B)
Change (B) — (A)
Balance sheet amount (A)
Fair value(B)
Change (B) — (A)
Japanese Government Bonds ¥123,534,320 ¥125,831,093 ¥2,296,773 ¥129,548,188 ¥131,912,587 ¥2,364,398
Japanese local government bonds 5,279,006 5,355,960 76,954 7,232,314 7,351,184 118,869
Japanese corporate bonds 5,552,480 5,626,314 73,834 4,387,181 4,456,220 69,038
Total ¥134,365,807 ¥136,813,368 ¥2,447,561 ¥141,167,684 ¥143,719,991 ¥2,552,307
Note: Fair value is determined based on the market price as at the balance sheet dates.
Available-for-sale securities whose fair value is available at end of fiscal periodMillions of yen
As of March 31, 2009 As of March 31, 2008
Acquisition cost (A)
Balance sheet amount (B)
Change (B) — (A)
Acquisition cost (A)
Balance sheet amount (B)
Change (B) — (A)
Bonds: ¥36,988,754 ¥37,182,023 ¥193,269 ¥30,670,692 ¥30,906,419 ¥235,727
Japanese Government Bonds 31,790,638 31,955,835 165,196 27,026,090 27,224,969 198,878
Japanese local government bonds 889,016 898,206 9,189 263,195 266,932 3,737
Japanese corporate bonds 4,309,099 4,327,982 18,882 3,381,406 3,414,517 33,110
Other securities 1,553,501 1,525,912 (27,588) 487,266 478,921 (8,345)
Total ¥38,542,255 ¥38,707,936 ¥165,680 ¥31,157,958 ¥31,385,340 ¥227,382
Notes: 1. The balance sheet amount is stated at the market price as at the balance sheet dates. 2. “Other securities” consists primarily of foreign securities. 3. Securities include investment securities, negotiable certificates of deposit recorded under “Cash and due from banks" and investment trusts under
“Monetary claims bought.”
Securities whose fair value is not available at end of the fiscal periodMillions of yen
As of March 31, 2009
As of March 31, 2008
Investments in subsidiaries and affiliates:
Investment in affiliates ¥ 900 –
Other securities:
Commercial paper 542,904 –
Loans by IndustryMillions of yen
As of March 31, 2009
As of March 31, 2008 Y-o-Y change
Agriculture, forestry, fishing, and mining – – –
Manufacturing ¥ 190,182 ¥ 7,821 ¥ 182,360
Utilities, information/communications, and transportation 201,651 – 201,651
Wholesale and retail 18,392 6,391 12,000
Finance and insurance 3,414,775 3,735,689 (320,914)
Construction and real estate 50,681 5,000 45,681
Services 10,200 1,500 8,699
National and local governments 51,381 – 51,381
Others 94,323 15,125 79,197
Total ¥ 4,031,587 ¥ 3,771,527 ¥ 260,060
Note: Loans to the Management Organization for Postal Savings and Postal Life Insurance, included in loans to the line item “finance and insurance,” were ¥3,361,177 million at the end of fiscal 2009 and ¥3,713,689 million at the end of fiscal 2008.
Loans to Individuals and Small and Midsize EnterprisesMillions of yen, %
As of March 31, 2009
As of March 31, 2008 Y-o-Y change
Total loans (A) ¥4,031,587 ¥3,771,527 ¥260,060
Loans to individuals and small and midsize enterprises (B) 67,323 15,125 52,197
(B/A) 1.66 0.40 1.26
Loans
The balance of outstanding loans was ¥4,031.5 billion, an increase of ¥260.0 billion, or 6.8%, from the end of fiscal 2008. Although loans to the Management Organization for Postal Savings and Postal Life Insurance declined, the total balance of outstanding loans increased due to a rise in the balance of syndicated loans. Loans include loans to the Management Organization for Postal Savings and Postal Life Insurance, syndicated loans, loans with collateral deposits, and loans to group companies. The Bank is not allowed to provide loans directly to corporations. In addition, the mortgage loan business is currently an intermediary operation that is operated through Suruga Bank Ltd. Loans to the Management Organization for Postal Savings and Postal Life Insurance were ¥3,361.1 billion, down by ¥352.5 billion, or 9.4%, from the end of fiscal 2008. These loans mainly consist of loans to Japanese local governments provided as part
of the government’s fiscal investment and loan program and will likely continue to decline in the future periods. Loans to individuals totaled ¥67.3 billion, an increase of ¥52.1 billion, or 345.0%, from the end of fiscal 2008. Loans to Japan Post Holding, which totaled ¥22.0 billion at the end of fiscal 2008, were reduced to zero at the end of fiscal 2009. Loans other than those described above, such as syndicated loans and loans purchased on secondary markets, totaled ¥603.0 billion, an increase of ¥582.3 billion, or 2,811%, from the end of fiscal 2008. In December 2007, we launched syndicated and secondary loan businesses after receiving governmental approval. We increased the amount of these loans as part of proactive measures to diversify our sources of income and ensure higher returns. Our loans are all classified as normal loans. We do not hold any non-performing loans classified as problem assets under the Financial Reconstruction Law.

JAPAN POST BANK Annual Report 200952 53
MD
&A
Financial Statem
entsFinancial D
ata
Disclosures Under the Financial Reconstruction LawMillions of yen
As of March 31, 2009
As of March 31, 2008 Y-o-Y change
Loans to borrowers classified as bankrupt or quasi-bankrupt – – –
Loans to borrowers classified as doubtful – – –
Loans requiring close monitoring – – –
Loans to borrowers classified as normal ¥4,042,904 ¥3,785,615 ¥257,289
Total ¥4,042,904 ¥3,785,615 ¥257,289
Securitized Products Billions of yen, %
As of March 31, 2009
Acquisition cost (A)Net unrealized
gains (losses) (B) (B/A) Credit ratings
Residential mortgage backed securities (RMBS): ¥704.5 ¥(5.0) (0.7) AAA Subprime loan related amounts – – – –Collateralized loan obligations (CLO) 71.3 0.5 0.7 AAAOther securitized products (securitized products with
credit card receivables as underlying assets) 63.6 (0.1) (0.2) AAA〜BBBCollateralized mortgage backed securities (CMBS) – – – –Collateralized debt obligations (CDO) – – – –Total ¥839.6 ¥(4.6) (0.5)Notes: 1. No hedging activities against credit risks were made.
2. Underlying assets are located in Japan.3. The numbers do not include securitized products that might be included in investment trusts.
Major Components of Deferred Tax Assets and LiabilitiesMillions of yen
As of March 31, 2009
As of March 31, 2008 Y-o-Y change
Deferred tax assets:
Reserve for possible loan losses ¥ 442 ¥ 614 ¥ (172)
Reserve for employees’ retirement benefits 51,913 50,839 1,073
Accumulated depreciation 20,847 9,781 11,065
Accrued interest on deposits 22,265 – 22,265
Impairment losses of money held in trust 11,764 – 11,764
Net unrealized losses on available-for-sale securities 11,578 – 11,578
Other 26,213 23,171 3,042
Total deferred tax assets 145,025 84,407 60,617
Deferred tax liabilities:
Unrealized gains (losses) on available-for-sale securities – 50,770 (50,770)
Other – 1,367 (1,367)
Total deferred tax liabilities 3,751 52,138 (48,386)
Net deferred tax assets ¥141,273 ¥ 32,269 ¥109,004
LiabilitiesMillions of yen
As of March 31, 2009
As of March 31, 2008 Y-o-Y change
Deposits ¥177,479,840 ¥181,743,807 ¥ (4,263,966)
Payables under securities lending transactions 804,770 – 804,770
Borrowed money 8,700,000 20,700,000 (12,000,000)
Foreign exchanges 102 327 (225)
Other liabilities 1,182,240 1,496,986 (314,746)
Reserve for employees’ bonuses 6,542 6,227 314
Reserve for employees’ retirement benefits 127,584 124,932 2,652
Reserve for directors’ retirement benefits 141 45 95
Total liabilities ¥188,301,222 ¥204,072,327 ¥(15,771,104)
Total Liabilities
Total liabilities were ¥188,301.2 billion, a decline of ¥15,771.1 billion, or 7.7%, from the end of fiscal 2008. The drop is mainly attributable to a decrease in borrowed money.
Deposits
Our deposits balance at the end of fiscal 2009 was ¥177,479.8 billion, a decline of ¥4,263.9 billion, or 2.3%, from the end of fiscal 2008. Declines in our deposits balance have been observed since prior to our incorporation due to the maturity of TEIGAKU deposits. These declines have, however, largely stabilized. The deposits balance fell by ¥3,182.4 billion in the first half of fiscal 2009 and by ¥1,081.5 billion in the second half. In particular, time deposits dropped by ¥1,175.5 billion in the first half of fiscal 2009, but saw an increase by ¥776.0 billion in the second half.
In addition, we have adopted measures aimed at maintaining and stabilizing the deposits balance, such as offering premium interest rates on deposits and taking steps to further enhance the convenience of customer accounts. Special deposits are government-guaranteed time deposits acquired before our incorporation (including those that became ordinary deposits as they were unredeemed after the date of maturity). These deposits were transferred to the Management Organization for Postal Savings and Postal Life Insurance following privatization and then deposited with the Bank. The balance of special deposits was ¥76,835.3 billion at the end of fiscal 2009, down from ¥109,519.6 billion at the end of fiscal 2008, and is expected to continue to decline. We are obligated to hold safe assets – such as Japanese Government Bonds and government-guaranteed bonds – in an amount that is equivalent to the amount of special deposits.
Deferred Tax Assets
Net deferred tax assets at the end of fiscal 2009 were ¥141.2 billion, an increase of ¥109.0 billion, or 337%, from the end of fiscal 2008. Unrealized gains on other (available-for-sale)
securities recorded in fiscal 2008 became losses in fiscal 2009. The move increased deferred tax assets by ¥62.3 billion. Considering the Bank’s size of taxable income, our management believes that all the deferred tax assets are recoverable.
Deposits (to the fiscal loan fund)
Deposits (to the fiscal loan fund) account for the largest proportion of other assets. The outstanding balance was ¥8,700.0 billion, a decline of ¥12 trillion, or 57.9%, from the end of fiscal 2008. Deposits (to the fiscal loan fund) are deposits that were made to the Ministry of Finance prior to the reforms to the Japanese government’s fiscal investment and loan program in fiscal 2002. No additional deposits have been made subsequent to these reforms. The current balance is equivalent to borrowed money, included in liabilities, and will fall to zero in fiscal 2011.
Securitized Products Exposure
Securitized products in fiscal 2009 totaled ¥839.6 billion, including ¥704.5 billion in residential mortgage backed securities (RMBS) originated mainly by Japan Housing Finance Agency. The Bank has no exposure to securitized products related to subprime loans, structured investment vehicles (SIVs), leveraged loans or monoline insurers, or U.S. government sponsored enterprises (GSEs). Furthermore, securitized products are all for investment purposes and the Bank does not include any products backed by its own assets among securitized products.

JAPAN POST BANK Annual Report 200954 55
MD
&A
Financial Statem
entsFinancial D
ata
Balances by Type of DepositMillions of yen
As of March 31, 2009
As of March 31, 2008 Y-o-Y change
Reference: As of September 30, 2008
Liquid deposits ¥ 59,660,898 ¥ 63,482,363 ¥(3,821,464) ¥ 61,454,511
Time deposits 117,488,226 117,887,704 (399,478) 116,712,202
Other deposits 330,715 373,739 (43,024) 394,638
Total ¥177,479,840 ¥181,743,807 ¥(4,263,966) ¥ 178,561,352
Notes: 1. Liquid deposits = Transfer deposits + Ordinary deposits + Savings deposits + Special deposits (equivalent to ordinary savings)
2. Time deposits = Time deposits + TEIGAKU deposits + Special deposits (Time savings equivalent + TEIGAKU savings equivalent + Installment postal savings equivalent + Postal savings for housing installments + Education installment savings equivalent)
3. Special deposits (corresponding to ordinary postal deposits) are due to banks received from the Management Organization for Postal Savings and Postal Life Insurance and correspond to the postal savings passed on to the organization by Japan Post.
Deposits Balance by CategoryMillions of yen
As of March 31, 2009
As of March 31, 2008 Y-o-Y change
Transfer deposits ¥ 7,269,971 ¥ 7,500,480 ¥ (230,509)
Ordinary deposits 46,109,765 48,243,513 (2,133,748)
Savings deposits 466,585 511,045 (44,460)
Time deposits 17,408,597 5,798,826 11,609,771
Special deposits 76,835,303 109,519,634 (32,684,331)
TEIGAKU deposits 29,058,902 9,796,566 19,262,335
Other deposits 330,715 373,739 (43,024)
Total ¥177,479,840 ¥181,743,807 ¥ (4,263,966)
Reserve for Employees’ Retirement BenefitsMillions of yen
As of March 31, 2009
As of March 31, 2008
Projected benefit obligation ¥(124,752) ¥(124,361)
Unfunded projected benefit obligation (124,752) (124,361)
Unrecognized net actuarial losses (2,832) (571)
Net amount recorded on the balance sheets (127,584) (124,932)
Reserve for employees’ retirement benefits ¥(127,584) ¥(124,932)
Breakdown of Total Retirement Benefit CostsMillions of yen
As of March 31, 2009
As of March 31, 2008
Service cost ¥5,922 ¥3,019
Interest cost on projected benefit obligation 2,117 1,082
Amortization of unrecognized net actuarial losses (57) –
Assumptions Used in the Calculation of the Above InformationAs of March 31,
2009 As of March 31,
2008
Method of attributing the projected benefits to periods of service Straight-line basis Straight-line basis
Discount rate 1.7% 1.7%
Amortization period of unrecognized actuarial gains (losses) 10 years 10 years
Net Assets
Millions of yen
As of March 31, 2009
As of March 31, 2008 Y-o-Y change
Common stock ¥3,500,000 ¥3,500,000 –
Capital surplus 4,296,285 4,296,285 –
Retained earnings 413,140 206,577 ¥ 206,563
Total shareholders’ equity 8,209,426 8,002,862 206,563
Net unrealized gains (losses) on available-for-sale securities (16,877) 73,992 (90,869)
Unrealized gains (losses) on hedging derivatives (12,974) – (12,974)
Total valuation and translation adjustments (29,851) 73,992 (103,844)
Total net assets ¥8,179,574 ¥8,076,855 ¥ 102,718
Capital Resource Management
Net assets at the end of fiscal 2009 were ¥8,179.5 billion, up by ¥102.7 billion, or 1.2%, from the end of fiscal 2008. Shareholders’ equity was ¥8,209.4 billion, an increase of ¥206.5 billion, or 2.5%, from the end of fiscal 2008, due to an increase in retained earnings. We posted ¥16.8 billion of net unrealized
losses on available-for-sale securities in fiscal 2009, down from ¥90.8 billion of gains in fiscal 2008, reflecting deterioration of financial markets. In addition, we book ¥12.9 billion of unrealized losses on hedging derivatives as these instruments were used to hedge interest rate and exchange rate risks.
At the end of fiscal 2009, net assets were ¥8,179.5 billion. We have maintained a capital adequacy ratio (non-consolidated, domestic standard) at a high level. As determined under the Banking Law of Japan, the Bank’s capital adequacy ratio at the end of fiscal 2009 was 92.09%, an increase of 6.18 percentage points from the end of fiscal 2008. In addition, Tier I capital accounted for the majority of the Bank’s capital, as underlined by its extremely high Tier I capital ratio of 92.08% at the end of fiscal 2009. The Bank’s risk-based capital totaled ¥8,152.4 billion, up by ¥171.4 billion, or 2.1%, from the end of fiscal 2008. This increase
was mainly attributable to a growth in retained earnings. Risk assets amounted to ¥8,852.4 billion, representing a decrease of ¥437.9 billion, or 4.7%, from the end of fiscal 2008. The decline is attributable mainly to a revision to the Bank’s asset structure, a result of the newly adopted diversified investment strategy, and a decrease in gross operating profits, which is a major component in the calculation of the operational risk equivalent.
Borrowed Money
At the end of fiscal 2009, the balance of borrowed money was ¥8.7 trillion, a decline of ¥12 trillion, or 57.9% from the end of fiscal 2008. Borrowed money represents the funds the postal savings business borrowed from the Ministry of Finance to manage at its own discretion, prior to the reforms to the Japanese government’s fiscal investment and loan program in fiscal 2002. No additional money has been borrowed subsequent to the reforms. The balance of borrowed money was equivalent to the
deposits (to the fiscal loan fund) in assets in fiscal 2009 and will fall to zero in fiscal 2011.
Reserve for Employees’ Retirement Benefits
The reserve for employees’ retirement benefits was ¥127.5 billion at the end of fiscal 2009, up by ¥2.6 billion, or 2.1%, from the end of fiscal 2008. We have adopted a lump-sum retirement benefit payment plan and do not use any other pension schemes.

JAPAN POST BANK Annual Report 200956 57
MD
&A
Financial Statem
entsFinancial D
ata
Capital Adequacy Ratio (Non-Consolidated, Domestic Standard)Millions of yen, %
As of March 31, 2009
As of March 31, 2008
Tier I capital (A) ¥8,152,126 ¥7,980,062
Tier II capital (B) 370 950
Deductions (C) – –
Total risk-based capital (A+B–C) (D) 8,152,496 7,981,013
Risk assets (E): 8,852,495 9,290,447
On-balance-sheet items 5,406,131 4,920,454
Off-balance-sheet items 74,249 882,951
Operational risk equivalent / 8% 3,372,115 3,487,041
Capital adequacy ratio (D/E) 92.09 85.90
Tier I capital ratio (A/E) 92.08 85.89
Off-Balance Sheet Arrangements & Contractual Cash Obligations
Contractual cash obligations in fiscal 2009 were as follows:
1. Assets pledged as of March 31, 2009 as collateral and their relevant liabilities at March 31, 2009 were as follows:Millions of yen
Assets pledged as collateral:
Securities ¥76,643,404
Relevant liabllities to the above assets:
Deposits 76,852,848
Payables under securities lending transactions 804,770
Millions of yen
One year or less ¥ 38,888
Over one year 89,202
Total ¥128,090
Critical Accounting Policies and Estimates
Dividends
While taking into account the Bank’s earnings performance and financial market conditions, the Bank intends as a policy matter to reinforce its capital base in a bid to retain its financial health, seek future growth opportunities, and boost its shareholder value by enhancing returns to shareholders. In view of the above-mentioned capital policy, the Bank increased the total cash dividend paid for fiscal 2009 to ¥57.3
billion, up from ¥22.8 billion in fiscal 2008, and the per-share cash dividend to ¥382, up from ¥152. The dividend payout ratio was 24.98%, representing an increase of 14.98% in fiscal 2008. It should be noted that the cash dividend paid in fiscal 2008 essentially reflects that of a six-month period following privatization on October 1, 2007, the date on which the Bank launched its banking operations.
Additionally, securities at March 31, 2009 amounting to ¥3,081,318 million are pledged as collateral for transactions such as BOJ overdrafts, exchange settlement transactions, or substitute securities for derivatives. At March 31, 2009, guarantee deposits of ¥834 million were included in “Other assets” in the accompanying balance sheet.
2. Contracts of loan commitments are contracts with customers to lend funds up to a certain limit agreed in advance. The Bank will make the loans upon the request of an obligor to draw down funds under such loan agreements as long as there is no breach of various terms and conditions stipulated in the relevant loan agreement. The unused commitment balance relating to these loan agreements at March 31, 2009 amounted to ¥26,200 million. Of this amount, ¥26,200 million was associated with loans in which the term of the agreement was less than one
year or unconditional cancellation of the agreement was allowed at any time. In many cases the term of the agreement runs its course without the loan ever being drawn down. Therefore, the unused amount will not necessarily affect future cash flows. Conditions are included in certain loan agreements which allow the Bank to decline the request for a loan draw-down when there is due cause to do so, such as when there is a change in financial condition or when it is necessary to protect the Bank’s credit. At the inception of contracts, the Bank has the obligor pledge collateral to the Bank
in the form of real estate, securities, etc., if considered to be necessary. Subsequently, the Bank reviews the obligor’s financial condition in accordance with the Bank’s established internal procedures and takes necessary measures to protect its credit.
3. The Bank has contractual obligations to make future payments on consignment contracts for system related services (such as usage of hardware, software, telecommunication services, and maintenance). The details are as follows:
Our financial statements are prepared in accordance with accounting principles generally accepted in Japan (“Japanese GAAP”). The preparation of these financial statements requires management to make estimates and assumptions that may affect the reported amounts in the financial statements. Our management continues to evaluate these estimates and assumptions taking into consideration experiences and various other information that management believes to be reasonable under the circumstances. Actual results may differ from these estimates and assumptions as these estimates and assumptions often involve uncertainties. Our management believes the following to be critical accounting policies and estimates that are expected to have a material impact on the reported amounts in our financial statements.
Valuation of Securities
The investment balances of our securities are important items in our financial statements. Accounting policies applied by management that require estimates of the value of the securities are expected to have a material impact on our financial statements. The securities we hold include “held-to-maturity securities” and “other securities.” Within “other securities,” the market price at the balance sheet date, if available, is recorded as the fair value. If there is no available market price at the balance sheet date, the fair value is based on the appraisal value assessed by independent third parties, such as brokers.
Valuation of Money Held in Trust
Accounting policies applied by management that require estimates of the value of money held in trust and impairment losses related to money held in trust are expected to have a material impact on our financial statements. “Other money held in trust” includes trust assets that consist of equity securities. Gains and losses on equity securities are recognized based on the average market prices during the last month of the fiscal period. The purpose is to level off short-term price fluctuations, as these equity securities are not purchased to be resold in a short period of time. In addition, if the market value of an equity security declines substantially from its cost at acquisition and we determine that its value is not likely to increase, the equity security is restated at the market price on the balance sheet and we record a valuation loss for the fiscal year. An equity security within money held in trust is deemed to have declined substantially when its market value declines by 50% or more from its cost at acquisition. In determining if an equity security’s value is not likely to increase, we consider the possibility that the market price of a security may recover if decreases are due to an overall decline of the stock market in the short-term or to changes in interest and foreign exchange rates, and not due to reasons specific to the security. However, management determines that an equity security’s value is not likely to increase when its average market value over the six months before the fiscal year end is 70% of its cost at acquisition or less.

JAPAN POST BANK Annual Report 200958 59
MD
&A
Financial Statem
entsFinancial D
ata
Risk Management
Process of Risk Management and Risk Capital Allocation
Risk capital(Core capital)
Risk capital for allocation
Risks being taken
Risk buffer
Operational risk
Market risk
Credit risk
Credit risk
Market risk
Operational risk
Capital not yet allocated(held in reserve for additional allocations, a stress event, etc.)
Management believes that its accounting policies applied to make estimates of the value of money held in trust are reasonable and conservative. If management later concludes that what had been viewed as a short-term economic cycle decline of the stock market is other than temporary, management may revise its criteria for determining whether the market values of equity securities within money held in trust are likely to increase or are recoverable and may additionally impair the values.
Reserve for Employees’ Retirement Benefits
The Bank has established a lump-sum retirement payment plan for employees in accordance with its internal retirement benefit rules. Periodic expenses and accrued liabilities relating to employees’ retirement benefits are calculated based on a number of actuarial assumptions, including discount rates, withdrawals, mortality, and rates of increase of compensation levels, which management determines by comprehensively considering all available information. The discount rate assumptions are based on high grade fixed income investment yields with durations that approximately match the estimated number of years remaining until employee retirement, the point at which benefit payment occurs. Management has set the discount rate at 1.7% after taking into account potential bond interest rate fluctuations, in addition to the above-mentioned assumptions. Actuarial gains and losses, the difference between actual payments and the above-mentioned assumptions, are recognized in income or expenses using the straight-line method over a period of years. Management has set this period as 10 years, which is fairly shorter than the expected average remaining years of service of employees. Management believes that the assumptions used are appropriate; however, differences between actual consequences and the above mentioned assumptions may affect retirement benefit expenses and liabilities in the future.
Deferred Tax Assets
Deferred tax assets are an important item on the asset side of our balance sheet. Accordingly, accounting policies applied by management that require estimates of the extent to which deferred tax assets will be utilized are expected to have a material impact on our financial statements. Each period we record taxable income sufficiently in excess of deductions resulting from temporary differences at the end of each period in accordance with the JICPA Auditing Committee Report No.66 “Auditing Treatment Regarding Judgment of Realizability of Deferred Tax Assets.” Accordingly, management has concluded that deferred tax assets are expected to be fully utilized. Management believes that the above conclusion of the extent to which deferred tax assets will be utilized is reasonable. However, substantial unanticipated changes to our business environment may arise reducing the extent to which deferred tax assets will be utilized and resulting in a material impact to the reported amounts in our financial statements.
Basic Approach
Advances in financial deregulation, globalization, and information technology have led to rapid growth in the diversity and complexity of banking operations, exposing financial institutions to various risks. We have placed a high priority on risk management to ensure a sophisticated framework that identifies, measures, monitors, and controls a wide variety of risks associated with our operational activities. Our basic policy is to manage risks in view of our management strategies and risk characteristics and to achieve optimal allocation of resources. By doing so, we are able to ensure a stronger financial condition and maximize shareholder value by maintaining a sound operation. The roles and responsibilities of personnel involved in risk management are assigned so that conflicts of interest do not occur and cross checking activities are performed effectively.
Integrated Risk Management
We broadly classify and define risks into five categories: market, market liquidity, funding liquidity, credit, and
operational risks. We analyze these risks from both quantitative and qualitative approaches. From our quantitative approach, we establish in advance a total amount of equity capital that is available to take on risk, or risk capital. Risk capital is then allocated to each business in accordance with the type of expected risk and nature of the business activities. We calculate our risk capital based on value at risk, or VaR, techniques that ensure objective and appropriate assessments as a uniform measurement standard. VaR is a statistical method used to compute the maximum expected loss based on assets and liabilities held at given probabilities and for given periods of time. From our qualitative approach – used in conjunction with the quantitative methodology – we assess the nature of the risks. For instance, we have established an integrated plan, do, check, action, or PDCA, cycle for operational risk that uniformly recognizes, evaluates, manages, and reduces risk. Allocation of risk capital is determined by the Representative Executive Officers,namely, the CEO and COO, following discussions in the ALM Committee and Executive Committee.

JAPAN POST BANK Annual Report 200960 61
MD
&A
Financial Statem
entsFinancial D
ata
Market Risk Management / Market Liquidity Risk Management
Market Risk Management System
Confirm transactions
Grants of internal credit ratings Audits
Reports on transactions
Reports regularly
Monitor
Board of Directors / Representative Executive Officer / Executive CommitteeALM Commitee / Risk Management Commitee
Front office
Back office(Treasury Administration and IT Dept.)
Middle office(Risk Management Dept.)Global Securities Investment Dept.
Syndicated Loan Dept, Others
Credit Office
Reports on audit results
VaR (From April 1, 2008 to March 31, 2009)Billions of yen
Fiscal 2008 Year end Maximum Minimum Average
¥1,560.1 ¥2,401.3 ¥1,560.1 ¥1,958.7
Risk Management Organization
We have established risk management departments per each risk category and a Risk Management Department, which operates independently from other departments. The risk management departments with in each risk category are responsible for monitoring the risk within the respective risk category. The Risk Management Department is responsible for monitoring the risks within the risk categories in an integrated manner in order to ensure comprehensive risk management. The Executive Committee has established special advisory committees – the Risk Management Committee and the ALM Committee – to handle risk management responsibilities. These advisory committees submit risk management reports based on the nature of each risk and review risk management policies and measures. Prior to launching new products, services, or businesses, potential risks are assessed and appropriate methods to determine risks are selected in order to establish a suitable risk management system for them.
Implementation of Basel II
The Basel Committee on Banking Supervision, an arm of the Bank for International Settlements, has set capital adequacy standards for all internationally active banks to ensure minimum levels of capital. The Basel Committee recently released a revised version, Basel II, which has been applied to Japanese banks since March 31, 2007. Basel II is based on three pillars: (1) minimum capital requirements, (2) a supervisory review process for risk assessment that cannot be fully addressed through minimum capital requirements alone (such as interest rate risks in the banking book and credit concentration risks), and (3) market discipline allowing for market assessment through appropriate disclosures. The Bank complies with all provisions of Basel II. The Bank has adopted the standardized approach to calculate its credit risk-weighted assets and the basic approach to assess the capital requirements for operational risk. Meanwhile, the Bank has adopted special exemptions for market risk amounts.
1. Market Risk ManagementThe Bank has developed a proprietary business model, which enables the Bank to gather deposits from nationwide individual customers. Under a sophisticated risk management framework, it ensures stable income flow by investing in secure and high-quality financial products – primarily Japanese Government Bonds. The majority of our deposits consist of 10-year TEIGAKU deposits, puttable after six months. Since Japanese Government Bonds account for the majority of our assets and TEIGAKU deposits for a majority of our liabilities, we focus on carefully adjusting asset and liability durations in order to secure stable income. Our market risk management system reflects the nature of assets and liabilities as indicated above. Our market risk management starts with setting appropriate risk limits to reflect risk capital allocations. We then ensure that market risk does not exceed our limits based on our financial strengths which are driven by a number of factors
including capital. The amount of market risks is measured by VaR. We also carry out various stress tests to factor in extreme market fluctuations that might not be measured under the VaR statistical method. In addition, we closely monitor and carefully control interest rate risk by performing earning simulations based on various market scenarios, given the importance of interest rate risk impact upon the Bank’s profit structure. To provide a system of cross checks and balances in market operations, we have set up the Risk Management Department as a “middle office” that is independent from the Bank’s front and back offices. Under the market risk management system, the Bank fully utilizes a VaR and quantitative risk limit framework on a daily basis to enable responsive and proactive decision-making. The Bank seeks to achieve a stable income flow by regularly conducting back and stress tests and reporting to the ALM Committee.
2. Market Risk Measurement ModelOur internal VaR risk management model measures market risk based on a historical simulation method, using as parameters a one-tailed confidence interval of 99%, a holding period of 240 business days (equivalent to one year), and an observation period of 1,200 business days (equivalent to five years). To measure interest rate risk relating to liquid deposits, we define the amount of “core deposits” as the smallest of (1) the minimum balance in the last 5 years, (2) the balance after deducting the maximum annual outflow in the last 5 years
from the current balance, or (3) the equivalent of 50% of the current balance, and assume the maturity of the deposits up to five years (the average is 2.5 years). Meanwhile, interest rate risk relating to TEIGAKU deposits is calculated based on an estimated future cash flow model.
3. Market Risk ExposureCurrently, the Bank is not involved in trading operations. In fiscal 2009, market risk (VaR) of the Bank’s banking operations was as follows:
4. Stress Testing Our VaR model calculates risk amounts using a statistical formula based on historical data, but is not designed to capture certain extreme market fluctuations. Accordingly, the Bank regularly conducts stress tests to measure potential losses using a number of scenarios, including the estimated effect of largest fluctuations in financial markets over the past decade. The results of the stress tests are reported to the ALM Committee and other risk management-related departments.
5. Market Liquidity Risk Management Our basic approach to market liquidity risk management is to monitor portfolio assets and market conditions so that the Bank is able to take appropriate actions in line with market liquidity conditions. The Risk Management Department monitors market liquidity risk as well as market risk.

JAPAN POST BANK Annual Report 200962 63
MD
&A
Financial Statem
entsFinancial D
ata
Funding Liquidity Risk Management
Credit Risk Management
Asset ClassificationsAsset category Description
Unclassified (Type I) Assets not classified as type II, III, or IV and deemed to have no material concerns in their recovery
Type II Assets that carry above-ordinary level of risk to the recovery of those assets due to insufficient repayment capacity or credit-related issues of borrowers
Type III Assets for which final recovery or asset value is very doubtful and pose a high risk of incurring a loss
Type IV Assets assessed as unrecoverable or worthless
Operational Risk Management
1. Credit Risk ManagementThe Bank’s assets mainly consist of Japanese Government Bonds, with limited investments in Japanese corporate bonds, syndicated loans, and other instruments. Taking into account our credit policy focusing on securing high-quality assets, we selectively invest in Japanese corporate bonds with high credit ratings. Consequently, our credit risk exposure is relatively small compared with our market risk exposure. Similar to market risk, we monitor and manage credit risk by setting credit risk and loss limits to reflect risk capital allocations determined by the committee. We use VaR to measure credit risk and also carry out various stress tests factoring in extreme market fluctuations that might not be measured under the VaR statistical method. In order to control credit concentration, we have set credit limits for individual companies and corporate groups according to their creditworthiness and monitor the portfolios in an appropriate manner by adhering to these limits. Looking ahead, we plan to improve our credit portfolio management as we expect to expand our borrower base. The Risk Management Department functions as a “middle office” independently from its front and back offices to provide a system of cross checks and balances in credit risk management. We also have a Credit Office for credit investigations. The Risk Management Department oversees the Bank’s internal credit rating system, self-assessments of loans, and other credit risk management activities. The Credit Office assigns internal credit ratings, monitors borrower status, watches large borrowers, and judges individual loans. The Risk Management Committee, the ALM Committee, and the Executive Committee regularly hold meetings to discuss key issues related to risk management.
2. Measuring Credit Risk Our credit risk (VaR) measurement model employs the Monte Carlo simulation method, which is designed to provide a 99 VaR confidence level and is calculated for a one-year time period. In addition, we calculate losses using the mark-to-market method, which recognizes losses from defaults by borrowers as well as those on loans whose economic value was reduced due to cuts in the credit ratings of the respective borrowers.
3. Stress Testing Our VaR calculations represent a statistical measurement of credit risk based on the probabilities associated with the changes in credit ratings and other financial conditions. Consequently, the model cannot properly reflect credit risks under conditions of extreme market volatility or when the assumptions used for our calculations are no longer valid. For that reason, we regularly conduct stress tests to determine the magnitude of losses that could result from market volatility exceeding the range of assumptions used in our model. In our stress tests, we use a number of scenarios, including the estimated effect of largest fluctuations in financial markets over the past decade. The results of the stress tests are reported to the ALM Committee and other risk management-related departments.
4. Internal Credit Ratings Internal credit ratings are used for various purposes such as credit risk measurement, loan pricing, self-assessments, and in determining reserves for possible loan losses and write-offs.
6. Management of Individual Borrowers We regularly monitor the loan repayment history and financial conditions of our borrowers in order to capture the credit risks of borrowers in a timely and appropriate manner. We are also
engage in stricter monitoring for those borrowers requiring extra attention due to a possible credit rating downgrade or sharp drops in stock prices.
The Bank classifies operational risks into seven categories: processing, computer system, information assets, legal, human resources, tangible assets, and reputational risks. We identify, assess, control, monitor, and mitigate risks for each risk category to manage operational risks and to maintain the soundness of our operations. The risk management process identifies risks associated with business operations and assesses these risks based on the occurrence frequency, and the degree of their impact on operations. Through the implementation of Risk & Control Self-Assessment (RCSA), operational risks and the control effectiveness for mitigating these risks are regularly assessed and examined.
RCSA points out areas that require improvement and aspects of our risk management activities that need to be reinforced. Based on the results, we form improvement plans, establish measures to further mitigate risk exposure, and take the required actions. The Bank has an operational risk reporting system to track and update operational errors and accidents in a timely manner. We analyze the contents of these reports to determine the causes of these events and identify trends. This process yields fundamental data for formulating and executing effective countermeasures.
Our basic steps in funding liquidity risk management are to closely monitor the funding conditions and take timely and appropriate actions. We then maintain appropriate liquidity reserves for unexpected fund outflows. Through these steps, the Risk Management Department monitors and analyzes the Bank’s funding liquidity indicators to ensure a stable liquidity management.
We have established a company-wide system to manage liquidity risk by categorizing the risk into the following three stages: “normal,” “concerned,” and “emergency.” We have also established a liaison and consultation system for funding in preparation for possible contingencies at the “concerned” and “emergency” stages.
5. Self-Assessments, Write-Offs, and Reserves We conduct self-assessments to classify assets based on their creditworthiness. This is an integral part of credit risk management and is the basis for appropriate accounting treatment, including reserves for possible loan losses and write-offs. The Bank carries out self-assessment of asset quality using criteria based on the practical guidelines for examining internal control regarding self-assessment of assets in banks and other financial institutions and auditing write-offs for defaulted loans and provisioning for possible loan losses as defined by the Financial Services Agency. Departments are responsible for self-assessments and assess the security of each asset.
• Loans to borrowers classified as normal or requiring special attention are divided into groups according to their default probability, and the expected loss amount for each classfication is reserved based on the classfication’s historical default ratio.
• For loans to doubtful borrowers, we set reserves for the remaining portion of the loan, as appropriate, after deducting the estimated value of collateral and guarantees from the loan.
• For loans to virtually bankrupt and already bankrupt borrowers, we deduct the estimated value of collateral and the amount that can be covered from guarantees from the loan balance and establish reserves for the entire remaining portion of the loan.

JAPAN POST BANK Annual Report 200964
MD
&A
Financial Statem
entsFinancial D
ata
65
Balance Sheets
Millions of yen
Thousands of U.S. dollars
(Note 1)
2009 2008 2009Assets
Cash and due from banks: ¥ 5,999,116 ¥ 8,835,055 $ 61,072,138
Cash 124,681 192,491 1,269,278
Due from banks 5,874,434 8,642,564 59,802,860
Call loans 51,184 3,655,000 521,063
Receivables under resale agreements − 149,803 −
Receivables under securities borrowing transactions 725,786 − 7,388,640
Monetary claims bought 66,409 20,908 676,061
Trading account securities (Note 20): 159 172 1,623
Trading Japanese government bonds 159 172 1,623
Money held in trust (Notes 19 and 20) 1,224,742 412,570 12,468,111
Securities (Notes 7, 19 and 20): 173,551,137 172,532,116 1,766,783,447
Japanese Government Bonds 155,490,155 156,773,157 1,582,919,230
Japanese local government bonds 6,177,212 7,499,247 62,885,192
Japanese corporate bonds 10,423,366 7,801,698 106,111,843
Other securities 1,460,403 458,012 14,867,181
Loans (Note 22): 4,031,587 3,771,527 41,042,326
Loans on deeds 3,790,537 3,502,875 38,588,390
Overdrafts 241,050 268,651 2,453,936
Foreign exchanges (Note 3) 9,872 13,453 100,505
Other assets (Note 4) 10,480,635 22,514,239 106,694,856
Tangible fixed assets (Note 5) 170,392 186,469 1,734,627
Intangible fixed assets (Note 6) 29,586 27,106 301,201
Deferred tax assets (Note 24) 141,273 32,269 1,438,191
Reserve for possible loan losses (1,087) (1,510) (11,074)
Total assets ¥ 196,480,796 ¥ 212,149,182 $ 2,000,211,714
See notes to financial statements.
Millions of yen
Thousands of U.S. dollars
(Note 1)
2009 2008 2009Liabilities
Deposits (Notes 7 and 8) ¥ 177,479,840 ¥ 181,743,807 $ 1,806,778,383
Payables under securities lending transactions (Note 7) 804,770 − 8,192,719
Borrowed money (Note 9): 8,700,000 20,700,000 88,567,647
Borrowings 8,700,000 20,700,000 88,567,647
Foreign exchanges (Note 3) 102 327 1,042
Other liabilities (Note 10) 1,182,240 1,496,986 12,035,429
Contingent liabilities (Note 11)Reserve for employees’ bonuses 6,542 6,227 66,600
Reserve for employees' retirement benefits (Note 23) 127,584 124,932 1,298,839
Reserve for directors' retirement benefits 141 45 1,436
Total liabilities 188,301,222 204,072,327 1,916,942,096
Net assets (Note 16)Common stock 3,500,000 3,500,000 35,630,663
Capital surplus 4,296,285 4,296,285 43,737,005
Retained earnings 413,140 206,577 4,205,845
Total shareholder’s equity 8,209,426 8,002,862 83,573,512
Net unrealized gains (losses) on available-for-sale securities (Note 20) (16,877) 73,992 (171,811)
Unrealized gains (losses) on hedging derivatives (12,974) − (132,083)
Total valuation and translation adjustments (29,851) 73,992 (303,894)
Total net assets 8,179,574 8,076,855 83,269,618
Total liabilities and net assets ¥ 196,480,796 ¥ 212,149,182 $ 2,000,211,714
As of March 31, 2009 and 2008
Financial Statements

JAPAN POST BANK Annual Report 200966
MD
&A
Financial Statem
entsFinancial D
ata
67
Statements of Changes in Net AssetsStatements of IncomeFor the years ended March 31, 2009 and 2008 For the years ended March 31, 2009 and 2008
Millions of yen
Thousands of U.S. dollars
(Note 1)
2009 2008 2009Revenues:
Interest income: ¥ 2,309,926 ¥ 1,265,087 $ 23,515,490
Interest on loans 45,185 22,847 460,001
Interest and dividends on securities 1,940,865 936,981 19,758,376
Interest on call loans 14,333 5,993 145,918
Interest on receivables under resale agreements 2,366 297 24,089
Interest on receivables under securities borrowing transactions 28,589 15,767 291,045
Interest on deposits with banks 23,288 9,222 237,080
Other interest income 255,297 273,977 2,598,982
Fees and commissions: 112,334 59,556 1,143,587
Fees and commissions on domestic and foreign exchanges 66,592 35,296 677,920
Other fees and commissions 45,742 24,259 465,668
Other operating income (Note 12) 53,791 703 547,604
Other income (Note 13) 12,965 3,716 131,988
Total income 2,489,017 1,329,063 25,338,670
Expenses:Interest expenses: 657,022 394,863 6,688,610
Interest on deposits 373,863 181,412 3,805,999
Interest on payables under securities lending transactions 25,878 15,536 263,450
Interest on borrowings 255,091 197,357 2,596,875
Interest on interest rate swaps 1,591 − 16,201
Other interest expenses 597 557 6,084
Fees and commissions: 21,238 9,704 216,208
Fees and commissions on domestic and foreign exchanges 297 37 3,026
Other fees and commissions 20,940 9,666 213,182
Other operating expenses (Note 14) 53,452 1,218 544,155
General and administrative expenses 1,266,205 617,787 12,890,214
Other expenses (Note 15) 106,885 49,649 1,088,115
Total expenses 2,104,803 1,073,222 21,427,303
Income before income taxes 384,213 255,840 3,911,367
Income taxes (Note 24): Current 192,604 132,277 1,960,751
Deferred (37,754) (28,617) (384,343)
Total income taxes 154,850 103,659 1,576,408
Net income ¥ 229,363 ¥ 152,180 $ 2,334,960
YenU.S. dollars
(Note 1)
2009 2008 2009Net income per share (Note 27) ¥1,529.08 ¥ 2,026.89 $15.57
See notes to financial statements.
Millions of yen
Thousands of U.S. dollars
(Note 1)
2009 2008 2009Common stock:
Balance at beginning of year ¥ 3,500,000 ¥ 50 $ 35,630,663
Issuance of new stock − 3,499,950 −
Balance at end of year ¥ 3,500,000 ¥ 3,500,000 $ 35,630,663
Capital surplus:Balance at beginning of year ¥ 4,296,285 ¥ 50 $ 43,737,005
Issuance of new stock − 4,296,235 −
Balance at end of year ¥ 4,296,285 ¥ 4,296,285 $ 43,737,005
Retained earnings:Balance at beginning of year ¥ 206,577 ¥ (21) $ 2,102,993
Tax effect (deferred) due to privatization − 54,418 −
Cash dividends (22,800) − (232,108)
Net income 229,363 152,180 2,334,960
Balance at end of year ¥ 413,140 ¥ 206,577 $ 4,205,845
Total shareholder's equity:Balance at beginning of year ¥ 8,002,862 ¥ 78 $ 81,470,660
Issuance of new stock − 7,796,185 −
Tax effect (deferred) due to privatization − 54,418 −
Cash dividends (22,800) − (232,108)
Net income 229,363 152,180 2,334,960
Balance at end of year ¥ 8,209,426 ¥ 8,002,862 $ 83,573,512
Net unrealized gains (losses) on available-for-sale securitiesBalance at beginning of year ¥ 73,992 − $ 753,262
Net changes in items other than shareholder’s equity (90,869) ¥ 73,992 (925,073)
Balance at end of year ¥ (16,877) ¥ 73,992 $ (171,811)
Unrealized gains (losses) on hedging derivativesBalance at beginning of year − − −
Net changes in items other than shareholder’s equity ¥ (12,974) − (132,083)
Balance at end of year ¥ (12,974) − $ (132,083)
Total valuation and translation adjustmentsBalance at beginning of year ¥ 73,992 − $ 753,262
Net changes in items other than shareholder’s equity (103,844) ¥ 73,992 (1,057,156)
Balance at end of year ¥ (29,851) ¥ 73,992 $ (303,894)
Total net assets: Balance at beginning of year ¥ 8,076,855 ¥ 78 $ 82,223,923
Issuance of new stock − 7,796,185 −
Tax effect (deferred) due to privatization − 54,418 −
Cash dividends (22,800) − (232,108)
Net income 229,363 152,180 2,334,960
Net changes in items other than shareholder’s equity (103,844) 73,992 (1,057,156)
Balance at end of year ¥ 8,179,574 ¥ 8,076,855 $ 83,269,618
See notes to financial statements.

JAPAN POST BANK Annual Report 200968
MD
&A
Financial Statem
entsFinancial D
ata
69
Statement of Cash FlowsFor the year ended March 31, 2009
Millions of yen
Thousands of U.S. dollars
(Note 1)
2009 2009
Cash flows from operating activities:Income before income taxes ¥ 384,213 $ 3,911,367Adjustments for:
Depreciation and amortization 54,797 557,846Losses on impairment of fixed assets 63 642Net change in reserve for possible loan losses (422) (4,302)Net change in reserve for employees’ bonuses 314 3,206Net change in reserve for employees’ retirement benefits 2,652 27,000Net change in reserve for directors’ retirement benefits 95 969Interest income (2,309,926) (23,515,490)Interest expense 657,022 6,688,610Net securities gains (151) (1,543)Gains on money held in trust—net 100,200 1,020,062Losses on foreign exchanges—net 292 2,977Losses on sale and disposal of fixed assets—net 1,432 14,579Net change in loans (260,128) (2,648,157)Net change in deposits (4,263,966) (43,407,991)Proceeds from maturity of deposits to the fiscal loan fund 12,000,000 122,162,272Net change in borrowed money (12,000,000) (122,162,272)Net change in negotiable certificates of deposit 514,000 5,232,617Net change in call loans 3,708,044 37,748,592Net change in receivables under securities borrowing transactions (725,786) (7,388,640)Net change in payables under securities lending transactions 804,770 8,192,719Net change in foreign exchange assets 3,581 36,456Net change in foreign exchange liabilities (225) (2,291)Interest received 2,387,231 24,302,473Interest paid (744,332) (7,577,442)Other—net (26,452) (269,289)
Subtotal 287,319 2,924,971Income taxes paid (230,841) (2,350,013)Net cash provided by operating activities 56,478 574,958
Cash flows from investing activities:Purchases of securities (66,091,066) (672,819,569)Proceeds from sales of securities 13,095,782 133,317,545Proceeds from maturity of securities 51,684,625 526,159,277Investment in money held in trust (1,029,778) (10,483,335)Proceeds from disposition of money held in trust 25,300 257,559Purchases of tangible fixed assets (31,692) (322,633)Proceeds from sales of tangible fixed assets 436 4,445Purchases of intangible fixed assets (9,631) (98,052)Proceeds from sales of intangible fixed assets 120 1,232Other—net (291) (2,966)Net cash used in investing activities (2,356,193) (23,986,496)
Cash flows from financing activities:Cash dividends paid (22,800) (232,108)Net cash used in financing activities (22,800) (232,108)
Effect of exchange rate changes on cash and cash equivalents 575 5,861Net decrease in cash and cash equivalents (2,321,939) (23,637,786)Cash and cash equivalents at beginning of year 5,021,055 51,115,299Cash and cash equivalents at end of year ¥ 2,699,116 $ 27,477,513
See notes to financial statements.
1. BASIS OF PRESENTING FINANCIAL STATEMENTSJapan Post Bank Co., Ltd. (the “Bank”) became a private bank under the Banking Law of Japan (the “Banking Law”), as a wholly owned subsidiary of Japan Post Holdings Co., Ltd., following its privatization on October 1, 2007 in accordance with the Postal Service Privatization Law. The Bank has no subsidiaries to consolidate. The accompanying financial statements have been prepared in accordance with the provisions set forth in a) the Japanese Financial Instruments and Exchange Law and its related accounting regulations and b) the Ordinance for Enforcement of the Banking Law (1982 Finance Ministry Order No. 10), and in conformity with accounting principles generally accepted in Japan (“Japanese GAAP”), which are different in certain respects as to application and disclosure requirements of International Financial Reporting Standards. In preparing these financial statements, certain reclassifications and rearrangements have been made to the financial statements issued domestically in order to present them in a form which is more familiar to readers outside Japan. In conformity with the Japanese Financial Instruments and Exchange Law and its related accounting regulations, all Japanese yen figures in the financial statements have been rounded down to the nearest million yen, except for per share data. Accordingly, the total of each account may not be equal to the combined total of individual items. The financial statements are stated in Japanese yen, the currency of the country in which the Bank is incorporated and operates. The translations of Japanese yen amounts into U.S. dollar amounts are included solely for the convenience of readers outside Japan and have been made at the rate of ¥98.23 to US$1.00, the approximate rate of exchange at March 31, 2009. Such translations should not be construed as representations that the Japanese yen amounts could be converted into U.S. dollars at that or any other rate. All U.S. dollar figures in the financial statements have been rounded up to the nearest million yen, except for per share data. Accordingly, the total of each account may not be equal to the combined total of individual items.
2. SUMMARY OF SIGNIFICANT ACCOUNTING POLICIES a. Trading Account Securities, Securities and Money Held in Trust—Securities are classified into four categories, based
principally on the Bank’s intent, as follows: (1) Trading account securities which are held in the short term are reported at fair value, and the related unrealized gains and
losses are included in earnings; (2) Held-to-maturity securities, which are expected to be held to maturity with the positive intent and ability to hold to maturity, are
reported at amortized cost using the straight-line method; (3) Investments in affiliates are reported at cost determined by the moving-average method; and (4) Available-for-sale securities, which are not classified as either of the aforementioned securities, are reported at fair value,
with unrealized gains and losses including foreign exchange fluctuations, but excluding cases where the fair value hedge accounting method is applied to hedge exposure to the risks of foreign exchange fluctuations, net of applicable income taxes, reported in a separate component of net assets. Available-for-sale securities whose fair value is not available are reported at cost or amortized cost determined by the moving-average method. In addition, the costs of available-for-sale securities sold are determined primarily based on the moving-average method. Securities (stocks) invested in money held in trust, which is solely entrusted by the Bank for security trading purposes, are stated at the fair market value. Realized gains and losses on these securities are computed using the average market price of the final month in the fiscal year. Unrealized gains and losses on these securities are reported, net of applicable income taxes, in a separate component of net assets.
b. Tangible Fixed Assets—Tangible fixed assets are stated at cost less accumulated depreciation. Depreciation of tangible fixed assets, except for buildings (excluding building attachments) which are depreciated using the straight-line method, is computed by the declining-balance method at rates based on the estimated useful lives of the assets. The range of useful lives is principally from 3 to 50 years for buildings and from 2 to 75 years for others.
Notes to Financial StatementsYears ended March 31, 2009 and 2008

JAPAN POST BANK Annual Report 200970
MD
&A
Financial Statem
entsFinancial D
ata
71
c. Intangible Fixed Assets—The amortization of intangible fixed assets is computed by the straight-line method. Capitalized cost of computer software developed/obtained for internal use is amortized by the straight-line method over the estimated useful lives of 5 years.
d. Foreign Currency Transactions— Foreign currency denominated assets and liabilities at the balance sheet date are translated into Japanese yen principally at the exchange rates in effect at the balance sheet date. Exchange gains and losses are recognized in the fiscal year in which they occur.
e. Reserve for Possible Loan Losses—Reserve for possible loan losses is provided for in accordance with the write-off and provision standards as described below: Loans to normal borrowers and borrowers requiring caution, as provided by “Practical Guidance for Checking Internal Controls for Self-Assessments of Assets by Banks and Other Financial Institutions and for Audits of Loans Written Off and Loan Loss Allowance Provisions” (Japanese Institute of Certified Public Accountants, Special Committee for Audits of Banks, etc., Report No. 4), are classified into certain groups, and a reserve is provided for each group based on the estimated rate of loan losses. For loans to doubtful borrowers, a reserve is provided in the amount of loans, net of amounts expected to be collected through disposition of collateral or through execution of guarantees, and considered to be necessary based on a solvency assessment. For loans to bankrupt or effectively/substantially bankrupt borrowers, a reserve is provided based on the amount of loans, net of amounts expected to be collected through disposition of collateral or to be recoverable under guarantees. The asset evaluation department assesses all loans in accordance with the self-assessment rule in cooperation with the marketing related divisions.
f. Reserve for Employees’ Bonuses—Reserve for employees’ bonus is provided for the estimated employees’ bonuses attributable to the fiscal year.
g. Reserve for Employees’ Retirement Benefits—Reserve for employees’ retirement benefits is provided based on the
projected benefit obligation at the balance sheet date. Actuarial gains and losses are recognized in income or expenses using the straight-line method over the average expected remaining service years (10 years) from the following year after they are incurred.
h. Reserve for Directors’ Retirement Benefits—Reserve for directors’ retirement benefits is provided for the estimated retirement benefits which are attributable to the fiscal year.
i. Derivatives and Hedging Activities— Derivatives are recognized as either assets or liabilities and stated at fair value. Gains or losses on derivative transactions are recognized in the statements of income. Hedging against interest rate risks: For the fiscal year ended March 31, 2009, the Bank used interest rate swaps to reduce its exposure to interest rate risk on its monetary assets and liabilities. In principle, the Bank applied the deferred-hedge accounting method for interest rate swaps. The interest rate swaps which qualify for hedge accounting and meet specific matching criteria were not remeasured at market value, but the differential paid or received under the swap agreements is recognized and included in interest expenses or income. For some financial assets and liabilities, the Bank applied special accounting treatment for interest rate swaps. For the fiscal year ended March 31, 2008, the Bank applied special accounting treatment for interest rate swaps for some financial assets and liabilities. Hedging against foreign exchange fluctuation risks: The Bank uses the deferred tax accounting method and the fair value hedge accounting method to reduce its exposure to exchange rate fluctuations on the portion of the net unrealized gains/losses on available-for-sale securities exposed to the risks of foreign exchange fluctuation risk. The Bank specifies hedges in such a way that major conditions of hedged items and hedging instruments are almost the same, and accordingly, considers that hedges are highly effective instead of making judgments on effectiveness.
j. Consumption Taxes—The Bank is subject to Japan’s national and local consumption taxes. Japan’s national and local consumption taxes are excluded from transaction amounts.
k. Income Taxes— The Bank adopts the consolidated taxation system designating Japan Post Holdings Co., Ltd. as the parent company.
l. Cash and Cash Equivalents—For purpose of the statement of cash flows, cash and cash equivalents represent cash and due from banks on the balance sheet, excluding negotiable certificates of deposit in other banks.
3. FOREIGN EXCHANGESForeign exchanges at March 31, 2009 and 2008 consisted of the following:
Millions of yenThousands of U.S. dollars
2009 2008 2009Assets
Due from foreign banks ¥ 9,814 ¥13,362 $ 99,912
Foreign bills bought and foreign exchanges purchased 58 90 593
Total ¥ 9,872 ¥13,453 $ 100,505
Liabilities
Foreign bills sold ¥ 37 ¥ 227 $ 381
Foreign bills payable 64 100 661
Total ¥ 102 ¥ 327 $ 1,042
4. OTHER ASSETSOther assets at March 31, 2009 and 2008 consisted of the following:
Millions of yenThousands of U.S. dollars
2009 2008 2009Domestic exchange settlement accounts-debit ¥ 12,999 ¥ 14,748 $ 132,340
Prepaid expenses 200 423 2,038
Accrued income 331,348 333,950 3,373,186
Derivatives other than that for trading 271 26 2,759
Deposits to the fiscal loan fund 8,700,000 20,700,000 88,567,647
Other 1,435,816 1,465,090 14,616,885
Total ¥10,480,635 ¥ 22,514,239 $106,694,856
5. TANGIBLE FIXED ASSETSTangible fixed assets at March 31, 2009 and 2008 consisted of the following:
Millions of yenThousands of U.S. dollars
2009 2008 2009Land ¥ 27,121 ¥ 27,121 $ 276,100
Buildings 75,862 80,470 772,299
Construction in progress 52 44 531
Other 67,355 78,833 685,697
Total ¥ 170,392 ¥186,469 $1,734,627

JAPAN POST BANK Annual Report 200972
MD
&A
Financial Statem
entsFinancial D
ata
73
6. INTANGIBLE FIXED ASSETSIntangible fixed assets at March 31, 2009 and 2008 consisted of the following:
Millions of yenThousands of U.S. dollars
2009 2008 2009Software ¥29,192 ¥22,652 $297,185
Other 394 4,454 4,016
Total ¥29,586 ¥27,106 $301,201
7. ASSETS PLEDGED AS COLLATERALAssets pledged as collateral and their relevant liabilities at March 31, 2009 and 2008 were as follows:
Millions of yenThousands of U.S. dollars
2009 2008 2009Assets pledged as collateral:
Securities ¥76,643,404 ¥113,317,421 $780,244,370
Relevant liabilities to the above assets:
Deposits 76,852,848 109,535,882 782,376,554
Payables under securities lending transactions 804,770 – 8,192,719
Additionally, securities at March 31, 2009 and 2008 amounting to ¥3,081,318 million ($31,368,406 thousand) and ¥1,361,157 million, respectively, are pledged as collateral for transactions such as BOJ overdrafts, exchange settlement transactions, or substitute securities for derivatives. At March 31, 2009 and 2008, guarantee deposits amounting to ¥834 million ($8,491 thousand) and ¥432 million, respectively, are included in “Other assets” in the accompanying balance sheets.
8. DEPOSITSDeposits at March 31, 2009 and 2008 consisted of the following:
Millions of yenThousands of U.S. dollars
2009 2008 2009Transfer deposits ¥ 7,269,971 ¥ 7,500,480 $ 74,009,681
Ordinary deposits 46,109,765 48,243,513 469,406,143
Savings deposits 466,585 511,045 4,749,924
Time deposits 17,408,597 5,798,826 177,222,820
Special deposits* 76,835,303 109,519,634 782,197,934
TEIGAKU deposits 29,058,902 9,796,566 295,825,133
Other deposits 330,715 373,739 3,366,747
Total ¥177,479,840 ¥181,743,807 $1,806,778,383
*Special deposits represent deposits received from Management Organization for Postal Savings and Postal Life Insurance, an independent administrative agency.
“Transfer deposits” correspond to “Current deposits” and “TEIGAKU deposits” to “Other deposits” in liabilities in accordance with the Banking Law Implementation Regulations. “Special deposits” are deposits with banks made by Management Organization for Postal Savings and Postal Life Insurance.
9. BORROWED MONEYBorrowed money at March 31, 2009 and 2008 consisted of the following:
Millions of yenThousands of U.S. dollars
2009 2008 2009Borrowings from the Ministry of Finance due November 2010, with annual weighted average interest rate of 1.88% ¥8,700,000 ¥20,700,000 $88,567,647
Total ¥8,700,000 ¥20,700,000 $88,567,647
Annual maturities of borrowed money at March 31, 2009 and 2008 were as follows:
Millions of yenThousands of U.S. dollars
Years ended March 31 2009 2008 2009One year or less ¥6,700,000 ¥12,000,000 $68,207,269
> One and ≤ two years 2,000,000 6,700,000 20,360,379
> Two and ≤ three years – 2,000,000 –
Total ¥8,700,000 ¥20,700,000 $88,567,647
10. OTHER LIABILITIESOther liabilities at March 31, 2009 and 2008 consisted of the following:
Millions of yenThousands of U.S. dollars
2009 2008 2009Domestic exchange settlement accounts-credit ¥ 20,177 ¥ 22,451 $ 205,406
Income taxes payable 42,313 43,457 430,758
Accrued expenses 792,908 867,260 8,071,962
Unearned income 22 12 234
Derivatives other than that for trading 23,304 120 237,241
Other 303,513 563,684 3,089,829
Total ¥1,182,240 ¥1,496,986 $12,035,429
11. CONTINGENT LIABILITIESThe Bank has contractual obligations to make future payments on consignment contracts for system related services (such as usage of hardware, software, telecommunication services, and maintenance). The details as at March 31, 2009 are as follows:
Millions of yenThousands of U.S. dollars
One year or less ¥ 38,888 $ 395,894
Over one year 89,202 908,094
Total ¥128,090 $1,303,988
The Bank had to establish an integrated information processing system for the Japan Post Group. Japan Post Holdings has signed contracts for the outsourcing of the provision of communications services for the fourth-generation system for business operations and for the outsourcing of the provision of communications services for the fourth-generation system for management information. As at March 31, 2008, payments under the provisions of these long-term contracts were ¥51,063 million.
12. OTHER OPERATING INCOMEOther operating income for the fiscal years ended March 31, 2009 and 2008 consisted of the following:
Millions of yenThousands of U.S. dollars
2009 2008 2009Gain on sales of bonds including government bonds ¥53,067 ¥366 $540,236
Other 723 336 7,368
Total ¥53,791 ¥703 $547,604
13. OTHER INCOMEOther income for the fiscal years ended March 31, 2009 and 2008 consisted of the following:
Millions of yenThousands of U.S. dollars
2009 2008 2009Reversal of reserve for possible loan losses ¥ 417 – $ 4,254
Recoveries of written-off loans 47 ¥ 159 481
Other 12,500 3,557 127,253
Total ¥12,965 ¥3,716 $131,988

JAPAN POST BANK Annual Report 200974
MD
&A
Financial Statem
entsFinancial D
ata
75
14. OTHER OPERATING EXPENSESOther operating expenses for the fiscal years ended March 31, 2009 and 2008 consisted of the following:
Millions of yenThousands of U.S. dollars
2009 2008 2009Losses on foreign exchanges ¥ 536 ¥1,214 $ 5,462
Losses on sales of bonds including government bonds and redemption of bonds including government bonds 52,915 3 538,692
Total ¥53,452 ¥1,218 $544,155
15. OTHER EXPENSESOther expenses for the fiscal years ended March 31, 2009 and 2008 consisted of the following:
Millions of yenThousands of U.S. dollars
2009 2008 2009Provision for reserve for possible loan losses – ¥ 495 –
Write-off of loans – 12 –
Losses on money held in trust ¥100,200 14,905 $1,020,062
Losses on sales and disposal of fixed assets 1,432 489 14,579
Losses on impairment of fixed assets 63 1 642
Other 5,189 33,745 52,832
Total ¥106,885 ¥49,649 $1,088,115
16. SHAREHOLDER’S EQUITYThe Corporate Law of Japan requires that all shares of common stock be issued with no par value and at least 50% of the amount paid of new shares is required to be recorded as common stock and the remaining net proceeds as capital reserve, which is included in capital surplus. The Corporate Law of Japan permits Japanese companies, upon approval of the Board of Directors, to issue shares to existing shareholders without consideration by way of a stock split. Such issuance of shares generally does not give rise to changes within shareholders’ accounts. The Corporate Law of Japan allows Japanese companies to purchase treasury stock and dispose of such treasury stock upon resolution of the Board of Directors. The aggregate purchased amount of treasury stock cannot exceed the amount available for future dividends plus the amount of common stock, capital reserve, or legal reserve that could be transferred to retained earnings or other capital surplus other than capital reserve upon approval of such transfer at the annual general meeting of shareholders. The maximum amount that the Bank is able to distribute as dividends subject to the approval of the shareholder is calculated based on the non-consolidated financial statements of the Bank in accordance with the Corporate Law of Japan.
Type and number of outstanding shares issued for the fiscal years ended March 31, 2009 and 2008 were as follows:Thousand shares
2009 Type of shares March 31, 2008 Increase Decrease March 31, 2009
Common stock 150,000 – – 150,000
Thousand shares
2008Type of shares March 31, 2007 Increase Decrease March 31, 2008
Common stock 2 149,998 – 150,000
Note: The increase in stock is attributed mainly to the issuance of new shares for the incorporation of the Bank.
Dividends distributed during the fiscal year ended March 31, 2009
Resolution TypeCash dividends(Millions of yen)
Cash dividends (Thousands of U.S. dollars)
Cash dividends per share (yen)
Cash dividends per share
(U.S. dollars) Record date Effective date
May 29, 2008 Common stock ¥22,800 $232,108 ¥152 $1.55 March 31, 2008 May 30, 2008
Dividends distributed during the fiscal year ended March 31, 2008There were no dividends distributed during the fiscal year ended March 31, 2008.
Of dividends whose record date was included in the fiscal years ended March 31, 2009 and 2008, those whose effective date occurs after the fiscal year’s closing
2009
Resolution TypeCash dividends(Millions of yen)
Cash dividends (Thousands of U.S. dollars)
Cash dividends per share (yen)
Cash dividends per share
(U.S. dollars) Record date Effective date
May 20, 2009Common
stock¥57,300 $583,325 ¥382 $3.89
March 31, 2009
May 21, 2009
2008
Resolution TypeCash dividends(Millions of yen)
Cash dividends per share (Yen) Record date Effective date
May 29, 2008 Common stock ¥22,800 ¥152 March 31, 2008 May 30, 2008
The Bank on October 1, 2007 received investment in kind from Japan Post in accordance with the plan for assumption of business under Paragraph 1, Article 166 of the Postal Service Privatization Law, pursuant to Paragraph 3, Article 96 of the Postal Service Privatization Law. A summary of investment in kind is as follows:
Millions of yen
Assets ¥223,376,491
Liabilities ¥215,879,249
Net assets 7,497,241
17. CASH AND CASH EQUIVALENTSThe reconciliation between cash and cash equivalents in the statement of cash flows and cash and due from banks in the balance sheet at March 31, 2009 and 2008 were as follows:
Millions of yenThousands of U.S. dollars
2009 2008 2009Cash and due from banks ¥ 5,999,116 ¥ 8,835,055 $ 61,072,138
Due from banks, excluding negotiable certificates of deposit in other banks (3,300,000) (3,814,000) (33,594,625)
Cash and cash equivalents ¥ 2,699,116 ¥ 5,021,055 $ 27,477,513
18. LEASESOperating lease transactions:Future lease payments on noncancelable operating leases at March 31, 2009 were as follows:
Millions of yenThousands of U.S. dollars
Due within one year ¥ 508 $ 5,175
Due over one year 1,086 11,057
Total ¥1,594 $16,232

JAPAN POST BANK Annual Report 200976
MD
&A
Financial Statem
entsFinancial D
ata
77
19. SECURITIESFor the fiscal year ended March 31, 2009, the Bank had the rights to sell or pledge without restriction for securities held amounting to ¥727,271 million ($7,403,763 thousand) among the securities borrowed under the contract of loan for consumption (securities borrowing transactions) as well as those purchased under resale agreements and those borrowed with cash collateral under securities lending agreements. For the fiscal year ended March 31, 2008, Japanese Government Bonds included ¥1,171,519 million of unsecured loaned securities for which borrowers have the right to sell or pledge. As for the unsecured borrowed securities for which the Bank has the right to sell or pledge and the securities which the Bank purchased under resale agreements and borrowed with cash collateral, that are permitted to be sold or pledged without restrictions, ¥152,111 million of securities was held in hand as of the balance sheet date.
20. FAIR VALUE INFORMATION FOR SECURITIESSecurities discussed here include “Trading account securities,” negotiable certificates of deposit recorded under “Cash and due from banks,” trust beneficiary rights under “Monetary claims bought” and “Money held in trust,” in addition to “Securities” in the balance sheets.
a. Trading account securities:Net unrealized gains on trading account securities for the years ended March 31, 2009 and 2008 were as follows:
Millions of yenThousands of U.S. dollars
2009 2008 2009Amount on the balance
sheetNet unrealized
gains
Amount on the balance
sheetNet unrealized
gains
Amount on the balance
sheetNet unrealized
gains
Trading account securities ¥159 – ¥172 – $1,623 –
b. Held-to-maturity securities whose fair value is available:Held-to-maturity securities whose fair value is available at March 31, 2009 and 2008 consisted of the following:
Millions of yen
2009Amount on the balance sheet
Unrealized gains
Unrealized losses Fair value
Japanese Government Bonds ¥123,534,320 ¥2,343,773 ¥47,000 ¥125,831,093
Japanese local government bonds 5,279,006 78,553 1,598 5,355,960
Japanese corporate bonds 5,552,480 75,535 1,701 5,626,314
Total ¥134,365,807 ¥2,497,861 ¥50,300 ¥136,813,368
Millions of yen
2008Amount on the balance sheet
Unrealized gains
Unrealized losses Fair value
Japanese Government Bonds ¥129,548,188 ¥2,417,521 ¥53,122 ¥131,912,587
Japanese local government bonds 7,232,314 121,480 2,611 7,351,184
Japanese corporate bonds 4,387,181 70,562 1,523 4,456,220
Total ¥141,167,684 ¥2,609,565 ¥57,258 ¥143,719,991
Thousands of U.S. dollars
2009Amount on the balance sheet
Unrealized gains
Unrealized losses Fair value
Japanese Government Bonds $1,257,602,773 $23,860,060 $478,474 $1,280,984,359
Japanese local government bonds 53,741,285 799,685 16,277 54,524,693
Japanese corporate bonds 56,525,301 768,962 17,318 57,276,945
Total $1,367,869,359 $25,428,707 $512,069 $1,392,785,997
Note: Fair value is determined based on the market price at the balance sheet date.
c. Investments in subsidiaries and affiliates whose fair value is availableFor the fiscal year ended March 31, 2009, there were no investments in affiliates whose fair value is available. Cost of investment in affiliates amounted to ¥900 million ($9,162 thousand) at March 31, 2009. For the fiscal year ended March 31, 2008, there were no investments in affiliates whose fair value is available.
d. Available-for-sale securities whose fair value is available:Available-for-sale securities whose fair value is available at March 31, 2009 and 2008 consisted of the following:
Millions of yen
2009
CostUnrealized
gainsUnrealized
lossesAmount on the balance sheet
Debt securities: ¥36,988,754 ¥276,609 ¥ 83,340 ¥37,182,023
Japanese Government Bonds 31,790,638 236,899 71,702 31,955,835
Japanese local government bonds 889,016 9,905 715 898,206
Japanese corporate bonds 4,309,099 29,804 10,921 4,327,982
Other securities (mainly foreign bonds) 1,553,501 9,357 36,946 1,525,912
Total ¥38,542,255 ¥285,967 ¥120,287 ¥38,707,936
Millions of yen
2008
CostUnrealized
gainsUnrealized
lossesAmount on the balance sheet
Debt securities: ¥30,670,692 ¥274,542 ¥38,815 ¥30,906,419
Japanese Government Bonds 27,026,090 237,085 38,206 27,224,969
Japanese local government bonds 263,195 3,761 23 266,932
Japanese corporate bonds 3,381,406 33,695 585 3,414,517
Other securities (mainly foreign bonds) 487,266 2,641 10,986 478,921
Total ¥31,157,958 ¥277,183 ¥49,801 ¥31,385,340
Thousands of U.S. dollars
2009
CostUnrealized
gainsUnrealized
lossesAmount on the balance sheet
Debt securities: $376,552,523 $2,815,941 $ 848,424 $378,520,041
Japanese Government Bonds 323,634,723 2,411,683 729,949 325,316,457
Japanese local government bonds 9,050,355 100,841 7,289 9,143,907
Japanese corporate bonds 43,867,445 303,417 111,186 44,059,677
Other securities (mainly foreign bonds) 15,814,939 95,263 376,123 15,534,079
Total $392,367,463 $2,911,205 $1,224,547 $394,054,120
Note: The amounts on the balance sheets of the above securities are determined using the market price at the balance sheet date.

JAPAN POST BANK Annual Report 200978
MD
&A
Financial Statem
entsFinancial D
ata
79
e. Held-to-maturity securities Held-to-maturity securities sold during the fiscal years ended March 31, 2009 and 2008 consisted of the following:
Millions of yen
2009Cost of sales Sales proceeds Realized gains
Japanese Government Bonds ¥6,039,501 ¥6,039,766 ¥265
Total ¥6,039,501 ¥6,039,766 ¥265
Millions of yen
2008Cost of sales Sales proceeds Realized gains
Japanese Government Bonds ¥4,100,403 ¥4,100,544 ¥140
Total ¥4,100,403 ¥4,100,544 ¥140
Thousands of U.S. dollars
2009Cost of sales Sales proceeds Realized gains
Japanese Government Bonds $61,483,265 $61,485,970 $2,704
Total $61,483,265 $61,485,970 $2,704
These held-to-maturity securities were sold in accordance with Article 282 of the Industry Audit Committee Report No. 14 (“Practical Guidance on Accounting for Financial Products”) issued by the Japanese Institute of Certified Public Accountants (JICPA). Realized gains are included in “Interest and dividends on securities” in the accompanying statements of income.
f. Available-for-sale securities Available-for-sale securities sold during the fiscal years ended March 31, 2009 and 2008 consisted of the following:
Millions of yen
2009Sales proceeds Realized gains Realized losses
Available-for-sale securities ¥7,057,106 ¥53,067 ¥52,915
Total ¥7,057,106 ¥53,067 ¥52,915
Millions of yen
2008Sales proceeds Realized gains Realized losses
Available-for-sale securities ¥732,235 ¥366 ¥3
Total ¥732,235 ¥366 ¥3
Thousands of U.S. dollars
2009Sales proceeds Realized gains Realized losses
Available-for-sale securities $71,842,683 $540,236 $538,692
Total $71,842,683 $540,236 $538,692
g. Securities with no available fair value Securities with no available fair value at March 31, 2009 and 2008 were as follows:
Amount on the balance sheet
Millions of yenThousands of U.S. dollars
2009 2008 2009Available-for-sale securities:
Negotiable certificates of deposit ¥3,300,000 ¥3,814,000 $33,594,625
Commercial paper 542,904 – 5,526,866
Investment in unconsolidated subsidiaries and affiliates:
Investments in affiliates 900 – 9,162
h. Scheduled redemption amounts for bonds held-to-maturity and available-for-sale securities with maturity at end of fiscal yearsScheduled redemption amounts for bonds held-to-maturity and available-for-sale securities with maturity at March 31, 2009 and 2008 consisted of the following:
Millions of yen
2009
1 year or lessOver 1 year to
5 yearsOver 5 years to
10 years Over 10 years
Debt securities: ¥41,320,145 ¥76,937,168 ¥50,550,631 ¥3,282,790
Japanese Government Bonds 37,801,603 70,105,908 44,970,374 2,612,270
Japanese local government bonds 1,564,228 2,718,315 1,894,669 –
Commercial paper 542,904 – – –
Japanese corporate bonds 1,411,409 4,112,944 3,685,587 670,520
Other (mainly foreign bonds) 3,302,069 1,171,408 148,385 29,048
Total ¥44,622,214 ¥78,108,576 ¥50,699,016 ¥3,311,838
Millions of yen
2008
1 year or lessOver 1 year to
5 yearsOver 5 years to
10 years Over 10 years
Debt securities: ¥38,402,893 ¥81,637,242 ¥49,289,391 ¥2,744,577
Japanese Government Bonds 34,774,364 74,811,916 44,742,201 2,444,675
Japanese local government bonds 1,943,227 3,284,024 2,271,995 –
Japanese corporate bonds 1,685,301 3,541,301 2,275,194 299,902
Other (mainly foreign bonds) 3,773,785 365,887 149,549 3,698
Total ¥42,176,678 ¥82,003,129 ¥49,438,941 ¥2,748,275
Thousands of U.S. dollars
2009
1 year or lessOver 1 year to
5 yearsOver 5 years to
10 years Over 10 years
Debt securities: $420,646,901 $783,234,943 $514,614,996 $33,419,427
Japanese Government Bonds 384,827,477 713,691,425 457,806,923 26,593,405
Japanese local government bonds 15,924,138 27,672,962 19,288,093 –
Commercial paper 5,526,866 – – –
Japanese corporate bonds 14,368,419 41,870,555 37,519,980 6,826,022
Other (mainly foreign bonds) 33,615,694 11,925,156 1,510,595 295,719
Total $454,262,595 $795,160,099 $516,125,591 $33,715,146

JAPAN POST BANK Annual Report 200980
MD
&A
Financial Statem
entsFinancial D
ata
81
i. Money held in trustThe Bank did not hold money held in trust for the purpose of trading nor holding to maturity for the fiscal years ended March 31, 2009 and 2008. Money held in trust at March 31, 2009 and 2008 was as follows:
Millions of yen
2009
Cost Unrealized gains Unrealized lossesAmount on the balance sheet
Money held in trust classified as:
Available-for-sale ¥1,418,878 ¥6,201 ¥200,337 ¥1,224,742
Millions of yen
2008
Cost Unrealized gains Unrealized lossesAmount on the balance sheet
Money held in trust classified as:
Available-for-sale ¥515,188 ¥2,045 ¥104,663 ¥412,570
Thousands of U.S. dollars
2009
Cost Unrealized gains Unrealized lossesAmount on the balance sheet
Money held in trust classified as:
Available-for-sale $14,444,448 $63,132 $2,039,469 $12,468,111
Notes: 1. The amounts on the balance sheets are stated at the average market price of the final month for the fiscal year for equity securities and at the market price at the balance sheet date for other securities.
2. Securities (equity securities) with market quotations under management as trust assets, whose market values showed a substantial decline from their acquisition costs and were not judged to recover to their book values are restated at fair market price on the balance sheet and valuation differences are charged to income (hereafter “losses on impairment of fixed assets”) in the year in which they are recognized. The amount of losses on impairment of fixed assets for the fiscal years ended March 31, 2009 and 2008 amounted to ¥56,131 million ($571,428 thousand) and ¥12,240 million, respectively. Securities were judged as impaired when their market values showed a substantial decline from their book value. The criteria for determining if such decline is significant are as follows: Securities whose fair value is 50% or less than the acquisition cost, or
Securities whose fair value is 70% or less but over 50% of the acquisition cost and the market price continues to be less than a certain level
j. Unrealized gains (losses) on available-for-sale securities:Unrealized gains (losses) on available-for-sale securities for the fiscal years ended March 31, 2009 and 2008 consisted of the following:
Millions of yenThousands of U.S. dollars
2009 2008 2009Valuation differences: ¥ (28,455) ¥124,763 $ (289,680)
Available-for-sale securities 165,680 227,382 1,686,657
Available-for-sale money held in trust (194,135) (102,618) (1,976,337)
Deferred tax assets (liabilities) 11,578 (50,770) 117,868
Unrealized gains (losses) on available-for-sale securities ¥ (16,877) ¥ 73,992 $ (171,811)
21. DERIVATIVES1. Details of derivative transactions a. Derivative instruments
Derivative instruments which the Bank is utilizing include the following: Interest rate related instruments: Interest rate swaps Currency related instruments: foreign exchange forward contracts
b. Purposes and policies of using derivatives From the viewpoints of the Bank’s asset and liability management (ALM), the Bank utilizes interest rate swaps as hedging instruments for interest rate related transactions to avoid the risk of changes in future economic values of securities, loans, and time deposits on fluctuations of the yen interest rate. For currency related transactions, the Bank utilizes foreign exchange futures as hedging instruments to avoid the risk of foreign exchange fluctuations in connection with the translation of foreign currency denominated assets (bonds) held by the Bank and related yen translation amounts of redemption of principals and interests. Derivatives which meet certain requirements are accounted for by the hedge accounting method to control the effect on financial accounting within a fixed range when utilizing derivatives for hedging purposes. It is the Bank’s policy to enter into derivative contracts in compliance with the “Basic Plan for ALM.” Execution of transactions is compliant with defined internal rules including operating procedures for yen interest rate derivative transactions and operating procedures for foreign exchange hedging activities.
c. Nature of risk Derivatives involve principally market risk and credit risk. The Bank defines market risk as the risk by which the Bank might be adversely affected arising from the changes in the value of assets and liabilities (including off-balance sheet items) due to changes in market risk factors, such as interest rate, foreign exchange, and stock, or that the Bank might be affected arising from changes in earnings generated from assets and liabilities. The Bank does not enter into derivative contracts for speculation purposes, but for hedging purposes. Market risk involved in derivatives is mitigated and limited since the Bank designates derivatives as hedges and manages derivatives so that the risk profile would become homogeneous between hedged items and derivatives as hedging instruments. The Bank also defines credit risk as the risk that the value of assets (including off-balance sheet assets) might diminish or vanish and thus the Bank might be damaged from the deterioration of financial positions of credit counterparties. The counterparties of the Bank are mostly financial institutions with high credit ratings and credit risk is controlled by setting credit lines.
d. Risk control system The Bank has established the Risk Management Department as a middle office, systematically segregated from the front office and back office. The department is engaged in monitoring and controlling market risk and credit risk. Market risk of derivatives is controlled by measuring market risk exposure using VaR (Value at Risk) together with other assets and liabilities, and setting market risk limits and limits to market risk exposure to identify maximum losses, so that market risk exposure is maintained within the allocated amount of capital. In addition, credit risk is managed so that the credit balance per individual counterparties, calculated based on a current exposure method, in which the market value and future price fluctuation risk of derivatives are factored, remains within the credit line set by taking into account the credit status of individual counterparties.
2. Market value of derivative transactions (1) Interest rate related instruments: None The Bank does not disclose derivatives transactions to which hedge accounting is applied.
(2) Currency related instruments: The Bank had the following derivatives transactions outstanding at March 31, 2009 and 2008:
Millions of yen Thousands of U.S. dollars
2009 2008 2009Contract or
notionalamount
Fairvalue
Unrealizedgains
(losses)
Contract ornotionalamount
Fairvalue
Unrealizedgains
(losses)
Contract ornotionalamount
Fairvalue
Unrealizedgains
(losses)
Currency-related transaction: Over-the-counter:
Foreign exchange forward contracts-bought ¥1,890 ¥20 ¥20 ¥8,424 ¥(93) ¥(93) $19,245 $204 $204
Notes: 1. The above transactions are stated at fair value and unrealized gains (losses) are charged to revenues or expenses in the statements of income. Transactions, for which hedge accounting is applied have been excluded from the above table.
2. The fair value is determined using the discounted value of future cash flows.

JAPAN POST BANK Annual Report 200982
MD
&A
Financial Statem
entsFinancial D
ata
83
(3) Equity related derivatives: None as at March 31, 2009 and 2008
(4) Bond related derivatives: None as at March 31, 2009 and 2008
(5) Commodity related derivatives: None as at March 31, 2009 and 2008
(6) Credit derivatives: None as at March 31, 2009 and 2008
22. LOANS“Loans to bankrupt borrowers,” “Past-due loans,” “Past-due loans for three months or more,” and “Restructured loans” did not exist at March 31, 2009. The amount of participation principals of loan participations accounted for as loans due from the original debtors in accordance with the Accounting System Committee Report No. 3 issued by the Japan Institute of Certified Public Accountants on June 1, 1995 is ¥98,786 million ($1,005,663 thousand) in the accompanying balance sheet at March 31, 2009. Contracts of overdraft facilities and loan commitments are contracts with customers to lend funds up to a certain limit agreed in advance. The Bank will make the loans upon the request of an obligor to draw down funds under such loan agreements as long as there is no breach of various terms and conditions stipulated in the relevant loan agreement. The unused commitment balance relating to these loan agreements at March 31, 2009 amounted ¥26,200 million ($266,721 thousand). Of this amount, ¥26,200 million ($266,721 thousand) related to loans in which the term of the agreement was less than one year or unconditional cancellation of the agreement was allowed at any time. The unused commitment balance relating to these loan agreements at March 31, 2008 totaled ¥1,000 million. Of this amount, ¥1,000 million related to loans in which the term of agreement was less than one year or unconditional cancellation of the agreement was allowed at any time. In many cases the term of the agreement runs its course without the loan ever being drawn down. Therefore, the unused amount will not necessarily affect future cash flows. Conditions are included in certain loan agreements which allow the Bank to decline the request for a loan draw-down when there is due cause to do so, such as when there is a change in financial condition or when it is necessary to protect the Bank’s credit. At the inception of contracts, the Bank has the obligor pledge collateral to the Bank in the form of real estate, securities, etc., if considered to be necessary. Subsequently, the Bank reviews the obligor’s financial condition in accordance with the Bank established internal procedures and takes necessary measures to protect its credit.
23. RESERVE FOR RETIREMENT BENEFITSThe Bank has a lump-sum retirement payment plan for employees based on the internal retirement benefit rule.
Reserve for employees' retirement benefits at March 31, 2009 and 2008 consisted of the following:
Millions of yenThousands of U.S. dollars
2009 2008 2009Projected benefit obligation ¥ (124,752) ¥ (124,361) $ (1,270,003)
Unfunded projected benefit obligation (124,752) (124,361) (1,270,003)
Unrecognized net actuarial losses (2,832) (571) (28,836)
Net amount recorded on the balance sheets (127,584) (124,932) (1,298,839)
Reserve for employees’ retirement benefits ¥ (127,584) ¥ (124,932) $ (1,298,839)
The breakdown of total retirement benefit costs for the years ended March 31, 2009 and 2008 was as follows:
Millions of yenThousands of U.S. dollars
2009 2008 2009Service cost ¥5,922 ¥3,019 $60,295
Interest cost on projected benefit obligation 2,117 1,082 21,555
Amortization of unrecognized net actuarial losses (57) – (582)
Other – 215 –
Total retirement benefit costs ¥7,982 ¥4,318 $81,268
Assumptions used in the calculation of the above information for the years ended March 31, 2009 and 2008 were set forth as follows:
2009 2008
Method of attributing the projected benefits to periods of service Straight-line basis Straight-line basis
Discount rate 1.7% 1.7%
Amortization period of unrecognized actuarial losses 10 years 10 years
24. INCOME TAXESIncome taxes, which consist of corporation, inhabitant, and enterprise taxes, are calculated based on taxable income. The Bank is subject to Japanese national and local income taxes which, in the aggregate, resulted in normal effective statutory tax rates of approximately 40.69% for the years ended March 31, 2009 and 2008. The tax effects of significant temporary differences which resulted in deferred tax assets and liabilities at March 31, 2009 and 2008 were as follows:
Millions of yenThousands of U.S. dollars
2009 2008 2009Deferred tax assets:
Reserve for possible loan losses ¥ 442 ¥ 614 $ 4,506
Reserve for employees’ retirement benefits 51,913 50,839 528,487
Accumulated depreciation 20,847 9,781 212,229
Accrued interest on deposits 22,265 – 226,668
Impairment losses of money held in trust 11,764 – 119,763
Net unrealized losses on available-for-sale securities 11,578 – 117,868
Other 26,213 23,171 266,863
Total deferred tax assets 145,025 84,407 1,476,384
Deferred tax liabilities:
Unrealized gains (losses) on available-for-sale securities – 50,770 –
Other – 1,367 –
Total deferred tax liabilities 3,751 52,138 38,192
Net deferred tax assets ¥141,273 ¥ 32,269 $1,438,191
For the fiscal years ended March 31, 2009 and 2008, the difference between the effective income tax rate and effective tax payout ratio was less than 5%.

JAPAN POST BANK Annual Report 200984
MD
&A
Financial Statem
entsFinancial D
ata
85
25. EQUITY EARNINGS OF AFFILIATESThe details for the fiscal year ended March 31, 2009 were as follows:
Millions of yenThousands of U.S. dollars
Investment in unconsolidated subsidiaries and affiliates: Investments in affiliates ¥900 $9,162Investments, if equity method is adopted for accounting 791 8,053Investment losses, if equity method is adopted for accounting 108 1,109
The Bank recorded no equity earnings of affiliates for the fiscal year ended March 31, 2008.
26. RELATED PARTY TRANSACTIONS1. Transactions with related partiesa. Transactions between the Bank and related parties for the years ended March 31, 2009 and 2008 were as follows:
For the year ended March 31, 2009Japan Post Holdings Co., Ltd. (Parent company)Ownership of voting rights held 100% of the Company’s shares are owned.
Capital ¥3,500,000 million
Nature of transactions Concurrent holding of positions by executive management directors
Details of transactions Payments of grants*
Transaction amount ¥97,732 million ($994,939 thousand)
Account –
Outstanding balance at end of fiscal year –
* Payment is made pursuant to Article 122 of the Postal Service Privatization Law.
For the year ended March 31, 2008Japan Post Holdings Co., Ltd. (Parent company)Ownership of voting rights held 100% of the Company’s shares are owned.
Capital ¥3,500,000 million
Nature of transactions Concurrent holding of positions by executive management directors
Details of transactions Subscription to capital increase* Payments of grants**
Transaction amount ¥298,944 million 51,185 million
Account –
Outstanding balance at end of fiscal year –
* The Bank received investment-in-kind (securities (JGBs)). ** Payment is made pursuant to Article 122 of the Postal Service Privatization Law.
b. Transactions between the Bank and unconsolidated subsidiaries or affiliates: None for the fiscal years ended March 31, 2009 and 2008
c. Transactions between the Bank and companies with the same parent or subsidiaries of the Bank’s affiliates for the years ended March 31, 2009 and 2008 were as follows:
For the year ended March 31, 2009Japan Post Network Co., Ltd. (Subsidiary of Parent company)Ownership of voting rights held Nil
Capital ¥100,000 million
Nature of transactions Consignment of banking agency operations and Concurrent holding of positions by executive management directors
Details of transactions Payment of consignment fees*
Receipt and payment of funds related to banking agency operations
Transaction amount ¥648,147 million ($6,598,264 thousand)
¥1,380,712 million ($14,055,913 thousand)
–
Account Other liabilities Other assets** Other assets***
Outstanding balance at end of fiscal year ¥54,826 million ($558,143 thousand)
¥1,340,000 million ($13,641,454 thousand)
¥38,443 million ($391,359 thousand)
For the year ended March 31, 2008Japan Post Network Co., Ltd. (Subsidiary of Parent company)Ownership of voting rights held Nil
Capital ¥100,000 million
Nature of transactions Consignment of banking agency operations and Concurrent holding of positions by executive management directors
Details of transactions Payment of consignment fees*
Receipt and payment of funds related to banking agency operations
Transaction amount ¥301,046 million ¥1,563,387 million –
Account Other liabilities Other liabilities** Other assets***
Outstanding balance at end of fiscal year ¥53,473 million ¥1,440,000 million ¥42,469 million
* The figures are determined based on the total costs incurred in connection with the services provided by the service outsourcing companies. ** The figures represent advance payments of funds necessary for delivery of deposits based on the banking agency service agreement. The transaction
amounts are presented on an average balance basis for the fiscal years ended March 31, 2009 and 2008. *** The figures represent the unsettled amount between the Bank and Japan Post Network Co., Ltd. in connection with receipt/payment operations with
customers based on the banking agency service agreement. Transaction amounts are not presented because, being settlement transactions, these amounts are substantial.
Note: Transaction amounts are exclusive of consumption and other taxes. Year-end balances include consumption and other taxes.
d. Receivables from and payables due to directors and/or executive officers None
2. Notes related to the parent company and/or significant affiliatesa. Information on the parent company
Japan Post Holdings Co., Ltd.
b. Information on significant affiliates None

JAPAN POST BANK Annual Report 200986
MD
&A
Financial Statem
entsFinancial D
ata
87
27. PER SHARE DATANet assets per share at March 31, 2009 and 2008 and net income per share for the years then ended were as follows:
Yen U.S. dollars
2009 2008 2009Net assets per share ¥54,530.49 ¥53,845.70 $555.13
Net income per share 1,529.08 2,026.89 15.57
Net assets per share for the fiscal years ended March 31, 2009 and 2008 was calculated based on the following:
Millions of yenThousands of U.S. dollars
2009 2008 2009Net assets ¥8,179,574 ¥8,076,855 $83,269,618
Net assets attributable to common stock at the end of the fiscal year 8,179,574 8,076,855 83,269,618
Number of common stock at the fiscal year-end used for the calculation of net assets per share (thousand shares) 150,000 150,000 150,000
Net income per share data for the fiscal years ended March 31, 2009 and 2008 was calculated based on the following:
Millions of yenThousands of U.S. dollars
2009 2008 2009Net income ¥229,363 ¥152,180 $2,334,960
Net income attributable to common stock 229,363 152,180 2,334,960
Average number of common stock outstanding during the fiscal year (thousand shares) 150,000 75,080 150,000
Notes: 1. Diluted net income per share is not presented since there has been no potential dilution for the years ended March 31, 2009 and 2008. 2. Net income per share for the fiscal year ended March 31, 2008 (from October 1, 2007 through March 31, 2008) was ¥1,019.41 based on the
average number of common shares outstanding.
28. SUBSEQUENT EVENTNone

JAPAN POST BANK Annual Report 200988
MD
&A
Financial Statem
entsFinancial D
ata
89
Key Financial Indicators Earnings
Key Financial IndicatorsYears ended March 31
Millions of yen, %Thousands of U.S. dollars
2009 2008 2009
Revenues ¥ 2,488,552 ¥ 1,328,904 $ 25,333,935
Operating profit (before provision for (reversal of) general reserve for possible loan losses) 480,602 302,859 4,892,623
Net operating profit 480,602 301,945 4,892,623
Net ordinary income 385,243 256,171 3,921,854
Net income 229,363 152,180 2,334,960
Common stock 3,500,000 3,500,000 35,630,663
Shares outstanding (thousand shares) 150,000 150,000 150,000
Net assets 8,179,574 8,076,855 83,269,618
Total assets 196,480,796 212,149,182 2,000,211,714
Deposits 177,479,840 181,743,807 1,806,778,383
Loans 4,031,587 3,771,527 41,042,326
Securities 173,551,137 172,532,116 1,766,783,447
Capital adequacy ratio (non-consolidated, domestic standard) 92.09 85.90Dividend payout ratio 24.98 14.98Employees 11,675 11,201Notes: 1. Earnings for the fiscal year ended March 31, 2008 essentially reflect banking operations for the six-month period following the Bank's incorporation on
October 1, 2007. In addition, gains and losses (including a net loss of ¥731 million) of the preparatory planning company for privatization during the first half of the fiscal period have been included.
2. The capital adequacy ratio is calculated based on standards stipulated by Article 14-2 of the Banking Law (Financial Services Agency Notification No. 19, March 27, 2006) for the purpose of determining whether banks have sufficient equity capital given their holdings of assets and other instruments. The Bank adheres to capital adequacy standards applicable in Japan.
3. The number of employees excludes Japan Post Bank employees assigned to other companies by the Bank but includes employees assigned to the Bank by other companies. The figures do not include short-term contract and part-time employees.
Income AnalysisYears ended March 31
Millions of yenThousands of U.S. dollars
2009 2008 2009
Gross operating profit: ¥ 1,746,765 ¥ 920,548 $ 17,782,401
(Excluding gains (losses) on bonds) 1,746,613 920,185 17,780,858
Interest income 1,655,330 871,211 16,851,573
Fees and commissions 91,096 49,852 927,379
Trading gains – − –
Other operating income (loss) 338 (515) 3,449
(Gains (losses) on bonds) 151 362 1,543
General and administrative expenses (excluding non-recurring losses): (1,266,162) (617,738) (12,889,778)
Personnel expenses (109,562) (53,567) (1,115,367)
Non-personnel expenses (1,082,643) (519,392) (11,021,518)
Taxes and dues (73,956) (44,778) (752,893)
Operating profit (before provision for (reversal of) general reservefor possible loan losses) 480,602 302,859 4,892,623
(Excluding gains (losses) on bonds) 480,450 302,497 4,891,080
Provision for general reserve for possible loan losses – (914) –
Net operating profit: 480,602 301,945 4,892,623
Gains (losses) on bonds 151 362 1,543
Non-recurring gains (losses): (95,358) (45,773) (970,770)
Gains (losses) on money held in trust (100,200) (14,905) (1,020,062)
Other non-recurring gains (losses) 4,842 (30,867) 49,293
Net ordinary income 385,243 256,171 3,921,854
Extraordinary income (loss): (1,030) (331) (10,486)
Gains (losses) on sales and disposal of fixed assets (1,432) (489) (14,579)
Losses on impairment of fixed assets (63) (1) (642)
Reversal of reserve for possible loan losses 417 − 4,254
Recoveries of written-off loans 47 159 481
Income before income taxes 384,213 255,840 3,911,367
Income taxes - current (192,604) (132,277) (1,960,751)
Income taxes - deferred 37,754 28,617 384,343
Net income 229,363 152,180 2,334,960
Credit-related expenses: (103) (8) (1,058)
Provision for general reserve for possible loan losses (103) (8) (1,058)
Write-off of loans − − −
Provision for specific reserve for possible loan losses − − −
Recoveries of written-off loans − − −Notes: 1. Gross operating profit for the fiscal year ended March 31, 2008 is based on the six-month period from October 1, 2007 to March 31, 2008.
2. The figures for general and administrative expenses, operating profit (before provision for (reversal of) general reserve for possible loan losses), net operating profit, net ordinary income, extraordinary income (loss), and net income for the fiscal year ended March 31, 2008 essentially reflect banking operations for the six-month period following the Bank's incorporation on October 1, 2007. In addition, profits and losses (including a net loss of ¥731 million) of the preparatory planning company for privatization during the first half of the fiscal period have been included.
3. Employees’ retirement benefits (non-recurring costs) and other items have been excluded from general and administrative expenses in the calculation of “general and administrative expenses (excluding non-recurring losses)” indicated in the above table.
4. Credit-related expenses are expenses related to problem assets disclosed under the Financial Reconstruction Law.
5. Expenses are denoted by parentheses.
Financial Data

JAPAN POST BANK Annual Report 200990
MD
&A
Financial Statem
entsFinancial D
ata
91
Gross Operating Profit and Gross Operating Profit MarginYears ended March 31
Millions of yen, %Thousands of U.S. dollars
2009 2008 2009
Gross operating profit ¥1,746,765 ¥920,548 $17,782,401
Gross operating profit margin 0.86 0.86Notes: 1. Gross operating profit = Net interest income + Net fees and commissions + Net other operating income
2. Gross operating profit margin = Gross operating profit / Average balance of interest-earning assets x 100 (annualized rate for the fiscal year ended March 31, 2008)
3. Figures for the fiscal year ended March 31, 2008 are for the six-month period from October 1, 2007 to March 31, 2008.
Net Interest Income, Net Fees and Commissions, Net Trading Income, and Net Other Operating Income (Loss)Years ended March 31
Millions of yenThousands of U.S. dollars
2009 2008 2009
Net interest income: ¥1,655,330 ¥ 871,211 $16,851,573
Interest income 2,309,926 1,265,037 23,515,490
Interest expenses 654,596 393,826 6,663,917
Net fees and commissions: 91,096 49,852 927,379
Fees and commissions received 112,334 59,556 1,143,587
Fees and commissions paid 21,238 9,703 216,208
Net trading income: − − −
Trading gains − − −
Trading losses − − −
Net other operating income (loss): 338 (515) 3,449
Other operating income 53,791 703 547,604
Other operating expenses 53,452 1,218 544,155Notes: 1. Interest expenses exclude expenses corresponding to money held in trust (fiscal year ended March 31, 2009, ¥2,425 million ($24,693 thousand); fiscal
year ended March 31, 2008, ¥1,036 million).2. Figures for the fiscal year ended March 31, 2008 are for the six-month period from October 1, 2007 to March 31, 2008.
Average Balance, Interest, and Earnings Yield of Interest-Earning Assets and Interest-Bearing LiabilitiesYears ended March 31
Millions of yen, %
2009Average balance Interest Earnings yield
Interest-earning assets: ¥201,253,306 ¥2,309,926 1.14
Loans 3,820,816 45,185 1.18
Securities 174,294,416 1,940,865 1.11
Deposits (to the fiscal loan fund) 14,606,904 254,746 1.74
Due from banks 7,905,353 40,455 0.51
Interest-bearing liabilities: 193,530,970 654,596 0.33
Deposits 179,573,276 373,863 0.20
Borrowed money 14,606,904 255,091 1.74
Millions of yen, %
2008Average balance Interest Earnings yield
Interest-earning assets: ¥212,590,632 ¥1,265,037 1.19Loans 3,908,239 22,847 1.16Securities 172,423,811 936,932 1.08Deposits (to the fiscal loan fund) 31,221,950 273,865 1.75Due from banks 4,998,835 15,515 0.62
Interest-bearing liabilities: 207,409,851 393,826 0.37Deposits 185,626,493 181,412 0.19Borrowed money 22,329,234 197,357 1.76
Thousands of U.S. dollars, %
2009Average balance Interest Earnings yield
Interest-earning assets: $2,048,796,766 $23,515,490 1.14
Loans 38,896,640 460,001 1.18
Securities 1,774,350,161 19,758,376 1.11
Deposits (to the fiscal loan fund) 148,701,050 2,593,369 1.74
Due from banks 80,477,996 411,849 0.51
Interest-bearing liabilities: 1,970,181,927 6,663,917 0.33
Deposits 1,828,089,953 3,805,999 0.20
Borrowed money 148,701,052 2,596,875 1.74
Notes: 1. Income and expenses for money held in trust are included in “other income” and “other expenses,” respectively. Accordingly, the average balance of money held in trust (fiscal year ended March 31, 2009, ¥717,120 million ($7,300,425 thousand); fiscal year ended March 31, 2008, ¥546,203 million) is excluded from interest-earning assets, and the average balance of expenses corresponding to money held in trust (fiscal year ended March 31, 2009, ¥717,120 million ($7,300,425 thousand); fiscal year ended March 31, 2008, ¥546,203 million) and the corresponding interest (fiscal year ended March 31, 2009, ¥2,425 million ($24,693 thousand); fiscal year ended March 31, 2008, ¥1,036 million) are excluded from interest-bearing liabilities.
2. Due from banks in the fiscal year ended March 31, 2008 includes negotiable certificates of deposit, call loans, receivables under resale agreements, and monetary claims bought.
3. Due from banks in the fiscal year ended March 31, 2009 includes negotiable certificates of deposit, call loans, receivables under resale agreements, monetary claims bought, and Bank of Japan (BOJ) deposits. The BOJ deposits have been included in due from banks as of the fiscal year ended March 31, 2009 because these deposits bear interest rates under the BOJ’s supplementary current account system for smoothing monetary supply.
4. Figures for the fiscal year ended March 31, 2008 are for the six-month period from October 1, 2007 to March 31, 2008.5. Interest rates for the fiscal year ended March 31, 2008 have been annualized.

JAPAN POST BANK Annual Report 200992
MD
&A
Financial Statem
entsFinancial D
ata
93
Changes in Interest Income and ExpensesYears ended March 31
Millions of yen
2009Volume-related change Interest-related change Net change
Interest income: ¥(63,646) ¥1,108,535 ¥1,044,888
Loans (499) 22,837 22,337
Securities 10,273 993,659 1,003,933
Deposits (to the fiscal loan fund) 22,307 (41,427) (19,119)
Due from banks, etc. 11,787 13,152 24,940
Interest expenses: (24,424) 285,194 260,770
Deposits (5,717) 198,168 192,451
Borrowed money (31,691) 89,425 57,733
Thousands of U.S. dollars
2009Volume-related change Interest-related change Net change
Interest income: $(647,936) $11,285,100 $10,637,164
Loans (5,084) 232,489 227,405
Securities 104,589 10,115,639 10,220,228
Deposits (to the fiscal loan fund) 227,097 (421,735) (194,638)
Due from banks, etc. 120,001 133,894 253,895
Interest expenses: (248,645) 2,903,335 2,654,690
Deposits (58,202) 2,017,391 1,959,189
Borrowed money (322,627) 910,368 587,741
Notes: 1. When changes in balances and in interest rates become material, adjustments are apportioned according to those changes. 2. The changes in interest income and expenses shown for the fiscal year ended March 31, 2009 are in comparison with the fiscal year ended March 31,
2008.3. Figures for the fiscal year ended March 31, 2008 are for the six-month period from October 1, 2007 to March 31, 2008.
General and Administrative ExpensesYears ended March 31
Millions of yen, %Thousands of U.S. dollars
2009 2008 2009Amount % Amount % Amount
Personnel expenses: ¥ 109,605 8.65 ¥ 53,616 8.67 $ 1,115,803
Salary and allowances 101,590 8.02 49,510 8.01 1,034,210
Others 8,014 0.63 4,105 0.66 81,593
Non-personnel expenses: 1,082,643 85.50 519,392 84.07 11,021,518
Payments on commissioned services forJapan Post Network Co., Ltd. 648,147 51.18 301,046 48.72 6,598,264
Deposit insurance premiums paid to Japan Post Holdings Co., Ltd. (Note) 97,732 7.71 51,185 8.28 994,939
Deposit insurance expenses paid to Deposit Insurance Corporation of Japan 54,768 4.32 25,034 4.05 557,549Rent for land, buildings and others 10,960 0.86 5,114 0.82 111,582
Expenses on consigned businesses 90,100 7.11 38,283 6.19 917,244
Depreciation and amortization 54,797 4.32 30,908 5.00 557,846
Communication and transportation expenses 23,809 1.88 10,939 1.77 242,384
Maintenance expenses 10,023 0.79 2,320 0.37 102,040
Others 92,303 7.28 54,559 8.83 939,669
Taxes and dues 73,956 5.84 44,778 7.24 752,893
Total ¥1,266,205 100.00 ¥617,787 100.00 $12,890,214Note: The Bank makes payments equivalent to the insurance on time deposits (acquired prior to privatization) to Japan Post Holdings Co., Ltd. in accordance with
Article 122 of the Postal Service Privatization Law.
Balances by Type of DepositAs of March 31
Millions of yen, %Thousands of U.S. dollars
2009 2008 2009Amount % Amount % Amount
Domestic Liquid deposits ¥ 59,660,898 33.61 ¥ 63,482,363 34.92 $ 607,359,245
operations Time deposits 117,488,226 66.19 117,887,704 64.86 1,196,052,391
Other deposits 330,715 0.18 373,739 0.20 3,366,747
Subtotal 177,479,840 100.00 181,743,807 100.00 1,806,778,383
Negotiable certificates of deposit − − − − −
Total 177,479,840 100.00 181,743,807 100.00 1,806,778,383
Internationaloperations Total − − − − −
Total ¥177,479,840 − ¥181,743,807 − $1,806,778,383
Years ended March 31
Average BalancesMillions of yen, %
Thousands of U.S. dollars
2009 2008 2009Amount % Amount % Amount
Domestic Liquid deposits ¥ 62,009,526 34.53 ¥ 64,155,140 34.56 $ 631,268,722
operations Time deposits 117,184,987 65.25 121,094,085 65.23 1,192,965,365
Other deposits 378,761 0.21 377,268 0.20 3,855,866
Subtotal 179,573,276 100.00 185,626,493 100.00 1,828,089,953
Negotiable certificates of deposit − − − − −
Total 179,573,276 100.00 185,626,493 100.00 1,828,089,953
Internationaloperations Total − − − − −
Total ¥179,573,276 − ¥185,626,493 − $1,828,089,953
Note: Figures for the fiscal year ended March 31, 2008 are for the six-month period from October 1, 2007 to March 31, 2008.
Deposits

JAPAN POST BANK Annual Report 200994
MD
&A
Financial Statem
entsFinancial D
ata
95
Loans
Time Deposits by Time to MaturityAs of March 31
Millions of yenThousands of U.S. dollars
2009 2008 2009
Less than three months Time deposits: ¥ 3,274,184 ¥ 2,335,226 $ 33,331,820
Fixed interest rates 3,274,184 2,335,226 33,331,820
Floating interest rates − − −
Other time deposits − − −
≥ Three months < six months Time deposits: 3,061,672 1,736,696 31,168,405
Fixed interest rates 3,061,672 1,736,696 31,168,405
Floating interest rates − − −
Other time deposits − − −
≥ Six months < one year Time deposits: 8,626,805 4,209,494 87,822,515
Fixed interest rates 8,626,805 4,209,494 87,822,515
Floating interest rates − − −
Other time deposits − − −
≥ One year < two years Time deposits: 1,780,532 885,512 18,126,158
Fixed interest rates 1,780,532 885,512 18,126,158
Floating interest rates − − −
Other time deposits − − −
≥ Two years < three years Time deposits: 967,116 1,600,382 9,845,432
Fixed interest rates 967,116 1,600,382 9,845,432
Floating interest rates − − −
Other time deposits − − −
Three years or more Time deposits: 988,681 461,836 10,064,967
Fixed interest rates 988,681 461,836 10,064,967
Floating interest rates − − −
Other time deposits − − −
Total Time deposits: ¥18,698,993 ¥11,229,148 $190,359,297
Fixed interest rates 18,698,993 11,229,148 190,359,297
Floating interest rates − − −
Other time deposits − − −Notes: 1. The above table indicates balances of time deposits and special deposits (equivalent to time savings) based on the remaining time to maturity.
2. Special deposits are due to banks received from Management Organization for Postal Savings and Postal Life Insurance and correspond to the postal savings passed on to that organization by Japan Post.
TEIGAKU Deposits by Time to MaturityAs of March 31
Millions of yenThousands of U.S. dollars
2009 2008 2009
Less than one year ¥ 3,448,037 ¥ 4,546,686 $ 35,101,680
≥ One < three years 23,651,061 22,483,231 240,772,284
≥ Three < five years 9,658,266 21,312,003 98,322,980
≥ Five < seven years 9,034,650 13,227,502 91,974,457
Seven years or more 52,946,595 44,935,274 539,006,371
Total ¥98,738,612 ¥106,504,698 $1,005,177,771Notes: 1. The above table indicates balances of TEIGAKU deposits and Special deposits (equivalent to TEIGAKU savings) based on the remaining time to maturity.
2. Special deposits are due to banks received from Management Organization for Postal Savings and Postal Life Insurance and correspond to the postal savings passed on to that organization by Japan Post.
3. Figures have been calculated based on the assumption that all deposits will be held to maturity.
Loans by CategoryAs of March 31
Millions of yenThousands of U.S. dollars
2009 2008 2009
Loans on notes ¥ − ¥ − $ −
Loans on deeds 3,790,537 3,502,875 38,588,390
Overdrafts 241,050 268,651 2,453,936
Notes discounted − − −
Total ¥4,031,587 ¥3,771,527 $41,042,326
Years ended March 31
Average Balances Millions of yenThousands of U.S. dollars
2009 2008 2009
Loans on notes ¥ − ¥ − $ −
Loans on deeds 3,573,023 3,631,550 36,374,059
Overdrafts 247,793 276,688 2,522,581
Notes discounted − − −
Total ¥3,820,816 ¥3,908,239 $38,896,640
Note: Figures for the fiscal year ended March 31, 2008 are for the six-month period from October 1, 2007 to March 31, 2008.
Loans by Time to MaturityAs of March 31
Millions of yenThousands of U.S. dollars
2009 2008 2009
One year or less Loans: ¥ 397,720 ¥ 296,153 $ 4,048,871
Floating interest ratesFixed interest rates
> One and ≤ three years Loans: 143,289 13,973 1,458,711
Floating interest rates 100,156 7,141 1,019,617
Fixed interest rates 43,132 6,831 439,094
> Three and ≤ five years Loans: 348,813 128,149 3,550,988
Floating interest rates 138,817 4,581 1,413,186
Fixed interest rates 209,996 123,568 2,137,802
> Five and ≤ seven years Loans: 205,474 192,334 2,091,767
Floating interest rates 16,805 8,300 171,081
Fixed interest rates 188,669 184,034 1,920,686
> Seven and ≤ ten years Loans: 1,211,073 905,027 12,328,958
Floating interest rates 50,000 − 509,009
Fixed interest rates 1,161,073 905,027 11,819,948
Over ten years Loans: 1,725,216 2,235,888 17,563,031
Floating interest rates − − −
Fixed interest rates 1,725,216 2,235,888 17,563,031
No designated term Loans: − − −
Floating interest rates − − −
Fixed interest rates − − −
Total ¥4,031,587 ¥3,771,527 $41,042,326Notes: 1. Loans to depositors (maturities of two years or less) are treated as having time to maturity of one year or less.
2. Loans with maturities of one year or less have not been categorized into fixed and floating interest rate instruments.

JAPAN POST BANK Annual Report 200996
MD
&A
Financial Statem
entsFinancial D
ata
97
Loans and Acceptances and Guarantees by Type of CollateralAs of March 31
Loans by Type of Collateral Millions of yen
Thousands of U.S. dollars
2009 2008 2009
Securities ¥ 472 ¥ 580 $ 4,807
Receivables 65,804 14,545 669,898
Merchandise − − −
Real estate − − −
Others − − −
Sub-total 66,276 15,125 674,704
Guarantees 26,594 − 270,738
Credit 3,938,716 3,756,401 40,096,884
Total ¥4,031,587 ¥3,771,527 $41,042,326
Loans by PurposeAs of March 31
Millions of yen, %Thousands of U.S. dollars
2009 2008 2009Amount % Amount % Amount
Funds for capital investment ¥ 57,945 1.43 ¥ 690 0.01 $ 589,892
Funds for working capital 3,973,642 98.56 3,770,837 99.98 40,452,434
Total ¥4,031,587 100.00 ¥3,771,527 100.00 $41,042,326
Loans by IndustryAs of March 31
Millions of yen, %Thousands of U.S. dollars
2009 2008 2009Amount % Amount % Amount
Agriculture, forestry, fishing, and mining ¥ − − ¥ − − $ −
Manufacturing 190,182 4.71 7,821 0.20 1,936,089
Utilities, information/communications, and transportation 201,651 5.00 − − 2,052,848
Wholesale and retail 18,392 0.45 6,391 0.16 187,235
Finance and insurance 3,414,775 84.70 3,735,689 99.04 34,763,058
Construction and real estate 50,681 1.25 5,000 0.13 515,952
Services 10,200 0.25 1,500 0.03 103,839
National and local governments 51,381 1.27 − − 523,075
Others 94,323 2.33 15,125 0.40 960,231
Total ¥4,031,587 100.00 ¥3,771,527 100.00 $41,042,326
Loans to Individuals and Small and Midsize EnterprisesAs of March 31
Millions of yen, %Thousands of U.S. dollars
2009 2008 2009
Total loans (A) ¥4,031,587 ¥3,771,527 $41,042,326
Loans to individuals and small and midsize enterprises (B) 67,323 15,125 685,366
(B/A) 1.66 0.40Note: Individuals and small and midsize enterprises are defined as companies with capital of ¥300 million or less (¥100 million or less for wholesalers and ¥50
million or less for retail and service businesses) or companies with full-time employees of 300 workers or less (100 employees or less for wholesalers, 50 employees or less for retail businesses, and 100 employees or less for service businesses) and individuals.
Problem Assets Disclosed under the Financial Reconstruction LawAs of March 31
Millions of yen, %Thousands of U.S. dollars
2009 2008 2009
Loans to borrowers classified as bankrupt or quasi−bankrupt ¥ − ¥ − $ −
Loans to borrowers classified as doubtful − − −
Loans requiring close monitoring − − −
Sub-total (A) − − −
Loans to borrowers classified as normal 4,042,904 3,785,615 41,157,538
Total (B) ¥4,042,904 ¥3,785,615 $41,157,538
Non-performing loan ratio (A/B) − −
Reserve for Possible Loan LossesFor the years ended March 31
Millions of yen
2009Balance at
beginning of fiscal year
Increase during fiscal year
Decrease during fiscal
year
Balance at end of fiscal year
General reserve for possible loan losses ¥ 950 ¥ 370 ¥ (950) ¥ 370
Specific reserve for possible loan losses 559 717 (559) 717
Total ¥1,510 ¥1,087 ¥(1,510) ¥1,087
Millions of yen2008
Balance at beginning of fiscal year
Increase during fiscal year
Decrease during fiscal
year
Balance at end of fiscal year
General reserve for possible loan losses − ¥ 987 ¥ 36 ¥ 950Specific reserve for possible loan losses − 1,538 978 559Total − ¥2,525 ¥1,015 ¥1,510
Thousands of U.S. dollars
2009Balance at
beginning of fiscal year
Increase during fiscal year
Decrease during fiscal
year
Balance at end of fiscal year
General reserve for possible loan losses $ 9,681 $ 3,771 $ (9,681) $ 3,771
Specific reserve for possible loan losses 5,695 7,303 (5,695) 7,303
Total $15,376 $11,074 $(15,376) $11,074Note: The increased amounts during the fiscal year ended March 31, 2008 include ¥36 million of general reserve for possible loan losses and ¥978 million of
specific reserve for possible loan losses, which were both taken over from Japan Post.

JAPAN POST BANK Annual Report 200998
MD
&A
Financial Statem
entsFinancial D
ata
99
Securities
Average Balance by Type of Trading Account Securities Years ended March 31
Millions of yenThousands of U.S. dollars
2009 2008 2009
Trading account Japanese Government Bonds ¥280 ¥206 $2,852
Trading account Japanese local government bonds − − −
Trading account government guaranteed bonds − − −
Other trading account securities − − −
Total ¥280 ¥206 $2,852Note: Figures for the fiscal year ended March 31, 2008 are for the six-month period from October 1, 2007 to March 31, 2008.
Securities by Time to MaturityAs of March 31
Millions of yen
2009
One yearor less
> One and≤ three years
> Three and≤ five years
> Five and≤ seven years
> Seven and≤ ten years
Over ten years
No designated
termTotal
Japanese GovernmentBonds ¥37,801,603 ¥43,220,377 ¥26,885,531 ¥22,458,707 ¥22,511,666 ¥2,612,270 ¥ − ¥155,490,155
Japanese localgovernment bonds 1,564,228 1,278,829 1,439,485 1,050,860 843,808 − − 6,177,212
Commercial paper 542,904 − − − − − − 542,904Japanese corporate bonds 1,411,409 2,397,020 1,715,924 1,081,130 2,604,457 670,520 − 9,880,462
Stocks − − − − − − 900 900
Others: 2,069 324,905 816,268 66,596 74,662 − 175,000 1,459,503
Foreign bonds 2,069 324,905 816,268 66,596 74,662 − − 1,284,502
Foreign stocks − − − − − − − −
Total ¥41,322,214 ¥47,221,132 ¥30,857,209 ¥24,657,295 ¥26,034,594 ¥3,282,790 ¥175,900 ¥173,551,137
Millions of yen
2008
One yearor less
> One and≤ three years
> Three and≤ five years
> Five and≤ seven years
> Seven and≤ ten years
Over ten years
No designated
termTotal
Japanese GovernmentBonds ¥34,774,364 ¥41,965,281 ¥32,846,635 ¥17,562,310 ¥27,179,890 ¥2,444,675 − ¥156,773,157
Japanese localgovernment bonds 1,943,227 2,383,545 900,478 1,369,600 902,395 − − 7,499,247
Commercial paper − − − − − − − −Japanese corporate bonds 1,685,301 2,369,207 1,172,093 727,302 1,547,891 299,902 − 7,801,698Stocks − − − − − − − −Others: 9,785 68,621 232,057 112,621 34,926 − − 458,012
Foreign bonds 9,785 68,621 232,057 112,621 34,926 − − 458,012Foreign stocks − − − − − − − −
Total ¥38,412,678 ¥46,786,655 ¥35,151,265 ¥19,771,835 ¥29,665,104 ¥2,744,577 − ¥172,532,116
Thousands of U.S. dollars
2009
One yearor less
> One and≤ three years
> Three and≤ five years
> Five and≤ seven years
> Seven and≤ ten years
Over ten years
No designated
termTotal
Japanese GovernmentBonds $384,827,477 $439,991,627 $273,699,799 $228,633,900 $229,173,023 $26,593,405 $ − $1,582,919,230
Japanese localgovernment bonds 15,924,138 13,018,722 14,654,240 10,697,962 8,590,130 − − 62,885,192
Commercial paper 5,526,866 − − − − − − 5,526,866
Japanese corporate bonds 14,368,419 24,402,123 17,468,433 11,006,111 26,513,869 6,826,022 − 100,584,977
Stocks − − − − − − 9,162 9,162
Others: 21,069 3,307,597 8,309,768 677,962 760,082 − 1,781,540 14,858,019
Foreign bonds 21,069 3,307,597 8,309,768 677,962 760,082 − − 13,076,479
Foreign stocks − − − − − − − −
Total $420,667,970 $480,720,069 $314,132,239 $251,015,935 $265,037,105 $33,419,427 $1,790,702 $1,766,783,447

JAPAN POST BANK Annual Report 2009100
MD
&A
Financial Statem
entsFinancial D
ata
101
Balance by Type of Securities As of March 31
Millions of yenThousands of U.S. dollars
2009 2008 2009
Japanese Government Bonds ¥155,490,155 ¥156,773,157 $1,582,919,230
Japanese local government bonds 6,177,212 7,499,247 62,885,192
Commercial paper 542,904 − 5,526,866
Japanese corporate bonds 9,880,462 7,801,698 100,584,977
Stocks 900 − 9,162
Others 1,459,503 458,012 14,858,019
Total ¥173,551,137 ¥172,532,116 $1,766,783,447
Years ended March 31
Average Balances
Millions of yenThousands of U.S. dollars
2009 2008 2009
Japanese Government Bonds ¥157,557,897 ¥156,740,162 $1,603,969,229
Japanese local government bonds 6,861,037 7,906,902 69,846,665
Commercial paper 437,789 − 4,456,778
Japanese corporate bonds 8,557,389 7,445,295 87,115,850
Stocks 833 − 8,484
Others 879,468 331,451 8,953,156
Total ¥174,294,416 ¥172,423,811 $1,774,350,161
Note: Figures for the fiscal year ended March 31, 2008 are for the six-month period from October 1, 2007 to March 31, 2008.
Fund Management StatusAs of March 31
Millions of yen, %Thousands of U.S. dollars
2009 2008 2009Outstanding
assets % Outstandingassets % Outstanding
assets
Loans ¥ 4,031,587 2.07 ¥ 3,771,527 1.83 $ 41,042,326
Money held in trust 1,224,742 0.63 412,570 0.20 12,468,111
Securities: 173,551,137 89.48 172,532,116 84.13 1,766,783,447
Japanese Government Bonds 155,490,155 80.16 156,773,157 76.44 1,582,919,230
Japanese local government bonds 6,177,212 3.18 7,499,247 3.65 62,885,192
Commercial paper 542,904 0.27 − − 5,526,866
Japanese corporate bonds 9,880,462 5.09 7,801,698 3.80 100,584,977
Stocks 900 0.00 − − 9,162
Other securities 1,459,503 0.75 458,012 0.22 14,858,019
Call loans 51,184 0.02 3,655,000 1.78 521,063
Guarantees on securities lending transactions 725,786 0.37 − − 7,388,640
Due from banks, etc. 5,657,973 2.91 3,984,711 1.94 57,599,239
Deposits (to the fiscal loan fund) 8,700,000 4.48 20,700,000 10.09 88,567,647
Others 10,784 0.00 14,227 0.00 109,790
Total ¥193,953,196 100.00 ¥205,070,154 100.00 $1,974,480,263Notes: 1. Due from banks, etc. for the fiscal year ended March 31, 2008 includes negotiable certificates of deposit, receivables under resale agreements, and
monetary claims bought.2. Due from banks, etc. for the fiscal year ended March 31, 2009 includes negotiable certificates of deposit, receivables under resale agreements, monetary
claims bought, and Bank of Japan (BOJ) deposits. There was no year-end balance of receivables under resale agreements in due from banks, etc. in the fiscal year ended March 31, 2009. The BOJ deposits have been included in due from banks, etc. as of the fiscal year ended March 31, 2009 as these deposits bear interest rates under the BOJ’s supplementary current account system for smoothing monetary supply.
Foreign BondsAs of March 31
Millions of yen, %Thousands of U.S. dollarsForeign Bonds by Currency
2009 2008 2009Fair value % Fair value % Fair value
Japanese yen ¥1,198,704 93.32 ¥229,995 50.21 $12,203,034
Euro 85,798 6.67 121,828 26.59 873,445
U.S. dollar − − 88,331 19.28 −Others − − 17,857 3.89 −Total ¥1,284,502 100.00 ¥458,012 100.00 $13,076,479
Money Held in TrustAs of March 31
Millions of yen, %Thousands of U.S. dollarsAssets by Type
2009 2008 2009Fair value % Fair value % Fair value
Domestic stocks ¥ 995,990 86.69 ¥334,035 84.49 $10,139,373
Domestic bonds 152,719 13.29 − − 1,554,714
Foreign stocks 114 0.00 61,306 15.50 1,168
Total ¥1,148,824 100.00 ¥395,341 100.00 $11,695,256
Millions of yen, %Thousands of U.S. dollarsAssets by Currency
2009 2008 2009Fair value % Fair value % Fair value
Japanese yen ¥1,148,710 99.99 ¥334,035 84.49 $11,694,087
U.S. dollar 113 0.00 31,936 8.07 1,153
Euro 0 0.00 12,133 3.06 8
Others 0 0.00 17,236 4.35 7
Total ¥1,148,824 100.00 ¥395,341 100.00 $11,695,256
Note: Cash and deposits are excluded.

JAPAN POST BANK Annual Report 2009102
MD
&A
Financial Statem
entsFinancial D
ata
103
Securitized Product Exposure
As at March 31, 2009, the Bank held the following securitized products.
The Bank’s credit risk exposure to securitized products and other products was limited to special purpose enterprises (SPEs) that are
final investors. None of these SPEs were established as originators of securitized products and have dubious status as to whether or
not they should be consolidated.
Furthermore, the Bank did not realize any actual losses on securitized products during the fiscal year ended March 31, 2009 due to
write-off or losses on sales.
As of March 31
1. Securitized Products Billions of yen, %
2009Acquisition cost
(A)Net unrealized
gains (losses) (B) (B/A) Credit ratings
Residential mortgage backed securities (RMBS) ¥704.5 ¥(5.0) (0.7) AAA
Subprime loan related − − − −
Collateralized loan obligations (CLO) 71.3 0.5 0.7 AAA
Other securitized products(Securitized products with credit card receivables as underlying assets) 63.6 (0.1) (0.2) AAA〜BBB
Commercial mortgage backed securities (CMBS) − − − −
Collateralized debt obligations (CDO) − − − −
Total ¥839.6 ¥(4.6) (0.5)
Millions of U.S. dollars, %
2009Acquisition cost
(A)Net unrealized
gains (losses) (B) (B/A) Credit ratings
Residential mortgage backed securities (RMBS) $7,172.8 $(51.1) (0.7) AAA
Subprime loan related − − − −
Collateralized loan obligations (CLO) 726.6 5.4 0.7 AAA
Other securitized products(Securitized products with credit card receivables as underlying assets) 647.9 (1.6) (0.2) AAA〜BBB
Commercial mortgage backed securities (CMBS) − − − −
Collateralized debt obligations (CDO) − − − −
Total $8,547.5 $(47.2) (0.5)
Notes: 1. No hedging activities against credit risks were made.2. Underlying assets are located in Japan.3. The numbers do not include securitized products that might be included in investment trusts. The same holds hereinafter.
2. Structured Investment Vehicles (SIVs)
There were no investments in SIVs
3. Leveraged Loans
There were no outstanding leveraged loans.
4. Monoline Insurer Related Products
There were no monoline insurer related exposures.
In addition, the Bank has not extended credit to or executed credit derivatives transactions with any monoline insurers.
5. U.S. Government Sponsored Enterprises (GSEs)
The bank does not hold any securitized products that have as underlying assets securities issued by the Government National
Mortgage Association (Ginnie Mae), Federal National Mortgage Association (Fannie Mae), and Federal Home Loan Mortgage
Corporation (Freddie Mac) of the United States. Nor does the Bank hold any securities directly issued by these GSEs.
Ratios
Net Operating Income to Assets and EquityYears ended March 31
%
2009 2008
Net operating income to assets 0.18 0.23Net operating income to equity 4.73 6.48Note: 1. For the fiscal year ended March 31, 2009, net operating income to assets and net operating income to equity are calculated as follows:
Net Operating Income to Assets = Net operating income / [(sum of total assets at beginning and end of fiscal period) / 2] x 100 Net Operating Income to Equity = Net operating income / [(sum of total capital at beginning and end of fiscal period) / 2] x 100
2. For the fiscal year ended March 31, 2008, net operating income to assets and net operating income to equity are calculated as follows: Net Operating Income to Assets = Net operating income / [(sum of total assets at start of operations and end of fiscal period) / 2] x 100 Net Operating Income to Equity = Net operating income / [(sum of total capital at start of operations and end of fiscal period) / 2] x 100
3. Figures for the fiscal year ended March 31, 2008 are for the six-month period from October 1, 2007 to March 31, 2008 and are annualized.
Net Income to Assets and EquityYears ended March 31
%
2009 2008
Net income to assets (ROA) 0.11 0.14Net income to equity (ROE) 2.82 3.85Notes: 1. For the fiscal year ended March 31, 2009, net income to assets and net income to equity are calculated as follows:
ROA = Net income / [(sum of total assets at beginning and end of fiscal period) / 2] x 100 ROE = Net income / [(sum of total capital at beginning and end of fiscal period) / 2] x 100
2. For the fiscal year ended March 31, 2008, net income to assets and net income to equity are calculated as follows: ROA = Net income / [(sum of total assets at start of operations and end of fiscal period) / 2] x 100 ROE = Net income / [(sum of total capital at start of operations and end of fiscal period) / 2] x 100
3. Figures for the fiscal year ended March 31, 2008 are for the six-month period from October 1, 2007 to March 31, 2008 and are annualized.
Overhead Ratio and Deposit-to-Expense RatioYears ended March 31
%
2009 2008
Overhead ratio (OHR) 72.48 67.11Deposit-to-expense ratio 0.70 0.66Notes: 1. OHR = general and administrative expenses / gross operating profit x 100
2. Deposit-to-expense ratio = general and administrative expenses / average deposit balances x 100 3. General and administrative expenses used in calculating the OHR and deposit-to-expense ratio for the fiscal year ended March 31, 2008 essentially
reflect the six-month period following the Bank's incorporation on October 1, 2007. In addition, gains and losses (including a net loss of ¥731 million) of the preparatory planning company for privatization during the first half of the fiscal period have been included.
4. The gross operating profit used in calculating the OHR for the fiscal year ended March 31, 2008 is for the six-month period from October 1, 2007 to March 31, 2008.
5. The deposit-to-expense ratio for the fiscal year ended March 31, 2008 has been annualized.

JAPAN POST BANK Annual Report 2009104
MD
&A
Financial Statem
entsFinancial D
ata
105
SpreadYears ended March 31
%
2009 2008
Yield on interest-earning assets 1.14 1.19
Interest rate on interest-bearing liabilities 0.33 0.37
Spread 0.80 0.82Notes: 1. Figures for the fiscal year ended March 31, 2008 are for the six-month period from October 1, 2007 to March 31, 2008.
2. Interest rates and spreads for the fiscal year ended March 31, 2008 have been annualized.
Loan-Deposit RatioAs of March 31 (except where noted)
Millions of yen, %Thousands of U.S. dollars
2009 2008 2009
Loans (A) ¥ 4,031,587 ¥ 3,771,527 $ 41,042,326
Deposits (B) 177,479,840 181,743,807 1,806,778,383
Loan-deposit ratio (A/B) 2.27 2.07Loan-deposit ratio (average for fiscal period)* 2.12 2.10* Figures for the fiscal year ended March 31, 2008 are for the six-month period from October 1, 2007 to March 31, 2008.
Security-Deposit RatioAs of March 31 (except where noted)
Millions of yen, %Thousands of U.S. dollars
2009 2008 2009
Securities (A) ¥173,551,137 ¥172,532,116 $1,766,783,447
Deposits (B) 177,479,840 181,743,807 1,806,778,383
Security-deposit ratio (A/B) 97.78 94.93Security-deposit ratio (average for fiscal period)* 97.06 92.88* Figures for the fiscal year ended March 31, 2008 are for the six-month period from October 1, 2007 to March 31, 2008.
Others
Over-the-Counter Sales of Japanese Government BondsYears ended March 31
Millions of yenThousands of U.S. dollars
2009 2008 2009
Long-term bonds ¥ 90,731 ¥ 40,389 $ 923,668
Medium-term bonds 806,190 383,662 8,207,173
Bonds for individuals 285,003 235,485 2,901,393
Total ¥1,181,926 ¥659,537 $12,032,234Note: Figures for the fiscal year ended March 31, 2008 are for the six-month period from October 1, 2007 to March 31, 2008.
Domestic ExchangesYears ended March 31
Mutual Remittances
Millions of yenThousands of U.S. dollars
2009 2008 2009
Remittances(thousands) Amount Remittances
(thousands) Amount Amount
Sent 1,668 ¥4,215,404 108 ¥1,564,318 $42,913,618
Received 1,145 1,464,417 38 203,405 14,908,048Note: For the fiscal year ended March 31, 2008 and for the period from April 1, 2008 to December 30, 2008, domestic exchange balances reflected mutual
remittances services between the Bank and other financial institutions. Effective January 5, 2009, the Bank became a member of the Zengin Data Telecommunication System (the "Zengin System") and all remittances are now transferred through that system. Accordingly, the number of remittances and amount of domestic exchanges with other financial institutions for the fiscal year ended March 31, 2009 are the sum of the mutual remittances services and the Zengin System remittances.
Transfer Deposits
Millions of yenThousands of U.S. dollars
2009 2008 2009
Remittances(thousands) Amount Remittances
(thousands) Amount Amount
In-payment 1,236,168 ¥68,146,219 628,644 ¥34,631,336 $693,741,416
Transfers 87,756 62,125,079 39,948 34,638,839 632,445,078
Out-payment 131,003 67,532,728 61,768 35,524,900 687,495,960Notes: 1. The numbers for the fiscal year ended March 31, 2008 and for the period from April 1, 2008 to December 30, 2008 include mutual remittances indicated
in the above table.2. Figures and amounts for the fiscal year ended March 31, 2008 are for the six-month period from October 1, 2007 to March 31, 2008.
Ordinary Remittances and Postal Orders (TEIGAKU KOGAWASE) Millions of yen
Thousands of U.S. dollars
2009 2008 2009
Remittances(thousands) Amount Remittances
(thousands) Amount Amount
Ordinary remittances 4,359 ¥64,312 2,590 ¥42,155 $654,713
Postal orders (TEIGAKU KOGAWASE) 24,079 11,314 11,935 5,977 115,185Note: Figures and amounts for the fiscal year ended March 31, 2008 are for the six-month period from October 1, 2007 to March 31, 2008.
Foreign ExchangesYears ended March 31
Millions of U.S. dollars
2009 2008Remittances(thousands) Amount Remittances
(thousands) Amount
427 $1,114 230 $632Notes: 1. Foreign exchanges represent the total of international remittances and purchases and sales of traveler’s checks.
2. Figure and amount for the fiscal year ended March 31, 2008 are for the six-month period from October 1, 2007 to March 31, 2008.

JAPAN POST BANK Annual Report 2009106
MD
&A
Financial Statem
entsFinancial D
ata
107
Investment Trusts Sales (Contract Basis)Years ended March 31
Millions of yenThousands of U.S. dollars
2009 2008 2009
Number of contracts (thousands) 1,598 1,063 Sales value ¥171,395 ¥147,498 $1,744,830
As of March 31
Millions of yenThousands of U.S. dollars
2009 2008 2009
Number of investment trust accounts (thousands) 551 508Net assets ¥815,666 ¥978,531 $8,303,631Notes: 1. Figures have been rounded off.
2. Account numbers and amounts for the fiscal year ended March 31, 2008 are for the period from October 1, 2007 to March 31, 2008.
Other BusinessesAs of March 31, 2009
Credit Cards
Cards issued (outstanding) 366,798 Cards
Mortgage Loans
Millions of yenThousands of U.S. dollars
New credit extended (as intermediary) ¥56,247 $ 572,614
Variable Annuities Policies
Millions of yenThousands of U.S. dollars
Number of policies 3,786Value of policies ¥17,615 $ 179,326Notes: 1. The Bank launched the credit card business on May 1, 2008, the mortgage loan intermediary business on May 12, 2008, and the variable annuity
business on May 29, 2008.
2. The Bank acts as the intermediary for Suruga Bank Ltd.’s mortgage loan business.
Capital Position
Capital Adequacy Ratio (Non-Consolidated, Domestic Standard)As of March 31
Millions of yen, %
Account 2009 2008
Tier I capital Common stock ¥3,500,000 ¥3,500,000Non-cumulative perpetual preferred stock − −
Deposit for subscriptions to shares − −Capital surplus reserve 4,296,285 4,296,285Other capital surplus − −Retained earnings − −Other retained earnings 413,140 206,577Others − −Treasury stock (deduction) − −Advance on subscription for treasury stock − −Cash dividends to be paid (57,300) (22,800)Unrealized gains (losses) on other securities − −Subscription rights to shares − −Goodwill equivalents (deduction) − −Intangible fixed assets accounted as a result of merger (deduction) − −Gains on sale on securitization transactions (deduction) − −
Total Tier I capital (total of above items) before deduction of deferred tax assets − −Deduction of deferred tax assets (Note1) − −
Total Tier I capital (A) 8,152,126 7,980,062Redeemable equity securities, etc.
(carrying covenant regarding step-up interest rate) − −Tier II capital 45% of revaluation reserve for land − −
General reserve for possible loan losses 370 950Capital raising through debt financing − −
Capital raising through debt financing − −Subordinated bonds with maturity dates and preferred stocks with maturity dates − −
Items not included in Tier II capital − −Total Tier II capital (B) 370 950
Deductions Deductions (C) − −Total risk-based capital Total risk-based capital (A+B-C) (D) 8,152,496 7,981,013Risk assets On-balance-sheet items 5,406,131 4,920,454
Off-balance-sheet items 74,249 882,951Operational risk equivalent / 8% 3,372,115 3,487,041Risk assets, etc. (E) 8,852,495 9,290,447
Capital adequacy ratio (D/E) 92.09 85.90Tier I capital ratio (A/E) 92.08 85.89Notes: 1. At the end of the fiscal year ended March 31, 2009, the amount equivalent to deferred tax assets totaled ¥141,273 million (¥32,269 million at the end of
the fiscal year ended March 31, 2008), and the regulatory ceiling on allowable inclusion of deferred tax assets in capital was ¥1,630,425 million (¥1,596,012 million at the end of the fiscal year ended March 31, 2008).
2. The non-consolidated capital adequacy ratio is calculated based on standards stipulated by Article 14-2 of the Banking Law (Notification No. 19, the Financial Services Agency of Japan, March 27, 2006) for the purpose of determining whether banks have sufficient equity capital given their holdings of assets and other instruments.
3. The Bank has had its assessment method for capital adequacy ratios audited by the independent audit corporation KPMG AZUSA & Co. in accordance with the Japanese Institute of Certified Public Accountants (JICPA) Industry Audit Committee Report No. 30. The independent audit did not involve auditing of financial accounting methods, but focused on the capital adequacy assessment process of the internal control system based on procedures agreed on by the Bank and KPMG AZUSA & Co. The audit corporation reported these results privately to the Bank and did not issue an audit opinion regarding the capital adequacy ratio or the internal capital adequacy assessment process.

JAPAN POST BANK Annual Report 2009108
MD
&A
Financial Statem
entsFinancial D
ata
109
The Bank assesses the adequacy of its capital by comparing its equity base with its exposure to market, credit, and other risks. Within
its capital structure, the Bank evaluates the quality of its capital base by using such factors as the proportion of Tier 1 capital, included
in overall capital which includes equity capital and other elements, directed toward establishing a financial base appropriate to its risk
appetite.
Specifically, the Bank assesses its capital adequacy position by comparing its risk capital, which is defined as the total of its total risk-
based capital (Tier 1 + Tier 2), a portion of unrealized valuation gains on other securities, and projected profits with total risk exposure to
market, credit, and operational risk during the period being monitored. To evaluate the quality of its capital, the Bank examines its Tier 1
capital ratio (Tier 1 capital/total risk capital).
The Bank’s capital adequacy management framework comprises monthly reporting of these abovementioned assessments to the
ALM Committee and quarterly reporting to the ALM Committee, the Executive Committee, Board of Directors, and other management
bodies.
Assessment of Capital Adequacy
Millions of yen, %
2009 2008
(1) Capital requirement for credit risk (Note 1): ¥219,215 ¥232,136Portfolios applying the standardized approach 217,852 231,765Securitization exposures 1,362 370
(2) Capital requirement for operational risk (Note 2): 134,884 139,481The basic indicator approach 134,884 139,481
(3) Total capital requirements ((1) + (2)) (Note 3) 354,099 371,617(4) Capital adequacy ratio 92.09 85.90(5) Tier I capital ratio 92.08 85.89Notes: 1. Risk weighted assets x 4%
2. (Operational risk / 8%) x 4%
3. Denominator of capital adequacy ratio x 4%
The Bank raises capital through the issue of common shares. Current issuance is as follows.
•Total issued and outstanding common shares: 150 million shares
Total Required Capital, Capital Adequacy Ratio, and Tier I Capital Ratio (Non-Consolidated)
Outline of Instruments for Raising Capital
As of March 31
Instruments for Raising Capital
Exposure Amount of Capital Required for Credit Risk (On-Balance Sheet Items)As of March 31
(Reference) Risk weight
(%) (Note 2)
Millions of yen
Item 2009 2008
1 Cash 0 ¥ 0 ¥ 02 Japanese government and the Bank of Japan 0 0 03 Foreign national governments and central banks 0〜100 23 174 Bank for International Settlements, etc. 0 − −5 Japanese local public agencies 0 0 06 Foreign public-sector agencies, other than central governments 20〜100 1,297 2017 International Development Bank 0〜100 0 −8 Local public corporations and other financial institutions 10 562 −9 Japanese government agencies 10〜20 18,956 19,185
10 Three regional public corporations 20 − −11 Financial institutions and Financial Instruments Business Operators Engaged
in Type I Financial Instruments Businesses 20〜100 37,022 67,38812 Corporations 20〜100 99,776 83,57413 Small and midsize enterprises and individuals 75 − −14 Mortgage loans 35 − −15 Project finance (acquisition of real estate) 100 − −16 Past-due (three months or more) 50〜150 − 017 Unsettled bills 20 − −18 Loans guaranteed by Credit Guarantee Association, etc. 10 − −19 Loans guaranteed by Industrial Revitalization Corporation of Japan 10 − −20 Investments in capital and others 100 42,924 15,82021 Other than above 100 14,318 10,25822 Securitization transactions (as originator) 20〜100 − −23 Securitization transactions (as investor and other) 20〜100 1,362 37024 Assets comprised of asset pools (so-called funds) for
which the individual underlying assets are difficult to identify − − −25 Capital deductions − − −
Total − ¥216,245 ¥196,818Notes: 1. Capital requirements are calculated using the following formula.
(Risk weighted assets x 4%)
2. Risk weightings are stipulated in the Capital Adequacy Notification.

JAPAN POST BANK Annual Report 2009110
MD
&A
Financial Statem
entsFinancial D
ata
111
Amount of Capital Required for Credit Risk (Off-Balance Sheet Items)As of March 31
(Reference) Risk weight
(%) (Note 2)
Millions of yenItem 2009 2008
1 Commitment line cancelable automatically or unconditionally at any time 0 ¥ − ¥ −2 Commitment lines with original contract terms of one year or less 20 49 13 Short-term trade contingent liabilities 20 − −4 Contingent liabilities arising from specific transactions 50 − −
(Guaranteed principal amounts held in some trusts under the transitional provisions) 50 − −5 NIFs or RUFs 50 − −6 Commitment lines with original duration of over one year 50 − −7 Contingent liabilities arising from directly substituted credit 100 − −
(Secured with loan guarantees) 100 − −(Secured with securities) 100 − −(Secured with draft acceptance) 100 − −(Guaranteed principal amounts held in some trusts outside
of the transitional provisions) 100 − −(Credit derivative protection provided) 100 − −
8 Assets sold with repurchase agreements or assets sold with right of claim(after deductions) − − −
Assets sold with repurchase agreements or assets sold with right of claim(before deductions) 100 − −
Deductions − − −9 Futures purchases, forward delivery deposits, partly paid shares, partly paid bonds 100 − −
10 Securities lending, cash or securities collateral provision, or sale or purchase of securities with repurchase agreements 100 2,765 35,310
11 Derivative transactions − 155 5(1) Foreign exchange-related transactions − 109 0(2) Interest rate-related transactions − 42 4(3) Gold-related transactions − − −(4) Equity-related transactions − − −(5) Precious metal-related transactions (excluding gold) − − −(6) Other commodity-related transactions − − −(7) Credit derivative transactions (counterparty risk) − 3 −Write-off of credit equivalent amount under close-out netting agreement (deduction) − − −
12 Long-settlement transactions − 0 013 Accounts outstanding − − −14 Eligible liquidity facilities related to securitization exposure
and eligible servicer cash advance facilities 0〜100 − −15 Off-balance sheet securitization exposure other than the above 100 − −16 Capital deductions − − −
Total − ¥2,969 ¥35,318Notes: 1. Capital requirements are calculated using the following formula.
(Risk weighted assets × 4%)
2. Risk weightings are stipulated in the Capital Adequacy Notification.
Ratings for Portfolios Eligible for the Standardized Approach
Outline of Credit Risk Management Policies and Procedures
Exposure Rating agencies
Central goverments and central banks Resident R&I, JCR, Moody’s, S&P
Non-resident Moody’s, S&P, OECDJapanese local public agencies R&I, JCR, Moody’s, S&PForeign public agencies, other than foreign national governments Moody’s, S&P, OECDInternational Development Bank Moody’s, S&PJapanese government agencies R&I, JCR, Moody’s, S&PFinancial institutions and Financial Instruments Business Operators Resident R&I, JCR, Moody’s, S&P Engaged in Type I Financial Instruments Businesses Non-resident Moody’s, S&P, OECDCorporations Resident R&I, JCR, Moody’s, S&P
Non-resident Moody’s, S&PSecuritization R&I, JCR, Moody’s, S&P
Credit Risk
See Page 62-63 (Credit Risk Management)
• Qualified Rating Agencies Used to Determine Risk Weights
In determining risk weights, the Bank utilizes the credit ratings of four rating agencies, specifically, Rating and Investment Information,
Inc. (R&I), Japan Credit Rating Agency, Ltd. (JCR), Moody’s Investors Service, Inc. (Moody’s), and Standard & Poor’s Ratings Services
(S&P), in addition to the Organisation for Economic Co-operation and Development (OECD).
• Qualified Rating Agencies Used to Determine Risk Weight by Exposure Category
The Bank uses the following qualified rating agencies for each of the following risk exposure categories.
In the case where multiple credit ratings agencies provide ratings, the Bank selects the credit rating that yields the second smallest
risk weight in accordance with the Capital Adequacy Notification.

JAPAN POST BANK Annual Report 2009112
MD
&A
Financial Statem
entsFinancial D
ata
113
Year-End Balances of Exposure to Loans in Arrears for Three Months or More and for Loans in Default and Details by Loan Class (by Region and Industry)
There were no year-end balances.
Loan Write-Off by Industry and Counterparty
There were no write-off of loans during the fiscal year ended March 31, 2009.
Millions of yen
2009
Region Industry Loans, deposits, etc. Securities Derivatives Others Total
Japan Agriculture, forestry, fishery, and mining ¥ − ¥ − ¥ − ¥ − ¥ −
Manufacturing 190,824 660,980 − 4 851,809
Utilities, information/communications, and transportation 201,797 4,084,766 − 19,286 4,305,850
Wholesale and retail 18,441 161,197 − − 179,639
Finance and insurance 13,095,907 4,646,218 6,316 16,660 17,765,103
(77,488,440) (77,488,440)
Construction and real estate 50,745 404,976 − 2 455,724
Services 1,350,202 318,189 − 40,002 1,708,395
National and local government agencies 11,939,035 161,727,856 − 1,235 173,668,128
Others 1,594,922 − − 361,579 1,956,501
Total 28,441,877 172,004,185 6,316 438,771 200,891,151
(77,488,440) (77,488,440)
Overseas Sovereigns − 380,646 − 1,315 381,962
Financial institutions 62,907 574,245 9,872 4,889 651,914
Others 130,485 509,799 − 4,041 644,325
Total 193,392 1,464,690 9,872 10,246 1,678,202
Grand total 28,635,270 ¥173,468,876 ¥16,188 ¥449,018 202,569,354
¥(77,488,440) ¥(77,488,440)
Millions of yen
2008
Region Industry Loans, deposits, etc. Securities Derivatives Others Total
Japan Agriculture, forestry, fishery, and mining ¥ − ¥ − ¥ − ¥ − ¥ −Manufacturing 7,823 292,823 − − 300,647Utilities, information/communications, and transportation − 3,134,349 − 14 3,134,363Wholesale and retail 6,402 152,491 − − 158,893Finance and insurance 15,004,096 3,726,279 360 20,661 18,751,398
(115,653,403) (115,653,403)Construction and real estate 5,001 309,324 − 2 314,329Services 1,441,500 145,027 − 44 1,586,572National and local government agencies 20,700,000 164,341,401 − 3,127 185,044,528Others 544,527 − − 256,783 801,310Total 37,709,352 172,101,696 360 280,633 210,092,043
(115,653,403) (115,653,403)Overseas Sovereigns 701 293,710 − − 294,411
Financial institutions 3,619,405 76,627 336 70 3,696,439Others 229,844 90,798 − 20 320,662Total 3,849,950 461,135 336 91 4,311,513
Grand total 41,559,302 ¥172,562,832 ¥697 ¥280,725 214,403,557¥(115,653,403) ¥(115,653,403)
Notes: 1. Loans, deposits, etc. comprise loans, deposits with banks, call loans, and off-balance sheet assets other than derivatives. Figures in parenthesis are collateral provided (off balance sheet assets) to Management Organization for Postal Savings and Postal Life Insurance noted elsewhere.
2. Securities include Japanese Government Bonds, Japanese local government bonds, Japanese corporate bonds, etc.3. Derivatives comprise such instruments as interest rate swaps and forward foreign exchange contracts.4. The amount of exposure includes balances before the deduction of specific reserve for possible loan losses and after the application of credit risk
mitigation methods.
Exposure by Region, Industry, and Remaining Period
Exposure by Region and IndustryAs of March 31
Millions of yen
2009
Time to maturity Loans, deposits, etc. Securities Derivatives Others Total
One year or less ¥ 14,130,243 ¥ 41,644,261 ¥ 173 ¥ 57,576 ¥ 55,832,254
(77,488,440) (77,488,440)
> One and ≤ three years 2,168,776 47,141,988 2,658 4 49,313,427
> Three and ≤ five years 488,315 30,755,970 8,774 27 31,253,087
> Five and ≤ seven years 378,748 24,627,186 − − 25,005,935
> Seven and ≤ ten years 2,331,840 25,900,985 4,582 − 28,237,408
Over ten years 3,450,433 3,215,172 − − 6,665,605
No designated term 5,686,912 183,311 − 391,410 6,261,635
Total 28,635,270 ¥173,468,876 ¥16,188 ¥449,018 202,569,354
¥(77,488,440) ¥(77,488,440)
Millions of yen
2008
Time to maturity Loans, deposits, etc. Securities Derivatives Others Total
One year or less ¥ 22,191,289 ¥ 38,734,867 ¥110 ¥ 7,407 ¥ 60,933,675(115,653,403) (115,653,403)
> One and ≤ three years 8,763,973 46,752,433 586 − 55,516,993> Three and ≤ five years 128,149 35,053,983 − − 35,182,133> Five and ≤ seven years 192,334 19,673,963 − − 19,866,298> Seven and ≤ ten years 905,027 29,625,054 − − 30,530,082Over ten years 2,235,888 2,722,529 − − 4,958,417No designated term 7,142,639 − − 273,317 7,415,956Total 41,559,302 ¥172,562,832 ¥697 ¥280,725 214,403,557
¥(115,653,403) ¥(115,653,403)
Notes: 1. Loans and deposits, etc. comprise loans, deposits with banks, call loans, and off-balance sheet assets other than derivatives. Figures in parenthesis are collateral provided (off balance sheet assets) to Management Organization for Postal Savings and Postal Life Insurance noted elsewhere.
2. Securities include Japanese Government Bonds, Japanese local government bonds, Japanese corporate bonds, etc.3. Derivatives comprise such instruments as interest rate swaps and forward foreign exchange contracts.4. The amount of exposure includes balances before the deduction of specific reserve for possible loan losses and after the application of credit risk
mitigation methods.
Exposure by Time to MaturityAs of March 31

JAPAN POST BANK Annual Report 2009114
MD
&A
Financial Statem
entsFinancial D
ata
115
Balance at end of fiscal period Millions of yen
2009 2008
General reserve for possible loan losses ¥112 ¥8Specific reserve for possible loan losses − −Loan loss reserve for specific overseas countries − −
Years ended March 31
Changes during fiscal period Millions of yen
2009 2008
General reserve for possible loan losses ¥103 ¥8Specific reserve for possible loan losses − −Loan loss reserve for specific overseas countries − −
Notes: 1. Breakdowns by domestic and overseas amounts are not disclosed as the Bank only booked general reserve for possible loan losses for the fiscal years ended March 31, 2009 and 2008.
2. Since the reserves for possible loan losses noted are those for problem assets disclosed under the Financial Reconstruction Law, they do not match the figures for balance of reserve for possible loan losses and changes during the fiscal year on page 97.
Balance at end of fiscal period Millions of yen
2009 2008
General reserve for possible loan losses ¥112 ¥8Specific reserve for possible loan losses − −Loan loss reserve for specific overseas countries − −
Years ended March 31
Changes during fiscal period Millions of yen
2009 2008
General reserve for possible loan losses ¥103 ¥8Specific reserve for possible loan losses − −Loan loss reserve for specific overseas countries − −
Notes: 1. Breakdowns by industry are not disclosed as the Bank only booked general reserve for possible loan losses for the fiscal years ended March 31, 2009 and 2008.
2. Since the reserves for possible loan losses noted are those for problem assets disclosed under the Financial Reconstruction Law, they do not match the figures for balance of reserve for possible loan losses and changes during the fiscal year on page 97.
Year-End Balances and Changes During the Period of General Reserve for Possible Loan Losses, Specific Reserve for Possible Loan Losses, and Loan Loss Reserve for Specific Overseas Countries
By RegionAs of March 31
By IndustryAs of March 31
Exposure by Risk Weight ClassificationAs of March 31
Millions of yen
2009 2008Risk weight Rated Not rated Rated Not rated
0% ¥175,751,925 ¥87,511,631 ¥187,976,853 ¥117,163,15310% − 5,520,037 − 10,930,12920% 7,460,051 − 11,354,228 −35% − − − −50% 822,279 − 403,507 −75% − − − −100% 133,526 2,858,342 122,302 2,106,786150% − − 0 −350% − − − −Others − − − −Capital deductions − − − −Total ¥184,167,783 ¥95,890,010 ¥199,856,892 ¥130,200,068Notes: 1. Ratings are limited to those rated by qualified rating agencies.
2. The amount of exposure includes balances before the deduction of specific reserve for possible loan losses and after application of the credit risk mitigation methods.
3. The portion of exposure from assets qualified for credit risk mitigation methods was allocated to risk weight categories before the application of credit risk mitigation methods through the end of the fiscal year ended March 31, 2008. As of the fiscal year ended March 31, 2009, however, assets have been allocated to risk weight categories after the application of credit risk mitigation methods. Figures for the fiscal year ended March 31, 2009 and beyond have been adjusted to reflect this change in the allocation method.

JAPAN POST BANK Annual Report 2009116
MD
&A
Financial Statem
entsFinancial D
ata
117
Millions of yen, %
2009 2008Item Exposure % Exposure %
Eligible financial collateral ¥78,604,285 93.03 ¥109,788,309 96.34Guarantees 5,883,870 6.96 4,164,102 3.65Total ¥84,488,155 100.00 ¥113,952,412 100.00Notes: 1. The categories of eligible financial collateral used by the Bank include cash, self deposits, and securities.
2. The major guarantors used by the Bank are the national government and corporations. The use of these guarantors lowers risk weights more than non-guaranteed debts.
3. There is no exposure to funds that include investment trusts, etc.
Exposure After Applying Credit Risk Mitigation
Outline of Risk Management Policies and Procedures
As of March 31
The Bank applies credit risk mitigation methods as stipulated in the Capital Adequacy Notification in calculating its capital adequacy
ratio. Credit risk mitigation methods involve taking into consideration the benefits of collateral and guarantees in the calculation of
its capital adequacy ratio and can be appropriately applied to eligible financial collateral, the netting of loans against the Bank’s self
deposits, and guarantees and credit derivatives.
• Categories of Eligible Financial Collateral
Cash, self deposits, and securities are the only type of eligible financial collateral used by the Bank.
• Outline of Policies and Procedures for the Assessment and Management of Collateral
The Bank uses the Simple Method stipulated in the Capital Adequacy Notification as its credit risk mitigation method.
The Bank has established internal procedures that enable timely sales or purchases of eligible financial collateral based on collateral
contracts, including terms and conditions, signed prior to any of these transactions.
• Outline of Policies and Procedures for the Netting of Loans and Self Deposits and the Types of Transactions and Scope
for which Netting can be Applied
The Bank regards the netted amount of loans and self deposits as the amount of exposure used in the calculation of the capital
adequacy ratio in accordance with special clauses on netting in banking transaction agreements.
Currently, this policy is not being applied.
• Explanation of the Credit Worthiness of Guarantors and Major Types of Counterparties in Credit Derivative Transactions
The major guarantors used by the Bank are the national government and corporations. The use of these guarantors lowers risk weights
more than non-guaranteed debts. The Bank has no credit derivative balances.
• Outline of Policies and Procedures for Legally Applying Close-Out Netting Contracts for Derivative Transactions as well
as Repurchase Transaction Agreements and the Type and Scope of Transactions to which This Method is Applied
Not applicable.
• Information on the Concentration of Credit and Market Risk Arising from the Application of Credit Risk Mitigation Methods
There is no concentration arising from the use of credit risk mitigation.
Credit Risk Mitigation Methodology
Outline of Policies and Procedures for Risk Management
Derivative Transactions and Long-Settlement TransactionsAs of March 31
Millions of yen
2009 2008
ItemGross
replacement costs
Gross add-on amounts
Net credit equivalents
Gross replacement
costs
Gross add-on amounts
Net credit equivalents
Interest rate-related transactions:
Interest rate swaps ¥303 ¥ 4,335 ¥ 4,638 ¥ 86 ¥500 ¥586
Currency-related transactions:Forward foreign exchange contracts 23 11,526 11,549 26 84 110
Long-settlement transactions 0 0 0 6 0 6
Total ¥327 ¥15,861 ¥16,189 ¥119 ¥584 ¥704Notes: 1. Net credit equivalents are calculated using the Current Exposure Method.
2. There are no outstanding credit derivatives or credit risk exposures to which credit risk mitigation methods were applied.3. Gross replacement costs for which reconstruction costs were less than zero are not included.4. As prescribed in the Capital Adequacy Notification, currency-related derivative transactions with original contract periods of five business days or less are
excluded.5. Long-settlement transactions at the Bank represent securities transactions with settlement periods exceeding five business days.6. There is no exposure to funds that include investment trusts, etc.
• Policy on Collateral Security and Reserve Calculation and Impact of Additional Collateral Demanded on Deterioration of
Credit Quality
The Bank signs, as necessary, credit risk mitigation contracts with counterparties in derivative transactions that involve regular transfers
of collateral determined in accordance with replacement costs and the likes. Under these contracts, the Bank must provide the
counterparty with additional collateral in the event of deterioration in the Bank’s credit quality. However, the impact of these contracts is
deemed to be minor.
At the end of the fiscal year ended March 31, 2009, collateral provided for these derivative transactions amounted to ¥18,985 million.
The Bank’s policy on reserve calculation related to derivative transactions is the same as that on applied to ordinary on-balance sheet
assets.
• Policy on Credit Line Limit and Risk Capital Allocation Method
Credit ratings have been assigned to all transaction counterparties based on credit quality assessments. Accordingly, the Bank has no
particular concerns over the credit standings of these counterparties.
The Bank assigns debtor ratings to all derivative transaction counterparties. The Bank sets credit line limits based on these ratings
and conducts regular monitoring on a daily basis to ensure appropriate management of credit risk. The Bank uses the Current Exposure
Method in determining the amount of credit outstanding as part of its credit risk management. This method takes into consideration
market value of and price fluctuation risk of derivative transactions.
The risk capital allocations for derivative transactions are included in those for market risk.
Derivative Transactions and Transactions with Long-Term Settlements

JAPAN POST BANK Annual Report 2009118
MD
&A
Financial Statem
entsFinancial D
ata
119
Millions of yen
2009 2008
Risk weight Balance Capital requirements Balance Capital
requirements
Less than 20% ¥ 71,669 ¥ 286 ¥ − ¥ −20% 134,514 1,076 46,323 37050% − − − −100% − − − −150% − − − −Capital deductions − − − −Total ¥206,184 ¥1,362 ¥46,323 ¥370Notes: 1. The above figures are not risk-weighted assets calculated in accordance with Article 15 of the Supplementary Provisions to the Capital Adequacy
Notification.2. Capital requirements are calculated using the following formula.
(Risk weighted assets x 4%)
Millions of yen
Type of underlying assets 2009 2008
Mortgage loans ¥ 87,598 ¥22,706Auto loans 13,592 8,406Leases 19,581 10,206Consumer loans 13,742 5,005Corporate loans 71,669 −Total ¥206,184 ¥46,323Note: The above figures are not risk-weighted assets calculated in accordance with Article 15 of the Supplementary Provisions to the Capital Adequacy
Notification.
Outline of Policies and Procedures for Risk Management
Method Applied for the Calculation of Credit Risk-Weighted Asset Amounts with Regard to Securitization Exposure
Qualified Rating Agencies Used to Determine Risk Weights by Type of Securitization Exposure
Investments in Securitized Instruments
The Bank is exposed to risks associated with securitization as an investor. For the acquisition of securitized instruments, the Bank refers
to external credit ratings and examines closely the quality of underlying assets, the structure of senior and subordinate rights, and the
details of the securitization scheme. In view of these procedures, it assigns ratings to debtors and conducts investment management
within the credit line limits. Following acquisition, the Bank monitors the external credit ratings, the recovery of the underlying assets,
and other indicators. Furthermore, credit risks related to the securitized instruments are included in the calculation of credit risk amount,
while related interest rate risks are included in the calculation of market risk amount.
The Bank applies the “Standardized Approach” stipulated in the Capital Adequacy Notification to calculate credit risk-weighted asset
amounts related to securitized instruments.
The Bank adopts the credit ratings of the following qualified rating agencies to determine credit risk-weighted asset amounts related to
securitized instruments.
• Rating and Investment Information, Inc. (R&I)
• Japan Credit Rating Agency, Ltd. (JCR)
• Moody’s Investors Service, Inc. (Moody’s)
• Standard & Poor’s Ratings Services (S&P)
Securitization Exposure
Breakdown by Type of Underlying AssetsAs of March 31
Balance by Risk Weight and Amount of Capital RequirementsAs of March 31
Accounting Policy for Securitization Transactions
The Bank complies with the Accounting Standards Board of Japan Statement No. 10, Accounting Standards for Financial Instruments
(Business Accounting Council, January 22, 1999) in recognizing the initiation and extinguishment of financial assets and liabilities in
securitization transactions and assessing and booking these assets and liabilities.
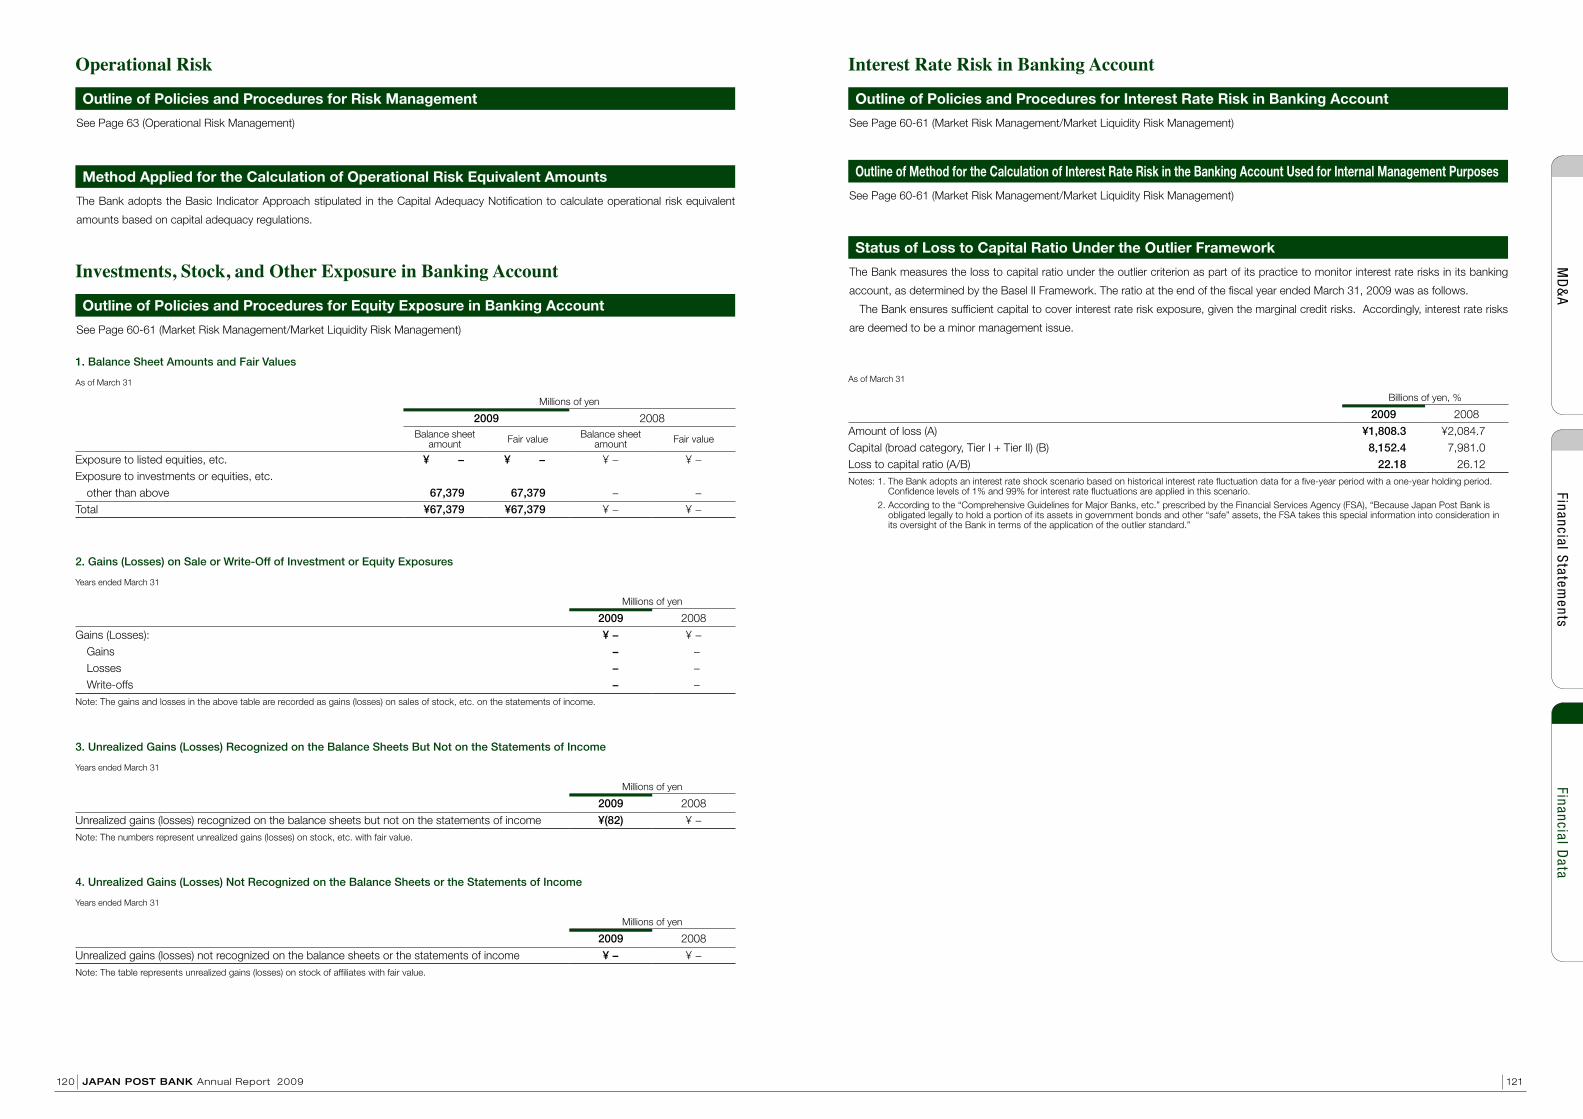
JAPAN POST BANK Annual Report 2009120
MD
&A
Financial Statem
entsFinancial D
ata
121
Millions of yen
2009 2008Balance sheet
amount Fair value Balance sheet amount Fair value
Exposure to listed equities, etc. ¥ − ¥ − ¥ − ¥ −Exposure to investments or equities, etc.
other than above 67,379 67,379 − −Total ¥67,379 ¥67,379 ¥ − ¥ −
1. Balance Sheet Amounts and Fair Values
As of March 31
Millions of yen
2009 2008
Gains (Losses): ¥ − ¥ −Gains − −Losses − −Write-offs − −
Note: The gains and losses in the above table are recorded as gains (losses) on sales of stock, etc. on the statements of income.
2. Gains (Losses) on Sale or Write-Off of Investment or Equity Exposures
Years ended March 31
Millions of yen
2009 2008
Unrealized gains (losses) recognized on the balance sheets but not on the statements of income ¥(82) ¥ −Note: The numbers represent unrealized gains (losses) on stock, etc. with fair value.
3. Unrealized Gains (Losses) Recognized on the Balance Sheets But Not on the Statements of Income
Years ended March 31
Millions of yen
2009 2008
Unrealized gains (losses) not recognized on the balance sheets or the statements of income ¥ − ¥ −Note: The table represents unrealized gains (losses) on stock of affiliates with fair value.
4. Unrealized Gains (Losses) Not Recognized on the Balance Sheets or the Statements of Income
Years ended March 31
Outline of Policies and Procedures for Risk Management
Method Applied for the Calculation of Operational Risk Equivalent Amounts
Outline of Policies and Procedures for Equity Exposure in Banking Account
See Page 63 (Operational Risk Management)
The Bank adopts the Basic Indicator Approach stipulated in the Capital Adequacy Notification to calculate operational risk equivalent
amounts based on capital adequacy regulations.
See Page 60-61 (Market Risk Management/Market Liquidity Risk Management)
Operational Risk
Investments, Stock, and Other Exposure in Banking Account
As of March 31
Billions of yen, %
2009 2008
Amount of loss (A) ¥1,808.3 ¥2,084.7Capital (broad category, Tier I + Tier II) (B) 8,152.4 7,981.0Loss to capital ratio (A/B) 22.18 26.12Notes: 1. The Bank adopts an interest rate shock scenario based on historical interest rate fluctuation data for a five-year period with a one-year holding period.
Confidence levels of 1% and 99% for interest rate fluctuations are applied in this scenario.2. According to the “Comprehensive Guidelines for Major Banks, etc.” prescribed by the Financial Services Agency (FSA), “Because Japan Post Bank is
obligated legally to hold a portion of its assets in government bonds and other “safe” assets, the FSA takes this special information into consideration in its oversight of the Bank in terms of the application of the outlier standard.”
Outline of Policies and Procedures for Interest Rate Risk in Banking Account
Outline of Method for the Calculation of Interest Rate Risk in the Banking Account Used for Internal Management Purposes
Status of Loss to Capital Ratio Under the Outlier Framework
See Page 60-61 (Market Risk Management/Market Liquidity Risk Management)
See Page 60-61 (Market Risk Management/Market Liquidity Risk Management)
The Bank measures the loss to capital ratio under the outlier criterion as part of its practice to monitor interest rate risks in its banking
account, as determined by the Basel II Framework. The ratio at the end of the fiscal year ended March 31, 2009 was as follows.
The Bank ensures sufficient capital to cover interest rate risk exposure, given the marginal credit risks. Accordingly, interest rate risks
are deemed to be a minor management issue.
Interest Rate Risk in Banking Account

Board Member Koji Furukawa Chairman & CEO
Shokichi Takagi President & COO
Atsushi Kinebuchi Director (outside)
Yoshifumi Nishikawa Director (outside)
Fumio Masada Director (outside)
Noboru Matsuda Director (outside)
Nomination Committee Yoshifumi Nishikawa Chairman
Koji Furukawa
Shokichi Takagi
Atsushi Kinebuchi
Fumio Masada
Audit Committee Noboru Matsuda Chairman
Atsushi Kinebuchi
Fumio Masada
Compensation Committee Yoshifumi Nishikawa Chairman
Koji Furukawa
Shokichi Takagi
Atsushi Kinebuchi
Fumio Masada
Japan Post Bank Co., Ltd.
1-3-2 Kasumigaseki, Chiyoda-ku,
Tokyo 100-8798
Japan
Internet : http://www.jp-bank.japanpost.jp/
Annual Report 2009
This report contains forward-looking statements. Forward-looking statements are
statements that are not historical facts; they include statements about our beliefs and
expectations and assumptions made by Japan Post Bank’s management. These
statements are based on plans, estimates and projections currently available to the
management at the time of producing these statements. Japan Post Bank undertakes
no obligation to publicly update or revise any forward-looking statements in light of new
information or future events.
By their nature, forward-looking statements involve risks and uncertainties. A number
of important factors could therefore cause actual results to differ materially from those
contained in any forward-looking statements.
Representative Executive Officers Koji Furukawa Chairman & CEO
Shokichi Takagi President & COO
Executive Officers Tomohiro Yonezawa Executive Vice President
Sumio Fukushima Executive Vice President
Tomohisa Mase Senior Managing Executive Officer
Akira Iwasaki Senior Managing Executive Officer
Toru Takahashi Senior Managing Executive Officer
Shuichi Ikeda Managing Executive Officer
Susumu Tanaka Managing Executive Officer
Hiroshi Yamada Managing Executive Officer
Satoshi Hoshino Managing Executive Officer
Satoru Ito Managing Executive Officer
Riki Mukai Managing Executive Officer
Masahiro Murashima Managing Executive Officer
Hiroichi Shishimi Executive Officer
Takashi Usuki Executive Officer
Yoko Makino Executive Officer
Masaya Aida Executive Officer
Naoto Misawa Executive Officer
Masato Wakai Executive Officer
Katsumi Amano Executive Officer
Kunihiko Amaha Executive Officer
Osami Niihori Executive Officer
JAPAN POST BANK Annual Report 2009122 123
Board of Directors and Executive Officers Corporate Data
Cautionary Statement
As of August 1, 2009

Dialogue
Related Documents