MAY THE JOYOUS SEASON BRING YOU A FULFILLING HARVEST, SOARING HAPPINESS AND RYTHMIC CELEBRATIONS HAPPY LOHRI & MAKAR SANKRANTI 2016 : Issue 509, Week : 11th - 14th January A Weekly Update from SMC (For private circulation only) WISE M NEY Brand smc 333

Welcome message from author
This document is posted to help you gain knowledge. Please leave a comment to let me know what you think about it! Share it to your friends and learn new things together.
Transcript

MAY THE JOYOUS SEASONBRING YOU A FULFILLING HARVEST,SOARING HAPPINESS AND RYTHMIC CELEBRATIONS
HAPPY LOHRI &MAKAR SANKRANTI
2016 : Issue 509, Week : 11th - 14th JanuaryA Weekly Update from SMC
(For private circulation only)
WISE M NEY
Bra
nd
sm
c 333

Contents
Equity 4-7
Derivatives 8-9
Commodity 10-13
Currency 14
IPO 15
FD Monitor 16
Insurance 17
Mutual Fund 18
SMC RESEARCH TEAMREGISTERED OFFICES:
11 / 6B, Shanti Chamber, Pusa Road, New Delhi 110005.
Tel: 91-11-30111000, Fax: 91-11-25754365
MUMBAI OFFICE:
Dheeraj Sagar, 1st Floor, Opp. Goregaon sports Club, Link Road
Malad (West), Mumbai 400064
Tel: 91-22-67341600, Fax: 91-22-28805606
KOLKATA OFFICE:
18,Rabindra Sarani, Poddar Court, Gate No-4,5th Floor, Kolkata-700001
Tel : 91-33-39847000 Fax No : 91-33-39847004
AHMEDABAD OFFICE :
10/A, 4th Floor, Kalapurnam Building, Near Municipal Market,
C G Road, Ahmedabad-380009, Gujarat
Tel : 91-79-26424801 - 05, 40049801 - 03
CHENNAI OFFICE:
Salzburg Square, Flat No.1, III rd Floor, Door No.107, Harrington Road,
Chetpet, Chennai - 600031.
Tel: 044-39109100, Fax -044- 39109111
SECUNDERABAD OFFICE:
206, 3rd Floor, above CMR Exclusive, Bhuvana Towers, S.D.Road,
Secunderabad - 500003
Tel: 91-40-30780298/99, 39109536
DUBAI OFFICE:
312, Belshalat Building, Al Karama, Dubai, P.O. Box 117210, U.A.E.
Tel: 97143963120, Mobile : 971502612483
Fax : 9714 3963122
Email ID : [email protected]
Printed and Published on behalf of
Mr. Saurabh Jain @ Publication Address
11/6B, Shanti Chamber, Pusa Road, New Delhi-110005
Website: www.smcindiaonline.com
Investor Grievance : [email protected]
Printed at: S&S MARKETING
102, Mahavirji Complex LSC-3, Rishabh Vihar, New Delhi - 110092 (India)
Ph.: +91-11- 43035012, 43035014, Email: [email protected]
ith the onset of the New Year, global stock markets rattled with a sinking
Yuan adding to concern about the strength of China's economy as it shifts Waway from investment and manufacturing toward consumption and
services. Investors turn risk averse with regards to growing concern over the health of
the Asia's largest economy i.e. China, selling stocks all over the globe. China-fueled
selloff in mining and energy shares spooked sentiments in the European stocks too, that
fell mirroring declines that shook global equities in August. U.S. markets too came off in
tandem with other markets as investors sensed that the global growth engine is starting
to slow. The World Bank on Wednesday cut its global growth forecasts for this year and
2017, citing concerns over China's economy and its impact on commodities that have
been at the forefront of traders' minds since 2016 got under way.
Back at home, Indian markets tumbled down by more than 4 percent, reflecting the
weakness in the global markets. Foreign institutional investors remained on the sell side
of the markets. It seems that slowing China is widely expected to spell trouble for world
markets. On the macro front, data on industrial production for November 2015 and the
data on inflation based on the consumer price index (CPI) for December 2015 will be
announced by the government after market hours on Tuesday, 12 January 2016. Recently,
the World Bank forecast that India is likely to grow by a robust 7.8 percent this year and
7.9 percent in the next two years on the back of stronger domestic policy reforms.
Macroeconomic data, Q3 results of India Inc., trend in global markets, investment by
foreign portfolio investors (FPIs) and domestic institutional investors (DIIs), the
movement of rupee against the dollar and crude oil price movement will dictate trend on
the bourses in the near term.
On the commodity front, some tensions in the Middle East and rout in the Chinese market
influenced the commodity prices significantly. It gave a negative impact on the base
metal and energy prices. Investors may jump back to gold to hedge some of the
uncertainties over global growth, over China, with positioning in gold. Gold can move in
the range of 25500-26700 while Silver can move in the range of 32000-36000. Crude oil
may remain on a volatile path with some short covering at lower levels can be seen after
the recent slide amid global supply glut. Crude oil can move in the range of 2050-2600 in
MCX. New Yuan Loans, Unemployment Rate of Australia, German GDP, BOE Asset
Purchase Target, Bank of England Rate Decision, Advance Retail Sales, U. of Michigan
Confidence are some data and events, which should be taken care of while trading in
commodities.
From The Desk Of Editor
(Saurabh Jain)
SMC Global Securities Limited is proposing, subject to receipt of requisite approvals, market conditions and other considerations, a further public offering of its equity shares and has filed the Draft Red Herring Prospectus with the Securities and Exchange Board of India (“SEBI”) and the Stock Exchanges. The Draft Red Herring Prospectus is available on the website of SEBI at www.sebi.gov.in and on the websites of the Book Running Lead Manager i.e., ICICI Securities Limited at www.icicisecurities.com and the Co- Book Running Lead Manager i.e., Elara Capital (India) Private Limited at www.elaracapital.com . Investors should note that investment in equity shares involves a high degree of risk and for details relating to the same, please see the section titled “Risk Factors” of the aforementioned offer document.
SMC Global Securities Ltd. (hereinafter referred to as “SMC”) is a registered Member of National Stock Exchange of India Limited, Bombay Stock Exchange Limited and its associate is member of MCX stock Exchange Limited. It is also registered as a Depository Participant with CDSL and NSDL. Its associates merchant banker and Portfolio Manager are registered with SEBI and NBFC registered with RBI. It also has registration with AMFI as a Mutual Fund Distributor.
SMC has applied with SEBI for registering as a Research Entity in terms of SEBI (Research Analyst) Regulations, 2014. SMC or its associates has not been debarred/ suspended by SEBI or any other regulatory authority for accessing /dealing in securities Market.
SMC or its associates including its relatives/analyst do not hold any financial interest/beneficial ownership of more than 1% in the company covered by Analyst. SMC or its associates and relatives does not have any material conflict of interest. SMC or its associates/analyst has not received any compensation from the company covered by Analyst during the past twelve months. The subject company has not been a client of SMC during the past twelve months. SMC or its associates has not received any compensation or other benefits from the company covered by analyst or third party in connection with the research report. The Analyst has not served as an officer, director or employee of company covered by Analyst and SMC has not been engaged in market making activity of the company covered by Analyst.
The views expressed are based solely on information available publicly available/internal data/ other reliable sources believed to be true.
SMC does not represent/ provide any warranty express or implied to the accuracy, contents or views expressed herein and investors are advised to independently evaluate the market conditions/risks involved before making any investment decision.

NEWS
DOMESTIC NEWSEconomy• India will likely grow by a robust 7.8 percent this year and 7.9 percent in
the next two years on the back of stronger domestic policy reforms, the World Bank forecast, even as it cut its global economic growth forecast for 2016, citing weak growth among emerging markets.
• The Indian Cabinet approved conversion of MUDRA Ltd, an NBFC, into MUDRA Bank and also setting up of a Credit Guarantee Fund for loans disbursed under the Pradhan Mantri Micro Units Development Refinance Agency (MUDRA) Yojana.
Pharmaceutical• Glenmark Pharmaceuticals Inc., USA has been granted tentative approval
by the United States Food & Drug Administration for its Dronedarone Tablets, 400 mg, the generic version of Multaq Tablets, 400 mg of Sanofi- Aventis U.S., LLC.
• Lupin has launched its Tri-Lo-Marzia tablets, an oral contraceptive drug, in the US market after getting approval from the American health regulator. The company's US subsidiary Lupin Pharmaceutical Inc has launched Tri-Lo-Marzia tablets after receiving approval from the United States Food and Drug Administration (USFDA).
• Cipla has inked a pact with US-based BioQ Pharma for registration and commercialisation of latter's Ropivacaine infusion system, used in treating post-operative pain, in India.
Realty/ Construction• NBCC has bagged orders worth `8,523 crore in the month gone by. The
company was awarded ̀ 8195 crore worth of orders for project management consultancy (PMC) during December. It also managed to fetch engineering procurement and construction (EPC) orders worth ̀ 328 crore.
• National Buildings Construction Corporation announced that Indian Institute of Technology, Mandi has awarded the work of construction of Academic Building, Guest House, Gymnasium, Hospital and Auditorium at IIT Mandi Campus for ̀ 294.78 crore.
• Punj Lloyd has won four highway projects worth `1,555 crore in Bihar, Chhattisgarh, Odisha and Punjab from the central government. The engineering, procurement and construction projects in Bihar, Chhattisgarh and Odisha have been awarded to Punj Lloyd by the National Highways Authority of India while the order in Punjab has been won from the Ministry of Road Transport and Highways (MORTH).
• IRB Infrastructure Developers has bagged a `10,050-crore order to construct the Zozila pass tunnel in Jammu & Kashmir. It is the biggest national highway project awarded in India in terms of project cost with a tunnel length spanning 14.08 km.
Automobile• Mahindra & Mahindra launched Imperio, a premium pick-up priced at
`6.25 lakh (ex-showroom, Thane, BS III variant). The new M&M vehicle will compete against Tata Xenon and Isuzu D-Max pick-ups. The Imperio will replace the existing Genio pick-up.
INTERNATIONAL NEWS• The World Bank trimmed its global growth outlook, citing anemic recovery
in major emerging markets, although it suggested that overall growth will improve from last year, underpinned by advanced economies. Global economic growth is forecast to be 2.9 percent this year, instead of the 3.3 percent projected in June, the Washington-based lender said in its bi-annual Global Economic Prospects.
• US factory orders edged down by 0.2 percent in November after jumping by 1.3 percent in October. The modest decrease matched economist estimates. The pullback partly reflected a continued decrease in orders for non-durable goods, which fell by 0.4 percent in November after dipping by 0.2 percent in October.
• US non-manufacturing index edged down to 55.3 in December from 55.9 in November, although a reading above 50 continues to point to growth in the service sector. The modest decrease came as a surprise to economists, who had expected the non-manufacturing index to inch up to 56.2.
• US trade deficit shrank to $42.4 billion in November from a revised $44.6 billion in October. Economists had expected the deficit to widen to $44.4 billion in November from the $43.9 billion originally reported for the previous month.
• US construction spending fell 0.4 percent to an annual rate of $1.123 trillion in November from the revised October estimate of $1.127 trillion. Economists had expected spending to rise by 0.7 percent. The unexpected drop was partly due to a steep decline in spending on public construction, which slumped 1.0 percent to annual rate of $294.3 billion.
• US initial jobless claims fell to 277,000, a decrease of 10,000 from the previous week's unrevised level of 287,000. Economists had expected jobless claims to drop to 272,000.
• Eurozone producer prices decreased at a stable pace for the second straight month in November, in line with expectations. The producer price index fell 3.2 percent year-over-year in November, the same rate of decrease as in the previous month, which was revised from a 3.1 percent drop reported earlier. The figure was also matched with consensus estimate.
Ex-Date Company Purpose
11-Jan-16 JMC Projects (India) Rights 2:7
19-Jan-16 Oil India Interim Dividend
21-Jan-16 Siemens Final Dividend Rs 6/- Plus Special Dividend Rs 4/- Per Share
25-Jan-16 MindTree Interim Dividend
2-Feb-16 Persistent Systems Interim Dividend (Record Date Revised)
3-Feb-16 Godrej Consumer Products Third Interim Dividend
Meeting Date Company Purpose
12-Jan-16 DCB BANK Results
12-Jan-16 Tata Consultancy Ser. Results/Dividend
12-Jan-16 Oil India Dividend
12-Jan-16 IndusInd Bank Results
12-Jan-16 The Federal Bank Results
13-Jan-16 Reliance Industrial
Infrastructure Results
13-Jan-16 Karur Vysya Bank Results
14-Jan-16 Infosys Results
15-Jan-16 Hindustan Unilever Results
15-Jan-16 Zee Entertainment Ent. Results
15-Jan-16 Pipavav Defence and
Offshore Engineering Com. Results
15-Jan-16 NIIT Technologies Results
16-Jan-16 The Karnataka Bank Results
16-Jan-16 Wipro Results/Dividend
16-Jan-16 LIC Housing Finance Results
18-Jan-16 Asian Paints Results
18-Jan-16 MindTree Results/Dividend
18-Jan-16 Kotak Mahindra Bank Results
19-Jan-16 HCL Technologies Results/Dividend
FORTHCOMING EVENTS
NOTES:1) These levels should not be confused with the daily trend sheet, which is sent every morning by e-mail in the name
of "Morning Mantra ".2) Sometimes you will find the stop loss to be too far but if we change the stop loss once, we will find more strength
coming into the stock. At the moment, the stop loss will be far as we are seeing the graphs on weekly basis and taking a long-term view and not a short-term view.
TREND SHEET
Stocks *Closing Trend Date Rate SUPPORT RESISTANCE Closing
Price Trend Trend
Changed Changed
SENSEX 24934 DOWN 13.11.15 25610 26000 27000
S&P NIFTY 7601 DOWN 13.11.15 7762 7990 8120
CNX IT 10990 DOWN 24.04.15 11132 11400 11600
CNX BANK 16143 DOWN 11.12.15 16343 17000 17300
ACC 1296 DOWN 20.03.15 1570 1370 1400
BHARTIAIRTEL 324 DOWN 04.12.15 322 335 345
BHEL 154 DOWN 13.08.15 259 170 175
CIPLA 622 DOWN 03.09.15 691 660 680
DLF 112 DOWN 13.11.15 110 120 126
HINDALCO 77 DOWN 12.12.14 154 85 90
ICICI BANK 245 DOWN 06.02.15 329 270 275
INFOSYS 1063 DOWN 20.11.15 1052 1100 1120
ITC 314 DOWN 08.01.16 314 330 340
L&T 1179 DOWN 27.08.15 1620 1320 1350
MARUTI 4215 DOWN 08.01.16 4215 4450 4500
NTPC 140 UP 06.11.15 136 130 124
ONGC 230 DOWN 17.10.14 397 240 250
RELIANCE 1026 UP 23.10.15 955 960 940
TATASTEEL 254 UP 24.12.15 263 240 230
S/l
4
®
Closing as on 08-01-2016

BSE SENSEX GAINERS & LOSERS TOP (% Change) NSE NIFTY GAINERS TOP & LOSERS (% Change)
SECTORAL INDICES (% Change)
SMC Trend
FMCGHealthcare
Auto BankRealty
Cap GoodsCons Durable
Oil & GasPower
ITMetal
Down SidewaysUp
GLOBAL INDICES (% Change)
INDIAN INDICES (% Change)
5
®
SMC Trend
Nifty BSE Midcap S&P CNX 500BSE SmallcapSensex Nifty Junior
SMC Trend
FTSE 100CAC 40
NasdaqDow jonesS&P 500
NikkeiStrait times
Hang SengShanghai
280.54
8.70
-574.88
-245.06
-113.69-49.10 -72.90
357.60
-800.00
-600.00
-400.00
-200.00
0.00
200.00
400.00
600.00
Friday Monday Tuesday Wednesday Thursday
FII / FPI Activity MF Activity
0.23
-14.52
-12.29-11.46
-10.67-10.04
-16.00
-14.00
-12.00
-10.00
-8.00
-6.00
-4.00
-2.00
0.00
2.00
GAIL (India) Tata Motors Bank of Baroda
Vedanta Punjab Natl.Bank
B H E L
-4.96 -5.00
-3.52 -3.61 -3.77
-4.54
-6.00
-5.00
-4.00
-3.00
-2.00
-1.00
0.00
Nifty Sensex BSE Midcap BSE Smallcap
Nifty Junior S&P CNX 500
-7.22
-5.99-6.27
-0.93
-4.42-4.29
-3.32
-4.27
-1.66
-4.23
-5.95
-8.00
-7.00
-6.00
-5.00
-4.00
-3.00
-2.00
-1.00
0.00
Auto Index Bankex Cap Goods Index
Cons Durable Index
FMCG Index Healthcare Index
IT Index Metal Index Oil & Gas Index
Power Index Realty Index
-6.35
-5.23-4.93
-6.65
-5.30
-7.21
-11.70
-4.62-5.04
-14.00
-12.00
-10.00
-8.00
-6.00
-4.00
-2.00
0.00
Nasdaq Comp. Dow Jones S&P 500 Nikkei Strait Times Hang Seng Shanghai Comp.
FTSE 100 CAC 40
0.11
-14.55
-10.03
-8.99-8.58
-7.95
-16.00
-14.00
-12.00
-10.00
-8.00
-6.00
-4.00
-2.00
0.00
2.00
GAIL (India) Tata Motors B H E L Axis Bank Adani Ports St Bk of India
INSTITUTIONAL ACTIVITY (Equity) (` Crore)
Closing as on 22.10.15
Closing as on 21.10.15
Beat the street - Fundamental Analysis
Above calls are recommended with a time horizon of 8 to 10 months. Source: Company Website Reuters Capitaline
6
®
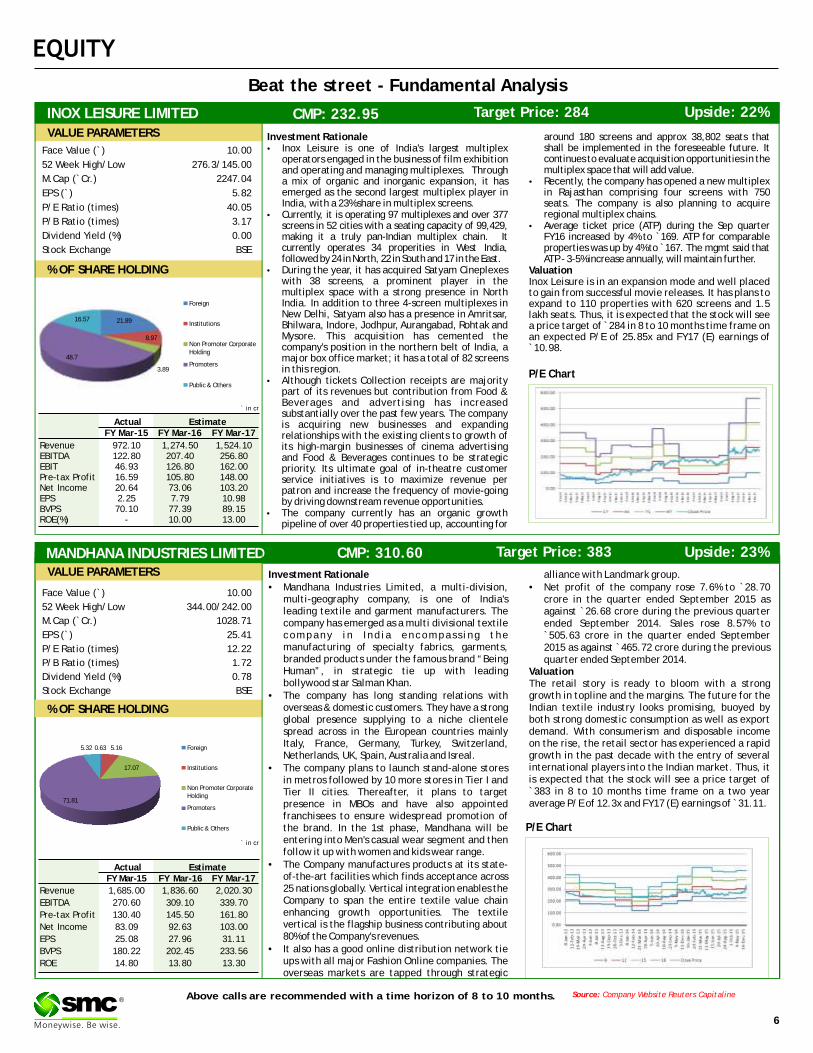
Investment Rationale alliance with Landmark group.•Mandhana Industries Limited, a multi-division, •Net profit of the company rose 7.6% to `28.70
multi-geography company, is one of India's crore in the quarter ended September 2015 as leading textile and garment manufacturers. The against `26.68 crore during the previous quarter company has emerged as a multi divisional textile ended September 2014. Sales rose 8.57% to company in Ind ia encompass ing the `505.63 crore in the quarter ended September manufacturing of specialty fabrics, garments, 2015 as against `465.72 crore during the previous branded products under the famous brand “Being quarter ended September 2014.Human”, in strategic tie up with leading Valuationbollywood star Salman Khan. The retail story is ready to bloom with a strong
•The company has long standing relations with growth in topline and the margins. The future for the overseas & domestic customers. They have a strong Indian textile industry looks promising, buoyed by global presence supplying to a niche clientele both strong domestic consumption as well as export spread across in the European countries mainly demand. With consumerism and disposable income Italy, France, Germany, Turkey, Switzerland, on the rise, the retail sector has experienced a rapid Netherlands, UK, Spain, Australia and Isreal. growth in the past decade with the entry of several
international players into the Indian market. Thus, it •The company plans to launch stand-alone stores is expected that the stock will see a price target of in metros followed by 10 more stores in Tier I and `383 in 8 to 10 months time frame on a two year Tier II cities. Thereafter, it plans to target average P/E of 12.3x and FY17 (E) earnings of ̀ 31.11.presence in MBOs and have also appointed
franchisees to ensure widespread promotion of the brand. In the 1st phase, Mandhana will be entering into Men's casual wear segment and then follow it up with women and kids wear range.
•The Company manufactures products at its state-of-the-art facilities which finds acceptance across 25 nations globally. Vertical integration enables the Company to span the entire textile value chain enhancing growth opportunities. The textile vertical is the flagship business contributing about 80% of the Company's revenues.
•It also has a good online distribution network tie ups with all major Fashion Online companies. The overseas markets are tapped through strategic
P/E Chart
MANDHANA INDUSTRIES LIMITED CMP: 310.60 Upside: 23%Target Price: 383
Face Value (`) 10.00
52 Week High/Low 344.00/242.00
M.Cap (`Cr.) 1028.71
EPS (`) 25.41
P/E Ratio (times) 12.22
P/B Ratio (times) 1.72
Dividend Yield (%) 0.78
Stock Exchange BSE
` in cr
% OF SHARE HOLDING
VALUE PARAMETERS
Actual EstimateFY Mar-15 FY Mar-16 FY Mar-17
Revenue 1,685.00 1,836.60 2,020.30
EBITDA 270.60 309.10 339.70
Pre-tax Profit 130.40 145.50 161.80
Net Income 83.09 92.63 103.00
EPS 25.08 27.96 31.11
BVPS 180.22 202.45 233.56
ROE 14.80 13.80 13.30
INOX LEISURE LIMITED CMP: 232.95 Upside: 22%Target Price: 284
Investment Rationale around 180 screens and approx 38,802 seats that •Inox Leisure is one of India's largest multiplex shall be implemented in the foreseeable future. It
operators engaged in the business of film exhibition continues to evaluate acquisition opportunities in the and operating and managing multiplexes. Through multiplex space that will add value.a mix of organic and inorganic expansion, it has •Recently, the company has opened a new multiplex emerged as the second largest multiplex player in in Rajasthan comprising four screens with 750 India, with a 23% share in multiplex screens. seats. The company is also planning to acquire
•Currently, it is operating 97 multiplexes and over 377 regional multiplex chains. screens in 52 cities with a seating capacity of 99,429, •Average ticket price (ATP) during the Sep quarter making it a truly pan-Indian multiplex chain. It FY16 increased by 4% to `169. ATP for comparable currently operates 34 properities in West India, properties was up by 4% to ̀ 167. The mgmt said that followed by 24 in North, 22 in South and 17 in the East. ATP - 3-5% increase annually, will maintain further.
•During the year, it has acquired Satyam Cineplexes Valuationwith 38 screens, a prominent player in the Inox Leisure is in an expansion mode and well placed multiplex space with a strong presence in North to gain from successful movie releases. It has plans to India. In addition to three 4-screen multiplexes in expand to 110 properties with 620 screens and 1.5 New Delhi, Satyam also has a presence in Amritsar, lakh seats. Thus, it is expected that the stock will see Bhilwara, Indore, Jodhpur, Aurangabad, Rohtak and a price target of ̀ 284 in 8 to 10 months time frame on Mysore. This acquisition has cemented the an expected P/E of 25.85x and FY17 (E) earnings of company's position in the northern belt of India, a `10.98.major box office market; it has a total of 82 screens in this region.
•Although tickets Collection receipts are majority part of its revenues but contribution from Food & Beverages and advertising has increased substantially over the past few years. The company is acquiring new businesses and expanding relationships with the existing clients to growth of its high-margin businesses of cinema advertising and Food & Beverages continues to be strategic priority. Its ultimate goal of in-theatre customer service initiatives is to maximize revenue per patron and increase the frequency of movie-going by driving downstream revenue opportunities.
•The company currently has an organic growth pipeline of over 40 properties tied up, accounting for
Face Value (`) 10.00
52 Week High/Low 276.3/145.00
M.Cap (`Cr.) 2247.04
EPS (`) 5.82
P/E Ratio (times) 40.05
P/B Ratio (times) 3.17
Dividend Yield (%) 0.00
Stock Exchange BSE
% OF SHARE HOLDING
P/E Chart
` in cr
Actual EstimateFY Mar-15 FY Mar-16 FY Mar-17
Revenue 972.10 1,274.50 1,524.10EBITDA 122.80 207.40 256.80EBIT 46.93 126.80 162.00Pre-tax Profit 16.59 105.80 148.00Net Income 20.64 73.06 103.20EPS 2.25 7.79 10.98BVPS 70.10 77.39 89.15ROE(%) - 10.00 13.00
21.89
8.97
3.89
48.7
16.57
Foreign
Institutions
Non Promoter Corporate Holding
Promoters
Public & Others
0.63 5.16
17.07
71.81
5.32 Foreign
Institutions
Non Promoter Corporate Holding
Promoters
Public & Others
VALUE PARAMETERS

Charts by Spider Software India Ltd
7
EQUITY
Above calls are recommended with a time horizon of 1-2 months
Disclaimer : research. The analysis contained in the analyst research is based on numerous assumptions. Different assumptions could result in materially different results.The analyst, not any of its affiliated companies, not any of their members, directors, employees or agents accepts any liability for any loss or damage arising out of the use of all or any part of the analysis research.
The analyst and its affiliates companies make no representation or warranty in relation to the accuracy, completeness or reliability of the information contained in its
SOURCE: CAPITAL LINE
®
The stock closed at `387.45 on 08th January 2016. It made a 52-week low at
`272.95 on 06th January 2015 and a 52-week high at `412 on 10th August 2015.
The 200 days Exponential Moving Average (EMA) of the stock on the daily chart is
currently at ̀ 363.23.
After falling marginally from higher levels, it managed to hold its price by
rebounding from its crucial support of 280 levels, which is clear on the charts.
Moreover, oscillators are also supporting this particular scrip so we anticipate
that in coming days it will remain on higher note and reach our targets. One can
buy in range of 377-380 levels for the target of 405-415 levels with SL of 365
levels.
Godrej Industries Limited
The stock closed at `887.55 on 08th January 2016. It made a 52-week low at
`543.10 on 05th January 2015 and a 52-week high of `990.95 on 10th August
2015. The 200 days Exponential Moving Average (EMA) of the stock on the daily
chart is currently at ̀ 756.88.
As we can see on the charts, it has maintained its uptrend with marginal
retracements. Last week there was steep decline in broader index but it was still
on higher side. We anticipate that in the coming days it will manage to hold its
upward rally and may reach our desired targets. One can buy in range of 875-880
levels for the target of 915-925 levels with SL of 858 levels.
Hindustan Petroleum Corporation Limited
DERIVATIVES
CHANGE IN NIFTY OPTION OI (IN QTY)
WEEKLY VIEW OF THE MARKET
NIFTY OPTION OI CONCENTRATION (IN QTY)
CHANGE IN BANKNIFTY OPTION OI (IN QTY)BANKNIFTY OPTION OI CONCENTRATION (IN QTY)
®
PTC (JAN FUTURE)
Buy: Above `69
Target: `72
Stop loss: `67.5
CIPLA
Buy JAN 620. PUT 13.70
Sell JAN 610. PUT 9.70
Lot size: 800
BEP: 616.00
Max. Profit: 4800.00 (6.00*800)
Max. Loss: 3200.00 (4.00*800)
OPTIONSTRATEGY
FUTURE
TCS
Buy JAN 2450. CALL 38.00
Sell JAN 2500. CALL 24.00
Lot size: 200
BEP: 2464.00
Max. Profit: 7200.00 (36.00*200)
Max. Loss: 2800.00 (14.00*200)
BHEL
Buy JAN 150. PUT 4.55
Sell JAN 145. PUT 2.65
Lot size: 2000
BEP: 148.10
Max. Profit: 6200.00 (3.10*2000)
Max. Loss: 3800.00 (1.90*2000)
DERIVATIVE STRATEGIES
TATASTEEL (JAN FUTURE)
Sell: Below `249
Target: `241
Stop loss: `253
ORIENTBANK (JAN FUTURE)
Sell: Below `126
Target: `120
Stop loss: `129
BULLISH STRATEGY BEARISH STRATEGY
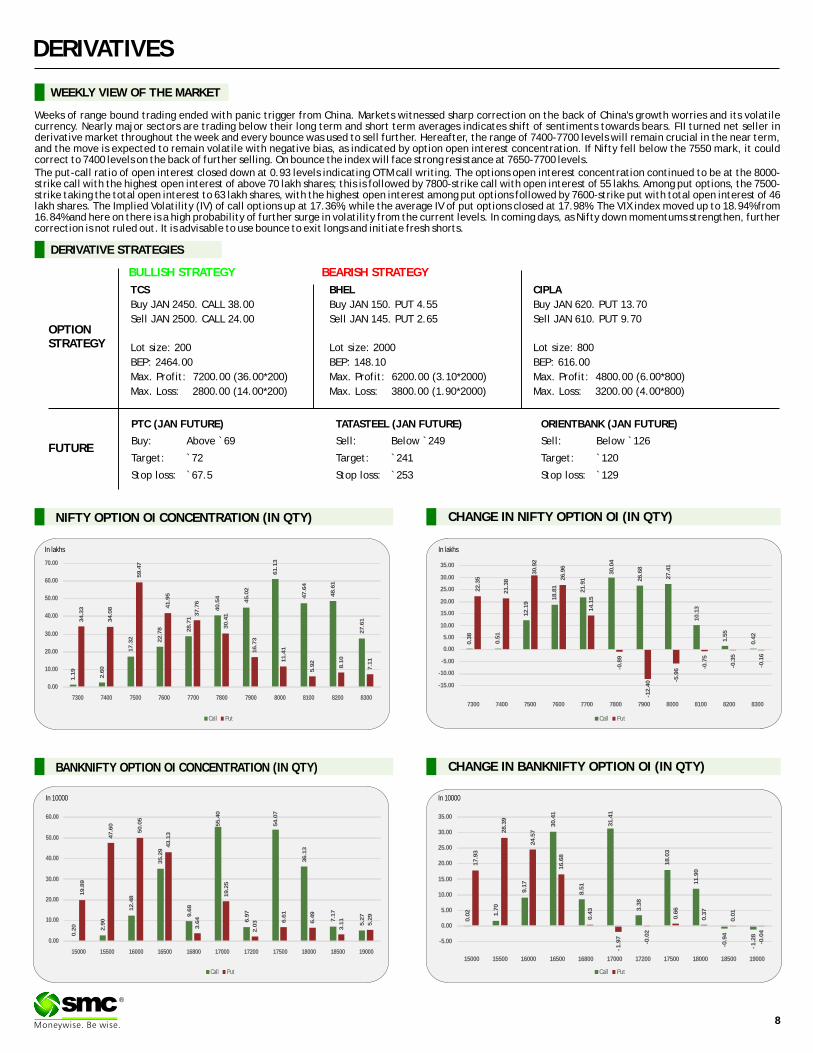
Weeks of range bound trading ended with panic trigger from China. Markets witnessed sharp correction on the back of China's growth worries and its volatile currency. Nearly major sectors are trading below their long term and short term averages indicates shift of sentiments towards bears. FII turned net seller in derivative market throughout the week and every bounce was used to sell further. Hereafter, the range of 7400-7700 levels will remain crucial in the near term, and the move is expected to remain volatile with negative bias, as indicated by option open interest concentration. If Nifty fell below the 7550 mark, it could correct to 7400 levels on the back of further selling. On bounce the index will face strong resistance at 7650-7700 levels. The put-call ratio of open interest closed down at 0.93 levels indicating OTM call writing. The options open interest concentration continued to be at the 8000-strike call with the highest open interest of above 70 lakh shares; this is followed by 7800-strike call with open interest of 55 lakhs. Among put options, the 7500-strike taking the total open interest to 63 lakh shares, with the highest open interest among put options followed by 7600-strike put with total open interest of 46 lakh shares. The Implied Volatility (IV) of call options up at 17.36%, while the average IV of put options closed at 17.98%. The VIX index moved up to 18.94% from 16.84% and here on there is a high probability of further surge in volatility from the current levels. In coming days, as Nifty down momentums strengthen, further correction is not ruled out. It is advisable to use bounce to exit longs and initiate fresh shorts.
In lakhs
In 10000 In 10000
Call Put
0.3
8
0.5
1
12
.19
18
.81
21
.91
30
.04
26
.68
27
.41
10
.13
1.5
5
0.4
2
22
.35
21
.38
30
.92
26
.96
14
.15
-0.8
9
-12
.40 -5
.96 -0
.75
-0.3
5
-0.1
6
-15.00
-10.00
-5.00
0.00
5.00
10.00
15.00
20.00
25.00
30.00
35.00
7300 7400 7500 7600 7700 7800 7900 8000 8100 8200 8300
Call Put
1.1
9
2.6
0
17
.32 22
.78 28
.71
40
.54
45
.02
61
.13
47
.64
48
.61
27
.613
4.3
3
34
.08
59
.47
41
.95
37
.76
30
.41
16
.73
11
.41
5.9
2
8.1
0
7.1
1
0.00
10.00
20.00
30.00
40.00
50.00
60.00
70.00
7300 7400 7500 7600 7700 7800 7900 8000 8100 8200 8300
Call Put
0.2
0
2.9
0
12
.48
35
.29
9.6
8
55
.40
6.9
7
54
.07
36
.13
7.1
7
5.2
7
19
.89
47
.60
50
.05
43
.13
3.6
4
19
.25
2.0
3 6.6
1
6.4
9
3.1
1
5.2
9
0.00
10.00
20.00
30.00
40.00
50.00
60.00
15000 15500 16000 16500 16800 17000 17200 17500 18000 18500 19000
Call Put
0.0
2 1.7
0
9.1
7
30
.41
8.5
1
31
.41
3.3
8
18
.03
11
.90
-0.9
4
-1.2
8
17
.93
28
.39
24
.57
16
.68
0.4
3
-1.9
7
-0.0
2
0.6
6
0.3
7
0.0
1
-0.0
4
-5.00
0.00
5.00
10.00
15.00
20.00
25.00
30.00
35.00
15000 15500 16000 16500 16800 17000 17200 17500 18000 18500 19000
8
In lakhs
9
DERIVATIVES
®
FII’s ACTIVITY IN DERIVATIVE SEGMENT
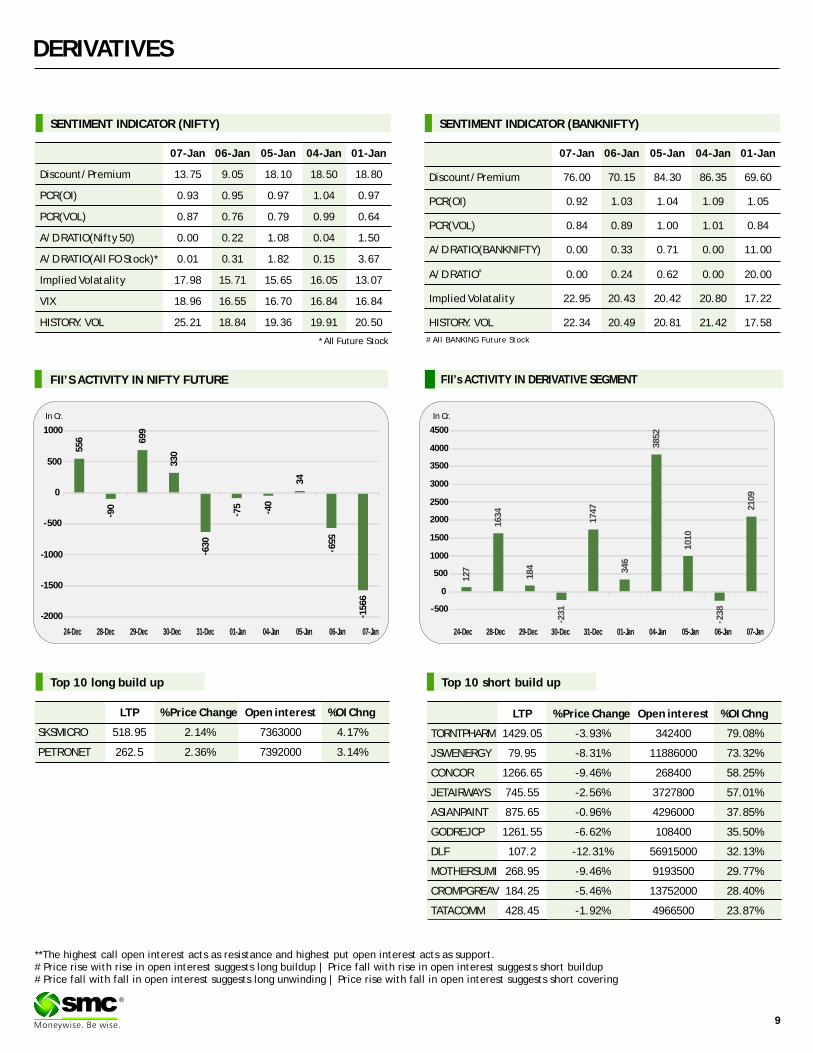
SENTIMENT INDICATOR (NIFTY)
07-Jan 06-Jan 05-Jan 04-Jan 01-Jan
Discount/Premium 13.75 9.05 18.10 18.50 18.80
PCR(OI) 0.93 0.95 0.97 1.04 0.97
PCR(VOL) 0.87 0.76 0.79 0.99 0.64
A/D RATIO(Nifty 50) 0.00 0.22 1.08 0.04 1.50
A/D RATIO(All FO Stock)* 0.01 0.31 1.82 0.15 3.67
Implied Volatality 17.98 15.71 15.65 16.05 13.07
VIX 18.96 16.55 16.70 16.84 16.84
HISTORY. VOL 25.21 18.84 19.36 19.91 20.50
*All Future Stock
SENTIMENT INDICATOR (BANKNIFTY)
07-Jan 06-Jan 05-Jan 04-Jan 01-Jan
Discount/Premium 76.00 70.15 84.30 86.35 69.60
PCR(OI) 0.92 1.03 1.04 1.09 1.05
PCR(VOL) 0.84 0.89 1.00 1.01 0.84
A/D RATIO(BANKNIFTY) 0.00 0.33 0.71 0.00 11.00
#A/D RATIO 0.00 0.24 0.62 0.00 20.00
Implied Volatality 22.95 20.43 20.42 20.80 17.22
HISTORY. VOL 22.34 20.49 20.81 21.42 17.58
FII’S ACTIVITY IN NIFTY FUTURE
**The highest call open interest acts as resistance and highest put open interest acts as support.# Price rise with rise in open interest suggests long buildup | Price fall with rise in open interest suggests short buildup # Price fall with fall in open interest suggests long unwinding | Price rise with fall in open interest suggests short covering
# All BANKING Future Stock
Top 10 short build up
In Cr. In Cr.
Top 10 long build up
LTP % Price Change Open interest %OI Chng
SKSMICRO 518.95 2.14% 7363000 4.17%
PETRONET 262.5 2.36% 7392000 3.14%
LTP % Price Change Open interest %OI Chng
TORNTPHARM 1429.05 -3.93% 342400 79.08%
JSWENERGY 79.95 -8.31% 11886000 73.32%
CONCOR 1266.65 -9.46% 268400 58.25%
JETAIRWAYS 745.55 -2.56% 3727800 57.01%
ASIANPAINT 875.65 -0.96% 4296000 37.85%
GODREJCP 1261.55 -6.62% 108400 35.50%
DLF 107.2 -12.31% 56915000 32.13%
MOTHERSUMI 268.95 -9.46% 9193500 29.77%
CROMPGREAV 184.25 -5.46% 13752000 28.40%
TATACOMM 428.45 -1.92% 4966500 23.87%
55
6
- 90
69
9
33
0
- 63
0
- 75
- 40
34
-
55
9
- 15
66
-2000
-1500
-1000
-500
0
500
1000
24-Dec 28-Dec 29-Dec 30-Dec 31-Dec 01-Jan 04-Jan 05-Jan 06-Jan 07-Jan
12
7
16
34
18
4
- 23
1
17
47
34
6
38
52
10
10
- 23
8
21
09
-500
0
500
1000
1500
2000
2500
3000
3500
4000
4500
24-Dec 28-Dec 29-Dec 30-Dec 31-Dec 01-Jan 04-Jan 05-Jan 06-Jan 07-Jan
Turmeric futures (Apr) is expected to consolidate in the range of 9600-10400 levels. The upside may remain capped as the selling pressure will perhaps catch pace in the days to come. It is reported that in Sangli, the new crop has started entering the market. Secondly, at Erode spot markets, the sentiments are bearish as only 50% of the arrivals are getting sold due to lack of upcountry demand. The market participants are waiting for the fresh crop to hit as prices are expected to go down, before making any bulk purchase. Cardamom futures (Jan) is likely to take support near 790 levels & trade higher towards 835-850 levels. At the spot markets, exporters are buying as the prices of exportable grade material continued to stay at affordable levels. On the international market, in the current crop season, Guatemala expects a production of 28,000 tonnes, lower than the 4-year average production of 34,250 tonnes due to dry spell in the flowering and fruit setting season. Jeera futures (Feb) will possibly take an attempt to break the support near 14000 levels & fall further in days to come on the back of weak export as well as domestic demand. Moreover, favourable weather with higher sowing has made the sentiments bearish in spot market. At Unjha mandi of Gujarat, the best quality jeera quoted near ̀ 2,600-2,850 per 20 kg and medium jeera stood at ̀ 2,400-2,600. Coriander futures (April) would possibly consolidate in the range of 7400-8400 levels. The fundamental factors of lower sowing area reported in Gujarat and Andhra Pradesh may support the prices. Farmers revealed that, current weather is not favourable for Coriander crop & may reduce the yield.
SPICES
Soybean futures (Feb) will probably fall further & test 3600 levels. The sentiments attached to this counter on the domestic as well as in the international markets are bearish owing to contracting Chinese economy. Furthermore, on CBOT, U.S soybeans are under pressure on expectations of bumper South American production. It is reported that soybean harvesting has started in Brazil's top two growing states Mato Grosso and Parana. At home, the major crushing giants are refraining themselves from aggressive buying and crushing in Madhya Pradesh, Maharashtra and Rajasthan. The crushing units in these states are running at much lower crushing capacity (below 30%) while some are closed due to unviable crushing. Mustard futures (Jan) may trade in the range of 4150-4320 levels. In the current scenario, the crop is under pod formation stage & in good condition. The weather temperature is conducive in key mustard seed growing belts of Rajasthan, Uttar Pradesh, Madhya Pradesh, Haryana and West Bengal. Refined soy oil futures (Feb) is expected to drop towards 585 levels, while CPO futures (Jan) may continue to consolidate in the range of 400-420 levels. The factors that are capping the upside are low refining margins, seasonal slowdown of demand and high stocks at ports as well as in pipelines. Malaysian palm oil futures on the Bursa Malaysia Derivatives Exchange are under pressure due to weak export demand and a narrowing spread between the tropical oil and soyoil. On the international market, the market participants will remain cautious ahead of the release of palm oil export data by Cargo surveyor ITS & SGS accompanied with Malaysia's December 2015 data to be released by Malaysian palm oil Board on January 11, 2016.
OIL AND OILSEEDS
OTHER COMMODITIES
Sugar futures (Mar) is likely to trade range bound within 3140-3250 levels. The upside may get limited due to rise in the domestic prices of the sweetener, the prospects of exports are fading out & Indian parity is facing stiff competition against Brazilian supplies in key export markets. Secondly, the supplies in the domestic market are getting stronger as crushing season is in its full pace. As on 31st December, 2015 sugar production is 6.5% higher as compared to last season's production for the corresponding period. Kapas futures (Apr) is expected to trade in the range of 850-875 levels, with a downside bias. The fundamentals of cotton on the international market are bearish amid concerns about the economy in top consumer China. Secondly, the U.S. producer selling has picked up as farmers who had held off until the New Year for tax reasons entered the market. Back at home, many of the textile mills in country are willing to import cotton from African region rather than buying it from local traders. Wheat futures (Feb) may consolidate in the range of 1650-1720 levels. The downside may remain capped as the total production is expected to be lower this season. In the current scenario, sowing is on and would continue till 15th January-2016. Recovery in coverage is expected now to some extent with decreasing temperature in central, east and western parts of India. However, overall acreage may decrease due to late sowing. As per latest update from Ministry of Agriculture Indian wheat growing States have covered 271.46 lakh ha area till 1st Jan, 2016.It is almost 7.4 % lower (293.16 lakh ha) in comparison to area covered in the corresponding time of last year.
Bullion counter may remain on positive path as global stock markets meltdown amid china slowdown concerns is creating safe haven demand for the yellow metal. Furthermore the movement of dollar index will give direction to the bullion counter as it can move in range of 97-100 in near term. On domestic bourses, movement in local currency rupee has affected the prices which can move in range of 65.50 -67.50 in near term. Gold can move in range of 25500-26700 while Silver can move in range of 32000-36000. Recently global stock markets fell on major exchanges fell for a sixth straight day and crude oil prices touched multi-year lows as investors fretted over the state of China's economy and its ability to stabilize its stock market. In a sign of improving investor sentiment, assets of SPDR Gold Trust, the top gold-backed exchange-traded fund, rose 0.65 percent to 645.13 tonnes last week which was the first increase in three weeks. Escalating tension in West Saia, led by Iran severing ties with a number of Gulf countries, plus the hydrogen bomb tests by North Korea, have raised geopolitical uncertainty. With South Korea seeking support from America in terms of installation of nuclear missiles at its border with North Korea, tension is likely to continue. Gold is considered as safe haven in times of geopolitical uncertainty. With China's growth dropping, as seen from falling equity markets and the Yuan's devaluation, investors park their money in gold as alternative asset.
BULLIONS
Crude oil may remain on volatile path with some short covering at lower levels can be seen after the recent slide amid global supply glut. Crude oil can move in range of 2050-2600 in MCX. The global benchmark oil prices fell to nearly 32 levels which were last seen in 2004, hammered by the market turmoil in China, the world's second-biggest consumer of the fuel. Worries about slowing economic growth, especially in China, are helping to drive the sharp drop in crude prices. With producers in the U.S. and Mideast still pumping oil at a fast clip, a drop-off in demand would add to the global supply glut that has shaved about 70% off prices over the past 18 months. In the near term, though, the prospect of more barrels from Iran is looming over the market. Sanctions on the Persian Gulf producer could be lifted this quarter, giving Iranian producers the green light to ship more crude into an already oversupplied market. OPEC hasn't agreed to any output cuts since prices started falling in mid-2014, and the group's production rose sharply last year. OPEC's next meeting is scheduled for June 2016. Natural gas prices may continue its recovery due to colder weather in US. Overall natural gas can move in range of test 145-175 in MCX. Moderate weather-driven demand and robust production has pushed the natural-gas market into oversupply in recent months. Stockpiles usually start drawing in early winter as more consumers use natural gas for indoor heating, but mild temperatures this winter meant that inventories kept growing until late November.
ENERGY COMPLEX
Base metals counter may continue to remain on volatile path with some short covering at current levels can be seen after the recent fall amid China concerns. In a move that deepened concerns over China's economic health, the People's Bank of China set the yuan midpoint rate lower for an eighth consecutive day last week. The 0.5 percent decline was the biggest between daily fixings since August. China's central bank is under increasing pressure from policy advisers to let the yuan currency fall quickly and sharply, by as much as 10-15 percent, as its recent gradual softening is thought to be doing more harm than good. Copper may move in the range of 285-320. Copper prices tumbled last week, hitting their lowest in nearly seven years, as plunging China equities highlighted the country's economic problems and reinforced concern about demand for industrial metals. Lead can move in the range of 107-117 and Zinc can hover in range of 97-105. Chinese refined zinc production growth is expected to slow down in 2016 due to decreased concentrate supply from major overseas miners and planned production cuts by China's top smelters. Zinc concentrate supply will become much tighter in 2016 given the closure of several overseas mines in 2015 and the production cuts by Glencore and Nyrstar. Aluminum can move in range of 95-102 in MCX. Japan's aluminium premiums for January-March shipments were set at $110 per tonne, up 22 percent from the previous quarter. Nickel may move in range of 520-620 in MCX.
BASE METALS
10
®

11
TECHNICAL RECOMMENDATIONS
COMMODITY
ALUMINIUM MCX (JANUARY) contract closed at `98.50 on 07th Jan'16. The contract made its high of
`103.60 on 24th Dec'15 and a low of ̀ 97 on 24th Nov'15. The 18-day Exponential Moving Average of the
commodity is currently at ̀ 99.98.
On the daily chart, the commodity has Relative Strength Index (14-day) value of 45.One can buy in the
range of ̀ 98.60-97.50 with the stop loss of ̀ 96 for a target of ̀ 100.
COTTON SEED OIL NCDEX (FEBRUARY) contract closed at 2092 on 07th Jan'16. The contract made its
high of ̀ 2147 on 01st Jan'16 and a low of ̀ 1542 on 5th Aug'15. The 18-day Exponential Moving Average of
the commodity is currently at ̀ 2019.
On the daily chart, the commodity has Relative Strength Index (14-day) value of 79. One can buy in the
range of ̀ 2080-2070 with the stop loss of ̀ 2050 for a target of ̀ 2150.
`
CORIENDER NCDEX (APRIL) contract closed at 7989 on 07th Jan'16. The contract made its high of
`9948 on 19th Nov'15 and a low of ̀ 7365 on 30th Dec'15. The 18-day Exponential Moving Average of the
commodity is currently at ̀ 8037.8.
On the daily chart, the commodity has Relative Strength Index (14-day) value of 36. One can buy in the
range of ̀ 7900-7870 with the stop loss of ̀ 7800 for a target of ̀ 8100.
`
®
ALUMINIUM MCX (JANUARY)
COTTON SEED OIL NCDEX (FEBRUARY)
CORIENDER NCDEX (APRIL)
NOTES : 1) These levels should not be confused with the daily trend sheet, which is sent every morning by e-mail in the name of Daily report- commodities (Morning Mantra).
2) Sometimes you will find the stop loss to be too far but if we change the stop loss once, we will find more strength coming into the commodity. At the moment, the stop loss will be far as we are seeing the graphs on weekly basis and taking a long-term view and not a short-term view.
EXCHANGE COMMODITY CONTRACT CLOSING DATE TREND TREND RATE TREND SUPPORT RESISTANCE CLOSING
PRICE CHANGED CHANGED STOP/LOSS
NCDEX SOYABEAN JAN 3640.00 03.12.15 Down 3680.00 - 3750.00 3800.00
NCDEX JEERA JAN 13985.00 23.12.15 Down 14595.00 - 15200.00 15700.00
NCDEX CHANA JAN 4880.00 23.12.15 UP 4954.00 4500.00 - 4300.00
NCDEX RM SEEDS JAN 4242.00 10.12.15 SIDEWAYS
MCX MENTHA OIL JAN 880.70 05.11.15 UP 956.60 870.00 - 850.00
MCX CARDAMOM FEB 818.50 07.01.16 SIDEWAYS
MCX SILVER MAR 34531.00 12.11.15 Down 33889.00 - 35500.00 36500.00
MCX GOLD FEB 26100.00 12.11.15 Down 25329.00 - 26200.00 26500.00
MCX COPPER FEB 300.80 04.06.15 Down 381.35 - 325.00 340.00
MCX LEAD JAN 110.20 31.12.15 Up 118.05 108.00 - 105.00
MCX ZINC JAN 99.45 04.06.15 Down 137.15 - 106.00 110.00
MCX NICKEL JAN 562.90 21.05.15 Down 827.90 - 640.00 660.00
MCX ALUMINUM JAN 98.50 22.10.15 Down 94.50 - 103.00 104.00
MCX CRUDE OIL JAN 2254.00 12.11.15 Down 2876.00 - 2600.00 2800.00
MCX NATURAL GAS JAN 160.90 22.10.15 Down 154.70 - 163.00 168.00
TREND SHEET
*Closing as on 07.01.16
COMMODITY
NEWS DIGEST
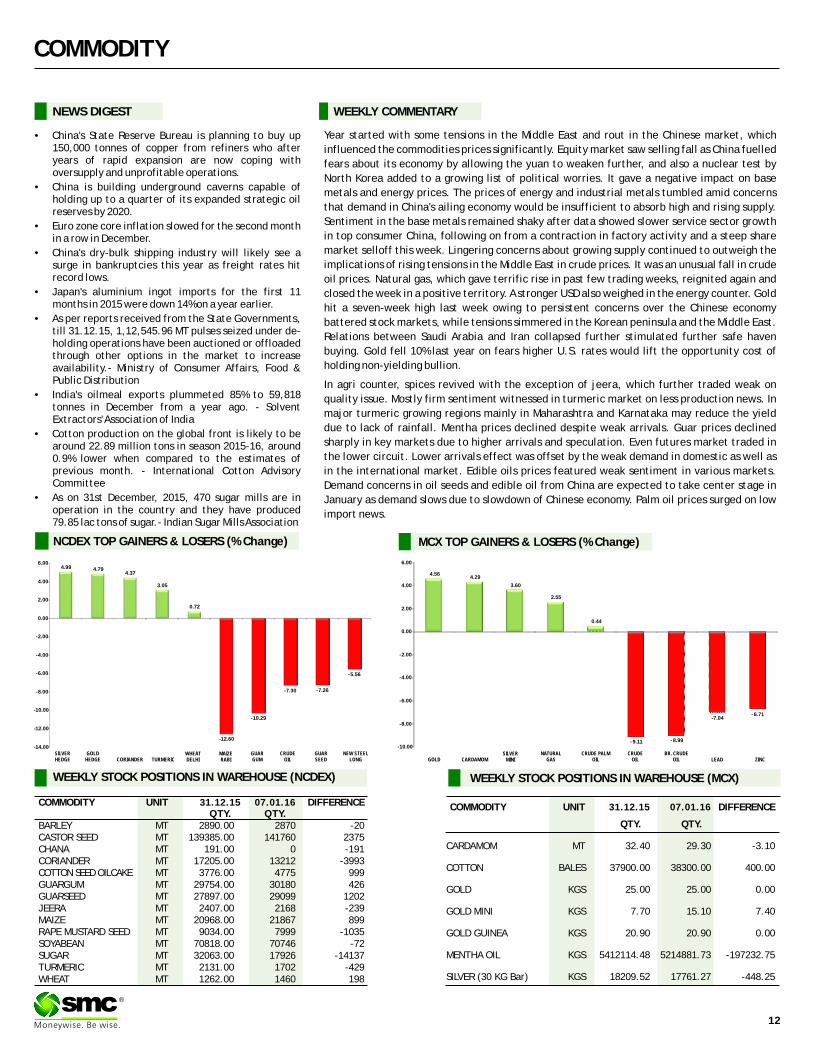
Year started with some tensions in the Middle East and rout in the Chinese market, which
influenced the commodities prices significantly. Equity market saw selling fall as China fuelled
fears about its economy by allowing the yuan to weaken further, and also a nuclear test by
North Korea added to a growing list of political worries. It gave a negative impact on base
metals and energy prices. The prices of energy and industrial metals tumbled amid concerns
that demand in China's ailing economy would be insufficient to absorb high and rising supply.
Sentiment in the base metals remained shaky after data showed slower service sector growth
in top consumer China, following on from a contraction in factory activity and a steep share
market selloff this week. Lingering concerns about growing supply continued to outweigh the
implications of rising tensions in the Middle East in crude prices. It was an unusual fall in crude
oil prices. Natural gas, which gave terrific rise in past few trading weeks, reignited again and
closed the week in a positive territory. A stronger USD also weighed in the energy counter. Gold
hit a seven-week high last week owing to persistent concerns over the Chinese economy
battered stock markets, while tensions simmered in the Korean peninsula and the Middle East.
Relations between Saudi Arabia and Iran collapsed further stimulated further safe haven
buying. Gold fell 10% last year on fears higher U.S. rates would lift the opportunity cost of
holding non-yielding bullion.
In agri counter, spices revived with the exception of jeera, which further traded weak on
quality issue. Mostly firm sentiment witnessed in turmeric market on less production news. In
major turmeric growing regions mainly in Maharashtra and Karnataka may reduce the yield
due to lack of rainfall. Mentha prices declined despite weak arrivals. Guar prices declined
sharply in key markets due to higher arrivals and speculation. Even futures market traded in
the lower circuit. Lower arrivals effect was offset by the weak demand in domestic as well as
in the international market. Edible oils prices featured weak sentiment in various markets.
Demand concerns in oil seeds and edible oil from China are expected to take center stage in
January as demand slows due to slowdown of Chinese economy. Palm oil prices surged on low
import news.
WEEKLY COMMENTARY
COMMODITY UNIT 07.01.16 DIFFERENCEQTY. QTY.
BARLEY MT 2890.00 2870 -20CASTOR SEED MT 139385.00 141760 2375CHANA MT 191.00 0 -191CORIANDER MT 17205.00 13212 -3993COTTON SEED OILCAKE MT 3776.00 4775 999GUARGUM MT 29754.00 30180 426GUARSEED MT 27897.00 29099 1202JEERA MT 2407.00 2168 -239MAIZE MT 20968.00 21867 899RAPE MUSTARD SEED MT 9034.00 7999 -1035SOYABEAN MT 70818.00 70746 -72SUGAR MT 32063.00 17926 -14137TURMERIC MT 2131.00 1702 -429WHEAT MT 1262.00 1460 198
31.12.15 COMMODITY UNIT 07.01.16 DIFFERENCE
QTY. QTY.
CARDAMOM MT 32.40 29.30 -3.10
COTTON BALES 37900.00 38300.00 400.00
GOLD KGS 25.00 25.00 0.00
GOLD MINI KGS 7.70 15.10 7.40
GOLD GUINEA KGS 20.90 20.90 0.00
MENTHA OIL KGS 5412114.48 5214881.73 -197232.75
SILVER (30 KG Bar) KGS 18209.52 17761.27 -448.25
31.12.15
•China's State Reserve Bureau is planning to buy up 150,000 tonnes of copper from refiners who after years of rapid expansion are now coping with oversupply and unprofitable operations.
•China is building underground caverns capable of holding up to a quarter of its expanded strategic oil reserves by 2020.
•Euro zone core inflation slowed for the second month in a row in December.
•China's dry-bulk shipping industry will likely see a surge in bankruptcies this year as freight rates hit record lows.
•Japan's aluminium ingot imports for the first 11 months in 2015 were down 14% on a year earlier.
•As per reports received from the State Governments, till 31.12.15, 1,12,545.96 MT pulses seized under de-holding operations have been auctioned or offloaded through other options in the market to increase availability.- Ministry of Consumer Affairs, Food & Public Distribution
•India's oilmeal exports plummeted 85% to 59,818 tonnes in December from a year ago. - Solvent Extractors' Association of India
•Cotton production on the global front is likely to be around 22.89 million tons in season 2015-16, around 0.9% lower when compared to the estimates of previous month. - International Cotton Advisory Committee
•As on 31st December, 2015, 470 sugar mills are in operation in the country and they have produced 79.85 lac tons of sugar.- Indian Sugar Mills Association
WEEKLY STOCK POSITIONS IN WAREHOUSE (MCX)
12
®
NCDEX TOP GAINERS & LOSERS (% Change) MCX TOP GAINERS & LOSERS (% Change)
WEEKLY STOCK POSITIONS IN WAREHOUSE (NCDEX)
4.99 4.794.37
3.05
0.72
-12.60
-10.29
-7.30 -7.26
-5.56
-14.00
-12.00
-10.00
-8.00
-6.00
-4.00
-2.00
0.00
2.00
4.00
6.00
SILVERHEDGE
GOLD HEDGE CORIANDER TURMERIC
WHEATDELHI
MAIZERABI
GUARGUM
CRUDEOIL
GUARSEED
NEW STEELLONG
4.564.29
3.60
2.55
0.44
- 9.11 -8.99
-7.04- 6.71
-10.00
-8.00
-6.00
-4.00
-2.00
0.00
2.00
4.00
6.00
GOLD CARDAMOMSILVER
MININATURAL
GASCRUDE PALM
OILCRUDE
OILBR. CRUDE
OIL LEAD ZINC

Price movement of commodities in December 2015
In last month of the year 2015, highest gainer and highest loser, both were from
agri commodity complex. Cotton oilseed cake was the highest gainer in December
2015 due to increased mill use amid expectation of lower production of cotton in
India and expectation of falling World ending stocks. Kapas prices also moved up
with same reason. Sugar prices rose the highest monthly gain in December last year
on the estimates of higher export amid deficit in the international market. Oilseed
counters moved down on the multiple reasons. The high price of soybean in the
domestic market against the lower realization for meal and oil resulted in to
drastic fall in demand and export of soybean meal. RM Seed slipped on expectation
of higher yield and lower rapemeal export.
In spices counter, jeera and dhaniya prices dragged down whereas steady to firm
sentiment was witnessed in cardamom market. Jeera prices declined due to lower
export and domestic demand. Coriander prices plunged the most due to lower
quality supply in the spot market and possibility of a rise in sowing acreage in the
current season.
All the base metals, except nickel, witnessed its first monthly gain since April as lead
led the rally. Lead and zinc rose on worries short supply. Copper climbed on
speculation of production cuts in China will help reduce a supply glut. Nine of the
biggest copper producers have agreed to cut sales by 200,000 metric tonnes in the
first three months of 2016. Nickel continued to trade lower on higher stock position.
Bearish sentiments continued in bullion counters as the Federal Reserve rose
interest rates mid-December, making precious metals less attractive to those
investors seeking yield-bearing assets. Silver closed down too.
COMMODITY
COMMODITY EXCHANGE CONTRACT 07.01.16 CHANGE%
ALUMINIUM LME 3 MONTHS 1473.00 1475.00 0.14
COPPER LME 3 MONTHS 4609.50 4524.00 -1.85
LEAD LME 3 MONTHS 1745.50 1659.50 -4.93
NICKEL LME 3 MONTHS 8505.00 8505.00 0.00
ZINC LME 3 MONTHS 1568.00 1506.00 -3.95
GOLD COMEX FEB 1075.60 1107.80 2.99
SILVER COMEX MAR 13.84 14.34 3.63
LIGHT CRUDE OIL NYMEX FEB 36.76 33.27 -9.49
NATURAL GAS NYMEX FEB 2.33 2.38 2.06
01.01.16
PRICES OF METALS IN LME/ COMEX/ NYMEX (in US $)
WEEKLY STOCK POSITIONS IN LME (IN TONNES)
COMMODITY STOCK POSITION STOCK POSITION DIFFERENCE
31.12.15 07.01.16
ALUMINIUM 2901200 2882800 -18400
COPPER 236975 235850 -1125
NICKEL 444702 440358 -4344
LEAD 191675 190900 -775
ZINC 465975 457325 -8650
INTERNATIONAL COMMODITY PRICES
COMMODITY EXCHANGE CONTRACT UNIT 01.01.16 07.01.16 CHANGE(%)
Soya CBOT MAR Cent per Bushel 856.00 864.25 0.96
Maize CBOT MAR Cent per Bushel 351.50 353.00 0.43
CPO BMD MAR MYR per MT 2436.00 2422.00 -0.57
Sugar LIFFE MAR 10 cents per MT 419.20 428.80 2.29
13
®
SPOT PRICES (% change)
-7.64
-4.83
-2.76
-2.53
-1.60
-1.41
-1.26
-1.07
-0.83
-0.63
-0.56
-0.04
0.00
0.07
0.25
0.28
1.37
1.53
2.08
3.54
-10.00 -8.00 -6.00 -4.00 -2.00 0.00 2.00 4.00 6.00
GUAR GUM (JODHPUR)
GUAR SEED (JODHPUR)
SOYABEAN (INDORE)
MUSTARD (JAIPUR)
REFINED SOYA OIL (INDORE)
SUGAR (KOLKATA)
CHILLI (GUNTUR)
CORIANDER (KOTA)
BARLEY (JAIPUR)
JEERA (UNJHA)
GUR (MUZAFFARNGR.)
WHEAT (DELHI)
CRUDE PALM OIL (KANDLA)
COTTON (KADI)
COTTON SEED OIL CAKE (AKOLA)
TURMERIC (NIZAMABAD)
PEPPER MALABAR GAR (KOCHI)
SILVER 5 KG (DELHI)
CHANA (DELHI )
RAW JUTE (KOLKATA)
CURRENCY
Currency Table
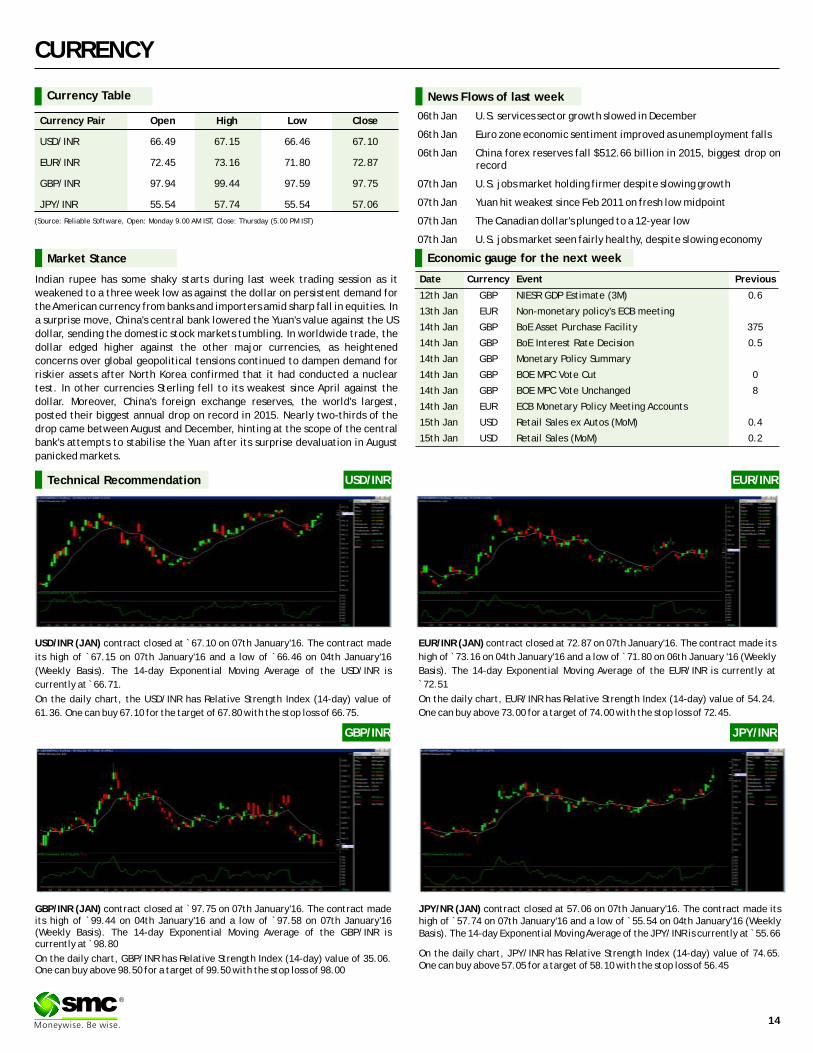
Currency Pair Open High Low Close
USD/INR 66.49 67.15 66.46 67.10
EUR/INR 72.45 73.16 71.80 72.87
GBP/INR 97.94 99.44 97.59 97.75
JPY/INR 55.54 57.74 55.54 57.06
(Source: Reliable Software, Open: Monday 9.00 AM IST, Close: Thursday (5.00 PM IST)
News Flows of last week
06th Jan U.S. services sector growth slowed in December
06th Jan Euro zone economic sentiment improved as unemployment falls
06th Jan China forex reserves fall $512.66 billion in 2015, biggest drop on record
07th Jan U.S. jobs market holding firmer despite slowing growth
07th Jan Yuan hit weakest since Feb 2011 on fresh low midpoint
07th Jan The Canadian dollar's plunged to a 12-year low
07th Jan U.S. jobs market seen fairly healthy, despite slowing economy
EUR/INR (JAN) contract closed at 72.87 on 07th January'16. The contract made its
high of ̀ 73.16 on 04th January'16 and a low of ̀ 71.80 on 06th January '16 (Weekly
Basis). The 14-day Exponential Moving Average of the EUR/INR is currently at
`72.51
On the daily chart, EUR/INR has Relative Strength Index (14-day) value of 54.24.
One can buy above 73.00 for a target of 74.00 with the stop loss of 72.45.
JPY/NR (JAN) contract closed at 57.06 on 07th January'16. The contract made its high of `57.74 on 07th January'16 and a low of `55.54 on 04th January'16 (Weekly Basis). The 14-day Exponential Moving Average of the JPY/INR is currently at ̀ 55.66
On the daily chart, JPY/INR has Relative Strength Index (14-day) value of 74.65. One can buy above 57.05 for a target of 58.10 with the stop loss of 56.45
Market Stance
Indian rupee has some shaky starts during last week trading session as it
weakened to a three week low as against the dollar on persistent demand for
the American currency from banks and importers amid sharp fall in equities. In
a surprise move, China's central bank lowered the Yuan's value against the US
dollar, sending the domestic stock markets tumbling. In worldwide trade, the
dollar edged higher against the other major currencies, as heightened
concerns over global geopolitical tensions continued to dampen demand for
riskier assets after North Korea confirmed that it had conducted a nuclear
test. In other currencies Sterling fell to its weakest since April against the
dollar. Moreover, China's foreign exchange reserves, the world's largest,
posted their biggest annual drop on record in 2015. Nearly two-thirds of the
drop came between August and December, hinting at the scope of the central
bank's attempts to stabilise the Yuan after its surprise devaluation in August
panicked markets.
EUR/INR
USD/INR (JAN) contract closed at `67.10 on 07th January'16. The contract made
its high of `67.15 on 07th January'16 and a low of `66.46 on 04th January'16
(Weekly Basis). The 14-day Exponential Moving Average of the USD/INR is
currently at ̀ 66.71.
On the daily chart, the USD/INR has Relative Strength Index (14-day) value of
61.36. One can buy 67.10 for the target of 67.80 with the stop loss of 66.75.
GBP/INR (JAN) contract closed at 97.75 on 07th January'16. The contract made its high of `99.44 on 04th January'16 and a low of `97.58 on 07th January'16 (Weekly Basis). The 14-day Exponential Moving Average of the GBP/INR is currently at ̀ 98.80
On the daily chart, GBP/INR has Relative Strength Index (14-day) value of 35.06. One can buy above 98.50 for a target of 99.50 with the stop loss of 98.00
`
USD/INRTechnical Recommendation
Economic gauge for the next week
Date Currency Event Previous
12th Jan GBP NIESR GDP Estimate (3M) 0.6
13th Jan EUR Non-monetary policy's ECB meeting
14th Jan GBP BoE Asset Purchase Facility 375
14th Jan GBP BoE Interest Rate Decision 0.5
14th Jan GBP Monetary Policy Summary
14th Jan GBP BOE MPC Vote Cut 0
14th Jan GBP BOE MPC Vote Unchanged 8
14th Jan EUR ECB Monetary Policy Meeting Accounts
15th Jan USD Retail Sales ex Autos (MoM) 0.4
15th Jan USD Retail Sales (MoM) 0.2
GBP/INR JPY/INR
14
®
IPO
IPO NEWSIPO NEWS
VLCC gets Sebi nod for ̀ 400 crore IPO Capital markets regulator Sebi has given clearance to beauty and wellness firm VLCC Health Care to raise at least `400 crore through IPO to fund its expansion in domestic as well as international markets. The firm, which had filed draft red herring prospectus (DRHP) with Sebi on September 23, seeking permission for an IPO, obtained clearance from Sebi on December 29. As per the draft papers, the initial public offer (IPO) comprises fresh issue of shares worth Rs 400 crore and an offer for sale of up to 37.67 lakh equity shares by the existing shareholders - Indivision India Partners and Leon International. The company plans to sell up to 18 lakh equity shares for ̀ 100 crore through a pre-IPO placement of its shares to the institutional investors. The proceeds of the issue will be utilised for setting up VLCC Wellness Centres in India and abroad. Besides, the firm plans to establish VLCC Institutes in the country. In addition, funds will also be used for payment of loans, brand development and general corporate purpose, among others. Founded by Vandana Luthra in 1989, the company has operations in India, Sri Lanka, Bangladesh, Nepal, Malaysia, Singapore, the UAE, Oman, Bahrain, Qatar, Kuwait, Saudi Arabia and Kenya. ICICI Securities, Citigroup Global Markets India and Axis Capital are the merchant bankers for the proposed IPO. The shares are proposed to be listed on BSE and NSE.
L&T Infotech Gets Sebi Clearance For ̀ 2,000-crore IPOL&T Infotech, a subsidiary of engineering giant Larsen & Toubro, has received capital markets regulator Securities and Exchange Board of India's (Sebi) approval to float an initial public offering worth ̀ 2,000 crore. The issue comprises an offer for sale of up to 1,75,00,000 equity shares of face value of Rs 1 each by Larsen & Toubro. The firm, which had filed draft red herring prospectus (DRHP) with Sebi on September 28 seeking permission for an IPO, obtained clearance from capital markets regulator on December 31. Last month, a company official had said that L&T Infotech is looking to raise over ̀ 2,000 crore through the initial public offer (IPO) and the public issue is expected to hit the capital markets in the last quarter of 2015-16. Citigroup Global Markets India, Kotak Mahindra Capital Company, Barclays Bank Plc and ICICI Securities are stated to manage to issue. Equity shares offered through the issue are proposed to be listed on BSE and NSE. L&T Infotech will be the second unit of the parent company to go public. Company's financial arm L&T Finance Holdings Ltd was listed in 2011. L&T Infotech currently has a headcount of more than 20,000 people and has Chevron Corp., Hitachi Ltd and Lafarge SA as its top clients.
International Tractors plans to raise ̀ 1,200 crore via IPO in 2016International Tractors Ltd (ITL), the makers of Sonalika tractors, is planning to raise as much as ̀ 1,200 crore through an initial public offering (IPO), according to three people aware of the development, who spoke on condition of anonymity. The Delhi-based company is the third largest maker of tractors in the country. Global private equity major Blackstone Group Lp, which invested $100 million for a 12.5% stake in the company in 2012, is looking to make a partial exit through the IPO, said a second person aware of the development. A large portion of the IPO will be an offer for sale from Blackstone. The 20-year-old firm had sales close to ̀ 4,000 crore in 2014-15, according to the third person cited above. The company is about to start a new production facility with a capacity of 40,000 units, taking its total production capacity to 100,000 units a year. Though most tractor makers were hit by this year's weak monsoon, ITL has performed relatively better because of robust exports. During April-September, ITL's tractor sales fell 16.7% to 30,209 units from 36,279 units a year ago. Mahindra and Mahindra group saw its tractor sales decline 21.8% to 101,289 units and TAFE's sales declined 21.2% to 58,828 units.
SP Apparels files IPO papers with SebiJoining the IPO bandwagon, Coimbatore-based SP Apparels has filed draft papers with capital markets regulator Sebi to raise at least `215 crore through its initial public offer. The company intends to garner up to ̀ 215 crore through fresh issue of shares, while its existing shareholders will offload 9,00,000 equity shares, as per the Draft Red Herring Prospectus (DRHP) filed with Sebi. Established in 1989, the company manufactures and exports knitted garments for infants and children. The firm also manufactures and retails menswear in India under the brand 'Crocodile'. The company said that proceeds from the fresh issue will be utilised for repayment of debt, expansion and modernisation of manufacturing facility at Salem in Tamil Nadu and opening of new stores for the sale of 'Crocodile' products. The funds raised will be also used for addition of balancing machineries for its existing dyeing unit at Sipcot, Perundurai in Tamil Nadu and other general corporate purposes. The company intends to list its shares on BSE and NSE. The book running lead manager to the issue is Motilal Oswal Investment Advisors and Centrum Capital.
SME watch: Fourth Dimension's IPO sees slow startThe initial public offering (IPO) of Fourth Dimension Solutions on the NSE's SME platform Emerge had seen a slow start, with total bids for just 28,000 shares so far, which represents 0.01 times of the 28,92,000 shares up for sale. The IPO price was fixed at ̀ 30 apiece, which represents a premium of ̀ 20 on the face value of ̀ 10 per share. The market lot was fixed at ̀ 4,000 equity shares and in multiples thereafter, suggesting any investor interested in the IPO will have to make a bid worth at least `1,20,000. For retail investors, there was a ceiling of `2,00,000 on bids for SME IPOs. The limit for bids by market makers was set at 1,48,000 equity shares. Sarthi Capital Advisors is the leading managers of the issue. The company, which had generated negative cash flow in the past four years, intends to use the proceeds to meet its working capital requirements.
Sebi asks two firms to repay investor money Markets regulator Sebi has ordered two firms - Sunplant Constructions and Krutibibha Corporation - to refund the money they had raised illegally from investors. Besides barring the firms and their directors from capital markets for four years, Securities and Exchange Board of India (Sebi) also directed them to pay 15 per cent interest annually along with the refund amount. A Sebi probe found Sunplant Constructions had raised about ̀ 24 crore by way of issuance of Redeemable Preference Shares (RPS) to 3,212 investors without complying with the public issue norm, while Krutibibha collected `3.84 crore by issuing preference shares to 2,081 people. Krutibibha claimed to have paid back around ̀ 2.57 crore to investors. Since the shares were issued to more than 50 persons by each company, they were required to list these securities on stock exchanges. However, the companies failed to comply with this norm. Accordingly, Sebi said the companies and their directors will refund the money "through the issuance of RPS...with an interest of 15 per cent per annum... from the date when the repayments became due to the investors till the date of actual payment." Besides, they will also have to issue public notice in all editions of two National Dailies (one English and one Hindi) and in one local daily with wide circulation, detailing the modalities for refund, including details of contact persons within 15 days. After completing the repayments, the firms will have to file a report of such completion with Sebi within a period of three months, certified by two independent Chartered Accountants. In case the firms fail to comply with the orders, Sebi will initiate attachment and recovery proceedings, besides registering a civil/criminal case against Sunplant Constructions and Krutibibha, among others. Besides, Sebi has barred the firms and their directors from the capital markets and said such debarment will be in place for four years from "the date of completion of refunds to investors" .
Thyrocare Technologies Limited files draft IPO papers Indian diagnostic company Thyrocare Technologies Ltd said on Thursday it had filed draft red herring prospectus with the country's market regulator for an initial public offering (IPO) of 10.7 million shares. Thyrocare said it plans to list on both the BSE and NSE exchanges. JM Financial, Edelweiss Financial and ICICI Securities are lead managers for the issue.
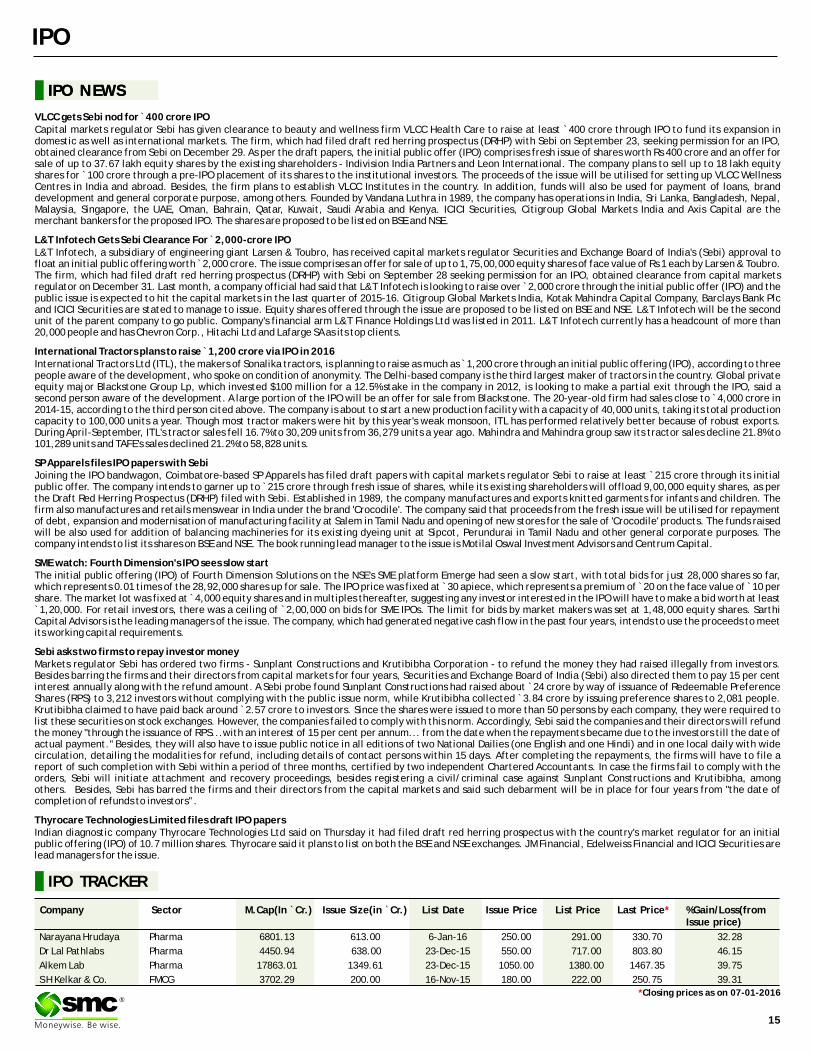
Narayana Hrudaya Pharma 6801.13 613.00 6-Jan-16 250.00 291.00 330.70 32.28
Dr Lal Pathlabs Pharma 4450.94 638.00 23-Dec-15 550.00 717.00 803.80 46.15
Alkem Lab Pharma 17863.01 1349.61 23-Dec-15 1050.00 1380.00 1467.35 39.75
S H Kelkar & Co. FMCG 3702.29 200.00 16-Nov-15 180.00 222.00 250.75 39.31
IPO TRACKER
Company Sector M.Cap(In `Cr.) Issue Size(in `Cr.) List Date Issue Price List Price Last Price %Gain/Loss(from Issue price)
*
*Closing prices as on 07-01-2016®
15
®
16
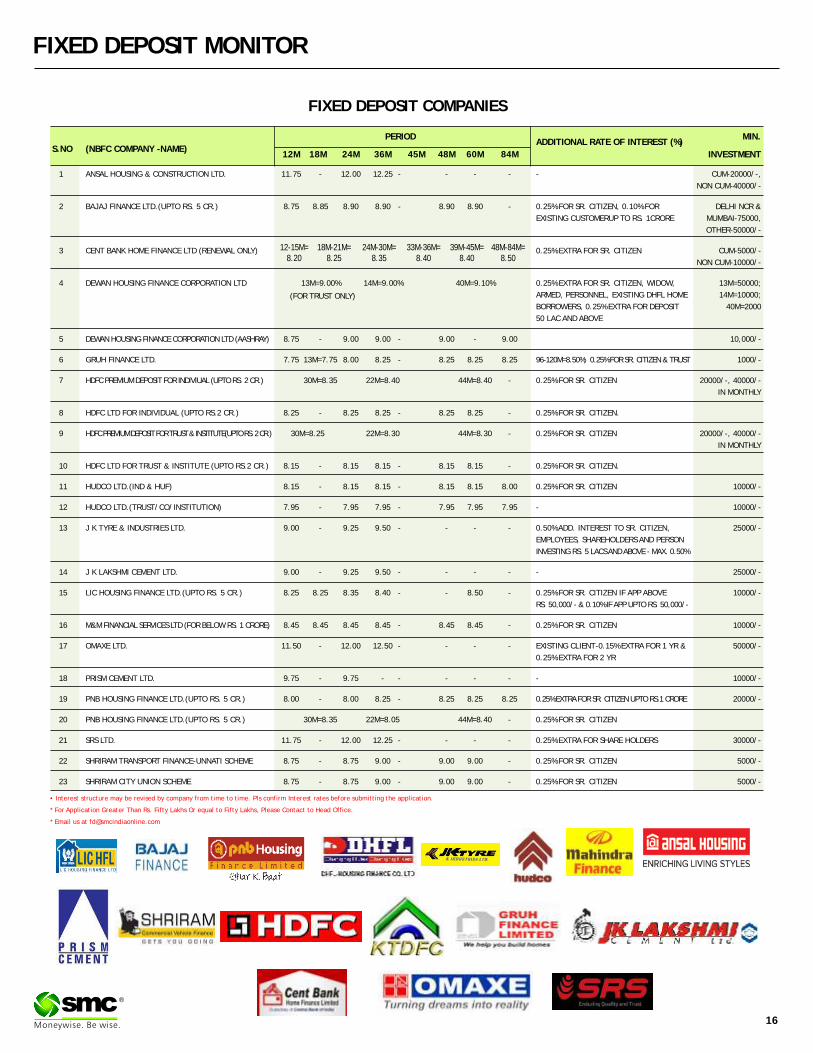
FIXED DEPOSIT MONITOR
• Interest structure may be revised by company from time to time. Pls confirm Interest rates before submitting the application.
* For Application Greater Than Rs. Fifty Lakhs Or equal to Fifty Lakhs, Please Contact to Head Office.
* Email us at [email protected]
FIXED DEPOSIT COMPANIES
PERIOD MIN.ADDITIONAL RATE OF INTEREST (%)
S.NO (NBFC COMPANY -NAME)12M 18M 24M 36M 45M 48M 60M 84M INVESTMENT
1 ANSAL HOUSING & CONSTRUCTION LTD. 11.75 - 12.00 12.25 - - - - - CUM-20000/-,
NON CUM-40000/-
2 BAJAJ FINANCE LTD.(UPTO RS. 5 CR.) 8.75 8.85 8.90 8.90 - 8.90 8.90 - 0.25% FOR SR. CITIZEN, 0.10% FOR DELHI NCR &
EXISTING CUSTOMERUP TO RS. 1CRORE MUMBAI-75000,
OTHER-50000/-
3 CENT BANK HOME FINANCE LTD (RENEWAL ONLY) 0.25% EXTRA FOR SR. CITIZEN CUM-5000/-
NON CUM-10000/-
4 DEWAN HOUSING FINANCE CORPORATION LTD 13M=9.00% 14M=9.00% 40M=9.10% 0.25% EXTRA FOR SR. CITIZEN, WIDOW, 13M=50000;
ARMED, PERSONNEL, EXISTING DHFL HOME 14M=10000;
BORROWERS, 0.25% EXTRA FOR DEPOSIT 40M=2000
50 LAC AND ABOVE
5 DEWAN HOUSING FINANCE CORPORATION LTD (AASHRAY) 8.75 - 9.00 9.00 - 9.00 - 9.00 10,000/-
6 GRUH FINANCE LTD. 7.75 13M=7.75 8.00 8.25 - 8.25 8.25 8.25 96-120M=8.50%; 0.25% FOR SR. CITIZEN & TRUST 1000/-
7 HDFC PREMIUM DEPOSIT FOR INDIVIUAL (UPTO RS. 2 CR.) 30M=8.35 22M=8.40 44M=8.40 - 0.25% FOR SR. CITIZEN 20000/-, 40000/-
IN MONTHLY
8 HDFC LTD FOR INDIVIDUAL (UPTO RS.2 CR.) 8.25 - 8.25 8.25 - 8.25 8.25 - 0.25% FOR SR. CITIZEN.
9 HDFC PREMIUM DEPOSIT FOR TRUST & INSTITUTE(UPTO RS. 2 CR.) 30M=8.25 22M=8.30 44M=8.30 - 0.25% FOR SR. CITIZEN 20000/-, 40000/-
IN MONTHLY
10 HDFC LTD FOR TRUST & INSTITUTE (UPTO RS.2 CR.) 8.15 - 8.15 8.15 - 8.15 8.15 - 0.25% FOR SR. CITIZEN.
11 HUDCO LTD.(IND & HUF) 8.15 - 8.15 8.15 - 8.15 8.15 8.00 0.25% FOR SR. CITIZEN 10000/-
12 HUDCO LTD.(TRUST/CO/INSTITUTION) 7.95 - 7.95 7.95 - 7.95 7.95 7.95 - 10000/-
13 J K TYRE & INDUSTRIES LTD. 9.00 - 9.25 9.50 - - - - 0.50% ADD. INTEREST TO SR. CITIZEN, 25000/-
EMPLOYEES, SHAREHOLDERS AND PERSON
INVESTING RS. 5 LACS AND ABOVE - MAX. 0.50%
14 J K LAKSHMI CEMENT LTD. 9.00 - 9.25 9.50 - - - - - 25000/-
15 LIC HOUSING FINANCE LTD.(UPTO RS. 5 CR.) 8.25 8.25 8.35 8.40 - - 8.50 - 0.25% FOR SR. CITIZEN IF APP ABOVE 10000/-
RS. 50,000/- & 0.10% IF APP UPTO RS. 50,000/-
16 M&M FINANCIAL SERVICES LTD (FOR BELOW RS. 1 CRORE) 8.45 8.45 8.45 8.45 - 8.45 8.45 - 0.25% FOR SR. CITIZEN 10000/-
17 OMAXE LTD. 11.50 - 12.00 12.50 - - - - EXISTING CLIENT-0.15% EXTRA FOR 1 YR & 50000/-
0.25% EXTRA FOR 2 YR
18 PRISM CEMENT LTD. 9.75 - 9.75 - - - - - - 10000/-
19 PNB HOUSING FINANCE LTD.(UPTO RS. 5 CR.) 8.00 - 8.00 8.25 - 8.25 8.25 8.25 0.25% EXTRA FOR SR. CITIZEN UPTO RS.1 CRORE 20000/-
20 PNB HOUSING FINANCE LTD.(UPTO RS. 5 CR.) 30M=8.35 22M=8.05 44M=8.40 - 0.25% FOR SR. CITIZEN
21 SRS LTD. 11.75 - 12.00 12.25 - - - - 0.25% EXTRA FOR SHARE HOLDERS 30000/-
22 SHRIRAM TRANSPORT FINANCE-UNNATI SCHEME 8.75 - 8.75 9.00 - 9.00 9.00 - 0.25% FOR SR. CITIZEN 5000/-
23 SHRIRAM CITY UNION SCHEME 8.75 - 8.75 9.00 - 9.00 9.00 - 0.25% FOR SR. CITIZEN 5000/-
(FOR TRUST ONLY)
12-15M=8.20
18M-21M=8.25
24M-30M=8.35
33M-36M=8.40
39M-45M=8.40
48M-84M=8.50
INSURANCE
®
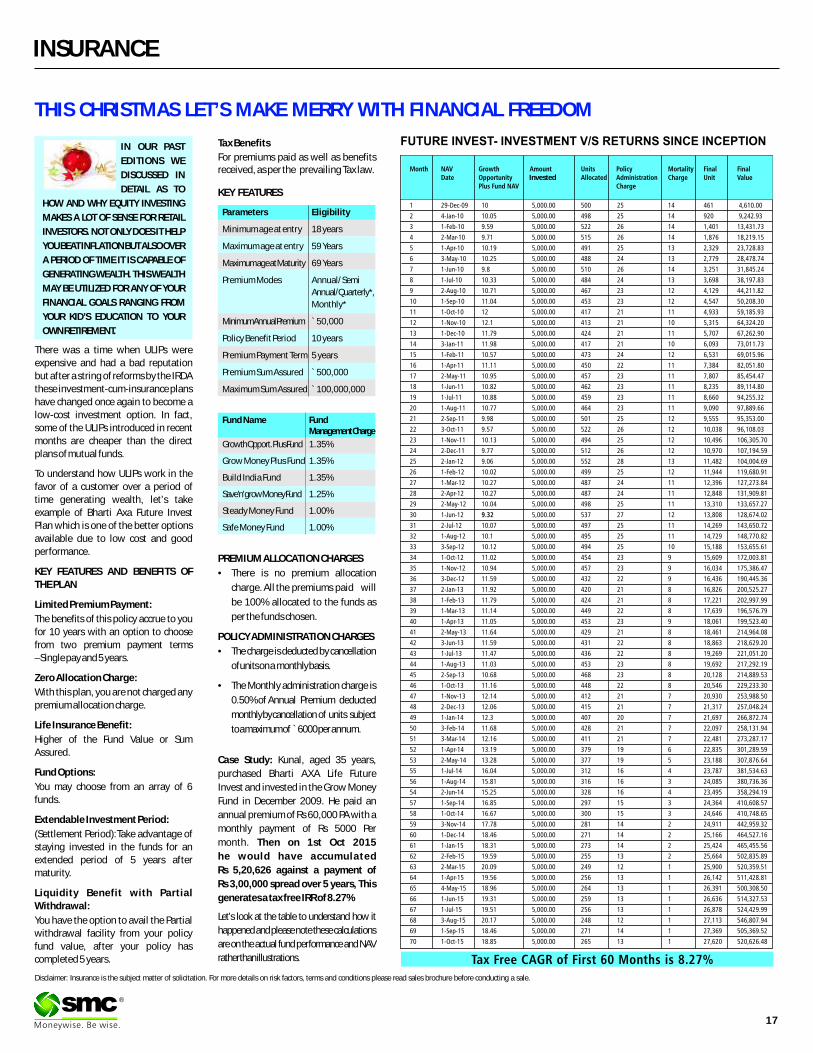
THIS CHRISTMAS LET’S MAKE MERRY WITH FINANCIAL FREEDOM
17
PREMIUM ALLOCATION CHARGES
• There is no premium allocation
charge. All the premiums paid will
be 100% allocated to the funds as
per the funds chosen.
POLICY ADMINISTRATION CHARGES
• The charge is deducted by cancellation
of units on a monthly basis.
• The Monthly administration charge is
0.50% of Annual Premium deducted
monthly by cancellation of units subject
to a maximum of ̀ 6000 per annum.
Case Study: Kunal, aged 35 years,
purchased Bharti AXA Life Future
Invest and invested in the Grow Money
Fund in December 2009. He paid an
annual premium of Rs 60,000 PA with a
monthly payment of Rs 5000 Per
month. Then on 1st Oct 2015
he would have accumulated
Rs 5,20,626 against a payment of
Rs 3,00,000 spread over 5 years, This
generates a tax free IRR of 8.27%
Let’s look at the table to understand how it
happened and please note these calculations
are on the actual fund performance and NAV
rather than illustrations.
KEY FEATURES
There was a time when ULIPs were
expensive and had a bad reputation
but after a string of reforms by the IRDA
these investment-cum-insurance plans
have changed once again to become a
low-cost investment option. In fact,
some of the ULIPs introduced in recent
months are cheaper than the direct
plans of mutual funds.
To understand how ULIPs work in the
favor of a customer over a period of
time generating wealth, let’s take
example of Bharti Axa Future Invest
Plan which is one of the better options
available due to low cost and good
performance.
KEY FEATURES AND BENEFITS OF
THE PLAN
Limited Premium Payment:
The benefits of this policy accrue to you
for 10 years with an option to choose
from two premium payment terms
–Single pay and 5 years.
Zero Allocation Charge:
With this plan, you are not charged any
premium allocation charge.
Life Insurance Benefit:
Higher of the Fund Value or Sum
Assured.
Fund Options:
You may choose from an array of 6
funds.
Extendable Investment Period:
(Settlement Period):Take advantage of
staying invested in the funds for an
extended period of 5 years after
maturity.
Liquidity Benefit with Partial
Withdrawal:
You have the option to avail the Partial
withdrawal facility from your policy
fund value, after your policy has
completed 5 years.
IN OUR PAST
EDITIONS WE
DISCUSSED IN
DETAIL AS TO
HOW AND WHY EQUITY INVESTING
MAKES A LOT OF SENSE FOR RETAIL
INVESTORS. NOT ONLY DOES IT HELP
YOU BEAT INFLATION BUT ALSO OVER
A PERIOD OF TIME IT IS CAPABLE OF
GENERATING WEALTH. THIS WEALTH
MAY BE UTILIZED FOR ANY OF YOUR
FINANCIAL GOALS RANGING FROM
YOUR KID’S EDUCATION TO YOUR
OWN RETIREMENT.
Tax Benefits
For premiums paid as well as benefits received, as per the prevailing Tax law.
Disclaimer: Insurance is the subject matter of solicitation. For more details on risk factors, terms and conditions please read sales brochure before conducting a sale.
Parameters Eligibility
Minimum age at entry 18 years
Maximum age at entry 59 Years
Maximum age at Maturity 69 Years
Premium Modes Annual/ Semi
Annual/ Quarterly*,
Monthly*
Minimum Annual Premium `50,000
Policy Benefit Period 10 years
Premium Payment Term 5 years
Premium Sum Assured `500,000
Maximum Sum Assured `100,000,000
Fund Name Fund Management Charge
Growth Opport. Plus Fund 1.35%
Grow Money Plus Fund 1.35%
Build India Fund 1.35%
Save'n' grow Money Fund 1.25%
Steady Money Fund 1.00%
Safe Money Fund 1.00%
Invested
18
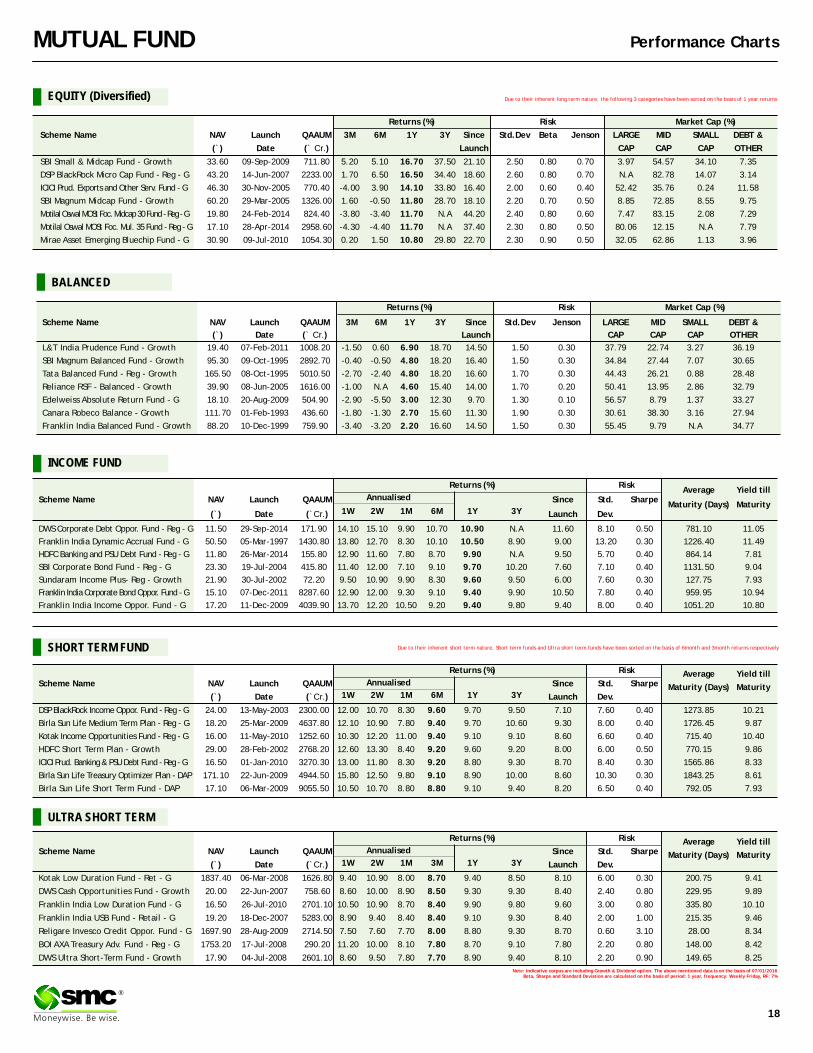
MUTUAL FUND Performance Charts
Returns (%) Risk Market Cap (%)
Scheme Name NAV Launch QAAUM 3M 6M 1Y 3Y Since Std.Dev Beta Jenson LARGE MID SMALL DEBT &
(`) Date (` Cr.) Launch CAP CAP CAP OTHER
SBI Small & Midcap Fund - Growth 33.60 09-Sep-2009 711.80 5.20 5.10 16.70 37.50 21.10 2.50 0.80 0.70 3.97 54.57 34.10 7.35
DSP BlackRock Micro Cap Fund - Reg - G 43.20 14-Jun-2007 2233.00 1.70 6.50 16.50 34.40 18.60 2.60 0.80 0.70 N.A 82.78 14.07 3.14
ICICI Prud. Exports and Other Serv. Fund - G 46.30 30-Nov-2005 770.40 -4.00 3.90 14.10 33.80 16.40 2.00 0.60 0.40 52.42 35.76 0.24 11.58
SBI Magnum Midcap Fund - Growth 60.20 29-Mar-2005 1326.00 1.60 -0.50 11.80 28.70 18.10 2.20 0.70 0.50 8.85 72.85 8.55 9.75
Motilal Oswal MOSt Foc. Midcap 30 Fund - Reg - G 19.80 24-Feb-2014 824.40 -3.80 -3.40 11.70 N.A 44.20 2.40 0.80 0.60 7.47 83.15 2.08 7.29
Motilal Oswal MOSt Foc. Mul. 35 Fund - Reg - G 17.10 28-Apr-2014 2958.60 -4.30 -4.40 11.70 N.A 37.40 2.30 0.80 0.50 80.06 12.15 N.A 7.79
Mirae Asset Emerging Bluechip Fund - G 30.90 09-Jul-2010 1054.30 0.20 1.50 10.80 29.80 22.70 2.30 0.90 0.50 32.05 62.86 1.13 3.96
EQUITY (Diversified)
INCOME FUND
Note: Indicative corpus are including Growth & Dividend option. The above mentioned data is on the basis of 07/01/2016Beta, Sharpe and Standard Deviation are calculated on the basis of period: 1 year, frequency: Weekly Friday, RF: 7%
ULTRA SHORT TERM
SHORT TERM FUND
Due to their inherent long term nature, the following 3 categories have been sorted on the basis of 1 year returns
Due to their inherent short term nature, Short term funds and Ultra short term funds have been sorted on the basis of 6month and 3month returns respectively
Returns (%) RiskAverage Yield till
Scheme Name NAV Launch QAAUM Since Std. SharpeMaturity (Days) Maturity
1W 2W 1M 6M 1Y 3Y(`) Date (`Cr.) Launch Dev.
DWS Corporate Debt Oppor. Fund - Reg - G 11.50 29-Sep-2014 171.90 14.10 15.10 9.90 10.70 10.90 N.A 11.60 8.10 0.50 781.10 11.05
Franklin India Dynamic Accrual Fund - G 50.50 05-Mar-1997 1430.80 13.80 12.70 8.30 10.10 10.50 8.90 9.00 13.20 0.30 1226.40 11.49
HDFC Banking and PSU Debt Fund - Reg - G 11.80 26-Mar-2014 155.80 12.90 11.60 7.80 8.70 9.90 N.A 9.50 5.70 0.40 864.14 7.81
SBI Corporate Bond Fund - Reg - G 23.30 19-Jul-2004 415.80 11.40 12.00 7.10 9.10 9.70 10.20 7.60 7.10 0.40 1131.50 9.04
Sundaram Income Plus- Reg - Growth 21.90 30-Jul-2002 72.20 9.50 10.90 9.90 8.30 9.60 9.50 6.00 7.60 0.30 127.75 7.93
Franklin India Corporate Bond Oppor. Fund - G 15.10 07-Dec-2011 8287.60 12.90 12.00 9.30 9.10 9.40 9.90 10.50 7.80 0.40 959.95 10.94
Franklin India Income Oppor. Fund - G 17.20 11-Dec-2009 4039.90 13.70 12.20 10.50 9.20 9.40 9.80 9.40 8.00 0.40 1051.20 10.80
Annualised
Returns (%) Risk Average Yield tillScheme Name NAV Launch QAAUM Since Std. Sharpe Maturity (Days) Maturity
1W 2W 1M 6M 1Y 3Y(`) Date (`Cr.) Launch Dev.
DSP BlackRock Income Oppor. Fund - Reg - G 24.00 13-May-2003 2300.00 12.00 10.70 8.30 9.60 9.70 9.50 7.10 7.60 0.40 1273.85 10.21
Birla Sun Life Medium Term Plan - Reg - G 18.20 25-Mar-2009 4637.80 12.10 10.90 7.80 9.40 9.70 10.60 9.30 8.00 0.40 1726.45 9.87
Kotak Income Opportunities Fund - Reg - G 16.00 11-May-2010 1252.60 10.30 12.20 11.00 9.40 9.10 9.10 8.60 6.60 0.40 715.40 10.40
HDFC Short Term Plan - Growth 29.00 28-Feb-2002 2768.20 12.60 13.30 8.40 9.20 9.60 9.20 8.00 6.00 0.50 770.15 9.86
ICICI Prud. Banking & PSU Debt Fund - Reg - G 16.50 01-Jan-2010 3270.30 13.00 11.80 8.30 9.20 8.80 9.30 8.70 8.40 0.30 1565.86 8.33
Birla Sun Life Treasury Optimizer Plan - DAP 171.10 22-Jun-2009 4944.50 15.80 12.50 9.80 9.10 8.90 10.00 8.60 10.30 0.30 1843.25 8.61
Birla Sun Life Short Term Fund - DAP 17.10 06-Mar-2009 9055.50 10.50 10.70 8.80 8.80 9.10 9.40 8.20 6.50 0.40 792.05 7.93
Annualised
Returns (%) Risk Average Yield tillScheme Name NAV Launch QAAUM Since Std. Sharpe Maturity (Days) Maturity
1W 2W 1M 3M 1Y 3Y(`) Date (`Cr.) Launch Dev.
Kotak Low Duration Fund - Ret - G 1837.40 06-Mar-2008 1626.80 9.40 10.90 8.00 8.70 9.40 8.50 8.10 6.00 0.30 200.75 9.41
DWS Cash Opportunities Fund - Growth 20.00 22-Jun-2007 758.60 8.60 10.00 8.90 8.50 9.30 9.30 8.40 2.40 0.80 229.95 9.89
Franklin India Low Duration Fund - G 16.50 26-Jul-2010 2701.10 10.50 10.90 8.70 8.40 9.90 9.80 9.60 3.00 0.80 335.80 10.10
Franklin India USB Fund - Retail - G 19.20 18-Dec-2007 5283.00 8.90 9.40 8.40 8.40 9.10 9.30 8.40 2.00 1.00 215.35 9.46
Religare Invesco Credit Oppor. Fund - G 1697.90 28-Aug-2009 2714.50 7.50 7.60 7.70 8.00 8.80 9.30 8.70 0.60 3.10 28.00 8.34
BOI AXA Treasury Adv. Fund - Reg - G 1753.20 17-Jul-2008 290.20 11.20 10.00 8.10 7.80 8.70 9.10 7.80 2.20 0.80 148.00 8.42
DWS Ultra Short-Term Fund - Growth 17.90 04-Jul-2008 2601.10 8.60 9.50 7.80 7.70 8.90 9.40 8.10 2.20 0.90 149.65 8.25
Annualised
®
BALANCED
Returns (%) Risk Market Cap (%)
Scheme Name NAV Launch QAAUM 3M 6M 1Y 3Y Since Std.Dev Jenson LARGE MID SMALL DEBT &
(`) Date (` Cr.) Launch CAP CAP CAP OTHER
L&T India Prudence Fund - Growth 19.40 07-Feb-2011 1008.20 -1.50 0.60 6.90 18.70 14.50 1.50 0.30 37.79 22.74 3.27 36.19
SBI Magnum Balanced Fund - Growth 95.30 09-Oct-1995 2892.70 -0.40 -0.50 4.80 18.20 16.40 1.50 0.30 34.84 27.44 7.07 30.65
Tata Balanced Fund - Reg - Growth 165.50 08-Oct-1995 5010.50 -2.70 -2.40 4.80 18.20 16.60 1.70 0.30 44.43 26.21 0.88 28.48
Reliance RSF - Balanced - Growth 39.90 08-Jun-2005 1616.00 -1.00 N.A 4.60 15.40 14.00 1.70 0.20 50.41 13.95 2.86 32.79
Edelweiss Absolute Return Fund - G 18.10 20-Aug-2009 504.90 -2.90 -5.50 3.00 12.30 9.70 1.30 0.10 56.57 8.79 1.37 33.27
Canara Robeco Balance - Growth 111.70 01-Feb-1993 436.60 -1.80 -1.30 2.70 15.60 11.30 1.90 0.30 30.61 38.30 3.16 27.94
Franklin India Balanced Fund - Growth 88.20 10-Dec-1999 759.90 -3.40 -3.20 2.20 16.60 14.50 1.50 0.30 55.45 9.79 N.A 34.77

CHANNEL PARTNER FOR

NSE INB/INF/INE 230771431, BSE INB/INF/INE 011343937, MCX- SX INB/INF 260771432 INE 260771431, USEL INE 271343936, CDSL IN-DP-CDSL-583-2010, NSDL IN-DP-NSDL-333-2010 (SMC Global Securities Ltd.) NCDEX: NCDEX/TCM/CORP/0131, MCX: MCX/TCM/CORP/0385, MCX MEMBER ID: 8200, NMCE: NMCE/TCM/CORP/0215, ICEX: ICEX/TCM/CORP/009, ACE: ACEL/CM/CORP/0267, UCX: 210001 (SMC Comtrade Ltd.), PMS INP000003435 (SMC Investments and Advisors Ltd.), IRDAI Regi: No: DB 272/04 License No. 289 (SMC Insurance Brokers Pvt. Ltd.) , Merchant Banker INM000011427 (SMC Capitals Ltd.), Client must read Risk Disclosure Document (RDD) & Do's and Don'ts before investing is included in the content of the Advertisement.
Investment in securities & commodities market are subject to market risk • All insurance products sold through SMC Insurance Brokers Pvt. Ltd. • Investment Banking Services provided by SMC Capitals Ltd. • Equity PMS and Wealth management services provided by SMC Investments & Advisors Ltd. • IPOs and Mutual Funds distribution service is provided by SMC Global Securities Ltd. • Financing Services provided by Moneywise Financial Services Pvt Ltd. • Insurance is the subject matter of solicitation • Commodity broking services provided by SMC Comtrade Ltd. • Real Estate Advisory services are offered through SMC Real Estate Advisors Pvt. Ltd. • Award sources: Best Financial Services Provider given to SMC Comtrade Ltd.• Property Consultant of the year (residential) given to SMC Real Estate Advisors Pvt. Ltd. • Zee Business Market Analyst Awards 2014 • Assocham - Excellence Awards 2015 • BSE-D&B Equity Broking Awards 2014,2013 & 2012 • Assocham SME Excellence Awards 2014 • Bloomberg-UTV Financial Leadership Awards 2012.
Disclaimer: SMC Global Securities Limited is proposing, subject to receipt of requisite approvals, market conditions and other considerations, a further public offering of its equity shares and has filed the Draft Red Herring Prospectus with the Securities and Exchange Board of India (“SEBI”) and the Stock Exchanges. The Draft Red Herring Prospectus is available on the website of SEBI at www.sebi.gov.in and on the websites of the Book Running Lead Manager i.e., ICICI Securities Limited at www.icicisecurities.com and the Co- Book Running Lead Manager i.e., Elara Capital (India) Private Limited at www.elaracapital.com. Investors should note that investment in equity shares involves a high degree of risk and for details relating to the same, please see the section titled “Risk Factors” of the aforementioned offer document.
2014 & '13
BEST EQUITY BROKING HOUSE-
DERIVATIVE SEGMENTAwarded by:
Investors' Protection Fund
2012
BESTCURRENCY
BROKERAwarded by:
2012
BEST EQUITY
BROKING HOUSE
Investors' Protection Fund
Awarded by:
2015
PROPERTY CONSULTANT OF THE YEAR - RESIDENTIAL
Awarded by:
ABP NEWS
2014ZEE BUSINESS
INDIA'S BEST MARKET ANALYST
COMMODITY FUNDAMENTAL Awarded by:
2015
BEST FINANCIAL SERVICES
PROVIDERAwarded by:
2014
BESTCOMMODITY
BROKERAwarded by:
Related Documents