79 Table 34: District - wise distribution of Wastelands KERALA Category Alappuzha Cannanore Ernakulam Idukki Kasaragod Kollam Kottayam Kozhikode Mala- puram Palghat Pathana- mthitta Thiruvanan- thapuram Thrissur Waynad Total 1 0.00 0.00 0.00 0.00 0.00 0.00 0.00 0.00 0.00 0.00 0.00 0.00 0.00 0.00 0.00 2 0.00 0.00 0.00 0.00 0.00 0.00 0.00 0.00 0.00 0.00 0.00 0.00 0.00 0.00 0.00 3 0.00 8.91 21.15 259.60 10.14 23.46 63.08 1.20 116.65 33.64 101.06 14.30 29.83 42.61 725.62 4 0.02 157.25 10.81 48.11 290.88 8.37 47.55 38.97 1.85 131.79 7.44 4.96 14.35 25.44 787.78 5 0.00 0.00 0.00 0.00 0.00 0.00 3.58 1.48 0.00 0.00 0.00 0.00 0.00 0.00 5.06 6 0.00 0.00 3.42 0.00 0.00 0.00 1.16 0.16 0.00 2.64 0.00 0.00 7.29 0.24 14.91 7 0.00 0.00 0.00 0.00 0.00 0.00 0.00 0.00 0.00 0.00 0.00 0.00 0.00 0.00 0.00 8 0.00 0.00 0.00 0.00 0.00 0.00 0.00 0.00 0.00 0.00 0.00 0.00 0.00 0.00 0.00 9 0.00 0.00 0.00 0.00 0.00 0.00 0.00 0.00 0.00 0.00 0.00 0.00 0.00 0.00 0.00 10 0.00 0.00 0.00 0.00 0.00 0.00 0.00 0.00 0.00 0.00 0.00 0.00 0.00 0.00 0.00 11 0.00 17.07 52.03 29.33 0.42 13.36 4.46 33.21 56.92 190.69 0.45 145.43 14.69 14.19 572.25 12 0.00 0.00 0.00 0.00 0.00 0.00 0.00 0.00 0.00 0.00 0.00 0.00 0.00 0.00 0.00 13 0.00 0.00 0.00 0.00 0.00 0.00 0.00 0.00 0.00 0.00 0.00 0.00 0.00 0.00 0.00 14 0.00 0.00 0.00 0.00 0.00 0.00 0.00 0.00 0.00 0.00 0.00 0.00 0.00 0.00 0.00 15 0.00 0.00 0.00 0.00 0.00 0.00 0.00 0.00 2.52 9.47 0.00 0.00 4.49 0.00 16.48 16 1.30 2.31 1.42 0.00 5.25 0.10 0.00 3.23 3.56 0.00 0.00 8.65 2.88 0.00 28.70 17 0.00 0.00 0.00 0.00 0.00 0.00 0.00 0.00 0.00 0.00 0.00 0.00 0.00 0.00 0.00 18 0.00 0.00 0.00 0.00 0.00 0.00 0.00 0.00 0.00 0.00 0.00 0.00 0.00 0.00 0.00 19 0.00 0.00 0.00 0.00 0.00 0.00 0.00 0.00 0.00 0.00 0.00 0.00 0.00 0.00 0.00 20 0.00 0.00 0.00 0.00 0.00 0.00 0.00 0.12 0.00 0.00 0.00 0.06 0.02 0.00 0.20 21 0.00 0.00 0.00 0.00 0.00 0.00 0.00 0.00 0.00 0.00 0.00 0.00 0.00 0.00 0.00 22 0.00 15.70 15.13 112.53 15.85 0.47 0.68 14.38 21.66 89.64 2.40 9.59 7.16 2.49 307.68 23 0.00 0.00 0.00 0.00 0.00 0.00 0.00 0.00 0.00 0.00 0.00 0.00 0.00 0.00 0.00 Total 1.32 201.24 103.95 449.57 322.54 45.77 120.50 92.76 203.16 457.86 111.36 182.99 80.72 84.96 2458.69 TGA 1414.00 2997.00 2408.00 5019.00 1961.00 2583.00 2204.00 2345.00 3548.00 4392.00 2642.00 2186.00 3032.00 2132.00 38863.00 % to TGA 0.09 6.71 4.32 8.96 16.45 1.77 5.47 3.96 5.73 10.42 4.21 8.37 2.66 3.98 6.33 1. Gullied and/ or ravinous land (Medium) 2. Gullied and/ or ravinous land (Deep) 3. Land with Dense Scrub 4. Land with Open Scrub 5. Waterlogged and Marshy land (Permanent) 6. Waterlogged and Marshy land (Seasonal) 7. Land affected by salinity/alkalinity (Medium) 8. Land affected by salinity/alkalinity (Strong) 9. Shifting Cultivation - Current Jhum 10. Shifting Cultivation - Abandoned Jhum 11. Under-utilised/degraded forest (Scrub domin) 12. Under-utilised/degraded forest (Agriculture) 13. Degraded pastures/ grazing land 14. Degraded land under plantation crop 15. Sands-Riverine 16. Sands-Coastal 17. Sands-Desertic 18. Sands-Semi Stab.-Stab>40m 19. Sands-Semi Stab.-Stab 15-40m 20. Mining Wastelands 21. Industrial wastelands 22. Barren Rocky/Stony waste 23. Snow covered /Glacial area Total - Total Wasteland Area TGA - Total Geographical Area

Welcome message from author
This document is posted to help you gain knowledge. Please leave a comment to let me know what you think about it! Share it to your friends and learn new things together.
Transcript
79
Table 34: District - wise distribution of WastelandsKERALA
Category Alappuzha Cannanore Ernakulam Idukki Kasaragod Kollam Kottayam Kozhikode Mala-puram
Palghat Pathana-mthitta
Thiruvanan-thapuram
Thrissur Waynad Total
1 0.00 0.00 0.00 0.00 0.00 0.00 0.00 0.00 0.00 0.00 0.00 0.00 0.00 0.00 0.002 0.00 0.00 0.00 0.00 0.00 0.00 0.00 0.00 0.00 0.00 0.00 0.00 0.00 0.00 0.003 0.00 8.91 21.15 259.60 10.14 23.46 63.08 1.20 116.65 33.64 101.06 14.30 29.83 42.61 725.624 0.02 157.25 10.81 48.11 290.88 8.37 47.55 38.97 1.85 131.79 7.44 4.96 14.35 25.44 787.785 0.00 0.00 0.00 0.00 0.00 0.00 3.58 1.48 0.00 0.00 0.00 0.00 0.00 0.00 5.066 0.00 0.00 3.42 0.00 0.00 0.00 1.16 0.16 0.00 2.64 0.00 0.00 7.29 0.24 14.917 0.00 0.00 0.00 0.00 0.00 0.00 0.00 0.00 0.00 0.00 0.00 0.00 0.00 0.00 0.008 0.00 0.00 0.00 0.00 0.00 0.00 0.00 0.00 0.00 0.00 0.00 0.00 0.00 0.00 0.009 0.00 0.00 0.00 0.00 0.00 0.00 0.00 0.00 0.00 0.00 0.00 0.00 0.00 0.00 0.0010 0.00 0.00 0.00 0.00 0.00 0.00 0.00 0.00 0.00 0.00 0.00 0.00 0.00 0.00 0.0011 0.00 17.07 52.03 29.33 0.42 13.36 4.46 33.21 56.92 190.69 0.45 145.43 14.69 14.19 572.2512 0.00 0.00 0.00 0.00 0.00 0.00 0.00 0.00 0.00 0.00 0.00 0.00 0.00 0.00 0.0013 0.00 0.00 0.00 0.00 0.00 0.00 0.00 0.00 0.00 0.00 0.00 0.00 0.00 0.00 0.0014 0.00 0.00 0.00 0.00 0.00 0.00 0.00 0.00 0.00 0.00 0.00 0.00 0.00 0.00 0.0015 0.00 0.00 0.00 0.00 0.00 0.00 0.00 0.00 2.52 9.47 0.00 0.00 4.49 0.00 16.4816 1.30 2.31 1.42 0.00 5.25 0.10 0.00 3.23 3.56 0.00 0.00 8.65 2.88 0.00 28.7017 0.00 0.00 0.00 0.00 0.00 0.00 0.00 0.00 0.00 0.00 0.00 0.00 0.00 0.00 0.0018 0.00 0.00 0.00 0.00 0.00 0.00 0.00 0.00 0.00 0.00 0.00 0.00 0.00 0.00 0.0019 0.00 0.00 0.00 0.00 0.00 0.00 0.00 0.00 0.00 0.00 0.00 0.00 0.00 0.00 0.0020 0.00 0.00 0.00 0.00 0.00 0.00 0.00 0.12 0.00 0.00 0.00 0.06 0.02 0.00 0.2021 0.00 0.00 0.00 0.00 0.00 0.00 0.00 0.00 0.00 0.00 0.00 0.00 0.00 0.00 0.0022 0.00 15.70 15.13 112.53 15.85 0.47 0.68 14.38 21.66 89.64 2.40 9.59 7.16 2.49 307.6823 0.00 0.00 0.00 0.00 0.00 0.00 0.00 0.00 0.00 0.00 0.00 0.00 0.00 0.00 0.00
Total 1.32 201.24 103.95 449.57 322.54 45.77 120.50 92.76 203.16 457.86 111.36 182.99 80.72 84.96 2458.69TGA 1414.00 2997.00 2408.00 5019.00 1961.00 2583.00 2204.00 2345.00 3548.00 4392.00 2642.00 2186.00 3032.00 2132.00 38863.00
% to TGA 0.09 6.71 4.32 8.96 16.45 1.77 5.47 3.96 5.73 10.42 4.21 8.37 2.66 3.98 6.33
1. Gullied and/ or ravinous land (Medium)2. Gullied and/ or ravinous land (Deep)3. Land with Dense Scrub4. Land with Open Scrub5. Waterlogged and Marshy land (Permanent)
6. Waterlogged and Marshy land (Seasonal)7. Land affected by salinity/alkalinity (Medium)8. Land affected by salinity/alkalinity (Strong)9. Shifting Cultivation - Current Jhum10. Shifting Cultivation - Abandoned Jhum
11. Under-utilised/degraded forest (Scrub domin)12. Under-utilised/degraded forest (Agriculture)13. Degraded pastures/ grazing land14. Degraded land under plantation crop15. Sands-Riverine
16. Sands-Coastal17. Sands-Desertic18. Sands-Semi Stab.-Stab>40m19. Sands-Semi Stab.-Stab 15-40m20. Mining Wastelands
21. Industrial wastelands22. Barren Rocky/Stony waste23. Snow covered /Glacial areaTotal - Total Wasteland AreaTGA - Total Geographical Area

80
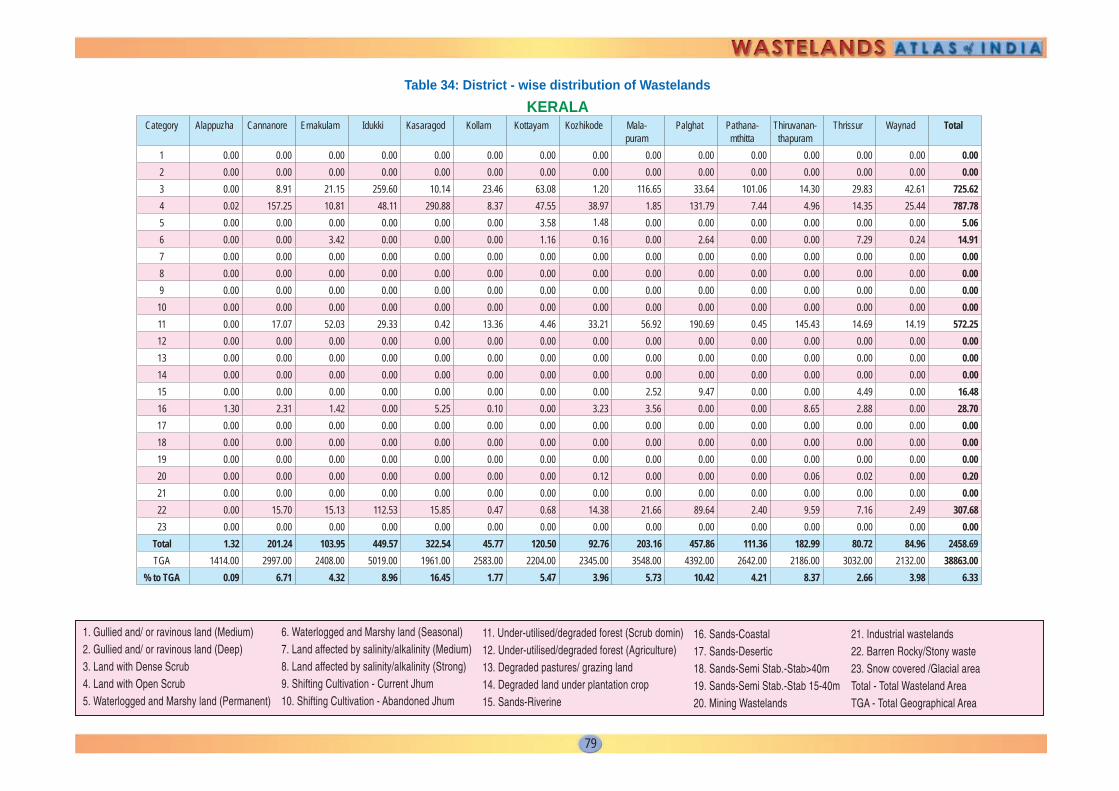
WASTELAND MAP
Coordinated by:Land Use Division, LRG, RS & GIS - AA
National Remote Sensing CentreISRO, Dept. of Space, Govt of India,
Balanagar,Hyderabad - 500625
KERALA2005-06
Based on 3 season data of IRS P6 LISS III (2005-06) & Limited ground checks
Partner Institution:Kerala State Remote Sensing
and Environment CentreVikas Bhawan
Thiruvananthapuram- 695033
Total Geog. Area (TGA) :38863.00 sq.km.Total Wasteland Area : 2458.69 sq. km.Wasteland Area : 6.33 %
30%
32%1%
23%
1%1%
12%
3
1716
6
11
4
22
IDUKKI
PALGHAT
TRICHUR
QUILON
MALAPPURAM
CANNANORE
WAYANAD
KOTTAYAM
ERNAKULAM
PATTANAMTITTA
KOZHIKODE
TRIVANDRUM
KASARAGOD
ALLEPPEY
LEGEND
Major RoadRailway Line
Gullied/ Ravine land-Medium ravine (1)Gullied/Ravine land-Deep/ very deep ravine (2)Scrubland - Land with dense scrub (3)Scrubland - Land with open scrub (4)Waterlogged and marshy land - Permanent (5)Waterlogged and marshy land - Seasonal (6)Land Affected by Salinity/ Alkalinity - Moderate (7)Land Affected by Salinity/ Alkalinity - Strong (8)Shifting cultivation - Current jhum (9)Shifting cultivation - Abandoned jhum (10)Under-utilised Deg Notif Forest - Scrub Dom (11)Under- utilised Deg Notif Forest - Agriculture (12)Degraded Pastures/ grazing land (13)Degraded Land under Plantation Crop (14)Sands - Desert sand (15)Sands - Coastal sand (16)Sands - Riverine (17)Sands - Semi-stab to stab (>40m) dune (18)Sands-Semi-stab to stab mod high(15-40m) dune (19)Mining Wastelands (20)Industrial Wastelands (21)Barren rocky area (22)Snow cover and/ or glacial area (23)Non Wasteland Area
Figure. 31

81
Table 35: Kerala - Category-wise distribution and changes in wastelandsArea in sq.km.
Sl Wasteland Categories 2005-06 % 2003 % Change % diff1 Land with Dense Scrub 725.62 1.87 691.26 1.78 34.36 0.092 Land with Open Scrub 787.78 2.03 3.24 0.01 784.54 2.023 Waterlogged and Marshy land-Permanent 5.06 0.01 19.94 0.05 -14.88 -0.044 Waterlogged and Marshy land-Seasonal 14.91 0.04 248.49 0.64 -233.58 -0.605 Under utilised/degraded notified forest land-Scrub dominated 572.25 1.47 425.53 1.09 146.72 0.386 Degraded pastures/grazing land 0.00 0.00 124.00 0.32 -124.00 -0.327 Degraded land under plantation Crops 16.48 0.04 51.56 0.13 -35.08 -0.098 Sands-Riverine 28.70 0.07 0.00 0.00 28.70 0.079 Sands-Coastal 0.00 0.00 11.55 0.03 -11.55 -0.03
10 Mining wastelands 0.20 0.00 2.18 0.01 -1.98 -0.0111 Barren rocky area 307.68 0.79 211.05 0.54 96.63 0.25
Total 2458.68 6.33 1788.80 4.60 669.88 1.72TGA 38863.00
Related Documents