Edith Cowan University Edith Cowan University Research Online Research Online Theses : Honours Theses 2003 Wireless Local Area Network Security : An Investigation Into Wireless Local Area Network Security : An Investigation Into Security Tool Usage In Wireless Networks Security Tool Usage In Wireless Networks Susan Webb Edith Cowan University Follow this and additional works at: https://ro.ecu.edu.au/theses_hons Part of the Digital Communications and Networking Commons Recommended Citation Recommended Citation Webb, S. (2003). Wireless Local Area Network Security : An Investigation Into Security Tool Usage In Wireless Networks. https://ro.ecu.edu.au/theses_hons/241 This Thesis is posted at Research Online. https://ro.ecu.edu.au/theses_hons/241

Welcome message from author
This document is posted to help you gain knowledge. Please leave a comment to let me know what you think about it! Share it to your friends and learn new things together.
Transcript

Edith Cowan University Edith Cowan University
Research Online Research Online
Theses : Honours Theses
2003
Wireless Local Area Network Security : An Investigation Into Wireless Local Area Network Security : An Investigation Into
Security Tool Usage In Wireless Networks Security Tool Usage In Wireless Networks
Susan Webb Edith Cowan University
Follow this and additional works at: https://ro.ecu.edu.au/theses_hons
Part of the Digital Communications and Networking Commons
Recommended Citation Recommended Citation Webb, S. (2003). Wireless Local Area Network Security : An Investigation Into Security Tool Usage In Wireless Networks. https://ro.ecu.edu.au/theses_hons/241
This Thesis is posted at Research Online. https://ro.ecu.edu.au/theses_hons/241

Edith Cowan University
Copyright Warning
You may print or download ONE copy of this document for the purpose
of your own research or study.
The University does not authorize you to copy, communicate or
otherwise make available electronically to any other person any
copyright material contained on this site.
You are reminded of the following:
Copyright owners are entitled to take legal action against persons who infringe their copyright.
A reproduction of material that is protected by copyright may be a
copyright infringement. Where the reproduction of such material is
done without attribution of authorship, with false attribution of
authorship or the authorship is treated in a derogatory manner,
this may be a breach of the author’s moral rights contained in Part
IX of the Copyright Act 1968 (Cth).
Courts have the power to impose a wide range of civil and criminal
sanctions for infringement of copyright, infringement of moral
rights and other offences under the Copyright Act 1968 (Cth).
Higher penalties may apply, and higher damages may be awarded,
for offences and infringements involving the conversion of material
into digital or electronic form.
Wireless local area network security:
an investigation into
security tool usage
in wireless networks
A thesis submitted in partial fulfilment of the
requirements for the degree of
Bachelor of Science Honours
(Computer Science)
School of Computer and Information Science,
Edith Cowan University,
Perth, Western Australia
Student:
Student Number:
Supervisors:
Submission Date:
Susan Webb
Dr Thomas O'Neill
Craig Valli
July 2003

Abstract
Many organisations and individuals installing wireless local area networks
(WLANs ), which are based on the IEEE 802.11 b standard, have little
understanding ofthe security issues that surround this technology.
This study was initiated to determine how WLAN security issues affect
organisations in Perth, Western Australia. The scope of the study was
restricted to 802.llb WLANs operating in infrastructure mode, where all
traffic is transmitted by wireless access points (APs).
This study was conducted in two phases. The general aims of the first
phase were to determine the number of detectable WLANs in the Perth
Central Business District (CBD) and subsequently, the percentage of them
that have enabled Wired Equivalent Privacy (WEP). Additionally, phase 1
was able to show how many WLANs were still using the manufacturer's
default settings and how the network devices may be grouped according to
manufacturt!r.
The general aims of the second phase were to find out if the IT managers of
various Perth organisations were aware of the security issues related to
WLANs and to find out the degree to which the security tools and
processes have been implemented. These aims were also achieved and in
addition, anecdotal infonnation was collected and analysed.
The results of this study indicate that in the Perth CBD, the majority of
those persons responsible for the implementation and management of
wireless networks are aware of the problems and have taken steps to secure
their netwo;ks.
II

USE OF THESIS
The Use of Thesis statement is not included in this version of the thesis.

Declaration
I certify that this thesis does not, to the best of my knowledge and belief:
(i) incorporate without acknowledgement any material previously
submitted for a degree or diploma in any institution of higher
education;
(ii) contain any material previously published or written by another
person except where due reference is made in the text; or
:::,~oDate:
Susa Wet·b
Ill

Acknowledgements
I would like to take this opportunity to acknowledge and thank all the
people who have assisted me in this work.
I am especially grateful to my two supervisors - Dr Thontas O'Neill and
Craig Valli. Dr O'Neill was always willing and able to assist in any way, from
sourcing books to giving me invaluable grammar lessons. Craig generously
offered technical support and advice as well as obtaining the equipment
neces!'.ary for phase one of my study. He even built the antenna I used!
Big thanks also to all my fellow Honours students. The Honours lab was
generally a pleasant and fun place to work. Thanks guys! Thanks also to
Michael Collins (the Honours program coordinator) for setting up the Honours
lab and fostering our collaborative learning environment.
However the person I need to thank the most is my 10-year-old daughter,
Caitlin. Her patience with me during Jhis tough time was invaluable. I love you,
Caitie.
iv
Table of Contents
1. Introduction ............................................................................................................... l
1.1. The background to the study ......................................................................... 1
1.2. The significance of the study ........................................................................ 4
1.3. The purpose of the study ............................................................................... 7
1.4. Research questions ........................................................................................ 7
2. Review of the literature ............................................................................................. 8
2.1. Literature on the background of the study .................................................... 8
2.1.1. General information about the security ofWLANs .......................... 8
2.1.2. WEP flaws ....................................................................................... I 0
2.1.3. Detecting and/or attacking insecure WLANs ................................. 15
2.2. Literature on previous findings ................................................................... 16
2.2.1. Findings similar to phase 1 of this study ......................................... 17
2.2.2. Findings similar to phase 2 of this study ......................................... l7
2.3. Specific studies similar to the current study ............................................... 17
2.4. Literature on the research methodology ...................................................... 18
2.4.1. Inductive Research .......................................................................... 18
2.4.2. Interview Surveys ............................................................................ 19
3. Research Methodology ........................................................................................... 21
3.1. Phase 1 ........................................................................................................ 21
3.1.1. Surveytargets .................................................................................. 21
3.1.2. Specific equipment used ................................................................. 22
3.1.3. Procedure ......................................................................................... 23
3.1.4. Data analysis ................................................................................... 25
3.2. Phase 2 ........................................................................................................ 27
3.2.1. Survey targets .................................................................................. 27
3.2.2. Equipment and instruments ............................................................. 27
3.2.3. Procedure ......................................................................................... 28
3.2.4. Data analysis ................................................................................... 30
4. Results and Findings ............................................................................................... 31
4.1. Phase 1 results ............................................................................................. 31
4.1.1. Preliminary scans ............................................................................ 33
4.1.2. Scan 1 results .................................................................................. 33
4.1.3. Scan 2 results .................................................................................. 36
4.1.4. Scan 3 results .................................................................................. 38
v

4.1.5. Scan 4 results .................................................................................. 40
4.1.6. Scan 5 results .................................................................................. 42
4.1. 7. Unique networks detected ............................................................... 44
4.1.8. Scans summary ............................................................................... 51
4.1.9. Comparison of results to other resear\.h .......................................... 58
4.2. Phase 2 results ............................................................................................. 62
4.2.1. Question 1 results ............................................................................ 63
4.2.2. Question 2 results ............................................................................ 65
4.2.3. Question 3 results ............................................................................ 68
4.2.4. Question 4 results ............................................................................ 69
4.2.5. Question 5 results ............................................................................ 69
4.2.6. Question 6 results ............................................................................ 69
4.2.7. Question 7 results ............................................................................ 70
4.2.8. Qut:stion 8 results ............................................................................ 71
4.2.9. Question 9 results ............................................................................ 72
4.2.10. Question 10 results .......................................................................... 75
4.2.11, Question II results .......................................................................... 76
4.2.12. Question 12 results .......................................................................... 78
4.2.13. Anecdotal responses ........................................................................ 82
4.2.14. Phase 2 summary data ..................................................................... 92
5. Discussion ............................................................................................................... 94
6. Conclusion .............................................................................................................. 96
7, Further Study ........................................................................................................... 98
References ....................................................................................................................... 99
Appendix A -Definitions oftenns ................................................................................ 103
Appendix B- Research documents .............................................................................. 107
Initial letter sent to candidates .............................................................................. 108
Covering letter given to respondents .................................................................... 109
Respondent consent form ...................................................................................... 110
Interview survey instrument. ................................................................................. 111
Appendix C- Final scan route for phase 1 ................................................................... 116
vi

List of Figures
Figure 1 -Projected number ofwirele:>s internet users in 2005 ............................. 2
Figure 2- WEP enciphennent block diagram ...................................................... ll
Figure 3 -The wheel of science .......................................................................... 18
Figure 4- Laptop used for phase 1 scans ............................................................ 23
Figure 5 -Antenna used for phase 1 scans .......................................................... 23
Figure 6 -Networks by network type (unique networks) .................................... 45
Figure 7 -Infrastructure networks with or without WEP enabled ..................... .46
Figure 8 -Infrastructure networks with or without masked SSID, and with WEP enabled ......................................................................................................... 46
Figure 9- Infrastructure networks with or without a default SSID, and with or without WEP enabled ................................................................................... 47
Figure 10- Total networks detected ..................................................................... 51
Figure 11- Box plot of networks detected ........................................................... 52
Figure 12- Infrastructure networks detected ................................... , ................... 53
Figure 13- Box plot of infrastructure networks detected .................................... 54
Figure 14- Networks by network type (summary) .............................................. 55
Figure 15- Infrastructure networks with or without WEP enabled (summary) .. 56
Figure 16 -Infrastructure networks with or without masi:ed SSID and with WEP enabled (summary) ...................................................................................... 57
Figure 17- Infrastructure networks with or without default SSID and with or without WEP (summary) .................................. , .......................................... 57
Figure 18- Comparison of scan resultS showing WEP enabkd .......................... 60
Figure 19- Overall number of network nodes .................................................... 63
Figure 20- Organisations with WLANs .............................................................. 64
Figure 21- Number of nodes for organisations with WLANs ............................. 64
Figure 22 -Organisations that do not intend to implement or test WLAN technology, by organisation type ................................................................. 71
Figure 23 - Reasons for not using WLAN technology (other than security) ....... 81
vii

List of Tables
Table 01- Results of telephone calls to candidates ............................................. 29
Table 02 -Networks by network type (scan 1) .................................................... 33
Table 03- Infrastructure only networks (scan 1) ................................................ 34
Table 04- Networks by manufacturer (scan 1) .................................................... 35
Table 05 -Networks by network type (scan 2) .................................................... 36
Table Of!- Infrastructure only networks (scan 2) ................................................ 36
Table 0'7- Networks by manufacturer (scan 2) .................................................... 37
Table 08 -Networks by network type (scan 3) .................................................... 38
Table' 09- Infrastructure only networks (scan 3) ................................................ 38
Table 10- Networks by manufacturer (scan 3) .................................................... 39
Table 11 -Networks by network type (scan 4) ................................................... .40
Table 12- Infrastructure only networks (scan 4) ............................................... .40
Table 13- Networks by manufacturer (scan 4) ................................................... .41
Table 14 -Networks by network type (scan 5) .................................................... 42
Table 15- Infrastructure only networks (scan 5) ............................................... .42
Table 16- Networks by manufacturer (scan 5) ................................................... .43
Table 17 -Networks by network type (unique networks) ................................... .44
Table 18- Infrastructure only networks (unique networks) ............................... .45
Table 19- Networks by manufacturer (unique networks) .................................. .47
Table 20- Infrastructure networks with or without WEP, by manufacturer ...... .48
Table 21 -Infrastructure networks with masked SSID and with WEP enabled, by
manufacturer ................................................................................................ 49
Table 22- Infrastructure networks with default SSID and without WEP enabled,
by manufacturer .................. ""''''"'''''"'''"'""··"·····""·····"·""'··"""''"'"''''' 50
Table 23 -Total networks detected ...................................................................... 51
Table 24- Summary of total networks detected .................................................. 52
Table 25- Infrastructure networks detected ......................................................... 53
Table 26- Summary of infrastructure networks detected .................................... 53
Table 27 -Networks by network type (summary) ............................................... 55
Table 28- Infrastructure only networks (summary) ............................................ 56
Table 29- Results ofWWWD1 ........................................................................... 58
Table 30- Results of W WWD2 ............................................................................ 59
Table 31 -Respondent organisation classification ............................................... 62
Table 32- Do you have a WLAN? ...................................................................... 63
viii

Ta-ble 33 -Information source statistics ............................................................... 68
Table 34- Sources of information regarding WLAN security ............................ 69
Table 35 -Additional security tools employed .................................................... 70
Table 36- Infonnation source statistics ............................................................... 75
Table 37 -Sources of information regarding WLAN security ............................ 76
Table 38- Other reasons for not using WLAN technology (other than security)
" .... " ........................... " ..... " .... "" .... "" .. "" ... " ..................... "" ........ " ............ 80
Table 39- Sources ofinfonnation regarding WLAN security ............................ 93
ix
1. Introduction
1.1. The bac'kground to the study
Wire1es5 Local Area Networks (WLANs) may be deployed by
organisations who want to network devices such as desktop computers,
laptop computers and personal digital assistants (PDAs). WLANs may
also be implemented in situations where cabling is difficult or impossible
or where there are restrictive covenants on making structural changes to
the building, for example a heritage listed building.
802.11b WLANs are wireless networks that are made up of components
that confonn to the 1999 IEEE 802.11 b standard They are also known as
Local Area Wireless Networks or LAWNs. 802.llb components operate
in the 2.4 GHz radio frequency and typically have a range of 50 to 65
metres indoors (Kershaw, 2002). This range increases to 400 metres in an
open or outdoor area (Karygiannis & Owens, 2002). With the addition of
a high-gain antenna and an amplifier, the outdoor range can extend to 32
kilorn.etres (Maxim & Pollino, 2002, p. 48).
WLANs may operate in either infrastructure or ad hoc mode.
Infrastructure mode is where all network traffic is transmitted by wireless
access poir.~s (APs). These access points are connected to other network
devices such as servers. Ad hoc mode is where the wireless network cards
talk directly to each other without going through an access point.
The scope of this study has been restricted to 802.11 b WLANs that are
operating in infrastructure mode.
The Gartner Group (cited in Barnes et al., 2002, p. 4) has predicted (with a
0.7 probability) that by 2005, 50 percent of Fortune 100 companies will
have deployed wireless LANs that will operate in either infrastructure or
ad hoc mode.
Figure 1 below shows the projected number of wireless Internet users in
2005 as predicted by the Yankee Group (cited in Barnes et al., 2002, p. 4).
·_(/

500
- 400 0 c :g
300 ~
E .E - 200 !!! " 0
::> 100
0
195.2
North
America
466 7
313.3
118.7 86
Europe Asia Latin Africa and
America Middle East
Figure 1 ~ Projected number of wireless internet users in 2005
WLANs are becoming popular because:
• they improve the productivity of staff (Wireless LAN Benefits Study,
2001);
• the hardware required is relatively inexpensive compared to traditional
fixed networks (Intel, 2001; Ellison, 2002; Young, 2001);
• no cabling is needed. Installation problems in locations where network
cabling would be difficult or impossible are thereby overcome. For
example, a building may have restrictive covenants that would prevent
the tenants from making structural changes such as drilling holes in
walls;
• they are easier to set up out-of-the-box than wired networks (Ellison,
2002);
• they improve the portability of components like laptop computers
(Verisign, 2002); and
• they improve the expandability of a network as additional users and
access points may be added easily (Whitney, 2001).
2

WLANs usc radio frequency (RF) signals to transmit and receive data. As
is the nature of RF, the signals arc broadcast in an cmnidircctional pattern
into the ether. Many people believe that data transmitted by an access
point stops when it encounters a physical barrier such as a wall or window
(Ellison, 2002; Mills, 2002). The wireless transmission medium contrasts
with traditional wired networks where the data signals arc conveyed via
cables that arc protected by the physical boundaries and access controls of
the building. The differences bct\vecn wireless and wired networks mean
that WLANs suffer from security concerns, such as eavesdropping and
bandwidth theft, that arc not readily present in wired networks.
Several types of attacks may be perpetrated against WLANs. The most
basic is a passive attack that exploits the situation where a large number of
WLAN administrators have not enabled the default security (Ellison,
2002). There is currently no way to detect someone who is passively
monitoring your network (Savage, 2001). An active alt~lck takes
advantage of the flaws in the built-in Wired Equivalent Privacy (WEP)
encryption. These flaws a~!ow attackers to connect, perhaps unnoticed, to
a WLAN in order to read, modify or inject data onto the network. To
detect the presence of a h~cker., the network administrator wou!d require a
"properly laid-out network and direction-finding equipment" otherwise an
attacker could remain "anonymous and hidden anywhere in the wireless
coverage area" (Maxim & Pollino, 2002, p. 54).
WLANs arc susceptible to 'man-in-the-middle' (MITM) attacks plus
Denial of Service (DoS) and flooding attacks. MITM attacks occur where
malicious users logically situate themselves between a source and a target
(Barnes eta\., 2002, p. 33). Maxim and Pollino (2002, p. 49) describe the
MITM attack as follows: ''The attacker sends out unsolicited ARP
(Address Resolution Protocol] replies to target stations on the [W]LAN.
The targets will send all traffic to the attacker instead of the intended
destination and the attacker wilt then fonvard the packets to their
originally intended destination".
DoS and flooding attacks in WLANs may be trigg1~red deliberately or
accidentally. Two ways that the network may be deliberately rendered
3
useless are by an attacker flooding the WLAN with tra·asmissions or by
hijacking an access point.
Accidental OoS events may be triggered by having too many WLANs in a
small area or by interference from other devices operating at the same
frequency, for example cordless phones and microwave ovens (Barnes et
a!., 2002, p. 226).
In summary, insecurely configured WLANs present a threat to the
confidentiality, availability and integrity of network data. Unless a bn.:·lch
is detected, risks may go unnoticed by many WLAN operators due to a
lack of awareness of security issues.
1.2. The significance of the study
WLAN security is a significant issue in the context of computer and
network security, in that the data of some orga11isations may be at risk due
to a lack of awareness of WLAN security implications. Discovering how
these issues affect organisations in the Perth CBD is the main objective of
this study. Couzins (2002) states that security experts are concerned at the
"disparity between the amount of wireless network activity in the
corporate community and the low level of awar('ncss of the vulnerability
of radio local area networks".
Many of the features that make WLANs appealing give rise to major
security concerns: for example, because of the ease with which WLANs
may be installed, non-technical staff may implement them without having
any understanding of the security implications. In Australia, Mills (2001)
cites that around 60 percent of organisations running WLANs have not
enabled the standard's built-in WEP encryption. As Mackenzie (2002a,
p.l) s:atcs "Many organisations arc enjoying the benefiis of wireless
technology without fully understanding the new network security issues it
raises".
Even with WEP encryption enabled, a network may be at risk because that
encryption may be cracked in less than 15 minutes (WEP: ready in 15
minutes, 2001; AirSnort Tool Cracks WEP in 15 minutes, 2001) though in
practice it generally takes several hours to capture enough data to be able
to crack WEP. Requiring WEP does however raise the minimum skill
4

level that is needed to intercept and read wireless data (Andress, 2002) and
WEP "remains an adequate mechanism for [the] prevention of casual
eavesdropping" (Wireless DeMilitarized Zone (WDMZ), 2002).
Security problems arise when a default or out·of-the-box installation is
performed because the vendor's default settings generally sacrifice
security in favour of functionality and ease of installation (Cohen, 2001;
De Spiegeleire, 2001; Wireless LANs unprotected in London, 2002}.
Mills (2001) gives the following as examples of default settings that are
detrimental to the security of a network:
• The default network name of many wireless access points is the
vendor name.
• The default encryption key for every vendor is available on the
Internet.
Out-of.the-box installations are commonplace according to Barnes et ul.
(2002, p. 204) who noted that when people install new equipment they
generally do just enough to make it work and then never touch it again
once it is operational. Barnes has found that "nearly 40 percent of
WLANs had yet to change their configuration from the factory default"
(ibid, 2002, p. 315).
Another major issue arises where the WLAN is connected to an internal
wired network, creating a hybrid network of wireless and wired
components. Logically interfacing wireless access points with an existing
wired network could open up the extended system to wireless hackers
(Stewart, 2000). The ease with which WLANs may be installed has meant
a number of unauthorised or 'rogue' WLANs being implemented by users
in some organisations, without the knowledge of the systems
administrators (Leyden, 2001; Brewin, 2002). Most networks rely on
firewalls for perimeter security and "are not prepared for an attack from an
insider" (Maxim & Pollino, 2002, p.54).
'Rogue' access points may also be set up by attackers. The legitimate
users of the WLAN might "unknowingly connect to this false AP and
divulge sensitive credentials such as authentication information" (Maxim
& Pollino, 2002, p.54}. An example of an attacker setting up a rogue
access point was reported in October 2002 (Cox, 2002}. The access point,
5

which was situated outside a building, ~1ppeared as an official access point
on the corporate wireless LAN.
Very little expenditure or technir.al knowledge is required to attack a
WLAN, as many of the tools are inexpensive and readily available, for
example, antennae can be made using empty potato chip containers or tin
cans by following instructions available on the Internet (Fiickenger, 2001).
Such attacks usually employ a technique known as "war driving" (Shipley
2001). The origin of this term is a practice called "war dialling" where an
attacker dials a range of phone numbers until a modem answers (Andress,
2002).
Essentially, war driving transpires when an attacker connects the required
tools and then drives around in his or her car attempting to locate WLANs.
According to Gast (2002), such location is easy. At regular intervals, the
network's wireless access points send unencrypted broadcast messages,
called beacon management frames, which contain network information.
Depending on the strength of the signal and the range of the antenna, these
frames may be detected from up to 30 kilometres away (Pollino, 2002).
In August 2002, a war driver from Western Australia conducted a war
flying experiment during which he flew a small plane at an altitude of 500
metres above the city of Perth. During this experiment, he detected 187
wireless access points (Brewin, 2002).
The tools that are required to perpetrate an attack are:
• a laptop computer;
• a wireless network interface card;
• some software e.g. Netstumbler;
• an antenna; and
• a global positioning system (GPS) device (optional).
This research is significant because there has been an increase in the usage
and reliance on wired and wireless networks. The commercial
confidentiality of some organisations may be at risk due to their lack of
awareness ofWLAN security implications.
6
1.3. The purpose of the study
It was hoped that the study would provide groundwork for higher level
study, therefore it was conducted using inductive research methodologies
(see section 2.4.1 and Appendix A). The study was conducted in two
distinct phases.
By conducting the first phase of the study, it was possible to detect the
presence or absence ofWLANs operating in the Perth CBD (see Appendix
C for scan route) and to detennine the percentage of those detectable
networks that have the built-in WEP encryption enabled.
The second phase of the study detennines the level of knowledge of
WLAN security issues in selected (see section 3.2.1) Perth organisations.
The results of each phase were then compared to the results of other
studies that were similar to the current study (see sections 2.2.1 and 2.2.2).
The results of the research will give an overall picture of the state of
WLAN security in Perth.
1.4. Research questions
As this was an inductive study (see 2.4.1 and Appendix A}, no specific
hypothesis was being tested. However, some general questions were
answered during the two phases of the study.
Phase 1:
• How many 802.11 b WLANs are detectable in the Perth CBD?
• What is the percentage of detectable infrastructure-mode WLANs
that have enabled the WEP encryption?
Phase 2:
• Are IT managers aware of the full extent of the security issues
related to WLANs?
• To what degree have the appropriate and readily available security
tools and processes been implemented?
7
(_;
2. Review of the literature
2.1. Literature on the background of the study
The number of texts that have been published regarding the security of
wireless networks is small but increasing. Several books have described
the security issues relating to wireless technology. However, a large part
of'Theitcontent concerns technology that is not relevant to this study, for
example cellular telephone technology. The author has been able to
identify only three texts written specifically about the security of wireless
LAN technology, and has only been able to gain access to one. This text is
discussed in section 2.1.1 below. The remaining background information
was discovered in hard copy or electronic journals and on Internet sites.
The background literature may be separated into three categories:
• general infonnation about the security ofWLANs;
• information on the flaws in the WEP encryption algorithm; and
• infonnlition related to the tools and techniques used for detecting
and possibly attacking WLANs.
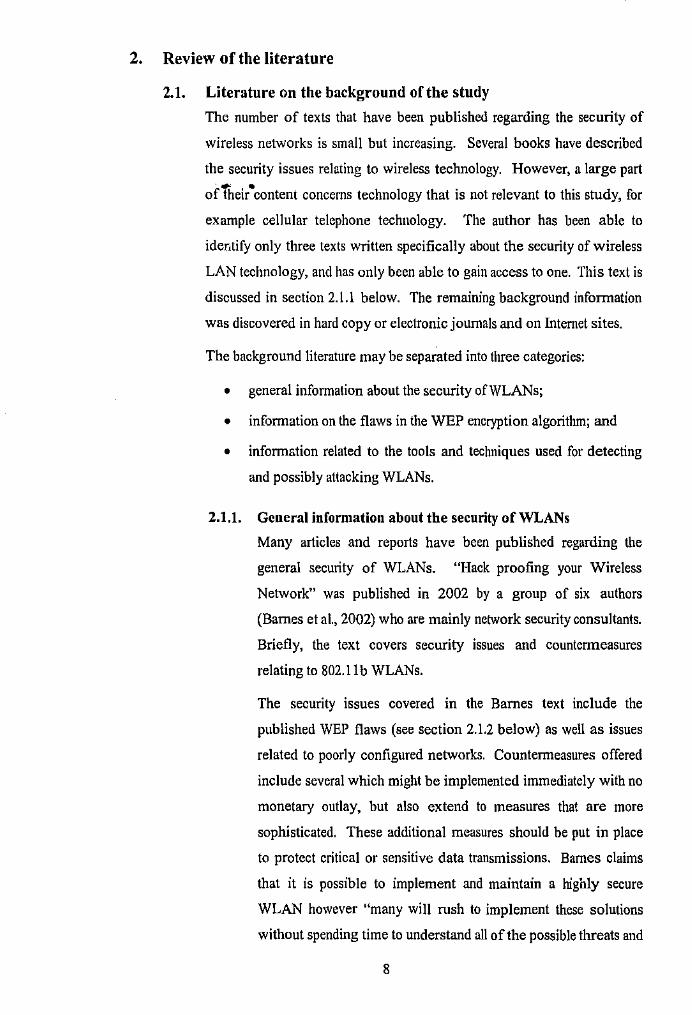
2.1.1. General information about the security ofWLANs
Many articles and reports have been published regarding the
general security of WLANs. "Hack proofing your Wireless
Network" was published in 2002 by a group of six authors
(Barnes et at., 2002) who are mainly network security consultants.
Briefly, the text covers security issues and countermeasures
relating to 802.llb WLANs.
The security issues covered in the Barnes text include the
published WEP flaws (see section 2.1.2 below) as well as issues
related to poorly configured networks. Countermeasures offered
include several which might be implemented immediately with no
monetary outlay, but also extend to measures that are more
sophisticated. These additional measures should be put in place
to protect critical or sensitive data transmissions. Barnes claims
that it is possible to implement and maintain a highly secure
WLAN however "many will rush to implement these solutions
without spending time to understand all of the possible threats and
8
security precautions that should be taken to mitigate them. As a
result, misconfigurations will likely result in the downfall of
security ... " (Barnes et al., 2002, p. 33)
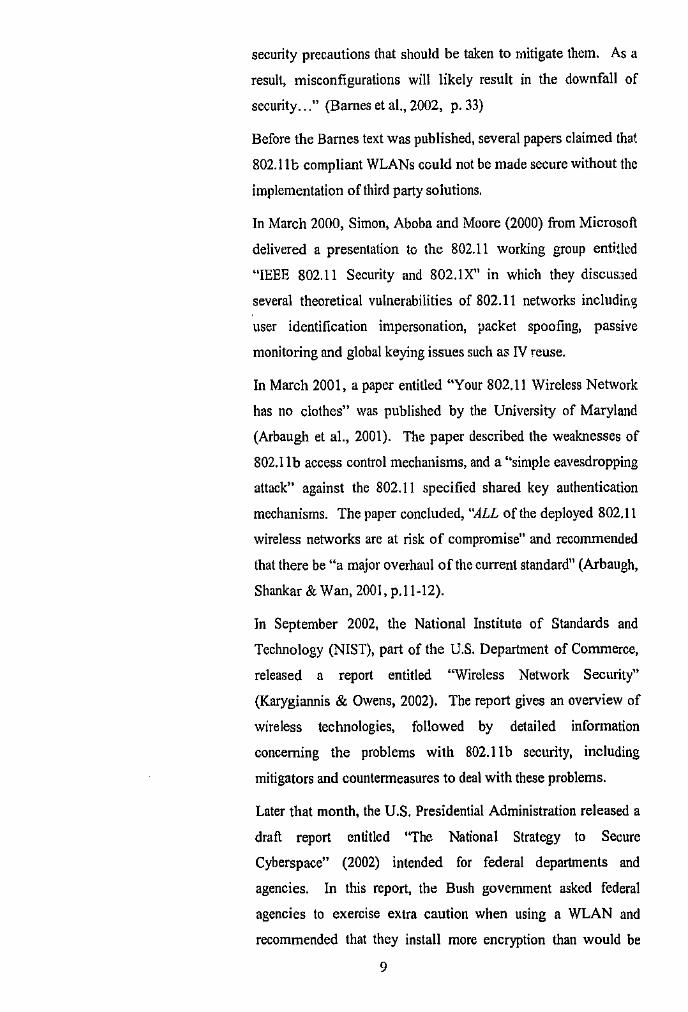
Before the Barnes text was published, several papers claimed that
802.111:; compliant WLANs could not be made secure without the
implementation of third party solutions.
In March 2000, Simon, Ababa and Moore (2000) from Microsoft
delivered a presentation to the 802.11 working group entitled
"IEEE 802.11 Security and 802.1X" in which they discus.3ed
several theoretical vulnerabilities of 802.11 networks including
user identification impersonation, packet spoofing, passive
monitoring and global keying issues such as IV reuse.
In March 2001, a paper entitled "Your 802.11 Wireless Network
has no clothes" was published by the University of Maryland
{Arbaugh et al., 2001). The paper described the weaknesses of
802.11 b access control mechanisms, and a "simple eavesdropping
attack" against the 802.11 specified shared key authentication
mechanisms. The paper concluded, ''ALL of the deployed 802.11
wireless networks are at risk of compromise" and recommended
that there be "a major overhaul of the current standard" (Arbaugh,
Shankar & Wan, 2001, p.ll-12).
In September 2002, the National Institute of Standards and
Technology (NIST), part of the U.S. Department of Commerce,
released a report entitled "Wireless Network Security"
(Karygiannis & Owens, 2002). The report gives an overview of
wireless technologies, followed by detailed information
concerning the problems with 802.11b security, including
mitigators and countenneasures to deal with these problems.
Later that month, the U.S. Presidential Administration released a
draft report entitled ''The National Strategy to Secure
Cyberspace" (2002) intended for federal departments and
agencies. In this report, the Bush government asked federal
agencies to exercise extra caution when using a WLAN and
recommended that they install more encryption than would be
9

necessary on a wired network. The report referred to the NIST
document and recommended that "agencies . . . carefully review
the recent NIST report on the use of wireless technologies and
take into account NIST recommendations and findings".
Several papers have recommended the implementation and usage
of Demilitarised Zones (DMZs) together with Virtual Private
Network (VPN) technology to secure WLANs. A frequently
recommended solution is to place all of the wireless access points
in a de~militarised zone (DMZ) which is then attached to a Virtual
Private Network (VPN) server (Stewart, 2000; Lancaster, 2002;
Intel, 2001; Szerszen, 2001). Gartner recommends that
organisations use VPNs on all WLAN connections (Leyden,
2001).
Webb (2002) found that "using a DMZ solves the problem of
opening up the wired network to wireless hackers while the VPN
technology is used to improve the authentication and encryption
of network data, thus solving the problems with WEP. This
combined solution is preferable to adding encryption on its own
as the encryption is integrated into the product and is generally
invisible to the end user."
2.1.2. WEP flaws
The 802.11 b standard defines the WEP algorithm as "a fonn of
electronic codebook in which a block of plaintext is bit~wise
XORed with a pseudorandom key sequence of equal length. The
key sequence is generated by the WEP algorithm" (cited in
Barnes et al., 2002, p, 205). XOR or "exclusive or" is a
mathematical operator that returns true if one and only one of its
operands is true. The key sequence generation process may be
seen below in Figure 2 taken from Barnes et al. (2002, p. 205).
10

Initialisation Vector(IV)
Secret key
I .G "''
Key Sequence
{~-PRNG
XOR !-----<
II
'-
Figure 2M WEP encipberment block diagram
IV
Ciphertext
Message
WEP vl.O was designed to use static 40~bit keys; this is generally
referred to as 40-bit WEP. The restriction on the key length was
imposed because WEP vl.O was developed at a time when the US
Government treated the export of encryption software in the same
way as it treated the export of weapons of mass destruction (Gast,
2002). At that time, the longest exportable key length was 40
bits. WEP v2.0 allows for key sizes up to 104 bits. WEP v2.0 is
often referred to as 128~bit WEP but this name is misleading. It
infers that the encryption key will be 88 bits longer than a 40-bit
WEP key. In fact it is only 64 bits longer because 24 bits of the
128~bit WEP key are the initialisation vector (IV). With 40~bit
WEP, the bits of the IV have not been included in the bit count.
If 40-bit WEP is used, then a 40~bit secret key is combined with a
24~bit initialisation vector (IV) to create a 64~bit RC4 key. If SO·
called 128~bit WEP is used, then a 104~bit secret key is combined
with a 24~bit N to create a 128~bit RC4 key. The RC4 key is
used to seed the pseudo-random number generator that generates
a keystream equal to the length of the frame body plus the IV.
The keystream is then XORed with the frame body and the IV to
11

encipher it. The IV is placed in plaintext in the header of the
frame, as the receiver must know the IV in order to decipher the
m~ssage.
Many papers detailed problems with the WEP encryption
protocol. The main design goal of the WEP protocol was to
provide data privacy to a level equivalent to that of a wired
network (WEP Security Statement, 2001). Several authors have
demonstrated that this goal has not been met.
In October 2000 Jesse Walker from Intel Corporation published
"Unsnfe at any key size; an analysis of the WEP encapsulation".
Walker stated that the "802.11 design community ... repeatedly
suggests, asserts and assumes" the notion that WEP may be made
safe by increasing its key size from 40 bits to 128 bits. He
demonstrated that this assumption is invalid because the problem
is with the initialisation vector (IV), not the key length. "It is
infeasible to achieve privacy with the WEP encapsulation by
simply increasing the key size" (Walker, 2000). Walker pointed
out that the main weakness of WEP is the fact that it reinitialises
the encrypted data stream every time a data collision occurs.
Someone eavesdropping on wireless communications may
capture the initialisation vector (IV) infonnation transmitted with
each frame and, in a matter of hours, have all the data needed to
recover the WEP key. The NIST paper 'Wireless Network
Security' (Karygiannis & Owens, 2002) described this problem:
"The IV is part of the RC4 encryption key. The fact that an
eavesdropper knows 24-bits of the packet key, combined with a
weakness in the RC4 key schedule, leads to a deadly analytic
attack that recovers the key after intercepting and analysing only a
relatively small amount of traffic".
In January, 2001 a paper published by a team from the University
of California at Berkeley documented several security flaws in the
WEP protocol "stemming from misapplication of cryptographic
primitives" (Borisov et al., 2001). This paper showed several
practical attacks that demonstrated why the RC4 stream cipher
12

was a poor algorithm choice for encrypting wireless
communications, and that using a CRCM32 checksum, designed to
detect random errors in a message, is not suitable for the detection
of intentional modifications to messages. The authors felt that
RC4 and CRCM32 were chosen for their speed and ease of
implementation and that the security community was not
consulted regarding the suitability of using them.
In response to publications describing the research done at the
University of Maryland and at Berkeley, Steve Bellovin, who is a
security expert and researcher at AT&T Labs stated "the security
breaches discovered by the two universities are 'minor' because it
would take a fairly sophisticated intruder to exploit them" (cited
in Miller, 2001, p.l8). In tum, his statement was soon shown to
be false.
In August 2001, three scientists, from Cisco and the Weizmann
Institute in Israel, published a paper entitled "Weaknesses in the
Key Scheduling Algorithm ofRC4" (Fluhrer et al., 2001). Their
paper described two significant weaknP.sses in the Key
Scheduling Algorithm (KSA) of RC4 upon which WEP is based.
The KSA is the mechanism that extends a short key into a key the
length of the frame body. The first weakness is the existence of
"large classes o. weak keys". These classes occur when certain
values of the IVs allow an attacker to reconstruct the encryption.
The second weakness is related to the first and applies when part
of the key is exposed to an attacker. As the IV is transmitted in
plaintext in every WEP packet, an attacker knows at least 24-bits
of each RC4 key.
The paper goes on to describe a theoretical ciphertext Monty attack
based on these two weaknesses in the KSA. This theoretical
attack is described by Schenk et al. (2001) as being "completely
passive and therefore impossible (currently] to detect".
The theoretical attack, described by Fluhrer et al. in their
"Weaknesses in the Key Scheduling Algorithm of RC4" paper,
was soon realised by staff of the AT&T Labs in New Jersey, who
13

successfully implemented an attack based purely on their
description. The AT&T Labs researchers felt that the designers of
the WEP protocol "did not have a strong grounding in
cryptography and security" and were not aware of the
recommendations of the developers of RC4 regarding its correct
implementation (Stubblefield et al., 2001).
Though the researchers did not release their source code, tools for
breaking WEP keys, based on the Fluhrer, Mantin and Shamir
attack, were soon publicly available. One of these tools is called
"AirSnort". It has been reported to be capable of retrieving a 128-
bit WEP key in fifteen minutes. In September 2001, the Wireless
Ethernet Compatibility Alliance (WECA), the developers of
WEP, released a statement acknowledging the results of the work
of the researchers from Berkeley and AT&T and recommended
that organisations implement VPN technology to secure their
WLANs (WEP Security Statemen~ 2001).
It is generally understood within the IT community that the three
goals of computer security are confidentiality, integrity and
authenticity. Gast (2002, p.89} points out that WEP fails to meet
all of these goals. Confidentiality cannot be assured because of
flaws in the RC4 encryption cipher. Integrity cannot be assured
because the integrity check used is only efficient at detecting
single-bit errors. Authenticity cannot be assured because the
authentication that occurs is of the Media Access Control (MAC)
address of the device, not the actual user. A MAC address is an
address that, theoretically, uniquely identifies each hardware node
of a network.
At the end of October, 2002 the WiFi Alliance, formerly known
as WECA, released a press statement announcing that it was
developing a standards-based security solution to replace WEP
(WiFi Alliance Announces Standard, 2002). Originally called
WEP2 and then TKIP, WiFi Protected Access (WPA) has taken
the sections of 802.1li that are ready for deployment and may be
implemented in software. This is an interim measure designed to
14
bridge the gap left by WEP while the IEEE continue to work on
the forthcoming 802.lli standard, itself due for release in late
2003.
Even though WPA has not been releaseti, c>. vulnerability has
already been identified that will make WPA susceptible to a
particular type of Denial of Service (DoS) attack (Batista, 2002).
This attack is executed by a perpetrator sending just two packets
of unauthorised data within a one-second period. The system
believes itself to be under attack and shuts itself down (The
Michael Vulnerability, 2002)
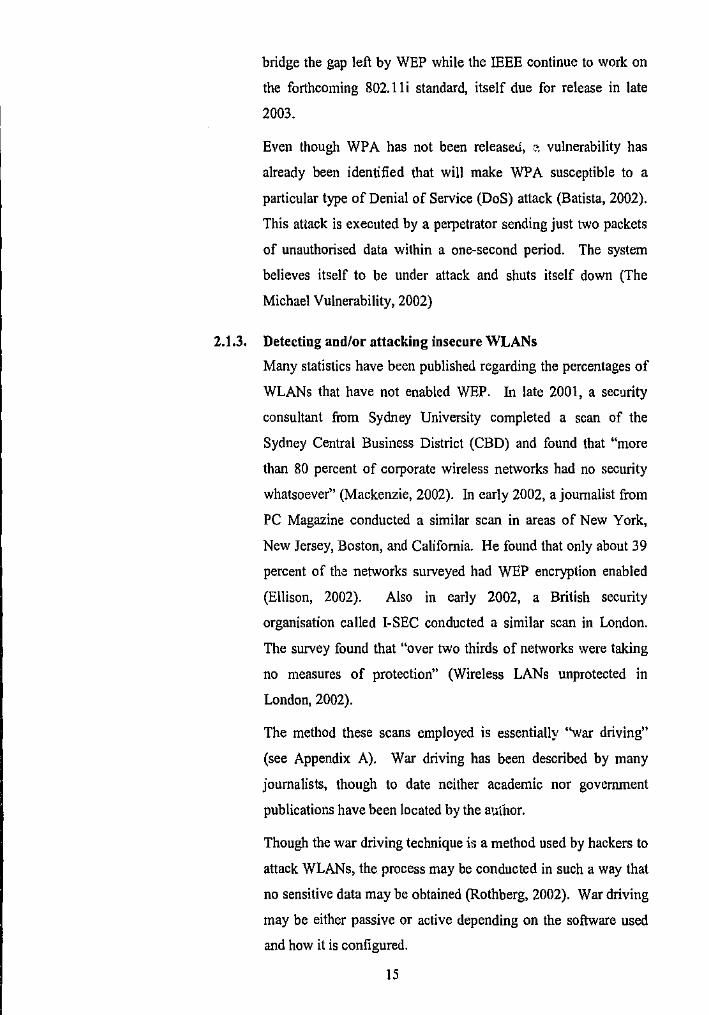
2.1.3. Detecting and/or attacking insecure WLANs
Many statistics have been published regarding the percentages of
WLANs that have not enabled WEP. In late 2001, a security
consultant from Sydney University completed a scan of the
Sydney Central Business District (CBD) and found that "more
than 80 percent of corporate wireless networks had no security
whatsoever" (Mackenzie, 2002). In early 2002, a journalist from
PC Magazine conducted a similar scan in areas of New York,
New Jersey, Boston, and California. He found that only about 39
percent of the networks surveyed had WEP encryption enabled
(Ellison, 2002). Also in early 2002, a British security
organisation called I-SEC conducted a similar scan in London.
The survey found that "over two thirds of networks were taking
no measures of protection" (Wireless LANs unprotected in
London, 2002).
The method these scans employed is essentially "war driving"
(see Appendix A). War driving has been described by many
journalists, though to date neither academic nor govenunent
publications have been located by the a•;.thor.
Though the war driving technique is a method used by hackers to
attack WLANs, the process may be conducted in such a way that
no sensitive data may be obtained (Rothberg, 2002). War driving
may be either passive or active depending on the software used
and how it is configured.
15
--·---.' '"

For example, Netstumbler software may be used to detect the
presence ofWLANs; but it does not offer packet capture (Schenk
eta!., 2001).
Sniffing is a technique used to eavesdrop on network
communications. Gast (2002, p.S.) describes sniffing on a
wireless network, compared to sniffing on a wired network, as
being "much easier because the radio transmissions are designed
to be processed by any receiver within range". This range may be
anything up to 32 kilometres if the attacker has employed
antennae and amplifiers, which enable the attacker to be a
considerable distance away from the target during an attack
(Maxim & Pollino, 2002, p. 48).
Maxim and Pollino (ibid, p. 49) describe the primary goals of an
attacker as follows:
"The attacker needs to understand:-
• who uses the network;
• what is accessible;
• what the capabilities of the equipment on the network are;
• when it is used least and most; and
• what the coverage area is".
2.2. Literature on previous findings
To date, the author has been unable to locate any published results of
university or government research into the implementation and usage of
WLANs. However, several market research studies have been conducted.
In autumn, 2001, research was conducted by NOP World Technology on
behalf of CISCO Systems to detennine the levels of take-up of WLAN
technology and to provide "insight into the perceived benefits of wireless
LAN implementation" (Wireless LAN Benefits Study, 2001, p. 4). This
research found that 10 percent of U.S. organisations have either tested or
deployed WLAN infrastructure (ibid, 2001, p.4).
16
2.2.1. Findings similar to phase 1 of this study
In "an effort ... to generate awareness of the need by individual
users and companies to secure their access points" (Worldwide
War Drive FAQ, 2002), security professionals and hobbyists from
several countries took part in two separate large-scale WLAN
scans dubbed 'Worldwide War Drive I' (WWWDI) and
'Worldwide War Drive II' (WWWD2). The first scan took place
in early September and the second in late October, 2002. These
scans found that on average 29 percent of WLANs located had
not enabled the built-in encryption. See section 4.1.9 for a
comparison of the results from phase 1 of this study to the results
of the two Worldwide War Drives.
2.2.2. Findings similar to phase 2 of this study
In April 2002 SECURE Computing, which ts a UK-based
computer security magazine, conducted market research into
wireless security trends (Tullitt, 2002). There were 314
respondents to this study, most of whom were in computer
management roles. As it was a computer security magazine, it
may be deduced that the respondents have some prior knowledge
of computer security and were perhaps aware of the security
implications of using WLANs. See section 4.2 for a comparison
of the results of phase 2 of this study to the results of the
SECURE Computing market research.
2.3. Specific studies similar to the current study
At this time, neither academic nor government studies similar to the
current study are known; certainly no publications have been found.
However, other studies related to WLAN security are currently being
funded by the US Government's National Institute of Standards and
Technology - Critical Infrastructure Grants Program -Computer Security
Division. Research projects related to WLAN security are ~mder way at
the University of Pittsburgh and the University of Maryland (Computer
Security Grants Program, 2002).
The University of Pittsburgh study is looking at developing "a survivable
and secure wireless information architecture" while the University of
17

Maryland study is focusing on building "a secure wireless LAN/MAN
infrastructure test bed" (ibid, 2002).
2.4. Literature on the research methodology
2.4.1. Inductive Research
The methodology used in the study is based on an inductive
research approach in which the researcher does not begin with a
defined theory or hypothesis they wish to test. Instead, the
researcher develops theories from the analysis of research data.
This method may be used in new areas of research where
hypotheses are yet to be established. The inductive method
contrasts with the traditional scientific method that is based on a
deductive approach. Both methods are shown in Figure 3 -The
wheel of science (Babbie, 1992, p. 53).
Empirical
i5 (Geoer.>lisation.\
i= Observations Theories
~ \ z ~Hypotheses'~~-
Figure 3 -The wheel of science
f,1 g g 0 z
Babbie (1992, p.G4) defines induction as "The logical model in
which general principles are developed from specific
observations".
18

Trochim (2002) also describes the inductive process:
"In inductive reasoning, we begin with specific
observations and measures, begin to detect patterns
and regularities, formulate some tentative
hypotheses that we may explore, and finally end up
developing some general conclusions or theories".
This study uses the inductive approach to attempt to develop a
theory or hypothesis regarding the usage of security tools in
WLANs.
2.4.2. Interview Surveys
The data collected in phase 2 of the study was collected via an
interview survey that was created for this research. See section
3.2.2 for a discussion of criteria and limitations of the survey
instrument. An interview survey was preferred for this study
because ir.terview surveys generally achieve a much higher
respor.Je rate than self-administered questionnaires. Babbie
(1992, p.269) believes that interview surveys "ought to achieve a
completion rate of at least 80 to 85 percent".
Interviews were preferred as the researcher could be present to
rephrase questions where necessary, or to follow up on any
particular answer which needed to be explored further. Mitchell
and Jolley (1988, p.289) describe this additional interaction with
the respondent as "a tremendous asset in ... studies where you
haven't yet identified all the important variables".
One drawback of conducting interviews is that the research itself
cannot be anonymous (Babbie, 1992, p. 467). However, it may
be confidential in that the researcher promises that only the
researcher will know the identity of the respondent or the
respondent's organisation. It was important that this researcher
made it clear to the responclents that the survey was conducted
confidentially, not anonymously (ibid, 1992, p. 467). It was an
imperative of this particular study that respondents understood
19
.. ' ' ,_,,- ',-, ,--
that their data would be kept confidential, as any identifying data
might be used to attack a vulnerable WLAN.
Respondents might have been reluctant to reveal infonnation
about the configuration of their computer networks or may have
chosen to give answers that did not correspond to the actual
situation. Once assured that all information collected will be kept
confidential, and that no identifying information will be
published, the respondents may have been more comfortable in
answering the questions honestly. In addition, because the survey
was conducted in person, the respondents may have been more
likely to give honest answers (Mitchell & Jolley, 1988, p. 289).
Several authors discuss the problem of researcher bias when
conducting interviews (Sproull, 1988, p. 166; Mitchell & Jolley,
1988, p.289). As the researcher is present when the response is
made, it may seem necessary to guide the respondent towards an
answer. Any guidance may inadvertently be towards ideas that
are preconceived by the researcher, not the respondent.
This study is inductive and does not have ar.y specific theory or
hypothesis to test; therefore, the incidence of preconceived ideas
on the part of the researcher may be reduced. Close attention was
paid by the researcher to avoid leading respondents.
20
3. Research Methodology
The research was conducted in two phases. Phase 1 involved the scanning of
certain areas of the Perth CBD in an attempt to detect WLANs that were
operating. Phase 2 involved conducting survey interviews c,f IT Managers from
organisations located in the Perth CBD to detennine the levels of implementation
and usage of wireless networks. Each phase is discussed separately below.
3.1. Phase 1
3.1.1. Survey targets
The survey targets for phase 1 of the study were the detectable
WLANs operating in selected areas of the Perth CBD. Originally,
it was planned to scan only a small section of Perth. However,
after conducting preliminary scans, it was found that insufficient
numbers ofWLANs were detected in the CBD. After conducting
five preliminary scans, the greatest number of networks detected
on any one scan was six, with an average of2.8.
There may have been several factors contributing to the low
number of WLANs detected. The equipment may not have been
configured properly, the speed of the motor vehicle from which
the scans were conducted may have been too high, and/or the
structure of the buildings may have interfered with the signals.
There may also have been other reasons which are not apparent to
the author. As a result, it was decided that the scan area should be
expanded to include some outlying regions such as East Perth and
West Perth.
A map of the final scan route maybe found in Appendix C.
21

3.1.2. Specific equipment used
The laptop computer used for phase 1 (see Figure 4 below for
image) is as follows:
Manufacturer: ffiM ThinkPad 600E
Processor: 366mhz Pentium II
Memory: 96mb ofRAM
Operating System: Dual Boot system running both Windows 98
and Mandrake Linux v9.0
Wireless NIC: Cabletron Orinoco RoamAbout 802.11 DS
PC Card
Sniffing software: Netstumbler v0.3.30 (in Windows 98),
Kismet v. 2.6.0 (in Linux)
Antenna: A directional antenna made from a tin can
(see Figure 5 below for image). The
specifications for the antenna are given
below.
Antenna Specifications
Diameter: 85mm
Length: l75mm
Gain: 8-10 dbi
For construction details refer to "How to build a waveguide
antenna" at: www.tumpoint.net/wireless/cantennahowto.html
22
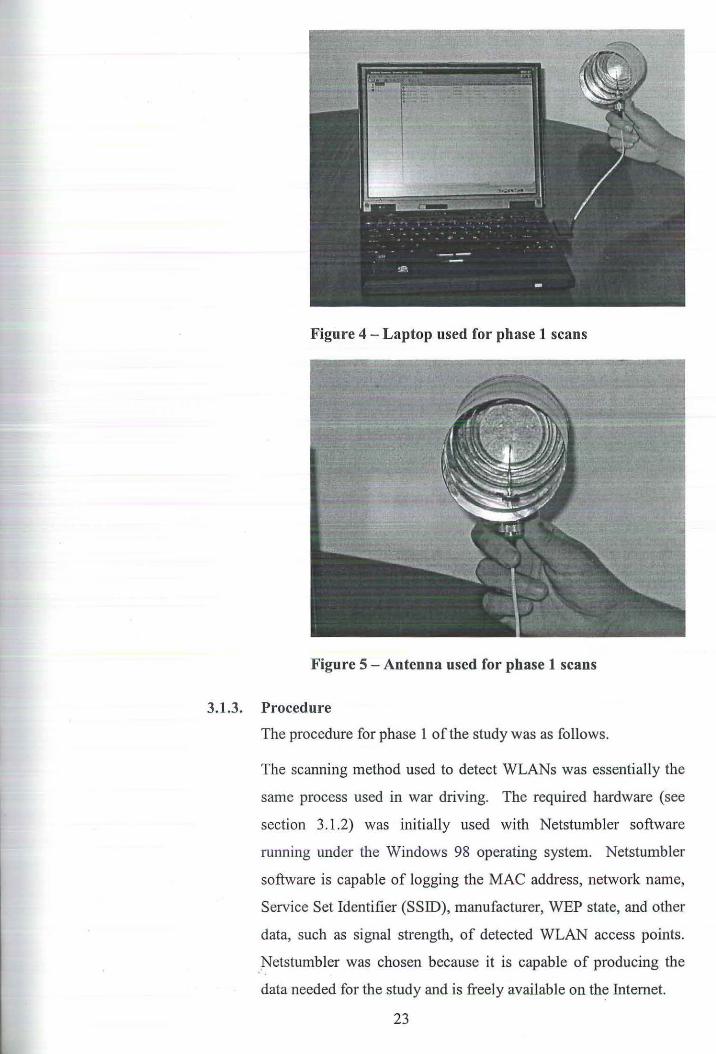
Figure 4- Laptop used for phase 1 scans
Figure 5 -Antenna used for phase 1 scans
3.1.3. Procedure
The procedure for phase 1 of the study was as follows.
The scanning method used to detect WLANs was essentially the
same process used in war driving. The required hardware (see
section 3.1.2) was initially used with Netstumbler software
running under the Windows 98 operating system. Netstumbler
software is capable of logging the MAC address, network name,
Service Set Identifier (SSID), manufacturer, WEP state, and other
data, such as signal strength, of detected WLAN access points.
Netstumbler was chosen because it is capable of producing the
data needed for the study and is freely available on th~ Internet.
23
...

The first five preliminary scans failed to find more than six
networks. After expanding the scau region, as described in
section 3.1.1, problems detecting a sufficient number of networks
were still experienced.
The preliminary s-;ans were conducted using Netstumbler running
in Windows 98. It became apparent, however, that the network
card was causing some kind of hardware conflict when running
under Windows and was not able to function correctly. Once it
was clear that the scans could not be performed satisfactorily
while running under Windows, a Linux~based tool had to be
found.
Kismet software is used to monitor and record wireless network
traffic. It produces detailed network information similar to that
produced by Netstumbler. Kismet uses a channel hopping
function that means the user does not have to change channels
manually while scanning. Kismet is also capable of revealing
closed WLANs, which are networks that have masked their SSID.
This gives Kismet an advantage over Netstumbler, which is only
capable of detecting open networks. Kismet was chosen because
it is capable of sniffing Access Points (APs) that have masked
SSIDs and/or have switched off broadcast messages. As a result,
the subsequent scans were performed while running Kismet under
Linux.
The five subsequent scans were much more successful than the
preliminary scans performed while running Netstumbler under
Windows and 170 networks were detected on the first day. See
section 4.1 for complete scan results.
24

3.1.4. Data analysis
The collected data was analysed and summarised using standard
statistical methods. The results, in section 4.1 below, show:
• The number of scans performed;
• The results of each scan (see below)
• The overall results (see below)
Individual Scan Data Analysis
For each of the five individual scans, the following statistics were
generated:
• The number of networks detected;
• The count and percentage of each network type;
• For infrastructure type networks :-
• The count and percentage with WEP enabled;
• The count and percentage without WEP enabled;
• The count and percentage with a masked SSID;
• The count and percentage with a masked SSID and
with WEP enabled;
• The count and percentage with a masked SSID and
without WEP enabled;
• The count and percentage with the manufacturer's
default SSID;
• The count and percentage with the manufacturer's
default SSID and with WEP enabled;
• The count and percentage with the manufacturer's
default SSID without WEP enabled;
• The count and percentage of the top 10 manufacturers
of the wireless hardware that was detected (based on
the MAC address).
25
These statistics were also produced for the cumulative set of
unique networks that were detected over the five separate scans.
Summary Data Analysis
To summarise the distribution of each of the count statistics
mentioned in the previous section, the following statistics were
generated:
• The count or frequency (n);
• The minimum value;
• The maximum value;
• The centre shown by average and median; and
• The spread shown by standard deviation and interquartile
range.
26

3.2. Phase 2
3.2.1. Survey targets
The survey targets for phase 2 of the study were the IT directors
or managers of selected Perth organisations. The candidate
targets were chosen from a list of businesses operating in the
Perth CBD. The names and addresses of the organisations were
obtained from an electronic copy of the Telstra Whitepages™.
This software allows the user to search for businesses by their
street name.
This search resulted in a sample frame of over 1500 businesses.
This list was then shortened back to approximately 150 candidate
organisations by a combined process of selection and elimination.
Organisations were selected if their name was recognised by the
researcher and they were deemed a good candidate for the
research. That is, the researcher believed that the organisation
was sufficiently large to have a computer network.
Other organisations were eliminated because their name indicated
that the business would be highly unlikely to have a wireless
network or even a computer network. An example of the type of
business that would have been immediately eliminated from the
list is a business with the word "church" in its name.
As the researcher only had a limited amount oftime and resources
to contact. the potential interviewees, it was decided that
approximately 150 candidate organisations would be sufficient to
provide adequate data for the research, given the likelihood of a
low participation rate.
3.2.2. Equipment and ins~ruments
The data collection instrument for phase 2 of the study was an
interview survey during which each respondent was asked a set of
prepared questions. See Appendix B for the survey instrument.
This method was chosen ahead of a self-administered
questionnaire, in an attempt to improve the response rate to the
27
survey and to pennit clarification of any responses (Sproull, 1988,
p. 162).
When designing the survey instrument, the researcher took care to
avoid leading or biased questions that may have encouraged the
respondents to answer questions in a particular way. The
questions included in the instrument were developed to
The design criteria for the survey instrument were driven by the
research questions as outlined in section 1.4. The limitations of
the instrument were imposed by the scope of the study in that
only infonnation regarding 802.llb infrastructure WLANs was
recorded. The number of questions was limited so that each
interview would only take up between 10 and 20 minutes of each
respor.dent's time.
The equipment required for phase 2 was:
• Telstra Whitepages™ on CD
• ECU postage prepaid window faced envelopes
• ECU letterhead
• Access to a telephone
3.2.3. Procedure
Once the shortlist of potential interviewees had been finalised, a
letter was sent to each organisation indicating that a research
student from Edith Cowan University would be contacting them
in the near future to discuss their organisation's participation in
the research. The letter stressed the significance of the research to
those organisations that chose to participate. See Appendix B for
a copy of the letter.
One week after the letters went out a phone call was made to each
potential respondent. The purpose of the phone call was to
identify the person within each organisation who would best be
able to answer the interview questions. Once this person had
been identified, the researcher attempted to arrange an
appointment.
28

Of the 154 organisations contacted, many stated that either they
outsourced their Infonnation Technology (IT) or that their IT was
managed from some related office in the Eastern States.
A summary of the results of the telephone calls to candidates is
listed in Table l below.
Result Quantity %
Outsources IT 38 24.7
Managed from Eastern States 26 16.9
Didn't return messages 22 14.3
Interviewed 20 13.0
No answer I Wrong number 15 9.7
Too busy 12 7.8
Mail returned 11 7.1
Not interested 7 4.5
Policy not to do surveys 2 1.3
No network I 0.6
Total 154 100.0
Table 1 -Results of telephone calls to candidates
Originally, 15 organisations agreed to participate. This number
later increased to 20 as several of the original interviewees
recommended other candidates. This represents a 13 percent
positive response.
29

3.2.4. Data analysis
The collected data was analysed using both quantitative and
qualitative techniques.
Quantitative Analysis
Questions requiring a simple Yes I No answer and those that
providtod an exhaustive list of possibilities were analysed using
standard quantitative statistical methods such as count,
percentage, average, etc.
Qualitative Analysis
Responses to open-ended questions that were designed to elicit
new and anecdotal information from respondents were analysed
qualitatively. This process (as summarised from Creswell, 1998,
Ch. 8) involved:
• Reviewing all collected information to obtain a sense of
the overall data.
• Writing notes and beginning to write swnmaries as an
initial sorting out process.
• Reducing data by developing codes or categories and then
sorting data into those codes or categories.
• The process then moved from reading data to describing,
classifying and interpreting data.
• Classifying data involved taking text apart, looking for
patterns, categories, or themes of information.
• The result of this process was narrative text supplemented
by tables and figures reflecting the r.lassification of the
data.
30
4. Results aud Findings
Each phase of the research is discussed separately below.
4.1. Pha.e I results
The route taken during the five scans included in the results may be seen in
Appendix C. The route was the same on each occasion, though the time of
day of each scan varied. The scans were performed on five consecutive
business days starting on Tuesday January 14, 2003 and concluding on
Monday January 20, 2003.
The software used in the five scans produced a set of comma delimited
text files that were then imported into a spreadsheet program for analysis.
The data that each of the Kismet files contained is as follows:
• A network number which is a unique number indicating the order
that the networks were detected in;
• The type of network traffic given by one of five or six types. These
types are ad hoc, data, infrastructure, lucent, probe and unknown Ad
hoc indicates that the network traffic detected belonged to a WLAN
that did not utilise an access point. Data indicates that the network is
a data~only network with no control packets. Infrastructure indicates
that the network traffic is coming from an access point. Lucent
indicates that the network traffic is coming from an outdoor router.
Probe indicates that a client was attempting to gain access to a
WLAN but the scanning device was out of range once the access was
achieved. Had the scanning device still be in range, the probe request
would have changr:d to either an ad hoc or infrastructure network
type;
., The Extended Service Set Identifier (ESSID) which is the name of
theWLAN;
• The Basic Service Set Identifier (BSSID) which contains the Media
Access Control (MAC) address of the access point;
• Info which only has a value when the manufacturer is Cisco/ Aironet;
• Channel - One of II channels in which WLAN devices operate,
where each channel operates in a slightly different frequency;
31
• Maxrate- the maximum data rate of the device;
• WEP - a Yes/No field which states whether WEP encryption is
enabled on the device;
• LLC, Data, Crypt, Weak and Total which are fields that describe
the types of packets detected;
• First which is a time stamp that indicates when the network device
was first detected;
• Last whicl. is a time stamp that indicates when the network device
was last detected;
• Best Signal which indicates the best signal strength achieved for the
detected device; and
• Best Noise that indicates the highest noise level achieved for the
detected device.
From the imported data, it was then possible to generate two more fields of
information. From the MAC address contained in the BSSID, it was
possible to determine the manufacturer of the device, as the first 24 bits
of a MAC address uniquely identify the manufacturer of the device. This
information was obtained from a list of registered MAC addresses
avai table at http: //standards. i ece.orglregauth/oui/index .sh tml
By obtaining a list of default SSIDs (SSID Defaults, 2003), it was
possible to detennine if the ESSID detected was still set .to the
manufacturer's default value. This is important as it may indicate an out
of-the-box installation, especially if the access point is using the default
SSID ar j has WEP switched off.
32 .,,_

4.1.1. Preliminary scans
As a result of the problems encountered while conducting the
preliminary scans (see section 3.1.3), the preliminary scan data
has not been analysed.
The following sections provide the results of scans that were
conducted after the operating system and scanning software were
changed to Linux and Kismet respectively. For each of the five
scans conducted, a set of results, presented as tables, is given.
The results for scan 1 include a discussion on what information is
being presented. For each subsequent scan, the table structures
and format are the same. See section 4.1.8 for a summmy of the
five scans and a discussion of the results therein.
4.1.2. Scan 1 results
Scan Date: Tuesday January 14, 2003
Start Time: 1:25pm
Finish Time: 2:25pm
Total Networks Detected: 171
Table 2 shows how these networks were separated by their
network type. Section 4.1 contains a description of each network
type.
Network by Network Type Count %
Ad-hoc 11 6
Data 5 3
Infrastructure 136 80
Lucent 2 1
Probe 17 10
Total 171 100
Table 2 -Networks by network type (scan 1)
33
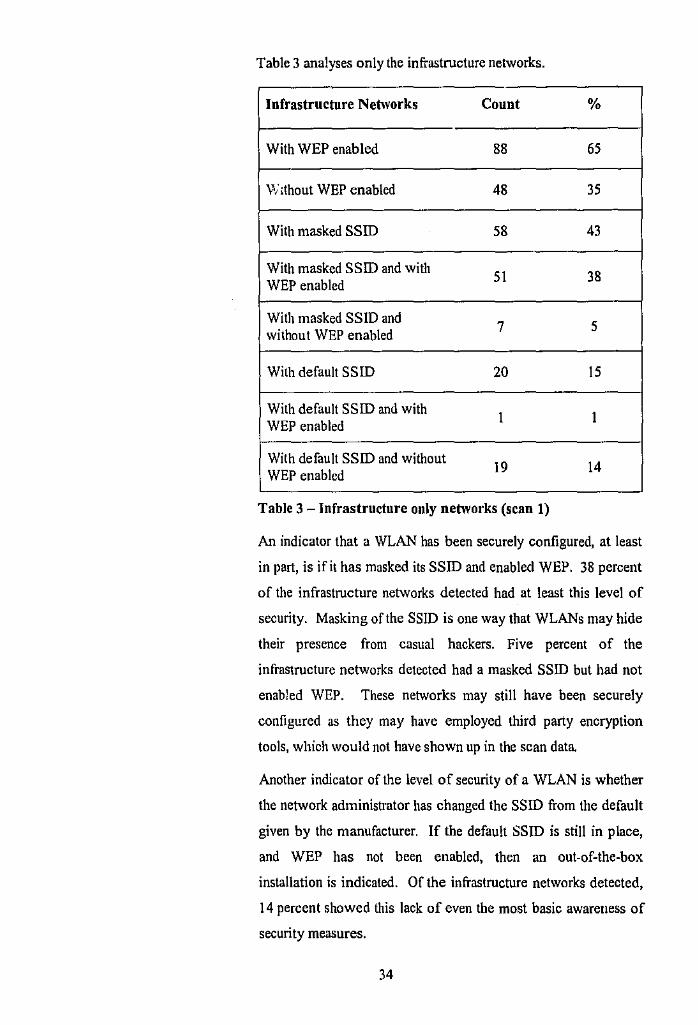
Table 3 analyses only the infrastructure networks.
Infrastructure Networks Count %
With WEP enabled 88 65
v-; ;thout WEP enabled 48 35
With masked SSID 58 43
With masked SSID and with 51 38 WEP enabled
With masked SSID and 7 5
without WEP enabled
With default SSID 20 15
With default SSID and with I I
WEP enabled
With default SSID and without 19 14 WEP enabled
Table 3- Infrastructure only networks (scan 1)
An indicator that a WLAN has been securely configured, at least
in part, is if it has masked its SSID and enabled WEP. 38 percent
of the infrastructure networks detected had at least this level of
security. Masking of the SSID is one way that WLANs may hide
their presence from casual hackers. Five percent of the
infrastructure networks detected had a masked SSID but had not
enabled WEP. These networks may still have been securely
configured as they may have employed third party encryption
tools, which would not have shown up in the scan data
Another indicator of the level of security of a WLAN is whether
the network administrator has changed the SSID from the default
given by the manufacturer. If the default SSID is still in place,
and WEP has not been enabled, then an out-of-the-box
installation is indicated. Of the infrastructure networks detected,
14 percent showed this lack of even the most basic awareness of
security measures.
34

Table 4 below shows the breakdown of the networks by
manufacturer. This was detennined by the manufacturer that
registered the MAC found in the BSSID.
MAC Registered to Count %
Aironet Wireless Communications 45 26
Agere Systems 28 16
Apple Computer Inc 15 9
Enterasys 13 8
Cabletron 12 7
Lucent Technologies 11 6
Symbol Technologies 11 6
ANI Communications 8 5
Delta Networks 7 4
All Others 21 12
Total 171 100
Table 4 M Networks by manufacturer (scan 1)
Results for each subsequent scan are given below. The same
fonnat has been utilised ...
35
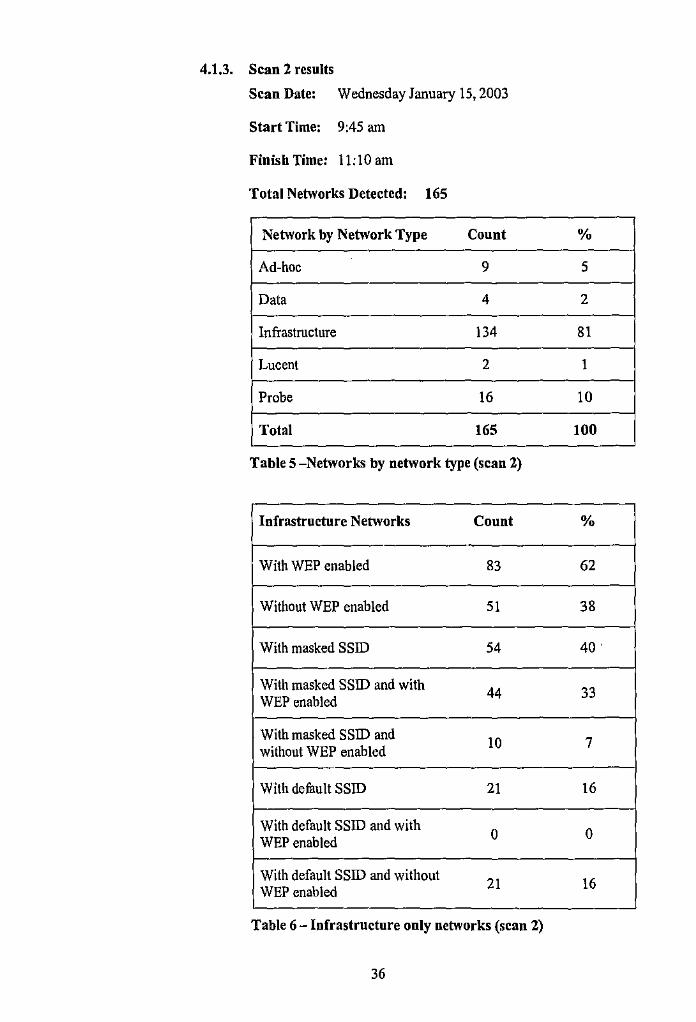
4.1.3. Scan 2 results
Scan Date: Wednesday January 15,2003
Start Time: 9:45 am
Finish Time: 11:10 am
Total Networks Detected: 165
Network by Network Type Count %
Ad-hoc 9 5
Data 4 2
Infrastructure 134 81
Lucent 2 I
Probe 16 10
Total 165 100
Table 5 -Networks by network type (scan 2)
Infrastructure Networks Count %
With WEP enabled 83 62
Without WEP enabled 51 38
With masked SSID 54 40'
With masked SSID and with 44 33 WEP enabled
With masked SSID and 10 7 without WEP enabled
With default SS!D 21 16
With default SS!D and with 0 0
WEP enabled
With default SSID and without 21 16 WEP enabled
Table 6- Infrastructure only networks (scan 2)
36

MAC Registered to Count %
Aironet Wireless Communications 47 28
Agere Systems 28 17
Enterasys 11 7
Symbol Technologies 11 7
Cabletron 10 6
Lucent Technologies 10 6
Apple Computer Inc 9 5
ANI Communications 8 5
Premax Electronics 6 4
Others 25 IS
Total 165 100
Table 7- Networks by manufacturer (scan 2)
37

4.1.4. Scan 3 results
Scan Date: Thursday January 16,2003
Start Time: 10:40 am
Finish Time: 12:10 pm
Total Networks Detected: 179
Network by Network Type Count %
Ad-hoc 18 10
Data 6 3
Infrastructure 134 75
Lucent 2 I
Probe 19 11
Total 179 100
Table 8 -Networks by network type (scan 3)
JTJfrastructure Networks Count %
With WEP enabled 85 63
Without WEP enabled 49 37
With masked SSID 45 34
With masked SSID and with 40 30 WEP enabled
With masked SSID aud 5 4 without WEP enabled
With default SSID 20 15
With default SSID and with 0 0 WEP enabled
With default SSID and without 20 15 WEP enabled
Table 9- Infrastructure only networks (scan 3)
38
",'
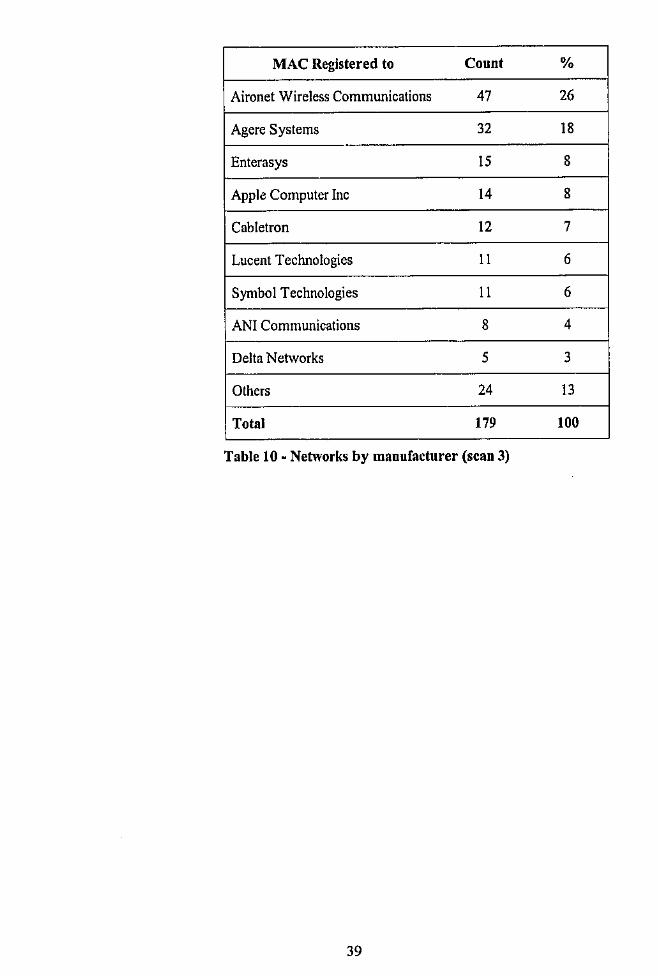
MAC Registered to Count %
Aironet Wireless Communications 47 26
Agere Systems 32 18 .
Enterasys IS 8
Apple Computer Inc 14 8
Cabletron 12 7
Lucent Technologies II 6
Symbol Technologies II 6
ANI Communications 8 4
Delta Networks 5 3
Others 24 13
Total 179 100
Table 10- Networks by manufacturer (scan 3)
39
,_ -:'-·:-,.-.
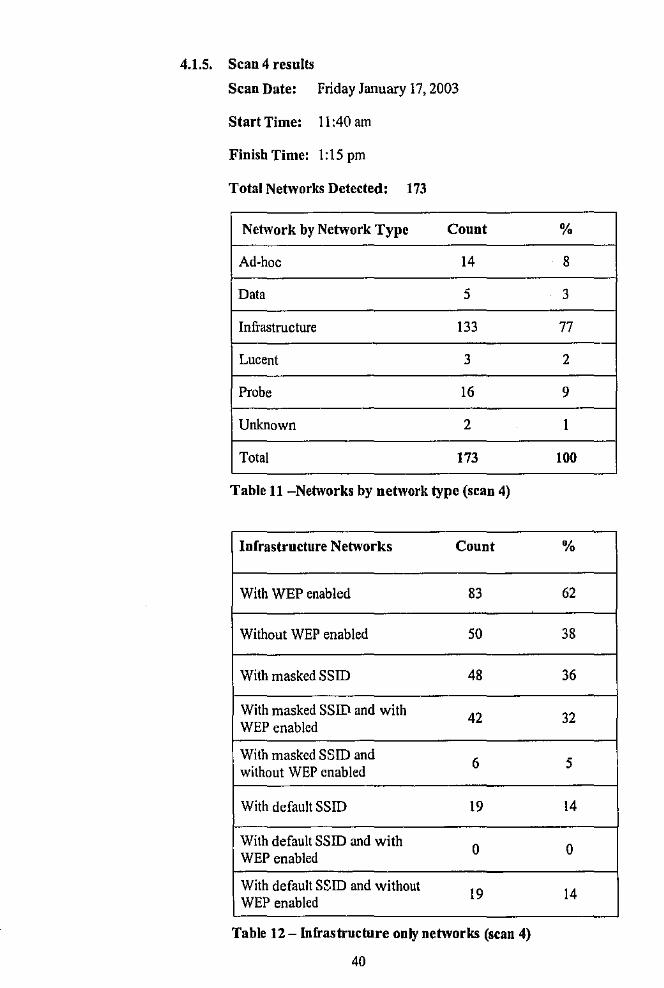
4.1.5. Scan 4 results
Scan Date: Friday January 17,2003
Start Time: 11 :40 am
Finish Time: 1:15 pm
Total Networks Detected: 173
Network by Network Type Count
Ad-hoc 14
Data 5
Infrastructure 133
Lucent 3
Probe 16
Unknown 2
Total 173
Table 11-Networks by network type (scan 4)
Infrastructure Networks Count
With WEP enabled 83
Without WEP enabled 50
With masked SSID 48
With masked SSID and with 42 WEP enabled
With masked SSID and 6 without WEP enabled
With default SSID 19
With default SSID and with 0
WEP enabled
With default S~ID and without 19 WEP enabled
Table 12- Infrastructure only networks (scan 4)
40
%
8
3
77
2
9
I
100
%
62
38
36
32
5
14
0
14
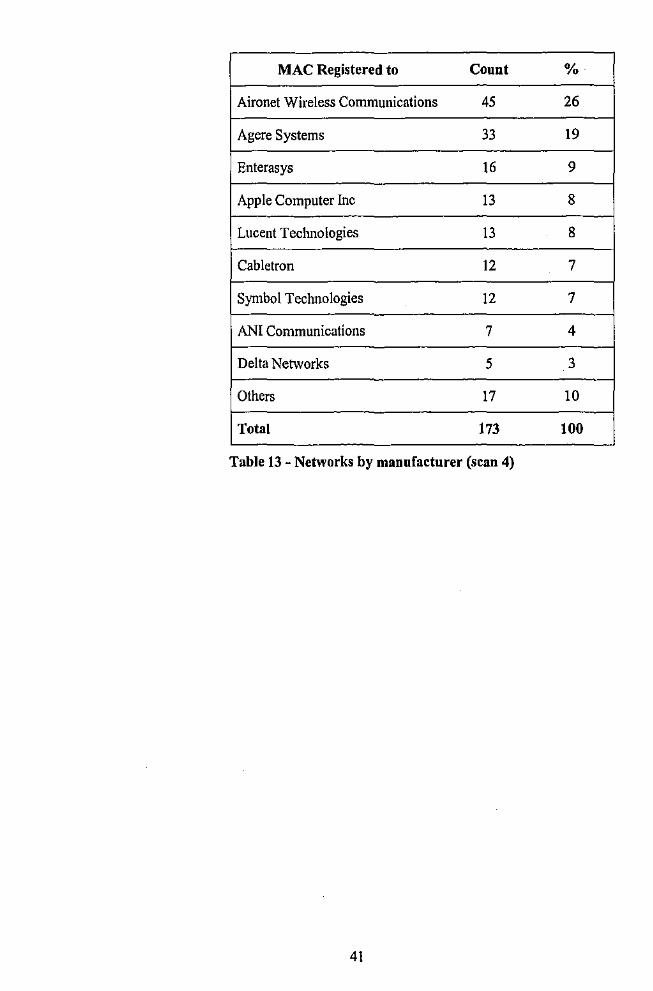
MAC Registered to Count %
Aironet Wireless Communications 45 26
Agere Systems 33 19
Enterasys 16 9
Apple Computer Inc 13 8
Lucent Technologies 13 8
Cabletron 12 7
Symbol Teclmologies 12 7
ANI Communications 7 4
Delta Networks 5 3
Others 17 10
Total 173 100
Table 13 - Networks by manufacturer (scan 4)
41

4.1.6. Scan 5 results
Scan Date: Monday January 20, 2003
Start Time: 10:55 am
Finish Time: 12:10 pm
Total Networks Detected: 173
Network by Network Type Count %
Ad-hoc 8 5
Data 4 2
Infrastructure 137 79
Lucent 2 1
Probe 22 13
Total 173 100
Table 14 -Networks by network type (scan 5)
Infrastructure Networks Count %
With WEP enabled 84 61
Without WEP enabled 53 39
With masked SSID 47 34
With masked SSID and with 42 31 WEP enabled
With masked SSID and 5 4 without WEP enabled
With default SSID 20 15
With default SSID and with 1 1 WEP enabled
With default SSID and without 19 14 WEP enabled
Table 15- Infrastructure only networks (scan 5)
42

MAC Registered to Count %
Aironet Wireless Communications 48 28
Agere Systems 30 17
Apple Computer Inc 14 8
Enterasys 13 8
Symbol Technologies 13 8
Lucent Technologies 12 7
Cabletron 9 s
ANI Communications 8 s
Delta Networks s 3
Others 21 12
Total 173 100
Table 16- Networks by manufacturer (sc:m 5)
43

4.1.7. Unique networks detected
By importing the results of all scans into a single spreadsheet and
then filtering out the duplicate BSSIDs, it was possible to
generate a list of unique networks detected over the five days.
Total Networks Detected: 260
Network by Network Type Count %
Ad-hoc 27 10
Data 7 3
Infrastructure 177 68
Lucent 2 1
Probe 45 17
Unknown 2 1
Total 260 100
Table 17 -Networks by network type (unique networks)
These results show that there was a larger proportion of probe
requests than normal, 17 percent compared to an average of 10
percent. This is because probe requests are attempts by client
devices to attach to a WLAN. Once the attachment has been
made, the client device would not appear in the scan results,
rather, the access point that the client had attached to would show
up in the infrastructure results. Probe requests would likely come
from a multitude of clients over the five days of the scans whereas
access points' showing as infrastructure network types would be
more static.
44
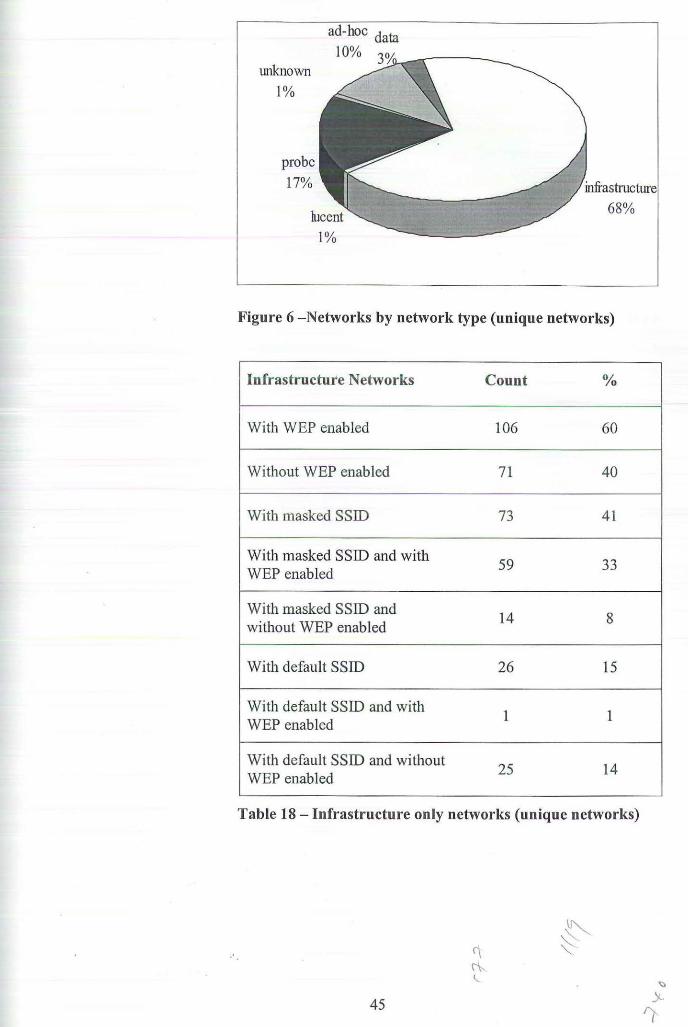
unknown
1%
probe
17%
ad-hoc data 10%
1%
Figure 6 -Networks by network type (unique networks)
Infrastructure Networks Count o;o
With WEP enabled 106 60
Without WEP enabled 71 40
With masked SSID 73 41
With masked SSID and with 59 33
WEP enabled
With masked SSID and 14 8 without WEP enabled
With default SSID 26 15
With default SSID and with 1 1 WEP enabled
With default SSID and without 25 14 WEP enabled
Table 18- Infrastructure only networks (unique networks)
45

WithoutWEP
enabled
enabled 60%
Figure 7 - Infrastructure networks with or without WEP
enabled
Without
Masked
SSID
59%
With Masked
SSID and
WEP 33%
8%
Figure 8 - Infrastructure networks with or without masked
SSID, and with WEP enabled

Without
Defuult SSID
85%
With Defuult SSID and
WEP
1%
ithDefuuh
SSID no
WEP
14%
Figure 9 - Infrastructure networks with or without a default
SSID, and with or without WEP enabled
MAC Registered to Count o;o
Aironet Wireless Communications 55 21
Agere Systems 51 20
Enterasys 23 9
Apple Computer Inc 21 8
Cabletron 17 7
Symbol Technologies 17 7
Lucent Technologies 14 5
ANI Communications 10 4
Delta Networks 8 3
Others 44 17
Total 260 100
Table 19- Networks by manufacturer (unique networks)
The list of unique infrastructure networks was then sorted and
filtered to determine how the security statistics were distributed
-·by manufacturer.
47
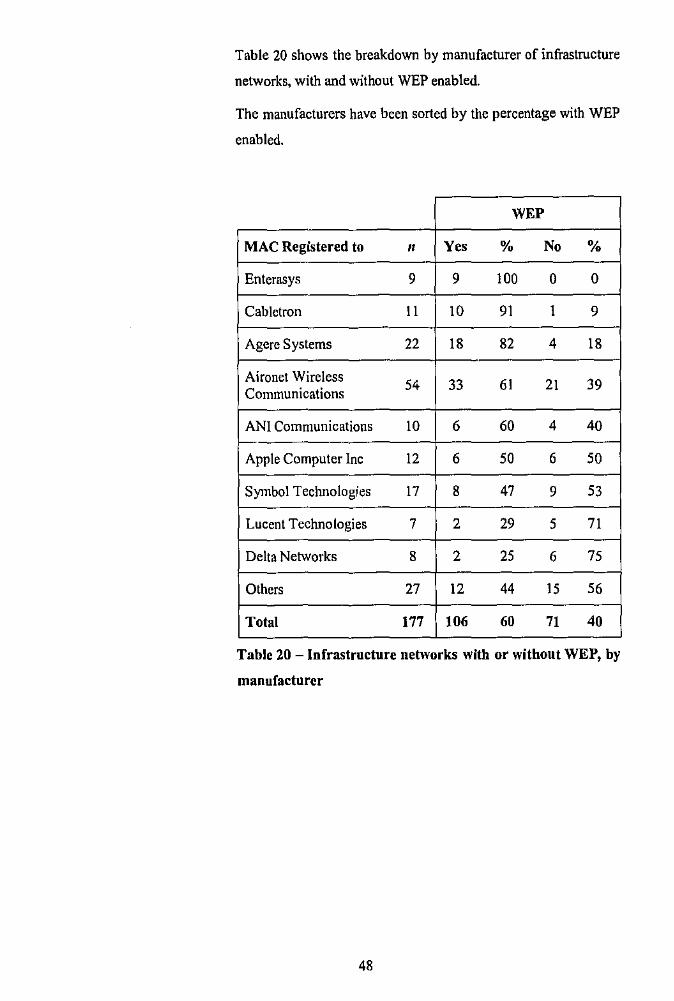
Table 20 shows the breakdown by manufacturer of infrastructure
networks, with and without WEP enabled.
The manufacturers have been sorted by the percentage with WEP
enabled.
WEP
MAC Registered to , Yes % No %
Enterasys 9 9 100 0 0
Cabletron 11 10 91 1 9
Agerc Systems 22 18 82 4 18
Aironet Wireless 54 33 61 21 39 Communications
ANI Communications 10 6 60 4 40
Apple Computer Inc 12 6 50 6 50
Symbol Technologies 17 8 47 9 53
Lucent Technologies 7 2 29 5 71
Delta Networks 8 2 25 6 75
Others 27 12 44 15 56
Total 177 106 60 71 40
Table 20 -Infrastructure networks with or without WEP, by
manufacturer
48
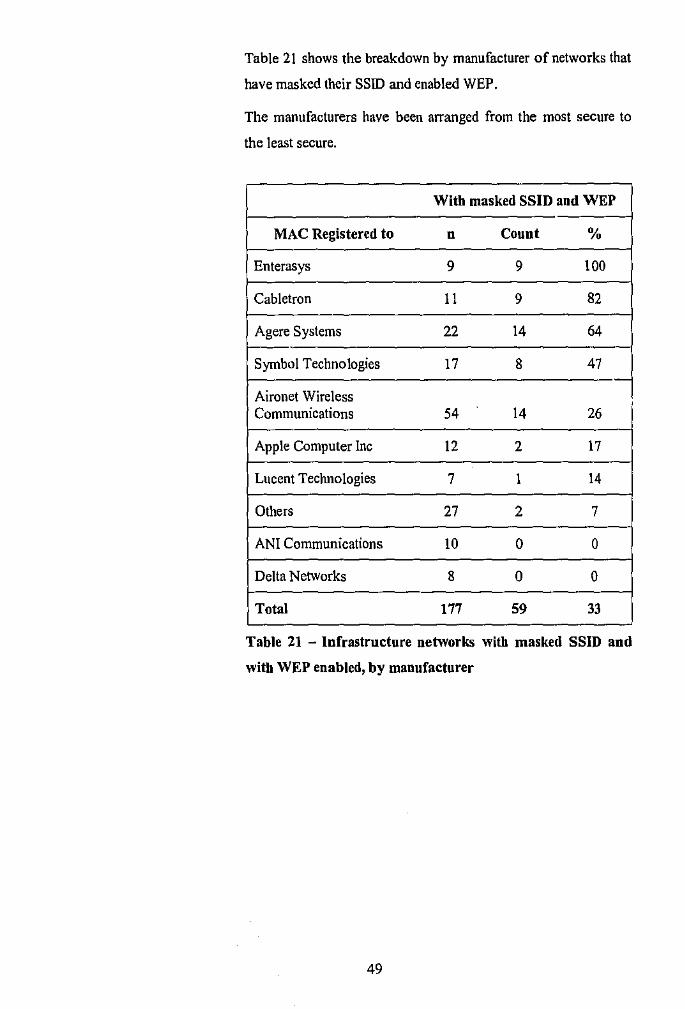
Table 21 shows the breakdown by manufacturer of networks that
have masked their SSID and enabled WEP.
The manufacturers have been arranged from the most secure to
the least secure.
With masked SSID and WEP
MAC Registered to n Count %
Enterasys 9 9 100
Cabletron 11 9 82
Agere Systems 22 14 64
Symbol Technologies 17 8 47
Aironet Wireless Communications 54 14 26
Apple Computer Inc 12 2 17
Lucent Technologies 7 1 14
Others 27 2 7
ANI Communications 10 0 0
Delta Networks 8 0 0
Total 177 59 33
'
Table 21 - Infrastructure networks with masked SSID and
witb WEP enabled, by manufacturer
49

Table 22 shows the breakdown by manufacturer of networks that
are using the default SSID and have not enabled WEP, indicating
and out~of~the~box installation.
The manufacturers have been arranged from the most secure to
the least secure.
MAC Registered to II Count %
Agere Systems 22 0 0
Apple Computer Inc 12 0 0
Cabletron II 0 0
Enterasys 9 0 0
ANI Communications 10 I 10
Others 27 4 15
Aironet Wireless Communications 54 II 20
Symbol Technologies 17 4 24
Lucent Technologies 7 2 29
Delta Networks 8 4 50
Total 177 26 15
Table 22 - Infrastructure networks with default SSID and
without WEP enabled, by manufacturer
Enterasys equipment was the most secure, with 100 percent
configured with a masked SSID and WEP enabled. Cabletron
was next with 9 out of 11 configured as per the Enterasys
equipment. No Enterasys or Cabletron networks detected
indicated that they had been set up out-of~the~box.
Aironet Wireless Communications, which is part of Cisco, had
the greatest share of detected network devices but nearly 40
percent had not enabled WEP, and 20 percent suggested a default
configuration. Delta Networks fared the worst with 75 percent
unprotected by WEP, and 50% with a default configuration.
50
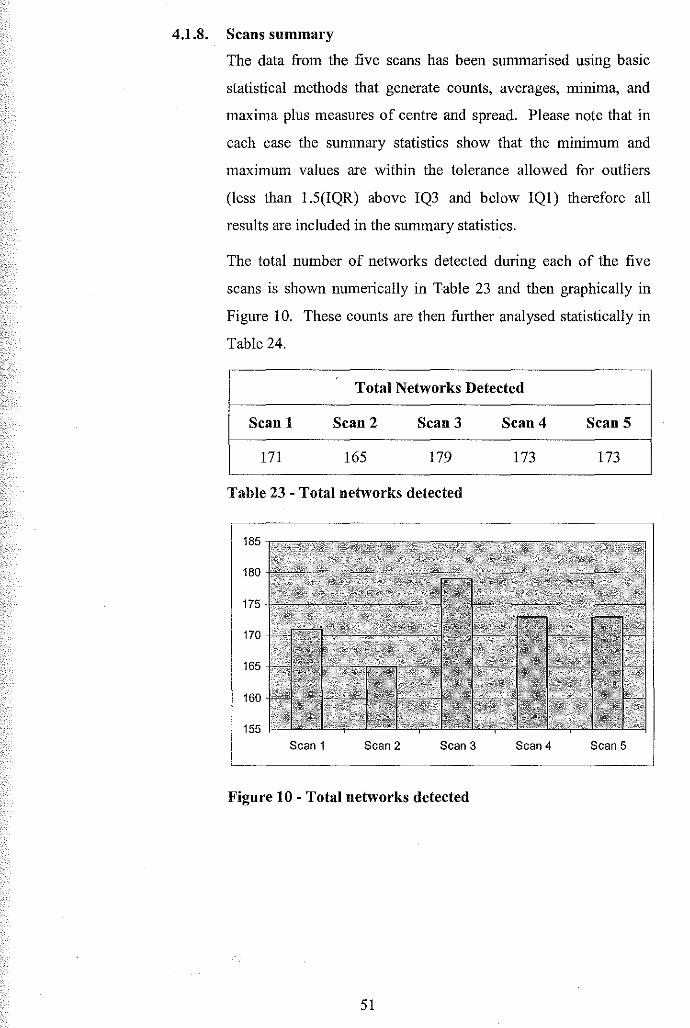
4.1.8. Scans snmmary
The data from the five scans has been summarised using basic
statistical methods that generate counts, averages, minima, and
maxima plus measures of centre and spread. Please note that in
each case the summary statistics show that the minimum and
maximum values are within the tolerance allowed for outliers
(less than 1.5(IQR) above IQ3 and below IQl) therefore all
results are included in the summary statistics.
The total number of networks detected during each of the five
scans is shown numerically in Table 23 and then graphically in
Figure 10. These counts are then further analysed statistically in
Table 24.
Total Networks Detected
Scan 1 Scan 2 Scan 3 Scan4 Scan 5
171 165 179 173 173
Table 23 - Total networks detected
Scan 1 Scan 2 Scan 3 Scan 4 Scan 5
Fignre 10- Total networks detected
51

Statistical Function Result
Minimum 165
IQ 1 - lower quartile 168
Median 173
IQ3 - upper quartile 176
Maximum 179
IQR- inter-quartile range 8
Average 172.2
Standard deviation 5.01996
Table 24 - Summary of total networks detected
": '!
180
178
176
174
172 170
168
166
164
162
160
Networks Detected
Figure 11 - Box plot of networks detected
52
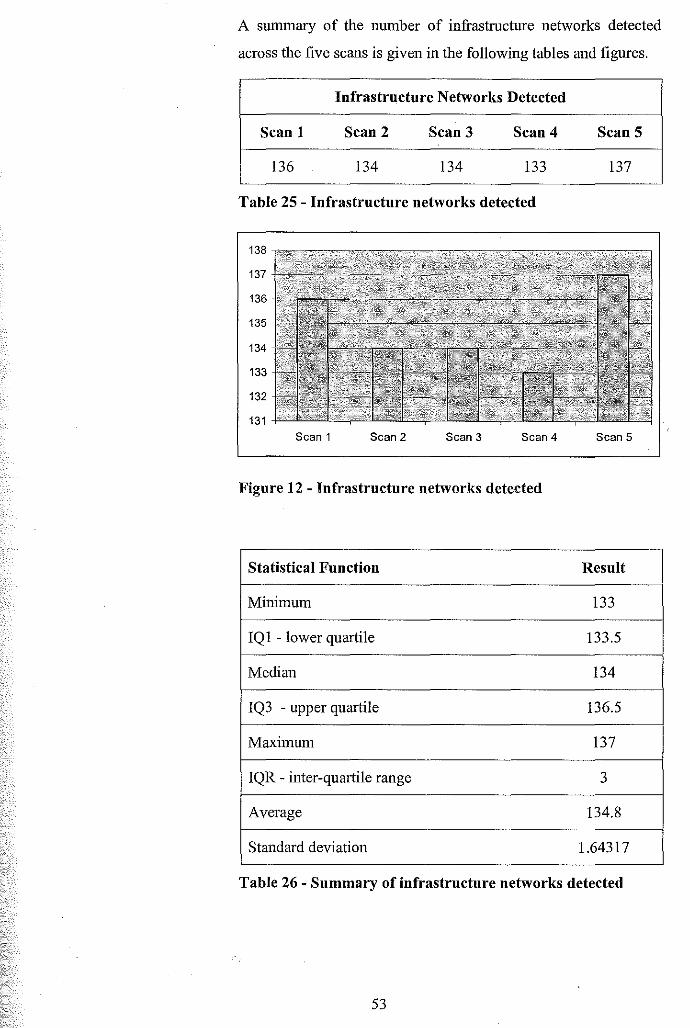
A summary of the number of infrastructure networks detected
across the five scans is given in the following tables and figures.
Infrastructure Networks Detected
Scan 1 Scan2 Scan3 Scau4 Scan 5
136 134 134 133 137
Table 25 - Infrastructure networks detected
Figure 12 - Infrastructure networks detected
Statistical Function Result
Minimum 133
IQ1 -lower quartile 133.5
Median 134
IQ3 - upper quartile 136.5
Maximum 137
IQR- inter-quartile range 3
Average 134.8
Standard deviation 1.64317
Table 26- Summary of infrastructure networks detected
53
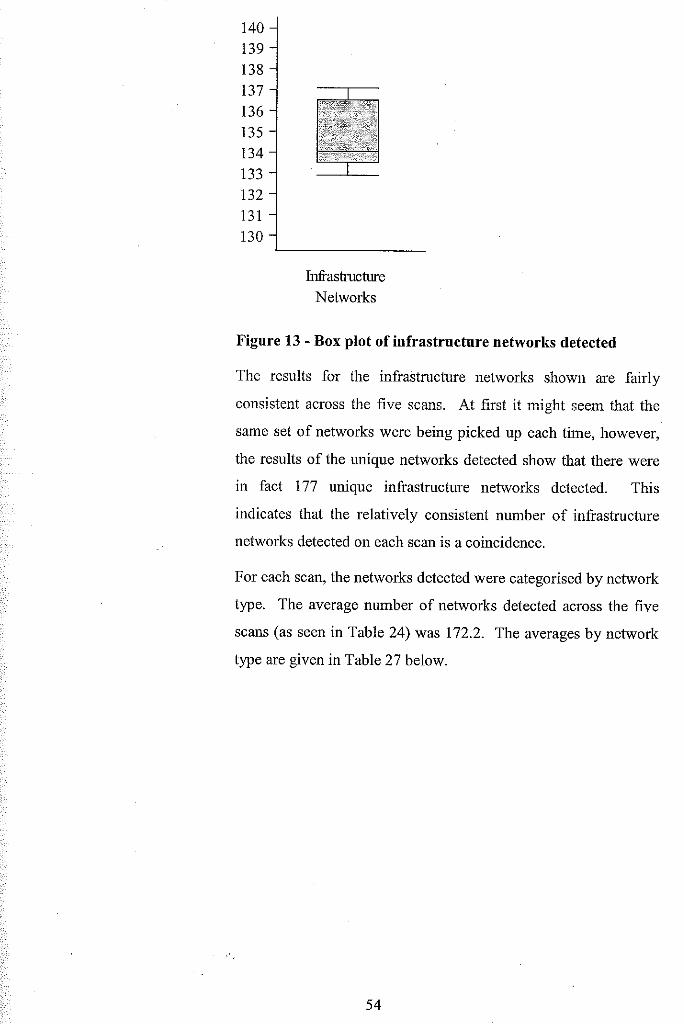
140 139 138 137 136 135 134 133 132 131 130
Infrastructure Networks
Figure 13 -Box plot of infrastructure networks detected
The results for the infrastructure networks shown are fairly
consistent across the five scans. At first it might seem that the
same set of networks were being picked up each time, however,
the results of the unique networks detected show that there were
in fact 177 unique infrastructure networks detected. This
indicates that the relatively consistent number of infrastructure
networks detected on each scan is a coincidence.
For each scan, the networks detected were categorised by network
type. The average number of networks detected across the five
scans (as seen in Table 24) was 172.2. The averages by network
type are given in Table 27 below.
54

Network by Network Type Average
Ad-hoc 12
Data 4.8
Infrastructure 134.8
Lucent 2.2
Probe 18
Other 0.4
Total 172.2
Table 27 -Networks by network type (summary)
data, 3% ad-hoc, 7% ------
unknown, 0%
probe, 1
0/o
7
3
78
1
10
0
100
78%
Figure 14- Networks by network type (summary)
Summarising just the infrastructure networks, the following
average counts and percentages (of the average infrastructure
count of 134.8) were determined.
55

Infrastructure Networks Average %
With WEP enabled 84.6 63
Without WEP enabled 50.2 37
With masked SSID 50.4 37
With masked SSID and with 43.8 32
WEP enabled
With masked SSID and 6.6 5 without WEP enabled
With default SSID 20 15
With default SSID and with 0.4 0 WEP enabled
With default SSID and without 19.6 15 WEP enabled
Table 28- Infrastructure only networks (summary)
WithoutWEP enabled
enabled 63%
Figure 15 - Infrastructure networks with or without WEP
enabled (summary)
56

Without
Masked
SSID
63%
With Masked
SSID and
WEP
32%
SSIDno
WEP
5%
Figure 16 -Infrastructure networks with or without masked
SSID and with WEP enabled (summary)
Without
Defuult SSID
85%
WithDefuult
SSID and
WEP
0%
Defuu
SSIDno
WEP
15%
Figure 17 - Infrastructure networks with or without default
SSID and with or without WEP (summary)
57
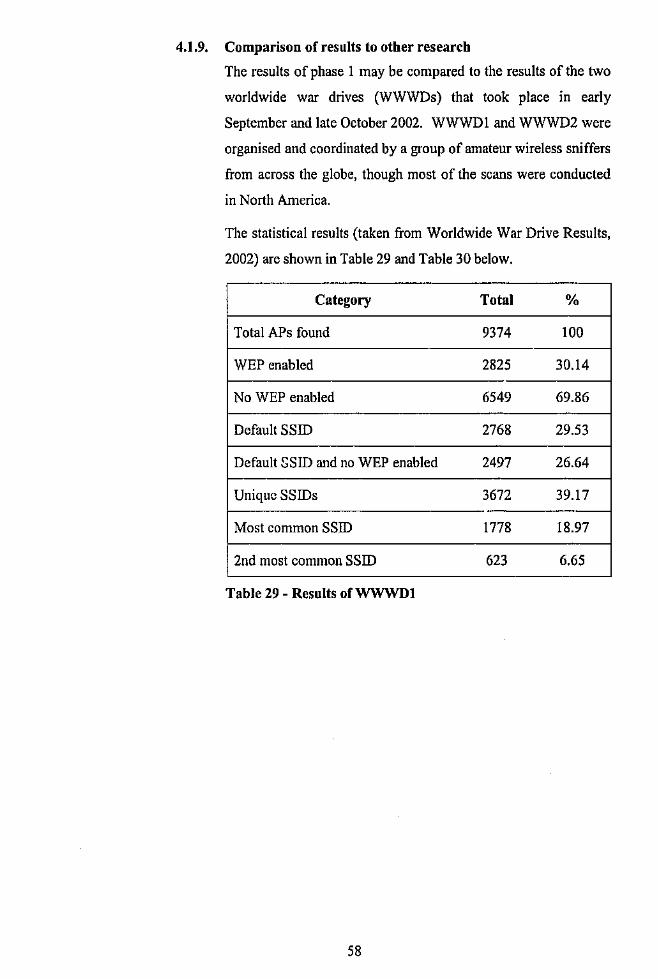
4.1.9. Comparison of results to other research
The results of phase 1 may be compared to the results of the two
worldwide war drives (WWWDs) that took place in early
September and late October 2002. WWWD 1 and WWWD2 were
organised and coordinated by a group of amateur wireless sniffers
from across the globe, though most of the scans were conducted
in North America.
The statistical results (taken from Worldwide War Drive Results,
2002) are shown in Table 29 and Table 30 below.
Category Total %
Total APs found 9374 100
WEP enabled 2825 30.14
No WEP enabled 6549 69.86
Default SSID 2768 29.53
Default SSID and no WEP enabled 2497 26.64 I--
Unique SSIDs 3672 39.17
Most common SSID 1778 18.97
2nd most common SSID 623 6.65
Table 29 - Results of WWWDl
58

Category Total % %
change
Total APs found 24958 100 N/A
WEP e11.abled 6970 27.93 -2.21
No WEP enabled 17988 72.07 2.21
Default SSID 8802 35.27 5.74
Default SSID and no WEP enabled 7847 31.44 4.80
Most common SSID 5310 21.28 2.31
2nd most common SSID 2048 8.21 1.56
Table 30- Results ofWWWD2
When combined, these scans found that on average only 29
percent of detected APs had WEP enabled. This is significantly
less than the 63 percent average of infrastructure networks with
WEP enabled uncovered during phase 1 of this study. There are
several possible reasons for this large discrepancy.
Firstly, the more recent of the two WWWDs was done more than
three months prior to the scans for this study and it is possible that
user awareness has increased dramatically during that time.
resulting in an increase in applied security.
Secondly, the scan regions were significantly different. The
participants in both WWWDs stated that "home installations
accounted for the majority of the APs detected" (Brewin, 2002).
This was inferred from the types of APs detected. This is
significant because home users may be more likely to leave
security switched off or be unaware of the need for security.
Chiswell is quoted by Douglas (2002) as saying, "Home users
often leave themselves vulnerable to an attack through a lack of
awareness".
Thirdly, the scanning software used by the WWWD participants
was Netstumbler. Netstumbler is not capable of detecting APs
59

who have masked their SSIDs. For this reason, the WWWD
scans would not have detected any networks whose administrators
would be most likely to have enabled WEP, as masking the SSID
of the network is a fundamental step in securing a WLAN. This
statement is backed up by the results of phase 1 as they show that
88 percent of the networks that had a masked SSID also had WEP
enabled.
To test this theory, the results from phase 1 were reproduced,
omitting the data for the infrastructure networks that have masked
SSIDs. The list of unique infrastructure networks was filtered to
show only infrastructure networks that had not masked the SSID.
There were 177 unique infrastructure networks detected, of which
73 had masked the SSID. This left 104 infrastructure networks
without a masked SSID. Of these 104, 47 or 45 percent had
enabled WEP, while 57 or 55 percent had not.
Figure 18 shows how the results from the WWWDs compare to
the results from phase 1 of this study, in regards to whether WEP
was enabled.
80%
60%
40%
20%
0%
WWWDs All No Networks Masked
SSID
Masked SSID
Figure 18- Comparison of scan results showing WEP enabled
Two other comparisons may be made between the WWWDs and
phase 1 of this study. The number of APs using the default SSID
60

and the number of APs with the default SSID and without WEP
were measured in both studies.
On average, 34 percent of the APs detected during the WWWDs
were using the default SSID. This compares to 15 percent found
during phase I of this study. Once again, this discrepancy is most
likely caused by the difference in the types of networks detected,
i.e. home networks compared to business networks.
A closer fit was found in the comparison of networks that were
using the default SSID and had not enabled WEP. On average,
the WWWDs found that 89 percent of the networks with a default
SSID had not enabled WEP, while the results from this stndy
showed that of the networks that used a default SSID, 96 percent
had not enabled WEP.
61

4.2. Phase 2 results
Of the 154 organisations contacted, 20 agreed to participate with this
study. The respondents from these 20 organisations classified their
organisations as shown in Table 31 below. The median number of
network nodes represents the most· often selected option for that
classification. A summary of the number of network nodes per
organisation may be seen in Figure 19 below.
Organisation Type Count % Median#
Network Nodes
Agricultural services I 5 100+
Consulting - IT 1 5 51-100
Consulting - Security 1 5 <10
Finance 4 20 26-50
Government 6 30 100+
Hotel 1 5 26-50
Law 1 5 51-100
Member organisation 2 10 51-100
Mining & exploration 3 15 100+
Total 20 100 100+
Table 31 -Respondent organisation classification
<10 11-25 26-50 51-100 100+
Number of Network Nodes
62
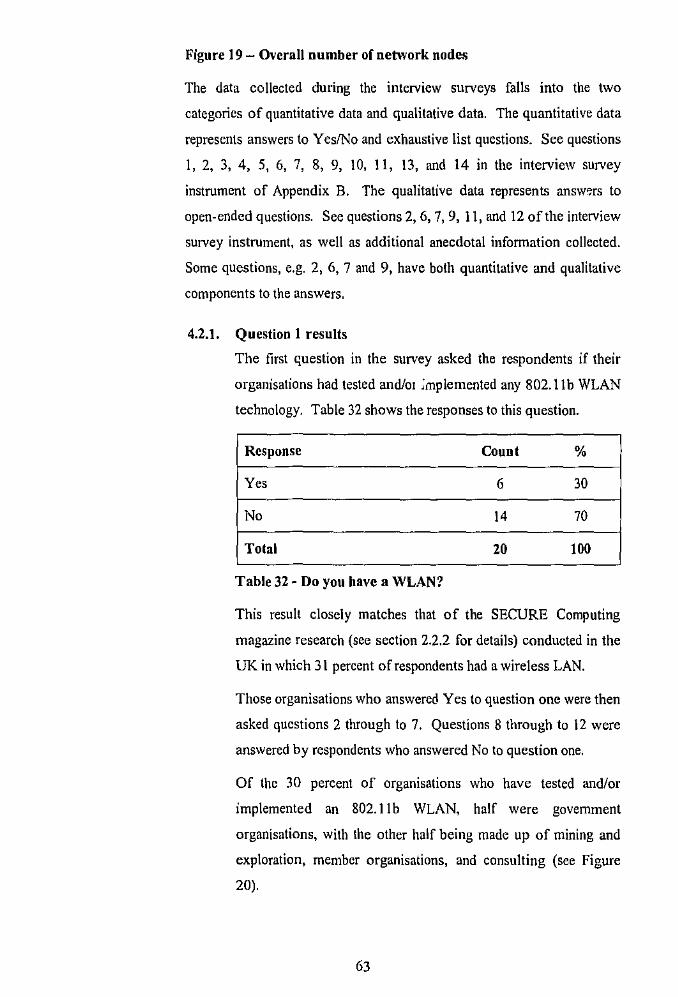
Figure 19- Overall number of network nodC!i
The data collected during the interview surveys falls into the two
categories of quantitative data and qualitative data. The quantitative data
represents answers to Yes/No and exhaustive list questions. See questions
1, 2, 3, 4, 5, 6, 7, 8, 9, 10, 11, 13, and 14 in the interview survey
instrument of Appendix B. The qualitative data represents answ~rs to
open-ended questions. See questions 2, 6, 7, 9, 11, and 12 of the interview
survey instrument, as well as additional anecdotal infonnation collected.
Some questions, e.g. 2, 6, 7 and 9, have both quantitative and qualitative
components to the answers.
4.2.1. Question 1 results
The first ~uestion in the survey asked the respondents if their
organisations had tested and/01 ;mplemented any 802.llb WLAN
technology. Table 32 shows the responses to this question.
Response Count %
Yes 6 30
No 14 70
Total 20 100
Table 32 ~ Do you have a WLAN?
This result closely matches that of the SECURE Computing
magazine research (see section 2.2.2 for details) conducted in the
UK in which 31 percent of respondents had a wireless LAN.
Those organisations who answered Yes to question one were then
asked questions 2 through to 7. Questions 8 through to 12 were
answered by respondents who answered No to question one.
Of the 30 percent of organisations who have tested and/or
implemented an 802.11 b WLAN, half were government
organisations, with the other half being made up of mining and
exploration, member organisations, and consulting (see Figure
20).
63

Government
Member
Organisation
Consulting -
Security
Figure 20- Organisations with WLANs
Mining&
Exploration
Two thirds of the organisations who have WLANs have more
than 100 network nodes (see Figure 21 ).
-0:: ::> 0 (.)
<10 11-25 26·50 51-100 100+
Number of Network Nodes
Figure 21 -Number of nodes for organisations with WLANs

4.2.2. Question 2 results
When asked if they were aware of any security implications of
using WLANs, 100 percent of the organisations that have wireless
networks responded in the affirmative. When prompted to
expand on their answers, the following data emerged.
WEP weaknesses
Many of the comments made in response to question two were
related to WEP, the encryption built in to the 802.11b standard.
The types of comments made range from a general knowledge of
the weaknesses ofWEP, for example "I guess WEP is not deemed
to be totally secure, it can be cracked" (Respondent 5), to the
more specific mention of the problems associated w:~n weak key
reuse.
"The biggest issue is the encryption algoritlun that's used- RC4
to do with the production of weak keys, with sufficient weak keys
being grabbed, the user may use software like AirSnort and things
like that to be able to unencrypt [sic1 the packets" (Respondent
19).
Two of the interviewees mentioned that the problems with WEP
cannot be fixed by increasing the length of the key. "128 bit is
nearly as vulnerable as 40 bit" (Respondent 5). "Regardless of
the levels of encryption that you have, if you have the ability to
sniff data and get sufficient data then you can crack the network''
(Respondent 15)
These respondents demonstrated a reasonable knowledge of the
problems with WEP key lengths. As Walker (2000) stated, the
WEP encapsulation remains insecure whether its key length is 1
bit or 1000 bits.
65

Physical Access
Four of the six intetviewees spoke of their awareness that hackers
do not need to have physical access to the network infrastructure
to be able to intercept transmissions. "People don't have to be
plugged into something physical in order to access your network"
(Respondent 2).
The practice of war driving was also mentioned, though not by
name. "People can just sort of sit outside the office in a car and
log into your network" (Respondent 5).
These comments show that many of the respondents are aware of
the inability of WLAN administrators to control unauthorised
access to the transmission medium.
General Comments
One respondent talked about how his organisation had gone ahead
with the implementation of a WLAN even though he "doesn't
believe that there is such a thing as a secure wireless network".
The respondent felt that there would always be risks in operating
a wireless network but it was a "case of convenience versus the
risk" (Respondent 15). This indicates that the respondent believes
the benefits of wireless outweigh the risks.
Another respondent's organisation had yet to move from testing
into production with his or her WLAN. This person stated that
the organisation would not "let it out" until they had done a lot
more research and come up with an organisation-wide standard
for implementing WLANs. The respondent mentioned that this
would probably take another 12 months and would most likely
correspond with a shift in premises {Respondent 5).
A third respondent, whose organisation only uses WLANs for
special events and not as part of their regular network, declared "I
don't think it's yet acceptable for a corporate environment that
involves sensitive data" (Respondent 2).
66

This statement is an indication of the reluctance of organisations
to trust their sensitive data to what is perceived to be an open
medium.
Question 2 Summary
In summary, the respondents to question two showed a good
understanding of the security problems associated with WLAN
technology.
This knowledge is reassuring as all of those who responded to this
question have implemented or tested 802.llb WLANs.
67
---- o __ 'C -- -
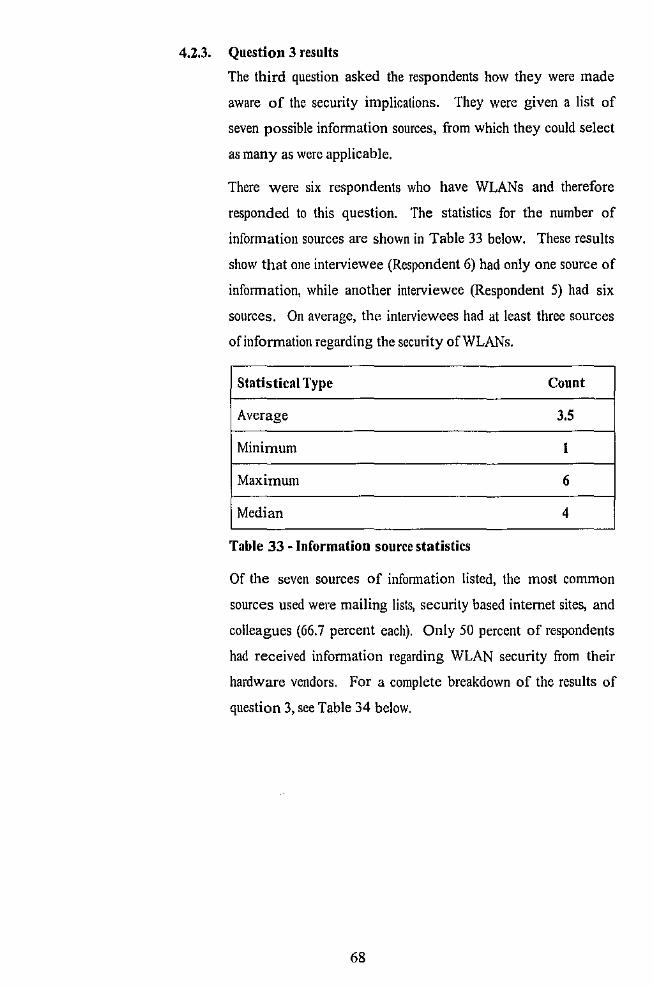
4.2.3. Question 3 results
The third question asked the respondents how they were made
aware of the security implications. They were given a list of
seven possible information sources, from which they could select
as many as were applicable.
There were six respondents who have WLANs and therefore
responded to this question. The statistics for the number of
infonnation sources are shown in Table 33 below. These results
show that one interviewee (Respondent 6) had only one source of
infonnation, while another interviewee (Respondent 5) had six
sources. On average, the interviewees had at least three sources
of information regarding the security ofWLANs.
Statistical Type Count
Average 3.5
Minimum I
Maximum 6
Median 4
Table 33 ~Information source statistics
Of the seven sources of infonnation listed, the most common
sources used were mailing lists, security based internet sites, and
colleagues (66.7 percent each). Only 50 percent of respondents
had received information regarding WLAN security from their
hardware vendors. For a complete breakdown of the results of
question 3, see Table 34 below.
68

Information Source Count %
Mailing list 4 66.7
Security Internet site 4 66.7
Colleague(s) 4 66.7
WLAN hardware vendor 3 50.0
Print media 3 50.0
Other, general Internet site 2 33.3
Other* I 16.7
Table 34 - Sources of information regarding WLAN security
*The oLlter source in this case was security seminars.
These results are compared to and combined with the results of
Question 10 in section 4.2.14.
4.2.4. Question 4 results
The fourth question asked the respondents if they had enabled the
built-in WEP encryption. Five out of six respondents stated that
they had enabled WEP.
4.2.5. Question S results
The fifth question asked the respondents if they were aware of
any design flaws that allow hackers to decipher WEP-encrypted
data. The results were identical to the results of question 4, that
is, five out of six organisations responded in the affinnative. This
shows that 100 percent of the organisations that had employed
WEP were aware of its limitations.
4.2.6. Question 6 results
The organisations with WLANs were then asked if they had
employed any other enc.:ryption tools. Only one interviewee
(Respondent 15) said Yes. This organisation had implemented a
Virtual Private Network (VPN) over the top ofWEP.
69

4.2.7. Question 7 results
Question 7 asked the interviewees if their organisations had
employed any security tools other than encryption. Four or 67
percent said Yes.
The tools employed were as shown below in Table 35: ~
Security Tool Count %
Access controls 2 50
Authentication 2 50
Weak key avoidance I 25
Table 35- Additional security tools employed
One of the interviewees (Respondent 5) who responded No to
question 7 stated that the reason they had not added any further
security to their WLAN was because they had never moved their
network out of testing mode.
When the testing was conducted, between December 2000 and
May 2001, the organisation was not aware of the security
problems affecting WLA.~s. The respondent added that if they
were implementing a WLAN now, they would "at least use
[Access Control Lists] ACLs".
If the respondent was referring to Ethernet MAC ACLs then the
network might still be at risk because MAC addresses may be
spoofed, however he may have been referring to third party
ACI.s.
Questions 8 through to 12 were answered by the respondents who
have not implemented or tested WLANs.
70

4.2.8. Question 8 results
Question 8 asked the interviewees if their organisation intended to
test and/or implement any 802.11 b WLAN technology in the next
12 months.
Of the 14 respondents who had ·not already tested or implemented
a WLAN, 3 or 21 percent said that they would, while 11 or 79
percent said they would not.
Of the eleven respondents that replied No to question 8, four were
from finance organisations and three were from government.
Mining&
9%
Hotel 9%
Government 27%
Figure 22 - Organisations that do not intend to implement or
test WLAN technology, by organisation type
It is significant that none of the respondents from finance
organisations have already implemented or tested WLAN
technology, nor do they intend to in the near future. This shows
that the finance industry may have an unwillingness to use
technology that is described by many as immature and unsafe,
regardless of the perceived benefits.

4.2.9. Question 9 results
When asked if they were "aware of any security implications of
using WLANs", ten or 71 percent of the 14 organisations without
WLANs said Yes and four or 29 percent said No. When
prompted to expand on their answers, the following Jata emerged.
Wardriving
Of the ten organisations that answered Yes to this question, eight
or 80 percent were aware of the practice of war driving, though,
as for question 2, none of them mentioned it by name.
One respondent (number 18) talked about a seminar he had
attended which was held by one of his organisation's outsource
suppliers. At the seminar, the supplier conducted a war driving
demonstration in Perth to show the attendants how easy it was to
detect and in some cases, attach to insecure networks. "It was
actually quite enlightening to see that he, using this fairly basic
type of technology that he could buy down at a Dick Smith type
of shop for a few hundred dollars, and drive around in a car
saying 'there's a point ... there's a point. .. there's a point. .. ' ... in
some cases [he] was able to connect to that network.".
Thi:> seminar, where the presenter demonstrated the
vulnerabilities of real networks, appears to have made a
significant impact on the respondent, more so perhaps than if the
content of the seminar had been purely theoretical.
Another respondent was aware that some war drivers publish their
findings on the Internet for others to use. " ... in a number of
places including Perth you have places where people have
identified where locations of networks with weak points are"
(Respondent 16).
This respondent is probably referring to websites known as web
logs or 'blogs'. These sites are community~based websites that
often post maps showing the locations of open wireless networks.
72
WEP weaknesses
Half of the respondents mentioned problems with the encryption
used in 802.11 b WLANs. The comments though, were all
general in nature, for example, "from a high level perspective I'm
aware that there are WEP based problems" (Respondent 20).
When comparing these responses to those in section 4.2.2, it is
evident that the organisations that have WLANs have a higher
awareness of specific WEP problems than those organisations that
do not have WLANs.
Poor configuration
Two of the respondents made comments regarding the security
issues arising from a poorly configured WLAN. One of these
comments came from respondent 20. "I know that [the problems}
are overcome by nailing it [the WLANJ down properly, it's
usually just poor implementations that enable people to access
[the networks}".
Though poor implementations are definitely a security hazard,
some issues such as the problems with WEP are not
implementation dependent. These issues currently require third
party solutions; they cannot be fixed by "nailing it down".
Immature technology
Respondents 13 and 16 both stated that they felt that wireless
LAN technology is 'bleeding edge' technology that is still
immature, especially concerning security. "This clearly indicates
to us that the technology itself is not at a mature level yet ... we
do not consider the security of the solution mature enough"
(Respondent 16).
73

General comments
The open or public nature of radio frequency transmissions was
mentioned by three of the interviewees (Respondents 3, 11, 17).
One manager talked about the difference in priorities between
vendors and consumers. "There is a big sales push for it and
usually they tell you how great it is and you find out how bad it is
after when it could be too late" (Respondent 13).
One respondent from a large mining and exploration company
mentioned how the parent body of his organisation had
implemented organisation-wide WLAN security standards. This
particular organisation had not yet implemented a WLAN but
planned to do so within 12 months. Another company that came
under the same parent body had already put a WLAN in place.
"Our security group in [the parent organisation] said 'right- no
more wireless LANs until we've actually sorted out what the
security issues are. We are going to set up the standards so that
when you [eventually] do it, you know exactly what you've got to
do to minimise or eliminate the risk" (Respondent 18).
In March 2002, once these standards were in place, the security
group conducted audits on any existing WLANs within the group
of companies to ensure that they were compliant. The security
group told the IT managers "if you are not up to scratch in tenns
of your security, we're discotmecting you from the rest of the
[organisation] network".
This stance from the organisation's internal security group
indicates how seriously they view unsafe WLANs. They are not
prepared to jeopardise the security of the network because
someone within the group has set up an insecure WLAN, which
could potentially open up the entire network to intruders.
74
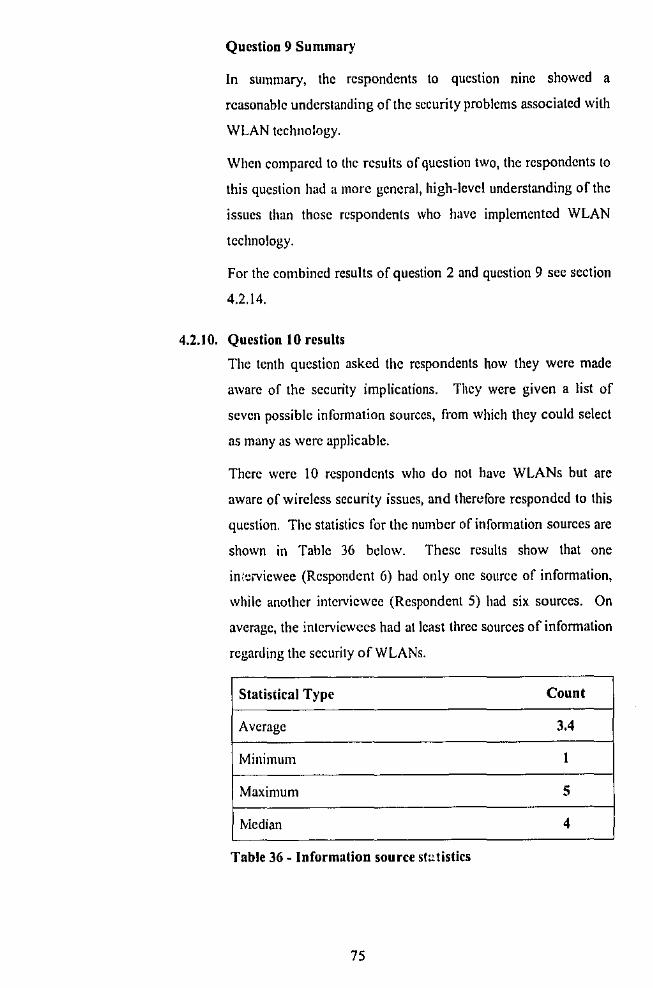
Question 9 Summary
In summary, the respondents to question nine showed a
reasonable understanding of the security problems associated with
WLAN technology.
When compared to the results of question two, the respondents to
this question had a more general, high-level understanding of the
issues than those respondents who have implemented WLAN
technology.
For the combined results of question 2 and question 9 sec section
4.2.14.
4.2.10. Question 10 results
The tenth question asked the respondents how they were made
aware of the security implications. They were given a list of
seven possible information sources, from which they could select
as many as were applicable.
There were 10 respondents who do not have WLANs but are
aware of wireless security issues, and therefore responded to this
question. The statistics for the number of information sources are
shown in Table 36 below. These results show that one
in\::rvicwee (Respondent 6) had only one source of information,
while another interviewee (Respondent 5) had six sources. On
average, the interviewees had at least three sources of information
regarding the security of WLANs.
Statistical Type Count
Average 3.4
Minimum I
Maximum 5
Median 4
Table 36- Information source sf::tistics
75
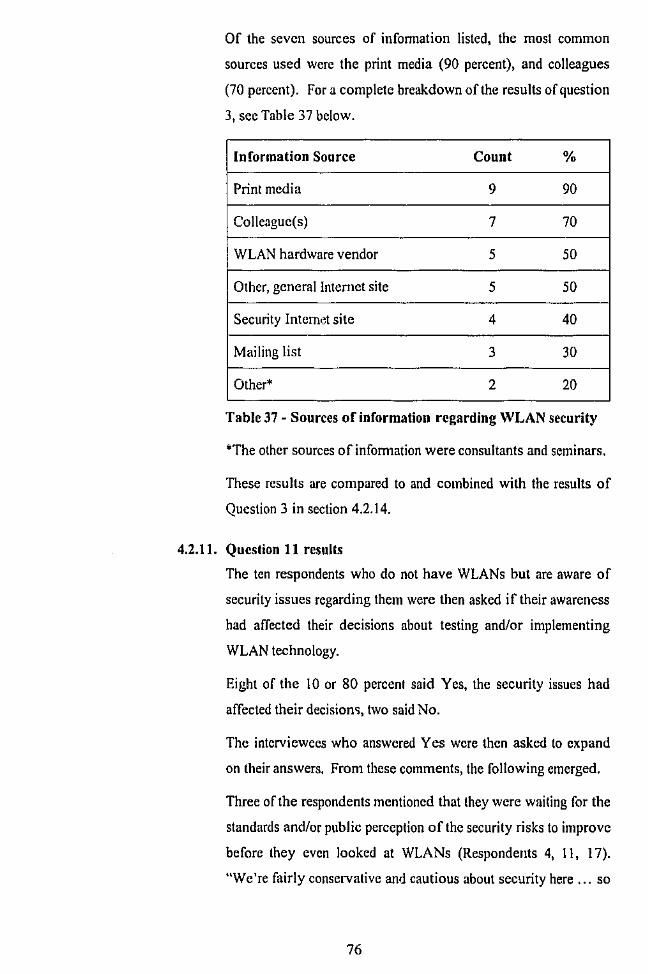
Of the seven sources of infonnation listed, the most common
sources used were the print media (90 percent), and colleagues
(70 percent). For a complete breakdown of the results of question
3, sec Table 37 below.
Information Source Count %
Print media 9 90
Colleaguc(s) 7 70
WLAN hardware vendor 5 50
Other, general Intemet site 5 50
Security Intcm·~t site 4 40
Mailing list 3 30
Other* 2 20
Table 37- Sources of information regarding WLAN security
*The other sources of information were consultants and seminars.
These results are compared to and combined with the results of
Question 3 in section 4.2.14.
4.2.11. Question 11 resuUs
The ten respondents who do not have WLANs but are aware of
security issues regarding them were then asked if their awareness
had affected their decisions about testing and/or implementing
WLAN technology.
Eight of the 10 or 80 percent said Yes, the security issues had
affected their decision'>, two said No.
The interviewees who answered Yes were then asked to expand
on their answers. From these comments, the following emerged.
Three of the respondents mentioned that they were waiting for the
standards and/or public perception of the security risks to improve
before they even looked at WLANs (Respondents 4, 11, 17).
"We're fairly conservative and cautious about security here , .. so
76

we're quite prepared to sit back and wait to see how the standards
and technologies change to reduce the risk" (Respondent 17).
This reluctance is similar to that expressed by respondents 13 and
16 in section 4.2.9. The comments indicate that the interviewees
expect that the technology will eventually mature to a point where
the risk is acceptable.
Two of the respondents, one from government and the other from
mining and exploration, expressed major concerns about exposing
information about their organisations to others. "Because we are
in a political environment and things that go on in here could
cause headlines and a great deal of embarrassment, security is
very important to us, so if we know that there is a risk it would be
a mistake to try and implement it and expose ourselves"
(Respondent 3). " ... we are also involved in the uranium and
.mclear industry so we wouldn't like to sort of make ourselves too
easy a target for industrial espionage" (Respondent 13).
In this case, both respondents are demonstrating a distrust of the
technology and a belief that wireless cannot offer confidentiality.
Respondent 18, from a mining and exploration organisation stated
that WLAN security problems had caused his organisation to
defer implementing a WLAN that they had planned to put in place
in the middle of2002.
77

4.2.12. Question 12 results
Question 12 was an open-ended question that asked the
interviewees if they had any reasons other than security for not
testing or implementing WLAN technology. From the fourteen
responses to this question, the following data emerged.
Cost
Five of the fourteen respondents stated that cost was currently a
significant restriction to implementing WLAN technology. The
IT manager for a large Perth hotel said that cost was the reason
they were not currently looking at wireless. "We've got a V1~ry
small IT budget for the next 24 months so we're not doing
anything 'speccy' [sic]" (Respondent 10).
Another respondent stated that as far as he was concerned,
security was the biggest factor but "the company would always
say that cost was the most important" (Respondent 11 ).
These respondents felt that the cost of implementing WLAN
technology was not justified by the benefits gained by moving to
wireless technology.
The issue of cost arises again in the anecdotal infonnation
collected. See section 4.2.13.
Lack of Business Drivers
Five of the respondents gave reasons that were to do with the
perceived lack of business drivers for implementing wireless.
Generally, they felt that the benefits of wireless were not
significant enough to warrant the cost and effort of implementing
it.
One respondent remarked that there had not been any great
demand from his users (Respondent 3) while another did not see
the need to move to wireless because they were satisfied with
their current. network configuration (Respondent 12).
These respondents indicated that the impetus for moving to new
technologies would generally come from the users. At this stage,
78
______ --,·~-

these users had not made any significant demands to incorporate
wireless into their networks.
Speed and Bandwidth
Two of the people interviewed felt that the speed of wireless did
not measure up to other available technologies. "You can run a 1
gig network at the moment and you wouldn't get close to that on
wireless (Respondent 11 )". One finance company had looked at
using WLAN technology to act as a bridge between two buildings
but ended up running a fibre-optic cable under the road instead.
This decision was made because of the slowness of wireless
compared to optic fibre.
Other Reasons
Two of the fourteen respondents had no other reason, other than
security, for failing to take up wireless LAN technology
(Respondents 13 and 17). One interviewee stated that he was
currently too busy to look at wireless properly; he had looked at
wireless briefly, but was put off by all the security issues. He felt
there were other areas within his organisation that needed
attention more than wireless (Respondent 18).
Another organisation had considered wireless and had reached the
point where they asked Cisco to do a site survey. This survey
found that the building the organisation is currently occupying
had too much cabling in the roof and too much steel in the walls
and ceilings. The composition of the building means that if the
organisation wants to use wireless, they could only achieve
horizontal transmissions across each floor; vertical transmissions
between floors would be impossible (Respondent 4).
This was the only respondent who indicated that their premises
were not suitable to wireless. This issue has received very little
press in the push for wireless technology.
79

Question 12 Summary
After scrutinising the responses to question 12, the summary
information given below in Table 38 and Figure 23 was
generated.
Note that three respondents gave more than one other reason for
not taking up wireless technology.
Respondent 1 found both cost and a lack of business drivers to be
reasons, respondent 3 stated that after security, bandwidth and a
lack of need were issues, and respondent 11 felt that cost and
bandwidth were both significant, after security.
Reason Count %
Cost 5 3I
No drivers 5 3I
Speed or bandwidth 3 I3
No other reason 2 I3
Unsuitable premises I r,
Too busy I 6
Total I7 100
Table 38 -Reasons for not using WLAN technology (other
than security)
80

Cost
29%
Too busy
6% Unsuitable
preilllSes
6%
No Drivers
29%
No other
reason
12%
Speed or
Bandwidt
18%
Figure 23 - Reasons for not using WLAN technology (other
than security)
These figures may be compared to those found by the SECURE
Computing market research (see section 2.2.2 for details). This
research found that security was the biggest obstacle to deploying
WLANs, followed by cost.

4.2.13. Anecdotal responses
At the completion of the structured questions, the researcher
explained to each respondent that the study was not testing any
hypothesis and that anecdotal evidence was being collected. The
interviewees were then invited to add anything that they felt
might be relevant. The statements that were made by the
respondents were analysed and then arranged into the following
categories:
• Security related comments;
• Cost issues;
• Business driver issues;
• Speed and bandwidth comments;
• Interference problems;
• hnmature technology;
• Current and potential u&.::s; :md
• The future.
Security related comments
Thirteen of the twenty respondents made comments about the
secu.rity of wireless.
One organisation is planning to install a WLAN towards the end
of 2003. The person interviewed from that organisation expects
that by ~he time the WLAN is rolled out, the security issues would
be resolved (Respondent 5) .
.. 1 think security is an issue. I'm sure it will be addressed by the
vendors and software companies with their security and
encryption tools over time" (Respondent 7).
"I see no reason once those sort of issues are addressed why we
wouldn't be doing it ... The technology is probably just a bit early
for us yet because of the security issues, but once that's settled,
we'll be more than happy to 00 looking at it and putting it in"
(Respondent 17).
82

Though many of these comments were about the current security
problems, there was a general expectation that the shortfalls in
WLAN security will be fixed in the near future.
Two of the respondents mentioned seminars that they had
attended regarding the security of WLANs. At one seminar, a
security consultant from the United States demonstrated the
inadequacy of the security of some Perth WLANs. The
demonstration showed that these WLANs had been set up using
default configurations and that they were highly vulnerable to
unauthorised access.
When prompted for more infonnation about the seminar, the
respondent made a comment in regards to people's knowledge of
security issues.
"I mean a lot of people effectively have relatively limited
knowledge with how you should properly encrypt a network.
Some of them will be deploying default technology especially if it
is unmanaged. If not, then in default encryption mode, which is
very easy to break. The gist of the presentation was that you
shouldn't put your faith into out~of~thc~box solutions"
(Respondent 16).
Another respondent made a similar comment about "off~the·
shelf' implementations. " ... People aren't implementing it
properly, they are just whacking in an off-the·shelfproduct, and
putting in a few cards and seeing how it goes, not realising that
there are shared bandwidth issues" (Respondent 20).
These concerns were strengthened by two other respondents who
stated that they were not aware of any security problems with
WLANs.
"I didn't know there were any security issues... It's certainly
something that we will need to consider. Now that I've been
made aware of it, I will have to look into it" (Respondent 8).
"Security is something I hadn't really thought of' (Respondent 9).
83

As both these respondents were planning to implement WLANs
in the future, this lack of awareness is disconcerting.
Other security-related comments indicated that the security issues
were holding organisations back from deploying WLANs.
"I guess it's a technology that we're interested in pursuing but the
security issues just come up every time so we've said no, we're
not going to touch it yet, we'll wait and see" (Respondent 17).
"It's something we recognise that it's easy to deploy it but it's not
easy to deploy it securely. We need a lot more time to make sure
we do it properly" (Respondent 5).
These comments tie back to the responses to questions 11 where
eight out of 10 respondents had stated that security issues had
affected their decisions about testing or implementing WLAN
technology.
Some security countenneasures such as doing external scans and
having your network independently audited were discussed.
"You can reduce the actual output of the access point so that you
don't radiate outside your building, so you reduce that down ...
we would probably do scans around the building to make sure
that our signals are not being transmitted outside" (Respondent
5).
"We employ consultants who frequently work with us to ensure
that our wireless network conforms to industry best practices"
(Respondent 15).
The mention of these countermeasures is evidence of an
awareness that there are methods for reducing the risks of using
WLAN technology.
84
Cost issues
There were conflicting opinions about whether WLANs would be
a cost burden or a cost saving.
A security consultant felt quite strongly that it was not yet cost
effective. "While it's not cost effective, forget it. It's the simple
answer, it doesn't matter how good it is, if it's not cost effective.
In the commercial world, cost is an even bigger bsue than
security" (Respondent 6).
This opinion was countered by another respondent from a
government department who felt that implementing a WLAN
could result in a cost saving. "We can see the benefits from cost
savings in relocations and office changes for a start ... just the
physical costs of moving and putting new points in walls and
cabling ... we're sure to save money" (Respondent 17).
The comment from respondent 6 reflects the opinions of many
others. Cost was stated as a reason for not implementing WLAN
technology by five of the 14 respondents to question 12 (see
section 4.2.12) and in the results of the SECURE Computing
market research, cost was the second biggest obstacle to
implementing WLANs. However, the comment from respondent
17 demonstrates that the respondent has perhaps looked more
closely at how wireless might be of benefit to his or her
organisation. If an organisation has to cater for a flexible
workforce, where people change offices or departments
frequently, then wireless may prove more cost effective than fixed
wiring.
Business driver issues
Many comments were made about the COhlmercial reasons for
businesses not implementing WLANs. "I think [aJ lack of
commercial factors would be the main issue why people don't
take it up" (Respondent 16).
85

Four respondents (respondents 3, 7 12 and 13) commented that
for their organisations, they did not currently have any reasons for
putting in WLANs.
"I guess we'll review what benefits we'd get out of it, we have
thought about it but at the moment we haven't seen any real need
to go to wireless, so we'll keep an eye on it and review any
possibilities" (Respondent 12).
"There's so much investment in existing network infrastructure,
there's no point in junking that for the convenience of not having
a few cables" (Respondent 13).
These comments are similar to remarks made in answer to
question 12. See section 4.2.12.
Some of these comments reflect the respondents' beliefs that
wireless is used as a replacement for wired networks. WLAN
technology is most oftea used as an adjunct to, rather than as a
replacement of, wired networks in order to provide flexibility and
portability where needed. There is generally no need to "junk
existing infrastructure".
Speed and bandwidth comments
There were also conflicting opinions about whether the bandwidth
ofWLANs is sufficient for most networks.
One interviewee stated that bandwidth was not as important as
network stability. He mentioned that his organisation had been
offered, by the owners of the building, a }~gigabyte fibre~optic
network medium but he said, "I don't see the benefit to changing
from what we are doing at the moment" (Respondent 14).
Another point of view is that bandwidth is not as important as
others make out. "People put too much weight on bandwidth.
[The need for] a lot of bandwidth ... has come because a lot of
software and different applications are so inefficient with the way
they communicate. We've actually got some satellite
communications that we use here and that's relatively small
86

bandwidth compared to fibre optics and other Jandline stuff'
(Respondent 13).
In contrast to this, others felt that wireless could not deliver the
same content they get with their existing network infrastructure.
"We are now running everything at lOOmbps. We use [our
networks] to deliver video, we use them to do a lot of other things
and I'm not quite sure that wireless will work that well in those
sorts of scenarios" (Respondent 3).
"The actual bandwidth ... and throughput on the LAN [is] still
pretty ordinary .... you can do your nonnal work through that but
if you start to really try and do heavy load type stuff, [wireless]
jus:· can't cope with that" (Respondent 18).
"Though they talk about 11 meg, the realistic throughput is
nothing like that. ... we have to wait for the technology to mature
enough to give us the required bandwidth" (Respondent 19).
As with the business driver issues in the previous section, these
responden~s seem to be talking about wireless as a replacement
for fixed~ wire networks.
Immature technology
Two respondents felt that wireless LA.~ technology is still too
immature to consider using it at this stage. One of these
respondents described wireless as 'bleeding edge' technology.
"Wireless seemed to be a little bit too 'bleeding edge'... If you
are on the cutting edge or the bleeding edge you just are burnt
every time, and it is expensive. It is not worth the headache.
We'll let the technology sort itself out and then look into it"
(Respondent 12).
"!t's something t:1at we had a look at, sort of 12 or 18 months ago
but we didn't even dip our feet in the water ... .It's relatively new
in the lifespan of the technology so we thought we'd sit on the
fence a bit longer" (Respondent 13).
Similar comments were made in response to Question 9.
87
-- ,. --- ,--
Labelling a technology as "bleeding edge" infers an untested
technology or technology so new that its ramifications on the
stability of a system or business have not yet been determined. It
also implies that a failure of this technology may hurt the bufiness
or system.
Interference problems
One interviewee talked about how his organisation had caused
some interference problems with a wireless bridge they had
installed between two buildings. "We're interfering with others
and they're interfering with us, knocking out our signal. We were
interfering with a retail outlet that sold satellite navigation
equipment" (Respondent 19).
As there is a limited amount of bandwidth available to 802.11 b
WLAN technology, interference may be inevitable, however there
are several channels available to users to attempt to rectify
interference problems.
Current and potential uses
Many of the comments made to the researcher were to do with
current or potential uses for wireless LAN technology.
One government organisation uses wirele3s for special events but
does not currently use it within their internal network
(Respondent 2).
Another government organisation uses wireless but mainly
because one of their buildings is heritage listed which precludes
them from using fixed cabling (Respondent 15).
Two of the three mining and exploration companies interviewed
could see potential applications for wireless technology for their
organisations.
Respondent 18 is the IT manager at one of these companies. This
respondent mentioned that the organisation currently have
problems at mining sites in getting communications from the
workers in the bottom of a pit to the ¥Jorkers at the top. Currently
88

,;>-- -.·,; __ ,_. -- ~'- ... \ --· ,(
-,._; -,_,
.hey use very expensive satellite and mobile phone
communications but see wireless as being a very good candidate
to replace the current system.
"We've got a huge amount of data thal's transmitted from the
haul pack trucks which are on the move all the time, we have a
control tower on top of the hill, they're monitoring a continuous
stream of data from eaGh truck, from each shovel, from each
crane .. , the whole thing, they are all connected. At the moment
we arc using radio, GPS, satellite, it's actually quite sophisticated.
I sec wireless as getting down from the big Lits of equipment that
can carry that sort of transmission equipment to the person who
can't, and hopefully replacing their mobile with a connection
point, probably through PDAs, that's where we envision it going"
(Respondent 18).
Ano~;er mining and exploration company has used wireless in
point-to-point communications at a remote mining site. "We
would use the [access point] to do distance communication
without cabling ... we've done a lot of that up in the northwest
where cabling is very difficult ... so we usc it point to point in
bridge mode" (Respondent 5).
This same organisation intends to use WLAN technology to
improve the mobility of its workers, but not until they move
buildings. "In the new building we're going to have a lot of , ..
collaboration areas, where people will be able to ... sit down and
have a meeting. The whole idea is to give people the flexibility to
work where they want. We will still be running IPTel over
wireless as well, ... so they can just sit [in the collaboration area}
and it's like they are sitting at their desk, their telephone's here
connected to the network (Respondent 5).
Anoth-:-r organisation mentioned that they were also moving
premises and would look at wireless again when it was time to
develop the infrastructure for the new building (Respondent 7).
89
J,
II 'I
" '
-I .. __
, ... ,
-_'' -.- -
Shifting locations presents an ideal time for an organisation to
incorporate wireless technology into the corporate network, as the
organisation has not spent money on a wired infrastructure.
Other respondents spoke of using wireless in ad hoc situations
where users are bringing laptop computers into a meeting or
training room (Respondents 8, 12 and 19).
The future
A few respondents made comments regarding the future of
wireless, both within their own organisations and in general.
"In the commercial world it will be interesting to see whether they
pick up wireless as a preferred option because whilst they have
systems that are hard-wired ... and it's up and working they would
see no reason to install it" (Respondent 6).
This remark, as with the comments on cost, and busines:; driver
issues in previous sections, indic<~tes that the respondent views
wireless as a replacement for wired networks. This view is not
shared by respondent 7.
"I don't believe it's going to be a total replacement for current
network infrastructures. It will be an additional or an optional
sort of set up that an organisation will adopt so they will still have
fixed cabling throughout buildings and wireless will be more of a
tool to allow some sort of mobility but it won't be a complete
replacement" (Respondent 7).
One respondent made comments regarding his perception of the
state of the IT industry, and how wireless might be affected by it.
"I think that wireless's time is coming. I think wireless is
probably one of the areas ofiT that is likely to either not diminish
in size and importance but if anything grow. I personaHy see a
big downturn coming in the IT industry; I think it's already
beginning or begun. Pretty much, post 2000 and all the fear that
came out of Y2K and all the waste of mon~y that was spent...
wireless I think could be a little bit immune to that because it's
addressing a new upcoming market" (Respondent 13).
90
·-. ;>. _.' ,, \. . ,,_ ., -<:'-

- ,_,- ' ',;'
One other respondent spoke of not implementing new technology
just for the sake of it.
"It's really about making sure that whatever we do has a really
useful business application. We're not doing it just for the fun,
there [has] to be a very real business problem that we are trying to
resolve and there has to be benefit to solving the problem. If
there's no benefit out of fixing it, I won't fix it. We wUI only do
wireless when I can see there's value in it" (Respondent 18).
91
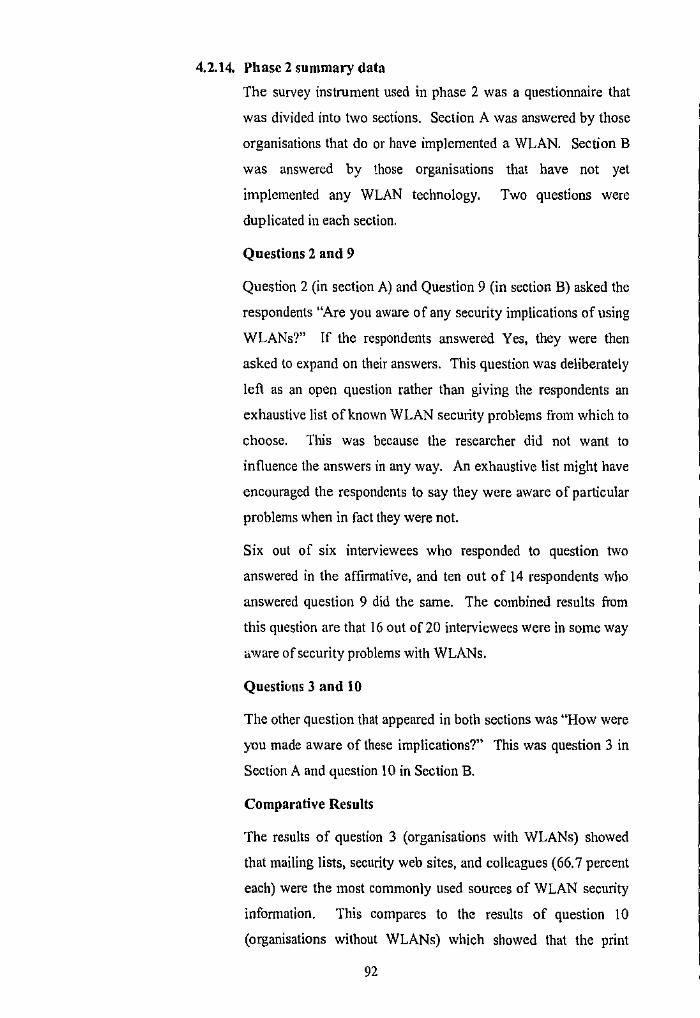
4.2.14. Phase 2 summary data
The survey instrument used in phase 2 was a questionnaire that
was divided into two sections. Section A was answered by those
organisations that do or have implemented a WLAN. Section B
was answered by those organisations that have not yet
implemented any WLAN technology. Two questions were
duplicated in each section.
Questions 2 and 9
Question 2 (in section A) and Question 9 (in section B) asked the
respondents "Are you aware of any security implications of using
WLANs?" If the respondents answered Yes, they were then
asked to expand on their answers. This question was deliberately
left as an open question rather than giving the respondents an
exhaustive list of known WLAN security problems from which to
choose. This was because the researcher did not want to
influence the answers in any way. An exhaustive list might have
encouraged the respondents to say they were aware of particular
problems when in fact they were not.
Six out of six interviewees who responded to question two
answered in the affinnative, and ten out of 14 respondents who
answered question 9 did the same. The combined results from
this question are that 16 out of 20 interviewees were in some way
aware of security problems with WLANs.
Questiuns 3 and 10
The other question that appeared in both sections was "How were
you made aware of these implications?" This was question 3 in
Section A and question 10 in Section B.
Comparative Results
The results of question 3 (organisations with WLANs) showed
that mailing lists, security web sites, and colleagues (66.7 percent
each) were the most commonly used sources of WLAN security
infonnation. This compares to the results of question 10
(organisations without WLANs) which showed that the print
92
media (90 percent), and t:olleagues 00 percent) were the most
common sources.
These results may indicate that those persons responsible for
WLANs are possibly more likely to seek out information
regarding security (by subscribing to mailing lh:ts and visiting
security-based web sites), whereas the respondents from
organisations that do not have WLANs may learn of the issues
without intentionally seeking the information (via the print
media).
Combined Results
These questions were answered by 16 respondents (those who had
said Yes to either question 2 or question 9).
For individual results, please refer to sections 4.2.2 and 4.2.10.
The combined results are as follows:
Of the seven sources of information listed, the most common
sources used were the print media (75 ,ercent), hardware vendors,
colleagues and mailing lists (50 percent each). For a complete
breakdown of the combined results of questions 3 and 10, see
Table 39 below.
Information Source Count %
Print media 12 75.0
Colleague(s) II 68.8
WLAN hardware vendor 8 50.0
Security Internet site 8 50.0
Mailing list 7 43.8
Other, general Internet site 7 43.8
Other* 3 18.8
Table 39- Sources of information regarding WLAN security
*The other sources were seminars (2) and consultants.
93

5. Discussion As recently as May 2002, a computer security journalist stated that there was "a
disparity between the amount of wireless activity in the corporate community and
the low level of awareness of the vulnerability nf radio local area networks"
(Couzins, 2002). In regards to Perth, this statement is not supported by the results
of phase 2 of this study, which shows that 80 percent of participating
organisations were aware of the security issues related to WLAN technology.
The statement by Couzins is also refuted by the results of phase 1 of this study
which showed that on average 63 percent of the 134.8 detected infrastructure
networks had enabled WEP leaving 37 percent unprotected. Reports publishe-d
earlier, in Australia anC overseas, give much higher figures of unprotected
networks. For example, in January 2002, Mackenzie reported that more than 80
percent of corporate wireless networks detected in Sydney, Australia had no
security whatsoever (2002). Similar reports were made on the state of security of
WLANs in the United States and London. The US scans found that only about 39
percent had enabled WEP while the report on the London scan showed that over
two thirds of the networks were unprotected.
As the specific methodological details of these scans were not reported, it is
difficult to compare the results to those found in phase 1 of this study. However,
the results of this study indicate that awareness and security tool usage are
significantly higher than may have b:.""f!n expected.
This reduction in the number of unprotected networks is significant and may be a
result of an increased awareness of the problems associated with WLAN security.
The results of this study show that a lower percentage of WLANs have not
changed the default settings. The Barnes text stated that nearly 40 percent of
WLANs had yet to change their configuration from the factory default (2002, p.
315). In Perth, this proportion was measured at only 15 percent.
Much of the literature that was read in preparation for this thesis implied or stated
that a large proportion ofWLANs lack even basic security. This deficiency was
blamed on a lack of knowledge on behalf of those responsible for implementing
and/or managing the wireless networks. The results from both phases of this
study demonstrate that in Perth, this implication is not true. Neither is the
assertion that there is a lack of knowledge regarding the security implications of
wireless networks.
94
' '
The results of phase two of this study show that among the study participants
there is quite a high level of understanding of the benefits and limitations of
WLAN technology.
One hundred percent of the government departments that participated in the study
were aware of the security implications, as were all of the organisations that
classified themselves as mining and industry.
It also emerged that larger organisations showed a greater awareness of the
security problems. All 10 organis;;.lions that have more than 100 network nodes
were aware ofWLAN security probiems.
Those respondents with WLANs had a higher awareness of specific problems,
especially with the built in encryption, however some of those without WLANs
knew more about issues like war driving and the problems associated with poorly
configured WLANs.
In summary, the results of this study show that in Perth the majority of those
persons responsible for the implementation and management of wireless networks
are aware of the problems and have taken steps to secure their networks.
95
_i,'

6. Conclusion The objective of this study was to investigate and report on the levels of usage of
wireless LAN technology in Perth, as well as the levels of knowledge of the
security issues surrounding WLANs.
In the introduction to this thesis the issues presented were why WLANs are
becoming more popular, how the security of WLANs differs from the security of
wired networks, and what types of atta1~ks may be (and have been) perpetrated
against WLANs. This study was initiated to determine how WLAN security
issues affect Perth organisations.
The literature review showed that WLAN security was proved vulnerable as early
as March 2000. By August 2001, free software tools were available that could
determine encryption keys from captured packets. It was shown that increasing
the length of the key did not negatively affect the capability of these tools. Many
authors felt that WLANs '.vould need third party tools to be made secure. The
literature showed that the built~in encryption did not meet its stated goal, which
was to provide privacy that was equivalent to the level provided by a wired
network. New standards are under development to rectify this shortfall.
The general aims of the first phase were 1o detennine how many WLA:·:, were
detectable in the Perth CBD and the percentage that have enabled WEP. These
aims were achieved. Additionally, phase 1 was able to show how many WLANs
were still using the manufacturer's default settings and how the network devices
may be grouped according to manufacturer.
The results of phase 1 were limited by several factors. The regions scanned did
not incorporate suburban areas so home networks were not included in the results.
The antenna used was a directional antenna and as the researcher was not able to
reposition the antenna whilst driving, some networks may not have been detected.
Timing of the scans may also have had an impact on the results. These factors not
withstanding, the results were fairly consistent across the five scans. The results
are themselves limited by the fact that they are only a snapshot of what was
happening at the time of the research.
The general aims of the second phase were to find out if the IT managers of
various Perth organisations were aware of the security issues related to WLANs
and also to find out the degree to which the security tools and processes have been
96

implemented. These mms were also achieved and in addition, anecdotal
information was collected and analysed.
The results of this study are significant within the Perth IT community because
they show that the participants have an understanding of the benefits and
limitations of wireless, but also a reluctance to implement it too quickly.
97

. ,, '
7. Further Study The scope of this research project was limited by the time and resources available
to the researcher. As a consequence, there is plenty of scope for future research
based on, and relating to, the findings of this study.
The methodology of the phase 1 research could be expanded to detennine:
• if different scanning software produced different sets of results;
• if using different antennas produced different results;
• if the timing of the scans affected the results; and
• if the weather and temperature of the equipment affected the results.
The results of phase 2 could be verified by conducting case studies of
organisations that have implemented WLANs to detennine what they use them
for, how they are configured, what security tools are in place, and how they are
connected to any wired networks.
98

References Airsnort software available from http://airsnort.shmoo.com/
AirSnort Tool Cracks WEP in 15 minutes (2001). Computer Fraud and Security Journal. September, 2001. p. 5
Andress, M. (2002). Wireless J_,Ocal Area Network Security. Retrieved June, 2002 from: http://www. wmrc.com/busincssbnc!ingl
Arbaugh, W., Shankar, N. and Wan, Y.C. (2001). Your 802.11 Wireless Network has no Clothes. Retrieved May, 2002 from: www.cs.umd.edu/-waa!wireless.pdf
Babbie, E. (l992). The Practise of Social Research. 61h Edition. Wadsworth Publishing Company, California.
Barnes, C., Bautts, T., Lloyd, D., Oullet, E., Posluns, J., Zendzian, D. (2002). Hack proofing your Wireless Network. Syngress Publishing Inc. USA
Batista, E. (Nov 15, 2002). Wi-Fi Encryption Fix Not Perfect Retrieved November, 2002 from: http://www.wired.com/ncws
Blackwell, G. (January, 2002). Serious WLAN Security Threats: Part II. Retrieved July, 2002 from: www.80211-plantc.com/columns
Borisov, N., Goldberg, I., Wagner, D. (2001). Intercepting Mobile Communications: The Insecurity of802.11. Retrieved May, 2002 from: http://www.isaac.cs.berkeley.edu
Borisov, N., Goldberg, L, Wagner, D. (2001). Security of the WEP algorithm. Retrieved May, 2002 from: http://www.isaac.cs.berkclcy.edu/isaac/wen-faq.html
Brewin, B. (June, 2002). Nets Exponsed by 'rogue' threats. Computerworld. Volume 36. Retrieved July, 2002 from: Proque5t database.
Brewin, B. (August, 2002). War flying: Wireless LAN sniffing goes airborne. Computerworld. Retrieved January, 2003 from: www.computerworld.com quicklink# 32566
Bre\dn, B. (September, 2002). Worldwide 'war drive' exposes insecure wireless LANs. Retrieved January, 2003 from http://www.computerworld.com
Chandra, P (2002). Security in Wireless Networks. Retrieved July, 2002 from: http://www .columbia.edu/itc/ce/c6951 /2002spring/Projects/CVN/rcport l.pdf
Cohen, F. (2001). The Wireless Revolution. Network Security Journal. June, 2001. p. 17
Computer Security Grants Program. National Institute of Standards and TechnologyCritical Infrastructure Grants Program- Computer Security Division. Retrieved July, 2002 from: http://csrc.nist.govhu·ants/awards.html
Couzins, M. (May 2002). Wireless networks- is yours secure?. Computer Weekly, May 23, 2002 p54. Retrieved July, 2002 from Expanded Academic ASAP database.
Cox, J. (October, 2002). Wireles LAN attacks grow in sophistication. Retrieved November 2002 from: Proquest database.
Creswell, J. W. (1998). Qualitative Inquiry and Research Design. Sage Publications. California.
De Spi~geleire, K. (2001). Wireless LANs: the new vulnerability? Security Management Today. December, 2001. p.Sl
99

Douglas, J. V. (September, 2002). Home LANs risk accidental hacks. Retrieved February, 2003 from http://ncws.zdnet.eo.uk/
Ellison, C. (2002). Wireless LANs at Risk. Retrieved April, 2002 from: http: if\, ww. pc Ill a g. com
Flickenger, R. (2001) Antenna on the Cheap. Retrieved March, 2002 from: http:/ I w w w .orci 11 vnct. com/ c s/wcb log/vi cw I w 1 g/448
Fluhrer, S., Mantin,l., Shamir, A. (2001) Weaknesses in the Key Scheduling Algorithm ofRC4. Retrieved May, 2002 from: http:/ I down 1 o~ld s. sec uri 1 y !l1cus. com/] i brary/ rc4 ksaproc. pdf
Gast, M. (2002). 802.11 Wireless Networks The definitive guide. O'Reilly and Associates, USA.
Gast, M. (2002). Wireless LAN Security: A Short History. Retrieved May, 2002 from: \\W\\'. orei 11 vnet .c om/1 pt/ a/ /w i rc 1 css/2002/04/ I 9/ security. htm I
How to Build a tin can Waveguide antenna. Retrieved January, 2003 from: ht I p ://w ww. 1 urn poi at. nct/wi rc 1 css/ cant en nahowt o. h tm I
IEEE OUI and Company ID Assignments. Retrieved January, 2003 from: hIt p :/I standards. i ccc. andre gau th/ ou iii ndex . shtm I
Intel- Wireless Security and VPN. (2001) Retrieved April, 2002 from: ht 1 p :I /www. i ntc 1. com/ network/ con nee t i vi t y/resourccs/ doc I i brary/ documents/pd f/W LO Security WP LOWrcz \.pdf
Johnson, B. C. (2002). Wireless 802.11 LAN Security: Understanding the Key Issues. SystemExperts Corporation. Retrieved July, 2002 from: http://www. system ex pcrts .co m/t u tors/ w i rc I css- issues. pdf
Karygiannis, T. and Owens, L. (September, 2002). Wireless Network Security. Retrieved November, 2002 from: http:/ I csrc. n i st. !.!O v /pub 1 i cations/ d ralls/ dra n -sp800-48. pdf
Kershaw, M. (2002). Linux 802.1\b and wireless (in)security. Retrieved May, 2002 from: !ill.P: I /w\vw .1 i nux security. com/ f cat u re stori es/wi relcss-k ism ct. h tm I
Lancaster, T. (2002). VPN Termination. Retrieved May, 2002 from http://scarchnctworking.tcchtargct.com/tip/ 1 ,289483 ,sid7 gci8157 58,00.html
Leyden, J. (2001 ). Rogue WLA~s- the next security battlefield?. Retrieved May, 2002 from: h t 1 p :/ lwww. thcrcgi st er. co.u kl con t cnt/5 5/20920. html
Mackenzie, K. (2002a). Wireless Network:; Unprotected. Retrieved March, 2002 from: http://australiani t.ncw.com.au
Mackenzie, K. (2002b). Wireless Protection Nightmare. The Australian. p.31
Maxim, M. and Pollino, D. (2002). Wireless Security. McGraw Hill. California USA.
Mills, K. (2001 ). Tum on wireless encryption to tune out hack1!rs. Retrieved May, 2002 from: http://www.computcrworld.com.au
Miller, S. K. (July 2001 ). Facing the Challenge of Wireless Security. Technology News. July,200l.p.18
Mitchell, M. and Jolley, J. (1988). Research Design Explained. Holt, Rinehart and Windston, Inc. New York.
PC Webopaedia (2002). Definition ofDHCP. Retrieved July, 2002 from: http://www.pcwcbopacdia.com/TERM/D/DHCP.html
100

PC Webopaedia (2002). Definition of SSID. Retrieved July, 2002 from: http:.'/\\\\'\\' .pcm:bopaedia.com/TE R l\.1 /SISS I D.html
Pollino, D. (2002). How to secure an office wireless network. Ne~work Security Journal. January, 2002. p. 12-13
Rothberg, A. (March, 2002) Tales of a White Hat War Driver. Retrieved July, 2002 from \\-w~--=-LlfL'! 11 )'!lC\Rl_t_~ljpJ 'a: /wire lcss~OCJ" 103/29/wanlrivcr.htm!
Savage, M. (September, 2001 ). Insecure WLANs Face Risk of Athck. Computer RescUer News. September 2001. p. 49. Retrieved July, 2002 from: Expanded Academic ASAP.
Schenk, R., Garcw, A., lwanchuk, R., (August 2001). Wirless LAN Deployment and Security Basics. Retrieved July, 2002 from: \\'\\"W.cxtrcmctcch.col\l
Shipley, P. (200! ). Retrieved June, 2002 from: www.wardriving.corn/about
Simon, D., Aboba, B., and Moore, T. (2000). IEEE 802.11 Security and 802.1X. Retrieved July, 2002 from: !ilip: -'..'www. iel'eSt P .<1[g I m irror..'S02 1 /docs 'lfJ()()/!-:021 x Sccurit y.PDF
Sproull, N. (1988). Handbook of Research Method~~ 2m1 Edition. Scarecrow Press, Inc. USA.
SSID Defaults. Retrieved January, 2003 from: http://www. wi 2WO.org/mediawhore/n fU/wircless/ssid dcfaults/ssid dclaults~ 1.0.5. txt
Stewart, J. (2000). Connecting with Confidence. Web Techniques. Volume 5. Retrieved May, 2002, from: ProQuest database.
Stubblefield, A., Joannidis, J., and Rubin, A. D. (August 2001). Using the Fluhrer. Mantin, and Shamir Attack to Break WEP. AT&T Labs Technical Report TD-4ZCPZZ
Szerszen, D. (2001 ). Wireless Networking: Nirvana or Nightmare? N~:twork Security Journal. November, 2001. p. 7
The 'Michael' Vulnerability. (December, 2002). Retrieved January 7.003 from: http://www.R0211-p1anct.com.columns
Tl-te National Strategy to Secure Cyberspace. (September, 2002). Retrieved January, 2003 from: hlifl_;;'f!'::\\'\\'. whi.tchousc.gov/pcipb/cybcrstratcgv~dra n.html.
Trochim, W. M. K. (2002). Deduction and Induction. Retrieved July, 2002 from: http://trochiln.humar:.con1e11.edut;.;b/dcdind.htn!
Tu\litt, J. (June, 2002). Security Concerns Overshadow WLAN Boom. Retrieved January, 2003 from: http :/!www .check ~mark.com/securecomputing'2002 06/wlan/
Veri sign~ Securing Globe! Roaming for 802.11 WLAN~ C~On?~. Retrieved April, 2002 from: !HJll:!lww\\'. \'Crisign.cnm
Walker, J.R. (2000). Unsafe at any key size: An analysis of the WEP encapsulation. Retrieved May, 2002 from: http://www.tlrin:le.com/--aboba!l·t~EE.~
Webb, S. G. (2002). Wireless InSecurity- Current Issue'> with Se~;uring WLAN's utilising 802.11 b technology. Proceedings of the 3ru Australian Infommtion Warfare and Security Conference 2002. Edith Cowan University. Perth, Western Australia
WEP Security Statement . Wireless Ethernet Compatibility Alliance. (September, 2001 ). Retrieved April, 2002 from: http://www. Wi~ li.com/pdf/20011 () 15 \VEP Sccurity.pdf
WEP: ready in 15 minutes (2001 ). Network Security Journal. August, 2001. p.4
I OJ

Whitney, D. (2001 ). Business Continuity with Wireless So~utions. Retrieved May, 2002 from: http: .'\\ ww.ro:l!web.com/cisco.·T o:chWorkshonstDrcwWirelcss.pdf
Wi-Fi Alliance Announces Standards-Based Security Solution to Replace WEP. Retrieved November, 2002 from: http:.:/www.wi-ti.com
Wireless DeMilitarized Zone (WDMZ) Entcrusys Networks' Best Practices Approach to an Interoperable WI.AN Security Solution. Retrieved March, 2002 from: http:: :w\\ \\' .o:nterasvs.c<.1m prndut:,ts-'whi lcpapersiw LANDMZBestPracticcs.pd f
Wireless LAN Benefits Sh1dy (Fall, 2002). Conducted by NOP World Technology on behalf of CISCO Systems. Retrieved July, 2002 from: llllp::.'\\ W\~.:.~!!!)PJ~\.:.lJ!-,'_k~.:~~_s.!_l.!!.:.ill.t~~-:..L.6.0''~-;,2(lBencfits'X,20Study!X,20hiYo20Cisco.pdf
Wireless LANs unprotected in London (2002). Network Security Journal. March, 2002. p.2
Worldwid~_W?fdrivc --Some Frequently Asked Questions (2002). Retrieved January, 2003 from: ll!tp:i/www. world \\'idcwardri vc.org
Worldwide Wardrivc Results (2002). Retrieved January, 2003 from: hI tp: / i w w ·.v. world wi dew ardri vc .org
Young, P. (2001). Wireless LANs appeal grows, begs for protection. Computerworld. December 3, 2001. p. 4-5
102
-~·

Appendix A -Definitions of terms
Additional WLAN security tools and processes
At the time of writing, the following additional security tools and
processes have been identified. These tools and processes may be
purchased to increase the security of a WLAN.
• Implement key·hopping software to allow for the rapid and automated
update of encryption keys.
• Implement a Virtual Private Network (VPN) to add secure
authentication and encryption.
• Implement proprietary solutions to WLAN vulnerabilities.
Bandwidth Theft
Bandwidth theft is where an attacker makes an unauthorised connection to
a WLAN for the purpose of connecting to the Internet. Though the attack
is not nonnally malicious, the resources (specifically the bandwidth) of the
network owner are being used by an unauthorised party (Chandra, 2002).
Built-in WLAN security tools and processes
At the time of writing, the following built·in security tools and processes
have been identified. These tools and processes are readily available to
WLAN operators.
• Enable WEP encryption to deter casual eavesdroppers.
• Change all default identifiers and passwords.
• Change the default authentication mechanism.
• Regularly change encryption keys.
• Disable the broadcast feature of the access point (if available).
• Configure access points so that they will not respond to "probe
response" requests (Johnson, 2002).
• Configure the access points so that they do not offer DHCP for new
clients (Johnson, 2002).
• Treat all systems that are connected via 802.llb as external. Place all
access points outside the firewall. (Stubblefield, lonnidis & Rubin,
2001; Blackwell, 2002).
103

Detectable wireless networks
A detectable wireless network is an IEEE 802.11 b standard WLAN of
which wireless access point beacon signals may be detected using
?.ppropriate hardware and software.
DHCP (Dynamic Host Configuration Protocol)
DHCP is a protocol for assigning dynamic IP addresses to devices on a
network. With dynamic addressing, a device may have a different IP
address every time it connects to the network (PC Webopaedia, 2002). If
you use DHCP, the network will automatically give a hacker configured
with a stolen SSID a legal IP address.
Eavesdropping
In network security, eavesdropping refers to an unauthorised party gaining
access to a network and then being able to read that network's data.
Inductive research
With an inductive study, the researcher does not start with a definitive
hypothesis that they wish to test. Rather, the researcher believes that after
some period of observation (during which data is collected and analysed),
theories may emerge.
bduction is a largely qualitative research method that is generally used
where an area of research is relatively new and theories need to be
developed. Inductive research is often used to generate theories and later
deductive research may be used to test those theories (Babbie, 1992, p.53).
MAC (Media Access Control)
A MAC address is an address that, theoretically, uniquely identifies each
hardware node of a network. It is built into the network interface card by
the manufacturer and may be used to identify the manufacturer of the
network card. Some wireless network interface cards allow you to
reconfigure them with a new MAC address. Hackers may use this method
to impersonate a valid network node and thereby gain access to the
network (Schenk, Garcia & Iwanchuk, 2001 ).
104

RC4 is a stream cipher algorithm. RC4 is the most commonly used stream
cipher in software applications (Fluhrer, Mantin & Shamir, 2001). It was
designed by Ron Rivest in 1987 and its algorithm was kept secret until
1994. WEP is based on the RC4 algorithm.
Security issues related to WLANs
At the time of writing, the following security issues that are peculiar to
WLANs have been identified.
• The case with which WLANs may be detected and located.
• The flaws with the built-in security tools that enable hackers to
intercept and/or modify network data.
• The availability of security tools incorporated into WLAN
components.
• The availability of additional security tools developed for WLANs.
• The adaptation of wired networks' security tools which may be
employed to increase the security WLANs.
SSID (Service Set Identifier)
An SSID is a 32-charactcr unique identifier attached to the header of
packets sent over a WLAN that acts as a password when a mobile device
tries to connect to the network. The SSID differentiates one WLAN from
another, so all access points and all devices attempting to connect to a
specific WLAN must usc the same SSID. A device will not be pennitted
to joi11 the network unless it provides the correct SSID. "Because an SSID
may be sniffed in plain text from a packet it does not supply any security
to the network" (PC Webopaedia, 2002).
War driving
The tenn "war driving" originated from a practice called "war dialling"
where an attacker dials a range of phone numbers until a modem answers
(Andress, 2002). War driving is an attack method used specifically for
attacking WLANs. It is literally driving around in a motor vehicle looking
for unsecured wireless networks.
105
Wired Equivalent Privacy (WEP)
WEP is the encryption algorithm that is part of the IEEE 802.1lb standard
It is defined in the standard as proving protection to authorised users from
'casual eavesdropping' (cited in Barnes et al., 2002, p. 35). It operates at
the link layer above the MAC sublayer and is based on the RC4 stream
cipher. WEP relies on a secret key that is shared between access points
and wireless devices. The secret key is concatenated with a 24-bit
initialisation vector (N) and then used to encrypt and decrypt data
transmissions.
Wired Network
A wired network is a computer network in which the nodes are physically
connected by cable. In a wired network, the network data transmissions
arc carried via cable.
WLAN/Wireless Network
A WLAN/wireless network is a computer network where the nodes are not
physically connected. In a WLAN, the network data transmissions are
carried via wireless components such as wireless access points, wireless
network cards, and antennas.
IEEE 802.11b standard compliant Wireless Local Area Networks
(WLANs) operate in the unlicensed Industrial, Scientific and Medical
(ISM) 2.4000 to 2.4835 GHz band and may achieve transfer rates of up to
liMB/sec.
106

Appendix B- Research documents
•
107
Initial letter sent to candidates
Monday, 2 December 2002
The IT Director/Manager <Organisation Name>
•<Organisation Address> Perth W A 6000
RE: Important research into Wireless Local Area Network (WLAN) Security
Dear Sir/Madam,
The School of Computer and lnfonnation Science (at Edith Cowan University) with nearly 2000 students is the largest computing school in Western Australia specialising in applied research covering a wide range of disciplines, including computer security, software engineering and knowledge management. Strong links with IT industry and overseas research centres are the cornerstone of our research strategy.
Shortly, an honours student from our school will be contacting you regarding research into WLAN security. The student's project is concerned with the usage of security tools in wireless networks. The results of the research will give an overall pi-..ture of the state of WLAN security in Perth.
This research is significant because there has been an increase in the usage and reliance on wired and wireless networks and the commercial confidentiality of some organisations may be at risk due to a lack of awareness ofWLAN security implications.
The honours student, Sue Webb, will contact you shortly to request that your organisation participate in her research project. I encourage you to take part as the research is significant to all Perth organisations, plus the anonymous results of the research will be shared with all participants. These results may assist in increasing your organisation's understanding of the security issues relating to WLANs.
Yours faithfully,
Dr. Thomas O'Neill School of Computer and Infonnation Science Edith Cowan University
Contact Details:
Dr. Thomas O'Neill (Supervisor) Phone: 9370 6431 email: [email protected]
. _,, . q ..... -.,~ .. 11:. i :·
Sue Webb (Honours Student) Phone: email: [email protected]
!08

Covering letter given to respondents
Edith Cowan University
School of Computer and Information Science
My name is Sue Webb and I am an Honours student at Edith Cowan University. I am investigating security tool usage in wireless networks for my Honours thesis.
I would like your organisation to participate in my research by taking part in an interview survey. Your participation is entirely voluntary and you can withdraw at any time.
In order to protect your privacy the interview survey has been designed so that the processed data will not identify any individual participant. Each survey is marked with a respondent number and I am the only person with access to the list matching respondent numbers to individual organisations/respondents. Please also note that the results received will only be accessible by me and any computerised documents related to this research will be stored in an encrypted fonnat, also accessible only by me. This survey has been cleared by the University Ethics Board.
Please read and sign the consent fonn attached to the front. Once the survey is complete and the results are compiled, I will make those results available to you.
Please direct any questions about the survey to me at the
School of Computer and Infonnation Science Mount Lawley Campus Edith Cowan University 2 Bradford Street MT LAWLEY WA 6050
Email: swebb(iilstudent.ecu.edu.au Phone:
It should take between 20 and 30 minutes to complete the interview.
With thanks for your participation
Sue Webb School of Computer and lnfonnation Science August, 2002
109

Respondent consent form
Response Number __
Consent Form
I have read the covering letter relating to the collection of data for the purpose of
investigating security tool usage in wireless networks. I recognise the purpose of
the data collection and I appreciate that my participation is voluntary.
I understand that my response will be kept confidential and that no person other
than the researcher (Sue Webb) will have any means of identifying me or my
organisation from the published results.
I hereby consent to participating in the collection by way of responding to the
interview survey.
Signed: .................................................................. ..
Full Name: .............................................................. .
Position: ................... , ............................................. ..
Organisation: ........................................................... .
Date: .. ./ ... .12002
II 0
•, .,

Interview survey instrument
Sectio11 A -All respo11de11ts
1) Has your organisation tested and/or implemented any 802.llb WLAN technology?
No
0 (Go to Section B)
2) Are you aware of any security implications of using WLANs?
Yes No
Cl If yes, please specify 0 (Go to question 4)
3) How were you made aware of the implications? (Select as many as applicable)
WLAN hardware vendor 0
Colleague(s) 0
Print media 0
Mailing list 0
Security Internet site 0
Other, general Internet site 0
Other please specify 0
Ill
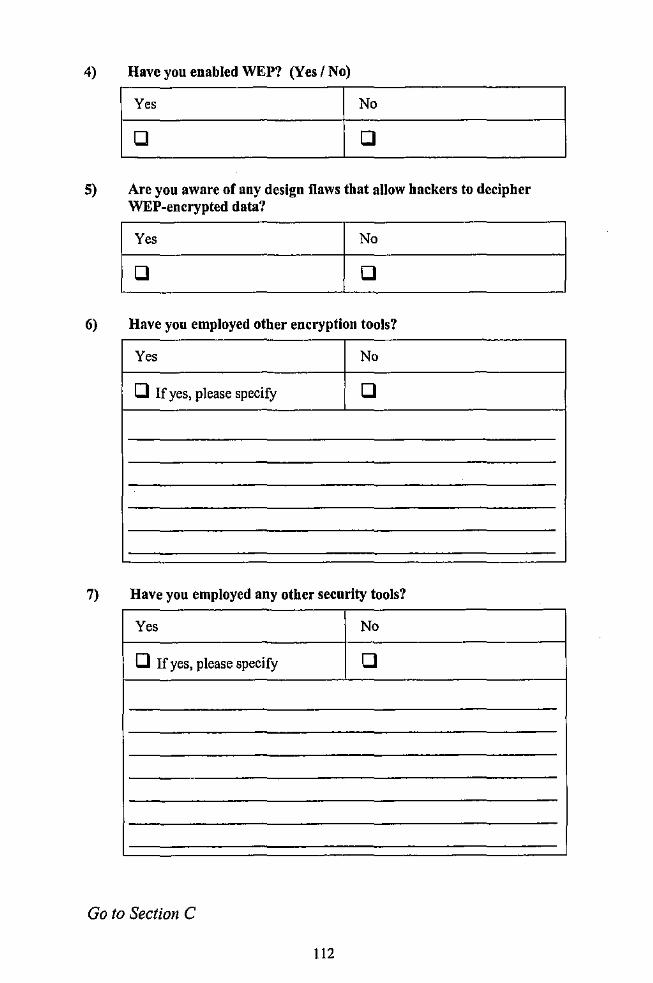
4) Have you enabled WEP? (Yes I No)
No
D
5) Are you aware of any design flaws that allow hackers to decipher WEP-encrypted data?
I~ 6) Have you employed other encryption tools?
Yes No
D If yes, please specify D
7) Have you employed any other security tools?
Yes No
D If yes, please specify D
Go to Section C
112 ,,

Sectio11 B- No c11rre111 WLAN implemel!tatioll
8) Does your organisation ir~tend to test and/or implement any 802.11b WLAN technology in the next 12 months?
[~ 9) Are you aware of any security implications of using WLANs?
Yes No
CJ If yes, please specify 1:1 (Go to question 11)
10) How were you made aware of these implkations? (select as many as applicable)
WLAN hardware vendor 1:1
Colleague(s) 1:1
Print media 1:1
Mailing list 1:1
Security Internet site 1:1 -
Other, general Internet site 1:1
Other- please specify 1:1
113
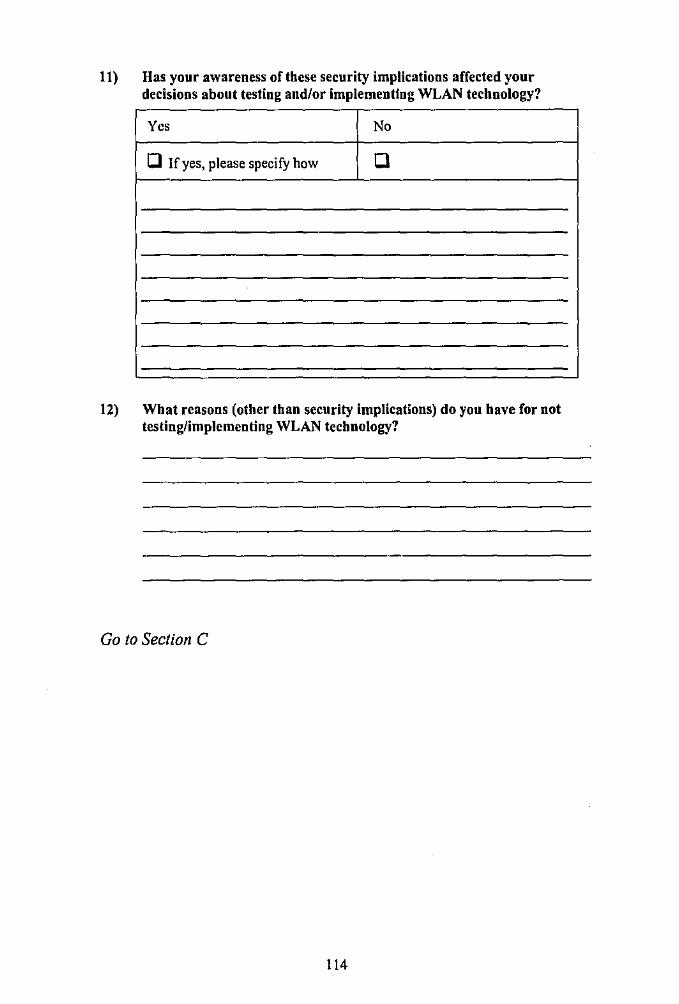
11) Has your awareness of these security implications affected your decisions about testing and/or implementfng WLAN technology?
Yes No
IJ If yes, please specify how CJ
12) What reasons (other than security implicaUons) do you have for not testing/implementing WLAN technology?
Go to Section C
114
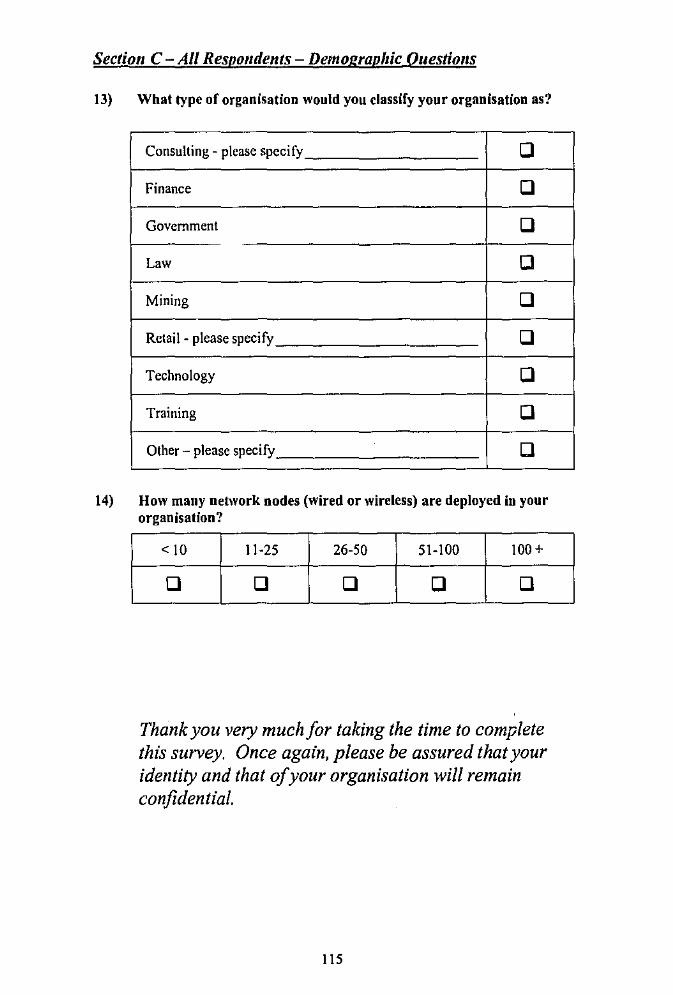
Section C-All Respondents- Demograpltic Questiolls
13) What type of organisation would you classify your organisation as?
Consulting- please specify Cl
Finance Cl
Government Cl
Law Cl
Mining Cl
Retail- please specify Cl
Technology Cl
Training Cl
Other - please specify Cl
14) How many network nodes (wired or wireless) are deployed in your organisation?
<10 11-25 26-50 51-100 100+
Cl Cl Cl Cl Cl
Thank you very much for taking the time to complete this survey. Once again, please be assured that your identity and that of your organisation will remain confidential.
115
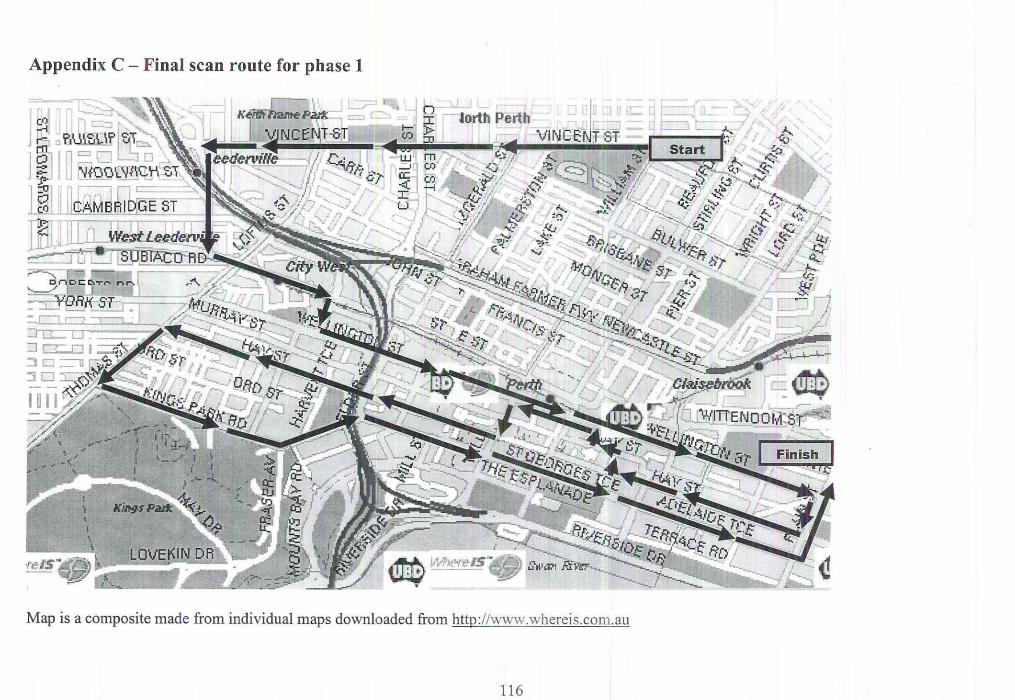
Appendix C - Final scan route for phase 1
c_() --i - _ _,
J ~ :J f>,\.1\f,\..Ji> lf,~~ \
I Ol J = .-., "J " ;. :Wooc~i\~r\· Dl l r' ,_ 1rL- -l~ ctAM B fill cfGE ST
):: II . I I ' Lf .. ·...:_~ WeSUee_den.•i6F
c~ .
Map is a composite made from individual maps downloaded from http://www.whereis.com.au
116
Related Documents