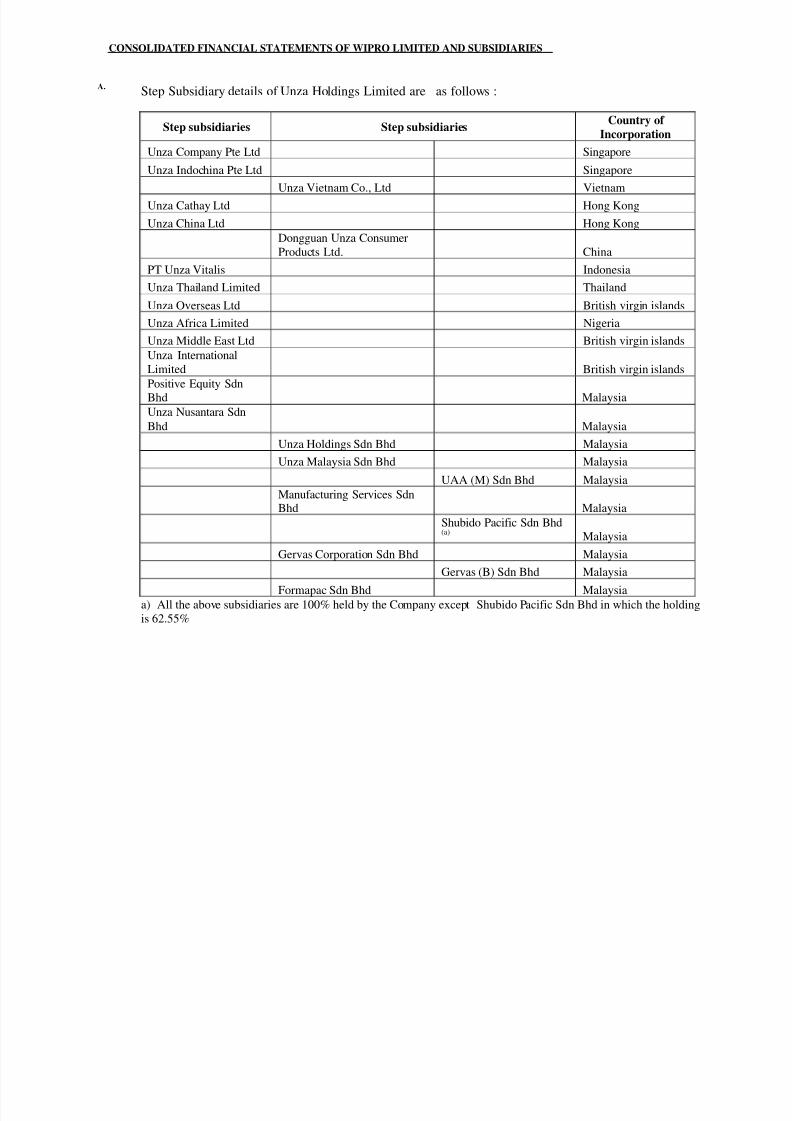
CONSOLIDATED FINANCIAL STATEMENTS OF WIPRO LIMITED AND SUBSIDIARIES CONSOLIDATED BALANCE SHEET (Rs in Million) Schedule 2009 2008 SOURCES OF FUNDS SHAREHOLDERS' FUNDS Share capital 1 2,928 2,923 Share application money pending allotment 15 40 Reserves and surplus 2 133,356 113,991 136,299 116,954 LOAN FUNDS Secured loans 3 1,858 2,072 Unsecured loans 4 55,034 42,778 56,892 44,850 Minority interest 237 116 193,428 161,920 APPLICATION OF FUNDS FIXED ASSETS Goodwill 19(6) 56,521 42,209 Gross block 5 75,353 56,280 Less: Accumulated depreciation 36,342 28,067 Net block 39,011 28,213 Capital work-in-progress and advances 13,552 13,370 109,084 83,792 INVESTMENTS 6 18,096 16,022 DEFERRED TAX ASSET (NET) 19(20) 684 529 CURRENT ASSETS, LOANS AND ADVANCES Inventories 7 7,586 6,664 Sundry debtors 8 48,859 40,453 Cash and bank balances 9 49,117 39,270 Loans and advances 10 45,673 29,610 151,235 115,997 LESS: CURRENT LIABILITIES AND P ROVISIONS Liabilities 11 67,989 39,890 Provisions 12 17,682 14,530 85,671 54,420 NET CURRENT ASSETS 65,564 61,577 193,428 161,920 Notes to Accounts 19 The schedules referred to above form an integral part of the consolidated balance sheet As of March 31, As per our report attached for B S R & Co. Azim Premji B C Prabhakar Girish S Paranjpe Suresh Vaswani Chartered Accountants Chairman Di rector Jt CEO, IT Business & Jt CEO, IT Busi ness & Director Di rector Akeel Master Suresh C Senapaty N Vaghul V Ramachandran Partner Chi ef Fi nancial Officer Di rector Company Secretary Membership No. 046768 & Director Bangalore April 22, 2009 For and on behalf of the Board of Directors

Welcome message from author
This document is posted to help you gain knowledge. Please leave a comment to let me know what you think about it! Share it to your friends and learn new things together.
Transcript
8/4/2019 Wipro Financial Statements
http://slidepdf.com/reader/full/wipro-financial-statements 1/37
CONSOLIDATED FINANCIAL STATEMENTS OF WIPRO LIMITED AND SUBSIDIARIES
CONSOLIDATED BALANCE SHEET
(Rs in Million)
Schedule 2009 2008
SOURCES OF FUNDS
SHAREHOLDERS' FUNDS
Share capital 1 2,928 2,923
Share application money pending allotment 15 40
Reserves and surplus 2 133,356 113,991
136,299 116,954
LOAN FUNDS
Secured loans 3 1,858 2,072
Unsecured loans 4 55,034 42,778
56,892 44,850
Minority interest 237 116
193,428 161,920
APPLICATION OF FUNDS
FIXED ASSETS
Goodwill 19(6) 56,521 42,209
Gross block 5 75,353 56,280
Less: Accumulated depreciation 36,342 28,067
Net block 39,011 28,213 Capital work-in-progress and advances 13,552 13,370
109,084 83,792
INVESTMENTS 6 18,096 16,022
DEFERRED TAX ASSET (NET) 19(20) 684 529
CURRENT ASSETS, LOANS AND ADVANCES
Inventories 7 7,586 6,664
Sundry debtors 8 48,859 40,453
Cash and bank balances 9 49,117 39,270
Loans and advances 10 45,673 29,610
151,235 115,997
LESS: CURRENT LIABILITIES AND PROVISIONS
Liabilities 11 67,989 39,890 Provisions 12 17,682 14,530
85,671 54,420
NET CURRENT ASSETS 65,564 61,577
193,428 161,920
Notes to Accounts 19
The schedules referred to above form an integral part of the consolidated balance sheet
As of March 31,
As per our report attached
for B S R & Co. Azim Premji B C Prabhakar Girish S Paranjpe Suresh Vaswani
Chartered Accountants Chairman Director Jt CEO, IT Business & Jt CEO, IT Business &
Director Director
Akeel Master Suresh C Senapaty N Vaghul V Ramachandran
Partner Chief Financial Officer Director Company Secretary
Membership No. 046768 & Director
Bangalore
April 22, 2009
For and on behalf of the Board of Directors

8/4/2019 Wipro Financial Statements
http://slidepdf.com/reader/full/wipro-financial-statements 2/37
CONSOLIDATED FINANCIAL STATEMENTS OF WIPRO LIMITED AND SUBSIDIARIES
CONSOLIDATED PROFIT AND LOSS ACCOUNT
(Rs in Million except share data)
Schedule 2009 2008 2009 2008
INCOME
Gross sales and services 65,456 57,555 258,050 201,451
Less: Excise duty 176 399 1,055 1,655 Net sales and services 65,280 57,156 256,995 199,796
Other income 13 287 616 2,621 4,174
65,567 57,772 259,616 203,970
EXPENDITURE
Cost of sales and services 14 44,995 39,810 178,958 140,244
Selling and marketing expenses 15 4,499 4,149 18,453 14,216
General and administrative expenses 16 3,708 3,229 14,609 10,750
Interest 17 583 469 2,400 1,690
53,785 47,657 214,420 166,900
PROFIT BEFORE TAXATION 11,782 10,115 45,196 37,070
Provision for taxation including fringe benefit tax 19(20) 1,667 1,399 6,460 4,550
Profit before minority interest / share in earnings of associates 10,115 8,716 38,736 32,520
Minority interest (50) (16) (99) (24)
Share in earnings of associates 35 100 362 333 PROFIT FOR THE PERIOD 10,100 8,800 38,999 32,829
Appropriations
Interim dividend - - - 2,919
Proposed dividend - - 5,860 5,846
Tax on dividend - - 996 1,489
TRANSFER TO GENERAL RESERVE 10,100 8,800 32,143 22,575
EARNINGS PER SHARE - EPS
Equity shares of par value Rs. 2/- each
Basic (in Rs.) 6.94 6.06 26.81 22.62
Diluted (in Rs.) 6.93 6.03 26.72 22.51
Number of shares for calculating EPS (Refer note 19(15))
Basic 1,455,860,563 1,452,855,432 1,454,662,502 1,451,127,719
Diluted 1,458,193,700 1,458,285,808 1,459,352,869 1,458,239,060
Notes to Accounts 19
The schedules referred to above form an integral part of the consolidated profit and loss account
Quarter ended March 31, Year ended March 31,
As per our report attached
for B S R & Co. Azim Premji B C Prabhakar Girish S Paranjpe Suresh Vaswani
Chartered Accountants Chairman Director Jt CEO, IT Business & Jt CEO, IT Business &
Director Director
Akeel Master Suresh C Senapaty N Vaghul V Ramachandran
Partner Chief Financial Officer Director Company Secretary
Membership No. 046768 & Director
Bangalore
April 22, 2009
For and on behalf of the Board of Directors

8/4/2019 Wipro Financial Statements
http://slidepdf.com/reader/full/wipro-financial-statements 3/37
As per our report attached
or B S R & Co. Azim Premji B C Prabhakar Girish S Paranjpe Suresh Vaswani
Chartered Accountants Chairman Director Jt CEO, IT Business & Jt CEO, IT Business &
Director Director
Akeel Master Suresh C Senapaty N Vaghul V Ramachandran
Partner Chief Financial Officer Director Company Secretary
Membership No. 046768 & Director
Bangalore
April 22, 2009
For and on behalf of the Board of Directors
CONSOLIDATED FINANCIAL STATEMENTS OF WIPRO LIMITED AND SUBS IDIARIES
CONSOLIDATED CASH FLOW STATEMENT
(Rs in Million)
2009 2008 2009 2008
A. Cash flows from operating activities:
Profit before tax 11,782 10,115 45,196 37,070
Adjustments:
Depreciation and amortization 1,871 1,509 6,864 5,359
Amortisation of stock compensation 427 288 1,767 1,166
Exchange differences - net 1,476 678 3,702 (595)
Deferred cancellation losses related to designated hedges (4,667) - (12,196) - Interest on borrowings 584 469 2,400 1,690
Dividend / interest - net (435) (537) (3,664) (2,802)
(Profit) / Loss on sale of investments (13) (176) (681) (771)
Gain on sale of fixed assets (9) (2) (28) (174)
Working capital changes :
Trade and other receivable 1,445 (2,796) (13,152) (11,885)
Loans and advances 1,877 (2,001) (1,622) (5,157)
Inventories 188 (478) (922) (1,565)
Trade and other payables (393) 1,057 16,233 6,182
Net cash generated from operations 14,133 8,126 43,897 28,518
Direct taxes paid (4,426) (1,221) (7,798) (5,459)
Net cash generated by operating activities 9,707 6,905 36,099 23,059
B. Cash flows from investing activities:
Acquisition of property, fixed assets
plant and equipment (including advances) (4,498) (4,849) (16,746) (14,226)
Proceeds from sale of fixed assets 175 88 358 479 Purchase of investments (73,955) (50,863) (342,717) (231,684)
Proceeds on sale / from maturities on investments 77,811 53,940 341,687 250,013
Intercorporate deposit (3,750) 100 (3,750) 150
Net payment for acquisition of businesses-Refer note 19(6) (5,488) (462) (6,679) (32,790)
Dividend / interest income received 435 464 3,664 2,490
Net cash used in investing activities (9,270) (1,582) (24,183) (25,568)
C. Cash flows from financing activities:
Proceeds from exercise of employee stock option 4 149 63 541
Share application money pending allotment 15 (12) 15 40
Interest paid on borrowings (584) (469) (2,400) (1,690)
Dividends paid (including distribution tax) - - (6,829) (12,632)
Repayment of borrowings / loans (28,321) (18,940) (80,229) (74,970)
Proceeds of borrowings / loans 39,006 36,766 86,648 110,641
Proceeds from issuance of shares by subsidiary - - - 55
Ne t cash gene rate d by / (use d in) financing activitie s 10, 120 17,494 (2,732) 21,985
Net (decrease) / increase in cash andcash equivalents during the period 10,557 22,817 9,184 19,476
38,383 16,508 39,270 19,822
Effect of translation of cash balance 177 (55) 663 (28)
Cash and cash equivalents at the end of the period 49,117 39,270 49,117 39,270
Cash and cash equivalents at the beginning of the period
Quarter Ended March 31, Year Ended March 31 ,

8/4/2019 Wipro Financial Statements
http://slidepdf.com/reader/full/wipro-financial-statements 4/37
SCHEDULE 2 RESERVES AND SURPLUS
Capital reserveBalance brought forward from previous year 1,144 47 Addition during the year - 1,097
1,144 1,144
Securities premium accountBalance brought forward from previous year 25,373 24,530 Add: Shares issued to controlled trust 540 - Add: Exercise of stock options by employees 1,366 843 Less: Shares issued to controlled trust [Refer note 19(2)] 540 -
26,739 24,530
Translation reserveBalance brought forward from previous year (10) (247) Movement during the year 507 237
497 (10)
Restricted stock units reserve [Refer note 19(12)]
Employee stock options outstanding 6,693 5,023
Less: Deferred employee compensation expense 4,380 3,206
2,313 1,817
General reserveBalance brought forward from previous year 86,764 67,790 Additions [Refer note 19 (3) (ii)] 32,049 18,974
118,813 86,764
Hedging reserve [Refer note 19(5)]
Balance brought forward from previous year (1,097) -
Movement during the year (15,053) (1,097)
Unrealised gain/ (loss) on cash flow hedging derivatives, net (16,150) (1,097)
Summary of reserves and surplusBalance brought forward from previous year 113,991 93,042 Movement during the year 19,365 20,949
133,356 113,991
CONSOLIDATED FINANCIAL STATEMENTS OF WIPRO LIMITED AND SUBSIDIARIES
CONSOLIDATED BALANCE SHEET
(Rs in Million except share data)
SCHEDULE 1 SHARE CAPITAL 2009 2008
Authorised capital
1,650,000,000 (2008: 1,650,000,000) equity shares of Rs 2 each 3,300 3,300 25,000,000 (2008: 25,000,000) 10.25 % redeemable cumulative
preference shares of Rs. 10 each 250 250 3,550 3,550
Issued, subscribed and paid-up capital [Refer note 19 (2)]
1,464,980,746 (2008: 1,461,453,320) equity shares of Rs 2 each 2,930 2,923
Less: 968,803 (2008: Nil) equity shares issued to and held by controlled
trust (2) -
2,928 2,923
As of March 31,

8/4/2019 Wipro Financial Statements
http://slidepdf.com/reader/full/wipro-financial-statements 5/37
SCHEDULE 5 FIXED ASSETS(Rs. in Million)
PARTICULARS
As of April1, 2008
Additions3 Effect of
Transalation*Deductions As of March
31, 2009As of April 1,
2008Depreciationfor the year
Effect of Transalation*
Deductions / adjustments
3As of March
31, 2009As of March
31, 2009As of March
31, 20083
(a) Tangible fixed assets
Land (including leaseho ld) 2,744 1,292 24 8 4,052 8 11 - - 19 4,033 2,736
Buildings 10,000 5,118 293 82 15,329 1,238 307 97 17 1,659 13,670 8,762
Plant & machinery2 31,029 9,762 1,459 213 42,037 20,930 5,069 850 329 27,178 14,859 10,099
Furniture, fixture and equipments 7,302 712 309 163 8,160 3,600 816 168 35 4,619 3,541 3,702
Vehicles 2,566 599 32 333 2,864 1,416 531 11 (199) 1,759 1,105 1,150
(b) Intangible fixed asse ts
Technical know-how 359 4 21 - 384 345 4 35 - 384 - 14
Brands, patents, trade marks and
rights2,280 120 127 - 2,527 530 126 51 17 724 1,803 1,750
56,280 17,607 2,265 799 75,353 28,067 6,864 1,212 199 36,342 39,011 28,213
P revious year - 31 M ar ch 2008 37, 287 19,407 322 736 56,280 18,993 5,359 135 3,580 28,067 28,213
* Represents translation of fixed ass ets of non-integral operations into Indian Rupee2-Plant and machinery includes computers and computer software
3-Additions include Gro ss Block of R s 859 (2008: Rs 8,106) and adjustments include Acc umulated depreciation of R s 613 (2008: Rs 3,951)
in respect of assets of entities acquired during the year.
GROSS BLOCK ACCUMULATED DEPRECIATION NET BLOCK
CONSOLIDATED FINANCIAL STATEMENTS OF WIPRO LIMITED AND SUBSIDIARIES
CONSOLIDATED BALANCE SHEET
(Rs in Million)
2009 2008
SCHEDULE 3 SECURED LOANS
Term loans1 233 513
Cash credit facilities1 643 535
Finance lease obligation 982 1,024
1,858 2,072
SCHEDULE 4 UNSECURED LOANS
External commercial borrowings 18,052 14,070 Borrowing from banks 35,829 28,368
Interest free loan from state governments 37 41
Others 1,116 299
55,034 42,778
As of March 31,
1Term loans and cash credit facility are secured by hypothecation of stock-in-trade, book debts,
immovable/movable properties and other assets

8/4/2019 Wipro Financial Statements
http://slidepdf.com/reader/full/wipro-financial-statements 6/37
CONSOLIDATED FINANCIAL STATEMENTS OF WIPRO LIMITED AND SUBSIDIARIES
CONSOLIDATED BALANCE SHEET
(Rs in Million)
2009 2008
SCHEDULE 6 INVESTMENTS
Investments long term - unquoted
Investment in associates [Refer note 19(10)]
Wipro GE Healthcare Private Limited 4 1,670 1,343
1,670 1,343
Current investments - quoted [Refer note 19(23)]
Investments in Indian money market mutual funds 15,136 14,317
Current investments - unquoted [Refer note 19(23)]
Certificates of deposit 947 -
Other investments [Refer note 19(23)] 343 362
16,426 14,679
18,096 16,022
4Equity investments in this company carry certain restrictions on transfer of shares that are normally
provided for in shareholders' agreements
As of March 31,
SCHEDULE 7 INVENTORIES
Finished goods 3,533 2,370
Raw materials 2,668 2,761
Stock in process 694 1,078
Stores and spares 691 455
7,586 6,664
SCHEDULE 8 SUNDRY DEBTORS
(Unsecured)Debts outstanding for a period exceeding six months
Considered good 5,832 3,109
Considered doubtful 1,433 1,096
7,265 4,205
Other debtsConsidered good 43,027 37,344 Considered doubtful 486 -
50,778 41,549
Less: Allowance for doubtful debts 1,919 1,096
48,859 40,453
SCHEDULE 9 CASH AND BANK BALANCESBalances with bank:
In current account 22,264 10,884
In deposit account 26,173 28,104
Cash and cheques on hand 680 282
[Refer note 19(22)] 49,117 39,270

8/4/2019 Wipro Financial Statements
http://slidepdf.com/reader/full/wipro-financial-statements 7/37
CONSOLIDATED FINANCIAL STATEMENTS OF WIPRO LIMITED AND SUBSIDIARIES
CONSOLIDATED BALANCE SHEET
(Rs in Million)
2009 2008
SCHEDULE 10 LOANS AND ADVANCES
(Unsecured, considered good unless otherwise stated)Advances recoverable in cash or in kind or for value to be receivedConsidered good- Prepaid expenses 4,059 2,800 - Advance to suppliers / expenses 706 1,402 - Employee travel & other advances 1,359 1,503 - Derivative asset 1,421 938 - Finance lease receivables 3,605 665 - Others 3,500 3,713
14,650 11,021 Considered doubtful 160 169
14,810 11,190
Less: Provision for doubtful advances 160 169
14,650 11,021
Other de osits 1,626 1,911
Advance income tax 10,185 7,116
Inter corporate deposit 4,250 500
Balances with excise and customs 854 548
Unbilled revenue 14,108 8,514
45,673 29,610
SCHEDULE 11 LIABILITIES
Accrued expenses 24,762 15,593
Statutory liabilities 3,455 2,522
Sundry creditors 18,017 13,082
Unearned revenues 6,734 4,269
Advances from customers 2,428 1,642
Derivative liability 12,257 2,571
Unclaimed dividends 17 4
Others 319 207
67,989 39,890
SCHEDULE 12 PROVISIONS
Employee retirement benefits 3,111 2,737
Warranty provision 989 941
Provision for tax 6,726 4,013
Proposed dividend 5,860 5,846 Tax on dividend 996 993
17,682 14,530
As of March 31,

8/4/2019 Wipro Financial Statements
http://slidepdf.com/reader/full/wipro-financial-statements 8/37
CONSOLIDATED FINANCIAL STATEMENTS OF WIPRO LIMITED AND SUBSIDIARIES
CONSOLIDATED PROFIT AND LOSS ACCOUNT
(Rs in Million)
2009 2008 2009 2008
SCHEDULE 13 OTHER INCOME
Income from current investments
- Dividend on mutual fund units 325 231 2,265 1,428
- Profit on sale of invetsments 12 176 681 771
Interest on debt instruments and others 674 244 1,964 1,576
Exchange differences - net (761) 49 (1,553) (221)
Exchange fluctuations on foreign currency borrowings (net) (265) (202) (1,465) (202)
Miscellaneous income 302 118 729 822
287 616 2,621 4,174
SCHEDULE 14 COST OF SALES AND SERVICES
Employee compensation 23,607 19,567 91,004 70,655
Raw materials, finished and process stocks (refer schedule 18) 11,001 10,471 45,463 36,263
Sub contracting / technical fees / third party application 2,944 3,416 13,926 10,763 Travel 1,541 1,410 6,684 5,042
Depreciation 1,739 1,404 6,367 4,965
Repairs 744 741 3,142 2,950
Communication 771 540 2,610 1,970
Power and fuel 481 423 1,863 1,532
Outsourced technical services 383 331 1,442 1,109
Rent 473 369 1,667 1,286
Stores and spares 180 247 936 946
Insurance 102 78 372 238
Rates and taxes 94 47 313 137
Miscellaneous 935 766 3,169 2,388
44,995 39,810 178,958 140,244
Quarter ended March 31, Year ended March 31,
8/4/2019 Wipro Financial Statements
http://slidepdf.com/reader/full/wipro-financial-statements 9/37
CONSOLIDATED FINANCIAL STATEMENTS OF WIPRO LIMITED AND SUBSIDIARIES
CONSOLIDATED PROFIT AND LOSS ACCOUNT
(Rs in Million)
2009 2008 2009 2008
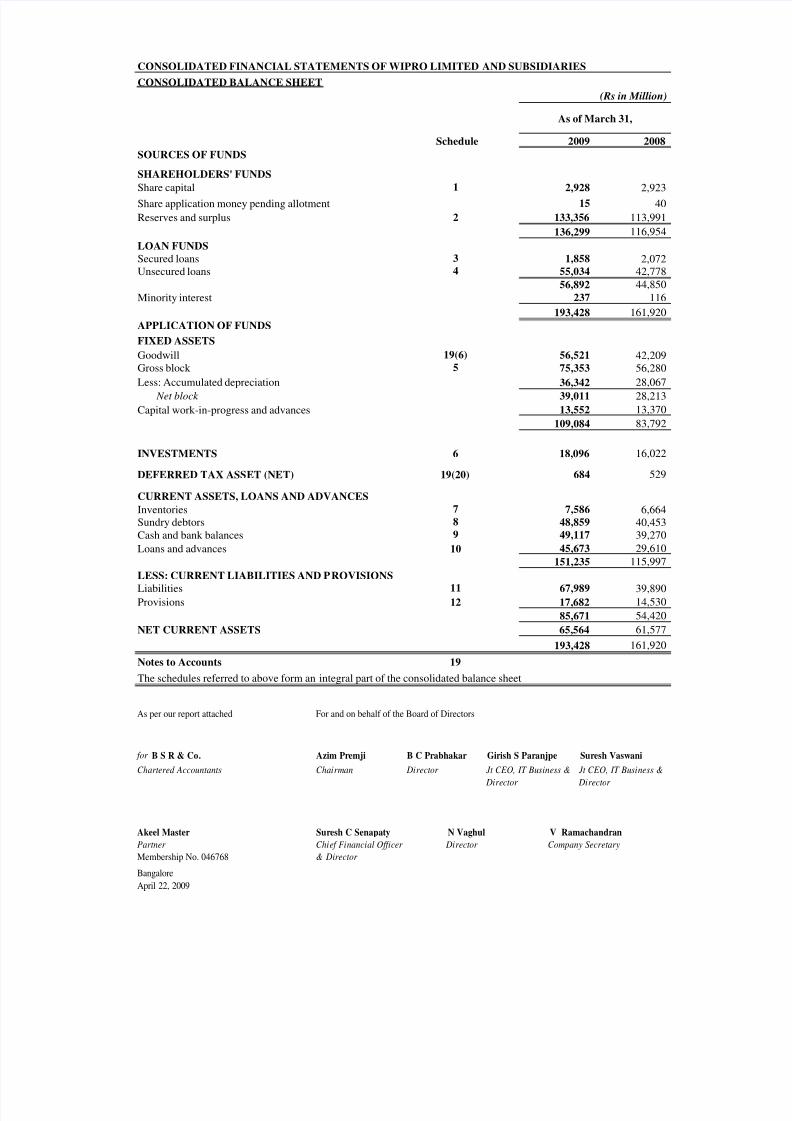
SCHEDULE 15 SELLING AND MARKETING EXPENSES
Employee compensation 2,371 2,148 9,639 7,045
Advertisement and sales promotion 814 702 3,470 2,385 Travel 186 293 1,037 1,023
Carriage and freight 259 282 1,005 1,137
Commission on sales 197 194 886 585
Rent 88 111 477 470
Communication 121 92 396 349
Conveyance 41 32 157 136
Depreciation 68 39 265 245
Repairs to buildings 24 24 123 79
Insurance 9 9 26 35
Rates and taxes 17 9 59 34
Miscellaneous expenses 304 214 913 693
4,499 4,149 18,453 14,216
SCHEDULE 16 GENERAL AND ADMINISTRATIVE EXPENSES
Employee compensation 1,726 1,483 6,421 5,026
Travel 291 363 1,435 1,198
Legal and professional charges 319 264 1,502 905
Repairs and mantainance 210 170 780 565
Provision for bad debts 103 63 939 289
Staff recruitment 66 156 411 704
Manpower outside services 51 59 264 223
Depreciation 65 65 232 148
Rates and taxes 37 13 72 57
Insurance 34 26 125 81
Rent 158 58 382 124
Auditors' remuneration
Audit fees 4 14 19 24 For certification including tax audit 1 1 2 2
Out of pocket expenses - 1 2 2
Miscellaneous expenses 643 493 2,023 1,402
3,708 3,229 14,609 10,750
Quarter ended March 31, Year ended March 31,

8/4/2019 Wipro Financial Statements
http://slidepdf.com/reader/full/wipro-financial-statements 10/37
CONSOLIDATED FINANCIAL STATEMENTS OF WIPRO LIMITED AND SUBSIDIARIES
CONSOLIDATED PROFIT AND LOSS ACCOUNT
(Rs in Million)
2009 2008 2009 2008
SCHEDULE 17 INTEREST
Cash credit and others 583 469 2,400 1,690
583 469 2,400 1,690
SCHEDULE 18
RAW MATERIALS, FINISHED AND PROCESSED STOCKS
Consumption of raw materials and
bought out components :
Opening stocks 3,105 2,777 2,761 1,584
Add: Stock taken over on acquisition - 9 - 380
Add: Purchases 3,947 4,762 21,831 17,887
Less: Closing stocks 2,668 2,762 2,668 2,761
4,384 4,786 21,924 17,090
Purchase of finished products for sale 6,742 6,143 24,318 19,765
(Increase) / Decrease infinished and process stocks :
Opening stock
In process 773 773 1,078 491
Finished products 3,329 2,198 2,370 1,777
Stock taken over on acquisition
In process - - - 8
Finished products - 18 - 580
Less: Closing stock
In process 694 1,078 694 1,078
Finished products 3,533 2,369 3,533 2,370
(125) (458) (779) (592)
11,001 10,471 45,463 36,263
Quarter ended March 31, Year ended March 31,

8/4/2019 Wipro Financial Statements
http://slidepdf.com/reader/full/wipro-financial-statements 11/37
CONSOLIDATED FINANCIAL STATEMENTS OF WIPRO LIMITED AND SUBSIDIARIES
SCHEDULE 19 – NOTES TO ACCOUNTS
Company overview
Wipro Limited (Wipro), together with its subsidiaries and associates (collectively, the Company or the group) isa leading India based provider of IT Services, including Business Process Outsourcing (BPO) services, globally.Further, Wipro has other businesses such as IT Products and Consumer Care and Lighting. Wipro isheadquartered in Bangalore, India.
1. Significant accounting policies
i. Basis of preparation of financial statements
The financial statements are prepared in accordance with Indian Generally Accepted Accounting Principles(GAAP) under the historical cost convention on the accrual basis except for certain financial instruments,which are measured on a fair value basis. GAAP comprises Accounting Standards (AS), issued by theInstitute of Chartered Accountants of India (ICAI) and other generally accepted accounting principles inIndia.The interim consolidated financial statements for the quarter ended March 31, 2009 have been prepared inaccordance with the recognition, measurement and disclosure provisions of AS 25, Interim FinancialReporting, issued pursuant to the Companies (Accounting Standards) Rules, 2006 and by the ICAI. These
financial statements should be read in conjunction with the consolidated annual financial statement of theCompany for the year ended as at March 31, 2009. The accounting policies followed in the preparation of the financial statement are consistent with those followed in the preparation of t he consolidated annualfinancial statement, except the adoption of AS 30, Financial Instruments: Recognition and Measurement.Effective April 1, 2008 the Company adopted AS 30. The adoption of AS 30 along with limited revision toother accounting standards has been described in Note 4 of the notes to accounts.
ii. Principles of consolidation
The consolidated financial statements include the financial statements of Wipro and all its subsidiaries,which are more than 50% owned or controlled.
The financial statements of the parent company and its majority owned / controlled subsidiaries have beencombined on a line by line basis by adding together the book values of all items of assets, liabilities,incomes and expenses after eliminating all inter-company balances / transactions and resulting unrealizedgain / loss.
The consolidated financial statements are prepared using uniform accounting policies for similartransactions and other events in similar circumstances.
iii. Use of estimates
The preparation of financial statements requires management to make estimates and assumptions thataffect the reported amounts of assets and liabilities, the disclosure of contingent assets and liabilities on thedate of the financial statements and reported amounts of revenues and expenses during the period reported.Actual results could differ from those estimates.
iv. Goodwill
Goodwill arising on consolidation / acquisition of assets is not amortised. It is tested for impairment on aperiodic basis and written-off if found impaired.
v. Fixed assets, intangible assets and work-in-progress
Fixed assets are stated at historical cost less accumulated depreciation.
Interest on borrowed money allocated to and utilized for qualifying fixed assets, pertaining to the period upto the date of capitalization is capitalized.
Intangible assets are stated at the consideration paid for acquisition less accumulated amortization.

8/4/2019 Wipro Financial Statements
http://slidepdf.com/reader/full/wipro-financial-statements 12/37
CONSOLIDATED FINANCIAL STATEMENTS OF WIPRO LIMITED AND SUBSIDIARIES
Advances paid towards the acquisition of fixed assets outstanding as of each balance sheet date and thecost of fixed assets not ready for use before such date are disclosed under capital work-in-progress.
Payments for leasehold land are amortised over the period of lease.
vi. Investments
Long term investments (other than investment in associate) are stated at cost less provision for diminutionin the value of such investments. Diminution in value is provided for where the management is of the
opinion that the diminution is of other than temporary nature. Current investments are valued at lower of cost and fair value determined by category of investment. The fair value is taken as quoted market priceadjusted for cost of disposal.
Investment in associate is accounted under the equity method.
vii. Inventories
Finished goods are valued at cost or net realizable value, whichever is lower. Other inventories , primarilycomprising material and other supplies held for use in the course of production are valued at cost lessprovision for obsolescence. Small value tools and consumables are charged to consumption on purchase.Cost is determined using weighted average method.
viii. Provisions and contingent liabilities
The Company creates a provision when there is a present obligation as a result of an obligati ng event thatprobably requires an outflow of resources and a reliable estimate can be made of the amount of theoutflow.
A disclosure for a contingent liability is made when there is a possible obligation or a present obligationthat may, but probably will not, require an outflow of resources. Where there is a possible obligation or apresent obligation in respect of which the likelihood of outflow of resources is remote, no provision ordisclosure is made.
The company recognizes provision for onerous contracts based on the estimate of excess of unavoidablecosts of meeting obligations under the contracts over the expected economic benefits.
ix.
Revenue recognition
Services:
Revenue from Software development services comprises revenue from time and material and fixed -pricecontracts. Revenue from time and material contracts is recognised as related services are performed.Revenue from fixed-price, fixed-time frame contracts is generally recognised in accordance with the“Percentage of Completion” method.
Revenues from BPO services are derived from both time-based and unit-priced contracts. Revenue isrecognised as the related services are performed, in accordance with the spe cific terms of the contract withthe customers.
Revenue from application maintenance services is recognized over the period of the contract.
Revenue from customer training, support and other services is recognised as the related services areperformed.
Provision for estimated losses, if any, on incomplete contracts are recorded in the period in which suchlosses become probable based on the current contract estimates.
‘Unbilled revenues’ included in loans and advances represent cost and earnings in exces s of billings as atthe balance sheet date. ‘Unearned revenues’ included in current liabilities represent billing in excess of revenue recognised.

8/4/2019 Wipro Financial Statements
http://slidepdf.com/reader/full/wipro-financial-statements 13/37
CONSOLIDATED FINANCIAL STATEMENTS OF WIPRO LIMITED AND SUBSIDIARIES
Products:
Revenue from sale of products is recognised when the product has been delivered, in accordance with thesales contract. Revenues from product sales are shown as net of excise duty, sales tax separately chargedand applicable discounts.
Others:
Agency commission is accrued when shipment of consignment is dispatched by the principal.
Profit on sale of investments is recorded upon transfer of title by the Company. It is determined as thedifference between the sales price and the then carrying amount of the investment.
Interest is recognised using the time-proportion method, based on rates implicit in the transaction.
Dividend income is recognised where the Company’s right to receive dividend is established.
Export incentives are accounted on accrual basis and include estimated realizable values/ benefits fromspecial import licenses and advance licenses.
Other income is recognised on accrual basis.
x. Leases
Assets acquired under finance leases are recognised at the lower of the fair value of the leased assets atinception and the present value of minimum lease payments. Lease payments are apportioned between thefinance charge and the outstanding liability. The finance charge is allocated to periods during the leaseterm at a constant periodic rate of interest on the remaining balance of the liability.
Lease rentals in respect of assets taken under operating leases are charged to profit and loss account on astraight line basis over the lease term.
Inventories given under finance leases, are recognised at an amount equal to the net investment in the leaseand the finance income is based on a constant rate of return on the outstanding net investment.
xi. Warranty cost
The Company accrues the estimated cost of warranties at the time when the revenue is recognised. Theaccruals are based on the Company’s historical experience of material usage and service del ivery costs.
xii. Foreign currency transactions
The Company is exposed to currency fluctuations on foreign currency transactions. Foreign currencytransactions are accounted in the books of accounts at the average rate for the month.
Transaction:
The difference between the rate at which foreign currency transactions are accounted and the rate at which
they are realized is recognised in the profit and loss account.
Integral operations:
In respect of integral operations, monetary assets and liabilities are translated at the exchange rateprevailing at the date of the balance sheet. Non-monetary items are translated at the historical rate. Theitems in the profit and loss account are translated at the average exchange rate during the period. Thedifferences arising out of the translation are recognised in the profit and loss account.

8/4/2019 Wipro Financial Statements
http://slidepdf.com/reader/full/wipro-financial-statements 14/37
CONSOLIDATED FINANCIAL STATEMENTS OF WIPRO LIMITED AND SUBSIDIARIES
Non-integral operations:
In respect of non-integral operations, assets and liabilities are translated at the exchange rate prevailing atthe date of the balance sheet. The items in the profit and loss account are translated at the averageexchange rate during the period. The differences arising out of the translation are transferred to translationreserve.
Translation:
Monetary foreign currency assets and liabilities at period-end are translated at the closing rate. Thedifference arising from the translation is recognised in the profit and loss account, except for the exchangedifference arising on monetary items that qualify as hedging instruments in a cash flow hedge or hedge of a net investment. In such cases the exchange difference is initially recognized in hedging reserve ortranslation reserve respectively. Such exchange differences are subsequently recognized in the profit andloss account on occurrence of the underlying hedged transaction or on disposal of the investmentrespectively.
xiii. Financial Instruments
Derivative instruments and Hedge accounting:
The Company is exposed to foreign currency fluctuations on foreign currency assets, liabilities, netinvestment in a foreign operation and forecasted cash flows denominated in foreign currency. TheCompany limits the effects of foreign exchange rate fluctuations by following established risk managementpolicies including the use of derivatives. The Company enters into derivative financial instruments, wherethe counterparty is a bank.
Effective April 1, 2007, based on the recognition and measurement principles set out in the AS 30, changesin the fair values of derivative financial instruments designated as cash flow hedges were recognizeddirectly in shareholders’ funds and reclassified into the profit and loss account upon the occurrence of thehedged transaction. The company also designated derivative financial instruments as hedges of netinvestment in non-integral foreign operation. The portion of the changes in fair value of derivativefinancial instruments that was determined to be an effective hedge was recognised in the shareholders’funds and would be recognised in the profit and loss account upon sale or disposal of rela ted non-integral
foreign operation. Changes in fair value relating to the ineffective portion of the hedges and derivatives notdesignated as hedges were recognized in the profit and loss account as they arose.
On April 1, 2008, the Company early adopted AS 30 and the limited revisions to other accountingstandards which come into effect upon adoption of AS 30. AS 30 states that particular sections of otheraccounting standards; AS 4, Contingencies and Events Occurring after Balance sheet Date, to the extent itdeals with contingencies, AS 11 (revised 2003), The Effects of Changes in Foreign Exchange Rates, to theextent it deals with the ‘forward exchange contracts’ and AS 13, Accounting for Investments, except to theextent it relates to accounting for investment properties, will stand withdrawn only from the date AS 30becomes mandatory (April 1, 2011 for the Company).
Accordingly, the Company continues to comply with the guidance under these accounting standards; AS 4– relating to Contingencies, AS 11 – relating to forward contracts and AS 13 until AS 30 becomesmandatory.
The impact of adoption of AS 30 has been described in Note 4 of the notes to accounts.

8/4/2019 Wipro Financial Statements
http://slidepdf.com/reader/full/wipro-financial-statements 15/37
CONSOLIDATED FINANCIAL STATEMENTS OF WIPRO LIMITED AND SUBSIDIARIES
Non-Derivative Financial Instruments
A financial instrument is any contract that gives rise to a financial asset of one entity and a financialliability or equity instrument of another entity. Financial assets of the Company mainly include cash andbank balances, sundry debtors, unbilled revenues, finance lease receivables, employee travel and otheradvances, other loans and advances and derivative financial instruments with a positive fair value.Financial liabilities of the Company mainly comprise secured and unsecured loans, sundry creditors,accrued expenses and derivative financial instruments with a negative fair value. Financial assets /
liabilities are recognized on the balance sheet when the Company becomes a party to the contractualprovisions of the instrument. Financial assets are derecognized when all of risks and rewards of theownership have been transferred. The transfer of risks and rewards is evaluated by comparing theexposure, before and after the transfer, with the variability in the amounts and timing of the net cash flowsof the transferred assets.
Short-term receivables with no stated interest rates are measured at original invoice amount, if the effect of discounting is immaterial. Non-interest-bearing deposits are discounted to their present value.
The Company measures the financial liabilities, except for derivative financial liabilities at amortized costusing the effective interest method. The Company measures the short-term payables with no stated rate of interest at original invoice amount, if the effect of discounting is immaterial.
xiv. Depreciation and amortisation
Depreciation is provided on straight line method at rates not lower than rates specified in Schedule XIV tothe Companies Act, 1956. In some cases, assets are depreciated at the rates which are higher thanSchedule XIV rates to reflect the economic life of asset. Management estimates the useful life of variousassets as follows:
Nature of asset Life of asset
Building........................................................... 30 – 60 yearsPlant and machinery............................... ......... 5 – 21 yearsOffice equipment......................................... ... 3 - 10 yearsVehicles........................................................... 4 years
Furniture and fixtures...................................... 3 - 10 yearsData processing equipment and software..... 2 – 6 years
Fixed assets individually costing Rs 5,000/- or less are depreciated at 100%.
Assets under capital lease are amortised over their estimated useful life or the lease term, whichever islower. Intangible assets are amortized over their estimated useful life. For various brands acquired by theCompany, the estimated useful life has been determined ranging between 20 to 25 years based on expectedlife, performance, market share, niche focus and longevity of the brand. Accordingly, such intangibleassets are being amortised over the determined useful life.
xv. Impairment of assets
Financial assets:
The Company assesses at each balance sheet date whether there is any objective evidence that a financialasset or group of financial assets is impaired. If any such indication exists, the Company estimates theamount of impairment loss. The amount of loss for short-term receivables is measured as the differencebetween the assets carrying amount and undiscounted amount of future cash flows. Reduction, if any, isrecognized in the profit and loss account. If at the balance sheet date there is any indication that if apreviously assessed impairment loss no longer exists, the recognised impairment loss is reversed, subjectto maximum of initial carrying amount of the short-term receivable.

8/4/2019 Wipro Financial Statements
http://slidepdf.com/reader/full/wipro-financial-statements 16/37
CONSOLIDATED FINANCIAL STATEMENTS OF WIPRO LIMITED AND SUBSIDIARIES
Other than financial assets:
The Company assesses at each balance sheet date whether there is any indication that a non-financial assetincluding goodwill may be impaired. If any such indication exists, the Company estimates the recoverableamount of the asset. If such recoverable amount of the asset or the recoverable amount of the cashgenerating unit to which the asset belongs to is less than its carrying amount, the carrying amount isreduced to its recoverable amount. The reduction is treated as an impairment loss and is recognised in theprofit and loss account. If at the balance sheet date there is an indication that if a previously assessed
impairment loss no longer exists, the recoverable amount is reassessed and the asset is reflected at therecoverable amount subject to a maximum of depreciated historical cost. In respect of goodwill theimpairment loss will be reversed only when it was caused by specific external events and their effects havebeen reversed by subsequent external events.
xvi. Provision for retirement benefits
Provident fund:
Employees receive benefits from a provident fund. The employee and employer each make monthly
contributions to the plan equal to 12% of the covered employee's salary. A portion of the contribution is
made to the provident fund trust managed by the Company, while the remainder of the contribution is
made to the Government's provident fund.
Compensated absences:
The employees of the Company are entitled to compensated absence. The employees can carry-forward aportion of the unutilized accrued compensated absence and utilize it in future periods or receive cashcompensation at retirement or termination of employment for the unutilized accrued compensated abs ence.The Company records an obligation for compensated absences in the period in which the employee rendersthe services that increase this entitlement. The Company measures the expected cost of compensatedabsence as the additional amount that the Compan y expects to pay as a result of the unused entitlement thathas accumulated at the balance sheet date.
Gratuity:
In accordance with applicable Indian laws, the Company provides for gratuity, a defined benefit retirementplan (Gratuity Plan) covering certain categories of employees. The Gratuity Plan provides a lump sumpayment to vested employees, at retirement or termination of employment, an amount based on therespective employee's last drawn salary and the years of employment with the Company. Liability withregard to gratuity plan is accrued based on actuarial valuations at the balance sheet date, carried out by anindependent actuary. Actuarial gain or loss is recognised immediately in the statement of profit and loss asincome or expense. The Company has an employees’ gratuity fund managed by the Life InsuranceCorporation of India (LIC).
Superannuation:
Apart from being covered under the Gratuity Plan described above, the employees of the Company alsoparticipate in a defined contribution plan maintained by the Company. This plan is administered by the
LIC & ICICI Prudential Insurance Company Limited. The Company makes annual contributions based on
a specified percentage of each covered employee's salary.
xvii. Employee stock options
The Company determines the compensation cost based on the intrinsic value method. The compensationcost is amortised on a straight line basis over the vesting period.

8/4/2019 Wipro Financial Statements
http://slidepdf.com/reader/full/wipro-financial-statements 17/37
CONSOLIDATED FINANCIAL STATEMENTS OF WIPRO LIMITED AND SUBSIDIARIES
xviii. Research and development
Revenue expenditure on research and development is charged to profit and loss account and capitalexpenditure is shown as addition to fixed assets.
xix. Income tax & Fringe benefit tax
Income tax:
The current charge for income taxes is calculated in accordance with the relevant tax regulations.
Deferred tax assets and liabilities are recognised for the future tax consequences attributable to timingdifferences that result between the profit offered for income taxes and the profit as per the financialstatements by each entity in the Company.
Deferred taxes are recognised in respect of timing differences which originate during the tax holidayperiod but reverse after the tax holiday period. For this purpose, reversal of timing difference is determinedusing FIFO method.
Deferred tax assets and liabilities are measured using the tax rates and tax laws that have been enacted orsubstantively enacted by the balance sheet date. The effect on deferred tax assets and liabilities of achange in tax rates is recognised in the period that includes the enactment/ substantive enactment date.
Deferred tax assets on timing differences are recognised only if there is a reasonable certainty thatsufficient future taxable income will be available against which such deferred tax assets can be realized.However, deferred tax assets on the timing differences when unabsorbed depreciation and losses carriedforward exist, are recognised only to the extent that there is virtual certainty that sufficient future taxableincome will be available against which such deferred tax assets can be realized.
Deferred tax assets are reassessed for the appropriateness of their respective carrying amounts at eachbalance sheet date.
The Company offsets, on a year on year basis, the current tax assets and liabilities, where it has a legallyenforceable right and where it intends to settle such assets and liabilities on a net basis.
Fringe benefit tax:
The Fringe Benefit Tax (FBT) is accounted for in accordance with the guidance note on accounting forfringe benefits tax issued by the ICAI. The provision for FBT is reported under income taxes.
xx. Earnings per share
Basic:
The number of shares used in computing basic earnings per share is the weighted average number of sharesoutstanding during the period excluding shares held by controlled trust.
Diluted:
The number of shares used in computing diluted earnings per share comprises the weighted average sharesconsidered for deriving basic earnings per share, and also the weighted average number of equity sharesthat could have been issued on the conversion of all dilutive potential equity shares.
Dilutive potential equity shares are deemed converted as of the beginning of the period, unless issued at alater date. The number of shares and potentially dilutive equity shares are adjusted for any stock splits andbonus shares issued.

8/4/2019 Wipro Financial Statements
http://slidepdf.com/reader/full/wipro-financial-statements 18/37
CONSOLIDATED FINANCIAL STATEMENTS OF WIPRO LIMITED AND SUBSIDIARIES
xxi. Cash flow statement
Cash flows are reported using the indirect method, whereby net profits before tax is adjusted for the effectsof transactions of a non-cash nature and any deferrals or accruals of past or future cash receipts orpayments. The cash flows from regular revenue generating, investing and financing activities of theCompany are segregated.

8/4/2019 Wipro Financial Statements
http://slidepdf.com/reader/full/wipro-financial-statements 19/37
CONSOLIDATED FINANCIAL STATEMENTS OF WIPRO LIMITED AND SUBSIDIARIES
NOTES TO ACCOUNTS
2. The following are the details for 1,464,980,746 (2008: 1,461,453,320) equity shares as of March 31,2009.
No. of shares Description
1,398,430,659 Equity shares / American Depository Receipts (ADRs) (2008: 1,398,430,659) havebeen allotted as fully paid bonus shares / ADRs by capitalization of Securitiespremium account and Capital redemption reserve
1,325,525 Equity shares (2008: 1,325,525) have been allotted as fully paid-up, pursuant toscheme of amalgamation, without payment being received in cash .
968,803 Equity shares ( 2008: Nil) allotted to the Wipro Inc Trust, the sole beneficiar y of which is Wipro Inc, wholly owned subsidiary of the Company, without paymentbeing received in cash, in consideration of acquisition of inter -companyinvestments.
3,162,500 Equity shares (2008: 3,162,500) representing American Depository Receiptsissued during 2000-2001 pursuant to American Depository offering by theCompany
60,168,259 Equity shares (2008: 57,609,636) issued pursuant to Employee Stock Option Plan
3. Note on Reserves:
i) Restricted stock units reserve includes Deferred Employee Compensation, which represents futurecharge to the profit and loss account and employee stock options outstanding to be treated as securitiespremium at the time of allotment of shares.
ii) Additions to General Reserve include:
(Rs in Million )
Particulars For the year ended March 31,
2009 2008
Transfer from Profit and Loss Account................................... .... 32,143 22,575
Adjustment on account of amalgamation ……………………... - (3,601)
Adjustment on adoption of AS 30 (89) -Others……………………………………………………………. (5) -
32,049 18,974
4. Adoption of AS 30
In December 2007, the ICAI issued AS 30. Although AS 30 becomes recommendatory in respect of accounting periods commencing on or after April 1, 2009 and mandatory in respect of accountingperiods commencing on or after April 1, 2011, in March 2008 the ICAI announced that the earlieradoption of AS 30 is encouraged. AS 30, along with limited revision to other accounting standards hascurrently not been notified pursuant to Companies (Accounting Standard) Rules, 2006.
On April 1, 2008, the Company early adopted AS 30 and the limited revisions to other accounting
standards which come into effect upon adoption of AS 30.AS 30 states that particular sections of other accounting standards; AS 4, Contingencies and EventsOccurring after Balance sheet Date, to the extent it deals with contingencies, AS 11 (revised 2003), TheEffects of Changes in Foreign Exchange Rates, to the extent it deals with the ‘forward exchangecontracts’ and AS 13, Accounting for Investments, except to the extent it relates to accounting forinvestment properties, would stand withdrawn only from the date AS 30 becomes mandatory (April 1,2011 for the Company).
Accordingly, the Company continues to comply with the guidance under these accounting standards; AS4 – relating to Contingencies, AS 11 – relating to Forward Contracts and AS 13 until AS 30 becomesmandatory.

8/4/2019 Wipro Financial Statements
http://slidepdf.com/reader/full/wipro-financial-statements 20/37
CONSOLIDATED FINANCIAL STATEMENTS OF WIPRO LIMITED AND SUBSIDIARIES
Until March 31, 2008, the Company applied the recognition and measurement principles as set out in AS30 in accounting for derivatives and hedge accounting. Changes in the fair values of derivative financialinstruments designated as cash flow hedges were recognized directly in shareholders’ funds andreclassified into the profit and loss account upon the occurrence of the hedged transaction. The Companyalso designated derivative financial instruments as hedges of net investments in non-integral foreignoperation. The portion of the changes in fair value of derivative financial instruments that wasdetermined to be an effective hedge is recognized in the shareholders’ funds and was recognized in the
profit and loss account upon sale or disposal of related non-integral foreign operation. Changes in fairvalue relating to the ineffective portion of the hedges and derivatives not designated as hedges wererecognized in the profit and loss account as they arose.
As the Company was already applying the principles of AS 30 in respect of its accounting for derivativefinancial instruments in relation to derivative and hedge accounting, the early adoption of AS 30 did nothave a material impact on the Company.
As permitted by AS 30 and the consequent limited revisions to other accounting standards, the Companyhas designated a yen-denominated foreign currency borrowing amounting to JPY 27 billion, along with afloating for floating Cross-Currency Interest Rate Swap (CCIRS), as a hedging instrument to hedge itsnet investment in a non-integral foreign operation. In addition the company has also designated yen-denominated foreign currency borrowing amounting to JPY 8 billion along with floating for fixedCCIRS as cash flow hedge of the yen- denominated borrowing and also as a hedge of net investment in anon-integral foreign operation
Accordingly, the translation gain/ (loss) on the foreign currency borrowings and portion of the changesin fair value of CCIRS which are determined to be effective hedge of net investment in non -integraloperation aggregating to Rs 551 Million and Rs 3,044 Million for the quarter and year ended March 31,2009, respectively was recognized in translation reserve / hedging reserve in shareholders’ funds. Theamount of loss of Rs 507 Million and Rs 3,753 Million respectively for the quarter and year endedMarch 31, 2009 recognized in translation reserve would be transferred to profit and loss account uponsale or disposal of non-integral foreign operations and the amount of loss of Rs 43 Million and gain of Rs 709 Million for the quarter and year ended March 31, 2009 recognized in the hedging reserve wouldbe transferred to profit and loss upon occurrence of the hedged transaction.
In accordance with AS 11, if the Company had continued to recognize translation losses on foreigncurrency borrowing in the profit and loss account, the foreign currency borrowing would not have beeneligible to be combined with CCIRS for hedge accounting. Consequently the CCIRS also would not havequalified for hedge accounting and changes in fair value of CCIRS would have been recognized in theprofit and loss account. As a result profit after tax for the quarter and year ended March 31, 2009 wouldhave been lower by Rs 551 Million and Rs 3,044 Million respectively.
5. Derivatives
As of March 31, 2009, the Company had derivative financial instruments to sell USD 1,060 Million,GBP 54 Million and JPY 6,130 Million and CCIRS of JPY 8 Billion relating to highly probableforecasted transactions. As of March 31, 2008, the Company had derivative financial instruments to sellUSD 2,497 Million, GBP 84 Million, EUR 24 Million and JPY 7,682 Million relating to highly probableforecasted transactions. As of March 31, 2009, the Company has recognised mark-to-market losses of Rs16,150 Million (2008: Rs 1,097 Million) relating to derivative financial instruments that are designated
as effective cash flow hedges in the shareholders’ funds.
In addition to Yen denominated foreign currency borrowing and related CCIRS discussed in Note 4, theCompany had derivative financial instruments to sell USD 267 Million and Euro 40 Million designatedas hedge of net investment in non-integral foreign operations as of March 31, 2009. For the quarter andyear ended March 31, 2009, the Company has recognized Mark to market losses of Rs 833 Million andRs 4,410 Million respectively (2008: Rs 495 Million) relating to the above derivative financialinstruments in translation reserve in the shareholders’ funds.
As of March 31, 2009, the Company had undesignated derivative financial instruments to sell USD 612Million, GBP 53 Million and EUR 39 Million. As of March 31, 2008, the Company had undesignatedderivative financial instruments to sell USD 414 Million, GBP 58 Million and EUR 39 Million. The

8/4/2019 Wipro Financial Statements
http://slidepdf.com/reader/full/wipro-financial-statements 21/37
CONSOLIDATED FINANCIAL STATEMENTS OF WIPRO LIMITED AND SUBSIDIARIES
Company has recognized mark-to-market gain/ (losses) on such derivative financial instruments throughthe profit and loss account.
6. Acquisitions
In January 2009, the Company acquired 100% shareholding in India based Citi Technology ServicesLimited (subsequently renamed as Wipro Technology Services Limited - “WTS”) for a purchaseconsideration of US $ 127 Million and has recorded a goodwill of Rs 4,472 Million. WTS is an Indiabased provider of information technology services and solutions to Citi Group worldwide. WTS has astrong competency in Technology Infrastructure Services (TIS), Application Development and
Maintenance services (ADM) for cards, capital markets and corporate banking. The acquisition willenhance Wipro’s capabilities to compete for both TIS business and ADM business in the financialservice industry.
7. Merger of certain subsidiaries
(i) In the terms of the scheme of amalgamation filed with and endorsed by the State of Delaware,United States of America, Spectramind Inc. amalgamated with Wipro Inc. with effect fromMarch 31, 2009. The amalgamation has been accounted as ‘amalgamation in the nature of merger’ in accordance with AS 14, Accounting for Amalgamations.
(ii) The Company has merged its following, fully owned subsidiaries into Infocrossing Inc with
effect from March 31, 2009:
a) Infocrossing EAS Incb) Infocrossing Services Incc) Infocrossing West Incd) Infocrossing Healthcare Services Ince) Infocrossing iConnection, Incf) Infocrossing Services West Inc.
(iii) The Company has merged Infocrossing Services Southeast Inc, a fully owned subsidiary intoInfocrossing LLC with effect from March 31, 2009.
8. Finance lease receivables
The Company provides lease financing for the traded and manufactured products primarily through financeleases. The finance lease portfolio contains only the normal collection risk with no important uncertaintieswith respect to future costs. These receivables are generally due in monthly, quarterly or semi-annualinstallments over periods ranging from 3 to 5 years.
The components of finance lease receivables are as follows:
( Rs in Million)
Particulars As of March 31,
2009 2008
Gross investment in lease for the period…………… … 4,376 836Not later than one year………………………………. 1,024 197
Later than one year and not later than five years… … 3,180 555Unguaranteed residual values …………………… …. 172 84
Unearned finance income……………………………. . (771) (171)
Net investment in finance receivables……………… ... 3,605 665

8/4/2019 Wipro Financial Statements
http://slidepdf.com/reader/full/wipro-financial-statements 22/37
CONSOLIDATED FINANCIAL STATEMENTS OF WIPRO LIMITED AND SUBSIDIARIES
Present value of minimum lease receivables are as follows:
(Rs in Million)
Particulars As of March 31,
2009 2008
Present value of minimum lease paymentsreceivables....................................................................
3,605 604
Not later than one year…………………………….. 967 181Later than one year and not later than five years….. 2,638 423
9. Assets taken on lease
Finance leases:
The following is a schedule of present value of future minimum lease payments under capital leases,together with the value of the minimum lease payments as of March 31, 2009
(Rs in Million)
Particulars As of March 31,
2009 2008
Present value of minimum lease payments:Not later than one year…………………………….. 431 323Later than one year and not later than five years….. 915 629Thereafter………….………………………………. 71 72
Total present value of minimum lease payments…….. 1,417 1,024Add: Amount representing interest…………………… 243 199
Total value of minimum lease payments……………... 1,660 1,223
Operating leases:
The Company leases office and residential facilities under cancelable and non-cancelable operating leaseagreements that are renewable on a periodic basis at the option of both the lessor and the lessee. Rentalpayments under such leases are Rs 2,526 Million and Rs 1,880 Million during the years ended March 31,
2009 and 2008 respectively.
Details of contractual payments under non-cancelable leases are given below:
( Rs in Million)
Particulars As of March 31,
2009 2008
Not later than one year………………….. ............... 1,064 773Later than one year and not later than five years… 3,669 2,433Thereafter…………………………………………. 3,168 2,826
Total…………………………………… ………... .. 7,901 6,032
10. The Company has a 49% equity interest in Wipro GE Healthcare Private Limited (Wipro GE), an entityin which General Electric, USA holds the majority equity interest. The shareholders agreement providesspecific rights to the two shareholders. Management believes that these specific rights do not confer j ointcontrol as defined in Accounting Standard 27 “Financial Reporting of Interests in Joint Ventures”.Consequently, Wipro GE is not considered as a joint venture and consolidation of financial statements iscarried out as per the equity method in terms of Accounting Standard 23 “Accounting for Investments inAssociates in Consolidated Financial statements”.

8/4/2019 Wipro Financial Statements
http://slidepdf.com/reader/full/wipro-financial-statements 23/37
CONSOLIDATED FINANCIAL STATEMENTS OF WIPRO LIMITED AND SUBSIDIARIES
11. Employee Benefit Plans
Gratuity: In accordance with applicable Indian laws, the Company provides for gratuity, a defined benefitretirement plan (Gratuity Plan) covering certain categories of employees. The Gratuity Plan provides alump sum payment to vested employees, at retirement or termination of employment, an amount based onthe respective employee's last drawn salary and the years of employment with the Company. The Company
provides the gratuity benefit through annual contributions to a fund managed by the Life InsuranceCorporation of India (LIC). Under this plan, the settlement obligation remains with the Company, althoughthe LIC administers the plan and determines the contribution premium required to be paid by theCompany.
(Rs in Million)
Change in the benefit obligation As of March 31,
2009 2008
Projected Benefit Obligation (PBO) at thebeginning of the year...................... .................
1,515 1,121
Service cost................................ ...................... 369 281
Interest cost................................ ...................... 135 83
Benefits paid................................... ................. (118) (135)
Actuarial loss/(gain).............. .......................... (77) 165
PBO at the end of the year.................. ............. 1,824 1,515
(Rs in Million)
Change in plan assets As of March 31,
2009 2008
Fair value of plan assets at the beginning of theyear............................................................
1,244 727
Expected return on plan assets........................ 92 52
Employer contributions................................... 154 550
Benefits paid........................... ......................... (118) (135)
Actuarial (loss) / gain............................ ........ 25 50
Fair value of plan assets at the end of the year 1,397 1,244
Present value of unfunded obligation.............. (427) (271)
Recognised liability..................................... .... (427) (271)
The Company has invested the plan assets with the Life Insurance Corporation of India. Expected rate of return on the plan asset has been determined scientifically considering the current and expected plan assetallocation, historical rate of return earned by the company, current market trend and the expected return onthe plan assets. Expected contribution to the fund during the year ending March 31, 2010 is Rs 764Million.
Net gratuity cost for the year ended March 31, 2009 and 2008 are as follows:
( Rs in Million)
Particulars For the year ended March 31,
2009 2008
Service cost...................................... .................. 369 282
Interest cost........................................... ............. 135 82
Expected return on plan assets........................... (92) (52)
Actuarial loss / (gain)......................... ............. (102) 115
Net gratuity cost……………………………… 310 427

8/4/2019 Wipro Financial Statements
http://slidepdf.com/reader/full/wipro-financial-statements 24/37
CONSOLIDATED FINANCIAL STATEMENTS OF WIPRO LIMITED AND SUBSIDIARIES
The weighted average actuarial assumptions used to determine benefit obligations and net periodic gratuitycost are:
AssumptionsAs of March 31,
2009 2008
Discount rate.................................... ................. 6.75% 7.75%
Rate of increase in compensation levels........... 5% 7%
Rate of return on plan assets............................. 8% 7.50%
The Company assesses these assumptions with its projected long-term plans of growth and prevalentindustry standards. The estimates of future salary increase, considered in actuarial valuation, take accountof inflation, seniority, promotion and other relevant factors such as supply and demand factors in theemployment market.
Superannuation: Apart from being covered under the gratuity plan, the employees of the Company alsoparticipate in a defined contribution plan maintained by the Company. This plan is administered by theLIC & ICICI. The Company makes annual contributions based on a specified percentage of each coveredemployee's salary.
Provident fund (PF): In addition to the above, all employees receive benefits from a provident fund. Theemployee and employer each make monthly contributions to the plan equal to 12% of the coveredemployee's salary. A portion of the contribution is made to the provident fund trust established by theCompany, while the remainder of the contribution is made to the Government's provident fund. For theyear ended March 31, 2009, the Company contributed Rs 2,426 Million to PF and other employee welfarefunds (2008: Rs 1,326 Million)
The interest rate payable by the trust to the beneficiaries is regulated by the statutory authorities. Thecompany has an obligation to make good the shortfall, if any, between the returns from its investments andthe administered rate.
The Guidance on implementing AS 15, Employee Benefits issued by the Accounting Standards Board(ASB) provides that exempt provident funds which require employers to meet the interest shortfall are in
effect defined benefit plans. The Company’s actuary has informed that it is currently not practicable toactuarially determine the interest shortfall obligation. The computation of liability and disclosure inaccordance with the provisions of AS 15 cannot be implemented due to the inability o n the part of theactuary to measure it.
12. Employee stock option
i) Employees covered under Stock Option Plans and Restricted Stock Unit (RSU) Option Plans are grantedan option to purchase shares of the Company at the respective exercise prices, subject to requirements of vesting conditions. These options generally vest over a period of five years from the date of grant. Uponvesting, the employees can acquire one equity share for every option. The maximum contractual term foraforementioned stock option plans is generally 10 years.
ii) The stock compensation cost is computed under the intrinsic value method and amortised on a straightline basis over the total vesting period of five years. The Company has granted 8,366,676 Options underRSU Options Plan and 120,000 options under Stock Options Plan during the year ended March 31, 2009.For the quarter and year ended March 31, 2009 the Company has recorded stock compensation expenseof Rs 427 Million and Rs 1,770 Million respectively (2008: Rs 291 Million and Rs 1,166 Millionrespectively).
iii) The Company has instituted various Employee Stock Option Plans. The compensation committee of theboard evaluates the performance and other criteria of employees and approves the grant of options.These options vest with employees over a specified period subject to fulfillment of certain conditions.Upon vesting, employees are eligible to apply and secure allotment of Company’s shares at a pricedetermined on the date of grant of options. The particulars of options granted under various plans are

8/4/2019 Wipro Financial Statements
http://slidepdf.com/reader/full/wipro-financial-statements 25/37
CONSOLIDATED FINANCIAL STATEMENTS OF WIPRO LIMITED AND SUBSIDIARIES
tabulated below. (The numbers of shares in the table below are adjusted for any stock splits and bonusshares issues).
Activity under Stock Option plans
Particulars Year Ended March 31, 2009 Year Ended March 31, 2008
SharesWt. average
exercise price
Shares Wt. average
exercise
price
Outstanding at the beginning of theyear………………...........................
1,228,632 264 3,511,408 317
Granted.……………........................ 120,000 489 - -
Exercised……………...................... 349,499 263 1,712,077 332
Forfeited and lapsed……................. 876,387 264 570,699 367
Outstanding at the end of theyear……………................................
122,746 484 1,228,632 264
Exercisable at the end of the year 2,746 245 1,228,632 264
Activity under Restricted Stock Option plans
Particulars Year Ended March 31, 2009 Year Ended March 31, 2008
Shares Wt. averageexercise price
Shares Wt. averageexercise
price
Outstanding at the beginning of theyear………………...........................
11,585,399 2 12,498,194 2
Granted.……………........................ 8,366,676 2 746,686 2
Exercised……………...................... 2,209,124 2 741,591 2
Forfeited and lapsed……................. 1,472,725 2 917,890 2
Outstanding at the end of theyear……………................................
16,270,226 2 11,585,399 2
Exercisable at the end of the year 3,184,399 2 1,330,107 2
The following table provides details in respect of range of exercise price and weighted average remainingcontractual life (in months) for the options outstanding as at March 31, 2009.
Range of exercise price Year Ended March 31, 2009 Year Ended March 31, 2008
SharesWt. average
remaining life
Shares Wt. average
remaininglife
Rs 2 16,270,225 44.85 11,585,399 43.11
Rs 172 – 255 1,140 2.93 12,840 10.49
Rs 265 – 396 - - 1,207,087 13.91
Rs 489 120,000 64 -
$ 3.46 – 5.01 1,606 11.90 6,006 14.89$ 5.82 – 6.90 - - 2,699 11.93
iv) The Finance Act, 2007 introduced Fringe Benefit Tax (FBT) on employee stock options. The differencebetween the fair value of the underlying share on the date of vesting and the exercise price paid by theemployee is subject to FBT. The Company recovers such tax from the employee. During the year endedMarch 31, 2009 the Company has recognised FBT liability and related recovery of Rs 197 Million (2008:Rs 81 Million) arising from the exercise of stock options. The Company’s obligation to pay FBT arisesonly upon the exercise of stock options.

8/4/2019 Wipro Financial Statements
http://slidepdf.com/reader/full/wipro-financial-statements 26/37
CONSOLIDATED FINANCIAL STATEMENTS OF WIPRO LIMITED AND SUBSIDIARIES
13. The Company had received tax demands from the Indian income tax authorities for the financial yearsended March 31, 2001, 2002, 2003 and 2004 aggregating to Rs. 11,127 (including interest of Rs. 1,503).The tax demand was primarily on account of denial of deduction claime d by the Company under Section10A of the Income Tax Act 1961, in respect of profits earned by its undertakings in Software TechnologyPark at Bangalore. The appeals filed by the Company for the above years to the first appellate authoritywere allowed in favour of the Company, thus deleting substantial portion of the demand raised by theIncome tax authorities. On further appeal filed by the income tax authorities, the second appellate authority
upheld the claim of the company for the years ended March 31, 2001, 2002, 2003 and 2004. In December2008, the Company received, on similar grounds, an additional tax demand of Rs. 5,388 (including interestof Rs. 1,615) for the financial year ended March 31, 2005. The Company has filed an appeal against thesaid demand within the time limits permitted under the statute.
Considering the facts and nature of disallowance and the order of the first appellate authority upholdingour claims for earlier years, we believe that the final outcome of the above disputes should be in our favourand there should not be any material impact on the financial statements.
14. Product warranty expenses are accrued based on the Company’s historical experience of material usageand service delivery costs.
(Rs in Million)
Particulars For the year ended March 31,2009 2008
Provision at the beginning of the year................ 941 831Additions during the year................................... 730 944Utilised during the year...................................... (682) (834)
Provision at the end of the year.......................... 989 941
15. The working for computation of equity shares used in calculating basic & diluted earnings per share is setout below:
Particulars For the year ended March 31,
2009 2008
Weighted average equity shares outstanding........................... 1,462,624,262 1,459,089,479Share held by a controlled trust................................... ............ (7,961,760) (7,961,760)
Weighted average equity shares for computing basic EPS 1,454,662,502 1,451,127,719Dilutive impact of employee stock options............................. 4,690,367 7,111,341
Weighted average equity shares for computing dilutedEPS..........................................................................................
1,459,352,869 1,458,239,060
Net income considered for computing diluted EPS (Rs inMillion)...................................................... ................ ..............
38,999 32,829

8/4/2019 Wipro Financial Statements
http://slidepdf.com/reader/full/wipro-financial-statements 27/37
CONSOLIDATED FINANCIAL STATEMENTS OF WIPRO LIMITED AND SUBSIDIARIES
16. The list of subsidiaries is given below :
Direct Subsidiaries Step SubsidiariesCountry of
Incorporation
Wipro Inc. USA
Wipro Gallagher Solutions Inc USA
Enthink Inc. USA
Infocrossing Inc USA
Infocrossing, LLC USA
cMango Pte Limited Singapore
Wipro Japan KK Japan
Wipro Shanghai
Limited China
Wipro TrademarksHolding Limited India
Cygnus Negri InvestmentsPrivate Limited India
Wipro Travel ServicesLimited India
Wipro Consumer CareLimited India
Wipro Holdings(Mauritius) Limited Mauritius
Wipro Holdings UK Limited UK
Wipro Technologies UKLimited UK
BVPENTEBeteiligungsverwaltung GmbH Austria
New Logic TechnologiesGmbH Austria
NewLogic TechnologiesSARL France
3D Networks FZ-LLC Dubai
3D Networks (UK)Limited UK
Wipro Cyprus PrivateLimited Cyprus
Wipro Technologies S.A DEC.V Mexico
Wipro BPO Philippines LTD.Inc Philippines
Wipro Holdings HungaryKorlátolt Felel•sség Társaság Hungary
Wipro Technologies ArgentinaSA Argentina
Wipro InformationTechnology Egypt SAE Egypt
Wipro Arabia Limited(a)
Dubai
Wipro Poland Sp Zoo Poland
Wipro InformationTechnology Netherlands BV(Formely Retail Box BV) Netherlands
Enabler Informatica SA Portugal
Enabler France SAS
Enabler UK Ltd
Wipro do BrasilTechnologia Ltda

8/4/2019 Wipro Financial Statements
http://slidepdf.com/reader/full/wipro-financial-statements 28/37
CONSOLIDATED FINANCIAL STATEMENTS OF WIPRO LIMITED AND SUBSIDIARIES
Wipro TechnologiesGmbh.(formely Enabler &Retail Consult Gmbh)
Wipro TechnologiesLimited, Russia Russia
Wipro Technologies OY(formerly Saraware OY) Finland
Wipro InfrastructureEngineering AB Sweden
Wipro InfrastructureEngineering OY Finland
Hydrauto Celka San veTic Turkey
Wipro Technologies SRL Romania
Wipro Singapore Pte Limited Singapore
Unza Holdings Limited (A) Singapore
Wipro Technocentre(Singapore) Pte Limited Singapore
Wipro (Thailand) CoLimited Thailand
Wipro Australia PtyLimited Australia
Wipro Networks PteLimited (formerly 3DNetworks Pte Limited) Singapore
Planet PSG Pte Limited Singapore
Planet PSG SDN BHD Malaysia
Wipro ChengduLimited China
Wipro ChandrikaLimited (b) India
WMNETSERV Limited Cyprus
WMNETSERV (UK) Ltd. UK
WMNETSERV INC.
USA
Wipro TechnologyServices Limited India
All the above subsidiaries are 100% held by the Company except the following:a) 66.67% held in Wipro Arabia Limitedb) 90% held in Wipro Chandrika Limited
8/4/2019 Wipro Financial Statements
http://slidepdf.com/reader/full/wipro-financial-statements 29/37
CONSOLIDATED FINANCIAL STATEMENTS OF WIPRO LIMITED AND SUBSIDIARIES
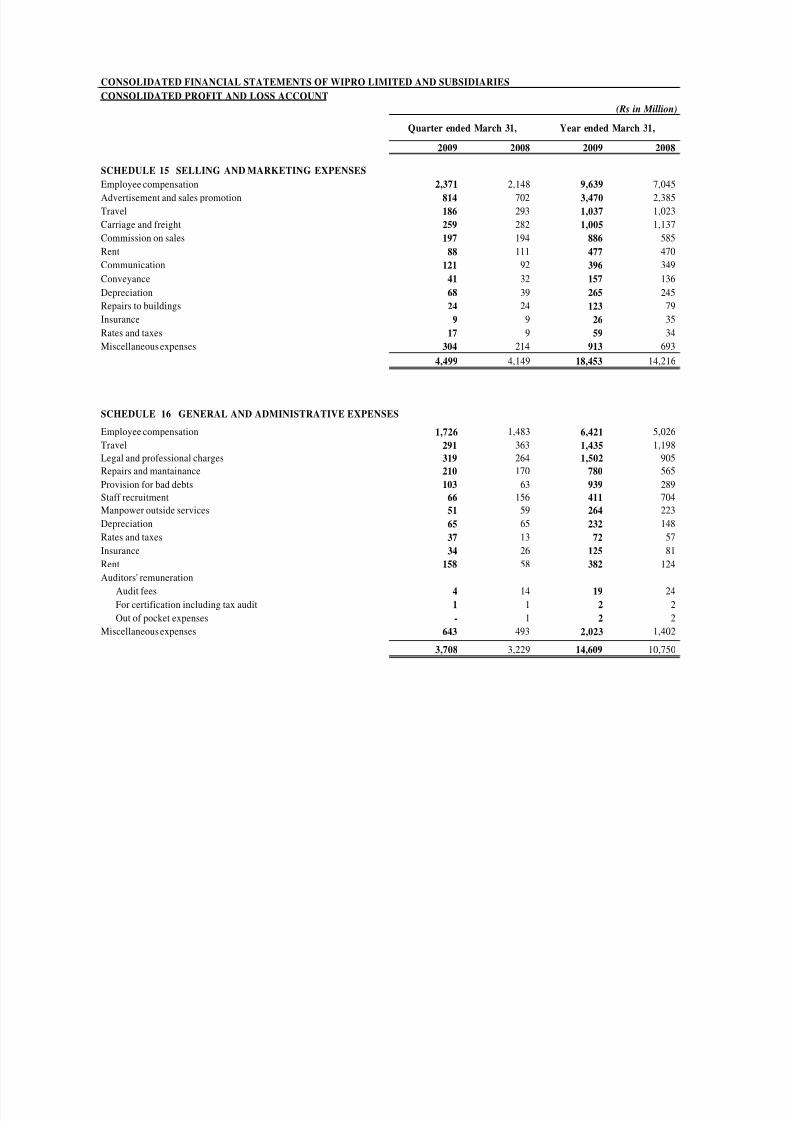
A. Step Subsidiary details of Unza Holdings Limited are as follows :
Step subsidiaries Step subsidiariesCountry of
Incorporation
Unza Company Pte Ltd Singapore
Unza Indochina Pte Ltd Singapore
Unza Vietnam Co., Ltd Vietnam
Unza Cathay Ltd Hong Kong
Unza China Ltd Hong Kong
Dongguan Unza ConsumerProducts Ltd. China
PT Unza Vitalis Indonesia
Unza Thailand Limited Thailand
Unza Overseas Ltd British virgin islands
Unza Africa Limited Nigeria
Unza Middle East Ltd British virgin islands
Unza InternationalLimited British virgin islands
Positive Equity SdnBhd MalaysiaUnza Nusantara SdnBhd Malaysia
Unza Holdings Sdn Bhd Malaysia
Unza Malaysia Sdn Bhd Malaysia
UAA (M) Sdn Bhd Malaysia
Manufacturing Services SdnBhd Malaysia
Shubido Pacific Sdn Bhd(a)
Malaysia
Gervas Corporation Sdn Bhd Malaysia
Gervas (B) Sdn Bhd Malaysia
Formapac Sdn Bhd Malaysiaa) All the above subsidiaries are 100% held by the Company except Shubido Pacific Sdn Bhd in which the holdingis 62.55%

8/4/2019 Wipro Financial Statements
http://slidepdf.com/reader/full/wipro-financial-statements 30/37
CONSOLIDATED FINANCIAL STATEMENTS OF WIPRO LIMITED AND SUBSIDIARIES
17. Related party relationships and transactions:
The related parties are:
Name of the entity Nature % of holding Country of
Incorporation
Wipro Equity Reward Trust Trust Fully controlled trust IndiaWipro Inc Trust Trust Fully controlled trust USA
Wipro GE Healthcare Private Limited Associate 49% India
Azim Premji Foundation Entity controlled by Director
Hasham Premji (partnership firm) Entity controlled by Director
Azim Premji Chairman and ManagingDirector
Suresh C Senapaty Chief Financial Officer& Director
Suresh Vaswani Jt CEO, IT Business &Director
Girish S Paranjpe Jt CEO, IT Business &Director
Rishad Premji Relative of the director
The Company has the following related party transactions:(Rs in Million)
Transaction / Balances
Associate/
Trusts
Entities
controlled by
Directors
Non-Executive
Directors/ Key
Management
personnel*
2009 2008 2009 2008 2009 2008
Sales of services - - - - - -
Sale of goods 15 19 1 4 - -
Purchase of services - 1 - - - -
Dividend 36# - - - 4,648
Payments to non-executive
directors:
Dr. Ashok Ganguly 2 1
Narayan Vaghul 2 1
Dr. Jagdish N Sheth 3 2
P.M. Sinha 1 1
B.C. Prabhakar 1 1
Bill Owens 4 3
Payments to key management
personnel*74 18
Balances as on March 31,Receivables - 40 - - - -
Payables 36#
- - - 4,652 -
*Includes remuneration paid to relative of director.#
Represents dividend payable to Wipro Inc Trust and Wipro Equity Reward Trust.
The following are the significant transactions during the year ended March 31, 2009 and 2008:
(Rs in Million)
Name of the entity
Sale of goods
2009 2008
Wipro GE Healthcare Private Limited 15 19

8/4/2019 Wipro Financial Statements
http://slidepdf.com/reader/full/wipro-financial-statements 31/37
CONSOLIDATED FINANCIAL STATEMENTS OF WIPRO LIMITED AND SUBSIDIARIES
18. Estimated amount of contracts remaining to be executed on capital accounts and contingent liabilities:
(Rs in Million)
Particulars As at March 31,
2009 2008
Estimated amount of contracts remaining to be executed on Capitalaccount and not provided for................. .......................................... ...
5,371 7,266
Contingent liabilities in respect of:
a) Disputed demands for excise duty, customs duty, income tax, salestax and other matters....................................................................
872 333
b) Performance and financial guarantees given by the Banks on behalf of the Company............................................................................
8,305 4,392
19. Borrowings
The Company entered into an arrangement with a consortium of banks to obtain External CommercialBorrowings (ECB) during the year ended March 31, 2008. Pursuant to this arrangement the Company hasavailed ECB of approximately 35 billion Yen repayable in full in March 2013. The ECB is an unsecuredborrowing and the Company is subject to certain customary restrictions on additional borrowings and
quantum of payments for acquisitions in a financial year.
20. Income Tax
The provision for taxation includes tax liability in India on the company’s worldwide income. The tax hasbeen computed on the worldwide income as reduced by the various deductions and exemptions providedby the Income tax act in India (Act) and the tax credit in India for the tax liabilities payable in foreigncountries.
Most of the company’s operations are through units in Software Technology Parks (‘STPs’). Income fromSTPs is eligible for 100% deduction for the earlier of 10 years commencing from the fiscal year in whichthe unit commences operations or March 31, 2010. The Company also has operations in Special EconomicZones (SEZ’s). Income from SEZ’s are eligible for 100% deduction for the first 5 years, 50% deductionfor the next 5 years and 50% deduction for another 5 years subject to fulfilling certain con ditions.
Pursuant to the amendments in the Act, the company has calculated its tax liability after considering theprovisions of law relating to Minimum Alternate Tax (MAT). As per the Act, any excess of MAT paidover the normal tax payable can be carried forward and set off against the future tax liabilities andaccordingly the same is disclosed under ‘Loans and Advances’ in the balance sheet as of March 31, 2009.
i) Provision for tax has been allocated as follows:
(Rs in Million)
Particulars For the year ended March 31,
2009 2008
Net Current tax*……………………………................... ..... 6,203 4,194Deferred tax …………………....... ......................................... (155) 62Fringe benefit tax…………………………………………… 412 294
Total income taxes………………………………………… 6,460 4,550
*- Current tax provision includes reversal of tax provision in respect of earlier periods no longer requiredamounting to Rs 369 Million for the year ended March 31, 2009 ( 2008: Rs 529 Million) and Rs 212 Million forthe quarter ended March 31, 2009 (2008: Rs (48) Million)

8/4/2019 Wipro Financial Statements
http://slidepdf.com/reader/full/wipro-financial-statements 32/37
CONSOLIDATED FINANCIAL STATEMENTS OF WIPRO LIMITED AND SUBSIDIARIES
ii) The components of the net deferred tax asset are as follows:
(Rs in Million)
Particulars As of March 31,
2009 2008
Fixed assets – depreciation differential.......................................... (548) (375)Accrued expenses and liabilities……........................... .................. 715 514Allowances for doubtful debts……………………………………. 260 194Amortisable goodwill…………………………………………… (527) (472)Carry – forward business losses…………………………………… 811 608Others.................................. ............................. ................................. (27) 60
Net deferred tax assets…………………………………………... 684 529
8/4/2019 Wipro Financial Statements
http://slidepdf.com/reader/full/wipro-financial-statements 33/37
CONSOLIDATED FINANCIAL STATEMENTS OF WIPRO LIMITED AND SUBSIDIARIES
21. The segment information for the quarter and year ended March 31, 2009 is as follows:
Until March 31, 2008, the Company was reporting Global IT Services & Products (comprising of IT Services &Products and BPO Services segments), India & AsiaPac IT Servi ces & Products, Consumer Care & Lighting andOthers.
In April 2008, the Company re-organized its IT businesses by combining the Global IT Services & Products andthe India & AsiaPac IT Services & Products businesses and appointed joint CEOs for the combined IT business.Consequent to the re-organization of the Company, the Company changed its system of internal financialreporting to the board of directors and the chief executive officer wherein the financial results are reported as ITServices and IT Products. Accordingly, the Company identified IT services and IT products as reportablesegments. There is no change in the reportable segments for other businesses.
Segment information in respect of earlier period has been revised to conform to the presentat ion as per currentreportable segments.
IT Services segment provides IT and IT enabled services to customers. Key service offering includes softwareapplication development, application maintenance, research and development services for hardware and softwa redesign, data center outsourcing services and business process outsourcing services.
IT Products segment sells a range of Wipro personal desktop computers, Wipro servers and Wipro notebooks
and is a value added reseller of desktops, servers, notebooks, storage products, networking solutions andpackaged software for leading international brands.

8/4/2019 Wipro Financial Statements
http://slidepdf.com/reader/full/wipro-financial-statements 34/37
Rs. in Million
Particulars
2009 2008 Growth % 2009 2008 Growth %Revenues
IT Services 49,323 41,206 20% 191,661 146,626 31%IT Products 8,698 7,838 11% 34,552 26,400 31%
Consumer Care and Lighting 5,164 4,808 7% 20,830 15,207 37%Others 1,469 3,272 9,144 11,691
Eliminations (136) (122) (745) (349)
TOTAL 64,518 57,002 13% 255,442 199,575 28%
Profit before Interest and Tax - PBIT
IT Services 10,729 8,641 24% 40,323 31,290 29%IT Products 372 375 -1% 1,481 1,227 21%
Consumer Care and Lighting 683 630 8% 2,548 1,900 34%
Others (310) 285 (348) 770
TOTAL 11,474 9,931 16% 44,004 35,187 25%
Interest and Other Income, Net 308 182 1,192 1,883
Profit Before Tax 11,782 10,113 17% 45,196 37,070 22%
Income Tax expense including Fringe Benefit Tax (1,667) (1,399) (6,460) (4,550)Profit before Share in earnings of associates and
minority interest 10,115 8,714 16% 38,736 32,520 19%
Share in earnings of associates 35 100 362 333
Minority interest (50) (16) (99) (24)
PROFIT AFTER TAX 10,100 8,798 15% 38,999 32,829 19%
Operating Margin
IT Services 21.8% 21.0% 21.0% 21.3%
IT Products 4.3% 4.8% 4.3% 4.6%
Consumer Care and Lighting 13.2% 13.1% 12.2% 12.5%
TOTAL 17.8% 17.4% 17.2% 17.6%
CAPITAL EMPLOYED
IT Services and Products 119,997 93,969 119,997 93,969Consumer Care and Lighting 18,689 17,292 18,689 17,292
Others 54,742 50,659 54,742 50,659
TOTAL 193,428 161,920 193,428 161,920
CAPITAL EMPLOYED COMPOSITION
IT Services and Products 62% 58% 62% 58%
Consumer Care and Lighting 9% 11% 9% 11%
Others 28% 31% 28% 31%
TOTAL 100% 100% 100% 100%
RETURN ON AVERAGE CAPITAL EMPLOYED
IT Services and Products 40% 40% 39% 44%
Consumer Care and Lighting 15% 15% 14% 19%
TOTAL 24% 26% 25% 27%
Quarter ended March 31, Year ended March 31,
CONDENSED CONSOLIDATED FINANCIAL STATEMENTS OF WIPRO LIMITED AND SUBSIDIARIES

8/4/2019 Wipro Financial Statements
http://slidepdf.com/reader/full/wipro-financial-statements 35/37
CONSOLIDATED FINANCIAL STATEMENTS OF WIPRO LIMITED AND SUBSIDIARIES
Notes to Segment Report
a) The segment report of Wipro Limited and its consolidated subsidiaries and associates has been preparedin accordance with the AS 17 "Segment Reporting" issued pursuant to the Companies (AccountingStandard) Rules, 2006 and by The Institute of Chartered Accountants of India.
b) In certain specific total outsourcing contracts of IT services segment, the company delivers hardware,software and other related deliverables. Revenue relating to these items are reported in the IT productssegment.
c) Segment revenue includes the following exchange differences, which are reflected under other income inthe financial statements.
(Rs in Million)
ParticularsQuarter ended
March 31,Year endedMarch 31,
2009 2008 2009 2008
IT Services (778) (52) (1,308) 155IT Products (25) 104 (229) 27Consumer Care & Lighting (46) 4 (54) (21)Others 88 (7) 38 (382)
(761) 49 (1,553) (221)
d)
Segment wise depreciation is as follows:(Rs in Million)
ParticularsQuarter ended
March 31,
Year ended
March 31,
2009 2008 2009 2008
IT Services 1,637 1,303 6,067 4,680IT Products 49 48 88 112Consumer Care & Lighting 118 90 420 292Others 68 67 289 275
1,872 1,508 6,864 5,359
e) Segment PBIT includes Rs 155 Million and Rs 581 million (2008: Rs 119 Million and Rs 824 Million)
for the quarter and year ended March 31, 2009 respectively of certain operating other income which is
reflected in other income in the Financial Statements.
f) Capital employed of segments is net of current liabilities. The net current liability of segments is asfollows :–
(Rs in Million)
Particulars As of March 31,
2009 2008
IT Services and Products 59,249 30,456Consumer Care and Lighting 4,026 3,382Others 15,935 20,582
79,210 54,420
g) The Company has four geographic segments: India, USA, Europe and Rest of the World. Significantportion of the segment assets are in India. Revenue from geographic segments based on domicile of thecustomers is outlined below:
(Rs in Million)
Particulars Year ended March 31
2009 % 2008 %
India 54,608 21 48,847 24USA 115,105 45 87,439 44Europe 57,109 22 48,259 24Rest of the world 28,620 12 15,030 8
255,442 100 199,575 100

8/4/2019 Wipro Financial Statements
http://slidepdf.com/reader/full/wipro-financial-statements 36/37
CONSOLIDATED FINANCIAL STATEMENTS OF WIPRO LIMITED AND SUBSIDIARIES
h) For the purpose of reporting, business segments are considered as primary segments and geographicsegments are considered as secondary segments.
22. Cash and Bank
Details of balances with banks as of March 31, 2009 are as follows:
(Rs in Million)
Bank Name
Current
Account
Deposit
Account Total
Wells Fargo Bank 13,663 - 13,663
State Bank of India 296 6,306 6,602
ICICI Bank 64 4,660 4,724
IDBI Bank 11 3,202 3,213
Central Bank Of India - 3,130 3,130
Oriental Bank of Commerce 2 2,702 2,704
HSBC Bank 2,388 60 2,448
Citi Bank 1,278 409 1,687
Union Bank Of India - 1,500 1,500
HDFC Bank 1,438 - 1,438
The Saudi British Bank 1,213 - 1,213Standard Chartered Bank 188 880 1,068
ING Vysya Bank 18 950 968
Others 1,705 2,374 4,079
Cash and cheques on hand - - 680
Total 22,264 26,173 49,117
23. Investments
(a) Investments in Indian money market mutual funds:
(Rs in Million)
Fund House As of March 31, 2009
ICICI Prudential 4,054
HDFC 2,196
UTI 1,942
Reliance 1,645
Birla Sun Life 1,424
Franklin Templeton 1,271
Kotak 460
IDFC 403
HSBC 300
DSP BlackRock 200
DWS 200
Tata 200ING 171
Fidelity 150
Principal PNB 150
LIC 120
AIG 100
DBS Cholamandalam 100
Sundaram BNP Paribas 50
Total 15,136

8/4/2019 Wipro Financial Statements
http://slidepdf.com/reader/full/wipro-financial-statements 37/37
CONSOLIDATED FINANCIAL STATEMENTS OF WIPRO LIMITED AND SUBSIDIARIES
(b) Investment in Certificates of Deposit:
(Rs in Million)
Particulars As of March 31, 2009
IDBI Bank 478State Bank of Bikaner and Jaipur 230HSBC Bank 239
Total 947
(c) Other Investments:(Rs in Million)
Particulars As of March 31, 2009
Non-Convertible Debentures -Citicorp Finance 250Investment in WEP Peripherals 85Other Investments 8
Total 343
24. Corresponding figures for previous periods presented have been regrouped, where necessary, to confirm tothe current period classification.
Related Documents