Wintertime characteristics of aerosols at middle Indo-Gangetic Plain: Impacts of regional meteorology and long range transport M. Kumar a , S. Tiwari b , V. Murari a , A.K. Singh b , T. Banerjee a, * a Institute of Environment and Sustainable Development, Banaras Hindu University, Varanasi, India b Atmospheric Research Laboratory, Department of Physics, Banaras Hindu University, Varanasi, India highlights Exceptionally high aerosol mass loading for both PM 10 and PM 2.5 at middle IGP. Space borne & ground based AOD reveal variability and moderate association with PM. CALIPSO cross-section profiles depicts altitudinal distributions of aerosols. At lower altitude continental wind accumulate fine PM from north-western dry part. At higher altitude coarser PM accumulate due to strong intercontinental westerly. article info Article history: Received 17 November 2014 Received in revised form 4 January 2015 Accepted 5 January 2015 Available online 6 January 2015 Keywords: Aerosol Aerosol optical depth CALIPSO Indo-Gangetic Plain MODIS Trans-boundary abstract To develop a coherent picture of possible origin of Asian aerosol, transport and meteorological inter- action; wintertime aerosol (January,1 to March, 31, 2014 (n ¼ 90)) were measured in middle IGP in terms of aerosol mass loading, optical properties, altitudinal distributions and both high and low altitude transportation. Both space-borne passive (Aqua and Terra MODIS) and active sensor (CALIPSO-CALIOP) based measurements were concurrently used over the selected transect (25 10 0 e25 19 0 N and 82 54 0 e83 4 0 E). Exceptionally high aerosol mass loading was recorded for PM 10 (233 ± 58.37 mgm 3 ) and PM 2.5 (138 ± 47.12 mgm 3 ). Daily variations of PM 2.5 /PM 10 persist in a range of 0.25e0.97 (mean ¼ 0.60 ± 0.14; n ¼ 90) and were in accordance to computed Angstrom exponent (0.078e1.407; mean: 1.002 ± 0.254) explaining concurrent contribution of both PM 2.5 and PM 10 for the region. Space borne (Aqua MODIS- AOD: 0.259e2.194) and ground based (MTP-AOD: 0.066e1.239) AODs revealed significant temporal variability and moderate association in terms of PM 10 (MODIS-AOD: 0.46; MTP-AOD: 0.56) and PM 2.5 (MODIS-AOD: 0.54; MTP-AOD: 0.39). Varying association of AOD and aerosol mass loading was also explained in terms of meteorological variables. CALIPSO altitude-orbit-cross-section profiles revealed presence of non-spherical coarse particulates (altitude: 1.2e5.4 km) and dominance of spherical fine particulates (altitude: 0.1e4.2 km). Contribution of trans-boundary aerosols transportation to mass loadings at middle IGP were recognized through lagrangian particle dispersion model, synoptic vector wind profiles at different geopotential heights and satellite images. © 2015 Elsevier Ltd. All rights reserved. 1. Introduction Aerosols are multi-component mixtures originate from a range of regional and global sources and have potential to alter Earth's climatic balance by affecting physical, chemical or optical proper- ties. Aerosol-climate chemistry includes heterogeneity at spatial levels and hence their effects vary with topography, climate and meteorological conditions (Murari et al., 2014). Among several identified regional hotspots around the globe, Indo-Gangetic Plains (IGP) is considered to be most vulnerable to aerosol induced climate impacts. Thus creates the essentiality of conducting a comprehensive research to identify local and transboundary sour- ces of aerosol, its association with regional meteorology, transport mechanism and altitudinal distribution. The nature of aerosols at middle IGP is mostly characterized by presence of mineral dust, organic aerosols and elemental carbon produced through burning * Corresponding author. Institute of Environment and Sustainable Development, Banaras Hindu University, Varanasi 221005, India. E-mail addresses: [email protected], [email protected] (T. Banerjee). Contents lists available at ScienceDirect Atmospheric Environment journal homepage: www.elsevier.com/locate/atmosenv http://dx.doi.org/10.1016/j.atmosenv.2015.01.014 1352-2310/© 2015 Elsevier Ltd. All rights reserved. Atmospheric Environment 104 (2015) 162e175

Welcome message from author
This document is posted to help you gain knowledge. Please leave a comment to let me know what you think about it! Share it to your friends and learn new things together.
Transcript
lable at ScienceDirect
Atmospheric Environment 104 (2015) 162e175
Contents lists avai
Atmospheric Environment
journal homepage: www.elsevier .com/locate/atmosenv
Wintertime characteristics of aerosols at middle Indo-Gangetic Plain:Impacts of regional meteorology and long range transport
M. Kumar a, S. Tiwari b, V. Murari a, A.K. Singh b, T. Banerjee a, *
a Institute of Environment and Sustainable Development, Banaras Hindu University, Varanasi, Indiab Atmospheric Research Laboratory, Department of Physics, Banaras Hindu University, Varanasi, India
h i g h l i g h t s
� Exceptionally high aerosol mass loading for both PM10 and PM2.5 at middle IGP.� Space borne & ground based AOD reveal variability and moderate association with PM.� CALIPSO cross-section profiles depicts altitudinal distributions of aerosols.� At lower altitude continental wind accumulate fine PM from north-western dry part.� At higher altitude coarser PM accumulate due to strong intercontinental westerly.
a r t i c l e i n f o
Article history:Received 17 November 2014Received in revised form4 January 2015Accepted 5 January 2015Available online 6 January 2015
Keywords:AerosolAerosol optical depthCALIPSOIndo-Gangetic PlainMODISTrans-boundary
* Corresponding author. Institute of Environment aBanaras Hindu University, Varanasi 221005, India.
E-mail addresses: [email protected], tirthankaronl
http://dx.doi.org/10.1016/j.atmosenv.2015.01.0141352-2310/© 2015 Elsevier Ltd. All rights reserved.
a b s t r a c t
To develop a coherent picture of possible origin of Asian aerosol, transport and meteorological inter-action; wintertime aerosol (January, 1 to March, 31, 2014 (n ¼ 90)) were measured in middle IGP in termsof aerosol mass loading, optical properties, altitudinal distributions and both high and low altitudetransportation. Both space-borne passive (Aqua and Terra MODIS) and active sensor (CALIPSO-CALIOP)based measurements were concurrently used over the selected transect (25�100e25�190N and 82�540
e83�40E). Exceptionally high aerosol mass loading was recorded for PM10 (233 ± 58.37 mg m�3) and PM2.5
(138 ± 47.12 mg m�3). Daily variations of PM2.5/PM10 persist in a range of 0.25e0.97 (mean ¼ 0.60 ± 0.14;n ¼ 90) and were in accordance to computed Angstrom exponent (0.078e1.407; mean: 1.002 ± 0.254)explaining concurrent contribution of both PM2.5 and PM10 for the region. Space borne (Aqua MODIS-AOD: 0.259e2.194) and ground based (MTP-AOD: 0.066e1.239) AODs revealed significant temporalvariability and moderate association in terms of PM10 (MODIS-AOD: 0.46; MTP-AOD: 0.56) and PM2.5
(MODIS-AOD: 0.54; MTP-AOD: 0.39). Varying association of AOD and aerosol mass loading was alsoexplained in terms of meteorological variables. CALIPSO altitude-orbit-cross-section profiles revealedpresence of non-spherical coarse particulates (altitude: 1.2e5.4 km) and dominance of spherical fineparticulates (altitude: 0.1e4.2 km). Contribution of trans-boundary aerosols transportation to massloadings at middle IGP were recognized through lagrangian particle dispersion model, synoptic vectorwind profiles at different geopotential heights and satellite images.
© 2015 Elsevier Ltd. All rights reserved.
1. Introduction
Aerosols are multi-component mixtures originate from a rangeof regional and global sources and have potential to alter Earth'sclimatic balance by affecting physical, chemical or optical proper-ties. Aerosol-climate chemistry includes heterogeneity at spatial
nd Sustainable Development,
[email protected] (T. Banerjee).
levels and hence their effects vary with topography, climate andmeteorological conditions (Murari et al., 2014). Among severalidentified regional hotspots around the globe, Indo-Gangetic Plains(IGP) is considered to be most vulnerable to aerosol inducedclimate impacts. Thus creates the essentiality of conducting acomprehensive research to identify local and transboundary sour-ces of aerosol, its association with regional meteorology, transportmechanism and altitudinal distribution. The nature of aerosols atmiddle IGP is mostly characterized by presence of mineral dust,organic aerosols and elemental carbon produced through burning
M. Kumar et al. / Atmospheric Environment 104 (2015) 162e175 163
of biomass and fossil fuels, which further get complicated by trans-boundary movement of aerosols originating from the Middle-eastcountries and Thar Desert. Additionally, burning of agriculturalresidues during winter has been a common practice in easternUttar Pradesh and Bihar which predominately adds large quantityof aerosols of different nature and sizes (Ram et al., 2010; Murariet al., 2014). A substantial number of studies on varying spatialand temporal scale at different locations of IGP, i.e. Lahore (Ghauriet al., 2012), Patiala (Mittal et al., 2009), Hisar (Raman et al., 2011),Delhi (Sharma et al., 2014), Varanasi (Murari et al., 2014; Tiwari andSingh, 2013) and Kolkata (Karar and Gupta, 2007) highlights thepresence of quantum of both primary and secondary aerosols.However, for the present analysis, efforts were made to understandthe entire spectrum of aerosol from origin to its transport, meteo-rological interaction and vertical distribution so that a coherentpicture may be established.
For the current analysis, ground based aerosol observationsweremade at Varanasi, India. Situated at middle IGP, Varanasi is notan exception of having worst statistics in terms of aerosols whichexceeds the national standards on a frequent basis. The submittedmanuscript initially presents an approach to associate the behaviorof ambient aerosols (PM10 and PM2.5) with regional meteorologicalparameters. Such association is extremely critical in terms offorecasting aerosol chemistry in context of projected climatechange. Additionally, efforts were made to identify interrelations ofground based aerosol mass loading with its optical propertiescollected both through ground and satellite based platforms. Alti-tudinal distribution of aerosol for the selected transect was madethrough active lidar instrument. Conclusively, based on aerosolvertical profile, synoptic meteorological data was plotted for entireregion to understand trans-boundary origin and transport ofaerosol for middle IGP. The implications of such findings may wellbe useful to understand uncertain association of aerosol massconcentrations with regional meteorology and its optical proper-ties, aerosol origin and transport for a region long been projected asmost vulnerable through aerosol induced climate change.
2. Experimental methods
2.1. Site description
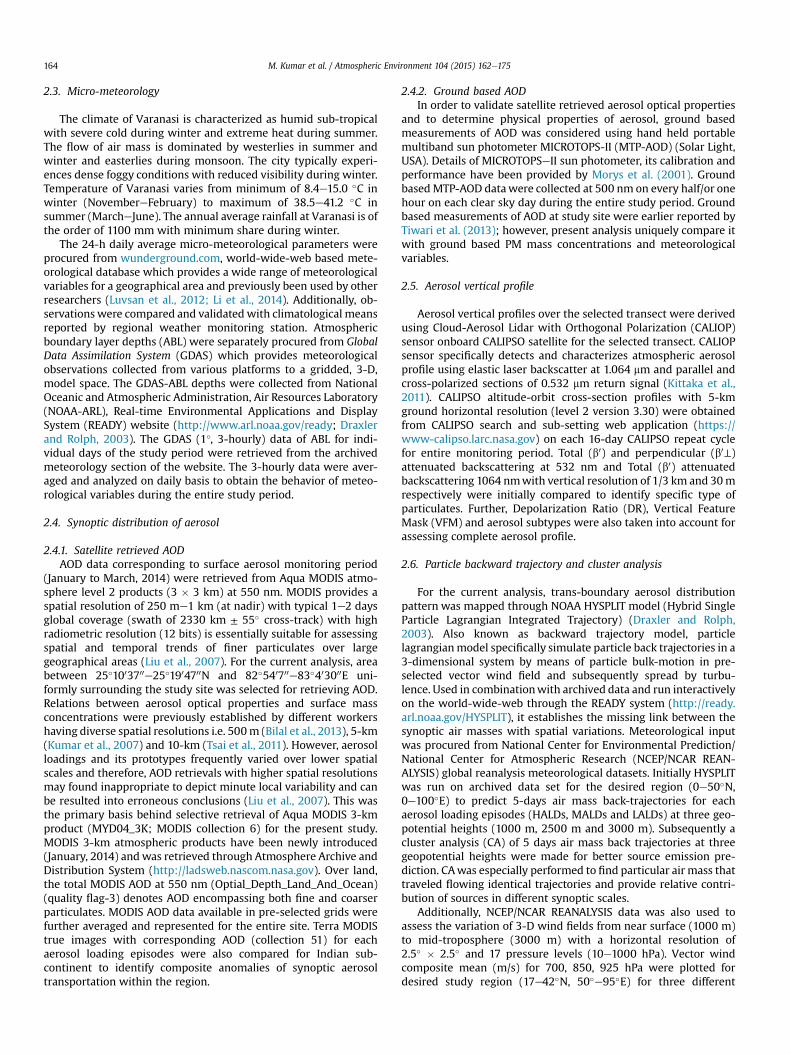
Varanasi, located at the bank of the river Ganges in the middleIndo-Gangetic Plains is considered as one of the ancient and ho-liest cities of the world. The entire study was carried out at the
Fig. 1. Geographical location of aero
premises of IESD-BHU campus, Varanasi (25�1602900N, 82�5904600E)(Fig. 1). The sampling site is represented by an institutional set upsurrounded by an urban environment typically characterized bytraffic congested roads with mixed residential and commercialsprawl in the northern side and densely populated residentialareas in the eastern, western and southern part. The region isclimatologically affected by wide range of synoptic weather pat-terns but is devoid of any localized effects of oceans and moun-tains. Relatively flat topography is believed to simplify theatmospheric boundary layer structure of the region and improvethe applicability of assimilated meteorological parameters used inthe analysis.
2.2. Ground-based in-situ measurements
All ground-based in-situ aerosol measurements for the cur-rent analysis were made at Varanasi (25�160N, 82�590E,77 m msl). Aerosol samples having aerodynamic diameter�10 mm (PM10) and �2.5 mm (PM2.5) were collected continuouslyseven days a week for entire winter months i.e. January, 1 toMarch, 31, 2014 (n ¼ 90). Aerosol samplers were placed at anelevation of 7.5 m at the roof of IESD-BHU and monitoring wascontinued for 22 h (1200e1000 h) on each consecutive day.Coarser particulates were collected through particulate samplerwith size selective inlet (IPM-FDS, Instrumex). Ambient air waspassed through the sampler using glass fiber filter (GF/A,Whatman, 47-mm diameter) with an airflow of 16.67 LPM (flowmeter resolution of ±2% under actual operating condition).Additionally, fine particulates (PM2.5) were sampled throughpolytetrafluoroethylene filters (PTFE, Whatman, 47-mm diam-eter) with an airflow of 1 m3 h�1 (accuracy ±2%) by fine particlesampler (APM 550, Envirotech). Filter papers were pre-conditioned in a desiccator for 24 h before sampling and pre-weighed using a microbalance (AY220, Shimadzu). Pre-conditioned filter papers were placed in filter holders (forPM2.5) and cloth-lined envelope (for PM10) before being taken tothe field for sampling to avoid any possible contamination.Exposed filters were placed into cassettes and wrapped inaluminum foils to prevent exposure to sunlight and photo-oxidation. Aerosol mass concentration was gravimetricallycalculated and exposed filters were stored under cool and drycondition (�20 �C) for further particulate speciation. All in-struments deployed for the sampling have been frequently cali-brated both before and after sampling.
sol ground monitoring station.
M. Kumar et al. / Atmospheric Environment 104 (2015) 162e175164
2.3. Micro-meteorology
The climate of Varanasi is characterized as humid sub-tropicalwith severe cold during winter and extreme heat during summer.The flow of air mass is dominated by westerlies in summer andwinter and easterlies during monsoon. The city typically experi-ences dense foggy conditions with reduced visibility during winter.Temperature of Varanasi varies from minimum of 8.4e15.0 �C inwinter (NovembereFebruary) to maximum of 38.5e41.2 �C insummer (MarcheJune). The annual average rainfall at Varanasi is ofthe order of 1100 mm with minimum share during winter.
The 24-h daily average micro-meteorological parameters wereprocured from wunderground.com, world-wide-web based mete-orological database which provides a wide range of meteorologicalvariables for a geographical area and previously been used by otherresearchers (Luvsan et al., 2012; Li et al., 2014). Additionally, ob-servations were compared and validated with climatological meansreported by regional weather monitoring station. Atmosphericboundary layer depths (ABL) were separately procured from GlobalData Assimilation System (GDAS) which provides meteorologicalobservations collected from various platforms to a gridded, 3-D,model space. The GDAS-ABL depths were collected from NationalOceanic and Atmospheric Administration, Air Resources Laboratory(NOAA-ARL), Real-time Environmental Applications and DisplaySystem (READY) website (http://www.arl.noaa.gov/ready; Draxlerand Rolph, 2003). The GDAS (1�, 3-hourly) data of ABL for indi-vidual days of the study period were retrieved from the archivedmeteorology section of the website. The 3-hourly data were aver-aged and analyzed on daily basis to obtain the behavior of meteo-rological variables during the entire study period.
2.4. Synoptic distribution of aerosol
2.4.1. Satellite retrieved AODAOD data corresponding to surface aerosol monitoring period
(January to March, 2014) were retrieved from Aqua MODIS atmo-sphere level 2 products (3 � 3 km) at 550 nm. MODIS provides aspatial resolution of 250 me1 km (at nadir) with typical 1e2 daysglobal coverage (swath of 2330 km ± 55� cross-track) with highradiometric resolution (12 bits) is essentially suitable for assessingspatial and temporal trends of finer particulates over largegeographical areas (Liu et al., 2007). For the current analysis, areabetween 25�1003700e25�1904700N and 82�540700e83�403000E uni-formly surrounding the study site was selected for retrieving AOD.Relations between aerosol optical properties and surface massconcentrations were previously established by different workershaving diverse spatial resolutions i.e. 500m (Bilal et al., 2013), 5-km(Kumar et al., 2007) and 10-km (Tsai et al., 2011). However, aerosolloadings and its prototypes frequently varied over lower spatialscales and therefore, AOD retrievals with higher spatial resolutionsmay found inappropriate to depict minute local variability and canbe resulted into erroneous conclusions (Liu et al., 2007). This wasthe primary basis behind selective retrieval of Aqua MODIS 3-kmproduct (MYD04_3K; MODIS collection 6) for the present study.MODIS 3-km atmospheric products have been newly introduced(January, 2014) andwas retrieved through Atmosphere Archive andDistribution System (http://ladsweb.nascom.nasa.gov). Over land,the total MODIS AOD at 550 nm (Optial_Depth_Land_And_Ocean)(quality flag-3) denotes AOD encompassing both fine and coarserparticulates. MODIS AOD data available in pre-selected grids werefurther averaged and represented for the entire site. Terra MODIStrue images with corresponding AOD (collection 51) for eachaerosol loading episodes were also compared for Indian sub-continent to identify composite anomalies of synoptic aerosoltransportation within the region.
2.4.2. Ground based AODIn order to validate satellite retrieved aerosol optical properties
and to determine physical properties of aerosol, ground basedmeasurements of AOD was considered using hand held portablemultiband sun photometer MICROTOPS-II (MTP-AOD) (Solar Light,USA). Details of MICROTOPSeII sun photometer, its calibration andperformance have been provided by Morys et al. (2001). GroundbasedMTP-AOD datawere collected at 500 nm on every half/or onehour on each clear sky day during the entire study period. Groundbased measurements of AOD at study site were earlier reported byTiwari et al. (2013); however, present analysis uniquely compare itwith ground based PM mass concentrations and meteorologicalvariables.
2.5. Aerosol vertical profile
Aerosol vertical profiles over the selected transect were derivedusing Cloud-Aerosol Lidar with Orthogonal Polarization (CALIOP)sensor onboard CALIPSO satellite for the selected transect. CALIOPsensor specifically detects and characterizes atmospheric aerosolprofile using elastic laser backscatter at 1.064 mm and parallel andcross-polarized sections of 0.532 mm return signal (Kittaka et al.,2011). CALIPSO altitude-orbit cross-section profiles with 5-kmground horizontal resolution (level 2 version 3.30) were obtainedfrom CALIPSO search and sub-setting web application (https://www-calipso.larc.nasa.gov) on each 16-day CALIPSO repeat cyclefor entire monitoring period. Total (b0) and perpendicular (b0⊥)attenuated backscattering at 532 nm and Total (b0) attenuatedbackscattering 1064 nmwith vertical resolution of 1/3 km and 30mrespectively were initially compared to identify specific type ofparticulates. Further, Depolarization Ratio (DR), Vertical FeatureMask (VFM) and aerosol subtypes were also taken into account forassessing complete aerosol profile.
2.6. Particle backward trajectory and cluster analysis
For the current analysis, trans-boundary aerosol distributionpattern was mapped through NOAA HYSPLIT model (Hybrid SingleParticle Lagrangian Integrated Trajectory) (Draxler and Rolph,2003). Also known as backward trajectory model, particlelagrangianmodel specifically simulate particle back trajectories in a3-dimensional system by means of particle bulk-motion in pre-selected vector wind field and subsequently spread by turbu-lence. Used in combinationwith archived data and run interactivelyon the world-wide-web through the READY system (http://ready.arl.noaa.gov/HYSPLIT), it establishes the missing link between thesynoptic air masses with spatial variations. Meteorological inputwas procured from National Center for Environmental Prediction/National Center for Atmospheric Research (NCEP/NCAR REAN-ALYSIS) global reanalysis meteorological datasets. Initially HYSPLITwas run on archived data set for the desired region (0e50�N,0e100�E) to predict 5-days air mass back-trajectories for eachaerosol loading episodes (HALDs, MALDs and LALDs) at three geo-potential heights (1000 m, 2500 m and 3000 m). Subsequently acluster analysis (CA) of 5 days air mass back trajectories at threegeopotential heights were made for better source emission pre-diction. CAwas especially performed to find particular air mass thattraveled flowing identical trajectories and provide relative contri-bution of sources in different synoptic scales.
Additionally, NCEP/NCAR REANALYSIS data was also used toassess the variation of 3-D wind fields from near surface (1000 m)to mid-troposphere (3000 m) with a horizontal resolution of2.5� � 2.5� and 17 pressure levels (10e1000 hPa). Vector windcomposite mean (m/s) for 700, 850, 925 hPa were plotted fordesired study region (17e42�N, 50�e95�E) for three different
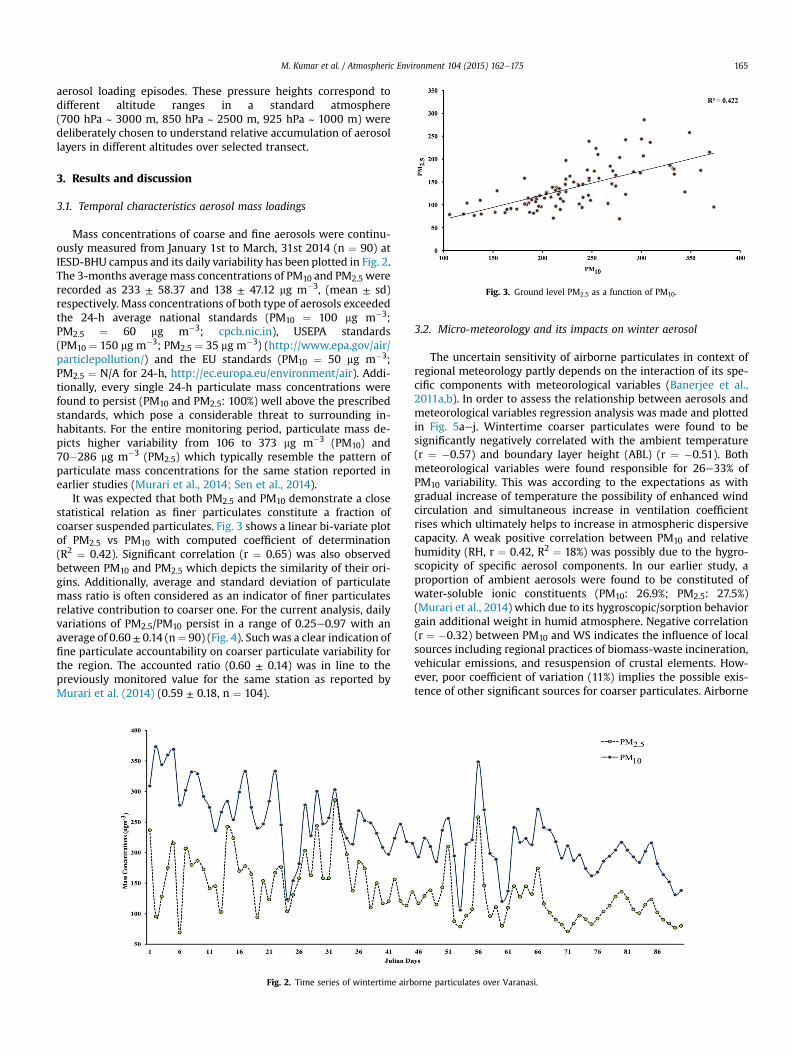
Fig. 3. Ground level PM2.5 as a function of PM10.
M. Kumar et al. / Atmospheric Environment 104 (2015) 162e175 165
aerosol loading episodes. These pressure heights correspond todifferent altitude ranges in a standard atmosphere(700 hPa ~ 3000 m, 850 hPa ~ 2500 m, 925 hPa ~ 1000 m) weredeliberately chosen to understand relative accumulation of aerosollayers in different altitudes over selected transect.
3. Results and discussion
3.1. Temporal characteristics aerosol mass loadings
Mass concentrations of coarse and fine aerosols were continu-ously measured from January 1st to March, 31st 2014 (n ¼ 90) atIESD-BHU campus and its daily variability has been plotted in Fig. 2.The 3-months averagemass concentrations of PM10 and PM2.5 wererecorded as 233 ± 58.37 and 138 ± 47.12 mg m�3, (mean ± sd)respectively. Mass concentrations of both type of aerosols exceededthe 24-h average national standards (PM10 ¼ 100 mg m�3;PM2.5 ¼ 60 mg m�3; cpcb.nic.in), USEPA standards(PM10 ¼ 150 mg m�3; PM2.5 ¼ 35 mg m�3) (http://www.epa.gov/air/particlepollution/) and the EU standards (PM10 ¼ 50 mg m�3;PM2.5 ¼ N/A for 24-h, http://ec.europa.eu/environment/air). Addi-tionally, every single 24-h particulate mass concentrations werefound to persist (PM10 and PM2.5: 100%) well above the prescribedstandards, which pose a considerable threat to surrounding in-habitants. For the entire monitoring period, particulate mass de-picts higher variability from 106 to 373 mg m�3 (PM10) and70�286 mg m�3 (PM2.5) which typically resemble the pattern ofparticulate mass concentrations for the same station reported inearlier studies (Murari et al., 2014; Sen et al., 2014).
It was expected that both PM2.5 and PM10 demonstrate a closestatistical relation as finer particulates constitute a fraction ofcoarser suspended particulates. Fig. 3 shows a linear bi-variate plotof PM2.5 vs PM10 with computed coefficient of determination(R2 ¼ 0.42). Significant correlation (r ¼ 0.65) was also observedbetween PM10 and PM2.5 which depicts the similarity of their ori-gins. Additionally, average and standard deviation of particulatemass ratio is often considered as an indicator of finer particulatesrelative contribution to coarser one. For the current analysis, dailyvariations of PM2.5/PM10 persist in a range of 0.25e0.97 with anaverage of 0.60± 0.14 (n¼ 90) (Fig. 4). Suchwas a clear indication offine particulate accountability on coarser particulate variability forthe region. The accounted ratio (0.60 ± 0.14) was in line to thepreviously monitored value for the same station as reported byMurari et al. (2014) (0.59 ± 0.18, n ¼ 104).
Fig. 2. Time series of wintertime airb
3.2. Micro-meteorology and its impacts on winter aerosol
The uncertain sensitivity of airborne particulates in context ofregional meteorology partly depends on the interaction of its spe-cific components with meteorological variables (Banerjee et al.,2011a,b). In order to assess the relationship between aerosols andmeteorological variables regression analysis was made and plottedin Fig. 5aej. Wintertime coarser particulates were found to besignificantly negatively correlated with the ambient temperature(r ¼ �0.57) and boundary layer height (ABL) (r ¼ �0.51). Bothmeteorological variables were found responsible for 26e33% ofPM10 variability. This was according to the expectations as withgradual increase of temperature the possibility of enhanced windcirculation and simultaneous increase in ventilation coefficientrises which ultimately helps to increase in atmospheric dispersivecapacity. A weak positive correlation between PM10 and relativehumidity (RH, r ¼ 0.42, R2 ¼ 18%) was possibly due to the hygro-scopicity of specific aerosol components. In our earlier study, aproportion of ambient aerosols were found to be constituted ofwater-soluble ionic constituents (PM10: 26.9%; PM2.5: 27.5%)(Murari et al., 2014) which due to its hygroscopic/sorption behaviorgain additional weight in humid atmosphere. Negative correlation(r ¼ �0.32) between PM10 and WS indicates the influence of localsources including regional practices of biomass-waste incineration,vehicular emissions, and resuspension of crustal elements. How-ever, poor coefficient of variation (11%) implies the possible exis-tence of other significant sources for coarser particulates. Airborne
orne particulates over Varanasi.
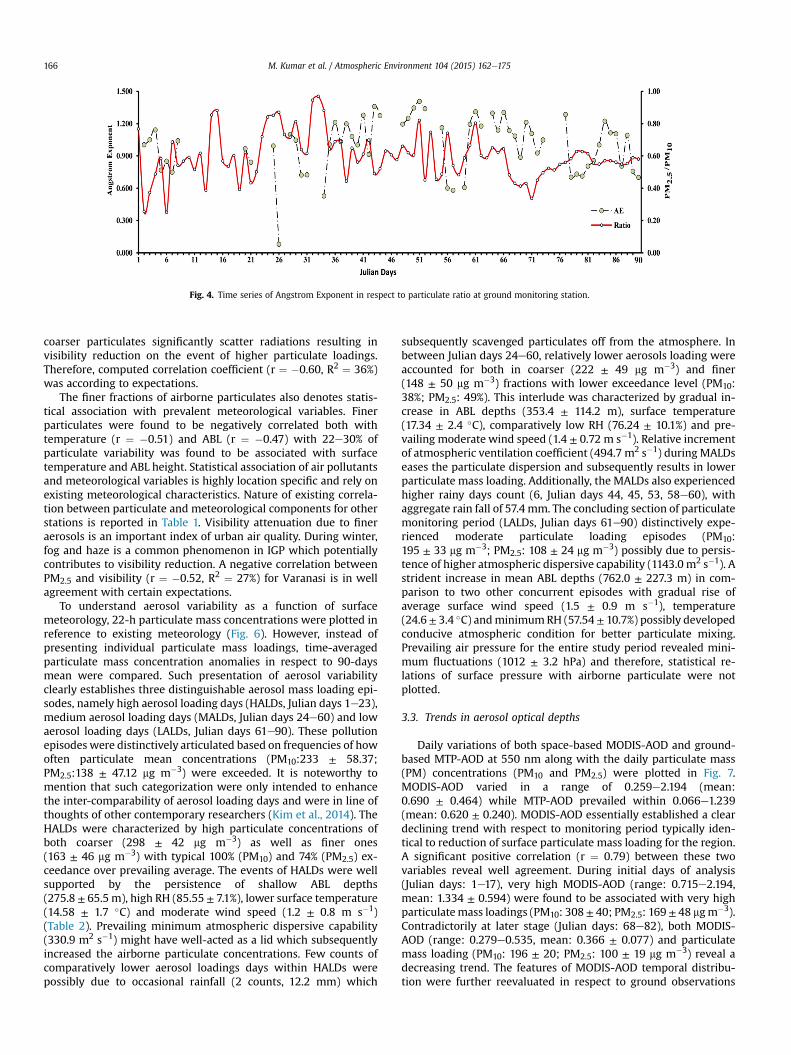
Fig. 4. Time series of Angstrom Exponent in respect to particulate ratio at ground monitoring station.
M. Kumar et al. / Atmospheric Environment 104 (2015) 162e175166
coarser particulates significantly scatter radiations resulting invisibility reduction on the event of higher particulate loadings.Therefore, computed correlation coefficient (r ¼ �0.60, R2 ¼ 36%)was according to expectations.
The finer fractions of airborne particulates also denotes statis-tical association with prevalent meteorological variables. Finerparticulates were found to be negatively correlated both withtemperature (r ¼ �0.51) and ABL (r ¼ �0.47) with 22e30% ofparticulate variability was found to be associated with surfacetemperature and ABL height. Statistical association of air pollutantsand meteorological variables is highly location specific and rely onexisting meteorological characteristics. Nature of existing correla-tion between particulate and meteorological components for otherstations is reported in Table 1. Visibility attenuation due to fineraerosols is an important index of urban air quality. During winter,fog and haze is a common phenomenon in IGP which potentiallycontributes to visibility reduction. A negative correlation betweenPM2.5 and visibility (r ¼ �0.52, R2 ¼ 27%) for Varanasi is in wellagreement with certain expectations.
To understand aerosol variability as a function of surfacemeteorology, 22-h particulate mass concentrations were plotted inreference to existing meteorology (Fig. 6). However, instead ofpresenting individual particulate mass loadings, time-averagedparticulate mass concentration anomalies in respect to 90-daysmean were compared. Such presentation of aerosol variabilityclearly establishes three distinguishable aerosol mass loading epi-sodes, namely high aerosol loading days (HALDs, Julian days 1e23),medium aerosol loading days (MALDs, Julian days 24e60) and lowaerosol loading days (LALDs, Julian days 61e90). These pollutionepisodes were distinctively articulated based on frequencies of howoften particulate mean concentrations (PM10:233 ± 58.37;PM2.5:138 ± 47.12 mg m�3) were exceeded. It is noteworthy tomention that such categorization were only intended to enhancethe inter-comparability of aerosol loading days and were in line ofthoughts of other contemporary researchers (Kim et al., 2014). TheHALDs were characterized by high particulate concentrations ofboth coarser (298 ± 42 mg m�3) as well as finer ones(163 ± 46 mg m�3) with typical 100% (PM10) and 74% (PM2.5) ex-ceedance over prevailing average. The events of HALDs were wellsupported by the persistence of shallow ABL depths(275.8 ± 65.5 m), high RH (85.55 ± 7.1%), lower surface temperature(14.58 ± 1.7 �C) and moderate wind speed (1.2 ± 0.8 m s�1)(Table 2). Prevailing minimum atmospheric dispersive capability(330.9 m2 s�1) might have well-acted as a lid which subsequentlyincreased the airborne particulate concentrations. Few counts ofcomparatively lower aerosol loadings days within HALDs werepossibly due to occasional rainfall (2 counts, 12.2 mm) which
subsequently scavenged particulates off from the atmosphere. Inbetween Julian days 24e60, relatively lower aerosols loading wereaccounted for both in coarser (222 ± 49 mg m�3) and finer(148 ± 50 mg m�3) fractions with lower exceedance level (PM10:38%; PM2.5: 49%). This interlude was characterized by gradual in-crease in ABL depths (353.4 ± 114.2 m), surface temperature(17.34 ± 2.4 �C), comparatively low RH (76.24 ± 10.1%) and pre-vailing moderate wind speed (1.4 ± 0.72 m s�1). Relative incrementof atmospheric ventilation coefficient (494.7 m2 s�1) during MALDseases the particulate dispersion and subsequently results in lowerparticulate mass loading. Additionally, the MALDs also experiencedhigher rainy days count (6, Julian days 44, 45, 53, 58e60), withaggregate rain fall of 57.4 mm. The concluding section of particulatemonitoring period (LALDs, Julian days 61e90) distinctively expe-rienced moderate particulate loading episodes (PM10:195 ± 33 mg m�3; PM2.5: 108 ± 24 mg m�3) possibly due to persis-tence of higher atmospheric dispersive capability (1143.0 m2 s�1). Astrident increase in mean ABL depths (762.0 ± 227.3 m) in com-parison to two other concurrent episodes with gradual rise ofaverage surface wind speed (1.5 ± 0.9 m s�1), temperature(24.6± 3.4 �C) andminimumRH (57.54 ± 10.7%) possibly developedconducive atmospheric condition for better particulate mixing.Prevailing air pressure for the entire study period revealed mini-mum fluctuations (1012 ± 3.2 hPa) and therefore, statistical re-lations of surface pressure with airborne particulate were notplotted.
3.3. Trends in aerosol optical depths
Daily variations of both space-based MODIS-AOD and ground-based MTP-AOD at 550 nm along with the daily particulate mass(PM) concentrations (PM10 and PM2.5) were plotted in Fig. 7.MODIS-AOD varied in a range of 0.259e2.194 (mean:0.690 ± 0.464) while MTP-AOD prevailed within 0.066e1.239(mean: 0.620 ± 0.240). MODIS-AOD essentially established a cleardeclining trend with respect to monitoring period typically iden-tical to reduction of surface particulate mass loading for the region.A significant positive correlation (r ¼ 0.79) between these twovariables reveal well agreement. During initial days of analysis(Julian days: 1e17), very high MODIS-AOD (range: 0.715e2.194,mean: 1.334 ± 0.594) were found to be associated with very highparticulatemass loadings (PM10: 308± 40; PM2.5: 169 ± 48 mgm�3).Contradictorily at later stage (Julian days: 68e82), both MODIS-AOD (range: 0.279e0.535, mean: 0.366 ± 0.077) and particulatemass loading (PM10: 196 ± 20; PM2.5: 100 ± 19 mg m�3) reveal adecreasing trend. The features of MODIS-AOD temporal distribu-tion were further reevaluated in respect to ground observations
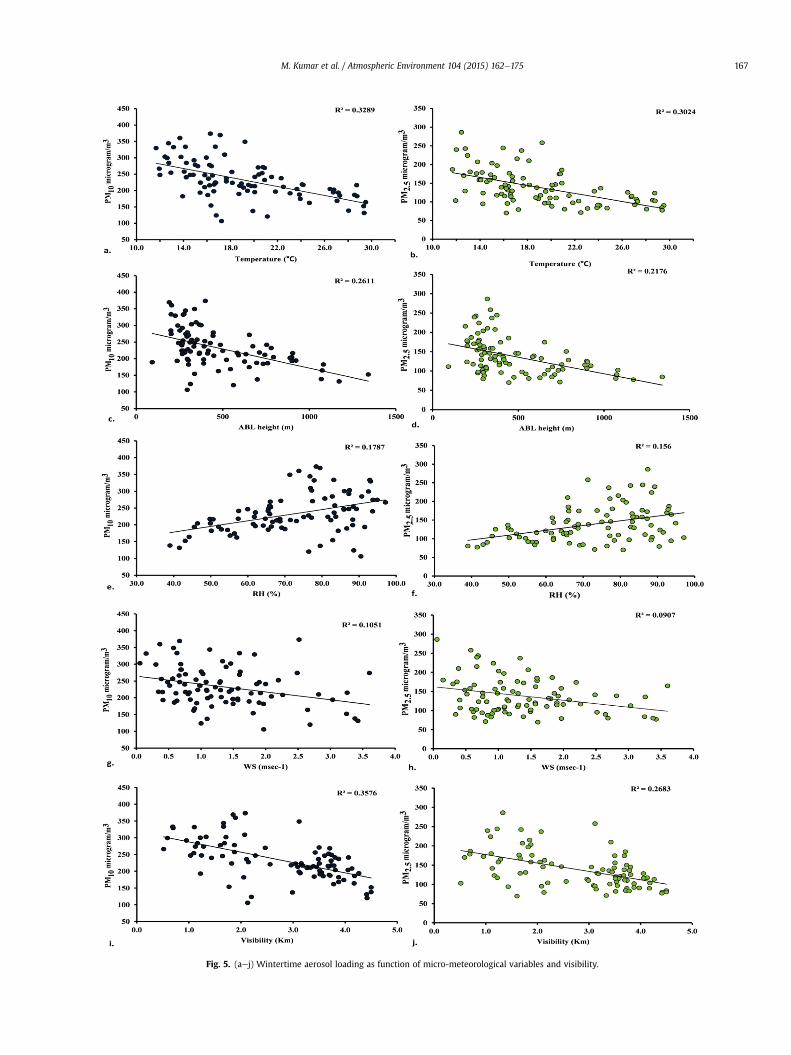
Fig. 5. (aej) Wintertime aerosol loading as function of micro-meteorological variables and visibility.
M. Kumar et al. / Atmospheric Environment 104 (2015) 162e175 167
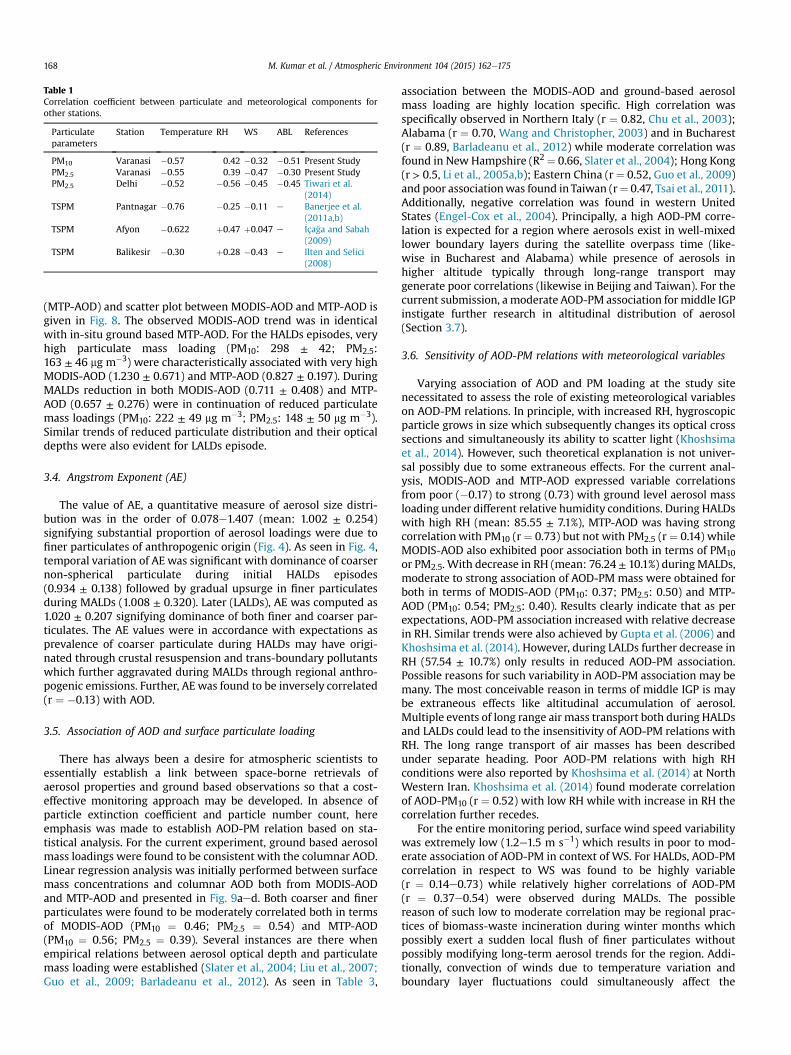
Table 1Correlation coefficient between particulate and meteorological components forother stations.
Particulateparameters
Station Temperature RH WS ABL References
PM10 Varanasi �0.57 0.42 �0.32 �0.51 Present StudyPM2.5 Varanasi �0.55 0.39 �0.47 �0.30 Present StudyPM2.5 Delhi �0.52 �0.56 �0.45 �0.45 Tiwari et al.
(2014)TSPM Pantnagar �0.76 �0.25 �0.11 e Banerjee et al.
(2011a,b)TSPM Afyon �0.622 þ0.47 þ0.047 e _Iça�ga and Sabah
(2009)TSPM Balikesir �0.30 þ0.28 �0.43 e Ilten and Selici
(2008)
M. Kumar et al. / Atmospheric Environment 104 (2015) 162e175168
(MTP-AOD) and scatter plot between MODIS-AOD and MTP-AOD isgiven in Fig. 8. The observed MODIS-AOD trend was in identicalwith in-situ ground based MTP-AOD. For the HALDs episodes, veryhigh particulate mass loading (PM10: 298 ± 42; PM2.5:163 ± 46 mg m�3) were characteristically associated with very highMODIS-AOD (1.230 ± 0.671) and MTP-AOD (0.827 ± 0.197). DuringMALDs reduction in both MODIS-AOD (0.711 ± 0.408) and MTP-AOD (0.657 ± 0.276) were in continuation of reduced particulatemass loadings (PM10: 222 ± 49 mg m�3; PM2.5: 148 ± 50 mg m�3).Similar trends of reduced particulate distribution and their opticaldepths were also evident for LALDs episode.
3.4. Angstrom Exponent (AE)
The value of AE, a quantitative measure of aerosol size distri-bution was in the order of 0.078e1.407 (mean: 1.002 ± 0.254)signifying substantial proportion of aerosol loadings were due tofiner particulates of anthropogenic origin (Fig. 4). As seen in Fig. 4,temporal variation of AE was significant with dominance of coarsernon-spherical particulate during initial HALDs episodes(0.934 ± 0.138) followed by gradual upsurge in finer particulatesduring MALDs (1.008 ± 0.320). Later (LALDs), AE was computed as1.020 ± 0.207 signifying dominance of both finer and coarser par-ticulates. The AE values were in accordance with expectations asprevalence of coarser particulate during HALDs may have origi-nated through crustal resuspension and trans-boundary pollutantswhich further aggravated during MALDs through regional anthro-pogenic emissions. Further, AE was found to be inversely correlated(r ¼ �0.13) with AOD.
3.5. Association of AOD and surface particulate loading
There has always been a desire for atmospheric scientists toessentially establish a link between space-borne retrievals ofaerosol properties and ground based observations so that a cost-effective monitoring approach may be developed. In absence ofparticle extinction coefficient and particle number count, hereemphasis was made to establish AOD-PM relation based on sta-tistical analysis. For the current experiment, ground based aerosolmass loadings were found to be consistent with the columnar AOD.Linear regression analysis was initially performed between surfacemass concentrations and columnar AOD both from MODIS-AODand MTP-AOD and presented in Fig. 9aed. Both coarser and finerparticulates were found to be moderately correlated both in termsof MODIS-AOD (PM10 ¼ 0.46; PM2.5 ¼ 0.54) and MTP-AOD(PM10 ¼ 0.56; PM2.5 ¼ 0.39). Several instances are there whenempirical relations between aerosol optical depth and particulatemass loading were established (Slater et al., 2004; Liu et al., 2007;Guo et al., 2009; Barladeanu et al., 2012). As seen in Table 3,
association between the MODIS-AOD and ground-based aerosolmass loading are highly location specific. High correlation wasspecifically observed in Northern Italy (r ¼ 0.82, Chu et al., 2003);Alabama (r ¼ 0.70, Wang and Christopher, 2003) and in Bucharest(r ¼ 0.89, Barladeanu et al., 2012) while moderate correlation wasfound in New Hampshire (R2 ¼ 0.66, Slater et al., 2004); Hong Kong(r > 0.5, Li et al., 2005a,b); Eastern China (r ¼ 0.52, Guo et al., 2009)and poor associationwas found in Taiwan (r¼ 0.47, Tsai et al., 2011).Additionally, negative correlation was found in western UnitedStates (Engel-Cox et al., 2004). Principally, a high AOD-PM corre-lation is expected for a region where aerosols exist in well-mixedlower boundary layers during the satellite overpass time (like-wise in Bucharest and Alabama) while presence of aerosols inhigher altitude typically through long-range transport maygenerate poor correlations (likewise in Beijing and Taiwan). For thecurrent submission, a moderate AOD-PM association for middle IGPinstigate further research in altitudinal distribution of aerosol(Section 3.7).
3.6. Sensitivity of AOD-PM relations with meteorological variables
Varying association of AOD and PM loading at the study sitenecessitated to assess the role of existing meteorological variableson AOD-PM relations. In principle, with increased RH, hygroscopicparticle grows in size which subsequently changes its optical crosssections and simultaneously its ability to scatter light (Khoshsimaet al., 2014). However, such theoretical explanation is not univer-sal possibly due to some extraneous effects. For the current anal-ysis, MODIS-AOD and MTP-AOD expressed variable correlationsfrom poor (�0.17) to strong (0.73) with ground level aerosol massloading under different relative humidity conditions. During HALDswith high RH (mean: 85.55 ± 7.1%), MTP-AOD was having strongcorrelation with PM10 (r ¼ 0.73) but not with PM2.5 (r ¼ 0.14) whileMODIS-AOD also exhibited poor association both in terms of PM10or PM2.5. With decrease in RH (mean: 76.24 ± 10.1%) during MALDs,moderate to strong association of AOD-PM mass were obtained forboth in terms of MODIS-AOD (PM10: 0.37; PM2.5: 0.50) and MTP-AOD (PM10: 0.54; PM2.5: 0.40). Results clearly indicate that as perexpectations, AOD-PM association increased with relative decreasein RH. Similar trends were also achieved by Gupta et al. (2006) andKhoshsima et al. (2014). However, during LALDs further decrease inRH (57.54 ± 10.7%) only results in reduced AOD-PM association.Possible reasons for such variability in AOD-PM association may bemany. The most conceivable reason in terms of middle IGP is maybe extraneous effects like altitudinal accumulation of aerosol.Multiple events of long range air mass transport both during HALDsand LALDs could lead to the insensitivity of AOD-PM relations withRH. The long range transport of air masses has been describedunder separate heading. Poor AOD-PM relations with high RHconditions were also reported by Khoshsima et al. (2014) at NorthWestern Iran. Khoshsima et al. (2014) found moderate correlationof AOD-PM10 (r ¼ 0.52) with low RH while with increase in RH thecorrelation further recedes.
For the entire monitoring period, surface wind speed variabilitywas extremely low (1.2e1.5 m s�1) which results in poor to mod-erate association of AOD-PM in context of WS. For HALDs, AOD-PMcorrelation in respect to WS was found to be highly variable(r ¼ 0.14e0.73) while relatively higher correlations of AOD-PM(r ¼ 0.37e0.54) were observed during MALDs. The possiblereason of such low to moderate correlation may be regional prac-tices of biomass-waste incineration during winter months whichpossibly exert a sudden local flush of finer particulates withoutpossibly modifying long-term aerosol trends for the region. Addi-tionally, convection of winds due to temperature variation andboundary layer fluctuations could simultaneously affect the
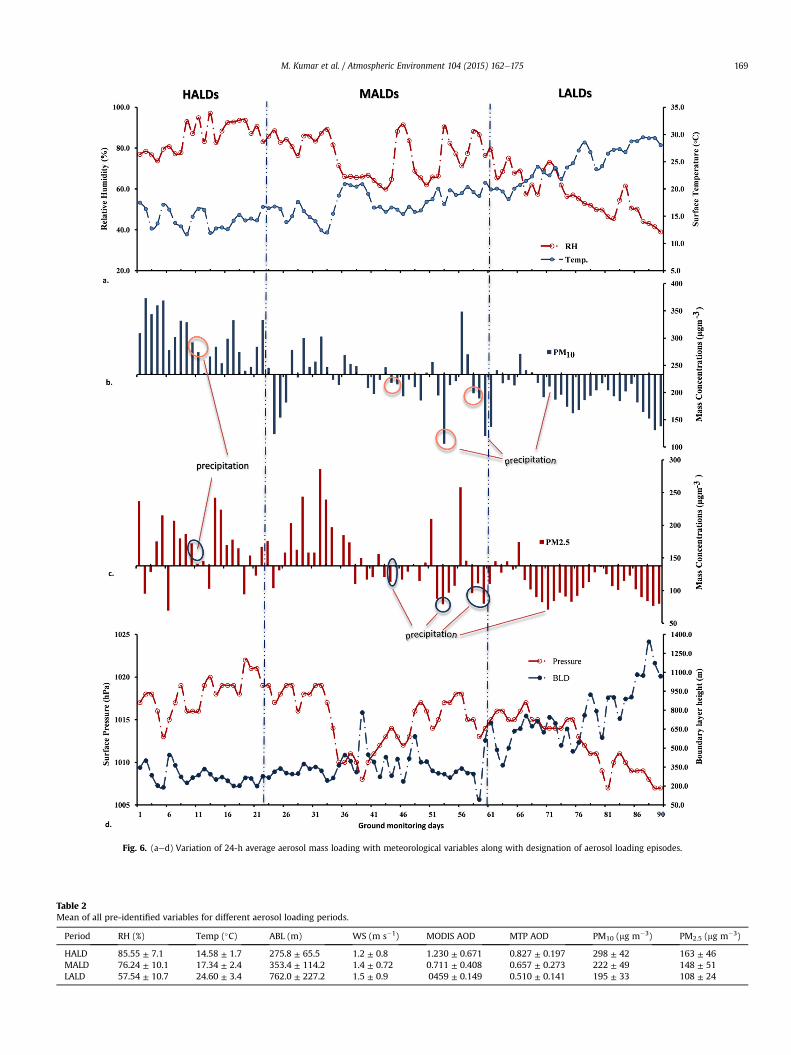
Fig. 6. (aed) Variation of 24-h average aerosol mass loading with meteorological variables along with designation of aerosol loading episodes.
Table 2Mean of all pre-identified variables for different aerosol loading periods.
Period RH (%) Temp (�C) ABL (m) WS (m s�1) MODIS AOD MTP AOD PM10 (mg m�3) PM2.5 (mg m�3)
HALD 85.55 ± 7.1 14.58 ± 1.7 275.8 ± 65.5 1.2 ± 0.8 1.230 ± 0.671 0.827 ± 0.197 298 ± 42 163 ± 46MALD 76.24 ± 10.1 17.34 ± 2.4 353.4 ± 114.2 1.4 ± 0.72 0.711 ± 0.408 0.657 ± 0.273 222 ± 49 148 ± 51LALD 57.54 ± 10.7 24.60 ± 3.4 762.0 ± 227.2 1.5 ± 0.9 0459 ± 0.149 0.510 ± 0.141 195 ± 33 108 ± 24
M. Kumar et al. / Atmospheric Environment 104 (2015) 162e175 169
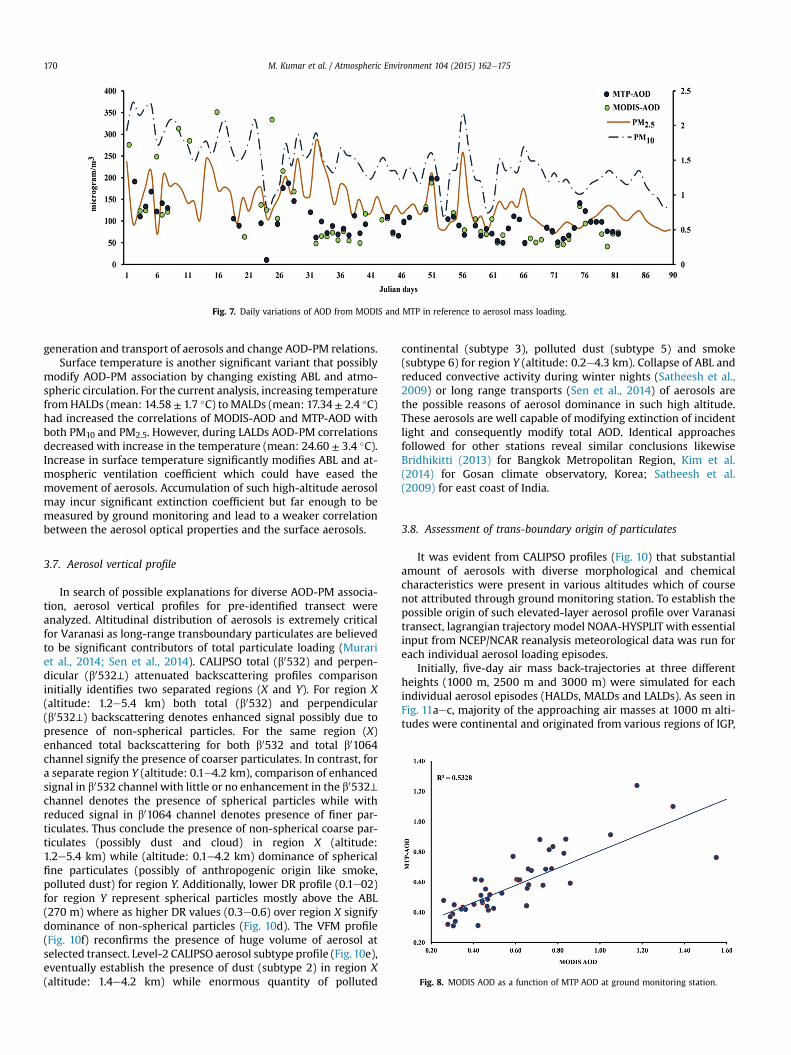
Fig. 7. Daily variations of AOD from MODIS and MTP in reference to aerosol mass loading.
M. Kumar et al. / Atmospheric Environment 104 (2015) 162e175170
generation and transport of aerosols and change AOD-PM relations.Surface temperature is another significant variant that possibly
modify AOD-PM association by changing existing ABL and atmo-spheric circulation. For the current analysis, increasing temperaturefromHALDs (mean: 14.58 ± 1.7 �C) toMALDs (mean: 17.34 ± 2.4 �C)had increased the correlations of MODIS-AOD and MTP-AOD withboth PM10 and PM2.5. However, during LALDs AOD-PM correlationsdecreased with increase in the temperature (mean: 24.60 ± 3.4 �C).Increase in surface temperature significantly modifies ABL and at-mospheric ventilation coefficient which could have eased themovement of aerosols. Accumulation of such high-altitude aerosolmay incur significant extinction coefficient but far enough to bemeasured by ground monitoring and lead to a weaker correlationbetween the aerosol optical properties and the surface aerosols.
Fig. 8. MODIS AOD as a function of MTP AOD at ground monitoring station.
3.7. Aerosol vertical profile
In search of possible explanations for diverse AOD-PM associa-tion, aerosol vertical profiles for pre-identified transect wereanalyzed. Altitudinal distribution of aerosols is extremely criticalfor Varanasi as long-range transboundary particulates are believedto be significant contributors of total particulate loading (Murariet al., 2014; Sen et al., 2014). CALIPSO total (b0532) and perpen-dicular (b0532⊥) attenuated backscattering profiles comparisoninitially identifies two separated regions (X and Y). For region X(altitude: 1.2e5.4 km) both total (b0532) and perpendicular(b0532⊥) backscattering denotes enhanced signal possibly due topresence of non-spherical particles. For the same region (X)enhanced total backscattering for both b0532 and total b01064channel signify the presence of coarser particulates. In contrast, fora separate region Y (altitude: 0.1e4.2 km), comparison of enhancedsignal in b0532 channel with little or no enhancement in the b0532⊥channel denotes the presence of spherical particles while withreduced signal in b01064 channel denotes presence of finer par-ticulates. Thus conclude the presence of non-spherical coarse par-ticulates (possibly dust and cloud) in region X (altitude:1.2e5.4 km) while (altitude: 0.1e4.2 km) dominance of sphericalfine particulates (possibly of anthropogenic origin like smoke,polluted dust) for region Y. Additionally, lower DR profile (0.1e02)for region Y represent spherical particles mostly above the ABL(270 m) where as higher DR values (0.3e0.6) over region X signifydominance of non-spherical particles (Fig. 10d). The VFM profile(Fig. 10f) reconfirms the presence of huge volume of aerosol atselected transect. Level-2 CALIPSO aerosol subtype profile (Fig.10e),eventually establish the presence of dust (subtype 2) in region X(altitude: 1.4e4.2 km) while enormous quantity of polluted
continental (subtype 3), polluted dust (subtype 5) and smoke(subtype 6) for region Y (altitude: 0.2e4.3 km). Collapse of ABL andreduced convective activity during winter nights (Satheesh et al.,2009) or long range transports (Sen et al., 2014) of aerosols arethe possible reasons of aerosol dominance in such high altitude.These aerosols are well capable of modifying extinction of incidentlight and consequently modify total AOD. Identical approachesfollowed for other stations reveal similar conclusions likewiseBridhikitti (2013) for Bangkok Metropolitan Region, Kim et al.(2014) for Gosan climate observatory, Korea; Satheesh et al.(2009) for east coast of India.
3.8. Assessment of trans-boundary origin of particulates
It was evident from CALIPSO profiles (Fig. 10) that substantialamount of aerosols with diverse morphological and chemicalcharacteristics were present in various altitudes which of coursenot attributed through ground monitoring station. To establish thepossible origin of such elevated-layer aerosol profile over Varanasitransect, lagrangian trajectory model NOAA-HYSPLIT with essentialinput from NCEP/NCAR reanalysis meteorological data was run foreach individual aerosol loading episodes.
Initially, five-day air mass back-trajectories at three differentheights (1000 m, 2500 m and 3000 m) were simulated for eachindividual aerosol episodes (HALDs, MALDs and LALDs). As seen inFig. 11aec, majority of the approaching air masses at 1000 m alti-tudes were continental and originated from various regions of IGP,
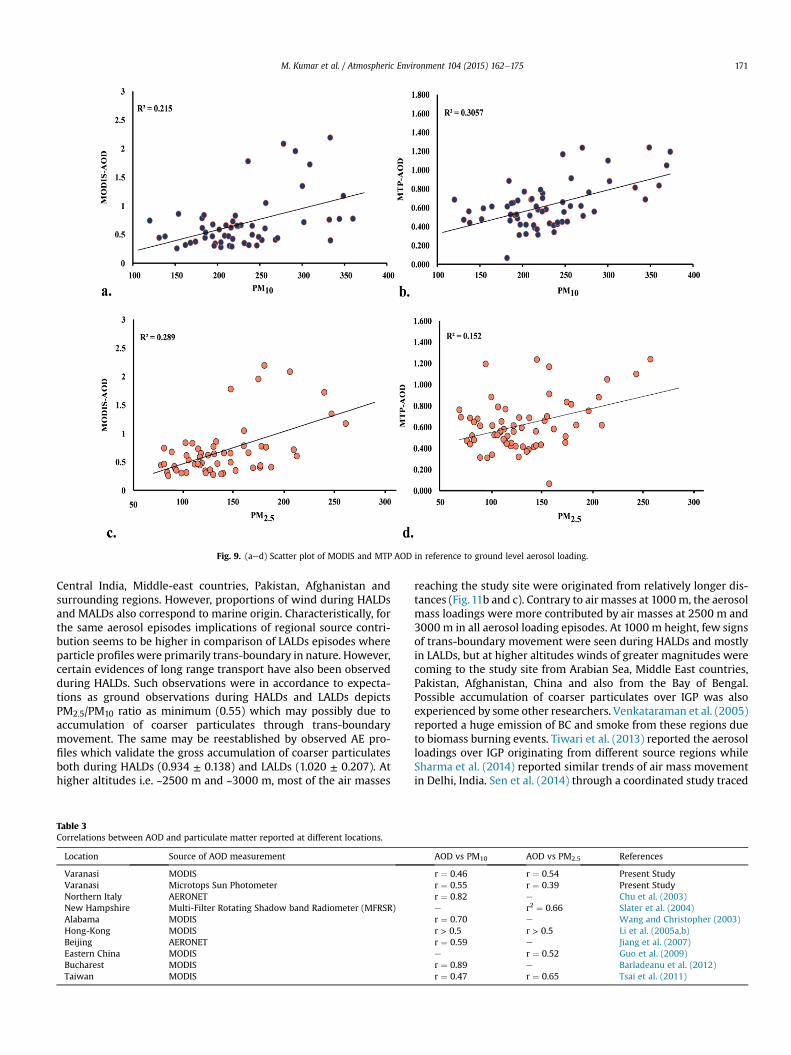
Fig. 9. (aed) Scatter plot of MODIS and MTP AOD in reference to ground level aerosol loading.
M. Kumar et al. / Atmospheric Environment 104 (2015) 162e175 171
Central India, Middle-east countries, Pakistan, Afghanistan andsurrounding regions. However, proportions of wind during HALDsand MALDs also correspond to marine origin. Characteristically, forthe same aerosol episodes implications of regional source contri-bution seems to be higher in comparison of LALDs episodes whereparticle profiles were primarily trans-boundary in nature. However,certain evidences of long range transport have also been observedduring HALDs. Such observations were in accordance to expecta-tions as ground observations during HALDs and LALDs depictsPM2.5/PM10 ratio as minimum (0.55) which may possibly due toaccumulation of coarser particulates through trans-boundarymovement. The same may be reestablished by observed AE pro-files which validate the gross accumulation of coarser particulatesboth during HALDs (0.934 ± 0.138) and LALDs (1.020 ± 0.207). Athigher altitudes i.e. ~2500 m and ~3000 m, most of the air masses
Table 3Correlations between AOD and particulate matter reported at different locations.
Location Source of AOD measurement
Varanasi MODISVaranasi Microtops Sun PhotometerNorthern Italy AERONETNew Hampshire Multi-Filter Rotating Shadow band Radiometer (MFRSR)Alabama MODISHong-Kong MODISBeijing AERONETEastern China MODISBucharest MODISTaiwan MODIS
reaching the study site were originated from relatively longer dis-tances (Fig.11b and c). Contrary to air masses at 1000m, the aerosolmass loadings were more contributed by air masses at 2500 m and3000 m in all aerosol loading episodes. At 1000 m height, few signsof trans-boundary movement were seen during HALDs and mostlyin LALDs, but at higher altitudes winds of greater magnitudes werecoming to the study site from Arabian Sea, Middle East countries,Pakistan, Afghanistan, China and also from the Bay of Bengal.Possible accumulation of coarser particulates over IGP was alsoexperienced by some other researchers. Venkataraman et al. (2005)reported a huge emission of BC and smoke from these regions dueto biomass burning events. Tiwari et al. (2013) reported the aerosolloadings over IGP originating from different source regions whileSharma et al. (2014) reported similar trends of air mass movementin Delhi, India. Sen et al. (2014) through a coordinated study traced
AOD vs PM10 AOD vs PM2.5 References
r ¼ 0.46 r ¼ 0.54 Present Studyr ¼ 0.55 r ¼ 0.39 Present Studyr ¼ 0.82 e Chu et al. (2003)e r2 ¼ 0.66 Slater et al. (2004)r ¼ 0.70 e Wang and Christopher (2003)r > 0.5 r > 0.5 Li et al. (2005a,b)r ¼ 0.59 e Jiang et al. (2007)e r ¼ 0.52 Guo et al. (2009)r ¼ 0.89 e Barladeanu et al. (2012)r ¼ 0.47 r ¼ 0.65 Tsai et al. (2011)
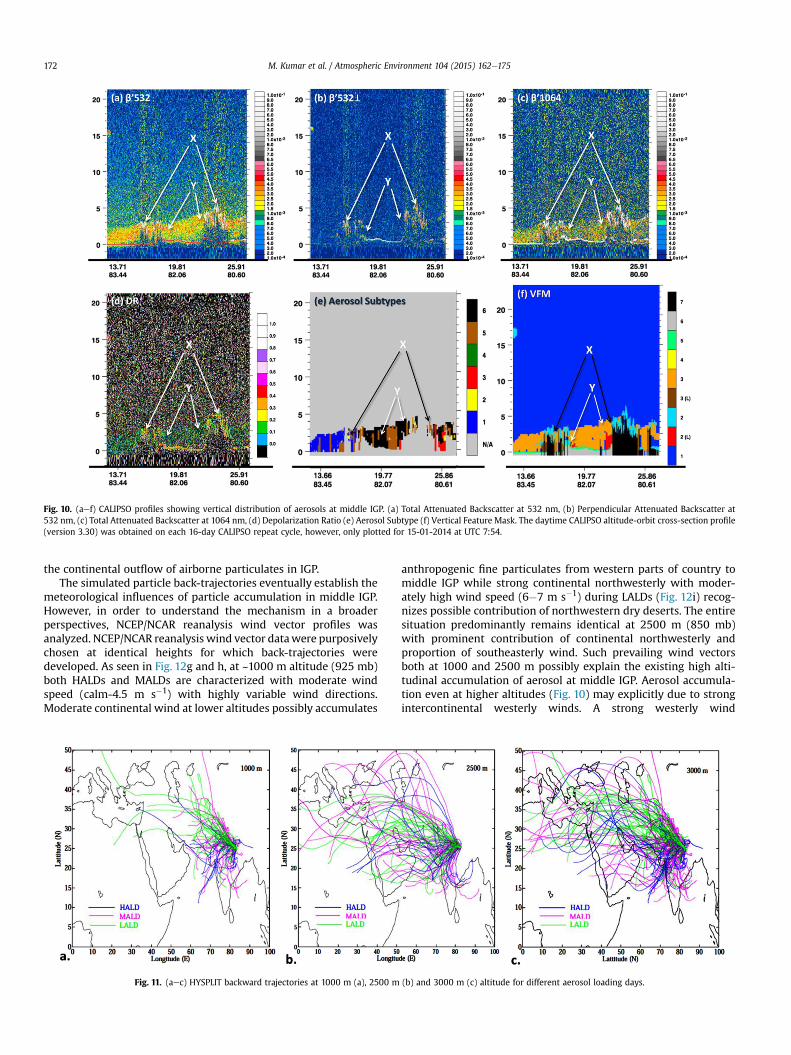
Fig. 10. (aef) CALIPSO profiles showing vertical distribution of aerosols at middle IGP. (a) Total Attenuated Backscatter at 532 nm, (b) Perpendicular Attenuated Backscatter at532 nm, (c) Total Attenuated Backscatter at 1064 nm, (d) Depolarization Ratio (e) Aerosol Subtype (f) Vertical Feature Mask. The daytime CALIPSO altitude-orbit cross-section profile(version 3.30) was obtained on each 16-day CALIPSO repeat cycle, however, only plotted for 15-01-2014 at UTC 7:54.
M. Kumar et al. / Atmospheric Environment 104 (2015) 162e175172
the continental outflow of airborne particulates in IGP.The simulated particle back-trajectories eventually establish the
meteorological influences of particle accumulation in middle IGP.However, in order to understand the mechanism in a broaderperspectives, NCEP/NCAR reanalysis wind vector profiles wasanalyzed. NCEP/NCAR reanalysis wind vector datawere purposivelychosen at identical heights for which back-trajectories weredeveloped. As seen in Fig. 12g and h, at ~1000 m altitude (925 mb)both HALDs and MALDs are characterized with moderate windspeed (calm-4.5 m s�1) with highly variable wind directions.Moderate continental wind at lower altitudes possibly accumulates
Fig. 11. (aec) HYSPLIT backward trajectories at 1000 m (a), 2500 m
anthropogenic fine particulates from western parts of country tomiddle IGP while strong continental northwesterly with moder-ately high wind speed (6�7 m s�1) during LALDs (Fig. 12i) recog-nizes possible contribution of northwestern dry deserts. The entiresituation predominantly remains identical at 2500 m (850 mb)with prominent contribution of continental northwesterly andproportion of southeasterly wind. Such prevailing wind vectorsboth at 1000 and 2500 m possibly explain the existing high alti-tudinal accumulation of aerosol at middle IGP. Aerosol accumula-tion even at higher altitudes (Fig. 10) may explicitly due to strongintercontinental westerly winds. A strong westerly wind
(b) and 3000 m (c) altitude for different aerosol loading days.
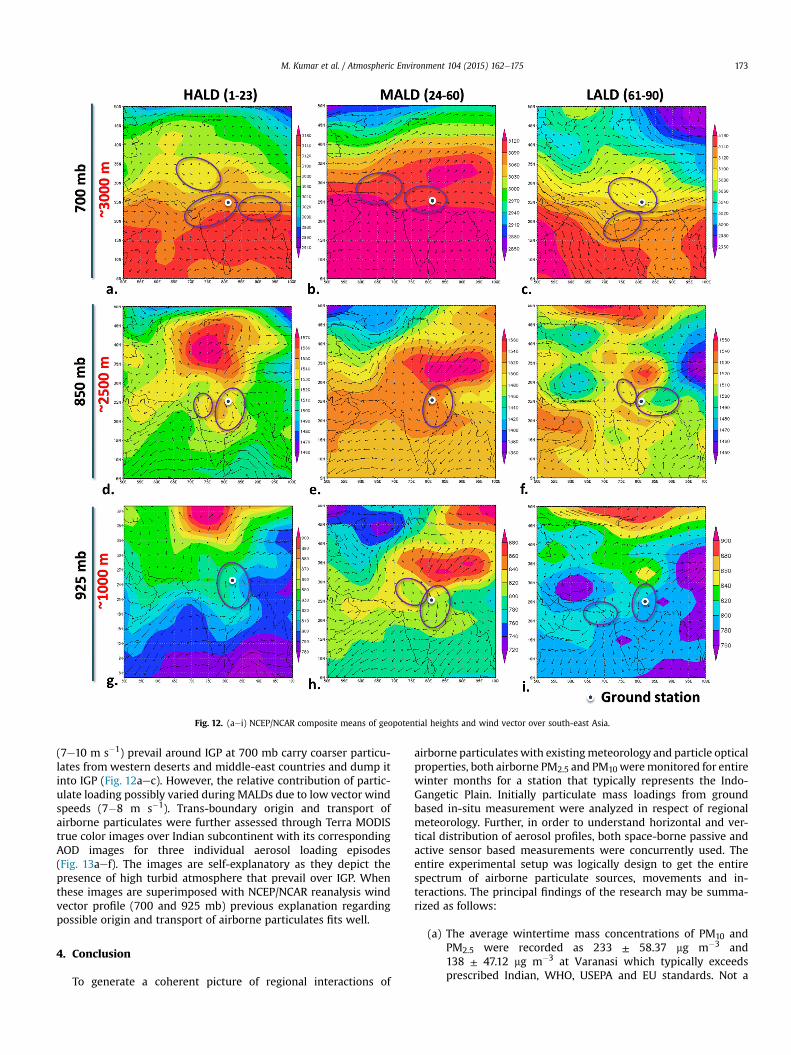
Fig. 12. (aei) NCEP/NCAR composite means of geopotential heights and wind vector over south-east Asia.
M. Kumar et al. / Atmospheric Environment 104 (2015) 162e175 173
(7e10 m s�1) prevail around IGP at 700 mb carry coarser particu-lates from western deserts and middle-east countries and dump itinto IGP (Fig. 12aec). However, the relative contribution of partic-ulate loading possibly varied during MALDs due to low vector windspeeds (7�8 m s�1). Trans-boundary origin and transport ofairborne particulates were further assessed through Terra MODIStrue color images over Indian subcontinent with its correspondingAOD images for three individual aerosol loading episodes(Fig. 13aef). The images are self-explanatory as they depict thepresence of high turbid atmosphere that prevail over IGP. Whenthese images are superimposed with NCEP/NCAR reanalysis windvector profile (700 and 925 mb) previous explanation regardingpossible origin and transport of airborne particulates fits well.
4. Conclusion
To generate a coherent picture of regional interactions of
airborne particulates with existingmeteorology and particle opticalproperties, both airborne PM2.5 and PM10 weremonitored for entirewinter months for a station that typically represents the Indo-Gangetic Plain. Initially particulate mass loadings from groundbased in-situ measurement were analyzed in respect of regionalmeteorology. Further, in order to understand horizontal and ver-tical distribution of aerosol profiles, both space-borne passive andactive sensor based measurements were concurrently used. Theentire experimental setup was logically design to get the entirespectrum of airborne particulate sources, movements and in-teractions. The principal findings of the research may be summa-rized as follows:
(a) The average wintertime mass concentrations of PM10 andPM2.5 were recorded as 233 ± 58.37 mg m�3 and138 ± 47.12 mg m�3 at Varanasi which typically exceedsprescribed Indian, WHO, USEPA and EU standards. Not a
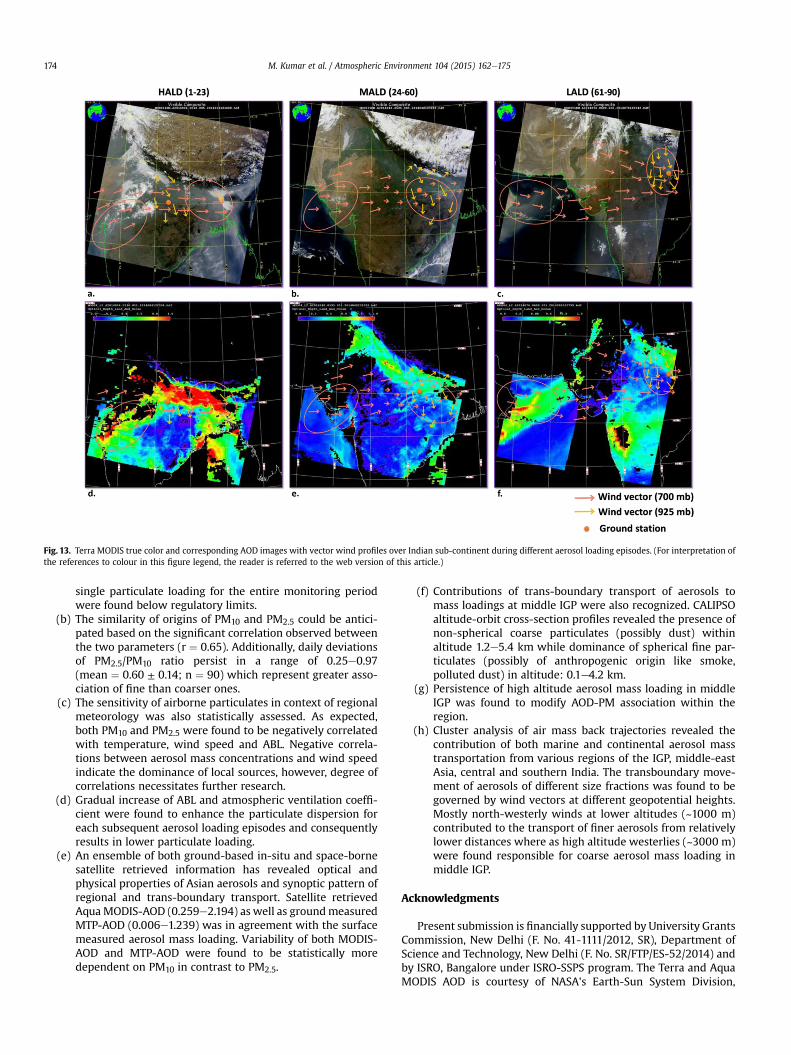
Fig. 13. Terra MODIS true color and corresponding AOD images with vector wind profiles over Indian sub-continent during different aerosol loading episodes. (For interpretation ofthe references to colour in this figure legend, the reader is referred to the web version of this article.)
M. Kumar et al. / Atmospheric Environment 104 (2015) 162e175174
single particulate loading for the entire monitoring periodwere found below regulatory limits.
(b) The similarity of origins of PM10 and PM2.5 could be antici-pated based on the significant correlation observed betweenthe two parameters (r ¼ 0.65). Additionally, daily deviationsof PM2.5/PM10 ratio persist in a range of 0.25e0.97(mean ¼ 0.60 ± 0.14; n ¼ 90) which represent greater asso-ciation of fine than coarser ones.
(c) The sensitivity of airborne particulates in context of regionalmeteorology was also statistically assessed. As expected,both PM10 and PM2.5 were found to be negatively correlatedwith temperature, wind speed and ABL. Negative correla-tions between aerosol mass concentrations and wind speedindicate the dominance of local sources, however, degree ofcorrelations necessitates further research.
(d) Gradual increase of ABL and atmospheric ventilation coeffi-cient were found to enhance the particulate dispersion foreach subsequent aerosol loading episodes and consequentlyresults in lower particulate loading.
(e) An ensemble of both ground-based in-situ and space-bornesatellite retrieved information has revealed optical andphysical properties of Asian aerosols and synoptic pattern ofregional and trans-boundary transport. Satellite retrievedAquaMODIS-AOD (0.259e2.194) as well as groundmeasuredMTP-AOD (0.006e1.239) was in agreement with the surfacemeasured aerosol mass loading. Variability of both MODIS-AOD and MTP-AOD were found to be statistically moredependent on PM10 in contrast to PM2.5.
(f) Contributions of trans-boundary transport of aerosols tomass loadings at middle IGP were also recognized. CALIPSOaltitude-orbit cross-section profiles revealed the presence ofnon-spherical coarse particulates (possibly dust) withinaltitude 1.2e5.4 km while dominance of spherical fine par-ticulates (possibly of anthropogenic origin like smoke,polluted dust) in altitude: 0.1e4.2 km.
(g) Persistence of high altitude aerosol mass loading in middleIGP was found to modify AOD-PM association within theregion.
(h) Cluster analysis of air mass back trajectories revealed thecontribution of both marine and continental aerosol masstransportation from various regions of the IGP, middle-eastAsia, central and southern India. The transboundary move-ment of aerosols of different size fractions was found to begoverned by wind vectors at different geopotential heights.Mostly north-westerly winds at lower altitudes (~1000 m)contributed to the transport of finer aerosols from relativelylower distances where as high altitude westerlies (~3000 m)were found responsible for coarse aerosol mass loading inmiddle IGP.
Acknowledgments
Present submission is financially supported by University GrantsCommission, New Delhi (F. No. 41-1111/2012, SR), Department ofScience and Technology, New Delhi (F. No. SR/FTP/ES-52/2014) andby ISRO, Bangalore under ISRO-SSPS program. The Terra and AquaMODIS AOD is courtesy of NASA's Earth-Sun System Division,
M. Kumar et al. / Atmospheric Environment 104 (2015) 162e175 175
distributed by LAADS Web. The CALIPSO data were obtained fromthe Atmospheric Science Data Center at NASA Langley ResearchCenter. Meteorological data from wunderground.com is alsoacknowledged. Authors also acknowledge the NOAA-ARL for HYS-PLIT transport model and NCEP/NCAR Reanalysis team forproviding synoptic meteorological maps. The guidance and coop-eration provided by Director, IESD-BHU is also acknowledged.
References
Banerjee, T., Singh, S.B., Srivastava, R.K., 2011a. Development and performanceevaluation of statistical models correlating air pollutants and meteorologicalvariables at Pantnagar, India. Atmos. Res. 99, 505e517.
Banerjee, T., Barman, S.C., Srivastava, R.K., 2011b. Application of air pollutiondispersion modeling for source-contribution assessment and model perfor-mance evaluation at integrated industrial estate-Pantnagar. Environ. Pollut. 159,865e875.
Barladeanu, R., Stefan, S., Radulescu, R., 2012. Correlation between the particulatematter (PM10) mass concentrations and aerosol optical depth in Bucharest,Romania. Rom. Rep. Phys. 64 (4), 1085e1096.
Bilal, M., Nichol, J.E., Bleiweiss, M.P., Dubois, D., 2013. A simplified high resolutionMODIS Aerosol Retrieval Algorithm (SARA) for use over mixed surfaces. RemoteSens. Environ. 136, 135e145.
Bridhikitti, A., 2013. Atmospheric aerosol layers over Bangkok metropolitan regionfrom CALIPSO observations. Atmos. Res. 127, 1e7.
Chu, D.A., Kaufman, Y.J., Zibordi, G., Chern, J.D., Mao, J.M., Li, C., Holben, H.B., 2003.Global monitoring of air pollution over land from EOS-Terra MODIS. J. Geophys.Res. 108 (D21), 4661.
Draxler, R.R., Rolph, G.D., 2003. HYSPLIT (HYbridSingle-Particle Lagrangian Inte-grated Trajectory) Model Access Via NOAA ARL READY Website. NOAA Air Re-sources Laboratory, Silver Spring, MD. http://www.arl.noaa.gov/ready/hysplit4.html.
Engel-Cox, J.A., Holloman, C.H., Coutant, B.W., Hoff, R.M., 2004. Qualitative andquantitative evaluation of MODIS satellite sensor data for regional and urbanscale air quality. Atmos. Environ. 38 (16), 2495e2509.
Ghauri, B., Mansha, M., Khalil, C., 2012. Characterization of cytotoxicity of airborneparticulates from urban areas of Lahore. J. Environ. Sci. 24 (11), 2028e2034.
Guo, J.P., Zhang, X.Y., Che, H.Z., Gong, S.L., An, X., Cao, C.X., et al., 2009. Correlationbetween PM concentrations and aerosol optical depth in eastern China. Atmos.Environ. 43, 5876e5886.
Gupta, P., Christopher, S.A., Wang, J., Gehrig, R., Lee, Y., Kumar, N., 2006. Satelliteremote sensing of particulate matter and air quality assessment over globalcities. Atmos. Environ. 40, 5880e5892.
Ilten, N., Selici, T., 2008. Investigating the impacts of some meteorological param-eters on air pollution in Balikesir, Turkey. Environ. Monit. Assess. 140, 267e277.
_Iça�ga, Y., Sabah, E., 2009. Statistical analysis of air pollutants and meteorologicalparameters in Afyon, Turkey. Environ. Model. Assess. 14, 259e266.
Jiang, X., Liu, Y., Yu, B., Jiang, M., 2007. Comparison of MISR aerosol optical thicknesswith AERONET measurements in Beijing metropolitan area. Remote Sens. En-viron. 107, 45e53.
Karar, K., Gupta, A.K., 2007. Source apportionment of PM10 at residential and in-dustrial sites of an urban region of Kolkata, India. Atmos. Res. 84 (1), 30e41.
Khoshsima, M., Givi, F.A., Bidokhti, A.A., Sabetghadam, S., 2014. Impact of meteo-rological parameters on relation between aerosol optical indices and airpollution in a sub-urban area. J. Aerosol Sci. 68, 46e57.
Kim, Y., Kim, S.W., Yoon, S.C., Kim, M.H., Park, K.H., 2014. Aerosol properties andassociated regional meteorology during winter pollution event at GosanClimate Observatory, Korea. Atmos. Environ. 85, 9e17.
Kittaka, C., Winker, D.M., Vaughan, M.A., Omar, A., Remer, L.A., 2011. Intercompar-ison of column aerosol optical depths from CALIPSO and MODIS-Aqua. Atmos.Meas. Tech. 4, 131e141.
Kumar, N., Chu, D.A., Foster, A., 2007. An empirical relationship between PM2.5 and
aerosol optical depth in Delhi Metropolitan. Atmos. Environ. 4492e4503.Li, C.C., Mao, J.T., Lau, A.K.H., Yuan, Z.B., Wang, M.H., Liu, X.Y., 2005a. Application of
MODIS satellite products on the air pollution research in Beijing. Sci. China Ser.D48 (Suppl. II), 209e219.
Li, C., Lau, A.K.H., Mao, J., Chu, D.A., 2005b. Retrieval, validation, and application ofthe 1-km aerosol optical depth from MODIS measurements over Hong Kong.IEEE Trans. Geosci. Remote Sens. 43 (11), 2650e2658.
Li, L., Huang, C., Huang, H.Y., Wang, Y.J., Yan, R.S., Zhang, G.F., et al., 2014. An inte-grated process rate analysis of a regional fine particulate matter episode overYangtze River Delta in 2010. Atmos. Environ. 91, 60e70.
Liu, Y., Koutrakis, P., Kahn, R., Turquety, S., Yantosca, R.M., 2007. Estimating fineparticulate matter component concentrations and size distributions usingsatellite-retrieved fractional aerosol optical depth: part 2 e a case study. J. AirWaste Manag. Assoc. 57 (11), 1360e1369.
Luvsan, M.E., Shie, R.H., Purevdorj, T., Badarch, L., Baldorj, B., Chan, C.C., 2012. Theinfluence of emission sources and meteorological conditions on SO2 pollution inMongolia. Atmos. Environ. 61, 542e549.
Mittal, S.K., Singh, N., Agarwal, R., Awasthi, A., Gupta, P.K., 2009. Ambient air qualityduring wheat and rice crop stubble burning episodes in Patiala. Atmos. Environ.43, 238e244.
Morys, M., Mims, F.M., Hagerup, S., Anderson, S.E., Baker, A., Kia, J., et al., 2001.Design, calibration, and performance of MICROTOPS II handheld ozone monitorand sun photometer. J. Geophys. Res. 106, 14573e14582.
Murari, V., Kumar, M., Barman, S.C., Banerjee, T., 2014. Temporal variability ofMODIS aerosol optical depth and chemical characterization of airborne par-ticulates in Varanasi, India. Environ. Sci. Pollut. Res. http://dx.doi.org/10.1007/s11356-014-3418-2 (Published Online).
Ram, K., Sarin, M.M., Tripathi, S.N., 2010. A 1 year record of carbonaceous aerosolsfrom an urban site in the Indo-Gangetic Plain: characterization, sources, andtemporal variability. J. Geophys. Res. 115, D24313.
Raman, R.S., Ramachandran, S., Kedia, S., 2011. A methodology to estimate source-specific aerosol radiative forcing. J. Aerosol Sci. 42 (5), 305e320.
Satheesh, S.K., Vinoj, V., Babu, S.S., Moorthy, K.K., Nair, V.S., 2009. Vertical distri-bution of aerosols over the east coast of India inferred from airborne LIDARmeasurements. Ann. Geophys. 27, 4157e4169.
Sen, A., Ahammed, Y.N., Arya, B.C., Banerjee, T., Begam, G.R., Baruah, B.P., et al.,December 2014. Atmospheric fine and coarse mode aerosols at different envi-ronments of India and the Bay of Bengal during Winter-2014: implications of acoordinated campaign. MAPAN J. Metrol. Soc. India 29 (4), 273e284 (PublishedOnline).
Sharma, S.K., Kumar, M., Rohtash, Gupta, N.C., Saraswati, Saxena, M., Mandal, T.K.,2014. Characteristics of ambient ammonia over Delhi, India. Meteorol. Atmos.Phys. 124, 67e82.
Slater, J.F., Dibb, J.E., Campbell, J.W., Moore, T.S., 2004. Physical and chemicalproperties of surface and column aerosols at a rural New England site duringMODIS overpass. Remote Sens. Environ. 92, 173e180.
Tiwari, S., Singh, A.K., 2013. Variability of aerosol parameters derived from groundand satellite measurements over Varanasi located in the Indo-Gangetic Basin.Aerosol Air Qual. Res. 13, 627e638.
Tiwari, S., Srivastava, A.K., Singh, A.K., 2013. Heterogeneity in pre-monsoon aerosolcharacteristics over the Indo-Gangetic Basin. Atmos. Environ. 77, 738e747.
Tiwari, S., Bisht, D.S., Srivastava, A.K., Pipal, A.S., Taneja, A., Srivastava, M.K., et al.,2014. Variability in atmospheric particulates and meteorological effects on theirmass concentrations over Delhi, India. Atmos. Res. 145e146, 45e56.
Tsai, T.C., Jeng, Y.J., Chu, D.A., Chen, J.P., Chang, S.C., 2011. Analysis of the relationshipbetween MODIS aerosol optical depth and particulate matter from 2006 to2008. Atmos. Environ. 45, 4777e4788.
Venkataraman, C., Habib, G., Eiguren-Fernandez, A., Miguel, A.H., Friedlander, S.K.,2005. Residential biofuels in South Asia: carbonaceous aerosol emissions andclimate impacts. Science 307, 1454e1456.
Wang, L., Christopher, L., 2003. Inter-comparison between satellite-derived aerosoloptical thickness and PM2.5 mass: implications for air quality studies. Geophys.Res. Lett. 30 (21).
Related Documents