Atmospheric Environment 35 (2001) 4889–4902 Wintertime and summertime S * ao Paulo aerosol source apportionment study Andr ! ea D.A. Castanho*, Paulo Artaxo Instituto de F! ısica, Universidade de S * ao Paulo, Rua do Mat * ao, Travessa R, 187, CEP 05508-901, S * ao Paulo, S.P., Brazil Received 20 December 2000; accepted 26 June 2001 Abstract A detailed aerosol source apportionment study was performed with two sampling campaigns, during wintertime and summertime in the heavily polluted metropolitan area of S * ao Paulo, Brazil. In addition to 12 h fine and coarse mode filter sampling, several real time aerosol and trace gas monitors were used. PM 10 was sampled using stacked filter units that collects fine (do2.5 mm) and coarse (2.5odo10 mm) particulate matter, providing mass, black carbon (BC) and elemental concentration for each aerosol mode. The concentration of about 20 elements was determined using the particle induce X-ray emission technique. Real time aerosol monitors provided PM 10 aerosol mass (TEOM), organic and elemental carbon (Carbon Monitor 5400, R&P) and BC concentration (Aethalometer). A complex system of sources and meteorological conditions modulates the heavy air pollution of the urban area of S * ao Paulo. The boundary layer height and the primary emissions by motor vehicles controls the strong pattern of diurnal cycles obtained for PM 10 , BC, CO, NO x , and SO 2 . Absolute principal factor analysis results showed a very similar source pattern between winter and summer field campaigns, despite the different locations of the sampling sites of both campaigns, pointing that there are no significant change in the main air pollution sources. The source identified as motor vehicle represented 28% and 24% of the PM 2.5 for winter and summer, respectively. Resuspended soil dust accounted for 25% and 30%. The oil combustion source represented 18% and 21%. Sulfates accounts for 23% and 17% and finally industrial emissions contributed with 5% and 6% of PM 2.5 , for winter and summer, respectively. The resuspended soil dust accounted for a large fraction (75–78%) of the coarse mode aerosol mass. Certainly automobile traffic and soil dust are the main air pollution sources in S * ao Paulo. The sampling and analytical procedures applied in this study showed that it is possible to perform a quantitative aerosol source apportionment in a complex urban area such as S * ao Paulo. r 2001 Elsevier Science Ltd. All rights reserved. Keywords: Urban pollution; Aerosol particles; Aerosol source apportionment; Trace elements; Black carbon; Receptor models 1. Introduction The urban air pollution issue is a concern in many mega cities, because of its hazardous effect to human health (Macchione et al., 1999; Saldiva et al., 1995; Schwartz, 1994; Spektor et al., 1991). The metropolitan area of S * ao Paulo is possibly the third largest metropolitan conglomerate of the world, with about 17 million inhabitants. It is the most industrialized and developed region of South America, representing 18.5% of the Brazilian GNP. S * ao Paulo city is home of one of the largest urban motor vehicles fleet (5.5 millions automobiles) of the world. It is located in a plateau at about 860 m above sea level (a.s.l.) and it is surrounded by hills of about 1200 m in height. Frequent subsidence and thermal inversion layers provides unfavorable conditions for the dispersion of pollutants during most of the winter season. The strong emissions of trace gases and aerosol particles by vehicles, industry and resus- pended soil dust, together with secondary aerosol, *Corresponding author. E-mail addresses: [email protected] (A.D.A. Castanho), [email protected] (P. Artaxo). 1352-2310/01/$ - see front matter r 2001 Elsevier Science Ltd. All rights reserved. PII:S1352-2310(01)00357-0

Welcome message from author
This document is posted to help you gain knowledge. Please leave a comment to let me know what you think about it! Share it to your friends and learn new things together.
Transcript
Atmospheric Environment 35 (2001) 4889–4902
Wintertime and summertime S*ao Paulo aerosol sourceapportionment study
Andr!ea D.A. Castanho*, Paulo Artaxo
Instituto de F!ısica, Universidade de S *ao Paulo, Rua do Mat *ao, Travessa R, 187, CEP 05508-901, S *ao Paulo, S.P., Brazil
Received 20 December 2000; accepted 26 June 2001
Abstract
A detailed aerosol source apportionment study was performed with two sampling campaigns, during wintertime andsummertime in the heavily polluted metropolitan area of S*ao Paulo, Brazil. In addition to 12 h fine and coarse modefilter sampling, several real time aerosol and trace gas monitors were used. PM10 was sampled using stacked filter units
that collects fine (do2.5mm) and coarse (2.5odo10 mm) particulate matter, providing mass, black carbon (BC) andelemental concentration for each aerosol mode. The concentration of about 20 elements was determined using theparticle induce X-ray emission technique. Real time aerosol monitors provided PM10 aerosol mass (TEOM), organic
and elemental carbon (Carbon Monitor 5400, R&P) and BC concentration (Aethalometer). A complex system ofsources and meteorological conditions modulates the heavy air pollution of the urban area of S*ao Paulo. The boundarylayer height and the primary emissions by motor vehicles controls the strong pattern of diurnal cycles obtained for
PM10, BC, CO, NOx, and SO2. Absolute principal factor analysis results showed a very similar source pattern betweenwinter and summer field campaigns, despite the different locations of the sampling sites of both campaigns, pointingthat there are no significant change in the main air pollution sources. The source identified as motor vehicle represented28% and 24% of the PM2.5 for winter and summer, respectively. Resuspended soil dust accounted for 25% and 30%.
The oil combustion source represented 18% and 21%. Sulfates accounts for 23% and 17% and finally industrialemissions contributed with 5% and 6% of PM2.5, for winter and summer, respectively. The resuspended soil dustaccounted for a large fraction (75–78%) of the coarse mode aerosol mass. Certainly automobile traffic and soil dust are
the main air pollution sources in S*ao Paulo. The sampling and analytical procedures applied in this study showed that itis possible to perform a quantitative aerosol source apportionment in a complex urban area such as S*ao Paulo. r 2001Elsevier Science Ltd. All rights reserved.
Keywords: Urban pollution; Aerosol particles; Aerosol source apportionment; Trace elements; Black carbon; Receptor models
1. Introduction
The urban air pollution issue is a concern in many
mega cities, because of its hazardous effect to humanhealth (Macchione et al., 1999; Saldiva et al., 1995;Schwartz, 1994; Spektor et al., 1991). The metropolitanarea of S*ao Paulo is possibly the third largest
metropolitan conglomerate of the world, with about 17
million inhabitants. It is the most industrialized anddeveloped region of South America, representing 18.5%of the Brazilian GNP. S*ao Paulo city is home of one of
the largest urban motor vehicles fleet (5.5 millionsautomobiles) of the world. It is located in a plateau atabout 860 m above sea level (a.s.l.) and it is surroundedby hills of about 1200 m in height. Frequent subsidence
and thermal inversion layers provides unfavorableconditions for the dispersion of pollutants during mostof the winter season. The strong emissions of trace gases
and aerosol particles by vehicles, industry and resus-pended soil dust, together with secondary aerosol,
*Corresponding author.
E-mail addresses: [email protected] (A.D.A. Castanho),
[email protected] (P. Artaxo).
1352-2310/01/$ - see front matter r 2001 Elsevier Science Ltd. All rights reserved.
PII: S 1 3 5 2 - 2 3 1 0 ( 0 1 ) 0 0 3 5 7 - 0
coupled with the unfavorable natural conditions ofdispersion, are responsible for the high concentrations of
pollutants observed in the S*ao Paulo metropolitan area(Artaxo and Castanho, 1998).
In S*ao Paulo, PM10 concentrations consistently
exceed the annual national air quality PM10 standardof 50mg m�3 during the last 20 years for severalmonitoring stations around the urban area. Concentra-tions of CO and NO2 are also high due to high motor
vehicle emissions, but the SO2 concentrations are lowbecause of the consumption of low sulfur fuels in S*aoPaulo, and also probably because of the somewhat fast
conversion rate of SO2 to sulfate in the atmosphere.Concentrations of ozone frequently exceed the airquality standard of 160mg m�3, 1-h limits, during the
spring and summer, when the photochemical processesare efficient. The high level of pollutants occurs inseveral air pollution monitoring stations distributed over
the Metropolitan region of S*ao Paulo (RMSP) (CE-TESB, 1998), indicating that the air pollution issue isactually a regional issue, not limited anymore to the cityborders. Several previous works have been done study-
ing air pollution in S*ao Paulo, where the particulatematter has been characterized and sources of pollutantshave been identified by receptor models (Andrade et al.,
1994; Artaxo et al., 1995; Artaxo and Castanho, 1998;Orsini et al., 1984, 1986). However, this is the first studyto use real time aerosol and trace gas monitors that
allows the study of the diurnal pattern of pollutants overthe metropolitan area during winter and summertime.
This paper reports quantitative source apportionmentcalculations for winter and summertime aerosols col-
lected in the S*ao Paulo metropolitan area. Fine andcoarse mode aerosol particles were collected andanalyzed for mass, black carbon (BC) and up to 20
trace elements using particle induced X-ray emissionanalysis. The carbonaceous component was measuredusing several techniques, including an aerosol carbon
monitor, to measure organic and total carbon with atime resolution of 60 min. The aerosol optical absorp-tion component was determined using one Aethalometer
from Magee Scientific. The measurement of gaseouscomponent, mostly SO2, CO and NO2 has helped toapportion aerosol sources. Meteorological influence inthe PM10 concentrations was studied using real time
aerosol mass monitors such as the TEOM sampler. Thisstudy includes measurements during summertime inaddition to wintertime, to allow comparison of source
strengths in different seasons.
2. Experimental and analytical methodologies
Two sampling campaigns were carried out continu-
ously during the wintertime of 1997 (10 June until 10September) and summertime of 1998 (16 January until 6
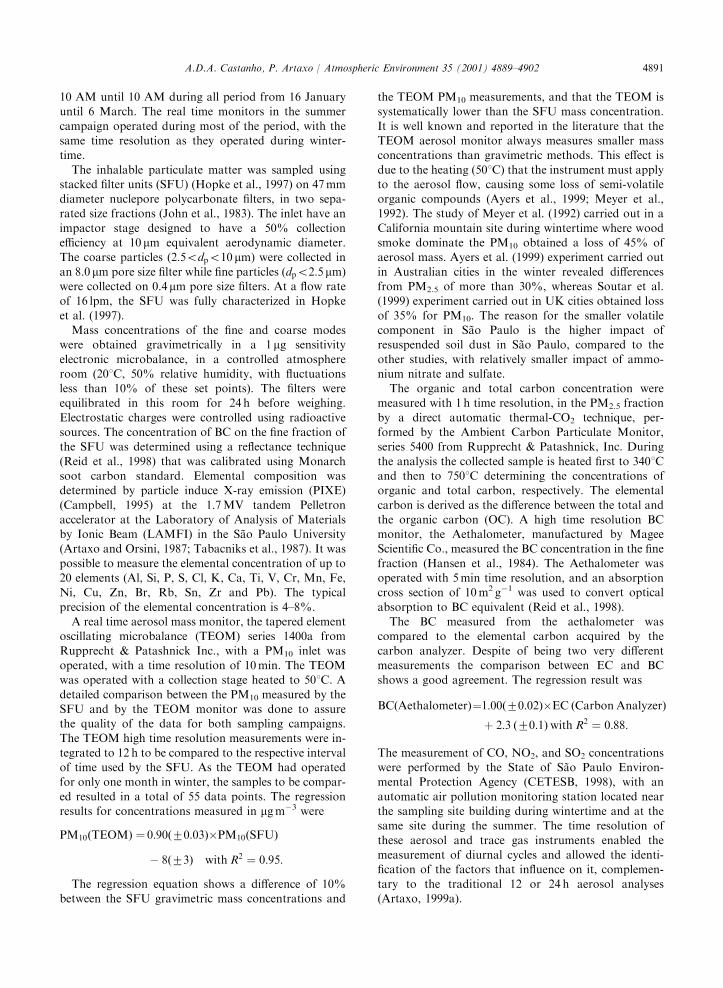
March). The wintertime study was carried out in a sitelocated about 6 km from S*ao Paulo downtown at the
Medical School building at the University of S*ao Paulo,indicated in Fig. 1. The sampling sites and meteorolo-gical station locations in the city are indicated in this
figure. The region is characterized by heavy traffic andthe local activity is mainly commercial. The summertimecampaign was carried out in the University of S*ao Paulocampus located about 10 km from downtown. The site is
also characterized by a heavy traffic and the localactivity is mainly residential and commercial. Thecomparison of atmospheric characteristics between two
different sampling sites for winter and summer has itslimitations, because you aren’t under identical samplingcondition for both studies. However, S*ao Paulo is a very
large urban area and the small distance between the twosampling site and the well mixed characteristics of theurban area makes the comparison valid. The compar-
ison between the two sites for different seasons wasvalid, and the results confirm that. In both campaignsthe equipment inlets were located 3 m above the groundon the flat roof of the 3-floor buildings to minimize
direct influence of emissions from local vehicles andnearby resuspended soil dust by the local traffic. Bothsites were at about 760 m a.s.l.
During the wintertime campaign the SFU operatedwith an integration time of 12 h from 10 AM to 10 PMfrom 10 June until 10 September. The Aethalometer also
operated during all the campaign period with a timeresolution of 10 min. The carbon monitor operated witha time resolution of 1 h in the last month, from 10August until 10 September, at the same period the
TEOM operated with a time resolution of 10 min. Tracegas data were available from July until September with atime resolution of 1 h. During the summer campaign of
1998, the SFU operated for 24 h integration time, from
Fig. 1. S*ao Paulo metropolitan region map with the sampling
locations indicated: (1) Medical SchoolFUSP, site of the
winter campaign; (2) S*ao Paulo University CampusFUSP, site
of the summer campaign; #, Congonhas Airport; K, Meteor-
ological Station.
A.D.A. Castanho, P. Artaxo / Atmospheric Environment 35 (2001) 4889–49024890
10 AM until 10 AM during all period from 16 Januaryuntil 6 March. The real time monitors in the summer
campaign operated during most of the period, with thesame time resolution as they operated during winter-time.
The inhalable particulate matter was sampled usingstacked filter units (SFU) (Hopke et al., 1997) on 47 mmdiameter nuclepore polycarbonate filters, in two sepa-rated size fractions (John et al., 1983). The inlet have an
impactor stage designed to have a 50% collectionefficiency at 10 mm equivalent aerodynamic diameter.The coarse particles (2:5odpo10 mm) were collected in
an 8.0mm pore size filter while fine particles (dpo2:5mm)were collected on 0.4 mm pore size filters. At a flow rateof 16 lpm, the SFU was fully characterized in Hopke
et al. (1997).Mass concentrations of the fine and coarse modes
were obtained gravimetrically in a 1mg sensitivity
electronic microbalance, in a controlled atmosphereroom (201C, 50% relative humidity, with fluctuationsless than 10% of these set points). The filters wereequilibrated in this room for 24 h before weighing.
Electrostatic charges were controlled using radioactivesources. The concentration of BC on the fine fraction ofthe SFU was determined using a reflectance technique
(Reid et al., 1998) that was calibrated using Monarchsoot carbon standard. Elemental composition wasdetermined by particle induce X-ray emission (PIXE)
(Campbell, 1995) at the 1.7 MV tandem Pelletronaccelerator at the Laboratory of Analysis of Materialsby Ionic Beam (LAMFI) in the S*ao Paulo University(Artaxo and Orsini, 1987; Tabacniks et al., 1987). It was
possible to measure the elemental concentration of up to20 elements (Al, Si, P, S, Cl, K, Ca, Ti, V, Cr, Mn, Fe,Ni, Cu, Zn, Br, Rb, Sn, Zr and Pb). The typical
precision of the elemental concentration is 4–8%.A real time aerosol mass monitor, the tapered element
oscillating microbalance (TEOM) series 1400a from
Rupprecht & Patashnick Inc., with a PM10 inlet wasoperated, with a time resolution of 10 min. The TEOMwas operated with a collection stage heated to 501C. A
detailed comparison between the PM10 measured by theSFU and by the TEOM monitor was done to assurethe quality of the data for both sampling campaigns.The TEOM high time resolution measurements were in-
tegrated to 12 h to be compared to the respective intervalof time used by the SFU. As the TEOM had operatedfor only one month in winter, the samples to be compar-
ed resulted in a total of 55 data points. The regressionresults for concentrations measured in mg m�3 were
PM10ðTEOMÞ ¼ 0:90ð70:03Þ�PM10ðSFUÞ
� 8ð73Þ with R2 ¼ 0:95:
The regression equation shows a difference of 10%between the SFU gravimetric mass concentrations and
the TEOM PM10 measurements, and that the TEOM issystematically lower than the SFU mass concentration.
It is well known and reported in the literature that theTEOM aerosol monitor always measures smaller massconcentrations than gravimetric methods. This effect is
due to the heating (501C) that the instrument must applyto the aerosol flow, causing some loss of semi-volatileorganic compounds (Ayers et al., 1999; Meyer et al.,1992). The study of Meyer et al. (1992) carried out in a
California mountain site during wintertime where woodsmoke dominate the PM10 obtained a loss of 45% ofaerosol mass. Ayers et al. (1999) experiment carried out
in Australian cities in the winter revealed differencesfrom PM2.5 of more than 30%, whereas Soutar et al.(1999) experiment carried out in UK cities obtained loss
of 35% for PM10. The reason for the smaller volatilecomponent in S*ao Paulo is the higher impact ofresuspended soil dust in S*ao Paulo, compared to the
other studies, with relatively smaller impact of ammo-nium nitrate and sulfate.
The organic and total carbon concentration weremeasured with 1 h time resolution, in the PM2.5 fraction
by a direct automatic thermal-CO2 technique, per-formed by the Ambient Carbon Particulate Monitor,series 5400 from Rupprecht & Patashnick, Inc. During
the analysis the collected sample is heated first to 3401Cand then to 7501C determining the concentrations oforganic and total carbon, respectively. The elemental
carbon is derived as the difference between the total andthe organic carbon (OC). A high time resolution BCmonitor, the Aethalometer, manufactured by MageeScientific Co., measured the BC concentration in the fine
fraction (Hansen et al., 1984). The Aethalometer wasoperated with 5 min time resolution, and an absorptioncross section of 10 m2 g�1 was used to convert optical
absorption to BC equivalent (Reid et al., 1998).The BC measured from the aethalometer was
compared to the elemental carbon acquired by the
carbon analyzer. Despite of being two very differentmeasurements the comparison between EC and BCshows a good agreement. The regression result was
BCðAethalometerÞ¼1:00ð70:02Þ�EC ðCarbon AnalyzerÞ
þ 2:3 ð70:1Þ with R2 ¼ 0:88:
The measurement of CO, NO2, and SO2 concentrationswere performed by the State of S*ao Paulo Environ-mental Protection Agency (CETESB, 1998), with an
automatic air pollution monitoring station located nearthe sampling site building during wintertime and at thesame site during the summer. The time resolution of
these aerosol and trace gas instruments enabled themeasurement of diurnal cycles and allowed the identi-fication of the factors that influence on it, complemen-
tary to the traditional 12 or 24 h aerosol analyses(Artaxo, 1999a).
A.D.A. Castanho, P. Artaxo / Atmospheric Environment 35 (2001) 4889–4902 4891
Meteorological variables were monitored at theUniversity of S*ao Paulo automatic weather station,
located in the southeast part of the city. Despite of beingin a different site, the data was only used to classifyweather patterns. The products of the analysis of these
meteorological data helped to classify the generalmeteorological conditions in the region of S*ao Paulo,basically if the weather was favorable or not to thedispersion of the pollutants. It was analyzed atmo-
spheric pressure at surface level, temperature, relativehumidity, precipitation, and cloudiness observations.Radiosondes were done at Congonhas Airport, twice a
day and also analyzed (9 AM and 9 PM local time).Receptor model methodologies are based on statis-
tical multivariate analysis to infer source contributions
at the receptor sites (Henry, 1991; Puri et al., 1996).Absolute principal factor analysis (APFA) was appliedto identify the absolute source profiles and quantify the
source apportionment (Thurston and Spengler, 1985).The APFA model is based on the eigenvalue andeigenvector analysis of the correlation matrix of thenormalized elemental concentration. The aim is to
obtain a reduced number of factors that are independentand uncorrelated that could explain most of the originaldata variability. The factor-loading matrix represents
the association between the trace elements and eachfactor obtained. The factor-scores are an indication ofthe strength of each sample to each retained factor. The
percentage of variance explained for each variable canbe used to test the effectiveness of the factor model tothat particular variable. Also the total varianceexplained by the model can be used as a check if the
number of factors and their composition is adequate tothe original database (Hopke, 1991).
3. Results and discussion
In this experiment, a careful quality assurance anddata validation procedure was implemented. Several keyrelated aerosol properties were measured by different
samplers and techniques, allowing a detailed analysis ofthe data quality. To facilitate discussion of the results,the time series of the SFU, TEOM and related bulk
aerosol properties will be first presented and discussed,followed by a presentation of the aerosol sourceapportionment with the measured aerosol elementalcomposition. Summer and wintertime and fine and
coarse aerosol fraction will be discussed separately.The time series of PM10 concentrations measured by
the SFU separated in the fine and coarse fractions are
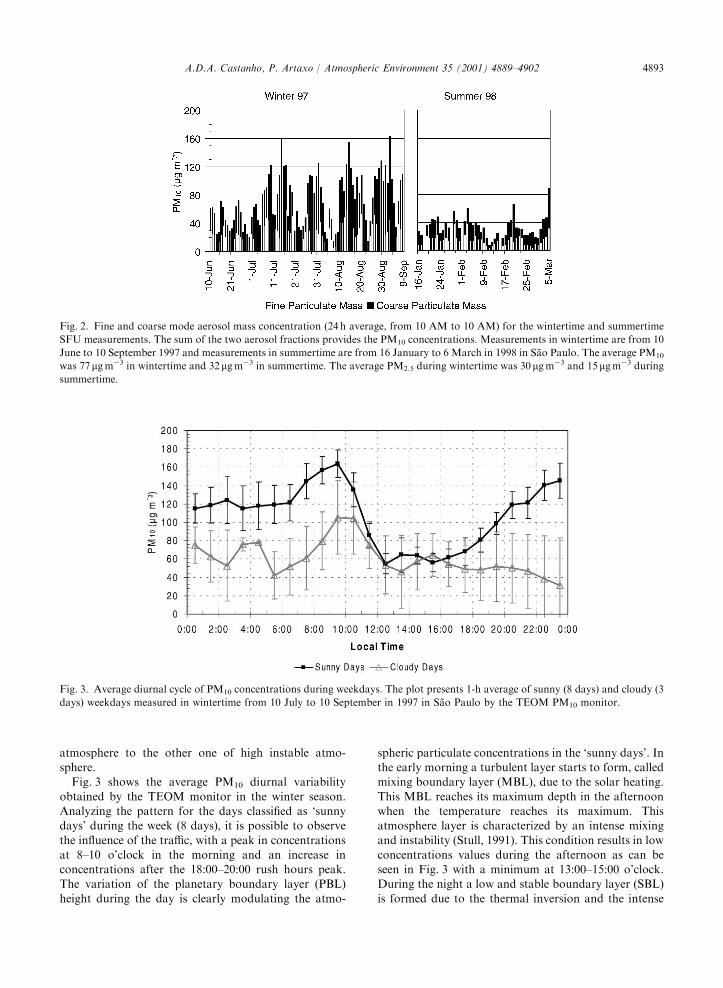
shown in Fig. 2. Fig. 2 presents the temporal series ofPM10 in 24 h average in order to compare the variabilityof winter and summer concentrations, and also to
compare the PM10 measurements to the Brazilian airpollution standard limit for PM10 that is 150mg m�3
averaged over 24 h. During the winter period PM10
concentrations from 20 up to 160 mg m�3 were measured.
The meteorological analysis identified that the periodwith low concentrations in wintertime are coincidentwith days with synoptic systems of low pressure
associated with high wind speed and occasional rain.This condition is favorable to dispersion and depositionof the pollutants. However, periods were also observedwhere the meteorological conditions are characterized
by synoptic systems of high pressure that broughtmostly sunny weather, low wind speed and a low heightthermal inversion layer, a meteorological condition
unfavorable to the dispersion of the pollutants. If thismeteorological condition persists for more than 3 days,the resulting accumulation of pollutants in the atmo-
sphere brings high PM10 concentrations. During thesummertime campaign, a very different pattern wasobserved, as can be seen in the right pane in Fig. 2. The
PM10 concentrations are relatively low, with an averageof 32mg m�3 in the summer, compared to 77 mg m�3
during wintertime. This pattern can be explained by thefavorable conditions to the dispersion of pollutants
during the summer, with frequent rains in the metropo-litan region of S*ao Paulo. Comparing winter andsummertime periods, the fine fraction had a reduction
of about 50% while the coarse fraction had a greaterreduction of 60%. This is probably due to the differenceof deposition efficiency between the coarse and fine
modes in the summer when there are more frequentlyrainy periods. Artaxo et al. (1999b) in a similar study inSantiago de Chile, obtained average concentrations ofPM10 of 148 mg m�3 downtown. Similar fractions of
PM10 for the fine (40% PM2.5/PM10) and coarse mode(60% of CPM/PM10) were obtained for Santiago andS*ao Paulo.
There are two clear meteorological conditions thatinfluence the pattern of pollutants in S*ao Paulo. Theycan be classified by clear and sunny days, versus cloudy
days. In the first condition, the so-called ‘sunny days’represent 12 days of the total data set of 29 days. Duringthese days the region was under a high-pressure synoptic
system and the boundary layer has a very well definedcycle during the day. They are characterized by absenceof clouds, high thermal amplitude (131C nighttime to271C daytime) and by low daytime relative humidity
(from 20% to 36%). The nighttime stable layer couldreach heights very low as 20–60 m. In the second weatherclassification, ‘cloudy days’ represent 7 days of 29 days
of the data set. During these days the region was mainlyunder low-pressure synoptic system, characterizing thearrival of cold fronts. Cloudy skies with or without rain,
low thermal amplitude (151C nighttime to 221C day-time) and high humidity (60% daytime and 90%nighttime) characterized these days. The other 10 days
represent a mix of the two situations listed above, theywere transitions from one extreme of high stable
A.D.A. Castanho, P. Artaxo / Atmospheric Environment 35 (2001) 4889–49024892
atmosphere to the other one of high instable atmo-sphere.
Fig. 3 shows the average PM10 diurnal variability
obtained by the TEOM monitor in the winter season.Analyzing the pattern for the days classified as ‘sunnydays’ during the week (8 days), it is possible to observe
the influence of the traffic, with a peak in concentrationsat 8–10 o’clock in the morning and an increase inconcentrations after the 18:00–20:00 rush hours peak.The variation of the planetary boundary layer (PBL)
height during the day is clearly modulating the atmo-
spheric particulate concentrations in the ‘sunny days’. Inthe early morning a turbulent layer starts to form, calledmixing boundary layer (MBL), due to the solar heating.
This MBL reaches its maximum depth in the afternoonwhen the temperature reaches its maximum. Thisatmosphere layer is characterized by an intense mixing
and instability (Stull, 1991). This condition results in lowconcentrations values during the afternoon as can beseen in Fig. 3 with a minimum at 13:00–15:00 o’clock.During the night a low and stable boundary layer (SBL)
is formed due to the thermal inversion and the intense
Fig. 2. Fine and coarse mode aerosol mass concentration (24 h average, from 10 AM to 10 AM) for the wintertime and summertime
SFU measurements. The sum of the two aerosol fractions provides the PM10 concentrations. Measurements in wintertime are from 10
June to 10 September 1997 and measurements in summertime are from 16 January to 6 March in 1998 in S*ao Paulo. The average PM10
was 77 mg m�3 in wintertime and 32 mg m�3 in summertime. The average PM2.5 during wintertime was 30 mg m�3 and 15mg m�3 during
summertime.
Fig. 3. Average diurnal cycle of PM10 concentrations during weekdays. The plot presents 1-h average of sunny (8 days) and cloudy (3
days) weekdays measured in wintertime from 10 July to 10 September in 1997 in S*ao Paulo by the TEOM PM10 monitor.
A.D.A. Castanho, P. Artaxo / Atmospheric Environment 35 (2001) 4889–4902 4893
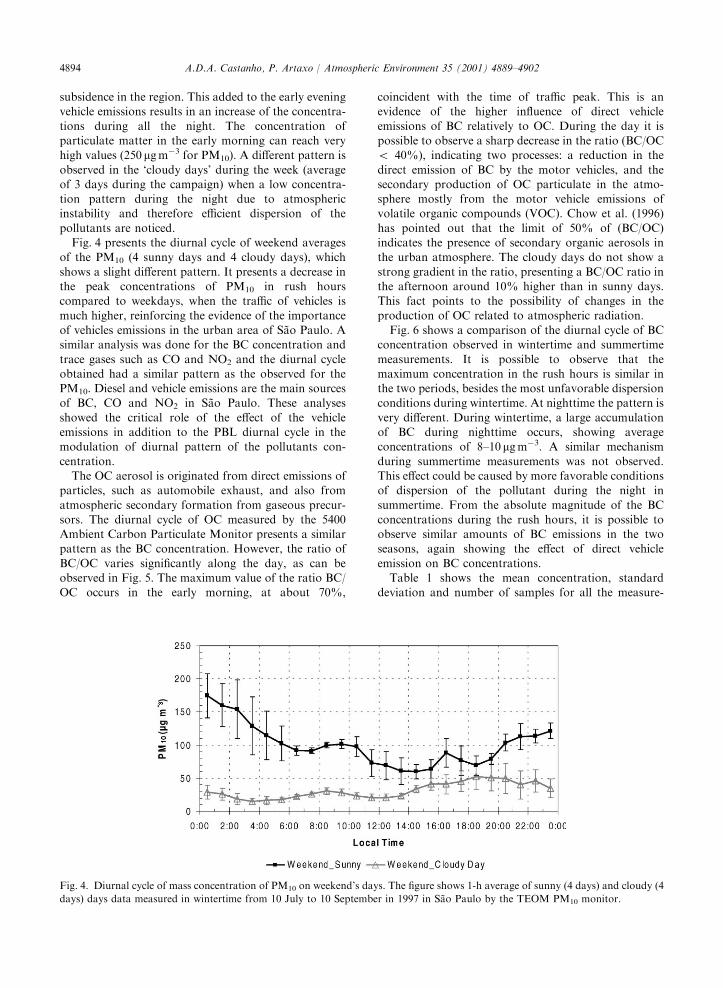
subsidence in the region. This added to the early eveningvehicle emissions results in an increase of the concentra-
tions during all the night. The concentration ofparticulate matter in the early morning can reach veryhigh values (250 mg m�3 for PM10). A different pattern is
observed in the ‘cloudy days’ during the week (averageof 3 days during the campaign) when a low concentra-tion pattern during the night due to atmosphericinstability and therefore efficient dispersion of the
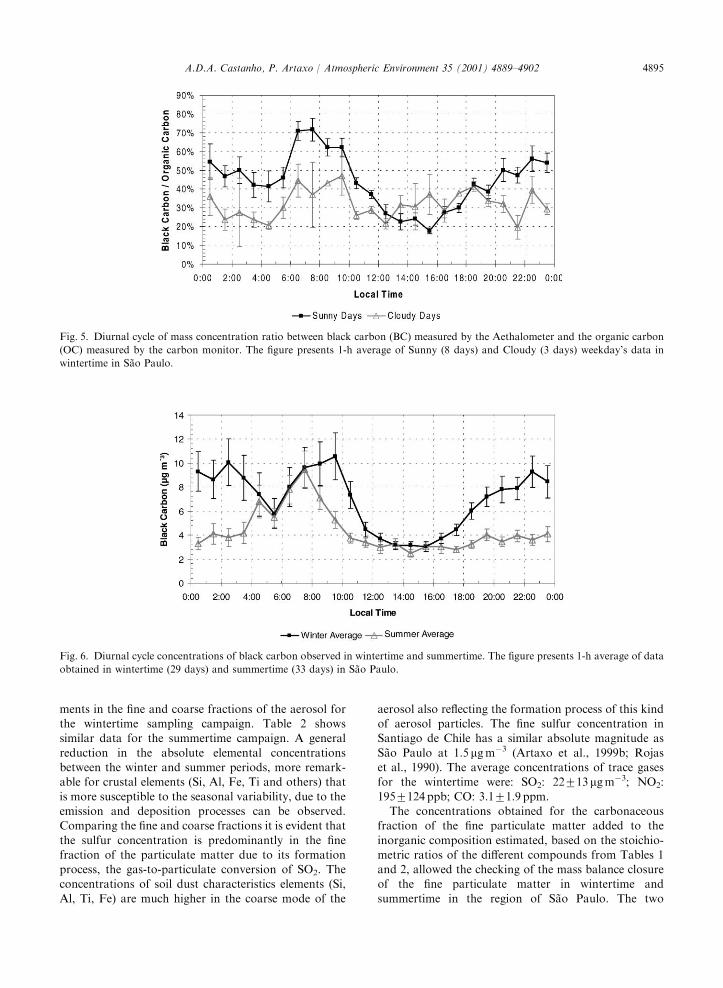
pollutants are noticed.Fig. 4 presents the diurnal cycle of weekend averages
of the PM10 (4 sunny days and 4 cloudy days), which
shows a slight different pattern. It presents a decrease inthe peak concentrations of PM10 in rush hourscompared to weekdays, when the traffic of vehicles is
much higher, reinforcing the evidence of the importanceof vehicles emissions in the urban area of S*ao Paulo. Asimilar analysis was done for the BC concentration and
trace gases such as CO and NO2 and the diurnal cycleobtained had a similar pattern as the observed for thePM10. Diesel and vehicle emissions are the main sourcesof BC, CO and NO2 in S*ao Paulo. These analyses
showed the critical role of the effect of the vehicleemissions in addition to the PBL diurnal cycle in themodulation of diurnal pattern of the pollutants con-
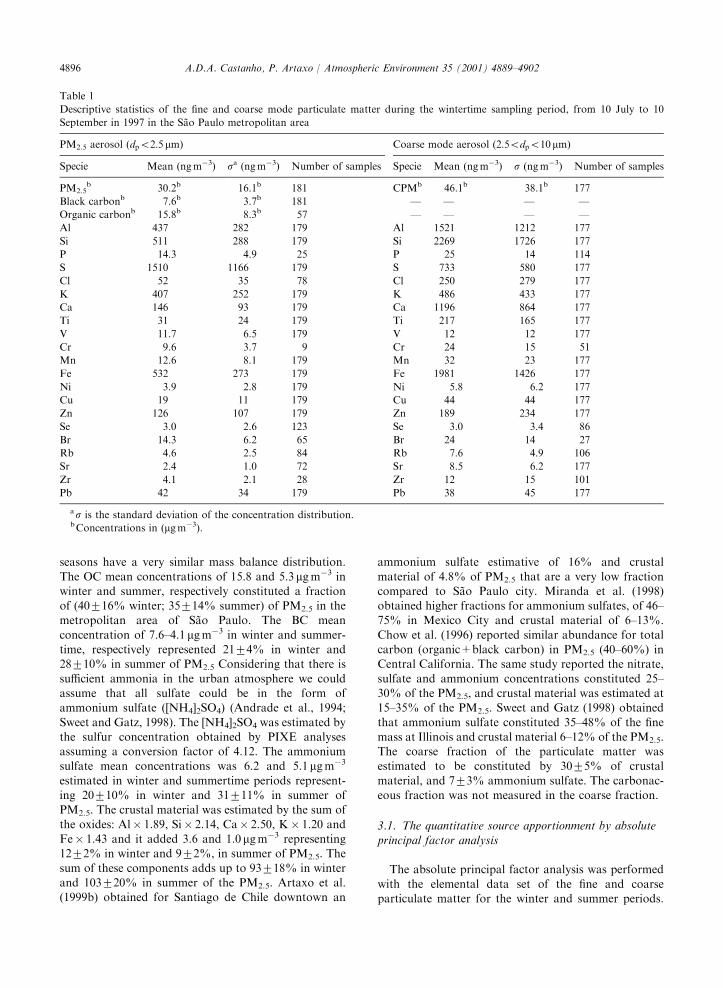
centration.The OC aerosol is originated from direct emissions of
particles, such as automobile exhaust, and also from
atmospheric secondary formation from gaseous precur-sors. The diurnal cycle of OC measured by the 5400Ambient Carbon Particulate Monitor presents a similarpattern as the BC concentration. However, the ratio of
BC/OC varies significantly along the day, as can beobserved in Fig. 5. The maximum value of the ratio BC/OC occurs in the early morning, at about 70%,
coincident with the time of traffic peak. This is anevidence of the higher influence of direct vehicle
emissions of BC relatively to OC. During the day it ispossible to observe a sharp decrease in the ratio (BC/OCo 40%), indicating two processes: a reduction in the
direct emission of BC by the motor vehicles, and thesecondary production of OC particulate in the atmo-sphere mostly from the motor vehicle emissions ofvolatile organic compounds (VOC). Chow et al. (1996)
has pointed out that the limit of 50% of (BC/OC)indicates the presence of secondary organic aerosols inthe urban atmosphere. The cloudy days do not show a
strong gradient in the ratio, presenting a BC/OC ratio inthe afternoon around 10% higher than in sunny days.This fact points to the possibility of changes in the
production of OC related to atmospheric radiation.Fig. 6 shows a comparison of the diurnal cycle of BC
concentration observed in wintertime and summertime
measurements. It is possible to observe that themaximum concentration in the rush hours is similar inthe two periods, besides the most unfavorable dispersionconditions during wintertime. At nighttime the pattern is
very different. During wintertime, a large accumulationof BC during nighttime occurs, showing averageconcentrations of 8–10 mg m�3. A similar mechanism
during summertime measurements was not observed.This effect could be caused by more favorable conditionsof dispersion of the pollutant during the night in
summertime. From the absolute magnitude of the BCconcentrations during the rush hours, it is possible toobserve similar amounts of BC emissions in the twoseasons, again showing the effect of direct vehicle
emission on BC concentrations.Table 1 shows the mean concentration, standard
deviation and number of samples for all the measure-
Fig. 4. Diurnal cycle of mass concentration of PM10 on weekend’s days. The figure shows 1-h average of sunny (4 days) and cloudy (4
days) days data measured in wintertime from 10 July to 10 September in 1997 in S*ao Paulo by the TEOM PM10 monitor.
A.D.A. Castanho, P. Artaxo / Atmospheric Environment 35 (2001) 4889–49024894
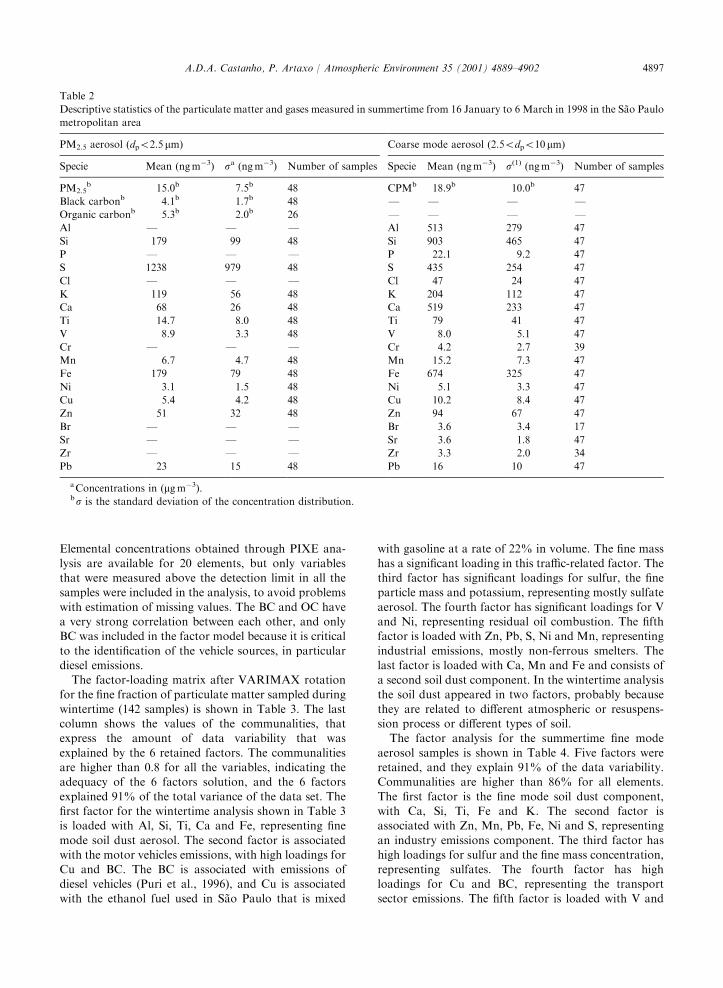
ments in the fine and coarse fractions of the aerosol forthe wintertime sampling campaign. Table 2 showssimilar data for the summertime campaign. A general
reduction in the absolute elemental concentrationsbetween the winter and summer periods, more remark-able for crustal elements (Si, Al, Fe, Ti and others) that
is more susceptible to the seasonal variability, due to theemission and deposition processes can be observed.Comparing the fine and coarse fractions it is evident that
the sulfur concentration is predominantly in the finefraction of the particulate matter due to its formationprocess, the gas-to-particulate conversion of SO2. Theconcentrations of soil dust characteristics elements (Si,
Al, Ti, Fe) are much higher in the coarse mode of the
aerosol also reflecting the formation process of this kindof aerosol particles. The fine sulfur concentration inSantiago de Chile has a similar absolute magnitude as
S*ao Paulo at 1.5mg m�3 (Artaxo et al., 1999b; Rojaset al., 1990). The average concentrations of trace gasesfor the wintertime were: SO2: 22713mg m�3; NO2:
1957124 ppb; CO: 3.171.9 ppm.The concentrations obtained for the carbonaceous
fraction of the fine particulate matter added to the
inorganic composition estimated, based on the stoichio-metric ratios of the different compounds from Tables 1and 2, allowed the checking of the mass balance closureof the fine particulate matter in wintertime and
summertime in the region of S*ao Paulo. The two
Fig. 5. Diurnal cycle of mass concentration ratio between black carbon (BC) measured by the Aethalometer and the organic carbon
(OC) measured by the carbon monitor. The figure presents 1-h average of Sunny (8 days) and Cloudy (3 days) weekday’s data in
wintertime in S*ao Paulo.
Fig. 6. Diurnal cycle concentrations of black carbon observed in wintertime and summertime. The figure presents 1-h average of data
obtained in wintertime (29 days) and summertime (33 days) in S*ao Paulo.
A.D.A. Castanho, P. Artaxo / Atmospheric Environment 35 (2001) 4889–4902 4895
seasons have a very similar mass balance distribution.
The OC mean concentrations of 15.8 and 5.3 mg m�3 inwinter and summer, respectively constituted a fractionof (40716% winter; 35714% summer) of PM2.5 in themetropolitan area of S*ao Paulo. The BC mean
concentration of 7.6–4.1 mg m�3 in winter and summer-time, respectively represented 2174% in winter and28710% in summer of PM2.5 Considering that there is
sufficient ammonia in the urban atmosphere we couldassume that all sulfate could be in the form ofammonium sulfate ([NH4]2SO4) (Andrade et al., 1994;
Sweet and Gatz, 1998). The [NH4]2SO4 was estimated bythe sulfur concentration obtained by PIXE analysesassuming a conversion factor of 4.12. The ammoniumsulfate mean concentrations was 6.2 and 5.1 mg m�3
estimated in winter and summertime periods represent-ing 20710% in winter and 31711% in summer ofPM2.5. The crustal material was estimated by the sum of
the oxides: Al� 1.89, Si� 2.14, Ca� 2.50, K� 1.20 andFe� 1.43 and it added 3.6 and 1.0 mg m�3 representing1272% in winter and 972%, in summer of PM2.5. The
sum of these components adds up to 93718% in winterand 103720% in summer of the PM2.5. Artaxo et al.(1999b) obtained for Santiago de Chile downtown an
ammonium sulfate estimative of 16% and crustal
material of 4.8% of PM2.5 that are a very low fractioncompared to S*ao Paulo city. Miranda et al. (1998)obtained higher fractions for ammonium sulfates, of 46–75% in Mexico City and crustal material of 6–13%.
Chow et al. (1996) reported similar abundance for totalcarbon (organic+black carbon) in PM2.5 (40–60%) inCentral California. The same study reported the nitrate,
sulfate and ammonium concentrations constituted 25–30% of the PM2.5, and crustal material was estimated at15–35% of the PM2.5. Sweet and Gatz (1998) obtained
that ammonium sulfate constituted 35–48% of the finemass at Illinois and crustal material 6–12% of the PM2.5.The coarse fraction of the particulate matter wasestimated to be constituted by 3075% of crustal
material, and 773% ammonium sulfate. The carbonac-eous fraction was not measured in the coarse fraction.
3.1. The quantitative source apportionment by absolute
principal factor analysis
The absolute principal factor analysis was performed
with the elemental data set of the fine and coarseparticulate matter for the winter and summer periods.
Table 1
Descriptive statistics of the fine and coarse mode particulate matter during the wintertime sampling period, from 10 July to 10
September in 1997 in the S*ao Paulo metropolitan area
PM2.5 aerosol (dpo2:5 mm) Coarse mode aerosol (2:5odpo10mm)
Specie Mean (ng m�3) sa (ng m�3) Number of samples Specie Mean (ng m�3) s (ng m�3) Number of samples
PM2.5b 30.2b 16.1b 181 CPMb 46.1b 38.1b 177
Black carbonb 7.6b 3.7b 181 F F F FOrganic carbonb 15.8b 8.3b 57 F F F FAl 437 282 179 Al 1521 1212 177
Si 511 288 179 Si 2269 1726 177
P 14.3 4.9 25 P 25 14 114
S 1510 1166 179 S 733 580 177
Cl 52 35 78 Cl 250 279 177
K 407 252 179 K 486 433 177
Ca 146 93 179 Ca 1196 864 177
Ti 31 24 179 Ti 217 165 177
V 11.7 6.5 179 V 12 12 177
Cr 9.6 3.7 9 Cr 24 15 51
Mn 12.6 8.1 179 Mn 32 23 177
Fe 532 273 179 Fe 1981 1426 177
Ni 3.9 2.8 179 Ni 5.8 6.2 177
Cu 19 11 179 Cu 44 44 177
Zn 126 107 179 Zn 189 234 177
Se 3.0 2.6 123 Se 3.0 3.4 86
Br 14.3 6.2 65 Br 24 14 27
Rb 4.6 2.5 84 Rb 7.6 4.9 106
Sr 2.4 1.0 72 Sr 8.5 6.2 177
Zr 4.1 2.1 28 Zr 12 15 101
Pb 42 34 179 Pb 38 45 177
as is the standard deviation of the concentration distribution.b Concentrations in (mg m�3).
A.D.A. Castanho, P. Artaxo / Atmospheric Environment 35 (2001) 4889–49024896
Elemental concentrations obtained through PIXE ana-
lysis are available for 20 elements, but only variablesthat were measured above the detection limit in all thesamples were included in the analysis, to avoid problems
with estimation of missing values. The BC and OC havea very strong correlation between each other, and onlyBC was included in the factor model because it is critical
to the identification of the vehicle sources, in particulardiesel emissions.
The factor-loading matrix after VARIMAX rotation
for the fine fraction of particulate matter sampled duringwintertime (142 samples) is shown in Table 3. The lastcolumn shows the values of the communalities, thatexpress the amount of data variability that was
explained by the 6 retained factors. The communalitiesare higher than 0.8 for all the variables, indicating theadequacy of the 6 factors solution, and the 6 factors
explained 91% of the total variance of the data set. Thefirst factor for the wintertime analysis shown in Table 3is loaded with Al, Si, Ti, Ca and Fe, representing fine
mode soil dust aerosol. The second factor is associatedwith the motor vehicles emissions, with high loadings forCu and BC. The BC is associated with emissions ofdiesel vehicles (Puri et al., 1996), and Cu is associated
with the ethanol fuel used in S*ao Paulo that is mixed
with gasoline at a rate of 22% in volume. The fine mass
has a significant loading in this traffic-related factor. Thethird factor has significant loadings for sulfur, the fineparticle mass and potassium, representing mostly sulfate
aerosol. The fourth factor has significant loadings for Vand Ni, representing residual oil combustion. The fifthfactor is loaded with Zn, Pb, S, Ni and Mn, representing
industrial emissions, mostly non-ferrous smelters. Thelast factor is loaded with Ca, Mn and Fe and consists ofa second soil dust component. In the wintertime analysis
the soil dust appeared in two factors, probably becausethey are related to different atmospheric or resuspens-sion process or different types of soil.
The factor analysis for the summertime fine mode
aerosol samples is shown in Table 4. Five factors wereretained, and they explain 91% of the data variability.Communalities are higher than 86% for all elements.
The first factor is the fine mode soil dust component,with Ca, Si, Ti, Fe and K. The second factor isassociated with Zn, Mn, Pb, Fe, Ni and S, representing
an industry emissions component. The third factor hashigh loadings for sulfur and the fine mass concentration,representing sulfates. The fourth factor has highloadings for Cu and BC, representing the transport
sector emissions. The fifth factor is loaded with V and
Table 2
Descriptive statistics of the particulate matter and gases measured in summertime from 16 January to 6 March in 1998 in the S*ao Paulo
metropolitan area
PM2.5 aerosol (dpo2.5 mm) Coarse mode aerosol (2.5odpo10 mm)
Specie Mean (ng m�3) sa (ng m�3) Number of samples Specie Mean (ng m�3) s(1) (ng m�3) Number of samples
PM2.5b 15.0b 7.5b 48 CPMb 18.9b 10.0b 47
Black carbonb 4.1b 1.7b 48 F F F FOrganic carbonb 5.3b 2.0b 26 F F F FAl F F F Al 513 279 47
Si 179 99 48 Si 903 465 47
P F F F P 22.1 9.2 47
S 1238 979 48 S 435 254 47
Cl F F F Cl 47 24 47
K 119 56 48 K 204 112 47
Ca 68 26 48 Ca 519 233 47
Ti 14.7 8.0 48 Ti 79 41 47
V 8.9 3.3 48 V 8.0 5.1 47
Cr F F F Cr 4.2 2.7 39
Mn 6.7 4.7 48 Mn 15.2 7.3 47
Fe 179 79 48 Fe 674 325 47
Ni 3.1 1.5 48 Ni 5.1 3.3 47
Cu 5.4 4.2 48 Cu 10.2 8.4 47
Zn 51 32 48 Zn 94 67 47
Br F F F Br 3.6 3.4 17
Sr F F F Sr 3.6 1.8 47
Zr F F F Zr 3.3 2.0 34
Pb 23 15 48 Pb 16 10 47
a Concentrations in (mg m�3).bs is the standard deviation of the concentration distribution.
A.D.A. Castanho, P. Artaxo / Atmospheric Environment 35 (2001) 4889–4902 4897
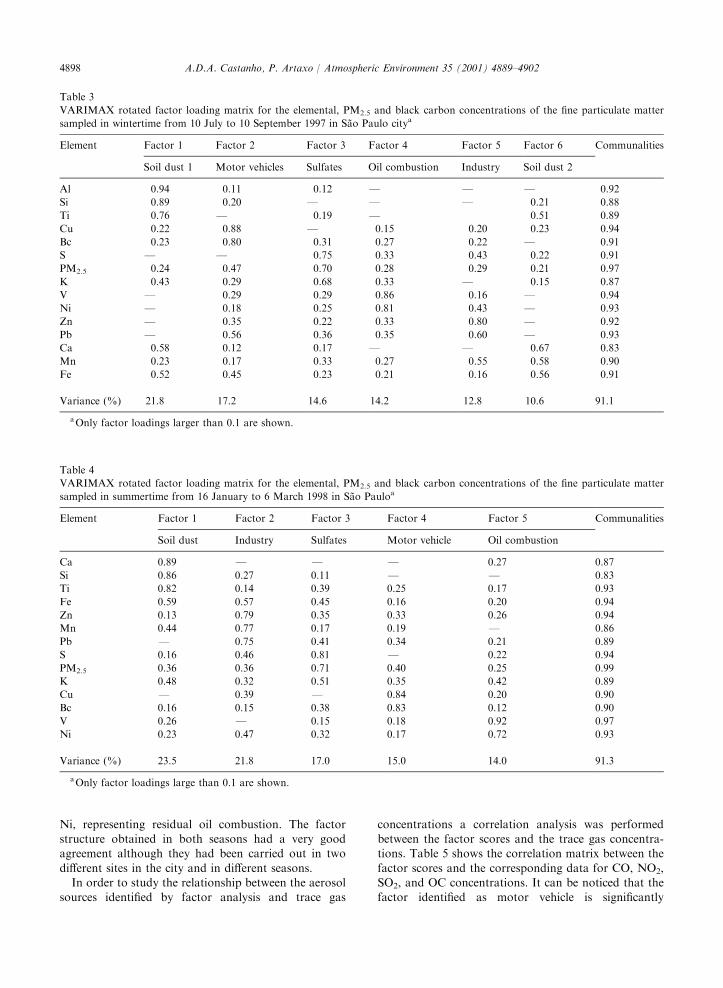
Ni, representing residual oil combustion. The factorstructure obtained in both seasons had a very goodagreement although they had been carried out in two
different sites in the city and in different seasons.In order to study the relationship between the aerosol
sources identified by factor analysis and trace gas
concentrations a correlation analysis was performedbetween the factor scores and the trace gas concentra-tions. Table 5 shows the correlation matrix between the
factor scores and the corresponding data for CO, NO2,SO2, and OC concentrations. It can be noticed that thefactor identified as motor vehicle is significantly
Table 3
VARIMAX rotated factor loading matrix for the elemental, PM2.5 and black carbon concentrations of the fine particulate matter
sampled in wintertime from 10 July to 10 September 1997 in S*ao Paulo citya
Element Factor 1 Factor 2 Factor 3 Factor 4 Factor 5 Factor 6 Communalities
Soil dust 1 Motor vehicles Sulfates Oil combustion Industry Soil dust 2
Al 0.94 0.11 0.12 F F F 0.92
Si 0.89 0.20 F F F 0.21 0.88
Ti 0.76 F 0.19 F 0.51 0.89
Cu 0.22 0.88 F 0.15 0.20 0.23 0.94
Bc 0.23 0.80 0.31 0.27 0.22 F 0.91
S F F 0.75 0.33 0.43 0.22 0.91
PM2.5 0.24 0.47 0.70 0.28 0.29 0.21 0.97
K 0.43 0.29 0.68 0.33 F 0.15 0.87
V F 0.29 0.29 0.86 0.16 F 0.94
Ni F 0.18 0.25 0.81 0.43 F 0.93
Zn F 0.35 0.22 0.33 0.80 F 0.92
Pb F 0.56 0.36 0.35 0.60 F 0.93
Ca 0.58 0.12 0.17 F F 0.67 0.83
Mn 0.23 0.17 0.33 0.27 0.55 0.58 0.90
Fe 0.52 0.45 0.23 0.21 0.16 0.56 0.91
Variance (%) 21.8 17.2 14.6 14.2 12.8 10.6 91.1
a Only factor loadings larger than 0.1 are shown.
Table 4
VARIMAX rotated factor loading matrix for the elemental, PM2.5 and black carbon concentrations of the fine particulate matter
sampled in summertime from 16 January to 6 March 1998 in S*ao Pauloa
Element Factor 1 Factor 2 Factor 3 Factor 4 Factor 5 Communalities
Soil dust Industry Sulfates Motor vehicle Oil combustion
Ca 0.89 F F F 0.27 0.87
Si 0.86 0.27 0.11 F F 0.83
Ti 0.82 0.14 0.39 0.25 0.17 0.93
Fe 0.59 0.57 0.45 0.16 0.20 0.94
Zn 0.13 0.79 0.35 0.33 0.26 0.94
Mn 0.44 0.77 0.17 0.19 F 0.86
Pb F 0.75 0.41 0.34 0.21 0.89
S 0.16 0.46 0.81 F 0.22 0.94
PM2.5 0.36 0.36 0.71 0.40 0.25 0.99
K 0.48 0.32 0.51 0.35 0.42 0.89
Cu F 0.39 F 0.84 0.20 0.90
Bc 0.16 0.15 0.38 0.83 0.12 0.90
V 0.26 F 0.15 0.18 0.92 0.97
Ni 0.23 0.47 0.32 0.17 0.72 0.93
Variance (%) 23.5 21.8 17.0 15.0 14.0 91.3
a Only factor loadings large than 0.1 are shown.
A.D.A. Castanho, P. Artaxo / Atmospheric Environment 35 (2001) 4889–49024898
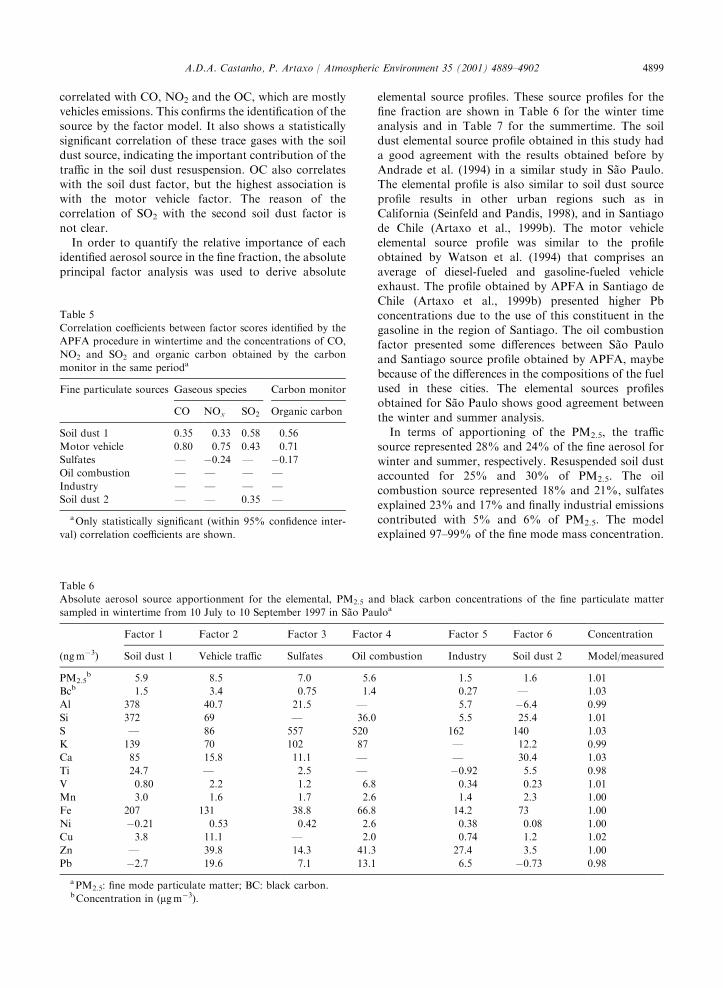
correlated with CO, NO2 and the OC, which are mostlyvehicles emissions. This confirms the identification of the
source by the factor model. It also shows a statisticallysignificant correlation of these trace gases with the soildust source, indicating the important contribution of the
traffic in the soil dust resuspension. OC also correlateswith the soil dust factor, but the highest association iswith the motor vehicle factor. The reason of thecorrelation of SO2 with the second soil dust factor is
not clear.In order to quantify the relative importance of each
identified aerosol source in the fine fraction, the absolute
principal factor analysis was used to derive absolute
elemental source profiles. These source profiles for thefine fraction are shown in Table 6 for the winter time
analysis and in Table 7 for the summertime. The soildust elemental source profile obtained in this study hada good agreement with the results obtained before by
Andrade et al. (1994) in a similar study in S*ao Paulo.The elemental profile is also similar to soil dust sourceprofile results in other urban regions such as inCalifornia (Seinfeld and Pandis, 1998), and in Santiago
de Chile (Artaxo et al., 1999b). The motor vehicleelemental source profile was similar to the profileobtained by Watson et al. (1994) that comprises an
average of diesel-fueled and gasoline-fueled vehicleexhaust. The profile obtained by APFA in Santiago deChile (Artaxo et al., 1999b) presented higher Pb
concentrations due to the use of this constituent in thegasoline in the region of Santiago. The oil combustionfactor presented some differences between S*ao Paulo
and Santiago source profile obtained by APFA, maybebecause of the differences in the compositions of the fuelused in these cities. The elemental sources profilesobtained for S*ao Paulo shows good agreement between
the winter and summer analysis.In terms of apportioning of the PM2.5, the traffic
source represented 28% and 24% of the fine aerosol for
winter and summer, respectively. Resuspended soil dustaccounted for 25% and 30% of PM2.5. The oilcombustion source represented 18% and 21%, sulfates
explained 23% and 17% and finally industrial emissionscontributed with 5% and 6% of PM2.5. The modelexplained 97–99% of the fine mode mass concentration.
Table 5
Correlation coefficients between factor scores identified by the
APFA procedure in wintertime and the concentrations of CO,
NO2 and SO2 and organic carbon obtained by the carbon
monitor in the same perioda
Fine particulate sources Gaseous species Carbon monitor
CO NOx SO2 Organic carbon
Soil dust 1 0.35 0.33 0.58 0.56
Motor vehicle 0.80 0.75 0.43 0.71
Sulfates F �0.24 F �0.17
Oil combustion F F F FIndustry F F F FSoil dust 2 F F 0.35 F
a Only statistically significant (within 95% confidence inter-
val) correlation coefficients are shown.
Table 6
Absolute aerosol source apportionment for the elemental, PM2.5 and black carbon concentrations of the fine particulate matter
sampled in wintertime from 10 July to 10 September 1997 in S*ao Pauloa
Factor 1 Factor 2 Factor 3 Factor 4 Factor 5 Factor 6 Concentration
(ng m�3) Soil dust 1 Vehicle traffic Sulfates Oil combustion Industry Soil dust 2 Model/measured
PM2.5b 5.9 8.5 7.0 5.6 1.5 1.6 1.01
Bcb 1.5 3.4 0.75 1.4 0.27 F 1.03
Al 378 40.7 21.5 F 5.7 �6.4 0.99
Si 372 69 F 36.0 5.5 25.4 1.01
S F 86 557 520 162 140 1.03
K 139 70 102 87 F 12.2 0.99
Ca 85 15.8 11.1 F F 30.4 1.03
Ti 24.7 F 2.5 F �0.92 5.5 0.98
V 0.80 2.2 1.2 6.8 0.34 0.23 1.01
Mn 3.0 1.6 1.7 2.6 1.4 2.3 1.00
Fe 207 131 38.8 66.8 14.2 73 1.00
Ni �0.21 0.53 0.42 2.6 0.38 0.08 1.00
Cu 3.8 11.1 F 2.0 0.74 1.2 1.02
Zn F 39.8 14.3 41.3 27.4 3.5 1.00
Pb �2.7 19.6 7.1 13.1 6.5 �0.73 0.98
a PM2.5: fine mode particulate matter; BC: black carbon.b Concentration in (mg m�3).
A.D.A. Castanho, P. Artaxo / Atmospheric Environment 35 (2001) 4889–4902 4899
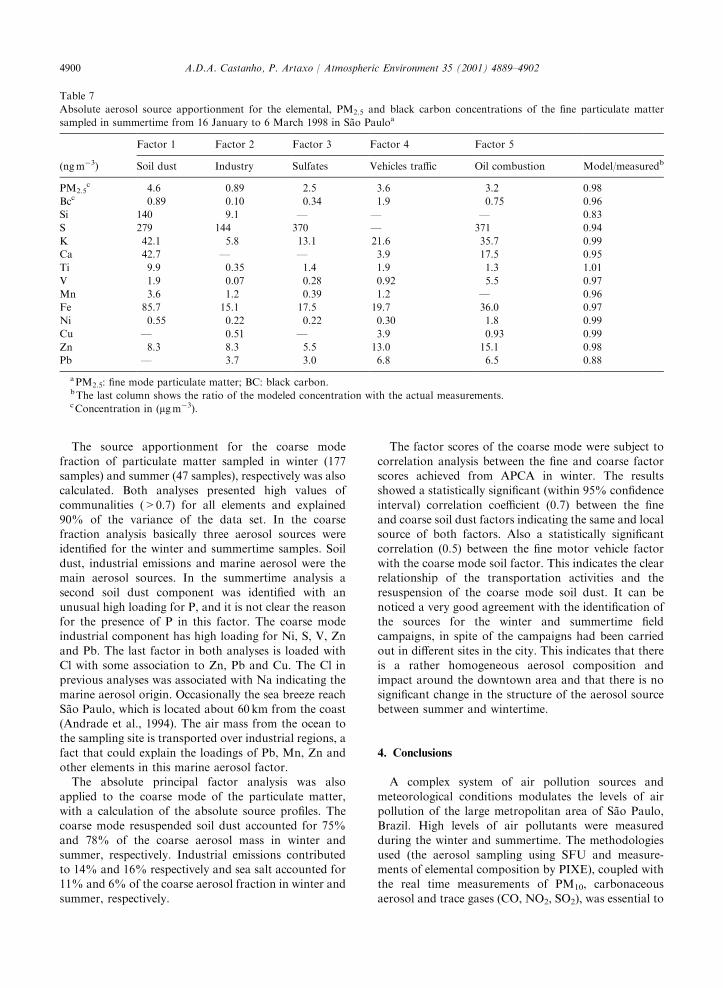
The source apportionment for the coarse mode
fraction of particulate matter sampled in winter (177samples) and summer (47 samples), respectively was alsocalculated. Both analyses presented high values of
communalities (>0.7) for all elements and explained90% of the variance of the data set. In the coarsefraction analysis basically three aerosol sources wereidentified for the winter and summertime samples. Soil
dust, industrial emissions and marine aerosol were themain aerosol sources. In the summertime analysis asecond soil dust component was identified with an
unusual high loading for P, and it is not clear the reasonfor the presence of P in this factor. The coarse modeindustrial component has high loading for Ni, S, V, Zn
and Pb. The last factor in both analyses is loaded withCl with some association to Zn, Pb and Cu. The Cl inprevious analyses was associated with Na indicating the
marine aerosol origin. Occasionally the sea breeze reachS*ao Paulo, which is located about 60 km from the coast(Andrade et al., 1994). The air mass from the ocean tothe sampling site is transported over industrial regions, a
fact that could explain the loadings of Pb, Mn, Zn andother elements in this marine aerosol factor.
The absolute principal factor analysis was also
applied to the coarse mode of the particulate matter,with a calculation of the absolute source profiles. Thecoarse mode resuspended soil dust accounted for 75%
and 78% of the coarse aerosol mass in winter andsummer, respectively. Industrial emissions contributedto 14% and 16% respectively and sea salt accounted for11% and 6% of the coarse aerosol fraction in winter and
summer, respectively.
The factor scores of the coarse mode were subject to
correlation analysis between the fine and coarse factorscores achieved from APCA in winter. The resultsshowed a statistically significant (within 95% confidence
interval) correlation coefficient (0.7) between the fineand coarse soil dust factors indicating the same and localsource of both factors. Also a statistically significantcorrelation (0.5) between the fine motor vehicle factor
with the coarse mode soil factor. This indicates the clearrelationship of the transportation activities and theresuspension of the coarse mode soil dust. It can be
noticed a very good agreement with the identification ofthe sources for the winter and summertime fieldcampaigns, in spite of the campaigns had been carried
out in different sites in the city. This indicates that thereis a rather homogeneous aerosol composition andimpact around the downtown area and that there is no
significant change in the structure of the aerosol sourcebetween summer and wintertime.
4. Conclusions
A complex system of air pollution sources and
meteorological conditions modulates the levels of airpollution of the large metropolitan area of S*ao Paulo,Brazil. High levels of air pollutants were measured
during the winter and summertime. The methodologiesused (the aerosol sampling using SFU and measure-ments of elemental composition by PIXE), coupled with
the real time measurements of PM10, carbonaceousaerosol and trace gases (CO, NO2, SO2), was essential to
Table 7
Absolute aerosol source apportionment for the elemental, PM2.5 and black carbon concentrations of the fine particulate matter
sampled in summertime from 16 January to 6 March 1998 in S*ao Pauloa
Factor 1 Factor 2 Factor 3 Factor 4 Factor 5
(ng m�3) Soil dust Industry Sulfates Vehicles traffic Oil combustion Model/measuredb
PM2.5c 4.6 0.89 2.5 3.6 3.2 0.98
Bcc 0.89 0.10 0.34 1.9 0.75 0.96
Si 140 9.1 F F F 0.83
S 279 144 370 F 371 0.94
K 42.1 5.8 13.1 21.6 35.7 0.99
Ca 42.7 F F 3.9 17.5 0.95
Ti 9.9 0.35 1.4 1.9 1.3 1.01
V 1.9 0.07 0.28 0.92 5.5 0.97
Mn 3.6 1.2 0.39 1.2 F 0.96
Fe 85.7 15.1 17.5 19.7 36.0 0.97
Ni 0.55 0.22 0.22 0.30 1.8 0.99
Cu F 0.51 F 3.9 0.93 0.99
Zn 8.3 8.3 5.5 13.0 15.1 0.98
Pb F 3.7 3.0 6.8 6.5 0.88
a PM2.5: fine mode particulate matter; BC: black carbon.b The last column shows the ratio of the modeled concentration with the actual measurements.c Concentration in (mg m�3).
A.D.A. Castanho, P. Artaxo / Atmospheric Environment 35 (2001) 4889–49024900
assist in the identifications and quantification of themain air pollution sources. It was possible to quantify
the contribution of the motor vehicles that is animportant source of air pollution in several LatinAmerican cities such as S*ao Paulo, Santiago and Mexico
City. The motor vehicle emissions represented 28% and24% of the PM2.5 for winter and summer, respectively.Resuspended soil dust accounted for 25% and 30%, andthis factor is also related to vehicle traffic. The oil
combustion source represented 18% and 21%. Sulfatesaccounts for 23% and 17% and finally industrialemissions contributed with 5% and 6% of PM2.5, for
winter and summer, respectively. The resuspended soildust accounted for a large fraction (75–78%) of thecoarse mode aerosol mass. The set of tools used in this
study identified the responsibility of the motor vehiclesfor the direct emission of several gases and particulatepollutants and for the resuspension of soil dust. The
results of APFA for the winter and summertime fieldcampaigns, pointed that there is no significant change inthe structure of the aerosol sources for both periods. Themain difference between winter and summer periods is in
the absolute concentration of the particulate mass that issignificantly higher during the winter, when the condi-tions for dispersion of the pollutants are frequently more
unfavorable. The meteorological conditions presentedsignificant responsibility in the process of accumulationor dispersion of pollutants during the day through the
variability of the boundary layer height. The movementsof large-scale synoptic systems also are an importantcomponent of the air pollution pattern over the S*aoPaulo metropolitan area. The analyses of the particulate
mass balance showed that the OC (40716%) represent alarge fraction of the fine particulate matter, followed byBC (2174%), sulfates (20710%) and the soil compo-
nent (1272%). The sampling campaigns carried out inthe winter and summer periods resulted in similaraerosol source apportionments despite the fact that they
were carried out in two different sampling sites. This factindicates the similarity of the aerosol sources in theurban area in S*ao Paulo, and the robust characteristic of
the methodologies used in this study.
Acknowledgements
We thank Alcides C. Ribeiro, Ana Lucia Loureiroand Tarsis Germano for assistance in sample collection
and analyses. We acknowledge the meteorologicalsupport provided by Pedro Silva Dias, F!atima Andrade,Art#emio Plana Fattori and Maria Assun-c*ao Faus da
Silva Dias. We also thank CETESB for providing thetrace gas measurements. The assistance during the PIXEanalysis by the LAMFI staff is acknowledged. We thank
one reviewer for very valuable comments and contribu-tions work was financed by FAPESP (Funda-c*ao de
Amparo "a Pesquisa do Estado de S*ao Paulo) throughgrants numbers 97/00844–0, 94/0552–0, 96/1403–4, 99/
12493–2.
References
Andrade, M.F., Orsini, C., Maenhaut, W., 1994. Relation
between aerosol sources and meteorological parameters for
inhalable atmospheric particles in S*ao Paulo city, Brazil.
Atmospheric Environment 28 (14), 2307–2315.
Artaxo, P., Castanho, A.D.A., 1998. Aerosol concentrations
and source apportionment in the urban area of S*ao Paulo,
Brazil. IAEA (International Atomic Energy Agency), TEC
DOC series.
Artaxo, P., Orsini, C., 1987. PIXE and receptor models applied
to remote aerosol source apportionment in Brazil. Nuclear
Instruments and Methods in Physics Research B 22, 259–
263.
Artaxo, P., Castro, W.E., Freitas, M., Longo, K.M., 1995.
Receptor modeling of atmospheric aerosols in the urban
area of S*ao Paulo. In: Applied Research on Air Pollution
Using Nuclear-Related Analytical Techniques. IAEA (In-
ternational Atomic Energy Agency). Publication NAHRES-
26, 5–1, pp. 5–11.
Artaxo, P., Castanho, A.D.A., Yamasoe, M.A., Martins, J.V.,
Longo, K.M., 1999a. Analysis of atmospheric aerosols by
PIXE: the importance of real time and complementary
measurements. Nuclear Instruments and Methods in
Physics Research B 150, 312–321.
Artaxo, P., Oyola, P., Martinez, R., 1999b. Aerosol composi-
tion and source apportionment in Santiago de Chile.
Nuclear Instruments and Methods in Physics Research B
150, 409–416.
Ayers, G.P., Keywood, M.D., Gras, J.L., 1999. Teom vs
manual gravimetric methods for determination of PM2.5
aerosol mass concentration in urban Australia. Atmo-
spheric Environment (Technical Note) 33 (22), 3717–3721.
Campbell, J.L., 1995. Instrumentation, fundamentals, and
quantification. In: Johansson, S.E., Campbell, J.L., Mal-
mqvist, K.G. (Eds.), Particle Induced X-ray Emission
Spectrometry. Wiley, New York, pp. 19–99.
CETESB, 1998. Relat !orio de Opera-c*ao Inverno 1997. Report
CETESB, S*ao Paulo, in Portuguese. Available at www.
cetesb.sp.gov.br.
Chow, J.C., Watson, J.G., Lu, Z., 1996. Descriptive analysis of
PM2.5 and PM10 at regionally representative locations
during SJVAQS/AUSPEX. Atmospheric Environment 30
(12), 2079–2112.
Hansen, A.D.A., Rosen, H., Novakov, T., 1984. The aethalo-
meterFan instrument for the real-time measurement of
optical absorption by aerosol particles. Science of the Total
Environment 36, 191–196.
Henry, R.C., 1991. Multivariate receptor models. In: Hopke,
P.K. (Ed.), Receptor Modeling for Air Quality Manage-
ment. Elsevier, Amsterdam, pp. 117–147.
Hopke, P.K., 1991. Receptor Modeling for Air Quality
Management. Elsevier, Amsterdam.
Hopke, P.K., Xie, Y., Raunema, T., Biegalski, S., Landsberger,
S., Maenhaut, W., Artaxo, P., Cohen, D., 1997. Character-
A.D.A. Castanho, P. Artaxo / Atmospheric Environment 35 (2001) 4889–4902 4901
ization of the gent stacked filter unit PM10 sampler. Aerosol
Science and Technology 27, 726–735.
John, W., Hering, S., Reischl, Sasaki, G., 1983. Characteristics
of nuclepore filters with large pore size, II, filtration
properties. Atmospheric Environment 17, 373–382.
Macchione, M., Oliveira, A.P., Gallafrio, C.T., Much*ao, F.P.,
Obara, M.T., Guimar*aes, E.T., Artaxo, P., King, M.,
Lorenzi-Filho, G., Junqueira, V.C.B., Saldiva, P.H.N.,
1999. Acute effects of inhalable particles on the frog palate
mucociliary epithelium. Environmental Health Perspectives
107 (10), 829–833.
Meyer, M., Lijek, J., Ono, D., 1992. Continuous PM10
measurements in a wood smoke environment. In: Chow
J.C., Ono, M. (Eds.), PM10 Standards and National
Particulate Source Controls, Vol. 1. Air Waste Management
Association, TR-22, pp. 24–38.
Miranda, J., Su!arez, A.L., Guti!errez, R.P., Gonz!alez, S., Lucio,
O.G., Andrade, E., Morales, J.R., Sobarzo, M.J.A., 1998. A
study of atmospheric aerosols from five sites in Mexico city
using PIXE. Nuclear Instruments and Methods in Physics
Research B 136–138, 970–974.
Orsini, C., Artaxo, P., Tabacniks, M., 1984. The S*ao Paulo
PIXE system and its use on a national monitoring air
quality program. Nuclear Instruments and Methods in
Physics Research 231, 462–465.
Orsini, C., Tabacniks, M., Artaxo, P., Andrade, M.F., Kerr,
A.S., 1986. Characteristics of fine and coarse particles of
natural and urban aerosols of Brazil. Atmospheric Envir-
onment 20, 2259–2269.
Puri, E.S.S., Hansson, H.C., Edner, H., 1996. Urban air
pollution source apportionment using a combination of
aerosol and gas monitoring techniques. Atmospheric
Environment 30 (15), 2795–2809.
Reid, J.S., Hobbs, P.V., Liousse, C., Martins, J.V., Weiss, R.E.,
Eck, T.F., 1998. Comparison of techniques for measuring
short-wave absorption and black carbon content of aerosol
from biomass burning in Brazil. Journal of Geophysical
Research 103 (D24), 32031–32040.
Rojas, C.M., Artaxo, P., Van Grieken, R., 1990. Aerosols in
Santiago de Chile: a study using receptor modeling with
X-ray fluorescence and single particle analysis. Atmospheric
Environment 24B, 227–241.
Saldiva, P.H.N., Pope, C.A., Schwartz, J., Dockery, D.W.,
Lichtenfels, A.J., Salge, J.M., Barone, I., Bohm, G.M.,
1995. Air pollution and mortality in elderly people: a time-
series study in S*ao Paulo, Brazil. Archives Environmental
Health 50, 159–163.
Schwartz, J., 1994. Air pollution and daily mortality: a review
and meta analysis. Environmental Research 64, 36–52.
Seinfeld, J.H., Pandis, S.N., 1998. Atmospheric Chemistry and
PhysicsFfrom Air Pollution to Climate Change. New
York, USA, Wiley.
Spektor, D., Hofmeister, V.A., Artaxo, P., Braga, J.A.P.,
Echalar, F., Nogueira, D.P., Hayes, G., Thurston, M.,
Lippmann, 1991. Effects of heavy industrial pollution on
respiratory function in the children of Cubat*ao, Brazil: a
preliminary report. Environmental Health Perspectives 94,
51–54.
Soutar, A., Watt, M., Cherrie, J.W., Seaton, A., 1999.
Comparison between a personal PM10 sampling head and
the tapered element oscillating microbalance (TEOM)
system. Atmospheric Environment 33, 3373–4377.
Stull, R.B., 1991. An Introduction to Boundary Layer Meteo-
rology. Kluwer Academic Publishers, Boston, pp. 2–26.
Sweet, C.W., Gatz, D.F., 1998. Short communication summary
and analysis of available PM2.5 measurements in Illinois.
Atmospheric Environment 32 (6), 1129–1133.
Tabacniks, M., Orsini, C., Artaxo, P., 1987. PIXE analysis for
air pollution source apportionment in urban areas of Brazil.
Nuclear Instruments and Methods in Physics Research B
22, 315–318.
Thurston, G.D., Spengler, J.D., 1985. A quantitative assess-
ment of source contributions to inhalable particulate matter
pollution in metropolitan Boston. Atmospheric Environ-
ment 19 (1), 9–25.
Watson, J.G., Chow, J.C., Lowenthal, D.H., Pritchett, L.C.,
Frazier, C.A., 1994. Differences in the carbon composition
of source profiles for diesel and gasoline powered vehicles.
Atmospheric Environment 28 (15), 2493–2505.
A.D.A. Castanho, P. Artaxo / Atmospheric Environment 35 (2001) 4889–49024902
Related Documents


