Thesis for the Degree of Doctor of Philosophy Winter Road Conditions and Traffic Accidents in Sweden and UK Present and Future Climate Scenarios Anna K. Andersson FACULTY OF SCIENCE Doctoral thesis A131 University of Gothenburg Department of Earth Sciences, Physical Geography Gothenburg, Sweden 2010

Welcome message from author
This document is posted to help you gain knowledge. Please leave a comment to let me know what you think about it! Share it to your friends and learn new things together.
Transcript

Thesis for the Degree of Doctor of Philosophy
Winter Road Conditions and Traffic Accidents in Sweden and UK
Present and Future Climate Scenarios
Anna K. Andersson
FACULTY OF SCIENCE
Doctoral thesis A131 University of Gothenburg
Department of Earth Sciences, Physical Geography Gothenburg, Sweden 2010

II Anna K. Andersson
Anna K. Andersson Winter Road Conditions and Traffic Accidents in Sweden and UK – Present and Future Climate Scenarios A131 2010 ISBN: 978-91-628-7996-9 ISSN: 1400-3813 http://hdl.handle.net/2077/21547 Copyright © Anna K. Andersson, 2010 Printed by Chalmers Reproservice Distribution: Department of Earth Sciences, University of Gothenburg, Sweden

III Winter Road Conditions and Traffic Accidents – Present and Future Climate Scenarios
Abstract
This thesis investigates the distribution of slippery roads in Sweden and the UK for the present climate and how this may be affected by climate change for the rest of the century. It also addresses future scenarios for traffic accidents and winter road maintenance. The purpose of this thesis is to get a better understanding of winter road conditions and relationships to motor vehicle accidents. A variety of scales are studied in this thesis ranging from nationwide studies in Sweden to smaller scale case studies in Sweden and the UK. The Swedish Road Weather Information System (RWIS) is one of the most extensive in the world with a total of 720 outstations. Air and road surface temperatures are measured at each outstation along with relative humidity, precipitation and wind. In this thesis four different types of slipperiness are considered: Slippery conditions due to moderate hoarfrost (HR1), severe hoarfrost (HR2), road icing (HT) and rain or sleet on a cold road (HN). These four slipperiness types can be combined to form a winter index (WI). However, other types of precipitation are studied where appropriate. Four papers are included in this thesis. The first aims of these papers include an analysis of the geographical distribution of different slipperiness types in Sweden and how these different types of slipperiness relate to traffic accidents. Further on the impact of climate change on road surface temperatures is also considered and in particular, what impact a changing climate would have on the number of traffic accidents, both in the Gothenburg area, Sweden and West Midlands, UK. In Sweden, the frequency of occasions with road slipperiness increases towards the north, with the exception for the slipperiness type road icing (HT), which actually decrease towards the north. When a mild winter was compared to a winter with a temperature marginally warmer than the baseline winter (1961-1990), slippery roads caused more accidents in the mild winter where as snow was the cause of most accidents in the colder winter. Climate change scenarios show that the number of days with temperatures below zero degrees will gradually decrease over the next century. By the 2080s (2070-2100), there will be a 22% reduction of the number of days in the Gothenburg area (Sweden) and a 48% reduction in the Birmingham area (UK). By using derived statistical relationships with traffic accidents, this translates to a theoretical reduction in the number of accidents occurring when the temperature is below zero degrees by 20% respectively 43%. Winter maintenance costs are likely to be reduced by at least 15% in the Gothenburg area until the 2080s. This can be compared with a decline of 38% per annum in the Birmingham area. There may be a disadvantage with a warming climate at least when considering accidents. Since the temperature is rising the number of days with temperatures above zero degrees increases quite rapidly until 2080s. If the ratio between accidents and number of days at each degree will remain unchanged there will be an increase in the number of traffic accidents with as much as 88% at temperatures above zero degrees. Despite this great increase, the total amount of accidents will only increase by 2%. Keywords: Winter road condition, Slipperiness, Traffic accident, Winter road maintenance, Climate change

IV Anna K. Andersson

V Winter Road Conditions and Traffic Accidents – Present and Future Climate Scenarios
Till Simon & Alva
Publisher: Methuen & co. Ltd.

VI Anna K. Andersson
VII Winter Road Conditions and Traffic Accidents – Present and Future Climate Scenarios
List of Publications
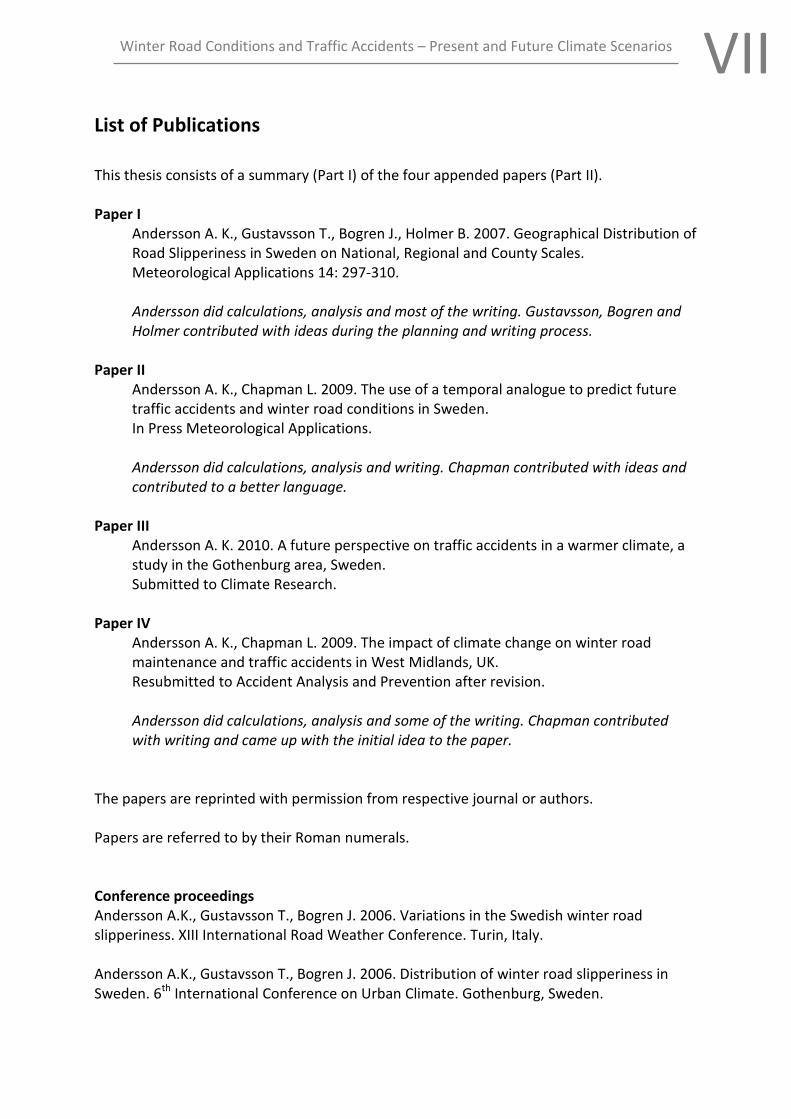
This thesis consists of a summary (Part I) of the four appended papers (Part II). Paper I
Andersson A. K., Gustavsson T., Bogren J., Holmer B. 2007. Geographical Distribution of Road Slipperiness in Sweden on National, Regional and County Scales. Meteorological Applications 14: 297-310.
Andersson did calculations, analysis and most of the writing. Gustavsson, Bogren and Holmer contributed with ideas during the planning and writing process.
Paper II Andersson A. K., Chapman L. 2009. The use of a temporal analogue to predict future traffic accidents and winter road conditions in Sweden. In Press Meteorological Applications. Andersson did calculations, analysis and writing. Chapman contributed with ideas and contributed to a better language.
Paper III
Andersson A. K. 2010. A future perspective on traffic accidents in a warmer climate, a study in the Gothenburg area, Sweden. Submitted to Climate Research.
Paper IV
Andersson A. K., Chapman L. 2009. The impact of climate change on winter road maintenance and traffic accidents in West Midlands, UK. Resubmitted to Accident Analysis and Prevention after revision. Andersson did calculations, analysis and some of the writing. Chapman contributed with writing and came up with the initial idea to the paper.
The papers are reprinted with permission from respective journal or authors. Papers are referred to by their Roman numerals. Conference proceedings Andersson A.K., Gustavsson T., Bogren J. 2006. Variations in the Swedish winter road slipperiness. XIII International Road Weather Conference. Turin, Italy. Andersson A.K., Gustavsson T., Bogren J. 2006. Distribution of winter road slipperiness in Sweden. 6th International Conference on Urban Climate. Gothenburg, Sweden.
VIII Anna K. Andersson
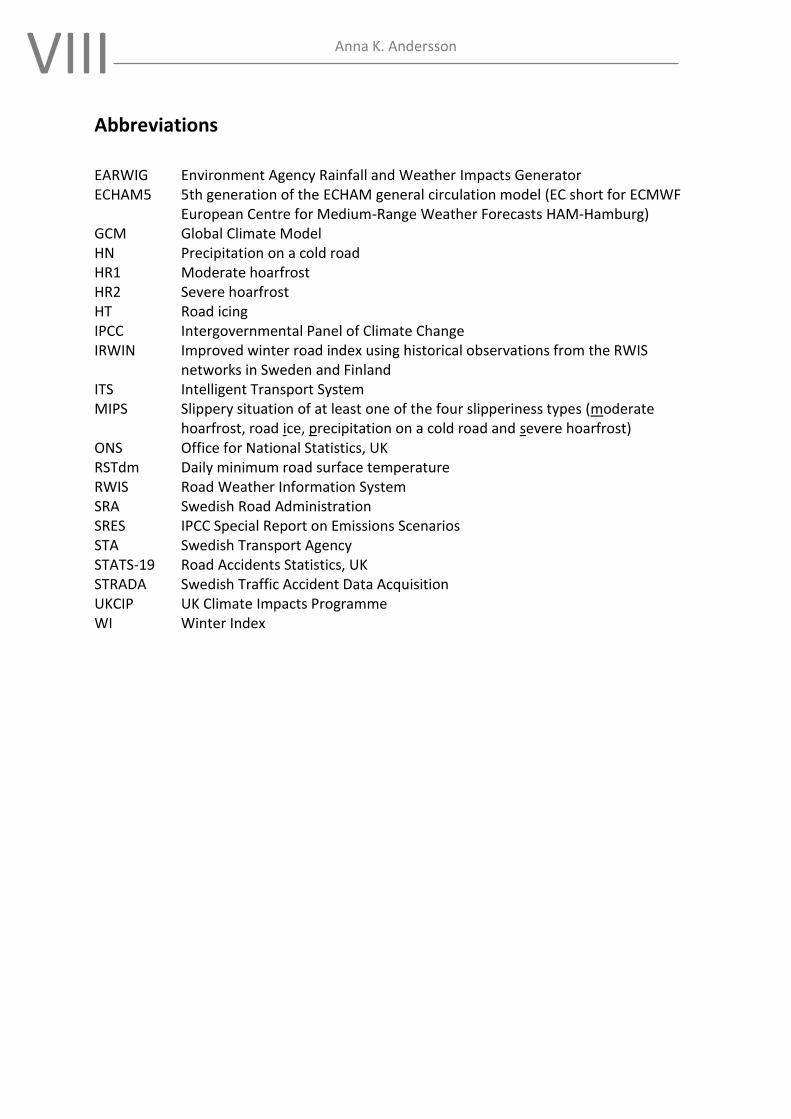
Abbreviations
EARWIG Environment Agency Rainfall and Weather Impacts Generator ECHAM5 5th generation of the ECHAM general circulation model (EC short for ECMWF
European Centre for Medium-Range Weather Forecasts HAM-Hamburg) GCM Global Climate Model HN Precipitation on a cold road HR1 Moderate hoarfrost HR2 Severe hoarfrost HT Road icing IPCC Intergovernmental Panel of Climate Change IRWIN Improved winter road index using historical observations from the RWIS
networks in Sweden and Finland ITS Intelligent Transport System MIPS Slippery situation of at least one of the four slipperiness types (moderate
hoarfrost, road ice, precipitation on a cold road and severe hoarfrost) ONS Office for National Statistics, UK RSTdm Daily minimum road surface temperature RWIS Road Weather Information System SRA Swedish Road Administration SRES IPCC Special Report on Emissions Scenarios STA Swedish Transport Agency STATS-19 Road Accidents Statistics, UK STRADA Swedish Traffic Accident Data Acquisition UKCIP UK Climate Impacts Programme WI Winter Index

IX Winter Road Conditions and Traffic Accidents – Present and Future Climate Scenarios
Contents
Abstract III List of Publications VII Abbreviations VIII
PART I SUMMARY
1. Introduction 3
2. Data and Methodology 6
2.1 Study areas 6 2.2 Road weather – RWIS 7 2.3 Winter road conditions 7 2.4 Future climate change 8 2.5 Weather generators 9 2.6 Traffic accidents 10
3. Results 11 3.1 Distribution of slipperiness in different scales 11 3.2 Traffic accidents and winter road conditions in Sweden 12 3.3 Climate change impact on traffic accidents in Gothenburg, Sweden 15 3.4 Climate change impacts on winter maintenance and accidents in West Midlands, UK 19 3.5 Summary of results 21
4. Conclusions 23
5. Reflections of future road climatology 25
Acknowledgements 26
References 28
PART II PAPERS


Part I
Summary
“Don't knock the weather. If it didn't change once in a while,
nine out of ten people couldn't start a conversation.” Kin Hubbard (1868 - 1930)

2 Anna K. Andersson

3 Winter Road Conditions and Traffic Accidents – Present and Future Climate Scenarios
1. Introduction
The first car crash was in 1771 when Nicolas-Joseph Cugnot collided with the Arsenal Wall in Paris. In the beginning of the last century, motor driven vehicles became more and more common (S.I.A, 2009). On the 31st August 1896, Mary Ward became the first person to be killed in a traffic accident, when she fell out of her cousins’ car and was run over (IU, 2009). Although Sweden has one of the world’s lowest numbers of fatal traffic accidents, the Swedish parliament works towards a decrease in the number of accidents. Hence, in 1997 a treaty was ratified that there should be no fatalities or serious injuries in road traffic. One of the intermediate goals was to reduce traffic deaths by 50% by the year 2007 compared with 1996. In 2007 there were 471 persons killed, significantly over the target of 270 persons. In May 2009 new intermediate goals were set by the government. One goal is to reduce the number of persons killed in traffic by 50% from 2007 to 2020, so that in 2020 no more than 220 people would be killed. The number of seriously injured should also be reduced by 25% in the same time frame (VV, 2009). The British government has a similar aim to reduce casualties (killed or seriously injured) on the roads in Great Britain by 40% in the year of 2010 compared with the average for 1994-1998, the aim for children casualties was a 50% reduction (Department for Transport, 2009a). When 2008 was analysed, the number of people seriously injured or killed was 40% less than the average in 1994-1998 and for children the reduction was 59% (Department for Transport, 2009b). The difference between the two countries in achieving their aims can depend on many factors. For example, the nature of preventive measures before and during the campaign. The traffic density also differs between the two countries. Indeed, in 2007, 2946 people were killed in road traffic accidents in the UK compared to just 471 in Sweden (Department for Transport, 2009a). There have been many previous studies on winter road conditions (e.g. Lindqvist, 1975; Bogren and Gustavsson, 1989; Thornes, 1991). There are also many studies linking traffic accidents and road conditions (e.g. Codling, 1974; Smith, 1982; Palutikof, 1991; Edwards, 1996). 40% of the traffic accidents in Edmonton, Canada, which occur during the winter months, are on roads with ice/snow or rain (Andrey and Olley, 1990). These accidents are often caused by a combination of precipitation and associated poor visibility which increases in winter (Fridström et al., 1995; Edwards, 1999) and peaks in December (Asano and Hirasawa, 2003). Bad weather makes motorists drive more slowly (Hassan & Barker, 1999), as they reduce their speed, even though not by much, to adjust for worsening weather and conditions. For example, Kilpeläinen and Summala (2007) found that average traffic flow speed was reduced by 6.7% in bad weather. In wet and slushy conditions, the reduction can be as high as 25% (Martin et al., 2000 cited in Koetse & Rietveld, 2009). Lindqvist (1979) was one of the first to study the road climate in Sweden. He identified 24 types of slipperiness of varying severity, which were later reduced to ten (Norrman, 2000). Of the ten different types of slipperiness, precipitation on an already frozen surface had the

4 Anna K. Andersson
highest accident risk. 52% of traffic accidents were caused by a reduction of road friction according to a study of Bogren et al. (2006). Rain has been shown to be a major factor causing traffic accidents (Brodsky and Hakkert, 1988; Andrey and Yagar, 1993; Fridström et al., 1995; Levine et al. 1995; Andreescu and Frost, 1998). Indeed, some studies show a doubling of the accident rate during rainfall (Bertness, 1980; Brodsky and Hakkert, 1988). There are also positive results, Andrey (2009) found that the rain-related traffic accidents have decreased with approximately 60% between 1984 and 2002 on the roads of Canadian cities. Snow is often a cause of traffic chaos (e.g. Thornes, 2005; London Assembly, 2009). When there is snowfall, the risk for an accident is increased (Andreescu & Frost, 1998; Suggett, 1999; Norrman et al. 2000; Eisenberg and Warner, 2005). The impact varies considerably from study to study, Smith (1982) found an increase of just 2.2%, whilst other studies have found a doubling in the accident rate (Codling, 1974; Andreescu and Frost, 1998; Suggett, 1999). In the UK, 2.8% of all traffic accidents are caused by snow (Edwards 1999), but in some parts of the country it is higher with the highest percentage in northeast England (5.9%) (Edwards, 1996). Some studies also show that snow can contribute to a decrease in the amount of accidents (Fridström et al., 1995) or at least diminish the outcome of the accidents (Koetse & Rietveld, 2009). In many cases, this can be explained by the effects of snow and ice influencing drivers behaviour. The results are postponed leisure trips as travel is restricted to essential journeys when driving conditions are poor (Smith, 1982; Palutikof, 1983; Parry, 2000; Kilpeläinen and Summala, 2007). Road surfaces are the most slippery when the temperature is close to zero degrees (Moore, 1975). However, Campbell (1986) found that there were more accidents in Winnipeg, Canada, when the temperature was below -15°C than in the temperature range -15°C to 0°C. It is not only snow, ice, rainfall, wind, fog or low sun that can be a contributory factor for traffic accidents, even hot temperatures (>34°C) have shown to be a contributing factor in Saudi Arabia (Nofal and Saeed, 1997). Other factors can also affect driving, for instance sudden illnesses (Lam and Lam, 2005) or drink driving (Meyhew et al., 1986; Horwood and Fergusson, 2000; Evans, 2004). Perhaps even superstition can play a role as the cause of an accident, Näyhä (2002) found that there was an increase in the amount of fatal accidents on Friday 13th for women by 1.63 compared with other Fridays, the corresponding number for men was 1.02. Fatal accidents among female drivers occurred most often in the temperature interval -3°C to 1°C that coincides when slippery roads occur. The number of accidents on roads is reduced significantly by expensive winter road maintenance strategies. The most common ways to perform winter road maintenance are salting as a preventive measure or snow clearance by ploughing. The cost for winter maintenance varies from country to country. In Finland the annual cost is €100 million (Venäläinen and Kangas, 2003), where as in Sweden the total cost for 2005 was €207 million (VV, 2006). The UK spends £482 million (€538m 30/10/09) on the primary road network, plus a further £1069 million (€1193m 30/10/09) on local roads (Department for Transport, 2009). However, more efficient practices are greatly reducing the associated costs. For example, in the winter of 1993-1994 salt consumption in Sweden was 420 000 tonnes, this

5 Winter Road Conditions and Traffic Accidents – Present and Future Climate Scenarios
has been reduced and in the winter of 2007-2008 just 184 000 tonnes were used (VV, 1999; VV, 2009a). By comparison, the UK uses 2 million tonnes of rock salt in an average winter (Salt Union, 2009). These numbers are highly variable and depend on the severity of the winter season. For example, Changnon and Changnon (2005) found that in a mild winter the cost for ploughing and salting was reduced by 65–80% compared with a winter with normal conditions in USA. It is hypothesised that climate change will see such reductions become the norm. Indeed, an increasing focus on climate change is becoming evident with studies starting to appear documenting the impact of a changing climate on the winter road conditions (Venäläinen and Kangas, 2003; Carmichael et al., 2004; Scottish Road Network, 2005).
Aim of the thesis The overall aim of this thesis is to achieve a better understanding of current and future winter road conditions and associated relationships with traffic accidents. The first study is about the distribution of slipperiness on the Swedish winter roads in different scales, this was done to analyse if there were any differences in the slipperiness types across Sweden during five winters (Paper I). The second study continues the analysis of the winter road conditions in Sweden but in relation to traffic accidents. Two winters with fairly different weather is compared (Paper II). The third study also deals with traffic accidents in Sweden, but this study has a future aspect to it to analyse how a changing climate can affect winter road conditions and traffic accidents in the Gothenburg area (Paper III). The final paper is a study of the relationship between traffic accidents and air temperatures with respect to climate change in the West Midlands, UK (Paper IV). The specific aims in this thesis are:
• Investigate if there are any particular geographical patterns in the distribution of slipperiness on the Swedish winter roads in three different scales, national, regional and county. (Paper I)
• Analyse how weather influences the traffic accidents on Swedish winter roads. (Paper II)
• Analyse the impact climate change have on road surface temperatures in the Gothenburg area, Sweden, and the effect it can have on traffic accidents. (Paper III)
• Study how traffic accidents across the West Midlands, UK, in the winter might change with climate change and to determine how the number of days requiring winter road maintenance may change in the future. (Paper IV)

6 Anna K. Andersson
2. Data and Methodology
Several sources of data have been used in this thesis, in this chapter the different sources will be presented and discussed.
2.1 Study areas The majority of this thesis studies different parts in Sweden except for Paper IV that focuses on an area of the English Midlands.
Sweden The study areas in Paper I, II and III are all in Sweden. Paper I, was a study of geographical patterns in Sweden divided into three different scales. The first scale was national where Sweden was divided into seven regions. Next, the paper focuses on a specific region (Region Väst) and finally looks in detail at one of the counties in the southern part of Region Väst, Halland (Figure 1). In paper II the same seven national regions were used, with a focus on the Region Skåne and the city of Stockholm (darker grey areas, Figure 1). Finally, Paper III analysed an area close to Gothenburg in the southwest of Sweden (area with larger dots, Figure 1). Sweden has a total areal of 449 964 km2 whereof 410 934 km2 are land.
Figure 1. Map of Sweden, divided in seven regions. Region Väst (light grey) with Halland in the south, Region Skåne (grey), Stockholm (dark grey), RWIS outstations (small dots) and RWIS outstations in Gothenburg area (black dots).

7 Winter Road Conditions and Traffic Accidents – Present and Future Climate Scenarios
West Midlands, UK The second largest conurbation in United Kingdom, the county of West Midlands, was chosen as a study area in Paper IV (Figure 2). In the centre of this region lies the second largest city in England, Birmingham. The area of West Midlands is 902 km2 England has a total areal 129 720 km2.
Figure 2. United Kingdom and in zoom West Midlands.
2.2 Road weather – RWIS There are approximately 720 outstations in the Swedish Road Weather Information System (RWIS) (see Figure 1 for the RWIS locations). 200 outstations are equipped with cameras for monitoring the road surface. The outstations collect information about road surface temperature, air temperature, relative humidity, precipitation, and wind speed and wind direction. Additionally, dew-point is calculated from air temperature and relative humidity. Data are collected every 30 minutes during the winter months and stored in a database at the Swedish Road Administration (SRA). The weather data are used for winter maintenance decisions. Data have been collected in this way since the mid-1980s, and from 1992 is the information published on the internet. The main usage for the RWIS outstations is to monitor the road weather for the maintenance personnel. It is also more and more used in the intelligent transport system (ITS) (VV, 2009b).
2.3 Winter road conditions Throughout this thesis there have been calculations of the slipperiness on winter roads. Four types of slipperiness have been focussed on, which are the four types originally developed by the Swedish Road Administration (Möller, 2002) to help them determine their need for maintenance activities. The definitions for the four types of slipperiness are:

8 Anna K. Andersson
Slippery conditions due to moderate hoarfrost (HR1) HR1 often occurs as a result of radiative cooling in the evening/night or turbulence induced mixing of an inversion layer in the morning. The road surface temperature should be between 0.5°C and 2.0°C lower than the dew-point temperature of the air.
Slippery conditions due to severe hoarfrost (HR2) HR2 is, in general, the result of advecting warm and moist air. The road surface temperature should be at least 2.0°C lower than the dew-point temperature.
Slippery conditions due to road icing (HT) For an HT situation, the road must first be moist/wet due to rain/sleet, melting snow or condensation of dew after which the temperature drops below +1.0°C which then results in a freezing road surface.
Slippery conditions due to rain or sleet on a cold road (HN) A HN situation arises when rain or sleet falls onto a cold surface; a cold surface is defined as a road surface below +1.0°C. In Paper I, the road surface temperature was set to be lower than +1.0°C for all four types of slipperiness, which followed SRAs definition for their decisions regarding winter maintenance activities, +1°C is used as a safety margin to account for any inaccuracy of the sensors. This was changed to 0°C in Paper II to get more real values for slipperiness. A more complete definition of the four types can be read in Paper I or in Möller (2002). Paper I used a winter index (WI) based on the number of occurrences of the four types of slipperiness. WI = HR1 + HR2 + HT + HN (1) In Paper II, a slightly modified version of slipperiness types was used. When there was a situation with at least one of the four types it was referred to as MIPS (MIPS is an abbreviation of the four types of slipperiness, Moderate hoarfrost, road Ice, Precipitation on cold road and Severe hoarfrost). This study also considered other precipitations and road conditions: Rain, Freezing rain, Snow, Sleet or the combination of MIPS or Snow. In Paper III and Paper IV the daily minimum road surface temperature and daily minimum air temperature was used instead of the different slipperiness types.
2.4 Future climate change The eleven warmest years globally since the weather recording started (≈1850) were between 1995 and 2006. There has been a trend of changing precipitation patterns in many

9 Winter Road Conditions and Traffic Accidents – Present and Future Climate Scenarios
regions, the cyclonic activity in North Atlantic has increased and precipitation totals have now increased in northern Europe (IPCC, 2007). If greenhouse gases are not reduced, the global temperature is predicted to rise in the range of 1.1°C to 6.4°C during this century (IPCC, 2007). Over the same period, the Swedish winter air temperature is supposed to increase between 3.8°C and 5.5°C (Räisänen et al. 2003). In UK is the annual average temperature estimated to rise between 2°C to 5°C, with the warming expected to be more in summer than in winter (Met Office, 2009). The IPCC Special Report on Emissions Scenarios (SRES, 2000) present different scenarios, depending on demographics, economics and technological development. In scenario A1 it is assumed that the world will have a population that peaks in the middle of the century, the economy is growing fast and that new and improved technology is introduced in a high pace. The A1 scenario is subdivided in three groups depending on the development in new technologies, if fossil energy is intensified (A1FI) or if it is going to be a non-fossil energy (A1T) or if it is going to be a balance across all sources (A1B). In the A2 scenario the population will have a high growth rate and both economics and changes of technologies are slowly developed.
2.5 Weather generators Weather generators are used to produce time series of stochastic weather data based on the baseline climate (Hutchinson, 1987). Paper III used a model for the calculations of the Swedish road surface temperatures in a future perspective. The model is called IRWIN (for further details Saarikivi et al. 2009) and uses an analogue model for statistical downscaling, which combines historical weather data from the RWIS outstation and the Global Climate Model (GCM) climate change scenario. The GCM is the ECHAM5 which is an atmospheric general circulation model from Max Planck Institute for Meteorology, Hamburg, Germany. To obtain road surface temperature the model takes the weather data in the scenario and compares it with historical data. The model is built on the emission scenario IPCC SRES A1B. IRWIN was used to obtain the road surface temperatures at baseline (November 1970-March 2000) and also for the three future time periods 2020s (N2010-M2040), 2050s (N2040-M2070) and 2080s (N2070-M2100). EARWIG (Environment Agency Rainfall and Weather Impacts Generator), which is based on the UKCIP02 (UK Climate Impacts Programme) scenarios was used in Paper IV. EARWIG uses observed baseline (1961-1990) weather data from the UK Meteorological Office to produce daily weather records, which then can be used to generate probability distributions. EARWIG uses two stochastic models, first a simulation of rainfall, which is used in the second model, which is generating the other variables that are depending on rainfall (see Kilsby et al., 2007 for a full description of the model and application). EARWIG used UKCIP02 medium-high emission scenario derived from the IPCC SRES A2 storyline (Hulme et al., 2002). EARWIG was used to calculate temperature distributions for the baseline scenario and also for the three future time slices, 2020s (2011-2040), 2050s (2041-2070) and 2080s (2071-2100).
10 Anna K. Andersson
2.6 Traffic accidents Swedish Transport Agency’s database, Swedish Traffic Accident Data Acquisition (STRADA), was used for the traffic accident analysis in Paper II & III. The database contains information about accidents obtained from both the police and the emergency units in hospitals. The number of participating hospitals has increased since the beginning in 2003. In June 2009, 71% of the hospitals were connected to STRADA (STA, 2009). For the UK, the Department of Transports database, Road Accidents Statistics (STATS-19) was used in Paper IV. The British accidents are personal injury accidents with vehicles on public highways known to the police within 30 days. The statistics from personal road accidents has been recorded since 1909 and STATS-19 was introduced 1949 and is included on police accident report forms since 1969 (ONS, 2009).
11 Winter Road Conditions and Traffic Accidents – Present and Future Climate Scenarios
3. Results
This chapter is subdivided into four subheadings to summarise the most important results of the four papers.
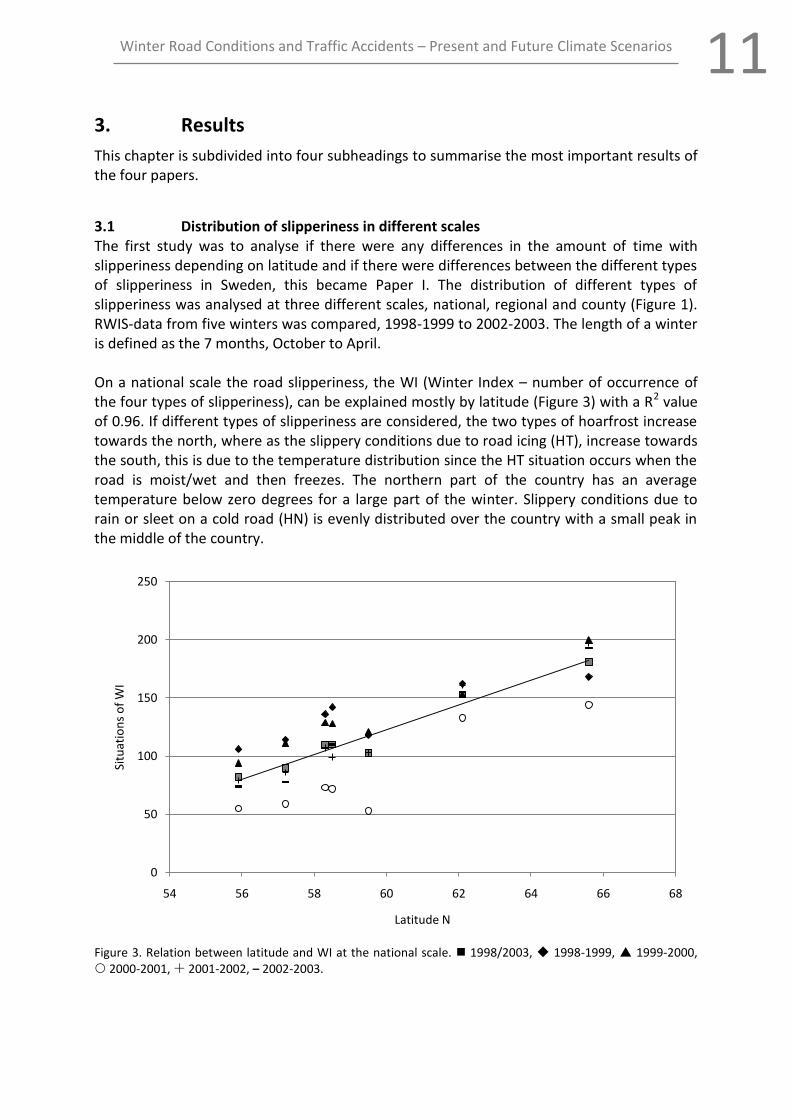
3.1 Distribution of slipperiness in different scales The first study was to analyse if there were any differences in the amount of time with slipperiness depending on latitude and if there were differences between the different types of slipperiness in Sweden, this became Paper I. The distribution of different types of slipperiness was analysed at three different scales, national, regional and county (Figure 1). RWIS-data from five winters was compared, 1998-1999 to 2002-2003. The length of a winter is defined as the 7 months, October to April. On a national scale the road slipperiness, the WI (Winter Index – number of occurrence of the four types of slipperiness), can be explained mostly by latitude (Figure 3) with a R2 value of 0.96. If different types of slipperiness are considered, the two types of hoarfrost increase towards the north, where as the slippery conditions due to road icing (HT), increase towards the south, this is due to the temperature distribution since the HT situation occurs when the road is moist/wet and then freezes. The northern part of the country has an average temperature below zero degrees for a large part of the winter. Slippery conditions due to rain or sleet on a cold road (HN) is evenly distributed over the country with a small peak in the middle of the country.
Figure 3. Relation between latitude and WI at the national scale. 1998/2003, 1998-1999, 1999-2000, 2000-2001, 2001-2002, – 2002-2003.
0
50
100
150
200
250
54 56 58 60 62 64 66 68
Situ
atio
ns
of
WI
Latitude N
12 Anna K. Andersson
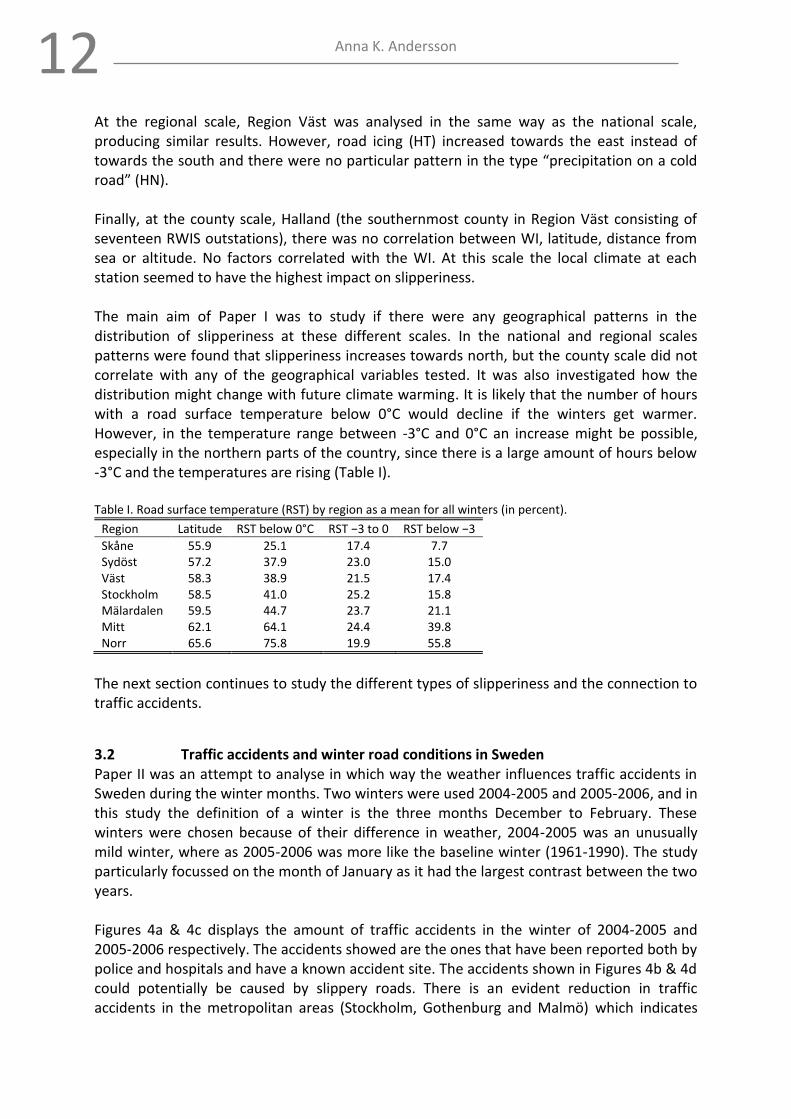
At the regional scale, Region Väst was analysed in the same way as the national scale, producing similar results. However, road icing (HT) increased towards the east instead of towards the south and there were no particular pattern in the type “precipitation on a cold road” (HN). Finally, at the county scale, Halland (the southernmost county in Region Väst consisting of seventeen RWIS outstations), there was no correlation between WI, latitude, distance from sea or altitude. No factors correlated with the WI. At this scale the local climate at each station seemed to have the highest impact on slipperiness. The main aim of Paper I was to study if there were any geographical patterns in the distribution of slipperiness at these different scales. In the national and regional scales patterns were found that slipperiness increases towards north, but the county scale did not correlate with any of the geographical variables tested. It was also investigated how the distribution might change with future climate warming. It is likely that the number of hours with a road surface temperature below 0°C would decline if the winters get warmer. However, in the temperature range between -3°C and 0°C an increase might be possible, especially in the northern parts of the country, since there is a large amount of hours below -3°C and the temperatures are rising (Table I). Table I. Road surface temperature (RST) by region as a mean for all winters (in percent).
Region Latitude RST below 0°C RST −3 to 0 RST below −3
Skåne 55.9 25.1 17.4 7.7 Sydöst 57.2 37.9 23.0 15.0 Väst 58.3 38.9 21.5 17.4 Stockholm 58.5 41.0 25.2 15.8 Mälardalen 59.5 44.7 23.7 21.1 Mitt 62.1 64.1 24.4 39.8 Norr 65.6 75.8 19.9 55.8
The next section continues to study the different types of slipperiness and the connection to traffic accidents.
3.2 Traffic accidents and winter road conditions in Sweden Paper II was an attempt to analyse in which way the weather influences traffic accidents in Sweden during the winter months. Two winters were used 2004-2005 and 2005-2006, and in this study the definition of a winter is the three months December to February. These winters were chosen because of their difference in weather, 2004-2005 was an unusually mild winter, where as 2005-2006 was more like the baseline winter (1961-1990). The study particularly focussed on the month of January as it had the largest contrast between the two years. Figures 4a & 4c displays the amount of traffic accidents in the winter of 2004-2005 and 2005-2006 respectively. The accidents showed are the ones that have been reported both by police and hospitals and have a known accident site. The accidents shown in Figures 4b & 4d could potentially be caused by slippery roads. There is an evident reduction in traffic accidents in the metropolitan areas (Stockholm, Gothenburg and Malmö) which indicates

13 Winter Road Conditions and Traffic Accidents – Present and Future Climate Scenarios
that accidents due to slippery roads are less frequent close to urban areas. A comparison between the number of accidents and the traffic density was completed and showed that the highest ratio of accidents per vehicle was in the least trafficked areas in the northern part of Sweden. Conversely, the highly trafficked area of Stockholm (capital city) had the least accidents per vehicle.
a) b) c) d) Figure 4. a) All traffic accidents in December 2004 to February 2005 b) accidents potentially caused by slipperiness 2004-2005 c) all accidents in 2005-2006 d) potentially caused by slipperiness 2005-2006.
The road conditions at the time for the accidents were compiled for the two winters. This was done to determine the road conditions preceding the time of the accident, and also to see which of the road conditions that was the most common when an accident occurred. The winter 2004-2005 had the largest amount of accidents when there was at least one of the four types of slipperiness (MIPS). In the winter of 2005-2006 the category Snow where the one with the most accidents. MIPS or Snow occurred in 24.8% and 30.0% respectively of the three winter months. This difference in road condition is also shown in the percentage of accidents. 33.4% and 40.6% respectively of accidents were in this category (Table II). Table II. Percentage of accidents in certain road condition and percentage of road conditions.
HR1 HR2 HT HN MIPS Rain Freezing
rain Snow Sleet
MIPS or Snow
Accidents Jan 05 14.9 4.4 7.4 6.3 20.6 13.9 0.0 15.1 6.6 29.2 Jan 06 11.1 3.2 3.1 2.9 15.4 3.3 0.4 25.4 2.2 37.8 04-05 14.1 4.0 9.9 8.1 22.1 11.6 0.5 18.6 7.9 33.4 05-06 11.3 3.2 4.8 4.5 16.7 5.4 0.9 30.3 3.3 40.6
Road Jan 05 9.1 4.9 3.3 1.8 15.9 5.6 0.1 7.9 1.5 22.1 conditions Jan 06 11.4 5.2 1.9 1.2 17.8 1.4 0.2 12.8 0.5 28.9 04-05 10.4 4.9 3.7 2.2 17.8 3.9 0.1 9.7 1.8 24.8 05-06 9.8 4.0 2.5 1.4 15.7 2.1 0.2 17.0 0.9 30.0
14 Anna K. Andersson
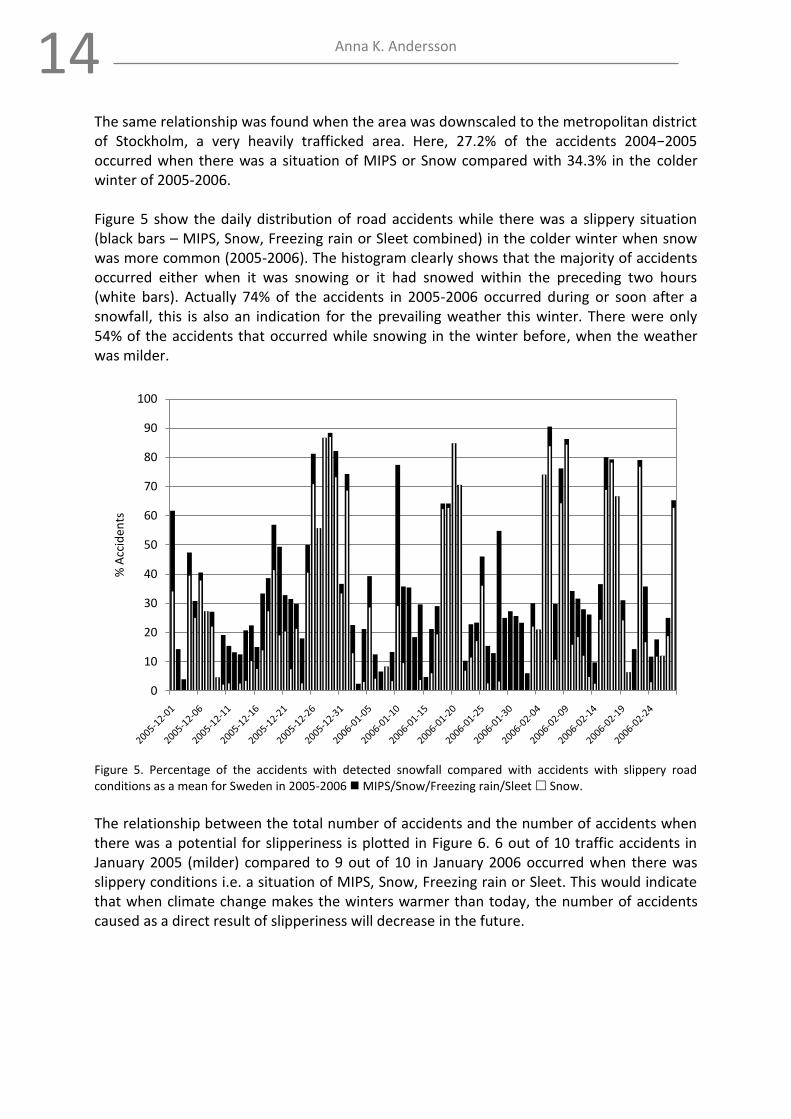
The same relationship was found when the area was downscaled to the metropolitan district of Stockholm, a very heavily trafficked area. Here, 27.2% of the accidents 2004−2005 occurred when there was a situation of MIPS or Snow compared with 34.3% in the colder winter of 2005-2006. Figure 5 show the daily distribution of road accidents while there was a slippery situation (black bars – MIPS, Snow, Freezing rain or Sleet combined) in the colder winter when snow was more common (2005-2006). The histogram clearly shows that the majority of accidents occurred either when it was snowing or it had snowed within the preceding two hours (white bars). Actually 74% of the accidents in 2005-2006 occurred during or soon after a snowfall, this is also an indication for the prevailing weather this winter. There were only 54% of the accidents that occurred while snowing in the winter before, when the weather was milder.
Figure 5. Percentage of the accidents with detected snowfall compared with accidents with slippery road conditions as a mean for Sweden in 2005-2006 MIPS/Snow/Freezing rain/Sleet Snow.
The relationship between the total number of accidents and the number of accidents when there was a potential for slipperiness is plotted in Figure 6. 6 out of 10 traffic accidents in January 2005 (milder) compared to 9 out of 10 in January 2006 occurred when there was slippery conditions i.e. a situation of MIPS, Snow, Freezing rain or Sleet. This would indicate that when climate change makes the winters warmer than today, the number of accidents caused as a direct result of slipperiness will decrease in the future.
0
10
20
30
40
50
60
70
80
90
100
% A
ccid
ents

15 Winter Road Conditions and Traffic Accidents – Present and Future Climate Scenarios
Figure 6. Accidents per day during MIPS/Snow/Freezing rain/Sleet vs. total amount of accidents per day 2004-2005, Jan 2005 (short trend line), 2005-2006, Jan 2006 (long trend line).
Finally, this study showed that traffic accidents are most prevalent when road surface temperatures are below -3°C or when there is a snowfall. This led to the question of how frequently this situation would be encountered in a warming winter climate. The next section analyse this.
3.3 Climate change impact on traffic accidents in Gothenburg, Sweden 19 RWIS outstations in the Gothenburg area were used in this investigation (Figure 1). Three winters 2006-2007, 2007-2008 and 2008-2009 were studied, where a winter is the five months between November and March. (N.B. Temperature is always the daily minimum road surface temperature (RSTdm) if not otherwise defined.) During these three winters there were 1273 traffic accidents with a complete dataset for precipitation. There was no precipitation according to the nearest RWIS outstation in 79 % of the accidents. For the remaining accidents, it was raining in 12%, snowing in 8 % and freezing rain for 0.24% (Table I). To investigate which type of precipitation posed the largest risk for an accident, the following equation was used (Norrman, 2000):
Accident risk= 1
N At,mhm Amht,m
-1Mar 2009
m=Nov 2006 (1)
0
10
20
30
40
50
60
70
80
90
0 20 40 60 80 100 120
Acc
iden
ts/d
ay w
ith
MIP
S, S
no
w, F
reez
ing
rain
, Sle
et
Total Accidents/day

16 Anna K. Andersson
where N – Number of months At,m – Number of accidents in month (m) in precipitation type (t) hm – Number of hours in month (m) Am – Number of accidents in month (m) h t,m – Number of hours with precipitation type (t) Norrman (2000) used it to estimate the risk of an accident at different road conditions. One assumption made in these calculations was that the accidents had an even distribution. Although only 0.24% of the accidents occurred during Freezing rain, this precipitation type had the highest risk. There were 3 accidents recorded in the three winters in a total of 8 half-hours of Freezing rain. Hence, the risk for having an accident in this type of weather is high. The category of No precipitation had the risk of 1.0 which was the expected risk (Table III). Table III. Accidents in 2006 – 2009 (NDJFM) in different type of precipitation and the risk of having an accident in different types of precipitation.
Type of precipitation Number of accident (%) Accident risk
No precipitation 79 1.0 Rain 12 1.1 Freezing rain 0.24 2.2 Snow 8 1.4 Sleet 1 1.6
Using the IRWIN scenarios, changes in average precipitation for the three time slices, 2020s, 2050s and 2080s was calculated for each of the three precipitation categories (Snow, Rain and No precipitation). To calculate the estimated number of accidents for the future the same statistical accident risks were applied to the average amount of precipitation in the future time periods. The distribution of the number of accidents became 11% for Rain and 9% for Snow while No precipitation was unchanged in the 2080s (the two missing categories, Freezing rain and Sleet, which were missing in the model since there was too few observations). In 66% of the days November to March, 2006-2009, the daily minimum road surface temperature was equal or below zero degrees (Figure 7). The most common temperature during the three winters was -1°C. 67% of the traffic accidents occurred when the temperature was below zero degrees.

17 Winter Road Conditions and Traffic Accidents – Present and Future Climate Scenarios
Figure 7. Number of days with daily minimum road surface temperature (°C) (black) and the number of accidents at the same daily minimum road surface temperature (grey) for the three studied winters 2006-2009.
The daily minimum road surface temperatures were compiled for the three future scenarios 2020s, 2050s and 2080s but also for the Baseline (1970-2000) and the number of days for each temperature degree was calculated. The number of days with temperatures ≤0°C decreased from the baseline winter to the 2080s from the original 79% of the days in the baseline winter to 62%. The ratio between the number of traffic accidents and the number of days per winter for each temperature degree was then calculated. Number of accidents at RSTdm
Number of days per winter with RSTdm (2)
This ratio shows an increase of accidents/day if the temperature increases, this means that there are fewer accidents at lower temperatures, which can be an indication that drivers are more cautious at lower temperatures when there is a risk for slippery conditions. Number of accidents 2006-2009 at Temp X
Number of days 2006-2009 at Temp X=
Number of accidents BL at Temp X
Number of days BL at Temp X (3)
The assumption was that the ratio is the same now and in the future (equation 3). This ratio was applied on the calculated number of days per winter at each temperature for the three future time slices 2020s, 2050s and 2080s. It turned out that there was a threshold in the
0
50
100
150
200
250
300
0
10
20
30
40
50
60
-15-14-13-12-11-10 -9 -8 -7 -6 -5 -4 -3 -2 -1 0 1 2 3 4 5 6 7 8 9 10 11 12 13 14 15
Nu
mb
er o
f ac
cid
ents
Nu
mb
er o
f d
ays
Daily mimimum road surface temperature (deg C)
18 Anna K. Andersson
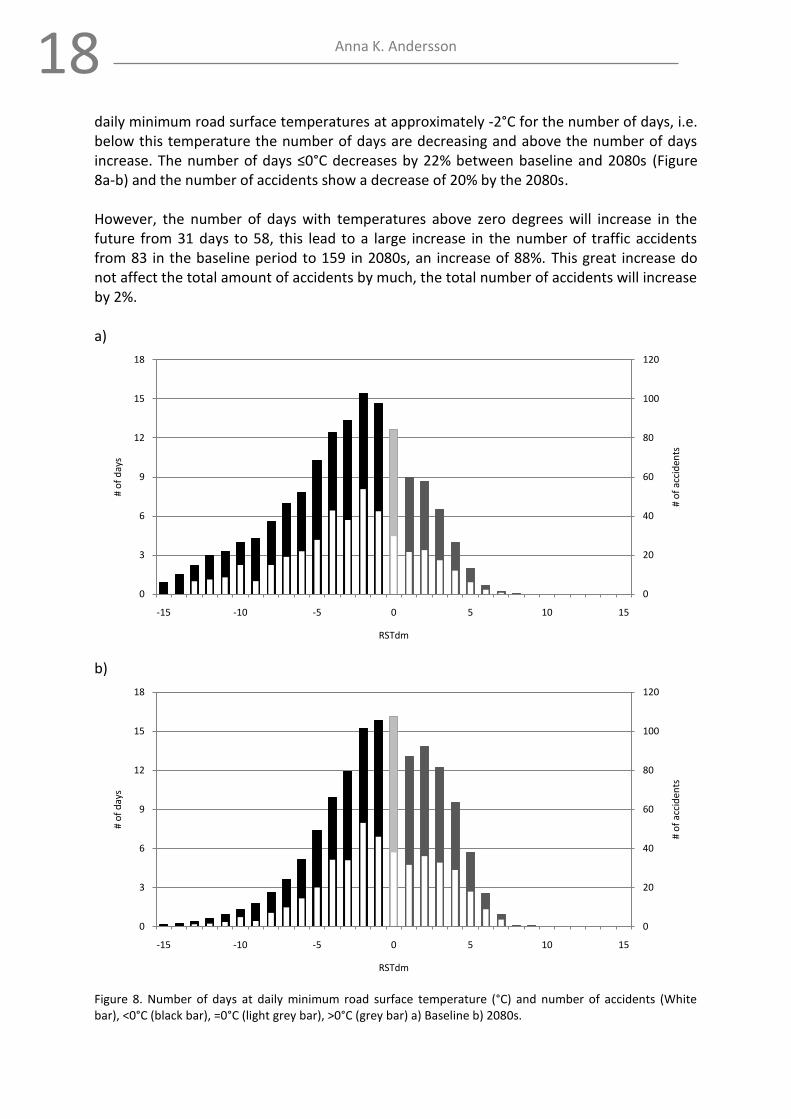
daily minimum road surface temperatures at approximately -2°C for the number of days, i.e. below this temperature the number of days are decreasing and above the number of days increase. The number of days ≤0°C decreases by 22% between baseline and 2080s (Figure 8a-b) and the number of accidents show a decrease of 20% by the 2080s. However, the number of days with temperatures above zero degrees will increase in the future from 31 days to 58, this lead to a large increase in the number of traffic accidents from 83 in the baseline period to 159 in 2080s, an increase of 88%. This great increase do not affect the total amount of accidents by much, the total number of accidents will increase by 2%. a)
b)
Figure 8. Number of days at daily minimum road surface temperature (°C) and number of accidents (White bar), <0°C (black bar), =0°C (light grey bar), >0°C (grey bar) a) Baseline b) 2080s.
0
20
40
60
80
100
120
0
3
6
9
12
15
18
-15 -10 -5 0 5 10 15
# o
f ac
cid
ents
# o
f d
ays
RSTdm
0
20
40
60
80
100
120
0
3
6
9
12
15
18
-15 -10 -5 0 5 10 15
# o
f ac
cid
ents
# o
f d
ays
RSTdm
19 Winter Road Conditions and Traffic Accidents – Present and Future Climate Scenarios
The Swedish Government and the Swedish Road Administration have a long term aim to reduce the amount of salt used on the Swedish roads. In a baseline winter, there were 118 days with a daily minimum road surface temperature of ≤0°C, this is reduced by 22% to 93 by 2080s. When the Swedish road administration make decisions regarding winter maintenance activities they use an upper limit of +1°C instead of 0°C for the road surface temperatures to have a safety margin to account for any inaccuracy of the sensors (Möller, 2002). Taking this into account the number of days below ≤1°C is going to decrease by 17% by 2080. This translates into a decrease of at least 15% in the winter maintenance activities by the 2080s. If this is converted into salt, then up to 38 700 tonnes of salt could be saved in a future average winter. The main conclusion in this paper was that the amount of winter traffic accidents in Sweden will decrease, at least when weather is considered. There are, however as mentioned in the introduction several other reasons why an accident may occur. Since the number of days with higher temperatures will increase there is a risk that the accidents at temperatures above zero degrees increase with as much as 88% in the winter months November to March. So far traffic accidents with future scenarios have been studied in a small area in the south western part of Sweden, hence it was considered interesting to apply the same thought analysis somewhere else in Europe. The Birmingham (UK) area was chosen as both Gothenburg and Birmingham are the second largest cities in each country. The climate in the middle part of England is not dissimilar to the climate experience in south-west Sweden, but yet a few degrees warmer e.g. approx. 4°C difference in January. This means the area may provide a potential spatial analogue for climate change in Sweden.
3.4 Climate change impacts on winter maintenance and accidents in West Midlands, UK
The idea for Paper IV started with a visit to Birmingham University that provided data pertaining to traffic accidents statistics (STATS-19) and weather data from Elmdon (Birmingham airport) for the two winters December 2004 to February 2005 and December 2005 to February 2006. The aim was to analyse slipperiness and accidents in UK in the same way as done in Sweden. However, getting access to the road surface temperatures turned out to be impossible since it is not publically available so instead was air temperature data obtained from the World Meteorological Organisation weather station at Elmdon (Birmingham Airport) located centrally in the West Midlands analysed. Two consecutive years were chosen because they had differences in temperatures, the first winter had a mean temperature 1.3°C above baseline while the second winter were more close to the baseline winter. The weather generator, EARWIG (Kilsby et al., 2007) was used for calculating the temperature distribution for a baseline scenario and for three future time slices, 2020 (2011-2040), 2050 (2041-2070) and 2080 (2071-2100). (N.B. Temperature is always the daily minimum air temperature if not otherwise defined.) The number of days with an air temperature below zero degrees was calculated. For the baseline, there are 69 frost days per year decreasing with each time slice until the 2080s where 28 is left. The number of days per year for each temperature degree for baseline and for the three future time slices is plotted in Figure 9. In this figure, the temperature change is

20 Anna K. Andersson
evident, with a 38% decrease of days per year with daily minimum temperature of five or less by the 2080s.
Figure 9. Number of days per year for each temperature degree 2080 2050 2020 BL.
Traffic accidents were analysed with respect to the actual air temperatures recorded at the time for the accident. To study how the number of traffic accidents in West Midlands might change with a future change of climate, a simple relationship was formed between the numbers of traffic accidents at baseline (DJF 2005-2006) and the climate at Elmdon for the same period of time: Number of accidents at Temp X
Number of days per winter at daily minimum Temp X (4)
To calculate future accidents rates, the ratio in equation 4 was applied to the calculated number of days for three future time slices (Figure 10). As a validation of this method the ratio was also applied to the warmer winter (DJF 2004-2005) in which 2039 accidents were predicted. This is within 3% of the actual amount of traffic accidents in the database, so it gave confidence in the method. This methodology indiactes that there will be a decrease of 48% in the amount of days when the air temperature is below zero degrees. However, on the marginal nights with temperatures equal or below 5°C the traffic accidents will be reduced with 12%. For temperatures ≤0°C the predicted reduction of accidents is 43%.
208020502020BL
0
5
10
15
20
25
30
-10 -9 -8 -7 -6 -5 -4 -3 -2 -1 0 1 2 3 4 5
Nu
mb
er o
f d
ays
per
yea
r
Daily Minimum Air Temperature (°C)

21 Winter Road Conditions and Traffic Accidents – Present and Future Climate Scenarios
Figure 10. Amount of accidents in December to February for each temperature degree for the actual amount of accidents and for three future scenarios 2005-2006 2020 2050 2080.
Hence, if the winters are to become shorter in line with climate change scenarios, will there be the same need for winter maintenance service? The answer is yes. Since the number of days below 5°C will remain in approximately 30% of the days in a year in the 2080s, they reduces with 21%, so there will continue to be many of the dangerous marginal nights that will need the winter maintenance service.
3.5 Summary of results In general for the five winters that was examined in Paper I, the different types of slipperiness increased with increasing latitude, although this was not applicable for the category road icing (HT). A logical thought is that the traffic accidents also would increase towards the north. This is partly true since there is less traffic in the north and the relation between accidents and traffic density is considerably greater there than it is for an area with denser traffic. However, it was concluded in Paper II that the most accidents are occurring while it is snowing and not because of icy roads. If the scenarios for the future climate are correct, then the number of days per year equal or below zero degrees will be reduced by 22% (Nov-Mar) in the Gothenburg area and 48% in the Birmingham area by the 2080s. This in turn should decrease the number of traffic accidents by 20% and 43% respectively. Winter maintenance costs should be reduced by milder winters. During the winter months, November to March, a 15% decrease would be possible in the Gothenburg area by the 2080s. For the Birmingham area, this could be as high as 38% (DJF).
05-062020
20502080
0
100
200
300
400
500
600
-5 -4 -3 -2 -1 0 1 2 3 4 5 6
Traf
fic
acci
den
ts
Air Temperature (°C)
22 Anna K. Andersson
The scenario for the number of days with daily minimum road surface temperature above zero degrees is increasing rapidly from 31 to 58 days between baseline and the 2080s. If the ratio between accidents and number of days is unchanged, the number of accidents will increase with 88% at these temperatures. Though, the total number of accidents will only increase with 2%.

23 Winter Road Conditions and Traffic Accidents – Present and Future Climate Scenarios
4. Conclusions
This section is going to revisit the aims stated at the beginning of this thesis. The overall aim with this thesis was to get a better understanding about winter road conditions and the relationship between slippery roads and traffic accidents. Was there any particular geographical pattern in the distribution of slipperiness on the Swedish winter roads? The different types of slipperiness are to a great extent controlled by latitude. In the northern parts of the country it is more likely to be one of the two types of hoarfrost (HR1 & HR2, moderate and severe hoarfrost). Hoarfrost is established when the road surface temperature is at least 0.5°C below the dew-point temperature of the air. Hoarfrost contributes to a strong increase for the Winter Index (WI) towards the north. It is worth mentioning when talking about hoarfrost car drivers in the northern part of the country might not frequently experience this type of slipperiness since the roads usually are covered in snow and ice already and the frost just glitters on the surface. The slipperiness type, road icing (HT – moist or wet surface that freezes due to a temperature drop below zero) is more frequent in the southern parts of the country compared to the northern parts due to the fact that the temperature is more often around zero in the south. This distribution was repeated at the regional scale. The only difference on the regional scale was that road icing (HT) had the highest amounts in the east, this might have been different if another region had been chosen instead. Finally, at the local scale, the county, the distribution of slipperiness appeared to have the largest influence from the local environment around the station. In a mild winter there were more traffic accidents on the Swedish roads when it was slippery conditions. When the colder winter was studied, snow seemed to be the cause for the most accidents. This is the result of more occasions with snowfall in the colder winter and during the milder winter low temperature was more frequent at around zero degrees and thereby more opportunities of slipperiness. The second main aim was to study what effect a warming climate might have on traffic accidents on wintery roads. Winters will become warmer in the Gothenburg area and it will affect the road surface temperatures in the sense that the number of days below zero degrees will decrease by 22% until the 2080s. This in turn would reduce traffic accidents that occur at these temperatures by 20% over the same period. On the other hand a warmer climate leads to an increase in the number of days above zero degrees, which results in an 88% increase of the accidents during the five winter months studied. In total the accidents will increase with 2%. Traffic accidents caused by slippery roads will also decline in the West Midlands, UK, because there will be fewer days with slipperiness when the winter climate becomes warmer. The number of accidents that occur when the air temperature is below zero degrees could be reduced with as much as 43% until the 2080s.
24 Anna K. Andersson
The number of days that need winter maintenance will be reduced until the end of this century in West Midlands, UK. If the days that have a daily minimum air temperature below 5 degrees are in need of winter maintenance, the days will decrease by 21%. But despite this, it is still 65 days left in the three winter months studied in this thesis with air temperatures below 5 degrees. So the need for winter maintenance will remain in the end of this century. It seems inevitable that there will always be accidents on our roads. However, it seems like the number of accidents caused by slippery roads could be reduced in the future. Although long term accident trends and climate scenarios would indicate that accident rates should continue to fall. However, there are some factors that are contradictory to this. For example, if the roads are slippery less often, drivers might lack the skills of controlling a vehicle on slippery roads. However, both cars and roadways will be improved in the future and this will hopefully lead to less severe accidents and fewer personal injuries.

25 Winter Road Conditions and Traffic Accidents – Present and Future Climate Scenarios
5. Reflections of future road climatology
Increased knowledge is the key to preventing accidents. If you know the road conditions before you travel, it could save you from having an accident. Snow is easy to see and driving styles can be adjusted accordingly, however black ice on the road it is not as easy to spot. Black ice is the most dangerous form of slipperiness, because it is so difficult to detect, it is transparent with no lustre and is often mistaken for a wet road surface. It is formed on a wet or moist road when the road surface temperature is falling beneath zero degrees and over a short period of time, in the transition into ice, there is a release of latent heat that contributes of making a thin liquid film that freezes without any air bubbles. Black ice can in this thesis be compared with HT. As concluded in Paper III & IV the number of dangerous marginal nights will not change drastically in the future. One possible scenario can be that the occasions with temperatures around zero degrees will even increase and as a consequence of this there will be more black ice. This will result in an increased number of traffic accidents and this is an area that needs more research. To predict and understand more about the future road climate there is, among other things, a need to determine the distribution patterns of the different slipperiness types connected to the future climate. It is necessary to extend the mapping in this thesis to cover in detail larger areas. This will allow for changes in the pattern of slipperiness types to be fully identified.

26 Anna K. Andersson
Acknowledgements
Before I start to thank people individually, I have to start by thanking everybody that feel concerned, so nobody is forgotten. It has been a long and winding journey. It all started the 1st November 2002, and if I remember correctly it was a Friday and it consisted of a meeting with the others in the graduate school climate-mobility. After that I went home and began to think about what I just had started, this thought has been following me ever since for seven years, two others that have been following me, are my supervisors: Torbjörn Gustavsson and Jörgen Bogren. Thanks for giving me this opportunity to get a PhD degree. It has been a lot of fun and worthwhile. Thanks to Vägverket, for letting me use their databases RWIS and STRADA. I´m sorry for all the times I crashed the server, wanting to have too much at the same time. What would I have done without the colleagues at the Earth Sciences Centre especially in physical geography? Thanks to all whom I´ve been drinking coffee and had lunch with, had yoga with or just went for a short walk around the cottages after lunch. Thanks for an unforgivable road trip Sven, and the PhD´s Jenny, Elisabeth, Matilda and Fredrik, next time I´m also taking a swim in the Colorado River. Dave, thanks for the help with calculating in Matlab (Paper III), otherwise my laptop would have given up long-time ago (i.e. been thrown out the window). I also want to thank the people I have shared room with over the years, Esben and Lina, and also the foreign PhD guests that stayed in “my” room. Thanks Björn for the collaboration in Paper I, without you I would still be writing on that manuscript . Lee, what can I say…? I can’t thank you enough for helping me with the writing and correction of the English language in Paper II and IV but also in this thesis. Not to forget baby Anna who wanted to eat in the middle of the night and therefore made it possible for you to stay up reading my manuscripts . Thanks to the road climatology group that have changed over the years, in the beginning Marie, Cissi, Hanna and Esben and more recent Lina (don’t forget Hotel California ), Carro (I´ll buy your bling bling anytime). Thanks to my family and friends that now at least can see in print what I have been doing all those years. I don’t say that you have to understand it, but if you see this at least you can tell people that you have read something I have written. The biggest THANK YOU!! goes to Hampus, my future husband (love U) and our gorgeous children, Simon and Alva. Both who have started their lives during my writing on this thesis. I will hopefully become a “normal mother” soon (from now on I rather have you guys in my
lap instead of the laptop). /Anna
Ps. Don´t try to do translations on the internet,
väglag (road condition) translates to road teams.

27 Winter Road Conditions and Traffic Accidents – Present and Future Climate Scenarios
Financial support has been received from: Centre for Environment and Sustainability, GMV, University of Gothenburg - Chalmers in Gothenburg, Sweden Göteborgs Universitet (Adlerbertska stipendiestiftelsen) Göteborgs Universitet (Adlerbertska studentbostadsstiftelsen) Göteborgs Universitet (Stiftelsen Paul och Marie Berghaus donationsfond) Kungliga Vetenskapsakademien (Stiftelsen J A Letterstedt resestipendiefond) Kungliga Vetenskapsakademien (Stiftelsen Margit Altins stipendiefond)
When you are a Bear of Very Little Brain, and Think of Things, you find sometimes that a Thing which seemed very Thingish inside you is quite different when it gets out into the open
and has other people looking at it. A. A. Milne (The House at Pooh Corner)

28 Anna K. Andersson
References
Andreescu MP, Frost DB. 1998. Weather and traffic accidents in Montreal, Canada. Climate Research 9: 225-230. Andrey J. 2009. Long-term trends in weather-related crash risks. Journal of Transport Geography. (In Press) doi: 10.1016/j.trangeo.2009.05.002. Andrey J, Olley R. 1990. The relationship between weather and road safety: past and future research directions. Climatological Bulletin 24: 123-127. Andrey J, Yagar S. 1993. A temporal analysis of rain-related crash risk. Accident Analysis and Prevention 25: 465-472. Asano M, Hirasawa M. 2003. Characteristics of traffic accidents in cold, snowy Hokkaido, Japan. Proceedings of the Eastern Asia Society for Transportation Studies, Vol.4. Bertness J. 1980. Rain-related impact on selected transportation activities and utility services in the Chicago area. Journal of Applied Meteorology 19: 545-556. Bogren J, Gustavsson T. 1989. Modelling of local climate for prediction of road slipperiness. Physical Geography 10: 147–164. Bogren J, Gustavsson T, Gaunt H. 2006. `Tema Vintermodell: VViS−data som underlag för beräkning av väglagsfördelning och olycksstatistik.` Earth Sciences Centre, Göteborg University. Report C75. (in Swedish) Brodsky H, Hakkert AS. 1988. Risk of a road accident in rainy weather. Accident Analysis and Prevention 20: 161-176. Campbell LR. 1986. Assessment of traffic collision occurrence related to winter conditions in the city of Winnipeg: 1974 to 1984. City of Winnipeg. Carmichael CG, Gallus WA, Temeyer BR, Bryden MK. 2004. A winter weather index for estimating winter roadway maintenance costs in the Midwest. Journal of Applied Meteorology 43: 1783–1790. Changnon SA, Changnon D. 2005. Lessons from the unusual impacts of an abnormal winter in the USA. Meteorological Applications 12: 187–191. Codling PJ. 1974. Weather and road accidents. In. Taylor JA (ed) Climatic resources and economic activity. David & Charles Holdings, Newton Abbot, p 205-222. Department for Transport, 2009. Transport Statistics Great Britain 2008 Available from: http://www.dft.gov.uk [Accessed June 2009]

29 Winter Road Conditions and Traffic Accidents – Present and Future Climate Scenarios
Department for Transport, 2009a. Road Casualties in Great Britain: Main Results: 2008. Available from: http://www.dft.gov.uk [Accessed 23 October 2009] Department for Transport, 2009b. Transport Statistics Great Britain 2008 Available from: http://www.dft.gov.uk [Accessed 29 October 2009] Edwards JB. 1996. Weather-related road accidents in England and Wales: a spatial analysis. Journal of Transport Geography 4: 201-212. Edwards JB. 1999. The temporal distribution of road accidents in adverse weather. Meteorological Applications 6: 59−68. Eisenberg D, Warner KE. 2005. Effects of Snowfalls on Motor Vehicle Collisions, Injuries, and Fatalities. American Journal of Public Health 95: 120-124. Evans L. 2004. Traffic Safety. SSS, Bloomfield Hills, MI. Fridstrom L, Liver J, Ingebrigtsen S, Kulmala R, Thomsen L. 1995. Measuring the contribution of randomness, exposure, weather, and daylight to the variation in road accident counts. Accident Analysis and Prevention 27: 1-20. Hassan YA, Barker DJ. 1999. The impact of unseasonable or extreme weather on traffic activity within Lothian region, Scotland. Journal of Transport Geography 7: 209-213. Horwood LJ, Fergusson DM. 2000. Drink driving and traffic accidents in young people. Accident Analysis and Prevention 32: 805-814. Hulme M, Jenkins GJ, Lu X, Turnpenny JR, Mitchell TD, Jones RG, Lowe J, Murphy JM, Hassell D, Boorman P, McDonald R, Hill S. 2002. Climate Change Scenarios for the United Kingdom: The UKCIP02 Scientific Report, Tyndall Centre for Climate Change Research, School of Environmental Sciences, University of East Anglia, Norwich, UK. 120pp Hutchinson MF. 1987. Methods for generation of weather sequences. In Agricultural Environments: Characterisation, Classification and Mapping, Bunting AH (ed.). CAB International: Wallingford: 149-157. IPCC. 2007. IPCC, Climate Change 2007: Synthesis Report. Contribution of Working Groups I, II and III to the Fourth Assessment Report of the Intergovernmental Panel on Climate Change, IPCC, Geneva, Switzerland (2007) 104 pp. IU. 2009. Mary Ward. Irish Universities Promoting Science. Available from: http://www.universityscience.ie/pages/scientists/sci_mary_ward.php [Accessed 21 December 2009] Kilpeläinen M, Summala H. 2007. Effects of weather and weather forecasts on driver behaviour. Transportation Research Part F 10: 288–299.

30 Anna K. Andersson
Kilsby CG, Jones PD, Burton A, Ford AC, Fowler HJ, Harpham C, James P, Smith A, Wilby RL. 2007. A daily weather generator for use in climate change studies. Environmental Modelling & Software 22: 1705-1719. Koetse MJ, Rietveld P. 2009. The impact of climate change and weather on transport: An overview of empirical findings. Transportation Research Part D 14: 205-201. Lam LT, Lam MKP. 2005. The association between sudden illness and motor vehicle crash mortality and injury among older drivers in NSW, Australia. Accident analysis and prevention 37: 563-567. Levine N, Kim KE, Nitz LH. 1995. Daily fluctuations in Honolulu motor vehicle accidents. Accident analysis and prevention 27: 785-796. Lindqvist S. 1975. The influence of micro- and mesoclimatological factors on ice-formation on roads. In GUNI Report 8. Department of Physical Geography, Gothenburg, 41, (only abstract in English). Lindqvist S. 1979. Studies of slipperiness on roads. In GUNI Report 12. Department of Physical Geography, Gothenburg, 46, (only abstract in English). London Assembly. 2009. Slipping up? Impact of extreme weather on London Transport. Available from: http://www.london.gov.uk/assembly/reports/transport/snow-report-0309.pdf [Accessed 18 June 2009] Met Office. 2009. Warming, Climate change – the facts. Available from: http://www.metoffice.gov.uk./climatechange/guide/ [Accessed 30 December 2009] Meyhew DR, Donelson AC, Beirness DJ, Simpson HM. 1986. Youth, alcohol and relative risk of crash involvement. Accident analysis and prevention 18: 273-287. Moore DF. 1975. The friction of pneumatic tyres. Oxford: Elsevier Scientific. 220pp. Möller S. 2002. Ersättningsmodell för vinterväghållning baserad på väderdata från VViS. VTI notat 30−2002. Statens väg− och transportforskningsinstitut. Linköping 2002. (in Swedish). Näyhä S. 2002. Traffic Deaths and Superstition on Friday the 13th. American Journal of Psychiatry 159: 2110–2111. Nofal FH, Saeed AAW. 1997. Seasonal variation and weather effects on road traffic accidents in Riyadh City. Public Health 111: 51-55. Norrman J, Eriksson M, Lindqvist S. 2000. Relations between traffic accidents on slippery roads and winter road maintenance. Climate Research 15: 185-193.

31 Winter Road Conditions and Traffic Accidents – Present and Future Climate Scenarios
Norrman J. 2000. Slipperiness on roads–an expert system classification. Meteorological Applications 7: 27–36. ONS. 2009. Office for National Statistics. Available from: http://www.statistics.gov.uk [Accessed 23 October 2009] Palutikof JP. 1983. The effect of climate on road transport. Climate Monitor 12: 46-53. Palutikof JP. 1991. Road accidents and weather. In A. H. Perry & L. J. Symons, Highway meteorology. London: E & FN Spon. Parry ML. 2000. Assessment of Potential Effects and Adaptations for Climate Change in Europe: the Europe ACACIA project. Jackson Environment Institute, University of East Anglia. Räisänen J, Hansson U, Ullerstig A, Döscher R, Graham LP, Jones C, Meier M, Samuelsson P, Willén U. 2003. GCM driven simulations of recent and future climate with the Rossby Centre coupled atmosphere–Baltic Sea regional climate model RCAO. SMHI–RMK No. 101. ISSN: 0347-2116 SMHI Reports Meteorology Climatology, 61. Saarikivi P, Gustavsson T, and Rayner D. 2009. IRWIN Improved local winter index to assess maintenance needs and adaptation costs in climate change scenarios, Final Report. ERA-NET ROAD ENR SRO3 project document, http://www.eranetroad.org. Salt Union. 2009. Available from: http://www.saltunion.com [Accessed June 2009] Scottish Road Network Climate Change Study. The Scottish Executive. ISBN: 0-7559-4652-9 Available from: http://www.scotland.gov.uk [Accessed October 2005]. S.I.A. 2009. Le fardier de Cugnot. Société des Ingénieurs de l’Aoutmobile. Available from: http://www.ile-de-france.drire.gouv.fr/vehicules/homolo/cnrv/histoire.htm [Accessed 21 Dec 2009]. Smith K. 1982. How seasonal weather conditions influence road accidents in Glasgow. Scottish Geographical Magazine 98: 102-114. SRES. 2000. IPCC Special Report on Emissions Scenarios ISBN: 92-9169-113-5 STA. 2009. Swedish Transport Agency. Available from: http://www.transportstyrelsen.se (in swedish) [Accessed 23 October 2009] Suggett J. 1999. The effect of precipitation on traffic safety in the city of Regina. Master of Science Thesis, University of Regina, Saskatoon. Thornes JE. 1991. Thermal mapping and road-weather information systems for highway engineers. In Highway Meteorology, E. and F.N. Spon, London, England; 39-67.
32 Anna K. Andersson
Thornes JE. 2005. Snow and road chaos in Birmingham on 28th January, 2004. Weather 60: 146-149. Venäläinen A, Kangas M. 2003. Estimation of winter road maintenance costs using climate data. Meteorological Applications 10: 69–73. VV. 1999. Årsredovisning 1998. Publikation 1999:33. ISSN: 1401-9612. Available from: http://www.vv.se (in swedish) [Accessed 6 November 2009] VV. 2006. Vägverket Årsredovisning 2005 . Publication 2006:21E. ISSN 1401-9612. Also available from: http://www.vv.se/filer/2181/annual report 05.pdf [Accessed June 2006]. VV. 2009. Vision Zero. Available from: http://www.vv.se [Accessed 29 October 2009] VV. 2009a. Årsredovisning 2008. Publikation 2009:10. ISSN: 1401-9612. Also available from: http://www.vv.se (in swedish) [Accessed 6 November 2009] VV. 2009b. ITS – Intelligent Transport Systems and Services. Available from: http://www.vv.se [Accessed 29 September 2009]

Part II
Papers


Paper I
Geographical Distribution of Road Slipperiness in Sweden on National, Regional and County Scales.
Anna K. Andersson, Torbjörn Gustavsson, Jörgen Bogren and Björn Holmer
“In the winter that road is treacherous. I was only going 20 mph when my accident occurred
and once I hit the ice there was no way to stop.” Andy Whyman quotes

METEOROLOGICAL APPLICATIONSMeteorol. Appl. 14: 297–310 (2007)Published online in Wiley InterScience(www.interscience.wiley.com) DOI: 10.1002/met.32
Geographical distribution of road slipperiness in Sweden,on national, regional and county scales
A. K. Andersson,* T. Gustavsson, J. Bogren and B. HolmerDepartment of Earth Sciences, Physical Geography, Road Climate Centre, Goteborg University, S-405 30 Goteborg, Sweden
ABSTRACT: The influence of latitude on the distribution of slipperiness of roads in Sweden was studied at three scales:national, regional and county. Data from 654 Road Weather Information System (RWIS) stations were compiled over fivewinter seasons, from 1998/1999 to 2002/2003. The aim of the study was to establish a basis on which to model how futureclimate changes might affect frequency of slipperiness and costs for maintenance in winter. Four types of slipperiness werestudied (slippery conditions due to moderate (HR1) or severe (HR2) hoarfrost, moist/wet surface that freezes (HT), andrain or sleet falling on a cold road (HN)), all adding up to form the winter index (WI).
In Sweden, the distribution of slipperiness varies depending on the scale (national, regional or county). On the nationaland regional scales the mean temperatures give a general picture of the total slipperiness – i.e. dependence on latitude;different factors were tested and latitude proved to be the most correlated. Slipperiness caused by HR1 and HR2 hoarfrosttends to increase towards the north, while road icing (HT) decreases. On the county scale, neither latitude nor any othertested geographical variable, could explain much of the variance. Local climate and the directions of movement of individualweather systems may be more important. The regional scale is considered to be most suitable for future modelling of theinfluence of the effect of a changed climate on the slipperiness of the roads. Copyright 2007 Royal MeteorologicalSociety
KEY WORDS road climate; slipperiness; winter index; road icing; hoarfrost
Received 12 July 2006; Revised 29 June 2007; Accepted 2 July 2007
1. Introduction
Climate change and its impact on winter road conditionshas been the central focus of a few studies during thelast decade (Venalainen and Kangas, 2003; Carmichaelet al., 2004; Scottish Road Network, 2005). Some studieshave concentrated on how much money can be saved onroad maintenance in mild winters compared to winterswith normal conditions. In the USA, in the winter of2001–2002, the cost of snow ploughing and salting wasreduced by 65–80% for the federal, state and localhighway/street departments (Changnon and Changnon,2005). In Finland, the costs for annual winter roadmaintenance amount to EUR 100 million (Venalainenand Kangas, 2003). In Sweden, in 2005, the total costfor winter road maintenance amounted to approximatelyEUR 207 million (SRA, 2006).
Keeping roads free from ice and snow is a majorpart of winter road maintenance. If road maintenance isconducted properly the adverse effects of severe weatheron society are reduced. Factors such as accidents andthe costs of delays affect both individuals and society.Therefore, it is very important that winter maintenance isperformed correctly and in a timely manner. To be able to
* Correspondence to: A. K. Andersson, Department of Earth Sciences,Physical Geography, Road Climate Centre, Goteborg University, S-40530 Goteborg, Sweden. E-mail: [email protected]
do this, it is important to have a good understanding of thefrequency and spatial distribution of slipperiness duringthe winter months. Knowing and understanding theseconditions helps planning for future road maintenanceactivities in a changing climate. This study is intendedto be part of a larger study of how climate change willaffect winter road slipperiness in Sweden in the future,thereby influencing transportation. It can be of use incost planning and the distribution of resources in winterroad maintenance, with different types of slipperinessrequiring different types of efforts.
The Intergovernmental Panel on Climate Change(IPCC) has predicted several different scenarios for futureclimate (IPCC, 2001). The scenario SRES A2 shows avery uniform world where local identities are preserved,there is a constant increase in world population, and eco-nomic growth is mainly regional and slower than in theother scenarios (IPCC, 2001). The annual mean temper-ature in Sweden is predicted to increase between 3.6and 4.5 °C by the end of the twenty-first century, andbetween 3.8 and 5.5 °C in the winter months (Decem-ber to February) (Raisanen et al., 2003). If this is thecase for Sweden, it still does not indicate how this willaffect severe weather and slipperiness. For example, ifGothenburg’s mean January air temperature (1961–1990)(SMHI, 2005) increases 4 °C from −1.1 °C, this will, ofcourse, change the potential slipperiness of the roads. Forexample, a road with a surface temperature of −1.7 °C
Copyright 2007 Royal Meteorological Society

298 A. K. ANDERSSON ET AL.
and an air temperature of −0.3 °C might have a slipperysituation of moderate hoarfrost (HR1), but if the future airtemperature is changed to 3.7 °C the road surface temper-ature might change to 0.8 °C and the risk for slipperinessis over. If the mean temperature rises above zero therewill be a decrease in the frequency of road slipperiness,but there will probably also be displacements in the pro-portions of the different types of slipperiness.
Today, winter indices are well-established tools for cal-culating the need for winter maintenance activities inrelation to the climate (Hulme, 1982; Knudsen, 1994;Gustavsson, 1996; Heiberg Mahle and Rogstad, 2002;Strong and Shvetsov, 2006). The winter indices are clima-tological. Thus, they are not influenced by maintenanceactivities to prevent or reduce slipperiness.
To calculate variations in slipperiness, both in relationto today’s climate and future climate scenarios, it isnecessary to have detailed knowledge of the factors thatgive rise to slipperiness. Road slipperiness is mainlyinfluenced by two factors: the prevailing weather and thelocal and micro-climate variations along stretches of road(for example, Gustavsson and Bogren, 1990; Knollhoffet al., 2003).
The interaction between atmospheric conditions androad surfaces can give rise to several types of slipperinessof varying severity. Lindqvist (1979) listed 24 types thatwere later reduced to10 (Norrman, 2000). Both, weatherchanges and stable weather can cause slipperiness. Slip-periness can also be associated with both, falling andrising temperatures. Of the ten different types of slipper-iness proposed by Norrman (2000), four are used in thepresent study: moderate and severe hoarfrost, moist/wetsurface that freezes and rain or sleet falling on a coldroad. Some of the weather situations that can create prob-lems on winter roads are described below.
Weather changes which result in precipitation on afrozen road surface will result in a slippery surface if it isnot salted. During the winter, if the weather starts to clearup after rain has fallen on a surface which is above thefreezing point, icy surfaces might occur due to radiationalcooling of the road. Weather changes which advect warmair over a frozen surface might cause HR2. The warmerand more moist the air, the greater the risk for slipperinessdue to sublimation (Bogren and Gustavsson, 1989). Thisis common during weather changes associated with warmfronts, even if the front itself does not produce activeweather. Slipperiness can also occur without weatherchanges, due to the diurnal temperature cycle. Changesin combination with site-specific circumstances influencethe risk of slipperiness. Such examples are:
• Rapid cooling of the surface – on clear and calm nightsthe road surface can be cooled by radiation to belowthe dew-point of the air. This will result in weaksublimation since the turbulence is weak due to thecontemporaneous stabilization of the air (Lindqvist,1975).
• Inversion above a cool surface – during clear and calmmornings with a cold road surface; the mixing of air
due to turbulence by traffic, brings relatively warmerair down to the cold road surface causing risk ofsublimation. At sunrise there is also a weakening ofthe inversion, and an increased turbulent transport ofmoisture towards the surface (Lindqvist, 1975).
Some of the events described above will occur overlarge areas (due to the presence of fronts and advec-tion) while others are more site-specific. Differences intopography, nearby water bodies, vegetation, shading andthermal properties of the roadbed are all important factorsthat can differentiate the risk of slipperiness in an area.However, the distribution of slipperiness is also influ-enced by geographical factors such as latitude, altitudeand distance from the sea, all of which affect tempera-ture, humidity and wind in prevailing weather systems.In Sweden, Eriksson and Norrman (2001) also found thatnot only did altitude have some influence on an areafrom the Swedish west coast to 250 kilometres to theeast, but also distance from the sea. However, the ques-tion arises as to whether the same geographical variablescould explain the distribution of slipperiness if the areawas much larger/smaller in size. Is there an optimal sizeto investigate geographical influences on the distributionof slipperiness?
The aim of this study was to investigate the particulargeographical patterns in the distribution of slipperinesson Swedish winter roads, both for the total number ofoccurrences of slipperiness and for the four differenttypes of slipperiness, and to see how these patternsdepend on the size of the areas. Therefore, analyseswere done on three different scales: national, regionaland county. For the first two scales, the different types ofslipperiness were related to latitude (since Sweden covers15° of latitude). For the county scale, distance from thesea and altitude above sea level were investigated. Thestudy is based on the Road Weather Information System(RWIS) in Sweden and was carried out over the period1998–2003, with monitoring of the road conditions (i.e.temperature, precipitation and humidity) every half hourduring the wintertime (defined as October to April).
2. Methods and Data
2.1. Study area
The Swedish Road Administration (SRA) uses both,regions and counties to divide the country into smalleradministrative units. In total, there are 7 regions and 24counties (Figure 1(a)). The regions are not similar in size,but the divisions are still useful, as they form areas withsimilar characteristics: these regions are used as a basisfor the calculations of the extent of slipperiness. The rea-son for choosing the pre-defined regions used by the SRAis that the result of the analyses can be directly linkedto such parameters as the cost of salt used for wintermaintenance. Region Vast, in the western part of thecountry (Figure 1(b)), was selected for the analyses onthe regional scale. One county in that region, Halland,
Copyright 2007 Royal Meteorological Society Meteorol. Appl. 14: 297–310 (2007)DOI: 10.1002/met

DISTRIBUTION OF ROAD SLIPPERINESS IN SWEDEN 299
(a) (b) (c)
Figure 1. (a) The seven regions in Sweden (b) Counties in Region Vast with four marked stations (c) Stations in Halland.
was selected for a more detailed analysis (Figure 1(c)).All three areas have the same narrow stretch from northto south, which makes it easier to compare the differentareas.
2.2. Swedish climate
The mean January temperature, between 1961 and 1990(Figure 2), shows the typical pattern of decreasing tem-peratures with increasing latitude. The coldest meanannual temperature is found in the north in the areaseast of the mountain range. Precipitation falls all yearround, but the largest amount is in the summer and in theautumn, generally 500–800 mm year−1, but in the moun-tain areas the yearly mean are 1500–2000 mm (SMHI,2005). At that time of year, most of the low pressurecomes in from the west or southwest, so most precipita-tion falls in the western part of Sweden. In the wintertime,most precipitation in the northern part of the country
Figure 2. Mean air temperature in January 1961–1990, redrawn fromSMHI (2005).
comes as snow. Temperatures are milder on the coaststhan inland, the differences can be up to a couple ofdegrees (SMHI, 2005). Cold fronts most often come fromthe north.
Since 1988, the annual mean temperatures in Swedenhave been higher than the normal reference value, withthe exception of 1996. On average, the mean annualtemperature was about 1.3 °C higher than normal between2000 and 2003 (SMHI, 2000–2003). During the fivewinter seasons studied, 2001 is closest to the meanvalue of the reference period 1961–1990 when the meantemperature was 0.7 °C higher than the normal referencetemperature (SMHI, 2001). Here follows a short summaryof the weather in the five winter seasons between 1998and 2003 (SMHI, 1998–2003):
1998/1999: Early winter conditions in the northern partand in November 1998 winter prevailed in the wholecountry. The start of 1999 was mild in the south andcold in north, but winter conditions then returned withunexpected snowfalls during the end of the season.
1999/2000: Mild with several storms at the end of 1999,2000 started relatively mild with much precipitation inthe western and northern parts of the country. Marchand April were warm in the south, while March wascold in the north.
2000/2001: The end of 2000 was mild with a lot of pre-cipitation; there were even some record precipitationamounts in the southern parts. The first month of 2001was mostly mild with a short spell of colder weatherand very little snow in the whole country.
2001/2002: The end of 2001 was very wet and mild,but there was some extremely cold weather at the endof December. Mild weather interspersed with somecold spells continued in 2002. April started with a lotof snow in the north, but then it became warm withrecord temperatures, while in the south there was a lotof rain.
2002/2003: In October and November 2002 there wasvery dry weather in the north and in the southeast therewas a large amount of precipitation. January 2003 was
Copyright 2007 Royal Meteorological Society Meteorol. Appl. 14: 297–310 (2007)DOI: 10.1002/met

300 A. K. ANDERSSON ET AL.
cold in the north and warm in the south, February hadthe opposite relationship. March and April continuedwith mild weather and there was not much precipita-tion during these four months.
The area most exposed to frost is the northern part ofSweden, especially the areas with an altitude of 500 mabove sea level and higher. The least frost-inclined areasare in the south, on the west coast and around the biglakes. Normally, slipperiness caused by frost starts atthe beginning of October in the northern part of thecountry, and at the end of October in the southernpart (SMHI, 2006); the border between north and southcorresponds roughly to the southern border of RegionMitt (Figure 1(a)).
2.3. Road weather data
All information from RWIS stations in Sweden hasbeen collected in a central database since the middleof the 1980s. Today the system consists of more than710 stations situated along the major roads in thecountry. The stations monitor road surface temperature,air temperature, relative humidity, precipitation and windspeed. The dew-point is calculated from air temperatureand relative humidity. Data are collected every 30 minduring the winter months and stored in a database at theSRA. In this study, wintertime is defined as the period of212 days between October and April.
Totally, data from 654 RWIS stations were used forthe winter seasons of 1998/1999–2002/2003. All stationswere checked for missing data. If any set of data hada gap lasting no more than 2 h in succession, then themissing data were replaced with data from the SRA.In situations where the interruption was over a longerperiod, the station in question was excluded from theanalysis (for example, when the actual measuring processhad an unknown start date, or when it was incompletedue to a missing or unknown end date). The numberof stations varies between the different regions andyears (Table I). Approximately 30% of the stations wereexcluded each year.
The mean value of the number of occasions on whichslippery conditions developed was calculated for eachtype of slipperiness and each region in Sweden for thefive winters. Slipperiness was compared in the different
regions and in different winters. In Region Vast, furthercalculations of slipperiness were made for each county.
The first step in analysing the distribution of roadslipperiness in Sweden on the national scale is comparinglatitude with the winter index (WI). The latitude usedat the national scale is a mean value of the stations’latitude for the region. The latitude is also used in RegionVast, but there the latitude for each station is used fordownscaling. In the county of Halland, three differentfactors were analysed: latitude, distance from sea andaltitude above sea level. The calculated WI and theindividual types of slipperiness were investigated for eachregion and each winter season.
2.4. Winter index and classification of differentslippery conditions
Combinations of monitored weather variables were usedto calculate the possible occurrence of the four kindsof winter road slipperiness that the SRA considers mostimportant for allocation of maintenance resources – thatis, HR1, HR2, moist/wet surface that freezes, otherwisecalled road icing (HT) and HN.
By adding the number of occurrences of the four typesof slipperiness the WI can be calculated.
WI = HR1 + HR2 + HT + HN
All calculations of slipperiness are done in real-timeand stored within the RWIS, and the information is usedby the road maintenance personnel for making decisionson how to handle a situation of slipperiness.
The WI is a purely climatological index, so effectsof maintenance actions, for example salting, are notincluded. No direct information is available about theactual road conditions (i.e. if there actually is a slipperyroad surface). RWIS data have the advantage of beingcollected close to roads, and they have a very hightemporal and spatial resolution. These factors make itpossible to perform detailed calculations with respect toboth, what kind of slipperiness is actually possible on theroad, and the duration of a specific occurrence.
For a weather event to be designated as slippery, acertain duration time has to be specified. The duration ofan occurrence of slipperiness is determined in relationto length of time for which the salt is effective afterit has been spread on the road, which is approximately
Table I. Number of road weather stations used in each region.
Skane Sydost Vast Stockholm Malardalen Mitt Norr
Latitude 55.9 57.2 58.3 58.5 59.5 62.1 65.698/99 33 52 87 26 36 107 7299/00 35 52 88 26 37 111 7200/01 36 53 95 30 38 118 7601/02 36 53 95 30 38 117 7602/03 36 53 94 31 38 117 76Mean number of stations 35 53 92 29 37 114 74
Copyright 2007 Royal Meteorological Society Meteorol. Appl. 14: 297–310 (2007)DOI: 10.1002/met
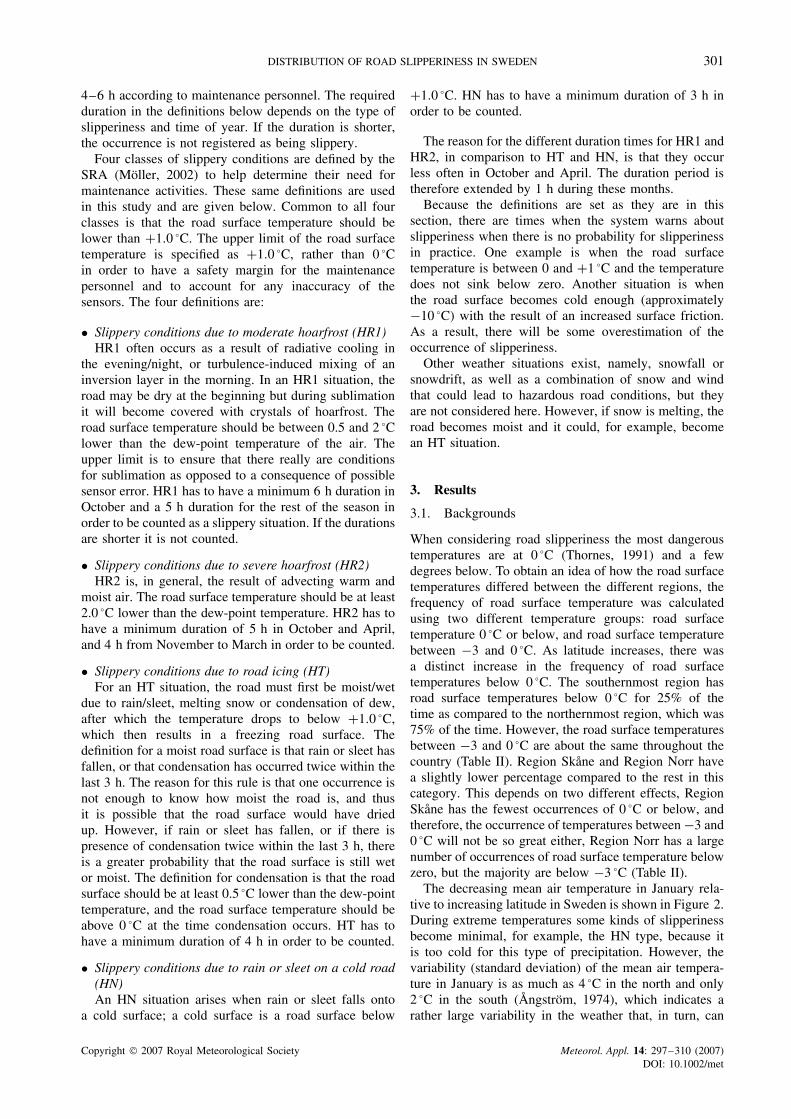
DISTRIBUTION OF ROAD SLIPPERINESS IN SWEDEN 301
4–6 h according to maintenance personnel. The requiredduration in the definitions below depends on the type ofslipperiness and time of year. If the duration is shorter,the occurrence is not registered as being slippery.
Four classes of slippery conditions are defined by theSRA (Moller, 2002) to help determine their need formaintenance activities. These same definitions are usedin this study and are given below. Common to all fourclasses is that the road surface temperature should belower than +1.0 °C. The upper limit of the road surfacetemperature is specified as +1.0 °C, rather than 0 °Cin order to have a safety margin for the maintenancepersonnel and to account for any inaccuracy of thesensors. The four definitions are:
• Slippery conditions due to moderate hoarfrost (HR1)HR1 often occurs as a result of radiative cooling in
the evening/night, or turbulence-induced mixing of aninversion layer in the morning. In an HR1 situation, theroad may be dry at the beginning but during sublimationit will become covered with crystals of hoarfrost. Theroad surface temperature should be between 0.5 and 2 °Clower than the dew-point temperature of the air. Theupper limit is to ensure that there really are conditionsfor sublimation as opposed to a consequence of possiblesensor error. HR1 has to have a minimum 6 h duration inOctober and a 5 h duration for the rest of the season inorder to be counted as a slippery situation. If the durationsare shorter it is not counted.
• Slippery conditions due to severe hoarfrost (HR2)HR2 is, in general, the result of advecting warm and
moist air. The road surface temperature should be at least2.0 °C lower than the dew-point temperature. HR2 has tohave a minimum duration of 5 h in October and April,and 4 h from November to March in order to be counted.
• Slippery conditions due to road icing (HT)For an HT situation, the road must first be moist/wet
due to rain/sleet, melting snow or condensation of dew,after which the temperature drops to below +1.0 °C,which then results in a freezing road surface. Thedefinition for a moist road surface is that rain or sleet hasfallen, or that condensation has occurred twice within thelast 3 h. The reason for this rule is that one occurrence isnot enough to know how moist the road is, and thusit is possible that the road surface would have driedup. However, if rain or sleet has fallen, or if there ispresence of condensation twice within the last 3 h, thereis a greater probability that the road surface is still wetor moist. The definition for condensation is that the roadsurface should be at least 0.5 °C lower than the dew-pointtemperature, and the road surface temperature should beabove 0 °C at the time condensation occurs. HT has tohave a minimum duration of 4 h in order to be counted.
• Slippery conditions due to rain or sleet on a cold road(HN)An HN situation arises when rain or sleet falls onto
a cold surface; a cold surface is a road surface below
+1.0 °C. HN has to have a minimum duration of 3 h inorder to be counted.
The reason for the different duration times for HR1 andHR2, in comparison to HT and HN, is that they occurless often in October and April. The duration period istherefore extended by 1 h during these months.
Because the definitions are set as they are in thissection, there are times when the system warns aboutslipperiness when there is no probability for slipperinessin practice. One example is when the road surfacetemperature is between 0 and +1 °C and the temperaturedoes not sink below zero. Another situation is whenthe road surface becomes cold enough (approximately−10 °C) with the result of an increased surface friction.As a result, there will be some overestimation of theoccurrence of slipperiness.
Other weather situations exist, namely, snowfall orsnowdrift, as well as a combination of snow and windthat could lead to hazardous road conditions, but theyare not considered here. However, if snow is melting, theroad becomes moist and it could, for example, becomean HT situation.
3. Results
3.1. Backgrounds
When considering road slipperiness the most dangeroustemperatures are at 0 °C (Thornes, 1991) and a fewdegrees below. To obtain an idea of how the road surfacetemperatures differed between the different regions, thefrequency of road surface temperature was calculatedusing two different temperature groups: road surfacetemperature 0 °C or below, and road surface temperaturebetween −3 and 0 °C. As latitude increases, there wasa distinct increase in the frequency of road surfacetemperatures below 0 °C. The southernmost region hasroad surface temperatures below 0 °C for 25% of thetime as compared to the northernmost region, which was75% of the time. However, the road surface temperaturesbetween −3 and 0 °C are about the same throughout thecountry (Table II). Region Skane and Region Norr havea slightly lower percentage compared to the rest in thiscategory. This depends on two different effects, RegionSkane has the fewest occurrences of 0 °C or below, andtherefore, the occurrence of temperatures between −3 and0 °C will not be so great either, Region Norr has a largenumber of occurrences of road surface temperature belowzero, but the majority are below −3 °C (Table II).
The decreasing mean air temperature in January rela-tive to increasing latitude in Sweden is shown in Figure 2.During extreme temperatures some kinds of slipperinessbecome minimal, for example, the HN type, because itis too cold for this type of precipitation. However, thevariability (standard deviation) of the mean air tempera-ture in January is as much as 4 °C in the north and only2 °C in the south (Angstrom, 1974), which indicates arather large variability in the weather that, in turn, can
Copyright 2007 Royal Meteorological Society Meteorol. Appl. 14: 297–310 (2007)DOI: 10.1002/met

302 A. K. ANDERSSON ET AL.
Table II. Percentage of road surface temperature (RST) by region as a mean for all winters, 1998–2003.
Skane Sydost Vast Stockholm Malardalen Mitt Norr
Latitude 55.9 57.2 58.3 58.5 59.5 62.1 65.6Total RST below 0 °C 25.1 37.9 38.9 41.0 44.7 64.1 75.8RST −3 to 0 17.4 23.0 21.5 25.2 23.7 24.4 19.9RST below −3 7.7 15.0 17.4 15.8 21.1 39.8 55.8
lead to increased occurrences of slipperiness dependingon advection. Earlier studies (for example, Gustavssonand Bogren, 1990) have shown that variations in tem-perature caused by a change of air masses often lead tohoarfrost. Therefore, temperature variations can be moreinteresting than mean temperatures.
Two stations were compared to show how slipperinessand changing road surface temperature are co-dependent.One station (station 2528, lat: 66°97′ long: 19°82′)was in the northern part of the country and the otherin the southern part (station 1620, lat: 58°16′ long:13°46′). The winter of 2002/2003 was studied to analysewhen slipperiness warnings were issued. Two types ofslipperiness were compared: HR2 and HT. All warningsfor the two types of slipperiness were studied, andtherefore, a period of slipperiness can last anywherebetween half an hour to several hours.
HT did not occur at all between November and Febru-ary in the northern part at station 2528, while HR2 wasvery common (Table III). This finding contradicts whatwas expected, and shows that there were more warningsfor HR2 during mid-winter than in the beginning andend of winter. HR2 in the northern station in Februaryoccurred 21 times when the temperature was rising, and10 times when the temperature fell. HT occurred only sixtimes in the northern station; thrice in October, twice inMarch and once in April.
At the southern station (1620), both types of slipper-iness are evenly distributed. One example is in Januarywhen both HR2 and HT occur seven times for both, ris-ing and falling temperatures. HT is more common in thebeginning and at the end of the winter at the southernstation, which is probably due to temperature fluctuationsaround 0 °C during these months.
In total, there are more occurrences of slipperinesswhen the temperature is rising at the northern station,while at the southern station the relationship is moreor less the same. The comparison of the two stationsshows that there is a clear connection between the type ofslipperiness, and where in the country it occurs (Table III)
3.2. Distribution of road slipperiness on the nationalscale
3.2.1. Distribution of WI
The mean values of the total number of occurrences ofslipperiness for the five studied winters 1998–2003 areshown in Figure 3. A clear distribution can be seen withthe total number of occurrences increasing towards the
Table III. Number of warnings for slippery situations with ris-ing or falling road surface temperature. HR2 = Severe hoarfrost
HT = Road icing.
Slippery Month Station 2528 Station 1620type
Rising Falling Rising Falling
Oct 3 0 0 2Nov 7 5 1 0Dec 12 16 0 0
HR2 Jan 20 10 7 7Feb 21 10 1 1Mar 6 2 0 0Apr 0 0 0 0∑
69 43 9 10Oct 3 0 4 4Nov 0 0 7 12Dec 0 0 3 5
HT Jan 0 0 7 7Feb 0 0 2 1Mar 2 0 0 2Apr 1 1 2 6∑
6 1 25 37
Figure 3. Mean value of the distribution of situations with slipperiness(WI) in Sweden for the period 1998–2003.
north. There are approximately twice as many occur-rences of road slipperiness in the northern parts of thecountry in comparison to the southern parts. One possiblecause for this variation is that winter lasts longer in thenorth than in the south, that is, there is a gradual decreasein temperature with latitude. However, another factor canbe the larger temperature variability in the north.
Copyright 2007 Royal Meteorological Society Meteorol. Appl. 14: 297–310 (2007)DOI: 10.1002/met
DISTRIBUTION OF ROAD SLIPPERINESS IN SWEDEN 303
Figure 4 shows the relation between latitude and WIfor each of the studied years, and in total for the entireperiod. The number of occurrences of slipperiness variedfrom year to year, but they all showed the same trend.The R2 value, determination coefficient, was 0.96 forall winters from 1998 to 2003. The co-variations for theseparate years are also very good (Table IV). On average,the WI increases by slightly more than 10 for each degreeof change in latitude towards the north (Figure 4). The1998/1999 winter had the highest amount of slipperinessin all regions except for Region Norr. This deviation isprobably related to the different proportions of the typesof slipperiness (Section 3.2.2).
0
50
100
150
200
250
54 56 58 60 62 64 66 68
Latitude N
Situ
atio
ns o
f WI
Figure 4. Relation between latitude and WI at the national scale.y = 10.63 × −514.83 R2 is 0.96 for the 1998/2003 period. � 1998/2003, ♦ 1998/1999, � 1999/2000, ° 2000/2001, + 2001/2002,
2002/2003.
Table IV. Determination coefficients (R2) between latitude andslipperiness during the different winter seasons (bold num-ber over 0.50) WI = Winter index HR1 = Moderate hoarfrostHR2 = Severe hoarfrost HT = Road icing HN = Rain or sleet
on a cold road.
Season WI HR1 HR2 HT HN
98/03 0.96 0.83 0.96 0.78 0.0598/99 0.78 0.54 0.93 0.87 0.6099/00 0.96 0.52 0.95 0.67 0.0200/01 0.82 0.79 0.91 0.08 0.4701/02 0.96 0.86 0.93 0.77 0.8702/03 0.98 0.93 0.99 0.65 0.12
The variations between the different years can, tosome extent, be explained by the prevailing weather inthat winter season. For example, the temperature of the2000/2001 winter was very mild all season, and precipita-tion was above normal for the whole country. This winterseason was the least slippery of all winters in the study.In contrast, the winter of 1998 came early, especially inthe northern part, and by November had arrived over thewhole country. The cold continued throughout the rest ofthe winter in the northern parts while the southern part ofthe country had mild temperatures with windy conditionsin the beginning of 1999. Thus, both on the inter-annualbasis and on the national scale, a mild and short wintergives a low WI.
3.2.2. Distribution of different types of slipperiness
The amounts for the different types of slipperiness in theseven regions are shown in Table V. The table clearlyshows that the number of occurrences of the differenttypes of slipperiness greatly varies between the differentregions. In the two regions in the northern part of thecountry, the WI contains more than 80% hoarfrost, whilein the south, Region Skane, it is only 58%. The amountof WI due to HN slipperiness type varied between 9and 18% in the different regions. The different typesof slipperiness were investigated for co-variation withlatitude in the same way as for the WI.
3.2.3. Moderate hoarfrost (HR1)
The amount of HR1 distinctly increases towards the northbut levels out in the most northern part of the country(Figure 5). The determination coefficient for HR1 as aresult of latitude varied from a value between 0.52 to0.93, and the value for all winters between 1998 and2003 was 0.83, which means that latitude can explain thedistribution quite well.
On a yearly basis, 1998/1999 has the most occurrencesof slipperiness with the exception of Region Norr; thehighest value for that region was in the winter of2002/2003. This region had a cold winter, and somemonths had very little precipitation as compared tothe normal precipitation for the years between 1961and 1990. The mild winter of 2000/2001 had the leastoccurrences of HR1 for all the regions.
Table V. Distribution of slippery conditions according to region, both in total (WI) and separately, for the different typesof conditions as a mean for all winters, 1998–2003. WI = Winter index HR1 = Moderate hoarfrost HR2 = Severe hoarfrost
HT = Road icing HN = Rain or sleet on a cold road.
Skane Sydost Vast Stockholm Malardalen Mitt Norr
Latitude 55.9 57.2 58.3 58.5 59.5 62.1 65.6WI 82 90 110 110 103 153 181HR1 37 44 50 53 51 68 70HR2 11 15 27 26 23 55 85HT 21 14 15 14 12 11 9HN 13 16 19 17 17 18 16
Copyright 2007 Royal Meteorological Society Meteorol. Appl. 14: 297–310 (2007)DOI: 10.1002/met
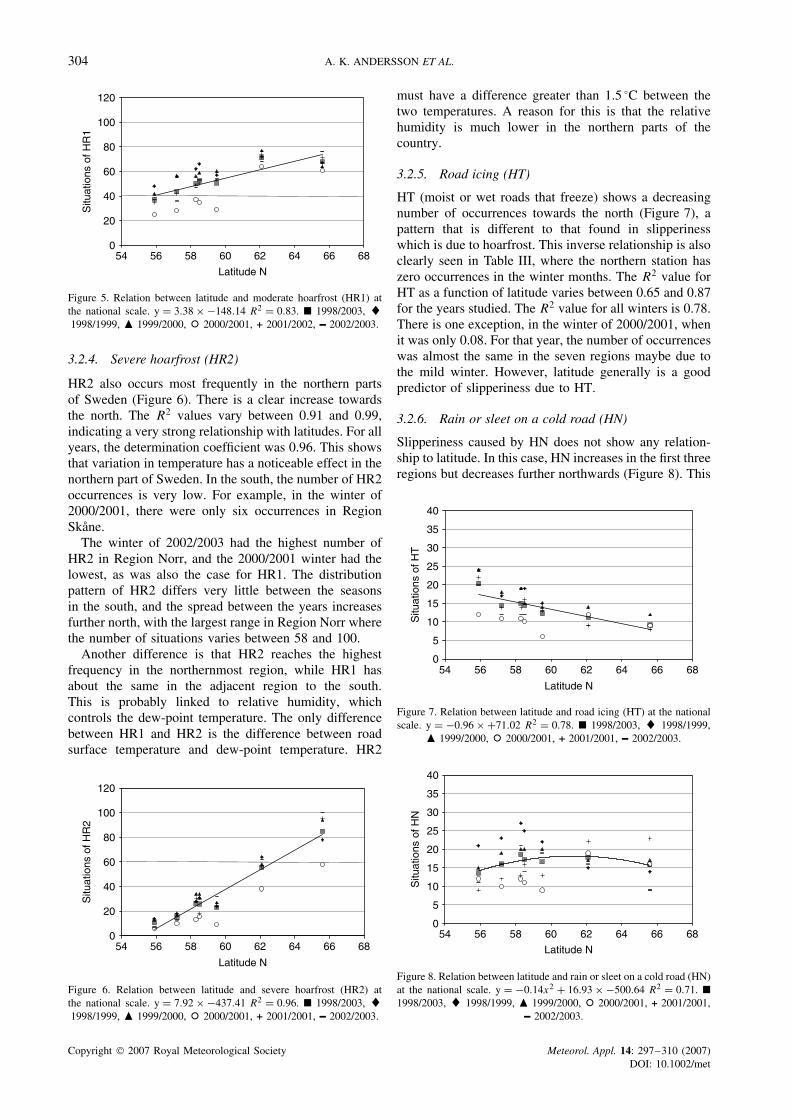
304 A. K. ANDERSSON ET AL.
0
20
40
60
80
100
120
54 56 58 60 62 64 66 68
Latitude N
Situ
atio
ns o
f HR
1
Figure 5. Relation between latitude and moderate hoarfrost (HR1) atthe national scale. y = 3.38 × −148.14 R2 = 0.83. � 1998/2003, ♦1998/1999, � 1999/2000, ° 2000/2001, + 2001/2002, 2002/2003.
3.2.4. Severe hoarfrost (HR2)
HR2 also occurs most frequently in the northern partsof Sweden (Figure 6). There is a clear increase towardsthe north. The R2 values vary between 0.91 and 0.99,indicating a very strong relationship with latitudes. For allyears, the determination coefficient was 0.96. This showsthat variation in temperature has a noticeable effect in thenorthern part of Sweden. In the south, the number of HR2occurrences is very low. For example, in the winter of2000/2001, there were only six occurrences in RegionSkane.
The winter of 2002/2003 had the highest number ofHR2 in Region Norr, and the 2000/2001 winter had thelowest, as was also the case for HR1. The distributionpattern of HR2 differs very little between the seasonsin the south, and the spread between the years increasesfurther north, with the largest range in Region Norr wherethe number of situations varies between 58 and 100.
Another difference is that HR2 reaches the highestfrequency in the northernmost region, while HR1 hasabout the same in the adjacent region to the south.This is probably linked to relative humidity, whichcontrols the dew-point temperature. The only differencebetween HR1 and HR2 is the difference between roadsurface temperature and dew-point temperature. HR2
0
20
40
60
80
100
120
54 56 58 60 62 64 66 68
Latitude N
Situ
atio
ns o
f HR
2
Figure 6. Relation between latitude and severe hoarfrost (HR2) atthe national scale. y = 7.92 × −437.41 R2 = 0.96. � 1998/2003, ♦1998/1999, � 1999/2000, ° 2000/2001, + 2001/2001, 2002/2003.
must have a difference greater than 1.5 °C between thetwo temperatures. A reason for this is that the relativehumidity is much lower in the northern parts of thecountry.
3.2.5. Road icing (HT)
HT (moist or wet roads that freeze) shows a decreasingnumber of occurrences towards the north (Figure 7), apattern that is different to that found in slipperinesswhich is due to hoarfrost. This inverse relationship is alsoclearly seen in Table III, where the northern station haszero occurrences in the winter months. The R2 value forHT as a function of latitude varies between 0.65 and 0.87for the years studied. The R2 value for all winters is 0.78.There is one exception, in the winter of 2000/2001, whenit was only 0.08. For that year, the number of occurrenceswas almost the same in the seven regions maybe due tothe mild winter. However, latitude generally is a goodpredictor of slipperiness due to HT.
3.2.6. Rain or sleet on a cold road (HN)
Slipperiness caused by HN does not show any relation-ship to latitude. In this case, HN increases in the first threeregions but decreases further northwards (Figure 8). This
0
5
10
15
20
25
30
35
40
54 56 58 60 62 64 66 68
Latitude N
Situ
atio
ns o
f HT
Figure 7. Relation between latitude and road icing (HT) at the nationalscale. y = −0.96 × +71.02 R2 = 0.78. � 1998/2003, ♦ 1998/1999,
� 1999/2000, ° 2000/2001, + 2001/2001, 2002/2003.
0
5
10
15
20
25
30
35
40
54 56 58 60 62 64 66 68
Latitude N
Situ
atio
ns o
f HN
Figure 8. Relation between latitude and rain or sleet on a cold road (HN)at the national scale. y = −0.14x2 + 16.93 × −500.64 R2 = 0.71. �1998/2003, ♦ 1998/1999, � 1999/2000, ° 2000/2001, + 2001/2001,
2002/2003.
Copyright 2007 Royal Meteorological Society Meteorol. Appl. 14: 297–310 (2007)DOI: 10.1002/met

DISTRIBUTION OF ROAD SLIPPERINESS IN SWEDEN 305
type of slipperiness also commonly shows a variationbetween the seasons. In the winter seasons of 1998/1999,1999/2000 and 2002/2003, Region Vast had the largestnumber of occurrences of slipperiness caused by HN. Inone year, the amount was higher in the southern parts,while in the following year the highest values were foundin the northern regions. Consequently, the slope of theregression line for a specific winter is either positiveor negative. For a single winter, R2 can be rather high(0.87 in 2001/2002), but when all winters are includedit is very low. However, because there seems to be acurved trend for the relationship between HN and lat-itude, a second-degree equation was fitted to the trendline for all slipperiness in all the winters between 1998and 2003. This second-degree curve gave a R2 value of0.71, which shows a better relationship between HN andlatitude than the linear trend did (i.e. HN is most commonin the middle of the country).
To summarize the results on the national scale, thelatitude factor explains slipperiness quite well. However,its influence differs according to the type of slipperiness.WI increases towards the north as do also the twotypes of hoarfrost. HT, instead, decreases northwards, andprecipitation on cold roads occurs mostly in the middleof the country, while further northward, the precipitationfalls as snow, not rain or sleet.
3.3. Distribution of road slipperiness on the regionalscale
3.3.1. Distribution of WI
As an example of the regional scale, Region Vastin southwestern Sweden was chosen (Figure 1). Thedistribution of WI follows the same pattern in RegionVast as it does on the national scale, with a strongincrease to the north.
When Region Vast is studied year by year (Figure 9),considerable differences between the counties are seen.The slipperiness in Region Vast increased towards thenortheast in the first three winter seasons, whereas in thelast two seasons the increase was more northerly.
Regressions between latitude and WI were calculatedin the same way as for the national scale. The slope of theregression line for all five winters was steeper than for
Sweden as a whole (29 days for each degree of latitude,Figure 10), and R2 was of the same magnitude (0.95).The winter with the lowest determination coefficientwas 2000/2001 with 0.76. This winter was the mildestwith the least number of occurrences in every countyexcept for Skaraborg. The variation between the yearsincreased towards the northern parts of the region. Thenorthernmost county had a difference of 90 between thehighest and the lowest number of occurrences, whileHalland had 45.
The WI for the individual stations (average overthe five winters) was also plotted against latitude, toget a more detailed view of the WI distribution. Thelatitudinal influence on WI is obvious when lookingat individual stations. However, the larger variation ofthe WI for individual stations (Figure 11) caused thedetermination coefficient to decrease to 0.53. Somestations deviated more than others, one example beingstation A (Figure 1(b)), with almost 300 occurrences. Anexplanation for the large number could be that the stationis located in an elevated, wooded area, and is thus moreoften exposed to colder temperatures. Station B, at lowerlatitude, with the highest amount of occurrences, is near alake and exposed to winds from the south and southwest,but sheltered from all other wind directions. Station Cis located on a high bridge and therefore, exposed to allwind directions. Station D, with the second highest WI
0
40
80
120
160
200
56.5 57.0 57.5 58.0 58.5 59.0 59.5 60.0 60.5
Latitude N
Situ
atio
ns o
f WI
Figure 10. Relation between latitude and WI at the regional scale. R2 is0.95 for the 1998/2003 period. y = 29.19 × −1595.75. � 1998/2003,♦ 1998/1999, � 1999/2000, ° 2000/2001, + 2001/2001, 2002/2003.
Figure 9. Distribution of slipperiness in total (WI) in Region Vast.
Copyright 2007 Royal Meteorological Society Meteorol. Appl. 14: 297–310 (2007)DOI: 10.1002/met

306 A. K. ANDERSSON ET AL.
0
50
100
150
200
250
300
350S
ituat
ions
of W
I A
B
C
D
56.5 57 57.5 58 58.5 59 59.5 60 60.5 61 61.5
Latitude N
Figure 11. Relation between latitude and WI for the separatestations A–D, for the 1998/2003 period at the regional scale.
y = 30.69 × +1680.68 R2 = 0.53.
number is located at a high, open place. In spite of this,the general trend is an increase with latitude.
As shown in Figure 2, January temperatures are higherin the coastal areas, so distance from the sea mightinfluence the WI. However, latitude and distance from thesea were not as highly related as expected (R2 value of0.54), so, including distance from the sea in the regressionhardly increases the explained variance.
3.3.2. Distribution of different types of slipperiness
Slipperiness that arises on account of both, HR1 andHR2, appears to have the same main pattern in RegionVast as for the national scale, with values increasing
towards the north. However, HR1 has a northeasterlytendency (Figure 12) while HR2 has a more northerlydirection (Figure 13). The R2 values for the distributionof hoarfrost slipperiness as a mean value for all years are0.90 for HR1 and 0.92 for severe.
Slipperiness due to HT, (Figure 14) or HN, (Figure 15)has a more diffuse pattern in Region Vast. HT has a slighttendency to increase towards the east. HN has the mostirregular pattern. The precipitation appears to be spreadevenly over the region. There is a weak trend showingan increasing degree of slipperiness towards the north forHN. For HT, the mean R2 value for all years is close tozero and for HN the value is 0.48.
To summarize the results on the regional scale, thepattern of the distribution of slipperiness is the samefor WI and hoarfrost as it was for the entire nationalscale, that is, a dependency on latitude. HT has a differentpattern with increasing values towards the east comparedto the national scale where it increased towards the south.The slipperiness type HN is evenly spread across theregion while the national scale increases a little in thefirst three regions, thereafter there is a decrease in thevalues.
3.4. Distribution of road slipperiness on the countyscale
3.4.1. Distribution of WI
The distribution of slipperiness at county scale wasstudied in Halland, the southernmost county in Region
Figure 12. Distribution of moderate hoarfrost (HR1) in Region Vast.
Figure 13. Distribution of severe hoarfrost (HR2) in Region Vast.
Copyright 2007 Royal Meteorological Society Meteorol. Appl. 14: 297–310 (2007)DOI: 10.1002/met

DISTRIBUTION OF ROAD SLIPPERINESS IN SWEDEN 307
Figure 14. Distribution of road icing (HT) in Region Vast.
Figure 15. Distribution of slipperiness caused by rain or sleet on a cold road (HN) in Region Vast.
Vast. Seventeen stations are spread over the county(Figure 1(c)). On this scale, three factors were studied:latitude, distance from the sea and altitude above sealevel.
In Figure 16, the latitude is plotted against the WI foreach station. As seen, there is no correlation between WIand latitudes in Halland.
Distance from the sea was the next factor that wasinvestigated (Figure 17). The results for this factor wereas poor as they were for latitude. As the majority of thestations in Halland are placed on major roads along thecoast, most stations are situated within 20 km from the
0
40
20
80
60
120
140
100
160
56.4 56.6 56.8 57.0 57.2 57.4 57.6
Latitude N
Situ
atio
ns o
f WI
Figure 16. Relation between latitude and WI at the county scale. R2 is0.01 for the 1998/2003 period. y = −4.34 × +317.73. � 1998/2003,♦ 1998/1999, � 1999/2000, ° 2000/2001, + 2001/2001, 2002/2003.
coastline, with the exception of three stations (Figure 1(c)Station Nos: 1330, 1331 and 1332). The range in thenumber of occurrences of slipperiness is large betweenthe different stations. The resulting correlation betweendistance from the sea and WI was zero.
The third factor that was studied was the altitude abovesea level (Figure 18). The altitude above sea level doesnot differ much from station to station. Most of thestations are situated below 50 m above sea level. In thiscase, the determination coefficient was close to zero. Thethree stations with elevations above 100 metres are thesame three stations that were furthest from the sea. These
0 10 20 30 40 50 60 70 80
Distance from sea (km)
0
40
20
80
60
120
140
100
160
Situ
atio
ns o
f WI
Figure 17. Relation between distance from sea and WI at the countyscale. R2 is 0.00 for the 1998/2003 period. y = −0.05 × +71.75.� 1998/2003, ♦ 1998/1999, � 1999/2000, ° 2000/2001, + 2001/2001,
2002/2003.
Copyright 2007 Royal Meteorological Society Meteorol. Appl. 14: 297–310 (2007)DOI: 10.1002/met

308 A. K. ANDERSSON ET AL.
50 100 150 200
Altitude above sea level (m)
00
40
20
80
60
120
140
100
160S
ituat
ions
of W
I
Figure 18. Relation between altitude above sea level and WI at thecounty scale. R2 is 0.03 for the 1998/2003 period. y = −0.04 ×+72.96. � 1998/2003, ♦ 1998/1999, � 1999/2000, ° 2000/2001,
+ 2001/2001, 2002/2003.
three stations are situated in the eastern part of Hallandclose to the border with the southern highlands.
In Figure 19, each station has an index relative tothe mean value in all stations for each year. The indexapproach was chosen to make it easier to compare if therewas any similarity in the relative frequency at the stationsbut it is not possible to find any patterns in Halland. Onestation with a high index one year has a low index thenext year, and stations close to each other can have theopposite conditions.
3.4.2. Distribution of different types of slipperiness
In spite of the results in the previous section, where noneof the tested factors could explain the distribution of WI,the different types of slipperiness were also studied inrelation to the latitude at this scale. Table VI shows thedetermination coefficients for a linear trend of latitudeand slipperiness in Halland.
HR1 increases slightly towards the north, and theincreases are still larger for HR2, i.e. the same as thenational scale. However, the determination coefficientsare very low at this scale, so latitude cannot explain thedistribution of slipperiness for the two types of hoarfrost.One explanation for this is the exposure of local climateat each station.
HT at the county scale tends to decrease with increasedlatitude. This is also the same at the national scale.The determination coefficient received the highest value(0.42) for any of the four types of slipperiness (Table VI).
Table VI. Determination coefficients (R2) between latitude andslipperiness during the different winter seasons in Halland (boldnumber over 0.50) WI = Winter index HR1 = Moderate hoar-frost HR2 = Severe hoarfrost HT = Road icing HN = Rain or
sleet on a cold road.
Season WI HR1 HR2 HT HN
98/03 0.01 0.04 0.20 0.42 0.2498/99 0.01 0.05 0.02 0.31 0.0099/00 0.01 0.00 0.02 0.02 0.1900/01 0.00 0.01 0.10 0.02 0.1501/02 0.15 0.11 0.37 0.11 0.0002/03 0.06 0.00 0.53 0.57 0.19
HN, had the second highest determination coefficientalthough it was only 0.24. There is a small trend fora decrease with latitude. This is a deviation from theother scales, where there were no particular trends forprecipitation on cold roads.
To summarize the county scale: None of the threefactors that were tested could explain the distributionof slipperiness well. In contrast to the WI for Halland,the different types of slipperiness showed that there aresome trends in the distribution of slipperiness. Both HR1and HR2 tended to slightly increase towards the north,while HT and HN tended to decrease. However, thedetermination coefficients were low, so the explanationfor the distribution of slipperiness was not good atthe county scale. There was also a comparison amongthe stations to see whether there was any similaritybetween them; for example, stations with the same type oflocation. This did not give any good co-variations either.
Studies at the county scale showed that there are toomany differences in the locations of the stations, so thedistribution of slipperiness at this scale cannot be easilyexplained. The factors that probably have the largestinfluence at this scale are the local climate at each station,the direction of the weather front and the weather types.
4. Discussion and Conclusions
A few studies have been undertaken on geographicalfactors influencing the climate in the winter months(Chapman and Thornes, 2006). Cornford and Thornes,(1996) used a modified Hulme index (Thornes, 1991)
Figure 19. Each station’s WI compared with the mean WI for every year in Halland (lat. 56° 48’ to lat. 57° 48’).
Copyright 2007 Royal Meteorological Society Meteorol. Appl. 14: 297–310 (2007)DOI: 10.1002/met

DISTRIBUTION OF ROAD SLIPPERINESS IN SWEDEN 309
and found a strong relationship between altitude abovesea level and the number of snowy days in Scotland.Eriksson and Norrman (2001) studied the influence ofdifferent types of slipperiness with distance from thesea in a rectangular area across southern Sweden. Theyshowed an evident influence of distance to the eastfrom the Swedish west coast. Both these studies are inthe same order of magnitude as Region Vast; Scotlandis approximately 25% larger and the rectangular areaacross southern Sweden is 25% smaller. However, thestrongest relationship in Region Vast was with latitude.So why do these three regions differ with respect towhich geographic variable that was most important toexplain the distributions of slipperiness? In Scotland, thealtitudes differed from sea level to 1300 m above sealevel, while in the two Swedish areas altitudes were onlyslightly above 300 m. Thus, the range in temperatureis much higher due to the differences in altitude inScotland. The area used by Eriksson and Norrman (2001)is 2.5 times the length in west–east orientation thanin south–north orientation. Distance from the sea (anddiminishing temperature) has a larger range than latitude.Finally, in the present study, the elongated shape insouth–north orientation of Region Vast favours latitude.So, the geographical variable with the largest range isthe most important factor in explaining the distributionof slipperiness in these areas of regional size.
At the national and regional scales the two hoarfrosttypes (HR1 and HR2) are related to the decrease in tem-perature with latitude. Since the relationship between airand dew-point temperature is flattened out at low temper-atures, low temperatures are not favourable for hoarfrost.However, low average temperatures often mean longwinters, and thus more occasions when hoarfrost mightdevelop. Furthermore, since the temperature variabilityis higher in the north due to the contrast of mild mar-itime air masses from the west, and cold continental airmasses to the east, the number of hoarfrost occurrencescan increase to the north. On the other hand, HT slipper-iness decreases with latitude because of a more frequentvariation of the temperature around zero degrees in thesouth. The HN slipperiness type is equally distributedthroughout the whole country.
The largest deviation between the regional scale andthe national scale is in the HT type of slipperiness, wherethe increase is to the east instead of a decrease towards thesouth. This is probably due to the difference in elevation,and therefore, a higher frequency of precipitation inland.Consequently, the roads become more moist, and thetemperatures here are usually lower compared to thecoast; therefore, ice can form.
At the county scale no particular pattern was found.On this scale, the characteristics of the location of thestations seems to be important. There are differences inthe local climate at the stations; for example, whetherthe station is open or shaded, situated on a hill orin a depression, wind-exposed or close to water. Thelocations have to be examined more carefully so thatthey can be located at similar places to obtain a more
reliable comparison between them. Studies have beenconducted during clear, calm nights on road stretcheswhere temperatures were measured and compared (forexample, Gustavsson et al., 1998; Karlsson, 2000) inorder to examine the temperature differences betweenforests and adjacent open areas.
The aim in this study was to determine if there wereparticular geographical patterns in the distribution ofslipperiness on Swedish winter roads at different scalesfor use in a model for a future study on winter roadclimate. The national scale has good correlations forlatitude, but this scale can be too large an area to beused in a model. Factors such as distance from the sea oraltitude above sea level might disappear because of thestrength of the latitudinal influence at the national scale.At the county scale, no good correlations were found forany of the factors that were tested, so it is not suitableeither. The study concludes that using the regional scaleis best in a model for future winter road climate.
The strong correlation related to latitude implies thata calculation of the general increase in WI can bemade using the equation in Figure 4. The slope of thisrelationship can be used to study the effect on a changingclimate. As shown in Figure 10, it is possible to use thisrelationship for the regional scale.
If the climate changes to warmer winters the number ofhours below 0 °C will be reduced but the number of hoursbetween −3 and 0 °C will probably increase, especiallyin the northern parts of the country (Table II).
The variation in the distribution of different kinds ofslippery conditions in Sweden means that the related costsvary accordingly. The results from this study give a broadpicture of how slipperiness is distributed in differentscales as a result of varying winter climates. These resultscan also form the basis of how a future climate changecould influence the distribution of slippery conditions inSweden. It will be possible to calculate the costs related tothe changes needed for winter maintenance. In addition, itmight be possible to establish the future costs of accidentsrelated to winter roads, as well as other disturbances thatare costly to society.
Acknowledgements
This study is financed by Climate and Mobility, which isa graduate school funded by Goteborg University. Thanksto The Royal Swedish Academy of Sciences for financialsupport.
References
Angstrom A. 1974. Sveriges klimat. Swedish, 3rd edn. ABKartografiska Institutet: Stockholm; 188.
Bogren J, Gustavsson T. 1989. Modelling of local climate forprediction of road slipperiness. Physical Geography 10: 147–164.
Carmichael CG, Gallus WA, Temeyer BR, Bryden MK. 2004. Awinter weather index for estimating winter roadway maintenancecosts in the Midwest. Journal of Applied Meteorology 43:1783–1790.
Changnon SA, Changnon D. 2005. Lessons from the unusual impactsof an abnormal winter in the USA. Meteorological Applications 12:187–191.
Copyright 2007 Royal Meteorological Society Meteorol. Appl. 14: 297–310 (2007)DOI: 10.1002/met

310 A. K. ANDERSSON ET AL.
Chapman L, Thornes JE. 2006. A Geomatics based road surfacetemperature prediction model. Science of the Total Environment 360:68–80.
Cornford D, Thornes JE. 1996. A comparison between spatial winterindices and expenditure on winter road maintenance in Scotland.International Journal of Climatology 16: 339–357.
Eriksson M, Norrman J. 2001. Analysis of station locations in aroad weather information system. Meteorological Applications 8:437–448.
Gustavsson T. 1996. Test of indices for classification of winter climate.Meteorological Applications 3: 215–222.
Gustavsson T, Bogren J. 1990. Road slipperiness during warm-airadvections. Meteorological Magazine 119: 267–270.
Gustavsson T, Karlsson M, Bogren J, Lindqvist S. 1998. Developmentof temperature pattern during nocturnal cooling. Journal of AppliedMeteorology 37: 559–571.
Heiberg Mahle A, Rogstad G. 2002. NORIKS–a winter index for nor-wegian conditions. In Proceedings of the 11th SIRWEC Conference,Sapporo, Japan, Available from: http://www.sirwec.org/conferences/sapporo2002.html [Accessed Apr 2005].
Hulme M. 1982. A new winter index and geographical variations inwinter weather. Journal of Meteorology 7: 294–300.
IPCC. 2001. Climate Change 2001: The Scientific Basis, Contributionof Working Group I to the Third Assessment Report of theIntergovernmental Panel on Climate Change. Cambridge UniversityPress: Cambridge; 881.
Karlsson IM. 2000. Nocturnal air temperature variations between forestand open areas. Journal of Applied Meteorology 39: 851–862.
Knollhoff DS, Takle ES, Gallus WA Jr, Burkheimer D, McCauley D.2003. Evaluation of a frost accumulation model. MeteorologicalApplications 10: 337–343.
Knudsen F. 1994. A winter index based on measured andobserved road weather parameters. In Proceedings of the7th SIRWEC Conference, Seefeld, Austria, Available from:http://www.sirwec.org/conferences/seefeld1994.html [Accessed Jan2007].
Lindqvist S. 1975. The influence of micro- and mesoclimatologicalfactors on ice-formation on roads. In GUNI Report 8. Department ofPhysical Geography , Gothenburg, 41, (only abstract in English).
Lindqvist S. 1979. Studies of slipperiness on roads. In GUNI Report 12.Deptartment of Physical Geography , Gothenburg, 46, (only abstractin English).
Moller S. 2002. Ersattningsmodell for vintervaghallning baserad pavaderdata fran VViS. VTI notat 30-2002. Statens vag- ochtransportforskningsinstitut. Linkoping 2002, in swedish.
Norrman J. 2000. Slipperiness on roads–an expert system classifica-tion. Meteorological Applications 7: 27–36.
Raisanen J, Hansson U, Ullerstig A, Doscher R, Graham LP, Jones C,Meier M, Samuelsson P, Willen U. 2003. GCM driven simulationsof recent and future climate with the Rossby Centre coupledatmosphere–Baltic Sea regional climate model RCAO. SMHI–RMKNo. 101. ISSN: 0347-2116 SMHI Reports Meteorology Climatology,61.
Scottish Road Network. 2005. Scottish Road Network Climate ChangeStudy . The Scottish Executive. ISBN: 0-7559-4652-9 Availablefrom: http://www.scotland.gov.uk [Accessed Oct 2005].
SMHI. 1998. Vader och vatten. Vaderaret 1998. SMHI. Nr 13/1998.SMHI. 1999. Vader och vatten. Vaderaret 1999. SMHI. Nr 13/1999.SMHI. 2000. Vader och vatten. Vaderaret 2000. SMHI. Nr 13/2000.SMHI. 2001. Vader och vatten. Vaderaret 2001. SMHI. Nr 13/2001.SMHI. 2002. Vader och vatten. Vaderaret 2002. SMHI. Nr 13/2002.SMHI. 2003. Vader och vatten. Vaderaret 2003. SMHI. Nr 13/2003.SMHI. 2005. Medeltemperaturen 1961-1990 januari. in Swedish.
Available from: http://www.smhi.se [Accessed Jun 2005].SMHI. 2006. Frost. in swedish. Available from: http://www.smhi.se
[Accessed Mar 2006].SRA. 2006. Vagverket Arsredovisning 2005 . Publication 2006 : 21E.
ISSN 1401-9612. Also available from: http://www.vv.se/filer/2181/annual report 05.pdf [Accessed Jun 2006].
Strong C, Shvetsov Y. 2006. Development of roadway weather severityindex. Transportation Research Record 1948: 161–169.
Thornes JE. 1991. Thermal mapping and road-weather informationsystems for highway engineers. In Highway Meteorology. E & FNSpon: London; 39–67.
Venalainen A, Kangas M. 2003. Estimation of winter road maintenancecosts using climate data. Meteorological Applications 10: 69–73.
Copyright 2007 Royal Meteorological Society Meteorol. Appl. 14: 297–310 (2007)DOI: 10.1002/met
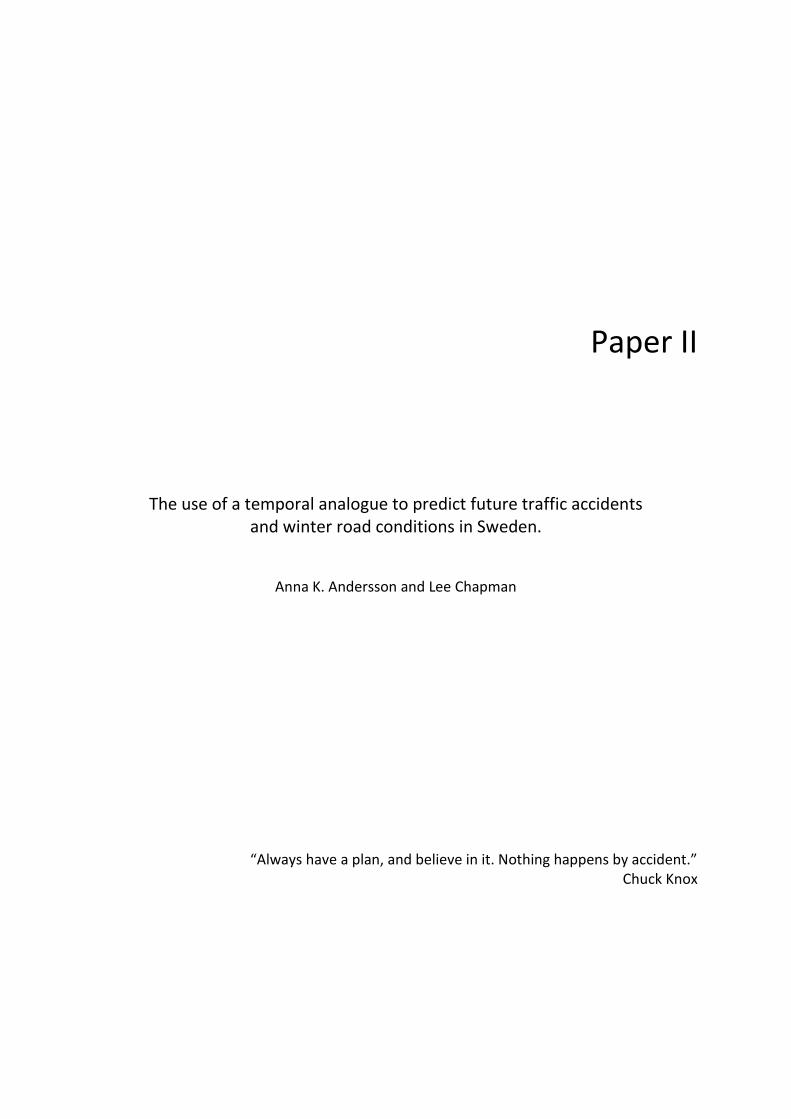
Paper II
The use of a temporal analogue to predict future traffic accidents and winter road conditions in Sweden.
Anna K. Andersson and Lee Chapman
“Always have a plan, and believe in it. Nothing happens by accident.” Chuck Knox

The use of a temporal analogue to predict future traffic accidents and winter road conditions in Sweden |1
The use of a temporal analogue to predict future traffic accidents and winter road conditions in Sweden
Anna K. Andersson & Lee Chapman
Abstract Slippery roads due to ice and snow are a major cause of road traffic accidents in Sweden during the winter months. This paper investigates the hypothesis that as the climate becomes increasingly milder there will be a reduction in the number of accidents in winter. Two winters are compared in this analysis; one colder and drier than average, the other warmer and wetter than average. Despite the differences in weather between the two months, there was approximately the same number of accidents in both cases, although the exact cause of these accidents varied. It is concluded that using the warmer month as a temporal analogue, the accident rate in Sweden will not be reduced under current climate change scenarios. This result is attributed to the fact that drivers become more complacent in milder weather conditions where the risk of slippery roads is reduced. Keywords: Road traffic accident, winter maintenance, slipperiness, climate change
1. Introduction During the three year period 2003 to 2005, there were approximately 54,000 traffic accidents reported in Sweden where people were fatally or seriously injured (Swedish Institute for Transport and Communications Analysis: SIKA, 2006). There have been numerous studies into the effects of different weather conditions on traffic accidents in a variety of countries (e.g. Edwards, 1999; Keay and Simmonds, 2005; Andrey and Olley, 1990). In particular, rain has been shown to be a major factor (Andreescu and Frost, 1998; Fridström et al., 1995; Andrey and Yagar, 1993), with some studies showing a doubling in the baseline accident rate during rainfall (Brodsky and Hakkert, 1988; Bertness, 1980). Other than rainfall, wind, fog, low sun, snow, ice and even hot temperatures (e.g. Saudi Arabian summer >34°C) can be a contributory factor in road accidents (Nofal and Saeed, 1997). However, winter-time in Scandinavia, the major weather related cause of road accidents is snow and ice. Despite Sweden, being well prepared for winter weather, some 45% of the total number of accidents reported during 2003 to 2005 occurred during the winter season (SIKA, 2006). This figure is in agreement with the work of Bogren et al. (2006) who established that 52% of road accidents occurring across two winter seasons in Sweden were caused by reduced road friction. Of the ten different types of slipperiness identified by Norrman et al. (2000), precipitation on an already frozen surface posed the highest risk, whereas hoarfrost or drifting snow the lowest risk. Similarly, Smith (1982) showed an increase of just 2.2% in the amount of traffic accidents on snowy days. These findings contradict other studies which have shown that snow could potentially double accident rates (e.g. Codling, 1974; Andreescu and Frost, 1998; Suggett, 1999; Nokhandan et al. 2008). With respect
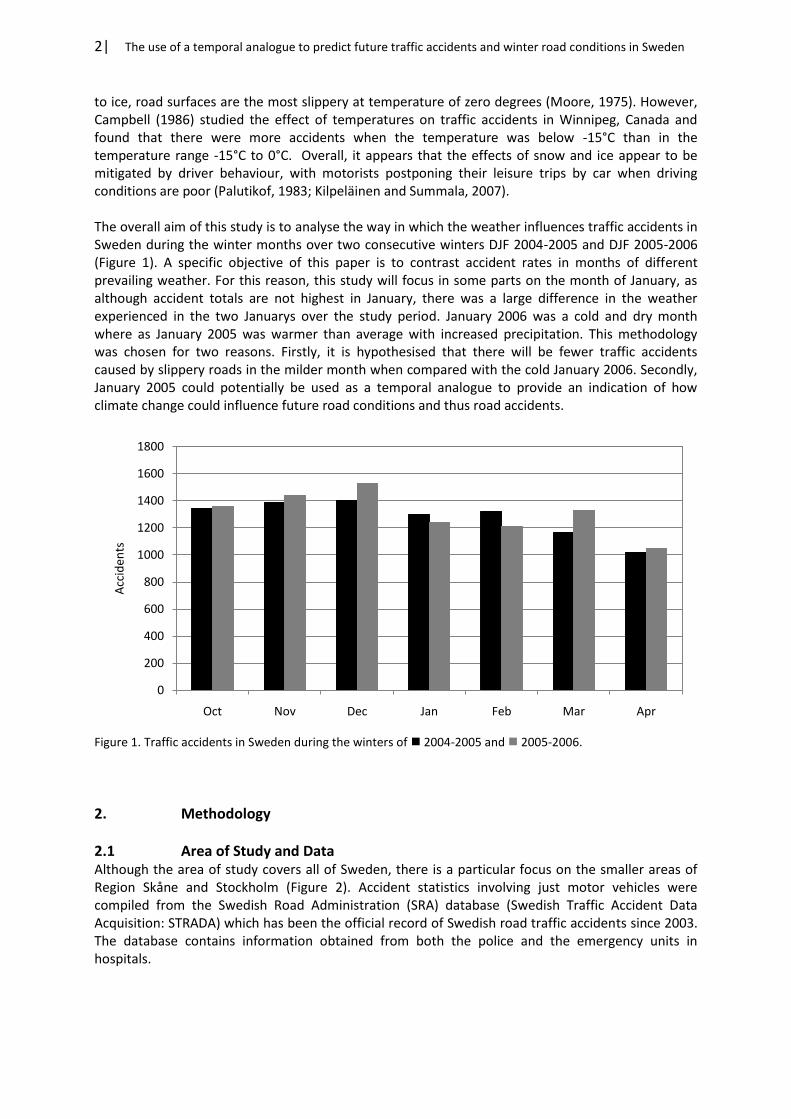
2| The use of a temporal analogue to predict future traffic accidents and winter road conditions in Sweden
to ice, road surfaces are the most slippery at temperature of zero degrees (Moore, 1975). However, Campbell (1986) studied the effect of temperatures on traffic accidents in Winnipeg, Canada and found that there were more accidents when the temperature was below -15°C than in the temperature range -15°C to 0°C. Overall, it appears that the effects of snow and ice appear to be mitigated by driver behaviour, with motorists postponing their leisure trips by car when driving conditions are poor (Palutikof, 1983; Kilpeläinen and Summala, 2007). The overall aim of this study is to analyse the way in which the weather influences traffic accidents in Sweden during the winter months over two consecutive winters DJF 2004-2005 and DJF 2005-2006 (Figure 1). A specific objective of this paper is to contrast accident rates in months of different prevailing weather. For this reason, this study will focus in some parts on the month of January, as although accident totals are not highest in January, there was a large difference in the weather experienced in the two Januarys over the study period. January 2006 was a cold and dry month where as January 2005 was warmer than average with increased precipitation. This methodology was chosen for two reasons. Firstly, it is hypothesised that there will be fewer traffic accidents caused by slippery roads in the milder month when compared with the cold January 2006. Secondly, January 2005 could potentially be used as a temporal analogue to provide an indication of how climate change could influence future road conditions and thus road accidents.
Figure 1. Traffic accidents in Sweden during the winters of 2004-2005 and 2005-2006.
2. Methodology
2.1 Area of Study and Data Although the area of study covers all of Sweden, there is a particular focus on the smaller areas of Region Skåne and Stockholm (Figure 2). Accident statistics involving just motor vehicles were compiled from the Swedish Road Administration (SRA) database (Swedish Traffic Accident Data Acquisition: STRADA) which has been the official record of Swedish road traffic accidents since 2003. The database contains information obtained from both the police and the emergency units in hospitals.
0
200
400
600
800
1000
1200
1400
1600
1800
Oct Nov Dec Jan Feb Mar Apr
Acc
iden
ts

The use of a temporal analogue to predict future traffic accidents and winter road conditions in Sweden |3
Figure 2. Map of Sweden divided in seven regions. Area of Stockholm (grey).
All climate data used in this study is obtained directly from outstations of the Swedish Road Weather Information System (RWIS). The system presently consists of approximately 720 stations situated along the major roads in the country. Each outstation routinely collects information about road surface temperature, air temperature, relative humidity, precipitation and wind speed and direction. Data are collected every 30 minutes during the winter months and stored in a central database at the SRA. Data have been collected in this way since the mid-1980s, but a recent development has seen the inclusion of a camera at around 200 of the outstations to aid monitoring of the surface state of the road. In this study, each recorded accident is spatially joined in a Geographical Information System (GIS) to the nearest RWIS outstation. By using this approach, the prevailing weather and conditions (type of slipperiness) at the time of the accident can be determined. A decision was taken to analyse the prevailing weather for the previous two hours to determine the cause of the accident as this was considered to be more representative than a simple snapshot of the weather at the time of the accident. Furthermore, it is hypothesised that often the cause of the accident would be a sudden change in the weather. This would then be captured in the two hour time interval. There are some limitations with this approach. Firstly, due to the 30 minute time interval used by outstations, the nearest time interval to the accident time needs to be used. Secondly, there is also the potential for error due to the location of the RWIS outstation often being several kilometres away from the scene of the accident and therefore potentially experiencing different local weather.
2.2 Different types of slipperiness For this study, road slipperiness has been subdivided into four types in which the road surface temperature should be lower than 0°C. These four categories are the same as used by Andersson et al. (2007), with a minor change to the +1°C threshold to 0°C and are based on the scheme used by the SRA in their decision−making for maintenance activities i.e. salting or ploughing (Möller, 2002). The different slipperiness types have the following definitions (for further details see Andersson et al. 2007): Slippery conditions due to moderate hoarfrost (HR1) The road surface temperature should be 0.5°C to 2°C lower than the dew−point temperature. Slippery conditions due to severe hoarfrost (HR2) The road surface temperature should be at least 2°C lower than the dew−point temperature.

4| The use of a temporal analogue to predict future traffic accidents and winter road conditions in Sweden
Slippery conditions due to road icing (HT) Moist/wet road surface due to rain/sleet, melting snow or condensation of dew and a temperature drop below 0°C. Slippery conditions due to rain or sleet on a cold road (HN) Rain or sleet falls onto a road surface below 0°C. Where there has been a situation of at least one of these four types it is referred to as MIPS (MIPS is an abbreviation for the four types of slipperiness, Moderate hoarfrost, road Ice, Precipitation and Severe hoarfrost). However, there are also three types of precipitation (snow, freezing rain and sleet) that can contribute to a slippery road. These are also taken into account and are used in the comparisons of how the different road conditions influence the amount of traffic accidents. The different precipitation types Snow, Freezing rain and Sleet is obtained from the RWIS−stations precipitation sensors, which measure both the amount and type of precipitation.
3. Baseline Weather Conditions The two winters used in this study can be described as mild and above average (2004−2005) and one (2005−2006) more like baseline average (1961−1990). Both winters experienced similar weather in December and February. However, there was a large contrast in the weather experienced in January. For this reason, the study focuses on the two January months. The average January mean temperature in Sweden (Figure 3a) has a range from zero in the south to below −16°C in the north (SMHI, 2005a) with an overall average of −6.5°C (SMHI, 2006a). The average precipitation range is from below 40 mm in the northern part of the country (Figure 3b) to over 100 mm in some of the mountain areas (north-west), the whole country has an average of 46 mm of precipitation in January (SMHI, 2006a).
Figure 3. a) Average mean air temperature b) average precipitation in January 1961−1990 redrawn from SMHI (2005a) and SMHI (2007a)
January 2005 Most of the month had mild winds from the west with frequent precipitation. It was particularly windy in the south of Sweden and in mountainous areas. The month started with temperatures well above average, although during the later part of the month the temperatures were more normal. Overall, temperatures in the northern and middle part of the country were 5−8°C above average and

The use of a temporal analogue to predict future traffic accidents and winter road conditions in Sweden |5
the southern part 3−5°C degrees above average (Figure 4a). With the exception of the south of the country, precipitation was also above average in many parts of the country. This was falling often as rain, even in the north of the country (SMHI, 2005). January 2006 Although, the north of the country had a mild month, locally 6°C above average, further south, temperatures were average, with the southernmost parts of the country up to 2°C below average. Precipitation was also below average, with the exception being mountainous areas where it was locally up to double the normal amount. In the south parts and along the east coast the precipitation was half of the average amounts (Figure 4d) (SMHI, 2006).
Figure 4. a) Deviation from normal mean air temperature in January 1961−1990 in January 2005 and b) 2006 c) percentage of precipitation compared with normal mean precipitation in January 1961−1990 in January 2005 and d) 2006 redrawn from SMHI (2007).
3.1 Road surface temperatures Typical road surface temperatures for the January months of the study period are shown in Figure 5.
Figure 5. Road surface temperatures in a) January 2005 and b) January 2006
The temperatures are taken from the RWIS outstations and calculated to a mean value for each month before being spatially interpolated. (NB: The accuracy of the interpolations is increasingly

6| The use of a temporal analogue to predict future traffic accidents and winter road conditions in Sweden
accurate in the south of the country due to the denser network of outstations in these regions). Figure 5 shows that the overall pattern for the two months is as expected with road surface temperature reducing with latitude. However, there is a clear difference in the magnitude of temperatures between the two months, especially in the southern parts of the country, with January 2005 being typically 2-4°C warmer than January 2006. Notably, the southernmost part of the country had a mean temperature above 0°C.
4. Results & Discussion
4.1 Accident Distribution There were 3987 traffic accidents in December 2004 to February 2005 (3897 with available position data), the following winter (2005−2006) had 3922 traffic accidents whereof 3803 with available position data. In January 2005, there were a total of 1253 accidents compared with 1179 in January 2006. The distribution of these accidents is shown in Figure 6 and is indicative of the general pattern of an increased number of accidents located at major urban centres and highways.
a) b) Figure 6. Accident positions in a) 2004-2005 and b) 2005-2006
4.2 Temperature Distribution Using the RWIS outstation data, the mean air temperature in January 2005 was −0.19°C compared with −4.03°C in January 2006. Air temperatures were below 0°C for just 53% of the time in January 2005 compared to 81% in January 2006. With respect to MIPS or Snow (i.e. the percentage of the presence of at least one slipperiness type or snow) this stands at 22.1% and 28.9% for January 2005 and 2006 respectively.

The use of a temporal analogue to predict future traffic accidents and winter road conditions in Sweden |7
As a first step to ascertain whether there are fewer weather related accidents in the milder month of January 2005, the number of accident was plotted as a cumulative percentage for each degree of the road surface temperature at the time of the accidents (Figure 7).
Figure 7. Road surface temperatures when the accidents occurred in cumulative percentage 2004-2005 2005-2006
Although there are other factors to take into account when deducing the slipperiness of the road, this simple analysis of surface temperature provides a basic comparison between the two years. Ultimately, road surface temperature is the most important prerequisite in order to get a slippery road surface, since a road cannot become slippery if the surface temperature is over 0°C. Figure 7 shows that 66% of the accidents in 2004−2005 were caused when the surface temperatures was below 0°C compared to 81% in 2005−2006. The difference in surface temperature between the two years is clear and shows that the road surface temperatures were generally higher when an accident occurred in 2004−2005 than in 2005−2006. If the months of January is excerpted the percentage is in the same range as it were for the three months (64% resp. 88%). It is accepted that the most dangerous temperature when it comes to slippery roads is when the road surface is around or just below 0°C (Thornes, 1991). The distribution of traffic accidents at various thresholds is shown in Table I. There is actually little difference between the two years for temperatures between 0 and -3°C (when ice is most slippery: Moore, 1975). Only when the interval is increased further do the differences become more apparent. Table I. Road surface temperature (RST) while traffic accident (in percent).
RST below 0°C RST −3 to 0 RST −5 to 0
Jan 2005 63.7 34.9 46.1 Jan 2006 87.7 35.3 54.6
2004-2005 56.6 34.8 45.8 2005-2006 75.2 39.2 55.1
4.3 Distribution of slipperiness In order to analyse if the amount of accidents increased or decreased in different parts of the country from 2004−2005 to 2005−2006, Sweden was subdivided into the seven SRA regions
0
10
20
30
40
50
60
70
80
90
100
-15-14-13-12-11-10 -9 -8 -7 -6 -5 -4 -3 -2 -1 0 1 2 3 4 5 6 7 8 9 10 11 12 13 14 15
Acc
iden
ts %
Road surface temperature
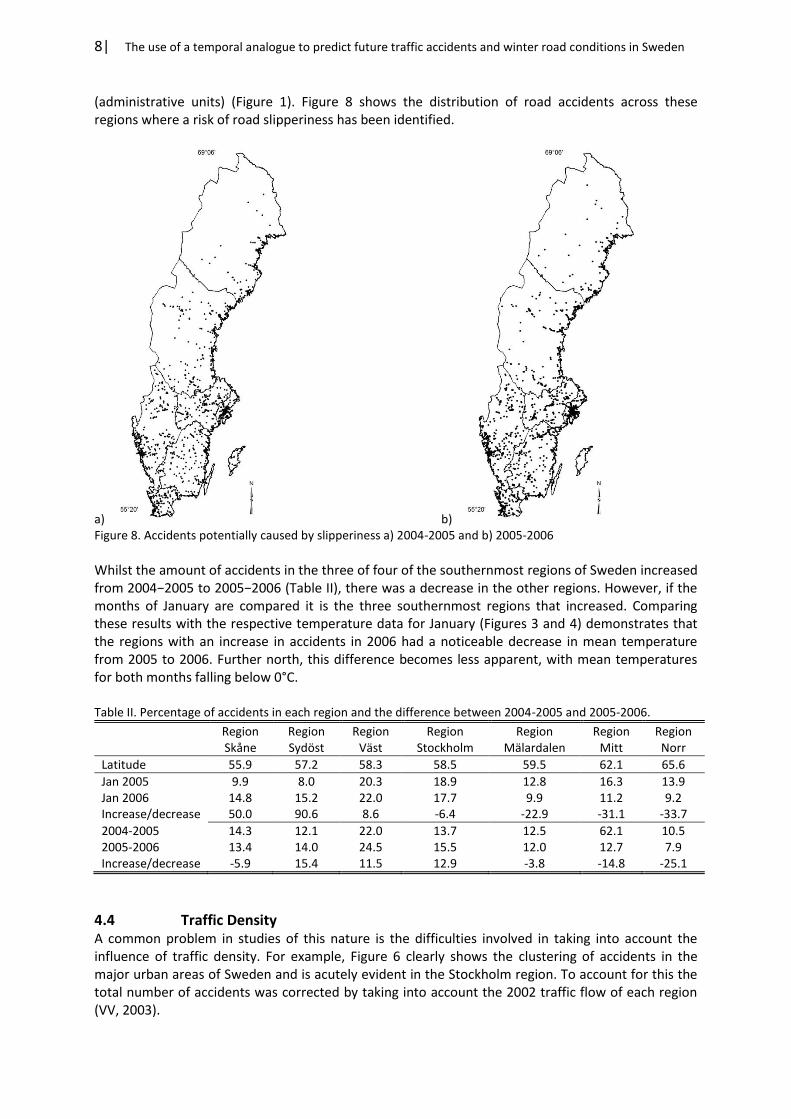
8| The use of a temporal analogue to predict future traffic accidents and winter road conditions in Sweden
(administrative units) (Figure 1). Figure 8 shows the distribution of road accidents across these regions where a risk of road slipperiness has been identified.
a) b) Figure 8. Accidents potentially caused by slipperiness a) 2004-2005 and b) 2005-2006
Whilst the amount of accidents in the three of four of the southernmost regions of Sweden increased from 2004−2005 to 2005−2006 (Table II), there was a decrease in the other regions. However, if the months of January are compared it is the three southernmost regions that increased. Comparing these results with the respective temperature data for January (Figures 3 and 4) demonstrates that the regions with an increase in accidents in 2006 had a noticeable decrease in mean temperature from 2005 to 2006. Further north, this difference becomes less apparent, with mean temperatures for both months falling below 0°C. Table II. Percentage of accidents in each region and the difference between 2004-2005 and 2005-2006.
Region Skåne
Region Sydöst
Region Väst
Region Stockholm
Region Mälardalen
Region Mitt
Region Norr
Latitude 55.9 57.2 58.3 58.5 59.5 62.1 65.6
Jan 2005 9.9 8.0 20.3 18.9 12.8 16.3 13.9 Jan 2006 14.8 15.2 22.0 17.7 9.9 11.2 9.2 Increase/decrease 50.0 90.6 8.6 -6.4 -22.9 -31.1 -33.7
2004-2005 14.3 12.1 22.0 13.7 12.5 62.1 10.5 2005-2006 13.4 14.0 24.5 15.5 12.0 12.7 7.9 Increase/decrease -5.9 15.4 11.5 12.9 -3.8 -14.8 -25.1
4.4 Traffic Density A common problem in studies of this nature is the difficulties involved in taking into account the influence of traffic density. For example, Figure 6 clearly shows the clustering of accidents in the major urban areas of Sweden and is acutely evident in the Stockholm region. To account for this the total number of accidents was corrected by taking into account the 2002 traffic flow of each region (VV, 2003).
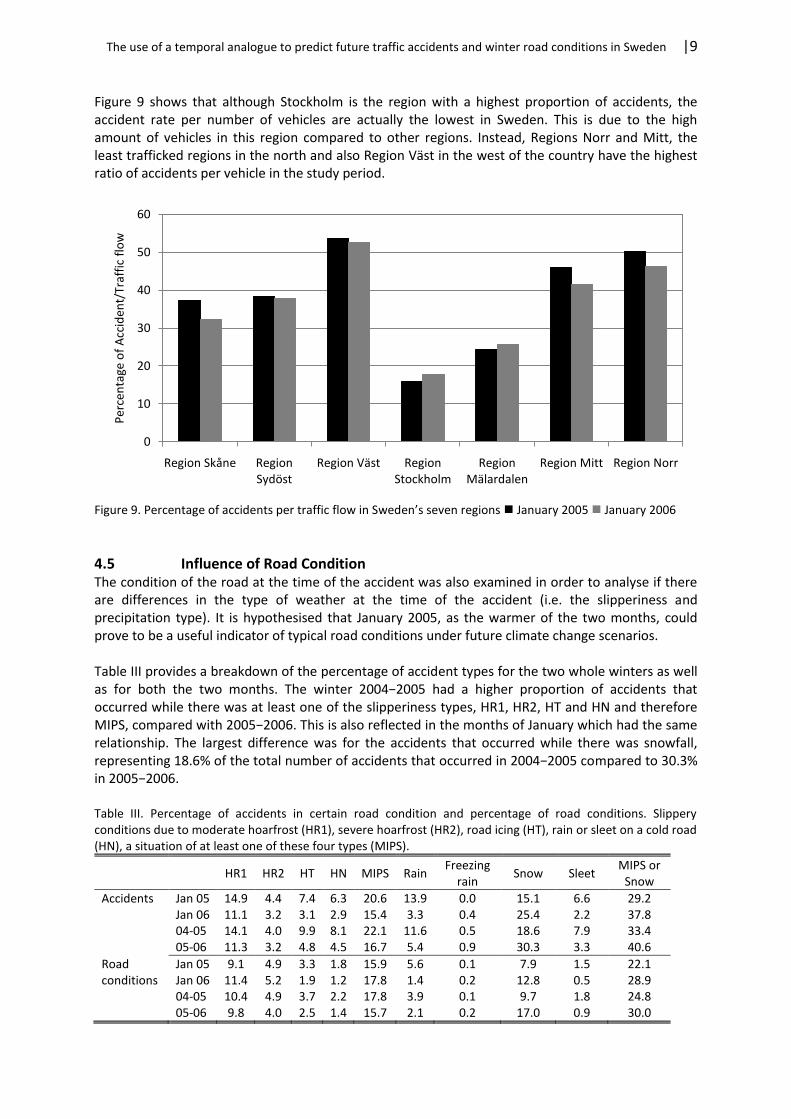
The use of a temporal analogue to predict future traffic accidents and winter road conditions in Sweden |9
Figure 9 shows that although Stockholm is the region with a highest proportion of accidents, the accident rate per number of vehicles are actually the lowest in Sweden. This is due to the high amount of vehicles in this region compared to other regions. Instead, Regions Norr and Mitt, the least trafficked regions in the north and also Region Väst in the west of the country have the highest ratio of accidents per vehicle in the study period.
Figure 9. Percentage of accidents per traffic flow in Sweden’s seven regions January 2005 January 2006
4.5 Influence of Road Condition The condition of the road at the time of the accident was also examined in order to analyse if there are differences in the type of weather at the time of the accident (i.e. the slipperiness and precipitation type). It is hypothesised that January 2005, as the warmer of the two months, could prove to be a useful indicator of typical road conditions under future climate change scenarios. Table III provides a breakdown of the percentage of accident types for the two whole winters as well as for both the two months. The winter 2004−2005 had a higher proportion of accidents that occurred while there was at least one of the slipperiness types, HR1, HR2, HT and HN and therefore MIPS, compared with 2005−2006. This is also reflected in the months of January which had the same relationship. The largest difference was for the accidents that occurred while there was snowfall, representing 18.6% of the total number of accidents that occurred in 2004−2005 compared to 30.3% in 2005−2006. Table III. Percentage of accidents in certain road condition and percentage of road conditions. Slippery conditions due to moderate hoarfrost (HR1), severe hoarfrost (HR2), road icing (HT), rain or sleet on a cold road (HN), a situation of at least one of these four types (MIPS).
HR1 HR2 HT HN MIPS Rain Freezing
rain Snow Sleet
MIPS or Snow
Accidents Jan 05 14.9 4.4 7.4 6.3 20.6 13.9 0.0 15.1 6.6 29.2 Jan 06 11.1 3.2 3.1 2.9 15.4 3.3 0.4 25.4 2.2 37.8 04-05 14.1 4.0 9.9 8.1 22.1 11.6 0.5 18.6 7.9 33.4 05-06 11.3 3.2 4.8 4.5 16.7 5.4 0.9 30.3 3.3 40.6
Road Jan 05 9.1 4.9 3.3 1.8 15.9 5.6 0.1 7.9 1.5 22.1 conditions Jan 06 11.4 5.2 1.9 1.2 17.8 1.4 0.2 12.8 0.5 28.9 04-05 10.4 4.9 3.7 2.2 17.8 3.9 0.1 9.7 1.8 24.8 05-06 9.8 4.0 2.5 1.4 15.7 2.1 0.2 17.0 0.9 30.0
0
10
20
30
40
50
60
Region Skåne Region Sydöst
Region Väst Region Stockholm
Region Mälardalen
Region Mitt Region Norr
Per
cen
tage
of
Acc
iden
t/Tr
affi
c fl
ow

10| The use of a temporal analogue to predict future traffic accidents and winter road conditions in Sweden
A similar pattern is exhibited for MIPS or Snow of 33.4% and 40.6% respectively. Table III also provides information pertaining to the actual frequency of the slipperiness types. The general trend appears to mirror the distribution of accidents in each class, with MIPS or Snow being the primary cause of road traffic accidents. Stepping down from the national picture of Sweden, the analysis was repeated at a smaller scale for the heavily trafficked area of Stockholm (Figure 10a). Interestingly, the results were comparable to those obtained for the whole of Sweden, with snow accounting for 18.3% of accidents in 2004−2005 (17.2% January 2005) compared with 27.2% in 2005−2006 (23.8% January 2006). For the category MIPS or Snow it was 27.2% and 34.3% for respectively winter. Region Skåne (in the more marginal south of Sweden) presents a similar picture (Figure 10b). a)
b)
Figure 10. Percentage of accidents in different road conditions in a) Stockholm and b) Region Skåne 2004-2005 2005-2006 January 2005 January 2006
0
5
10
15
20
25
30
35
40
HR1 HR2 HT HN MIPS Rain Freezing rain
Snow Sleet MIPS or Snow
% A
ccid
ents
Road condition
0
5
10
15
20
25
30
35
40
HR1 HR2 HT HN MIPS Rain Freezing rain
Snow Sleet MIPS or Snow
% A
ccid
ents
Road condition
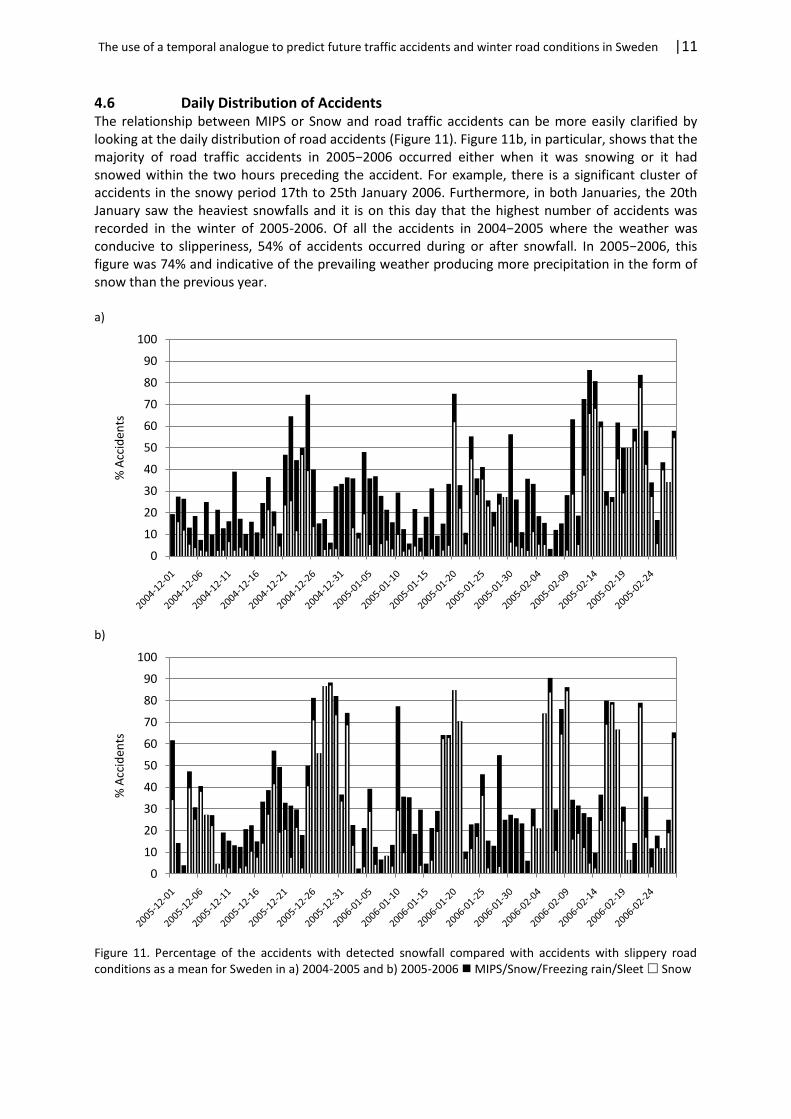
The use of a temporal analogue to predict future traffic accidents and winter road conditions in Sweden |11
4.6 Daily Distribution of Accidents The relationship between MIPS or Snow and road traffic accidents can be more easily clarified by looking at the daily distribution of road accidents (Figure 11). Figure 11b, in particular, shows that the majority of road traffic accidents in 2005−2006 occurred either when it was snowing or it had snowed within the two hours preceding the accident. For example, there is a significant cluster of accidents in the snowy period 17th to 25th January 2006. Furthermore, in both Januaries, the 20th January saw the heaviest snowfalls and it is on this day that the highest number of accidents was recorded in the winter of 2005-2006. Of all the accidents in 2004−2005 where the weather was conducive to slipperiness, 54% of accidents occurred during or after snowfall. In 2005−2006, this figure was 74% and indicative of the prevailing weather producing more precipitation in the form of snow than the previous year. a)
b)
Figure 11. Percentage of the accidents with detected snowfall compared with accidents with slippery road conditions as a mean for Sweden in a) 2004-2005 and b) 2005-2006 MIPS/Snow/Freezing rain/Sleet Snow
0
10
20
30
40
50
60
70
80
90
100
% A
ccid
ents
0
10
20
30
40
50
60
70
80
90
100
% A
ccid
ents
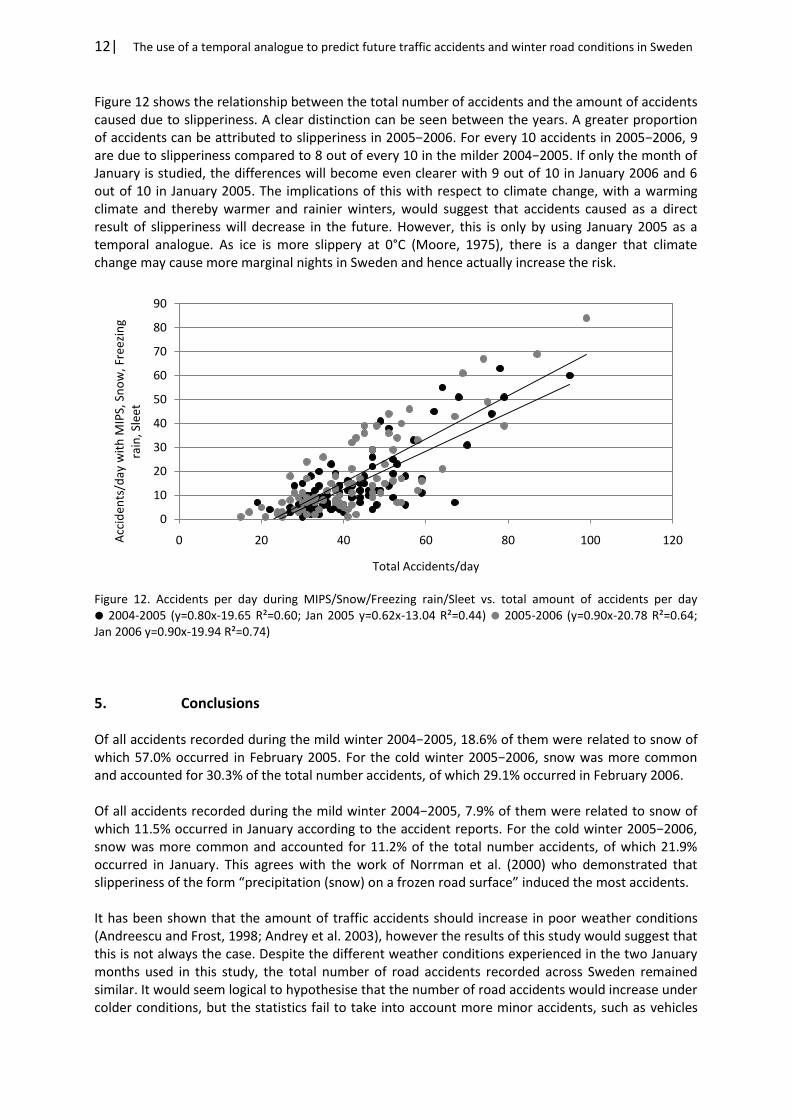
12| The use of a temporal analogue to predict future traffic accidents and winter road conditions in Sweden
Figure 12 shows the relationship between the total number of accidents and the amount of accidents caused due to slipperiness. A clear distinction can be seen between the years. A greater proportion of accidents can be attributed to slipperiness in 2005−2006. For every 10 accidents in 2005−2006, 9 are due to slipperiness compared to 8 out of every 10 in the milder 2004−2005. If only the month of January is studied, the differences will become even clearer with 9 out of 10 in January 2006 and 6 out of 10 in January 2005. The implications of this with respect to climate change, with a warming climate and thereby warmer and rainier winters, would suggest that accidents caused as a direct result of slipperiness will decrease in the future. However, this is only by using January 2005 as a temporal analogue. As ice is more slippery at 0°C (Moore, 1975), there is a danger that climate change may cause more marginal nights in Sweden and hence actually increase the risk.
Figure 12. Accidents per day during MIPS/Snow/Freezing rain/Sleet vs. total amount of accidents per day 2004-2005 (y=0.80x-19.65 R²=0.60; Jan 2005 y=0.62x-13.04 R²=0.44) 2005-2006 (y=0.90x-20.78 R²=0.64; Jan 2006 y=0.90x-19.94 R²=0.74)
5. Conclusions Of all accidents recorded during the mild winter 2004−2005, 18.6% of them were related to snow of which 57.0% occurred in February 2005. For the cold winter 2005−2006, snow was more common and accounted for 30.3% of the total number accidents, of which 29.1% occurred in February 2006. Of all accidents recorded during the mild winter 2004−2005, 7.9% of them were related to snow of which 11.5% occurred in January according to the accident reports. For the cold winter 2005−2006, snow was more common and accounted for 11.2% of the total number accidents, of which 21.9% occurred in January. This agrees with the work of Norrman et al. (2000) who demonstrated that slipperiness of the form “precipitation (snow) on a frozen road surface” induced the most accidents. It has been shown that the amount of traffic accidents should increase in poor weather conditions (Andreescu and Frost, 1998; Andrey et al. 2003), however the results of this study would suggest that this is not always the case. Despite the different weather conditions experienced in the two January months used in this study, the total number of road accidents recorded across Sweden remained similar. It would seem logical to hypothesise that the number of road accidents would increase under colder conditions, but the statistics fail to take into account more minor accidents, such as vehicles
0
10
20
30
40
50
60
70
80
90
0 20 40 60 80 100 120Acc
iden
ts/d
ay w
ith
MIP
S, S
no
w, F
reez
ing
rain
, Sle
et
Total Accidents/day

The use of a temporal analogue to predict future traffic accidents and winter road conditions in Sweden |13
gently slipping of the road or the fact that motorists will adopt a more cautious driving style in poor conditions. For example, Edwards (1999a) saw that the average speed was reduced 4.4% when it was rain compared with when it was fine weather. This is perhaps demonstrated by the fact that there was 5.2% more accidents caused by slippery roads in the milder January 2005 compared with the same month in 2006. Alternatively, this may simply be a consequence of the increased marginality of the weather in January 2005. With respect to slipperiness, although the most dangerous road surface temperature has been shown to be 0°C, this study shows that it is actually temperatures below -3°C where accidents are more prevalent. Putting this in a future perspective, assuming increased winter air temperatures of 3.8 to 5.5°C in Sweden over the next century (Räisänen et al. 2003), the number of accidents due to slipperiness should actually decrease. This will be a direct consequence of reduced snowfall, and higher overall temperatures. Indeed, accidents related to slipperiness could become quite uncommon in the south of Sweden as the climate becomes increasingly marginal. In this instance, a spatial analogue could be useful to make a first approximation of the future situation in Sweden. In the marginal climate of the UK, 2.8% of all traffic accidents are attributed to snow, with 25-40% of them occurring in the month of January (Edwards, 1999). The highest proportion recorded in the UK occurs in County Durham, in NE England where 5.9% of all accidents are attributed to snow (Edwards, 1996). These figures are small when compared to Sweden. Even in the mild January of 2005, 15.1% of accidents were attributed to snow (in 2006 it was 25.4%). There is some potential to maybe study the winter climate of the UK as a spatial analogue for climate change in Sweden. In summary, although the number of severe accidents attributed to slipperiness will reduce in a warming climate, this does not automatically mean that the total number of accidents will decline. Using January 2005 as a temporal analogue clearly shows that this is not the case. Furthermore, a large number of accidents can not be explained due to the prevailing weather. In the two winters used in this study, 65.3% respective 58.8% of accidents could not be explained by the weather. Overall, climate change should reduce the number of accidents related to slipperiness and will may reduce the burden of winter road maintenance by reducing the number of frost days. However, it is highly likely that the number of problematic marginal nights (where ice is most slippery) will remain the same. Whilst studies indicate that motorists modify their driving to compensate for conditions today, the motorists of the future may grow complacent and lack the skills to cope with extreme events which will still occur, even in a milder climate.
Acknowledgements This study is financed by Climate and Mobility, which is a graduate school funded by Göteborg University. Thanks to Lisbeth Hansson at the Swedish Road Administration, Gothenburg, for providing the traffic accident data, and the Swedish Road Administration that provided all the RWIS outstation data. Thanks to The Royal Swedish Academy of Sciences for additional financial support. We also wish to thank the editor and referees for their contribution to an improved manuscript.
References Andersson AK, Gustavsson T, Bogren J, Holmer B. 2007. Geographical Distribution of Road Slipperiness in Sweden on National, Regional and County Scales. Meteorological Applications 14: 297-310.
14| The use of a temporal analogue to predict future traffic accidents and winter road conditions in Sweden
Andreescu MP, Frost DB. 1998. Weather and traffic accidents in Montreal, Canada. Climate Research 9: 225-230. Andrey J, Olley R. 1990. The relationship between weather and road safety: past and future research directions. Climatological Bulletin 24: 123-127. Andrey J, Yagar S. 1993. A temporal analysis of rain-related crash risk. Accident Analysis and Prevention 25: 465-472. Andrey J, Mills B, Leahy M, Suggett J. 2003. Weather as a Chronic Hazard for Road Transportation in Canadian Cities. Natural Hazards 28: 319-343. Bertness J, 1980. Rain-related impact on selected transportation activities and utility services in the Chicago area. Journal of Applied Meteorology 19: 545-556. Bogren J, Gustavsson T, Gaunt H. 2006. `Tema Vintermodell: VViS−data som underlag för beräkning av väglagsfördelning och olycksstatistik.` Earth Sciences Centre, Göteborg University. Report C75. (in Swedish) Brodsky H, Hakkert AS. 1988. Risk of a road accident in rainy weather. Accident Analysis and Prevention 20: 161-176. Campbell LR. 1986. Assessment of traffic collision occurrence related to winter conditions in the city of Winnipeg: 1974 to 1984. City of Winnipeg. Codling PJ. 1974. Weather and road accidents. In Climatic resources and economic activity. Taylor JA (ed.). David & Charles Holdings, Newton Abbot; 205-222. Edwards JB. 1996. Weather-related road accidents in England and Wales: a spatial analysis. Journal of Transport Geography 4: 201-212. Edwards JB. 1999. The temporal distribution of road accidents in adverse weather. Meteorological Applications 6: 59−68. Edwards JB. 1999a. Speed adjustment of motorway commuter traffic to inclement weather. Transportation Research Part F: Traffic Psychology and Behaviour 2: 1−14. Fridstrom L, Liver J, Ingebrigtsen S, Kulmala R, Thomsen L. 1995. Measuring the contribution of randomness, exposure, weather, and daylight to the variation in road accident counts. Accident Analysis and Prevention 27: 1-20. Keay K, Simmonds I. 2005. The association of rainfall and other weather variables with road traffic volume in Melbourne, Australia. Accident Analysis and Prevention 37: 109-124. Kilpeläinen M, Summala H. 2007. Effects of weather and weather forecasts on driver behaviour. Transportation Research Part F: Traffic Psychology and Behaviour 10: 288-299. Möller S. 2002. `Ersättningsmodell för vinterväghållning baserad på väderdata från VViS.` VTI notat 30−2002, Statens väg− och transportforskningsinstitut. Linköping 2002. (in swedish) Moore DF. 1975. The friction of pneumatic tyres. Oxford: Elsevier Scientific. 220pp.

The use of a temporal analogue to predict future traffic accidents and winter road conditions in Sweden |15
Nofal FH, Saeed AAW. 1997. Seasonal variation and weather effects on road traffic accidents in Riyadh City. Public Health 111: 51-55. Nokhandan MH, Bazrafshan J, Ghorbani K. 2008. A quantitative analysis of risk based on climatic factors on the roads in Iran. Meteorological Applications 15: 347-357. Norrman J, Eriksson M, Lindqvist S. 2000. Relationships between road slipperiness, traffic accident risk and winter road maintenance activity. Climate Research 15: 185-193. Palutikof JP. 1983. The effect of climate on road transport. Climate Monitor 12: 46-53. Räisänen J, Hansson U, Ullerstig A, Döscher R, Graham LP, Jones C, Meier M, Samuelsson P, Willén U. 2003. `GCM driven simulations of recent and future climate with the Rossby Centre coupled atmosphere–Baltic Sea regional climate model RCAO.` SMHI–RMK No. 101. ISSN: 0347-2116 SMHI Reports Meteorology Climatology, 61. SIKA. 2006. `Vägtrafikskador 2005 (Road Traffic Injuries 2005).` SIKA Statistik: 2006:31 ISBN: 91−89586−66−2. SMHI. 2005. `Väder och vatten.` SMHI, Nr 1/2005. SMHI. 2005a. `Medeltemperaturen 1961−1990 januari.` (in Swedish). Available from: http://www.smhi.se [Accessed Jun 2005]. SMHI. 2006. `Väder och vatten.` SMHI, Nr 1/2006. SMHI. 2006a. `Klimat i förändring.` (in swedish). Faktablad nr 29 October 2006. Available from: http://www.smhi.se [Accessed Jan 2007]. SMHI. 2007. `Medeltemperaturens avvikelse från normalvärdet i ºC.` (in Swedish). Available from: http://www.smhi.se [Accessed Jan 2007]. SMHI. 2007a. `Precipitation 1961−1990 January.` Available from: http://www.smhi.se *Accessed Jan 2007]. Smith K. 1982. How seasonal and weather conditions influence road accidents in Glasgow. Scottish Geographical Magazine 98: 103-114. Suggett J. 1999. The effect of precipitation on traffic safety in the city of Regina. Master of Science Thesis, University of Regina, Saskatoon. Transportation Research Record 910: 1-7. Thornes JE. 1991. Thermal mapping and road-weather information systems for highway engineers. In Highway Meteorology, E. and F.N. Spon, London, England; 39-67. VV. 2003. `Respektive regions medelflöde på statliga vägnätet 2002.` (in Swedish). Available from: http://www.vv.se [Accessed Mar 2007].

Paper III
A future perspective on traffic accidents in a warmer climate, a study in the Gothenburg area, Sweden.
Anna K. Andersson
“In the spring, I have counted 136 different kinds of weather inside of 24 hours.” Mark Twain


A future perspective on traffic accidents in a warmer climate, a study in the Gothenburg area, Sweden |1
A future perspective on traffic accidents in a warmer climate, a study in the Gothenburg area, Sweden
Anna K. Andersson
Abstract This study examines the effects climate change can have on winter road conditions and the frequency of traffic accidents that occur during wintertime. All traffic accidents over three winters in the Gothenburg area (~20 000 km2), in the south-west of Sweden, were assigned to the nearest outstation in the Swedish Road Weather Information System (RWIS). This was done to obtain the daily minimum road surface temperature on the same day as the traffic accident occurred. Future climate scenarios for the 2020s, 2050s and 2080s were modelled and a ratio between the number of traffic accidents and the daily minimum road surface temperature was calculated. This study suggests that the percentage of traffic accidents for temperatures equal to or below zero degrees might be reduced by 20% by the 2080s compared to the total amount of accidents. Winter maintenance, such as salt scattering, can be reduced by at least 15% by the 2080s, due to a reduction in the amount of days with risk of slippery roads in this part of Sweden. However, in temperatures above zero degrees the number of accidents involving motor vehicles will increase noticeably due to more days at these temperatures. Keywords: climate change, traffic accident, RWIS, road maintenance, road climate
1. Introduction An annual average of 425 traffic accidents were reported to the Swedish Road Administration’s database during the three winters (November – March) 2006-2007 to 2008-2009 in coastal south-western Sweden (county of Västra Götaland). Positions of these accidents were registered and known by police and hospitals. Approximately 40% of annual traffic accidents occur in these five winter months. The reasons why accidents occur can vary. While there have been studies of traffic accidents and poor road conditions (Fridström et al. 1995; Edwards 1996), others have focussed their studies on connecting accidents to different types of precipitation, e.g. snow (Codling, 1974; Andreescu and Frost, 1998; Eisenberg and Warner, 2005) and rain (Brodsky and Hakkert, 1988; Levine et al. 1995). The linkage between traffic accidents and slippery roads has been studied by others (e.g. Lindqvist, 1979; Gustavsson and Bogren, 1990; Norrman, 2000). Other reasons for accidents include drink driving (e.g. Meyhew et al. 1986; Horwood and Fergusson 2000; Evans, 2004) or sudden illnesses (Lam and Lam 2005). Studies of speed reduction in adverse weather also exist. Edwards (1999) found average speeds were reduced by 4.4% in rain compared to fine weather. Andrey (2009) concluded that rain-related traffic accidents decreased by approximately 60% on the roads of Canadian cities over two decades. However, in snow this trend was not noticeable.
2| A future perspective on traffic accidents in a warmer climate, a study in the Gothenburg area, Sweden
Andersson & Chapman (2009) studied the influences of weather on traffic accidents in Sweden. One conclusion was that traffic accidents were more prevalent at road surface temperatures below -3°C, a common winter temperature in Sweden. With the future scenario of temperature changes (3.8 to 5.5°C in Sweden over the next century (Räisänen et al. 2003)), the number of traffic accidents due to slippery roads might decrease. There are few studies that state the impact climate change can have on winter road conditions, and thereby the impact it has on traffic accidents. Therefore, the focus of this paper is to analyse the impact climate change may have on the road surface temperatures and thus its effects on traffic accidents. Changes to winter road maintenance in the future are also discussed. This paper expressly addresses the following questions:
If the winters are getting warmer, and thus the number of days with slippery roads is decreasing, will the frequency of traffic accidents on roads with low temperatures (≤0°C) also decrease?
If there is a decrease in the amount of accidents at low temperatures, is the total amount of accidents during the winter months also likely to decrease?
This paper is a study of winter roads and traffic accidents using weather data from outstations in the Swedish Road Weather Information System (RWIS), three future time scenarios of road weather and calculated estimations of the number of traffic accidents for the rest of this century. Parameters such as fewer roads with oncoming traffic, increases/decreases in traffic, the usage of studded tyres during the winter months in Sweden or improvements to cars (i.e. anti-lock braking systems) are not taken into account in this study. Studded tyres are commonly seen on vehicles in Sweden; their usage is debated and even prohibited on some roads. Möller and Öberg (2009) analysed the effects of a reduction in the usage of studded tyres in Sweden and concluded that annually the estimated number of police-reported injury accidents would increase by 56 and the people killed would increase by 1.8 if usage reduced from 70% to 50%.
2. Methodology
2.1 Area of Study and Weather Data The area studied in this paper lies near Gothenburg, south-west Sweden (Figure 1), and is approximately 20 000 km2. There are 19 outstations from the Swedish Road Weather Information System (RWIS) that have been used in this area for the collection of weather condition data. This area was chosen because future climate scenarios were available for the 19 RWIS outstations, as they are part of the IRWIN project (for further description see Saarikivi et al. 2009), and because they had reliable data with few errors. Each traffic accident has also been connected to the nearest RWIS outstation to provide estimations about the prevailing road weather at the time of the accident. Traffic accidents and weather data in this study are from three winters 2006-2007, 2007-2008 and 2008-2009. A winter is defined as the five months from November to March.
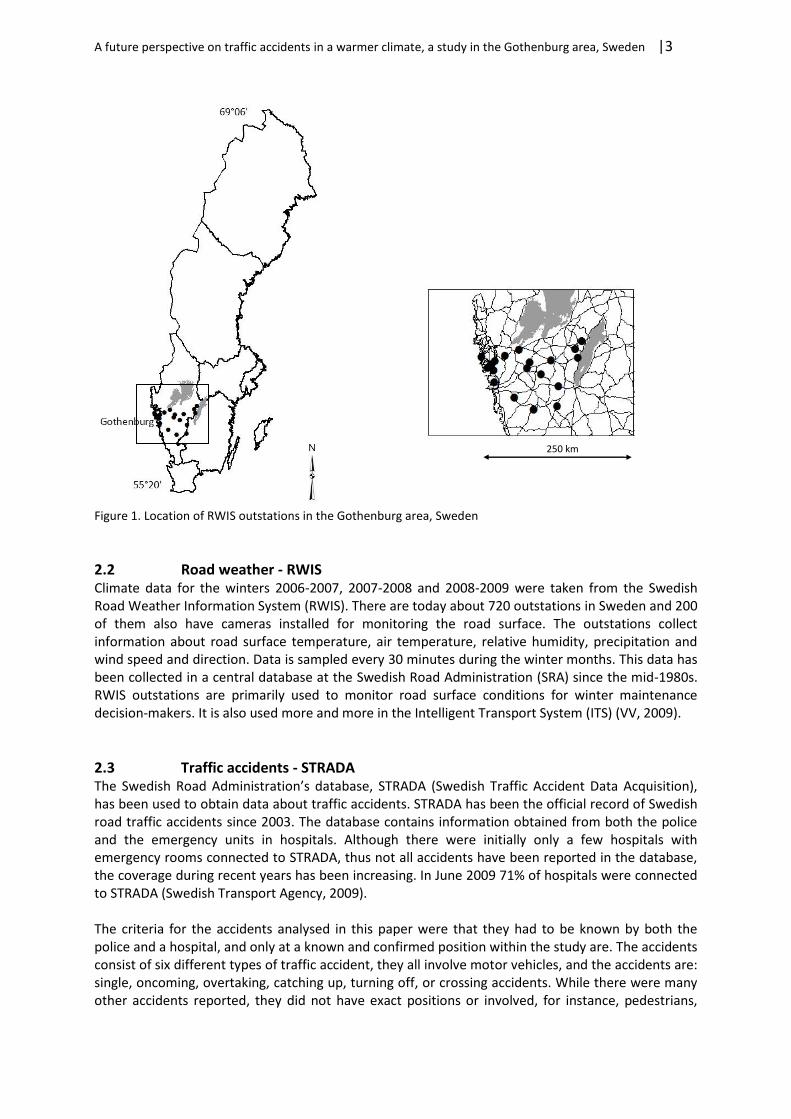
A future perspective on traffic accidents in a warmer climate, a study in the Gothenburg area, Sweden |3
Figure 1. Location of RWIS outstations in the Gothenburg area, Sweden
2.2 Road weather - RWIS Climate data for the winters 2006-2007, 2007-2008 and 2008-2009 were taken from the Swedish Road Weather Information System (RWIS). There are today about 720 outstations in Sweden and 200 of them also have cameras installed for monitoring the road surface. The outstations collect information about road surface temperature, air temperature, relative humidity, precipitation and wind speed and direction. Data is sampled every 30 minutes during the winter months. This data has been collected in a central database at the Swedish Road Administration (SRA) since the mid-1980s. RWIS outstations are primarily used to monitor road surface conditions for winter maintenance decision-makers. It is also used more and more in the Intelligent Transport System (ITS) (VV, 2009).
2.3 Traffic accidents - STRADA The Swedish Road Administration’s database, STRADA (Swedish Traffic Accident Data Acquisition), has been used to obtain data about traffic accidents. STRADA has been the official record of Swedish road traffic accidents since 2003. The database contains information obtained from both the police and the emergency units in hospitals. Although there were initially only a few hospitals with emergency rooms connected to STRADA, thus not all accidents have been reported in the database, the coverage during recent years has been increasing. In June 2009 71% of hospitals were connected to STRADA (Swedish Transport Agency, 2009). The criteria for the accidents analysed in this paper were that they had to be known by both the police and a hospital, and only at a known and confirmed position within the study are. The accidents consist of six different types of traffic accident, they all involve motor vehicles, and the accidents are: single, oncoming, overtaking, catching up, turning off, or crossing accidents. While there were many other accidents reported, they did not have exact positions or involved, for instance, pedestrians,
250 km

4| A future perspective on traffic accidents in a warmer climate, a study in the Gothenburg area, Sweden
cyclists, tractors or animals. The exact reasons why an accident has occurred are not known in STRADA. There are, however, many accidents that never get reported at all to STRADA. One example is from January 5, 2008, when the following was reported in a Swedish newspaper: “The entire southern Skåne was plagued by treacherous icy conditions on Saturday because of freezing rain and strong winds. Between 10am and 5pm there were about 80 traffic accidents reported to the police department in Skåne.” (Aftonbladet, 2008). Only eight accidents were reported in STRADA during the entire day in Region Skåne. This indicates that there are many accidents missing in the statistics, and it must be clarified that the accidents used as statistics in this paper are the more severe ones. The traffic accidents were time corrected to the nearest half hour and then connected to the nearest RWIS outstation. This was done to get an idea of the weather at the time of the accident. The accidents were also connected to the daily minimum road surface temperature, allowing comparisons to the number of days with the same daily minimum road surface temperature. In this study, an accident has occurred in winter road conditions if there are theoretical conditions for it i.e. the nearest RWIS outstation shows a surface temperature of zero degrees or below.
2.4 Climate change – future road surface temperatures The future road weather dataset is generated as a part of the IRWIN project, funded by the ERA NET ROAD (for further description see Saarikivi et al. 2009). IRWIN scenarios are based on Global Climate Models (GCM). To make the climate change predictions, IRWIN uses the analogue model for statistical downscaling to combine the historical RWIS outstation weather data and GCM climate change scenarios. To obtain road surface temperatures, the model takes the weather data in the scenario and compares it to historical data. The model is built on the atmospheric general circulation model ECHAM5 and also IPCC emission scenario A1B, which is defined by a rapid growing economy and a global population that peaks in the middle of the century and then declines. The scenario assumes also that new and more efficient technologies are rapidly introduced (IPCC, 2002). The modelled data is divided into four time slices; November to March for Baseline (BL) 1970 – 2000, 2020s (2010 – 2040), 2050s (2040 – 2070) and 2080s (2070 – 2100); and is calculated for each RWIS outstation.
2.5 Traffic accidents – future scenario Andersson and Chapman (2009a) used a temporal analogue to predict the change in the number of traffic accidents in a future perspective; the same analogue is used in this paper. The relationship ratio is calculated as the difference between the number of accidents at each temperature degree and the number of days per winter at the same daily minimum road surface temperature (RSTdm). Number of accidents at RSTdm
Number of days per winter with RSTdm (1)
The assumption is that the ratio is the same in the three future time slices (2020s, 2050s and 2080s) as the ratio is in the winters of 2006-2009 (equation 2).
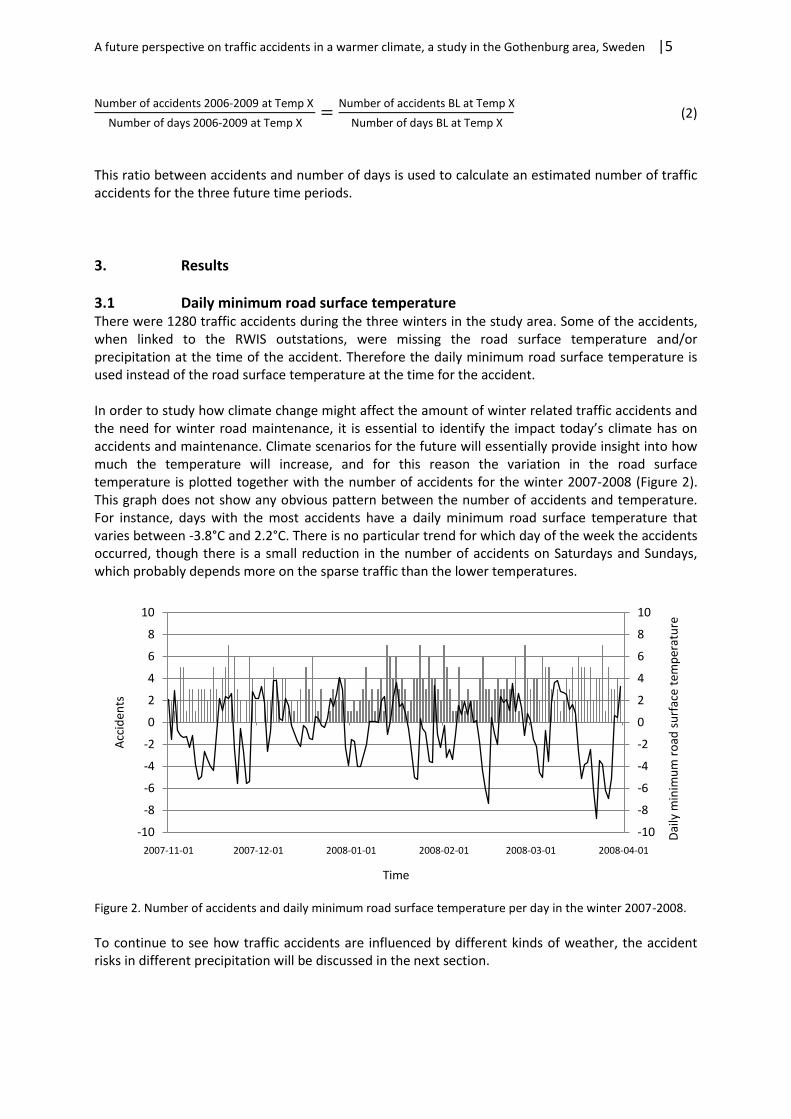
A future perspective on traffic accidents in a warmer climate, a study in the Gothenburg area, Sweden |5
Number of accidents 2006-2009 at Temp X
Number of days 2006-2009 at Temp X=
Number of accidents BL at Temp X
Number of days BL at Temp X (2)
This ratio between accidents and number of days is used to calculate an estimated number of traffic accidents for the three future time periods.
3. Results
3.1 Daily minimum road surface temperature There were 1280 traffic accidents during the three winters in the study area. Some of the accidents, when linked to the RWIS outstations, were missing the road surface temperature and/or precipitation at the time of the accident. Therefore the daily minimum road surface temperature is used instead of the road surface temperature at the time for the accident. In order to study how climate change might affect the amount of winter related traffic accidents and the need for winter road maintenance, it is essential to identify the impact today’s climate has on accidents and maintenance. Climate scenarios for the future will essentially provide insight into how much the temperature will increase, and for this reason the variation in the road surface temperature is plotted together with the number of accidents for the winter 2007-2008 (Figure 2). This graph does not show any obvious pattern between the number of accidents and temperature. For instance, days with the most accidents have a daily minimum road surface temperature that varies between -3.8°C and 2.2°C. There is no particular trend for which day of the week the accidents occurred, though there is a small reduction in the number of accidents on Saturdays and Sundays, which probably depends more on the sparse traffic than the lower temperatures.
Figure 2. Number of accidents and daily minimum road surface temperature per day in the winter 2007-2008.
To continue to see how traffic accidents are influenced by different kinds of weather, the accident risks in different precipitation will be discussed in the next section.
-10
-8
-6
-4
-2
0
2
4
6
8
10
-10
-8
-6
-4
-2
0
2
4
6
8
10
2007-11-01 2007-12-01 2008-01-01 2008-02-01 2008-03-01 2008-04-01
Dai
ly m
inim
um
ro
ad s
urf
ace
tem
per
atu
re
Acc
iden
ts
Time

6| A future perspective on traffic accidents in a warmer climate, a study in the Gothenburg area, Sweden
3.2 Precipitation There were 1273 traffic accidents with a complete dataset for precipitation during these three winters and 79% of these accidents occurred while there was no precipitation, according to the nearest RWIS outstation. Of the remaining 21% of accidents, 12% occurred while raining and 8% had snowfall (Table I). There was no precipitation at the 19 RWIS outstations over 82.8% of the time. However, even though there was no precipitation at the time of an accident, the road surface could have been slippery due to earlier precipitation. Norrman et al. (2000) calculated the risk of having an accident in different types of slippery road conditions, and found that, of the 10 types of slipperiness in the expert system developed by Norrman (2000), precipitation (rain/sleet) on a frozen road surface had the highest risk. The same equation used by Norrman et al. (2000) for calculating accident risk in different road conditions is used here to determine the accident risk in different precipitation types.
Accident risk = 1
N At,m hm Am ht,m
−1Mar 2009
m=Nov 2006 (3)
where N – Number of months At,m – Number of accidents in month (m) in precipitation type (t) hm – Number of hours in month (m) Am – Number of accidents in month (m) h t,m – Number of hours with precipitation type (t) The assumptions that the accidents were evenly distributed and not affected by road conditions were made in these calculations. Table I. Accidents in 2006 – 2009 (NDJFM) in different type of precipitation and the risk of having an accident in different types of precipitation.
Type of precipitation Number of accident (%) Accident risk
No precipitation 79 1.0 Rain 12 1.1 Freezing rain 0.24 2.2 Snow 8 1.4 Sleet 1 1.6
The greatest risk for an accident to occur was during Freezing rain, even if these accidents were very few. There were a total of three accidents during the three winters, but during the same time only eight half-hours were registered at the RWIS outstation indicating Freezing rain, suggesting the risk of being involved in an accident is really high while it is Freezing rain, even though it does not occur very often. The category No precipitation had the risk of 1.0, meaning that there were as many accidents as expected. If the accident risk is larger than 1.0, there have been more accidents than expected at an even distribution. The precipitation type Snow had an accident risk of 1.4, i.e. there is a higher risk of being involved in an accident while it is snowing.

A future perspective on traffic accidents in a warmer climate, a study in the Gothenburg area, Sweden |7
3.3 Distribution of future precipitation This study is mostly concerned with road surface temperatures, since the precipitation in the IRWIN model only calculated precipitation for the future divided into two categories, Rain and Snow (the two categories Freezing rain and Sleet had too few observed occasions in the measured data to be of use in the model). The distribution for accidents in Table I was for the winters 2006-2009; three winters warmer than average. To compare the accident risks to a future perspective the same accident risk used in Table I was used for the calculated precipitation in the three time slices. Based on the IRWIN model, the precipitation was compiled as an average for the Baseline and the three time slices 2020s, 2050s and 2080s. Using this calculation, the level of No precipitation is likely to remain constant over the rest of this century. However, the two categories Rain and Snow will alter. There is an increase in the Rain hours between the baseline years (BL) and 2080s by 71% and over the same time Snow will decrease by 35%. This change will result in a change of the number of accidents by the same percentage (Table II). Table II. Percentage of precipitation in Baseline (BL) and in three future time slices 2020s, 2050s and 2080s (NDJFM) across different types of precipitation and the risk of being involved in an accident in different types of precipitation.
Type of precipitation
BL (%)
2020s (%)
2050s (%)
2080s (%)
Accident risk
Accident BL (%)
Accident 20s (%)
Accident 50s (%)
Accident 80s (%)
No precipitation 83.5 82.9 83.4 83.1 1.0 80.7 80.1 80.6 80.3 Rain 5.8 8.0 8.6 9.9 1.1 6.5 8.9 9.6 11.1 Snow 10.6 9.2 8.0 6.9 1.4 14.5 12.4 10.9 9.4
3.4 Temperatures and accidents during three winters In chapter 3.1, the daily minimum road surface temperature and the number of accidents per day were plotted and no particular patterns were found. In order to analyse this in more detail, all accidents were connected to the nearest RWIS outstation and the daily minimum road surface temperature (RSTdm) for each accident was compiled. These temperatures were then compared to the number of days this daily minimum road surface temperature had occurred during the three winters, to see if the temperatures were connected to the accidents, as Figure 2 showed a low correlation between accident and temperature. The number of days each road surface temperature occurred during the three winters is plotted in Figure 3 together with the number of accidents at each road surface temperature. Some 66% of days were below zero degrees, while 67% of accidents occurred at these temperatures. The most common daily minimum road surface temperature was -1°C, while accidents peaked at -2°C. The relationship between traffic accidents and the number of days for different temperatures in Figure 3 are not the same for the different daily minimum road surface temperatures. However, there are some intervals that have similarities if the percentage is compared. In the intervals between 0°C and 3°C and for temperatures below -5°C there are fewer accidents in percentage compared to days, while more accidents occur at temperatures between -4°C and -1°C and above 4°C. The interval with the highest number of accidents was from -4°C to -1°C, with 40% of the total amount of accidents. The majority of days had temperatures between -4°C to 3°C (Table III).
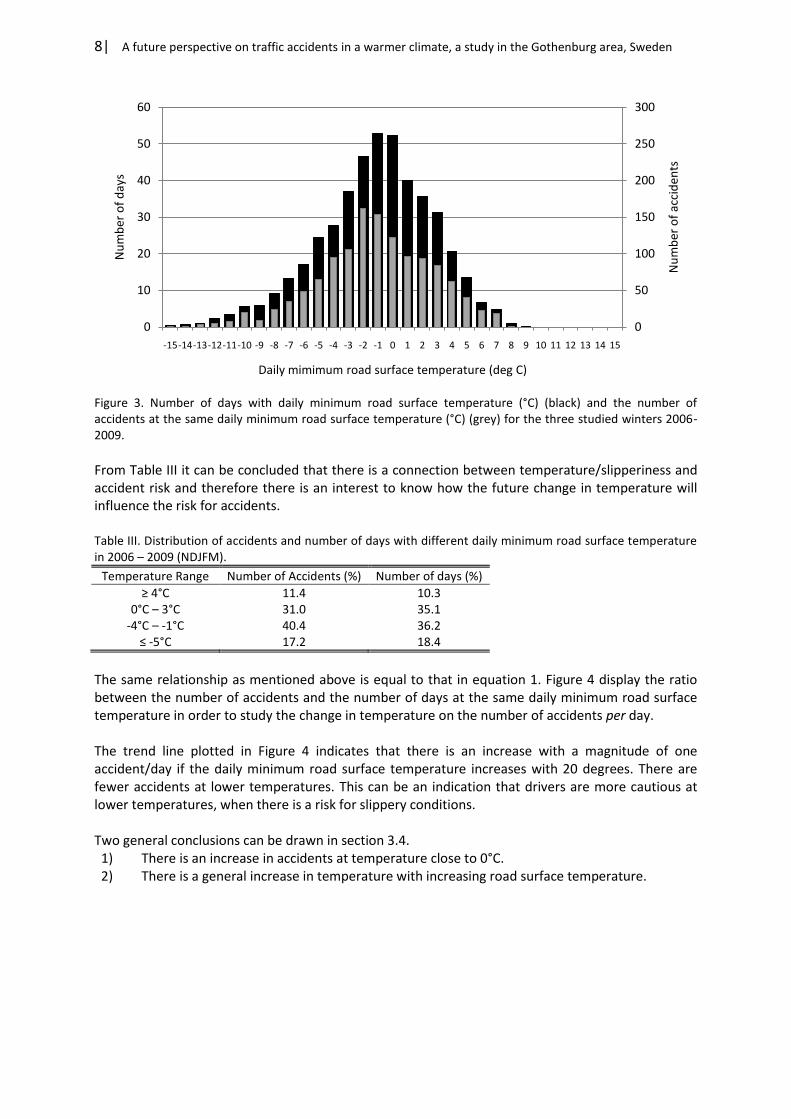
8| A future perspective on traffic accidents in a warmer climate, a study in the Gothenburg area, Sweden
Figure 3. Number of days with daily minimum road surface temperature (°C) (black) and the number of accidents at the same daily minimum road surface temperature (°C) (grey) for the three studied winters 2006-2009.
From Table III it can be concluded that there is a connection between temperature/slipperiness and accident risk and therefore there is an interest to know how the future change in temperature will influence the risk for accidents. Table III. Distribution of accidents and number of days with different daily minimum road surface temperature in 2006 – 2009 (NDJFM).
Temperature Range Number of Accidents (%) Number of days (%)
≥ 4°C 11.4 10.3 0°C – 3°C 31.0 35.1
-4°C – -1°C 40.4 36.2 ≤ -5°C 17.2 18.4
The same relationship as mentioned above is equal to that in equation 1. Figure 4 display the ratio between the number of accidents and the number of days at the same daily minimum road surface temperature in order to study the change in temperature on the number of accidents per day. The trend line plotted in Figure 4 indicates that there is an increase with a magnitude of one accident/day if the daily minimum road surface temperature increases with 20 degrees. There are fewer accidents at lower temperatures. This can be an indication that drivers are more cautious at lower temperatures, when there is a risk for slippery conditions. Two general conclusions can be drawn in section 3.4. 1) There is an increase in accidents at temperature close to 0°C. 2) There is a general increase in temperature with increasing road surface temperature.
0
50
100
150
200
250
300
0
10
20
30
40
50
60
-15-14-13-12-11-10 -9 -8 -7 -6 -5 -4 -3 -2 -1 0 1 2 3 4 5 6 7 8 9 10 11 12 13 14 15
Nu
mb
er o
f ac
cid
ents
Nu
mb
er o
f d
ays
Daily mimimum road surface temperature (deg C)

A future perspective on traffic accidents in a warmer climate, a study in the Gothenburg area, Sweden |9
Figure 4. Number of accidents per number of days with the same daily minimum road surface temperatures. Trend line y = 0.05x +2.13 R² = 0.30.
To predict future scenarios, some assumptions had to be made. One assumption was that traffic remains the same as today (e.g. the traffic density, road construction and speed limits are the same). Another assumption was that the same number of accidents occurs at the same daily minimum road surface temperatures (equation 1 and Figure 4). The ratio (equation 1) between accidents and temperature was applied to the number of days for the three future time slices 2020s, 2050s and 2080s. This ratio was also applied to the number of days for the baseline, since the three studied winters were warmer than the baseline years and therefore the comparisons between the three recent years and the future periods are not appropriate. The future time slices are therefore compared to the baseline.
3.5 Road surface temperatures and traffic accidents in 2020s, 2050s and 2080s Road surface temperatures were calculated for the three future scenarios 2020s, 2050s and 2080s and also for a baseline period (1970-2000). The daily minimum road surface temperatures were thereafter selected and compiled for each road surface temperature and are plotted in Figure 5. If the number of days at baseline (Figure 5a) is compared to the actual number of days in the three recent winters (Figure 3), the main differences are that there were a more widespread number of days in the baseline period and the most common daily minimum road surface temperature is at -2°C rather than -1°C. There are also more days at colder temperatures. The three latest winters have been warmer than the 30 years’ average baseline winters, at least if the daily minimum road surface temperatures are compared. During the five studied winter months, 79% of the days with daily minimum road surface temperatures were equal to or below zero degrees at baseline. In the scenario for the 2080s, the amount of days has changed to 62% (Figure 5a & 5d).
0
1
2
3
4
5
6
7
8
9
10
-15 -14 -13 -12 -11 -10 -9 -8 -7 -6 -5 -4 -3 -2 -1 0 1 2 3 4 5 6 7
Acc
iden
t/d
ay
Daily minimum road surface temperature (°C)

10| A future perspective on traffic accidents in a warmer climate, a study in the Gothenburg area, Sweden
a) b)
c) d) Figure 5. Number of days with daily minimum road surface temperature (°C) a) Baseline b) 2020s c) 2050s d) 2080s. <0°C (black bar), =0°C (light grey bar), >0°C (grey bar).
In both Figure 5 and Table IV the change throughout this century is evident for the number of days at different daily minimum road surface temperatures. For temperatures equal to or below zero degrees, the number of days will be decreased by 20%, and for temperatures above zero the increase is 87%. There is a threshold at -2°C; below this the number of days is decreasing and above increasing. To compare the changes in time, the same temperature intervals are used for the actual temperatures in Table III. In the temperature range between 0°C and 3°C the increase of days will be 50% during the 100 years between Baseline and 2080s (37 days to 55), while in the range between -4°C and -1°C there is a decrease of 3 days from 56, and for temperatures below five degrees will be reduced from 50 days at Baseline to 24, a 52% decrease (Table IV). Table IV. Percentage of days with daily minimum road surface temperature at Baseline, 2020s, 2050s and 2080s at different temperature ranges
Temperature Range BL (%) 2020 (%) 2050 (%) 2080 (%)
≥ 4°C 4.6 7.7 10.4 12.5 0°C – 3°C 24.6 31.8 32.9 36.6
-4°C – -1°C 37.4 36.2 35.4 35.0 ≤ -5°C 33.4 24.3 21.3 15.9
The ratio between number of traffic accidents and number of days (equation 1) was applied to the calculated number of days per winter in the three future scenarios, 2020s, 2050s and 2080s to estimate the number of accidents at each daily minimum road surface temperature. This was also done to the baseline period to make comparisons with today, instead of the winters 2006-2009, which was warmer than the average baseline. The calculated number of accidents is plotted in Figure 6. There is a small increase in the total amount of traffic accidents between baseline and 2080s, with 10 accidents or 2%. The decrease in the number of days below -2°C is reflected in the number of accidents; there is a 22% decrease in the
0
5
10
15
20
-15 -10 -5 0 5 10 15
# o
f d
ays
RSTdm
0
5
10
15
20
-15 -10 -5 0 5 10 15
# o
f d
ays
RSTdm
0
5
10
15
20
-15 -10 -5 0 5 10 15
# o
f d
ays
RSTdm
0
5
10
15
20
-15 -10 -5 0 5 10 15
# o
f d
ays
RSTdm

A future perspective on traffic accidents in a warmer climate, a study in the Gothenburg area, Sweden |11
accidents equal to or below zero degrees from today to the 2080s. However, the large difference is in the temperatures above zero, where the accidents will be increased by 88% over the same time, from 83 to 159.
a) b)
c) d) Figure 6. Number of accidents at daily minimum road surface temperatures (°C) a) 2006-2009 b) 2020s c) 2050s d) 2080s. <0°C (black bar), =0°C (light grey bar), >0°C (grey bar).
The distribution of accidents at the same temperature intervals as previously used is compiled in Table V. Most accidents occur at the interval between -4°C and -1°C and this temperature interval continues to have the most accidents in the 2080s. However, in the range from 0°C to 3°C the increase is 48%. This is a temperature range where there is high potential for slipperiness at exposed locations, e.g. bridges and valleys. Table V. Percentage of accidents at daily minimum road surface temperatures at Baseline, 2020s, 2050s and 2080s across different temperature ranges.
Temperature Range BL (%) 2020 (%) 2050 (%) 2080 (%)
≥ 4°C 5.1 8.6 11.5 13.8 0°C – 3°C 21.9 28.2 29.1 32.3
-4°C – -1°C 42.4 40.7 39.6 39.0 ≤ -5°C 30.7 22.5 19.8 14.9
To see the changes in both the number of days at different temperatures and the number of accidents throughout this century, Figure 7 was plotted. Comparing the two graphs, the daily minimum road surface temperatures seem to be less widespread in the 2080s compared to baseline and more concentrated in the temperature range between -4°C and 4°C. In the 2080s, 118 of the 151 days in the five months are in this temperature range, compared to 97 days at baseline (+22%). The number of accidents will increase by 19% in this temperature interval.
0
10
20
30
40
50
60
-15 -10 -5 0 5 10 15
# o
f ac
cid
ents
RSTdm
0
10
20
30
40
50
60
-15 -10 -5 0 5 10 15
# o
f ac
cid
ents
RSTdm
0
10
20
30
40
50
60
-15 -10 -5 0 5 10 15
# o
f ac
cid
ents
RSTdm
0
10
20
30
40
50
60
-15 -10 -5 0 5 10 15
# o
f ac
cid
ents
RSTdm

12| A future perspective on traffic accidents in a warmer climate, a study in the Gothenburg area, Sweden
a)
b)
Figure 7. Number of days at daily minimum road surface temperatures (°C) and number of accidents (White bar) a) Baseline b) 2080s. <0°C (black bar), =0°C (light grey bar), >0°C (grey bar).
4. Discussion and conclusion Although the calculations in this paper are limited spatially to a smaller area, it is possible to get an idea about the distribution of future scenarios for road surface temperatures. It can also paint a picture of the number of traffic accidents expected at the end of this century. One of the aims of this paper was to analyse the impact of a warming climate on the daily minimum road surface temperature. The number of days at each daily minimum temperature will shift in the future, to fewer days with lower temperatures. There will be a turning point at -2°C degrees, i.e. the number of days in the temperature range below -2°C will decline and at temperatures above this the number of days will increase. As well as road conditions, there are many other factors that can affect drivers. Even though the number of traffic accidents increase at road surface temperatures above -2°C, it does not necessarily
0
20
40
60
80
100
120
0
3
6
9
12
15
18
-15 -10 -5 0 5 10 15
# o
f ac
cid
ents
# o
f d
ays
RSTdm
0
20
40
60
80
100
120
0
3
6
9
12
15
18
-15 -10 -5 0 5 10 15
# o
f ac
cid
ents
# o
f d
ays
RSTdm
A future perspective on traffic accidents in a warmer climate, a study in the Gothenburg area, Sweden |13
have anything to do with slippery roads, but the risk of accidents is increased since roads are more slippery when the road surface temperature is close to 0°C (Moore, 1975). In the temperature range when the road is the most slippery, the trend is decreasing in the number of days with daily minimum road surface temperatures equal to or below zero. This in turn can lead to a decrease in the amount of traffic accidents caused by slippery road conditions. This study has shown that the percentage of traffic accidents for temperatures equal to or below zero degrees will be reduced by 20% by the 2080s. However, the total number of accidents will not decrease. Instead there will be a small increase of the total number of accidents (+2%). When the climate is getting warmer the number of days for temperatures above zero degrees is increasing. This, in turn, results in an increase of traffic accidents equal to or above zero degrees by 88%. This increase may be the result of high velocity, since the driver thinks that there is no risk of slippery conditions. Andersson & Chapman (2009) concluded that traffic accidents were more prevalent at temperatures equal to or below -3°C, which is a temperature common in the Swedish winter months. It has been shown in this study that there will be a decrease in the number of days with cold road surface temperatures by the 2080s, and that traffic accidents can therefore be assumed to decrease. However, if the number of occasions with slippery roads is strongly reduced the awareness of the driver is reduced and the skills to control a sliding vehicle might also be lost. This could instead lead to an increase in the amount of accidents on days with slippery conditions. In the baseline months (Nov-Mar) there were 118 days that had a daily minimum road surface temperature of zero or below. By 2080 these days are reduced to 93; a reduction of 22%. This reduction could lead to a diminished need for winter road maintenance. However, the Swedish Road Administration uses the upper limit of +1°C for road surface temperatures, instead of 0°C, to allow a safety margin to account for any inaccuracy of the sensors (Möller, 2002). The number of days with temperatures equal to or below 1°C will decline by 17% by the 2080s. This might lead to a possible reduction of winter maintenance by at least 15% in the Gothenburg area, Sweden. The Swedish Government and the Swedish Road Administration’s goal is to reduce the amount of salt on the Swedish roads. In the winter of 1993-1994 the salt consumption was 420 000 tonnes. This amount was reduced 50% by 1996-1997. The reduction has continued and, for the winter 2007-2008, consumption was 184 000 tonnes (VV, 1999; VV, 2009a). During the last ten winters there has been an average salt consumption of 258 000 tonnes per winter. If this is reduced by 15% there will be a saving of 38 700 tonnes. Assuming that one tonne of salt costs 580 SEK (Ihs and Möller, 2004), this will save 22 446 000 SEK (€2 096 700; 06/11/09) per year in today’s monetary value. The amount of salt can probably be reduced even more in the future and techniques for salt scattering can probably be further improved. If the low consumption in the winter 2007-2008 is lessened by 15%, 27 600 tonnes of salt can be saved. The conclusions in this paper are that the number of accidents increases with increasing temperature at present time. The largest number of accidents is at temperatures just below zero degrees, indicating that slipperiness and poor road conditions affect the frequency of accidents and the need for winter road maintenance is high at these temperatures. The conclusions about the future is that due to a reduction in the number of days with winter road conditions will lead to a decrease in the traffic accidents involving motor vehicles by the end of this century and the need for winter maintenance will not be as large as today. However, in the temperature range around zero degrees the change will not be as great as at lower temperatures but the total need for winter maintenance will be reduced. There will be a large increase in the number

14| A future perspective on traffic accidents in a warmer climate, a study in the Gothenburg area, Sweden
of accidents occurring in the temperatures above zero degrees, perhaps as a result of more careless driving at these temperatures where the drivers perceive the risk of slippery conditions as low.
Acknowledgements This study has been financed by Climate and Mobility, which is a graduate school funded by the University of Gothenburg. The author wants to thank D. Rayner and C. Tengroth for help with accessing the future climate data in the IRWIN project. Thanks to colleagues and friends for useful comments, especially thanks to B. Holmer, T. Gustavsson & J Bogren for questioning and helping me with improvements to this paper.
References Aftonbladet 2008. Blixthalka i Skåne. in swedish. Available from: http://www.aftonbladet.se [Accessed 5 January 2008]. Andersson A.K., Chapman L. 2009. The use of a temporal analogue to predict future traffic accidents and winter road conditions in Sweden. (In Press Meteorological Applications) Andersson A.K., Chapman L. 2009a. The impact of climate change on winter road maintenance and traffic accidents in West Midlands, UK. (Resubmitted to Accident Analysis and Prevention after revision) Andreescu MP, Frost DB. 1998. Weather and traffic accidents in Montreal, Canada. Climate Research 9: 225-230. Andrey J. 2009. Long-term trends in weather-related crash risks. Journal of Transport Geography. (In Press) doi: 10.1016/j.trangeo.2009.05.002. Brodsky H, Hakkert AS. 1988. Risk of a road accident in rainy weather. Accident Analysis and Prevention 20: 161-176. Codling PJ. 1974. Weather and road accidents. In Climatic resources and economic activity. Taylor JA (ed.). David & Charles Holdings, Newton Abbot; 205-222. Edwards JB. 1996. Weather-related road accidents in England and Wales: a spatial analysis. Journal of Transport Geography 4: 201-212. Edwards JB. 1999. Speed adjustment of motorway commuter traffic to inclement weather. Transportation Research Part F: Traffic Psychology and Behaviour 2: 1−14. Eisenberg D. Warner K.E., 2005. Effects of snowfalls on motor vehicle collisions, injuries, and fatalities. American Journal of Public Health 95, 120-124. Evans L. 2004. Traffic Safety. SSS, Bloomfield Hills, MI. Fridström L, Liver J, Ingebrigtsen S, Kulmala R, Thomsen L. 1995. Measuring the contribution of randomness, exposure, weather, and daylight to the variation in road accident counts. Accident Analysis and Prevention 27: 1-20.

A future perspective on traffic accidents in a warmer climate, a study in the Gothenburg area, Sweden |15
Gustavsson T., Bogren J. 1990. Road slipperiness during warm-air advections. Meteorological Magazine 119: 267–270. Horwood L.J., Fergusson D.M. 2000. Drink driving and traffic accidents in young people. Accident Analysis and Prevention 32: 805-814. Ihs A., Möller S. 2004. Beräkningsmodeller för vinterväghållningskostnader. VTI notat 53-2004. Statens väg- och transportforskningsinstitut. Linköping 2004. (In swedish). IPCC. 2000. Emissions scenarios. Cambridge University Press UK. pp 432. Lam L.T., Lam M.K.P., 2005. The association between sudden illness and motor vehicle crash mortality and injury among older drivers in NSW, Australia. Accident Analysis and Prevention 37: 563-567. Levine N., Kim K.E., Nitz L.H. 1995. Daily fluctuations in Honolulu motor vehicle accidents. Accident Analysis and Prevention 27: 785-796. Lindqvist S. 1979. Studies of slipperiness on roads. In GUNI Report 12. Department of Physical Geography, Gothenburg, 46, (only abstract in English). Meyhew D.R., Donelson A.C., Beirness D.J., Simpson H.M. 1986. Youth, alcohol and relative risk of crash involvement. Accident Analysis and Prevention 18: 273-287. Moore DF. 1975. The friction of pneumatic tyres. Oxford: Elsevier Scientific. 220pp. Möller S. 2002. Ersättningsmodell för vinterväghållning baserad på väderdata från VViS. VTI notat 30−2002. Statens väg− och transportforskningsinstitut. Linköping 2002. (in Swedish). Möller S., Öberg G. 2009. Hur påverkas trafiksäkerheten om restriktioner av dubbdäcksanvändning införs? Kan en förbättrad vinterväghållning medföra att trafiksäkerheten bibehålls? VTI report 648. Statens väg− och transportforskningsinstitut. Linköping 2009. (in Swedish, English summary). Norrman J, 2000. Slipperiness on roads – an expert system classification. Meteorological Applications 7: 27-36. Norrman J, Eriksson M, Lindqvist S. 2000. Relations between traffic accidents on slippery roads and winter road maintenance. Climate Research 15: 185-193. Räisänen J, Hansson U, Ullerstig A, Döscher R, Graham LP, Jones C, Meier M, Samuelsson P, Willén U. 2003. `GCM driven simulations of recent and future climate with the Rossby Centre coupled atmosphere–Baltic Sea regional climate model RCAO.` SMHI–RMK No. 101. ISSN: 0347-2116 SMHI Reports Meteorology Climatology, 61. Saarikivi, P., Gustavsson, T. and Rayner D., 2009: IRWIN Improved local winter index to assess mainenance needs and adaptation costs in climate change scenarios, Final Report. ERA-NET ROAD ENR SRO3 project document, http://www.eranetroad.org. Swedish transport agency. 2009. http://www.transportstyrelsen.se [Accessed 8 Sep 2009] VV. 1999. Årsredovisning 1998. Publikation 1999:33. ISSN: 1401-9612. Available from: http://www.vv.se (in swedish) [Accessed 6 November 2009]

16| A future perspective on traffic accidents in a warmer climate, a study in the Gothenburg area, Sweden
VV. 2009. ITS – Intelligent Transport Systems and Services. http://www.vv.se [Accessed 29 September 2009] VV. 2009a. Årsredovisning 2008. Publikation 2009:10. ISSN: 1401-9612. Available from: http://www.vv.se (in swedish) [Accessed 6 November 2009]
Paper IV
The impact of climate change on winter road maintenance and traffic accidents in West Midlands, UK.
Anna K. Andersson and Lee Chapman
“The English winter; ending in July, to recommence in August.” Lord Byron (1788-1824)


The impact of climate change on winter road maintenance and traffic accidents in West Midlands, UK |1
The impact of climate change on winter road maintenance and traffic accidents in West Midlands, UK
Andersson Anna K. & Chapman Lee
Abstract Winter weather can be a significant cause of road traffic accidents. This paper uses UKCIP climate change scenarios and a temporal analogue to investigate the relationship between temperature and severe road accidents in the West Midlands, UK. This approach also allows quantification of the changes in the severity of the winter season over the next century in the region. It is demonstrated that the predicted reduction in the number of frost days should in turn reduce the number of road accidents caused due to slipperiness by approximately 50%. However, the paper concludes by warning against complacency in winter maintenance regimes. A warmer climate may result in budget cuts for highway maintenance which in turn may well reverse declining accident trends. Keywords: road surface temperature, road traffic accident, winter road maintenance, climate change, temporal analogue, weather generator
1. Introduction The British government has a long term aim to reduce the number of casualties on UK roads by 40 % in the year 2010 compared with the average for 1994-98 (Department for Transport, 2009). There have been numerous studies into the influence of weather conditions as a cause of traffic accidents (e.g. Codling, 1974; Palutikof, 1991; Edwards, 1996). However, precipitation, and associated poor visibility, is the main cause of many weather related incidents (Keay & Simmonds, 2006; Songchitruksa & Balke, 2006; Koetse & Rietveld, 2009) and is a problem which becomes particularly acute in winter (Fridström et al., 1995; Edwards, 1999). Indeed, there is often a pronounced peak in accidents in the month of December (Asano & Hirasawa, 2003), where the problems of winter weather are compounded with reduced daylight hours. In colder climates, the risk of an accident increases if the precipitation is falling as snow (Andreescu & Frost, 1998; Suggett, 1999). Andrey & Olley (1990) found that 40% of the total number of winter accidents occurred on roads with ice/snow or rain. In particular, Norrman et al. (2000) identified that the largest amount of accidents occurred when snow was falling on a frozen road surface. However, these relationships are not universal. Some countries are well prepared for winter weather and the onset of snow can actually mean a decrease in the number of accidents (Fridström et al., 1995) or at the very least, the severity of incidents (Koetse & Rietveld, 2009). Drivers respond to the conditions by restricting travel to essential journeys (Parry, 2000; Smith, 1982) and by driving more slowly (Hassan & Barker, 1999). For example, Kilpeläinen & Summala (2007) showed that average traffic flow speed reduced by 6.7% in bad weather. Similarly, in wet and slushy conditions, speed reductions can be as high as 25% (Martin et al., 2000 cited in Koetse & Rietveld, 2009)

2| The impact of climate change on winter road maintenance and traffic accidents in West Midlands, UK
The UK does not have a particularly snowy climate, but the appearance of snow is often the cause of traffic chaos (e.g. Thornes, 2005; London Assembly, 2009). To some extent, this represents complacency in the winter maintenance regime. Although a duty of care exists to protect the motorist (as per section 42 of the UK Railways and Transport Safety Act, 2003), it is clearly not reasonable for every responsible party to maintain a stockpile of specialist equipment to deal with snowy conditions which may only occur once or twice per annum. Instead, the problem which is the focus of attention in the UK is the formation of ice on roads. On many winter nights, the forecast is straightforward and the roads are treated if necessary. However, marginal nights, where temperatures are close to freezing, are more problematic. This paper studies traffic accidents across the West Midlands during the winter months December to February with the aim of applying UKCIP (UK Climate Impacts Programme) climate change scenarios to determine how the number of days requiring winter road maintenance may change in the future and how this subsequently may affect road traffic accident statistics.
2. Methodology
2.1 Area of Study & Weather Data The focus of this study is the county of the West Midlands (Figure 1) which is the second largest conurbation in the UK. This study makes use of weather data obtained from the World Meteorological Organisation weather station located centrally in the region at Elmdon (Birmingham Airport).
Figure 1. Area of interest, Showing the location of the West Midlands and Elmdon weather station.
2.2 STATS-19 Data In the UK, the recording of the weather as a factor in road accidents has been undertaken on police accident report forms (STATS-19) since 1969. All road accidents which involve a fatality or personal injury are recorded on the form, which is filled in at the site of the accident by an attending police officer. However, ‘damage-only’ or ‘minor injury’ accidents are not recorded. This means that true accident data are likely to be under-reported. Furthermore, although weather conditions are recorded in the database, it is important to appreciate that road accidents are caused by a combination of factors and that weather may not be the principal cause.

The impact of climate change on winter road maintenance and traffic accidents in West Midlands, UK |3
Figure 2 provides an overview of winter (DJF) traffic accidents numbers that have occurred in the West Midlands over the last 10 years. To put this into context, the accident rates are plotted against the winter mean temperature. Since DJF 1999-2000, there has been a general downward trend in the number of accidents recorded each year. This is in common with other studies and is attributed to be a consequence of improvements in vehicle technology (Edwards, 1996). However, over this time period there is no overall warming trend evident in the mean winter temperatures. Indeed there is a limited relationship between mean temperature and long term accident rates, although the coldest year (DJF 2000-2001) did produce the second highest number of accidents. In order to improve understanding of the impact of temperature on road accidents, much more detailed analysis of individual years are required.
Figure 2 Accidents in the West Midlands plotted against mean winter temperatures. Accidents (grey bars), mean temperature .
This study contrasts the last two years of data shown in Figure 2 (DJF 2004-2005 and DJF 2005-2006). DJF 2004-2005 was chosen as this was a warm winter (although not exceptional for the last 10 years) with mean temperatures of 1.3°C above the 1961-1990 baseline (UK Met Office, 2009). As a result, it may represent a temporal analogue of future average weather conditions (e.g. Feenstra et al., 1998). For comparison, DJF 2005-2006 was selected for a more detailed analysis as this was more an ‘average’ year being marginally warmer than the baseline conditions. Consecutive years were chosen so as to remove the impact of long-term trends on the accident data, for example, increasing traffic numbers or improvements in technology such as anti-lock brakes (Edwards, 1996). In the West Midlands, there were 2204 traffic accidents in DJF 2004-2005 (although only 2102 had a full record suitable for analysis). In DJF 2005-2006 the amount of accidents was similar totalling 2081 (2070 with a full record). These accidents are plotted in Figure 3 against the air temperature value measured at Elmdon when the accident occurred. Surprisingly, considering the difference in average temperature recorded in each of the two seasons, the total number of accidents in each of the years is very similar.
0
2
4
6
8
10
12
0
500
1000
1500
2000
2500
3000
97-98 98-99 99-00 00-01 01-02 02-03 03-04 04-05 05-06
Tem
per
atu
re
Acc
iden
ts
Winter

4| The impact of climate change on winter road maintenance and traffic accidents in West Midlands, UK
a)
b)
Figure 3. Road accidents in the West Midlands. a) Amount of accidents in December to February 2004-2005 & 2005-2006, 2004-2005 2005-2006, and b) cumulative percentage plot.
Figure 3b shows a cumulative percentage graph for accident numbers at different air temperatures. Here the difference between the two winters can be more clearly identified with a greater percentage of accidents occurring below the 0°C threshold in DJF 2005-2006. In terms of winter maintenance, 0°C is a critical threshold as ice is most slippery at 0°C when in a semi-frozen state (Moore, 1975). However, this is based on road temperature and not air temperature. Although the two are related, there is no rule of thumb measurement to translate between the two. During the winter months, it is not unusual for road surface temperatures to be several degrees below air temperature (Bogren & Gustavsson, 1991; Thornes, 1991), but this is very much dependent on the local geography (Chapman et al., 2001). For example road surface temperatures during a clear and calm evening change more rapidly in valleys and depressions than at more exposed locations (Gustavsson et al., 1998). This can be seen in Figure 3a as the accident rate peaks at air temperatures around 4-6°C (therefore, road temperatures could theoretically be below freezing). This could be a consequence of the increased frequency of temperatures in this range but could also be caused by
0
50
100
150
200
250
300
-10 -9 -8 -7 -6 -5 -4 -3 -2 -1 0 1 2 3 4 5 6 7 8 9 10 11 12 13 14 15
Traf
fic
acci
den
ts
Air Temperature (°C)
0
10
20
30
40
50
60
70
80
90
100
-10 -9 -8 -7 -6 -5 -4 -3 -2 -1 0 1 2 3 4 5 6 7 8 9 10 11 12 13 14 15
Traf
fic
acci
den
ts (
%)
Air Temperature (°C)
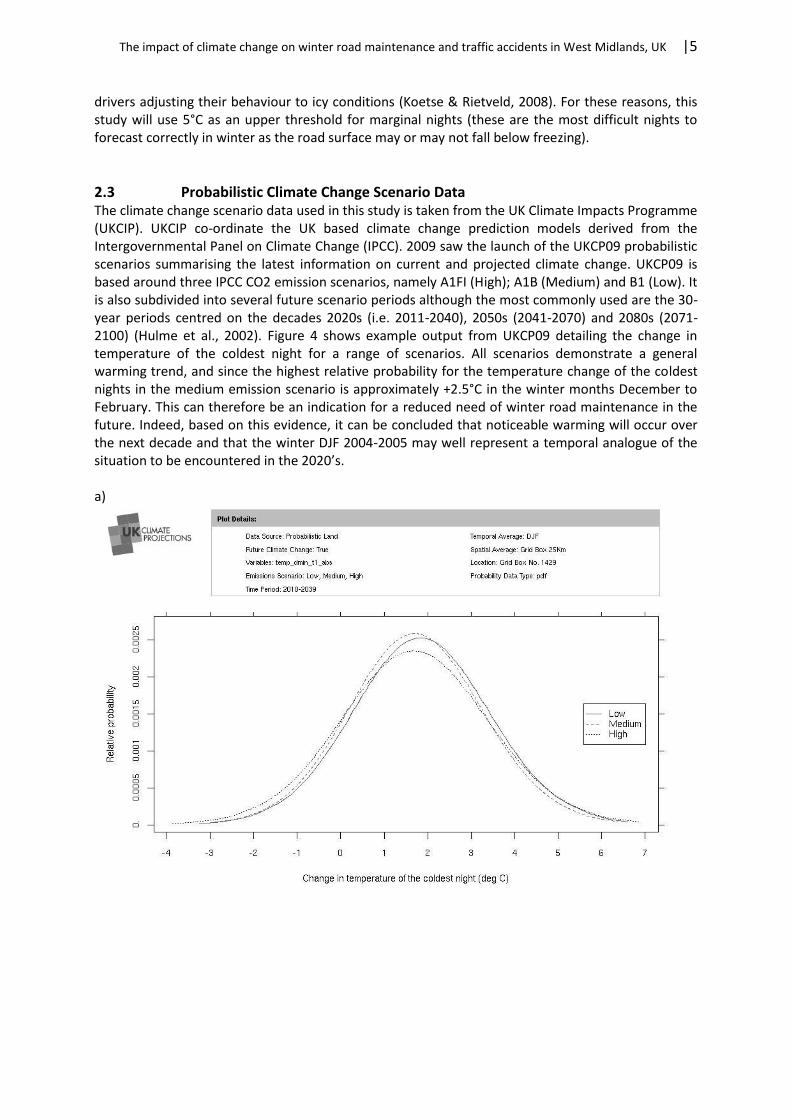
The impact of climate change on winter road maintenance and traffic accidents in West Midlands, UK |5
drivers adjusting their behaviour to icy conditions (Koetse & Rietveld, 2008). For these reasons, this study will use 5°C as an upper threshold for marginal nights (these are the most difficult nights to forecast correctly in winter as the road surface may or may not fall below freezing).
2.3 Probabilistic Climate Change Scenario Data The climate change scenario data used in this study is taken from the UK Climate Impacts Programme (UKCIP). UKCIP co-ordinate the UK based climate change prediction models derived from the Intergovernmental Panel on Climate Change (IPCC). 2009 saw the launch of the UKCP09 probabilistic scenarios summarising the latest information on current and projected climate change. UKCP09 is based around three IPCC CO2 emission scenarios, namely A1FI (High); A1B (Medium) and B1 (Low). It is also subdivided into several future scenario periods although the most commonly used are the 30-year periods centred on the decades 2020s (i.e. 2011-2040), 2050s (2041-2070) and 2080s (2071-2100) (Hulme et al., 2002). Figure 4 shows example output from UKCP09 detailing the change in temperature of the coldest night for a range of scenarios. All scenarios demonstrate a general warming trend, and since the highest relative probability for the temperature change of the coldest nights in the medium emission scenario is approximately +2.5°C in the winter months December to February. This can therefore be an indication for a reduced need of winter road maintenance in the future. Indeed, based on this evidence, it can be concluded that noticeable warming will occur over the next decade and that the winter DJF 2004-2005 may well represent a temporal analogue of the situation to be encountered in the 2020’s. a)

6| The impact of climate change on winter road maintenance and traffic accidents in West Midlands, UK
b)
c)
Figure 4. Change in temperature of the coldest night from UKCP09 climate change predictions for a) 2020’s b) 2050’s and c) 2080’s.
2.4 Weather Generators Weather generators are used to produce time series’ of stochastic weather data based on the baseline climate (Hutchinson, 1987), however they have recently been adapted to account for

The impact of climate change on winter road maintenance and traffic accidents in West Midlands, UK |7
climate change scenarios (e.g. Semenov & Barrow, 1997). Before the launch of the UKCP09 scenarios, weather generators were needed to produce probabilistic output. The increased information available from UKCP09 now means that the use of a weather generator is not necessary for many studies, but the functionality has been included to allow for studies at a daily time-scale. However, at the time of writing, the UKCP09 and associated threshold detector was still in development and hence for the purpose of the study, EARWIG (Environment Agency Rainfall and Weather Impacts Generator), which is based on the earlier UKCIP02 scenarios is used. EARWIG uses observed baseline (1961-2000) weather data from the UK Meteorological Office to produce daily weather records which can then be used to generate probability distributions. EARWIG uses two stochastic models, first a simulation of rainfall that is used in the second model that is generating the other variables that is depending on rainfall. Although EARWIG was originally developed for use in the climate impact assessments of agricultural and water system management (see Kilsby et al., 2007 for a full description of the model and application), it has since been used in other climate change impact assessments. For example, Dobney et al. (2009) used the technique to study the impact of climate change on railway buckling in the southeast UK. In this study, EARWIG was used to calculate temperature distributions for the baseline scenario and also for the three future time slices, 2020, 2050 and 2080. In the interests of conciseness, only the UKCIP02 medium-high emission scenario derived from the IPCC SRES A2 storyline is used (Hulme et al., 2002).
3. Results
3.1 Future climate scenarios Using EARWIG, the percentage of days per month with air temperatures equal or below the two thresholds of 0°C and 5°C were calculated (Figure 5a,b). As expected, in line with the UKCP09 scenarios, there is a general trend of increasing temperatures over time. This in turn translates into a decrease in the number of frost days and length of the winter season. At the moment, 69 frost days can be expected in the region every year, but this is predicted to shorten to 28 by 2080 (Figure 5a). A similar trend can also be seen using the upper threshold of 5°C (Figure 5b), a reduction of 38%. The frequency of each minimum temperature over the course of a year is summarised in Figure 5c.
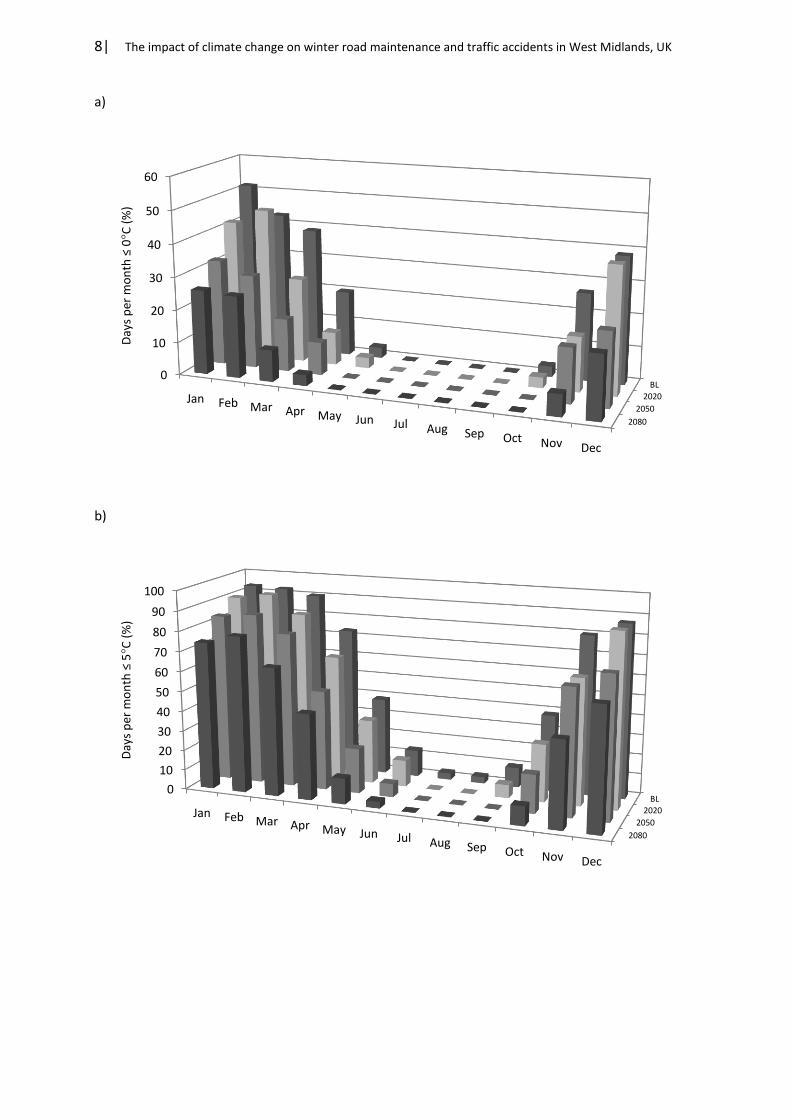
8| The impact of climate change on winter road maintenance and traffic accidents in West Midlands, UK
a)
b)
2080
2050
2020
BL0
10
20
30
40
50
60
Jan Feb Mar Apr May Jun Jul Aug Sep Oct Nov Dec
Day
s p
er m
on
th ≤
0°C
(%
)
2080
2050
2020BL
0
10
20
30
40
50
60
70
80
90
100
Jan Feb Mar Apr May Jun Jul Aug Sep Oct Nov Dec
Day
s p
er m
on
th ≤
5°C
(%
)
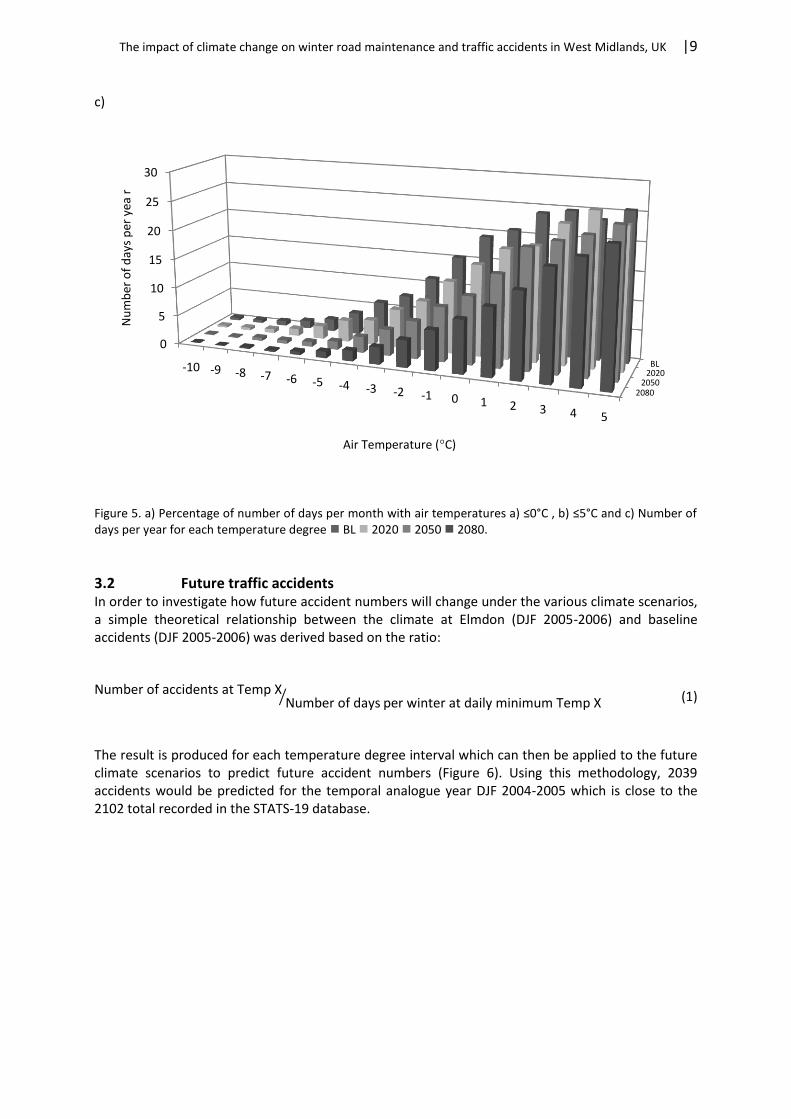
The impact of climate change on winter road maintenance and traffic accidents in West Midlands, UK |9
c)
Figure 5. a) Percentage of number of days per month with air temperatures a) ≤0°C , b) ≤5°C and c) Number of days per year for each temperature degree BL 2020 2050 2080.
3.2 Future traffic accidents In order to investigate how future accident numbers will change under the various climate scenarios, a simple theoretical relationship between the climate at Elmdon (DJF 2005-2006) and baseline accidents (DJF 2005-2006) was derived based on the ratio: Number of accidents at Temp X
Number of days per winter at daily minimum Temp X (1)
The result is produced for each temperature degree interval which can then be applied to the future climate scenarios to predict future accident numbers (Figure 6). Using this methodology, 2039 accidents would be predicted for the temporal analogue year DJF 2004-2005 which is close to the 2102 total recorded in the STATS-19 database.
20802050
2020BL
0
5
10
15
20
25
30
-10 -9 -8 -7 -6 -5 -4 -3 -2 -1 0 1 2 3 4 5
Nu
mb
er o
f d
ays
per
yea
r
Air Temperature (°C)
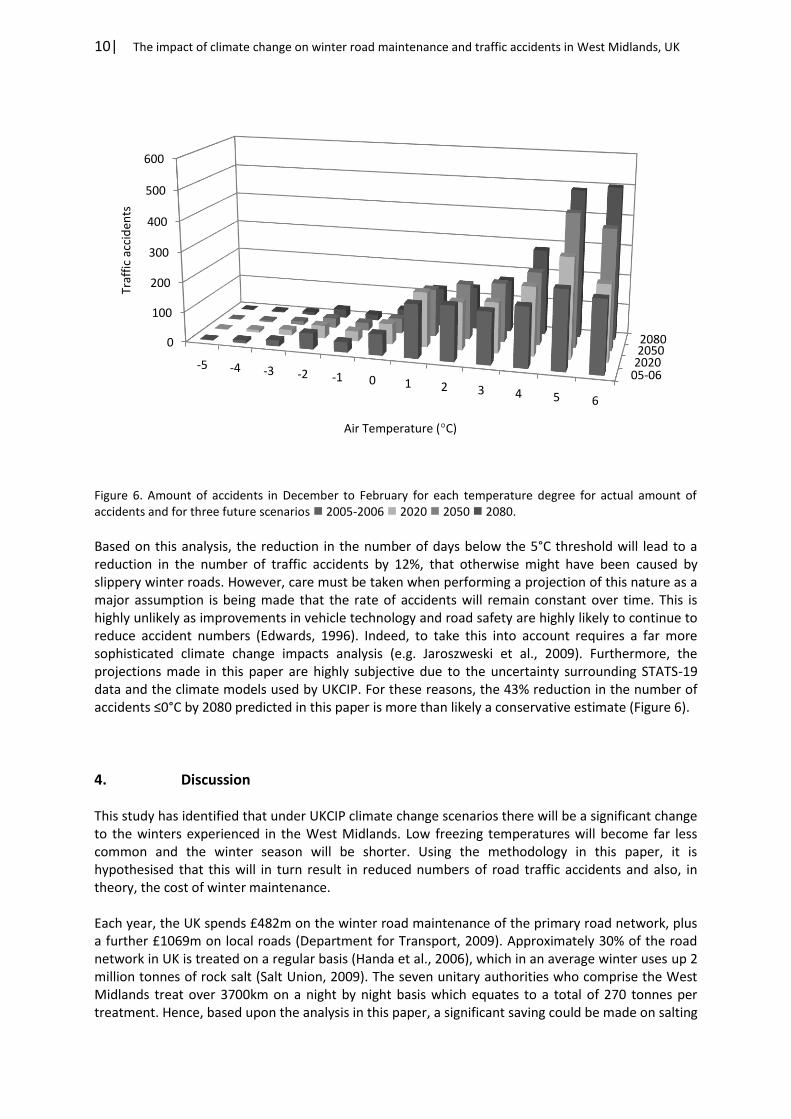
10| The impact of climate change on winter road maintenance and traffic accidents in West Midlands, UK
Figure 6. Amount of accidents in December to February for each temperature degree for actual amount of accidents and for three future scenarios 2005-2006 2020 2050 2080.
Based on this analysis, the reduction in the number of days below the 5°C threshold will lead to a reduction in the number of traffic accidents by 12%, that otherwise might have been caused by slippery winter roads. However, care must be taken when performing a projection of this nature as a major assumption is being made that the rate of accidents will remain constant over time. This is highly unlikely as improvements in vehicle technology and road safety are highly likely to continue to reduce accident numbers (Edwards, 1996). Indeed, to take this into account requires a far more sophisticated climate change impacts analysis (e.g. Jaroszweski et al., 2009). Furthermore, the projections made in this paper are highly subjective due to the uncertainty surrounding STATS-19 data and the climate models used by UKCIP. For these reasons, the 43% reduction in the number of accidents ≤0°C by 2080 predicted in this paper is more than likely a conservative estimate (Figure 6).
4. Discussion This study has identified that under UKCIP climate change scenarios there will be a significant change to the winters experienced in the West Midlands. Low freezing temperatures will become far less common and the winter season will be shorter. Using the methodology in this paper, it is hypothesised that this will in turn result in reduced numbers of road traffic accidents and also, in theory, the cost of winter maintenance. Each year, the UK spends £482m on the winter road maintenance of the primary road network, plus a further £1069m on local roads (Department for Transport, 2009). Approximately 30% of the road network in UK is treated on a regular basis (Handa et al., 2006), which in an average winter uses up 2 million tonnes of rock salt (Salt Union, 2009). The seven unitary authorities who comprise the West Midlands treat over 3700km on a night by night basis which equates to a total of 270 tonnes per treatment. Hence, based upon the analysis in this paper, a significant saving could be made on salting
05-062020205020800
100
200
300
400
500
600
-5 -4 -3 -2 -1 0 1 2 3 4 5 6
Traf
fic
acci
den
ts
Air Temperature (°C)

The impact of climate change on winter road maintenance and traffic accidents in West Midlands, UK |11
operations in the West Midlands by 2080. Since the authorities make preventive maintenance, and the number of days below five degrees (marginal nights with risk for slippery roads) is reduced with 38% the reduction of salt can be in the same range. However, an environment of continual cost cutting currently exists. Local authorities seek to achieve ‘best-value’ for the local taxpayers by reducing costs on services wherever possible. After a number of mild years in the UK (Figure 2), there has been the temptation to gradually reduce stockpiles of salt as a cost-saving measure. An initial run of mild winters had proven this to be a prudent measure, there was serious shortcomings over the winter season 2008-2009 where many councils ran out of salt. The result was that many roads across the country went untreated leading to widespread disruption reported across the media. Such complacency is not new in the UK. The country is frequently underprepared for snow-related problems (e.g. Thornes, 2005; London Assembly, 2009), and the danger is that a similar situation is now starting to occur with icy roads. Whilst lessons will have been learned from the winter season 2008-2009, talk of climate change will always make winter road maintenance an easy target for decision makers when setting annual budgets. An argument could be made that if freezing temperatures are rarely experienced in the future, it may not be appropriate to operate a winter maintenance service (at least not at the level accustomed to). However, as this paper has shown, it is not the coldest of nights which cause the problems (≤0°C), it is the marginal nights (≤5°C). Indeed, the number of marginal nights will not change significantly over the next century. In the Baseline DJF there were 82 marginal nights with a minimum temperature of 5°C or under. By 2080 this reduces to 65, a reduction of 21%. However, this still means that a winter maintenance service will be required in the future to secure the roads and thereby reduce road accidents under the most dangerous of situations where surface temperatures hover above 0°C. To some extent this is also demonstrated by the use of DJF 2004-2005 as a temporal analogue where the increased temperatures experienced in that year made only a minor difference to accident numbers when compared with a baseline year (Figure 2a). In effect, accident numbers were greater than predicted which underlines the need for caution when using temporal analogues to infer future climate change (e.g. Andersson and Chapman, 2009)
5. Conclusion In summary, the number of frost days (≤0°C) and the length of the winter season will reduce in the West Midlands. This will theoretically result in a 43% reduction in the number of accidents caused due to slipperiness (days with frost). It can also lead to a reduction in the quantity of salt required to treat the roads. However, as the number of dangerous marginal nights (≤5°C) still remain in approximately 30% of the days in a year (Figure 5c), it will remain essential to maintain a winter maintenance service over the next 80 years to prevent a significant increase in accident numbers due to winter weather.
References Andersson, A.K., Chapman, L., 2009. The use of a temporal analogue to predict future traffic accidents and winter road conditions in Sweden. Accepted to Meteorological Applications. Andreescu, M.P., Frost, D.B., 1998. Weather and traffic accidents in Montreal, Canada. Climate Research 9, 225–230.

12| The impact of climate change on winter road maintenance and traffic accidents in West Midlands, UK
Andrey, J., Olley, R., 1990. The relationship between weather and road safety: past and future research directions. Climatological Bulletin 24, 123-127. Asano, M., Hirasawa, M., 2003. Characteristics of traffic accidents in cold, snowy Hokkaido, Japan. Proceedings of the Eastern Asia Society for Transportation Studies, Vol.4. Bogren, J & Gustavsson, T. (1991). Nocturnal air and road surface temperature variations in complex terrain. International Journal of Climatology 11: 443-455. Chapman, L., Thornes, J.E. & Bradley, A.V. (2001) Modelling of road surface temperatures from a geographical parameter database. Part 2: Numerical Meteorological Applications 8: 421-436 Codling, P.J., 1974. Weather and road accidents. In. Taylor JA (ed) Climatic resources and economic activity. David & Charles Holdings, Newton Abbot, p 205-222. Department for Transport, 2009. Transport Statistics Great Britain 2008 Available from: http://www.dft.gov.uk [Accessed June 2009] Dobney, K., Baker, C.J., Quinn, A.D., Chapman, L., 2009. Quantifying the effects of high summer temperatures due to climate change on buckling and rail related delays in south-east United Kingdom. Meteorological Applications 16, 245-251. Edwards, J.B., 1996. Weather-related road accidents in England and Wales: a spatial analysis. Journal of Transport Geography 4, 201–212. Edwards, J.B., 1999. Speed adjustment of motorway commuter traffic to inclement weather. Transportation Research Part F 2, 1−14. Feenstra JF, Burton I, Smith JB, Tol RSJ. 1998. Handbook on Methods for Climate Change Impact Assessment and Adaptation Strategies. United Nations Environment programme: Amsterdam; Institute for Environment Studies: Nairobi; 80. Fridström, L., Ifver, J., Ingebrigtsen, S., Kulmala, R., Thomsen, L.K., 1995. Measuring the contribution of randomness, exposure, weather, and daylight to the variation in road accident counts. Accident Analysis and Prevention 27 (1), 1-20. Gustavsson, T., Karlsson, M., Bogren, J., Lindqvist, S., 1998. Development of temperature patterns during clear and calm nights. Journal of Applied Meteorology 37, 559-571. Handa, H., Lin, D., Chapman, L., Yao, X., 2006. Robust Solution of Salting Route Optimisation Using Evolutionary Algorithms. Proceedings of the 2006 Congress on Evolutionary Computation (CEC'06), 3098-3105. Hassan, Y.A., & Barker, D.J., 1999. The impact of unseasonable or extreme weather on traffic activity within Lothian region, Scotland. Journal of Transport Geography 7, 209-213. Hulme,M., Jenkins,G.J., Lu,X., Turnpenny,J.R., Mitchell,T.D., Jones,R.G., Lowe,J., Murphy,J.M., Hassell,D., Boorman,P., McDonald,R. Hill,S. 2002. Climate Change Scenarios for the United Kingdom: The UKCIP02 Scientific Report, Tyndall Centre for Climate Change Research, School of Environmental Sciences, University of East Anglia, Norwich, UK. 120pp

The impact of climate change on winter road maintenance and traffic accidents in West Midlands, UK |13
Hutchinson MF. 1987. Methods for generation of weather sequences. In Agricultural Environments: Characterisation, Classification and Mapping, Bunting AH (ed.). CAB International: Wallingford; 149-157. IPCC. 2000. Summary for Policy Makers, Emissions Scenarios, Intergovernmental Panel on Climate Change, Working group III, 27. Jaroszweski, D., Chapman, L. & Petts, J.I., In Press. Assessing the potential impact of climate change on transportation: The need for an interdisciplinary approach. Journal of Transport Geography. Keay, K., Simmonds, I., 2006. Road accidents and rainfall in a large Australian city. Accident Analysis and Prevention 38 (3), 445-454. Kilpeläinen, M., & Summala, H., 2007. Effects of weather and weather forecasts on driver behaviour. Transportation Research Part F 10, 288–299. Kilsby, C.G., Jones, P.D., Burton, A., Ford, A.C., Fowler, H.J., Harpham, C., James, P., Smith, A., Wilby, R.L.. 2007. A daily weather generator for use in climate change studies. Environmental Modelling & Software 22, 1705-1719. Koetse, M.J. & Rietveld, P. 2009. The impact of climate change and weather on transport: An overview of empirical findings. Transportation Research Part D 14, 205-201. London Assembly, 2009. Slipping up? Impact of extreme weather on London Transport. http://www.london.gov.uk/assembly/reports/transport/snow-report-0309.pdf [Accessed 18/06/2009] Moore, D.F., 1975. The friction of pneumatic tyres. Oxford: Elsevier Scientific. 220pp. Norrman, J., Eriksson, M. & Lindqvist, S. 2000. Relations between traffic accidents on slippery roads and winter road maintenance. Climate Research 15, 185–193. Palutikof, J.P., 1991. Road accidents and weather. In A. H. Perry & L. J. Symons, Highway meteorology. London: E & FN Spon. Parry, M.L., 2000. Assessment of Potential Effects and Adaptations for Climate Change in Europe: the Europe ACACIA project. Jackson Environment Institute, University of East Anglia. Salt Union. Available from: http://www.saltunion.com/news/quick-facts [Accessed December 2009] Semenov MA, Barrow EM. 1997. Use of a stochastic weather generator in the development of climate change scenarios. Climatic Change 35: 397-414. Smith, K., 1982. How seasonal weather conditions influence road accidents in Glasgow. Scottish Geographical Magazine 98, 102-114. Songchitruksa, P., Balke, K.N., 2006. Assessing weather, environment, and loop data for real-time freeway incident prediction. Transport Research Record 1959, 105–113. Suggett ,J., 1999. The effect of precipitation on traffic safety in the city of Regina. Master of Science Thesis, University of Regina, Saskatoon.

14| The impact of climate change on winter road maintenance and traffic accidents in West Midlands, UK
Thornes, J.E. (1991) Thermal mapping and road-weather information systems for highway engineers, in Perry, A.H. & Symons, L.J. (eds) Highway Meteorology, E & FN Spon, London. 39-67pp. Thornes, J.E., 2005. Snow and road chaos in Birmingham on 28th January, 2004. Weather 60, 146-149 UK Met Office, 2009. Available from: http://www.metoffice.gov.uk [Accessed June 2009]

Related Documents