November 2009 Winter Maintenance Performance Measurement Using Friction Testing Transportation Association of Canada

Welcome message from author
This document is posted to help you gain knowledge. Please leave a comment to let me know what you think about it! Share it to your friends and learn new things together.
Transcript

November 2009
Winter Maintenance PerformanceMeasurement Using Friction Testing
Transportation Association of Canada

Copyright 2009 byTransportation Association of Canada2323 St. Laurent Blvd.Ottawa, ON K1G 4J8Tel. (613) 736-1350 ~ Fax (613) 736-1395www.tac-atc.ca
ISBN 978-1-55187-273-0
DISCLAIMER
The material presented in this text was carefully researched and presented. However,no warranty expressed or implied is made on the accuracy of the contents or theirextraction from reference to publications; nor shall the fact of distribution constituteresponsibility by TAC or any researchers or contributors for omissions, errors or pos-sible misrepresentations that may result from use of interpretation of the material con-tained herein.

TAC REPORT DOCUMENTATION FORM
Title and Subtitle Winter Maintenance Performance Measurement Using Friction Testing
Report Date
November 2009
Coordinating Agency and Address Transportation Association of Canada 2323 St. Laurent Boulevard Ottawa, ON K1G 4J8
ITRD No.
Author(s) Sany Zein
Corporate Affiliation(s) and Address(es) Opus International Consultants (Canada) Limited 850-1185 West Georgia St. Vancouver, B.C. Canada V63 4E6
Abstract Through a literature review and a survey of current practices throughout Canada and various international countries, this study established the latest developments with regards to winter friction testing and how it is integrated into winter maintenance operations. The types of equipment used and their effectiveness according to road agencies’ experiences were reviewed. The study also investigated the current approaches of road agencies related to communicating road friction in addition to other information that is provided to motorists during winter.
In summary, winter road surface friction measurement has been used by three Scandinavian countries (Finland, Norway and Sweden) as a quality standard and has been found by the respective road administrations as a useful tool to safeguard traffic safety. These road agencies have indicated that measuring friction can be difficult and challenging, and there are plans to improve the quality standards with further research and development.
Keywords
• Winter Maintenance • Properties of Road
Surfaces • Surfacing • Friction • Measurement • Safety • Black Ice
Supplementary Information

.
.

Winter Maintenance Performance Measurement Using Friction Testing
November 2009 i
ACKNOWLEDGEMENTS
The development of the Winter Maintenance Performance Measurement Using Friction Testing report was undertaken with funding provided by several agencies. TAC gratefully acknowledges the following sponsors for their contributions to the project.
Alberta Transportation
British Columbia Ministry of Transportation and Infrastructure
Ministry of Transportation, Ontario
Ministère des transports du Québec
Nova Scotia Department of Transportation & Infrastructure
Prince Edward Island Department of Transportation and Public Works
City of Winnipeg
City of Edmonton
Salt Institute

Winter Maintenance Performance Measurement Using Friction Testing
November 2009 ii
PROJECT STEERING COMMITTEE
This project was conducted under the supervision of a project steering committee. The members are gratefully acknowledged for their time and effort to the study.
Nicole Pharand-Fraser (Chair) British Columbia Ministry of Transportation and Infrastructure Moh Lali Alberta Transportation Sharla Griffiths Alberta Transportation Gary Todd Ministry of Transportation, Ontario Michel Brown Ministère des Transports du Québec Paul E. Richard Nova Scotia Department of Transportation & Infrastructure Kenneth Boyd City of Winnipeg Barry Belcourt City of Edmonton Richard L. Hanneman Salt Institute Asim Baluch (Project Manager) Transportation Association of Canada

Winter Maintenance Performance Measurement Using Friction Testing
November 2009 iii
TABLE OF CONTENTS EXECUTIVE SUMMARY...............................................................................................ix 1 INTRODUCTION .....................................................................................................1
1.1 Background..........................................................................................................................1 1.2 Study Objectives..................................................................................................................1 1.3 Study Methodology .............................................................................................................2
2 LITERATURE REVIEW...........................................................................................3 2.1 Introduction to Literature Review.......................................................................................3 2.2 Quantification of Winter Road Condition Measurements ................................................3
2.2.1 Road Weather Information System...........................................................................3 2.2.2 Friction Measurement ...............................................................................................4
2.2.2.1 Friction Measurement Models ..................................................................4 2.2.2.2 Direct Friction Measurements...................................................................4 2.2.2.3 Uses of Friction Measurements ................................................................4 2.2.2.4 Factors Affecting Friction Measurement ...................................................5 2.2.2.5 Harmonization of Friction Measurements .................................................6
2.2.3 Application of Friction Measurements.......................................................................7 2.2.3.1 Use of Devices in the Field.......................................................................7 2.2.3.2 Use of Devices in Winter Maintenance Research ..................................14 2.2.3.3 Pilot Testing of Friction Devices .............................................................15
2.3 Types of Instruments and Equipment Used for Winter Road Condition Measurements...................................................................................................... ........................................................................................................................................16 2.3.1 RWIS Sensors ........................................................................................................16 2.3.2 Friction Measurement Devices ...............................................................................17
2.3.2.1 Considerations for Friction Measurement Device Selection ...................17 2.3.2.2 Deceleration Devices with ABS Vehicles................................................18 2.3.2.3 Locked Wheel Testers............................................................................19 2.3.2.4 Side Force or Constant Slip Angle Devices............................................20 2.3.2.5 Fixed Slip Devices ..................................................................................21 2.3.2.6 Variable Slip Devices..............................................................................22
2.3.3 New Emerging Technologies..................................................................................26 2.3.3.1 Intelligent Tires .......................................................................................26 2.3.3.2 Vaisala Sensors......................................................................................26 2.3.3.3 Other Sensors ........................................................................................29
2.3.4 Vehicle Infrastructure Integration............................................................................30 3 CURRENT PRACTICES SURVEY........................................................................31
3.1 Overview of Agency Survey..............................................................................................31 3.1.1 Canadian Road Agencies .......................................................................................32 3.1.2 International Road Agencies...................................................................................32
3.2 Objectives for Measuring Winter Road Conditions ........................................................32 3.2.1 Canadian Road Agencies .......................................................................................32 3.2.2 International Road Agencies...................................................................................33

Winter Maintenance Performance Measurement Using Friction Testing
November 2009 iv
3.3 Methods for Quantifying Winter Road Condition Measurements .................................33 3.3.1 Canadian Road Agencies .......................................................................................33
3.3.1.1 Alberta Transportation ............................................................................35 3.3.1.2 Ministère des Transports du Québec .....................................................36 3.3.1.3 Ontario Ministry of Transportation ..........................................................36
3.3.2 International Road Agencies...................................................................................36 3.3.2.1 Denmark .................................................................................................38 3.3.2.2 Finland....................................................................................................40 3.3.2.3 Germany.................................................................................................45 3.3.2.4 Japan......................................................................................................45 3.3.2.5 New Zealand and Australia ....................................................................45 3.3.2.6 Norway ...................................................................................................45 3.3.2.7 Sweden...................................................................................................47 3.3.2.8 United Kingdom ......................................................................................49 3.3.2.9 United States ..........................................................................................49
3.4 Types of Instruments and Equipment Used and their Effectiveness ...........................52 3.4.1 Canadian Road Agencies .......................................................................................52
3.4.1.1 RWIS and Other Sensors .......................................................................52 3.4.1.2 Friction Measurement Devices ...............................................................52
3.4.2 International Road Agencies...................................................................................55 3.4.2.1 RWIS and Other Sensors .......................................................................55 3.4.2.2 Friction Measurement Devices ...............................................................55
3.5 Communicating Road Conditions to Road Users...........................................................60 3.5.1 Canadian Road Agencies .......................................................................................60 3.5.2 International Road Agencies...................................................................................61
3.5.2.1 Ohio Department of Transportation ........................................................61 3.5.2.2 Denmark .................................................................................................61 3.5.2.3 Finland....................................................................................................62 3.5.2.4 Norway ...................................................................................................62 3.5.2.5 Sweden...................................................................................................63 3.5.2.6 Japan......................................................................................................64
3.6 Lessons Learned from Current Usage of Friction Measurements................................64 3.6.1 Standard for Measuring Friction..............................................................................64 3.6.2 Different Results from Different Friction Devices ....................................................65 3.6.3 Limitations of Friction Devices ................................................................................65
4 RESEARCH GAPS................................................................................................67 4.1 Thorough Evaluation of Winter Friction Devices............................................................67 4.2 Harmonization of Winter Friction Measurement .............................................................68 4.3 Communication of Road Conditions to Road Users ......................................................68 4.4 Evaluation of Actual Vehicle Performance on Winter Roads ........................................68 4.5 Focus on Operational Needs ............................................................................................69 4.6 European Experiences ......................................................................................................69 4.7 Selection of Friction Devices For Canadian Applications .............................................70
5 RECOMMENDATIONS FOR CANADIAN ROAD AGENCIES.............................73 5.1 Enhancing Current Practices ...........................................................................................73
5.1.1 Conducting Trial Evaluation of Non-Invasive Technology ......................................73

Winter Maintenance Performance Measurement Using Friction Testing
November 2009 v
5.1.2 Meeting Transportation Association of Canada’s Mandate for Salt Management and Environmental Management ............................................................................74
5.1.3 Developing Winter Maintenance Management Strategies......................................74 5.1.3.1 Communication of Road Conditions to Road Users – Next Steps..........75 5.1.3.2 Evaluating Performance of Contractors – Next Steps ............................76
5.2 Future Technical Considerations.....................................................................................77 5.2.1 Use of Friction Devices to Control Spreader Output...............................................77 5.2.2 Application of Thermal Mapping .............................................................................77 5.2.3 Application of Advanced Technologies...................................................................78
6 CONCLUSION.......................................................................................................79 BIBLIOGRAPHY ..........................................................................................................81
Winter Maintenance Performance Measurement Using Friction Testing
November 2009 vi
APPENDIX A Literature review summaries APPENDIX B Current practices survey questionnaire and surveyed organizations and
individuals APPENDIX C Canadian survey responses APPENDIX D International survey responses APPENDIX E Friction device cost information APPENDIX F Current practices survey attachments (relevant reports, publications, etc)

Winter Maintenance Performance Measurement Using Friction Testing
November 2009 vii
List of Figures FIGURE 2.1 FOUR STANDARD FRICTION TEST TIRES. ....................................................6 FIGURE 2.2 RT3 UNIT TESTED IN JAPAN .........................................................................15 FIGURE 2.3 C-TRIP-MU DEVICE.........................................................................................19 FIGURE 2.4 LWFT BUS DEVICE .........................................................................................20 FIGURE 2.5 NORSEMETER ROAR FRICTION MEASUREMENT TRAILER.......................22 FIGURE 2.6 FRICTION –SLIP CURVE OF A BRAKING TIRE SHOWING
THE FRICTION VARIATION FROM FREE ROLLING (0% SLIP) TO LOCKED WHEEL (100% SLIP) ..................................................................23
FIGURE 2.7 SALTAR FRICTION MEASURING DEVICE MOUNTED ON A SALTED/PLOW TRUCK .........................................................................24
FIGURE 2.8 VAISALA GUARDIAN INCLUDING DSC111 AND DST111 SENSORS...........28 FIGURE 3.1 VARIABLE SPEED SIGN IN SWEDEN.............................................................64 List of Tables TABLE 2.1 CORRELATION BETWEEN FRICTION VALUES AND DRIVING
CONDITIONS IN FINLAND ................................................................................8
TABLE 2.2 A) FINNISH WINTER MAINTENANCE CLASSES .............................................9
TABLE 2.2 B) QUALITY STANDARDS OF WINTER MAINTENANCE IN FINLAND. ...........9
TABLE 2.3 SWEDEN’S FRICTION STANDARDS..............................................................11
TABLE 2.4 NORWAY’S FRICTION STANDARDS..............................................................12
TABLE 2.5 ROAD CLASSIFICATION IN JAPAN................................................................13
TABLE 2.6 MANAGEMENT OBJECTIVES IN JAPAN........................................................13
TABLE 2.7 ROAD SURFACE CONDITION CLASSIFICATION USED IN JAPAN..............13
TABLE 2.8 ROAD AGENCIES’ EXPERIENCE WITH FRICTION MEASUREMENTS ........16
TABLE 2.9 FRICTION DEVICES USED OR TESTED BY CANADIAN AND INTERNATIONAL AGENCIES..........................................................................25
TABLE 3.1 CURRENT PRACTICES OF CANADIAN ROAD AGENCIES...........................34
TABLE 3.2 CURRENT PRACTICES OF INTERNATIONAL ROAD AGENCIES.................37
TABLE 3.3 FRICTION DEVICES ADVANTAGES AND DISADVANTAGES (INFORMATION PROVIDED BY CANADIAN ROAD AGENCIES)...................53
TABLE 3.4 FRICTION DEVICES ADVANTAGES AND DISADVANTAGES (INFORMATION PROVIDED BY INTERNATIONAL ROAD AGENCIES).........56

Winter Maintenance Performance Measurement Using Friction Testing
November 2009 viii
THIS PAGE WAS INTENTIONALLY LEFT BLANK

Winter Maintenance Performance Measurement Using Friction Testing
November 2009 ix
EXECUTIVE SUMMARY
The Transportation Association of Canada has a long term vision to utilize the benefits of winter road surface friction testing in facilitating winter maintenance planning, evaluating the effectiveness of winter maintenance operations, minimizing environmental impacts, and enhancing road safety by communicating friction levels in a format that can be understood by motorists.
This study is intended as the first phase in achieving this long term vision. Through a literature review and a survey of current practices throughout Canada and various international countries, this study established the latest developments with regard to winter friction testing and how it is integrated into winter maintenance operations. The types of equipment used and their effectiveness according to road agencies’ experiences were reviewed. The study also investigated the current approaches of road agencies related to communicating road friction in addition to other information that is provided to motorists during winter.
In summary, winter road surface friction measurement has been used by three Scandinavian countries (Finland, Norway and Sweden) as a quality standard and has been found by the respective road administrations as a useful tool to safeguard traffic safety. These road agencies have indicated that measuring friction can be difficult and challenging, and there are plans to improve the quality standards with further research and development.
It is apparent from the experiences of these jurisdictions that in order to facilitate winter maintenance operations, it would be most beneficial to develop an efficient winter maintenance management system that integrates road condition measurements (which may include friction measurements) with tools that facilitate contractors’ performance and communicate real-time information to road users through the internet as well as variable message and variable speed signs.
Based on the consolidated review of the study findings, lessons learned from the current usage of friction measurements were identified. Research gaps have also been highlighted in this document, which included the following:
• Thorough Evaluation of Winter Friction Devices;
• Harmonization of Winter Friction Measurement;
• Communication of Road Conditions to Road Users;

Winter Maintenance Performance Measurement Using Friction Testing
November 2009 x
• Evaluation of Actual Vehicle Performance on Winter Roads;
• Focus on Operational Needs;
• European Experiences; and,
• Selection of Friction Devices for Canadian Applications.
Subsequent study phases may focus on the research gaps identified.
One of several recommendations made to enhance the current winter maintenance practices of Canadian road agencies include further planning and development of winter maintenance management systems as described above. Other recommendations include:
• Enhancing Capability of Road Weather Information System;
• Meeting Transportation Association of Canada’s Mandate for Salt Management and Environmental Management;
• Next Steps to Improve Communication of Road Conditions to Road Users; and,
• Next Steps to Improve the Evaluation of Contractors’ Performance.
Future technical considerations were also recommended, which would require technical advances before implementation. These recommendations include:
• Use of Friction Devices to Control Spreader Output;
• Application of Thermal Mapping; and,
• Application of Advanced Technologies.
As a first phase to meet the long term objectives established by Canadian road agencies with regard to winter friction measurements, this study provided a solid foundation of knowledge which subsequent phases can build upon.

Winter Maintenance Performance Measurement Using Friction Testing
November 2009 1
1 INTRODUCTION
1.1 BACKGROUND
During the winter season, snow and ice are common meteorological occurrences in many parts of Canada. These weather events pose significant safety risks for road users. Thus, the focus of winter maintenance operations by snow and ice control agencies lies in: determining risks from a climatological analysis, monitoring weather patterns and the state of pavement surfaces, and taking action that under icy conditions often necessitates prevention. One of the methods of determining the state of pavement surfaces is to measure the road surface friction level. This method has been used in the field by some road agencies and is extensively used by airport authorities to ensure airport runways are clear of icy and slippery conditions (Al-Qadi, 2002). However, the use of surface friction measurement by road agencies has mainly resided in research and development studies.
A long-term vision would be to utilize the benefits of friction testing in facilitating winter maintenance planning, evaluating the effectiveness of winter maintenance operations, minimizing environmental impacts, and enhancing road safety by communicating friction levels in a format that can be understood by motorists.
This study is intended to be the first phase in achieving this long-term vision. The outcome from this study forms a solid foundation with respect to the latest research developments in winter friction testing, current practices domestically and internationally, and any research gaps that have been identified. The subsequent study phases can focus on the areas requiring further research, any methodologies which are currently not in use by Canadian agencies but which may be feasible for application, the feasibility of applying standardization within and between Canadian provinces, and how friction measurements can be conveyed as useful information for motorists under winter driving conditions.
1.2 STUDY OBJECTIVES
The scope of this project is to examine methods that quantify winter road surface friction levels and current practices that measure real time winter road conditions. The specific objectives of the project are as follows:
• To identify the advantages, disadvantages, and effectiveness of each method; • To gather information on lessons learned by road agencies; • To identify new studies and methods that are currently under development; and,

Winter Maintenance Performance Measurement Using Friction Testing
November 2009 2
• To gather information on methods of communicating winter surface friction measurements to motorists.
1.3 STUDY METHODOLOGY
To achieve the objectives of the study, pertinent literature and research findings in the area of winter road surface friction measurements were reviewed. This information served as a foundation of the study. A summary of each literature source can be found in APPENDIX A, while the main findings of the literature are highlighted in SECTION 2 of this report.
Surveys were conducted for snow and ice control agencies and researchers in Canada, the United States (U.S.), the United Kingdom (U.K.), Australia, New Zealand, Europe, and Asia, as well as private consultants, a non-profit organization, and several friction device manufacturers who have experience or knowledge in the area of winter road surface friction measurements. The primary purpose was to determine the extent to which friction measurement is used in winter road surface condition monitoring programs, and to determine what are the advantages and disadvantages of the current methods being used. The surveys were distributed to the organizations by electronic mail and additional follow-up was conducted over the telephone with those agencies and individuals who appeared to have more experience with friction measurements. The complete questionnaire can be found in APPENDIX B and the main topics covered in the survey as well as the survey findings are outlined in SECTION 3 of this report. The results of the survey are also summarized in SECTION 3.
Based on the results of the literature review and agency surveys, Research Gaps were identified (SECTION 4), and Recommendations were developed for the consideration of Canadian agencies (SECTION 5).

Winter Maintenance Performance Measurement Using Friction Testing
November 2009 3
2 LITERATURE REVIEW
2.1 INTRODUCTION TO LITERATURE REVIEW
The literature review shows that a considerable amount of published reports and studies deal with strategies to measure winter road conditions, both in-use and theoretical. However, there is little documentation on agencies’ actual use of these road condition measurement strategies on a daily basis. In many of the studies, proposed road surface condition measurement methods are tested. However, these methods are not usually implemented or tested in the field by provincial, state, or local agencies in Canada or in the United States. In contrast, it appears that a few European countries are more progressive in terms of developing and implementing methods to measure winter road surface conditions.
2.2 QUANTIFICATION OF WINTER ROAD CONDITION MEASUREMENTS
2.2.1 Road Weather Information System
Today, the most widely used method to monitor winter road surface conditions is the road weather information system (RWIS). An RWIS consists of a network of monitoring stations, which are located along the road network and connected to a central computer system. At these stations, a variety of sensors are installed and used to measure parameters such as road surface and air temperature, humidity, water film thickness, and salt concentration. The data collected by these sensors is sent through the communication system to a central location where maintenance staff is able to read and analyze the information. RWIS use is particularly common in the United Kingdom and in European countries such as Finland, Sweden, Germany, Norway, Denmark, France, and the Netherlands. RWIS is also used in almost all Canadian provinces. However, the information provided by an RWIS, is still limited. They only provide information at a specific location along the roadway (Strong and Shi, 2008). In addition, they are expensive to build, operate and maintain (Ibid). Consequently, measuring road surface friction along roadways has been explored as a way to fill in this information gap.
Thermal mapping is a tool that can be integrated into an RWIS. Thermal mapping involves measuring road surface temperature under a range of different weather conditions using high resolution infrared thermometers fitted to a vehicle. The resulting pattern and distribution of warm and cold sections is determined by local environmental factors and prevailing weather conditions to generate a unique temperature fingerprint for each road. An advantage of thermal mapping over an RWIS is that thermal mapping can determine surface temperature across an entire road network, whereas an RWIS collects information at specific locations where sensors are installed.

Winter Maintenance Performance Measurement Using Friction Testing
November 2009 4
Thermal mapping has been used in Norway, Switzerland, and the Netherlands to help find suitable locations for measuring stations (PIARC, 2006). Trials have also been done in the U.K. using thermal maps to guide the gritting process.
2.2.2 Friction Measurement
2.2.2.1 Friction Measurement Models
To calculate friction, friction measurements can be directly taken in the field, or friction values can be modelled using other road characteristic data collected from the field. For example, Russell developed a model to forecast friction from asphalt material properties, age, traffic, and climate. According to Noyce et al. (2005), this model has been used by the Wisconsin Department of Transportation. Our study, however, focuses on direct friction measurements as opposed to friction models as a method to determine real time road surface conditions. More information about friction models can be found in Noyce et al. (2005), Al-Qadi et al. (2002), and Nakatsuji et al. (2002).
2.2.2.2 Direct Friction Measurements
Direct friction measurements, though used extensively on airport runways, have not been used in the field by road agencies as frequently (Al-Qadi, 2002). However, it is a tool used in many research projects. As well, there are many studies that have proposed improved ways to measure and estimate friction levels.
2.2.2.3 Uses of Friction Measurements
There are many different ways that friction measurements can be used to assist winter maintenance operations. Of these, Nixon (1998) lists the following uses:
• Verify and refine chemical treatment strategy; • Control spreader output so as to optimize chemical application; • Develop new strategies based on particular locations; • Inform customers (road users) of the “true” road condition; and, • Collect data for refinement of RWIS models. The first two uses listed above are components of winter maintenance performance evaluation, and Al-Qadi et al. (2002) state that there are three friction measurement methods that could be used for this particular purpose. The three methods are:

Winter Maintenance Performance Measurement Using Friction Testing
November 2009 5
• The threshold level approach: using a friction value to define road safety conditions; • The contaminant classification approach: defining the types of surface contaminants
that are permitted under specified weather conditions; and, • The spatial homogeneity approach: determining spatial variability between friction
readings, with a goal of maintaining similar driving characteristics over long distances so that drivers can adjust to road conditions.
An experiment conducted by the Swedish National Road and Traffic Research Institute has concluded that drivers are very poor at evaluating different friction conditions and would benefit from a simple friction indicator that could communicate friction conditions to them. However, the performance evaluation method most commonly used is a modified version of the threshold level approach, and most of the research being conducted today is focused on this modified approach. Instead of using a friction value to define road safety conditions, it is simply used as a maintenance standard. The reason for this modification is that the threshold approach as described by Al-Qadi et al. (2002) has two significant weaknesses. The first weakness is the variability of friction measurements on snow- and ice-covered road surfaces, which will be discussed in the next section. The second weakness is the increased potential for agency liability when there are accidents, which may occur even though the friction threshold is achieved or even if a small section of the road does not meet the friction threshold.
2.2.2.4 Factors Affecting Friction Measurement
Friction values between different instruments can be difficult to compare. According to Noyce et al. (2005), differences in friction using the same device could be approximately 5 percent between two consecutive measurements of the same road surface. Friction is also sensitive to other factors such as the tread on the tire and the tire material (see FIGURE 2.1), the speed of the vehicle, and the texture of the road surface. For example, Finland has found that friction measurements taken using smooth and grooved tires as measuring wheels are not affected by driving speed, while friction measurements taken using winter tires vary significantly with driving speeds. A study from New Zealand (Jamieson and Dravitzki, 2005), has shown that coarse texture road surfaces comprising of sharp, angular chips provide the highest friction under icy conditions. This is due to the high tire contact pressure at localised areas causing the ice film to be penetrated.
To add to the complexity of comparing friction values, different road agencies may have separate preferences in terms of instruments and methods used. Thus, there is a need to

Winter Maintenance Performance Measurement Using Friction Testing
November 2009 6
relate all the measurements to a standard, and this has been accomplished for general road friction measurements.
FIGURE 2.1 FOUR STANDARD FRICTION TEST TIRES.
A) PATTERNED ASTM E1136 B) RIBBED ASTM E501 C) SMOOTH ASTM E524 D) PATTERNED T49 (SWEDISH STANDARD FRICTION TEST TIRE)
Source: Wallman and Åström (2001)
2.2.2.5 Harmonization of Friction Measurements
The PIARC (usually known as the World Road Association, or the Permanent International Association of Road Congresses) Standard has an average friction curve (called the Golden Value Curve) developed by the World Road Association to which, with appropriate calibration testing, any friction device can be related. From this curve, an International Friction Index (IFI), which is composed of a friction number (F60) and the speed number (Sp), was developed. F60 represents the friction measured at 60 km/hr while Sp is the gradient of the friction values. Sp is calculated from a texture measurement and from regression constants obtained during an extensive two-year PIARC experiment that included internationally used friction devices. More information about how the IFI is calculated can be found in a 2002 report written by Al-Qadi and several other researchers.
It should be noted, however, that the Golden Value Curve was developed in the absence of snow and ice on the road surface and is for fixed slip friction measurement devices only (see

Winter Maintenance Performance Measurement Using Friction Testing
November 2009 7
SECTION 2.3 for an explanation of the different types of devices). Therefore, Nixon (1998) concluded that while the PIARC Standard may be useful in winter maintenance operations, it has yet to be tested in the field in that area. Thus, some work is needed to extend the PIARC standards into the winter maintenance area.
2.2.3 Application of Friction Measurements
2.2.3.1 Use of Devices in the Field
According to the results of an international working session in Roanoke, Virginia in September 2000, “friction measurements (and other measures of pavement state that are indexed to friction) hold high potential as operational tools in winter maintenance activities”. However, the on-going difficulties in obtaining repeatable friction measurements with robust and cost effective devices have so far rendered the technology, for the most part, impractical for immediate implementation (Al-Qadi et al., 2002, p.35). All of the session’s participants also indicated that they would continue to pursue friction measurements as potential tools for their winter maintenance operations.
Given this finding, in Canada there are no cases where friction devices have been used on a regular basis in the winter. However, in the US, the Ohio and Virginia Departments of Transportation (DOTs) have been evaluating the potential integration of friction devices into their winter maintenance operations. Both have installed friction devices on maintenance equipment.
In comparison, in Scandinavian countries such as Finland and Norway, there is a growing trend towards using friction measurements as a way to set standards for winter maintenance. In fact, Finland has used friction measurements for over two decades in their winter maintenance practices (Al-Qadi, 2002). Friction measurements are one of the quality standards used to ensure road conditions are safe for users. They specify a given time in which roads under various road classifications have to be brought to a pre-determined friction threshold level.
TABLE 2.1 presents the correlation between friction values and driving conditions. For Finnish condition standards of friction, TABLE 2.2A shows the maintenance classes and TABLE 2.2B shows the quality standards of winter maintenance. The friction requirement applies to at least half of the lane width, including the wheel paths. In addition, Finland is working on improving methods of communicating road conditions to users. For several years, tests were conducted on a mobile weather monitoring device that measures real-time road friction levels,

Winter Maintenance Performance Measurement Using Friction Testing
November 2009 8
as well as other parameters. More discussion regarding friction as a quality standard in Finland is included in Section 3.3.2.2.
TABLE 2.1 CORRELATION BETWEEN FRICTION VALUES AND DRIVING
CONDITIONS IN FINLAND
Source: Winter Maintenance Policy 2001 (Finnish Road Administration)

Winter Maintenance Performance Measurement Using Friction Testing
November 2009 9
TABLE 2.2 A) FINNISH WINTER MAINTENANCE CLASSES
Source: Winter Maintenance Policy 2001 (Finnish Road Administration)
TABLE 2.2 B) QUALITY STANDARDS OF WINTER MAINTENANCE IN FINLAND.

Winter Maintenance Performance Measurement Using Friction Testing
November 2009 10
Source: Winter Maintenance Policy 2001 (Finnish Road Administration)
Note: K1 and K2 shown in the tables above represent two classes of pedestrian and bicycle paths. Tlb is a sub-class of lb.
Sweden, Norway, and Iceland have friction standards that vary from country to country. Sweden and Norway allow little variation in friction level between road classes, while Iceland has lower friction values in the lower maintenance classes. TABLES 2.3 and 2.4 present the Swedish and Norwegian friction standards, respectively. More discussion regarding friction as a quality standard in Norway and Sweden is included in Sections 3.3.2.6 and 3.3.2.7, respectively.
It is important to note that each country uses different methods and equipment to measure and interpret friction values. The friction values in these tables are not directly comparable.
Sweden uses the Swedish Road Administration’s Method Specification 110:2000 (PIARC, 2006). Friction coefficients need to be 0.20-0.35, depending on the road surface temperature, type of precipitation, and the road class (Ibid). As can be seen in TABLE 2.4, in Norway, high volume roads need to be brought to a friction level of 0.4 or higher within a certain time limit that is dependent on the road’s annual average daily traffic volume (AADT). For lower volume roads, two friction levels (0.15 and 0.25) are used.

Winter Maintenance Performance Measurement Using Friction Testing
November 2009 11
TABLE 2.3 SWEDEN’S FRICTION STANDARDS
Source: PIARC (2006).

Winter Maintenance Performance Measurement Using Friction Testing
November 2009 12
TABLE 2.4 NORWAY’S FRICTION STANDARDS
Source: PIARC (2006).
The Swiss Federal Roads Authority is also using friction measurements to develop a quality management system for winter maintenance operations (COST, 2008). A standard will be developed to define the friction values that must be maintained on roads during the winter. The values will be based on time of day, traffic volume, and altitude (Ibid).
In Japan, the Hokkaido Development Bureau set winter road surface management objectives using the road surface classification shown in TABLE 2.5 (Al-Qadi et al., 2002). As shown in TABLE 2.6 (Al-Qadi et al., 2002), roads are classified into three categories: urban areas, flat areas, and mountainous areas; and conditions are divided into five classes (A to E). The management objectives, expressed as friction coefficients, for the five conditions are illustrated in TABLE 2.7. Al-Qadi et al. (2002) have noted that “efforts are being made to meet these management objectives, but this does not ensure their execution considering the severe winter weather and traffic conditions in Hokkaido” (p.23). It should also be noted that current friction measurement is not done on an operational-basis by Hokkaido Development Bureau. It is only done in research. The results of the research generate a co-relationship between the friction range and road surface classification for operational use (Ibid).

Winter Maintenance Performance Measurement Using Friction Testing
November 2009 13
TABLE 2.5 ROAD CLASSIFICATION IN JAPAN
TABLE 2.6 MANAGEMENT OBJECTIVES IN JAPAN
Note: While TABLE 2.6 refers to “time zones”, it is to be interpreted as the time periods outside of the hours specified.
TABLE 2.7 ROAD SURFACE CONDITION CLASSIFICATION USED IN JAPAN
Source: Al-Qadi et al. (2002).

Winter Maintenance Performance Measurement Using Friction Testing
November 2009 14
It is important to note that each country has their own preference in terms of the instruments and methods used for friction measurement. They may also interpret friction measurements differently. As such, friction quality standards from different countries cannot be compared to each other without knowing the exact friction measurement procedures that are followed by the respective countries, and how the countries interpret the information.
2.2.3.2 Use of Devices in Winter Maintenance Research
The area in which friction measurements have been put to the greatest use is in research and development. In fact, friction measurements have been used in research extensively by road agencies and researchers across the world. For example, one particular study conducted by the Ministry of Transport of Ontario showed how friction values of a sanded road declined rapidly after only one or two truck passes. Ontario has also used the RT3 (Real Time Traction Tool) friction device to test different salting methods and the Norsemeter Road Analyser and Recorder (ROAR) unit to estimate snow cover using friction measurements (Perchanok, 2008). Between October 1999 and May 2000, a study was done in Kamloops, British Columbia, using friction devices to determine if the transition of typical anti-icing chemicals from liquid to solid and from solid to liquid results in chemical slipperiness. It is noted that in the current report “anti-icing” materials refer to chemical freezing-point depressants used to prevent the formation of ice.
In the United States, Minnesota has used the ROAR device to determine that friction values significantly increase over a five-hour period after salting (Nixon, 1998). The Virginia, Utah, and Wyoming Departments of Transportation have also used the RT3 friction device in various research projects (CTC & Associates, 2007). In addition, the U.S. Strategic Highway Research Program has used friction measurements to gain a better understanding of the conditions for which anti-icing is effective and to develop successful anti-icing techniques for a range of conditions (Al-Qadi et al., 2002).
In Europe, Japan, and New Zealand, research using friction devices is also common. For example, from 1997 to 2002, Norway undertook the Winter Friction Project to deal with practical, technical, and economic issues associated with increasing friction and improving road conditions for drivers during the winter (Vaa, 2001, and Dahlen and Vaa, 2001). The Norway and Finland road administrations have used friction devices to evaluate different types of de-icing materials, and Japan has used friction measurements to determine de-icing application amounts and the effectiveness of de-icer effusion methods (Al-Qadi, 2002).

Winter Maintenance Performance Measurement Using Friction Testing
November 2009 15
Sweden put friction measurements to use in their research when they investigated driver behaviour on winter roads, and the susceptibility of different road pavement surfaces to icing (Ibid). It is noted that in the current report “de-icing” materials refer to various chemicals or salts that remove ice by lowering the freezing-point of water.
Japan has also used friction values to study the relationship between friction values on snow- and ice-covered road surfaces and traffic accident rates, to predict friction coefficients under winter conditions using artificial intelligence procedures based on data from experienced drivers, and to evaluate 15 freeze resistant pavements (Ibid). New Zealand has also used friction devices to evaluate the effectiveness of using Calcium Magnesium Acetate as a substitute for salt for de-icing (Jamieson and Dravitzki, 2006).
2.2.3.3 Pilot Testing of Friction Devices
Pilot tests have also been conducted to test the effectiveness and feasibility of different friction devices. Iowa, Minnesota, and Michigan DOTs have tested the Norsemeter ROAR, and Iowa DOT has tested the Norsemeter SALTAR (Wambold et al., 2002). Japan (see FIGURE 2.2) and Ohio DOT have also completed studies evaluating the feasibility of using the RT3 unit on their winter roads and the results appear to be promising (Tokunaga et al., 2008, and Tilley et al., 2008).
FIGURE 2.2 RT3 UNIT TESTED IN JAPAN Source: Tokunaga et al., 2008

Winter Maintenance Performance Measurement Using Friction Testing
November 2009 16
TABLE 2.8 provides a summary of road agencies that, based on existing literature, are likely to be using friction measurements in the field and/or in research, or have tested the feasibility of using friction devices.
TABLE 2.8 ROAD AGENCIES’ EXPERIENCE WITH FRICTION MEASUREMENTS
Road Agency* Have Used Friction Measurements as Decision Making Tool for Winter
Maintenance Activities
Have Tested Feasibility of Using Friction Devices
Alberta Transportation Yes Ontario Ministry of Transportation Yes British Columbia Ministry of Transportation
Yes
Ohio DOT Yes Yes Virginia DOT Yes Yes Utah DOT Yes Wyoming DOT Yes Minnesota DOT Yes Iowa DOT Yes Michigan DOT Yes Norway Road Administration Yes Yes Sweden Road Administration Yes Yes United Kingdom Highways Agency Yes Finland Road Administration Yes Yes Swiss Federal Roads Authority Yes Iceland Yes Yes Japan Yes New Zealand Transport Agency Yes * Note that these road agencies are the road agencies found in the literature review. This is not an extensive list; other road agencies contacted through the current practices survey also have experience with friction measurements.
2.3 TYPES OF INSTRUMENTS AND EQUIPMENT USED FOR WINTER ROAD CONDITION MEASUREMENTS
2.3.1 RWIS Sensors
As mentioned earlier, sensors that measure parameters such as temperature, road surface and air temperature, humidity, water film thickness, and salt concentration, are commonly found at road monitoring stations. Webcams are also often used in conjunction with these sensors.

Winter Maintenance Performance Measurement Using Friction Testing
November 2009 17
2.3.2 Friction Measurement Devices
When a tire goes from rolling freely to being locked, the fiction force placed on the wheel hub changes depending on the slip, which is the ratio between the slip speed (the relative speed between the tire and the pavement surface at the centre of the contact area) and the operating speed. When a wheel is locked, there is 100% slip.
Practical field friction testing devices can be grouped into five categories:
• Deceleration Devices used with regular ABS (automatic braking system) cars; • Locked wheel testers (100% slip); • Side force devices or constant slip angle devices; • Fixed slip devices (normally between 10 and 20% slip); and • Variable slip devices (0 to 100% slip). These devices vary in data precision, cost and usage. They are further described in Sections 2.3.2.2 to 2.3.2.6.
2.3.2.1 Considerations for Friction Measurement Device Selection
For effective use, several different criteria should be considered when a friction measurement device is being selected.
Safety considerations include the ability of the device to collect friction measurement data in traffic. Devices should be able to operate at normal traffic speeds and adjust to the normal speed variations in traffic. Devices that require braking, for example locked wheel testers and decelerometers, can be dangerous in high traffic volumes. Locked wheel testing may also be dangerous in low traffic volumes because its use usually requires the vehicle’s Anti-Lock Brake System (ABS) to be deactivated, which may pose safety risks to the operator if the vehicle loses control.
One technical consideration is the repeatability and accuracy of the device. Depending on the end use of the measured friction, the required accuracy of a friction device may range significantly. High impact uses like establishing safe speed limits, litigation situations, and contract performance management may have more rigorous data requirements than medium impact uses like providing general road information to road users (BMT Fleet Technology Limited, 2006). Device repeatability can be validated by taking numerous measurements with the same device to compare current and previous measurements.

Winter Maintenance Performance Measurement Using Friction Testing
November 2009 18
Another technical consideration is continuous measurement, which is highly preferable over spot reading. Continuous measuring capabilities can be restricted when devices require activation (for example, sensor activation, cornering, or braking), or when devices are not as accurate and repeatable when cornering. Devices should also be applicable to a wide range of surface conditions.
To ensure that the friction values are applicable to passenger and commercial vehicles, the friction devices should accurately simulate the actual tire-road interaction in two ways. The first consideration is that the tire should be of a similar construction of a car or truck tire, with a similar rubber compound and a similar contact footprint. Second, the tire should experience an applied load that is similar to the distributed weight of a car or truck so that the contact pressures are equivalent.
Mechanical simplicity, minimal maintenance, minimal tire wear, high durability, ease of use and low total cost are other important considerations for friction device selection. Costs over the entire life-cycle of the instrument should be considered: cost of the instrument, training of personnel and labour, operation, and maintenance.
2.3.2.2 Deceleration Devices with ABS Vehicles
These devices measure the deceleration of a vehicle under full braking, and the deceleration force is used to calculate the friction coefficient (Al-Qadi et al., 2002).
Regular passenger vehicles with ABS and equipped with deceleration devices (the most commonly used are the Coralba and C-trip-mu meters) have been commonly used to measure winter road friction in Sweden, Norway, and Finland (Wallman and Aström, 2001). The Coralba was also used by E. Fleege in support of the early studies conducted under the U.S. Strategic Highway Research Program (Al-Qadi et al., 2002). Other electronic recording deceleration devices include the Tapley-meter and Bowmonk meter (Ibid).
The advantage of this method is that it is simple and relatively inexpensive to use (see FIGURE 2.3 for a photo of the C-trip-mu meter). According to COST (2008), the cost for a decelerator is approximately $1,935 to $5,815 (1,250€ to 3,750€). With sufficient training, results are repeatable and appear to be reliable (Ibid). However, the main disadvantages are that the precision of the method is poor as different passenger vehicles have different types of tires and brake systems, and it poses a safety risk to the operator of the vehicle. The method only provides localized results and vertical gradients can affect the results (COST, 2008).

Winter Maintenance Performance Measurement Using Friction Testing
November 2009 19
In Sweden, the road administration requires that the friction evaluation car (with ABS and deceleration measurement equipment) be regularly calibrated against a BV11, a Saab Friction tester, or a BV14. In addition, deceleration devices are not suitable on roads with heavy traffic for safety reasons.
FIGURE 2.3 C-TRIP-MU DEVICE
Source: Vaa, 2001
2.3.2.3 Locked Wheel Testers
In the U.S., locked wheel testers are used for general friction testing (not exclusively winter friction testing) by more than 40 states (Al-Qadi et al., 2002). In this method, the relative velocity between the surface of the tire and the pavement surface is equal to the vehicle speed. Typically, the left wheel path in the travel lane is tested. The operator applies the brakes, measures the torque for one second after the tire is fully locked, and then determines the corresponding friction value.
In Japan, the standard device is the bus type full-locked wheel tester (LWFT shown in FIGURE 2.4) which is used mainly for research purposes due to its high cost (Tokunaga et al, 2008).

Winter Maintenance Performance Measurement Using Friction Testing
November 2009 20
FIGURE 2.4 LWFT BUS DEVICE Source: Tokunaga et al, 2008
2.3.2.4 Side Force or Constant Slip Angle Devices
Side force or constant slip angle devices such as SCRIM (Side Force Coefficient Road Inventory Machine) and the RT3 unit measure road surface friction as the lateral force acting on a free rolling measuring wheel that has a constant side slip angle. In the case of SCRIM, which is used in the United Kingdom, the wheel is placed between the front and the rear axle and constant slip angle is 20 degrees. RT3 has a constant slip angle of 1.5 degrees.
The RT3 uses a test wheel that attaches to a truck’s undercarriage or can be towed behind the host vehicle. Friction readings are presented to the operator as a number (the Halliday Friction Number) and as coloured lights on a display. Green indicates safe driving conditions, yellow indicates roads where caution is needed, and red indicates dangerous areas that require immediate maintenance work. The RT3 is intended to allow operators and supervisors to determine when to start and stop de-icing treatment, to modify the amount of chemical used, and to measure effectiveness of the larger treatment process. Friction data can also be sent to a web site to provide real-time picture of changing road surface conditions. The RT3 is being used in the field by the Ohio and Virginia state Departments of Transportation (CTC & Associates Ltd., 2007, and Tilley et al., 2008). They are also used in research projects in Utah DOT, Wyoming DOT, and Ontario MOT (Ibid). Utah has plans to use the RT3 to monitor and predict winter maintenance efforts on the highway, and to warn road users of road conditions. As of 2007, they were anticipating that they would be equipping 150 of their snowplow trucks with the device. Results from these tests show that the unit is able to generate repeatable results that are accurate reflections of the road surface conditions, even in severe snow and ice conditions (Tilley et al., 2008)

Winter Maintenance Performance Measurement Using Friction Testing
November 2009 21
Another type of side force device that has been developed is the mobile monitoring station, which was used in Finland (Myllylä and Pilli-Sihvola, 2002). It was used in a test vehicle and it was also mounted to a bus.
It collected information on road conditions and transmitted the information to a central computer in the Finnish RWIS. It was found that this method performed well on ice tracks, but it gave unexpected results on certain road sections and especially on snow. Due to the wide dispersion of friction values, Myllylä and Pilli-Sihvola (2002) do not recommend the device to be used in the quality monitoring of winter maintenance. It is more suitable for road condition monitoring, where it is not the only source of information.
The advantage of the side force devices is that they provide continuous measurements and there is less wear on the tires. Thus, they are more suitable for routine measurement than the locked wheel method.
2.3.2.5 Fixed Slip Devices
These devices usually operate between 10 and 20 percent slip. The English GripTester developed by Findlay Irvine Ltd. for the U.K. is an example of a fixed slip trailer and it is extensively used in the United Kingdom. BV11, BV14, and the Saab Friction tester (SFT), used by Sweden, are three other devices that have a fixed slip (Wallman and Aström, 2001). The Minnesota Department of Transportation have also tested the English GripTester and BV14 (Al-Qadi et al., 2002).
The Pon-Cat Traction Watcher One (TWO) is another example of a fixed slip device. This device has two wheels, of which one rolls slower. The friction is calculated from the force generated by the resistance of the slower wheel. It can be used on a car, truck, or trailer and the results are generally reliable (COST, 2008). The cost for a unit starts at $37,200 (24,000€) (COST, 2008).
The ASFT T2Go is a small and portable fixed slip device. The friction data and Global Positioning System (GPS) data are sent directly to a Pocket PC. This model is useful as it can be used where other instruments cannot, such as in cycling lanes and pedestrian roads. They are expensive units, and there is still a need to standardize the measurement method as the friction result is dependant on many factors.
The advantages of fixed slip devices are that measurements can be taken continuously, optimum braking friction can be selected, and the wear on the tire can be minimized (COST, 2008). However, they can only take readings at a specified slip speed (Al-Qadi et al., 2002).

Winter Maintenance Performance Measurement Using Friction Testing
November 2009 22
2.3.2.6 Variable Slip Devices
Variable slip devices measure friction as a function of slip between the wheel and road surface (Al-Qadi et al., 2002).
The ROAR device (see FIGURE 2.5), developed by Norway Norsemeter AS7 and commonly used in Norway, is a continuous measuring device with a variable slip wheel. However, whereas ROAR Mark I can only measure variable slip, ROAR Mark II and Mark III can also measure fixed slip. In the case of ROAR, the measurement wheel is programmed to brake at chosen time intervals and the entire friction slip-curve is measured (see FIGURE 2.6 for a typical friction-slip curve). Each time it brakes, the test wheel goes from free rolling, with the same speed as the vehicle to locked wheel. The main advantage of ROAR is that it can operate at speeds from 20 to 130 km/hr. It can also act as a stand-alone instrument or it can be towed by a host vehicle. However, the cost is significantly higher than other friction devices (COST, 2008). In fact, the cost of a ROAR trailer is about 90 times higher than that of a decelerometer (Ibid). Furthermore, in a field study, Minnesota DOT also found that the units were not durable enough.
FIGURE 2.5 NORSEMETER ROAR FRICTION MEASUREMENT TRAILER Source: Wallman and Åström (2001)

Winter Maintenance Performance Measurement Using Friction Testing
November 2009 23
FIGURE 2.6 FRICTION –SLIP CURVE OF A BRAKING TIRE SHOWING THE FRICTION
VARIATION FROM FREE ROLLING (0% SLIP) TO LOCKED WHEEL (100% SLIP) Source: Wallman and Åström (2001)
As mentioned earlier, Ontario MOT has used the Norsemeter ROAR device to estimate snow cover, Minnesota DOT has used the ROAR device to determine that friction values significantly increase over a five-hour period after salting, and Iowa and Michigan DOTs have tested the ROAR in a pilot test (Nixon, 1998, and Wambold et al., 2000).
OSCAR is another device that can measure a variable slip and fixed slip. The test wheel is bigger than the one used on the ROAR devices, and the ground pressure is greater.
Both the ROAR and OSCAR devices have also been used by the Norwegian Public Road Administration for research purposes in the Winter Friction Project (Vaa, 2001, and Dahlen and Vaa, 2001). Currently, all other approved friction devices in Norway have to be calibrated against the ROAR M III and OSCAR devices.
A modified version of the ROAR is the SALTAR, also manufactured by Norsemeter (FIGURE 2.7). The unit uses an electric brake to stop the test wheel, and is more compact, durable, and cost-effective than the ROAR unit. The unit can be mounted in the left or right wheel track, or in the middle of the vehicle, and it is possible to operate the unit in the forward or reverse direction (Wambold et al., 2002). A test conducted by Iowa DOT in the Concept Highway Maintenance Highway Vehicle study has shown that the device has great promise for measuring road friction under winter conditions (Ibid). The Norwegian Road Administration has also conducted similar testing and the results revealed that SALTAR provided lower friction coefficients than the ROAR but the values appeared to increase and decrease in a similar manner (Al-Qadi et al., 2002).

Winter Maintenance Performance Measurement Using Friction Testing
November 2009 24
FIGURE 2.7 SALTAR FRICTION MEASURING DEVICE MOUNTED ON A SALTED/PLOW TRUCK
Source: Wambold et al., 2002.
Normally, friction measurements with the SCRIM, the English GripTester and the Norsemeter ROAR involve application of a film of water onto a dry road surface so that friction levels of a wet road surface can be determined. This is not, however, possible under winter conditions because of the likelihood of ice formation. This may cause wear on the measuring tire and problems when comparing measurements between devices.
For laboratory tests, the two main devices currently used are the British Pendulum Tester (BPT, ASTM E-303) and the Japanese Dynamic Friction Tester (DFTester, ASTM E-1890). In the case of the BPT, a pendulum with a rubber slider at its edge is released over a sample and the loss in kinetic energy of the pendulum is measured. The resilience of the rubber slider is temperature dependent; measurements are usually standardized to 20ºC due to this sensitivity. New Zealand uses it to evaluate the effectiveness of calcium magnesium acetate as a de-icer (Jamieson and Dravitzki, 2006). The DFTester has three rubber sliders attached to a disk that is powered by a motor above the pavement surface. As the disk spins into the sample, a transducer measures the friction. This method allows friction to be measured as a function of speed.
TABLE 2.9 provides a summary of the documented utilization of the various friction devices by Canadian and international road agencies found in the literature reviewed.

Winter Maintenance Performance Measurement Using Friction Testing
November 2009 25
TABLE 2.9 FRICTION DEVICES USED OR TESTED BY CANADIAN AND INTERNATIONAL AGENCIES
* Note that these road agencies are the road agencies found in the literature review. This is not an extensive list; other road agencies contacted through the current practices survey have also used or tested friction devices.
** Device which the winter friction quality standards of the road agency is based on.
Road Agency* Friction Device
Norway Road Administration
• Norsemeter ROAR • Regular vehicles with ABS and instrumentation to measure deceleration during braking • Digi-slope • OSCAR** • Coralba • Kofriks
Sweden Road Administration
• BV11 • BV14 • Saab Friction Tester • Regular vehicles with ABS and instrumentation to measure deceleration during braking • RT3 • Coralba**
United Kingdom Highways Agency
• SCRIM • GripTester
Finland Road Administration
• Friction measurement truck (TIE 475) • C-trip** • DSC111
Minnesota DOT • Norsemeter ROAR • English GripTester
Iowa DOT • Norsemeter ROAR • SALTAR
Michigan DOT • Norsemeter ROAR Ohio DOT • RT3 Virginia DOT • RT3 Utah DOT • RT3 Wyoming DOT • RT3 Ontario MOT • RT3
Japan • Bus type full-locked wheel tester • RT3

Winter Maintenance Performance Measurement Using Friction Testing
November 2009 26
2.3.3 New Emerging Technologies
In addition to the five general types of field friction measurement devices, there are several studies associated with new emerging technologies, for example using sensors to obtain real-time friction values and using probe vehicles.
2.3.3.1 Intelligent Tires
The objective of the APOLLO project out of Europe was to develop an “intelligent tire” with sensors that monitor tire condition, road condition, and tire-road interaction. Using wireless communication systems, the “intelligent tyre” would be able to provide the resulting data in real-time to drivers, vehicle control systems, Advanced Driver Assistance Systems and external users. While the project did not focus directly on winter conditions, developing a technology that provides more information on all adverse road conditions (including wet and icy roads) could be beneficial for winter road maintenance and safety in the future. The project studied different sensors and found that:
• Capacitive MEMS (microelectromechanical systems) sensors had high potential at low cost
• Accelerometer sensors had potential but needed further study to improve accuracy
• Optical sensors had good accuracy but consumed too much power • Piezo sensors had low energy consumption but lacked durability in the tire
environment A prototype micro-mechanical acceleration sensor was used along with both a piezo and an optical reference sensor in the APOLLO tire. The project concluded that while much other information could be obtained from the new tire, available friction could not be determined using the acceleration sensor only. New promising sensor technologies, including micro-mechanical state-of-the-art sensors, were suggested as potential improvements, but the sensors were lacking robustness at the time of the project. The APOLLO sensor project was completed in 2005 and its continuation, the FRICTION project, is scheduled for completion by 2009.
2.3.3.2 Vaisala Sensors
It is also apparent that a new technology developed by Vaisala called DSC111 sensor is entering the field. The DSC111 operates by transmitting an infrared light beam onto the road

Winter Maintenance Performance Measurement Using Friction Testing
November 2009 27
surface and detects the backscattered signal at selected wavelengths. By properly selecting the wavelength, it is possible to observe the absorption of water and ice independently of each other. The observed absorption signal is transformed into information about the amount of water, ice, snow and frost that is on the road surface. With this information, the reduction in friction can then be modelled.
The DSC111 reports the following data items (Feng et al, 2007):
• pavement states: dry, wet (thin water layer), slushy (thick water layer, no ice or snow), snow or frost (white ice), ice (black ice);
• pavement contaminant depth in equivalent liquid water amount (mm); and • estimated surface grip level (on a scale of 0.01-1.00).
The sensitivity of DSC111 might allow the following areas to be achieved:
• more accurate decision making tool for winter maintenance; • automatic launching of management actions; • direct control of message signs; • weather adaptable speed limit systems; • quality controlling of maintenance work; • direct information to the drivers; • maintenance of walkways, garage slopes, tunnel entrances; and, • automatic de-icer spraying systems.
The DSC111 has been tested in Ontario as well as Finland. In Finland, the test results are promising (Haavasoja et al, 2006). According to information provided by Vaisala, the tests in Finland consisted of comparing values derived from a grip wheel with optical measurements using the DSC111. The results allowed Vaisala to develop an algorithm producing friction information.
The output of the DSC111 is very informative and quite useful but one needs to consider that the sensor is not in contact with the road. Although the DSC111 provides a good indication of the friction levels, it does not render the same precision as an actual grip wheel. The DSC111 is meant to be used for making winter maintenance decisions and due to its algorithm which is based on actual grip wheel values, the results are considered adequate for that purpose.
In Ontario, the DSC111 was tested alongside the DST111, a remote road surface temperature sensor. The DST111 reports the following data items (Feng et al, 2007):

Winter Maintenance Performance Measurement Using Friction Testing
November 2009 28
• pavement surface temperature (ºC); • air temperature (ºC); • dew point temperature (ºC); and, • relative humidity in percentage.
These two sensors are known collectively as Vaisala Spectro/Cyclo sensors. When combined with a low light camera, the three devices make up a non-invasive RWIS called the Vaisala Guardian, which additionally provides high-quality colour images of road and traffic conditions (see image of device in FIGURE 2.8). The system can be mounted onto existing structures such as lighting poles, traffic signals and buildings. The Guardian’s sensors measure a large surface area and are capable of detecting water, frost, snow, slush and black ice independently. As well as providing measurement of the road surface state, the Vaisala device also provides the level of grip offered by pavement. The system can be accessed anytime via an intuitive Web display where data is presented to assist in decision making. The remote processing unit has a solar power option, accommodates additional sensor capability and comes configured with a cellular modem.
FIGURE 2.8 VAISALA GUARDIAN INCLUDING DSC111 AND DST111 SENSORS
Limited field observations made in Ontario by Feng et al (2007) using the DSC111 and the DST111 had three main conclusions:
• The Vaisala sensors were reliable and accurate in determining road surface contaminants;
• There were systematic differences in temperature measurements between the Vaisala sensor and a traditional in-situ Lufft sensor; and,
• The grip levels reported by the Vaisala sensor did not correlate well with the observed friction measurements.

Winter Maintenance Performance Measurement Using Friction Testing
November 2009 29
These devices appear to have significant potential as a non-invasive technology, but further research is required especially into the reported grip levels.
According to information provided by Vaisala, Maine Department of Transportation and Yakima County in Washington State have tested the DSC111 in a mobile environment and were satisfied with the performance of the device.
2.3.3.3 Other Sensors
The Swedish Intelligent Vehicle Safety Systems program published a project on sensors in 2007. The project developed and evaluated three different approaches to estimating the coefficient of friction, using algorithms to derive the friction value from measurements.
• The first direct method was based on the forces and self-aligning torque measured in the front tires when cornering. Upon obtaining a required lateral acceleration of 0.3g, sensors placed in the steering gear were found to successfully estimate a reliable friction coefficient when cornering.
• The second direct method was based on the forces produced in straight driving. Using either optimization or minimization of an error function over a grid, the algorithm based on a physical model determined the friction coefficient with acceptable accuracy and availability.
• The third method was an indirect method using an optical sensor to classify the road surface ahead of the vehicle. Using different reflected wavelengths of infrared light, the sensor was able to discriminate between ice, snow, and dry pavement, but had difficulty classifying wet pavement. To improve this limitation, adding a third laser with a different wavelength to the sensor was suggested.
The project concludes all three methods can be used for tire to road friction estimation and are recommended for further development and industrialization.
Research is also being conducted on the possibility of using motion data from probe vehicles and GPS to estimate friction coefficients, with the intent of providing this information online for all road users. Maeda et al. used several parameters: the acceleration of “X, Y, and Z”, pitch rate, yaw rate, front tire wheel speed, back tire wheel speed, and GPS vehicle speed to classify different road surfaces. A new parameter called Pulse-Acceleration (PA) was derived from the derivative of the rotation speed of the tire, and the rate of variation was statistically analyzed. The results determined that PA is effective at classifying slippery road surfaces, but

Winter Maintenance Performance Measurement Using Friction Testing
November 2009 30
that the resulting accuracy of this study’s road classification analysis must be improved by considering weather conditions and the strength of acceleration and braking. This procedure has the potential to provide friction characteristics of entire areas to road users if further developed.
2.3.4 Vehicle Infrastructure Integration
To communicate road condition information from a test vehicle to another vehicle or to a supporting infrastructure, a new system is now being developed in the U.S. called Vehicle Infrastructure Integration (VII). VII is defined as “Vehicle to Infrastructure (V-I) and Vehicle to Vehicle (V-V) communication through Dedicated Short Range Communications (DSRC-wireless radio comm. 5.9 GHz)” (Mahoney et al., 2006, slide 2). This allows vehicles ahead to communicate road conditions such as low friction to the vehicles behind as well as to roadside equipment (RSE) (Ibid and Wayne et al., 2007). The RSEs would be strategically located at intersections and alongside freeways and interchanges on rural freeways (Ibid). Weather and road condition data from multiple sources could be compiled into a real time database accessible by vehicles. Precipitation detection and modelling from the vehicle data is possible. The benefits of using VII include informing drivers of upcoming road surface conditions, and improved weather modelling using the data collected from drivers.
VII is a program comprised of the U.S. Department of Transportation (DOT), American Association of State Highway and Transportation Officials (AASHTO), automobile manufacturers, and several state DOTs. Together, these organizations are working to develop and introduce the system to the United States. The tests are beginning with a handful of specially equipped vehicles in Michigan and Detroit, and the number of these vehicles is expected to rise to 3,000 over the next 2 years (Cardno, 2007). There are plans for more testing in San Francisco and Michigan (Ibid).

Winter Maintenance Performance Measurement Using Friction Testing
November 2009 31
3 CURRENT PRACTICES SURVEY
3.1 OVERVIEW OF AGENCY SURVEY
For this study, a survey was sent out to 70 organizations and individuals across the globe. APPENDIX B provides the survey form and a complete list of the surveyed organizations and individuals. The responses from the current practices survey can be found in APPENDICES C and D.
The topics covered by the survey include:
• Whether or not the agency conducted winter road surface condition measurements, such as friction measurements;
• Main objectives for conducting winter road condition measurements; • Equipment used to collect physical data and the type of data collected; • Advantages and disadvantages of the equipment used to collect winter road surface
condition measurements; • Pilot tests related to winter road surface conditions; • Service levels for different roadway classifications; and, • Lessons learned and areas for further research. Of the 70 surveys distributed, 49 completed surveys were returned, for a response rate of 70 percent. Some organizations and individuals sent back relevant information (e.g. literature to review) but did not complete the survey. The organizations and individuals who responded (either with a completed survey or with relevant information) were:
• 40 road agencies, including: o 28 Canadian provincial, territorial, and municipal road agencies o 3 U.S. state departments of transportation o 9 other international road agencies
• 2 U.S. university researchers (only literature sources provided) • 1 Canadian non-profit association (only literature sources provided) • 1 Canadian friction device manufacturer • 1 U.S. consultant (only literature sources provided) • 1 U.S. non-profit salt industry trade association • 1 U.S. friction device manufacturer • 2 industry contacts (1 Canadian and 1 U.S.)

Winter Maintenance Performance Measurement Using Friction Testing
November 2009 32
The responses to the survey range widely, from agencies that have never used friction measurements and do not have any plans to do so in the near future, to those who have relied on friction measurements for the last two decades as their primary decision-making tool in their winter maintenance operations.
Of the 40 road agencies, 18 indicated that they do not quantify road surface conditions during their winter maintenance operations, while 22 road agencies have indicated that road condition measurements are used in their winter maintenance operations. Of the 22 agencies that quantify road surface conditions, 4 have stated that they use friction measurements for their winter maintenance activities and 8 have indicated that they have only conducted pilot tests with friction devices.
The following sections of the report provide more details on the organizations that quantify winter road surface conditions.
3.1.1 Canadian Road Agencies
Of the 28 Canadian road agencies who have responded with a completed survey, 19 are municipal road agencies and 9 are provincial road agencies (Nunavut has been excluded as the transportation department does not monitor winter road conditions). Provincial agencies are responsible for maintaining highways while municipal road agencies are responsible for the remaining municipal roads. An IceChek Instruments representative provided some information about the pilot tests that were conducted in Alberta and Quebec with the IceChek Friction Tester. A Carmacks Enterprises Ltd. representative provided a 2001 report about prewetting skid tests on the Deerfoot Trail in Alberta using the VC2000PC.
3.1.2 International Road Agencies
Of the international organizations who have responded with a completed survey, 3 are U.S. state road agencies while 9 are federal European road agencies. Don Halliday Technologies Inc. has also provided information on the use of friction measurement devices in Sweden, Japan, and the state of Ohio.
3.2 OBJECTIVES FOR MEASURING WINTER ROAD CONDITIONS
3.2.1 Canadian Road Agencies
The most commonly reported objectives for measuring winter road conditions are:
• To obtain reliable, objective data about winter road conditions and to predict slippery conditions;

Winter Maintenance Performance Measurement Using Friction Testing
November 2009 33
• To understand the causes of local variations in snow conditions to aid in highway planning and operations;
• To ensure roadways are safe and meet the region’s standards; • To determine which locations require treatment; • To aid in the decision of equipment deployment; • To determine method of treatment (e.g., type of de-icing chemical); • To ensure the optimum amount of anti-icing and de-icing chemicals is used; • To reduce cost of operations; • To inform drivers of road surface conditions; • To control and improve quality of operations of contractors and of public road
agencies; and, • To ensure timely automated road condition reports and to reduce paperwork. 3.2.2 International Road Agencies
The objectives outlined by the U.S. and other international agencies for measuring winter road conditions are similar to the Canadian objectives. The main objectives include:
• To obtain reliable, objective data about winter road conditions and to predict slippery conditions;
• To measure the performance of winter maintenance operations; • To determine the start and end of winter maintenance treatment such as de-icing and
salting; • To confirm that contractors are meeting maintenance requirements per their contracts; • To ensure roadways are safe; and, • To inform drivers of road surface conditions. 3.3 METHODS FOR QUANTIFYING WINTER ROAD CONDITION MEASUREMENTS
3.3.1 Canadian Road Agencies
The survey has confirmed that no Canadian road agencies are currently measuring road surface friction levels as part of their regular winter maintenance activities. TABLE 3.1 presents a summary of current Canadian road agencies practices on:
• Whether the road agency uses RWIS; • Whether the road agency conduct visual assessment; and, • Whether the road agency has conducted friction measurements in research and/or pilot
tests.

Winter Maintenance Performance Measurement Using Friction Testing
November 2009 34
Further details about current Canadian road agencies practices are presented in APPENDIX C, Canadian Survey Responses.
TABLE 3.1 CURRENT PRACTICES OF CANADIAN ROAD AGENCIES
Road Agency (Canadian) Use RWIS? Use Visual Assessment?
Conducted Friction Measurements in Research and/or
Pilot Tests
ALBERTA TRANSPORTATION Yes Yes Yes BRITISH COLUMBIA MINISTRY OF TRANSPORTATION Yes Yes No
MANITOBA INFRASTRUCTURE AND TRANSPORTATION Yes Yes No
NEW BRUNSWICK DEPARTMENT OF TRANSPORTATION Yes Yes No
NEWFOUNDLAND AND LABRADOR TRANSPORTATION AND WORKS Yes Yes No
NOVA SCOTIA DEPARTMENT OF TRANSPORTATION AND INFRASTRUCTURE Yes Yes No
ONTARIO MINISTRY OF TRANSPORTATION Yes Yes Yes QUEBEC MINISTERE DES TRANSPORTS Yes Yes Yes YUKON DEPARTMENT OF HIGHWAYS AND PUBLIC WORKS Yes Yes Yes
CITY OF CALGARY, ALBERTA Yes Yes No CITY OF CHARLOTTETOWN, PRINCE EDWARD ISLAND No Yes No
CITY OF EDMONTON, ALBERTA No Yes No CITY OF FREDERICTON, NEW BRUNSWICK No Yes No CITY OF KAMLOOPS, BRITISH COLUMBIA Yes Yes No CITY OF MONTREAL, QUEBEC No Yes Yes CITY OF OTTAWA, ONTARIO No Yes No CITY OF PRINCE ALBERT, BRITISH COLUMBIA No Yes No CITY OF PRINCE GEORGE, BRITISH COLUMBIA No Yes No CITY OF REGINA, SASKATCHEWAN No Yes No CITY OF TORONTO, ONTARIO Yes Yes No CITY OF WHITEHORSE, YUKON No Yes No CITY OF WILLIAMS LAKE, BRITISH COLUMBIA No Yes No CITY OF WINNIPEG, MANITOBA Yes Yes Yes CITY OF YELLOWKNIFE, NORTH WEST TERRITORIES No Yes No
HALIFAX REGIONAL MUNICIPALITY, NOVA SCOTIA No Yes No
MRDC OPERATIONS CORPORATION, NEW BRUNSWICK Yes Yes No
REGION OF WATERLOO, ONTARIO No Yes No TOWN OF GANDER, NEWFOUNDLAND No Yes No

Winter Maintenance Performance Measurement Using Friction Testing
November 2009 35
The City of Montreal and the City of Winnipeg have conducted testing using friction devices in the early 1990’s for their salt/abrasive policy and for measuring braking power on streets.
Ontario, Quebec and Alberta provincial road agencies have conducted more recent pilot studies to test the effectiveness of various friction devices under winter service context. However, none of the agencies have yet to use friction devices on a routine basis.
In comparison, 10 agencies use some form of a road weather information system (RWIS) as their primary method of monitoring road conditions and a total of 28 agencies use visual assessments to determine road surface conditions.
With regards to maintenance service levels, 22 road agencies have different service levels for different road classifications. Most service levels are based on daily traffic volume or road category and whether or not roads are used as bus routes. As expected, typically higher volume roads and bus routes receive more immediate attention by maintenance personnel.
The current practices of Canadian agencies have been summarized and are included in APPENDIX C. The discussion below highlights the key information related to the current winter maintenance practices of the three road agencies with pilot friction test experience: Alberta, Ontario and Quebec. The devices used in the pilot tests are described in Section 3.4.1.2 TABLE 3.3.
3.3.1.1 Alberta Transportation
The main objective for measuring road conditions is to inform the public of winter road conditions for major provincial highways in Alberta. Future objectives may be to measure contractor performance and to provide quantitative winter road condition information via winter friction measurements.
For winter maintenance, the Highway Maintenance Guidelines and Level of Service Manual (June 2000) specifies the maximum reaction time and maximum time to good winter driving conditions for 8 classes of highway based on AADT. The maximum reaction time is measured from the time of a 3 cm snow accumulation and represents the time that will be required to respond after an average winter storm.

Winter Maintenance Performance Measurement Using Friction Testing
November 2009 36
3.3.1.2 Ministère des Transports du Québec
The main objectives for conducting friction measurements in Québec are to use these measurements as a decision-making aid, to control quality of operations and to provide automated road condition reports.
In the winter period, the Ministère des Transports du Québec determines the service levels for the road network under its responsibility based on two main criteria, the functional classification of the network and the winter daily traffic (WDT) recorded on the network. The service levels range from clear pavement to hardened snow base.
3.3.1.3 Ontario Ministry of Transportation
The Ministry has many objectives for conducting winter road condition measurements, including acceptance by the Ministry and contractors, informing the public, and to obtain objective data for winter road reports and performance measures.
The Ministry currently faces situations of subjective reporting of road conditions during winter storms, irregular monitoring intervals, and inaccurate reporting of bare pavement events. Questions that remain to be answered from a customer-based standpoint include: What service level is important to users? How do costs of service vary with level of service? The Ministry is also seeking to establish a cost-benefit curve for winter service.
All highways in Ontario are divided into five classes (1 to 5, with 1 being the highest level of service). The classes are defined by ADT and they determine the winter maintenance quality standard and the maximum time within which the quality must be achieved.
3.3.2 International Road Agencies
Through the information collected from 12 international road agencies, it was found that a RWIS is commonly used for monitoring winter road conditions. With regard to friction measurements, they are routinely conducted in Norway, Finland and Sweden as part of the road administrations’ winter maintenance standards. Friction measurements have also been routinely used in the United Kingdom, New Zealand and Australia; however, the usage in these countries is not specific to winter conditions. In the United Kingdom, friction measurements are carried out during the summer to ensure the carriageways meet the minimum friction requirements stated in the standards for year round use. In New Zealand and Australia, testing is carried out during the summer months when skid resistance is at its lowest.

Winter Maintenance Performance Measurement Using Friction Testing
November 2009 37
TABLE 3.2 presents a summary of current international road agencies practices on:
• Whether the road agency uses RWIS; • Whether friction is used as a decision making tool for winter maintenance; and, • Whether the road agency has conducted friction measurements in research and/or pilot
tests.
TABLE 3.2 CURRENT PRACTICES OF INTERNATIONAL ROAD AGENCIES
Road Agency (International) Use RWIS?
Use Friction as Decision-Making Tool for Winter Maintenance
Activities
Conducted Winter Friction
Measurements in Research and/or
Pilot Tests Australia Roads and
Traffic Authority (New South Wales)
Yes No No
Danish Road Directorate Yes No No Finnish Road Administration
Yes Yes Yes
Germany Federal Highway Research
Institute (BASt) Yes No Yes
Iowa DOT Yes No Yes Japan Civil Engineering Research Institute for
Cold Region Yes No Yes
Ohio DOT Yes Yes Yes Norwegian Public Roads
Administration Yes Yes Yes
Netherlands Ministry of Transport
Yes No No
New Zealand Transport Agency
Yes No No
Swedish National Road Administration
Yes Yes Yes
United Kingdom Highways Agency
Yes No No
Wisconsin DOT Yes No Yes
The current practices of international agencies have been summarized and are included in APPENDIX D. The discussion below highlights the key information related to the current practices of road agencies that responded to the survey.

Winter Maintenance Performance Measurement Using Friction Testing
November 2009 38
3.3.2.1 Denmark
In Denmark, the service objective is always to achieve bare pavement. The Danish Road Directorate does not use friction measurements in their winter maintenance operations. Instead, they rely on their RWIS to monitor weather conditions (at five minute intervals) and another system called Winterman to monitor contractors’ performance. Denmark is also testing Vaisala sensors, and unlike Finland (see Section 3.3.2.2), they have not found the results promising because the sensors only produce the correct value when a minimum water layer thickness exists on the road, a condition which occurs very rarely in the road network.
Denmark has 6 winter centrals that make decisions, with 3,800 km under the jurisdiction of the Road Directorate and 68,000 km under the municipalities. Private contractors carry out salting and snow ploughing.
Winterman was developed by the Danish Road Directorate to manage winter maintenance operations and has been used since 1998. A schematic of the system is shown on the next page. Winterman is currently used in 35 municipalities as individual systems. Approximately two-thirds of these are co-hosted by the Road Directorate which runs the winter centrals. The municipal systems co-hosted by the Road Directorate benefit from advanced notification through the winter centrals regarding expected slippery conditions through the 24-hour continuous monitoring conducted by the winter centrals.

Winter Maintenance Performance Measurement Using Friction Testing
November 2009 39
(Source: Danish Road Directorate)
While the basic Winterman system stores contact information, the start and finishing time-stamps and salt consumption of each maintenance vehicle, the system can be enhanced with the use of Global Positioning System (GPS) for assigning the routes to be taken by maintenance trucks and controlling spreader output (dosage, spreading width and symmetry). Trucks that are equipped with automated data collection capability are equipped with GPS such that an interface can occur between Winterman and the equipment for data registration in the management system. Currently, all of the spreaders and a few snow ploughs used on the state road network are equipped with automated data collection. Approximately 30 percent of the spreaders also have GPS controlled spreading, which is used to ensure better quality of the spreading actions. The Road Dictatorate has plans to convert all of its spreaders with GPS controlled spreading capability.
The Danish Road Directorate conducts open competitive tender for hiring contractors. Contracts are typically for a 4-year term. The contractor is obligated to have the vehicle and personnel available on a 24-hour basis for seven months (from October 1 through April 30). The Road Directorate owns the spreaders and snow ploughs to be used by the contractor.

Winter Maintenance Performance Measurement Using Friction Testing
November 2009 40
Essentially, the Winterman system conducts weather monitoring and when maintenance action is determined to be required the system will conduct automatic call-out to the contractor. The Winterman system automatically determines the length of routes, maintenance method, amount of treatment materials, cost of treatment materials as well as payments to contractors. The system is effective in monitoring and controlling the work quality and provides opportunity to review, analyze, improve and evaluate action plans.
The Road Directorate conducts auditing of contractor’s performance specifically on routes where maintenance trucks are not equipped with GPS controlled spreading, in order to validate the manual registrations. Data available through GPS is useful when complaints or insurance cases occur that require detailed documentation of the actions that have been taken.
Around 12,000 km of main roads consume around 150,000 tons of salt annually, with salt consumption doubling to 300,000 tons for all roads, following guidelines set and monitored by the Winterman system.
3.3.2.2 Finland
In Finland, the “Road Law” states that public roads shall be kept free of snow and ice obstacles as required by motor vehicle traffic. Winter maintenance follows several principles, including uniform, regionally equal prerequisites for predictable travel throughout the country, and striving to ensure that there are no unexpected changes in driving conditions.
The Finnish Road Administration holds friction values as an important quality standard (see TABLES 2.1 A and B, 2.2A and B). Friction measurements have been conducted in Finland since the early 1980’s with many different devices. The current friction quality standard is based on the C-trip device.
As specified in “Winter Maintenance Policy in Finland” prepared by the Finnish Road Administration (FinnRA), winter level of service is focused and controlled according to location and time, while taking into consideration the prevailing traffic demands and the condition of the road network. Another objective highlighted in the document is the basic principle that the winter time road safety risk is no higher than during the rest of the year. As winter weather naturally worsens driving conditions, it is important from the standpoint of road safety that the level of maintenance is as uniform and predictable as possible. Winter time road safety also requires matching the level of maintenance with speed limits. As such, variable speed limit signs and variable message signs are used on roadways to help road users anticipate risky, exceptional conditions.

Winter Maintenance Performance Measurement Using Friction Testing
November 2009 41
The country’s road network is divided into 5 maintenance classes according to ADT, and the maintenance classes determine the cycle time (defined as the time from the moment quality becomes inferior or time from the end of a snowfall event to the moment maintenance procedures are completed), and the quality standards (defined by friction values, maximum snow depth and surface evenness) for different effective periods (for example, day- and night-time). FinnRA’s objective is to provide bare pavement most of the time for the two highest maintenance classes, while allowing partial snow cover (strips of packed snow or packed snow on pavement surface) for the lower maintenance classes.
According to FinnRA, the benefit of using friction as a quality standard is in the safeguard of traffic safety. Conversely, the disadvantage is that measuring friction can be difficult and challenging and FinnRA is continually working towards improving friction measurement techniques.
The Finnish National Road Administration was divided in 2001 into two organizations: the Finnish Road Association (FinnRA) and the Finnish Road Enterprise. FinnRA is further divided into nine road districts, with 7-14 regions per road district and 500-1,500 km of roads per region. FinnRA determines the required level of service and then winter maintenance is contracted out according to a price and quality competition, followed up with annual customer satisfaction surveys. The contractors are responsible for all necessary equipment, personnel, and subcontractors. Contractors must meet quality requirements in the removal of snow, prevention of slipperiness, and maintenance of a level road surface, as well as maintain a consistent quality with adjoining areas. The Finnish Road Enterprise provides consultation services and supervises construction.
In Finland, the “Road Weather Information System” automates the collection, storage and distribution of data. The process is illustrated in the diagram below.

Winter Maintenance Performance Measurement Using Friction Testing
November 2009 42
(Source: Pilli-Sihvola Yrjö of FinnRA)
The system consists of road weather stations, optical friction sensors, road weather cameras, radar and satellite images, and road weather forecasts for data input; various servers for data storage, analysis and distribution; and various output channels including users’ workstations, the internet and roadside variable message and variable posted speed limit signs. The information in the system is updated every 5 to 15 minutes. According to FinnRA, the reliability of the information varies depending on the nature of measurement. For example, weather radar about rain or snow and temperature sensors provide the most accurate information while friction sensors (as described below) are still being evaluated. The Vaisala DSC111 optical friction sensor has been tested by FinnRA with promising results, especially when using the friction information measured continuously for traffic management purposes (see Section 2.3.3 for more information). Further studies have been conducted to identify the possibilities of using the friction information to measure winter maintenance performance but results were not yet ready at the time of the current practices survey.

Winter Maintenance Performance Measurement Using Friction Testing
November 2009 43
FinnRA is also studying how optical friction device and manual observations using the C-trip device can most effectively be used as a combination.
FinnRA conducts open competitive tender for hiring contractors. The evaluation of potential contractors involves the bidding price as well as 8 criteria with varying levels of importance. Points are assigned to each criteria and the total points are calculated. A system is also used to combine the total point and the bidding price for the final result. The 8 criteria and their respective level of importance are as follows:
Criteria Degree of importance
Plans of accessibility, monitoring of the state of road network, weather monitoring and information exchange 20%
Use of equipment, trucks, stocks, offices and other supplies 20%
Quality assurance and documentation of the contract 15%
Traffic safety and road user observation 15%
Principles of subcontracting and materials 10%
Competence of personnel 10%
Environmental Effects 5%
Work Safety 5%
FinnRA’s Winter Maintenance Policy specifies the Administration’s quality assurance procedures. The main elements of assurance are: the quality standards (which is either general or job-specific), the quality plan, selection of a competent contractor and the quality of the contractor’s operation. The Policy indicates that winter maintenance is primarily “quality-responsible contracting”, where it is important for the parties involved (the Administration and contractors) to have a common understanding of the requirements of winter maintenance, the purpose and objectives of operation, and the desired results. The Policy stresses that “regardless of the detailed quality specifications, many issues depend on the contractor’s operation”.
The Policy indicates that it is difficult to describe and control by means of quality standards. As such, quality plans place focus on striving toward service-oriented operation, well-timed management of situations, environmentally friendly and safe activity, and seamless

Winter Maintenance Performance Measurement Using Friction Testing
November 2009 44
cooperation between different contracts. Conducting audits to ensure that the entire personnel of the contractor operate according to the quality plan is crucial.
The contractor must present a plan to FinnRA regarding the execution of the procedures and quality assurance, prior to signing the contract.
FinnRA’s road weather information system was first developed for the purpose of providing information to winter maintenance personnel. Currently, the contractor has access to all the real-time information and data in FinnRA’s road weather information system through a web-based interface. Information from RWIS is available to assist contractors in making winter maintenance decisions. Contractors are required to follow-up with their maintenance activities to ensure that the quality standards are met. They are required to inform FinnRA should problems exist where deviations from standards may occur. FinnRA also conduct random sampling as a means of quality monitoring of the level of service and quality of the roads through an external consultant. The external consultant conducts examination approximately 10 times throughout the winter period to cover a minimum of 75 percent of the road network. Sampling by the contractors and the external consultant is mostly conducted using the C-trip device.
FinnRA has indicated that future actions to improve the current state of winter maintenance involve improved monitoring of prevailing road conditions (including friction) such that more precise requirements can be defined for contractors regarding the level of service to be provided.
Currently, FinnRA’s annual expense for its winter maintenance program is slightly below $1.55 million (1 million €). This cost involves maintenance of monitoring devices, data exchange, electric power, system storage and maintenance, road weather forecasts and satellite images. There are approximately 400 road weather stations and 350 road weather cameras in operation.
With regard to environmental management, as little salt as possible is used in Finland to protect the quality of groundwater. Alternative means of guaranteeing road safety (for example, high service levels and local speed limits) are used in environmentally sensitive areas. The use of dry salt is forbidden due to significant wastage. FinnRA also defines an annual amount of salt for each area, with fines for contractors if they use more salt and bonuses if they use less. The dust build up due to sanding is also regulated through the correct selection of sanding material.

Winter Maintenance Performance Measurement Using Friction Testing
November 2009 45
3.3.2.3 Germany
Germany mostly relies on their RWIS to detect the formation of icy and slippery road surfaces. Visual assessment is rarely conducted. Germany is currently conducting tests with the Vaisala Sensor DSC111 for friction measurements and results were not yet ready at the time of the current practices survey.
3.3.2.4 Japan
No response was received directly from Japan. However, Don Halliday of Halliday Technologies has indicated that Japan has been testing the continuous friction tester and is about to make a recommendation that friction measurement be used as their primary winter road maintenance decision-making tool.
3.3.2.5 New Zealand and Australia
While climate is temperate in these countries, the focus of skid measurement is on maintaining pavement conditions, and the skid resistance levels are also related to achieving a constant level of risk of involvement in a skidding related crash under wet conditions.
In Australia, skid testing is conducted annually. In New Zealand, where snow and icing occurs in winter, skid resistance management largely involves the use of weather information system and thermal mapping to identify the potential for icing to ensure early application of de-icing agents such as calcium magnesium acetate.
3.3.2.6 Norway
Winter maintenance in Norway is performed according to two different strategies: strategy for Winter Roads where snow and ice cover can be accepted during the winter period, and strategy for Bare Roads where they are free from snow and ice during the winter period. The roads should be passable for vehicles equipped for winter driving. This is achieved by removing snow and ice to provide sufficient friction for road users. Approximately 6,000 km of national roads are classified as Bare Roads and 46,000 km of national and county roads are classified as Winter Roads. For Winter Roads, winter maintenance actions include snow ploughing, snow and ice clearing and spreading. For Bare Roads, winter maintenance actions include snow ploughing, snow and ice clearing and salting.

Winter Maintenance Performance Measurement Using Friction Testing
November 2009 46
An RWIS is used to help guide winter maintenance operations in Norway and friction values are used as an important quality standard (see TABLE 2.4). In Norway, the currently approved friction measurement devices include various deceleration and fixed/variable slip devices. However, the current friction quality standard is based on the OSCAR device. Norway conducts testing of new friction equipment every winter, and according to the results, the list of approved devices may be updated. All approved devices are calibrated against the Oscar and ROAR devices.
Similar to Sweden and Finland, Norway defines winter maintenance standards based on road class and AADT, and these standards determine the appropriate trigger values, action times and quality standards that include friction levels and maximum snow depth. In Norway, variable message signs are used on roadways to warn drivers about congestion, reduced passability, and reduced speeds, and may also be used to recommend alternate routes.
Salt and salt solutions, in addition to other chemicals, are used to improve friction in areas where the policy is “Bare Roads”. Sand is used where the policy is “Winter Roads”. Salting action is triggered by the expected friction values after snowfall.
The Norwegian Public Roads Administration (NPRA) is guided by the Directorate of Roads, which is under the Ministry of Transport and Communication. NPRA is divided into 5 regions and 30 districts and funded by the state, the counties, and the municipalities. Maintenance of roads is contracted out after a competitive bidding procedure. Contractors must prepare and maintain a plan for winter operations; they are responsible for upholding the maintenance standard and reporting each activity, including actions that failed to comply with the specifications. Currently, the contractor has access to all the real-time information and data in NPRA’s RWIS through a web-based interface for the purpose of planning winter maintenance activities. A system that keeps track of where contractors have carried out maintenance and how much materials have been used has been introduced gradually. Currently, approximately 30 percent of contracts make use of this system.
NPRA conducts random sampling of the work carried out by contractors. NPRA has been constantly improving the bidding procedures (documents, quality control and standard specifications) since 2003. Starting in 2008, contractors are required to comply with ISO 9001 quality management system standards.
As shown in TABLE 3.4, the NPRA and contractors have to use approved devices for friction measurements, as specified in the contracts. Before every winter, all operators of approved

Winter Maintenance Performance Measurement Using Friction Testing
November 2009 47
friction devices arrange to meet to calibrate the equipment against the Oscar and ROAR devices and to receive training conducted by NPRA.
According to NPRA, the benefit of using friction as a quality standard is in the safeguard of traffic safety. Conversely, the disadvantage is that measuring friction can be difficult. In the future, NPRA plans to improve the quality standard for friction and improve the predictability of friction on its road network.
3.3.2.7 Sweden
In Sweden, the “Road Statute” of the Swedish National Road Administration (SNRA) states that road operation includes the removal of snow and ice, and taking actions against slipperiness to such a degree that the road is kept accessible to existing traffic, both vehicles and pedestrians.
Sweden uses an RWIS to help guide winter maintenance operations and holds friction values as an important quality standard (see TABLE 2.3). Friction measurements have been conducted in Sweden since the 1990’s with the testing of many different devices. The current friction quality standard is based on the Coralba device. Currently, the Coralba device is the only device used but is found to lack reliability and contribute to safety risks due to the system being a deceleration device that requires braking at high traveling speeds. The SNRA has been evaluating the RT3 for two winter seasons.
The country’s road network is divided into 5 standard classes according to AADT, and the standard classes determine the appropriate trigger values, action time and quality standards including friction levels, maximum snow depth and evenness levels. As soon as conditions reach a trigger value for snow depth, unevenness or friction, the time begins to be counted until action is taken. The action time is defined as the maximum time within which a maintenance measure (salt, sand and/or aggregate) is carried out on a road surface where a trigger value has been reached. The action time also defines the maximum time within which a specified standard is to be reached after the rain or snow has ceased. SNRA’s objective is to minimize the amount of snow cover for the higher maintenance classes by allowing for less maximum snow depth compared to the lower maintenance classes.
The SNRA is divided as a client / contractor organisation, with one head office, seven regional directorates, four profit centres, and 146 maintenance contract areas of 600 to 1,000 km each. Contractors are required to plan and coordinate all actions so that adjoining areas

Winter Maintenance Performance Measurement Using Friction Testing
November 2009 48
maintain consistent quality. The SNRA must be notified if severe weather conditions prevent requirements from being fulfilled. Currently, contractors are required to keep track and document their activities manually on paper. Contractors conduct friction measurements using the Coralba device before salt spreading or snow ploughing and after salt spreading or snow ploughing to check the prevailing friction values. SNRA conduct random inspections to evaluate a contractor’s performance. For inspecting friction, the SNRA uses the Coralba device. If a contractor fails the random inspection, a warning will be issued and if no further action is taken to improve the performance, the contractor will be fined.
SNRA, in conjunction with the Swedish Agency for Innovation Systems, VTI and Klimator AB has started the process of developing the Winter Model in 2001. The Winter Model is used for assessing the most important effects (those concerning road users, road administrators and the environment) and their monetary value of alterations of winter maintenance strategies and operations. The structure of the Winter Model is shown below.
(Source: SNRA)

Winter Maintenance Performance Measurement Using Friction Testing
November 2009 49
The Winter Model is a computer program that consists of various sub-models for assessing the state of the road. Currently, parts of the Winter Model are fully operational and are integrated in an Excel interface, while other parts are still under research. The Winter Model is not a winter maintenance tool for monitoring contractors’ performance (contrary to the Winterman system used by the Danish Road Directorate). It is a strategic model that allows the SNRA to review winter maintenance efforts through the evaluation of the effect of maintenance activities on traveling speeds, traffic safety and the environment and economic implications. According to SNRA, while the flow chart (as shown above) initially included the word “optimization”, in reality the Model is operating on the basis of iteration.
The SNRA has been active over the last 15 years to limit the use of road salt in winter road maintenance. SNRA’s objective is to maintain high accessibility to the road network and traffic safety while minimizing the use of salt in winter road maintenance and balancing it with the demands of the public. Roads with traffic lower than 2,000 AADT are normally not salted.
3.3.2.8 United Kingdom
Friction measurements are not carried out as part of the United Kingdom’s winter maintenance procedure. However, friction measurements are carried out during the summer to ensure the carriageways meet the minimum friction requirements stated in the standards for year round use. Summer friction measurements are not related to winter snow or ice conditions.
Winter skid resistance tests were carried out in 2007 as part of a research task into the effects of anti-icing treatment on skidding resistance. Comments had been received suggesting that the anti-icing treatments caused a reduction in skid resistance when road surface temperatures were above zero Celsius. The Pavement Friction Tester (PFT) was used for these tests as it can be used on a dry road surface.
3.3.2.9 United States
The Wisconsin and Iowa Departments of Transportation (DoT) mainly rely on their RWIS to monitor road conditions. They have done some testing and research of friction devices, but they do not currently use friction measurements in their maintenance operations.
Iowa DoT has tested two generations of ROAR, a SALTAR device and a Coralba device. In Iowa, they found it challenging to determine which trucks to equip with the friction measurement devices and which routes to cover. They also had maintenance issues with the

Winter Maintenance Performance Measurement Using Friction Testing
November 2009 50
friction wheels, which were expensive to repair. In the winter of 2008-2009, the Iowa DoT will make use of approximately 35 speed sensors (Wavetronix) for the first time at RWIS sites along the Interstate for measuring vehicle travel speeds. Through the usage of speed sensors, the Department will better understand the impact of weather and maintenance operations on prevailing speeds.
Wisconsin DoT has tested GPS/AVL (Global Positioning System – Automated Vehicle Location) technology. In Wisconsin, the cost of the friction measurement instruments and a lack of funding are the main reasons for not adopting these technologies.
The Ohio DoT’s experience with the Road Grip Tester (RT3 developed by Halliday Technologies Inc.) dated back to year 2001. Throughout the years, Ohio DOT, in collaboration with Halliday Technologies, has developed various prototypes of the RT3 to improve operation, reliability and durability of the device. Originally, the first system was installed on a dump truck and interfaced with ThomTech GPS system/data collector. By spring of 2004, the project was elevated to the design and development of a tow-hitch mounted RT3 for installation on a pickup truck. Testing continued through summer 2004 with the focus on verifying equipment and instrumentation durability and to confirm and validate the accuracy and repeatability of the collected data, which included date, time, speed, latitude, longitude, road temperature, air temperature and friction values information.
The tow-hitch mounted RT3 was first tested in the 2004-2005 winter season for validating the device under severe weather conditions. The collected data and feedback using manual data collection techniques were monitored to verify the usefulness of the friction measurements. Photographs were included as a visual documentation of measured conditions and were combined with mapping and graphing techniques to provide a thorough representation of actual conditions. The 2004-2005 testing provided supporting data to warrant a modification in the mounting position of the friction wheel. The new design (an offset version designed to replicate the path traveled by vehicles) received good results and the modifications were completed for all existing tow-behind units and newly ordered snowplow units for the 2005-2006 winter season.
Currently, none of the districts have integrated the RT3 on the entire fleet of snow trucks. Some operators make adjustments in treatment based on real-time information about prevailing road conditions displayed on the in-cab Halliday equipment. While the data collected is automatically transmitted to the ThomTech website, the website data is not being utilized at all in most cases.

Winter Maintenance Performance Measurement Using Friction Testing
November 2009 51
Ohio DOT has found that the measurements taken by the RT3 units are indicative of the road conditions with regard to the slickness, or lack of friction along a roadway. A benefit of using the RT3, as indicated by Ohio DOT, is the device’s capability of detecting hazardous road conditions such as black ice that are not apparent visually to the operator. The data allows maintenance managers to see where improvements could be made to the winter maintenance process (for example, adjusting route assignments, application and placement of equipment, and identifying over-treated and undertreated locations).
Ohio DOT has identified major targeted areas as they continue to experiment with the RT3.
Targeted Area Progress to date
Creating a system that detects, records, reports and disseminates data
Detection and recording functions are fully operational. Reporting function is 95 percent operational considering that ThomTech’s server
has crashed during winter events and grip data has been lost. The dissemination function is 95 percent operational considering that real-
time data is available and accessible to operators via the in-cab equipment; however, the data transmitted to the website is not entirely
accessible and is not being fully utilized.
Integration with other AVL applications and RWIS
No significant progress. RT3 grip data is not yet integrated with RWIS. AVL technology is not widely used but growth is expected in the
coming years. A small AVL pilot project is planned for one northern county in the winter of 2008.
Integration of RT3 data into an early alert and advance notification system for motorist alerts / buckeye traffic (the traffic information website) / winter maintenance activities, including treatment implementation and/or
adjustment
Little progress has been made to integrate RT3 data for motorist alerts and buckeye traffic. For winter maintenance operations, some
operators are making treatment adjustments using real-time data. The plan is to have an improved website that allows a decision-maker in the district office to relay treatment actions to an operator. This is
considered the priority area among the major targeted areas.
Performance evaluation and level of service
In the Central office, staff has tried to analyze the data from the website to evaluate performance after a snow event. Grip readings
before, during and after the snow storm were reviewed. Currently this is a slow and cumbersome progress.
Potential cost savings
It is noted that it is very difficult to quantify the cost savings related to reduction in the use of salt. However, there are plans to monitor cost
savings more closely in the winter of 2008. A pilot test has been planned for a central Ohio county.

Winter Maintenance Performance Measurement Using Friction Testing
November 2009 52
3.4 TYPES OF INSTRUMENTS AND EQUIPMENT USED AND THEIR EFFECTIVENESS
3.4.1 Canadian Road Agencies
3.4.1.1 RWIS and Other Sensors
In Canada, the sensors used at RWIS stations typically measure such parameters as:
• Road surface temperature; • Subsurface temperature; • Air temperature; • Wind speed and direction; • Pavement salinity; • Freezing point; • Precipitation and snow cover; • Barometric pressure • Concentration of chemicals; and • Relative humidity. Webcams are also set up to monitor weather conditions. Kamloops, British Columbia, also has ice warning sensors at their RWIS stations. Nova Scotia has recently installed a Vaisala DSC111 sensor (see Section 2.3.3.2) but it has not yet been tested during the winter.
3.4.1.2 Friction Measurement Devices
For friction devices, each individual device used by the Alberta, Quebec, and Ontario provincial road agencies has its own advantages and disadvantages, and the specific experiences are outlined in TABLE 3.3. For example, the Halliday RT3 is easy to read and provides consistent and repeatable results, but the centre mounted wheel is not a true representation of wheel tracks and does not produce accurate readings along curves. The IceChek Friction Tester produces small data files and has a useful light display, but the readings are not accurate along curves and they are affected by pavement texture.

Winter Maintenance Performance Measurement Using Friction Testing
November 2009 53
TABLE 3.3 FRICTION DEVICES ADVANTAGES AND DISADVANTAGES (INFORMATION PROVIDED BY CANADIAN ROAD AGENCIES)
DEVICE EXTENT OF USE SCALE ADVANTAGES DISADVANTAGES Deceleration Devices: VC3000 • Quebec
(currently being tested)
None provided by agency
• None provided by agency • None provided by agency
Tapley meter • Ontario (used in the past)
0 (low) -100 (high)
• None provided by agency • Dangerous to operate on a highway
VC2000PC • Alberta (used in the past)
None provided by agency
• None provided by agency • None provided by agency
Side Force Devices (also called Constant Slip Angle Devices): Halliday RT3 GripTester
• Quebec (currently being tested)
• Alberta (was tested)
• Ontario (currently being tested)
0 (low) -100 (high)
• Easy to read • Good feedback • Consistent and repeatable
results • Works well and easy to
use • Minimal tire wear on dry
pavement
• Centre mounted wheel not true representation of wheel tracks, not accurate through curves
• Not directly converted to coefficient of friction
• Large data files • Affected by pavement texture • Does not always correspond
to Alberta Motor Association road report
• Relative scale based on lateral force measurement requires calibration to a known surface
• Measurements are sensitive to steering angle
IceChek Friction Tester
• Quebec (currently being tested)
• Alberta (was tested)
0 (low) – 1.0 (high)
• Small data files • Tire is in wheel tracks • Useful light display • Takes 2 measurements
per second (compared to Halliday RT3, which takes 1 measurement/second)
• Results are repeatable if weather conditions remain the same
• Not accurate through curves • Affected by pavement texture • Not sure results are
repeatable on dry pavement • Not easily converted to a
friction coefficient because the downward force on the tire is not measured
• The equipment is not robust enough for constant and daily use (in Alberta, there was a loose bolt, exposed wires, and make-shift connections, and they also had trouble getting the GPS to “talk” to the software, etc.)
• IceChek Instruments is a small and young company; only sold about 5 units for use; equipment needs more testing

Winter Maintenance Performance Measurement Using Friction Testing
November 2009 54
TABLE 3.3 FRICTION DEVICES ADVANTAGES AND DISADVANTAGES (INFORMATION PROVIDED BY CANADIAN ROAD AGENCIES)
DEVICE EXTENT OF USE SCALE ADVANTAGES DISADVANTAGES Fixed slip device: Findlay Irvine Griptester
• Ontario (used in the past)
0 (low) -1 (high)
• None provided • Low normal force results in excessive loss of contact at highway speeds
Pon-Cat Traction Watcher One (TWO)
• Ontario (currently being tested)
• Quebec (currently being tested)
None provided
• Works well and easy to use
• Excessive tire wear on dry pavement
Fixed/Variable slip device: Norsemeter ROAR Mark I and II
• Ontario (used in the past)
0 (low) -1 (high)
• Under uniform conditions it provides very detailed and representative characterization of friction over a range of wheel slip speeds that can be used to estimate snow cover conditions accurately
• Each sample takes approximately 2 to 3 seconds of travel
• Mechanically complex device requires skilled maintenance
• Under non-uniform snow conditions, within the tire footprint it gives a reading that may be biased
Other devices: Nordaxe
• Quebec None provided by agency
• None provided by agency • None provided by agency
Vaisala DSC111 and DST111
• Ontario (testing only)
• Nova Scotia (recently installed)
None provided by agency
• None provided by agency • None provided by agency
The scales used by the various devices typically fall into two categories: some use a scale of 0 (low) to 100 (high), and others use a scale of 0 (low) to 1.0 (high). Frequent considerations include tire wear (directly related to maintenance costs), sensitivity/accuracy, repeatability, speed, wheel location, and data file size.

Winter Maintenance Performance Measurement Using Friction Testing
November 2009 55
3.4.2 International Road Agencies
3.4.2.1 RWIS and Other Sensors
RWIS is used by international road agencies on a routine basis.
The parameters measured at the RWIS stations in Wisconsin, Iowa, Denmark, Germany, and Finland are similar to the ones measured by Canadian agencies. Again, in most cases webcams are also set up to monitor weather conditions. These sensors provide useful information and help contractors determine the best course of action to ensure roads are safe in the winter. However, as Denmark has noted, some parameters can take a long time to validate and many sensors are sensitive to changes on the road.
Both Germany and Denmark have made the observation that any small change or defect (e.g., defective sensors, defective connections between the stations and the computer system) can lead to unreliable and false data.
In addition, Wisconsin noted that public road condition reports need to be continually updated with the information collected by the RWIS if it is to be of use to drivers. Currently in Wisconsin, the information is only updated three times per day. They have also identified a need to link the information collected by mobile sensors to the central database. Both of these issues would also be relevant in the case of friction measurements.
For friction measurements to be of use to drivers and for maintenance operators, an integrated computer system needs to be in place.
3.4.2.2 Friction Measurement Devices
Friction measurement devices identified by international road agencies in the current practices survey are shown in TABLE 3.4, along with the advantages and disadvantages of the devices based on agencies’ experiences.
While the road agencies surveyed were asked about costs related to friction devices, including acquisition costs, maintenance costs, costs of training operators and data maintenance costs, very few road agencies provided cost information. On the other hand, IceChek Instruments, Cargill and Vaisala provided some cost information, as shown in APPENDIX E.

Winter Maintenance Performance Measurement Using Friction Testing
November 2009 56
TABLE 3.4 FRICTION DEVICES ADVANTAGES AND DISADVANTAGES (INFORMATION PROVIDED BY INTERNATIONAL ROAD AGENCIES)
DEVICE EXTENT OF USE SCALE ADVANTAGES DISADVANTAGES Deceleration Devices: Greatek C-Trip (C-trip-ц, Coralba) used with ABS vehicles
Finland (the national quality standard is based on this device). • Used at weather
monitoring stations and during night patrol operations.
• Has been used for many years and the operators are used to it.
Sweden (has been used in the past, but they are phasing them out) Iowa (tested in the early 1990s) Norway (first device approved by the Public Road Administration)
0 (low) to 1.0 (high) In normal use the scale is 0 to 0.5
• The method is simple and relatively inexpensive.
• In their latest studies Finland has found that these values are not quite consistent with the real physical friction value (between 0.0 - 1.0).
• It is unsafe to brake hard in slippery conditions
Coralba µ, Dynatron og ELTRIP type 45 nk and 45 nkl
Norway (all approved devices)
• Information provided in Norwegian language only
ViaTrip µ Norway (approved device)
None provided by agency
• Calculates distance as well as additional sensors, such as GPS, temperature sensor and humidity sensor
• Installed in a standard car without any additional mechanical components
• Data verification
• Needs braking

Winter Maintenance Performance Measurement Using Friction Testing
November 2009 57
TABLE 3.4 FRICTION DEVICES ADVANTAGES AND DISADVANTAGES
(INFORMATION PROVIDED BY INTERNATIONAL ROAD AGENCIES)
DEVICE EXTENT OF USE SCALE ADVANTAGES DISADVANTAGES Gripman Tester
Finland (was tested in Friction Pilot projects 2004-2008)
0 (low) to 0.8 (high)
• Very easy to install into any kind of vehicle, the device only needs a 12 V current (out of the cigarette lighter) but it is not in any other way connected to the car.
• Quite easy to use • It gives physically right
friction values (right scale) • Inexpensive
• Needs braking • Variation in friction values • Dependent on the tires
(type and studs) • Somewhat dependent also
of the driver • Braking must be done on
even road section
Side Force Devices (also called Constant Slip Angle Devices): Mobile monitoring station
Finland (used in the past)
None provided by agency
• The equipment gave friction information continuously along the road
• It was possible to mount the measuring device to a van or bus and it did not hinder the driver
• Quite reliable on icy road surface
• The measuring device needed to be mounted onto the bus (or below the bus)
• The measuring tire was wearing out quickly
• The system needed frequent maintenance
• Wide dispersion of friction values
• On snowy roads unexpected friction values were generated
Halliday RT3 GripTester
Sweden (has been tested for two winters) Japan (just finished two-year test) Ohio (currently in use) Sweden, Japan, and Ohio will likely start using the website feature of the RT3 system so that drivers can get real time road surface conditions.
0-100 • Provides more detail than other devices (according to Halliday, up to 8 times the resolution of other devices)
• Is a useful tool for adjusting the amount of maintenance treatment
• Device gives accurate readings and is durable
• In addition, the tires, which are normally tires of a regular commercial passenger vehicle, do not wear out as quickly as the angle is quite small, usually at approximately 1.5 degrees.
• It does not measure around sharp curves as it was designed to measure along a straight line
• Periodic routine maintenance is needed

Winter Maintenance Performance Measurement Using Friction Testing
November 2009 58
TABLE 3.4 FRICTION DEVICES ADVANTAGES AND DISADVANTAGES (INFORMATION PROVIDED BY INTERNATIONAL ROAD AGENCIES)
DEVICE EXTENT OF USE SCALE ADVANTAGES DISADVANTAGES Sideways-force Coefficient Routine Investigatory Machine (SCRIM)
United Kingdom (routinely used for monitoring road friction values over the summer months, has been in use since the 1970’s)
None provided by agency
• None provided by agency • None provided by agency
Fixed Slip Devices: Pon-Cat Traction Watcher One (TWO)
Finland • Used in regular
maintenance quality control in FinnRA
Norway (an approved device)
0 (low) to 1.0 (high)
• Quite reliable friction values
• It is combined with GPS equipment and good data storage
• Measuring can be done without braking
• Not usable for high friction values over 0.5 as the tires wear out and the device can be damaged if there are long intervals of high friction measurements
ASFT T2Go Norway (an approved device)
None provided by agency
• Small, portable, hand pushed
• Displays mean mu value/BPN/SRT per every desired distance length
• Compatible with GPS and PDA
• Hand pushed (not suitable for large regional areas)
• Does not work below -25ºC
ViaFriction Norway (an approved device)
None provided by agency
• Small dimensions • Measurements can be
done at typical traffic speed (80 km/h)
• Uses an electric brake
• None provided by agency
GripTester United Kingdom (has been in use since the 1980’s)
None provided by agency
• None provided by agency • None provided by agency
Pavement Friction Tester
United Kingdom (used for testing of anti icing treatments in 2007)
None provided by agency
• Allows tests to be carried out at higher slip speeds
• Tests can be carried out on a dry surface
• Does not test continuously

Winter Maintenance Performance Measurement Using Friction Testing
November 2009 59
TABLE 3.4 FRICTION DEVICES ADVANTAGES AND DISADVANTAGES (INFORMATION PROVIDED BY INTERNATIONAL ROAD AGENCIES)
DEVICE EXTENT OF USE SCALE ADVANTAGES DISADVANTAGES Fixed/Variable slip devices: Norsemeter ROAR Mark I and II
Iowa (Tested in late 1990s as part of the Concept Highway Maintenance Vehicle project)
0 (low) -1 (high)
• Under uniform conditions it provides very detailed and representative characterization of friction over a range of wheel slip speeds that can be used to estimate snow cover conditions accurately
• Each sample takes approximately 2 to 3 seconds of travel
• Mechanically complex device requires skilled maintenance
• Under non-uniform snow conditions, within the tire footprint it gives a reading that may be biased
• ROAR device was not designed for application in the harsh snow and ice removal environment
Norsemeter RoAR M III, OSCAR
Norway (approved devices used for calibration of other devices)
• Information provided in Norwegian language only
Norsemeter SALTAR
Iowa (Tested in late 1990s and early 2000s in a concept vehicle, as part of the Concept Highway Maintenance Vehicle project)
None provided by agency
• It is a smaller unit than ROAR so it did not interfere with the underbody blade as the ROAR
• It is a more robust unit than ROAR
• It employs a simplified electronic system
• The tests showed that the SALTAR might be temperature sensitive
Other devices: Vaisala DSC111
Finland (currently being tested for winter conditions) Germany (was tested)
0 (low) to 1.0 (high)
• It gives physically right friction values (scale is right)
• Usable on stand alone and also for floating car measurements
• Easy to install by the road side
• Variation in the friction values
• During white snow circumstances, it gives friction values that are too low
• Variation in repeatability

Winter Maintenance Performance Measurement Using Friction Testing
November 2009 60
3.5 COMMUNICATING ROAD CONDITIONS TO ROAD USERS
Communicating information about road conditions to road users is valuable for road safety. Many countries make informing road users a priority for their road network management. Information is communicated to road users in several ways:
• Traffic information centres • Variable message signs • Websites • Roadside rest areas with communication capabilities • Media including radio, television, telephone, mobile phone, websites, and newspapers
While some countries have a goal of providing friction information to road users, none of the surveyed road agencies are currently doing so. Instead, information is collected through many different means as mentioned previously (primarily RWIS, as well as weather forecasts, cameras, driver reports). Sections 3.5.1 and 3.5.2 below present information on Canadian and International agencies, respectively.
3.5.1 Canadian Road Agencies
Currently, with the exception of Nunavut, all other Canadian provincial road agencies provide road condition information to road users through the internet and phone services. Images from highway cameras are accessible through the internet website of most agencies.
In general, road conditions are described in both text and graphical format. Some jurisdictions have separate reporting for summer and winter conditions. Other jurisdictions present year round road conditions using a more simplified legend. For winter conditions, the available information varies from those that indicate "use caution" and "road closed", to those that communicate more specific conditions, including visibility issues, slipperiness, snow covered, snow packed, ice, slush, etc.
For example, notable efforts to communicate winter road conditions to road users have taken place in Québec. The Ministère des Transports du Québec (MTQ) provides an information service on road network conditions, the Inforoutière, that is accessible online and by telephone. A shape and colour coded map (green circle – good, yellow diamond – fair, white square – critical, and red octagon – closed) describes the current conditions of traffic routes. To ensure the information is accurate, MTQ has developed a feedback system that checks for anomalies and corrects them.

Winter Maintenance Performance Measurement Using Friction Testing
November 2009 61
The frequency of the information updates vary. Some jurisdictions only update when staff and/or contractors observe and report conditions; some update their reports a minimum of two or three times a day and when situation changes. As indicated in all the internet websites, drivers are advised to exercise caution on the roads as severe weather may cause road conditions to change rapidly and the information on the websites may not reflect current conditions.
While friction information is not one of the road conditions currently communicated to road users, there is potential to do so in the future.
3.5.2 International Road Agencies
International road agencies have similar approaches to Canadian road agencies in communicating road conditions to users. The current practice of international road agencies (specifically those that conduct friction measurements) with regard to communicating road conditions to the public, are described below.
3.5.2.1 Ohio Department of Transportation
While Ohio DoT is currently using the RT3, the Department is using visual observations made by operators to supply road condition information for their “Buckeye Traffic” website. For winter conditions, four types are described: dry, wet, moderate and severe. Friction values are not communicated to road users.
3.5.2.2 Denmark
The Danish Road Directorate has a Traffic Information Centre that uses multiple forms of mass media to communicate road conditions. The road agency also provides variable message signs on all main roads, especially highways, to inform users about road conditions as well as other traffic data. Road weather information systems are connected to the Winterman system. The operators of winter centrals update the Internet website on a regular basis using road and air temperature information generated from RWIS, as well as information provided by maintenance personnel in trucks and patrol cars through visual observations of the road conditions.
The Danish Road Directorate conducts surveys from time to time for its traffic information website and the degree of user satisfaction. Based on the agency’s experience, on typically winter days where salting is carried out, the visitors are mainly from radio stations and centers

Winter Maintenance Performance Measurement Using Friction Testing
November 2009 62
for controlling trucks, taxis, etc. On days where snow is occurring, the number of visitors may be up to 50 times higher due to an increase in the number of general public users.
3.5.2.3 Finland
The Finnish Road Administration has a Traffic Information Centre that uses multiple forms of mass media to communicate road conditions, in addition to road works, accidents and other traffic disturbing factors.
While Text-TV is available, the most important channel for informing the public is through the Internet (http://alk.tiehallinto.fi/alk/english/). Information from road weather stations (including road and air temperature, precipitation and road condition), images from road weather cameras, traffic conditions and road works are available through the internet. Friction values are not communicated to road users. There is a close connection between the RWIS and the traffic information centre such that the most current road conditions are taken into account and relayed to the public within the shortest time possible (for example, accounting for the effects of maintenance actions that have occurred).
Finland’s RWIS contains a control and computing application that processes the data collected from road weather stations and other sensors using pre-determined algorithms to control, assign and update the messages displayed on variable message signs, as well as to implement lower posted speed limits on variable speed limit signs when specific conditions are met. For example, a specific combination of air temperature and data collected from a road surface sensor would trigger the display of “slippery roads”. Another example is when the visibility sensor detects available sight distance to be less than 200 metres, the posted speed limit on a motorway would be reduced to 80 km/h. The objective is to automate changes in the posted speed limit when required by road conditions but still allowing for manual changes by operators if needed.
FinnRA is studying the possibility to develop a more standardized interface for users accessing information given by the RWIS. A preliminary study was conducted to examine the possibility of creating an open database but currently this is still in the planning stage due to contractual and commitment issues.
3.5.2.4 Norway
The Norwegian Public Road Administration has a Traffic Information Centre that uses multiple forms of mass media to communicate road conditions.

Winter Maintenance Performance Measurement Using Friction Testing
November 2009 63
Information to the public is provided via radio, text-TV and the internet. The current information does not include measured friction. The terms used for informing the public are in standardized terms, including “dry bare road”, “wet bare road”, “sleet”, “powder snow”, “hard snow/ice”, and “thin ice”. On the website, information related to winter maintenance is currently available for one county in southeast Norway (http://www.visveg.no).
Variable message signs are used to warn drivers about traffic jams or reduced passability, and they can recommend another driving route, reduced speed and so on. A mix of mechanical and optical signs are currently used.
Updates on road user information occur when contractors notify the traffic information centre that road conditions have changed.
3.5.2.5 Sweden
The Swedish National Road Administration has a Traffic Information Centre that uses multiple forms of mass media to communicate road conditions. Currently, the information provided on the internet website (http://trafikinfo.vv.se/triniMenu/trinimenu.html?startmenu=1) is not real- time and is a “light” version of what is available to the SNRA and contractors. The current information does not include measured friction. Updates occur when contractors notify the traffic information centre that road conditions have changed.
On the website, road weather forecast information is provided with a colour system where yellow represents slippery roads due to frost, orange represents slippery roads due to snow and red represents slippery roads due to ice. During the winter, another map is available to identify roads where no problems are expected to be encountered (with links shown in green), “white roads” that do not receive any treatment (with links shown in blue), roads with risk of dangerous driving conditions (with links shown in yellow) and roads that should be avoided due to dangerous driving conditions (with links shown in red).
There are plans within 2 years’ time to translate friction values measured by the RT3 into useful information for motorists. For example, testing is being conducted to evaluate the feasibility of converting the Halliday Friction Number into percentage of grip denoted by 3 colours: green representing more than 70 percent road grip; yellow representing 50 to 70 percent road grip; and red representing less than 50 percent road grip. Testing is also being conducted with various pavement surfaces, tires and vehicles to correlate stopping distance with the Halliday Friction Number. The objective is to translate the percentage of road grip to an equivalent measure of stopping distance.

Winter Maintenance Performance Measurement Using Friction Testing
November 2009 64
The SNRA also provides three different types of traffic signs. They have older mechanical signs that show both road surface temperature and air temperature. The intent is to help the road user realize that the difference between the two temperatures can be up to 10 to 12ºC so that they drive more carefully on winter roads. SNRA also has variable speed limit signs (speeds ranging from 110 to 50 km/h) that use input from RWIS data analysed by a weather model. Lastly, they have signs that show a symbol of a slippery road or heavy traffic together with the recommended lower speed limit (see FIGURE 3.1 for an example).
FIGURE 3.1: Variable Speed Sign in Sweden
3.5.2.6 Japan
Japan is researching ITS technology for the provision of advanced information on road conditions: guiding drivers through snowstorms with light-emitting delineators that flash in warning, millimetre-wave sensors that detect stopped cars or other dangerous situations ahead and provide the information through variable message signs.
3.6 LESSONS LEARNED FROM CURRENT USAGE OF FRICTION MEASUREMENTS
While some responses received contain information on lessons learned from the use of RWIS, this section focuses specifically on lessons learned from current usage of friction measurements. Information on other lessons learned can be found in the current practices surveys of Canadian and International agencies in APPENDICES C and D, respectively.
3.6.1 Standard for Measuring Friction
Finland has stated that measuring road surface friction is a very complicated matter and that developing a standardized procedure to measure friction is difficult. Friction varies along the width and length of a road, and many factors, such as tire type, affect friction measurements. As a result, Finland intends to continue studying the issues of measuring friction. Norway has

Winter Maintenance Performance Measurement Using Friction Testing
November 2009 65
also admitted that there is a lot more to learn about friction measurement, but the fact that measurements are being conducted will trigger further developments in measuring devices and methods for measuring slippery roads.
3.6.2 Different Results from Different Friction Devices
Finland’s latest tests show that different measuring equipments give different values. The C-trip method, the Pon-Cat TWO, and the Gripman all gave different friction values, with those from the C-trip method being the lowest. There is also a high linearity error (the difference is highly negative in the low friction values and highly positive in the high friction values).
Based on the various friction tests conducted, the Ontario Ministry of Transportation has identified various key factors that affect correlation between devices, including: Normal force (sufficient weight to maintain good surface contact on bumpy ice); tire wear on dry pavement; slip ratio (must be constant for consistent readings; angled wheel varies as vehicle turns); and, across-lane position where all devices must measure at the same position across the pavement.
3.6.3 Limitations of Friction Devices
Norway has indicated that deceleration devices could be dangerous to use on high traffic roads and in curves, and that they will only measure a small part of the road. There are few continuous measurement devices available worldwide at the moment and some of these devices are very costly.
From friction testing pilot projects, Alberta Transportation has learned that: rough pavement produces more erratic readings because the wheel bounces around more; measurements are not accurate through curves (as there is too much or too little side force on tire); there are no standards for manufacture and use of friction testing equipment; the Halliday equipment produced good qualitative and repeatable quantitative results; and the IceChek equipment produced good qualitative results, but they were not repeatable (poor quantitative data).
The Ministère des Transports du Québec indicated that it is important to pay special attention to the integration of friction data into the decision-making process, with consideration of the limits of the measurement devices. The needs of operational staff are important as well; having well defined goals of use and guidance for selecting among the different types of devices would be helpful.
IceChek Instruments Limited has acknowledged that some agencies have expressed concern about the equipment not measuring correctly on tight-radius curves for behind-the-truck

Winter Maintenance Performance Measurement Using Friction Testing
November 2009 66
models. However, this phenomenon is well-known and applies to other manufacturers’ products as well. While approaches and exits cannot be tested accurately unless a means of correcting the measurements is added to the apparatus, IceChek Instruments Limited has designed an attachment to eliminate the error on tight radius curves and this attachment will be available in late 2008.

Winter Maintenance Performance Measurement Using Friction Testing
November 2009 67
4 RESEARCH GAPS
Through the literature review and the information received from the current practices survey of Canadian and International road agencies, several research gaps were identified.
4.1 THOROUGH EVALUATION OF WINTER FRICTION DEVICES
The challenge is to develop simple, inexpensive and effective methods of measuring friction. The cost of continuous measuring friction meters is relatively high. As of 1998, the Norsemeter ROAR system (the most sophisticated device on the market at that point) was approximately $80,250 to $107,000. The most inexpensive devices at the time were about $2,140 each, but they could not be used continuously. Today, the cost of friction equipment continues to be one of the main obstacles preventing it from being widely adopted (See APPENDIX E Friction Device Cost Information).
It would be useful to define the potential use and the technical limitations of each friction device. A survey of operational staff should be conducted to see if there is a high interest in compiling this data.
There is also a need to develop a comprehensive cost-benefit analysis for different friction measurement devices so that the use of these devices can be more easily justified. A simplified cost-benefit analysis method was proposed by Nixon (1998), but it only accounted for the reduction in the use of de-icing chemicals and the cost to purchase and install the friction measurement device. Other factors such as savings in labour cost, fuel, and environmental impacts were excluded. There is a need to further develop an analysis tool that is more reflective of the real cost and benefit of using friction measurement devices.
It is also important to regard friction measurements as a component, rather than the main focus, of a winter maintenance strategy, and to research other potential sources of road information equally.
The development of computer-based integrated expert systems that include friction measurements will also play a significant role in the widespread use of friction measurement. According to Nixon (1998), the use of expert systems in winter maintenance in 1998 was limited, but there was definite potential for growth. Today, there has been progress made in this area but not all road agencies have the resources to adopt these systems.

Winter Maintenance Performance Measurement Using Friction Testing
November 2009 68
4.2 HARMONIZATION OF WINTER FRICTION MEASUREMENT
As mentioned earlier, there is a need to harmonize winter friction measurement in order to achieve better standards of acceptable winter road surface friction and to facilitate the comparison of winter friction data between different agencies. A general International Friction Index has already been developed, but the details are not specific to winter conditions.
Finland and Norway have indicated that it is difficult to harmonize friction measurements from different devices, despite having conducted testing of various friction devices over many years.
4.3 COMMUNICATION OF ROAD CONDITIONS TO ROAD USERS
Friction measurements also need to be translated so they can be easily understood by the public. Simply providing drivers with friction coefficients will not tell drivers how they should adapt their driving behaviour to the current road conditions (Al-Qadi et al., 2002).
The method currently used to convey road condition information to the public may also need to be evaluated. A study into the optimal method and level of communication with motorists could address several questions that concern road agencies:
• What service road users are most likely to use (for example, traffic information centres, telephone centres, radio broadcasts and websites);
• How often road users are using these services; • Why road users are using these services; • What information road users find most useful; and, • Which overall service road users find most useful.
When allocating resources toward informing road users, a cost-benefit analysis might assist road agencies. Methods that integrate websites with information from friction devices could be effectively compared to other options that provide information in problematic areas with variable message signs.
4.4 EVALUATION OF ACTUAL VEHICLE PERFORMANCE ON WINTER ROADS
Passenger vehicle tires typically carry loads in excess of 150 kg, causing them to depress into ice and snow surfaces. Many friction devices currently used have a light wheel load. This includes the T2GO, ViaFriction, British Pendulum Tester, Findlay Irvine GripTester, and Norsemeter ROAR. This may cause the devices to slide over ice and snow surfaces. The measuring tire contact pressure of the GripTester is estimated to be only 60 kPa whereas the contact pressure of passenger car tires is typically between 200 and 500 kPa.

Winter Maintenance Performance Measurement Using Friction Testing
November 2009 69
Due to this difference in wheel load, the friction values measured by these devices may be inconsistent with actual vehicle performance. It would be valuable to correlate the measured friction values with actual vehicle performance especially when braking and cornering.
4.5 FOCUS ON OPERATIONAL NEEDS
The international working session led by Al-Qadi et al. (2002) also identified a need to stay focused on operational needs and requirements. The level of detail required for friction measurements for airport runways may not be needed for highway winter maintenance activities. It was stated that “friction measurements that lead to credible, qualitative descriptions of winter pavement state (poor, fair, good; or red, orange, green, for example) may be satisfactory for many winter maintenance operations” (p.35).
This also speaks to the fact that the lessons learned from the air transport sector with regard to friction measurement cannot be necessarily transferred to the highway sector as they have different needs and requirements.
4.6 EUROPEAN EXPERIENCES
The COST Action 353 Winter Service Strategies for Increased European Road Safety Final Report (European Cooperation in the Field of Scientific and Technical Research, 2008) outlines many research gaps based on European current practices in the area of winter maintenance. The key research areas are summarized below. Readers are suggested to review that document for further details.
Area Research Gaps
Monitoring road surface condition
“There is a need for methods and equipments to describe and measure road condition in an objective way during the winter time. The description should also address the significance of road condition to deceleration, acceleration, steering, driving comfort and driving cost, as well as consequences for traffic safety, accessibility and pollution problems…”
De-icing materials and their effects “The effects of different spreading materials and in different magnitudes on slipperiness/friction need to be investigated in different conditions…”
Winter maintenance (training, guidelines, urban vs. rural)
“Improved and efficient training and education of the staff is required to ensure that new research results and new technologies are really used in practice…”

Winter Maintenance Performance Measurement Using Friction Testing
November 2009 70
Effects of weather on drivers and flow maintenance
“The key research question is driver behaviour during winter conditions…”
ITS solutions “The information systems need to be developed to be such to reach the driver just when he actually needs the information…”
Optimal winter strategies considering global warming
“New ecological sustainable strategies and operational technologies need to be developed for winter service ie winter maintenance and traffic management on European roads, based on advanced modelling, forecasting and harmonized monitoring procedures…”
4.7 SELECTION OF FRICTION DEVICES FOR CANADIAN APPLICATIONS
As mentioned earlier, a study that defines the potential uses and the technical limitations of each winter friction device could be highly useful. The literature review and current practices survey found several suggestions that could help guide future research into selecting friction devices for Canadian applications. Depending on the application and its requirements, the potential of using each friction device will vary. General considerations for friction device selection can be found in section 2.3.2.1 of this report.
For the application of providing information to road users, it is highly important that the friction device accurately simulate the actual tire-road interaction. Suitable devices could be deceleration based systems that can be fitted to actual vehicles such as the C-Trip and the Coralba and fixed slip trailer devices that have a heavily loaded measuring wheel like the SCRIM and the RT3.
Since the applications of identifying road condition criteria to trigger maintenance operations, monitoring the quality of operations, and developing new contractual clauses are inter-related, the same friction device should fulfil any requirement of all three applications. Using the same device for all three applications also removes the need for strong correlation between the outputs of different devices, which has been identified as a research gap previously (see section 4.2 on harmonization of winter friction devices). The friction device must be robust to withstand rough handling in the field by contractors, provide continuous friction measurement, be relatively inexpensive to purchase and operate, and simple to use. For spreader operations associated with anti-icing, de-icing and sanding, the ability to have the friction measuring device as part of the spreader vehicle to assist in the adjustment of material application is very desirable from the perspectives of quality control and effective use of resources. A suitable device would be the RT3, and the Norsemeter ROAR and English GripTester could fill this role as well when used without applied water, although the devices may have reliability issues.

Winter Maintenance Performance Measurement Using Friction Testing
November 2009 71
An assessment program over one Canadian winter would be useful, and potential devices for trial include the RT3, Norsemeter ROAR, the English GripTester, the ViaFriction, the SALTAR and the ASFT trailer.
For the application of research purposes, it would be beneficial to use a variable slip device to allow issues like available peak friction and friction-slip speed dependencies to be investigated. These issues are included in vehicle control systems such as ABS and Electronic Stability Control (ESC) as well as other new emerging technologies. The most likely devices that meet this requirement are the Japanese dynamic friction tester (DFT) and the Norsemeter ROAR, although the ROAR may have reliability concerns.

Winter Maintenance Performance Measurement Using Friction Testing
November 2009 72
THIS PAGE INTENTIONALLY LEFT BLANK.

Winter Maintenance Performance Measurement Using Friction Testing
November 2009 73
5 RECOMMENDATIONS FOR CANADIAN ROAD AGENCIES
There are two types of recommendations made in this section: potential considerations that could be included to enhance current practices, and future technical considerations that may be possible in the future. Some of the future technical considerations would require technical advances before implementation. Subsequent study phases can focus on the recommendations described below.
The recommendations in this section should take into account the research gaps identified in Section 4. Implementation would achieve the highest value and benefit to road agencies when certain issues related to research gaps have been adequately addressed, such as:
• Further research and development effort relating to winter friction devices, including more comprehensive cost-benefit analysis and identification of use and limitations;
• Clear identification of the specific needs of Canadian road agencies; and, • Development of a potential standardized method for the manufacture and selection of
friction devices for Canadian application.
5.1 ENHANCING CURRENT PRACTICES
5.1.1 Conducting Trial Evaluation of Non-Invasive Technology
Canadian road agencies may consider making trial evaluation of the Vaisala DSC111 non-invasive technology as it can independently detect various states (water, frost, snow, slush and black ice) and provide estimation of road surface grip level.
While this technology offers various advantages, as described in Section 2.3.3.2, it is noted that the device does not render the same precision as a grip wheel that is in actual contact with the road surface. Therefore, it is recommended that Canadian road agencies conduct trial evaluation of the technology to identify whether the data provided can be useful for the winter maintenance decision making process. For further consideration, the Vaisala device may also be useful for controlling spreader output (see Section 5.2.1 below).
The DSC111 has been tested by various road agencies and the findings have been described in Section 2.3.3.2. Canadian road agencies may consider corresponding with these agencies to share experiences and lessons learned

Winter Maintenance Performance Measurement Using Friction Testing
November 2009 74
5.1.2 Meeting Transportation Association of Canada’s Mandate for Salt Management and Environmental Management
Many agencies have used friction testing to help evaluate the efficiency of various anti-icing, de-icing, sanding and other material applications that are used as part of winter maintenance operations. The impact of salt on the environment is a growing concern. It is important to ensure that the use of salt is minimized and that contamination is minimized. To better align with TAC’s best practices of road salt management and other mandates related to environmental management, Canadian road agencies could consider the use of friction testing as a means to help test, evaluate and optimize the type of anti-icing or de-icing materials used, the application methods, and the amount of materials used.
5.1.3 Developing Winter Maintenance Management Strategies
Canadian road agencies may need to develop tools that integrate winter road conditions measurements, maintenance operations and communication to road users if they wish to utilize the benefits of friction testing in facilitating winter maintenance planning, evaluating the effectiveness of winter maintenance operations, and enhancing road safety by communicating road conditions to drivers,. The current practices in the Scandinavian countries, in particular, are useful examples for which Canadian road agencies can refer to and potentially model after. For example, the Winterman system is a Winter Management system used in Denmark. It does not use friction values, but it takes control from the moment the spreaders are called-out. The system also assists with the administration of the winter service and the initiation, control and monitoring of maintenance activities. The system also documents all events and activities, including related quantities and costs, by a structured log book. In Finland, information collected from road weather stations and optical friction sensors is fed into a central database which is accessible to contractors through a web-based interface and also communicates with the internet and traffic control devices to provide real-time information and warnings to road users. In addition to the internet, the Scandinavian countries communicate real-time warnings to road users via variable road message signs and/or variable speed limit signs as part of traffic management. These experiences suggest that road condition measurements, which may or may not include friction, could be used as an indicator for triggering and monitoring winter maintenance operations.
The components of a winter maintenance management system and relevant recommendations for an effective system are described in the COST Action 353 Final Report (European Cooperation in the Field of Scientific and Technical Research, 2008). The key components are shown on the next page. Canadian road agencies may consider the listed

Winter Maintenance Performance Measurement Using Friction Testing
November 2009 75
components in the planning and development of efficient and effective winter maintenance management systems that are tailored to the need of individual agencies.
Road Weather Information System Administrative Information System • weather forecasts • weather radar images • measuring stations on the roads and
mobile stations • icy road warning system
• personnel information • duty schedules • action plans • tour planning system • contracts
Call-out System Intelligent Equipment • incoming information handling • automated mobilisation and information
of service personnel • event registration
• data acquisition in vehicle • presentation of actual situation and action • detailed documentation • navigation and GPS controlled spreading
Documentation and Follow-up Link to Traffic Management • analysis of situations • winter maintenance statistics • index calculation • monitoring quality standards • invoicing support
• information for road users • contact to traffic information centre • variable message signs • internet, radio, TV access
Required before winter maintenance operation begins Relevant during winter maintenance operation
Information acquired during winter maintenance operation
The next steps for achieving the main objectives identified by Canadian road agencies are described in Sections 5.1.3.1 and 5.1.3.2, for enhancing communication to road users and evaluating contractor’s performance, respectively.
5.1.3.1 Communication of Road Conditions to Road Users – Next Steps
Before conducting a cost-benefit analysis on the information to be provided to users, it would be worthwhile to ask which parameters should be taken into account in such an analysis and survey the road authorities concerned to validate the availability of the data on which to base the analysis.
With regard to communicating measured road surface friction values to the public, the study findings indicated that this is not being carried out by road agencies currently. The main

Winter Maintenance Performance Measurement Using Friction Testing
November 2009 76
reason is related to interpretation issues. Therefore, many road agencies, including Canadian road agencies, are describing conditions in terms that are generally understood by the public.
Canadian road agencies that are considering the use of friction, in part to communicate to road users, could use a similar manner to the Swedish National Road Administration (as described in Section 3.5.2.5) where a color system is used to denote various ranges of road grip values for the identification of road conditions from where no problems are expected to be encountered (due to optimal road grip) to where drivers should avoid travel because of dangerous driving conditions (due to low road grip).
Alternatively, as shown by Finland’s experience with its Road Weather Information System, Canadian agencies could consider the development of algorithms that trigger various messages on roadside variable message signs, based on the real-time data collected through roadside sensors.
Both examples above indicate that it would be important for an integrated system to be in place where input parameters such as road condition measurements are connected to the system outputs, which include tools such as the Internet or variable roadside signs for the dissemination of information that are accessible to the general public.
5.1.3.2 Evaluating Performance of Contractors – Next Steps
Scandinavian countries, specifically Finland, Norway and Sweden, exercise a high level of reliance on their contractors in ensuring that the friction quality standards and other specifications are met. Should Canadian road agencies consider using friction as part of evaluating contractors’ performance, the main step would be the development of a quality management system. Such a system could consist of the following:
• Establishing trigger values, including friction values, to define winter maintenance standards. A device selected for the identification of criteria to trigger operations should also be used for monitoring the quality of operations (both by the contractor and the road agency) to avoid the need for harmonizing friction values from the use of various devices.
• Establishing contracts that clearly define roles and responsibilities of the road agency and the contractor. Within this context, contractors may be required to have and comply with quality management standards such as ISO 9001.

Winter Maintenance Performance Measurement Using Friction Testing
November 2009 77
• In the development of winter maintenance management systems, Canadian road agencies may consider systems similar to the Winterman used in Denmark. A main advantage of Winterman is its ability to automatically assign and track contractors’ actions, as well as the required materials and associated costs.
5.2 FUTURE TECHNICAL CONSIDERATIONS
5.2.1 Use of Friction Devices to Control Spreader Output
Many Canadian agencies reported using visual inspection as part of their winter maintenance operations. Tokunaga et al (2008) determined that similar visual inspections in Japan were highly vulnerable to winter maintenance personnel’s individual variations in experience and subjectivity, resulting in both underestimations and overestimations of the severity of the road conditions. This subjectivity lead to over-application of material in some areas and in other areas in need of treatment, under-application or no application at all.
Using friction values as an objective measure of road condition may lead to more efficient and effective use of anti-icing agents and other materials with regard to “where to apply treatment”. Trailer based systems have significant potential to optimise application of anti-icing agents by allowing operators to adjust spreader output at locations where maintenance is most needed. The continuous friction devices that are able to record friction versus distance or are compatible with tools like Global Positioning System (GPS) may be able to record friction continuously over long distances and transmit the data to spreader vehicles.
The spreader vehicle would be able to start spreading materials at the same spot where the friction level does not meet the acceptable threshold value, and stop spreading when the friction level exceeds it.
5.2.2 Application of Thermal Mapping
Thermal mapping can enhance a road weather information system as it determines surface temperature relationships across an entire road network as compared to conditions at specific locations where sensors are installed in a road weather information system. Through the use of thermal mapping, potentially dangerous road sections can be identified. This capability can complement friction testing and other winter maintenance strategies by drawing attention to potentially problematic areas. The technology could be trialled on a problematic road section

Winter Maintenance Performance Measurement Using Friction Testing
November 2009 78
to determine if other Canadian regions with similar geographic and climatic conditions would benefit from its use. One additional benefit of thermal mapping is that it provides quantitative reference data which may be used for communicating potential icy road conditions to road users.
5.2.3 Application of Advanced Technologies
The concept of intelligent vehicles providing real-time information on road condition offers many possibilities for preventive winter road maintenance. Since the potential of Vehicle Infrastructure Integration has inspired a significant amount of research, Canadian road agencies could consider forming an association with research groups working in this area so that Canada would be an early benefactor of this technology.
The next steps in order of priority would be:
• Follow up with the FRICTION project scheduled for completion by 2009.
• Initiate dialogue between road asset managers and the vehicle industry so that the parties are more aware of developments in the vehicle sensor field and how they may have possible application to winter maintenance of road networks.
• Formulate standard data format requirements / communication protocols for sensors fitted to vehicles for adoption by the vehicle industry, to assist in seamless transfer of real-time road condition information to asset management systems used by road authorities.
• Offer post-graduate scholarships to encourage University research in this area.
• Work with the car industry to perform trials to illustrate feasibility and potential of the concept.

Winter Maintenance Performance Measurement Using Friction Testing
November 2009 79
6 CONCLUSION
Canadian and International road agencies have taken many different approaches to winter maintenance operations, depending on climatic, environmental and social needs. Using friction testing as a tool of winter maintenance has been found to be beneficial by some road agencies, particularly in Finland (FinnRA), Norway (NPRA), Sweden (SNRA) and the State of Ohio (Ohio DOT). Friction values have been integrated into the winter maintenance operations of the Scandinavian countries listed above and have been used as a quality standard.
Since Canada is among the countries that face adverse winter weather conditions, winter maintenance operations are essential. Optimizing the efficiency of winter road management strategies is of high importance for safety reasons as well as economic and environmental reasons. Friction testing devices and other systems such as road weather information systems and various sensors are able to provide additional information about road conditions that is valuable for the winter maintenance decision making process.
This study completed a literature review and a current practices survey, and found that there exists a wide range of friction testing devices with different capabilities, and that the individual devices have advantages and disadvantages depending on the desired function and outcome.
Several recommendations have been made to enhance the current winter maintenance practices of Canadian road agencies, including: enhancing capability of road weather information systems, using friction measurements to optimize the type, amount and application methods of anti-icing and de-icing materials, and further planning and developing winter maintenance management systems. Future technical considerations include: using friction devices to control spreader output, applying thermal mapping technology, and applying advanced technologies such as Vehicle Infrastructure Integration.
Subsequent study phases can focus on the recommendations made in this report.

Winter Maintenance Performance Measurement Using Friction Testing
November 2009 80
THIS PAGE INTENTIONALLY LEFT BLANK.

Winter Maintenance Performance Measurement Using Friction Testing
November 2009 81
BIBLIOGRAPHY
Alberta Transportation, Highway Maintenance Guidelines and Level of Service Manual, June 2000
Al-Qadi, I., Loulizi, A., Flintsch, G., Roosevelt, D., Decker, R., Wambold, J. C.,and Nixon, W. Feasibility of Using Friction Indicators to Improve Winter Maintenance Operations and Visibility, National Cooperative Highway Research Program, Transportation Research Board of the National Academies, 2002
Andersson, M., Bruzelius, F., Casselgren, J., Gäfvert, M., Hjort, M., Hultén, J., Håbring, F., Klomp, M., Olsson, G., Sjödahl, M., Svendenius, J., Woxneryd, S., and Wälivaara, B., Road Friction Estimation: IVSS Project Report, Intelligent Vehicle Safety Systems, 2007
Andresen, A., and Wambold, J. C., Friction Fundamentals, Concepts, and Methodology, Transport Canada: TP 13837E, October 1999
Arnberg, P.W., and Sjögren, L., Nordiska friktionsmätare, VTI Meddelande 333, Statens Vag-och Trafikinstitut, Linköping, 1983
Asano, M., The Possibility of Implementing the Management Cycle of Winter Maintenance by Performance Measurement, Civil Engineering Research Institute for Cold Region (CERI), Presentation from the 7th International Symposium on Snow Removal and Ice Control Technology, 2008
Asano, M., and Tokunaga, R. A., The Possibility of Implementing the Management Cycle of Winter Maintenance by Performance Measurement, Transportation Research Board E-C126: Snow08-007, pp 499-511, 2008
Austroads, Guidelines for the Management of Road Surface Skid Resistance, Austroroads, 2005
Bergstrom, A., Winter Maintenance and Cycle Ways, Stockholm: KTH, Civil and Architectural Engineering, 2002
BMT Fleet Technology Limited, Preliminary Investigation of Friction-Measuring Devices for Winter Surfaces: Final Report, Ontario Ministry of Transportation, 2006
Cardno, C. A., Vehicle Infrastructure Integration Test Beds Planned for Detroit, American Society of Civil Engineers, Civil Engineering Vol. 77 No. 9, pp 42-43, 2007

Winter Maintenance Performance Measurement Using Friction Testing
November 2009 82
Center for Transportation Research and Education, Highway Maintenance Concept Vehicle Final Report: Phase 3, Iowa State University, 2001
Clarke, M., Dravitzki, V., and Cenek, P., Development of the Safe Application and Usage of Calcium Magnesium Acetate as an Anti-icing Agent Under New Zealand Conditions, World Road Association – PIARC: Proceedings, 11th PIARC International Winter Road Congress, 2002
Cloutier, M., and Donaldson, L., Applicability of Friction Measurements in Ontario, 2006-2007 Winter Maintenance Technology Program, Ontario Ministry of Transportation, 2007
CTC & Associates LLC and WisDOT Research and Communication Services Section, Using Friction Measurements to Gauge Winter Maintenance Performance, Clear Roads Pooled Fund Study, 2007
Dahlen, J., and Vaa, T., Winter Friction Project in Norway, Transportation Research Record No. 1741: Advances and Issues in Snow-Removal and Ice-Control Technology, pp 34-41, 2001
Deffieux, J. C., Towards International Harmonisation of Friction Measurements, International Airport Review, Vol 8 issue 1, pp 51-57, 2004
Dupont, P., and Bauduin, A., Managing Road Pavement Skid Resistance, Bulletin des Laboratoires des Ponts et Chaussées Ref 4521, pp 159-168, 2005
Erdogan, G., Alexander, L., Agrawal, P., and Rajamani, R., Automated Winter Road Maintenance Using Road Surface Condition Measurements, Minnesota Department of Transportation, MN/RC 2007-37, 2007
European Cooperation in the Field of Scientific and Technical Research, COST Action 353 Winter Service Strategies for Increased European Road Safety Final Report, 2008
Feng, F., Fu, L., and Perchanok, M. S., Evaluation of Two New Vaisala Sensors for Road Surface Conditions Monitoring, University of Waterloo and Ontario Ministry of Transportation, 2007
Fleege, E.J., Wambold, J.C., and Radó, Z., Variable Slip Friction Measurement Techniques for Snow and Ice Operations Transportation Research Board Snow Removal and Ice Control Technology Conference 16 Proceedings, pp 92-100, 1997

Winter Maintenance Performance Measurement Using Friction Testing
November 2009 83
Haavasoja,, T. Haavisto, V., Nylander, P., Pilli-Sihvola, Y., and Toivonen, K., New Approach to Road Weather: Measuring Slipperiness. SIRWEC 2006: XIII International Road Weather Conference, 2006
Henry, J. J., National Cooperative Highway Research Program (NCHRP) Synthesis 291: Evaluation of Pavement Friction Characteristics - A Synthesis of Highway Practice, Transportation Research Board NCHRP Synthesis 291, 2000
Höyssä, M., Jääskö, J., Karjalainen, J., Lappalainen, H., Leppänen, A., Penttinen, O., Salmenkaita, J., Tarkkanen, A., Toivonen, S., and Tolonen, H., Winter Road Maintenance: Policy 2001, Finnish National Road Administration Strategic Planning, 2001
Jamieson, N., and Dravitzki, V., Management of Skid Resistance under Icy Conditions, International Safer Roads Conference, 2005
Katko, K., Goals and Methods of Winter Maintenance in Finland, Transportation Research Record: No 1387, 1993
Kennedy, W., and Hager, A., Severe Winter Weather Impacts on Urban Pavements, 7th International Conference on Managing Pavement Assets: Paper 33-99, 2008
Lund, B., Friction test, Comparative testing with 3 different equipments carried out during the summer 1996, Report 82 Road Directorate, Danish Road Institute, 1997
Maeda, C., Kawamura, A., and Nakatsuji, T., Classification of the Road Surface in Winter by using the Motion Data of the Probe Vehicles, World Road Association – PIARC: Proceedings SURF 2004 5th Symposium on Pavement Surface Characteristics Roads and Airports, 2004
Mahoney, W. P., Petty, K. R., and Wagoner, R.R., Weather & Road Condition Product Improvements Enabled by Vehicle Infrastructure Integration (VII), National Council for Atmospheric Research, 2006
Maze, T. H., Albrecht, C., and Kroeger, D. A., Performance Measures for Snow and Ice Control Operations Transportation Research Board E-C126: Surface Transportation Weather; Snow and Ice Control, Snow08-051, pp 625-637, 2008
Mesher, D., and Proskin, S., Ice Road Assessment, Modelling and Management, Transportation Association of Canada: 2008 Annual Conference and Exhibition, 2008
Myllylä, J., and Pilli-Sihvola, Y., Floating car road weather monitoring, Proceedings of 10th World Congress on Intelligent Transport Systems, 2003

Winter Maintenance Performance Measurement Using Friction Testing
November 2009 84
Nakatsuji, T., Fujiwara, T., Hagawara, T., and Onodera, Y., Snow and Ice Control System Based on Slipperiness Data Transmitted by Drivers: Usefulness of Subjective Slipperiness Data, Transportation Research Record No. 1533, Maintenance Management and Winter Operations, pp 44-49, 1996
Nakatsuji, T., Hamada, N., and Kawamura, A., Extracting Slipperiness Component from Weather and Traffic Data for Winter Maintenance Operations, Transportation Research Record No. 1794: Safety and Maintenance Services, pp 65-71, 2002
Nakatsuji, T., Hayashi, I., Ranjitkar, P., Shirakawa, T., and Kawamura, A., Online Estimation of Friction Coefficients of Winter Road Surfaces Using Unscented Kalman Filter, Transportation Research Record No 2015, pp 113-122, 2007
Nixon, W., The Potential of Friction as a Tool for Winter Maintenance, Iowa Department of Transportation and Iowa Research Board, Final Report of Project TR 400, 1998
Noyce, D. A., Bahia, H. U., Yambó, J. M., and Kim, G., Incorporating Road Safety into Pavement Management: Maximizing Asphalt Pavement Surface Friction for Road Safety Improvements Draft Literature Review and State Surveys, Midwest Regional University Transportation Center, Traffic Operations and Safety (TOPS) Laboratory, 2005
Ohio Department of Transportation Office of Maintenance Administration Field Operations, Our Experience with the RT3 (Real-Time Traction Tool), 2008
Patte, L., Accidents due to loss of skid resistance: The skid resistance-road safety relationship and preliminary intervention analysis, Bulletin des Laboratoires des Ponts et Chaussées Ref 4519, pp 169-178, 2005
Perchanok, M. S., An Approach to Terrain Classification to Improve Road Condition Forecasts of Maintenance Decision Support Systems, Transportation Research Board E-C126: Snow08-039, pp 337-350, 2008
Perchanok, M. S., Friction Based Quality Assurance Measures for Snow Clearing Operations, PIARC Winter Road Conference, 1998
Petty, K. R., and Mahoney III, W.P., Enhancing Road Weather Information Through Vehicle Infrastructure Integration, Transportation Research Record: Journal of the Transportation Research Board, No. 2015, pp 132-140, 2007

Winter Maintenance Performance Measurement Using Friction Testing
November 2009 85
PIARC Technical Committee C3.4 Winter Maintenance, Snow and Ice Databook - 2006 Edition, 2006
PIARC Technical Committee C3.4 Winter Maintenance, Increasing Customer Orientation in the Winter Maintenance of Roads, 2008
Pilli-Sihvola, Y., New Information for Road Maintenance – Pilot Study on Friction, Tie & Liikenne, 2007
Sommer, B., The Danish Winter Maintenance Management System, Road Directorate, Ministry of Transport Denmark, 2007
Strong, C. K., and Shi, X., Integrating Weather into Transportation Operations: A Utah Department of Transportation Case Study, Transportation Research Board E-C126: Weather08-005, pp 318-333, 2008
Tanda, W. K., and Piotrowicz, G., Vehicle Infrastructure Integration: More Than a Very Intriguing Idea, ITE Journal, 2007
Technical Research Centre of Finland (VTT), Intelligent Tyre for Accident-Free Traffic, Final Report, European Community “Information Society Technology” Programme (1998-2002), Deliverable D22, 2005
Tilley, J., Kroeber, S., Green, J., Clonch, D., and Halliday, D. Measurements of Pavement Condition and Road Weather Environment Within North Dakota Using a Tow-Hitch Mount Road Grip Tester, Transportation Research Board E-C126: Snow08-016, pp 364-378, 2008
Tokunaga, R., Funahashi, M., Takahashi, N., and Asano, M., A Feasibility Study on Friction for Winter Road Management, Transportation Research Board E-C126: Snow08-020, pp 352-363, 2008
Tokunaga, R., Funahashi, M., Takahashi, N., and Asano, M., Feasibility Study on Friction for Winter Road Management, Presentation for the Fourth National Conference on Surface Transportation Weather and the Seventh International Symposium on Snow Removal and Ice Control Technology, Civil Engineering Research Institute for Cold Region, P.W.R.I., Japan, 2008
Transportation Association of Canada, Syntheses of Best Practices Road Salt Management – 9.0 Winter Maintenance Equipment and Technologies, 2003

Winter Maintenance Performance Measurement Using Friction Testing
November 2009 86
Vaa, T., and Hol, I., Follow-Up Study of Winter Standard as a Research and Development Project, Transportation Research Board E-C126: Snow08-042, pp 304-317, 2008
Vaa, T., Methods for Measuring and Reporting Winter Maintenance Activities, Transportation Research Record No. 1741: Advances and Issues in Snow-Removal and Ice-Control Technology, pp 152-158, 2001
Vaa, T., and Sivertsen, Å., Winter Operations in View of Vision Zero, Transportation Research Board E-C126: Snow08-041, pp 16-26, 2008
Wallman, C. G., and Åström, H., Friction Measurement Methods and the Correlation between Road Friction and Traffic Safety: A Literature Review, Swedish National Road and Transport Research Institute, Project Code 80435, 2001
Wallman, C. G., Wretling, P., and Oberg, G., Effects of Winter Road Maintenance: State of the Art, Swedish National Road and Transport Research Institute, VTI Report 423A,1997
Wambold, J. C., Henry, J. J., Antle, C. E., and Radó, Z., International PIARC Experiment to Compare and Harmonize Texture and Skid Resistance Measurements, The World Road Association (PIARC) Technical Committee on Surface Characteristics C.1, 1995
Wambold, J. C., Henry, J.J., and Andresen, A., International Runway Friction Index (IRFI) Development Technique and Methodology, Transport Canada: TP 14061E, 2001
Wambold, J.C., Henry, J.J., and Radó, Z., Friction Measurement Techniques for Snow and Ice Road Operations, World Road Association – PIARC: Proceedings, 11th PIARC International Winter Road Congress, 2002

Winter Maintenance Performance Measurement Using Friction Testing
November 2009 A-1
APPENDIX A
LITERATURE REVIEW SUMMARIES

Winter Maintenance Performance Measurement Using Friction Testing
November 2009 A-2
Table A-1 lists the documents reviewed and the page number of the summary describing each one.

Winter Maintenance Performance Measurement Using Friction Testing
November 2009 A-3
Title Year of Publication
Canadian/ International Page
TOPIC: Feasibility of Using Friction Measurements to Guide Winter Maintenance Activities
Measurements of Pavement Condition and Road Weather Environment Within North Dakota Using a Tow-Hitch Mount Road Grip Tester
2008 International A-6
A Feasibility Study on Friction for Winter Road Management 2008 International A-8
Using Friction Measurements to Gauge Winter Maintenance Performance 2007 International A-9
Automated Winter Road Maintenance Using Road Surface Condition Measurements 2007 International A-10
Online Estimation of Friction Coefficients of Winter Road Surfaces Using Unscented Kalman Filter 2007 International A-11
New Approach to Road Weather: Measuring Slipperiness 2006 International A-12
Feasibility of Using Friction Indicators to Improve Winter Maintenance Operations and Mobility 2002 International A-14
Friction Measurement Techniques for Snow and Ice Road Operations 2002 International A-17
The Potential of Friction as a Tool for Winter Maintenance 1998 International A-19
Variable Slip Friction Measurement Techniques for Snow and Ice Operations 1997 International A-21
TOPIC: Friction Measurement for Improving Winter Maintenance Practices
An Approach to Terrain Classification to Improve Road Condition Forecasts of Maintenance Decision Support Systems 2008 Canadian A-22
Applicability of Friction Measurements in Ontario 2007 Canadian A-24
Preliminary Investigation of Friction-Measuring Devices for Winter Surfaces: Final Report 2006 Canadian A-26
Winter Operations in View of Vision Zero 2008 International A-28
Management of Skid Resistance under Icy Conditions on New Zealand Roads 2006 International A-30
Methods for Measuring and Reporting Winter Maintenance Activities 2001 International A-32
Winter Friction Project in Norway 2001 International A-33
Effects of Winter Road Maintenance 1997 International A-35

Winter Maintenance Performance Measurement Using Friction Testing
November 2009 A-4
Title Year of Publication
Canadian/ International
Page
TOPIC: Winter Maintenance - General
Performance Measures for Snow and Ice Control Operations 2008 International A-36
COST Action 353 Winter Service Strategies for Increased European Road Safety Final Report
2008 International A-37
Ice Road Assessment, Modeling and Management 2008 Canadian A-39
The Possibility of Implementing the Management Cycle of Winter Maintenance by Performance measurement
2008 International A-40
Integrating Weather into Transportation Operations 2008 International A-42
Follow-Up Study of Winter Standard as a Research and Development Project
2008 International A-44
Severe Winter Weather Impacts on Urban Pavements 2008 International A-46
Goals and Methods of Winter Maintenance in Finland 2006 International A-47
Snow and Ice Databook, 2006 Edition 2006 International A-48
Syntheses of Best Practices Road Salt Management – 9.0 Winter Maintenance Equipment and Technologies
2003 Canadian A-50
Extracting Slipperiness Component from Weather and Traffic Data for Winter Maintenance Operations
2002 International A-52
Snow and Ice Control System Based on Slipperiness Data Transmitted by Drivers: Usefulness of Subjective Slipperiness Data
1994 International A-53
TOPIC: Friction - General
Incorporating Road Safety into Pavement Management: Maximizing Asphalt Pavement Surface Friction for Road Safety Improvements Draft Literature Review and State Surveys
2005 International A-54
Guidelines for the Management of Road Surface Skid Resistance
2005 International A-56
Managing Road Pavement Skid Resistance 2005 International A-58

Winter Maintenance Performance Measurement Using Friction Testing
November 2009 A-5
Title Year of Publication
Canadian/ International
Page
Accidents Due to Loss of Skid Resistance: The Skid Resistance-Road Safety Relationship and Preliminary Intervention Analysis
2005 International A-59
Towards International Harmonisation of Friction Measurements 2004 International A-60
Friction Measurement Methods and the Correlation between Road Friction and Traffic Safety: A Literature Review.
2001 International A-61
International Runway Friction Index (IRFI) Development Technique and Methodology
2001 International A-63
Evaluation of Pavement Friction Characteristics - A Synthesis of Highway Practice
2000 International A-64
Friction Fundamentals, Concepts, and Methodology 1999 International A-65
International PIARC Experiment to Compare and Harmonize Texture and Skid Resistance Measurements
1995 International A-67
TOPIC: Vehicle Infrastructure Integration
Vehicle Infrastructure Integration: More Than a Very Intriguing Idea
2007 International A-69
Vehicle Infrastructure Integration Test Beds Planned for Detroit 2007 International A-71
Weather & Road Condition Product Improvements Enabled by Vehicle Infrastructure Integration (VII)
2006 International A-72
Enhancing Road Weather Information Through Vehicle Infrastructure Integration
2006 International A-73

Winter Maintenance Performance Measurement Using Friction Testing
November 2009 A-6
Report Summaries
TOPIC: Feasibility of Using Friction Measurements to Guide Winter Maintenance Activities
Title: Measurements of Pavement Condition and Road Weather Environment Within North Dakota Using a Tow-Hitch Mount Road Grip Tester
Authors and Date: Jeffrey S. Tilley, Scott S. Kroeber, Jennifer Green, Diana Clonch, Don Halliday, 2008
This report presents a study that explored the feasibility of using Halliday Technologies Inc.’s RT3 unit to measure friction. The study was performed by the University of North Dakota, the Ohio Department of Transportation, Halliday Technologies Inc., the Rural Geospatial Innovations program, and the Aurora Program. The RT3 test wheel is 15-inches and is mounted at an angle of 1.75 degree. There is an electrical load cell within the hub which measures the lateral force. The final output is a Halliday Friction Number (HFN) displayed numerically and as a coloured light. In 2001, RT3 units were installed with GPS vehicle location devices on dumptrucks and tested for a year. The RT3 units were found to provide consistent repeatable results for data including: date, time, speed, latitude, longitude, road temperature, air temperature, and Halliday Friction Numbers. Further tests were performed in controlled conditions and throughout the state of Ohio. The measured HFN values were found to accurately portray the pavement condition. In 2006 and 2007, tests were also performed in North Dakota as the winter conditions there are more severe. Pavement temperature is collected by an infrared remote sensor and air temperature is collected by a thermistor. These sensors make up the Commercial Vehicle Group Roadwatch SS system. The RedHen GPS-video system was used to collect video and geospatial data. The ThomTech GPS-AVL (Global Positioning System – Automated Vehicle Location) system was installed in the pick-up truck that was used in the tests. This device transmits information from the RT3 unit and RoadWatch SS sensors, which measure pavement temperature and air temperature as well as geospatial information and vehicle speed and direction, to a database server. The measurements revealed that the measured HFN values depended on both vehicle speed and pavement temperature. More specifically, it was found that there is a slightly negative

Winter Maintenance Performance Measurement Using Friction Testing
November 2009 A-7
relationship between the HFN value and the pavement temperature. When the RT3 measurements are compared with the video footage, the change in traction is reflective of the road condition and is accurate on the order of 15 metres. In summary, this report addresses all of the three study’s objectives.
Meeting Study Objectives Y/N
Instruments and equipment for winter road condition measurements? Y
Quantification of winter road condition measurements? Y
Research gaps? Y

Winter Maintenance Performance Measurement Using Friction Testing
November 2009 A-8
Title: A Feasibility Study on Friction for Winter Road Management
Authors and Date: Roberto A. Tokunaga, Makoto Funahashi, Naoto Takahashi, Motoki Asano, 2008
This study examines the feasibility of implementing a quantitative system of measuring friction on winter roads in Japan. The current method of evaluating roads for snow and ice control is visual assessment by maintenance personnel. This is a subjective and inaccurate system of evaluation, and results in some road segments being overtreated and other slippery segments being left untreated. This causes a safety and efficiency issue. A quantitative friction measurement system would allow specific areas requiring treatment to be accurately targeted, and the correct amount of material to be spread. In Japan the bus-typed locked-wheel friction tester is the device used by the road authorities. The device tested in this study is the Continuous Friction Tester or Halliday RT3, which measures road friction constantly in real time. This device is also in use in the United States. Friction is determined by the device by measuring the axial force on a test tire offset by one or two degrees from the direction of travel. The resulting number is between 0 and 100 and is called the Halliday Friction Number. This device has the advantage that it is not dependent on deceleration so friction measurements are available continuously. However, the disadvantage is that the result is highly dependant on the vehicle’s steering angle. It is recommended not to display values outside of a 7 degree range. When the bus-type locked-wheel friction tester and RT3 were tested against each other, their results correlated strongly and are equally accurate in determining road slipperiness. The conditions tested were icy and wet surfaces. This study showed that using the RT3 in Japan is feasible. It will address the issue of over or under-application of materials, and monitor the effectiveness of applying these materials. It also opens up the door to a possible future “slip alert system” which could potentially predict road slipperiness based on friction measurements and weather forecasts in a GIS system. In summary, this report meets two of the study’s objectives.
Meeting Study Objectives Y/N
Instruments and equipment for winter road condition measurements? Y
Quantification of winter road condition measurements? Y
Research gaps? N

Winter Maintenance Performance Measurement Using Friction Testing
November 2009 A-9
Title: Using Friction Measurements to Gauge Winter Maintenance Performance
Author and Date: CTC & Associates LLC for Clear Roads Pooled Fund Study, 2007
The objectives of the report were: to gain a better sense of whether friction measurements are realistic, effective, and reliable winter maintenance performance indicators; and to highlight how transportation agencies are using friction measurements to evaluate road conditions. It was found that several Canadian, United States and international highway agencies are utilizing or exploring friction measurements in winter maintenance operations or performance measurement. Five provincial and state transportation agencies’ experiences with the RT3 Real Time Traction Tool, a friction measurement device, are reviewed and highlighted. The report also summarizes six U.S. and international research papers, four of which have been reviewed and summarized by Opus Hamilton in this report. Thus, the summary of these papers are not included in this section. It was found that the content of the other two papers were redundant as the information had already been covered by other papers reviewed in this report. The RT3 measures road surface friction under winter conditions using an auxiliary wheel that can be attached underneath or behind a vehicle. Ohio and Virginia have used the RT3 in their operations to determine when and how to treat roads and bridges that have the potential to form black ice or when freezing rain is transitioning to ice and to allow maintenance managers to see where improvements could be made to the winter maintenance process. Utah and Ontario have tested the RT3 and are in process of determining how to incorporate it into their operations, while Wyoming has only used it for research purposes. All agencies appear to be satisfied with the measurements and capabilities of the RT3. In summary, this report meets all but one of the objectives for this study. It does not highlight any research gaps that have been identified in the reviewed papers.
Meeting Study Objectives Y/N
Instruments and equipment for winter road condition measurements? Y
Quantification of winter road condition measurements? Y
Research gaps? N

Winter Maintenance Performance Measurement Using Friction Testing
November 2009 A-10
Title: Automated Winter Road Maintenance Using Road Surface Condition Measurements
Authors and Date: Gurkan Erdogan, Lee Alexander, Piyush Agrawal, and Rajesh Rajamani, 2007
The report details the findings of a project where a wheel based tire-road friction coefficient measurement system for snowplows was developed and evaluated. This friction measurement system is based on the assessment of lateral tire forces, and it has few moving parts and does not utilize any actuators. Hence, the authors concluded that it is reliable and economically feasible. Filtering and signal processing algorithms were also developed to address the key challenge of quickly detecting changes in the tire-road friction coefficient while removing the high levels of noise in measured force signals. In addition, the use of accelerometers and an intelligent algorithm removed the influence of driver steering maneuvers on the measurements, thereby creating a robust friction measurement system. During the second portion of the project, the developed friction measurement system was used for automated control of the chemical applicator on a snowplow. A feedback control system, using the developed friction measurement sensor and a pavement temperature sensor, was built and implemented on the snowplow. The implementation of the system was documented on video. In an early unsuccessful part of the project, the use of piezoelectric sensors to estimate tire-road friction coefficient and slip angle was also evaluated. The results from this part of the project are also described in the report. In summary, the report meets two of the objectives of this study.
Meeting Study Objectives Y/N
Instruments and equipment for winter road condition measurements? Y
Quantification of winter road condition measurements? Y
Research gaps? N

Winter Maintenance Performance Measurement Using Friction Testing
November 2009 A-11
Title: Online Estimation of Friction Coefficients of Winter Road Surfaces Using Unscented Kalman Filter
Authors and Date: Takashi Nakatsuji, Ikuko Hayashi, Prakash Ranjitkar, Tatsuo Shirakawa, and Akira Kawamura, 2007
This project extended a previously proposed generic algorithm-based offline method to an online model utilizing the unscented Kalman filter, a relatively new algorithm, to estimate the friction coefficient of winter road surfaces using vehicular motion data. This data is measured by a probe vehicle equipped with a GPS device and a motion sensor. The unscented Kalman filter makes it possible to estimate friction coefficients in real time while keeping the core vehicular motion model unchanged. The paper describes the Kalman filter theory, explains why conventional feedback techniques such as the extended Kalman filter cannot be used to estimate friction coefficients, and illustrates the usefulness of this new unscented filter. It also describes numerical experiments that validated the computational efficiencies of this proposed new method of estimating friction coefficient. It was found that the friction coefficients estimated with the new technique were fairly close to those measured in the field. This project meets two of the objectives of this study.
Meeting Study Objectives Y/N
Instruments and equipment for winter road condition measurements? Y
Quantification of winter road condition measurements? Y
Research gaps? N

Winter Maintenance Performance Measurement Using Friction Testing
November 2009 A-12
Title: New Approach to Road Weather: Measuring Slipperiness
Authors and Date: Yrjo Pilli-Sihvola, Kimmo Toivonen, Taisto Haavasoja, Ville Haavisto, Pauli Nylander, 2006
This report presents the results of field testing of two remote optical sensors: Vaisala Remote Road Surface State Sensor DSC111 and Vaisala Remote Road Surface Temperature Sensor DST111. The “Remote” in the name refers to the fact that there is no installation required on the road surface itself. These devices can detect water, ice and white ice distinctly and the quantities of each. The DSC111 works by detecting the reflected scattered light of an infrared beam of light directed at the road surface. Since white ice, black ice, and water absorb different wavelengths it is possible to determine which is on the road surface and in what thickness. The DST111 works by measuring infrared radiation between the device and the surface of the road. Any non-balance of radiation indicates a difference in temperature between the device and the road surface. Testing was performed in Finland and the UK in 2004 and 2005. The DSC111 was found to be sensitive to 10μm thickness. Wet conditions are clear and icy conditions reduce the coefficient of friction at thicknesses of around 30 μm. The results obtained from the DSC111 were found to agree with human observation. It was found to be important to carefully aim the device precisely at the wheel tracks as different conditions of slipperiness are experienced at the centre of the lane than in the wheel tracks. The DSC111 can determine the friction value from the data it collects. In comparison with friction directly measured by a locked wheel apparatus, the root mean square difference in friction number was only 0.07 units so they very closely agreed. The results obtained in this study show that the DSC111 is a useful piece of equipment and could be included in road weather stations to: help make decisions in winter road maintenance; initiate management actions; control changeable message signs; adapt speed limits to road weather; control maintenance; provide drivers with information; and control automatic de-icing systems. More research will be conducted in future seasons.

Winter Maintenance Performance Measurement Using Friction Testing
November 2009 A-13
In summary, this report covered all of the study’s objectives.
Meeting Study Objectives Y/N
Instruments and equipment for winter road condition measurements? Y
Quantification of winter road condition measurements? Y
Research gaps? Y

Winter Maintenance Performance Measurement Using Friction Testing
November 2009 A-14
Title: Feasibility of Using Friction Indicators to Improve Winter Maintenance Operations and Mobility
Authors and Date: Imad Al-Qadi, Amara Loulizi, Gerardo Flintsch, Daniel Roosevelt, Rand Decker, James Wambold, and Wilfrid Nixon, 2002
The paper first discusses friction measurements, indices, and models. Included in this discussion is a basic explanation of friction, an introduction of the International Friction Index (IFI), which is a well-defined universal friction scale that has been used to harmonize friction measurements by different devices, and summary of the Penn State model and the Rado Friction model, which have been used to estimate friction coefficients with other roadway data. It then provides a brief history of friction measurements under winter conditions at airports. Airport runway projects use equipment that measures to a greater resolution and the equipment is often too expensive to be used as an operational tool for roadway agencies. However, the majority of friction measurement research projects have taken place at airports. Thus, the technical information from these projects still forms the foundation for most of the research on winter highway friction measurements. Results of experimental research on highway friction measurements under winter conditions are then described. Specifically, the paper reports on studies that have examined the effect of tires and pavement surfaces on friction measurements under winter highway conditions, the relationship between winter friction values and vehicles crashes, and the use of artificial intelligence to predict friction coefficients under winter conditions. Included in this overview are: • The Finnish National Road Administration’s (FinnRA) finding that a grooved tire is the
best measuring wheel on snow-covered surfaces; • FinnRA’s experience with their mobile weather monitoring system and friction meter; • The Swedish Road and Transport Research Institute’s research work examining the
susceptibility of different road pavement surfaces to icing; • A study conducted in Hokkaido, Japan to correlate skid resistance values on snow-
and ice-covered road surfaces to traffic accident rates; • A study in Japan which aimed to predict friction coefficients under winter conditions
using artificial intelligence procedures based on data from experienced drivers.
This is followed by a detailed description of how different road agencies have been using friction measurements in their winter maintenance operation decision-making. Those

Winter Maintenance Performance Measurement Using Friction Testing
November 2009 A-15
practices related to measuring winter road conditions have been included in SECTION 2.2.2 of this report. In summary, it is found the use of friction measurements in winter maintenance in European countries, especially Scandinavian countries, are more advanced than in North America and Japan. Special emphasis is placed on the experiences of Finland, Norway, and Sweden. The paper then proposes three ways to use friction measurements to evaluate winter maintenance performance: the threshold level approach, the contaminant classification approach, and the spatial homogeneity approach. More details are about these methods are included in the Literature Review section of this report. A discussion of the use of friction measurements to evaluate different types of de-icing materials and pavement materials is also incorporated in the paper by Al-Qadi et al. The paper also presents information gathered in a working session during which twenty-five national and international experts in the field were interviewed about the type of equipment, practices, and techniques being used to obtain friction indicators. The five principle findings that emerged from the working session are: 1. Finland has been successfully using friction measurement for 20 years as a decision
support tool and quality assurance measure for winter maintenance activities; 2. Friction measurements hold high potential as operational tools in winter maintenance
activities; 3. Friction measurements need to be translated so they can be easily understood by the
public; 4. The level of detail in friction measurements do not need to be high to meet the needs
and requirements of highway winter maintenance operations; and 5. Lessons learned from the air transport sector with regards to friction measurement
cannot be necessarily transferred to the highway sector as they have different needs and requirements.
Next, a discussion of the following practical techniques for friction measurement is provided: stopping distance; deceleration devices; locked wheel devices; side force devices; fixed slip devices; and variable slip devices. It is also suggested that automatic anti-lock braking systems and traction control systems on new vehicles may offer an opportunity to use such vehicles to gather information on the friction of the road surface. Based on a review of other studies, a comparison of these different field friction measurement techniques is also included. The findings indicate that deceleration and variable slip methods may be the most appropriate techniques for friction measurement under winter conditions.

Winter Maintenance Performance Measurement Using Friction Testing
November 2009 A-16
The authors also present four broad scenarios for the use of friction measurements in winter maintenance activities. These scenarios range from simply using friction measurements to determine when additional de-icing treatment is required and what the application rates for spreading snow and ice control materials should be (Scenario 1), to having records of friction measurements and location being transmitted in near-real-time from the snowplow/spreader vehicles to a central location where the information is processed by cell phone and radio (Scenario 4). In the latter scenario, the friction measurements can be used to alert both private and commercial drivers of the road conditions. To assess the feasibility of using different friction measurement techniques to assist winter maintenance operation and mobility and to evaluate the proposed scenarios, questionnaires were sent out to winter maintenance operators and field supervisors, as well as national and international experts in the field. The responses showed that most believed the use of friction measurement would improve winter maintenance operations. In particular, most respondents thought that “low cost, reliable friction measuring devices, complemented by other data such as pavement temperature, surface conditions, weather conditions, and air temperature, could be useful to allocate snow-fighting resources in real-time.” (p. 61). Of the four scenarios, Scenarios 4 and 1 were considered to be the promising ones with regards to improving winter maintenance operations decision-making. In terms of friction measurement technology, traction control system was the most promising technology, followed closely by deceleration and slip devices. The paper ends with two scenarios recommended for field testing to validate Scenarios 1 and 4 and to convert the findings into technology that enhance the efficiency and effectiveness of winter maintenance operations. In summary, all of the study’s objectives are covered in the paper.
Meeting Study Objectives Y/N
Instruments and equipment for winter road condition measurements? Y
Quantification of winter road condition measurements? Y
Research gaps? Y

Winter Maintenance Performance Measurement Using Friction Testing
November 2009 A-17
Title: Friction Measurement Techniques for Snow and Ice Road Operations
Author and Date: Prof. Dr. J.C. Wambold, Prof. Dr. J.J Henry and Dr. Zóltan Radó, 2002
This report discusses field studies that have been conducted at the NASA Wallops Flight Facility and in Iowa, Minnesota, Michigan and Norway using Norsemeter’s ROAR and later SALTAR to determine applicability of the equipment to snow & ice operations, reliability, and durability. The studies took place over a number of years. Data was collected concerning precipitation, pavement condition, pavement temperature, air temperature, speed of the measuring device and the friction values. The equipment, measurement procedures and findings are described in detail. This preliminary research study shows that different contaminant conditions can be separated and the friction level can be evaluated to determine whether or not to salt, salt light or salt heavy. Also, a supervisor can evaluate the effectiveness of abrasives and/or chemicals applied. Preliminary testing using the ROAR system and the Rado model provided the three coefficients required to produce the friction-slip speed curve; µpeak (value of peak friction), Speak (value of slip speed at which the peak friction occurred) and C (a value that gives the shape of the curve, called the shape factor). These values were to be studied to see what is needed to determine the type of contamination and if salting is needed. In the second year of testing, the ROAR results were compared with results from two KJ Law ASTM E-274 skid trailers. The results were favourable but it was found that the ROAR unit lacked the durability required for practical implementation. The ROAR units measured satisfactorily but did not do well structurally. This led Norsemeter, the makers of ROAR, to develop a less expensive unit called SALTAR that incorporated ruggedness in their design. Testing was then carried out at the NASA Wallops Flight Center on the following devices:
• USFT – US version of the Airport Surface Friction Tester from Sweden with two different tires.
• SALTAR – A friction tester designed by Norsemeter for salt trucks. • SFT79 – A 1997 Saab Friction Tester owned by Transport Canada. • BV11 – A Swedish designed friction tester owned by FAA. • RFT – Runway Friction Tester by K.J. Law owned by FAA. • E274 – An ASTM E274 skid tester from VADOT
It was found that the different testers showed up to 50% variation in measured friction values. SALTAR always gave results in the range of the other testers; however it measured higher

Winter Maintenance Performance Measurement Using Friction Testing
November 2009 A-18
friction values with increased speed in all but a few cases. From the results, it was expected that SALTAR will give good friction measurements at low friction and low speeds. The testing for SALTAR was continued at the Jack Garland Airport in North Bay, Ontario but results were affected by poor winterization of the equipment. Testing continued in Norway where SALTAR results were compared with ROAR results. Initially the SALTAR results were low compared to ROAR but with calibration, it was felt that the SALTAR results were satisfactory. The ROAR and SALTAR measuring devices are described in detail with accompanying photographs in this report. Results from various testing that took place are outlined graphically. Further development and testing for SALTAR is outlined. In summary, the report addresses all of the objectives for this study.
Meeting Study Objectives Y/N
Instruments and equipment for winter road condition measurements? Y
Quantification of winter road condition measurements? Y
Research gaps Y

Winter Maintenance Performance Measurement Using Friction Testing
November 2009 A-19
Title: The Potential of Friction as a Tool for Winter Maintenance
Author and Date: Wilfrid Nixon, 1998
This report examines the possibility of using friction as an operational tool in winter maintenance, with emphasis on the relationship of friction to traffic volume and speed, and accident rates. It also outlines steps to address current knowledge gaps and to “bring friction from its current state as a research tool to full deployment as an operational tool” (p.ii). The report explains the two general categories of friction measurement devices. The first utilizes an instrumented wheel mounted to a vehicle. The second uses accelerator devices to measure the deceleration of a vehicle under full braking. Factors that affect friction measurement (e.g., the tread on the tire and tire material) are then discussed, followed by a recommendation that an international standard be developed specifically for winter road conditions to which to relate all friction measurements. The international PIARC standard, which has helped achieve a degree of uniformity between different friction testing devices, was developed in the absence of snow or ice on the road surface and is for fixed slip devices only. The results of several studies in which measuring friction was the primary determinant of maintenance performance were outlined. Key findings included: the potential to reduce the amount of de-icing chemical applied as more accurate friction information is acquired; the fact that friction values significantly increase over a five hour period after salting; and the discovery that sanding only provides short-term gains in friction. One particular study conducted by the Ministry of Transport of Ontario showed how friction can be a “useful research tool in developing new winter maintenance treatments” (p.14). Also included in the report is a discussion of Finland and Norway’s experiences using friction measurement as a way to set standards for winter maintenance. These experiences have been included in SECTION 2.2.2 of this report. In addition, the report reviews potential problems and issues with measuring friction, and recommends further research in the following areas: • Understand how friction deteriorates during a storm; • Examine how friction improves as the road is treated; • Develop models to determine if and how snow/ice scraping efforts can reduce the
need to apply de-icing chemicals;

Winter Maintenance Performance Measurement Using Friction Testing
November 2009 A-20
• Develop computer based expert systems that incorporate friction measurements, results of snow/ice scraping models, and data from on-board temperature sensors and RWIS systems to determine the optimum amount of de-icing chemical; and
• Refining the cost-benefit analysis of using friction measurements.
Included are suggested experiments that might be used to address some of these issues. The report addresses all of the objectives for this study as shown in the following table.
Meeting Study Objectives Y/N
Instruments and equipment for winter road condition measurements? Y
Quantification of winter road condition measurements? Y
Research gaps? Y

Winter Maintenance Performance Measurement Using Friction Testing
November 2009 A-21
Title: Variable Slip Friction Measurement Techniques for Snow and Ice Operations
Author and Date: E.J. Fleege, Minnesota Department of Transportation; J.C. Wambold, CRM Inc; Zoltan Rado, Norsementer, Norway, 1997
This report discusses a joint venture between Norway and the state of Minnesota in investigating the use of Norsemeter’s road analyzer and friction recorder (ROAR) for determining whether and how much to salt, as well as ROAR’s durability and reliability. ROAR is a device which measures the friction force of the road against a pavement friction measuring tire mounted to a trailer towed by another vehicle. Research was conducted between Minneapolis and St. Paul on different road surfaces and weather conditions. The computer in ROAR uses the Rado friction model for calculating peak friction, slip speed at peak friction and the relationship between the slip speed and the curve slope of the coefficient of friction. This investigation yielded positive results in that it confirmed that ROAR can be used to monitor road friction levels in real time and may be used for control of salting. It also demonstrated that the Rado model constants can be used to differentiate between contaminates such as salt and sand. As indicated in the following table, this report meets two of the three study objectives. The Norsemeter ROAR instrument is described in detail for measurement of winter road conditions, and a quantitative analysis of the data is presented. The report does not address any research gaps beyond plans to repeat the study the following winter.
Meeting Study Objectives Y/N
Instruments and equipment for winter road condition measurements? Y
Quantification of winter road condition measurements? Y
Research gaps? N

Winter Maintenance Performance Measurement Using Friction Testing
November 2009 A-22
TOPIC: Friction Measurement for Improving Winter Maintenance Practices
Title: An Approach to Terrain Classification to Improve Road Condition Forecasts of Maintenance Decision Support Systems
Authors and Date: Max S. Perchanok, 2008
This paper examines friction measurement from a different perspective: using friction measurement as an estimation of snow cover. Roadway Weather Information Systems (RWIS) are used on highways to monitor factors that affect snow accumulation, but the minimum scale required is 104 and below this, features cannot be detected. For example, forests, bridges, roadside vegetation, rock cut and shading are all too small. In 2002, Perchanok developed an equation to use friction coefficients measured from a continuous friction measuring device to estimate snow cover fraction as they are inversely related. The friction measurements were made using a Norsemeter variable slip friction trailer. This device measures the maximum friction coefficient in 29m sections. The three field areas tested were: 1) farm fields, 2) drumlins (hills), 3) cross-section of a forested area, glacial moraine and farm fields. All of the investigated areas were Ontario Winter Class I serviced, which meant they were plowed before 1.2cm of snow accumulated and then again at 1.2h, and salted or sanded at 1.8h intervals. The environmental information such as wind, temperature and precipitation were obtained from Environment Canada. In field area #1, results showed that different friction conditions develop depending on the relative orientation of the road to the direction of the wind. Field area #2 illustrated that landforms and vegetation that provide shelter from the wind result in higher friction levels. This effect is greatest when the highway is perpendicular to the direction of the wind. Field area #3 revealed that the differences in friction level between sheltered and exposed zones were small when snow first starts falling and wind speeds are low, and greatest when wind speeds are greater than 10 km/hr These conclusions were drawn following detailed statistical analyses of the acquired data. Using friction to model the fractional snow cover provides an opportunity for detailed analysis of the surface conditions. Even along a single plow route, snow cover is not uniform as the roadside terrain influences the snow cover. RWIS data is therefore useful in estimating snow cover between zones of similar terrain and within the same zone, but can only be used as an estimate in a different zone at low wind speeds.

Winter Maintenance Performance Measurement Using Friction Testing
November 2009 A-23
In summary, this paper addresses one of the study’s objectives.
Meeting Study Objectives Y/N
Instruments and equipment for winter road condition measurements? Y
Quantification of winter road condition measurements? N
Research gaps? N

Winter Maintenance Performance Measurement Using Friction Testing
November 2009 A-24
Title: Applicability of Friction Measurements in Ontario
Authors and Date: Matthew Cloutier and Laura Donaldson, 2007
This study took place in the Eastern Region of Ontario during the winter of 2006-2007 with the intent of exploring the applicability of winter friction testing. The objective of the study was to determine if a consistent correlation could be found between measured friction coefficients and road surface conditions since the development of a reliable, repeatable relationship could potentially lead to a provincial standard for friction-based performance measures.
The study provides a detailed overview of current winter maintenance practices in Ontario, Norway, and Ohio. Using research from Norway as a model, surface contaminants were divided into four categories to evaluate the accuracy and reliability of friction measurements: wet ice, hard/packed snow, slush/snow, and bare/wet pavement. The Ministry of Transportation borrowed two Traction Watcher One (TWO) devices from Norway, commenced testing in January 2007, and finished testing in March after collecting around 2,500 km of data. An investigation into calibrating the TWO with the Road Grip Tester used in Ohio was also performed, and several additional comparisons were carried out:
• two different pavement types, asphalt and concrete; and • two different regions of the same highway maintained by different contractors.
The study found that the results were quite encouraging in terms of the repeatability of the testing on different surface contaminants. Due to variation in the results for the slush/snow category, it recommends that any further research subdivide this category further into light snow, deep snow, light slush, and deep slush to help narrow the range of values recorded for this surface contaminant. The study found that the TWO and the Grip Tester have different sensitivity to changes in surface conditions, because they had different magnitudes despite showing peaks and valleys at the same locations. When comparing concrete to the asphalt test sections, the friction values appeared to be consistent. When comparing different regions maintained by different contractors, the test section of one region outperformed the other region throughout the study.
The report suggests that friction testing would provide valuable knowledge of roadway conditions during winter events, and that using GPS, visual maps can easily be produced. Additionally, in the future data could be transmitted in real-time to highway authorities and other road users, possibly by using the automatic vehicle locator (AVL) technology the Ontario Ministry currently uses for maintenance monitoring. The friction values could also be used as a form of performance management for contractors, for example, objectively defining bare pavement which is Ontario’s current performance management tool.

Winter Maintenance Performance Measurement Using Friction Testing
November 2009 A-25
The study concludes that the concept of measuring road performance during and after winter events with a quantifiable and objective friction measure aligns well with the strategic direction of the Ministry of Transportation. Overall, the study recommends that the Ministry continue to research friction testing to build confidence in the accuracy and repeatability of the results, so that friction measurements can have higher level use, like in operations planning and contract supervision.
In summary, this report addresses all three of the study’s objectives.
Meeting Study Objectives Y/N
Instruments and equipment for winter road condition measurements? Y
Quantification of winter road condition measurements? Y
Research gaps? Y

Winter Maintenance Performance Measurement Using Friction Testing
November 2009 A-26
Title: Preliminary Investigation of Friction-Measuring Devices for Winter Surfaces: Final Report
Authors and Date: BMT Fleet Technology Limited, 2006
This report was completed for the Ontario Ministry of Transportation with the intent of completing a survey of existing friction measuring devices and comparing the readings given by the devices with respect to basic winter surfaces such as bare ice and bare packed snow. It describes four general categories of devices (locked wheel testers, side force testers, fixed slip testers, and variable slip testers) and the principles used by each type of device to determine the friction value and discriminate between surface types.
The report outlines several criteria that should be used when selecting a friction measuring device. It starts by defining the end use of the friction information, stating that high impact uses include litigation situations, performance management for contractors, and establishing safe speed limits, and that medium impact uses include providing input to general public advisories and providing a quantitative scale for evaluating different winter maintenance technologies. Then it defines several technical requirements:
• applicability to a wide range of surfaces; • the effect of vehicle wheel tracks; • low scatter and high repeatability of the measurements; • time-stability, and recalibration requirements; • temperature-dependence; • speed-dependence; and • continuous measurement versus spot reading.
Practical issues include safety and the ability to collect data in traffic, mechanical simplicity and minimum maintenance required, and low cost.
Friction data analyses were completed on friction measurements by the Ontario Ministry of Transportation’s RUNAR variable slip device, the Halliday Griptester fixed slip device, and the NAC Dynamic Runway Friction Tester. Surface conditions of bare ice, bare packed snow, and wet pavement were compared using different sources of available data. Values and analysis are provided in the report. The report concludes that despite differing in several ways, the tested devices give relatively consistent values on bare ice and bare packed snow. All of the devices would be able to reliably distinguish between a bare wet surface and ice or snow, but none would be able to reliably distinguish between bare ice and bare packed snow.

Winter Maintenance Performance Measurement Using Friction Testing
November 2009 A-27
The report recommends that further analyses and focused testing should be expanded to consider non-uniform surfaces, the effect of loose snow, and the effect of variations in the thickness of ice or packed snow layers on a highway pavement. It also makes a general recommendation that safety implications of speed and the skidding of locked-wheel testers be considered, as well as the ability of the device to measure non-uniform surfaces like highways.
In summary, this report addresses all three of the study’s objectives.
Meeting Study Objectives Y/N
Instruments and equipment for winter road condition measurements? Y
Quantification of winter road condition measurements? Y
Research gaps? Y

Winter Maintenance Performance Measurement Using Friction Testing
November 2009 A-28
Title: Winter Operations in View of Vision Zero
Authors and Date: Torgeir Vaa, Age Sivertsen, 2008
This paper is about Norway’s Winter Operations project for Vision Zero Traffic Safety Lillehammer. In this project, priority is given to winter operations due to the high number of serious winter accidents that occurred on the National Road 36 in this area. The objective of the project is to “test possibilities for improvements in the winter operations by looking into the choice of strategy, operational methods, and level of effort and also systems for decision support”. More specifically, a new salting strategy is examined in this paper. Under the new strategy, salting is allowed for anti-icing purposes, the temperature limit for salting after a snowfall event is removed, roads can be treated to an ‘almost bare road’ condition (where the road is clear in the tracks but not at the edges) instead of to a completely bare condition, and fixed sanding (hot water and sand mixed together) is used for low temperatures. RWIS stations collect weather information, and precipitation is measured by an Optic Eye (using light beams) and a Tipping Bucket. The results of the new strategy reveal that there was a slight increase in salt usage. It was also recommended that more trials with fixed sanding be conducted. This project also tested tandem driving. In this case, a grader goes first with a front-mounted plow and a plowshare, and it is followed by a truck with a spreader with a front-mounted plow and a side-mounted plow. It was found that this method is more efficient after heavy snowfall on two-lane sections with a guardrail and evacuation passages, when ramps are plowed simultaneously with the main road, and in broad crossing areas with painted canalization. The downside is that there is a greater number of kilometres of plowing, making it more expensive. However, the application of “mechanical cleaning” of the roadway reduces the amount of salt required. The accident pattern revealed that crash barriers and reinforced winter maintenance was effective in reducing the number of serious accidents. However, as both measures were introduced simultaneously, the individual effects of each measure are unknown. Further trials on other four lane roads will be conducted.

Winter Maintenance Performance Measurement Using Friction Testing
November 2009 A-29
In summary, this report only addressed one of the study’s objectives.
Meeting Study Objectives Y/N
Instruments and equipment for winter road condition measurements? N
Quantification of winter road condition measurements? N
Research gaps? Y

Winter Maintenance Performance Measurement Using Friction Testing
November 2009 A-30
Title: Management of Skid Resistance under Icy Conditions on New Zealand Roads
Authors and Date: N. Jamieson, V. Dravitzki, 2006
Vehicle corrosion from the use of common salt as a de-icing agent in New Zealand led to the abandonment of this practice, and the introduction of calcium magnesium acetate (CMA) as a replacement. However, vehicle crashes occurring after CMA applications raised concerns about the safety risk of the chemical. This study, conducted during the winter of 2004, examined the effectiveness of CMA with respect to skid resistance. The instruments used were a British Pendulum Tester (BPT), a Central Laboratories’ GripTester, and a car for Locked-Wheel-Braking (LWB) tests. Baseline skid resistance data in wet and dry conditions was obtained using the GripTester on the state highways that had been treated with CMA in the previous winter of 2003. Tests were done after CMA was applied on five test road surfaces (fine and coarse graded chipseals, asphaltic concrete, slurry seal and open graded porous asphalt). It was found that skid resistance on wet roads varied rapidly over short distances, and that a wet-road condition can be similar to the skid resistance of a dry road at a nearby location. The LWB results showed that after CMA application, skid resistance lowered by 65 to 85 percent from the baseline dry-road values, while the GripTester and the BPT indicated that there was a decrease of 35 to 75 percent from the dry road. The stopping distance was increased by up to 50 percent. The GripTester results also showed that after applying CMA at night, skid resistance was 40% to 85% of the corresponding dry-road values. With time, skid resistance increased as the CMA dried or was drained off. The tests also revealed that the CMA was “tracked” or moved away by vehicles of approximately 1 km past the end points of night-time application. Within this 1 km section, skid resistance gradually increased towards the dry-road values. In addition, the LWB results demonstrated that skid resistance on dry roads did not vary significantly across the five test road surfaces. However, the dry-road skid resistance levels for the coarser textured surfaces of coarse chipseal, open graded porous asphalt, and slurry seal were higher than those of the smoother textured fine chipseal and asphaltic concrete. The GripTester and BPT tests also revealed that dewfall, or moisture from high humidity or light rain would partially ‘reactivate’ the CMA, yielding lower skid resistance values that are lower the dry-road conditions. In terms of the timing of the application, afternoon and night time applications of CMA are 5% better in terms of reducing risk.

Winter Maintenance Performance Measurement Using Friction Testing
November 2009 A-31
The author’s recommendations with regards to the use of CMA included the following: • Have signage to warn drivers of the effects of CMA on skid resistance; • Change the regional best practices to include assessing level of risk when applying
CMA, and develop a risk model that will take environmental conditions into account; • Investigate the effects of tracking of CMA; • Study the impact that different traffic conditions have on reducing or extending the
time for which road resistance is reduced after CMA is applied; and • Conduct further LWB tests for different speeds to determine how the effects compare
to those of dry and wet roads. In summary, this report addressed all of the study’s objectives.
Meeting Study Objectives Y/N
Instruments and equipment for winter road condition measurements? Y
Quantification of winter road condition measurements? Y
Research gaps? Y

Winter Maintenance Performance Measurement Using Friction Testing
November 2009 A-32
Title: Methods for Measuring and Reporting Winter Maintenance Activities
Author and Date: Torgeir Vaa, 2001
From 1997 to 2002, Norway undertook the Winter Friction Project to deal with practical, technical, and economic issues associated with increasing friction and improving road conditions for drivers during the winter. The project documented the performance of different friction improvement methods and existing winter maintenance practices on both salted and sanded roads. This report outlined the procedures used to measure friction at the project study sites. The project used four types of friction measurement devices: C-my, Kofriks, ROAR Mark I and Mark II, and OSCAR. The report included explanations of how these devices were used. Only ROAR and OSCAR were used to document the performance of different friction improvement methods, while all four devices were utilized to measure the friction standards achieved by existing winter maintenance practices. Photographs were also taken during the study. Standards cameras were used along with the VicCon system, mounted in the ROAR devices. A thermo camera (Inframetrics SC1000) was used to study the performance of sanding methods that were based on adding water to the sand. Salt concentration along roads was measured by road sensors, by refractometers, or by a combination of the two methods. To ensure the salt was mixed with the water in the sample, the samples were taken after two or three vehicles had passed the sample location. In summary, the report addressed two of the objectives for this study.
Meeting Study Objectives Y/N
Instruments and equipment for winter road condition measurements? Y
Quantification of winter road condition measurements? Y
Research gaps? N

Winter Maintenance Performance Measurement Using Friction Testing
November 2009 A-33
Title: Winter Friction Project in Norway
Author and Date: Jon Dahlen and Torgeir Vaa, 2001
The Winter Friction Project in Norway deals with practical, technical, and economic problems arising in providing good friction on winter roads. One of the main activities throughout the whole project period was to carry out field studies, which consisted of a testing program (scientific studies) to document performance of different friction improvement methods. A follow-up study on roads in 10 counties to document existing winter maintenance practices on both salted and sanded roads was also mentioned. Tests during the 1998-1999 winter season revealed that Friction Maker and HOTSTONE heated sanding methods last longer than do traditional sanding methods. Although the effect of using cold and dry sand can disappear after the passage of 50 vehicles, it has been proven that by using heated materials or adding warm water to the sand it is possible to maintain a friction level above the standard, even after the passage of 2,000 vehicles. In particular, a method using a mix of hot water and sand showed promising results. During the summer and autumn of 1999, the warm-wetted sanding method was further improved by the development of two Norwegian prototypes. These new spreaders were tested together with alternative ways of adding water (type of spreader and temperature of the water). Wet sand was compared with traditional sanding using dry materials. The field tests carried out during the winter season 1999-2000 with wet sand and roller distributor confirmed previous results. Friction testing was carried out using two different devices; OSCAR and ROAR. The friction measurements were made until the friction level on the field with the most durable effect was back to the original standard or the trial was disrupted by a change in weather conditions. The evaluation system also included the possibility of simultaneous video images every 20 metres along with the friction measurements. Road weather information was gathered and the number of vehicles was counted.
Photographs are provided of the testing trucks and treated test roads. Friction test results are presented in graphical format. Suggestions for further testing include building a system onto a truck for heating sand and investigating types of spreaders and sand temperature.

Winter Maintenance Performance Measurement Using Friction Testing
November 2009 A-34
In summary, the report addresses all of the objectives for this study.
Meeting Study Objectives Y/N
Instruments and equipment for winter road condition measurements? Y
Quantification of winter road condition measurements? Y
Research gaps Y

Winter Maintenance Performance Measurement Using Friction Testing
November 2009 A-35
Title: Effects of Winter Road Maintenance
Authors and Date: Carl-Gustaf Wallman, Peter Wretling, Gudrun Oberg, 1997
This report investigates the effects of road maintenance on weather and road friction conditions. The report reviews the findings of Swedish, Nordic and American studies. The section on road friction is relatively small in comparison with the rest of the document. The Saab Friction Tester with tires without studs using the skidometer principle was used in Sweden to determine friction rates, and was found to accurately represent the road condition. The Skidding Tester ST-1 with an oblique wheel (8o
angle) was used for measuring friction in Norway Salting was confirmed to increase road friction, while sanding was determined to only have an effect on the friction rate experienced by the first 300 vehicles. Different road surfaces in different conditions were tested. Planing to smooth the road surface and ploughing were investigated and found to decrease friction as they smooth and compact the surface with steel. Vehicles were observed to travel faster on roads with higher friction coefficients. Friction variations due to daily weather as well as seasonal changes were investigated and quantified, and the short term variations were found to be significant. Straight and curved road segments were investigated with different tire treads. In warmer temperatures the lowest friction occurred with worn tires on a curve, however friction was improved in winter conditions due to altering the surface micro-texture. Friction varies temporally, and also along a road spatially. This section of this document on friction briefly discusses equipment and quantifies friction measurements. Research gaps concerning friction are not dealt with.
Meeting Study Objectives Y/N
Instruments and equipment for winter road condition measurements? Y
Quantification of winter road condition measurements? Y
Research gaps? N

Winter Maintenance Performance Measurement Using Friction Testing
November 2009 A-36
Topic: Winter Maintenance - General
Title: Performance Measures for Snow and Ice Control Operations
Authors and Date: Thomas H. Maze, Chris Albrecht, Dennis A. Kroeger, 2008
This paper discusses performance measures used globally by snow and ice control agencies, with the goal of developing a method that can be adopted by snow and ice control agencies to manage snow and ice. Initially, a literature review of performance measurement systems was conducted, and revealed that there is little documentation of actual field performance. Additionally, a survey was issued to 162 agencies in the United States, Canada, Europe and Asia, of which 24% were returned. The results were consolidated and they show that performance can be measured in three basic categories: 1) Input factors, such as the resources spent such as fuel, labour hours, equipment hours,
and material units; 2) Output factors, which are the physical results, such as the miles ploughed, sanded, or to
which de-icing materials or brine have been applied; and 3) Outcomes, which are the measures of effectiveness, such as improvement in safety and
reduction in crashes, reduction in the time taken to achieve bare pavement, reduction in the amount of road closures, increase in user satisfaction, and reduction in environmental impacts.
Measures are often combined into a Level of Service (LOS) rating. Technology such as GIS, automated vehicle location (AVL), and friction meters can be used to collect data. Weather severity can also be incorporated into a weather severity index. This is necessary for comparison between jurisdictions. Performance measurement is useful to a jurisdiction as it enhances decision-making, improves internal accountability, and supports strategic planning and goal setting. In summary, this paper does not meet any of the study objectives.
Meeting Study Objectives Y/N
Instruments and equipment for winter road condition measurements? N
Quantification of winter road condition measurements? N
Research gaps? N

Winter Maintenance Performance Measurement Using Friction Testing
November 2009 A-37
Title: COST Action 353 Winter Service Strategies for Increased European Road Safety Final Report
Authors and Date: COST, 2008
The Action commenced in 2004 and ran for 4 years and involved 22 European countries. The main objective was to “develop a framework for the management of winter traffic for maximized road safety” and the secondary objective was “to integrate new methods of winter maintenance management through the use of the latest technologies for data management, communication and vehicle positioning.” Chapter 3 of the document was the section that discussed new and emerging technologies. Weather and road condition data can be obtained from vehicle systems, and this information can be used in car-to-car communication and in improving the safety of the vehicle through driver warnings and reaction of vehicle systems. The information can also be used for car-to-road communication and for Winter Maintenance Management Systems (WMMS). Road Weather Information Systems (RWIS) and Variable Message Signs (VMS) are also used in WMMS. These technologies already exist. Road conditions that are dry, wet, snowy, or icy can be determined by using an infrared camera and infrared light, as each of these conditions absorbs infrared wavelengths differently. Testing in 2003 and 2004 revealed that a new sanding method of mixing 70% by weight of sand with 30% by weight of hot water at 90-95 degrees Celsius has longer lasting effects because the hot water melts the ice briefly and the sand freezes in clumps so it is not run off the road as quickly by passing vehicles. Similarly, hot water and dry salt (as opposed to wetting the salt with brine) work well as a de-icer worked and as an anti-icer. Friction measurement is usually done by a decelerometer or fixed slip measuring equipment. Decelerometers use an ordinary car and involve heavy braking for 1 or 2 seconds. They are cheap and simple devices and can be used on an ordinary car. However, the results depend on the operator, type of car and braking system, and they cannot be used on high volume roads as heavy braking is required. They also only provide localized results and vertical gradients affect the results. Devices based on fixed slip are useful because they provide continuous friction measurement and can be used in high traffic volumes as no braking is required because a special wheel with a fixed slip is used. An example is Norway’s ROAR (Road Analyzer and Recorder) which is used as a trailer pulled behind a vehicle. ROAR also takes pictures and sends the pictures and the friction data directly to a third party. It is, however, very expensive. Another model is Traction Watcher One (TWO) which is simpler and cheaper and has a fixed slip of 18%. It can be used on a car, lorry, or trailer, and the

Winter Maintenance Performance Measurement Using Friction Testing
November 2009 A-38
results are “good”. The ASFT T2Go is a small and portable fixed slip device. The friction data and GPS data are sent directly to a Pocket PC. This model is useful as it can be used where other instruments cannot such as in cycling lanes and pedestrian roads. They are, however, expensive units, however, and there is still a need to standardize the measurement method as the friction result is dependant on many factors. The Swiss Federal Roads Authority is also using friction measurements to develop a quality management system for winter maintenance operations. A standard will be developed to define the friction values that must be maintained on roads during the winter. The values will be based on time of day, traffic volume, and altitude. In summary, this report has met all of the objectives of this study.
Meeting Study Objectives Y/N
Instruments and equipment for winter road condition measurements? Y
Quantification of winter road condition measurements? Y
Research gaps? Y

Winter Maintenance Performance Measurement Using Friction Testing
November 2009 A-39
Title: Ice Road Assessment, Modeling and Management
Authors and Date: Darel Mesher, Sam Proskin, 2008
The Tibbitt Lake to Contwoyto Lake Winter Ice Road in the Northwest Territories, at 568 km, is the longest heavy haul winter ice road in the world. The frozen roadway is created annually and its load bearing capacity is determined by the structure of the frozen surface and by the water depth beneath the frozen surface. The changing global climatic conditions have affected the ice road as it had to be closed in the winter of 2006 when temperatures were too high. The frozen road is able to function due to the buoyancy force due to the hydrostatic pressure on the bottom of the ice supports the floating ice sheet. When a vehicle moves across the ice sheet it creates a load-deflection bowl that moves with it. The greatest vehicle speed that the ice sheet can support is called the critical speed and is dependant on the water depth and the properties of the ice sheet such as: thickness, stiffness, Poisson’s ratio, ice type, structural homogeneity and defects such as cracks. The deflection at critical speed can be as great as 2.5 times the deflection at rest, and the maximum tensile stress can be 1.5 times that at rest. A minimum 0.7m ice sheet thickness is required before the road is opened. For the Tibbett to Contwoyto Winter Ice Road, the required ice thickness is calculated in a Wyman’s stress analysis. The water depth and ice properties can be measured by the Ice RoadRadar ground penetrating radar (GPR) towed behind a vehicle. Testing of this device was conducted in 2007. Further testing in 2008 will be conducted using this device on the Tibbitt to Contwoyto Ice Road. In summary, this paper does not meet any of the study’s objectives.
Meeting Study Objectives Y/N
Instruments and equipment for winter road condition measurements? N
Quantification of winter road condition measurements? N
Research gaps? N

Winter Maintenance Performance Measurement Using Friction Testing
November 2009 A-40
Title: The Possibility of Implementing the Management Cycle of Winter Maintenance by Performance measurement
Authors and Date: Max Motoki Asano, Roberto A. Tokunaga, 2008
In 1990, the use of studded tires in Japan was banned to prevent the harmful environmental impacts of dust produced by the studded tires. As a result of the ban, however, winter accidents on slippery roads have increased. In the five years following the introduction of the law, accidents on winter roads doubled, and the average speed was reduced by 15%, significantly impact winter travel performance. Additionally, the number of pedestrians requiring an ambulance increased as did the volume of anti-icing chemicals and abrasives used on the roads. The study proposes a logic model to measure the performance of winter maintenance as studded tires can no longer be relied upon as a safety measure. This study utilizes the lessons learned from other countries’ winter maintenance practices. For example, Alberta’s asset management tool is discussed and adopted. In Alberta, input data from human resources and volume of anti-icing agent are compared with traffic volumes and vehicle speeds obtained from Alberta’s Automobile Association. Asano and Tokunaga also consider Sweden’s Winter Model for road management, which converts economic impacts, environmental impacts, travel performance, and traffic safety to monetary values. The final outcome of winter maintenance is improving winter traffic performance, reducing accidents and increasing satisfaction. However, it is important to have an outcome that is measured objectively and quantitatively. Therefore, using friction numbers is adopted as “intermediate outcome” in this study. The inputs are budget, human resources and technology, and the outputs are frequency and volume of applied anti-icing agents. The testing for this study was performed in the winter of 2006/07 using the continuous friction tester. This equipment is better than the locked-wheel friction tester because the locked-wheel friction tester can only take data from specific points. The objectives of the logic model are to: ensure friction resistance of at least 50; reduce winter accidents to less than 5 per 100 million vehicle kilometres; and maintain speed of travel on road ways to at least 20 km/hr. Meeting these objectives will ensure that the overall goal of increasing safety, reliability and mobility on winter roads is met. One of the issues of concern in this study is that the budget inputs and the output volume of anti-icing agents are annual numbers, whereas the friction measurements are a daily measure. This issue will be further researched. Other issues for further study include:

Winter Maintenance Performance Measurement Using Friction Testing
November 2009 A-41
clarifying the relationship between the intermediate outcome and final outcome, comparing the data over more than just one year; and comparing the data with other routes. In summary, this report addressed two of the study’s objectives.
Meeting Study Objectives Y/N
Instruments and equipment for winter road condition measurements? Y
Quantification of winter road condition measurements? N
Research gaps? Y

Winter Maintenance Performance Measurement Using Friction Testing
November 2009 A-42
Title: Integrating Weather into Transportation Operations
Authors and Date: Christopher K. Strong, Xianming Shi, 2008
This paper reviews the Utah Department of Transportation (UDOT) Weather Operations/RWIS program. This program integrates weather information with transportation operations to mitigate the effects of winter weather such as delays and safety. It is important to be proactive instead of reactive in winter maintenance. For example, anti-icing instead of de-icing methods results in a lower volume of chemicals used, lower costs, higher level of service (LOS) and fewer accidents. In order to achieve this goal of proactive winter maintenance, it is important to integrate weather information into traffic operations. RWIS are widely used and include sensors for environmental factors such as atmospheric condition, pavement condition and water level. They are generally situated at points along roadways that are prone to severe weather. The disadvantages of RWIS are that they provide information only at a specific location along the roadway, and they are expensive to build, operate and maintain. There are other technologies that have been developed with similar capabilities. For example, Mesonets integrate weather data from multiple sources to provide more useful weather information. Weather is a Washington State DOT web-based system that collects data in real-time and predicts weather on a statewide scale. The information is used by the DOT and the public in graphical format. WeatherView is an Iowa DOT web-based system. It also collects data and predicts weather in real time. Information is obtained from RWIS and airport sensors state-wide and is used by the DOT, contractors and the public. Similarly, WeatherShare is the equivalent California Caltrans web-based system, but does not provide forecasts. Clarus is a federal initiative and integrates RWIS data but does not provide forecasts. The FORETELL System is also used by many states. Maintenance Decision Support Systems (MDSS) forecast weather to recommend road treatments for winter maintenance personnel. The UDOT Weather Operations/RWIS program provides daily forecasts in email format with a 36 h time horizon. The information is used in planning construction and renovation, by maintenance engineers in storm events and for snow and ice control. The benefits of the program are that there are reduced costs to the agency. The cost of the program is the cost to sustain the program.

Winter Maintenance Performance Measurement Using Friction Testing
November 2009 A-43
The Winter Maintenance Cost Model was developed to compare different maintenance sheds at the same “baseline” by incorporating usage, level of anti-icing, level of maintenance, vehicle miles and winter severity index into an equation. The equation was modelled by an artificial neural network and the benefit to cost ratio was found to be 11:1 for the UDOT Weather Operations/RWIS program. In summary, this report addressed all of the study’s objectives.
Meeting Study Objectives Y/N
Instruments and equipment for winter road condition measurements? Y
Quantification of winter road condition measurements? Y
Research gaps? Y

Winter Maintenance Performance Measurement Using Friction Testing
November 2009 A-44
Title: Follow-Up Study of Winter Standard as a Research and Development Project
Authors and Date: Torgeir Vaa, Ivar Hol, 2008
The Norwegian Public Roads Administration has 103 winter maintenance contracts. The competitive tendering ensures a high level of research in winter maintenance. The goals of one of the contracts are to improve traffic safety and to provide reliable information to the public, the contractor and the road keeper regarding the conditions of the main road in the contract area (E136). In 2007 the project was extended to cover a second region and it involved two contractors. The Norwegian friction quality standard specifies the friction requirements and time limits for local sanding and continuous sanding of trunk roads and all other roads at different AADTs. The friction value triggering criteria and maximum time for action (Anti-icing and De-icing after snowfall) for different AADT is also provided in the quality standard. The main friction measuring device used is the Traction Watcher One (TWO). This is a fixed slip test wheel device that is 8 inches in diameter and is positioned in the left wheel track. Recordings are made every second and the data is collected via a laptop in the vehicle. The TWO has been modified to operate in three different modes: 1) Normal mode: standard 60kg ground pressure; 2) Inspection mode: has a friction threshold of 0.60 over 100m. Above this value, the
ground pressure used is 30kg, and below this value, 60kg ground pressure is used. 3) Spot mode: measurements are taken at fixed intervals (spot checks) between 1 and 5
km. 60 kg ground pressure is used over 70 m of measurement. Weather and environmental data were also collected from RWIS stations. Two other investigations were performed, including investigating the effect of sand grain size on friction and the duration of sanding, and investigating the relationship between pavement condition and winter maintenance. The two regions investigated had different sanding requirements due to climatic, geometric and settlement differences. Subjective data on road condition was also collected from bus and truck drivers. The results support incorporating research and development in maintenance contracts.

Winter Maintenance Performance Measurement Using Friction Testing
November 2009 A-45
In summary, this report addressed two of the study’s objectives.
Meeting Study Objectives Y/N
Instruments and equipment for winter road condition measurements? Y
Quantification of winter road condition measurements? Y
Research gaps? N

Winter Maintenance Performance Measurement Using Friction Testing
November 2009 A-46
Title: Severe Winter Weather Impacts on Urban Pavements
Authors and Date: William Kennedy, Angela Hager, 2008
This paper discusses the effects of severe winter weather on road surfaces in Denver, Colorado, as the result of violent snow storms in the winter of 2006/07. Denver uses Pavement Management Systems (PMS) to monitor the pavement condition of roads, and deterioration models to predict the condition of road segments. In the winter of 2006/07 uncharacteristically strong snow storms hit Denver, deteriorating the condition of the roads far beyond that predicted by the PMS. Many road closures were forced including Interstate Highways and U.S. Routes. The numerous storms resulted in the roads being subjected to several freeze-thaw cycles resulting in potholes, alligator cracking, overall longitudinal and transverse crack development, and general rutting and roughness. Pavement Condition Index (PCI) obtained shortly before the storm was compared with that after, and a significant drop was observed. In order to assess the condition of the vast length of affected collector and arterial roads, visual assessments were conducted, and a score of 1 to 5 was given to each distress. A Windshield Condition Index was calculated including a visually observed distress score, and was subsequently converted to PCI to quantify the impact of the storms on road deterioration. Standard PMS procedures for deducing PCI were used for the local roads as they were less urgent. The results revealed that a number of roads were close to full pavement failure, and as a result of this work, additional budget was used to rehabilitate these roads. In summary, this paper only covered one of the objectives of this study.
Meeting Study Objectives Y/N
Instruments and equipment for winter road condition measurements? N
Quantification of winter road condition measurements? Y
Research gaps? N

Winter Maintenance Performance Measurement Using Friction Testing
November 2009 A-47
Title: Goals and Methods of Winter Maintenance in Finland
Authors and Date: Kalevi Katko, 1993
This document discusses the importance of winter maintenance in Finland as much of the year is spent in winter conditions. Friction numbers need to be high enough to ensure the safety of road users. Mechanical snow removal is preferred to the environmentally harmful salting practice. Sand is also used as an antiskid treatment. Skid numbers defining different road surface textures for each of the categories: slippery condition, snow condition and evenness condition are given. Roads are divided into maintenance classes by their ADT and there are target condition values for day and night for each maintenance class. The de-icing and snow removal cycle times are provided for each maintenance class and the corresponding road surface condition. In Finland, maintenance staff have skid resistance testers installed in their vehicles, which are used to assess the need for salting or sanding. The timing of assessing the need for maintenance measures is dependant on changing weather conditions. Weather conditions are monitored by 150 road weather stations comprising the road weather service system. This document is not directly concerned with the measurement of friction numbers, and the details of the equipment used for this are not presented. The road conditions are quantified by friction number, however. No mention of gaps in research in friction number is made.
Meeting Study Objectives Y/N
Instruments and equipment for winter road condition measurements? N
Quantification of winter road condition measurements? Y
Research gaps? N

Winter Maintenance Performance Measurement Using Friction Testing
November 2009 A-48
Title: Snow and Ice Databook, 2006 Edition
Author and Date: PIARC Technical Committee on Winter Maintenance, 2006
This databook presents extensive summaries about winter maintenance operations from 22 different countries/regions around the world, including Austria, Belgium, Canada, Canada – Quebec, Denmark, Estonia, Finland, France, Germany, Iceland, Italy, Japan, Latvia, Lithuania, Norway, Slovenia, Spain, Sweden, Switzerland, The Netherlands, United Kingdom, and the United States. The purpose of the databook is to exchange knowledge and learning among countries affected by winter road conditions to achieve optimal results with reduced costs and environmental impacts. Each country report includes sections on demographics and road data, climate, winter road management, as well as ongoing research and studies. The databook presents different individual methods used to quantify winter severity and assess winter maintenance costs. Other focuses are economic and environmental issues, public-private partnerships, training, road user needs and emerging technologies. It also summarizes current methods used by these countries to communicate weather and road surface conditions to road users, including RWIS systems, the use of information technologies, cameras, phones, automatic incident detection, and variable message signs. Finland, Iceland, Norway, and Sweden currently use friction requirements to define levels of winter maintenance. Finland correlates friction values from 0.00 to 1.00 to driving conditions, quality standards, and reaction times. Iceland uses a minimum friction coefficient for both general areas as well as hazardous spots (curves and slopes) as a factor of their quality requirements. Part of Norway’s regulation is to “provide sufficient friction for the road user”, including both vehicles and pedestrians. Norway has defined values for sufficient friction for both spreading and salting procedures. Sweden uses the Swedish Road Administration’s Method Specification on Friction Measurement on Winter Road Surfaces to determine the friction coefficient and these specifications are applied to different road classes. Many regions are conducting relevant ongoing research. Estonia is performing ongoing studies about implementing a friction factor measurement system. Norway is testing a friction measuring device that is fixed to the road and sends friction data via the internet, as well as other methods and equipment for measuring friction. Sweden is working on a Winter Model to evaluate the effects of various road conditions on road users and road management. Some agencies in the United States conduct post-storm pavement friction measurements. Latvia is experimenting with the cutting of grooves in compacted snow to improve skid resistance on roads with low traffic volumes.

Winter Maintenance Performance Measurement Using Friction Testing
November 2009 A-49
Overall, this databook provides a highly useful summary of current practices in countries that experience winter conditions and could be used to identify sources for further research. It meets two of the three objectives as shown in the following table.
* details related to instruments and quantification are only available for certain countries
Study Objective Y/N
Instruments and equipment for winter road condition measurements? Y*
Quantification of winter road condition measurements? Y*
Research gaps? N

Winter Maintenance Performance Measurement Using Friction Testing
November 2009 A-50
Title: Syntheses of Best Practices Road Salt Management – 9.0 Winter Maintenance Equipment and Technologies
Author and Date: Transportation Association of Canada, 2003
This report provides an excellent overview of factors that must be considered when developing winter maintenance strategies. It outlines that the strategy developed should be based on forecasted, current and historical information, and should meet the 4-R’s of Salt Management: the Right Material, the Right Amount, the Right Place, the Right Time. Road Weather Information Systems (RWIS) are discussed including sensor based systems and infrared thermometers. Road service traction measurement, residual chemical measurement, and mechanical means to control snow and ice are discussed at a high level, mentioning the availability of options but not specifically highlighting any one in particular. Snow plowing options are discussed in detail, outlining the types of vehicles and plows that are available with pros and cons for each. Snow removal and disposal methods and using road salts to control snow and ice are also outlined with pro and con details on types of equipment available and rationale for methods used. The need for operational support for monitoring resources is outlined including discussions on material usage monitoring, loading and handling of materials and mixing materials. Finally, the importance of training maintenance crews on not only traditional equipment maintenance and safe operation, but with an understanding of best practices for snow and ice control, is discussed. With the more sophisticated equipment that is available, operators need to understand that decision-making means choosing when to take appropriate action or identifying when action is not required. As winter maintenance technology evolves, considerable planning, organization, and evaluation of new systems will be required by roadway agencies to ensure the best use of the equipment. A transition strategy should be developed to shift from the existing fleet to the new fleet of winter maintenance equipment.

Winter Maintenance Performance Measurement Using Friction Testing
November 2009 A-51
In summary, the report addresses two of the objectives for this study.
Meeting Study Objectives Y/N
Instruments and equipment for winter road condition measurements? Y
Quantification of winter road condition measurements? N
Research gaps Y

Winter Maintenance Performance Measurement Using Friction Testing
November 2009 A-52
Title: Extracting Slipperiness Component from Weather and Traffic Data for Winter Maintenance Operations
Author and Date: Takashi Nakatsuji, Naoki Hamada, and Akira Kawamura, 2002
This report investigates the determination of road slipperiness from weather and traffic data. Conventionally, coefficient of friction is used to represent road slipperiness, and the goal of the project outlined in this report was to avoid the unreliability of the coefficient of friction. Data was collected at an intersection on a suburban trunk line. The collected data were: air temperature, humidity, traffic volume, total solar radiation, net radiation, road surface temperature and skid number. The Kohonen Feature map (KFM) mathematical model, a neural network model, was used to integrate the observed traffic and weather data to extract the slipperiness component. KFM works by integrating observed data into fewer data sets to remove excessive data. Principal Component Analysis (PCA) was also used as a filter to extract the slipperiness component by means of integration of explanatory variables. PCA converts mutually correlated variables into a set of mutually independent variables. A multiple linear regression model was created to predict skid numbers and the skid numbers predicted by the model matched the observed skid numbers well. The report concludes that there is potential for using weather and traffic data for winter road slipperiness, but recommends further research into vehicular motion data in combination with weather data and repeating the research with a larger number of sites. As outlined in the table below, this report is focused on using existing techniques (weather monitoring and traffic volumes) to predict road slipperiness, and new instruments for direct measurement are not discussed. A quantitative analysis of the collected data is described, and further research is recommended.
Meeting Study Objectives Y/N
Instruments and equipment for winter road condition measurements? N
Quantification of winter road condition measurements? Y
Research gaps? Y

Winter Maintenance Performance Measurement Using Friction Testing
November 2009 A-53
Title: Snow and Ice Control System Based on Slipperiness Data Transmitted by Drivers: Usefulness of Subjective Slipperiness Data
Author and Date: Takashi Nakatsuji, Takashi Fujiwara, Toru Hagawara, and Yuki Onodera, 1996
This report describes research done in Japan using slipperiness data from drivers in transportation occupations for the purposes of developing a snow and ice control system. The relationships investigated were: subjective slipperiness as determined by driver judgement versus road condition classification determined visually (dry, wet, packed snow, ice); subjective slipperiness index versus friction coefficients; and the effectiveness of having a greater number of road condition divisions. The slipperiness index is a driver chosen rating with options of: 1) Not Slippery, 2) Not So Slippery, 3) Somewhat Slippery, and 4) Very Slippery. The results of the investigation revealed that the subjective slipperiness index correlates well with the coefficient of friction, and is a direct representation of the road condition. The slipperiness index, however, does not require any special equipment as it is based on driver judgement of road slipperiness, whereas coefficient of friction requires a skid resistance tester or a thermistor. Based on the results of the investigation, this report recommends further long-term investigation into the problem of predicting slipperiness from weather data. As shown in the following table, this report meets all three objectives of the study. It describes the instruments currently used in directly measuring road friction, and it discusses the quantification of winter road conditions as well as research that still needs to be done.
Meeting Study Objectives Y/N
Instruments and equipment for winter road condition measurements? Y
Quantification of winter road condition measurements? Y
Research gaps? Y

Winter Maintenance Performance Measurement Using Friction Testing
November 2009 A-54
Topic: Friction - General
Title: Incorporating Road Safety into Pavement Management: Maximizing Asphalt Pavement Surface Friction for Road Safety Improvements Draft Literature Review and State Surveys
Authors and Date: David A. Noyce, Hussain U. Bahia, Josué M. Yambó, and Guisk Kim, 2005
The report discusses the relationships between skid resistance/friction and pavement design, construction, maintenance, and safety. It begins by providing a definition of skid resistance and describing the objectives of measuring skid resistance. The objectives include: to control quality during construction and to manage the asset thereafter; to evaluate surface restoration work; and to assist winter maintenance activities on highways. It goes on to discuss methods to measure skid resistance. Such methods include the use of measuring devices (e.g., locked wheel testers, side force devices, fixed slip devices, and variable slip devices) and the utilization of models (e.g., Penn State Model and Rado Model). Methods to estimate microtexture and macrotexture, both of which depend on the pavement material and contribute to skid resistance, are also mentioned. It then discusses elements affecting skid resistance, including weather, water film thickness, the speed of the vehicle, the cornering path, the magnitude of acceleration or braking, the condition of the vehicle tires, and the characteristics of the pavement surface. Studies examining the reaction of drivers to the friction of the road are presented next. According to the Noyce et al, it has been found that actual friction values have little correlation with the driver’s choice of speed. Visual information has proven to be a stronger cue for drivers. The report also mentions a study that has shown drivers often do not slow down enough in winter condition. In addition, several studies have explored the correlation between stopping distances and actual friction coefficients. The authors then discuss the relationship between skid resistance and crash risk at length. Several studies that have analyzed friction values and crash data before and after roads were resurfaced to increase friction have shown that friction coefficients do correlate with crash rates. However, some studies have found that resurfacing may also increase driving speed, thus increasing crash risk. Also mentioned is the fact that skid resistance varies from lane to lane since there are different traffic flows on each lane. Furthermore, factors such as vehicle speed and road gradient affect the amount of friction needed to reduce the risk of skidding accidents.

Winter Maintenance Performance Measurement Using Friction Testing
November 2009 A-55
Next, integrating friction measurements into pavement management is discussed. It presents five categories of practices that American states are currently following to control skid resistance on asphalt roadways. These range from no consideration of friction/skid resistance in the design of new pavements to the integration of field performance when qualifying aggregates. In addition, it provides Austroad’s Guidelines for the Management of Road Surface Skid Resistance, which includes 16 key elements to be considered when developing and implementing a local strategy to manage skid resistance. UK’s procedure to identify and treat sites with skidding resistance problems is also highlighted. In the last section of the paper, the results of a study looking at the current use of skid resistance in hot mix asphalt pavement design, construction, maintenance, and safety are presented. With regards to maintenance, the following six US states reported that they use friction numbers as a measure for decision making regarding maintenance activities: Ohio, Iowa, Indiana, Michigan, Pennsylvania, and Washington (the information for Ohio, Iowa, and Indiana is included in the Current Practices section of this report). Iowa and Ohio do not specify threshold friction values for their maintenance activities, while the remaining four states do have specific criteria that they pursue in terms of friction numbers. However, these criteria are not specific to winter conditions and they vary between the different states. Wisconsin and Iowa have also developed models to estimate friction numbers. Moreover, Illinois, Iowa, Michigan, Missouri, and Ohio correlate friction numbers to crash data. Of the three objectives of this study, two are discussed in the report by Noyce et al.
Meeting Study Objectives Y/N
Instruments and equipment for winter road condition measurements? Y
Quantification of winter road condition measurements? Y
Research gaps? N

Winter Maintenance Performance Measurement Using Friction Testing
November 2009 A-56
Title: Guidelines for the Management of Road Surface Skid Resistance
Authors and Date: Austroads, 2005
This guide was produced by the Australian and New Zealand transportation and traffic authorities to provide road authorities with the information necessary to manage the skid resistance of a local network. Details are provided on surface friction, surface texture, and road conditions. Part 2 Section 3 of this guide is devoted to the measurement of skid resistance and surface texture. Equipment for measuring coefficient of friction involves forcing a tire across a road surface under a load and measuring the horizontal friction, traction, or resisting force. The four types of equipment used for measurement of the coefficient of friction are: Portable Skid Resistance Testers (hand operated), Sideways Force (test vehicle fitted with a test wheel at an angle to the direction of travel), Slip (Fixed and Variable) in which the test wheel travels more slowly than the vehicle it is mounted to forcing it to slip over the surface, and Locked Wheel in which frictional forces are measured when the test wheel is locked up as brakes are applied. The most common apparatus in use in Australia and New Zealand are: • Portable Pendulum Tester (PPT) which measures Skid Resistance Values from which
friction coefficients can be obtained but must be used in conjunction with texture depth measurements
• SCRIM (Sideways-force Coefficient Route Investigation Machine), which can be supplied with integrated surface texture sensors so that skid resistance and texture measurement can be carried out simultaneously. Transverse profile measurement equipment can also be used.
• Grip Tester (GT) which consists of a three-wheeled trailer with one test wheel and two bogey wheels and is widely used for airport runways, roadways and pedestrian walkways
• Norsemeter Road Analyser And Recorder (ROAR) which can measure fixed or variable slip or a combination thereof and the version currently available is Mark II which is small and has one test wheel, but is however very expensive.
The measurement results obtained are apparatus dependent, and as such measurements from one piece of equipment cannot be compared to measurements taken with a different piece of equipment. Efforts to “harmonise” these measurements have been undertaken. The PIARC Experiment performed by the PIARC Technical Committee on Surface Characteristics

Winter Maintenance Performance Measurement Using Friction Testing
November 2009 A-57
used 47 measuring systems from 16 countries to measure different textures and skid resistances. All measurements were converted to a scale called the International Friction Index (IFI). Harmonisation Of European Routine and Research Measuring Equipment For Skid Resistance of Roads and Runways developed the Skid Resistance Index , similar to the IFI but slightly more accurate as a lower slip speed is used and the texture depth is obtained from the Standard Mean Depth Profile. It is highly important to maintain test equipment and to ensure careful calibration. There are several methods for calibration. Static calibration is done off-site on a test sample to ensure correct functioning of equipment; dynamic calibration is done by measuring at a site where previous measurements have been taken to ensure consistency; and group calibration involves trials at a site with equipment from other places. Examples of skid resistance levels obtained by different apparatus are presented. This is an informative document pertaining to skid resistance. The sections relevant to measurement of skid resistance have been summarised above. As a guide, the purpose of the document is to inform readers, and the focus is not on gaps in research.
Meeting Study Objectives Y/N
Instruments and equipment for winter road condition measurements? Y
Quantification of winter road condition measurements? Y
Research gaps? N

Winter Maintenance Performance Measurement Using Friction Testing
November 2009 A-58
Title: Managing Road Pavement Skid Resistance
Author and Date: Pierre Dupont and Alain Bauduin, 2005
This article describes the new circular on skid resistance that the French National Highway Administration issued in 2002 to replace the previous version from 1988. To establish specifications and define compliance controls, it relies on three fundamental notions:
• On wet or damp pavement, the tire may partially compensate for a weak macrotexture, but not the effects of weak microtexture;
• Microtexture is necessary at all speeds and does not depend solely on resistance to aggregate polishing but rather on several parameters; and
• Macrotexture provides an additional condition at medium and high speeds.
It comments on the importance of macrotexture and microtexture in terms of their functionality. It also states the parameters upon which these functionalities depend. The three principles upon which the circular was founded are synthesized as:
“The choice of wearing course, over a target section, must reflect a compatibility between the supply of skid resistance provided by the surfacing material and the skid resistance demand mandated by the speed / configuration / type of pavement triad.”
There are relevant specifications in terms of Mean Texture Depth for ordinary sections of roads and proposed examples for special points on road sections. While these specifications only refer to Macrotexture, a memorandum was concurrently released on the selection of products with respect to skid resistance supply, based on characteristics of traffic intensity, climate, and external elements. This memorandum takes microtexture into account when selecting techniques and aggregates. The article meets one objective of this study, which is defining a research gap in that additional efforts are essential to optimize macrotexture and microtexture in situ.
Study Objective Y/N
Instruments and equipment for winter road condition measurements? N
Quantification of winter road condition measurements? N
Research gaps? Y

Winter Maintenance Performance Measurement Using Friction Testing
November 2009 A-59
Title: Accidents due to loss of skid resistance: The skid resistance-road safety relationship and preliminary intervention analysis
Author and Date: Lionel Patte, 2005
This report discusses the difficulty in analyzing accidents and what factors contributed to the hazard. Accidents arising on wet pavement, Awp are discussed with emphasis on the difficulties in determining how much of an impact the loss of skid resistance has as a contributing factor to accidents. The author outlines several elements that complicate studies to determine the relationship between Awp and skid resistance but offers no solid recommendations. The SURE national strategy is mentioned as a methodology used for analyzing key parameters and for conducting and evaluating infrastructure improvement actions. The analytical tool Alertinfra is also mentioned. The tool requires the availability of data for pavement characteristics, road geometry and environment. Based on the data provided, the tool will provide alerts or warnings of accident-prone situations. This report is basically emphasizing the need for road safety project managers to interpret considerable information from varied sources and integrate knowledge from many disciplines in order to diagnose problems. In summary, the report does not address any of the objectives for this study.
Meeting Study Objectives Y/N
Instruments and equipment for winter road condition measurements? N
Quantification of winter road condition measurements? N
Research gaps N

Winter Maintenance Performance Measurement Using Friction Testing
November 2009 A-60
Title: Towards International Harmonisation of Friction Measurements
Authors and Date: Jean Claude Deffieux, 2004
This article discusses friction measurement in application to airport runways and the need to establish an international standard for globally consistent friction measurements. The general procedure for measuring friction is described: a special reference tire is used to measure the frictional force at the tire/surface boundary and the tire rolling resistance. Some devices measure only braking torque (friction forces) and others measure friction and rolling resistance. The measurements are represented as coefficient of friction. However, the exact equipment used varies globally and thus measurements are inconsistent. Tests were conducted in order to develop an International Runway Friction Index (IRFI). The following equipment were included for measurement evaluation: RFT (Runway Friction Tester), BV11 Skiddometer for winter pavement evaluation, NASA’s ITTV, GRIP Tester (ET), ERD Decelerometer, and SARSYS Friction Tester (SFT), SARSYS Trailer Friction Tester (STFT) and the French IMAG. These devices were tested at a variety of locations across the globe on different surface conditions. Measurements were made relative to a chosen reference value determined by one piece of equipment. This reference device is used to calibrate a “master” device of each type of equipment which is in turn used for calibrating all other equipment of that type. The IRFI was found to apply to the data collected during the equipment tests and there exists ASTM guidelines for testing procedures. The IRFI was tested against aircraft landing distance, and found to relate to the aircraft braking coefficient. Friction measurements were inaccurate on surfaces covered thickly by fluid contaminants. Implementation of IRFI requires international and corporate cooperation. As shown in the following table, this article meets the objectives of discussing equipment and quantification of winter friction measurements, but does not present any research gaps.
Meeting Study Objectives Y/N
Instruments and equipment for winter road condition measurements? Y
Quantification of winter road condition measurements? Y
Research gaps? N

Winter Maintenance Performance Measurement Using Friction Testing
November 2009 A-61
Title: Friction Measurement Methods and the Correlation between Road Friction and Traffic Safety: A Literature Review.
Author and Date: Carl-Gustaf Wallman and Henrik Åström, 2001
This literature review discusses studies about the different friction methods in use, harmonisation of the resulting friction measurements, and relations between road friction and accident risk.
Friction forces are very sensitive to a number of parameters that are difficult to control, including the measuring tire, the road surface, and contaminants like water or dust. The authors describe these parameters in detail, emphasizing that even identical test repetitions can have significant differences in friction results.
There is a discussion on current standards and the use of friction measurement in different countries. Many agencies have specified road friction threshold values that define the lowest acceptable road friction. Winter road friction measurement is a way of assessing winter maintenance more than pavement quality, because it is the presence of ice, snow or slush that governs the friction value. Sweden, Norway, and Finland use the BV11 and Saab Friction Tester, the TIE475, and the ROAR, respectively, for winter friction measurements.
The PIARC experiment of 1995 is presented as the most ambitious attempt to harmonise the different road friction methods in use. Equations with coefficients specific to each instrument were used to set up a Friction Index. The authors conclude that it is necessary to continue work on harmonising road friction measurements to achieve better standards of acceptable road surface friction and to facilitate comparisons of friction and accident rate data between countries. They suggest the introduction of an International Friction Index, which would be a device-independent friction scale.
The authors conclude that it is difficult to relate road friction directly to accident risk. Drivers’ evaluation of road conditions is unreliable: when adjusting their speeds, they tend to rely on visual information like snow much more than the actual friction. Roads that have similar-looking conditions may have very different friction numbers. There are also difficulties because friction can vary to a great extent with time and space during winter, with the result that there is never any information about the prevailing friction at a crash location. Due to the absence of robust data, few studies estimate accident rates as a function of friction number.

Winter Maintenance Performance Measurement Using Friction Testing
November 2009 A-62
In summary, this report meets two of the study’s objectives.
Study Objective Y/N
Instruments and equipment for winter road condition measurements? Y
Quantification of winter road condition measurements? N
Research gaps? Y

Winter Maintenance Performance Measurement Using Friction Testing
November 2009 A-63
Title: International Runway Friction Index (IRFI) Development Technique and Methodology
Author and Date: James C. Wambold, J.J. Henry and Arild Andresen, 2001
This report defines the International Runway Index (IRFI), which is part of a government/industry project called the Joint Winter Runway Friction Measurement Program (JWRFMP), led by Transport Canada and the U.S. National Aeronautics and Space Administration.
A statistical model was developed into ASTM Standard E 2100-00, Standard Practice for Calculating the International Runway Friction Index and defines and prescribes how to calculate IRFI for Winter surfaces. The IRFI is a standard reporting index used to provide information on runway friction characteristics to aircraft operators or airport maintenance staff.
In order to standardize measurements, a local friction measuring device is calibrated directly or indirectly to an IRFI reference device. This achieves harmonization of the local friction devices to a common unit of measure, regardless of the local friction device used. The method typically reduces the present variations from 0.2 down to 0.04.
This report states that for any common scale of friction measure to work satisfactorily for the industry, annual harmonization of devices must be arranged.
This report does not outline specific testing methods or equipment. It stresses the importance of a common measurement scale across the industry and how to measure to that scale by calibrating local equipment to a reference. Recommendations for further research include designation of an IRFI reference device acceptable to the aviation community, development of new harmonization constants to predict IRFI using this permanent device, and development of new constants for relating individual pieces of equipment to the standard device.
In summary, the report addresses one of the objectives for this study.
Meeting Study Objectives Y/N
Instruments and equipment for winter road condition measurements? N
Quantification of winter road condition measurements? N
Research gaps Y

Winter Maintenance Performance Measurement Using Friction Testing
November 2009 A-64
Title: National Cooperative Highway Research Program (NCHRP) Synthesis 291: Evaluation of Pavement Friction Characteristics - A Synthesis of Highway Practice
Author and Date: John J. Henry, 2000
This report evaluates wet pavement friction characteristics by reviewing literature and responses to a questionnaire. It focuses on methods for measuring and reporting friction and texture and includes construction and surface restoration considerations. The questionnaire was sent to each state highway transportation agency in the Unites States, The National Aeronautics and Space Administration, Puerto Rico, the District of Columbia, each province in Canada, and 55 agencies outside of North America.
Although this report provides a comprehensive review of current friction practices for wet pavement, the discussion of winter characteristics are limited. It begins by describing two models for wet pavement friction, the Penn State Model and the Rado Model, as well as four types of field measurement methodologies and laboratory methods. In response to the questionnaire, 12 agencies reported that friction measurements were performed occasionally on snow and ice for research. The devices used for wet pavement friction texting are listed, and the survey responses are tabulated.
Conclusions include that:
- friction is ranked only slightly behind durability as the most important pavement quality design consideration
- it would be useful to establish a criterion for macrotexture in addition to reported friction values
- reporting macrotexture would assist in harmonizing measurements made at different speeds, and help with the implementation of the International Friction Index
This report did not meet any of the study objectives below.
Meeting Study Objectives Y/N
Instruments and equipment for winter road condition measurements? N
Quantification of winter road condition measurements? N
Research gaps N

Winter Maintenance Performance Measurement Using Friction Testing
November 2009 A-65
Title: Friction Fundamentals, Concepts, and Methodology
Author and Date: A. Andresen and J. C. Wambold, October 1999
This report is a tire-surface friction engineering reference text that covers a range of topics generally applied to runways and then focuses on the harmonisation of friction measurement devices. It groups these devices into three categories: fixed slip testers, variable slip testers, and decelerometer testers, concentrating on their common characteristics rather than on individual devices. After an introduction to the mechanics of tribometers (friction measurement devices), the main principles of braking slip friction are explained using simple friction models. Contaminants have adverse affects on measuring friction that are especially important in winter conditions. Equations describing these adverse effects are explained. As the travel speed of the tribometer increases in the presence of contaminants, the variability in the reported friction value also increases. The poor repeatability and reproducibility demonstrated by previous field tests presents a problem for harmonising tribometers of different types. To account for device and surface variability, descriptive statistics consisting of the mean, the standard deviation, and the number of samples should be reported. A scheme for normalized friction measures is suggested: the average friction value is calculated for every 10 m distance and the average friction value is reported for each 100 m distance with the descriptive statistics for a fixed sample size of 10. The methods of calculating these statistics are included, and theoretical results from several devices are compared. Friction-speed relationships vary significantly for different surfaces. Surface classifications are also discussed using the International Civil Aviation Organization’s deposit codes as an example. The modern tire-pavement friction models by the World Road Association (PIARC) and Pennsylvania State University (Rado model) are compared, concluding that these successes should encourage continued research into other tire-surface pairs with the goal of developing more precise friction models. The PIARC friction model produced the International Friction Index (IFI) and the International Runway Friction Index (IRFI), where calibration constants were determined for all of the participating devices. The harmonization procedure used for the IFI is described in detail. Both the American Society for Testing and Materials (ASTM) and the International Standards Organization (ISO) have developed standards for the IRFI. The quality of the ASTM E-2100-00 and other ground device harmonisers is evaluated. Lastly, this report discusses the

Winter Maintenance Performance Measurement Using Friction Testing
November 2009 A-66
importance of communicating harmonised friction values to principle users, primarily those operating aircraft. This report meets two of the three objectives as shown in the following table.
Study Objective Y/N
Instruments and equipment for winter road condition measurements? N
Quantification of winter road condition measurements? Y
Research gaps? Y

Winter Maintenance Performance Measurement Using Friction Testing
November 2009 A-67
Title: International PIARC Experiment to Compare and Harmonize Texture and Skid Resistance Measurements
Author and Date: The World Road Association (PIARC) Technical Committee on Surface Characteristics, 1995
This research compared different methods and devices used for measuring skid resistance around the world in order to develop relationships for converting their respective results into a common international friction scale. The main reasons for developing a common scale were to promote the exchange of research between countries and to standardize pavement specifications. At the same time, each country could still continue to use their traditional measuring methods. A total of 47 different measuring devices were evaluated, representing 16 countries from around the world. These included three types of friction measuring devices (side force, fixed slip, and lock wheel systems) and three types of macrotexture measuring devices (profilometers, volumetric, and outflow). These devices were tested at 54 sites encompassing a wide variety of pavement types and surface conditions. All tests were conducted on actual pavements in Spain and Belgium, during the months of September and October. Tests were conducted at speeds of 30, 60, and 90 km/hr. Test results were entered into a database, which was subsequently used to develop relationships between the friction testing devices. The various parameters produced by the macrotexture measuring devices were also compared with the volumetric mean texture depth measurement. The end result was the establishment of the International Friction Index (IFI), a harmonized index based on a friction measurement and a texture measurement provided by a given device. It was demonstrated that the IFI can typically be determined within +/- 0.03 of the actual friction number, using the relationships identified by this research. Although, this research does identify many types of instruments and equipment used for measuring skid resistance, there is no specific mention of winter operations. There is also no mention of winter road condition measurements.

Winter Maintenance Performance Measurement Using Friction Testing
November 2009 A-68
The report provides ten recommendations for future research, the most relevant of which include:
• Studying the effect of air temperature, surface temperature, and relative humidity on friction equipment;
• Understanding how texture shape levels relate to friction; and • Determining the sensitivity of friction measuring devices to varying speeds.
In summary, this paper only covers one of the study’s objectives.
Meeting Study Objectives Y/N
Instruments and equipment for winter road condition measurements? N
Quantification of winter road condition measurements? N
Research gaps Y

Winter Maintenance Performance Measurement Using Friction Testing
November 2009 A-69
Topic: Vehicle Infrastructure Integration
Title: Vehicle Infrastructure Integration: More Than a Very Intriguing Idea
Author and Date: Wayne K. Tanda, P.E., PTOE and Gary Piotrowicz, P.E., PTOE, 2007
This report discusses Vehicle Infrastructure Integration (VII) at a fairly conceptual level, outlining the possible benefits of implementing such a system. Vehicle-to-vehicle and vehicle-to-infrastructure communications are discussed. The VII systems would utilize data from a combination of on-vehicle sensors, such as those currently used for automatic operation and maintenance of a vehicle, and global positioning systems to couple the vehicle data with geographical considerations. The data would be transmitted to roadside equipment (RSE) using the FCC allocated 75 MHz spectrum. The RSEs would be strategically located at intersections and alongside freeways and interchanges on rural freeways. The authors envision two main uses for the data collected by the VII system. Firstly, anonymous data would be used to communicate with other vehicles and with traffic control devices to provide the driver with warnings to prevent collisions. Secondly, the driver may subscribe to personalized services such as route guidance or electronic toll payment. The authors also outline possible benefits to local transportation officials including: real-time adjustment of traffic signals, advanced preemption for emergency services, traffic volume data for land use planning, evaluation of arterial efficiency, balancing of traffic load, implementation of warning systems, special event information, and road quality and weather monitoring. There are currently two field tests taking place; one in the Detroit area and the other in California. In parallel with the field testing, laboratory testing and VII coalition work is taking place to address a number of outstanding issues such as: communication technology to use, deployment strategies, operations and maintenance issues, governance, funding, privacy of information and target deployment dates. This report is more conceptual than practical. It outlines the benefits of a VII system and some of the challenges that must be overcome in order to implement such a system.

Winter Maintenance Performance Measurement Using Friction Testing
November 2009 A-70
In summary, the report meets two of the objectives for this study.
Meeting Study Objectives Y/N
Instruments and equipment for winter road condition measurements? Y
Quantification of winter road condition measurements? Y
Research gaps N

Winter Maintenance Performance Measurement Using Friction Testing
November 2009 A-71
Title: Vehicle Infrastructure Integration Test Beds Planned for Detroit
Author and Date: Catherine A. Cardno, Ph.D., 2007
This is a very short article discussing the Vehicle Infrastructure Integration (VII) testing currently taking place in Michigan. The article states that the VII testing will gather information from vehicles about aspects such as speed of travel, air temperature, road surface conditions, windshield wiper use, and engagement of shocks and antilock brakes. This information will be used to help state transportation departments reduce accidents and better manage highways by determining where slippery pavements are and identify problem areas faster. The tests are beginning with a handful of specially equipped vehicles, expected to rise to 3,000 over the next 2 years. Motorola is currently outfitting the test vehicles with laptops, modems and video cameras that use the existing IEEE 802.11 standards for communication. The current stage of testing will help determine if moving vehicles can connect to the Internet, exchange information and continuously receive updates. There are plans for more testing in San Francisco and Michigan. A viability decision is expected some time in the Spring of 2008. In summary, the report meets two of the objectives for this study.
Meeting Study Objectives Y/N
Instruments and equipment for winter road condition measurements? Y
Quantification of winter road condition measurements? Y
Research gaps N

Winter Maintenance Performance Measurement Using Friction Testing
November 2009 A-72
Title: Weather & Road Condition Product Improvements Enabled by Vehicle Infrastructure Integration (VII)
Authors and Date: William P. Mahoney, Kevin R. Petty, Richard R. Wagoner, 2006
This is a PowerPoint presentation by the National Center for Atmospheric Research. Vehicle Infrastructure Integration (VII) is defined as “Vehicle to Infrastructure (V-I) and Vehicle to Vehicle (V-V) communication through Dedicated Short Range Communications (DSRC-wireless radio comm. 5.9 GHz)” (slide 2). This allows vehicles ahead to communicate road conditions such as low friction to the vehicles behind as well as to roadside equipment. Weather and road condition data from multiple sources could be compiled into a real time database accessible by vehicles. Precipitation detection and modelling is from the vehicle data is possible. The benefits of using VII include informing drivers of upcoming road surface conditions, and improved weather modelling using the data collected from drivers. The presentation is largely hypothetical stressing what possibilities could exist with the implementation of this technology. In summary, equipment for road condition measurements are mentioned in this presentation but not described in detail and road condition measurements are not quantified.
Meeting Study Objectives Y/N
Instruments and equipment for winter road condition measurements? Y
Quantification of winter road condition measurements? N
Research gaps? Y

Winter Maintenance Performance Measurement Using Friction Testing
November 2009 A-73
Title: Enhancing Road Weather Information Through Vehicle Infrastructure Integration
Authors and Date: Kevin R. Petty, William P. Mahoney III, 2006
This document discusses Vehicle Infrastructure Integration (VII) which utilizes vehicle and telecommunications technology to allow vehicles to communicate with each other and with infrastructure via wireless radio communication at a frequency of 5.9 GHz. The information transferred in VII is intended to improve safety on the road. Potential applications of a success VII system apply to: intersection violation, lane departure, collision notification warnings, optimizing signal timing and electronic tolls. VII is a program comprised of the US Department of Transportation (DOT), American Association of State Highway and Transportation Officials (AASHTO), automobile manufacturers, and several state DOTs. Together, these organizations are working to develop and introduce the system to the United States. The vehicles will be fitted with probes that collect the data to be shared. This data is transmitted to road side equipment when in range and will subsequently be shared with subscribers. Data collected are either periodic (for example, temperature) or event driven (for example, braking). Pavement condition is assessed by sensors mounted on individual vehicles for: braking, pavement temperature, traction control, stability control, and the anti-lock braking system. There is a data-collecting test vehicle in Detroit and there are plans to further improve the weather and road condition products from other test vehicles. This method of having vehicles across the U.S. transmitting data simultaneously will provide more detailed information than is currently available from radar systems. It also eliminates the inaccuracies of radar such as anomalous propagation, which results in the reporting of precipitation when there is none or when precipitation that does not actually reach the ground. Winter maintenance management would benefit as pavement conditions, pavement temperatures and areas with slippery pavement are identified. Further research is needed regarding the measurement probes, processing, fusing, and controlling the quality of data. In summary, this document does not focus on friction or winter road condition measurements. Winter road conditions are not quantified, and further friction research areas are not mentione
Meeting Study Objectives Y/N
Instruments and equipment for winter road condition measurements? Y
Quantification of winter road condition measurements? N
Research gaps? N

.
.

Winter Maintenance Performance Measurement Using Friction Testing
November 2009 B-1
APPENDIX B CURRENT PRACTICES SURVEY QUESTIONNAIRE AND
SURVEYED ORGANIZATIONS AND INDIVIDUALS

Winter Maintenance Performance Measurement Using Friction Testing
November 2009 B-2
THIS PAGE INTENTIONALLY LEFT BLANK

Winter Maintenance Performance Measurement Using Friction Testing
November 2009 B-3
Winter Maintenance Performance Measurement Using Friction Testing Current Practices Survey
Name: Phone: Agency: Date:
Please note that your agency may be contacted by phone to discuss your responses.
1. Does your agency conduct winter road surface condition measurements, such as friction measurements, using instruments and/or equipment? Are visual assessments being conducted as well?
2. What are the main objectives for conducting road condition measurements under
winter conditions? Are there initiatives to include more objectives in the future? For example, if the current main objective is to assess contractor performance through a review of winter road surface condition measurements, are there initiatives to further use the measurement data for informing the public about driving conditions?
3. If physical data is collected, what equipment is being used? What data output is
available from this equipment? What is the relationship between the data output and the quantification of winter road surface conditions? If available, please attach any documents that provide information on the equipment and the data output.

Winter Maintenance Performance Measurement Using Friction Testing
November 2009 B-4
4. Based on your experience, what are the advantages and disadvantages of the equipment used for collecting winter road surface condition measurements (identified in Question 3)?
5. Has your agency conducted any pilot tests related to winter road surface conditions?
If so, please provide any relevant information, including test procedures and results.
6. Does your agency adopt different service level for different roadway classification? If so, please attach any relevant information.

Winter Maintenance Performance Measurement Using Friction Testing
November 2009 B-5
7. Based on your experience with winter road surface condition measurements, what are the lessons learned so far? What are the issues with the current application(s)? Please identify any further research, testing and other technical actions that you consider necessary for improving the application(s).
Please attach or include any relevant sample reports, publications, literature and brochures.

Winter Maintenance Performance Measurement Using Friction Testing
November 2009 B-6
TABLE B-1 SURVEYED ORGANIZATIONS AND INDIVIDUALS Canadian Road Agencies Ministry Status Alberta Transportation Survey completed British Columbia Ministry of Transportation Survey completed Manitoba Infrastructure and Transportation Survey completed Ontario Ministry of Transportation Survey completed New Brunswick Department of Transportation Survey completed Newfoundland and Labrador Transportation and Works Survey completed Nova Scotia Department of Transportation and Infrastructure Survey completed Quebec Ministere des Transports Survey completed Yukon Department of Highways and Public Works Survey completed Northwest Territories Department of Transportation No response received to date Prince Edward Island Transportation and Public Works No response received to date Saskatchewan Highways and Infrastructure No response received to date Nunavut Department of Economic Development & Transportation (EDT)
No one from the department monitors road conditions as all roads are community roads.
Municipalities Status City of Calgary Survey completed City of Charlottetown Survey completed City of Edmonton Survey completed City of Fredericton Survey completed City of Kamloops Survey completed City of Ottawa Survey completed City of Montreal Survey completed City of Prince Albert Responded, did not complete questionnaire City of Prince George Survey completed City of Regina Survey completed City of Toronto Survey completed City of Whitehorse Survey completed City of Williams Lake Survey completed City of Winnipeg Survey completed City of Yellowknife Survey completed Halifax Regional Municipality Responded, did not complete questionnaire MRDC Operations Corporation Survey completed Region Municipality of Waterloo Survey completed Town of Gander Survey completed City of Campbellton No response received to date City of Corner Brook No response received to date City of Edmundston No response received to date City of Fort St. John No response received to date City of Grande Prairie No response received to date City of Yorkton No response received to date Regional Municipality of Wood Buffalo No response received to date Cape Breton Regional Municipality No response received to date Quebec City No response received to date

Winter Maintenance Performance Measurement Using Friction Testing
November 2009 B-7
TABLE B-1 SURVEYED ORGANIZATIONS AND INDIVIDUALS (continued)
US Road Agencies Agency Status Iowa Department of Transportation Survey completed Ohio Department of Transportation Survey completed Wisconsin Department of Transportation Survey completed Northern Arizona University Responded to survey, did not complete questionnaire University of Illinois, Urbana-Champaign Responded to survey, did not complete questionnaire Indiana Department of Transportation No response received to date Minnesota Department of Transportation No response received to date University of Iowa and Asset Insight Technologies No response received to date Utah Department of Transportation No response received to date Virginia Department of Transportation No response received to date Wyoming Department of Transportation No response received to date International Road Agencies Agency Status Australia New South Wales Roads and Traffic Authority Survey completed Danish Road Directorate Survey completed Finnish Road Administration (FinnRA) Survey completed Germany Federal Highway Research Institute (BASt) Survey completed Netherlands Ministry of Transport and Public Works Survey completed New Zealand Transport Agency (NZTA)t Survey completed Norwegian Public Roads Administration Survey completed Swedish National Road Administration Survey completed United Kingdom Highways Agency Survey completed France Laboratoire central des Ponts et Chaussées (LCPC) (Public Works Research Laboratory) No response received to date
Japan Expressway Holding and Debt, Repayment Agency No response received to date Consultants Name and Agency Status Glen Brown, IceChek Instruments Limited Has forwarded relevant information to Opus Kim Linsenmayer, CTC & Associates Has forwarded relevant information to Opus Richard (Dick) Hanneman, Salt Institute Has forwarded relevant information to Opus Sean Riley, Cargill Deicing Technology Has forwarded relevant information to Opus Don Halliday, Halliday Technologies Has forwarded relevant information to Opus Jim Wambold, CDRM Did not provide relevant information Gary Brooks, Carmacks Enterprises Has forwarded relevant information to Opus

.
.

Winter Maintenance Performance Measurement Using Friction Testing
November 2009 C-1
APPENDIX C CANADIAN SURVEY RESPONSES

Winter Maintenance Performance Measurement Using Friction Testing
November 2009 C-2

Winter Maintenance Performance Measurement Using Friction Testing
November 2009 C-3
RO
AD W
EATH
ER
INFO
RM
ATIO
N
SYST
EM?
VISU
AL
INSP
ECTI
ON
RO
AD S
UR
FAC
E FR
ICTI
ON
M
EASU
REM
ENT
EQU
IPM
ENT
(See
Tab
le 2
fo
r Det
ails
)
ALB
ERTA
TR
ANSP
OR
TATI
ON
X√
√ O
nly
pilo
t stu
dies
√√
√Ba
sed
on A
ADT
-To
info
rm th
e pu
blic
of
win
ter r
oad
codi
tions
for
maj
or p
rovi
ncia
l hig
hway
s in
Al
berta
Futu
re o
bjec
tives
may
be:
-To
mea
sure
con
tract
or
perfo
rman
ce-T
o pr
ovid
e qu
antit
ativ
e w
inte
r roa
d co
nditi
on
info
rmat
ion
via
win
ter
frict
ion
mea
surm
ents
Rou
gh p
avem
ent p
rodu
ce m
ore
erra
tic fr
ictio
n re
sults
bec
ause
fri
ctio
n te
stin
g w
heel
s bo
unce
ar
ound
mor
e• D
evic
es a
re n
ot a
ccur
ate
thro
ugh
curv
es (t
oo m
uch
side
fo
rce
on ti
re)
• No
stan
dard
s fo
r man
ufac
ture
an
d us
e of
fric
tion
test
ing
equi
pmen
t• H
allid
ay e
quip
men
t pro
duce
d go
od q
ualit
ativ
e an
d re
peat
able
qu
antit
ativ
e re
sults
• Ice
Che
k eq
uipm
ent p
rodu
ced
good
qua
litat
ive
resu
lts, b
ut th
ey
wer
e no
t rep
eata
ble
(poo
r qu
antit
ativ
e da
ta)
BC
MoT
X√
XX
X
√W
inte
r Cla
ssifi
catio
n A
thro
ugh
F. "A
" bei
ng h
igh
volu
me
traffi
c (>
5,00
0 A
DT
coun
t) an
d F
bein
g ro
ads
not m
aint
aine
d in
the
win
ter.
N/A
N/A
GO
VER
NM
ENT
OF
YUK
ON
√√
XX
√√
(But
no
writ
ten
proc
edur
es)
- To
appl
y sa
nd/s
alt w
here
w
ould
be
the
mos
t effe
ct
and
to e
nsur
e th
at s
and/
salt
is u
sed
econ
omic
ally
- Stil
l lea
rnin
g ho
w to
inte
rpre
t th
e R
WIS
dat
a so
that
it is
use
ful
in e
very
day
win
ter m
aint
enan
ce
oper
atio
ns
MAN
ITO
BA
INFR
ASTR
UC
TUR
E &
TR
ANSP
OR
TATI
ON
√√
X√
X√
N/A
- We
shou
ld b
e ut
ilizin
g th
e in
form
atio
n co
llect
ed to
sup
port
polic
y on
trig
gers
for t
reat
men
ts
on w
inte
r ope
ratio
ns, c
urre
ntly
w
e st
ill le
ave
flexi
bilit
y in
the
oper
atio
ns to
del
iver
var
ious
tre
amen
ts u
nder
sim
ilar
cond
ition
s.
TAB
LE C
-1 S
umm
ary
of R
espo
nses
to D
ate
- Gen
eral
Sum
mar
y
AGEN
CY
WIN
TER
RO
AD S
UR
FAC
E C
ON
DIT
ION
ASS
ESSM
ENT
PILO
T TE
STS
CO
ND
UC
TED
(S
ee T
able
2
for D
etai
ls)
DIF
FER
ENT
SER
VIC
E LE
VELS
FO
R D
IFFE
REN
T C
LASS
IFIC
ATIO
NS
OB
JEC
TIVE
S FO
R
CO
ND
UC
TIN
G R
OAD
SU
RFA
CE
MEA
SUR
EMEN
TS
LES
SON
S LE
ARN
ED /
FUR
THER
RES
EAR
CH
N/A
= A
genc
y re
spon
ded,
but
has
no
info
rmat
ion
to p
rovi
de

Winter Maintenance Performance Measurement Using Friction Testing
November 2009 C-4
RO
AD W
EATH
ER
INFO
RM
ATIO
N
SYST
EM?
VISU
AL
INSP
ECTI
ON
RO
AD S
UR
FAC
E FR
ICTI
ON
M
EASU
REM
ENT
EQU
IPM
ENT
(See
Tab
le 2
fo
r Det
ails
)
NEW
BR
UN
SWIC
K
DEP
ARTM
ENT
OF
TRAN
SPO
RTA
TIO
N√
√X
√X
√Se
rvic
e Le
vels
def
ined
un
der W
inte
r Ser
vice
Pol
icy
-To
esta
blis
h ap
prop
riate
st
orm
resp
onse
in s
uppo
rt of
the
Dep
artm
enta
l Win
ter
Serv
ice
Polic
y-T
o pr
ovid
e an
ove
rvie
w o
f w
inte
r driv
ing
cond
ition
s to
th
e pu
blic
-Mor
e re
sear
ch is
requ
ired
in
orde
r to
extra
pola
te R
WIS
En
viro
nmen
tal S
enso
r Sta
tions
(E
SS) m
easu
rem
ents
to
cond
ition
s on
sur
roun
ding
rout
es-M
ore
rese
arch
is re
quire
d to
pr
ovid
e co
nsis
tent
and
non
-pr
oprie
tary
mea
sure
men
ts o
f pa
vem
ent c
ondi
tions
for E
SS
sens
ors
-A s
tand
ard
dict
iona
ry o
f ro
adw
ay s
urfa
ce c
ondi
tions
is
requ
ired
in o
rder
to p
rovi
de A
tra
nsfe
rabl
e an
d co
nsis
tent
in
dica
tion
of w
inte
r roa
d co
nditi
ons
for t
rave
ller
info
rmat
ion
syst
ems.
NO
VA S
CO
TIA
DO
T &
IRX
√X
Xx
√ Ba
sed
on A
ADT.
Hig
her
AAD
T ar
e of
hig
her p
riorit
y
- To
mea
sure
how
wel
l we
perfo
rm o
ur w
inte
r m
aint
enan
ce a
nd a
ny
info
rmat
ion
we
can
conv
ey
to th
e pu
blic
rega
rdin
g w
inte
r roa
d co
nditi
ons
is o
f in
tere
st to
our
Dep
artm
ent
N/A
LES
SON
S LE
ARN
ED /
FUR
THER
RES
EAR
CH
WIN
TER
RO
AD S
UR
FAC
E C
ON
DIT
ION
ASS
ESSM
ENT
PILO
T TE
STS
CO
ND
UC
TED
(S
ee T
able
2
for D
etai
ls)
DIF
FER
ENT
SER
VIC
E LE
VELS
FO
R D
IFFE
REN
T C
LASS
IFIC
ATIO
NS
OB
JEC
TIVE
S FO
R
CO
ND
UC
TIN
G R
OAD
SU
RFA
CE
MEA
SUR
EMEN
TS
TAB
LE C
-1 S
umm
ary
of R
espo
nses
to D
ate
- Gen
eral
Sum
mar
y
AGEN
CY
N/A
= A
genc
y re
spon
ded,
but
has
no
info
rmat
ion
to p
rovi
de

Winter Maintenance Performance Measurement Using Friction Testing
November 2009 C-5
RO
AD
WEA
THER
IN
FOR
MAT
ION
SY
STEM
?
VISU
AL
INSP
ECTI
ON
RO
AD S
UR
FAC
E FR
ICTI
ON
M
EASU
REM
ENT
EQU
IPM
ENT
(See
Tab
le 2
fo
r Det
ails
)
ON
TAR
IO D
ESIG
N
CO
NTR
ACTS
AN
D
STAN
DAR
DS
OFF
ICE
X√
√√
√√
Base
d on
win
ter t
raffi
c vo
lum
e
-To
obta
in a
utom
atic
, ob
ject
ive
data
for w
inte
r ro
ad re
ports
and
pe
rform
ance
mea
sure
s.-T
o un
ders
tand
the
caus
es
of lo
cal v
aria
tions
in s
now
co
nditi
ons
to a
id in
hig
hway
pl
anni
ng a
nd o
pera
tions
.-T
o co
mm
unic
ate
with
the
publ
ic-T
o ob
tain
acc
epta
nce
by
cont
ract
ors
– C
ost r
educ
tion,
co
ntra
ct li
tigat
ion
– C
ontra
ctor
pe
rform
ance
sta
ndar
ds th
at
are
rela
ted
to d
rivin
g sa
fety
-To
obta
in a
ccep
tanc
e by
M
TO
–
Cos
t red
uctio
n,
pape
rwor
k re
duct
ion
– S
alt r
educ
tion
– P
ublic
saf
ety
– T
imel
y ro
ad c
ondi
tion
repo
rts
Cur
rent
situ
atio
n:-S
ubje
ctiv
e re
porti
ng o
f roa
d co
nditi
on d
urin
g w
inte
r sto
rms
-Irre
gula
r mon
itorin
g in
terv
al,
inac
cura
te re
porti
ng o
f bar
e pa
vem
ent e
vent
For c
usto
mer
-bas
ed s
tand
ards
, qu
estio
ns to
ans
wer
incl
ude:
w
hat s
ervi
ce le
vel i
s im
porta
nt to
us
ers?
how
do
cost
s of
ser
vice
va
ry w
ith le
vel o
f ser
vice
? Al
so
to e
stab
lish
a be
nefit
-cos
t cur
ve
for w
inte
r ser
vice
.Ke
y fa
ctor
s af
fect
ing
corr
elat
ion
betw
een
devi
ces:
-Nor
mal
forc
e (s
uffic
ient
wei
ght
to m
aint
ain
good
sur
face
co
nrta
ct o
n bu
mpy
ice)
-Tire
wea
r on
dry
pave
men
t-S
lip ra
tio (m
ust b
e co
nsta
nt fo
r co
nsis
tent
read
ings
; ang
led
whe
el v
arie
s as
veh
icle
turn
s)-A
cros
s-la
ne p
ositi
on;
lane
cl
ears
from
cen
trelin
e ou
twar
d;
all d
evic
es m
ust
mea
sure
at
sam
e po
sitio
n ac
ross
pav
emen
t
TAB
LE C
-1 S
umm
ary
of R
espo
nses
to D
ate
- Gen
eral
Sum
mar
y
AGEN
CY
WIN
TER
RO
AD S
UR
FAC
E C
ON
DIT
ION
ASS
ESSM
ENT
PILO
T TE
STS
CO
ND
UC
TED
(S
ee T
able
2
for D
etai
ls)
DIF
FER
ENT
SER
VIC
E LE
VELS
FO
R D
IFFE
REN
T C
LASS
IFIC
ATI
ON
S
OB
JEC
TIVE
S FO
R
CO
ND
UC
TIN
G R
OAD
SU
RFA
CE
MEA
SUR
EMEN
TS
LES
SON
S LE
ARN
ED /
FUR
THER
RES
EAR
CH
N/A
= A
genc
y re
spon
ded,
but
has
no
info
rmat
ion
to p
rovi
de
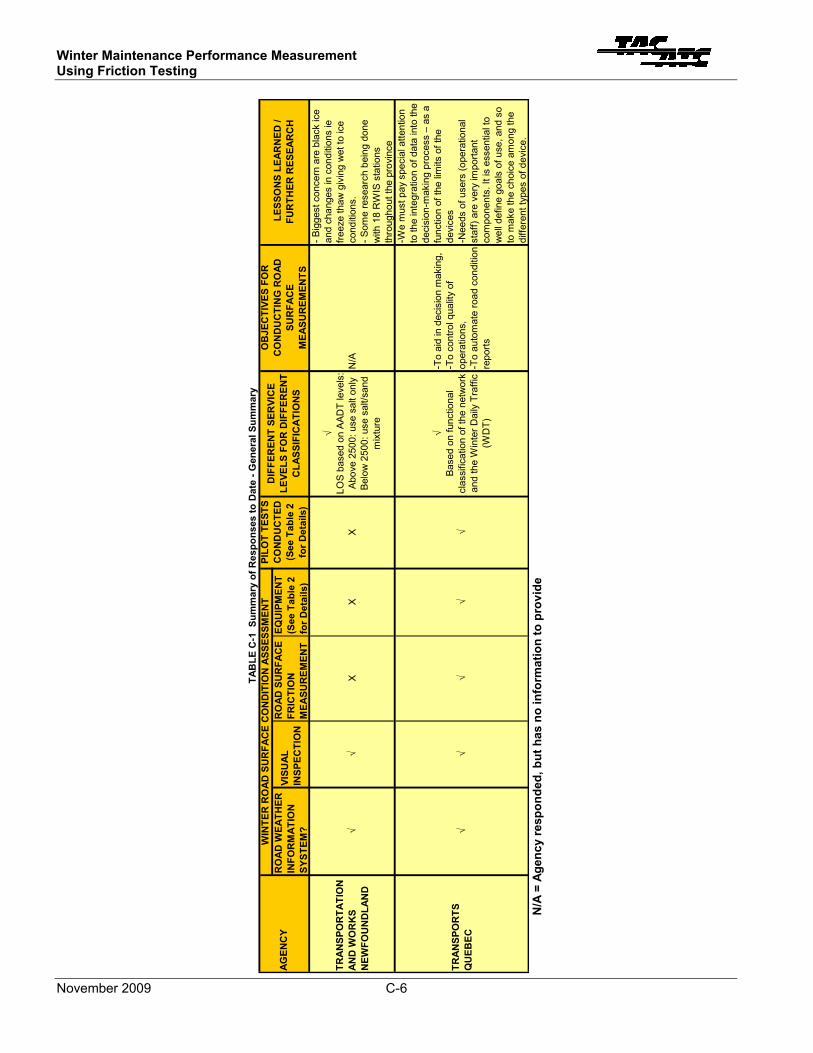
Winter Maintenance Performance Measurement Using Friction Testing
November 2009 C-6
RO
AD
WEA
THER
IN
FOR
MAT
ION
SY
STEM
?
VISU
AL
INSP
ECTI
ON
RO
AD S
UR
FAC
E FR
ICTI
ON
M
EASU
REM
ENT
EQU
IPM
ENT
(See
Tab
le 2
fo
r Det
ails
)
TRA
NSP
OR
TATI
ON
AN
D W
OR
KS
NEW
FOU
ND
LAN
D√
√X
XX
√LO
S ba
sed
on A
ADT
leve
ls:
Abov
e 25
00: u
se s
alt o
nly
Belo
w 2
500:
use
sal
t/san
d m
ixtu
re
N/A
- Big
gest
con
cern
are
bla
ck ic
e an
d ch
ange
s in
con
ditio
ns ie
fre
eze
thaw
giv
ing
wet
to ic
e co
nditi
ons.
- S
ome
rese
arch
bei
ng d
one
with
18
RW
IS s
tatio
ns
thro
ugho
ut th
e pr
ovin
ce
TRA
NSP
OR
TS
QU
EBEC
√√
√√
√
√Ba
sed
on fu
nctio
nal
clas
sific
atio
n of
the
netw
ork
and
the
Win
ter D
aily
Tra
ffic
(WD
T)
-To
aid
in d
ecis
ion
mak
ing,
-T
o co
ntro
l qua
lity
of
oper
atio
ns,
-To
auto
mat
e ro
ad c
ondi
tion
repo
rts
-We
mus
t pay
spe
cial
atte
ntio
n to
the
inte
grat
ion
of d
ata
into
the
deci
sion
-mak
ing
proc
ess
– as
a
func
tion
of th
e lim
its o
f the
de
vice
s-N
eeds
of u
sers
(ope
ratio
nal
staf
f) ar
e ve
ry im
porta
nt
com
pone
nts.
It is
ess
entia
l to
wel
l def
ine
goal
s of
use
, and
so
to m
ake
the
choi
ce a
mon
g th
e di
ffere
nt ty
pes
of d
evic
e.
TAB
LE C
-1 S
umm
ary
of R
espo
nses
to D
ate
- Gen
eral
Sum
mar
y
AGEN
CY
WIN
TER
RO
AD S
UR
FAC
E C
ON
DIT
ION
ASS
ESSM
ENT
PILO
T TE
STS
CO
ND
UC
TED
(S
ee T
able
2
for D
etai
ls)
DIF
FER
ENT
SER
VIC
E LE
VELS
FO
R D
IFFE
REN
T C
LASS
IFIC
ATI
ON
S
OB
JEC
TIVE
S FO
R
CO
ND
UC
TIN
G R
OAD
SU
RFA
CE
MEA
SUR
EMEN
TS
LES
SON
S LE
ARN
ED /
FUR
THER
RES
EAR
CH
N/A
= A
genc
y re
spon
ded,
but
has
no
info
rmat
ion
to p
rovi
de

Winter Maintenance Performance Measurement Using Friction Testing
November 2009 C-7
RO
AD W
EATH
ER
INFO
RM
ATIO
N
SYST
EM?
VISU
AL
INSP
ECTI
ON
RO
AD S
UR
FAC
E FR
ICTI
ON
M
EASU
REM
ENT
EQU
IPM
ENT
(See
Tab
le 2
fo
r Det
ails
)
CIT
Y O
F C
ALG
ARY,
AL
BER
TA√
√X
√X
√M
ost t
rave
lled
road
s do
ne
first
. Prio
ritiz
ed 1
-5.
-To
mon
itor r
oad
cond
ition
s(dr
y, w
et, e
tc.)
-To
dete
ct c
ondi
tions
that
w
ill m
ay le
ad to
road
s fre
ezin
g, w
hich
wou
ld
prom
pt m
aint
enan
ce
oper
atio
ns.
-Fut
ure
obje
ctiv
e m
ay to
be
shar
e th
e in
form
atio
n w
ith
the
publ
ic th
roug
h th
eir
Traf
fic M
anag
emen
t Cen
tre.
-Cur
rent
ly re
view
ing
thei
r RW
IS
site
s to
ens
ure
ther
e is
goo
d co
vera
ge c
ross
the
City
.-C
urre
ntly
revi
ewin
g th
eis
abilit
ies
to s
hare
thei
r in
form
atio
n w
ith th
e pu
blic
th
roug
ht T
raffi
c M
anag
emen
t C
entre
.
CIT
Y O
F C
HAR
LOTT
ETO
WN
X√
XX
XX
N/A
- Exp
erie
nce
says
equ
ipm
ent
shou
ld b
e us
ed fo
r col
lect
ing
win
ter r
oad
surfa
ce
mea
sure
men
ts, b
ut in
a s
mal
l ci
ty li
ke C
harlo
tteto
wn
it is
di
fficu
lt to
sel
l the
adv
anta
ges
to
Cou
ncil
and
Upp
er M
anag
emen
t (in
volv
e tra
inin
g st
aff a
nd
purc
hasi
ng e
quip
men
t tha
t so
met
imes
take
s a
cons
ider
able
am
ount
of t
ime
and
ener
gy)
CIT
Y O
F ED
MO
NTO
NX
√X
XX
No
resp
onse
pro
vide
dN
/AN
/A
CIT
Y O
F FR
EDER
ICTO
NX
√X
√X
√Pr
iorit
y 1:
Arte
rials
& M
ajor
C
olle
ctor
s (b
ared
)P
riorit
y 2:
Col
lect
ors
(Cen
trelin
e st
rip b
ared
)Pr
iorit
y 3:
Loc
al &
R
esid
entia
l (pl
owed
eve
ry
stor
m)
- Vis
ual i
nspe
ctio
n to
ens
ure
LOS
stip
ulat
ed in
sno
w
cont
rol p
lan
is p
rovi
ded.
- Tru
ck m
ount
ed
tem
pera
ture
sen
sors
use
d to
ass
ist i
n sp
read
rate
s fo
r sa
lt tru
cks
N/A
TAB
LE C
-1 S
umm
ary
of R
espo
nses
to D
ate
- Gen
eral
Sum
mar
y
AGEN
CY
WIN
TER
RO
AD S
UR
FAC
E C
ON
DIT
ION
ASS
ESSM
ENT
PILO
T TE
STS
CO
ND
UC
TED
(S
ee T
able
2
for D
etai
ls)
DIF
FER
ENT
SER
VIC
E LE
VELS
FO
R D
IFFE
REN
T C
LASS
IFIC
ATIO
NS
OB
JEC
TIVE
S FO
R
CO
ND
UC
TIN
G R
OAD
SU
RFA
CE
MEA
SUR
EMEN
TS
LES
SON
S LE
ARN
ED /
FUR
THER
RES
EAR
CH
N/A
= A
genc
y re
spon
ded,
but
has
no
info
rmat
ion
to p
rovi
de

Winter Maintenance Performance Measurement Using Friction Testing
November 2009 C-8
RO
AD W
EATH
ER
INFO
RM
ATIO
N
SYST
EM?
VISU
AL
INSP
ECTI
ON
RO
AD S
UR
FAC
E FR
ICTI
ON
M
EASU
REM
ENT
EQU
IPM
ENT
(See
Tab
le 2
fo
r Det
ails
)
CIT
Y O
F K
AMLO
OPS
, B
RIT
ISH
CO
LUM
BIA
√√
X√
X√
- To
aid
in th
e de
cisi
on o
f eq
uipm
ent d
eplo
ymen
t- T
o de
cide
whi
ch o
f san
d,
salt,
and
de-
icer
is th
e be
st
mat
eria
l acc
ordi
ng to
su
rface
tem
pera
ture
N/A
CIT
Y O
F M
ON
TREA
L,
QU
EBEC
X√
XX
√√
- To
mak
e su
re th
e pa
vem
ent i
s sa
fe- V
isua
l eva
luat
ion
is s
uffic
ient
fo
r the
mom
ent
CIT
Y O
F O
TTAW
AX
√X
XX
√M
aint
enan
ce C
lass
es 1
(H
igh
Prio
rity
Roa
ds)
thro
ugh
5 (R
esid
entia
l R
oads
and
Lan
es) w
ith
diffe
rent
sno
w c
lear
tim
es
and
treat
men
t sta
ndar
ds
N/A
N/A
CIT
Y O
F PR
INC
E AL
BER
TX
√X
XX
XN
/AN
/A
CIT
Y O
F PR
INC
E G
EOR
GE,
BR
ITIS
H
CO
LUM
BIA
X√
XX
X√
Roa
ds a
re c
lass
ified
as
# 1,
2,3,
and
4’s.
The
se ro
ads
are
then
don
e in
that
ord
er.
N/A
N/A
CIT
Y O
F R
EGIN
A,
SASK
ATC
HEW
ANX
√X
XX
√N
/AN
/A
CIT
Y O
F TO
RO
NTO
√√
X√
X
√Le
vel o
f ser
vice
for s
altin
g an
d pl
ough
ing
All
road
s ar
e m
aint
aine
d ba
sed
on ro
ad
clas
sific
atio
n: e
xpre
ssw
ays,
ar
teria
ls, c
olle
ctor
s, a
nd
loca
ls
- Mob
ilizat
ion
of w
inte
r eq
uipm
ent -
sal
ters
or
plou
ghs
- Esc
alat
ion
of e
vent
from
sa
lting
to p
loug
hing
- Ens
ure
that
leve
l of s
ervi
ce
is b
eing
met
- Mea
sure
con
tract
or
perfo
rman
ce
N/A
TAB
LE C
-1 S
umm
ary
of R
espo
nses
to D
ate
- Gen
eral
Sum
mar
y
AGEN
CY
WIN
TER
RO
AD S
UR
FAC
E C
ON
DIT
ION
ASS
ESSM
ENT
PILO
T TE
STS
CO
ND
UC
TED
(S
ee T
able
2
for D
etai
ls)
DIF
FER
ENT
SER
VIC
E LE
VELS
FO
R D
IFFE
REN
T C
LASS
IFIC
ATIO
NS
OB
JEC
TIVE
S FO
R
CO
ND
UC
TIN
G R
OAD
SU
RFA
CE
MEA
SUR
EMEN
TS
LES
SON
S LE
ARN
ED /
FUR
THER
RES
EAR
CH
N/A
= A
genc
y re
spon
ded,
but
has
no
info
rmat
ion
to p
rovi
de

Winter Maintenance Performance Measurement Using Friction Testing
November 2009 C-9
RO
AD W
EATH
ER
INFO
RM
ATIO
N
SYST
EM?
VISU
AL
INSP
ECTI
ON
RO
AD S
UR
FAC
E FR
ICTI
ON
M
EASU
REM
ENT
EQU
IPM
ENT
(See
Tab
le 2
fo
r Det
ails
)
CIT
Y O
F W
HIT
EHO
RSE
X√
XX
X
√ Th
e C
ity O
f Whi
teho
rse
has
a S
now
and
Ice
Polic
y w
hich
is re
view
ed e
very
ye
ar a
nd a
ppro
ved
by
coun
cil.
This
set
s th
e le
vel
of s
ervi
ce a
nd th
e pr
iorit
y of
ro
ads.
N/A
Base
d on
pas
t exp
erie
nces
the
City
doe
s no
t use
stra
ight
Sal
t an
d no
w u
se 3
%to
5%
sal
t san
d m
ixtu
re.
CIT
Y O
F W
ILLI
AMS
LAK
E, B
RIT
ISH
C
OLU
MB
IAX
√X
√X
X
-To
prov
ide
safe
road
s th
roug
h ef
fect
ive
use
of
snow
and
ice
cont
rol
mea
sure
s, s
uch
as c
ontro
l an
d m
onito
ring,
use
of
witn
er a
bras
ives
, san
d sa
lt an
d m
agne
sium
chl
orid
e, in
a
way
that
ens
ures
road
sa
fety
is ta
ken
care
of w
ith
the
leas
t am
ount
of i
mpa
ct
to th
e en
viro
nmen
t
- It i
s im
porta
nt th
at fo
reca
stin
g co
nditi
ons
is p
riorit
ized
to e
nsur
e th
at th
e rig
ht p
rodu
cts
are
beig
n ap
plie
d at
the
right
tim
e
CIT
Y O
F W
INN
IPEG
√√
X√
√
√Pr
iorit
y 1:
Arte
rial &
R
egio
nal s
treet
s (w
ithin
12
hour
s, s
alt o
r san
d)Pr
iorit
y 2
- Col
lect
ors
& Lo
cal B
us R
oute
s (c
lear
ed
with
in 2
4 ho
urs,
onl
y sa
nd)
Prio
rity
3: R
esid
entia
l st
reet
s (c
lear
ed w
ithin
48
hour
s, o
nly
sand
use
d)
- RW
IS d
ata
colle
cted
for
use
on d
ecis
ion
mak
ing
for
type
of t
reat
men
t- F
or p
avem
ent
tem
pera
ture
/con
ditio
n fo
reca
stin
g
N/A
CIT
Y O
F YE
LLO
WK
NIF
EX
√X
XX
√ P
riorit
y 1
egm
ents
are
se
rvic
ed fi
rst,
and
Prio
rity
4 se
gmen
ts a
re d
one
last
.
To d
eter
min
e w
hich
rout
es
requ
ire s
andi
ngSa
ndin
g is
the
only
thin
g th
at
wor
ks o
n an
eco
nom
ic le
vel
TAB
LE C
-1 S
umm
ary
of R
espo
nses
to D
ate
- Gen
eral
Sum
mar
y
AGEN
CY
WIN
TER
RO
AD S
UR
FAC
E C
ON
DIT
ION
ASS
ESSM
ENT
PILO
T TE
STS
CO
ND
UC
TED
(S
ee T
able
2
for D
etai
ls)
DIF
FER
ENT
SER
VIC
E LE
VELS
FO
R D
IFFE
REN
T C
LASS
IFIC
ATIO
NS
OB
JEC
TIVE
S FO
R
CO
ND
UC
TIN
G R
OAD
SU
RFA
CE
MEA
SUR
EMEN
TS
LES
SON
S LE
ARN
ED /
FUR
THER
RES
EAR
CH
N/A
= A
genc
y re
spon
ded,
but
has
no
info
rmat
ion
to p
rovi
de

Winter Maintenance Performance Measurement Using Friction Testing
November 2009 C-10
RO
AD W
EATH
ER
INFO
RM
ATIO
N
SYST
EM?
VISU
AL
INSP
ECTI
ON
RO
AD S
UR
FAC
E FR
ICTI
ON
M
EASU
REM
ENT
EQU
IPM
ENT
(See
Tab
le 2
fo
r Det
ails
)H
alifa
x R
egio
nal
Mun
icip
ality
X√
XX
XX
N/A
N/A
MR
DC
O
PER
ATIO
NS
CO
RPO
RAT
ION
, N
EW B
RU
NSW
ICK
√√
X√
XX
(s
ame
leve
l of s
ervi
ce fo
r en
tire
faci
lity)
-Bar
e pa
vem
ents
with
in 2
4 ho
urs
(or e
arlie
r) fo
llow
ing
end
of w
inte
r sto
rm e
vent
.- C
heck
ed th
roug
h da
ily
road
pat
rols
- Cur
rent
ly p
low
in ta
ndem
(e
chel
on) w
hich
is a
saf
er
oper
atio
n an
d us
e sa
lt br
ine
solu
tion
REG
ION
OF
WAT
ERLO
O,
ON
TAR
IOX
√X
X
X T
he R
egio
n ha
s no
t co
nduc
ted
any
pilo
t tes
ts
rela
ting
to w
inte
r ro
ad s
urfa
ce
cond
ition
s
√(O
ntar
io R
egul
atio
n #2
39/0
2 M
inim
um
Mai
nten
ance
Sta
ndar
ds)
- To
ensu
re th
e ro
adw
ays
are
safe
for t
he m
otor
ing
publ
ic a
nd to
ens
ure
the
Reg
ion
is m
eetin
g ou
r re
quire
men
ts to
mai
ntai
n th
e ro
adw
ays
to th
e cu
rren
t st
anda
rds
adop
ted
by th
e R
egio
n- R
oads
mai
ntai
ned
by
cont
ract
or fo
rces
are
m
onito
red
usin
g a
visu
al
asse
ssm
ent t
o en
sure
they
ar
e m
aint
aini
ng th
e ro
ads
to
our s
tand
ards
N/A
TOW
N O
F G
AND
ER,
NEW
FOU
ND
LAN
DX
√X
XX
√C
olle
ctor
s sa
lted
to a
chie
ve
bare
pav
emen
t with
in 2
4 ho
urs.
Oth
er s
treet
s on
ly
salte
d or
san
ded
if ve
ry
slip
pery
N/A
N/A
TAB
LE C
-1 S
umm
ary
of R
espo
nses
to D
ate
- Gen
eral
Sum
mar
y
AG
ENC
Y
WIN
TER
RO
AD S
UR
FAC
E C
ON
DIT
ION
ASS
ESSM
ENT
PILO
T TE
STS
CO
ND
UC
TED
(S
ee T
able
2
for D
etai
ls)
DIF
FER
ENT
SER
VIC
E LE
VELS
FO
R D
IFFE
REN
T C
LASS
IFIC
ATIO
NS
OB
JEC
TIVE
S FO
R
CO
ND
UC
TIN
G R
OAD
SU
RFA
CE
MEA
SUR
EMEN
TS
LES
SON
S LE
ARN
ED /
FUR
THER
RES
EAR
CH
N/A
= A
genc
y re
spon
ded,
but
has
no
info
rmat
ion
to p
rovi
de

Winter Maintenance Performance Measurement Using Friction Testing
November 2009 C-11
DAT
A C
OLL
ECTE
DEQ
UIP
MEN
TR
ELAT
ION
SHIP
BET
WEE
N
DAT
A O
UTP
UT
AND
RO
AD
SUR
FAC
E C
ON
DIT
ION
ADVA
NTA
GES
DIS
ADVA
NTA
GES
DES
CR
IPTI
ON
PRO
CED
UR
ER
ESU
LTS
Fric
tion
num
ber
Hal
liday
RG
T Fr
ictio
n re
adin
g on
a s
cale
of
0 (lo
w) t
o 10
0 (h
igh)
Easy
to re
ad, g
ood
feed
back
, con
sist
ent
and
repe
atab
le
resu
lts
Cen
tre m
ount
ed w
heel
not
true
re
pres
enta
tion
of w
heel
trac
ks,
not a
ccur
ate
thro
ugh
curv
es, n
ot
dire
ctly
con
verte
d to
coe
ffici
ent
of fr
ictio
n, la
rge
data
file
s,
affe
cted
by
pave
men
t tex
ture
, do
es n
ot a
lway
s co
rres
pond
to
AMA
road
repo
rt
2005
: Hal
liday
R
GT
Stan
dard
in
spec
tion
circ
uit,
all
wea
ther
co
nditi
ons
Agre
ed w
ith o
ther
eq
uipm
ent,
cons
iste
nt,
repe
atab
le
Fric
tion
num
ber
IceC
heck
Fr
ictio
n Te
ster
Fric
tion
read
ing
on a
sca
le o
f 0
(low
) to
1.0
(hig
h)
Smal
l dat
a fil
es, t
ire
in w
heel
trac
ks,
usef
ul li
ght d
ispl
ay
Not
acc
urat
e th
roug
h cu
rves
, af
fect
ed b
y pa
vem
ent t
extu
re• R
esul
ts a
re n
ot re
peat
able
• Not
eas
ily c
onve
rted
to a
fri
ctio
n co
effic
ient
bec
ause
the
dow
nwar
d fo
rce
on th
e tir
e is
not
m
easu
red
• The
equ
ipm
ent i
s no
t rob
ust
enou
gh fo
r con
stan
t and
dai
ly
use
(loos
e bo
ld, e
xpos
ed w
ires,
m
ake
shift
con
nect
ions
, tro
uble
ge
tting
GPS
to “t
alk”
to th
e so
ftwar
e, e
tc.)
• Sm
all a
nd y
oung
com
pany
; on
ly s
old
abou
t 5 u
nits
for u
se;
equi
pmen
t nee
ds m
ore
test
ing
2008
: Ice
Che
ck
Fric
tion
Test
er
Stan
dard
in
spec
tion
circ
uit,
all
wea
ther
co
nditi
ons
Goo
d re
sults
in
slip
pery
co
nditi
ons,
qu
estio
nabl
e re
peat
ibilit
y in
ba
re, d
ry
cond
ition
s
ALB
ERTA
TR
ANSP
OR
TATI
ON
TAB
LE C
-2 S
umm
ary
of R
espo
nses
to D
ate
- Det
aile
d In
form
atio
nPI
LOT
TEST
S
AGEN
CY
DAT
A C
OLL
ECTI
ON
AN
D E
QU
IPM
ENT
N/A
= A
genc
y re
spon
ded,
but
has
no
info
rmat
ion
to p
rovi
de

Winter Maintenance Performance Measurement Using Friction Testing
November 2009 C-12
DAT
A C
OLL
ECTE
DEQ
UIP
MEN
TR
ELAT
ION
SHIP
BET
WEE
N
DAT
A O
UTP
UT
AND
RO
AD
SUR
FAC
E C
ON
DIT
ION
ADVA
NTA
GES
DIS
ADVA
NTA
GES
DES
CR
IPTI
ON
PRO
CED
UR
ER
ESU
LTS
Fric
tion
num
ber
Whe
el a
t an
angl
e: R
T3-
Car
gill ,
Ic
eChe
ck,
Appr
oach
ba
sed
on
brak
ing
abilit
y:
Nor
daxe
, TW
O,
Dec
eler
omet
er:
VC30
00
Allo
ws
for i
dent
ifica
tion
of
slip
pery
sur
face
s
Som
e te
chno
logi
es
show
goo
d po
tent
ial
and
shou
ld b
e fu
rther
de
velo
ped.
The
us
ers
like
frict
ion
equi
pmen
t bec
ause
it
give
s th
em m
ore
info
rmat
ion
than
vi
sual
ass
essm
ents
. It
is a
noth
er v
isio
n of
th
e ro
ad c
ondi
tion
and
com
plem
enta
ry
info
rmat
ion
for t
heir
patro
l, sy
stem
inpu
t or
som
e sp
ecia
l st
udie
s
Spec
ializ
ed te
chni
cal p
erso
nnel
ar
e re
quire
d to
ope
rate
thes
e de
vice
s. T
he te
chno
logi
es a
re
not y
et fu
lly d
evel
oped
and
so
me
devi
ces
show
ser
ious
pr
oble
ms.
The
se e
quip
men
ts
are
mor
e or
less
relia
ble
for
seve
ral r
oad
surfa
ce c
ondi
tions
, bu
t it's
not
so
easy
to h
ave
glob
al in
form
atio
n w
hen
a m
ix o
f ap
halt,
sno
w a
nd ic
e co
vers
the
road
sur
face
. The
mea
sure
has
be
en ta
king
by
a w
heel
and
is
not a
lway
s re
pres
enta
tive
of
cond
ition
s ac
ross
the
wid
th o
f th
e ro
ad. T
here
are
sev
eral
di
sadv
anta
ges
too
conc
erni
ng
mai
nten
ance
and
cal
ibra
tion
proc
esse
s of
thes
e eq
uipm
ents
.
RT3
-Car
gill ,
Ic
eChe
ck,
Nor
daxe
, TW
O,
VC30
00 f
or
mea
surin
g sk
id
resi
stan
ce to
in
clud
e in
m
obile
wea
ther
st
atio
ns
All d
evic
es u
sed
sim
ulta
neou
sly
unde
r sim
ilar
cond
ition
s (r
oad
netw
ork)
, co
ntro
l co
nditi
ons
(test
tra
ck) a
nd
com
pare
d w
ith
SCR
IM. T
este
d ov
er a
rang
e of
sp
eeds
Allo
w fo
r id
entif
icat
ion
of
slip
pery
sur
face
s,
varia
ble
resu
lts
wer
e ob
tain
ed in
cu
rve
air
tem
pera
ture
, pa
vem
ent
surfa
ce
tem
pera
ture
, re
lativ
e hu
mid
ity,
atm
osph
eric
pr
essu
re, d
ew
poin
t te
mpe
ratu
re,
geog
raph
ic
posi
tion.
sens
ors
to
mea
sure
air
tem
pera
ture
, pa
vem
ent
surfa
ce
tem
pera
ture
, re
lativ
e hu
mid
ity,
atm
osph
eric
pr
essu
re, d
ew
poin
t te
mpe
ratu
re,
geog
raph
ic
posi
tion.
N/A
N/A
N/A
N/A
N/A
N/A
TRAN
SPO
RTS
Q
UEB
EC
TAB
LE C
-2 S
umm
ary
of R
espo
nses
to D
ate
- Det
aile
d In
form
atio
n
AGEN
CY
DAT
A C
OLL
ECTI
ON
AN
D E
QU
IPM
ENT
PILO
T TE
STS
N/A
= A
genc
y re
spon
ded,
but
has
no
info
rmat
ion
to p
rovi
de

Winter Maintenance Performance Measurement Using Friction Testing
November 2009 C-13
DAT
A C
OLL
ECTE
DEQ
UIP
MEN
TR
ELAT
ION
SHIP
BET
WEE
N
DAT
A O
UTP
UT
AND
RO
AD
SUR
FAC
E C
ON
DIT
ION
ADVA
NTA
GES
DIS
ADVA
NTA
GES
DES
CR
IPTI
ON
PRO
CED
UR
ER
ESU
LTS
Tapl
ey m
eter
(u
sed
in th
e pa
st)
a m
echa
nica
l dec
eler
omet
er
that
mea
sure
s m
axim
um
pend
ulum
sw
ing
durin
g lo
cked
w
heel
sto
p, s
cale
0-1
00
N/A
Dan
gero
us to
ope
rate
on
a hi
ghw
ay
1990
-94:
Ta
pley
met
er,
Find
lay-
Irvin
e G
ripte
ster
• Rel
atio
n of
tra
ctio
n im
prov
emen
t to
win
ter s
and
appl
icat
ion
rate
s• R
elat
ion
of
vehi
cle
stop
ping
di
stan
ce o
n sn
ow
to tr
actio
n le
vel
Nor
sem
eter
(R
OAR
, Run
ar)
(use
d in
the
past
)
mea
sure
s hy
drau
lic p
ress
ure
cont
inuo
usly
as
whe
el b
rake
s an
d go
es fr
om ro
lling
to a
lo
cked
pos
ition
ove
r a 1
-se
cond
inte
rval
, sca
le 0
-1. I
t is
hydr
aulic
-con
trolle
d, c
yclic
or
fixed
slip
Und
er u
nifo
rm
cond
ition
s it
give
s an
ex
trem
ely
deta
iled
and
repr
esen
tativ
e ch
arac
teriz
atio
n of
fri
ctio
n ov
er a
rang
e of
whe
el s
lip s
peed
s th
at c
an b
e us
ed to
es
timat
e sn
ow c
over
co
nditi
ons
accu
rate
ly.
-Mec
hani
cally
com
plex
dev
ice
requ
ires
skille
d m
aint
enan
ce
that
is n
ot e
asily
ava
ilabl
e un
der
field
con
ditio
ns in
Nor
th
Amer
ica.
-E
ach
sam
ple
take
s ap
prox
. 2 to
3
seco
nds
of tr
avel
. -U
nder
non
-uni
form
sno
w
cond
ition
s w
ithin
the
tire
foot
prin
t it g
ives
a re
adin
g th
at
may
be
bias
ed a
nd p
rovi
de fa
lse
info
rmat
ion
abou
t the
road
su
rface
.
1996
-200
3:
Nor
sem
eter
M
kI a
nd II
-Equ
atio
n th
at
estim
ates
sno
w
cove
r fro
m fr
ictio
n m
easu
rem
ents
-Con
cept
of w
inte
r fri
ctio
n as
a
perfo
rman
ce
mea
sure
-Use
fric
tion
to
mea
sure
influ
ence
of
terr
ain
on lo
cal
snow
cov
er
Find
lay-
Irvin
e G
ripte
ster
(u
sed
in th
e pa
st)
mea
sure
s to
w fo
rce
cont
inuo
usly
as
a m
echa
nica
l ch
ain
rest
ricts
mea
surin
g w
heel
spe
ed to
10-
20%
of t
ow
spee
d, s
cale
0-1
. It i
s ch
ain
cont
rolle
d fix
ed s
lip
N/A
Low
nor
mal
forc
e re
sults
in
exce
ssiv
e lo
ss o
f con
tact
at
high
way
spe
eds.
Pon-
Cat
Tr
actio
n W
atch
er O
ne
(TW
O)
(cur
rent
ly u
sing
tw
o de
vice
s)
Mea
sure
s to
w fo
rce
and
norm
al fo
race
(loa
d) a
t fix
ed
slip
of 1
7%
Wor
ks w
ell a
nd e
asy
to u
seEx
cess
ive
tire
wea
r on
dry
pave
men
t.
Hal
iday
RT3
G
ripTe
ster
(c
urre
ntly
usi
ng
one)
mea
sure
s re
sist
ance
co
ntin
uous
ly a
s w
heel
slip
s du
e to
ske
wed
rollin
g an
gle,
sc
ale
0-10
0 (a
djus
tabl
e). H
as
an a
ngle
d w
heel
, fix
ed s
lip
Wor
ks w
ell a
nd e
asy
to u
se.
Min
imal
tire
w
ear o
n dr
y pa
vem
ent.
-Rel
ativ
e sc
ale
base
d on
late
ral
forc
e m
easu
rem
ent r
equi
res
calib
ratio
n to
a k
now
n su
rface
.-m
easu
rem
ents
are
sen
sitiv
e to
st
eerin
g an
gle.
Fric
tion
num
ber
2006
-08:
Pon
-C
at T
WO
and
H
alid
ay
Grip
Test
er
-Equ
atio
n th
at
auto
mat
ical
ly
clas
sifie
s sn
ow
cove
r ext
ent
-Dem
onst
rate
sel
f-m
onito
ring
by
mai
nten
ance
co
ntra
ctor
-Und
erst
andi
ng
loca
l var
ianc
e in
sn
ow c
over
alo
ng
rout
e
ON
TAR
IO D
ESIG
N
CO
NTR
ACTS
AN
D
STAN
DAR
DS
OFF
ICE
TAB
LE C
-2 S
umm
ary
of R
espo
nses
to D
ate
- Det
aile
d In
form
atio
n (c
ontin
ued)
AGEN
CY
DAT
A C
OLL
ECTI
ON
AN
D E
QU
IPM
ENT
PILO
T TE
STS
N/A
= A
genc
y re
spon
ded,
but
has
no
info
rmat
ion
to p
rovi
de

Winter Maintenance Performance Measurement Using Friction Testing
November 2009 C-14
DAT
A C
OLL
ECTE
DEQ
UIP
MEN
TR
ELAT
ION
SHIP
BET
WEE
N
DAT
A O
UTP
UT
AND
RO
AD
SUR
FAC
E C
ON
DIT
ION
ADVA
NTA
GES
DIS
ADVA
NTA
GES
DES
CR
IPTI
ON
PRO
CED
UR
ER
ESU
LTS
CIT
Y O
F YE
LLO
WK
NIF
E
Acci
dent
nu
mbe
rs a
nd
publ
ic
satis
fact
ion
Tran
spor
tatio
n D
epar
tmen
t M
onito
rs a
nd
pool
ing
of
resi
dent
s
Acci
dent
num
bers
com
pare
d w
ith p
revi
ous
year
s an
d se
eing
if s
now
and
ice
cont
rol
stra
tegy
mee
ts n
eeds
of
publ
ic
Low
Tec
h, c
usto
mer
dr
iven
N/A
N/A
CIT
Y O
F C
ALG
ARY,
AL
BER
TA
Roa
d su
rface
te
mpe
ratu
re,
and
tem
pera
ture
be
neat
h an
d ab
ove
the
road
.W
ind
spee
d an
d di
rect
ion
Tem
pera
ture
se
nsor
s
Staf
f loo
k fo
r a d
rop
in
ambi
ent t
empe
ratu
re th
at
wou
ld c
ause
the
road
s to
fre
eze.
Syst
em w
orks
fine
The
RW
IS is
bas
ed o
n da
ted
equi
pmen
t, an
d do
es n
ot
com
plet
ely
cove
r the
City
. H
ence
judg
men
t stil
l pla
ys a
key
ro
le in
thei
r dec
isio
n-m
akin
g pr
oces
s.
N/A
N/A
N/A
NEW
BR
UN
SWIC
K
DEP
ARTM
ENT
OF
TRAN
SPO
RTA
TIO
N
road
sur
face
te
mpe
ratu
re
and
pave
men
t sa
linity
RW
IS: R
oad
surfa
ce
tem
pera
ture
(e
.g.,
infra
red
sens
or) a
nd
pave
men
t sa
linity
sen
sors
Infra
red
sens
ors
assi
st in
es
tabl
ishi
ng s
alt a
pplic
atio
n ra
tes.
1. L
imita
tion
of R
WIS
sen
sors
is
thei
r fix
ed lo
catio
n2.
Lim
itatio
n of
veh
icle
-mou
nted
I/R
sen
sors
: no
loca
tion
stam
p on
the
read
ings
; dis
play
-onl
y re
adin
gs (I
/R s
enso
rs d
o ha
ve
data
inte
rface
, but
dat
a is
not
be
ing
colle
cted
cur
rent
ly)
N/A
N/A
N/A
MR
DC
O
PER
ATIO
NS
CO
RPO
RAT
ION
, N
EW B
RU
NSW
ICK
pave
men
t te
mpe
ratu
re
and
subu
surfa
ce
tem
pera
ture
RW
IS:
Pave
men
t Te
mpe
ratu
re
and
Subs
urfa
ce
Tem
pera
ture
se
nsor
s
N/A
N/A
N/A
N/A
N/A
N/A
CIT
Y O
F PR
INC
E G
EOR
GE,
BR
ITIS
H
CO
LUM
BI A
N/A
N/A
N/A
N/A
N/A
N/A
N/A
N/A
TRAN
SPO
RTA
TIO
N
AND
WO
RK
S N
EWFO
UN
DLA
ND
RW
IS -
phys
ical
dat
aN
/AN
/AN
/AN
/AN
/AN
/AN
/A
CIT
Y O
F W
ILLI
AMS
LAK
E, B
RIT
ISH
C
OLU
MB
IA
Ambi
ent
Tem
pera
ture
, R
oad
Surfa
ce
Tem
pera
ture
Infra
Red
Te
mpe
ratu
re
Con
trol
N/A
N/A
N/A
N/A
N/A
N/A
TAB
LE C
-2 S
umm
ary
of R
espo
nses
to D
ate
- Det
aile
d In
form
atio
n (c
ontin
ued)
AGEN
CY
DAT
A C
OLL
ECTI
ON
AN
D E
QU
IPM
ENT
PILO
T TE
STS
N/A
= A
genc
y re
spon
ded,
but
has
no
info
rmat
ion
to p
rovi
de

Winter Maintenance Performance Measurement Using Friction Testing
November 2009 C-15
DAT
A C
OLL
ECTE
DEQ
UIP
MEN
TR
ELAT
ION
SHIP
BET
WEE
N
DAT
A O
UTP
UT
AND
RO
AD
SUR
FAC
E C
ON
DIT
ION
ADVA
NTA
GES
DIS
ADVA
NTA
GES
DES
CR
IPTI
ON
PRO
CED
UR
ER
ESU
LTS
GO
VER
NM
ENT
OF
YUK
ON
RW
IS -
phys
ical
dat
aR
WIS
sen
sors
N/A
N/A
N/A
Inst
alle
d 3
RW
IS s
ites
on
the
Alas
ka
Hig
hway
Phys
ical
dat
a co
llect
ed d
aily
Res
ults
from
R
WIS
site
s co
llect
ed d
aily
CIT
Y O
F R
EGIN
A,
SASK
ATC
HEW
ANN
/AN
/AN
/AN
/AN
/AN
/AN
/AN
/A
MAN
ITO
BA
INFR
ASTR
UC
TUR
E &
TR
ANSP
OR
TATI
ON
Surfa
ce
Tem
p, F
reez
e Po
int,
Sub
dept
h te
mp
RW
ISN
/A
-See
ing
the
actu
al
surfa
ce te
mpe
ratu
re
in re
latio
n to
the
air
tem
pera
ture
whi
ch
allo
ws
the
depa
rtmen
t to
mak
e m
ore
info
rmed
de
cisi
ons
N/A
N/A
N/A
N/A
NO
VA S
CO
TIA
DO
T &
IRN
/AN
/AN
/AN
/AN
/AN
/AN
/AN
/A
REG
ION
OF
WAT
ERLO
O,
ON
TAR
ION
/AN
/AN
/AN
/AN
/AN
/AN
/AN
/A
CIT
Y O
F K
AMLO
OPS
, B
RIT
ISH
CO
LUM
BIA
Air T
emp,
Su
rface
Te
mp,
Dew
Po
ints
, Sno
w
and
Ice
War
ning
s,
Che
mic
al
fact
ors,
Pr
ecip
itatio
n
RW
ISN
/A
- Inf
orm
atio
n re
ceiv
ed is
ano
ther
to
ol u
sed
in th
e W
itner
Mai
nten
ance
Pr
ogra
m- G
ives
an
over
view
of
wha
t is
happ
enin
g th
roug
hout
the
City
an
d w
hat r
esou
rces
to
dep
loy
whe
re
N/A
N/A
N/A
N/A
TOW
N O
F G
AND
ER,
NEW
FOU
ND
LAN
DN
/AN
/AN
/AN
/AN
/AN
/AN
/AN
/A
TAB
LE C
-2 S
umm
ary
of R
espo
nses
to D
ate
- Det
aile
d In
form
atio
n (c
ontin
ued)
AGEN
CY
DAT
A C
OLL
ECTI
ON
AN
D E
QU
IPM
ENT
PILO
T TE
STS
N/A
= A
genc
y re
spon
ded,
but
has
no
info
rmat
ion
to p
rovi
de

Winter Maintenance Performance Measurement Using Friction Testing
November 2009 C-16
DAT
A C
OLL
ECTE
DEQ
UIP
MEN
TR
ELAT
ION
SHIP
BET
WEE
N
DAT
A O
UTP
UT
AND
RO
AD
SUR
FAC
E C
ON
DIT
ION
ADVA
NTA
GES
DIS
ADVA
NTA
GES
DES
CR
IPTI
ON
PRO
CED
UR
ER
ESU
LTS
CIT
Y O
F M
ON
TREA
L,
QU
EBEC
N/A
N/A
N/A
N/A
N/A
199
2 Fr
ictio
n te
sts
Seve
ral t
ests
for
frict
ion
mea
sure
men
ts
Ensu
red
that
the
new
sal
t/abr
asiv
e po
licy
base
d on
a
new
spr
eadi
ng
rate
and
sel
ectio
n of
mat
eria
l is
safe
CIT
Y O
F ED
MO
NTO
NN
/AN
/AN
/AN
/AN
/AN
/AN
/AN
/A
CIT
Y O
F W
HIT
EHO
RSE
N/A
N/A
N/A
N/A
N/A
N/A
N/A
N/A
CIT
Y O
F C
HAR
LOTT
ETO
WN
N/A
N/A
N/A
N/A
N/A
N/A
N/A
N/A
CIT
Y O
F W
INN
IPEG
Air T
emp,
Su
rface
Te
mp,
Su
rface
W
et/S
now
C
over
ed)
RW
ISN
/AN
/AN
/AD
ecel
erom
eter
test
ed 1
5 ye
ars
ago
Mea
sure
d br
akin
g po
wer
on
stre
ets
Res
ults
in
cons
iste
nt a
nd
inco
nclu
sive
. No
furth
er w
ork
has
been
don
e.
CIT
Y O
F FR
EDER
ICTO
NPa
vem
ent
tem
pera
ture
Truc
k m
ount
ed
tem
pera
ture
se
nsor
sN
/AN
/AN
/AN
/AN
/AN
/A
CIT
Y O
F O
TTAW
AN
/AN
/AN
/AN
/AN
/AN
/AN
/AN
/AC
ITY
OF
PRIN
CE
ALB
ERT
N/A
N/A
N/A
N/A
N/A
N/A
N/A
N/A
BC
MoT
N/A
N/A
N/A
N/A
N/A
N/A
N/A
N/A
CIT
Y O
F TO
RO
NTO
Pave
men
t Te
mpe
ratu
re,
Air
Tem
pera
ture
C
hem
ical
C
once
ntra
tion,
Fo
reca
st ro
ad
and
air
tem
pera
ture
Two
RW
IS
stat
ions
Non
eN
/A
- Sur
face
con
ditio
ns re
cord
ed
are
subj
ectiv
e an
d ba
sed
on th
e In
spec
tor's
opi
nion
- A m
ore
scie
ntifi
c m
easu
rem
ent
wou
ld b
e m
ore
usef
ul fo
r m
anag
ing
clai
ms
N/A
N/A
N/A
Hal
ifax
Reg
iona
l M
unic
ipal
ityN
/AN
/AN
/AN
/AN
/AN
/AN
/AN
/A
TAB
LE C
-2 S
umm
ary
of R
espo
nses
to D
ate
- Det
aile
d In
form
atio
n (c
ontin
ued)
AGEN
CY
DAT
A C
OLL
ECTI
ON
AN
D E
QU
IPM
ENT
PILO
T TE
STS
N/A
= A
genc
y re
spon
ded,
but
has
no
info
rmat
ion
to p
rovi
de

Winter Maintenance Performance Measurement Using Friction Testing
November 2009 D-1
APPENDIX D INTERNATIONAL SURVEY RESPONSES

Winter Maintenance Performance Measurement Using Friction Testing
November 2009 D-2
APPENDIX B presents a complete list of the surveyed organizations and individuals. In the following summaries, for Australia, Denmark, Finland, Germany, Netherlands, New Zealand, Sweden, United Kingdom, Wisconsin Department of Transportation, and Iowa Department of Transportation, Ohio Department of Transportation, the majority of information comes from the surveys that were completed. Additional information was collected through various literature and online sources (listed in the Bibliography).
N/A = information not available

Winter Maintenance Performance Measurement Using Friction Testing
November 2009 D-3
Current Practices of Iowa Department of Transportation (DOT)
Objectives for Measuring Winter Road Conditions The main objectives are to provide a way to measure performance of winter operations. They are installing traffic speed sensors at all RWIS sites in the state for use in measuring performance. They feel that the impact of winter maintenance operations will be reflected through traffic speeds of motorists. By placing them at RWIS sites they will better be able to understand what impact weather and maintenance operations have on the public’s travel speeds Road Weather Information System Used? Yes. See comment above. Friction Measurements as Part of Winter Maintenance Operations? No Friction Thresholds Used? N/A Types of Instruments and Equipment Used to Measure Friction and their Effectiveness The speed sensors (Wavetronix) collect average traffic speeds and also classify and count traffic. The RWIS sites collect atmospheric information such as wind speed and direction, air temperature, relative humidity, camera images, type of precipitation and visibility. The RWIS also collects pavement temperatures and subsurface temperatures. The data collected at these sites all have an impact on the surface condition which has a direct relationship on traffic speeds. All information from the sensors will be made available to the public through the department’s web site. Their hope is that if the public sees traffic speeds averaging 15 mph they may decide to delay their trip. Research Gaps N/A Lessons Learned from Current Methods of Measuring Winter Road Conditions N/A Pilot Tests They have tested three different types of friction wheel devices in the past and do not feel that they will work at the Iowa DOT. With a fleet of 900 trucks and 24,000 lane miles of roadway, determining what trucks to equip with the technology and what routes to cover was challenging. They often had maintenance issues with the friction wheels that became very expensive to repair. At the time they tested the device they also weren’t readily adaptable to a standard snowplow and required a separate vehicle to collect the friction measurements. Since the Department already had 60+ RWIS sites in strategic locations across the state it was easier to add speed sensors to those sites. They are just starting to put their program together using traffic speeds as a measure of roadway conditions and winter performance. This winter will be their first use of the technology when they have approximately 35 speed sensors in place at RWIS sites along the Interstate system.

Winter Maintenance Performance Measurement Using Friction Testing
November 2009 D-4
Current Practices of Wisconsin Department of Transportation (DOT)
Objectives for Measuring Winter Road Conditions N/A Road Weather Information System Used? Yes. The Wisconsin DOT’s Road Weather Information System is designed to provide maintenance crews with the most accurate information about current and future weather conditions. Friction Measurements as Part of Winter Maintenance Operations? No, they do not measure road conditions and do not have a plan for the near future to do so. They do, however, have several sensors in the pavement that can tell us pavement temperature, chemical wetness, and pavement condition (wet, dry, snow covered, etc.) Friction Thresholds Used? N/A Types of Instruments and Equipment Used to Measure Friction and their Effectiveness At the RWIS stations, the following instruments are used: 1) Mobile pavement temperature sensors: Mobile infrared pavement temperature sensors on patrol trucks (both
Sprague Roadwatch and Control Products 999J. Both are highly effective at measuring road temperature. 2) Fixed pavement temperature sensors: SSI models E and FP2000. Effective at measuring pavement
temperature and status. Less effective at measuring chemical content of solution. Research Gaps N/A Lessons Learned from Current Methods of Measuring Winter Road Conditions With regards to their RWIS: 1) It needs to be continuously updated if it is to be of use to public. 2) They need a method to get info from mobile sensors back to central database. 3) Their main reporting mechanism for road conditions relies upon reports from State Patrol. It is only updated
three times a day and is of limited usefulness. Pilot Tests They have done some pilot testing on friction and AVL equipment. The studies have been completed and to date the technology has not been adopted into our operations. Cost and availability of fund are the reasons we are not going forward.

Winter Maintenance Performance Measurement Using Friction Testing
November 2009 D-5
Current Practices of Ohio Department of Transportation Objectives for Measuring Winter Road Conditions Friction measurements are taken: • To ensure ’safety’ for the snow truck operator and the travelling public. Based on grip readings viewed by the
operator, the operator readily knows the condition of the roadway and how to adjust his treatment of that roadway. The road grip testing system can detect hazardous road conditions (e.g. black ice) that are not apparent visually to the operator.
• To predict when roads have the potential to become slippery. • To improve operation performance • To inform drivers of road surface conditions (in the future) Friction measurements are not used to assess contractor performance. Road Weather Information System Used? Yes Friction Measurements as Part of Winter Maintenance Operations? Yes, in addition to visual assessments, which are used in the winter to indicate whether roads are dry, wet, moderate, or severe on their public ‘Buckeye Traffic’ website (updated every 2 hours). Friction Thresholds Used? No. See Appendix F for “Ohio’s Route Application Guidelines and Goals”. Types of Instruments and Equipment Used to Measure Friction and their Effectiveness Ohio has approximately 20 vehicles with Road Grip Testing (RGT) Equipment (also known as RT3s and manufactured by Halliday Technologies). Research Gaps How to fully integrate the RT3 into their winter maintenance operations. Lessons Learned from Current Methods of Measuring Winter Road Conditions Measurements taken by the RT3 units are indicative of the road conditions with regards to the slickness, or lack of friction along a roadway. Pilot Tests N/A

Winter Maintenance Performance Measurement Using Friction Testing
November 2009 D-6
Current Practices of Australia Roads & Traffic Authority New South Wales Objectives for Measuring Winter Road Conditions Australia does not primarily deal with skid resistance as a “winter” issue. Australia deals with skidding as a wet weather issue. Road Weather Information System Used? Yes, as well as thermal mapping Friction Measurements as Part of Winter Maintenance Operations? No. Skid resistance monitoring over the last 30 years has been on road pavement surfacing and accident prevention (combination of treatment of blackspots and attention to surfacing being the main drivers). Friction Thresholds Used? No Types of Instruments and Equipment Used to Measure Friction and their Effectiveness Conduct annual SCRIM testing for 10,000km of the road network on a risk-based assessment that accounts for climatic and traffic exposure. Australia experience to data has predominantly been with SCRIM and GripTester and these have proven to be acceptable. Also, investigatory limits need careful consideration to match local conditions. Research Gaps N/A Lessons Learned from Current Methods of Measuring Winter Road Conditions It should be noted that with more temperate climate in Australia, winter skid testing is not generally an objective. Correlation between the SCRIM’s have been conducted on various occasions and it was found that harmonization between different equipment is not so simple. Pilot Tests N/A

Winter Maintenance Performance Measurement Using Friction Testing
November 2009 D-7
Current Practices of Danish Road Directorate
Objectives for Measuring Winter Road Conditions The main objective is to help contractors determine the appropriate time for preventive de-icing operations to be performed. Road Weather Information System Used? Yes. Monitoring the weather situation is carried out with the RWIS. The moment the call out has been performed, an administrative Winter Management system called Winterman assists with initiation, control and monitoring of activities. It monitors the contractor’s performance, settles the accounts based on this information, documents all events and activities in a structured log book, and follows up on quantities and prices as activities are carried out. Winterman has existed since 1998 and the system is currently used by the State and many municipalities in Denmark. During winter season, all road authorities continually report the road situation and activities through Winterman, for example, if any activity has started for salting and snow spreading. The procedure is constantly in connection with a website Vintertrafik.dk, which provides the road users about current activities, together with information from RWIS sensors about road- and air temperature, visual observation with webcams and road condition (slippery). The terminology and concepts of Traffic Management have increased dramatically in Denmark for the past 10 years and is ongoing. The result is that all main roads, especially highways, have variable message signs that inform the users about road condition, expected traffic jam, accidents, road construction and estimated traffic time etc. Friction Measurements as Part of Winter Maintenance Operations? No, and there are currently no plans to use friction in the future. Friction Thresholds Used? N/A Types of Instruments and Equipment Used to Measure Friction and their Effectiveness With over 320 road weather stations equipped with road sensors, they are able to measure every conceivable parameter to monitor the road conditions. Among these parameters are: freezing point, salt concentration, water layer thickness, surface temperature, humidity etc. With all these parameters, combined with webcams placed strategically on site, they are able to make the right decisions to make sure roads are safe. In order to measure metrological and physical data on road, the Danish road authority uses several suppliers such as Vaisala and Boschung, as well as a self developed station “Malling”. This strategy helps maintain the competitiveness in the field. Many parameters are preset but they define other parameters such as Road Resistance (give an indication about residual salt) and Road Condition (surface condition, dry, humidity, wet etc.). The advantage is that all of the parameters help contractors determine the best course of action and to help keep roads safe for users. The disadvantages are that some parameters can take a long time to validate in the Danish climate and road situations or they can be useless. Many sensors are too “sensitive” to changes on the road. Any small changes can lead to unreliable data and an immediate service and calibration is required. For example, with the aim of being able to measure residual salt on road after a period, they are testing new sensors developed by Vaisala. So far the results are not promising as the sensors seems to measure the correct values under favourable condition, meaning

Winter Maintenance Performance Measurement Using Friction Testing
November 2009 D-8
that the sensors “requires” a minimum water layer thickness on the road to be able to measure the correct value, a condition that appears very few times on their road condition. Research Gaps N/A Lessons Learned from Current Methods of Measuring Winter Road Conditions N/A Pilot Tests N/A

Winter Maintenance Performance Measurement Using Friction Testing
November 2009 D-9
Current Practices of Finnish National Road Administration (FinnRA) Objectives for Measuring Winter Road Conditions Friction measurements are taken: • To predict when roads have the potential to become slippery. • To measure winter maintenance performance • To inform drivers of road surface conditions Road Weather Information System Used? Yes Friction Measurements as Part of Winter Maintenance Operations? Yes Friction Thresholds Used? Yes. See TABLES 2.1A and B and 2.2A and B.
Types of Instruments and Equipment Used to Measure Friction and their Effectiveness The information in the following table was provided by Finland:
TABLE D-2 FRICTION DEVICES USED IN FINLAND Extent of Use Scale Advantages Disadvantages Greatek C-Trip (C-trip-ц, Coralba) used with ABS vehicles
Finland (the national quality standard is based on this device). • Used at
weather monitoring stations and during night patrol operations.
• Has been used for many years and the operators are used to it.
0 (low) to 1.0 (high) In normal use the scale is 0 to 0.5
• The method is simple and relatively inexpensive.
• In the latest studies they have found that these values are not quite consistent with the real physical friction value (between 0.0 - 1.0).
• It is unsafe to brake hard while on slippery conditions
Mobile monitoring station The friction measurement of the road weather meter was based on the
Finland • Used in the
past • It was used
in a test vehicle and
0 to 1.0 ,
• The equipment gave friction information alongside the road
• The measuring device needed space to be mounted in to the bus (or below the bus)
• The measuring tire was

Winter Maintenance Performance Measurement Using Friction Testing
November 2009 D-10
principle of measuring sideways friction. The friction meter was fitted with a freely spinning measuring wheel installed at a four degree angle (slip angle) in relation to the longitudinal axis of the vehicle. A 600 N (60 kg) load was applied to the wheel by a pneumatic spring powered by a 12 V compressor. The force of friction was measured by a load cell built into the wheel support rod. The friction was calculated as the relationship between the force of sideways friction and the load exerted on the wheel.
it was also mounted to a bus in line traffic
• it collected information of slippery conditions and transmitted it to central computer in Finnish road weather information system, RWIS
• It was possible to mount the measuring device to a van or bus and it did not hinder the driving
• Quite reliable on
icy road surface
wearing quite quickly • The system needed
maintenance every now and then and it was difficult to organize that with the bus company
• Wide dispersion of
friction values • On snowy roads
unexpected friction values
Pon-Cat Traction Watcher One (TWO) -based on fixed-slip method -two wheels and the other one is rolling 15 % slower, the friction is calculated of the force that will resist the rolling of the slower wheel -mounted to the back of the car
Finland • Used in
regular maintenance quality control in FinnRA
0 (low) to 1.0 (high)
• Quite reliable friction values
• Combined with gps equipment and good data storage
• Measuring can be done without braking
• Not usable with high friction values over 0.5 because of wearing of the tires and the device can also be damaged if measured long intervals with high friction
Gripman Tester The device is based on deceleration It needs few seconds
Finland (was tested) in Friction Pilot projects 2004-2008
0 (low) to 0.8 (high)
• Very easy to install into the any kind of vehicle
• Quite easy to use • It gives physically
right friction
• Needs braking • Variation in friction
values • Dependent of the tires
(type and studs) • Somewhat dependent

Winter Maintenance Performance Measurement Using Friction Testing
November 2009 D-11
lock braking with ABS brakes and it calculates the friction value of the deceleration data The device needs only 12 V current (out of the cigarette lighter) but it is not in any other way connected to the cars systems
values (right scale)
• Inexpensive
also of the driver • Braking must be done
on even road section
Research Gaps N/A Lessons Learned from Current Methods of Measuring Winter Road Conditions • Measuring the road surface friction is very complicated matter. Measuring is difficult in a standard way. Friction
varies a lot in the cross-section as well as longitudinally. Friction of wheel tracks is completely different compared to the other part of the road, etc.
• Different measuring equipments gives different values • What is the right friction for the driver if he drives with summer tires, winter tires or studded tires • They are going to continue to study the problems of measuring the friction. Pilot Tests A new optical friction measuring instrument (DSC111 by Vaisala) has been tested and promising results have been generated, especially when using this friction information to the traffic management purposes. Possibilities to use that information to measure winter maintenance performance is also studied but results are not yet ready. DSC111 is based on active transmission of infrared light beam on the road surface and detection of the backscattered signal at selected wavelengths. By proper selection of wavelength it is possible to observe absorption of water and ice practically independently of each other. The observed absorption signal is readily transformable to water layer, to ice layer or to snow/frost amount in millimetres of water equivalent. With this information it is straightforward to determine the surface state as dry, moist, wet, icy, snowy/frosty or slushy. It can be modelled the apparent reduction of the friction coefficient due to ice and water on a road surface. • Finland (currently being tested for winter conditions) • In Finland 73 stand alone measuring points in spring 2008 • One test device for floating car measurement and test purposes • Tested during three winter seasons in different tests (made by FinnRA, VTT (Technical Research Center) and
Destia consulting Advantages: • First Finnish pilot tests showed promising results. • Second tests showed that the device works reliably and the values it gives can be used to traffic management,
i.e. definition of the values to the variable speed limits and traffic information

Winter Maintenance Performance Measurement Using Friction Testing
November 2009 D-12
• Third tests showed that there is possibility to use the friction information also to quality control but it needs still more studies
• It gives physically right friction values (scale is right) • Usable on stand alone and also for floating car measurements • Easy to install by the road side, needs not any operations on road surface Disadvantages: • Variation in the friction values
• during white snow circumstances gives too low friction values variation in repeatability

Winter Maintenance Performance Measurement Using Friction Testing
November 2009 D-13
Current Practices of Germany Federal Highway Research Institute (BASt) Objectives for Measuring Winter Road Conditions To ensure timely winter service so that roads are not slippery. Road Weather Information System Used? Yes Friction Measurements as Part of Winter Maintenance Operations? Yes, but mostly rely on Road Ice Warning Systems, which do not incorporate friction measurements. Friction Thresholds Used? No Types of Instruments and Equipment Used to Measure Friction and their Effectiveness Friction measurements come from the company Vaisala (sensor DSC111). Research Gaps N/A Lessons Learned from Current Methods of Measuring Winter Road Conditions (Most of the information provided by Germany was associated with Road Ice Warning Systems) Sensors currently being used in Road Ice Warning systems mainly measure freezing temperature, which is not enough information. They are currently waiting for better equipment to be developed in the industry. They are currently developing and testing routines to filter out false data, which can be caused by defective sensors, defective connections between the stations and the computer systems, and other factors. Pilot Tests They have started a research project using xFCD (extended Floating Car Data) as a way to improve the measurement of winter road surface conditions. Results are not yet available.

Winter Maintenance Performance Measurement Using Friction Testing
November 2009 D-14
Current Practices of Netherlands Ministry of Transport and Public Works
Objectives for Measuring Winter Road Conditions N/A Road Weather Information System Used? Yes Friction Measurements as Part of Winter Maintenance Operations? No, friction measurements are not carried out. Winter maintenance operations involve preventive spreading and spreading time is used to assess contractor performance. Friction Thresholds Used? No Types of Instruments and Equipment Used to Measure Friction and their Effectiveness RWIS is used and has reduced salt consumption and provided the opportunity to use preventive spreading actions. In snowy circumstances cameras are used to see if there is snow on the road surface. Research Gaps N/A Lessons Learned from Current Methods of Measuring Winter Road Conditions N/A Pilot Tests N/A

Winter Maintenance Performance Measurement Using Friction Testing
November 2009 D-15
Current Practices of New Zealand Transport Agency Objectives for Measuring Winter Road Conditions To identify the potential for icing for early application of de-icing agents. Road Weather Information System Used? Yes, as well as thermal mapping Friction Measurements as Part of Winter Maintenance Operations? No Friction Thresholds Used? No Types of Instruments and Equipment Used to Measure Friction and their Effectiveness Locked wheel measurements have been made to investigate the effectiveness of calcium magnesium acetate on treated and non-treated road sections. The results from the surveys made during the summer months, when skid resistance is allegedly at its lowest, are used to manage the road network so that there is an equal risk of having a skid related crash under wet conditions. Research Gaps N/A Lessons Learned from Current Methods of Measuring Winter Road Conditions It should be noted that with more temperate climate in New Zealand, winter skid testing is not generally an objective. Pilot Tests N/A

Winter Maintenance Performance Measurement Using Friction Testing
November 2009 D-16
Swedish Road Administration (SNRA)
Objectives for Measuring Winter Road Conditions Friction measurements are used: • To inform drivers of road surface conditions • To measure winter maintenance performance Road Weather Information System Used? Yes Friction Measurements as Part of Winter Maintenance Operations? Yes Friction Thresholds Used? Sweden uses the Swedish Road Administration’s Method Specification 110:2000, Friction Measurement on Winter Road Surfaces (using retardation measurements with Coralba or similar), to determine the friction coefficient and these specifications are applied to different road classes. On surfaces that are too small for measurement according to the methods specifications, the friction is assessed on the basis of surfaces with corresponding friction. (PIARC, 2006)
Friction coefficients need to be 0.20-0.35, depending on the road surface temperature, type of precipitation, and the type of facility (see TABLE 2.4 Sweden’s Friction Standards in Section 2.2.6).
For road classes 1-3:
• During snowfall when the trigger value (cm of loose snow) has not been reached and the road surface temperature is warmer than –6 degrees Celsius, the requirements are the same as during rain.
• When the road surface temperature increases, the requirements that apply to the warmer temperature range shall be fulfilled no later than 15 hours after a temperature threshold mark has been passed.
• During dry weather conditions when the action time after the precipitation has expired and there is no requirement on a snow- or ice-free surface, the same trigger values and action times apply as during snowfall.
• On the 100-metre stretch closest to an intersection with a state road, the friction coefficient is 0.30.
• On shoulders with unbroken road marking are allowed with start criteria of 0.20 in friction coefficient
Class 3:
• When the road surface temperature is warmer than -6oC, windrow snow along the centre of the road, between the wheel tracks and on the edges of the traffic lane is permissible. The central windrow, the windrow snow between the wheel tracks, and the edges of the traffic lane shall have a friction coefficient greater than 0.25.
Class 4:
• On the 100-metre stretch closest to an intersection with a state road, the friction coefficient is 0.30.
Class 5
• On the 100-metre stretch closest to an intersection with a state road in standard class 1-4, a friction coefficient of 0.30 is the trigger value as regards friction.
Friction coefficients also exist for pedestrian and cycle paths and prioritised bus stops. (PIARC, 2004 and 2006)

Winter Maintenance Performance Measurement Using Friction Testing
November 2009 D-17
Types of Instruments and Equipment Used to Measure Friction and their Effectiveness a) The standard device for measuring friction - Saab Friction Tester, (Bergstrom, 2002 and Wallman and Astrom, 2001) b) BV11 (Wallman and Astrom, 2001) c) Other devices: Portable Friction Tester (PFT) developed at the Swedish National Road and Transport Research Institute (VTI), originally for the purpose of measuring friction on road markings in wet conditions. Since the PFT is reasonably small and handy, it was considered practicable in this case when measuring friction on cycleway surfaces, where it can be difficult to use other measuring devices. (Bergstrom, 2002) d) Coralba e) Majority of friction measurements during winter are done with normal passenger cars with ABS and instrumentation to measure deceleration during breaking. By applying the brakes hard, the evaluated deceleration of the car is a measure of the available road friction. This method is simple and relatively inexpensive. However, it is imprecise. The road administration requires that the friction evaluation car should be regularly calibrated against a BV11, a Saab Friction tester or a BV14 on several typical winter road surfaces like ice and compacted snow. (Wallman and Astrom, 2001) Research Gaps N/A Lessons Learned from Current Methods of Measuring Winter Road Conditions N/A Pilot Tests Sweden is working on a Winter Model to evaluate the effects of various road conditions on road users and road management. (PIARC, 2006) Fiido, developed by the Swedish Road Administration and designed for use with pure manpower (weight 38 kg) gave very surprising results in certain test conditions, probably because of its light weight, although in general it performed fairly consistently. (Myllylä and Pilli-Sihvola, 2002). In 2001, BV14 was only used in research projects. (Wallman and Astrom, 2001).

Winter Maintenance Performance Measurement Using Friction Testing
November 2009 D-18
Current Practices of United Kingdom Highways Agency Objectives for Measuring Winter Road Conditions Friction measurements are taken: • To predict when roads have the potential to become slippery. • To determine treatment method. Road Weather Information System Used? Yes Friction Measurements as Part of Winter Maintenance Operations? No Friction Thresholds Used? Yes. In the U.K., a policy was developed to establish acceptable friction levels for different road and traffic situation. Friction levels are called investigatory levels where an investigation or surface treatment needs to be made if friction is at or below this level. Table 1 below summarizes the values taken with the SCRIM device (Side force Coefficient Road Inventory Machine) (Noyce et al, 2005).
TABLE D-3
Types of Instruments and Equipment Used to Measure Friction and their Effectiveness a) Griptester - more than 20 Griptester devices are placed at the local road administration offices around the country. It uses a fixed slip. (Wallman and Astrom, 2001). b) Side Force Coefficient Road Inventory Machine (SCRIM) (See Wallman and Astrom (2001) for description, p.17). There is a fleet of SCRIM devices that has been measuring the road network for many years. The devices are compared and calibrated every year and friction data are stored in a common national database. Research Gaps N/A Lessons Learned from Current Methods of Measuring Winter Road Conditions N/A Pilot Tests Trials have demonstrated that a forecast thermal map can accurately control the gritting process (location and spread rate). In turn, a forecast thermal map system was developed by weather forecast providers for use with the vehicle control and tracking information system. This new forecast method proved to be an improvement over the

Winter Maintenance Performance Measurement Using Friction Testing
November 2009 D-19
existing method and is also an essential element of the intelligent gritter. Unlike the traditional forecast maps, the new method generates road temperature and weather condition readings at much shorter intervals (200 m) along each precautionary gritting route at hourly intervals. In addition, the combination of the use of GPS and GIS within a gritter does allow adjustment to the spread rate in order to cater for different road surface materials, in particular porous asphalt road surfaces (PIARC, 2006).

Winter Maintenance Performance Measurement Using Friction Testing
November 2009 D-20
Current Practices of Norwegian Public Roads Administration Objectives for Measuring Winter Road Conditions Friction measurements are used: • To guide winter maintenance activities. • To determine treatment levels Road Weather Information System Used? Yes Friction Measurements as Part of Winter Maintenance Operations? Yes Friction Thresholds Used? Yes. According to the maintenance standards, high volume roads must be brought to a friction level of 0.4 or higher within a certain time that is dependent on the road’s AADT (see Table 2.5 Norway’s Friction Standards in Section 2.2.2.6) (Nixon, 1998). For lower volume roads, two friction levels (0.15 and 0.25) are used. They attempt to bring these roads to a groomed surface condition. Again, time limits to attain the friction levels are set and strategies to follow (sanding or plowing) are determined based on the friction level (Nixon, 1998). Types of Instruments and Equipment Used to Measure Friction and their Effectiveness a) Majority of friction measurements during winter are done with normal passenger cars with ABS and instrumentation to measure deceleration during breaking. By applying the brakes hard, the evaluated deceleration of the car is a measure of the available road friction. This method is simple and relatively inexpensive. However, it is imprecise. (Wallman and Astrom, 2001, p.21). b) ROAR developed by Norway Norsemeter AS7. (Wallman and Astrom, 2001 and Fleege, Wambold and Rado, 1997). c) The Norwegian Public Roads Administration uses the ‘Digi-slope’ friction measuring device to evaluate different types of deicing materials. The device operates when a test vehicle brakes at 40 kph with locked wheels. NPRA uses it to evaluate brine suitability under varying temperatures, precipitation intensity and road conditions (CTC & Associates LLC, 2007). Research Gaps Norway’s Winter Friction Project used several standards and measures, addressed the practical, technical and economic problems that arise in providing good friction conditions on winter roads. The project began in 1997 and a final report was scheduled for 2002. Field studies consisted of a testing program to document the performance of different friction improvement methods. A friction standard was among the measures used to evaluate the difference in conditions achieved on salted and sanded roads. (CTC & Associates LLC, 2007). In 2006, there were projects that looked at methods and equipment for measurement of friction (PIARC, 2006). Lessons Learned from Current Methods of Measuring Winter Road Conditions N/A Pilot Tests A friction measuring device which is fixed to the road and sending friction data via internet is under testing. (PIARC, 2006) Norway is testing other methods and equipment for measuring friction. (PIARC, 2006)

Winter Maintenance Performance Measurement Using Friction Testing
November 2009 E-1
APPENDIX E FRICTION DEVICE COST INFORMATION

Winter Maintenance Performance Measurement Using Friction Testing
November 2009 E-2

Winter Maintenance Performance Measurement Using Friction Testing
November 2009 E-3
TABLE E-1 FRICTION DEVICE COST INFORMATION
Source Device Cost (CDN) DESCRIPTION 2008 Small Truck Friction Maintainer
$8900.00 + installation costs of $800 in Alberta, or $1400 plus shipping outside of Alberta
Icechek
2008 Light Truck Friction Maintainer
$12500.00 + installation costs of $1200 in Alberta, or $1900 plus shipping outside of Alberta
- Continuous friction measuring equipment with electrical and electronic hook-ups and computer software, computer not included. - Small truck mounts on Ford Ranger, Toyota Tacoma and other small trucks. When installing the Friction Maintainer, the rear bumper of a small truck is usually removed and replaced by a stronger custom-made bumper and support frame bolted to the truck frame. - Light truck mounts on Ford F150/F250, Dodge 1500/2500and GMC 1500/2500 and similar trucks or commercial vans. It is not necessary to remove the bumper to install the equipment on Full-size Light Trucks. - Recurring maintenance costs include $50.00 each for 8” testing tire or $95.00 each for 12” testing tire (basic tire and rim). - There is a one year warranty on all Icechek equipment covering equipment replacement costs.
Norsemeter ROAR system $80,250 to $107,000 ($75,000 to $100,000 US)
- Not available
GripTester (used in New Zealand)
$58,850 ($55,000 US)
- Additional costs associated with purchasing a dedicated vehicle and fitting it out with a water supply, training of operators, calibration, and carrying of appropriate spares can easily double the purchase price of a device. Replacement measuring wheel comparatively expensive to purchase at about US$400 per tire.
Dynatest 1295 Pavement Friction Tester
$187,250 (US$175,000)
- Includes tow vehicle and watering system.
Data provided by senior advisor in New Zealand
SCRIM $568,240 ($299,073.00 GBP)
- For a double-sided machine (test wheel fitted on each side)
Cargill RT3 Surface Traction Measurement Technology
Between $26,750 and 37,450 (between US$25,000 and $35,000)
- Plus optional equipment, installation, and freight on delivery. - Training is included. - Recommended maintenance includes specific bearing lubrication and tire replacement every 6,000 miles. - Replacement tires generally cost between $100 and $125 per tire depending on availability. They are specific tires, but can be purchased from most tire retailers.
Guardian Around $28,890 (Around $27,000 US)
- Includes DSC111/DST111/Camera. Vaisala
DSC111 $16,050 ($15,000 US) - Includes software display for data display and recording. SNRA RT3 $42,800 per unit
($40,000 US per unit) - this is the cost of purchasing the device - cost of storing and maintaining device is minimal

.
.

Winter Maintenance Performance Measurement Using Friction Testing
November 2009 F-1
APPENDIX F CURRENT PRACTICES SURVEY ATTACHMENTS
(RELEVANT REPORTS, PUBLICATIONS, ETC)

Winter Maintenance Performance Measurement Using Friction Testing
November 2009 F-2
TABLE F-1 LIST OF RELEVANT PUBLICATIONS
Canadian Road Agencies Agency Document Page
Alberta Transportation Excerpt from the Highway Maintenance Guidelines and Level of Service Manual, June 2000 F-3
British Columbia Ministry of Transportation Excerpt on Winter and Summer Road Classifications F-4
Ministere des transports du Quebec Excerpt on Determination of Service Levels F-5
New Brunswick Department of Transportation Winter Maintenance Service Policy F-6
Nova Scotia Department of Transportation and Infrastructure
Snow and Ice Control F-9
City of Kamloops Excerpt on Roadway Priority and Snow Removal F-16 City of Regina Winter Road Maintenance Plan F-17 City of Toronto Table on Conditions for Winter Maintenance Operations F-19 City of Yellowknife Transportation Maintenance Policy F-20
United States Road Agencies Agency Document Page
Instructional Memorandum: Snow and Ice Control F-33 Instructional Memorandum: Snow and Ice Removal Operations F-39 Iowa Department of
Transportation Instructional Memorandum: Chemicals and Abrasives F-43 Route Application Guidelines and Goals F-146 Ohio Department of
Transportation Our Experience with the RT3 F-147 Winter Operations General: Passable Roadway During a Winter Storm F-46 Wisconsin Department of
Transportation Winter Operations General: Level of Effort by Category of Roadway F-47
International Road Agencies Agency Document Page
Road Maintenance F-54 Danish Road Directorate
The Danish Winter Management System F-61 Cost 353 – Winter Service Strategies for Increased European Road Safety F-85 CEN TC 337 – Road Condition and Weather Information System F-94 Road Weather Forecasts for a Winter Road Maintenance Information Center F-104
Germany Federal Highway Research Institute (BASt)
Winter Maintenance Equipment – Road Weather Information Systems F-109 Swedish National Road Administration Friction Meters F-122
United Kingdom Highways Agency Sideway-Force Coefficient Routine Investigation Machine F-123
Consultants Name and Agency Document Page Peter Cenek, Opus Central Laboratories
Implementing Advanced Skid Resistance Management: Research, Measurement, Policy and Achievement F-125
Don Halliday, Halliday Technologies Statement of Halliday Technologies Inc. Position with RT3 Product F-132
IceChek Continuous Friction Measuring Equipment F-135 Glen Brown, IceChek Instruments Limited What is a Reasonable Tolerance for Friction Measurements when CFME is to
be Used for Winter Highway Maintenance? F-142
Carmacks Enterprises Ltd. Prewetting Skid Tests Deerfoot Trail F-163

Alberta Ministry of Transportation From the Highway Maintenance Guidelines and Level of Service Manual, June 2000 http://www.infratrans.gov.ab.ca/INFTRA_Content/docType34/Production/los_manual.pdf
Class of Highway
Traffic Volume (AADT)
Maximum Reaction Time
(hours) *
Maximum Time to Good Winter
Driving Conditions (hours) **
A > 15,000 2 6 B 7,000 - 15,000 4 6 C 5,000 - 7,000 4 8 D 2,000 - 5,000 4 8 E 1,000 - 2,000 6 12 F 500 - 1,000 8 12 G 100 - 500 12 18 H < 100 16 24
* Maximum time allowable for equipment to have commenced work from the time of a 3 cm accumulation. This value represents the maximum time that will be required to respond after and average winter storm. Normally, equipment will begin working during most storm events and as a result most roads are cleared faster than the maximum time indicated ** Good Winter Driving Conditions exist when snow and ice have been removed from the driving lanes and excessive loose snow has been removed from the shoulders and centreline of highway. Short sections of ice and packed snow are acceptable and can be expected within the driving lanes between the wheel paths, as well as on centreline.
Winter Maintenance Performance Measurement Using Friction Testing Appendix F
F-3

British Columbia Ministry of Transportation Ref. to Question 6, Level of Service
Classification designates the kinds and levels of Maintenance Services to be provided according to the amount and type of service the Highway is expected to provide, and for each individual Highway or portion of Highway is the Class which the Province’s records designate, and as may be amended from time to time by the Province. The Minister may, at the sole discretion of the Minister, from time to time, change the Class of a Highway dependent upon other factors than indicated in this definition. Classifications of Highways in the Service Area are included in RIMS. The Summer Classification is generally based on, but not limited to, the following:
SUMMER CLASSIFICATION
A.D.T. (average daily traffic) Class Vehicles per Day
1 over 10,000 2 5,000 - 10,000 3 1,000 - 5,000 4 500 - 1,000 5 100 - 500 6 * 10 - 100 7 * 0 - 10 8 a Highway, typically without a constructed road but for which
maintenance responsibilities exist for such things as danger tree removal and drainage, and which may also have other improvements to maintain such as pedestrian and bicycle paths.
*Roads Classed 6 or 7 with heavy industrial use will be increased one Class in RIMS. Winter Classification is generally based on but not limited to the following:
WINTER CLASSIFICATION
Class Definition
A high volume traffic (over 5,000 winter average daily traffic count) or commuter routes and certain expressways and Freeways through mountain passes, as determined by the Province. They are heavy commuter traffic routes extended to include the bulk of vehicles commuting daily to a center and cut-off where traffic drops below 2,500 winter average daily traffic count. Very high volume ski hill and commuter routes.
B all trunk and main routes (or portion thereof as designated by the Province) not included in Class A, with a cut-off traffic volume of 1,000 winter average daily traffic count. Lower volume ski hill and commuter routes.
C all school bus routes and industrial (truck) traffic routes (more than 25% trucks) not included in Class A and B.
D all other regularly maintained winter routes.
E all other irregularly maintained winter routes.
F roads not maintained in the winter, or not open, or not maintained by the Minister.
Winter Maintenance Performance Measurement Using Friction Testing Appendix F
F-4

Ministère des Transports du Québec
In the winter period, the Ministère des Transports du Québec determines the service levels for the road
network under its responsibility based on two main criteria, the functional classification of the network
and the winter daily traffic (WDT) recorded on the network.
Determination of the Service Level
Functional Classification WDT Service level
Autoroute - Clear pavement
National highway
> 2,500 Clear pavement
≤ 2,500 Partly clear pavement
Regional highway
> 2,500 Clear pavement
≤ 2,500 Partly clear pavement
> 2,500 Clear pavement
Collector highway and resource access highway
from 500 to 2,500
Partly clear pavement
< 500 Roadway on hardened snow base
Winter Maintenance Performance Measurement Using Friction Testing Appendix F
F-5

NEW BRUNSWICK PAGE 1 OF 3 DEPARTMENT OF TRANSPORTATION MANAGEMENT MANUAL APPROVED BY: _______________________________ David J. Johnstone SECTION: 06-0150 DIVISION: OPERATIONS BRANCH: MAINTENANCE AND TRAFFIC SUBJECT: WINTER MAINTENANCE SERVICE POLICY ISSUED: 2/NOVEMBER/05 REVISED: 1. GENERAL This Policy applies to all Provincial Designated Highways. This policy does not apply to portions of Designated Highways that are operated and maintained by private companies under separate agreements. 2. OBJECTIVE The Department of Transportation’s objective with regards to winter maintenance is to provide passable roadways within the limitations imposed by climatic conditions, availability of resources, and environmental considerations. 3. WINTER MAINTENANCE SERVICE OPERATIONS 3.1 Winter maintenance service will be performed in accordance with the most recent NBDOT
policies, directives and maintenance management guidelines. 3.2 The Levels of Service Guidelines, (Table I), are intended as a guide for winter maintenance
operations under typical winter storm conditions. In extreme winter storm conditions, priorities will be given to higher volume roads and emergency situations.
• Highways eligible for Level of Service “A-1” will be provided with continuous service, as
conditions warrant.
• Highways eligible for Level of Service “A-2”, “B”, and “C”, winter maintenance coverage will typically be provided between the hours of 5:00 A.M. and 11:00 P.M. during the storm and as conditions warrant.
• Highways eligible for Level of Service “D” typically have very low traffic volumes and no
permanent residents. Winter service to these roads is considered a low priority and therefore may not receive service for extended periods of time.
Winter Maintenance Performance Measurement Using Friction Testing Appendix F
F-6

NEW BRUNSWICK PAGE 2 OF 3 DEPARTMENT OF TRANSPORTATION MANAGEMENT MANUAL APPROVED BY: _______________________________ David J. Johnstone SECTION: 06-0150 DIVISION: OPERATIONS BRANCH: MAINTENANCE AND TRAFFIC SUBJECT: WINTER MAINTENANCE SERVICE POLICY ISSUED: 2/NOVEMBER/05 REVISED: 4. WINTER LEVELS OF SERVICE Levels of service are guidelines that define expectations for the provision of winter maintenance on similar roadway facilities during a storm event.
Table I Winter Levels of Service Guidelines
Winter
Level of Service
Typical Highway
Classifications
Typical Surface
type
Typical Traffic Volumes
Typical Commence-
ment of Plowing
Surface Conditions
following storm
Salt or Abrasives to be used
“A-1” 4-Lane
Arterials and all of Route # 2
Asphalt Concrete
Greater than 4000
vehicles/day
After 2 cm. accumulation
Driving lanes bare within 24 hours
after end of storm.
Salt*
“A-2” Remaining Arterials and high volume Collectors
Asphalt Concrete
Greater than 2000
vehicles/day
After 2 cm. accumulation
Driving lanes bare within 24 hours
after end of storm
Salt*
“B” Medium volume Collectors,
selected Locals
Asphalt Concrete
or Chipseal
Between 500 and 2000
vehicles/day
After 2-8 cm of accumulation
Bare center strip within 24 hours
after end of storm
Salt or Abrasives
(sand)
“C” Low volume Collectors, most Local Highways
Chipseal or Aggregate
(gravel)
Less than 500 vehicles/day
After 8 cm of accumulation
Snow packed condition.
Abrasives applied on hills, curves
and intersections
Abrasives (sand)
“D” Low Volume Local Highways
without permanent residents
Aggregate (gravel) or Chipseal
Less than 100 vehicles/day
During regular working hours
and as directed by the District Transportation
Engineer
May not receive service for
extended periods of time
Abrasives (sand)
* Road surface temperatures (less than –15 C), limits the effectiveness of de-icing chemicals (i.e. salt). Abrasives (sand) may be used in these situations.
Winter Maintenance Performance Measurement Using Friction Testing Appendix F
F-7

NEW BRUNSWICK PAGE 3 OF 3 DEPARTMENT OF TRANSPORTATION MANAGEMENT MANUAL APPROVED BY: _______________________________ David J. Johnstone SECTION: 06-0150 DIVISION: OPERATIONS BRANCH: MAINTENANCE AND TRAFFIC SUBJECT: WINTER MAINTENANCE SERVICE POLICY ISSUED: 2/NOVEMBER/05 REVISED: 5. HIGHWAY DEFINITIONS
• Arterials Highways: Highways with route numbers between 1 and 99 • Collectors Highways: Highways with route numbers between 100 and 199 • Locals Highways:
• Highways with route numbers between 200 and 999 • Highways without route numbers (identified with local name)
6. LIMITATIONS OF SERVICE 6.1 During winter conditions, motorists can expect some inconvenience and will be expected to
modify their driving practices to suit road conditions. 6.2 Levels of service may be reduced due to the following:
• Length and severity of storm. • Limited visibility for operators, compromising the safety of maintenance personnel and/or the
traveling public. • Equipment and material availability. • Winds causing drifting. • Freezing rain or sleet. • Road surface temperatures (less than –15 C), which limits the effectiveness of de-icing
chemicals (i.e. salt). • Recovery time for operators during extended winter storm conditions.
Winter Maintenance Performance Measurement Using Friction Testing Appendix F
F-8

TPW - Winter Maintenance Standards RO90 - 104/105/106 Snow and Ice Control
Nova Scotia 104/105/106 SNOW AND ICE CONTROL GENERAL 1. The Operations Supervisor is responsible for ensuring that highways are maintained in
accordance with these Winter Maintenance Standards. 2. These Winter Maintenance Standards establish levels of service on Provincial
Highways. The following winter maintenance levels of service for snow and ice control are based on road classification and traffic volumes:
Levels of Service Table
LEVEL OF SERVICE Level 1A Level 1B Level 2 Level 3 Level 4
Type of Roads
-All 100 Series and -Selected high volume highways
-All Trunks and -Selected highways as per AADT limits
-All Routes and -Selected highways as per AADT limits
-All Local Roads
-All Gravel Roads
AADT Limits > 7,500 7,500 - 4,000 4,000 - 1,500 < 1,500
Winter Levels of Service Descriptions
Classification Description
1A Essentially Bare Pavement
1B Essentially Bare Pavement
2 Centre Line Bare 2.5m to 5.0m
3 Centre Line Bare 1.5m to 2.5m
4 Snow Packed 3. While this Maintenance Standard establishes levels of service, it is acknowledged that
conditions may occur, which temporarily prevent achieving levels assigned. In such cases, attempts shall be made to keep highways open by utilizing all available equipment.
Winter Maintenance Performance Measurement Using Friction Testing Appendix F
F-9

December 1, 2001
4. During severe weather conditions, when it becomes evident to the Operations Supervisor that available resources are not sufficient to maintain highways open and passable, the Operations Supervisor shall immediately notify the Area Manager and the RCMP (or local Police force). The Area Manager will determine if the road shall be closed. The Operations Supervisor is required to erect and maintain all road closures and notify all emergency services and issue public advisories.
5. The use of salt in environmentally sensitive areas is strictly prohibited. 6. During storm conditions, plow routes shall be configured to not exceed the following
criteria based on effective plow speed of not more than 42 km/h. For plowing calculations, the circuit time is based on the time required including deadheading, to complete all roads with the specific level of service.
Plow Route Configuration Criteria
Level of Service Circuit Time
Level 1A 3 Hours
Level 1B 4 Hours
Level 2 6 Hours
Level 3 8 Hours
Level 4 12 Hours
INSPECTION 1. Winter road patrols shall be carried out by designated personnel to continuously
monitor road and weather conditions as required. Inspection by road patrols shall cover all routinely observed road conditions, in addition to ensuring that winter levels of service are maintained
2. The Operations Supervisor is to follow the Department road reporting protocol
regarding normal winter road condition reporting. The Operations Supervisor (or other authorized personnel) shall submit regular scheduled road reports to the Department’s central road reporting office three times per day (6am,12pm,4pm). Any changes in severe weather or road conditions, which occur between specified reporting periods, should be reported immediately to the Department’s road reporting office.
3. The Operations Supervisor (or other authorized personnel) shall keep accurate and
legible daily logs. The log shall consist of the following information: ! Temperature every hour. ! Type and amount of precipitation every hour. ! Dispatch, loading and end times for all vehicles.
Winter Maintenance Performance Measurement Using Friction Testing Appendix F
F-10

December 1, 2001
! Operators on duty. ! Start and stop of storm event. ! Type of activity being performed (plowing, salting, sanding) ! Vehicle breakdowns or accidents ! Emergency calls to the dispatch ! Amount of material loaded (salt and sand) ! Supervisor in charge. CONDITIONS A. From the time unfavorable road conditions occur and winter equipment is required, the
Operations Supervisor has a maximum of one (1) hour to have the required equipment working in the assigned areas of responsibility. For the safety of the public, it is essential that the response time is kept to a minimum.
B. The Operations Supervisor shall deploy winter maintenance operations prior to the
accumulation of the specified snow depth if the roads are hazardous, slippery or ice or slush is developing.
C. Levels of Service
I. Level 1A - Essentially Bare Pavement
The defined level of service for Level 1A is essentially bare pavement, and is the objective to be reached as soon as possible after the storm has ended or abated, normally within eight (8) hours. This level of service applies to 100 Series highways and other selected high volume highways with an average daily traffic volume greater than 7,500 vehicles per day. To achieve this level of service, the Operations Supervisor shall remove snow and apply deicer as described in these Maintenance Standards.
The use of deicer is to be controlled, in terms of both quantity and frequency, to meet the specified level of service. Sand shall not normally be applied on Level 1A highways. Sand shall only be applied to Level 1A highways during severe cold weather when extremely slippery conditions exist.
A summary of Level 1A service is shown in the Levels of Service Summary Table.
II. Level 1B - Essentially Bare Pavement
The defined level of service for Level 1B is essentially bare pavement, and is the objective to be reached, as soon as possible after the storm has ended or abated, normally within twelve (12) hours . This level of service applies to all Trunk highways and other selected highways with an average daily traffic
Winter Maintenance Performance Measurement Using Friction Testing Appendix F
F-11

December 1, 2001
volume between 7,500 and 4,000 vehicles per day. To achieve this level of service, the Operations Supervisor shall remove snow and apply deicer as described in these Maintenance Standards.
The use of deicer is to be controlled, in terms of both quantity and frequency, to meet the specified level of service.
Sand is to be applied to all roads or sections of a road designated as being in environmentally sensitive areas. The use of salt in environmentally sensitive areas is strictly prohibited.
Sanding of environmentally sensitive areas shall take place at the beginning of a storm and shall be discontinued after 50mm of snowfall accumulation. Sanding will normally resume after a snowfall.
A summary of Level 1B service is shown in the Levels of Service Summary Table.
III. Level 2 - Centre Line Bare 2.5m to 5.0m
The defined level of service for Level 2 is a minimum centre line bare condition of 2.5m to 5.0m wide, and is the objective to be reached as soon as possible after the storm has ended or abated, normally within twelve (12) hours and be maintained until conditions permit baring the pavement full width. This level of service applies to all 200 and 300 series Routes and other selected highways with an average daily traffic volume between 4,000 and 1,500 vehicles per day. To achieve this level of service, the Operations Supervisor shall remove snow and apply deicer as described in these Maintenance Standards.
The use of deicer is to be controlled, in terms of both quantity and frequency, to meet the specified level of service.
Sand is to be applied to all roads or sections of a road designated as being in environmentally sensitive areas. The use of salt in environmentally sensitive areas is strictly prohibited.
Sanding of environmentally sensitive areas shall take place at the beginning of a storm and shall be discontinued after 50mm of snowfall accumulation. Sanding will normally resume after a snowfall.
A summary of Level 2 service is shown in the Levels of Service Summary Table.
IV. Level 3 - Centre Line Bare 1.5m to 2.5m
The defined level of service for Level 3 is a minimum centre line bare condition
Winter Maintenance Performance Measurement Using Friction Testing Appendix F
F-12

December 1, 2001
of 1.5m to 2.5m wide, and is the objective to be reached as soon as possible after the storm has ended or abated, normally within twenty four (24) hours, and be maintained until conditions permit baring the pavement full width. This level of service applies to all Local paved roads with an average daily traffic volume of less than1,500 vehicles per day. To achieve this level of service, the Operations Supervisor shall remove snow and apply deicer or sand as described in these Maintenance Standards
The use of deicer or sand is to be controlled, in terms of both quantity and frequency, to meet the specified level of service.
Sand is to be applied to all local roads or sections of a local road designated as being in environmentally sensitive areas. The use of salt in environmentally sensitive areas is strictly prohibited.
The application of deicer or sand will normally take place after a snowfall.
The application of deicer or sand may be applied at the beginning of a storm to hills, turns, intersections or railway crossings or where geographically conditions require.
A summary of Level 3 service is shown in the Levels of Service Summary Table.
I. Level 4 - Snow Packed
This level of service requires that the road surface be maintained in a snow packed condition as soon as possible after the storm has ended or abated normally within twenty four (24) hours. This level of service applies only to local gravel roads. To achieve this level of service the Operations Supervisor shall remove snow and apply sand as described in these Maintenance Standards
Gravel roads shall only have sand or other approved abrasives applied. The use of salt or other deicers on gravel roads is strictly prohibited.
The use of sand or other approved abrasives is to be limited, in terms of both quantity and frequency, and normally applied only to hills, turns, intersections and railway crossings after a storm has ended. Level areas will not normally be sanded unless severe slippery conditions exist. Urban areas may require the full length of the road be sanded.
A snow packed surface is described as a smooth, hard, good driving surface with satisfactory friction with shoulders that are free of loose snow. During warming trends it may be more efficient and economical to bare the surface than to try to maintain a snow packed condition.
The Operations Supervisor shall ice blade all snow packed surfaces that have washboarded, rutted, potholed or exhibit signs of developing slipperiness or where slipperiness has developed, especially due to rain or in rain conditions.
A summary of Level 4 service is shown in the Levels of Service Summary Table.
Winter Maintenance Performance Measurement Using Friction Testing Appendix F
F-13

December 1, 2001
Levels of Service Summary Table
LEVEL OF SERVICE Level 1A Level 1B Level 2 Level 3 Level 4
Type of Road
- All 100 Series - Selected high volume highways
- All Trunks - Selected highways as per AADT limits
- All Routes - Selected highways as per AADT limits
- All Local Paved Roads
- All Gravel Roads
AADT Limits > 7,500 7,500 - 4,000 4,000 - 1,500 < 1,500
Primary objective Essentially Bare Pavement*1
Essentially Bare Pavement*1
Centre Line Bare 2.5m to 5.0m
Centre Line Bare 1.2m to 2.5m Snow Packed
Time to meet primary objective after end of storm, not exceeding
8 hrs 12 hrs 12 hrs 24 hrs 24 hrs
Salting - Application of salt
Beginning of storm and
during as required
Beginning of storm and
during as required
Beginning of storm and
after
Beginning of storm where required and
after
N/A
Max. Application Rate (Rate based on 2-Lane Road)
125 kg/CL km 125 kg/CL km 110 kg/CL km 85 kg/CL km N/A
Plowing - Begin plowing when snow accumulation
≤ 25mm ≤ 25mm ≤ 50mm During storm as
required
During storm as
required - Max allowable accumulation ≤ 75mm ≤ 100mm ≤ 150mm ≤ 200mm ≤ 200mm
Sanding -Application of sand
- Not normally sanded - Sand only during severe cold with slippery conditions
Beginning of storm for environmentally sensitive areas or during severe cold with slippery conditions
Beginning of storm for environmentally sensitive areas or during severe cold with slippery conditions
- Beginning of storm where required and after - For environmentally sensitive areas - Slippery conditions when required
- After storm - For environmentally sensitive areas - Slippery conditions when required
Max. Application Rate (Rate based on 2-Lane Road)
N/A 800 kg/CL km 800 kg/CL km 500 kg/CL km 500 kg/CL km
*1 At cold temperatures below -10�C in the day and -7�C in the night when deicing methods are no longer effective, with prior approval from the Area Manager, the Operations Supervisor shall use sand or other approved abrasive materials to maintain an even surface free of loose snow with satisfactory friction. A roadway free of snow and ice is considered always to have satisfactory friction. A snow covered roadway has satisfactory friction if permitted vehicles can be driven on it with safety.
Winter Maintenance Performance Measurement Using Friction Testing Appendix F
F-14

December 1, 2001
ACCOMPLISHMENTS
Winter snow and ice control shall be recorded under the following activity numbers:
Activity No. Description ACCOMPLISHMENTS
104 Plowing Machine Hours
105 Salting tonnes
106 Sanding tonnes
NOTE:
! When a vehicle is plowing but not dispensing salt it is considered to be plowing.
! If a vehicle is dispensing salt or sand it is considered to be salting or sanding
regardless of weather the plow is down or not.
Winter Maintenance Performance Measurement Using Friction Testing Appendix F
F-15

City of Kamloops, British Columbia Roadways
In order to effectively control snow and ice throughout Kamloops, priorities are placed on the class of roads so as to optimize the benefits of our efforts. The priority levels described are the general rule; due to steep grades throughout Kamloops, some streets have their priority raised for safety purposes. The detailed zone maps in Appendix A identify the relative priorities throughout the City.
Priority 1 - Arterials Monitor weather warning system to prepare for anti-icing; Anti-ice as required; Maintain bare tracks as long as possible during storm event; Plow to remove excess precipitation (snow/slush); Anti-ice during storm event until compact layer is formed; Address compact snow during storm event with abrasives (corners, hills, and intersections); De-ice when storm event is completed; Obtain bare tracks within 4 hours of the completion of the storm event. Priority 2 - Collector Roads and Bus Routes Maintain bare tracks as long as possible during storm event; Plow to remove excess precipitation (snow/slush); Address compact snow during storm event with abrasives (corners, hills, and intersections); De-ice when storm event is completed; Address within 16 hours of the completion of the storm event. Priority 3 - Local Roads Plow to remove excess precipitation (snow/slush) after the completion of storm event; Address with abrasives as required once plowed; Address within 36 hours of the completion of the storm event. Lanes On-going snow and ice control on back lanes is not undertaken unless in exceptional circumstances such as the lane providing primary access or for safety reasons due to steep grades. In order to provide mobility for normal City operations such as garbage pick-up, occasional snow plowing may occur if accumulations warrant it.
Snow Removal Snow removal in the City Centre area is undertaken when the windrows exceed 60 cm and weather forecasts do not predict melting conditions. In addition, specific area snow removal operations are undertaken as a response to safety concerns (improve sight lines / widen travel lanes) and drainage issues. During the spring clean-up, snow removal will occur for the purpose of expediting street sweeping. Snow removal is to be done only with the approval of the Streets Supervisor.
Winter Maintenance Performance Measurement Using Friction Testing Appendix F
F-16

Winter Maintenance Performance Measurement Using Friction Testing Appendix F
F-17

Winter Maintenance Performance Measurement Using Friction Testing Appendix F
F-18

Toronto
CONDITIONS FOR WINTER MAINTENANCE OPERATIONS – TABLE 1
Page 1
Pavement Conditions After Sanding/Salting
Start of Ploughing After
Accumulation of(Cm)
Time To Completion(Hours) After The End of Snowfall
Storm Type 1 30-40 per year
(5cm)
Storm Type 2 3-6 per year
(5-15cm)
Storm Type 3 Once/2-3
years (15-25cm)
Storm Type 4
Once/10 years
(over 25cm) Expressways Bare Pavement 2.5 to 5.0 and
still snowing 2-3(1) 2-3(1) 2-3(1) 2-3(1)
Red Arterial Roads
Bare Pavement 5.0 and still snowing - 6-8 8-10 12-14+(2)
Blue (Bus Routes
Collector Roads/Locals with
Hills)
Centre Bare 5.0 – 8.0(3) - 8-10 10-12 14-16+(2)
Green (Local Streets)
Safe and Passable 8.0(3) - 14-16 18-20 24-36+(2)
Yellow (Local Streets
without boulevards and with long term on street parking
Safe and Passable 8.0(3) - 14-16 18-20 24-36+(2)
Dead Ends (or cul-de-sacs)
with limited or no snow storage
Safe and Passable 8.0(3) - 14-16 18-20 24-36+(2)
Laneways De-Ice as necessary
To maintain passable
Conditions
8.0 - - 50
Notes (1) Ploughing on Expressways is continuous for bare pavement conditions (2) Completion of ploughing under Type 4 Storm conditions, is dependant upon total snow accumulation (3) Snowfall to be substantially completed prior to ploughing operations commencing(except for heavy snowfalls)
Winter Maintenance Performance Measurement Using Friction Testing Appendix F
F-19

1
CITY OF YELLOWKNIFE
COUNCIL POLICY
POLICY: TRANSPORTATION MAINTENANCE
PURPOSE: To describe the manner in which transportation infrastructure maintenance will be carried out on roads designated for maintenance by the City.
AUTHORITY: Council Resolution # 2006-24-10 dated December 11, 2006
TRANSPORTATION MAINTENANCE POLICY
ENABLING LEGISLATION
1. Section 272 of the Municipal Act provides, “subject to this and the Highways Act, a municipality has jurisdiction, management and control over all highways within the boundaries of the municipality, other than a highway excepted by order of the Commissioner in Executive Council”.
POLICY STATEMENT
2. The City of Yellowknife is responsible for the maintenance of public road rights-of-way, including storm water management, within the geographical boundaries of the City. This maintenance responsibility includes, but is not limited to, the regularly scheduled remedial and repair work to provide for a reasonable level of service, safe road conditions and to extend the life of the infrastructure. The City will provide this service on a priority basis in a cost-effective manner, keeping in mind safety, budgets, personnel and environmental concerns.
OBJECTIVES
3. The objectives of this policy are: (1) To provide vehicular and pedestrian traffic with adequate mobility within
the City’s financial resources. (2) To prevent or reduce accidents and injuries. (3) To extend the life of transportation infrastructure. (4) To set the level of service for transportation infrastructure maintenance. (5) To provide an operational plan outlining how, when, where and in what
order of priority transportation maintenance is carried out. (6) To minimize economic loss to the community resulting from restricted
transportation routes.
Winter Maintenance Performance Measurement Using Friction Testing Appendix F
F-20

Council Policy: TRANSPORTATION MAINTENANCE 2007
2
DEFINITIONS
4. In this policy, “ASPHALT” means mixture of bitumen oil and aggregate to form asphalt concrete surface. "CENTRAL BUSINESS DISTRICT" means the downtown core as illustrated in Appendix “A”. “BST” means bituminous surface treatment. “CRACK SEALING” means the procedure for filling cracks in pavement with rubberized asphalt. “DUST CONTROL” means a treatment for gravel surfaces to suppress dust. “FEES AND CHARGES” means the City of Yellowknife Fees and Charges Bylaw as amended from time to time. “FLUSHING” means the application of water in order to clean. “GRADING,” means grading a road using a mechanical grader. "DIRECTOR OF PUBLIC WORKS" means the Director of Public Works for the City of Yellowknife, or his approved designate. “MILLING” means the material produced as the result of grinding out asphalt prior to repairs. “PARKING METER” means a device used to time length of stay of vehicles at parking spot. “PAVEMENT” means hard road surface constructed of asphalt or BST. “POTHOLE” means depression in road surface caused by traffic or surface deterioration. “POTHOLE PATCHING” means the operation of filling a pothole with a mixture of fine aggregate and bitumen or asphalt. “REGULATORY TRAFFIC SIGN” means a sign that indicates the applicability of legal requirements that may not otherwise be apparent to the driver. “ROAD/STREET” used interchangeably, means the portion of the roadway that is designed and normally used by vehicular traffic and includes the shoulder but not the sidewalk as identified, prioritized and shown in Appendix A. “ROAD RIGHTS-OF-WAY”, means that parcel of land within and owned by the City of Yellowknife dedicated to vehicular and pedestrian traffic. “SIDEWALK” means the hard surface designed and constructed for and normally used by pedestrian traffic within the road right of way, including designated multi-use paths. “SEASON” means the period of time during which a maintenance activity is carried out.
Winter Maintenance Performance Measurement Using Friction Testing Appendix F
F-21

Council Policy: TRANSPORTATION MAINTENANCE 2007
3
"SNOW AND ICE CONTROL AGGREGATE" means material placed during winter generally with a gradation of 16mm minus. “SPRING CLEANUP” means a period during spring where crews concentrate on an initial clean up of dust and dirt on City Streets. “STORM SEWER” means sewer system designed to transport surface water run-off from streets. “STREET LIGHT” means an overhead light to enhance nighttime visibility for vehicular and pedestrian traffic. “STREET SWEEPING” means the sweeping up and removal of dust and dirt from City Streets with a mechanical sweeper. “TRAFFIC CONTROL UNIT” means electronic control device used to control traffic lights. “TRAFFIC LIGHT” means an electrical signal light at intersections and along roadways to control traffic flow. “TRAFFIC SIGN” means a road sign to notify, control or provide warning for motorists. “TRANSPORTATION MAINTENANCE ACTIVITIES” means any maintenance activity as set out in this policy. “WARNING SIGN” means a sign that indicates in advance conditions on or adjacent to a road that will normally require caution and may require a reduction in speed.
RESPONSIBILITIES
5. City Council shall: (1) Set and adopt the Transportation Maintenance Budgets. (2) Adopt the levels of service. (3) Adopt the Priority Road, Sidewalk, and Storm Sewer Maps on an annual
basis. 6. The Director of Public Works shall ensure the implementation of the
Transportation Maintenance Policy by: (1) Determining when and how to initiate and perform Transportation
Maintenance activities. (2) Allocating and scheduling Public Works resources. (3) Obtaining, allocating and scheduling privately held resources. (4) Addressing Public concerns. (5) Managing the Budget.
Winter Maintenance Performance Measurement Using Friction Testing Appendix F
F-22

Council Policy: TRANSPORTATION MAINTENANCE 2007
4
(6) Recommending revisions to the Policy and Priority Roads, Sidewalks and Storm Sewer Maps on an annual basis.
7. The Public Works Employees shall carry out maintenance in accordance with the Transportation Maintenance Policy and in accordance with the instructions of the Director of Public Works.
ROADWAY PRIORITIES
8. The City operates with a limited amount of funds, which are required for a number of purposes. In establishing the Transportation Maintenance Policy, the City must take into consideration its financial resources and its personnel. Priorities are established to provide the greatest benefit to the majority of the travelling public. In setting priorities, consideration is given to criteria such as construction of the road in relation to the City of Yellowknife Servicing Standards Manual; traffic volume; road classification; road geometrics; transit; emergency services, budget funds, personnel, resources and environmental considerations.
9. The City has set five priority ratings for roads as follows and as illustrated and identified in the maps attached in Appendix A: (1) Priority 1: Freeways, major arterial roads, emergency routes, major
bus routes, roads adjacent to areas with concerns of impact relating to water quality and the environment.
(2) Priority 2: Remainder of the arterial roads, remainder of the bus routes, roads in the Central Business District, roads adjacent to schools and roads to prioritised City owned facilities and emergency routes within Priority 2 zones.
(3) Priority 3: The remainder of roads in the City. (4) Priority 4: City owned parking lots and lanes. (5) Unless specifically authorized by the Director of Public Works the City will
not maintain any other road not illustrated and identified in Appendix A.
PUBLIC RELATIONS
10. The Administrative Assistant at the Public Works Garage (766-5512), Monday to Friday, 0700 to 1600, shall handle all concerns and inquiries. At all other times, emergency concerns and inquires shall be directed to City Dispatch at 920-5699. Maintenance activities or information may also be advertised in the Capital Update newsletter, and may be included in the Public Works pages on the City website (www.yellowknife.ca).
HOURS OF OPERATION AND STAFF DEPLOYMENT
11. The City will provide Transportation Operation & Maintenance functions on road rights of way within the geographical boundary of the City of Yellowknife, as illustrated and identified in Appendix A.
Winter Maintenance Performance Measurement Using Friction Testing Appendix F
F-23

Council Policy: TRANSPORTATION MAINTENANCE 2007
5
12. Standard hours of operation are weekdays 0700 to 1600. Weekend shifts, early morning shifts and night shifts may also be deployed as determined by the Director of Public Works.
13. Operations that will constrain traffic flow will not take place in school zones between the hours of 0800 to 0930, 1130 to 1330 and 1500 to 1630, when school is in session, unless in case of emergency or major safety concern.
14. When in the opinion of the Director of Public Works abnormal conditions exist, overtime, additional City equipment and outside forces and equipment may be mobilized.
15. Un-seasonal or abnormal weather conditions may affect regularly scheduled maintenance activities.
PARKING BANS
16. Parking bans may be implemented to provide for operations. Areas where parking is to be banned will be signed twenty four (24) hours in advance. Vehicles that do not adhere to the parking ban may be towed and the owner of the vehicle shall be responsible for all towing costs. Authority for this is provided through the Consolidated Highway Traffic Bylaw 4063, Schedule B.
SAFETY
17. All work shall be carried out in accordance with the General Safety Regulations of the WCB Occupational Health and Safety Act and the City of Yellowknife Safe Work Practices. Scheduled or emergency maintenance work may at times require traffic lanes to be closed or detoured in order to safely carry out work.
UNPAVED ROAD MAINTENANCE
18. Maintenance on unpaved roads is carried out in order to restore the road structure and to improve ride and safety for motorists.
19. Unpaved road conditions are inspected, classified, prioritized and logged as part of the Pavement Management System. Maintenance frequency and cost will be monitored as part of the Pavement Management System.
20. Unpaved Road maintenance begins when ambient temperatures are above freezing and the frost is out of the ground. Work typically commences at the beginning of May and is completed by the end of September
21. Unpaved Road Maintenance consists of the following activities: (1) Road Grading is carried out on unpaved roads using a motor grader and
is done in order to mix road aggregates, to re-establish the crown of the road and to smooth and fill potholes and uneven road surfaces. New granular material is added as required. Road grading is a slow operation with speeds of 3-5 km/hr. Windrows may be left for short periods of time
Winter Maintenance Performance Measurement Using Friction Testing Appendix F
F-24

Council Policy: TRANSPORTATION MAINTENANCE 2007
6
during active grading operations until successive passes spread material over the grade of the road.
(2) Dust Control is carried out on unpaved roads as a preventative maintenance measure that helps to maintain the integrity of the road, improve visibility for vehicular traffic and to reduce the health and aesthetic impacts caused by dust on adjacent developments. Calcium chloride is generally used as dust palliative. Road surfaces are graded and then calcium chloride is applied, usually with water. The application involves the use of a grader, spreader truck and water truck. Application of calcium is a slow process and may result in temporary muddy conditions. Generally it takes 2 days for the road surface to set and become a hard driving surface.
22. The City has set the following standards for Unpaved Road Maintenance: (1) Maintenance is to be done in accordance with approved budgets. (2) Scheduled operations will be conducted on unpaved road surfaces as
indicated in priorities below. (3) Priority 1 – Residential Roads: The roads shall be graded first during
spring and then on a monthly basis, if needed, for the rest of the season. Roads will be evaluated for the need of dust control and, if needed, dust control will be scheduled and carried out first.
(4) Priority 2 – Industrial Roads: The roads shall be graded second during spring and then on a monthly basis, if needed, for the rest of the season. Roads will be evaluated for the need of dust control and, if needed, dust control will be scheduled and carried out second.
(5) Priority 3 – Parking Lots: City owned parking lots shall be graded and have dust control operations carried out on an irregular basis as required by the Director of Public Works.
DITCHING & SHOULDERING
23. Ditching and shouldering is carried out as a restorative/preventative maintenance activity and to improve safety along roadways.
24. Maintenance begins when ambient temperatures are above freezing and the frost is out of the ground. Work typically begins at the beginning of May and is completed by the end of September.
25. Ditching and shouldering consists of the following activities: (1) Shouldering is carried out on roads as a preventative maintenance
measure that helps to maintain the integrity of the road. Shoulders provide structure to the road and allow drainage from the road surface into ditches. They also allow a safe area for vehicles to pull off the travelled portion of the road. Maintenance is carried out using a motor grader. The grader pulls material from the ditch back up onto the shoulder, which is
Winter Maintenance Performance Measurement Using Friction Testing Appendix F
F-25

Council Policy: TRANSPORTATION MAINTENANCE 2007
7
then graded to match original road grades. New granular material may be added in cases of washouts. The process is slow with grader speeds of 3-5 km/hr. Shoulders may be re-compacted. Any damaged guide rails or other road appurtenances are identified and scheduled for repair.
(2) Ditching is carried out as a preventative maintenance activity to ensure that surface water drains away from the road structure. Ditches and culverts are inspected annually to observe any flow restrictions or other problems that are subsequently scheduled for repair. Maintenance and repairs may be provided, if needed, depending on the nature of the problem. During spring break-up culverts are thawed, if needed, to maintain flow. Culverts with a history of silting are flushed out in the fall. Failed culverts are scheduled for replacement.
(3) Brushing is carried out in order to control excessive vegetation growth along shoulders of roads, in ditches, and in other areas that can cause visibility problems for motorists and can also interfere with drainage. Brush is removed with an excavator in the late summer/early fall when ditching is in progress. Brushing is performed by the most effective means necessary.
26. The City has set the following standards for Ditching and Shouldering: (1) Maintenance is to be done in accordance with approved budgets. (2) Scheduled operations will be conducted along roads as indicated in
priorities below. (3) Priority 1: The roads shall be inspected first during spring and
evaluated for ditching, shouldering and brushing needs. Maintenance work will be scheduled in first priority and then only on an as required basis.
(4) Priority 2: The roads shall be inspected second during spring and evaluated for ditching, shouldering and brushing needs. Maintenance work will be scheduled after priority 1 roads and then only on an as required basis.
(5) Priority 3: The roads shall be inspected and evaluated for ditching, shouldering and brushing needs and have maintenance work scheduled as required by the Director of Public Works.
(6) Priority 4: Unpaved lanes and parking lots shall be inspected and evaluated for ditching, shouldering and brushing needs and have maintenance work scheduled as required by the Director of Public Works.
PAVEMENT MAINTENANCE
27. Pavement Maintenance is carried out in order to extend the life of paved and BST surfaces and to improve ride and safety for motorists. Maintenance includes work done on asphalt and BST roads. Over time paved surfaces form
Winter Maintenance Performance Measurement Using Friction Testing Appendix F
F-26

Council Policy: TRANSPORTATION MAINTENANCE 2007
8
cracks and surface deterioration leads to potholes and, in some cases, total deterioration of entire sections of pavement.
28. Paved road conditions are inspected, classified and logged as part of the Pavement Management System. Arterial and collector roads are inspected annually and the remaining roads are inspected once every second year. Data is used to schedule maintenance, capital upgrades and replacement.
29. Pavement Maintenance begins when ambient temperatures are above freezing and the frost is out of the ground. Work typically begins at the beginning of May and is completed by the end of September.
30. Pavement Maintenance consists of the following activities: (1) Pothole Patching is carried out on paved and BST roads by hand
placement of hot/cold asphalt mix to fill. Patches are ready for traffic immediately after the repair has been made. Potholes shall be logged as they are reported either by City crews or by public complaint and scheduled for repair. Initially a temporary patch may be installed with a permanent patch scheduled for later installation.
(2) Crack sealing is carried out on asphalt surfaces using a crack-sealing machine. Most cracks are routed and cleaned and then a hot tar sealant is poured into the crack to seal. Sand is placed over the sealed crack to protect the surface from traffic. The sealed crack is ready for traffic within 1 hour of work being complete. Crack sealing needs are logged as part of the pavement management program. Initial crack sealing shall commence within the first 2 years of a surface being paved.
(3) Large pavement patches are required where there is a failure of the paved surface or as the result of excavation rehabilitation. The deteriorated section of pavement is removed and new asphalt laid using a paving machine. The patch is ready for traffic within 1 hour of the work being complete. Major pavement road failures will be scheduled for asphalt overlay or reconstruction under capital works.
31. The City has set the following standards for Pavement Maintenance: (1) Maintenance is to be done in accordance with approved budgets. (2) Scheduled pavement maintenance operations will be conducted on paved
and BST road surfaces as indicated below. (3) Priority 1: The roads shall be inspected first during spring. Potholes,
cracks and large pavement patch requirements shall be logged and any maintenance needs that are identified in the pavement management program reviewed. Any roads with pavement or pavement overlay work completed within the previous 2 years shall receive priority for crack sealing. All maintenance work shall be scheduled and work carried out first and then on an as needed basis thereafter. Severe potholes or pavement failures shall be responded to within 24 hours after the City has been notified.
Winter Maintenance Performance Measurement Using Friction Testing Appendix F
F-27

Council Policy: TRANSPORTATION MAINTENANCE 2007
9
(4) Priority 2: The roads shall be inspected second during spring. Potholes, cracks and large pavement patch requirements shall be logged and any maintenance needs that are identified in the pavement management program reviewed. Any roads with pavement or pavement overlay work completed within the previous 2 years shall receive priority for crack sealing. All maintenance work shall be scheduled and work carried out after priority 1 roads and then only as needed for the rest of the season. Severe potholes or pavement failures shall be responded to within 48 hours after the City has been notified.
(5) Priority 3: The roads shall have pavement maintenance operations carried out as required by the Director of Public Works.
(6) Priority 4: Paved lanes and parking lots shall have pavement maintenance operations carried out as required by the Director of Public Works.
STREET & SIDEWALK SWEEPING 32. Street sweeping is carried out as indicated in the Consolidated Highway Traffic
Bylaw 4063, in order to remove dust, debris and litter that has collected on city streets. Excessive dust can result in poor visibility that can result in safety concerns for motorists. In addition, excessive dust may pose health concerns and is aesthetically unpleasing.
33. Street sweeping is carried out during spring, summer and fall. Spring cleanup is an annual maintenance activity with focus on removal of snow and ice control aggregate that has accumulated over winter. Spring cleanup begins when streets are significantly clear of snow and ice, usually mid April, after the risk of snow has passed. Spring Cleanup is typically complete by mid May after which sweeping is carried out at various levels of service for the duration of the season, which usually extends to the end of September.
34. Sweeping operations will only be conducted when weather conditions permit. Temperatures below 0ºC, wind, rain, snow and frozen gutter lines are factors that may delay sweeping operations.
35. Sweeping is carried out using a mechanical street sweeper. It is a slow process with average gutter line speeds for the first sweeping in spring that can be as slow as 3-5 km per hour. Normally centre lines are swept after the gutter lines are cleaned. Flushing equipment may be used in order to remove very fine dust particles in the Central Business District once in July.
36. The City has set the following standards for Street and Sidewalk Sweeping: (1) Maintenance is to be done in accordance with approved budgets. (2) Scheduled operations will be conducted on paved and BST road
surfaces as indicated in priorities below.
Winter Maintenance Performance Measurement Using Friction Testing Appendix F
F-28

Council Policy: TRANSPORTATION MAINTENANCE 2007
10
(3) Priority 1: The roads shall be swept first during spring cleanup and then be swept on a weekly basis, if needed, throughout the sweeping season.
(4) Priority 2: The roads shall be swept second during spring cleanup and then be swept on a monthly basis, if needed, throughout the sweeping season.
(5) Priority 3: The roads shall be swept once during spring cleanup and only as required by the Director of Public Works thereafter.
(6) Priority 4: Paved lanes and parking lots shall be swept as required by the Director of Public Works.
(7) Street sweeping on City boulevards and medians will be carried out once during spring cleanup and then only if needed throughout the rest of the season.
(8) Loose material left on roads as the result of crack sealing, pothole patching or milling operations will be swept within 2 days after completion of the work during which time warning signs shall remain in place.
37. Throughout the sweeping season the City will provide sweeping on sidewalks adjacent to City property as illustrated and identified in Appendix “B” to provide for reasonable community aesthetics and safe pedestrian travel. All other sidewalks shall be swept in accordance with Section 109 of the Consolidated Highway Traffic Bylaw 4063, which stipulates that every occupier of any building bordering upon any street within the City shall keep the sidewalks in front of or abutting such building in a state of cleanliness.
38. The City will provide sweeping at transit shelters, on an as-required basis, to provide for reasonably safe pedestrian travel.
STORM SEWER MAINTENANCE
39. Storm sewer maintenance is carried out in order to ensure surface water is able to drain off and away from streets. Keeping water off the street ensures vehicular and pedestrian mobility; reduces the potential for economic loss due to flooding and extends the life of the road and pavement structure. Regular storm system maintenance is also important in maintaining acceptable storm water effluent quality.
40. Storm sewer maintenance begins when ambient temperatures are above freezing and the spring melt water begins to pond. The storm sewer system consists of catch basins, manholes, laterals, mains and outfalls. Maintenance consists of the following activities: (1) Thawing is carried out in order to maintain flow of water as needed when
freezing and thawing conditions exist. This generally occurs March through May. Thawing is done using hot water or steam. In areas with drainage problems as identified in Appendix A, snow shall be removed
Winter Maintenance Performance Measurement Using Friction Testing Appendix F
F-29

Council Policy: TRANSPORTATION MAINTENANCE 2007
11
from streets prior to thawing of the storm water system in order to reduce the potential for “re-freezing” during successive freeze/thaw cycles.
(2) Cleaning and Flushing is carried out on storm water systems as a preventative maintenance activity to ensure proper drainage and to maintain acceptable effluent quality. Cleaning and flushing is done using a sewage vactor truck. Accumulation of sediments and debris are dislodged using water at high pressure and then removed using suction. Any material found in a storm system that appears to be deleterious in nature, shall be removed and disposed of in accordance with the City’s Water Licence.
(3) Storm Sewer System Repairs are carried out as a preventative maintenance activity or as needed in order to ensure the system is working as it was intended. Annual inspections shall identify maintenance work required. Work may include, but is not limited to, the levelling of catch basin frames or grouting and benching of catch basins and storm manholes. Defective catch basin frames or covers shall be repaired or replaced.
41. The City has set the following standards for Storm Sewer Maintenance: (1) Maintenance is to be done in accordance with approved budgets. (2) Storm sewer maintenance operations will be carried out on a priority
basis, based on the severity of the event, public safety and property damage.
(3) Storm sewer and appurtenance repair needs are identified during scheduled maintenance and then shall be scheduled for repair as needed.
SIDEWALK MAINTENANCE
42. Sidewalk maintenance is carried out in order to provide a reasonable walking surface and level of safety for pedestrians. Ongoing maintenance also extends the life of sidewalk infrastructure. Maintenance includes pruning of trees/bushes adjacent to the sidewalk that pose a safety hazard to pedestrians.
43. Sidewalks are inspected, classified and logged as part of the Pavement Management System by Public Works Maintenance crews. Sidewalks in the downtown core are inspected annually and the remainder of sidewalks are inspected once every second year.
44. Public complaints are received and logged. Data is used to schedule for maintenance, capital upgrades and replacement.
45. Sidewalk maintenance includes repair or replacement of single panels of sidewalk, or entire sections, depending on the need. Surface restoration may be carried out where feasible. Curbs and medians are repaired or replaced as needed.
Winter Maintenance Performance Measurement Using Friction Testing Appendix F
F-30

Council Policy: TRANSPORTATION MAINTENANCE 2007
12
46. Sidewalk maintenance begins when ambient temperatures are above freezing and the frost is out of the ground. Work typically begins at the beginning of June and is completed by the end of September.
47. The City has set the following standards for Sidewalk Maintenance: (1) Maintenance is to be done in accordance with approved budgets. (2) Sidewalks shall be repaired and maintained in a reasonable condition to
allow for safe passage of pedestrians. Priority is given to high volume sidewalks with the objective of reducing or eliminating tripping hazards.
(3) Curbs and medians are maintained in a satisfactory condition to delineate driving and parking areas and to channel and contain drainage.
TRAFFIC CONTROL SYSTEMS MAINTENANCE
48. Maintenance on Traffic control systems is carried out in order to ensure control systems are in place and operating for vehicular and pedestrian traffic safety and mobility. Traffic Control systems consist of traffic lights, traffic signs, street markings, parking meters and streetlights.
49. Traffic lights and pedestrian crossings control vehicular and pedestrian traffic in higher traffic volume areas. Systems are inspected and maintained on a year round ongoing basis. The City has set the following standards for Traffic Light Maintenance: (1) Maintenance is to be done in accordance with approved budgets. (2) Ongoing visual inspections of traffic lights are conducted by City crews or
are reported from outside agencies or the public. All concerns are logged. Complete repairs to failed traffic lights are a high priority and shall be attended to as soon as practical by the regular scheduled crew, call out crew or contractors as needed.
(3) Traffic control units shall be inspected and preventative maintenance undertaken on an annual basis during summer.
(4) Poles and mounting hardware shall be inspected annually during summer. (5) Traffic light heads and pedestrian crossing lights shall be cleaned and
LED units checked annually during summer. 50. Traffic signs control and guide vehicular movement throughout the City. Signs
are inspected and maintained on a year round ongoing basis. The City has set the following standards for Traffic Sign Maintenance: (1) Maintenance is to be done in accordance with approved budgets. (2) Ongoing visual inspections for traffic sign problems are conducted by City
crews or are reported from outside agencies or the public. Repairs or replacement of damaged or missing regulatory traffic and warning signs are a high priority and shall be attended to as soon as practical by regular
Winter Maintenance Performance Measurement Using Friction Testing Appendix F
F-31

Council Policy: TRANSPORTATION MAINTENANCE 2007
13
scheduled crew or by call out crew as needed. All other signs will be replaced during regular scheduled work.
(3) All signs and sign posts locations and type are logged in a sign database, and included in GIS.
(4) Signs are cleaned and maintained on an annual basis or as needed. 51. Street Markings guide and control vehicular and pedestrian movements
throughout the City. The Street Marking program includes longitudinal driving lines and divisional lines, crosswalks, stop bars, arrows, and auxiliary markings. Maintenance operations begin in spring when ambient temperatures are above freezing and after ice control aggregate has been swept and roads have been flushed. Work generally commences in June and extends through August. All street markings are painted once a year. The City has set the following standards for priorities for Street Marking Maintenance: (1) The maintenance of the standards is to be done in accordance with
approved budgets. (2) 1st Priority: Driving and divisional lines throughout the City. (3) 2nd Priority: Pedestrian Crossings and stop bars in school zones. (4) 3rd Priority: Pedestrian crossings and stop bars in the downtown core. (5) 4th Priority: The remainder of pedestrian crossings and stop bars in
the City. (6) 5th Priority: The remainder of all markings in the City.
52. Street Lights provide lighting for roadways and parking lots to enhance nighttime visibility for vehicular and pedestrian traffic. Northland Utilities Limited has established design levels in conjunction with the City of Yellowknife Engineering Department. The system is owned, operated and maintained by Northland Utilities Limited with the service paid for by the City on a unit-based rate that is reviewed periodically. When Street light failures are reported to the Public Works Maintenance Control Centre they are logged and then forwarded to Northland Utilities Limited for repair.
APPENDICES
Appendix “A”, Priority Streets (maps and text) Appendix “B”, Sidewalks and Trails (maps only) Appendix “C”, 1st Priority Storm Sewer Cleaning (maps only)
Winter Maintenance Performance Measurement Using Friction Testing Appendix F
F-32

I N S T R U C T I O N A L M E M O R A N D U M
IOWA DEPARTMENT OF TRANSPORTATION HIGHWAY DIVISION
OFFICE OF MAINTENANCE
IM 8.010
CHAPTER: SNOW AND ICE CONTROL NO: 8.010 TITLE: GENERAL GUIDELINES APPROVED: ORIGINATION DATE: October 15, 1984 REVISION DATE: September 28, 2005 I. Purpose:
To provide guidelines for carrying out the snow and ice control program. II. Definitions:
A. Early Morning Frost - frost that is generally expected to develop about the
time of sunrise. B. Roadway Weather Information System (RWIS) – A combination of
technologies that collects, transmits, models, or disseminates weather and road condition information.
C. Winter Abrasive – abrasive that has been treated with salt for use in winter operations.
D. Metropolitan Areas – The areas of Ames, Cedar Rapids, Council Bluffs, Davenport, Des Moines, Dubuque, Iowa City, Sioux City and Waterloo shall be defined as metro areas.
III. References:
A. Iowa DOT Policies and Procedures Manual (PPM) 010.14, 010.08,
120.07, 610.13, 610.17, 800.02, and 800.04 B. Office of Maintenance Instructional Memorandum (IM) 8.030, 8.100, and
8.400 C. Iowa DOT Standards for Maintenance Activities (Functions 675, 676, 677,
678 and 682) IV. General Guidelines:
A. Snow and ice control operations should be performed in accordance with appropriate policies and instructions contained and referenced herein.
V. Procedures:
A. Assistance to the Public 1. During severe snow storms maintenance employees should assist
occupants of stalled vehicles to reach the nearest shelter. Stalled
Page 1 of 6
Winter Maintenance Performance Measurement Using Friction Testing Appendix F
F-33

IM 8.010
vehicles observed before snow removal equipment is taken off the road should be checked for occupants.
2. Maintenance employees should provide assistance to victims and flag traffic at accident scenes.
3. Emergency trips with snow removal equipment should be made when requested by law enforcement authorities, fire departments, or doctors. After completion of the emergency trip, Highway Maintenance Supervisors (HMS) must be notified as soon as practicable.
4. State owned equipment shall not be used to pull or tow a privately owned vehicle that has run off the roadway.
5. Field personnel should move temporarily abandoned vehicles off the pavement surface only if they interfere with maintenance operations and law enforcement is not available to assist. License plate numbers of moved vehicles should be recorded for future reference.
B. Equipment Operation 1. Snow removal equipment shall only be used on primary highways and
state park and institutional roads except: a. As noted in V.A.3. above. b. When authorized by an emergency declaration of the governor. c. When authorized by the District Maintenance Manager (DMM),
District Operations Managers (DOM) or HMS pursuant to an agreement with a county or city.
2. Utilize regular snow equipment whenever possible. Switch to "V" plows to open blocked roads and use wings to lay snow back. If a rotary plow is necessary, open the drift and move to the next blocked area, return to widen out later if necessary.
3. Spreaders should be equipped with spinners or chutes to properly place abrasives and chemicals.
4. Trucks should carry sufficient ballast to provide traction for the job being performed. Chains or cables should be available for use when needed.
5. Prewetters should be used to aid snow and ice removal. 6. Ice blades or motor graders should not be used on unit 30 or 40
inverted penetration surfaces. Use on unit 80 or 90 surfaces should be carefully monitored to assure that the surfaces are not damaged.
7. Liquid applicators can be used in anti-icing and deicing operations to aid snow and ice removal.
8. Shoes, casters or wing-stops should be used on plows and/or wings to avoid scalping of shoulders.
C. Traffic Control 1. Special signing or flagging is not required for snow and ice control
operations except flag persons should be used to assist traffic during cleanup operations when: a. Snow is being moved across the highway. b. Rotary snowplows are working in a traffic lane. c. Rotary snowplows are blowing snow across a traffic lane.
IM 8.010 Page 2 of 6
Winter Maintenance Performance Measurement Using Friction Testing Appendix F
F-34

IM 8.010
d. The operation of rotary snow plows causes visibility to be obscured.
D. Weather Advisory Service 1. The Office of Maintenance arranges for daily weather advisory
reports during the winter months by contracting with an approved meteorological firm. These reports will provide daily forecasts for general weather conditions, pavement temperatures, storm development and progress, and frost formation potential.
a. The daily forecasts shall be considered in planning maintenance
operations, responses to storm development and progress, and frost runs.
b. When the weather advisory service forecasts early morning frost for bridges, the following are the methods available for treatment of frost:
1) If the 12:00 p.m. frost forecast predicts frost the following morning, and in accordance with V.D.1.e. crews shall begin applying liquid deicers anytime after the issuance of the forecast and prior to the end of the shift on the day the forecast is issued, except garages in Metropolitan areas. Metropolitan areas may apply liquid between noon on the day of the forecast and 7:00 a.m. the morning of the expected frost event.
2) On the morning of a predicted frost event, when it is necessary to treat frost that morning, crew shifts to treat those bridges shall begin between 5:30 a.m. and 7:00 a.m. and bridges may be treated with liquid deicers, dry deicers or mixtures.
3) After the first predicted or actual frost event of the season, the HMS may choose to treat for anticipated weekend (Saturday, Sunday, and Monday morning) frost on Fridays after 7:00 a.m. with liquid deicers. If precipitation (including frost) occurs after Friday treatment, the bridges should be retreated before the next predicted frost as prescribed in V.D.1.b.(1) or (2) above.
c. A temporary assignment schedule will be posted prior to October 15th each year to assign employees for bridge frost treatments on weekends and holidays. The scheduled employee(s) shall call the frost forecast recording daily on weekends and holidays via a toll-free telephone number to determine if there is frost predicted for the following morning.
d. If conditions indicate that frost is not likely to occur, the decision not to treat the bridge rests with the HMS.
e. Liquid deicers should only be applied to treat predicted frost when the pavement temperatures are above 15 degrees Fahrenheit at the time of application and wind speeds are not forecast to exceed 15 miles per hour when loose snow is present.
IM 8.010 Page 3 of 6
Winter Maintenance Performance Measurement Using Friction Testing Appendix F
F-35

IM 8.010
f. The methods, materials and quantities to use for frost treatments rests with the HMS.
g. When notice of frost or other adverse operating conditions is received from other sources, they are to be treated as prescribed in IM 8.100.
h. Each HMS has the option to call the forecast services vendor via a toll free telephone number to discuss the forecast with a meteorologist.
E. Roadway Weather Information System (RWIS) 1. The RWIS should be utilized in planning maintenance operations.
F. Chemical and Abrasive Materials 1. Usage a. Chemicals and abrasives should be used in accordance with IM
8.100 and 8.400 to achieve surface conditions specified for the service level assigned.
2. Ordering and Delivery a. Salt should be reordered to maintain a supply consistent with the
size of the salt storage facility, anticipated needs and the statewide material storage plan.
b. Place order via purchasing requisition system to re-supply quantities of salt used. Re-supply orders should be processed as soon as practical after use or in accordance with the statewide materials storage plan.
c. Promptly generate a purchasing receipt to report actual delivery date and quantity of salt received.
d. Rock salt should be inspected immediately upon delivery. If it does not meet specifications, proceed as provided in the specifications. Contact the District Materials Engineer if there are any questions regarding procedures and keep the Office of Procurement and Distribution informed.
3. Storage a. Sufficient quantities of abrasives shall be on hand at each location
to last through the first storms; arrangements for replenishment should provide adequate quantities for the remainder of the winter.
b. Salt facilities shall be filled prior to October 15; arrangements for replenishment should provide adequate quantities for the remainder of the winter.
1) Calcium chloride in bags shall be stored under cover. 4) Winter abrasives should be stockpiled and treated with
approximately 5 – 10% salt by volume. 3) Liquid calcium chloride should have a concentration of less
than 32% calcium. Greater concentrations will solidify when stored at temperatures below 50F.
4) Sodium chloride brine should have a concentration of 23 to 24%.
IM 8.010 Page 4 of 6
Winter Maintenance Performance Measurement Using Friction Testing Appendix F
F-36

IM 8.010
5) Rock salt should be stored inside buildings. If outdoor storage must be used, the rock salt should be on an impermeable pad and covered with waterproof fabric.
6) Outdoor storage of rock salt and abrasives should be on well-graded areas which confine run-off.
7) Only limited quantities of mixture should be mixed and stockpiled because of the potential for contaminated run-off unless stored inside.
G. Use of additional Highway Division personnel 1. Additional Highway Division personnel should be used to supplement
maintenance personnel for snow and ice removal operations. Additional Highway Division personnel may perform tasks including plowing snow and applying deicing chemicals, loading trucks, making salt brine, answering phone, assisting mechanic, checking weather information, tracking resources, gathering data and photos to measure performance to support research efforts, and other duties as needed.
H. Relief Crews and Rotary Plow Crews 1. Each maintenance area should be prepared to provide snowplow relief
crews and equipment if needed. 2. Rotary snowplow assistance may be requested through the Office of
Maintenance. Rotary snowplow crews consist of two operators who will normally be required to work alternate 12-hour shifts. The local area shall furnish a person to assist the operator whenever the blower is in operation and provide proper traffic control.
3. Local area will make lodging accommodations. 4. Relief crews and rotary snowplows may be moved across District lines
by the Office of Maintenance. 5. Temporarily reassigned personnel report to and receive direction from
the supervisor of the area in which they are working. 6. Emergency expenses are to be in accordance with Iowa DOT PPM
120.07. I. Supervisor's Daily Report (Winter Supplement)
1. The Winter Supplement to the Supervisor’s Daily Report shall be completed daily from October 15 – April 15. The report is to be completed using the Department’s computer network.
2. The Supervisor’s Daily Report Form No. 810001 shall also be completed daily and retained for five years.
J. Interstate Traffic Control During Severe Winter Storms 1. Iowa DOT PPM 610.17 provides guidance for interstate highway
traffic control during severe winter storms and other emergencies. K. Law Enforcement
1. Field maintenance personnel should cooperate with law enforcement agencies as provided in Iowa DOT PPM 800.02.
2. Department of Public Safety, Division of Communications should be kept advised of maintenance operations conducted outside normal work hours.
3. Notify law enforcement agencies when an abandoned vehicle needs to be removed from highway right-of-way.
IM 8.010
Page 5 of 6
Winter Maintenance Performance Measurement Using Friction Testing Appendix F
F-37

IM 8.010
L. Communications 1. Maintenance field forces shall use the two way radio system, computer
system, scanners and telephone systems to report operational activities, communicate storm development and progress, and assist in planning responses to storms. a. The Office of Maintenance shall coordinate statewide transmission
of weather information. b. The District Maintenance Manager shall coordinate
communications across maintenance areas and District boundaries and provide reports to the Office of Maintenance when requested.
c. The HMS or designee shall coordinate communications between garage areas and report to the District Office when requested. d. The HMS shall communicate with adjacent HMS’s and report to the District Office when requested.
IM 8.010 Page 6 of 6
Winter Maintenance Performance Measurement Using Friction Testing Appendix F
F-38

I N S T R U C T I O N A L M E M O R A N D U M
IOWA DEPARTMENT OF TRANSPORTATION HIGHWAY DIVISION
OFFICE OF MAINTENANCE
IM 8.100
CHAPTER: SNOW AND ICE CONTROL NO: 8.100 TITLE: SNOW AND ICE REMOVAL OPERATIONS APPROVED: ORIGINATION DATE: October 15, 1984 REVISION DATE: September 18, 2006 I. Purpose:
To provide guidance to field personnel with regard to establishing criteria and priorities for snow and ice removal operations.
II. Definitions:
A. Reasonably Near Normal Surface - A pavement surface that is sufficiently free of snow, ice, frost or slush to permit maintaining reasonable vehicle control when the vehicle is operated within the framework of existing laws and regulations. Some isolated spots or strips of packed snow or ice may be present.
B. Service Level - The maintenance classification given to a section of highway as identified on the current Office of Maintenance Service Level Map and as amended by agreement with counties.
C. Anti-Icing- Operations when overtime is authorized. D. Phase 1 - Operations when overtime is authorized. E. Phase 2 - Operations that are normally conducted during regular working
hours.
III. References:
A. Iowa DOT Standards for Maintenance Activities (Functions 675, 676, 677, 678, 679, 680, 681 and 682)
B. Iowa DOT Policies and Procedures Manual (PPM) 610.02, 610.13, 610.17, 800.02, and 800.04
IV. General Guidelines:
A. Snow and Ice Control operations should be performed as set out in the
Iowa DOT Standards for Maintenance Activities and as set out in agreements negotiated with counties and cities.
B. Crew shifts including supervisors should be limited to a maximum of 12 continuous hours of work, except that employees may work 16 hours on their first shift going into a storm that has been forecast to be of lengthy duration.
Page 1 of 4
Winter Maintenance Performance Measurement Using Friction Testing Appendix F
F-39

IM 8.100
C. When the Iowa DOT's Weather Advisory Service forecasts a prolonged storm moving into the area, consideration should be given to splitting crew shifts. The Highway Maintenance Supervisor (HMS) will determine whether or not to split shifts and will inform the District Maintenance Manager (DMM) if requested. If it is decided to use split shifts, part of the crew may be sent home to rest, with the anticipation that they will be called back to work later.
D. During clean-up operations, the Department is not required to load or haul snow from primary road extensions, but may do so if considered necessary by the DMM to maintain traffic flow. Some loading or hauling of snow may be necessary at bridges, interchanges or other locations where snow storage capacity is limited.
V. Procedures:
A. Snow and Ice Removal Operations 1. To make the most effective use of resources available, a system of
service levels has been established. It is the objective to conduct operations on Service Level A, B, and C highways capable of achieving the following, whenever practical. The general priorities for the various operations are as follows:
Priority No. Phase Description of Work
1. 1 Begin treatment of frost and ice on bridge decks within 3 hours after the Department has actual notice of the condition. Response should be based on the service level assigned to each segment of the highway system.
2. 1 Begin treatment of frost on roadways and freezing
rain within 3 hours after the Department has actual notice of the condition. This work is to be scheduled on the basis of the service level priorities assigned to each segment of the highway system.
3. 1 Begin treatment or plow isolated frost, ice, and snow
on pavement surfaces within 3 hours after the Department has actual notice of the condition. The work is to be scheduled on the basis of the service level priorities assigned to each segment of the highway system.
4. 1 Clear blockages and lane restrictions on the basis of
the Service Level priorities assigned to each segment of the highway system.
5. 1 On Service Level A-B highways. Ramps, main drives
through rest areas, and paved, public used crossovers with turn lanes, achieve a reasonably near normal surface condition within 24 hours after a storm ends.
IM 8.100 Page 2 of 4
Winter Maintenance Performance Measurement Using Friction Testing Appendix F
F-40

IM 8.100
6. 1 On Service Level C highways, achieve a reasonably bare inside wheel path within 24 hours after a storm ends.
7. 1 Remove snow from the traffic side of extended or continuous traffic barriers and from attenuators in gore areas to expose the barriers during regular working hours. Overtime for this work may be approved by the HMS.
8. 2 Remove snow from driveways and parking areas of
weigh stations and rest areas. Overtime for this work may be approved by the HMS. No sand or salt is to be used on driveways and ramps within 40 feet of the scale platform.
9. 2 On Service Level C highways, achieve a reasonably
near normal surface condition within three working days after Phase I operations are completed.
10. 2 On Service Level A-B highways, plow shoulders as
necessary during regular working hours within three working days after a reasonably near normal surface condition is attained on these highways.
11. 2 On Service Level C highways, plow shoulders as
necessary during regular working hours as time permits.
12. 2 Remove snow from curbs and gutters of bridges and
from the traffic side of traffic barriers and attenuators at spot locations during regular working hours as time permits.
13. 2 Remove snow from raised medians and islands as
necessary to delineate traffic lanes during regular working hours as time permits.
B. Snow and Ice Removal Operations on State Highways maintained by others.
1. On State highways maintained by others, all snow and ice removal operations will be performed to the level of service as determined by the Department or the entity performing the maintenance.
C. Operational Limitations 1. Snow and ice removal operations may be suspended during
periods of extremely poor visibility with notification to District Maintenance Managers and law enforcement as provided in DOT PPM 800.02.
2. When limited benefits are expected from continued snow ice operations the HMS may elect to suspend operations until weather conditions improve and resources can be better utilized. Notification will be made to District Maintenance Managers and law enforcement as provided in DOT PPM 800.02.
3. Weather conditions following storms, drifting, blockages, lane restrictions, lack of resources, or abnormal conditions may preclude achieving the objectives outlined above.
IM 8.100 Page 3 of 4
Winter Maintenance Performance Measurement Using Friction Testing Appendix F
F-41

IM 8.100
4. Phase 2 operations may require special procedures such as transferring snow from one side of a roadway to the other or using rotary snow plows to widen out heavily drifted areas. The affected areas should be returned to the appropriate service level condition as soon as practical after the operation has been completed.
IM 8.100 Page 4 of 4
Winter Maintenance Performance Measurement Using Friction Testing Appendix F
F-42

IM 8.400 Page1 of 3
INSTRUCTIONAL MEMORANDUM IOWA DEPARTMENT OF TRANSPORTATION
HIGHWAY DIVISION OFFICE OF MAINTENANCE
CHAPTER: SNOW AND ICE CONTROL NO: 8.400 TITLE: CHEMICALS AND ABRASIVES APPROVED: ORIGINATION DATE: October 15, 1984 REVISION DATE: September 18, 2006 I. Purpose:
To provide guidance to field personnel with regard to procedural guidelines in the use of chemicals and abrasives in the snow and ice removal program.
II. Definitions:
A. Mixture - may be any blend of a deicing chemical and an abrasive except winter abrasives. Actual percentages of each material shall be determined by the Highway Maintenance Supervisor (HMS) or designee as conditions warrant.
B. Anti-icing - snow and ice control practice which attempts to prevent the formation or development of bonded snow and ice by timely applications of a deicing chemical.
C. Prewetting - snow and ice control practice of wetting a solid deicing chemical or mixture with a liquid deicer before application to the roadway surface.
D. Liquid Sodium Chloride - generally a 23 - 24% solution of sodium chloride in water. E. Liquid Calcium Chloride - generally a 32% solution of calcium chloride in water. F. Liquid Calcium Magnesium Acetate - generally a 25% solution of calcium magnesium acetate
in water. G. Liquid Potassium Acetate - minimum of 50% potassium plus corrosion inhibitors, by weight
used for prewetting at low temperatures. H. Deicing - removal of ice or snowpack from roadway using freeze point depressants or
mechanical methods. I. Deicing Chemical – any chemical freeze point depressant that lowers the freezing point of
water. J. Winter Abrasive – abrasive that has been treated with salt for use in winter operations.
III. References:
A. Iowa DOT Standards for Maintenance Activities (Functions 675, 676, 677, 678, 680, 681 and
682) B. Office of Maintenance Instructional Memorandum (IM) 8.010, 8.030, and 8.100 C. Iowa DOT Policies and Procedures Manual (PPM) 010.04 and 010.08
IV. General Guidelines:
A. The Department will acquire necessary chemicals and abrasive material to assist with removal of snow and ice. The use of these materials should be governed by provisions of this instruction.
Winter Maintenance Performance Measurement Using Friction Testing Appendix F
F-43

IM 8.400 Page 2 of 3
V. Procedures:
A. Service Level A-B-C 1. Deicing chemicals (liquid, solid or mixture) may be applied in the removal of heavy frost,
snow, and ice. Solid deicing chemicals or a mixture should be prewetted for better adhesion and melting. The quantity of dry material should be reduced when prewetted. Refer to the Salt Application Guidelines, attached.
2. Anti-icing may be used prior to and during a winter storm to help prevent the bond of snow and ice to the pavement surface.
3. In general, rock salt (liquid or dry) should not be used with pavement temperature of 15 degrees F and falling. Salt may be applied if pavement temperatures are expected to rise to 15 degrees F or above.
4. Caution should be used when applying liquids to the roadways when winds are expected to exceed 15 mph and loose snow is present.
5. The application rate used must be determined locally and depends upon terrain, traffic, alignment, pavement temperature, type of storm and surface condition. Refer to the Salt Application Guidelines.
6. Calcium chloride in liquid, flake or pellet form may be added to rock salt or mixture. The application rate is 8 gallons of liquid, 38 pounds of flake or 30 pounds of pellets per ton of rock salt or mixture.
7. Recommended application rate for Liquid Sodium Chloride used for prewetting should be approximately 10-20 gallons per ton.
8. Recommended application rate for Liquid Potassium Acetate used for prewetting should be approximately 20 gallons per ton.
9. Recommended application rates for Liquid Sodium Chloride used for frost treatment on bridge decks should be approximately 40 gallons per lane mile.
10. Recommended application rate for Liquid Sodium Chloride used for anti-icing should be a minimum of 50 gallon per lane mile.
11. The decisions whether or not to treat the pavement, what to use, and the quantities to use rest with the HMS or designee based on his/her experience and the apparent road and weather conditions.
12. The termini for snow and ice removal should be predetermined to fall within cities or at intersections where possible. Each District Maintenance Manager (DMM) should set up a system to provide the necessary coordination between crews.
13. Nothing in this section shall preclude the use of straight winter abrasives at locations such as stop signs, railroad crossings, hills, curves and bridges and at other locations as deemed necessary by the HMS or designee.
14. The application of straight deicing chemicals can be used to reduce the accumulation of abrasives in curbs, storm sewers, etc.
B. Service Level E 1. Deicing chemicals, mixtures and abrasives shall be applied as set out in the Iowa DOT
Standards for Maintenance Activities or as are set out in agreements negotiated with counties.
Winter Maintenance Performance Measurement Using Friction Testing Appendix F
F-44

IM 8.400 Page 3 of 3
Salt Application Guideline*
Salt Application Rate Guidelines Prewetted Salt @12' wide lane (assume 2-hour route)
Roadway Surface Temp- Fahrenheit 32-30
29-27
26-24
23-21
20-18 17-15
Heavy Frost Mist
Light Snow 50 75 95 120 140 170
Drizzle Medium Snow (1/2" per hour)
75 100 120 145 165 200
Light Rain Heavy Snow
Pounds of Salt
(1" per hour) 100 140 182 250 300 350
Prewetted Salt @12' wide lane (assume 3-hour route)
Roadway Surface Temp- Fahrenheit 32-30
29-27
26-24
23-21
20-18 17-15
Heavy Frost Mist
Light Snow 75 115 145 180 210 255
Drizzle Medium Snow (1/2" per hour)
115 150 180 220 250 300
Light Rain Heavy Snow
Pounds of Salt
(1" per hour) 150 210 275 375 450 525
*- The salt application guidelines are adapted from the Guide for Snow and Ice Control developed for American Association of State Highway Officials.
Winter Maintenance Performance Measurement Using Friction Testing Appendix F
F-45

STATE HIGHWAY MAINTENANCE MANUAL Guideline 30.35
Effective: October 1, 2004 30.00 Winter Operations - General 30.35 Passable Roadway - Supersedes: October 1, 2002 During a Winter Storm By: Director, Bureau of Highway Operations Page 1 of 2
A. General
Purpose: To define the level of effort expectations for winter maintenance during a winter storm event. One of the goals of winter maintenance is to maintain “passable roadways” within the limitations imposed by climatological conditions, the availability of resources, and environmental concerns during a winter storm event.
B. Passable Roadway Definition
A “passable roadway” is defined as a roadway surface that is free from drifts, snow ridges, and as much ice and snow pack as is practical and can be traveled safely at reasonable speeds. A passable roadway should not be confused with a "dry pavement" or "bare pavement" which is essentially free of all ice, snow, and any free moisture from shoulder to shoulder. This "dry/bare pavement" condition may not exist until the weather conditions improve to the point where this pavement condition can be provided.
The definition of "reasonable speed" is considered a speed that a vehicle can travel without losing traction. During and immediately after a winter storm event, a reasonable speed will most likely be lower than the posted speed limit. Motorists can expect some inconvenience and will be expected to modify their driving practices to suit road conditions.
C. Effort During the Storm
During the storm counties will plow and salt according to 5 categories of roadways as explained in Guideline 30.36 of the Maintenance Manual. The category that a roadway is in will dictate how much effort will be applied to the roadway. For all categories, plowing is the first priority for snow removal. Only enough de-icing agents should be used to keep the total accumulation workable, thereby minimizing bonding during the winter storm event.
It is acknowledged that using greater salt and deicing agent application rates than those provided for in Guideline 35.30 of the Maintenance Manual has the potential to achieve bare/wet conditions more quickly during and after a storm. However, when balancing concerns for the environment, availability of resources, budgets, and common practices among the snow-belt states, we believe that the current application rates are appropriate and should be adhered to.
D. Exceptions
Exceptions to this guideline will occur when subsequent winter storm events happen at a frequency where it is not possible to maintain roadways according to the passable roadway definition and subsequently bare/wet or bare/dry pavement between the events. The severity of a winter storm event, roadway temperatures, and availability of resources along with other factors will dictate what condition the roadways are in and subsequently when bare/wet or bare/dry pavement can be obtained. Also, it may be deemed appropriate to use extraordinary means when impending weather or an influx of traffic, such as traffic prior to a holiday, is anticipated.
Winter Maintenance Performance Measurement Using Friction Testing Appendix F
F-46
Wisconsin

STATE HIGHWAY MAINTENANCE MANUAL Guideline 30.36 Effective: October 1, 2004 30.00 Winter Operations - General 30.36 Level of Effort by Category of Supersedes: Initial Issue Roadway By: Director, Bureau of Highway Operations Page 1 of 7 A. General
The purpose of this guideline is to outline the level of effort that should be undertaken on the five different categories of roadway during a winter storm event. After the event has ended the effort will switch to cleanup with the intermediate goal of bare/wet pavement and finally the ultimate goal of bare/dry pavement. The time to achieve these goals will depend on the limitations imposed by climatological conditions, the availability of resources, and environmental concerns.
B. Level of Effort by Roadway Category Category 1: Major urban freeways and most highways with six lanes and greater (These highways are considered “high volume” and receive 24-hour coverage, during the winter storm event. See Section 30.20.) Highways in this category often have traffic congestion and snow storage problems, making typical plowing and deicing agent applications very difficult or inappropriate. Therefore, when traffic volumes and snow storage are problems on these highways it may be appropriate to use extraordinary efforts, such as chemical removal, so that snow does not pack on the roadways during the winter storm event. On these highways counties should maintain all lanes and ramps equally, during the winter storm event. Plowing is the first priority for snow removal, however extraordinary efforts (as described above) may be taken so that snow does not pack on the roadways during the winter storm event. The appropriateness of using extraordinary efforts shall be agreed upon with the District maintenance office. When extraordinary efforts are not deemed appropriate, de-icing application rates as described in Guideline 35.30 should be followed. Category 2: High volume four-lane highways (AADT >= 25,000) and some four-lane highways (AADT < 25,000), and some 6-lane highways. (These highways are considered “high volume” and receive 24-hour coverage, during the winter storm event. See Section 30.20) Highways in this category typically do not have the traffic congestion and snow storage problems of those in category 1. However, they still have high traffic volumes that make it necessary to focus on more than just the driving lanes during the winter storm event.
Winter Maintenance Performance Measurement Using Friction Testing Appendix F
F-47

MAINTENANCE MANUAL Guideline 30.36 Page 2 of 7
On these highways counties should maintain the driving lanes, ramps, and passing lanes equally during the winter storm event. Plowing is the first priority for snow removal. De-icing applications should be conducted according to Guideline 35.30 of the Maintenance Manual. The counties should strive to keep the snow from packing on the driving lanes, ramps, and passing lanes (if not needed for snow storage) during the winter storm event. Only enough de-icing agents should be used to keep the total accumulation workable, thereby minimizing bonding during the winter storm event. It is considered inappropriate to attempt to melt the snow as fast as it hits the ground or keep the highway wet so as to eliminate any accumulation or packing. If packing should occur, counties should continue to plow and use sensible salting. When the winter storm event ends and conditions allow, counties will remove any packed snow and continue working towards the goals of bare/wet and ultimately bare/dry pavement. Category 3: All other four-lane highways (AADT < 25,000) (These highways may be considered either “high volume” or “all other” and should receive either 18-hour or 24-hour coverage, during the winter storm event. See Section 30.20.) Highways in this category have lower traffic volumes and do not fit into either category 1 or 2. Also some of the highways in this category do not receive 24-hour coverage. The typical cycle times in this category are long enough that it can sometimes be impractical to keep the snow “workable” in both the driving and passing lanes without excessive de-icing agent usage. On these highways counties should maintain the driving lanes and ramps equally as a first priority during the winter storm event. Plowing is the first priority for snow removal. De-icing applications should be conducted according to Guideline 35.30 of the Maintenance Manual. The counties should strive to keep the snow from packing on the driving lanes and ramps during the winter storm event. However, only enough de-icing agents should be used to keep the total accumulation workable, thereby minimizing bonding during the winter storm event. It is considered inappropriate to attempt to melt the snow as fast as it hits the ground or keep the highway wet so as to eliminate any accumulation or packing. If packing should occur, counties should continue to plow and use sensible salting on the driving lane and ramps only according to the appropriate coverage (either 18 or 24 hours). When the winter storm event ends and conditions allow, counties will remove any packed snow and continue working towards the goals of bare/wet and ultimately bare/dry pavement. Plowing with minimal salting should be conducted on the passing lanes throughout the winter storm event but the majority of effort required to eliminate any packing conditions and eventually obtain bare/wet and ultimately bare/dry pavement conditions on the passing lanes should be done, as soon as practical, after the winter storm event.
Winter Maintenance Performance Measurement Using Friction Testing Appendix F
F-48

MAINTENANCE MANUAL Guideline 30.36 Page 3 of 7
Category 4: Most high volume two-lane highways (AADT >= 5,000) and some 2-lanes (AADT <5000) (These highways may be considered either “high volume” or “all other” and should receive either 18-hour or 24-hour coverage, during the winter storm event. See Section 30.20.) On these highways counties should maintain the driving lanes, during the winter storm event. Plowing is the first priority for snow removal. De-icing applications should be conducted according to Guideline 35.30 of the Maintenance Manual. The counties should strive to keep the snow from packing on the driving lanes during the winter storm event. Only enough de-icing agents should be used to keep the total accumulation workable, thereby minimizing bonding during the winter storm event. It is considered inappropriate to attempt to melt the snow as fast as it hits the ground or keeping the highway wet so as to eliminate any accumulation or packing. If packing should occur, counties should continue to plow and use sensible salting. When the winter storm event ends and conditions allow, counties will remove any packed snow and continue working towards the goals of bare/wet and ultimately bare/dry pavement. Category 5: All other two-lane highways (These highways are considered “all other” and receive 18-hour coverage, during the winter storm event. See Section 30.20) On these highways counties should maintain the driving lanes, during the winter storm event. Plowing is the first priority for snow removal. De-icing applications should be conducted according to Guideline 35.30 of the Maintenance Manual. The counties should strive to keep the snow from packing on the driving lanes during the winter storm event. Only enough de-icing agents should be used to keep the total accumulation workable, thereby minimizing bonding during the winter storm event. It is considered inappropriate to attempt to melt the snow as fast as it hits the ground or keep the highway wet so as to eliminate any accumulation or packing If packing should occur, counties should continue to plow and use sensible salting. When the winter storm event ends and conditions allow, counties will remove any packed snow and continue working towards the goals of bare/wet and ultimately bare/dry pavement, during normal work hours (including Saturdays and Sundays). During the time between the winter storm event ending and achieving the ultimate goal of bare pavement it is acceptable that only clear wheel tracks be provided when conditions warrant.
Winter Maintenance Performance Measurement Using Friction Testing Appendix F
F-49

MAINTENANCE MANUAL Guideline 30.36 Page 4 of 7 C. Exceptions
Exceptions to providing the desired level of effort on the five categories of roadway can occur when the department, because of budget restrictions or unavailability of de-icing chemicals, has requested that counties reduce the level of effort during the winter storm event. In such a case the department, after notifying and in cooperation with the counties, may reduce level of effort expectations on one, several, or all five categories described in item B above.
D. Best Practices for Acceptable Roadway Conditions After the Storm has Ended (While Crews are on Overtime). If the following roadways conditions exist on the five categories of roadways after the storm has ended and while crews are on overtime hours, then it is desirable and acceptable to cease plowing and salting and to wait until the next day (on normal hours) to continue working towards the bare/wet and ultimately bare/dry pavement conditions. The termination of plowing and salting at this time assumes that the weather forecast and other factors will allow this to happen.
Winter Maintenance Performance Measurement Using Friction Testing Appendix F
F-50

MAINTENANCE MANUAL Guideline 30.36 Page 5 of 7
Category 1: Major urban freeways and most highways with six lanes and greater
Category 2: High volume four-lane highways (ADT >= 25,000) and some
four-lane highways (ADT < 25,000), and some 6-lane highways.
Winter Maintenance Performance Measurement Using Friction Testing Appendix F
F-51

MAINTENANCE MANUAL Guideline 30.36 Page 6 of 7
Category 3: All other four-lane highways (ADT < 25,000)
Category 4: Most high volume two-lane highways (ADT >= 5,000) and some 2-lanes (ADT <5000)
Winter Maintenance Performance Measurement Using Friction Testing Appendix F
F-52

MAINTENANCE MANUAL Guideline 30.36 Page 7 of 7
Category 5: All other two-lane highways
Winter Maintenance Performance Measurement Using Friction Testing Appendix F
F-53

22
The extent of road maintenance carried outon the trunk road network is dependent onthe Danish Parliament’s annual grant in theBudget. On the basis of this, the Danish RoadDirectorate strives to ensure an effective run-ning of the trunk road network. A continu-ous prioritisation of road maintenance isundertaken with a view to achieving the bestpossible gain for society from any work ini-tiated, within the budget limits set.
As a part of the Budget agreement in 2000,the Danish parliament (Folketing) decidedto strengthen the efforts on road maintenanceof the trunk road network. This meant thatthe Danish Road Directorate was awardedan extra 175 million crowns annually for therunning and maintaining of the trunk roadnetwork in the period 2000 – 2003. It wasalso agreed that an analysis of the “futurerequirements for and the strategy to be ap-plied to the maintenance of the trunk roadnetwork” should be undertaken.
The increased grant of 175 million crownsfor running and maintenance has been pri-oritised so that it is used primarily on workwhich will increase the trunk road network’scapital value, including surfacing and repair-ing of structures.
4. Road Maintenance
An evaluation was completed in 2000 and inthis the Danish Road Directorate describesthe “normal/standard conditions” which itstrives to uphold in it’s daily work in orderto achieve appropriate road maintenanceconditions for the trunk road network.
The normal/standard conditions are based onthe operational and the socio-economic con-siderations for an appropriate level of roadmaintenance in the long term. The normalconditions cover for example:
• That overall operations are carried outto an extent which ensures the securityof road capital, traffic safety and passa-bility together with aesthetic and serv-ice-minded standards that compare tosimilar roads in neighbouring foreigncountries and to local and regionalroads in Denmark.
• That winter maintenance is provided toan extent which lives up to road userexpectations.
• That surfaces are maintained and arereplaced as advised in road regulations.
• That repair and maintenance of bridgesand other structures is undertaken ingood time
Routine maintenance
Winter maintenance
Surface Dressing
Maintenance of structures
Routine maintenance includes: cleaning, grass mowing, maintenance of watering equipment, repair and replacement of signs and crash barriers, care of plants, road lighting, plus repair and replacement of other equipment.
Winter maintenance includes: prevention of slippery roads and snow clearance
Surface dressing includes: putting down of wearing and bearing course, repair works plus road markings. The road's bearing capacity and the functional state of the road surface is measured as part of this work.
Structures include: maintenance and repair of both small and large bridges and tunnels, noise barriers and signs
.
.
Table 4.1Road maintenanceon the trunk roadnetwork
Winter Maintenance Performance Measurement Using Friction Testing Appendix F
F-54
Denmark

23
These four areas into which the Danish RoadDirectorate divides up its maintenance op-erations on trunk roads are shown in Table4.1. Private entrepreneurs, employed on ten-dered contracts, are used for all these areas.
As a basis for the continuous control andprioritisation of maintenance work on trunkroads, the Danish Road Directorate recordsa number of different conditions relating tothe trunk road network’s condition and du-rability. Subsequently, a few of these ele-ments are described as distinguishing fea-tures of the condition and durability of sur-faces and structures.
4.1 Road surfacingApproximately 101 million crowns was spenton road surfacing works in 2000, which isabout 70% of what is needed to maintainnormal conditions over time. This means thatamongst other things, unevenness and theresulting costs will continue to rise. Like-wise, the capital invested in surfacing willfall in value. Moreover, there is a backlog ofroad surfacing works that should be carriedout. These were calculated to be approx. 270million crowns at the end of 2000.
27 major and minor road surfacing workswere completed in 2000. The most compre-
The durability ofasphalt is measuredby cutting asphaltsections out of theroad and investigat-ing them in the labo-ratory
4.1
Winter Maintenance Performance Measurement Using Friction Testing Appendix F
F-55

24
hensive of these was on the “Vestmotorvej”at Slagelse and on the “Holbækmotorvejen”at Holbæk. Map 4.1 shows the most impor-tant road surfacing works carried out in 2000.
Road surface conditions are assessed eachyear by, for example, measuring the even-ness, friction, rutting and durability of theroad network.
Unevenness, the unevenness of the road hasan effect on vehicle maintenance as well asthe vehicles wearing effect on the road sur-face. Uneven roads also reduce driving com-fort and in special circumstances can influ-ence road safety. Unevenness is measuredby a van which is equipped with a profilo-graph. See map 4.2.
Skid resistance, popularly called road grip,is an expression for the road’s ability to trans-fer breaking power to vehicles, to preventskidding. Friction is, therefore, very impor-tant for traffic safety. A road’s friction abil-ity is measured by a stradograph. As thenumber of trunk road stretches with unsatis-factory friction is minimal, the friction con-dition can be categorised as generally satis-factory.
In 2000 the Danish Road Directorate madeimprovements to a 7 km long road stretchfor traffic going west on the motorway nearSlagelse, on which a speed limit had beenimposed in 1999 because of friction prob-lems.
Rutting is caused by the pressure of heavyvehicles and shows itself as long deep ridg-es in the road. Considerable amounts of wa-ter collects on roads with rutting, which in-crease the risk of vehicles losing road gripand aquaplaning.
Rutting can be measured with a profilograph,which uses lasers to create a picture of theroad surface. These measurements reveal thedegree of rutting on a road.
Measurements taken in 2000 indicate thatthere were rutting problems on 47 km oftrunk roads, 8 km less than in 1999. These
were roads where the rutting was more than10 mm deep. See Map 4.3.
Condition of the wearing course. The wear-ing course is the very top layer of a road.Breakdown of this layer affects evenness andincreases the risk of water seeping down andruining the base course of the road. The re-maining economic life of the wearing courseis assessed by annual inspections.
When the wearing course has broken downto such an extent that it is necessary to re-surface, its remaining life is defined as lessthan half a year. If a wearing course with aremaining life of half a year is not replaced,it does not mean that one year later the wear-ing course will have totally broken down. Thewearing course will still be able to functionas a road surface, but it will be necessary tocalculate with rapid cost increases for re-placement at a later stage and for repair orrestoration of the underlying base course.
A total of 322 km of Danish trunk roads hada wearing course with a remaining lifetimeof less than six months, at the end of 2000.
The condition of the wearing course can al-so be described by a degree of wearing down,expressed as a percentage. A new wearingcourse is set at 100%, whilst one which hasbroken down to exactly the point where itcan still function as an underlay for a newroad surface, is set at 0%. A balanced roadnetwork will be 50% and if it is lower, thenetwork will have a road maintenance back-log. The Danish trunk road network has 42%,which means that a backlog has accrued.
4.2 Structures192 million crowns were used on mainte-nance and repair work on structures in 2000.This is approximately 80% of the amountwhich the Danish Road Directorate assessednecessary to achieve the normal conditionover time. The backlog of repairs on struc-tures has not risen further during 2000 com-pared to 1999; this is calculated to be 500million crowns.4.3
4.2
Winter Maintenance Performance Measurement Using Friction Testing Appendix F
F-56

25
The Danish Road Directorate has carried out10 repairs on major bridges and tunnels dur-ing 2000 including completion of work onthe new Little Belt Bridge, work on the Vej-lefjord Bridge and the Frederiksundsvej Tun-nel. See Map 4.1. In addition, repairs havebeen made to 14 standard bridges with edgegirder problems.
All bridges with edge girder problems arescheduled to be repaired before 2004. Thebridges concerned are indicated on Map 4.4.
Standard bridges can be attributed a numberof standard parameters, each of which areawarded an annual inspection grade in a scaleof 0-5, where 0 is perfect and 5 is worthless.
If a parameter is awarded a grade 2-5, it is inneed of repair. In 2000 a total of 1830 pa-rameters were assessed to be in a conditionrequiring repair, which is an increase of 4%in comparison to 1999.
Map 4.5 shows the major bridges and con-structions that are in need of urgent repair.
Distribution of bridges by age. The repairand maintenance requirement of bridges andstructures increases markedly after about 25years. Figure 3.2 shows the total number ofbridges on trunk roads by construction year.About 58% of the total area of bridges wereolder than 25 years in 2000.
4.3 Crash barriersIn 1995 the Danish Road Directorate beganto change out 425 km of cable crash barrierswith crash barriers of sheet metal. 87% ofthese were replaced at the end of 2000 and itis anticipated that the remaining 56 km willbe replaced by the end of 2002.
The roughness of theroad surface ismeasured with spe-cial lasers, which inturn will indicate theroad stretches whereroughness is too low.
4.6
4.4
4.5
Winter Maintenance Performance Measurement Using Friction Testing Appendix F
F-57

26
Fiskebæk bridge1)
Frederikssound road tunnel
Kollekollevej West
Karlstrup Marshpile bridge
Jyllingevej
Storstrøms bridge
Kværndrup
Siø
Jyderup
Guden River bridge1)
Limfjord bridge
New Little belt Bridge
Old Little belt Bridge
Vejlefjord bridge
Christiansfeld
Vilsund bridge
Holstebro
Ringkøbing
Maribo
Holbæk
Slagelse
Århus
Skanderborg
HelsingørHelsingborg
Frederikssund
Hillerød
RødbyRønne
Vordingborg
Kalundborg
Odense
Svendborg
Spodsbjerg
Tårs
Frederikshavn
Silkeborg
Sjællands Odde
Hobro
Randers
Hjørring
Aalborg
Hirtshals
Vejle
Horsens
Kolding
Herning
Viborg
Skive
Frøslev
Thisted
Hanstholm
Esbjerg
Skagen
Map 4.1
Major asphalt worksand bridge repairsundertaken in 2000
Bridge repairs
Asphalt works undertaken i 20001)Work finishes in 2001
27
Køge
København
Malmö
HelsingørHelsingborg
Frederikssund
Hillerød
Roskilde
Rødby
Maribo
Rønne
Vordingborg
Holbæk
Slagelse
Kalundborg
Odense
Svendborg
Spodsbjerg
Tårs
Frederikshavn
ÅrhusSilkeborg
Sjællands OddeSkanderborg
Hobro
Randers
Hjørring
Aalborg
Hirtshals
Vejle
Horsens
Kolding
Herning
Viborg
Skive
Frøslev
Thisted
Holstebro
Hanstholm
Ringkøbing
Esbjerg
Map 4.2
Unevenness ontrunk roads in 2000
Unevenness
Over 2.5
1.5 - 2.5
under 1.5
Information unavailable
Winter Maintenance Performance Measurement Using Friction Testing Appendix F
F-58

28
Køge
København
Malmö
HelsingørHelsingborg
Frederikssund
Hillerød
Roskilde
Rødby
Maribo
Rønne
Vordingborg
Holbæk
Slagelse
Kalundborg
Odense
Svendborg
Spodsbjerg
Tårs
Frederikshavn
ÅrhusSilkeborg
Sjællands OddeSkanderborg
Hobro
Randers
Hjørring
Aalborg
Hirtshals
Vejle
Horsens
Kolding
Herning
Viborg
Skive
Frøslev
Thisted
Holstebro
Hanstholm
Ringkøbing
Esbjerg
Map 4.3
Rutting on trunkroads in 2000
Rutting
over 10 mm
5 - 10 mm
under 5 mm
Information unavailable
On stretches where the road lanesare physically separated by a cen-tral reservation and/or a crashbarrier, it is the deepest ruttingwhich is shown on the map.
29
Køge
København
Malmö
HelsingørHelsingborg
Frederikssund
Hillerød
Roskilde
Rødby
Maribo
Rønne
Vordingborg
Holbæk
Slagelse
Kalundborg
Odense
Svendborg
Spodsbjerg
Tårs
Frederikshavn
ÅrhusSilkeborg
Sjællands OddeSkanderborg
Hobro
Randers
Hjørring
Aalborg
Hirtshals
Vejle
Horsens
Kolding
Herning
Viborg
Skive
Frøslev
Thisted
Holstebro
Hanstholm
Ringkøbing
Esbjerg
Map 4.4
Repair of bridgeedge girders
Completed before 2000
Completed in 2000
Future completion date
Winter Maintenance Performance Measurement Using Friction Testing Appendix F
F-59

30
Frederiksundsvej road tunnel
Bridge over Karlstrup MarshOld Little Belt Bridge
Vejlefjord bridge
New Little Belt Bridge
Storstrøms Bridge
Spodsbjerg Ferry Harbour
Siøsound Bridge
Map 4.5
Major bridges andconstructions need-ing urgent repairs
Figure 4.1
Distribution ofbridges by age
50
100
150
200
250
300
350
400
450
500
Before 1900
1901- 1910- 1920- 1930- 1940- 1950- 1960- 1970- 1980- 1990- 2000-1909 1919 1929 1939 1949 1959 1969 1979 1989 1999
Construction periods
Nos of bridge
s
31
Køge
København
Malmö
HelsingørHelsingborg
Frederikssund
Hillerød
Roskilde
Rødby
Maribo
Rønne
Vordingborg
Holbæk
Slagelse
Kalundborg
Odense
Svendborg
Spodsbjerg
Tårs
Frederikshavn
ÅrhusSilkeborg
Sjællands OddeSkanderborg
Hobro
Randers
Hjørring
Aalborg
Hirtshals
Vejle
Horsens
Kolding
Herning
Viborg
Skive
Frøslev
Thisted
Holstebro
Hanstholm
Ringkøbing
Esbjerg
Map 4.6
Centre strips onmotorwaysSafety precautionsin 2000
Cable crash barriers
Sheet metal crash barriers
Wide centre strip without crash barriers (10 m or over)
Other safety precaution
Not motorway
• Next document >
Winter Maintenance Performance Measurement Using Friction Testing Appendix F
F-60

Road DirectorateMinistry of Transport - Denmark
The Danish Winter Maintenance Management System
Road DirectorateMinistry of Transport - Denmark
Road DirectorateMinistry of Transport - Denmark
IS
FO
N
S
FIN
RUSEST
LV
LT
BY
PL
GB
IRL
DK
PE
F
ANDI
CHA
L
B
NLD
CZ
SK
H
SLO
HR BiH
AL
YU
UA
RO
MD
BG
MKTR
GR
Denmark inEurope
Tivoli Garden, CopenhagenTivoli Garden, Copenhagen
MermaidMermaid, Copenhagen, Copenhagen
The Great Belt BridgeThe Great Belt Bridge
Winter Maintenance Performance Measurement Using Friction Testing Appendix F
F-61

Road DirectorateMinistry of Transport - DenmarkThe Sky MountainThe Sky Mountain
Highest point in Denmark: Highest point in Denmark: 173 meter173 meter above sea levelabove sea level
Road DirectorateMinistry of Transport - Denmark
Road authorities in DenmarkRoad authorities in Denmark
• Road Directorate: 1,600 km.
• 13 Counties: 10,000 km.
• 271 Municipalities: 60,000 km.
The Danish Road Network
20062006
20072007
• Road Directorate: 3,800 km.
• 98 Municipalities: 68,000 km.
National Roads
Municipality Roads
100 Km
20072007
Winter Maintenance Performance Measurement Using Friction Testing Appendix F
F-62

Road DirectorateMinistry of Transport - Denmark
Winter in Denmark…
• Approx. 5-10 days with snowfall, 30-50 cm a year
• Main problems: Hoar frost and wet freezing roads
Winter in Denmark…
Road DirectorateMinistry of Transport - DenmarkWe do also have snow…
February 2007
Winter Maintenance Performance Measurement Using Friction Testing Appendix F
F-63

Road DirectorateMinistry of Transport - DenmarkSalt Consumption on
Main Roads ~ 12.000 km
Actions per year:Actions per year: Approx. 100
Dosage:osage: Hoar frost 5-10 g/m2 (20-40 kg/lane-km)
Snow 15-20 g/m2 (60-80 kg/lane-km)
Consumption:Consumption: 150,000 tons annually
1.25 kg/m2 (5.0 tons/lane-km)
All roads:All roads: 300,000 tons annually
200 kg/vehicle
Road DirectorateMinistry of Transport - DenmarkGuidelines - Organisation
The service objective is always to have black road surface
Decision is taken by 6 winter centrals
Private contractors carry out salting and snow ploughing
Dosage is based on a guideline
Situation Pre-wetted salt "Combi" spreader (1)(2)
Salt Brine (1)
Roads
Programmed
[g/m2]
brine + dry salt
[ml/m2 + g/m
2]
Total
salt
dosage
[g/m2]
Programmed
brine + dry salt
[ml/m2+ g/m
2]
Total
salt
dosage
[g/m2]
Pro-
grammed
[ml/m2]
Total
salt
dosage
[g/m2]
Remarks
Preventive salting against expected
rime ice on a DRY/MOISTY road:
Expected road temperature ca. 0oC
Expected road temperature over –3oC
Expected road temperature under -3oC
6 = 1,8 + 4,2
8 = 2,4 + 5,6
12 = 3,6 + 8,4
4,7
6,2
9,3
10 + 0
20 + 0
20 + 4
2,6
5,2
9,2
10
20
30
2,6
5,2
7,7
Preventive salting against expected
ice on a wet road (freezing wet
roads):
Expected road temperature over -3oC
Expected road temperature under -3oC
12 = 3,6 + 8,4
18 = 5,4 + 12,6
9,3
14,0
20 + 4
20 + 8
9,2
13,2
30
40
7,7
10,3
In case of very wet roads the
dosage should be increased.
Preventive salting against expected
snowfall:
Under 3 cm of snow
More than 3 cm of snow
15 = 4,5 + 10,5
20 = 6,0 + 14,0
11,7
15,5
20 + 6
20 + 10
11,2
15,2
40
60
10,3
15,5
When salting against snowfall,
dry salt can be used.
Preventive salting against expected
freezing rain (super cooled rain): 20 = 6,0 + 14,0 15,5
20 + 10 15,2
60 15,5
Other types of salting when a slip-
pery road accident already has oc-
curred:
15 = 4,5 + 10,5 11,7
20 + 6 11,2
40 10,3
Dosage varies in relation to the
road temperature and the ice
layer thickness.
The brine solution contains 22% of salt (by weight).
Slippery roads without snow:
Rime frost 2 hours
Ice 2 hours
After snowfall:
Slush 4 hours
Light snow 4 hours
Compacted snow 2 hours
After blown snow:
Driven snow 4 hours
Blocked 0 hours
Should be passable without
major inconveniences 24 hrs. a
day
Desired road conditions:
Dry
Wet
Other regional roadsOther county
roads
Slippery roads without snow:
Rime frost 0 hours
Ice 0 hours
After snowfall:
Slush 2 hours
Light snow 2 hours
Compacted snow 0 hours
After blown snow:
Driven snow 2 hours
Blocked 0 hours
Should be passable without
major inconveniences 24 hrs. a
day
Desired road conditions:
Dry
Wet
Freeways
Regional Roads
European Freeways
Other priority roads
State roads
Priority county
roads
Desired duration of Road Conditions below the Desired duration of Road Conditions below the
Service ObjectivesService Objectives
Service objectivesService objectivesType of roadType of roadClassClass
RoadsRoads
Slippery roads without snow:
Rime frost 2 hours
Ice 2 hours
After snowfall:
Slush 4 hours
Light snow 4 hours
Compacted snow 2 hours
After blown snow:
Driven snow 4 hours
Blocked 0 hours
Should be passable without
major inconveniences 24 hrs. a
day
Desired road conditions:
Dry
Wet
Other regional roadsOther county
roads
Slippery roads without snow:
Rime frost 0 hours
Ice 0 hours
After snowfall:
Slush 2 hours
Light snow 2 hours
Compacted snow 0 hours
After blown snow:
Driven snow 2 hours
Blocked 0 hours
Should be passable without
major inconveniences 24 hrs. a
day
Desired road conditions:
Dry
Wet
Freeways
Regional Roads
European Freeways
Other priority roads
State roads
Priority county
roads
Desired duration of Road Conditions below the Desired duration of Road Conditions below the
Service ObjectivesService Objectives
Service objectivesService objectivesType of roadType of roadClassClass
RoadsRoads
Winter Maintenance Performance Measurement Using Friction Testing Appendix F
F-64

Road DirectorateMinistry of Transport - DenmarkTasks and ToolsTasks and Tools
VINTERMANRWIS
Control and
Monitoring
Road Users
Weather & forecasts Call-out
Information
Winter Central
Road DirectorateMinistry of Transport - DenmarkThe Winter Central in Ribe
Other tasks
RWIS - VejVejr
Winterman
Winter Maintenance Performance Measurement Using Friction Testing Appendix F
F-65

Road DirectorateMinistry of Transport - Denmark
VINTERMANRWIS
Winter Central
Meteorological
Institute
Measurements
every 5. minutesPrognoses for each station
Regional 5 hour prognoses
Radar images
Satellite images
~325 Stations
RWIS StructureRWIS Structure
Road DirectorateMinistry of Transport - Denmark
A View of VejVejr.dk
Winter Maintenance Performance Measurement Using Friction Testing Appendix F
F-66

Road DirectorateMinistry of Transport - DenmarkThe Winter Central
VINTERMANRWIS
Control and
Monitoring
Road Users
Weather & forecasts Call-out
Information
Winter Central
Road DirectorateMinistry of Transport - DenmarkWinterman Tasks
• Organizing administrative information
• Assistance during call-outs
• Handling road condition reporting
• Documentation of all tasks
• Follow up on consumption and winter index
Winter Maintenance Performance Measurement Using Friction Testing Appendix F
F-67

Road DirectorateMinistry of Transport - DenmarkStarting a New Turnout
Road DirectorateMinistry of Transport - DenmarkActivity List: Calling Out
Winter Maintenance Performance Measurement Using Friction Testing Appendix F
F-68

Road DirectorateMinistry of Transport - DenmarkActivity List: Calling Out
Road DirectorateMinistry of Transport - DenmarkActivity List: Get Information
Winter Maintenance Performance Measurement Using Friction Testing Appendix F
F-69

Road DirectorateMinistry of Transport - DenmarkActivity List: It’s All Over
Road DirectorateMinistry of Transport - DenmarkAuditing: a Control Function
Winter Maintenance Performance Measurement Using Friction Testing Appendix F
F-70

Road DirectorateMinistry of Transport - DenmarkInvoicing Basis
Road DirectorateMinistry of Transport - Denmark
StatisticsMonthly Salt Consumption
Winter Maintenance Performance Measurement Using Friction Testing Appendix F
F-71

Road DirectorateMinistry of Transport - Denmark
StatisticsActivity Starting Hour
Road DirectorateMinistry of Transport - Denmark
• All telephone calls and attempts
• State changes for all activities
• Temporary telephone numbers and duty roaster changes
• Regularly reminders
• System login and logouts
• SMS and E-mails from Winterman
• Manually registrations
Struktured Logbook
Winter Maintenance Performance Measurement Using Friction Testing Appendix F
F-72

Road DirectorateMinistry of Transport - Denmark
• Call-out registration
• Salt registration
• Invoicing basis
• Statistic examples
Winter Central in South Denmark, Middelfart
You Have Seen…
Road DirectorateMinistry of Transport - Denmark
Winter Central in the municipality of Gentofte
You don’t Need All These PC’sto Run a Winter Central
Winter Maintenance Performance Measurement Using Friction Testing Appendix F
F-73

Road DirectorateMinistry of Transport - DenmarkCall-out Options
• Type the number manually on the phone
• Let Winterman type the number
• Use of the call-out robot & SMS
Road DirectorateMinistry of Transport - DenmarkOptions during the Action
• Call-in and press “Next state”
• Use a PDA, smartphone or web-browserto press “Next state”
• Send a SMS to Winterman
• Detect automatically from on-line data collection
Winter Maintenance Performance Measurement Using Friction Testing Appendix F
F-74

Road DirectorateMinistry of Transport - DenmarkMaps & Online Data Collection
Road DirectorateMinistry of Transport - Denmark
Winterman
Equipment:* Epoke* Falköping* Nido* Küpper Weisser* …?
GSM
DAU-files as InterfaceGPS
GPS
Online Data Collection
Winter Maintenance Performance Measurement Using Friction Testing Appendix F
F-75

Road DirectorateMinistry of Transport - DenmarkMaps: City of Aalborg
Road DirectorateMinistry of Transport - DenmarkDetailed Data Presentation
Winter Maintenance Performance Measurement Using Friction Testing Appendix F
F-76

Road DirectorateMinistry of Transport - DenmarkDetailed Data Presentation
Road DirectorateMinistry of Transport - DenmarkDetailed Data Presentation
Winter Maintenance Performance Measurement Using Friction Testing Appendix F
F-77

Road DirectorateMinistry of Transport - Denmark
•• Handling spreading width is a problem from time to time.
•• Spreading symmetry should be used morefrequently by drivers
•• Change in dosage due to e.g. sections withopen asphalt is very rarely used
•• This takes place even though the drivers have joined a comprehensive training programme
Identified Quality Problems
6 m
1554 kg 42 km/t 23:35
15 gm²
Road DirectorateMinistry of Transport - Denmark
The spreader shall be able to act adequately by itself while the driver just follows the route
Dosage settings, spreading width, spreading symmetry and beacon light must be handled automatically
The driver must always be able to override the automatic system
OFF ON – 10g/m²6 m width
ON - 20 g/m²9 m width
GPS Controlled Spreading
Winter Maintenance Performance Measurement Using Friction Testing Appendix F
F-78

Road DirectorateMinistry of Transport - Denmark
W: 4 m.S: Neutral
W: 4 m.S: Neutral
W: 7 m.S: <<
W: 7 m.S: >>
Driving time < 7 sec.
Adjustments:2 Width (W)3 Symmetry (S)
A typical 2 hour salting route has 200-700 adjustments
Road DirectorateMinistry of Transport - DenmarkThermal Mapping
Winter Maintenance Performance Measurement Using Friction Testing Appendix F
F-79

Road DirectorateMinistry of Transport - Denmark
-4
-3
-2
-1
0
1
2
30 3 6 9
12
15
18
21
24
27
30
33
36
39
42
45
48
51
54
57
60
63
66
69
72
75
ON – 5 g/m² ON – 10 g/m²OFF OFF OFFOFF
Future: Spreading Basedon Section Prognoses
Road DirectorateMinistry of Transport - DenmarkRoad Condition Reports
Winter Maintenance Performance Measurement Using Friction Testing Appendix F
F-80

Road DirectorateMinistry of Transport - Denmark
Telefonrobot
Road Condition Reportsby E-mail and SMS
Road DirectorateMinistry of Transport - Denmarkvintertrafik.dk
Sorry: Only available in Danish
Winter Maintenance Performance Measurement Using Friction Testing Appendix F
F-81

Road DirectorateMinistry of Transport - Denmarkvintertrafik.dk: Statistics
Sorry: Only available in Danish
Road DirectorateMinistry of Transport - DenmarkWinterman: 3 Versions
WintermanWinterman
Light
WintermanReport
Winter Maintenance Performance Measurement Using Friction Testing Appendix F
F-82

Road DirectorateMinistry of Transport - Denmark
Winterman:
26 Municipalities
Winterman Light:
15 Municipalities
Winterman Report:
? Municipalities
Road DirectorateMinistry of Transport - Denmark
Winterman Light:Available in 9 languages
Winter Maintenance Performance Measurement Using Friction Testing Appendix F
F-83

Road DirectorateMinistry of Transport - Denmark
Winterman & Winterman Light
Germany
Norway
Netherland
Austria
Poland
England
Iceland
Switzerland
Belgium
ChinaCanada/USA
Spain
Hungaria
Road DirectorateMinistry of Transport - DenmarkThank you for your attention
Bo Sommer – [email protected]
Winter Maintenance Performance Measurement Using Friction Testing Appendix F
F-84

���������� �� ��� ��� ������ � ���������� �� ������� ����������� ��
������ ������ ���!"�!#�!$$#�� %�����&�����'��( �����
�������������� �� ���������
�� ��� ��� ���( �����
�������� ����
���� ������������� ������������
) &�� �'������������������ �������������( �����
• ��������������� &�� �
• �����!�$*$$$�+���������� �� ����� !"###$����� ����
%�� ���� �������������� ������
!&"#'"!##(�������� ���� ����) "!
• %�� ���� �������������� ������*+&##�������,� ���
• -����������������� ������������� #####�������,� ���
• .�������� ���������� �������!+ �����������$����� ��/��!##'0
Winter Maintenance Performance Measurement Using Friction Testing Appendix F
F-85

�������������,� ������& ������� �-��+�
• !*1'- �2 �� � ����/���������������������0
• �,, �3������ ##�����2 ������ ������������������
!&"#'"!##(�������� ���� ����) "4
�� ��������������������� ���������� �����5���
• 4&�����2 ,� ��� �� ����������� ������������
T. Bandt
�������( ������.� �� ����� ������� �������/
!&"#'"!##(�������� ���� ����) "*
Winter Maintenance Performance Measurement Using Friction Testing Appendix F
F-86

0 ����,��������-�� ��� ��� �
• 6��7�� �����8������ 9���� �� �����:�� ��������� ������������� �-����� ��� . ���,� �1����������; ���%���� �1�����,� ���������������� �������
���� �% �� �������%�������� ���������������� �
!&"#'"!##(�������� ���� ����) "'
• ���� �% �� �������%�������� ���������������� ��������������
• <���<���/��������������� �� �����0
• ����� �� ����� ���������/� ��������0�����������,������
0 � ���� � 1�� � ��� ��� -�� ��� ��� �
�������� � �������������
=� ��� �� � ������������
9����� � ��� ���������
���-����'�� �����'�&��������
2 ������������� ���-����� � � ������'���������& �'��� 3�� ���
���� ����� ������� ����������� ������ ����������1����� ������������ ���� ������� ��������� $ ���� ������������ � ����� ��������
!*��� � /����0
� ����������� ���� ��������1���� �������1 ��,� ��5�������� ������� �������>,�����������,� $��� ���������1������ �
� ����������� ������������� �������,� �� ��������� �����1��� ���� ��,� ���� ��,� ��5�������� ������� ������� �� ���������� ���� �� �� ����� ���1�� �7�� ����������������>��������� ��,� $���� ��� ������� �� ���� �������� ��� ���� ��� ������"
!&"#'"!##(�������� ���� ����) "&
�� ��� ���� ��� ������"
� ����������� ������ �� ������� ��� ��������,� ���� � � ����1
���� ���� �� ��� ������ � �����1 ���� ���� ,����� ���,� �
� �� #&"##�"�"�� #"##,"�"/����0
� �����������
� �����������1�� �7�� �� �������� ������>����������������� �� ��������� �������,� �� ��������� �����1�� �7�� ����������<�����
�� ��� � � �����,, �, ���� �� ���� ����� �������
� ������������ �����������1�� �7�� �� �������� ������
������$�1������ ����1����,� ,��� ���
�,, �, ���� �� ���� ����� �������
� �����������1�������� �� ,����� ����
� ����������� ������ �� ������� ��� ������
,� $��� ��������� ������������ ���� ��,� ������� ���� ���� / ��!��� 40
�,, �, ���� �� ���� ����� �������
,��������� ,��������� ��������������� ��� ������
Winter Maintenance Performance Measurement Using Friction Testing Appendix F
F-87

� �&������ �������������-�� ��� ���
• ?���������� ��������� �� �����/-� $������ ���9���� ������0
?��� ������ � �7�� �������� �7��,����1�������
!&"#'"!##(�������� ���� ����) "+
• ?��� ������ � �7�� �������� �7��,����1������������������������/.���������8���� �����������0
• @� �,��������� ���� �7��,����/<@).<44+0
�� ��� ��� ��� -��+������ ��
!&"#'"!##(�������� ���� ����) "(
���� ����A.;B� � ���1��@
Winter Maintenance Performance Measurement Using Friction Testing Appendix F
F-88

���� �����
4��� ��������������
�,������ ����������'�
����������� ������� ����
5���������� ���������'�
����������� ������� ����
���� �� ��$ ����
/���� ���� �����������0
���� ����� ��������� � ������ ��
������� ��� ���� ����� �����
!&"#'"!##(�������� ���� ����) "C
��������0���� �����
����� �������� ���� ������� ���� �������
<����� ���� <�������<������� ,� �������� � ������ ��������� ��������
<��������D� ��� ����
<����������D<����� <����������D<�����
• &!���� ����������������,����� ������������������,, �3"&'$�
• '(* ����������������,�������� $������������������������4##$�
�����������6 ���� ���� �� ����
���� ����A%--�����
!&"#'"!##(�������� ���� ����) " #
Winter Maintenance Performance Measurement Using Friction Testing Appendix F
F-89

����
����
����
����
����
�������������
��� ������������������������������������������� �����������
��� ��
����� ������� ��
!&"#'"!##(�������� ���� ����) "
���� ��EA?� ���-����� ���. ���,� �1�����������������
�
����
����
����
����
����
������� ������� ������� ������� ������� ������� ������� ������� ��� ��
��������
�������������
��
��
��
��
�����
��� ������ ������ ���������������������� ��������
��� ��
����� ������� ��
!&"#'"!##(�������� ���� ����) " !
�
��
��
������� ������� ������� ������� ������� ������� ������� ������� ��� ��
�����
�������������
���� ��EA?� ���-����� ���. ���,� �1�����������������
Winter Maintenance Performance Measurement Using Friction Testing Appendix F
F-90

�� �-���������� ��� 7� ��
�� �-������
���� ��
���� ����A
�� ���� ���������� ���� ���� ���� ���� � ��� � ���
�������������������� ����������������
!&"#'"!##(�������� ���� ����) " 4
� ������ 4���
�� ������� ���
���� ����A
� � ���&������
;���������,� �� ����������������� ������D�������������
��� ������������� �� ����������� ����� �� ����������������� ����A.;B� � ���1��@
!&"#'"!##(�������� ���� ����) " *
��� ����������������������
���� ����A.;B� � ���1��@
Winter Maintenance Performance Measurement Using Friction Testing Appendix F
F-91

� � ���&������
<���$������������������������������������������������, ������������
!&"#'"!##(�������� ���� ����) " '
F��������������, �������������� ����� $
���� ����A.;B� � ���1��@
� � ���&������
F����,����������� ��������������������� ��� ����,������� ������������������
!&"#'"!##(�������� ���� ����) " &
)���������� ��������������� $
F��,���������������� ���� �������,���
Winter Maintenance Performance Measurement Using Friction Testing Appendix F
F-92

� � ���&�������
��, ������������� ������� ���������� ��� ��,,� ���� �,� �������������������� �� �����
���������� ������ ��� ������������������ ���� -�����
!&"#'"!##(�������� ���� ����) " +
%,,������������������������������������ ��E���,����
F�������� �,,����������������� ����������� �
���� ����A.;-������
� � ���&������
���������������� �������������� �7��,,�������� �� ������������������������������������� ������� ����� �,������������ ��,�����
!&"#'"!##(�������� ���� ����) " (
���� ����A.;B� � ���1��@
Winter Maintenance Performance Measurement Using Friction Testing Appendix F
F-93

GERMANY CEN TC 337 - Road condition and weather information system - RWIS
Page 1 of 10
Document in progress : Testing / verification of performance The sensor test procedures described further below are distinguishable partly in terms of performance and acceptance tests. Performance tests are intended to examine the basic suitability of a sensor - including the related evaluation electronics - for registering a particular variable. Such tests should be conducted on sensors which are already installed on pavement and which cannot be tested comprehensively due to technical or organizational reasons (closure to traffic). Acceptance tests are intended to verify compliance with requirements following installation of ice warning systems, in accordance with the available technical and organizational means. For the purpose of testing, the manufacturer must submit clear descriptions of the operation of the sensors and their evaluation electronics. Combinations between measurement variables intended to determine parameters must be disclosed. Sensors for different parameters which have been grouped into a single module must collectively pass operational tests. Test described below without evaluation of results must comprise at least 5 reference measurements or 15 observations under various conditions within the applicable measuring range. If a reference measurement yields a high difference between the measured values, at least 2 additional measurements must be conducted. If a reference measurement series yields less than 15% of measurement values exhibiting impermissibly high differences, these can be neglected as outliers. Deviations indicated by measured values and observations under similar conditions entail additional observations. If more than 15% of the results from a measurement series transgress the stipulated accuracies, the sensors should be re-calibrated, re-adjusted, or replaced.
a) Performance tests of sensors for registering pavement surface temperature Performance tests involve comparisons between values measured by the test sensor and reference sensors.
Equipment, sensors and aids: Horizontal area at least 3x3 m in size, with a pavement designed according to RStO 86/89: construction class SV; thickness of the frost-proof superstructure: 80 cm; no traffic, constant shade conditions except during sunrise and sunset; gradient of 2%. 3 thermocouples, accuracy class 1, type K (NiCr-Ni) according to IEC 584-2; with a 50-mm long, steel probe tip 0.5 mm in diameter; connection sleeve 30-mm long, approximately 5 mm in diameter; serving as reference sensors with a data acquisition system Radiation balance sensor with a data acquisition system Video camera with a recording mechanism
Winter Maintenance Performance Measurement Using Friction Testing Appendix F
F-94

GERMANY CEN TC 337 - Road condition and weather information system - RWIS
Page 2 of 10
Preparations for measurement: The sensor to be tested should be installed at the centre of the stipulated surface. If the sensor forms part of a module, the latter needs to be installed. Additionally required sensors should be connected, and remain fully operational during the test. At a distance of 50 cm to the test sensor, three temperature sensors should be installed on the surface using a drill core as a basis (see the illustration). These sensors must not recede more than 1 millimetre below the pavement surface (roughness peaks). A mixture of bitumen and fine chippings should be used for installation. Illustration: Installation position of the reference sensors The video camera and data recording system should be configured for measurement
field observation over the entire measurement period.
Number of measurements and result evaluations Over a period of 120 days (between the months of November and March), measurement data should be recorded at 1-minute intervals by the three reference sensors and the test sensor. The test sensor is evaluated on the basis of the measurement value from each of the reference sensors exhibiting the smallest deviation from the corresponding value yielded by the test sensor. The calculated deviations must not exceed the limits stipulated in Section 3.1.1.1. If they do, the video recordings should be used to exclude impermissible external influences. 0.5% of measured values exhibiting impermissibly high deviations under constant conditions can be considered outliers. A larger percentage indicates that the sensor does not comply with requirements.
Winter Maintenance Performance Measurement Using Friction Testing Appendix F
F-95

GERMANY CEN TC 337 - Road condition and weather information system - RWIS
Page 3 of 10
b) Acceptance tests of sensors for registering pavement surface temperature Acceptance tests involve comparisons between values measured by the test sensor and installed reference sensors.
Sensors and aids: Contact thermometer (Pt-100 with a contact area < 2 x 2 mm; the sensor must permit firm contact with the pavement surface without any significant distortions by heat flows, see the illustration) with a measurement accuracy of +/-0 Kelvin in ice water.
Federwegca. 5mm
Trägerplättchen mit Pt-100ca. 2x2 mm
Wärmeleitpaste
Carrier plate with Pt-100, approximately 2 x 2 mm Spring travel of approximately 5 mm Heat conducting paste Illustration: Sensor for measuring pavement surface temperature
Measurement procedure: Measurements are to be conducted at night or at dawn under a cloud cover of 8/8 and wind speed < 0.3 m/s. On commencement of measurement, the extent of the cloud cover needs to have prevailed for at least 3 hours. The temperature must lie between -5°C and +5°C. The temperatures of the reference sensor and heat conducting paste must agree with the temperature prevailing at the measuring point. A small quantity of heat conducting paste permitting contact between the pavement and sensor surfaces should be applied at 3 points on the pavement in the vicinity of the test sensor (at distances of less than 10 mm). 10 minutes after application of the heat conducting paste, 3 temperature measurements each are to be conducted at the marked points.
Winter Maintenance Performance Measurement Using Friction Testing Appendix F
F-96

GERMANY CEN TC 337 - Road condition and weather information system - RWIS
Page 4 of 10
Evaluation of results: The values measured by the test and reference sensors must not diverge by more than +/-1 Kelvin. If one or more values exceed these tolerance limits, additional measurements must be conducted. If less than 15% of a series of measured values exhibit transgressions, they can be neglected as outliers. If more than 15% of a series of measured values transgress the specified tolerance limits, the sensor must be re-calibrated or replaced.
c) Tests of sensors for registering pavement condition Measuring accuracy is checked through observations at the measuring point under various pavement conditions.
d) Performance tests of sensors for registering water film thickness Sensor accuracy and operation are to be examined here over several measuring cycles. These performance tests involve applications of defined, uniform water films on the sensor under investigation.
Equipment and aids: Air-conditioned room with adjustable air temperature and relative humidity Mechanically guided device (spray gun, spray valve etc.) for applying a uniform, defined water film Spirit level Stopwatch Beaker Paper tissues Fan heater
Calibration accessories: Scale with a resolution of 0.001 g and measuring accuracy of +/-0.003 g. Plastic bars with a cross-section of 10 x 10 mm and a rough surface, their number and length (at least 300 mm) depending on the test sensor's size.
Verification of defined, uniform water film thickness: The thickness and uniformity of the resulting water film are to be measured on plastic test bars by weighing the bars before and after application of the film. The difference in weight measured in each case serves as a basis for calculating the water film thickness on the bar. The plastic bars should be placed next to each other. The surface of each bar must lie in the same plane as that of the test sensor. A further bar should be placed along each longitudinal side to prevent lateral spraying of the test strips. The water film should be applied in the defined thickness to each bar within a period of 30 seconds. The water film thickness measured on each bar and the average of all individual values should not deviate by more than +/-10% from the desired value. The uniformity of the water film applied to each bar should be evaluated visually.
Winter Maintenance Performance Measurement Using Friction Testing Appendix F
F-97

GERMANY CEN TC 337 - Road condition and weather information system - RWIS
Page 5 of 10
Application of water films on the sensor: To verify the uniformity of the defined water film thickness, the sensor is placed horizontally beneath the spraying device in the same plane as the plastic bars. To prevent water films at higher levels from flowing off, the sensor should be demarcated appropriately. If these demarcations influence the measurements, the sensor should be installed in a road-like plane. The edges of this plane should then be demarcated appropriately. The ambient conditions must limit the proportion of water evaporating within a measuring cycle to 5%. - Application cycles for testing the accuracy of measured values In the first cycle, a water film is to be applied to the sensor under investigation with a thickness of 0.01 mm per minute until a thickness of 0.2 mm has been attained. In a second cycle, a water film is to be applied with a thickness of 0.04 mm per minute until a thickness of 0.8 mm has been attained. The values measured by the sensor under investigation are to be output every minute. Application of the water film should be commenced at the beginning of each polling cycle. Each application cycle is to be executed 5 times, between each of which the sensor should be dried thoroughly. - Application cycles for checking measurement periods To check the required, short measuring periods, water films of identical thicknesses are to be applied to the sensor within a period of 1 minute, at differing time intervals (see the table). Any water film thickness is permissible inside the stipulated measuring range. The sensor measurement values at the end of each application cycle must yield the ratios specified in the table's last row.
Auftragungszyklus 1 Auftragungszyklus 2 Auftragungszyklus 3nach 10s Auftrag 1 Auftrag 1 Auftrag 1nach 20s keine Auftrag kein Auftrag Auftrag 2nach 30s keine Auftrag Auftrag 2 Auftrag 3nach 40s keine Auftrag kein Auftrag Auftrag 4nach 50s keine Auftrag Auftrag 3 Auftrag 5nach 60s keine Auftrag kein Auftrag Auftrag 6Verhältnis der Auftragsmengen 1,0 2,0 3,5 Application cycle 1 ... After 10 s Application 1 ... After 20 s No application ... ... Application quantity ratio Each application cycle is to be executed 3 times, between each of which the sensor should be dried thoroughly. Application of the water film should be commenced at the beginning of each measurement period.
Evaluation of results:
- Checks of measurement value accuracy If one or more values measured during an application cycle deviate from the permissible range by more than 15%, additional measurement series should be conducted. If less than 15% of the measurement results exhibit excessive deviations, they can be neglected as outliers. If more than 15% of the results of a measurement series transgress the specified limits, the sensors need to be re-calibrated or re-adjusted.
Winter Maintenance Performance Measurement Using Friction Testing Appendix F
F-98

GERMANY CEN TC 337 - Road condition and weather information system - RWIS
Page 6 of 10
- Checks of measurement period The determined water film thicknesses must correspond to the ratios specified in the table in section A 1.2.3. The permissible tolerance range is +/-30%. If one or more measured values exceed these tolerance limits, additional application cycles must be executed. If less than 15% of a series of measured values exhibit transgressions, they can be neglected as outliers. If more than 15% of a series of measured values transgress the specified tolerance limits, the sensor must be re-adjusted.
e) Acceptance tests of sensors for registering water film thickness Acceptance tests involve applications of defined, uniform water films on the test sensor, as in the case of the performance tests, but not as extensive.
Equipment and aids: Mechanically guided device (spray gun, spray valve etc.) for applying a uniform, defined water film Stopwatch Beaker Paper tissues Fan heater
Verification of defined, uniform water film thickness: The device for applying a defined, uniform water film should be calibrated in the laboratory as described in the section concerning the performance test.
Application of water films on the sensor: The spraying device should be placed above the test sensor as during calibration in the laboratory. The ambient conditions must limit the proportion of water evaporating within a measuring cycle to 5%. Every minute, a water film 0.01 mm thick should be applied to the test sensor until attainment of a thickness at which the water film begins to flow off. The values measured by the sensor under investigation are to be output every minute. Application of the water film should be commenced at the beginning of each measurement period. Each application cycle is to be executed 5 times, between each of which the sensor should be dried thoroughly.
Evaluation of results: If one or more values measured during an application cycle deviate from the permissible range by more than 15% of the defined application value, additional application cycles must be executed. If less than 15% of the measurement results exhibit excessive deviations, they can be neglected as outliers. If more than 15% of the results of a measurement series transgress the specified limits, the sensors need to be re-calibrated, re-adjusted or replaced.
Winter Maintenance Performance Measurement Using Friction Testing Appendix F
F-99

GERMANY CEN TC 337 - Road condition and weather information system - RWIS
Page 7 of 10
f) Performance tests of sensors for registering freezing temperature Performance tests involve applications of thawing solutions of a defined, uniform thickness and varying freezing temperatures to the sensor under investigation.
Equipment and aids: Air-conditioned room with adjustable air temperature and relative humidity Mechanically guided device (spray gun, spray valve etc.) for applying a uniform, defined film of thawing agent Spirit level Stopwatch Beaker Paper tissues Fan heater Aqueous solutions for freezing temperatures of -2°C, -5°C, -10°C, -15°C and -20°C (the thawing agent is to be specified by the client).
Calibration accessories: Scale with a resolution of 0.001 g and measuring accuracy of +/-0.003 g. Plastic bars with a cross-section of 10 x 10 mm and a rough surface, their number and length (at least 300 mm) depending on the test sensor's size. Verification of defined, uniform thickness of a film of thawing solution: The thickness and uniformity of the resulting thawing-solution film are to be measured on plastic test bars by weighing the bars before and after application of the film. The difference in weight measured in each case serves as a basis for calculating the thawing-solution film thickness on the bar. The plastic bars should be placed next to each other. The surface of each bar must lie in the same plane as that of the test sensor. A further bar should be placed along each longitudinal side to prevent lateral spraying of the test strips. The thawing-solution film should be applied in the defined thickness to each bar within a period of 30 seconds. The tests are to be conducted on thawing solutions with freezing temperatures of -2°C, -5°C, -10°C, -15°C and -20°C.
Application of thawing-solution films on the sensor: To verify the uniformity of the defined thawing solution film thickness, the sensor is placed horizontally beneath the spraying device in the same plane as the plastic bars. To prevent thawing-solution films at higher levels from flowing off, the sensor should be demarcated appropriately. If these demarcations influence the measurements, the sensor should be installed in a road-like plane. The edges of this plane should then be demarcated appropriately. The ambient conditions must limit the proportion of thawing solution evaporating within a measuring cycle to 5%. In the first cycle, a thawing-solution film is to be applied to the sensor under investigation with a thickness of 0.01 mm per minute until a thickness of 0.2 mm has been attained. In a second cycle, a thawing-solution film is to be applied with a thickness of 0.04 mm per minute until a thickness of 0.8 mm has been attained. The values measured by the sensor under investigation are to be output every minute. Application of the thawing-solution film should be commenced at the beginning of each measuring period. Each thawing-solution application cycle should be executed 3 times, between each of which the sensor should freed completely of thawing solution and dried.
Winter Maintenance Performance Measurement Using Friction Testing Appendix F
F-100

GERMANY CEN TC 337 - Road condition and weather information system - RWIS
Page 8 of 10
Evaluation of results: If one or more values measured during an application cycle deviate from the permissible range by more than 15%, additional application cycles should be executed. If less than 15% of the results of a measurement series exhibit excessive deviations, they can be neglected as outliers. If more than 15% of the results of a measurement series transgress the specified limits, the sensors need to be re-calibrated or re-adjusted. The film thickness measured on each bar and the average of all individual values should not deviate by more than +/-20% from the desired value. The uniformity of the film applied to each bar should be evaluated visually.
g) Tests of sensors for registering subsoil temperature The measuring accuracy of the sensor is to be checked in a mixture of ice and water prior to installation. After one minute, the indicated value must not deviate from 0°C by more than +/-1 Kelvin.
h) Tests of sensors for registering air temperature Measuring accuracy is checked through reference measurement with a sensor possessing a measuring accuracy of +/-0.2 Kelvin and protected against radiation to the greatest possible extent (for example, psychrometer). During the reference measurements, the wind speed must not exceed 0.3 m/s. The measurements should be conducted at a horizontal distance of less than 1 m and vertical distance of less than 0.5 m to the test sensor. The values measured by the reference and test sensors must not diverge by more than +/-0.4 Kelvin.
i) Tests of sensors for registering relative humidity Measuring accuracy is checked through reference measurement with a sensor possessing a measuring accuracy of +/-2% (for example, psychrometer). During the reference measurements, the wind speed must not exceed 0.3 m/s. The measurements should be conducted at a horizontal distance of less than 1 m and vertical distance of less than 0.5 m to the test sensor. The values measured by the reference and test sensors must not diverge by more than +/-5%.
j) Tests of sensors for registering dew-point temperature Measuring accuracy is checked through reference measurement with a sensor possessing a measuring accuracy of +/-0.2 Kelvin (for example, psychrometer). During the reference measurements, the wind speed must not exceed 0.3 m/s. The measurements should be conducted at a horizontal distance of less than 1 m and vertical distance of less than 0.5 m to the test sensor. The values measured by the reference and test sensors must not diverge by more than +/-0.5 Kelvin.
k) Tests of sensors for registering precipitation Measuring accuracy is checked through observations at the measuring point given various precipitation intensities and types.
Winter Maintenance Performance Measurement Using Friction Testing Appendix F
F-101

GERMANY CEN TC 337 - Road condition and weather information system - RWIS
Page 9 of 10
l) Tests of sensors for registering precipitation intensity These tests involve reference measurements.
Equipment and aids: Scale with a resolution of 0.01 g and measuring accuracy of +/-0.01 g. Shield for protecting the scale against wind (for example, aquarium + cover). Desktop. Device (e.g. tent) for keeping the desktop, scale and measuring equipment dry. Tripod with a horizontal top platform (approximately 120 mm in diameter) for secure mounting of the collection tray described below. The platform's upper edge should be at a height of roughly 1000 mm above the ground. The tripod should possess a mechanism for aligning the platform horizontally. Spirit level, approximately 400 mm long. Collection tray as illustrated below.
∅ 230
25
20
∅ 225,7
Diagram: Dimensions of the collection tray (not true to scale) Cotton wool Umbrella Paper tissues Stopwatch
Measurement preparations Installation of the tripod next to the test sensor Important: The distance to the sensor must be less than 5 m. Ambient structures or vegetation must not influence the precipitation impinging on the collection tray differently with respect to the precipitation impinging on the test sensor. Wind conditions must be noted. With the help of the spirit level, align the tripod's top platform horizontally. Place the scale horizontally on a desktop, protecting it against precipitation and wind by means of an appropriate facility.
Measurement procedure: Wipe the collection tray dry and line its entire surface with a thin layer of cotton to prevent raindrops from bouncing out. Important: The cotton layer must not protrude beyond the trays edges. Determine the tare of the collection tray and cotton layer, and record this value. Important: The tare must not deviate from 0 by more than +/-0.02 g. On occurrence of a greater deviation, the scale must be furnished with a vibration absorbing base or improved wind shield. Wipe the tripod platform and collection tray dry and place them both underneath the umbrella. Place the collection tray on the platform, and position the umbrella so as to prevent precipitation from impinging inadvertently on the tray. Expose the collection tray to precipitation precisely at the required polling interval (stopwatch-aided measurements).
Winter Maintenance Performance Measurement Using Friction Testing Appendix F
F-102

GERMANY CEN TC 337 - Road condition and weather information system - RWIS
Page 10 of 10
Important: When moving the umbrella at the beginning and end of the exposure time, take care that no drops fall from the umbrella on to the collection tray. The reference measurement must take place in synchronization with the sensor's measurement period (required polling cycle). The sensor's supplier must have ensured ascertainment of the sensor value in the reference measuring period. The time value corresponding to the sensor measurement value must indicate the end of the reference measurement interval +/-2 seconds. Using the umbrella to protect the collection basin, move it to the scale. Wipe dry the collection tray's outer edge. Determine the weight of the collection tray and precipitation, and record this value.
Number of measurements and result evaluations The tests are to be conducted 5 times in each of the following precipitation intensity classes. The percentage differences specified between the reference and sensor measurement values must not be exceeded. At precipitation intensities over 0.1 to 0.5 mm/h: +/- 50% At precipitation intensities over 0.5 to 1.0 mm/h: +/- 30% At precipitation intensities over 1.0 mm/h: +/- 30% If the measured values diverge to a greater extent, additional measurements are necessary. If less than 15% of the results of a measurement series exhibit excessive deviations, they can be neglected as outliers. If more than 15% of the results transgress the specified limits, the sensors need to be re-calibrated, re-adjusted or replaced.
m) Tests of sensors for registering precipitation level Measuring accuracy is checked through reference measurement with a sensor possessing a measuring accuracy of +/-0.2 mm. The values measured by the reference and test sensors must not diverge by more than +/-0.5 mm.
n) Tests of sensors for registering global radiation Reference measurement with a calibrated sensor
o) Tests of sensors for registering radiation balance Reference measurement with a calibrated sensor
p) Tests of sensors for registering average wind speed Measuring accuracy is checked through reference measurement with a sensor possessing a measuring accuracy of +/-0.3 m/s. The reference value is also specified as an average value over a sliding time interval of 10 minutes. The measurements should be conducted at a horizontal distance of less than 1 m and vertical distance of less than 0.5 m to the test sensor. The values measured by the reference and test sensors must not diverge by more than +/-1.1 m/s.
q) Tests of sensors for registering wind direction Measuring accuracy is checked through reference measurement with a sensor possessing a measuring accuracy of +/-10°. The reference value is also specified as an average value over a sliding time interval of 10 minutes. The measurements should be conducted at a horizontal distance of less than 1 m and vertical distance of less than 0.5 m to the test sensor. The values measured by the reference and test sensors must not diverge by more than +/-20°.
Winter Maintenance Performance Measurement Using Friction Testing Appendix F
F-103

Road Weather Forecasts for a Winter Road Maintenance Information Center
Wolfgang E. Raatz * and Ludwig Niebrügge***Deutscher Wetterdienst, Entwicklung von Anwendungen
Frankfurter Str. 135, D-63067 Offenbach, [email protected]
** Landesbetrieb Straßenbau Nordrhein-WestfalenPO Box 4669, D-48026 Münster, Germany
1. IntroductionSince the early eighties an increased number of road weather monitoring stations have beeninstalled along the „Autobahnen“ of the German national highway system in order to monitorthe weather conditions and their effect on the state of the roads. The introduction ofGermany’s road weather information system (SWIS) has led to a dense network of roadweather monitoring stations. The data of these stations is used by the German MeteorologicalService (DWD) to monitor actual road weather, to predict road weather conditions (especiallyin the nowcasting range) and to develop new forecast methods.
The data of these stations was also monitored by the personnel at the telephone center of thelocal maintenance center. In addition, information on the road condition was passed on tothem by the highway police. When there was a risk or the occurrence of slipperiness thewinter road maintenance staff was alerted by the telephone center.
The quality of the road weather monitoring varied heavily, depending on the ability andexperience of the personnel at the telephone centers. The interpretation of the data and of thealerts provided by the road weather monitoring stations in connection with the weatherdevelopment and predictions was often carried out in an unsatisfactory manner. There was alack of knowledge, which could not be removed by additional training.
Due to these experiences and the intended closing down of the telephone centers, thenecessity of re-organizing the road weather monitoring system and the coordination of wintermaintenance became apparent. In this paper we will describe how the coordination of winterroad maintenance has changed in the state of Northrhine-Westfalia (Nordrhein-Westfalen)and its possible effects on the cooperation between the road administration and the GermanMeteorological Service (DWD).
2. Objective and TasksThe economic importance of the roads as a means of transportation imposes highrequirements on the winter road maintenance. Every day, the national highways, which fallunder the resposibility of the department of highway construction of the „LandesbetriebStraßenbau Nordrhein-Westfalen“ are used by 67.500 vehicles. In the industrial center of theRuhr region traffic flow regularly peaks at 110.000 vehicles per day. Since it is estimated thattraffic flow will further increase, there is a need to continue efforts to optimize winter road
Winter Maintenance Performance Measurement Using Friction Testing Appendix F
F-104

maintenance and its coordination. A thorough analysis came to the conclusion that it would beadvisable to set up a winter road maintenance information center, the first of its kind inGermany.
First of all, the winter road maintenance information center has to have access to all relevantroad weather data and forecasts. In additon, the staff has to be trained to interprete the data.Furthermore, the winter road maintenance information center has to have kowledge of thestatus of the winter road maintenance done by the different local maintenance centers.
Primary tasks of the winter road maintenance information center are:a) monitoring of the road weather data and their development,b) monitoring of the weather development using additional information (e.g. such as radar),c) comparing actual weather and predicted weather,d) calling the winter road maintenance centers to start service,e) coordinating the winter road maintenance done by different centers.
Secondary tasks are:a) keeping records of the the winter road maintenance information center’s activities as wellas of those done by the different maintenance centers,b) checking the technical condition and reliability of the road weather monitoring system(quality of measurements, data transfer, etc..),c) checking the operation of thawing agent spraying systems.
3. Technical Equipment and StaffThe winter road maintenance information center is equipped with several personal computerswhich are linked to the SWIS-network. They display simultaneously different parameters ofthe road weather monitoring stations, the DWD’s forecasts as well as precipitation images. Afurther PC is linked to the internet and is used to gather additional weather information fromthe World Wide Web.
The different local maintenance centers are also linked to the SWIS-network in order toensure that,a) exchange of information and coordination between the winter road maintenanceinformation center and the different local maintenance centers can take place on the basis ofthe same data,b) the person in charge (e.g. road master) of the local road maintenance center is able toevaluate the state of the roads in his/her network of responsibility,c) in the event of network problems the task of monitoring road weather can be handed overfrom the winter road maintenance information center to the local maintenance centers.
Finally, the winter road maintenance information center is equipped with a fax machine and amodern telephone system.
During the winter months the winter road maintenance information center is manned 24 hoursa day. The staff consists of 5-6 persons, who have practical experiences in carrying out winterroad maintenance. They are especially trained in evaluating road weather data and the
Winter Maintenance Performance Measurement Using Friction Testing Appendix F
F-105

alerts/alarms issued by the monitoring stations. In addition, they receive backgroundkowledge in basic meteorology.
4. Main Tasks4.1 Monitoring of the Road Weather Data and Their DevelopmentAs many as 100 road weather monitoring stations report every other minute their actual data.In addition, they provide trend forecasts and different types of alerts and alarms. In order toeasily evaluate these forecasts and alerts/alarms it has been decided to use sensors from onemanufacturer only.
4.2 Monitoring of the Weather Development Using Additional InformationIn order to organize winter road maintenace activities and to achieve a longer lead time beforehaving to start winter road maintenance it is important to have good forecasts on the weatherdevelopment. Different information sources are used:a) various forecast products provided by the German Meteorological Service (DWD) as partof SWIS (3-day forecast; 24-hrs detailed forecast for small climatic regions, sub-divided by200 m altitude intervals; road weather advice with up-to-date information as to expectedmeteorological developments within the next 2-4 hours),b) images from the DWD’s precipitation radar network,c) data from road weather monitoring stations from neighbouring road administrations,d) in critical situations telephone communication with the forecasters at the regional forecastcenter of the DWD.
Using all these different information sources the staff of the winter road maintenanceinformation center has a better overview on the road weather situation than the persons had atthe telephone centers. In addition, the quality of the weather forecast can be better judged, anupdate of the forecast may be demanded if necessary.
4.3 Alerting and Coordinating Local Winter Road MaintenanceAlerting the local winter road maintenance takes place on the basis of the informationdescribed above. During regular working hours of the local maintenance center the decision tocarry out winter road maintenance is made by the road master. Outside regular hours theresposibility is handed over to a certain person. The individuals initiate the necessary actionsfor their network. Thus, the winter road maintenance information center only passes oninformation, decisions are made locally.
Coordination of local winter maintenance by the winter road maintenance information centershould be restricted to those cases when the winter maintenance crews have to operate outsidetheir road network. For example, the winter road maintenance information center may orderan already operating salting vehicle to continue salting in a neighbouring territory in order toremove slipperiness at certain critical spots. This may avoid calling in extra personnel andmachinery, thus saving costs and time.In the event of extreme weather conditions, such as intensive snowfall, coordination of themaintenance crews becomes necessary. When problems of capacity arise at one maintenancecenter they must be alleviated by available resources from other centers. Because of itsadvantage of having more and better information the winter road maintenance information
Winter Maintenance Performance Measurement Using Friction Testing Appendix F
F-106

center can initiate the necessary actions much faster. Extreme situations can thus be dealtmore effectively and traffic jams may be avoided.
5. Experiences and OutlookThe winter road maintenance information center has been operating for 4 years. It has led toan increased efficiency in the organization of winter road maintenance and has improved itsquality.The participation of the winter road maintenance information center in alerting the localmaintenance centers has increased to 90%.Developments of road weather conditions could be anticipated with much more accurracy dueto the ability and knowledge of the staff. Therefore it was possible to raise the number ofpreventive operations by the winter road maintenance.The dialogue between the forcasters of DWD and the center’s staff has improved theevaluation of the weather situations. Due to the numerous information the center’s staff wasable to discuss the weather situation with the forecaster in greater detail. They becamecompetent partners in evaluating the weather situation and were better prepared to anticipatefurther weather development. Thus, cooperation was put on to a much higher level ofunderstanding than in the past.
Therefore, the German Meteorological Service (DWD) is planing to upgrade its forecastproducts within the frame of SWIS using internet technology. When the staff of the winterroad maintenance information center becomes better trained and competent, the forcastproducts may become more detailed by containing more complex information. Additionally,nowcasting products will supplement the long and short range forcasts. An example is givenin Figure 1. This product is called „satellite weather“. Information from satellite images andsynoptic observations have been combined, extrapolation up to 3 hours can be done. Incontrast to former times, forecast products may be issued several times a day, being more up-to-date.Since the winter road maintenance information center has the problem how to displayinformation from different sources and make them comparable, the DWD may provide apresentation software to display all meteorological information.
Winter Maintenance Performance Measurement Using Friction Testing Appendix F
F-107

Figure 1: Example of a nowcasting product called „satellite weather“.The analysed product can be extrapolated up to 3 hours. The results are fairly good forstratiform clouds, less accurate for convective weather phenomena.
freezing rain, freezing drizzle rain (stripped: little)
snow (stripped: little) clouds without significantweather phenomena
thunderstorm no significant clouds
fog (dotted)
Winter Maintenance Performance Measurement Using Friction Testing Appendix F
F-108

EUROPEAN STANDARD
NORME EUROPÉENNE
EUROPÄISCHE NORM
DRAFTprEN 15518
April 2006
ICS
English Version
Winter maintenance equipment - Road weather informationsystems - Product description and performance
This draft European Standard is submitted to CEN members for enquiry. It has been drawn up by the Technical Committee CEN/TC 337.
If this draft becomes a European Standard, CEN members are bound to comply with the CEN/CENELEC Internal Regulations whichstipulate the conditions for giving this European Standard the status of a national standard without any alteration.
This draft European Standard was established by CEN in three official versions (English, French, German). A version in any other languagemade by translation under the responsibility of a CEN member into its own language and notified to the Management Centre has the samestatus as the official versions.
CEN members are the national standards bodies of Austria, Belgium, Cyprus, Czech Republic, Denmark, Estonia, Finland, France,Germany, Greece, Hungary, Iceland, Ireland, Italy, Latvia, Lithuania, Luxembourg, Malta, Netherlands, Norway, Poland, Portugal, Romania,Slovakia, Slovenia, Spain, Sweden, Switzerland and United Kingdom.
Recipients of this draft are invited to submit, with their comments, notification of any relevant patent rights of which they are aware and toprovide supporting documentation.
Warning : This document is not a European Standard. It is distributed for review and comments. It is subject to change without notice andshall not be referred to as a European Standard.
EUROPEAN COMMITTEE FOR STANDARDIZATIONC OM ITÉ EUR OP ÉEN DE NOR M ALIS AT IONEUROPÄISCHES KOMITEE FÜR NORMUNG
Management Centre: rue de Stassart, 36 B-1050 Brussels
© 2006 CEN All rights of exploitation in any form and by any means reservedworldwide for CEN national Members.
Ref. No. prEN 15518:2006: E
Winter Maintenance Performance Measurement Using Friction Testing Appendix F
F-109
JCH
Textfeld
CEN/TC 337/WG 1 N0117

prEN 15518:2006 (E)
2
Contents Page
Foreword..............................................................................................................................................................3 Introduction .........................................................................................................................................................3 1 Scope ......................................................................................................................................................3 2 Normative references ............................................................................................................................3 3 Terms and definitions ...........................................................................................................................4 4 Requirements .........................................................................................................................................6 4.1 Data acquisition .....................................................................................................................................6 4.1.1 Stationary equipment ............................................................................................................................6 4.1.2 Mobile equipment ................................................................................................................................11 4.1.3 Weather forecast..................................................................................................................................11 4.2 Interfaces ..............................................................................................................................................13 4.2.1 Interface with weather service............................................................................................................13
Tables
Table 1 — Requirements................................................................................................................................... 6 Table 2 — Weather forecast products ........................................................................................................... 12
Winter Maintenance Performance Measurement Using Friction Testing Appendix F
F-110

prEN 15518:2006 (E)
3
Foreword
This document (prEN 15518:2006) has been prepared by Technical Committee CEN/TC 337 “Winter maintenance and road service area maintenance equipment”, the secretariat of which is held by AFNOR.
This document is currently submitted to the CEN Enquiry.
Introduction
Road Weather Information Systems (RWIS) are complex structures used for road maintenance decision support, which feature as a rule the following components: meteorological sensors and instruments, transmission technology, computer systems for processing, representation and storing of information, road weather forecasts, alarms, in relation to traffic control and traffic information systems and more.
This European standard lays down the requirements for the recommended components of a RWIS. In the description of requirements a distinction is made between the components, forming a basis RWIS for winter use and the recommended complementary components.
The aim is to ensure extensive combination and interchangeability within the systems.
With a set terminology for the components and the meteorological expressions an attempt is made to counteract a diversity of terms and designations for identical phenomena.
1 Scope
This European Standard specifies the requirements for all components of Road Weather Information Systems (RWIS).
The components include terminology, data acquisition and transmission, interface and test methods.
Furthermore are specified the requirements for road weather forecasts as well as information exchange between weather services and the RWIS.
2 Normative references
The following referenced documents are indispensable for the application of this document. For dated references, only the edition cited applies. For undated references, the latest edition of the referenced document (including any amendments) applies.
prEN 15144, Winter maintenance equipment — Terminology — Terms used for winter maintenance equipment
Winter Maintenance Performance Measurement Using Friction Testing Appendix F
F-111

prEN 15518:2006 (E)
4
3 Terms and definitions
For the purposes of this document, the terms and definitions given in prEN 15144 and the following apply.
3.1 Surface
3.1.1 pavement surface temperature effective radiation temperature of a pavement surface
3.1.2 road surface condition qualification of the status of road surface affected by road weather phenomenon
3.1.3 water film thickness mean thickness of the film of water present on a flat surface
3.2 Aerial
3.2.1 relative humidity filling rate of the mass of air with water vapour
NOTE It is determined in relation to water, in liquid phase, and recorded under a screen at a height between 1,5 m and 4,0 m from the ground.
3.2.2 precipitations general term designating any fall of rain, in the form of liquid drops or of frozen particles, which reaches the ground
3.2.3 rain precipitation of particles of liquid water in the form of drops of diameter > 0,5 mm or of scattered drops of diameter < 0,5 mm.
3.2.4 depth of precipitation thickness of the layer of water obtained by precipitation or deposit on a horizontal surface if the precipitations falling in solid form were to melt
3.2.5 depth of snow raw thickness of snow deposited on the ground
3.2.6 intensity of precipitation depth of precipitations collected per unit of time
3.2.7 wind velocity instantaneous and moderate wind
ratio of the distance travelled by the air, per unit of time
Winter Maintenance Performance Measurement Using Friction Testing Appendix F
F-112

prEN 15518:2006 (E)
5
3.2.8 gust of wind brief, sudden increase in the velocity of the wind in relation to its mean value
3.2.9 wind direction instantaneous and mean wind
direction from where the wind is blowing with respect to the magnetic north
3.2.10 visibility distance defined by the meteorological optical range
3.2.11 total radiation solar radiation received by a horizontal surface from the galactic centre, directed towards the ground, within a spectral range from 0,3 µm to 3 µm
3.2.12 atmospheric radiation high wavelength infrared radiation emitted by the atmosphere, within a spectral range from 4 µm to 100 µm.
3.2.13 total cloud cover fraction of the galactic centre hidden by all of the visible clouds
NOTE It is defined by the International Meteorological Code 2 700. It is expressed in octa corresponding to the eighth of the galactic centre occupied by the clouds.
3.3 General
3.3.1 screen shelter built in such a manner that it protects its contents against solar radiation, precipitations and condensation and contributes at the same time to ventilation
3.3.2 sampling interval time between two readings meant for the elaboration of a value
3.3.3 measurement interval time between two elaborated values
3.3.4 polling interval time between two transmissions of elaborated values
Winter Maintenance Performance Measurement Using Friction Testing Appendix F
F-113

prEN 15518:2006 (E)
6
4 Requirements
4.1 Data acquisition
4.1.1 Stationary equipment
4.1.1.1 Description and requirements on measured values
The requirements hereafter apply to sensors in road conditions. However, the accuracy requirements are meant for laboratory testing. Sensor set-up, calibration and special handling shall be specified by the manufacturer.
The first column of Table 1 hereafter states “B” for parameters recommended in a basic configuration, and “C” for parameters considered as complimentary.
Table 1 — Requirements
Parameters Requirements
B Pavement surface temperature
Measuring range: –30 °C to 60 °C
Resolution: 0,1°C
Accuracy: –15 °C to 10 °C, (± 0,2 °C)
–30 °C to –15 °C, (± 0,8 °C) and +10 °C to 60 °C , (± 0,8 °C)
B Road surface condition Dry: no humidity over the sensor
Moist: from (0,01 mm) water film thickness over the sensor
Wet: from (0,2 mm) water film thickness over the sensor
Streaming water: from (2 mm) water film thickness over the sensor
Slippery: detection at least of the presence of partly or wholly solidified aqueous solution over the sensor
C Water film thickness Measuring range: 0,2 mm to 3 mm
Resolution: 0,01 mm
Accuracy: 0,2 mm to 3 mm, (± 30 %)
NOTE Specific averaging can be required by the customer.
Winter Maintenance Performance Measurement Using Friction Testing Appendix F
F-114

prEN 15518:2006 (E)
7
Table 1 (continued)
Parameters Requirements
Measured:
Measuring range: –30 °C to 0 °C
Resolution: 0,1 °C
Accuracy: 0 °C to –15 °C, (± 0,5 °C)
–15 °C to –30 °C, (± 1,5 °C)
This requirement is independent of the de-icing agent being used.
These accuracies are obtained under the following conditions:
- Aqueous solution film thickness: 0,05 mm to 0,5 mm;
- Measured from ≤ 4 °C pavement surface temperature.
B Freezing point temperature
Calculated
Measuring range : –30 °C to 0 °C
Resolution : 0,1 °C
Accuracy : 0 °C to –2,5 °C, (± 0,5 °C)
–2,5 °C to –30 °C, (± 20 %)
This requirement depends on the de-icing agent being used.
These accuracies are obtained under the following conditions:
- Aqueous solution film thickness: 0,05 mm to 0,5 mm
- Under defined and constant de-icing agent
- Measured from ≤ 4 °C pavement surface temperature
C Road body temperature Measuring range: between –25 °C and 60 °C
Resolution: 0,1 °C
Accuracy: ± 1 °C
Winter Maintenance Performance Measurement Using Friction Testing Appendix F
F-115

prEN 15518:2006 (E)
8
Table 1 (continued)
Parameters Requirements
B Air temperature Measuring range: between –40 °C and 60 °C
Resolution: 0,1 °C
Accuracy: between (–10 ± 0,1)°C and (10 ± 0,1)°C
± 0,5 °C otherwise
B Relative humidity Measuring range: at least between 30 % and 100 %
Resolution: 1 %
Accuracy: (85 ± 3)% and (100 ± 3)%, otherwise ± 5 %
Measured
Measuring range: between –10 °C and 10 °C
Resolution: 0,1 °C
Accuracy: ± 0,3 °C
B
Dew-point temperature
Calculated
Measuring range: between –10 °C and 10 °C and relative humidity > 85 %
Resolution: 0,1 °C
Accuracy: ± 1,5 °C
B Precipitation detection time The following precipitation have to be detected in the following time :
2 min: ≥ 1,2 mm/h
6 min: ≥ 0,4 mm/h
10 min: ≥ 0,1 mm/h
B Precipitation type Distinction between solid and liquid precipitation with 80 % confidence within the above response times.
Winter Maintenance Performance Measurement Using Friction Testing Appendix F
F-116

prEN 15518:2006 (E)
9
Table 1 (continued)
Parameters Requirements
C Precipitation intensity Measuring range: between 0,1 mm/h and 200 mm/h.
Resolution: 0,1 mm/h
Accuracy: 0,1 mm/h to 0,5 mm/h (± 30 %)
0,5 mm/h to 5 mm/h (± 20 %)
> 5 mm/h (± 40 %)
NOTE The accuracy is given for liquid precipitation, when measured in a 10 min period.
Solid precipitation shall be expressed in terms of the rainfall equivalent.
C Snow depth (measured at the RWIS site)
Measuring range : 0 cm to 50 cm
Resolution : 1 cm
Accuracy : ± 2 cm
C Snow depth (measured on the road surface)
Measuring range : 0 cm to 50 cm
Resolution : 1 cm
Accuracy : ± 2 cm
These requirements shall be adapted to the equipment able to perform this type of measurement.
This information shall be representative of a given area.
C Wind speed Measuring range: at least between 0 m/s and 35 m/s
Resolution: 0,1 m/s
Accuracy: between (1 ± 1)m/s and (10 ± 1)m/s
between 10 m/s and 35 m/s (± 10 %)
Starting value: < 1 m/s
The wind speed shall be specified as an average vector over a sliding time interval of 10 min.
Winter Maintenance Performance Measurement Using Friction Testing Appendix F
F-117

prEN 15518:2006 (E)
10
Table 1 (continued)
Parameters Requirements
C Gust of wind Measuring range : between 0 m/s and 50 m/s
Resolution : 0,1 m/s
Accuracy : between (1 ± 1)m/s and (10 ± 1)m/s
between 10 m/s and 50 m/s (± 10 %)
Starting value: < 1 m/s
The gust of wind is measured over a period of ≤ 5 s, 3 s being recommended.
C Wind direction Measuring range : 0° to 359°
Resolution: 1°
Accuracy: < ± 10°
Starting value: < 1 m/s at an initial deflection of 90°
The wind direction shall be specified as an average vector over a sliding time interval of 10 min.
C Visibility Measuring range : 10 m to 500 m
Resolution : 10 m
Accuracy : ± 10 m or 20 %, whichever is greater
General requirements:
a) Thermal resistance
sensors embedded in the pavement need to survive surface temperatures from –40 °C to 70 °C;
Equipment placed in the air need to survive air temperatures from –40 °C to 50 °C.
b) Chemical resistance
All components of the road and weather information system installed on the pavement shall be resistant to the thawing agents and fuels to which roads are normally exposed.
c) Mechanical resistance
Sensors and other components embedded in the pavement shall withstand regular mechanical loads exerted by traffic, including rollovers by snow-clearing machines.
d) Electro-magnetical resistance
All components of the road and weather information system shall not be affected by conventional environing electro-magnetical conditions
Winter Maintenance Performance Measurement Using Friction Testing Appendix F
F-118

prEN 15518:2006 (E)
11
4.1.1.2 Basic requirements on data-transmission
Data transmission parameters and protocols shall comply with the client's specifications.
4.1.1.3 Testing/verification of performance
Not specified in this standard
4.1.2 Mobile equipment
Not specified in this standard
4.1.3 Weather forecast
Road weather is characterized by weather phenomena and meteorological parameters which affect the road surface conditions. A distinction has to be made between observation and forecast.
The RWIS-forecasts shall provide the necessary information for maintenance agents to
make a short-term (up to 4 h) and a long-term (up to one week) planning for the disposition of personnel and means;
decide on immediate interventions.
It has to be considered that the geographical accuracy is indirectly proportional to the forecast period. Therefore a forecast for 7 days covers a larger area than a short-term forecast for the next few hours.
Road weather forecasts describe conditions which would occur without winter maintenance interventions. They do not take into account the influences from traffic.
The forecast products which are recommended are shown in Table 2.
Winter Maintenance Performance Measurement Using Friction Testing Appendix F
F-119

prEN 15518:2006 (E)
12
Table 2 — Weather forecast products
Forecast product Frequency Resolution Content
long-term forecast from the 4th up to the 7th day
once a day without amendment
days;
regions of about 100 km × 100 km.
general weather conditions for daytime and night-time
medium-term forecast up to the 3rd day
twice a day days;
regions of about 100 km × 100 km.
general weather conditions for daytime and night-time;
details of road weather parameters such as:
general synopsis with time;
minimum air temperature;
minimum road surface temperature;
time of zero crossing;
likelihood and time of precipitation or deposition on road surface;
wind direction and speed;
gusts;
snow drifting;
probability of occurrence.
short-term-forecast for 24 h in tabular form
twice a day, if necessary with amendment a
in 3 h to 4 h intervals;
for small areas with similar climatological properties;
for each 200 m to 400 m altitude-levels.
air temperature;
pavement temperature;
cloud cover;
precipitation;
wind direction and speed;
road surface conditions for different site characteristics in the region (motorways, low traffic roads, bridges, shadowy stretches, cities).
Radar images and extrapolations for the next 2 h
every 5 min to15 min
charts, one pixel for max 2 km × 2 km area
real time images of the last 2 h;
two-hour-extrapolation of the actual precipitation areas;
distinction between liquid and solid water.
Winter Maintenance Performance Measurement Using Friction Testing Appendix F
F-120

prEN 15518:2006 (E)
13
Table 2 (continued)
Forecast product Frequency Resolution Content
warnings as soon as possible before the event
area will depend on event
description of events affecting road weather conditions
(freezing rain)
(large snow/rain falls)
(high wind speeds)
affected area and anticipated duration
consultation with forecast provider
on demand on demand on demand
satellite pictures b at least 30 min depending on satellite location
visible and infrared picture
The forecast provider discloses the scientific basis, the accuracy and the data base of the products to the customer. a The 24-h-forecast shall be amended if significant new developments occur in the following parameters:
precipitation; frost yes/no; road slipperiness; time shift of more than 3 h; fresh snow more than 5 cm.
b Satellite pictures are not part of the weather forecast tools, but can be used as a complementary information.
4.2 Interfaces
4.2.1 Interface with weather service
Data transmission, processing and monitoring has to be co-ordinated with the customer. Besides traditional text, formats for automatic processing, i.e. xml-files, shall be offered.
4.2.1.1 Upload of road data to the weather service
Not specified in this standard.
4.2.1.2 Download of weather forecast from the weather service
Not specified in this standard.
4.2.1.3 Interface with other equipment
Not specified in this standard.
Winter Maintenance Performance Measurement Using Friction Testing Appendix F
F-121

Friktionsmätare Friction meters
BV 14
Saab friction tester
BV11
Portable frictiontester, PFT
Freezing point sensorSurface temperature
BV 14 Twin Friction TesterUltrasonic sensors(snow depth)
Air temperature/Humidity
Air temperature
Video camera
Winter Measuring Car with BV14
Winter Maintenance Performance Measurement Using Friction Testing Appendix F
F-122

WDM Limited
North View, Staple Hill,
Bristol BS16 4NX
Telephone: +44 (0)117 9567233
Facsimile: +44 (0)117 9570351
www.wdm.co.uk
For further details, please contact WDM Limited on +44 (0)117 9567233 or email [email protected]
Sideway-force Coefficient Routine Investigation Machine
SCRIM® / SCRIMTEX
The SCRIM® is manufactured by WDM Limited under license to the UK Transport Research
Laboratory (TRL) and WDM Limited is the sole licensed manufacturer worldwide. The SCRIM® is
manufactured in full compliance with the current British Standard BS 7941-1:2006.
The SCRIM® is used to measure the wet skidding resistance of a road surface. The
measurements of skidding resistance recorded by the SCRIM® can be used to identify lengths of
road that are at or below investigatory levels defined for particular road categories.
The SCRIM® is ideal for network skidding resistance surveys and has a daily survey capacity of
200 to 300 km’s depending upon road type.
A SCRIM® survey in the UK can be undertaken at two
different target test speeds 50 and 80km/hr. The permitted
speed range covering these target speeds is 25 to 85km/hr.
Skidding resistance data recorded at speeds within this
range can be speed corrected to give equivalent values at 50
km/hr. The higher target speed should only be used where
the posted speed limit is greater than 50 MPH and where it
is considered safe by the SCRIM® driver. The SCRIM®
requires an operator and a driver. Skidding resistance data
are recorded continuously by the SCRIM® and stored as an
average for each 5,10 and 20m section of road. The
operator controls the survey and adds locational markers to the data stream during the SCRIM®
survey. All data are stored on USB flash drives for ease of processing. During periods of testing,
SCRIM® is calibrated before and on completion of each days testing.
Test wheels are available, mounted mid-vehicle, in both the
nearside and offside wheelpaths at an angle of 20 degrees
to the direction of travel. The test wheel which is fitted with
a smooth pneumatic tyre of standardised hardness, freely
rotates and is applied to the road surface under a known
load. A controlled flow of water wets the road surface
immediately in front of the test wheel and when the vehicle
moves forward, the test wheel slides in a forward direction
on the wet road surface. The force generated by this action
is related to the wet skidding resistance of the road surface.
Measurement of this sideways force allows the sideway-force coefficient to be calculated as an average for each continuous 5, 10 and 20m section.
SCRIMTEX is a development of the SCRIM®. SCRIMTEX
supplements the wet road skidding resistance by measuring
the surface macro-texture in front of the test wheel. This can
be achieved in both wheeltracks of a double-sided SCRIM®
and provides, in conjunction with air and surface
temperature, the ultimate requirement for the assessment of
road surface condition monitoring for network surveys.
Processing is undertaken using a suite of computer
programs. The SCRIM® Readings (SR) recorded by the
SCRIM® are corrected for speed where necessary and are rejected if the test speed is outside of
the range 25-85 km/h. Speed-corrected SCRIM® readings are converted to SCRIM® coefficients
which in turn are compared with a range of investigatory levels for different road categories to
identify deficient lengths of road.
Winter Maintenance Performance Measurement Using Friction Testing Appendix F
F-123

WDM Limited
North View, Staple Hill,
Bristol BS16 4NX
Telephone: +44 (0)117 9567233
Facsimile: +44 (0)117 9570351
www.wdm.co.uk
For further details, please contact WDM Limited on +44 (0)117 9567233 or email [email protected]
WDM manufacture the SCRIM®. The SCRIM® is a completely self-contained system consisting of
a commercial vehicle chassis fitted with a large water tank, one or two measuring wheel
assemblies and data recording electronics.
SCRIM® is a registered trade mark of WDM Limited.
Winter Maintenance Performance Measurement Using Friction Testing Appendix F
F-124

Central Laboratories0
IMPLEMENTING ADVANCED IMPLEMENTING ADVANCED SKID RESISTANCE MANAGEMENT:SKID RESISTANCE MANAGEMENT:
RESEARCH, MEASUREMENT, RESEARCH, MEASUREMENT, POLICY and ACHIEVEMENTPOLICY and ACHIEVEMENT
Peter CenekPeter [email protected]@opus.co.nz
Central Laboratories1
Presentation OutlinePresentation Outline
Overview of Australasian skid resistance management practicesCurrent issues facing AustralasiaLessons learnt from measuring and managing road surface skid resistance over the past decadePerceptions of the next decade
Winter Maintenance Performance Measurement Using Friction Testing Appendix F
F-125

Central Laboratories2
State controlled road networksState controlled road networks
Central Laboratories3
VictoriaVictoria
Roading Authority: VicRoadsSkid Resistance Management Plan: Since 1982Survey Apparatus: SCRIM (modified) Survey Details: High risk sites in Melbourne metropolitan
area and cities with population > 8,000 measured every 3 years.
Winter Maintenance Performance Measurement Using Friction Testing Appendix F
F-126

Central Laboratories4
New South WalesNew South Wales
Roading Authority: Road and Traffic Authority (RTA)Skid Resistance Management Plan: Since 1982Survey Apparatus: SCRIM (modified) Survey Details: 25% of RTA network (≈4,500 km) measured
each year.
Central Laboratories5
QueenslandQueensland
Roading Authority: Department of Main Roads (QLD)Skid Resistance Management Plan: In preparationSurvey Apparatus: Norsemeter ROAR, variable slip mode,
output expressed in terms of IFI. Survey Details: All state controlled roads with
AADT > 10,000 vpd at intervals not exceeding 2 years for higher risk roads and not more than 4 years for remainder.
Winter Maintenance Performance Measurement Using Friction Testing Appendix F
F-127

Central Laboratories6
Northern TerritoryNorthern Territory
Roading Authority: Northern Territory Transport GroupSkid Resistance Management Plan: Systematic testing not conducted.Survey Apparatus: GripTester has been used in past on urban
networks. Survey Details: British Pendulum Tester used at site specific
investigations. Texture surveys over entire network every 4 years with national highway every 2 years.
Central Laboratories7
Western AustraliaWestern Australia
Roading Authority: Main Roads (WA)Skid Resistance Management Plan: Network level assessment suspended
pending further research.Survey Apparatus: Norsemeter ROAR, variable slip mode,
output expressed in terms of IFI. Survey Details: Data collection commenced in 2002 but
suspended before the entire network had been surveyed.
Winter Maintenance Performance Measurement Using Friction Testing Appendix F
F-128
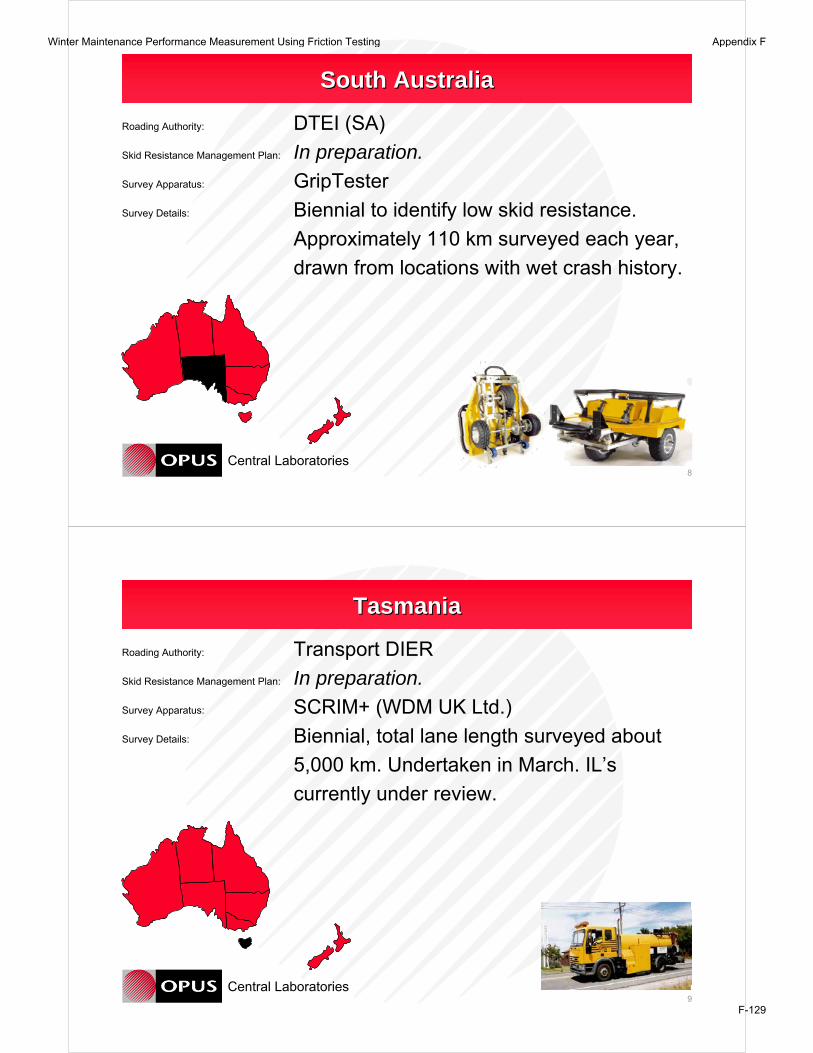
Central Laboratories8
South AustraliaSouth Australia
Roading Authority: DTEI (SA)Skid Resistance Management Plan: In preparation.Survey Apparatus: GripTesterSurvey Details: Biennial to identify low skid resistance.
Approximately 110 km surveyed each year, drawn from locations with wet crash history.
Central Laboratories9
TasmaniaTasmania
Roading Authority: Transport DIERSkid Resistance Management Plan: In preparation.Survey Apparatus: SCRIM+ (WDM UK Ltd.)Survey Details: Biennial, total lane length surveyed about
5,000 km. Undertaken in March. IL’scurrently under review.
Winter Maintenance Performance Measurement Using Friction Testing Appendix F
F-129

Central Laboratories10
New ZealandNew Zealand
Roading Authority: Transit New Zealand Skid Resistance Management Plan: Since 1997.Survey Apparatus: SCRIM+ (WDM UK Ltd.)Survey Details: Annually, entire network (10,790 km).
Texture, roughness, rutting, and road geometry additionally measured.
Central Laboratories11
Summary of SituationSummary of Situation
SRMP’s driven by legal considerations.• i.e. to enable a RA to defend a third party claim
SRMP’s based on “risk equalisation” across network.Targeted surveys favoured. Only New Zealand has adopted 100% surveys.No standard procedures for acquiring and reporting skid resistance data.PSV and PAFV tests utilised to ensure roading aggregates have satisfactory skid resistance performance.No texture depth related IL’s apart from Victoria and New Zealand.
Winter Maintenance Performance Measurement Using Friction Testing Appendix F
F-130

Central Laboratories12
Emerging IssuesEmerging Issues
Precision of skid resistance measurements (PSMC driven).Harmonisation of skid testers (to generate competitive market).0.78 “Index of SFC”– applied in UK and NZ but not Australia.Role of texture in skid resistance management.Monitoring programmes and IL’s appropriate to local conditions.A robust process for prioritising sites for treatment. Relationships between aggregate properties and in-service skid resistance performance.
Winter Maintenance Performance Measurement Using Friction Testing Appendix F
F-131

Statement of Halliday Technologies Inc. Position with RT3 Product
The RT3 product has been developed over a period of 6 years
It has been tested thoroughly by several organizations, the most notable being:
• Ohio Department of Transportation – Keith Swearingen, Diana Clonch – 5 years
• Swedish Road Administration – Jan Olander, Carl Henrik Ulegard, Pontus Gruhs, Niclas
Engstrom - 2 years
• Civil Engineering Research Institute -Cold Region (C.E.R.I.) – Dr. Roberto Tokunaga – 2 years
• Ontario Ministry of Transportation – Max Perchanok – 2 years
• Quebec Ministere des Transports – Francois Marchand – 1 year
• University of North Dakota – Professor Jeff Tilley (on behalf of Ohio DOT) – 2 years
All of the above agencies have indicated that they will deploy the RT3 in order to be able to reliably use
the “grip” data to more efficiently manage their winter maintenance process of staff, equipment and
product. They also plan to use this data to accurately inform the traveling public of dangerous road
conditions, improving metropolitan business efficiencies in the process.
It is notable that results from the Japanese government studies** of visual analysis of road conditions
compared to actual measured roadway slipperiness, showed incorrect evaluation by spreader operators,
up to 40% of the time.
Cost Savings:
Objective knowledge of road grip data through the use of the RT3 leads to more efficient use of:
• Staff
• Equipment wear and tear
• Fuel
• De-icing product
This in turn will reduce environmental damage to the minimum necessary to ensure safe road conditions.
It will also minimize damage to infrastructure, with potential long term cost savings.
Level of Service
Both Canada and Sweden are concerned about the performance measurement of their contractors and
are at present using the RT3 to measure grip levels to evaluate Level of Service. After the test at
Arjeplog, the Swedish government has decided that they are able reliably to use grip measurement for
this process.
Halliday Technologies Inc. 8525 Rausch Drive, Plain City, OH 43064 TEL: (614) 504-4150 www.hallidaytech.com FAX: (614) 873-3842
Winter Maintenance Performance Measurement Using Friction Testing Appendix F
F-132

Ohio DOT is concerned to improve consistency of Level of Service across the state. Currently they have
determined that there are wide variations in their winter maintenance process. They are also using the
RT3 in an initiative to produce a better result.
RT3 Models
The RT3 is made in 4 basic models currently: tow hitch right and left hand wheel mount and also under
truck right and left hand wheel mount. The RT3 is sufficiently rugged to be used on any snowplow type
vehicle and be continuously used during the operation of that vehicle during a winter event. The four
models use substantially the same components and differ with the mount frames being handed only.
The RT3 has been specifically designed for use on winter maintenance equipment with limited
maintenance required on the unit and uses a very simple interface with the operator to indicate slippery
roads.
The RT3 will soon be awarded FAA accreditation, having successfully tested at the Annual Friction
Workshop at Wallops Island in 2007. The airport RT3 model incorporates the standard RT3 right hand
mount tow hitch model with the addition of a water system and the inclusion of an accredited smooth
ASTM tire. We distinguish between measuring runway friction and roadway grip when we change
between this smooth tire and a treaded tire.
Like all effective friction testing equipment, the RT3 is designed to measure grip or friction when driven in
a straight line. The RT3 also incorporates a steering sensor, however, which allows the customer to
compensate for grip/friction data that is invalid when the vehicle is steered beyond a selected angle.
We have developed our own friction/grip scale. The scale is a number from 0 to 100 for grip (or 0 to 1 for
friction) which is a direct linear relationship to the side force acting between the tire and the surface.
There is no manipulation of the result other than for tread depth (when measuring grip). This method
eliminates the complications arising from additionally measuring the vertical forces and creating a mu
ratio (taking account of inertia affects etc).
A specific tread depth algorithm is imbedded in the software which allows the customer to use their tire of
choice, typically a treaded tire representative of a road tire in use in their country. We create this
algorithm, upon customer request, through comparative grip measurement testing on a single road
surface.
Maintenance of the RT3 is normally limited to unit cleaning, display update of tread depth, tire pressure
check and the greasing of five joints.
The RT3 has proven to be very reliable and provides repeatable data when comparing grip and friction
values. With regular maintenance, units have run well over 10,000 km per annum with no problems.
Unlike some friction/grip meters, the RT3 has extremely high resolution of grip/friction forces to the
display output. Because of this capacity, it allows the user to measure subtle changes in surface
Halliday Technologies Inc. 8525 Rausch Drive, Plain City, OH 43064 TEL: (614) 504-4150 www.hallidaytech.com FAX: (614) 873-3842
Winter Maintenance Performance Measurement Using Friction Testing Appendix F
F-133

grip/friction using a wide range of RT3 values. The values of grip measured by the RT3 align very well
with subjective judgment of surface slipperiness and in so doing uses a significant percentage of its total
available grip/friction range to demonstrate these differences (unlike some friction/grip meters). As an
example, the RT3 uses approximately 47% of its linear full range when measuring the differences
between packed snow and brushed ice compared to approximately 5% value difference for other meters
i.e. the RT3 has about 8 times the resolution of other meters (as determined at the Arjeplog Swedish
Road Administration test in 2008).
We are also currently close to completing our first AVL system that incorporates the readily available
technology used in cell phone PDA’s. When linked to our RT3, this PDA in the cab is capable of sending
vehicle position and road conditions simultaneously at intervals that are chosen by the customer. This
choice is readily configurable by the customer using the RT3 software loaded in the PDA.
As discussed, the RT3 has been thoroughly tested in terms of its durability, accuracy, repeatability and
usability and is ready to be used to actually help in establishing routines for cost saving on product and
equipment use and also in the notification of dangerous conditions to the traveling public, helping in the
process of reducing accidents and injury and decreasing the economic impact of traffic congestion.
The report from Lulea University for the Swedish Road Administration of four RT3 units and other
Scandinavian friction testing equipment should be made public within the next few weeks. As soon as I
receive this I will forward it on to you.
Regards Don
Cell: (614) 296 2503
** “Feasibility Study on Friction for Winter Road Management” TRB Indianapolis June 2008. Dr. R.
Tokunaga.
Tow Hitch RT3 - LH Under Snowplow RT3 - RH
Halliday Technologies Inc. 8525 Rausch Drive, Plain City, OH 43064 TEL: (614) 504-4150 www.hallidaytech.com FAX: (614) 873-3842
Winter Maintenance Performance Measurement Using Friction Testing Appendix F
F-134

IceChek continuous friction measuring equipment (Letter to Opus Hamilton) IceChek continuous friction measuring equipment (CFME) can play a major role in winter highway maintenance. The GPS friction recorder software receives electronic signals from a test wheel to provide the highest quality friction data. Road surface friction is one of the best indicators of the risk level of vehicle accidents making CFME one of the wisest equipment choices for winter highway maintenance. CFME can play an important part in acquiring information to dispatch snowplow/spreader trucks. The deployment of vehicles for ice control/anti-icing operations may be based upon objective and scientific road condition reports, not just a visual report. This additional tool in the toolbox for winter highway maintenance promises to help the contractors become pro-active as opposed to reactive. At the same time as helping to get the sand on the trouble-spots earlier, the CFME may also be used for Quality Control to monitor the condition of highways after abrasives and anti-icing chemicals are applied. You cannot drive a vehicle equipped with IceChek without asking yourself “How many lives could have been saved if this technology was adopted three or four years ago?” The reaction of many Canadian drivers when they see IceChek has been: “Why are we just hearing about this now for the first time? Why haven’t we heard about this before?” There is no easy explanation why this technology has been so long in coming. As the first Canadian company to manufacture CFME, IceChek believes that the recent developments in wireless communications and GPS will now make CFME viable to users who would otherwise remain unconvinced. Between 2003 and 2007, IceChek recorded friction as a friction versus time X-Y graph. The graphs were much better than any other company could produce at the time but they were useless for winter highway maintenance unless the driver used a voice recorder to record the odometer reading at regular intervals. It became obvious that we needed to acquire software to record friction versus distance and were finally able to do so in 2007. The use of GPS-stamped measurements together with scrolling graph software produced startling results. This software allows an inspection vehicle to record friction continuously over hundreds of kilometers and transmit the data file to a spreader vehicle. The spreader vehicle may then begin spreading sand at the same spot where the friction measurement dropped below the acceptance threshold. The spreader vehicle may also stop spreading sand at the same spot that the friction level returned to an acceptable level. Acquiring the advanced software provided IceChek with an added bonus, the ability to demonstrate repeatability to potential clients. Finally we were able to demonstrate to our clients that IceChek can measure with the same repeatability and precision as a decelerometer. To better understand the current situation in Canada and the efforts of IceChek and others to sell CFME products, let us examine three questions which go to the heart of the matter:
1. Does CFME have the potential to significantly reduce the rate of vehicle accidents either caused by or related to adhering-ice road conditions?
2. Does CFME have the potential to obtain better value from government expenditures on winter highway maintenance ice control programs?
3. Is IceChek’s technology practical after considering all the good points and bad points?
Winter Maintenance Performance Measurement Using Friction Testing Appendix F
F-135

IceChek has always regarded the measuring of road surface friction as a science with its own laws. Road friction measurements are repeatable when all variable parameters are either constant, or known. The best way to demonstrate this scientific predictability is to point out that stopping distance has been used for decades, and stopping distance charts have been used to get friction information at accident scenes and for numerous other uses. Stopping distance is the most common and accepted method of determining road surface friction. It is precise and it is also predictable if the variables such as tires and vehicle characteristics (ABS) are held constant. To get the results faster, the decelerometer (accelerometer), which measures G-force is a convenient way to measure friction without actually measuring stopping distance. The decelerometer has shown that road surface friction, even on various combinations of ice and snow, can be measured with scientifically predictable results. CFME should be considered seriously as a scientific measuring instrument. Let’s sum things up! First, road surface friction (or absence of road surface friction) is a very good indicator of risk level of accidents. Second, the spreading of abrasives and anti-icing chemicals is primarily conducted for the purpose of reducing the risk level of accidents by increasing the road friction. Third, road surface friction can be measured accurately in most conditions by decelerometers and other instruments. Fourth, decelerometers are already in use in other countries such as Finland as a method of maintaining a minimum level of friction on highways in winter. Therefore CFME should be a viable alternative to the use of decelerometers if the equipment can produce results that are at least as accurate as a top-of-the-line decelerometer. IceChek has begun using a Vericom decelerometer to verify the measurements of our equipment. The results of our testing showed that IceChek friction measuring equipment provides the same results as the decelerometer within a very close tolerance. The ratio between the decelerometer reading and the IceChek reading can turned into a conversion factor and then one instrument can be used to predict the results of the other instrument on any given surface. This finding has placed our equipment in a very competitive position. There is no longer any questionmark regarding the reliability of the data but there are still many problems requiring further research. Consistency of measurements over time is a major concern. An example of a “consistency over time” problem is the question of tread wear on the test tire. These questions will be addressed in my next communication to Opus Hamilton.
Winter Maintenance Performance Measurement Using Friction Testing Appendix F
F-136

Summary of friction testing program conducted over the winter of ’07-‘08 The following is summary of findings from testing performed by IceChek with the new friction- versus-distance graphing software which we call IceChek Friction Recorder: Positive findings:
- REPEATABLE RESULTS: Test runs were made by locating icy sections of Alberta highways with at least a few hundred yards of black ice or white ice. The friction recorder was turned on and a test run made over the section for a few kilometers. The driver then circled back and repeated the test over the same section of the highway while recording a friction-versus-distance graph. The graphs were later superimposed and compared to determine if the results of the first test were repeated in the second test. Comparing the graphs proved that the IceChek technique is repeatable to the highest standard. This repeatability can also be demonstrated when comparing graphs from two or more friction testing vehicles.
- TRAVELLING SPEED: On Highway 43, on February 17 there was an icy paved shoulder which had a one inch snow cover over adhering ice, and uniform friction in the range 0.3 -0.4 Mu over five kilometers. A test was performed by driving at various speeds on the paved shoulder to determine whether speed of the vehicle might affect results with one inch of snow cover. It was found that increasing or decreasing speed of the testing vehicle did not affect the value of the friction measurements.
Negative findings:
- CROSSWINDS: It was observed that high crosswind velocity can push the test wheel and distort measurements. This is a definite concern. It will be fairly obvious to the driver when it is happening because the vehicle will also be buffeted by the wind.
- CURVES: Some people have expressed concern about the fact that the equipment does not measure correctly on tight-radius curves. This phenomenon is well-known and applies to other manufacturers’ products as well. Approaches and exits cannot be tested accurately unless a means of correcting the measurements is added to the apparatus. IceChek has designed an attachment to eliminate the error on tight radius curves. This will be available in late 2008. 1
Other findings: - SNOW COVER: When the snow cover is more than one inch, or when the snow
is dense and wet, the friction measurements are affected. When friction testing in such conditions, watch for falling average values which may indicate a change from “wet snow over pavement” to “wet snow over adhering ice”. In these
Winter Maintenance Performance Measurement Using Friction Testing Appendix F
F-137

conditions, expand the x-axis or “range” on the display to display at least 10 kilometers. This will show the trend over time on the graph and alert the driver to the presence of ice.
- Maintaining calibration of a fleet The problem of maintaining uniform measurements, in other words, “calibration to a standard that does not change”, is a sizeable problem. Measurements must be the same from year-to-year, from province to province, and/or throughout a fleet of CFME-equipped vehicles. IceChek recommends that a decelerometer such as the Vericom be utilized to verify that CFME Mu measurements have not changed since leaving the factory or since being installed on a vehicle. The decelerometer is used to measure G-force when brakes are fully-applied. It is usually mounted in a vehicle equipped with ABS braking. The model of vehicle and tires on the vehicle should be consistent when using the decelerometer to verify CFME measurements. The decelerometer is one of the best reference methods (to verify the calibration of CFME) for icy conditions. The G-force measurements are very closely related to stopping distance, which is the best indicator of “danger” or “risk” on a slippery road. For icy conditions, or low values of Mu (μ) the decelerometer is an excellent choice as a reference standard. When verifying the calibration of CFME, it is important to compare readings with a reference at various levels of friction between Mu=0.2 to Mu=0.8 but it is critical to have maximum accuracy in the range where the critical decisions are made. Ask yourself “At what range of Mu do I need the maximum accuracy?” If you are responsible for making a decision to deploy a spreader vehicle to apply abrasives, the decision “to spread or not to spread” would be based on a specified level of friction. The specified level would probably be in the range between Mu=0.3 and Mu=0.5 therefore the CFME equipment would be calibrated using a reference that has been proven to be reliable in the range 0.3 to 0.5. Friction testers that work well on dry pavement with Mu over 0.5 are not necessarily accurate in the lower range of Mu. The best advice is to choose equipment to suit the job and choose your reference standard to suit the range of Mu where the critical decisions are going to be made. 1 IceChek does not have this problem with tight-radius curves when the test wheel is mounted under the truck near the rear axle but the IceChek Under-the-truck model has been discontinued temporarily while we focus on Behind-the-truck models.
Winter Maintenance Performance Measurement Using Friction Testing Appendix F
F-138

1
Icechek 1) How well does the equipment perform in terms of providing repeatable results on dry, bare pavement?
There is a significant difference between summertime testing and wintertime testing, because wintertime testing is performed almost exclusively for the purposes of detecting adhering ice, slush or hard pack snow posing a danger to traffic. It is also done to evaluate the extent of the danger, a “risk assessment”. The friction values of bare pavement cannot be used to predict the actual friction value at the moment of testing in any circumstance where the pavement is covered with foreign material such as ice. Adhering ice often completely coats the pavement and prevents contact between the rubber tire and the pavement. It is also very common to have a mixture of conditions in which tire contact with the pavement is inhibited. Summertime testing always involves bare pavement, free from foreign material. It is unlikely that a machine which provides optimum accuracy for one purpose, could also provide optimum accuracy for the other purpose. Icechek has not carried out the necessary trials to evaluate our equipment as a means of testing pavement in summertime. We are not focused on that market. The following comments will explain why we do not advertise our product for that type of testing. Wintertime testing is performed to monitor changes brought about by weather. Weather is largely unpredictable and therefore the road surface condition over hundreds of kilometers must be re-tested almost daily in many cases. Existing records of the highway are rapidly outdated and new friction measurements must be obtained. Summertime testing is very predictable; dry pavement exhibits one value of friction at any given location, while wet pavement exhibits another value. There is no need to test hundreds of kilometers daily to detect changes brought about by weather. Normally friction testing is performed only when a) there is no other way of getting the information and b) there is reason to suspect that a significant change in friction has occurred. “Significant” means that the change in friction would produce a change in the vehicle accident rate. In the summertime it would be rare for a significant change in friction to occur from day to day. Ultimately, the number of kilometers per month that are tested in any given state or province are the decisive factor in buying equipment. There are many machines available from other companies which will test accurately at slow speeds but the same machines are not competitive with Icechek for long distance testing. When Icechek performs testing in wintertime, we normally test hundreds of kilometers of any selected highway (not a representative sample consisting of a few kilometers). This could be described as 100% testing as opposed to “random sample” testing. For the most part, bare pavement testing in summertime does not necessitate daily testing of long distances. Testing of short distances at slower speeds to obtain a representative sample is quite often adequate. For this purpose there are many alternative makes and models of equipment that will do the job. Icechek is not offering its equipment for sale to be used mainly for bare pavement. Icechek has been developed to provide adequate accuracy throughout the full range of friction and to provide “More-Than-Adequate” accuracy in the lower values of Coefficient of Friction. Lives depend on our equipment, and for this reason it is calibrated to provide optimum accuracy, sensitivity and consistency in the lower end of the friction range in conditions that are encountered in below-freezing temperatures. This is also the reason that measurements are displayed and recorded as a numerical value and as a graph, measured at a minimum repetition rate of at least once per second.
Winter Maintenance Performance Measurement Using Friction Testing Appendix F
F-139

2
If a customer wants to use Icechek equipment mainly for bare, dry pavement it would be advisable to inform us when purchasing the equipment. We will then calibrate the Icechek software by comparing the measurements of Icechek against the reference standard on various pavement surfaces. Tire tread wear and air temperature (which affects hardness of the rubber) are variables which will affect the measurements and therefore must be taken into account. Tire tread wear-rate is greater on dry pavement and as the tire tread wears down, the contact surface area becomes greater causing measurement error. In snow and ice, the effect of tread wear on measurements is very complicated to predict because there are a number of factors at play. The area of the rubber in contact with the substrate is less important than the leading edge of the ribbing on the tire in wintertime road conditions. More study of this phenomenom is required but in the meantime, erroneous measurements caused by tread wear can be minimized by either a) using the same tire with a specified minimum tread depth when testing, or b) checking the accuracy of measurements at specified intervals. It is recommended that the Icechek tire be changed at intervals of 2000 kilometers when used on bare pavement, 5000 kilometers when used primarily on snow or ice. As you can see, if Icechek machines were used for testing bare pavement for short distances, tire tread wear would be negligible. Repeatable (consistent) readings would be virtually guaranteed between one Icechek machine and another Icechek machine. However we have never compared Icechek with “traditional” friction measuring methods, such as those recommended by ASTM standards. ASTM specifies a machine that essentially “drags” a tire. The tire bears a lot more weight than Icechek’s tire. Would the measurements be comparable if a correction factor were applied? That is a question that can only be answered by obtaining an ASTM device.
2) Other than Alberta Transportation, are there plans to conduct testing with the Icechek equipment anywhere else in Canada? or in the US?
The question is a fair question but I would prefer not to give away too much information at this time. As a promotion, Icechek will be friction-testing a route in northern Alberta on a regular basis throughout the winter of ’08-’09. We will distribute, free-of-charge, the X-Y line graphs on a daily basis to interested parties. This project will demonstrate the feasibility of using Icechek’s Friction Maintainer to schedule and dispatch snowplow/spreader vehicles. It will also promote our software, which features the X-Y graph of friction versus distance. In addition, it will demonstrate that the Icechek equipment is suitable for use on private and commercial light trucks and vans as well as government vehicles. In addition to the road testing that Icechek will carry out as a promotion, I am sure that there will be additional projects next winter however I cannot give you any specifics at this time.
Winter Maintenance Performance Measurement Using Friction Testing Appendix F
F-140

33) What is the cost of the device (capital cost, maintenance cost)? ICECHEK PRICES FOR THE 2008 Friction Maintainer (continuous friction measuring equipment with electrical and electronic hook-ups and computer software, computer not included) Small Truck Friction Maintainer $8900.00 CDN Mounts on Ford Ranger, Toyota Tacoma and other small trucks. When installing the Friction Maintainer, the rear bumper of a small truck is usually removed and replaced by a stronger custom-made bumper and support frame bolted to the truck frame. Light Truck Friction Maintainer $12500.00 CDN Mounts on Ford F150/F250, Dodge 1500/2500and GMC 1500/2500 and similar trucks or commercial vans. It is not necessary to remove the bumper to install the equipment on Full-size Light Trucks. MAINTENANCE COSTS Recurring maintenance costs are: 8” testing tire $50.00 each (basic tire and rim) 12” testing tire $95.00 each (basic tire and rim) Charge for installation of equipment on vehicle: Small truck In Alberta $800.00 Outside of Alberta $1400.00 plus shipping Full-size Light Truck In Alberta $1200.00 Outside of Alberta $1900.00 plus shipping
There is a one year warranty on all Icechek equipment covering equipment replacement costs. (Note: The Icechek “Black Ice Sensor” has been re-named the “Friction Maintainer”)
Winter Maintenance Performance Measurement Using Friction Testing Appendix F
F-141

What is a reasonable tolerance for friction measurements when CFME is to be used for winter highway maintenance?
(NOTE: The unit of measurement “Mu” is used in these comments to express general principles. Icechek currently displays friction as a value between 0.1 and 0.9. This corresponds roughly to Mu. Beginning in November 2008, we are going to develop an equivalency table to convert Icechek friction measurements to units of deceleration. The units of deceleration will be G-force as measured during a braking test. Once the conversion table has been completed, Icechek will be able to supply detailed information on the repeatability of Icechek equipment as tested at the factory level.)
Buyers of equipment need to evaluate the accuracy of their equipment but a major problem exists because “accuracy” or “repeatability” must be defined. Usually measuring equipment that could impact public safety is regulated by a written specification however this type of equipment has only recently been recognized in Canada. Repeatability means that a measurement is very close to previous measurements and therefore it can be safely predicted that future measurements will be reliable. In “continuous” friction measuring, individual measurements are averaged, or “smoothed”, before they are recorded. Therefore individual spurious measurements are ignored.
One way to compare equipment is to compare “bunches of readings” rather than individual readings. I am confident that Icechek will compare favourably either way but I recommend using “bunches of readings” in order to allow various makes of equipment to compete on an equal footing. This would be done by making a computed value based on all readings between Point A and Point B. Then the test would be repeated as many as ten times. The standard deviation of those ten computed values would be a measurement of repeatability. During operation of CFME, when the recorded friction readings are plotted on a line graph, there should be sharp changes in the line graph corresponding to sharp changes in friction. If the line graph looks like the Assiniboine River or the North Saskatchewan River, then it means that too much averaging or smoothing has been applied. “Assiniboine River equipment” will probably show repeatable measurements if the test sections are .5 kilometer or more. In order to screen out the “Assiniboine River equipment”, the distance between Point A and Point B must be limited to a fairly short distance. It is also important to specify the speed at which the test vehicle is to travel over the test section. Some equipment is only capable of testing at speeds below 80 kph.
On a surface covered with ice the difference between two tests conducted within a few minutes of each other would normally be less than .01 Mu but that is quite simple to achieve, even with the worst equipment available. On dry, bare pavement the range in the error will be up to .05 Mu. Icechek’s repeatability gets better as the value for Mu decreases. There is an exception to this statement. Whenever there is a mixture of conditions as opposed to uniform conditions, the repeatability will be unpredictable because moving slightly to the left or to the right from the previous track will alter the measurement significantly.
The challenge when comparing one friction-measuring product to another is to compare the equipment on roads with Mu greater than .25 and less than .5, in other words, compare the equipment in the conditions where it will be used to make “Go/No go” decisions. It is presumed that in the future, various provincial highways departments and their highway maintenance contractors will be making a decision to send a spreader truck after the Mu falls below a specified number somewhere between .3 and .45. (For a guide to friction indices, seethe other attachment).
Before we can set out a tolerance or acceptance criteria for CFME we must first agree upon a friction index and the type of equipment (i.e. decelerometer) that will be accepted as the “gospel”. All product manufacturers will be evaluated on a level playing field by comparing their product with the chosen standard. The standard could also be a slow-moving device that has a good reputation. Once those parameters of the test have been fixed, a stretch of road that has been chosen for the try-out would be tested using both the standard equipment and the equipment that is to be evaluated.
Let us assume that: 1) units of friction, 2) friction index, and 3) the specified make, model,
Winter Maintenance Performance Measurement Using Friction Testing Appendix F
F-142

velocity etc. of the reference standard have been specified. Then we will set out to specify acceptance criteria. The acceptance criteria would probably be stated as a plus/minus error or a standard deviation. The minimum number of test sections would be three representing low, intermediate, and high friction levels. The most critical zone of friction is the intermediate values. When the highway is bare, the danger level is low. When the highway is covered with ice it is assumed that the department of highways will send a sand spreader. The need for the sand spreader would be obvious. However in the in-between values, the question whether to send a sand spreader will be answered on the basis of CFME reports. The reports will help the highways supervisor to make “Go/No go” decisions. An example of this in-between zone would be hard-pack snow. For hard-pack snow, a repeatability tolerance of 1/15 of the measured value, when expressed as G-force, is recommended to allow the highway maintenance supervisor to make the necessary decisions within an acceptable margin of safety.
I believe that a tolerance of 1/15 of the measured value when expressed as G-force, is a high target to achieve but it is achievable. Icechek will aim for this level of repeatability. It is a pretty high standard compared to world standards for CFME four years ago. I observed results from other manufacturers four years ago that indicated that the repeatability would be less than 1/5 of the measured value.
Be careful when specifying units of measurement because units mean nothing if proportionality is not specified
The values of Mu and G-force are not proportional to each other therefore it is advisable to use G-force (deceleration) to specify plus/minus value for standard deviation in the acceptance criteria. The proportionality of the G-force measured on three surfaces with estimated friction of .25 Mu, .4 Mu, and .55 Mu will stay the same for tests conducted with different vehicles, whereas the proportionality of measurements obtained by friction-testing equipment could change depending on how the equipment was calibrated. In theory, an operator could go into the software program and change the proportionality. The purpose of setting acceptance criteria is to ensure that this doesn’t happen, hence the need to always use a trusted measurement such as stopping distance or deceleration to maintain the proportionality between readings at low, medium and high friction levels.
It is very easy to set up a table to monitor the proportionality of various devices to each other. Note that stopping distance increases inversely as Mu but deceleration increases as Mu increases. The following table shows where the measurement from Test Surface No. 2 would lie on an ascending scale between Test Surface No. 1 and Test Surface No. 3. This illustrates the importance of ensuring the proportionality across the range of friction.
A. TEST SURFACE NUMBER
B. G-FORCE DURING MAXIMUM BRAKING FROM 30 MPH
C. Mu measured by standard (reference) equipment as per spec
D. Mu measured by Icechek or other equipment competing for contract
E. MEASURED SKID MARK LENGTH AT 30 MPH
1 SMOOTH ICE
Note G-force and Mu increase as stopping distance decreases
As an example 0.2 Mu
600 FT
2 PACKED SNOW
As an example 0.4 Mu0.7-0.2=0.5 (range)0.2/0.5x100=40 %0.3/0.5x100=60%
100 FT600-60=540 (range)40/540x100=7.4%500/540x100=92.6%
3 BARE, DRY, TRAVELED PAVEMENT
As an example 0.7 Mu
60 FT
Winter Maintenance Performance Measurement Using Friction Testing Appendix F
F-143

0
20
40
60
80
100
Series1 0 0
Series2 7.4 40
Series3 100 100
1 2
In the above example, the intermediate value of friction occurs at 7.4% or 92.6% of the total range of friction when we use one method, Column E. It occurs at 40% or 60% of the total range of friction when we use another method, Column C. The proportionality between the three measurements is inconsistent from one method to another method. Therefore proportionality from year to year and from test to test when evaluating CFME friction measuring equipment is essential. For this reason deceleration in units of G-force or ft/sec² is highly recommended as the “common denominator” or index by which we evaluate friction equipment for accuracy and repeatability. We know that deceleration during maximum braking will retain its proportionality on three surfaces, from one year to the next, and from one test to the next. Yes, we know that the stopping distance varies from one ABS-equipped vehicle to another ABS-equipped vehicle, and also depends upon the tires, but the proportionality as defined above should remain unchanged.
Importance of limiting the length of the section to be tested during qualification of the contractor’s equipment
When performing an evaluation of CFME, the distance or length of each individual section tested should be no longer than about 0.25 kilometers or the length of a football field. In addition it is important to evaluate equipment on various surfaces with various friction values
Winter Maintenance Performance Measurement Using Friction Testing Appendix F
F-144

involving a range of conditions. Each “test section” must be tested at the same speed that the equipment will be travelling in service. By restricting the length of the test section, we make sure that the equipment responds to changes within a reasonable length of time. If you allow averaging of measurements during the test, you have to limit the length of the test section. The object of writing a specification with acceptance criteria is to “weed out” the CFME that does not have adequate sensitivity to sudden changes in friction. The friction could change drastically many times in one kilometer but those changes could be missed by “Brand X”. Brand X is no good for winter highway maintenance but it could perform very well if the length of the individual test sections is not limited to a distance less than one kilometer.
90KPH is 25 meters per second. At this speed, and at a sampling rate of one reading per second, 10 readings would be taken in 250 meters. A specified test distance of 250 meters would give all serious manufacturers an adequate distance to take several readings and do the internal computations that their software normally does. To determine the repeatability, multiple test runs over a specified test section would be performed, each test run resulting in a single reported measurement. The standard deviation of those reported measurements would determine if the equipment passes or fails. With the current Icechek software, we can provide the individual readings in Excel format so that the data can be analyzed in further detail if requested.
I am suggesting that a standard deviation of under 1/15 of the measurement, after conversion to units of G-force, be enforced because it permits adequate “danger recognition”. The driver can readily see a dangerous trend when the readings fall steadily by 1/15 of the screen height. This level of accuracy is required to provide maximum safety for the drivers of testing vehicles since those vehicles will be on the highways when the public is being warned to stay off the highways.
Once a manufacturer has demonstrated repeatability of the equipment being sold, it is assumed that the equipment will be easily calibrated to display the units of measurement and friction index as specified by the buyer. If the equipment meets the repeatability requirements, then adjusting the magnitude and proportionality of displayed measurements is an “electronics” and “software” issue. The mechanical design of the equipment is the deciding factor in repeatability. The magnitude of readings and proportionality of readings should be easily corrected in the software.
Repeatability is a decisive factor when using CFME for winter highway maintenance. There are other important qualities to look for in CFME such as “response time taken to display a change in friction” but that is not a significant factor if the data is being fed to a spreader truck. (A spreader truck is not going to start spreading and stop spreading every ten seconds).
Icechek has made a number of mechanical design modifications to de-sensitize the equipment in order to make the equipment more practical. We sacrifice “display response time” to get a more stable line graph. If we wanted to achieve a higher level of repeatability, we could de-sensitize the equipment even further. Of course we are trying to achieve an optimum balance between the two characteristics. We have found that the best product is one which provides adequate repeatability, adequate response time, and acceptable tire wear-rate.
Winter Maintenance Performance Measurement Using Friction Testing Appendix F
F-145

Winter Maintenance Performance Measurement Using Friction Testing Appendix F
F-146

Winter Maintenance Performance Measurement Using Friction Testing Appendix F
F-147

Winter Maintenance Performance Measurement Using Friction Testing Appendix F
F-148

Winter Maintenance Performance Measurement Using Friction Testing Appendix F
F-149

Winter Maintenance Performance Measurement Using Friction Testing Appendix F
F-150

Winter Maintenance Performance Measurement Using Friction Testing Appendix F
F-151

Winter Maintenance Performance Measurement Using Friction Testing Appendix F
F-152

Winter Maintenance Performance Measurement Using Friction Testing Appendix F
F-153

Winter Maintenance Performance Measurement Using Friction Testing Appendix F
F-154

Winter Maintenance Performance Measurement Using Friction Testing Appendix F
F-155

Winter Maintenance Performance Measurement Using Friction Testing Appendix F
F-156

Winter Maintenance Performance Measurement Using Friction Testing Appendix F
F-157

Winter Maintenance Performance Measurement Using Friction Testing Appendix F
F-158

Winter Maintenance Performance Measurement Using Friction Testing Appendix F
F-159

Winter Maintenance Performance Measurement Using Friction Testing Appendix F
F-160

Winter Maintenance Performance Measurement Using Friction Testing Appendix F
F-161

Winter Maintenance Performance Measurement Using Friction Testing Appendix F
F-162

Winter Maintenance Performance Measurement Using Friction Testing Appendix F
F-163

Winter Maintenance Performance Measurement Using Friction Testing Appendix F
F-164

Winter Maintenance Performance Measurement Using Friction Testing Appendix F
F-165

Winter Maintenance Performance Measurement Using Friction Testing Appendix F
F-166

Winter Maintenance Performance Measurement Using Friction Testing Appendix F
F-167

Winter Maintenance Performance Measurement Using Friction Testing Appendix F
F-168

Winter Maintenance Performance Measurement Using Friction Testing Appendix F
F-169

Winter Maintenance Performance Measurement Using Friction Testing Appendix F
F-170

Winter Maintenance Performance Measurement Using Friction Testing Appendix F
F-171

Winter Maintenance Performance Measurement Using Friction Testing Appendix F
F-172

Winter Maintenance Performance Measurement Using Friction Testing Appendix F
F-173

Winter Maintenance Performance Measurement Using Friction Testing Appendix F
F-174

Winter Maintenance Performance Measurement Using Friction Testing Appendix F
F-175

.
.
Related Documents