WINE QUALITY ANALYSIS ANKIT HALDAR ASHITHA VS DEBARNIK BISWAS KRISHNA BOLLOJULA

Welcome message from author
This document is posted to help you gain knowledge. Please leave a comment to let me know what you think about it! Share it to your friends and learn new things together.
Transcript

WINE QUALITYANALYSIS
ANKIT HALDARASHITHA VSDEBARNIK BISWASKRISHNA BOLLOJULA

AGENDA• OBJECTIVE• DATA DESCRIPTION• DATA ANALYSIS• INSIGHTS FROM ANALYSIS

OBJECTIVE• The dataset contains information about red
and white wine.• The dataset has 1000 data points of each
wine with 13 characteristics(attributes).• Wine quality is measured on 0(low)-
10(high) scale.• Management want
– To understand the characteristics of these wines.
– How different ingredients affect the quality.

DATA DESCRIPTION• The attributes are as follows
• fixed.acidity• volatile.acidity• citric.acid• residual.sugar• chlorides• free.sulfur.dioxide
• total.sulfur.dioxide
• density• pH• sulphates• alcohol• quality• wine_type

DATA ANALYSIS• To understand the characteristics of the
wine and find ingredients contributing more for quality, we have done the following– Subset the data based on wine type and find
descriptive statistics.– Subset the data based on good quality(7,8,9)
and bad quality(3,4,5,6) and find descriptive statistics.
– Decision tree.– Clustering the dataset.

DATA ANALYSIS• Subset the data based on wine type and find descriptive statistics.
• Subset the data based on good quality1(7,8,9) and bad quality0(3,4,5,6) and found descriptive statistics.

DATA ANALYSIS• Subset the data based on wine quality and find descriptive statistics.
• Volatile.acidity, citric.acid, chlorides are showing some pattern. Alcohol being the best.

DATA ANALYSIS• Decision tree
– Using rapid miner, we build a classification model to find the ingredients which are important for predicting red wine and white wine.
accuracy: 97.05% +/- 1.63% (mikro: 97.05%)
true Red Wine true White Wine class precision
pred. Red Wine 961 20 97.96%
pred. White Wine 39 980 96.17%
class recall 96.10% 98.00%
Ingredientschlorides
sulphatesfree.sulfur.dioxidevolatile.aciditytotal.sulfur.dioxide

DATA ANALYSIS• Decision tree
– Using rapid miner, we build a classification model to find the ingredients which are important for predicting the quality is high or low.
Ingredientscitric.acid
chloridesvolatile.aciditydensityalcohol
true 0 true 1 class precision
pred. 0 1431 183 88.66%pred. 1 211 175 45.34%class recall 87.15% 48.88%

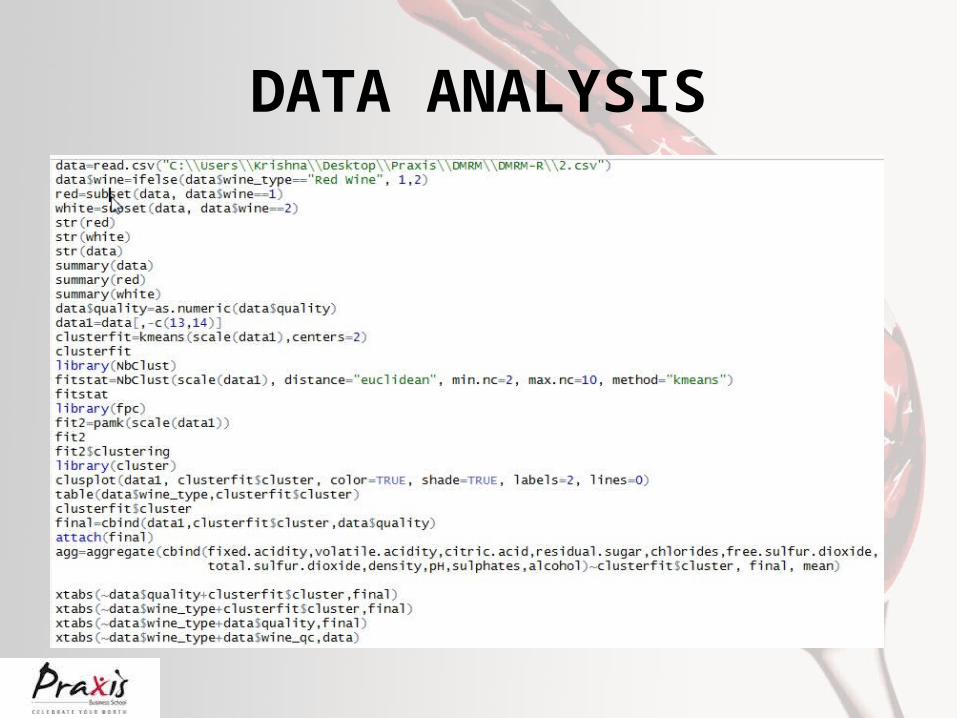
DATA ANALYSIS• Clustering(Code is on next slide)
• The cluster divides the whole data based on which wine it belongs.• We can see there is significant difference in all attributes.
DATA ANALYSIS

INSIGHTS FROM ANALYSIS
• Characteristics– Red wine or white wine– High or low quality
• Ingredients which contribute more for type of the wine.– Chlorides, sulphates, free.sulfur.dioxide, total
sulfur dioxide, volatile.acidity.• Ingredients which contribute more for
quality of the wine.– Alcohol(major), density.

Related Documents