DOT/FAA/DS-89/19 Windshear Case Study: Advanced System Design Service Denver, Colorado, Washington, D.C. 20591 July 11, 1988 N LD 0 N Herbert W. Schlekenmaer Flightcrew Systems Research Branch Federal Aviation Administration Washington, D.C. 20591 November 1989 Final Report This document is available to the public through the National Technical Information Service, Springfield, Virginia 22161. DTIC 2 1 ELECTE h ,-; APR16 T9900 U.S. Department of Transportation Federal Aviation Administration qO 04 13 159

Welcome message from author
This document is posted to help you gain knowledge. Please leave a comment to let me know what you think about it! Share it to your friends and learn new things together.
Transcript

DOT/FAA/DS-89/19 Windshear Case Study:Advanced System Design Service Denver, Colorado,Washington, D.C. 20591 July 11, 1988
N
LD
0N Herbert W. Schlekenmaer
Flightcrew Systems Research BranchFederal Aviation AdministrationWashington, D.C. 20591
November 1989
Final Report
This document is available to the publicthrough the National Technical InformationService, Springfield, Virginia 22161.
DTIC 21 ELECTE h
,-; APR16 T9900
U.S. Department of TransportationFederal Aviation Administration
qO 04 13 159

Technical Report Documentation Page
1. Report No. 2. Government Access,on No. 3. Recipent's Catalog No.
DOT/FAA/DS-89/19
4. Ttle and Subt,rile 5. Report Date
Windshear Case Study: November 1989
Denver, Colorado, July 11, 1988 6. Performing Organization Code
FAA/ADS-210
8. Performing Organzation Report No.
7. Author s
Herbert W. Schlickenmaier9. Performing Organization Name and Address 10. Workc Unit No. (TRAIS)
Flightcrew Systems Research Branch, ADS-210Federal Aviation Administration 11. Contract or Grant No.
800 Independence Avenue, S.W.Washington, D.C. 20591 13, Type of Report and Period Coered
12. Sponsoring Agency Name and Address Final Report
14. Sponsoring Agency Code
15. Suplementary Note This document contains reprints offive reports: 1. "Microburst Encounter, July 11,1988, Denver, Colorado, United Airines Flight Safety Investigation 88-46,February 9, 19; 2. Proctor, F.H., Bowles, R.L, 'Investigation of the Denver 11 July 1988 Microburst Storm with the Three-Dimensional NASA-Langley Windshear Model,' (Draft to beSubmitted as a NASA Report) July 26, 1989; 3. Coppenbarger, R.A., Wingrove, R.C., "Analysis of Records From Four Airliners in the Denver Micrc'burst, July 11, 1988," AIAA Paper 89-3354,August 14-18, 1989; 4. Campbell, S., Correspondence to Roland Bowies, dated 24 March 1989, containing velocity and shear values from FLOWS for July 11, 1988, at Denver StapletonAirport, and Isaminger, M. A., -WEEKLY SITE SUMMARY,- FL2 Radar Site, Denver, Colorado, both of MIT Lincoln Laboratory; 5. Elmore, K.L., Politovich, M.K., Sand, W.R., 'The 11 July 1988Microburst at Stapleton International Airport, Denver, Colorado,' National Center for Atmospheric Research, November 1989. These reprints are included with the explicit permissionof the authors to be used as substantiating data for this cue study,
16. AbstructOn Monday,"July 11, 1988, between 2207 and 2213 UTC (16:07-16:13 MDT), four successive United flights had
inadvertent encounters with microburst windshear conditions while on final approach to Denver Stapleton Airport,DBN _4 -'each resulting in a missed approach subsequent delay,,afid,'u'heventful arrival. A fifth flight executed a missed approachwithout encountering the phenomena. All of the flight crews were trained .tilizing the resources of the WindshearTraining Aid. There was no damage to aircraft and no passenger injuries. -", ", 1 -,
At the time the aircraft encountered the microburst, the Terminal Doppler Weather Radar (TDWR) QoperationsJeStand Experiment '(OT&E),was in progress and detected divergent flow that intersected the operating zones for theapproach runways. The radar used to test the TDWR algorithm was the Masachusetts Institute of Technology,LincolnLaboratory 10 cm Doppler radar. . - / .
This Windsher.. Case Study outlines the technical details of the encounter, as well as describes insights gained fromthis confrontation that should be applied to future investigations of aircraft encountering windshear. This studysummarize"-information from several sources includig-flight crew comments, air traffic control ',TC)-operations and
surveillance 'adar data, flight data recorders, data'from the TDWR and the Low-Level Wind Shear Alert System(LLWAS), technical details of the event meteorology, and data from the Terminal Area Simulation System (TASS).
- . •' - . 9
17. Key Words 18. Distribution Statement
aircraft safety; air traffic operations; windshear; This document is available to the public through themicroburst; flight data recorder; atmospheric modeling; National Technical Information Service, Springfield,windshear sensors; TDWR; LLWAS Virginia 22161.
19. Security Clossif. (of this report) 20. Security Classif. (of this page) 21. No. of Pages 22. Price
Unclassified Unclassified 552
Form DOT F 1700.7 (8-72) Reproduction of completed page authorized

PrologueDuring the first ten days following the July 11, 1988, windshear encounter at Denver,
Colorado, I was asked by the Federal Aviation Administration, the National Transportation SafetyBoard, other government agencies, and representatives of the industry to bring together thenecessary resources to examine and document that occurrence. The distribution of this reportcompletes that action.
The objective of this report is to record and evaluate all available data that related tothe performance of ground-based windshear detection systems, the flight crews and the aircraft toprovide a more thorough understanding of the windshear phenomena.
The opportunity presented by this occurrence allowed a complete review of all of ourpast and present research efforts regarding the Windshear Training Aid, hazard characterization,airborne warning systems, and the performance of the Terminal Doppler Weather Radar andLow-L.evel Wind Shear Alert System ground systems by a multi-agency/industry working group.
All parties to this review have provided complete and unrestricted openness andcooperation throughout this writing. The level of cooperation demonstrated could well set astandard for-t e resolutio of fu-tpre complex issues.
George C.HayFAA Windshear Progratn Manager
Aoa!39sion ?or'NTIS) GRA&IDTIC TABOfUnannounced QJustificatio
B_Ditstribut.of/
Availability CodeIAvail and/or
Dist~ Specialk

ForewordThe events reported in this case study indicate that on July 11, 1988, a severe microburst
occurred in Denver, Colorado. Mitigating the trivia of just another interesting meteorological eventare three facts. One, the microburst was unusual compared to other microbursts that have beenstudied. Secondly, five airliners' operations were affected by the event, and its detection. Finally,air traffic services at Stapleton International Airport were using an experimental radar that wasprovisionally commissioned for an operational test just 10 days earlier.
To the credit of the air traffic controllers and the flight crews of the airliners, therewas no loss of life, nor damage to property. However, the professionals involved also recognizedthe potentially lethal event that occurred and the need to document what transpired and todocument all aspects of it to the future as lessons learned. While no one made a mistake -- itwould be a mistake not to learn from the encounter.
The specialists have compiled invaluable bodies of knowledge based on the windshearthat occurred on July 11. Of particular note, the following individuals should be lauded for theirparticipation in developing this case study: Roland Bowles of the National Aeronautics and SpaceAdministration Langley Research Center; Steve Campbell and Mark Isaminger of MIT LincolnLab; Bob Ireland of United Airlines Flight Training Center; Bud Laynor of the NationalTransportation Safety Board, Bureau of Technology; Kim Elmore, Marcia Politovich and WayneSand, of the Research Applications Program at National Center for Atmospheric Research; FredProctor of MESO, Inc.; and Rod Wingrove and R.A. Coppenbarger of NASA Ames ResearchCenter.
This case study is the focus for thewc work.

CONTENTSpage
I SYN O PSIS . .................................................. 1
2 BACKGROUND .............................................. 32.1 Windshear-Related Activities Since 1985 ..................... 42.2 Preparation of this Case Study ............................. 5
3 FACTUAL MATERIAL ......................................... 93.1 General Sequence of Events .............................. 103.2 Radio Communications .................................. 113.3 Aircraft Flight Data Recorders ............................ 113.4 Meteorological Information ............................... 123.5 Ground-Based Sensors .................................. 133.6 Air Traffic Control Observations ........................... 153.7 Flight Crew Observatiors ................................ 16
4 AN ALY SIS .................................................. 194.1 G eneral . ............................................. 204.2 Meteorological Information ............................... 214.3 Hazard Analysis ....................................... 214.4 ARTS III Radar ....................................... 234.5 Flight Crew Analysis .................................... 234.6 Aircraft Wind Profile Reconstruction ........................ 244.7 Doppler Radar ........................................ 244.8 FLOWS/LLWAS Mesonet ............................... 254.9 Atmospheric Model Analysis .............................. 25
5 CONCLUSIONS .............................................. 275.1 Flight Operations ...................................... 285.2 Air Traffic Operations ................................... 295.3 Grot-nd Sensors ....................................... 295.4 Flight Data Recorder ................................... 305.5 Terminal Area Simulation System .......................... 30
6 RECOMMENDATIONS ......................................... 316.1 Interaction of Aircraft, Air Traffic, and Ground-Based Sensors ..... 326.2 The Case Study Process ................................. 33
7 REFERENCES ............................................... 35
8 SUBSTANTIATING DATA -- Appendices ........................... 39APPENDIX 1 -- United ReportAPPENDIX 2 -- NASA Langley ReportAPPENDIX 3 -- NASA Ames ReportAPPENDIX 4 -- MIT Lincoln Lab ReportAPPENDIX 5-- NCAR Report
i

CONTENTSpage
FiguresFigure 1 -- Relative locations of the Ground Stations during the TDWR OT&E ........ 13Figure 2 -- Four estimates of maximum F-Factor based on sensed data from the aircraft
flight data recorders, TDWR estimate (at 100 m elevation), the TASS model(at 280 m elevation), and the dual-Doppler radar analysis (at 690 melevation) ................................................... 22
TableTable I Compiled Sequence of Events ..................................... 20

1 SYNOPSISOn Monday, July 11, 1988, between 2207 and 2213 UTC (16:07-16:13 MDT), four
successive United flights had inadvertent encounters with microburst windshear conditions whileon final approach to Denver Stapleton Airport (DEN), each resulting in a missed approach,subsequent delay, and uneventful arrival. A fifth flight executed a missed approach withoutencountering the phenomena. All of the flight crews were trained utilizing the resources of theWindshear Training Aid. There was no damage to aircraft and no passenger injuries.
At the time the aircraft encountered the microburst, the Terminal Doppler WeatherRadar (TDWR) Operations Test and Experiment (OT&E) was in progress and detected divergentflow that intersected the operating zones for the approach runways. The radar used to test theTDWR algorithm was the Massachusetts Institute of Technology Lincoln Laboratory 10 cmDoppler radar.
This Windshear Case Study outlines the technical details of the encounter, as well asdescribes insights gained from this confrontation that should be applied to future investigations ofaircraft encountering windshear. This study summarizes information from several sourcesincluding flight crew comments, air traffic control (ATC) operations and surveillance radar data,flight data recorders, data from the TDWR and the Low-Level Wind Shear Alert System(LLWAS), technical details of the event meteorology, and data from the Terminal AreaSimulation System (TASS).

3
2 BACKGROUND

4 BACKGROUND
2.1 Windshear-Related Activities Since 1985
On August 2, 1985, Delta Airlines flight 191 crashed while on approach to Dallas-FortWorth Airport'.
On February 26, 1987, the Federal Aviation Administration accepted delivery of aWindshear Training Aid2. The Windshear Training Aid describes to flight crews the real threatthat windshear can pose. It counsels avoidance of hazardous windshear as the safest avenue forflight crews to follow. The Windshear Training Aid also described precautions for crews to useto improve their chances of escape. For inadvertent encounters, the crews were provided with aWindshear Recovery and Escape Maneuver to maximize their chances of surviving the encounter.
In June 1987, the Federal Aviation Administration published an "Integrated FAAWindshear Program Plan,"3 that described how the FAA planned to address the threat posed bywindshear. The plan addressed five areas: Training and Operating Procedures, Ground Sensors,Airborne Windshear Detection and Avoidance, Terminal Information Systems, and HazardCharacterization. The plan delineated an approach to provide incremental improvements to flightsafety. Some areas, like the Windshear Training Aid, could be implemented immediately to allflight crews.
The Ground Sensers program and Airborne Windshear Detection and Avoidanceprograms required thorough analysis, design and system integration. Some time would have topass before these aids would be available for the flight crews.
Flight crews would still have to make decisions on how to avoid windshear. As airborneand ground-based systems become fully functional, flight crews must continue to make their owndecisions for windshear avoidance. In the meantime, some important questions must beaddressed: What is the efficacy of the incremental improvements to the safety of the NationalAirspace System? How often are crews being exposed to this phenomenon?
Since June 1987, several aircraft have had encounters with low-altitude windshear. Themost significant encounter involved an aircraft on approach to Atlanta Hartsfield airport. Theaircraft was equipped with airborne windshear alerting equipment, and was being flown by a crewthat was trained for the avoidance and recovery procedures contained in the Windshear TrainingAid'. A report to an SAE meeting described the experience of a number of aircraft that wereequipped with certified airborne windshear alerting systems. Some of the aircraft encounteredwindshear. In all cases, available information concerning these encounters was shared within the
' "Delta Air Lines, Inc., Lockheed L-1011-385-1, N726DA Dallas/Fort Worth - International Airport, TexasAugust 2, 1985," Aircraft Accident Report, NTSB/AAR-86/05, National Transportation Safety Board, Washington,DC, August 15, 1986.
2 "Windshear Training Aid," Federal Aviation Administration, February 1987.
3 "Integrated FAA Windshear Program Plan," DOT/FAA/DL-,VS-,AT-88/1, Federal Aviation Administration,June 1987.
' Described by Mark E. Kirchner before the Subcommittee on Oversight and Investigations Committee onPublic Works and Transportation, Unhed States House of Representatives regarding Windshear, June 30, 1987.
5 Terry Zweifel, "Flight Experience with Wlndshear Detection," SAE Aerospace Control and GuidanceSystems Committee, Monterey, CA, March 9-11, 1988.

BACKGROUND 5
aviation community. To the credit of the industry, improvements were being planned based on
these experiences.
2.2 Preparation of this Case Study
On July 11, 1988, four United Airlines aircraft experienced inadvertent encounters withmicroburst-related windshears while approaching runways 26L and 26R at Denver StapletonInternational Airport. A fifth flight coordinated a maneuver with ATC to avoid the microburst.The Terminal Doppler Weather Radar Operations Test and Experiment was underway anddetected divergent flow that intersected the operating zones for the two runways. The flight crewswere all familiar with the Windshear Training Aid.
As a result of this event, technical specialists decided to collaborate and analyze thefacts that were available (based on the unique cooperation of organizations represented by theseexperts). These analyses provide detailed reports of the event from different operational andtechnical perspectives. The intent of this case study is to integrate the various reports. Therefore,this report not only describes the events that transpired on July 11, but also puts together areference document that describes the wealth of information that was reported by these technicalauthorities. This case study will also be the foundation for future investigations of windshearencounters.
A meeting took place in August 1988, to gather all of the technical specialists in oneplace and share the factual data as it existed. Teams were formed that specialized in atmosphericmodeling, flight data recorder, meteorological observation, ground sensor data recording, andoperational factors (both flight crew and air traffic).
One team was composed of elements of the FAA/NASA Airborne Windshear Detectionand Avoidance program. The objective of the Airborne Windshear Detection and Avoidanceprogram is to develop the system requirements for forward-looking windshear sensors for aircraft.The program is composed of three elements: hazard characterization, flight management, andsensor technology assessment. Of particular interest to this windshear case study is the applicationof results of the hazard characterization element. Two activities are applicable to this case study:quantifying the windshear hazard in terms of aircraft performance parameters; and the detailedinvestigation of a microburst at low-altitude.
Quantifying the windshear hazard resulted in a relationship of vertical and longitudinalwindshear terms known as the "F-Factor.'6 Although it was developed to be applied to airbornesystems, it can be applied to windshear investigations (when its effect on aircraft is of interest)to present a consistent comparison of sensed windshear data.
Investigations into the detailed low-altitude characteristics of the microburst resulted inthe development of the TASS'. The atmospheric model has been applied to previous windshearmicroburst cases. However, this case study is unusual in that this is the first time that the productsfrom flight data recorders, weather observations, and ground-based windshear sensors have been
6 Bowles, R.L., "Wind Shear 'Hit'," as presented to the "Wind Shear Detection, Forward-Looking SensorTechnology Conference," February 24 - 25, 1987, Hampton, Virginia; reference NASA CP 10004, DOT/FAA/PS-87/2, October 1987.
' Proctor, F.H., "The Terminal Area Simulation System, Volume I: Theoretical Formulation," NASA CR 4046,DOT/FAA/PM-86/50, I, April 1987.

6 BACKGROUND
available for comparison on a common time reference. These data provided further support forthe model's extensive validation'. With the abundance of recorded data available for this casestudy the TASS was used to manage and focus this effort. Once focused, a consistent data analysisresulted. The case study was simulated with TASS in August 1988, and presented in October1988. A report of the analysis was drafted in June 1989.
A second team member was United Airlines. United Airlines voluntarily initiated aFlight Safety Incident Investigation that incorporated a thorough operational evaluation (includingflight crew and air traffic issues). The results of that investigation were published in earlyFebruary 19890.
A third team focused on the plethora of ground-based data available through theTDWR OT&E. The National Center for Atmospheric Research contributed an extensive reporton the meteorology and ground-based data". The Massachusetts Institute of Technology LincolnLaboratories contributed a report on the operation of the Terminal Doppler Weather Radarduring the Operational Experiment'2" 3 . Some comparisons with TASS were also conducted as partof these analyses.
The National Transportation Safety Board (NTSB) voluntarily applied its expertise ininterpretation of ARTS III tapes and reducing the data from the flight data recorders for theaircraft that were involved in the windshear encounter. The NTSB data was supplied to all of theteam members for their analyses. The NASA Ames Research Center contributed their expertisein analyzing the flight data recorders and extracting and reconstructing the wind profiles".
After the initial meeting in August 1988, the next meeting of the technical specialiststook place in February, 1989. All of the technical teams exchanged their data and analyses, afterwhich focused data analyses ensued. By mid-May, draft reports of detailed analyses werecombined for use by this case study.
By July 1989, the technical team reviewed a working draft of this case study to ensure
8 Proctor, F.H., "The Terminal Area Simulation System, Volume II: Verification Cases," NASA CR 4047,DOT/FAA/PM-86/50, II, April 1987.
9 Proctor, F.H., Bowles, R.L., "Investigation of the Denver 11 July 1988 Microburst Storm with the Three-
Dimensional NASA-Langley Windshear Model," (Draft to be Submitted as a NASA Report) July 26, 1989.
10 "Microburst Encounter, July 11, 1988, Denver, Colorado," United Airlines Flight Safety Investigation 88-46,February 9, 1989.
" Elmore, K.L., Politovich, M.K., Sand, W.R., "The 11 July 1988 Microburst at Stapleton International Airport,Denver, Colorado," National Center for Atmospheric Research, November 1989.
12 Isaminger, M. A., "WEEKLY SITE SUMMARY," FL2 Radar Site, Denver, Colorado, MIT Lincoln Laboratory.
13 Campbell, S., Correspondence to Roland Bowles, dated 24 March 1989, containing velocity and shearvalues from FLOWS for July 11, 1988, at Denver Stapleton Airport, MIT Lincoln Laboratory.
14 Coppenbarger, R.A., Wingrove, R.C., "Analysis of Records From Four Airliners in the Denver Microburst,July 11, 1988," Proposed paper for the AIAA Atmospheric Flight Mechanics Conference, August 14-16, 1989,Boston, Massachusetts, AIAA Paper 89-3354, August 14-16, 1989.

7
BACKGROUND
that it reflected the technical reports. A final draft was circulated to the industry at the end of
that month.
The specialists have compiled invaluable bodies of knowledge based on the windshear
that occurred on July 11. This case study is the focus for their work.

F
3 FACTUAL MATERIAL

10 FACTUAL MATERIAL
3.1 General Sequence of Events
On Monday, July 11, 1988, between 2207 and 2213 UTC (16:07-16:13 MDT), foursuccessive United flights had inadvertent encounters with microburst windshear conditions whileon final approach to Denver Stapleton Airport (DEN), each resulting in a missed approach,subsequent delay, and uneventful arrival. A fifth flight executed a missed approach withoutencountering the phenomenon. There was no damage to aircraft and no passenger injuries wereincurred.
The five flights involved were (in approach sequence):
UA395 B-737-291A AUS/DEN (arriving from Austin)UA862 B-737-291A MLI/DEN (arriving from Moline, did not
encounter windshear)UA236 DC-8-71 SEA/DEN (arriving from Seattle)UA949 B-727-122 IAH/DEN (arriving from Houston)UA305 B-727-222A DSM/DEN (arriving from Des Moines)
All five flights were given vectors for an approach to runways 26L and 26R at Stapleton,and were in contact with DEN tower at the time of their respective windshear encounters and/ormissed approaches.
UA862 contacted DEN tower approximately two miles outside the ALTUR non-directional beacon (NDB), the final approach fix for runways 26L and 26R. The flight requesteda wind report for the airport. The tower gave UA862 clearance to land, and a Microburst Alertwith an expected windspeed loss of 40 knots, further characterized as "measured by machine, nopilot reports." The flight executed a missed approach, turning to the north. UA862 did notdescend below 8,000 feet above mean sea-leve! (MSL), and there is no evidence the flightencountered microburst activity.
UA395 contacted the tower inside ALTUR just before UA862 announced its missedapproach. It is noted that UA395 was, however, ahead of UA862 in sequence. Because ofrelative position, the crew of UA395 could not see UA862 but the captain recalls hearing anotherflight go around on the radio. The tower gave UA395 clearance to land and the same MicroburstAlert. The flight continued inbound on glidepath for 83 seconds before beginning to climb andnotifying the tower they were abandoning the approach. Radar data shows the flight descendedto less than 100 feet above ground level (AGL), or 250 feet below glidepath about one mile fromthe touchdown zone.
UA236 approached next, contacting the tower about 20 seconds after UA395 wentaround. Upon initial contact, UA236 was cleared to land and was given a Microburst Alert withan expected airspeed loss of 50 knots on two mile final. The tower did not report the previousmissed approaches. UA236 continued inbound for 77 seconds before announcing their missedapproach, just after reaching a minimum altitude of 5,800 feet MSL.
UA949 contacted the tower 10 seconds after UA236 announced a missed approach.The tower cautioned of wake turbulence behind the DC-8 going around, and delivered MicroburstAlert with an expected loss of 70 knots on three mile final. Clearance to land was not given.About 45 seconds later, the tower broadcast an undirected announcement of Microburst Alert, 80knots loss expected. The captain recalls a severe downdraft just after the 80 knot loss alert. Thewindshear recovery technique of 15 degrees pitch and full power was executed while going around.

FACTUAL MATERIAL 11
Stick shaker did not activate. The minimum altitude was about 6,200 feet MSL.
UA305 contacted the tower as UA949 was announcing its missed approach. TheMicroburst Alert of 80 knots loss was repeated. The crew requested confirmation of themagnitude which they received from the tower and two other airplanes. The crew discontinuedthe approach, and remained essentially level at 6,100 feet MSL for nearly 1 minute.
3.2 Radio Communications
ATIS messages X (2145 UTC), Y (2200 UTC), and A (2203 UTC) were included on thetower voice tape, and are transcribed in the United report (page 48 in Appendix 1). ATIS-Xobserves a 50°F difference between temperature and dew point, narrowing to a 40 degreedifference in ATIS-Y and ATIS-A. The large difference between temperature and dew point isan indication of possible microburst development"5 , and the narrowing is indicative of theapproaching rain. Windshear and Microburst Advisories appear in all three reports. ATIS-Anotes the development of a thunderstorm at the airport.
A time-based transcript of communications between Denver Tower and the five Unitedflights is contained in the United report' (pages 49-50 in Appendix 1). It is not known whichATIS message each flight had last monitored. All communications were clear and readable, andno crew members reported any malfunction of equipment. All radio messages used acceptedterminology. Specifically, tower reports pertaining to microburst windshear used standardphraseology. For example: "United 236 heavy, Denver tower. Microburst Alert, threshold windone four zero at five, expect a five zero knot loss, two mile final...." The "loss" refers to vectorwind magnitude along the expected flightpath, not airspeed loss per se. Airspeed loss is impossibleto predict with accuracy as it depends on just how the aircraft is flown, how power is modulated,and the distance over which the windspeed change occurs.
All five flights were given a "Microburst Alert" like that quoted above upon initialcontact with the tower. UA862, UA395, and UA236 were cleared to land at that time. UA862,although first to contact the tower, was in sequence behind UA395, as sections 3.1 and 3.6.1, 4.4describe.
None of the four flights encountering the event advised the tower of any reason fordeclaring missed approaches. Consequently, the tower did not give following crews any suchinformation.
3.3 Aircraft Flight Data Recorders
The flight data recorders (FDR) for all five aircraft were removed for data analysisafter the windshear encounters and sent to United Airlines' Operations Engineering (SFOEG).All flight recorders were foil medium units with four channels: altitude, airspeed, heading, and
'5*Windshear Training Aid," Federal Aviation Administration, February 1987.'6 This transcript was provided by United to aid in their analysis of the encounter. There was no formal
transcript as is typically provided by the FAA or NTSB In their accident or incident analyses.

12 FACTUAL MATERIAL
normal acceleration"' .
All recorders operated normally. The foil mediums were voluntarily sent to the NTSBfor analysis, and to the NASA Ames Research Center for detailed reconstruction of the windprofiles. Graphical data from the NTSB work is included in the United report (pages 56-60 inAppendix 1).
The recorder from UA862 confirms an early missed approach with no apparentabnormal airspeed or altitude fluctuations.
Data from UA395 shows airspeed oscillations during the windshear penetration of upto 9 knots per second. Typical magnitude of the oscillations was plus and minus 20 knots. Theminimum altitude was read out to be 5,341 feet MSL. The touchdown zone for runway 26L is at5,333 feet MSL. ARTS III radar confirmed an altitude of 20 to 70 feet AGL. While these figuresdisagree, the fact is the flight was at least 250 feet below the glideslope approximately one milefrom the touchdown zone.
UA236 was initially stable at approximately 160 knots. Airspeed rose in 20 seconds to202 knots (about 2.1 knots per second), then fell abruptly to 157 knots (3.5 knots per second),followed by a 27 knot rise at 6.75 knots per second, and a drop of 30 knots at 4.1 knots persecond. Minimum altitude was 5,800 feet MSL.
The recorder shows UA949 entered the shear area while stabilized at about 159 knots.Airspeed rose to 171 knots, then dropped 18 knots in three seconds. Subsequent oscillations ofplus or minus 20 knots per second occurred and normal accelerations ranged from 0.5 g to 1.3 g.Minimum altitude was recorded as 6,266 feet MSL.
UA305 was steadily bleeding airspeed during approach, reaching 170 knots as it enteredthe shear. Airspeed rose to 185 knots in 3 seconds (5 knots per second), followed by a 20 knotloss in 1.7 seconds (11.8 knots per second). Other oscillations occurred at rates higher than 10knots per second. Normal acceleration ranged from -0.19 g to 1.50 g. Minimum altitude recordedwas 6,280 feet MSL.
3.4 Meteorological Information
The United report (pages 19-27 of Appendix 1) contains a report by United Air LinesWeather Desk (OPBWX) analyzing the weather on July 11, 1988, for landings at Denver. A LowLevel Windshear (LLWS) alert was issued by OPBWX at 1516 UTC valid for 2100-0300 UTC andcovered the incident period.
Included in pages 28-46 of Appendix 1 are copies of pertinent portions of the WeatherBriefing Message (WBM) for each flight. In each case, the LLWS alert appears prominently atthe beginning of the WBM. Each contains the DEN terminal forecast of 1818 UTC calling for aslight chance of low clouds and thundershower development with gusts to 40 knots after2000 UTC.
" Since the analysis of thir encounter was voluntary, certain aircraft parameters (such as specific aircraftweight and balance, as well as moments of Inertia) are not available. Analyses conducted that are sensitive tothese parameters will be in error. No data has been presented in this report that Is affected by thoseparameters.

FACTUAL MATERIAL 13
A description of the meteorological conditions are contained in the NCAR report(pages 6-8 in Appendix 5).
3.5 Ground-Based Sensors
From July 1, 1988, through August 31, 1988, the TDWR OT&E was in progress. Theradar was active on July 11, 1988, at the time of the missed approaches and detected divergentflow that intersected the operating zones for the two runways. The Microburst Alerts which weretransmitted to each flight were generated by this system.
The radar used to test the TDWR algorithm was the Massachusetts Institute ofTechnology Lincoln Laboratory (MIT LL) 10 cm Doppler radar (identified as FL2). TheUniversity of North Dakota (UND) operated a 5 cm Doppler radar during the project. The radarwas located, about 11.3 nautical miles (nmi) north of FL2 and radar scans were coordinated toenable dual Doppler analysis.
2I0' I ' I I ,
20.0UND radar
0 0 0 0
0 0 ) 0-2 15.0
0 0 0
o 0 0t 00
10.0 ;• eo
0 0*. Stapleton runways
00
0
0FL2 radar
0.0 0 LLWAS stations 0 , r
0 FLOWS stations
-5.0 I I I I I
-30.0 -25.0 -20.0 -15.0 -10.0 -5.0 0.0
distance east of FL2 radar (km)
Figure 1 -- Relative locations of the Ground Stations during the TDWR OT&E

14 FACTUAL MATERIAL
The LLWAS is the commissioned facility at Denver Stapleton. During theTDWR OT&E the LLWAS was not displayed to the Air Traffic Service. However, the data wasrecorded. The FAA-Lincoln Laboratory Operational Weather System (FLOWS) mesonet was inplace and operating during the July 11, 1988, microburst. Combining the LLWAS and FLOWSmesonet provided surface wind detection coverage for a total of 42 sensor stations over a 6.5 x10.8 nmi area around the airport. LLWAS sends data to a central processor and display site every6 seconds; FLOWS data were available once per minute.
Figure 1 shows the relative location of FL2, the UND radar, the LLWAS stations and
the FLOWS stations.
3.5.1 Terminal Doppler Weather Radar
The working definition of a microburst for the TDWR OT&E was a 20 knot change inwindspeed over a path of 2.2 nmi or less. The radar used to test the TDWR algorithm was theMIT LL 10 cm Doppler radar (identified as FL2). The radar detects only wind components awayfrom and towards the radar. The TDWR algorithm seeks changes in air velocity along each beamwhich meet the microburst definition and then flags those segments of the beam; adjacentsegments are then mapped, a best-fit elliptical shape drawn around them, and the maximumchange in radar radial speed is recorded.
In early August, revisions were made to the TDWR microburst detection algorithm tocorrect a perceived over-warning problem. Changes in the windspeed differences and warningtimes resulting from these alterations are identified in the analysis section.
If the elliptical shape intersects the operating region for a particular runway, then theposition (in increments of I mile from the end of the runway) and the windspeed loss is sent tothe tower. The exact shape of the ellipse and its windspeed loss is sent to a Graphic SituationDisplay (GSD). Alerts are generated for events within one-half mile of the approach path, andwithin three miles of the runway (on approach) or within two miles of the runway (on takeoff).
The GSD diagrams are presented on monitors located in the tower, at the TRACONsupervisor's desk, and one other position. The actual display is in color. Microbursts appear asround or elliptical shapes with a number in the center indicating knots of wind differential acrossthe event. Precipitation echoes are irregular, and usually west of the airport in this series ofdiagrams. The first microburst to appear near runway 26 shows as 35 knots on the diagramlabeled as "TIME: 2206". A second microburst was just northwest of Buckley Air National GuardBase, outside the alerting area. As time progresses, the diagram shows up to three events overthe runway 26 complex and the approach path. The tower alert gives only the strongest event.
The NCAR report (contained within Appendix B of Appendix 5) contains a list ofalarms issued between 22:05 and 22:13 UTC on July 11, 1988, black and white prints of the GSD,and wind vector diagrams from Doppler radar measurements (contained within Appendix A ofAppendix 5).
The list of alarms appears in three columns corresponding to the displays in the tower.There are separate sets for the 35R/17L runway, the 35L/17R runway, and the 26/08 complex.The presentation is identical to that which appears on a cathode-ray tube (CRT) in front of thetower controller position for each runway. The list of alerts has been marked to emphasize thosealerts issued for the runway 26 approach corridor, confirming the alerts noted in the transcript.

FACTUAL MATERIAL 15
3.5.2 University of North Dakota Radar
The University of North Dakota (UND) operated a 5 cm Doppler radar during theproject. The radar was located about 11.3 nmi north of FL2 and radar scans were coordinated toenable dual Doppler analysis. This analysis provides a three-dimensional wind field; two-dimensional winds derived from this field in the airport vicinity are shown in Appendix D ofAppendix 5.
3.5.3 Low-Level Wind Shear Alert System
The LLWAS and the FLOWS mesonet were in place and operating during the July 11,1988, microburst. These provided surface wind detection coverage for a total of 42 sensor stationsover a 6.5 x 10.8 nmi area around the airport. LLWAS sends data to a central processor anddisplay site every 6 seconds; FLOWS data were available once per minute.
The NCAR report (contained within Appendix G of Appendix 5) shows windspeedfrom the 12 LLWAS stations and from the FL2 and UND radars. East-West windspeeds, U, andNorth-South windspeeds, V, components are shown for the 6-second LLWAS data in the twoupper plots. The lower plots show the radial wind components from each of the two radars, FL2and UND, with the 1-minute radar data from the gate nearest each LLWAS station, superimposedas asterisks.
3.5.4 Combined LLWAS/FLOWS Mesonet
Combining the LLWAS and FLOWS mesonet provided surface wind measurementcoverage for a total of 42 sensor stations over a 6.5 x 10.8 nmi area around the airport. Windvectors (pointing in the direction the wind is blowing toward) are shown in the NCAR report(contained within Appendix E of Appendix 5) for the times pertaining to the microburst. LLWASstations are labeled with "L," and FLOWS mesonet stations are labeled with "F." The plots arecentered at the centerpoint of the runways. The dotted areas indicate approximate areas formicrobursts causing divergence levels above threshold value at the approximate TDWR alarmlevel. The crossed areas indicate stronger divergence levels commensurate with the TDWRmicroburst alarm level. FLOWS station F13 was not operating correctly throughout the timeperiod.
3.5.5 Additional FLOWS Measurements
The NCAR report (con~tained within Appendix F of Appendix 5) shows the time seriesof temperature, relative humidity, average and maximum windspeed and wind direction (from trueNorth) for the FLOWS mesonet stations. (Station F30 was located at the FL2 radar.)
3.6 Air Traffic Control Observations
Two sets of observations were available. The Automated Radar Terminal System(ARTS 111) data that records aircraft position, identification and altitude. The aircraft altitudefrom ARTS Ill is periodically data-linked from every aircraft via Mode-C transmission from theaircraft. These data tapes were voluntarily provided by the FAA Air Traffic Service to the NTSB.The second set of observations were the Microburst Alarm messages that were displayed to thetower controllers to be sent to aircraft under their control.

16 FACTUAL MATERIAL
3.6.1 ARTS III Radar
One minute segment plots of ARTS III radar data are included in the United report(pages 84-89 in Appendix 1). The plots show the geographical position of each aircraft every5 seconds during the period 2207 through 2213 UTC. Altitude above mean sea-level is indicatedeach time it changed with resolution to the nearest 100 feet. Runway alignments are shown aswell as large crosses indicating the DEN VOR, ALTUR, and the radar installation. Towercommunication events are superimposed on the plots.
3.6.2 TDWR Microburst Alarm Message
See the NCAR report (contained within Appendix B of Appendix 5) for a list of theMicroburst Alarms issued between 2205 and 2213 UTC.
3.7 Flight Crew Observations
Flight crew observations in this report are based on the crews' training and their reportsafter the encounter.
3.7.1 Training
All crews received windshear training according to the Advanced Windshear TrainingProgram instituted by United beginning in 1984. United's program is substantially the same asthat of the FAA Windshear Training Aid which United personnel helped develop for the FAA.The Pilot Windshear Guide section of the FAA documentation was distributed to all United pilots,and a short test is conducted as a part of Annual Recurrent Training. A table of "MicroburstWindshear Probability Guidelines" from this document is included in the United report (page 62in Appendix 1).
According to bulletins which appear in the Adverse Weather section of each fleet'sFlight Manual, and backed by simulator training in conjunction with Annual Recurrent Training,pilots are trained to follow a "Model of Flight Crew Actions" prescribing a systematic approach todetection, avoidance, cautionary practices (called "Prevention"), and recovery from inadvertentencounters with wiidshear. An example of the bulletin is in the United report (pages 63-67 inAppendix 1).
In addition to the standard training described above, two Flight Manual bulletins wereissued for the summer of 1988 in all fleets. The first, a Summer Operations Bulletin (pages 68-75 of Appendix 1) reinforces the windshear training, particularly the Model of Flight CrewActions. The criteria for beginning a recovery procedure are restated as "uncontrolled changesfrom normal steady state flight in excess of:
* 15 knots indicated airspeed• 500 feet per minute vertical speed• 5 degrees pitch attitude• one dot displacement from the glideslope"
A second bulletin entitled "Denver Enhanced Low Level Windshear Alert System andTerminal Doppler Weather Radar Operational Demonstration" (pages 76-78 of Appendix 1)describes the TDWR program, its reliability, and the criteria for issuance of a "Microburst Alert."A statement of United policy towards these alerts is included which says, in part, "A FLIGHT

17FACTUAL MATERIAL
MUST NOT DEPART NOR CONDUCT AN APPROACH THROUGH AN AREA WHERE
A MICROBURST ALERT IS IN EFFECT."
3.7.2 Captains' Reports
Captains' Reports from each of the involved flights are included in the United report
(pages 108-112 in Appendix 1). In addition, available crew members from each flight were
interviewed at the United Training Center in Denver (DENTK), on July 22, 1988. Their
comments were recorded on videotape for further use in the production of safety and/or training
materials.

19
4 ANALYSIS

20 ANALYSIS
4.1 General
All data, including TASS modeling, TDWR measurements, crew statements, flightrecorders, and radar, substantiate the fact that microburst windshear conditions existed on the finalapproach path to runways 26L and 26R between 2206 and 2220 UTC on July 11, 1988. The samedata confirms that UA862 did not encounter significant windshear, while UA395, UA236, UA949,and UA305 did indeed fly directly through the microburst area.
Table I Compiled Sequence of Events
Time (UTC) Event name15:16:00 OPBWX issued LLWS alert for 2100-030018:00:00 TDWR OT&E On-Une21:19:00 Real-time reference for the start of the TASS model22:03:00 Microburst storm maximum strength exceeds F-Factor of 0.1022:05:56 LLWAS Alarm: First windshear alert, runway 26 Approach, 10 knots, on runway22:06:17 TDWR Alarm: 35 knots, 1 mile final22:07:00 Microburst storm maximum strength exceeds F-Factor of 0.1522:07:12 UA862 contacts DEN tower (first reference in United transcript)22:07:17 TDWR Alarm: 40 knots, 1 mile final22:07:31 UA395 contacts DEN tower22:07:55 UAS62 declares missed approach22:08:19 TDWR Alarm: 50 knots, 2 mile final22:08:35 UA395 exceeds F-Factor of 0.122:08:50 UA395 at 5400 feet MSL (100 feet AGL)22:08:51 UA395 peak F-Factor of 0.1222:08:53 UA395 exits F-Factor of 0.122:09:05 UA395 over the runway22:09:23 UA236 contacts DEN tower22:09:35 TDWR Alarm: 60 knots, 3 mile final22:10:21 UA236 exceeds F-Factor of 0.122:10:23 TDWR Alarm: 70 knots, 3 mile final22:10:30 UA236 stops descent at 5800 feet MSL (500 feet AGL)22:10:34 UA236 peak F-Factor of 0.1522:10:39 UA236 exits F-Factor of 0.122:10:40 UA236 announces missed approach22:10:42 LLWAS Alarm: First microburst alert, runway 26 Approach, 35 knots, 3 mile final22:10:50 UA949 contacts DEN tower22:11:04 UA236 over the runway22:11:17 TDWR Alarm: 80 knots, 3 mile final22:11:27 DEN Tower transmits 80 knots loss to all aircraft on frequency22:11:31 UA949 first exceeds F-Factor of 0.122:11:37 UA305 first contacts DEN tower22:11:40 UA949 declares missed approach22:11:44 UA949 first peak F-Factor of 0.1822:11:50 UA949 exits first 0.1 F-Factor22:12:10 UA305 announces missed approach22:12:17 UA305 first exceeds F-Factor of 0.122:12:24 TDWR Alarm: 80 knots, 3 mile final22:12:25 UA949 over the runway22:12:32 UA305 first peak F-Factor of 0.1622:12:36 UA305 exits from first F-Factor of 0.122:12:56 UA305 over the runway22:13:25 TDWR Alarm: 85 knots, 3 mile final22:16:00 Microburst storm maximum strength goes below F-Factor of 0.1522:18:00 Microburst storm maximum strength goes below F-Factor of 0.1001:00:06 TDWR OT&E Off-Une
Table I contains a listing of the events related to the microburst on July 11, 1988. TheTASS results were incorporated into this sequence of events using the following information:
The estimate of each of the aircraft's F-Factor along the respectiveflight path. This is provided in the NASA Langley report.Figure 22 of Appendix 2 shows the F-Factors as computed from

ANALYSIS 21
the TASS model winds.The correlation of time and distance provided by the NASA Amesreport. In particular, Figure 8 of Appendix 3 shows the correlationbetween the east-bound distance from the runway and time. Thedistance and times are correlated through the aircraft flight paths.
4.2 Meteorological Information
The major synoptic scale weather feature was a shallow pressure trough over thewestern United States, which was moving slowly eastward. This trough was not evident at levelsabove 700 mb. Westerly winds were present over Wyoming, Colorado, and Utah, which broughtwarm, moist air into the Denver area throughout the day. Also, two layers of higher windspeedsdeveloped; one centered near 10,800 feet MSL with winds from 295, and a layer of northwesterly20-30 knot winds above 22,600 feet MSL.
ATIS-X observed a 50F difference between temperature and dew point, narrowing toa 40 degree difference in ATIS-Y and ATIS-A. The large difference between temperature anddew point is an indication of possible microburst development, and the narrowing is indicative ofapproaching rain. Windshear and Microburst Advisories appeared in all three ATIS reports.ATIS-A notes the development of a thunderstorm at the airport.
A line of thunderstorms developed to the west of Stapleton and drifted southeastward.The microburst-producing storm originated from two 60+ dBz cell which formed around2130 UTC over the mountains 18.4 nmi west of Stapleton. Surface winds were from the north-northwest across the airport, temperatures were 88-90F across the FLOWS mesonet and the airwas fairly dry, with 22-25 percent relative humidity (see Appendix F of Appendix 5). Thestrongest outflow (which peaked at 80 knots) impacted operations along the east-west runways forapproximately 45 minutes. The outflow developed into a line that persisted across the southernperiphery of the airport.
4.3 Hazard Analysis
A primary threat of microbursts to aircraft is the single or combined effect of thehorizontal velocity shear and downdraft motion. Either of these effects can penalize theperformance of an aircraft, and possibly result in a critical loss of altitude for arriving or departingaircraft. A very useful parameter for indicating the severity of the windshear and vertical velocityon aircraft performance is the F-Factor" .
F = g' DU/Dt - w/V,
where DU/Dt is the rate of change of the horizontal wind component along the aircraft flightpath, g is the acceleration due to gravity, w is the vertical windspeed, and V, is the airspeed ofthe aircraft. The first term on the right side represents the contribution of windshear to theperformance of the aircraft, while the second term represents the contribution due to the verticalwind. Positive values of F indicate a performance-decreasing condition, whereas negative valuesindicate a performance-increasing situation.
'a Bowles, R.L, and Targ, R., "Wlndshear Detection and Avoidance: Airborne Systems Perspective,* 16thCongress of the ICAS, Jerusalem, Israel, 1988.

22 ANALYSIS
MAX. F - FACTOR COMPARISON0.25
0.20
eloome*lo
0.15
F "
0.10
0.05 AIRCRAFT FDR (WINGPOVE)TDWR ESTIMATE (ElevlCOm.)
.. ELMORE(Elevlg0m.)
NASA MODEL(PROCTOR,Efev 280m.)
0.00 , , ,
2204 2206 2208 2210 2212 2214 2216 2218TIME (UTC)
Figure 2 -- Four estimates of maximum F-Factor based on sensed data from the aircraft flight data recorders,TDWR estimate (at 100 m elevation), the TASS model (at 280 m elevation), and the dual-Doppler radar analysis(at 690 m elevation)
F-Factor can be approximated by:
F z g V6U/16R - w/V.
where ,U/6R is the horizontal velocity shear along the flight path, and V, is the aircraft's speedrelative to the microburst.
Four estimates of maximum F-Factor, shown in Figure 2, based on sensed data from theaircraft flight data recorders, TDWR estimate (at 328 feet AGL), the TASS model (at 919 feetAGL), and the dual-Dopp!er radar analysis (at 2,264 feet AGL) showed agreement. The severityof the microburst exceeding an F-Factor of 0.15, for example, started between 2206 and 2207 UTCand lasted until 2216 and 2217 UTC. For an F-Factor of 0.1, the microburst started at 2203 and2206 UTC and lasted beyond 2218 UTC. The peak maximum F-Factor is 0.25 for the encounter.

ANALYSIS 23
4.4 ARTS III Radar
ARTS III radar data are shown in the United Airlines report (pp. 84 - 89, Appendix 1).These are summarized as follows:
2207 to 2208 UTC: UA395 is shown approaching from the southeast and UA862 from thenortheast. UA862 enters the chart at 22:07:50 and declares a missed approach abeamALTUR. UA395 is ahead of UA862 and contacts the tower 1.3 miles inside ALTUR.
2208 to 2209 UTC: UA862 is shown turning to the north and staying above 8,000 feet, well clearof the approach profile. UA395 is shown continuing inbound on the localizer profileto runway 26L. Approximate MSL altitude of the glideslope beam is indicated bynumbers in parentheses. UA395 passed below the glidepath at 22:08:35. AT 22:08:50,the ARTS III measurement shows UA395 at 5,400 feet MSL, less than 100 feet AGL,or about 250 feet below the glidepath one mile from the touchdown zone. UA395maintains 5,400 feet MSL for the remainder of the period.
2209 to 2210 UTC: UA395 begins to climb and turn northward. UA236 enters the area, contactsthe tower just inside ALTUR. UA236 is approximately 200 feet below the glidepath.
2210 to 2211 UTC: UA236 continues inbound, staying 200 feet below the glidepath. The flightstops its steady descent at about 22:10:30, at 5,800 feet MSL. The altitudemeasurement remains 5,800 to 5,900 feet MSL for 45 seconds, during which a missedapproach is declared. UA949 enters the area on glidepath and contacts the tower onemile inside ALTUR.
2211 to 2212 UTC: UA236 begins climbing, regaining 6,000 feet MSL at midfield, and thereafterclimbing rapidly. UA949 continues inbound and is never below the glidepath. Aminimum altitude of 6,200 feet MSL is reached just as the missed approach is declared.UA305 enters the area six hundred feet below the glidepath at ALTUR. UA305intercepts the glidepath near the end of the period, approximately coincident with towercontact.
2212 to 2213 UTC: UA949 executes a missed approach to the south. UA305 continues onrunway heading, declaring a missed approach early in the period but with essentially noclimb for another 35 seconds. UA305 was at 6,200 to 6,300 feet MSL for about 50seconds altogether. The flight continues on approximately runway heading throughoutthe period.
4.5 Flight Crew Analysis
Each of the flight crews applied the Model of Flight Crew Action depending on theirlevel of information for each decision point. The Model of Flight Crew Action is listed below:
* Search for clues of windshear,* Avoidance of known windshear,• Use precautions (when avoidance is not chosen),* Use of standard operating techniques, and* Recovery from inadvertent encounters.
The crew of UA862 heard one of the first microburst message, and because of thewords "... microburst alert ...," the crew elected not to continue the approach. UA862 received the

24 ANALYSIS
message along with the "cleared to land," and the message that the windspeed loss was 40 knots.
The crew of UA395 noted (pages 109 and 110 of the United report, Appendix 1) that"... another aircraft said that they were going missed approach ......
The crew of UA949 said (page 111 of the United report, Appendix 1) that they wereaware of the possibility of windshear, and noted that they "... observed DC-8 execute a go-aroundand comment maybe it was because of windshear [and] took flaps [to] 250 [and heard toweradvise] 'microburst alert'."
The crew of UA305 said (pages 112 of the United report, Appendix 1) "... some aircraftahead of us were executing go-around's."
No pilots made reports to the tower, and this was contrary to United training. Thecrews seemed to be aware that aircraft were going around. However, the crews may not haverecognized the significance of the cumulative clues and the broadcast Microburst Alert. Thiscombined with the rapid sequence of events that occurred between contacting the tower, receivingthe microburst message, encountering the microburst, and executing a windshear escape andrecovery maneuver. The rapid dynamics of the encounter may conspire to reduce the overalleffectiveness of the pilot report in this particular encounter.
4.6 Aircraft Wind Profile Reconstructo,
A detailed analysis the wind profiles based on the flight data recorders is presented inthe NASA Ames report (Appendix 3).
4.7 Doppler Radar
The first detection of the microburst affecting the approach for runways 26L and 26Roccurred at 2206 UTC. Prior to this time, the radar measurements revealed several cells ofmoderate (less than 45 dBz) reflectivity to the northwest of the airport. These cells were growing,with strong updrafts that carried precipitation (presumably graupel) upward into the region ofstrong northwesterly winds. From there, the dual Doppler analyses clearly show that the graupelwas carried toward the airport. As it fell out of the updraft regions, it sublimated to produceintense local cooling. The strong downdraft which resulted originated at a level between 11,500and 12,000 feet MSL
The TDWR microburst alarm continued until 2248 (the revised alarm began at thesame time but ended at 2231). During first 6 min of alarm time, until 2212, the microburststrength as detected by TDWR grew from a windspeed difference of 35 knots to 80 knots (70knots in the revised version). The dual Doppler analyses indicate a maximum windspeeddifference of 68 knots, which makes it the strongest microburst (in terms of windspeed difference)yet analyzed using these techniques.
Additional microbursts developed to the west and northwest of the main feature, butwere not as intense. While the microbursts were present, outflow from the main part of the stormwhich was located to the northwest was encroaching on the airport vicinity. This low levelnorthwesterly flow appears to have distorted the flow patterns of these later-occurring microbursts.
By 2215 the storms from which the microbursts originated was clearly dissipating;downdrafts were present throughout most of the storm's volume and no new cells were observed.

ANALYSIS 25
The strong outflows continued for another 20-30 minutes. After 2220, the microburst parent celldissipated leaving behind only weak, low level divergence. The storm complex developed into aline and moved southeastward while additional outflow from new cells, weaker than that of themain microburst, triggered new convection to the southeast of the airport. As the line of new,although weak, cells moved further southeastward, it became indistinct and precipitation wasdetected by the radar over a more widespread area.
4.8 FLOWS/LLWAS Mesonet
Prior to the microburst occurrence, surface winds over the FLOWS and LLWASmesonets were generally light and variable. At around 2200, winds in the northwest part of thedomain were beginning to be affected by the outflow from the main storm cell; turning tonorthwesterly. As compared to the radar-measured winds, surface winds speeds were generallyhigher throughout the network. This is expected due to surface friction.
Prior to 2209 little evidence of the microburst was evident from the surfacemeasurements. However, between 2209 and 2210, the temperature at station F23, which was nearthe center of the main microburst (see Appendix F of Appendix 5) dropped 10.80 from 84.2 to73.4°F, and the windspeed increased from 14 to 30 knots. The relative humidity also increased,from 24 to 43 percent. During the previous minute, windspeed increased from 6 to 14 knots; thewinds apparently indicated outflow arrival prior to any temperature or humidity signatures.
From 2210 through 2220, considerable spatial and temporal variations in windspeek, itteapparent in the LLWAS. This is especially evident in those stations near the edge of themicroburst: Li, L2, L7 and L9. Data from these stations showed gustiness which was notresolved by the radar measurements; LLWAS data shows higher maximum microburst windspeedsthat those measured by the radars. LLWAS alarms during this time were sporadic and did notmaintain a constant strength (windspeed difference of 20 knots) as shown in Figure 11 ofAppendix 5.
Temperatures across the FLOWS mesonet slowly declined during the dissipation of thestorm. The main microburst actually affected only a few stations, F23, F22, and possibly F21. Therest of the mesonet was affected by multiple outflow centers, which did not produce the equivalentintense winds and temperature falls as did the main microburst. Temperatures decreased9 - 14.4°F while relative humidity increased by 8 - 21 percent over the mesonet as a result of themicroburst and storm outflow.
4.9 Atmospheric Model Analysis
An important aspect of this case study is the reconstruction of the atmosphere using anumerical model. The complete analysis is contained in the NASA Langley report (Appendix 2).The Terminal Area Simulation System model is a time-dependent, non-hydrostatic cloud modelwhich consists of 11 prognostic equations. The model has been applied extensively to the studyof microbursts, and has been successfully validated in five case studies of cumulonimbusconvection -- ranging from long-lasting supercell hailstorms to short-lived single-cell storms(including the 1985 Dallas-Fort Worth microburst storm).
The model indicates that there were multiple, low to moderate reflectivity microbursts.The strongest of the microbursts came from the anvil. The complete results from the modelanalysis can be found in the NASA Langley report (Appendix 2).

27
5 CONCLUSIONS

28 CONCLUSIONS
5.1 Flight Operations
5.1.1 An aircrew Flight Manual Handbook Bulletin was issued wherein a critical pilot proceduralrequirement was obscurely located.
United Flight Standards issued a 3-page aircrew Flight Manual Handbook Bulletinentitled "Denver ... LLWAS and ... TDWR Operational Demonstration" which appliedto Denver departures and arrivals only. The Bulletin described the TDWR system, therelated test program, and United's policy concerning actions to be taken by flight crewsduring TDWR Microburst Alerts. Within the Bulletin, a critical pilot proceduralrequirement which states "A FLIGHT MUST NOT DEPART NOR CONDUCT ANAPPROACH THROUGH AN AREA WHERE A MICROBURST ALERT IS INEFFECT' was obscurely located on page 3 of the Bulletin.
5.1.2 Reports of conditions favorable for the formation of low altitude windshear conditions wereavailable to all flights.
UA395, UA862, UA236, UA949, and UA305 were issued a Weather BriefingMessage prior to departure containing an alert section which forecast conditionsfavorable for the formation of low altitude windshear. Included were hourly weatherobservations which revealed temperature and dewpoint spreads of 35 and 39°F,conditions favorable for the formation of low altitude windshear.
5.1.3 UA862 received one of the first "... microburst alert ..." messages from the Tower, andelected to discontinue the approach because of the alert.
5.1.4 UA395, UA236, and UA949 were all issued landing clearances and a Microburst Alert.All three flights continued inbound, beginning missed approaches after encounteringsignificant altitude and airspeed performance problems.
At approximate 2-minute intervals, UA395, UA236, and UA949 contacted theTower from near ALTUR, and all were issued landing clearances and a MicroburstAlert with an expected windspeed loss of from 40 to 80 knots. All three flightscontinued inbound on the Instrument Landing System (ILS) glideslope for 83, 77, and44 seconds respectively following initial contact, beginning a missed approach only afterencountering significant altitude and airspeed performance problems.
5.1.5 UA305 initiated a missed approach after receiving the Microburst Alert and confirming thebroadcast windspeed loss.
UA305 contacted the Tower from near ALTUR approximately 2 minutes afterUA949 and slightly after UA949 announced a missed approach to the Tower. AMicroburst Alert was issued by the Tower with an expected windspeed loss of 80 knotson final approach. UA305 initiated a missed approach aftei the Alert and followingconfirmation of the broadcast windspeed loss.
5.1.6 Individual flight reaction varied from a standard go-around procedure to the use of thewindshear recovery procedure.
UA395, UA236, and UA949 reacted to actual microburst encounters by employingprocedures learned during the Advanced Windshear Training Program during initial and

CONCLUSIONS 29
recurrent flight training. Individual flight reaction varied from a standard go-aroundprocedure for UA395, UA862, UA236 to the use of the windshear recovery procedureby UA949 (maximum power and a 15' pitch-up attitude). UA305 reacted to theMicroburst Alert broadcast windspeed loss and initiated a missed approach afterconfirming the information.
5.1.7 UA305 descended to less than 100 feet AGL (250 feet below the glidepath) approximately
one mile from the touchdown zone.
5.2 Air Traffic Operations
5.2.1 All flights arrived in the Denver area during a period of time when ATIS broadcastscontained low altitude windshear advisories, microburst advisories, and a statement that aTDWR test was in progress.
5.2.2 Microburst Alert information was broadcast by the Tower to the flights as part of otherroutine landing communications and was not used as critical information by all involvedpilots.
UA862 was the first aircraft to contact Denver Tower from a position nearALTUR, the Final Approach Fix. The Tower responded by issuing a landing clearanceand a Microburst Alert. UA862 requested an alternate approach from Tower, andsubsequently executed a normal missed approach approximately 24 seconds laterwithout encountering microburst activity.
UA395, UA862, UA236, UA949, and UA305 executed what appeared to be go-around maneuvers while encountering microburst conditions.
5.2.3 None of the five flights advised the Tower of the reason for their missed approach;therefore, no pilot reports of windshear could be relayed to subsequent flights by the Tower.
5.3 Ground Sensors
5.3.1 The TDWR detected a microburst along the operating flight path and alarmed at2206 UTC.
Dual-Doppler analysis confirmed that the microburst's size and intensity asreported by TDWR were reasonably accurate. The good agreement with the TASSresults provide confidence that the inferences used in the radar analysis (see the NCARreport in Appendix 5) are realistic. Further analysis of TDWR data showed thatparameters are available within the TDWR to compute F-Factor to use for aircrafthazard determination.
5.3.2 An LL WAS windshear warning occurred at 2206 UTC and indicated a 10 knot windspeedloss on the runway.
5.3.3 The first LLWAS microburst alarm occurred at 2210:42, indicating a 35 knot windspeeddifference.
A review of LLWAS data (the NCAR report, Appendix 5) shows that an LLWASwindshear warning occurred at 2206 UTC. It indicated a 10 knot windspeed loss

30 CONCLUSIONS
located on the runway. The first LLWAS microburst alarm occurred at 2210:42,indicating a 35 knot windspeed difference. This was nearly 5 minutes after the TDWRalarm. There are two main reasons for this discrepancy. First, the radar detected themicroburst at 623 m above the ground, prior to its arrival at the surface. Second, theLLWAS network was not in an optimal location for detection of this event, which wassituated at the approach to the east-west runways. In fact, one of the LLWAS sensorswas located near the center of the microburst; winds there were never very strong. Sucha situation effectively removes that sensor from the network for this event. The rest ofthe sensors were to the west of the microburst. The westward progress of the microburstoutflow appears to have been somewhat impeded by the northwesterly outflow from themain part of the storm.
5.4 Flight Data Recorder
5.4.1 The wind pattern from the flight data recorder analysis agrees with the measurements fromthe Doppler radar and with the results from the TASS model.
5.4.2 Four-channel flight data recorders are able to provide reliable along-flight path windspeeddata when complemented with ground-based and analytical atmospheric model data.
The developing wind pattern from the flight data recorder analysis is in generalagreement with the measurements from the Doppler radar and with the analyticalresults from the numerical TASS model. The aircraft data complement these otherfindings by providing a detailed analysis of the internal velocity fluctuations. TheDoppler data was shown to not only validate the flight data, but also to add insight intothe resulting wind profiles by suggesting the presence of a secondary microburst cell.It is possible that the appearance of this second downburst caused the internalfluctuations in horizontal winds observed in the flight data of the latter three aircraft.
5.5 Terminal Area Simulation System
5.5.1 The multi-dimensional TASS give good quantitative comparisons with observations as wellas reconstructed data from Doppler radars and aircraft flight data recorders.
5.5.2 The TASS model is a useful tool in aircraft investigations, since it provides useful insightinto the storm and microburst structure, and can provide information which is not alwaysapparent from observed data.
The simulated storm is unusual in structure and produces multiple low-tomoderate-reflectivity microbursts. One of the microburst was unusually intense,containing st:ong downdrafts, outflow, and windshear; and driven by cooling primarilyfrom sublimating snow. F-Factors in the most intense microburst exceeded 0.2, evenbefore ground contact. This suggests that F-Factors also could be used as a precursorfor strong windshear at ground level. The TASS-simulated microburst outflow displaysa rough symmetry near the ground, becoming weaker and less symmetrical with altitudeabove 262 feet AGL. This suggests potential issues to be addressed for Doppler radaranalysis of such storms, if the radar beam is too broad, at too high of an elevation, orobstructed at low levels by significant ground clutter.

31
6 RECOMMENDATIONS

32 RECOMMENDATIONS
6.1 Interaction of Aircraft, Air Traffic, and Ground-Based Sensors
6.1.1 It is recommended that procedures be developed for the early, clear, and unambiguoustransfer of the microburst message.
Two points bear careful reexamination, and are: early receipt of microburstmessage and the context and format of the microburst message.
The first point regards the early receipt of microburst messages. UA862 receivedits microburst message early in its approach to landing. The early receipt of themessage coupled with the flight crew's windshear training, allowed the crew sufficienttime to make a decision to go-around and coordinate a maneuver with air traffic to missthe microburst. In this case, the early transfer from Approach Control to Towerfrecuency allowed the early receipt of the microburst message. If microburst messagesare being generated for transmission to flight crews, then aircraft that are under thejurisdiction of radar approach control should be considered as viable candidates toreceive terminal area microburst alert messages.
Attaining an unambiguous microburst message implies a coordination betweenair traffic and the affected flights. The reason for a microburst-related go-aroundshould be relayed back to air traffic from the flight crew. Subsequent flights receivingpilot reports are doubly alerted -- once by the detection technology on the ground andsecondly by the pilot report. This double-alert system emphasizes the severity of thesituation as strongly as is possible. All training and checking programs must stress theneed for timely pilot reporting of windshear and microburst encounters to ensure thisemphasis.
The second point regards the context and format of the microburst message.There was no incorrect or misleading information in the microburst messages that werepassed to the flight crews. The message format operated as intended. However, thecontext of the message in the final approach phase of the flight could have beenreinforced. There are two areas where this could have been effected. One is toprovide microburst messages earlier in the approach. The TDWR provides detectionof the microburst to a wider extent than the LLWAS system does (due to its physicallayout), and so may allow for microburst messages to be delivered by approach controlat airports that have TDWR's installed in them.
6.1.2 It is recommended that there should be a clear differentiation between windshear andmicroburst forecasts and real, detected alarms.
6.1.3 It is recommended that suitable methods for early dissemination of microburst messagesshould be established to ensure strategic coordination of air traffic to avoid microburstareas.
The ATIS message should not be considered a replacement for early disseminationof microburst messages. Its role is that of allowing the crew to assess the potentialwindshear threat along with other signs of windshear.
6.1.4 It is recommended that policies and methodologies should be established to communicatesafety-of-flight information to users operating with the National Airspace System.Differentiation must be made between general information and information related to

RECOMMENDATIONS 33
safety-of-flight matters.
6.1.5 It is recommended that an examination into the potential implications for windshear datacommunications should be pursued.
The three-phase process of terminal area windshear information exchange (sendinga microburst message to the aircraft, the flight crew's decision to execute a go-around,and the message back to air traffic that the reason for the go-around is the microburst)should be a candidate for automation. A research program that examines automationis technically feasible. The program should consist of three parts: 1. investigate thetransfer of ground-based information to the crew; 2. investigate the flight crew'sdecision making process based on integrating the ground-based data with airborneinformation; and 3. examine the automatic transfer of the flight crew's action to the airtraffic system.
6.2 The Case Study Process
6.2.1 It is recommended that the tools applied to this case study be applied to futureinvestigations of similar microburst encounters.
Surface wind sensor and Doppler radar data can be analyzed in conjunction withflight data recorder analyses to reconstruct wind profiles from each aircraft. Combiningthe flight data recorder analyses with TASS-model results, when reconfirmed withobserved wind fields, can provide further insight into the wind patterns traversed by theaircraft. The larger-scale atmospheric data and the flight path-derived wind profilesform an understanding of the atmosphere and its interaction with the aircraft that canprovide insight for safety briefings and further improvements to windshear systems.Since windshear interaction with aircraft are varied, these kinds of detailedreconstructions allow for further reinforcement of the elements of the model of flightcrew action, and insight into the operation of airborne and ground-based sensors andtheir respective operational issues.
6.2.2 It is recommended that standard investigation techniques can be augmented with theaddition of three teams that are responsible for: ground-based windshear data; airbornewindshear dat, and atmospheric modeling using TASS.
Standard investigative techniques should be maintained when microburst windshearencounters are suspected. Beyond that which is normally prepared for investigations,the following three teams should be organized:Ground-based Windshear Data Team: This team should document all sources of
ground-based windshear data (LLWAS- and TDWR-data, if available), includingbasic meteorology, surface wind measurements, and radar data.
Airborne Windshear Data Team: This team should document all sources of airbornewindshear data, including aircraft flight data recorder and data from airbornewindshear sensors (if available).
Atmospheric Modeling Team: The TASS should be run using data from a specialsounding near to the event. Timeliness and proximity must be carefully consideredwhen determining the appropriateness of available sounding data. The nearestNational Weather Service Rawinsonde Station should be notified to make arawinsonde launch within an hour of the event unless earlier, nearby sounding datais already available. Surface measurements from radars, wind sensors and

34 RECOMMENDATIONS
National Weather Service stations should be obtained to support the modelproducts. The TASS data should be used to focus data collections and analyses.

35
7 REFERENCES

36 REFERENCES
Bowles, R.L., "Wind Shear 'Hit'," as presented to the "Wind Shear Detection, Forward-LookingSensor Technology Conference," February 24 - 25, 1987, Hampton, Virginia; referenceNASA CP 10004, DOT/FAA/PS-87/2, October 1987.
Bowles, R.L., and Targ, R., "Windshear Detection and Avoidance: Airborne Systems Perspective,"16th Congress of the ICAS, Jerusalem, Israel, 1988.
Campbell, S., Correspondence to Roland Bowles, dated 24 March 1989, containing velocity andshear values from FLOWS for July 11, 1988, at Denver Stapleton Airport, MIT LincolnLaboratory.
Coppenbarger, R.A., Wingrove, R.C., "Analysis of Records From Four Airliners in the DenverMicroburst, July 11, 1988," AIAA paper 89-3354 for the Atmospheric Flight MechanicsConference, August 14-16, 1989, Boston, Massachusetts.
"Delta Air Lines, Inc., Lockheed L-1011-385-1, N726DA Dallas/Fort Worth - InternationalAirport, Texas August 2, 1985," Aircraft Accident Report, NTSB/AAR-86/05, NationalTransportation Safety Board, Washington, DC, August 15, 1986.
Elmore, K.L., Politovich, M.K., Sand, W.R., 'The 11 July 1988 Microburst at StapletonInternational Airport, Denver, Colorado," National Center for Atmospheric Research,November 1989.
Fujita, T.T., "DFW Microburst on August 2, 1985," University of Chicago, SMRP 217,January 1986.
Fujita, T.T., 'The Downburst: Microburst and Macroburst," University of Chicago, SMRP 210,February 1985.
"Integrated FAA Windshear Program Plan," DOT/FAA/DL-,VS-,AT-88/1, Federal AviationAdministration, June 1987.
Isaminger, M. A., "WEEKLY SITE SUMMARY," FL2 Radar Site, Denver, Colorado, MITLincoln Laboratory.
Kirchner, M., Statement of the Director of Engineering Technology, The Boeing CommercialAirplane Company, before the Subcommittee on Oversight and InvestigationsCommittee on Public Works and Transportation, United States House ofRepresentatives regarding Windshear, June 30, 1987.
"Microburst Encounter, July 11, 1988, Denver, Colorado," United Airlines Flight SafetyInvestigation 88-46, February 9, 1989.
Proctor, F.H., 'The Terminal Area Simulation System, Volume I: Theoretical Formulation,"NASA CR 4046, DOT/FAA/PM-86/50, I, April 1987.
Proctor, F.H., 'The Terminal Area Simulation System, Volume II: Verification Cases,"NASA CR 4047, DOT/FAA/PM-86/50, II, April 1987.
Proctor, F.H., Bowles, R.L., "Investigation of the Denver 11 July 1988 Microburst Storm with theThree-Dimensional NASA-Langley Windshear Model," (Draft to be Submitted as a

REFERENCES 37
NASA Report) July 26, 1989.
Turnbull, D., et al, 'The FAA Terminal Doppler Weather Radar (TDWR) Program," ThirdInternational Conference on the Aviation Weather System, 29 January - 3 February,1989, Anaheim, CA, American Meteorological Society. 414-419.
"Windshear Training Aid," Federal Aviation Administration, February 1987.
Zweifel, T., "Flight Experience with Windshear Detection," SAE Aerospace Control and GuidanceSystems Committee, Monterey, CA, March 9-11, 1988.

39
8 SUBSTANTIATING DATA -- Appendices

40 SUBSTANTIATING DATA -- Appendices
The appendices constitute the foundation for the case study. They are duplicated toprovide detailed information to the reader. The following reprints are included with the explicitpermission of the authors to be used as substantiating data for this case study:
1. "Microburst Encounter, July 11, 1988, Denver, Colorado," United AirlinesFlight Safety Investigation 88-46, February 9, 1989.
2. Proctor, F.H., Bowles, R.L., "Investigation of the Denver 11 July 1988Microburst Storm with the Three-Dimensional NASA-Langley WindshearModel," (Draft to be Submitted as a NASA Report) July 26, 1989.
3. Coppenbarger, R.A., Wingrove, R.C., "Analysis of Records From FourAirliners in the Denver Microburst, July 11, 1988," AIAA Paper 89-3354,August 14-16, 1989.
4. Campbell, S., Correspondence to Roland Bowles, dated 24 March 1989,containing velocity and shear values from FLOWS for July 11, 1988, atDenver Stapleton Airport, and Isaminger, M. A., "WEEKLY SITESUMMARY," FL2 Radar Site, Denver, Colorado, both of MIT LincolnLaboratory.
5. Elmore, K.L., Politovich, M.K., Sand, W.R., 'The 11 July 1988 Microburstat Stapleton International Airport, Denver, Colorado," National Center forAtmospheric Research, November 1989.

SUBSTANTIATING DATA -- Appendices
APPENDIX 1 -- United Report"Microburst Encounter, July 11, 1988, Denver, Colorado," United Airlines Right Safety
Investigation 88-46, February 9, 1989.

IUnITED AIRLiNES
Captain David A. SimmonDirector - Flight Safety
February 9, 1989
TO ALL RECIPIENTS:
Subject: United Airlines FlightSafety Investigation
SYNOPSIS
On July 11, 1988, at approximately 4:00PM MDT, foursuccessive United flights experienced inadvertent encounterswith microburst-related windshear while on final approach toDenver Stapleton Airport. A fifth flight executed a missedapproach without encountering the phenomena. There were noinjuries or damages to equipment. Worthy of note is thefact that a doppler radar microburst detection system wasoperational at the time and provided information to crewsconcerning the intensity of the observed activity.
The listed recommendations have been directed to various UAdepartments for action. These departments will contact theappropriate industry and government agencies for resolution.
This information is released for your use in the interestsof aircraft accident prevention and remedial action-and inthe spirit of FAR 831.11 (b).
Dave SimmonDirector of Flight Safety
Att.
P.O. Box 66100. Chicago, Illinois 60666

MANAGERS OF FLEET OPERATIONS EXOFS - Dave SimmonMANAGERS OF FLIGHT OPERATIONSEXOVF - Bill Cotton February 2, 1989OPBVV - John DansdillSFOEG - Bob DollEXOSW - Paul GreenEXOVF - Hart LangerDENTK - Ed MethotEXOFO - John O'KeefeSFOFS - Frank RoseEXCDD - Bob SmithDENTK - Bill Traub FLIGHT SAFETY INCIDENT
INVESTIGATION 88-46EXOPO - Jim Guyette
MANAGEMENT CONFIDENTIAL
Based on a thorough review of the attached Flight SafetyIncident Investigation, the following evaluation and actionassignments are provided:
SYNOPSIS
On July 11, 1988 at approximately 4:00 PM MDT, foursuccessive United flights experienced inadvertent encounterswith microburst-related windshear while on final approach toDenver Stapleton Airport. A fifth flight executed a missedapproach without encountering the phenomena. There were noinjuries or damages to equipment. Worthy of note is thefact that a test doppler radar microburst detection systemwas operational at the time and provided information tocrews concerning the intensity of the observed activity.
The Flight Center was tasked with investigating anddocumenting the event and that responsibility was carriedout by Bob Ireland whose final report is attached.
CONCLUSIONS
Flight Safety concurs with all findings and recommendationsand provides the following action assignments:
Recommendation 1: Action: DENTK/Traub; Due Date:3/31/89.
Recommendation 2: Action: DENTK/Traub; Due Date:3/31/89.
Recommendation 3: Action: EXODD/SMITH; Due Date:3/31/89.

-2-
Recommendation 4: Action: EXOVF/Cotton; Due Date:3/31/89.
Recommendation 5: Action: DENTK/Traub; Due Date:3/31/89.
Recommendation 6: Action: DENTK/Traub; Due Date:3/31/89.
Recommendation 7: Action: EXOVF/Cotton; Due Date:3/31/89.
Recommendation 8: Action: EXOVF/Cotton; Due Date:3/31/89.
Recommendation 9: Action: DENTK/Traub; Due Date:3/31/89.
Reviewed by: Released by:
Ed Marsey Dave Simmon
Flight Safety Investigator Director of Flight Safety
Atch.

EXOFS - Dave Simmon DENTK - Bob Ireland
January 27, 1989
FLIGHT SAFETY INCIDENTINVESTIGATION 88-46
FACTS
1. General:
On July 11, 1988, between 2207 and 2213 UTC (16:07-16:13 MDT), four successive United flights h-=dinadvertent encounters with microburst windshearconditions while on final approach to Denver StapletonAirport (DEN), each resulting in a missed approach,subsequent delay, and uneventful arrival. A fifthflight executed a missed approach without encounteringthe phenomena. There was no damage to aircraft and nopassenger injuries were incurred.
The five flights involved were (in approach sequence):
UA395 B-737-291A AUS/DENUA862 B-737-291A MLI/DEN (did not
encounter windshear)UA236 DC-8-71 SEA/DENUA949 B-727-122 IAH/DENUA305 B-727-222A DSM/DEN
All five flights were given vectors for an approach torunways 26L and 26R at Stapleton, and were in contactwith DEN tower at the time of their respectivewindshear encounters and/or missed approaches.
1.1 General Sequence of Events
Flight 862 contacted DEN tower approximately two milesoutside the ALTUR. NDB, the final approach fix forrunways 26L and 26R. The flight requested a windreport for the airport. The tower gave flight 862clearance to land, and a Microburst Alert with anexpected airspeed loss of 40 knots, furthercharacterized as "measured by machine, no pilotreports." The flight executed a missed approach,turning to the north. Flight 862 did not descend below8000 MSL, and there is no evidence the flightencountered microburst activity.
Flight 395 contacted the tower inside ALTUR just beforeflight 862 announced its missed approach. It is notedthat flight 395 was, however, ahead of flight 862 in

-2-
sequence. Because of relative position, the crew ofT'A395 could not see 862 but the captain recalls h-aringanother flight go around on the radio. The tower gaveflight 395 clearance to land and the same MicroburstAlert. The flight continued inbound on glidepath for83 seconds before beginning to climb and notifying thetower they were abandoning the approach. Radar datashows the flight descended to less than 100 feet AGL(250 feet below glidepath) about one mile from thetouchdown zone.
Flight 236 approached next, contacting the tower about20 seconds after UA395 went around. Upon initialcontact, flight 236 was cleared to land and was given aMicroburst Alert with expected airspeed loss of 50knots on two mile final. The tower did not report theprevious missed approaches. Flight 236 continuedinbound for 77 seconds before announcing their missedapproach, just after reaching a minimum altitude of5,800 MSL. Flight recorder data shows a slow rise inairspeed from 150 to 202 knots followed by a rapid lossback to 150 knots and subsequent oscillations. Theclimb out was normal.
Flight 949 contacted the tower 10 seconds after flight236 announced a missed approach. The tower cautionedof wake turbulence behind the DC-8 going around, anddelivered a Microburst Alert with an expected loss of70 knots on three mile final. Clearance to land wasnot given. About 45 seconds later, the tower broadcastan undirected announcement of Microburst Alert, 80knots loss expected. The captain recalls a severedowndraft just after the 80 knot loss alert. Thewindshear recovery technique of 15 degrees pitch andfull power was executed while going around. Airspeedrose from 150 to 171 knots, then oscillated sharply toa 130 knot minimum before recovering. Stick shaker didnot activate. Minimum altitude was about 6200 MSL.
Flight 305 contacted the tower as 949 was announcingits missed approach. The Microburst Alert of 80 knotsloss was repeated. The crew requested confirmation ofthe magnitude which they received from the tower andtwo other airplanes. Flight 305 began a missedapproach, but remained essentially level at 6,100 MSL,apparently unable to climb, for nearly one minute, atfull thrust before climbing.
2. Meteorological Data
Appendix 1 contains a report by OPBWX analyzing theweather on July 11, 1988 for landings at Denver. A LowLevel Windshear (LLWS) alert was issued by OPBWX at

-3-
1516 UTC valid from 2100-0300 UTC and covered theincident period.
Also included in Appendix 1 are copies of pertinentportions of the Weather Briefing Message (WBM) for eachflight. In each case, the LLWS alert appearsprominently at the beginning of the WBM. Each containsthe DEN terminal forecast of 1818 UTC calling for aslight chance of low clouds and thundershowerdevelopment with gusts to 40 knots after 2000 UTC.
Radio Communications
ATIS messages X (2145 UTC) , Y (2200 UTC) , and A (2203UTC) were included on the tower voice tape, and aretranscribed in Appendix 2. ATIS-X observes a 50 degreedifference between temperature and dew point, narrowingto a 40 degree difference in ATIS-Y and ATIS-A. Thelarge difference between temperature and dew point isan indication of possible microburst development, andthe narrowing is indicative of the approaching rain.Windshear and Microburst Advisories appear in all threereports. ATIS-A notes the development of athunderstorm at the airport.
A time-based transcript of communications betweenDenver Tower and the five United flights is containedin Appendix 2. It is not known which ATIS message eachflight had last monitored. All communications wereclear and readable, and no crewmembers reported anymalfunction of equipment. All radio messages usedaccepted terminology. Specifically, tower reportspertaining to microburst windshear used FAA/NCAR agreedphraseology. For example: "United 236 heavy, Denvertower. Microburst Alert, threshold wind one four zeroat five, expect a five zero knot loss two milefinal..." The "loss" refers to vector wind magnitudealong the expected flightpath, not airspeed loss perse, which is impossible to predict with accuracy as itdepends on just how the aircraft is flown and how poweris modulated.
All five flights were given a "Microburst Alert" likethat quoted above upon initial contact with the tower.Flights 862, 395, and 236 were cleared to land at thattime. Flight 862, although first to contact the tower,was in sequence behind flight 395, as sections 1.1 and6 describe.
None of the four flights encountering the event advisedthe tower of their reason(s) for declaring missedapproaches. Consequently, the tower did not givefollowing crews any such information.

-4-
4. Flight Data Recorders
The flight data recorders (FDR) for all five aircraftwere removed for data analysis after the windshearencounters and sent to SFOEG - Operations Engineering.All flight recorders were foil medium units with fourchannels: altitude, airspeed, heading, and normalacceleration.
All recorders operated normally. The foil r.diums weievoluntarily sent to the NTSB for further analysis.Graphical data from the NTSB work is included inAppendix 3.
The recorder from flight 862 confirms an early missedapproach with no apparent abnormal airspeed or altitudefluctuations.
Data from flight 395 shows airspeed oscillations duringthe windshear penetration of up to 9 knots/sec.Typical magnitude of the oscillations was plus an-minus 20 knots. The minimum altitude was read out tobe 5341 MSL. The touchdown zone for runway 26L is at5333 MSL. ARTS III radar confirmed an altitude of 20to 70 feet AGL. While these figures disagree, the factis the flight was at least 250 feet below theglideslope approximately one mile from the touchdownzone.
Flight 236 was initially stable at approximately 160knots. Airspeed rose in 20 seconds to 202 knots (about2.1 knots/sec), then fell abruptly to 157 knots (3.5knots/sec), followed by a 27 knot rise at 6.75knots/sec, and a drop of 30 knots at 4.1 knots/sec.Minimum altitude was 5800 ft. MSL.
The recorder shows flight 949 entered the shear areawhile stabilized at about 159 knots. Airspeed rose to171 knots, then dropped 18 knots in three seconds.Subsequent oscillations of plus or minus 20 knots persec. occurred and normal accelerations ranged from 0.55G's to 1.3 G's. Minimum altitude was recorded as 6266ft. MSL.
Flight 305 was steadily bleeding airspeed duringapproach, reaching 170 knots as it entered the shear.Airspeed rose to 185 knots in three seconds (5knots/sec.), followed by a 20 knot loss in 1.7 sec(11.8 knots/sec.). Other oscillations occurred atrates higher than 10 knots/sec. Normal accelerationranged from -0.19 G's to* 1.50 G's. Minimum altituderecorded was 6280 MSL.

-5-
5. Training
All involved crews received windshear trainingaccording to the Advanced Windshear Training Programinstituted by United beginning in 1984. United'sprogram is substantially the same as that of the FAAWindshear Training Aid which United personnel helpeddevelop for the FAA. The Pilot Windshear Guide sectionof the FAA documentation was distributed to all UApilots, and a short test is conducted as part of AnnualRecurrent Training. A table of "Microburst WindshearProbability Guidelines" from this document is includedin Appendix 4.
According to bulletins which appear in the AdverseWeather section of each fleet's Flight Manual, andbacked by simulator training in conjunction with AnnualRecurrent Training, pilots are trained to follow a"Model of Flight Crew Actions" prescribing a systematicapproach to detection, avoidance, cautionary practices(called "Prevention"), and recovery from inadvertentencounters with windshear. An example of th2 bulletinis in Appendix 4.
In addition to the standard training described above,two Flight Manual bulletins were issued for the summerof 1988 in all fleets. The first, a Summer OperationsBulletin (example in Appendix 4) reinforces thewindshear training, particularly the Model of FlightCrew Actions. The criteria for beginning a recoveryprocedure are restated as "uncontrolled changes fromnormal steady state flight in excess of:
- 15 knots indicated airspeed- 500 fpm vertical speed- 5 degrees pitch attitude- 1 dot displacement from the glideslope"
A second bulletin entitled "Denver Enhanced Low LevelWindshear Alert System and Terminal Doppler WeatherRadar Operational Demonstration" (example in Appendix4) describes the TDWR program, its reliability, and thecriteria for issuance of a "Microburst Alert." Astatement of UA policy towards these alerts is includedwhich says, in part, "A FLIGHT MUST NOT DEPART NORCONDUCT AN APPROACH THROUGH AN AREA WHERE A MICROBURSTALERT IS IN EFFECT."
6. ATC/ARTS III Radar
One minute segment plots of ARTS III radar data areincluded in Appendix 5. The plots show thegeographical position of each aircraft every fiveseconds during the period 22:07 through 22:13 UTC.

-6-
Altitude (MSL) is indicated each time it changed withresolution to the nearest 100 feet. Runway alignmentsare shown as well as large crosses indicating the DENVOR, ALTUR, and the radar installation. Towercommunication events are superimposed on the plots.
During the period 22:07 - 22:08, UA 395 is shownapproaching from the southeast and UA 862 from thenortheast. UA 862 enters the chart at 22:07:50 anddeclares a missed approach abeam ALTUR. UA 395 isahead of UA 862 and contacts tha tower 1.3 niles insideALTUR.
During the period 22:08 - 22:09, UA 862 is shownturning to the north and staying above 8000 ft., wellclear of the approach profile. UA 395 is showncontinuing inbound on the localizer profile to runway26L. Approximate MSL altitude of the glideslope beamis indicated by numbers in parentheses. UA 395 passedbelow the glidepath at 22:08:35. At 22:08:50, the ARTSIII measurement shows UA 395 at 5400 MSL, less than 100feet AGL, or about 250 feet below the glidepath onemile from the touchdown zone. UA 395 maintains 5400MSL for the remainder of the period.
During the period 22:09 - 22:10, UA 395 begins to climband turn niorthward. UA 236 enters the area, contactsthe tower just inside ALTUR. UA 236 is approximately200 feet below the glidepath.
During the period 22:10 - 22:11, UA 236 continuesinbound, staying 200 feet below the glidepath. Theflight stops its steady descent at about 22:10:30, at5800 MSL. The altitude measurement remains 5800 - 5900MSL for 45 seconds, during which a missed approach isdeclared. UA 949 enters the area on glidepath andcontacts the tower one mile inside ALTUR.
During the period 22:11 - 22:12, UA 236 beginsclimbing, regaining 6000 MSL at midfield, andthereafter climbing rapidly. UA 949 continues inboundand is never below the glidepath. A minimum altitudeof 6200 MSL is reached just as the missed approach isdeclared. UA 305 enters the area six hundred feetbelow the glidepath at ALTUR. UA 305 climbs to meetthe glidepath near the end of the period, approximatelycoincident with tower contact.
During the period 22:12 - 22:13, UA 949 executes amissed approach to the south. UA 305 continues onrunway heading, declaring a missed approach early inthe period but with essentially no climb for another 35seconds. UA 305 was at 6200-6300 MSL for about 50

- 7 -
seconds altogether. The flight continues onapproximately runway heading throughout the period.
7. National Center for Atmospheric Research Experiment
During the period from July 1 through August 31, 1988,a demonstration of Terminal Doppler Weather Radar wasin progress at Denver. The radar was active on July 11at the time of the missed approaches. MicroburstAlerts transmitted to each flight were generated bythis system. Alerts are generated for events withinone-half mile of the approach path, and within threemiles of the runway (on approach) or within two milesof the runway (on takeoff).
Appendix 6 contains a list of alarms issued between22:05 and 22:13 UTC on July 11, 1988, black and whiteprints of the Geographic Situation Display (GSD), andwind vector diagrams from Doppler radar measurements.
The list of alarms appears in three columnscorresponding to the displays in the tower. There areseparate sets for the 35R/17L runway, the 35L/17Rrunway, and the 26/08 complex. The presentation isidentical to that which appears on a CRT in front ofthe tower controller position for each runway. Thelist of alerts has been marked to emphasize thosealerts issued for the runway 26 approach corridor,confirming the alerts noted in the transcript.
The GSD diagrams show the display available at onelocation in the tower and at the TRACON supervisor'sdesk. The actual display is in color. Microburstsappear as round or "band-aid" shapes with a number inthe center indicating knots of wind differential acrossthe event. Precipitation echoes are irregular, andusually west of the airport in this series of diagrams.The first microburst to appear near runway 26 shows as35 knots on the diagram labeled as "TIME: 2206". Asecond microburst was just northwest of Buckley ANGB,outside the alerting area. As time progresses, thediagram shows up to three events over the runway 26complex and the approach path. The tower alert givesonly the strongest event.
The "dual Doppler" diagrams give a visualization of thewind patterns derived by two radar facilitiessimultaneously. The Stapleton runways are at thecenter. The plots, at about one minute intervals, havearrows indicating local wind direction, with strengthgiven by arrow length. During the period, a largeevent forms on the approach path somewhat elongatedtangentially.

NCAR scientists noted the elongated pattern of theevent(s) was unusual in that most would line upnorth/south rather than east/west as seen here. Bylining up east/west the airspeed loss effects werereduced since penetration time was lengthened. Had theaircraft penetrated the event along its minor axis,greater airspeed fluctuations would have been expected.
Crew Statements
Captain's Reports from eacn of the involved flights areincluded in Appendix 7. In addition, availablecrewmembers from each flight were interviewed at DENTKon July 22, 1988. Their comments were videotaperecorded for further use in the production of safetyand/or training materials.
ANALYSIS
All data, including TDWR measurements, crew statements,flight recorders, and radar, substantiate the fact thatMicroburst windshear conditions existed on the finalapproach path to runways 26L and 26R between 2206 and 2220UTC on July 11, 1988. The same data confirms that flight0G2 did not encounter significant windshear, while flights395, 236, 949, and 305 did indeed fly directly through themicroburst area.
Further analysis of events leading 1- the four encounterswith windshear and the one successful avoidance will followthe Model of Flight Crew Actions.
1. Search For Clues of Windshear
The following information was provided to the crews:
- Weather briefing message with LLWS alert andforecast of conditions at DEN conducive tomicroburst development.
- ATIS report of "windshear advisory and microburstadvisory." Windshear advisories are effectiveduring the period of windshear alerts and for 20minutes afterward. Microburst advisories are ineffect during a period of microburst alert and fortwo hours afterward. ATIS also reported atemperature/dew point spread of 30-40 degrees, awell-known clue of possible windshear.

-9-
Microburst Alert messages were issued by thetower, indicating a divergent flow exceeding 20knots differential within one half mile of thefinal approach path. NCAR subsequently changedthis criteria to 30 knots after the events of thisreport.
In ada-ion, crews reported observing:
- Radar echoes of precipitation over/near 'heairport.
- Convective weather development near the airport.
- Virga or rainfall near the runway.
- Moderate to severe turbulence.
Of the available clues, clearly the strongest is theTD;,R-produced Microburst Alert. This single clue meansdivergent conditions ARE PRESENT at the locationdetected, with the severity reported, lacking only areport of the altitude of maximum divergence. TheMicroburst Alert is also treated in a Flight ManualBulletin as a matter of policy requiring immediatetermination of approach.
The other clues are all medium or low probabilityindicators according to the table on page 36 of the FAAkilot Windshear Guide (see Appendix 4).
2. Avoidance of Known Windshear
Crews are required at this point to make a decisionbased on the available clues. The FAA Pilot WindshearGuide suggests the clues are cumulative. On thisbasis, avoidance should have been chosen in all cases.
The crew of flight 862 recognized the significance ofthe Microburst Alert. This single item caused them toinitiate a missed approach. In their interview, thecrew also indicated their concern based on the otherclues.
The crew of flight 305 also began an avoidance maneuverbefore their encounter according to voice tapes, radardata, and crew interviews. Their decision was based onthe Microburst Alert calling for an 80 knot loss. Inthe crew interview, however, the captain was clear instating they understood this to be a pilot report. Thewords "Microburst Alert" were either not heard or notunderstood in terms of policy.

- 10 -
It is clear that the crews of flights 395, 236, 949,and 305 either did not hear clearly or did not know themeaning of the term Microburst Alert. None of thesecrews took action based on hearing this alert, knowingits source (TDWR) and policy implication. Based on thetime period between tower broadcast of Microburst Alertand the missed approaches, it is concluded the go-arounds of flights 395, 236, and 949 were not based onthe tower report, but rather on conditions encountered.The crews for flights 395, 236, and 949 could notrecall that they ever heard "Microbars. Ale:t" _fninitial contact with the tower. The crews of flights395 and 236 did recall their clearance to land from thesane transmission. The captain of flight 949 did hearthe Microburst Alert which was broadcast as an isolatedtower transmission later in his approach. One captainreported that he had not read the associated FlightManual Bulletin until sometime after the events of July1i.
Use Precautions (When Avoidance is Not Chosen)
The four crews which encountered the microburst allindicated they had seen some clues and discussed theirsignificance. The crews of flights 395, 236, and 949took specific cautionary actions to increase theircapability to penetrate an inadvertent encounter withwindshear. All flights deliberately held extraairspeed of 10-15 knots. Flight 949 purposely wasflown high on the glidepath in a belief that a steeperglidepath might be helpful. It is noted that this isnot an appropriate precaution. While extra altitudenay be good, the higher descent rates necessary couldbe quite detrimental.
Use of Standard Operating Techniques
Aside from the precautions noted above, all crewsappear to have used standard techniques during theirapproaches and missed approaches. This fact, asintended, aided in the early recognition ofinadvertently encountered windshear.
Recovery From Inadvertent Encounters
All flights added thrust. Crews from flights 395 and949 indicated they moved the throttles full forward.Others used only go-around power with which they weresatisfied.
All flights raised their pitch attitudes as opposed tochasing airspeed in the decreasing performance part ofthe windshear. The crew of flight 236 initiallylowered the nose during the increasing performance

- 11 -
segment prior to their decision to go around. Only thecrew of flight 949 reported specific use of 15 degreesduring the go around, and training materials docurrently state "towards 15 degrees."
During the recovery phase, flight 395 had a minimumaltitude much closer to the ground than the crewthought. Flight recorder data confirms that additionalairspeed was available to trade.
Contrary to training, NO crew made a pilot report tothe tower about the windshear conditions encountered.
CONCLUSIONS
Finding 1: Flight Standards issued a 3-page aircrew FlightManual Handbook Bulletin entitled "Denver Low LevelWindshear Alert System (LLWAS) and Terminal DopplerWeather Radar (TDWR) Operational Demonstration" whichapplied to Denver departures and arrivals only. TheBulletin dezcribed the TDWR system, the related testprogram, and United's policy concerning actions to betaken by flight crews during TDWR Microburst Alerts.Within the Bulletin, a critical pilot proceduralrequirement which states "A FLIGHT MUST NOT DEPART NORCONDUCT AN APPROACH THROUGH AN AREA WHERE A MICROBURSTALERT IS IN EFFECT" was obscurely located on page 3.(CONTRIBUTING FACTOR)
Finding 2: Flight 395, 862, 236, 949, and 305 were issued aWeather Briefing Message (WBM) prior to departurecontaining an **ALERT** section which forecastconditions favorable for the formation of low levelwindshear. Included were hourly weather observationsfrom 1700 UTC, 1800 UTC, and 1900 UTC which revealedtemperature/dewpoint spreads of 35 to 39 degrees F, acondition favorable for the formation of low levelwindshear.
Finding 3: All flights arrived in the Denver area during aperiod of time when Airport Terminal InformationService (ATIS) broadcasts contained low level windshearadvisories, microburst advisories, and a statement thata Doppler radar windshear demonstration (TDWR) was inprogress.

- 12 -
F:nding 4: Flight 862 was the first aircraft to contactDenver Tower from a position near ALTUR, the FinalApproach Fix. The Tower responded by issuing a landingclearance and a Microburst Alert. Flight 862 executeda normal missed approach approximately 24 seconds laterwithout encountering microburst activity.
Finding 5: At approximate 2 minute intervals, Fliqhts 395,236, and 949 contacted the Tower from near ALTUR, ancall were issued landing clearances and a MicroburstAlert with an expected airspeed loss of from 40 to 80knots. All three flights continued inbound on the ILSglideslope for 83, 77, and 44 seconds respectivelyfollowing initial contact, beginning a missed approachonly after encountering significant altitude andairspeed performance problems. Crews may not haverecognized the significance of the cumulative clues andthe broadcast Microburst Alert. (PROBABLE CAUSE)
Finding 6: Flight 305 contacted the Tower from near ALTURapproximately 2 minutes after Flight 949 and slightlyafter Flight 949 announced a missed approach to theTower. A Microburst Alert was issued by the Tower withan expected airspeed loss of 80 knots on finalapproach. Flight 305 initiated a missed approach afterthe Alert and following confirmation of the broadcastairspeed loss. (PROBABLE CAUSE)
Finding 7: Flights 395, 236, and 949 reacted to actualmicroburst encounters by employing procedures learnedduring the Advanced Windshear Training Program duringinitial and recurrent flight training. Individualflight reaction varied from a standard go-aroundprocedure for Flights 395, 862, 236 to the use of thewindshear recovery procedure by Flight 949 (maximumpower and a 150 pitch-up attitude). Flight 305 reactedto the Microburst Alert broadcast airspeed loss andinitiated a missed approach after confirming theinformation.
Finding 8: Microburst Alert information was broadcast bythe Tower to the flights as part of other "routine"landing communications and may not have been perceivedas critical information by all involved pilots.(CONTRIBUTING FACTOR)
Finding 9: None of the five flights advised the Tower ofthe reason for their missed approach; therefore, no

- 13 -
pilot reports of windshear could be relayed tosubsequent flights by the Tower. (CONTRIBUTING FACTOR)
Finding 10: Flight 305 descended to less than 100 feet AGL(250 feet below the glidepath) approximately one milefrom the touchdown zone.
RECOMMENDATIONS
Recommendation 1: Establish a policy and methodology tocommunicate safety-of-flight information to all pilots.If the Flight Manual Handbook Bulletin is retained forthis purpose, differentiation must be made betweengeneral information and information relating to safety-of-flight matters. Additionally, bulletins shoulddisplay critical safety-of-flight information in thesame relative position within each bulletin.
Recommendation 2: Clearly differentiate between WindshearAlerts and Microburst Alerts in all written andclassroom materials and instruction.
Recommendation 3: Change the Weather Briefing Messagephraseology from "Windshear Alert" to "WindshearForecast."
Recommendation 4: Change ATC procedures so that MicroburstAlerts are given as a distinctly separate advisory andnot in the same sentence with other information.
Recommendation 5: Establish a standard relative to how lowa flight can descend on approach with a MicroburstAlert in effect.
Recommendation 6: Insure that all training and checkingprograms stress the need for timely pilot reporting ofwindshear and microburst encounters.
Recommendation 7: Access the feasibility of creatingflexibility in the missed approach procedure in orderto avoid microburst areas.
Recommendation 8: Establish a timely system to terminatemicroburst alerts when the hazard no longer exists.

- 14 -
Recommendation 9: Stress the importance of immediate andpositive corrective actions by the Pilot Flying whenaircraft performance deteriorates from desiredparameters and the responsibility of the Pilot NotFlying to announce aircraft performance and flight pathdeviations.
Investigated by: Reviewed by: Approved by:
Ireland Ed Methot BStaff Engineer Manager of Vice PresidentFlight Simulators Flight Standards Flight Standards
and Training and Training
Att.

LPEX T' 1 - Mu.tecrological Date
a. ~r.fror. OFBUX -Carl Knable"Denvcr LLUS - July 11, 19,88"
rj* -ath 'r Briefing MessagesFlipht 395/li-
.. / 6211

UNITED AIRLINES
TO: E1OFS - Ed Rarsey FROM: OPBWX - Carl Knable
EXODD - Dave RasmussenJuly 13, 1988
DENVER LLWS - JULY 11, 198&
INCIDENT
Flights: 395/23b/862/ 45,'30
Date/Time: 07-11-BE. Z22OZ-2232Z
Location: Landing Den e', Runways 26L and 26R
Incident: Microburst
W;ATHER ANALYSIS
0 J J.y II, a stat ionary iront extenoed from northwestern Wyoming acrossN -ifaska, and intc central i. ino:s. A weak low pressure trough ran NW-SE
a:ros5 Colorado. Colorado ,,es were clear during the morning, however a:analysis of the 1200Z raob data indicated a strong potential for convectivea~tivity during the afterr~oc'.
L:,t first showers began to develop west of Denver around 1700Z, building anodrifting at 15 knots to the southeast. By 2100Z, a large area of RW/IRW wittitops to FL360 hal formed over central Colorado.
Swy conditions at Denver were clear from sunrise to noon. At 1900Z, CB'sbegan to develop over the mountains and the temperature-dew point spread atDEN was nearly 40' (8o'/471i. By 2000Z, all LLWS conditions were present:miC level clouds (75 SCT 120 BKN), 404 temperature-dew point spread (86'/460)
and virga/RW being reported (RWU 5, VIRGA SW). At 2100Z, CB's were reportedSE and SW through N of the airport. Thunder was reported at 2200Z, as someoa the cells passed over and close to the field. These cells generated themicrobursts and LLWS encountered by the five United flights.
FORECASTS
The routine OPBWX morning review of all LLWS parameters (moisture aloft,
stability, dry layers, and predicted maximum temperatures) indicated a strongpotential for LLWS and microbursts at several western terminals including DENand COS. As a result, OPBWI issued a LLWS Alert for DEN and COS at 15l16Z.This Alert was valid from 2100Z through 030OZ.
The DEN terminal forecast issued by both OPBWI and NWS called for TRW during
the afternoon.
Both the terminal forecast and LLWS Alert should have been included in eachtrip's flight papers.

-2-
CONCLUSION
July 11 was a typical LLWS day at Denver. Indications of afternoon
convective activity were present early in the morning, leading to the
issuance of an OPBWX LLWS Alert. Convective activity developed during the
afternoon over the mountains and drifted southeast at 15 knots, reaching the
airport around 2200Z. The combination of high based CB's and the large
"teeperature-dew point spread was classic, and lead to the formation of dry
sicrobursts and intense shears in and around the airport.
C.R.K.
Attachmentb: Surface Chart 11/1800ZRadar Summary Charts I/1735Z-22351
HICB Work ChartDenver Surface ObservationsDenver FTOPBWX Wind Shear Alert

I ez MON 19M
% 69:,-6
1.Al
J -Sri,
2.03Z. k
Mi
XL cl
f
f®r
v b
'go
:tit
AM
Ak
S2
ie
fill
Al

V 4 7 ~~ fx .. 3\
* ~&..-& ~ . .-cc
1121 L 25
rl IL I~
I1 -, N- ~.~L*J ~ j
z
Lz, L~ -
- -k LL 'u
/ I ~. -
-S -T
z4 a~ cc
V~u '4 4 i
LL LvL) rz - l~
__ -7--O
16
* . 1'n cf

I~ -- E
4r -)
0 '
~ ~ cc
* ,A
-
~~re
-~ o- I,~
2 N
- >-j
p-Z1'Z -
)We;
*~~~L *L4
G-:-~-~ ;
_
deI1!4-O -l I
*j LOL
* GJJ
U,.,

a 7e
zt
4 (Y~ (I y
* --- ~ ~~= *L
7 ~ ~ J~ ' - > - ~ 'a I
.1 L~ .-
- 0100
'N4
CCV ~
t~-1cc
uz 61
1510 law--- 0
-'3. a
IL
~e 6u. seu
,,~ I
pud
IL
N
"HUN-;
'an5t
ul' 'tt Cr

~ I R1
x ~ ~ V
- 2o
7-I
0 C6
La 0101~
IleNt- u=
11- 96-V
7-1 a;-.-

% -- L r,
X,
own.
~ V413r'
u V a" Z.A-~ r i~' . r~CS
7, z ' U -
NO
T~ ce
ac
/ I19

V-% I LXy' /f
1c 1 ~ I j 'Ii I ,., I I I I I I I U! " Vfi I D W-E11 P3L SULL) I V[ 1'Hit-i. I1 ItL MLIAIj1Jt~k: I [~iM lU
2 L
j/26(31
- I L
I 1 1I
1I7--- -I 1-------.-- i
1 1 -, -- -270--- 1 1- 1 -- __ ___-
I I I
Ium 198 I0II

wULOJ
3
I IC.l Cr . j LO 3 C
ss Lfl 0
N.N .? - - W - U WWU
z - --- mI m~ s- w
0Z. I,) - ~ 333 ,,, Er, t: ,,j > 'Cl >'J m 17) ZZZ Gr =I N Cs
il1. U .cl N In co r- 'v S 1 N
.- jLu S G SSuL. Z 7- Cr- '-- 114 3 f n n so 0 s Wi S IT,
M 7)r Cr, L) U UUjf ZZZ W -- N' N. :rJN N. r' ~ LL UXl I- 6-I- ' N
S'j~ CLi N r W 3 2 ZCI.O 'T0 4 N, N'r"'
S .:fl Lfl - tn fnWW w inN M ' -- WbI ch G--
M~L. .' S f .S DW 0 i rM o cT-VU - - )U so S, s .0 .1 Ut -U CrE ~ 2 CX N S N~CI
3,z3 ,j r-.'J 711 N* Cjufln Zi En S ULL LLA-t.0 t - I - clW Ci - LMC'N -, ou (1r-I~ -t N '..f 0 3 N-s x
"'r, .- 4 l N' j ')'tji O ~ ~ S S -'W
0"L W " T L rii r -~ ' 2SCT) LU SISS ULJ Ij 1 Cr'
COJ Z aND h .N' G SS SS SSZ Z Z Z Z LfjGo'NN- -, N' N, NS N. N'N 'IN'N'-. ' X 2C X X =S
.T 44 CO' - - : : N -T :r-,s S S I)lDCo 'm.U) k Im i i Lm Cm USUi1'j--ii - fl ,* fr'jn- - - G S s G so
(. N-- UjL --f1is Cu -sI2S'S lU- 0 4" US -SN'' M 4~- -O WI WII.0' Ow -,N'N'N''N'. j Aj I'J CIJ CI U a)r\jN N. - -'iLI m Wn .aWirnUls
00--'--I- I '4 j IT 4 4 t4 T42 Z z sW 4U -T U F- - -I'N' :4NNN''' I- X -Y C
tnT ii~ - in U U U fI'X L0 U-~l44ul~ Mi M~ U'7.jNI I i I MI ininO4C - wrrw m Ln Ln --
4T-ss'-i S S SSOMM2Z ',D!') LD M l ) CD O G ? N CO.~J I-u.J'T U1 U- U- U-1 U-) UI-1 U f. S S Ch CO co CO - - .J - - . w
- ,j ,. **j uQ ..Q - ,S55 5 S- SU W WUu. u w w
,jL -r- UWU If) SSSGS - - IEn- -)f 0 .S - i u u u Uun- LD U tUD~ W kD.O.LD U L U U U U r- s
En r. , n (n inin Ln Ech D~ En 6 w
U ~U\-?4' 4: -- 4"LU LJ u uEu u u urNr- N x - -r- u_p Ii 3 G
cr - sssGG Is s GS'S~ NItUJss- 3 6. x5CIJ - M C
WI~ ~ ~ ~~~a Aj )1IUIfU UiCUt~1f~~f~f IAJ i AA SI
". (n-1 0 3L r1
I QQQ0 00 zzzzzzzz z z 0zxzmmmm m == WWWWWWWWMW-twzw LLW
~C0000C 0 0 00c~ao 0 OO3UI LT -
OS x - Cw" C )<> <XIc> -> > >>->)

Si i 2
L) zm U +' r
I.- xi U Li-9u LL LL CTJ ZxJ U> z Iz
U ~~ I. L >L LM i~ . z ~LII ul xr. Cl Cl >-9:S
4 5' r T I LU 0 f'i3 -iii S4~.J 0f '0l .J N M7. 3 S'- T LO U- tQ\
'- . LLi U~j jJ - - O r-4 -:r U - JSL) 2 ' C Cl 1' u~ LM *U U.'l u. u- U Lii
L - U ~ I U !L LL . S, j J+ m U .j'_j> I 3_ 3 Z: U>Z U -1 L z3 u m ULim (f= Ex L4,- = U U_ = IE _ > . Z',I U M L X IUu ai + - - + Uj M 0 oi U Cl 3 U1 Go
i- -So LrIIj y Z 3 ' =f. I- -S Si r, s : -U)-. 0 Z1 i Z - Uz:1 - S - ) xC f- S (10 "j LJ - U l ~Lm
U - 3U i MI Z .J _j - .- Si 0 Lio Is') z -. cr I.D 'T :r~~l'-> S m U-~
M 3 LL c - S .- . X 3 LL Y_ xD S -T-.. ff"I ~ F- I.II4 SW U - *w 0U. [1 ~ Mi LL X1 -?-r (1 -j
co LL LL0 CTi W) -T .'* Z C4Jsi UW U> u>U u o i i S-E~ .) F-U U- jU- '- Z
ZZ-?r U = m U 33-? U CWZz um 0 ZZ :lUU'j U _j U , L)r-4 _ UUU j -4 - X~ UI InU Z UU~c _ji MCO Z0 Ti **IZ .7' .. j jril *Um blii 00c[
UJ UZ F- - - z jZ -J 3I- I Z G CD -0 U,.D .D2 CU 0 f Li U)CD U W LDZ U Us X 3 c Chs W WU C
5'5'Lj 0 U U 0 SSU 0 CflILT4a W-Si~'CD so -C3 _ n V), -t iSc o0 >U") I ..'\ J U D Wuiu M u
IS Lo-T S 'J *J J-T S S LD 3," S (AZ X t2l:t - Nkf T- 0 -LT)Al% IIm-"Cum P-i- 51 *.. xI XXwl~ui. NU X-0- Nu Lu-U. _Jrl(J*J 0i ZZ -T -T P r-j Uf1 X - - x I i UZ- V) 4 z.XU _
33 MOLL MZ MOiLL 33 mumU X~ X - LT0 333 Ss:X - L -'.J I-U- " _J !'j -LL>UO .S I x imi M x 5,cxisU > - U L iU F 6- L s0U > 0 u-?T I G CD X1XL M .I I LWjEUU Li Wr In uU u I I LWE: c 2'i > P-a i0 oS I co w
1.0l> 1, t- -4 0- f> S ~ 5 .0 r-4 r- r-T L.L U CU SS SSSSSr-4 0 CISIWT fl OIiii U.-J S'S bi U > NJ GSii6.jG0 0 LisS fiS 0 lS 0 -9S 410 LisS il U ('1ai *5U Elo -.T'~i A.S
.~ii--.5~'J rS.x .UJ-- -S r-4 UUU N.'iLLNLL I-UzuoPs' Nmtlr4WT2 3IL
Fl- IU>i- I- .- >>I.*U>X 0i os 4 =I-xCX=UjU I U,_ U :L EUS USo ' ZU L LrU I U CXr-4 r- tD r- - 4')ZUL. U I I I- In SWn UflI.W.Ji " " -4flJ)r-4i In M LL 0i- "4 .,x c uli
r-4 > tjr-4 Cro r is) -4 r- > G 4") 0S -I Z S IM IE 14-s4aX S NH -Cr -a Ch t -- ?S4 -4 U .-. 3 -0w 1 I -G >
-~~ .-i-- - - 0 40 E-r- r-")aU..oUr-Ui *r- *t--tLrrU i- L)-'4 -U
-- I-I-n?G-S- -*-n- -+ UNU cu's i 5 ,1g5Jrr-mr-- .r-(D 03 cn rl-W r-sr- .CM Cr *- 3 GN4 *a130S
3 3 3 U * 330o
H -'S -'- S S -- -S S C UM2 0- mI- -NNJ'JT C 3 Z 6U 00 Cl m w a Cl o Lo a
C~ ~ 0 _0 0 WU

WI-
LC.
..
II4U.1 L' Ld
Li- L Le~
Q H
LIJJ
, A L~j: LT-_j r-- -1
L~L'4 LJ- *J--
4-~ j r Jcr. 1TI p.
LW *
_jV -. ' ~ ' rp~r. 4 ~ I '. -'1I- Lp
,J ~ 'D- 74- LI0~-Q ty -jQ444

1411 ' PID 2t5"72 ID. 07514? RTG KOS
AL'.OC'.ALIOOUA 11 ';121 27,t.O/HOL
wBM 395-I1 AUS-DEN'(2216Z) RT: I ALTNT COS
407-11 DEN-ONT (0127Z) RT: I ALTNT LAY
390-il ONT-DEN (0405Z) RT: I ALTNT NA
*** PART (1i : 02 PARTS ***
.************ ALERT ****** ALERT ****** ALERT ***********
DEN LLWS ALERT FROM 112100Z TO 120300Z
CONDITIONS FAVORABLE FOR DEVELOPMENT OF CONVECT IVE LLWS. IF
VIRGA, CS OR RW ARE OBSERVED OR REPORTED, EXPECT LLW-.
CO'S LLW.. ALERT FROM 112106Z TO 121300ZCONE ITION' FAVORABLE FOR DEVELOPMENT OF CONVECTIVE LLWS. IF
VIPc , CP '-. OR RW ARE OBSERVED OR REPORTED, EXPECT LLWS.
---------------- ------- MAP FEATURES-
MAF FEATURE: UNITED STATES. 11185?Z-120600Z
-JET C:ORE*- AT 120Z. FROM SLE (OREG) 350/26075 TO OI ( IA)
42,:''2.0675..FRIM O:C (O ) 380/25086 TO PIA(IL) 420/26,0'5 TO
E U-tNY) -:5': '24075.. SURFACE AT 1500Z. . COLD FRONT SSWD FROM NRN
IVA TO OFF NRN CALIF COAST, FRONT MOVING EWD AT
2'i NCiT..LAYERED CLOULDS/R-/F BEHIND FRONT FROM WASH SWL' TO NRN
CALIF.. STRATL'I. OVER SRN CALIF COASTAL AREAS MOVING OFF-SHORE
EARLY THEN MOVING BACK ONSHORE NEAR END OF PERIOID. COLD FRONT
EXTENDS SWWD FROM WRN NY TO NRN IL TO SRN NEB THEN STATIONARY
NWt-',. THr'., NE'N WYO TO NWRN MONT COLD FRONT MOVING EWE' AT 15-20
KNf:Tc...FEW: TO SCATTERED (CHC SEVERE) DEVELOPING VC:NTY
STATIONAR'' FROM FRONT FROM MONT SEWD TO NRN NEB. FEW TRW FROM
AZ/NMEX NEWD INTO SERN WYO..S :ATTERED TRW/RW OVER MOST OF AREA
FROM TX/OF NEWD INTO NEW ENGLAND AND EWD TO NRN FLA. CHC: HEAVY
TO SEVERE TRW FROM SRN NEW ENGLAND TO SCAR BY OOZ.
-ORI-DEST-ALTNT-WEATHER
AUS 1349 3S SCT 120 SCT EISO OVC: 12 137/85/73/2107/996
ALS SF' 1753 32 SCT E190 OVC 12 140/84/74/1610/997/ 000 152/ 77
AUS 1651 M2'4 BV.N 4? BKN 140 OVC 12 144/82/73/1705/999
AUS FT11 AMD 1 111917 1904Z 30 SCT C120 BKN 2010 OCNL C30
BKN RW CHC CS OVC 1TRW+. OOZ 40 SCT C120 BKN 2406 SLOT
CHC TRW. 06Z C12 BKN 1906 SLOT CHC TRW. 1IZ MVFR CIO..
AUS NO 2/6 THR 35 DSPLCD 1200AUS NO 2/8 17-35 CLSD EXCP DAY/VFR+12500/BLO
AUS NO 7/6 ARPT CLSD TO JET TRNG
ALS NO 13/1 AUS TWR DOES NOT CNTRL THE RAMP AREA.
PUSHBACK WILL BE AUZD BY UAL TUG OPERATOR. AS A
COURTESY ADVISE ORND CNTRL ON APPROPRIATE ATC FREQ
(RWk-DENTK 11' 25-87 By JWS)
AU. NO 13/2 CONSIDERABLE JET FIGHTER TFC AT BERGSTROM
A.F.B., LOCATED BTWN ARPT AND COLORADO RIVER. ALT SFC
TO 3000C FT (PER DICK KRUEGER DENTK 01APR87)
ALS NO 13/3 POSSIBLE TFC: CONFLICT BTWN BERGSTROM
A.F.B. TRAFFIC CUTTING ACROSS: RWY 13R DPTR CORRIDOR.TFC AT 3000 FT WHEN NORTH OF CORRIDOR DESCENDS TO 1200
FT SOUTH OF C:ORRIDOR. (PER DICK'. KRUEGER DENTK 01APR8,)

ALI NO 13/4 TWY 'P' SOUTHWEST OF TWY *D" FREQUENTLYCLSD FOR EQPT STORAGE.. HARDSTANDS BEHIND GATES 1, 3AND 5 USED AT NIGHT BY OTHER AIRCARRIER LAYOVER ACFT(DENTK DK' CHIDD JWW 4/28/88)
DEN 1851 CLR 50 078/86/47/0406/000/CB TCU S-NDEN 1750 CLR 60 085/84/46/0809/002/CB FRMO OMTNS S-NW/ 710 1003
5
DEN 1652 CLR 60 089/81/46/1308/003/CU FRMG OMTNS S-NWDEN FT11 111818 90 SCT 250 SCT 1612 SLOT CHC C70 BKN
TRW-A G40 AFT 2OZ. 04Z 150 SCT 1910. 06Z CLR 1910. 12ZVFR..
DEN NO 6/25 LDA LOC 35R OTSDEN NO 6/26 ILS DME 35R OTSDEN NO 6/36 LDA DME 35R OTSDEN NO 7/12 DEN ALS 35R OTS TIL 152000DEN NO 13/1 FOR PUSHBACK CLEARANCE AT GATE A-: C.ALL
UA RAMP ON 129.5. DEN PAGE 10-7 WILL BE CHANGED. (DENFOPB CHIDD JWW 6/16/88)
DEN NO 13/2 FDC 8/2040 ILS 35R CRCLG VIS CAT C VIS 23/4, CAT D VIS 3. ALT MINS 900-3
DEN NO 13/3 CONSTRUCTION AREA - ON RAMP EAST ANDSOUTHEAST OF THE B CONCOURSE. AREA EXTENDING 300 FT OUTFROM THE B CONCOURSE. THE VSR IS LOCATED AT THE EDGE OFTHE OUTAGE AREA. GATES B19 AND B21 ARE OUT OF SERVICEWITH B20 TO BE OUT OF SERVICE BY 6/28/86. AREA ISLIGHTED AND BARACADED. TAXI W/CAUTION. DURATION,APPROX. 30 DAYS. (CHIDD.GC)
COSe 1350 SO SCT 65 104/80/46/1209/008CC'S 1750 70 SCT 65 111/78/47/1307/010/ 705 1100 52C:C" 1650 CLR 65 119/75/45/1406/011/FEW CU SW-NWCOS FT11 101818 70 SCT 250 SCT 1510 SLOT CHC C60 BKN
TRW-A 040 AFT 202. 05Z 120 SCT 0110. 06Z CLR 0110. 12ZVFR..
c:Os NO 13/1 USE CAUTION TAXIING INTO THE RAMP FROMTHE SOUTH. TWY A3 SIGN IS LOCATED SOUTH OF TWY A3. THETWY SOUTH OF THE SIGN IS A PRIVATE TWY AND IS NOT AUZDFOR UAL ACFT
COS NO 13/2 COS NOT AUZD FOR PILOT TRAINING FROM2300-0600 MDT
ONT 1SSC' -X 3Hr 75/61/1804/002/ MK3ONT 1750 M17 BKN 2 1/2FH 69/61/2605/004/FH2ONT 1650 -X M13 OVC 21/2FH 65/60/2105/004/ FH2ONT FT11 111919 -X CI8 BKN 3H 2710 OCNL 18 SCT. 20Z -X
3H. 23Z -X 5H 2712. 02Z CLR 2712. 05Z CLR. IOZ -X CII VC3FH. 13Z MVFR CIO FH..
ONT NO 6/6 ONT ILS OS RY26R UNUSBL BLO 1089 MSL
LAX 1850 M24 OVC 9 171/68/58/2409/004/ CITY 70LAX 1754 M24 OVC 9 171/69/59/3105/004/ 108 15// 63/CITY 69LAX 1652 M23 OVC 9 170/68/58/1504/003/ CITY 68
LAX FT11 111919 C25 8KN 2512 OCNL 25 SCT. 22Z CLR 2512.02Z C18 BKN 2508 OCNL 18 SCT. 052 CIS OVC. 13Z MVFR CIG..
LAX NO 7/2 LAX 6L-24R CLSD 0600-1300 DLY EFF7/11-7/15
LAX NO 13/1 BTWN TRMNLS. IN THE ALLEYS, 180 DEG TURNSUNDER PWR ARE NOT PERMITTED. IF A REVERSAL IS RORD,SHUT DOWN ENGINES AND REQUEST A TOW. (LAXFO RPS/CHIDDJWW 9/15/87)
LAX NO 13/2 NOTIFY LAX TWR WHEN YOU ARE NUMBER I FORTKOF IF YOU SUSPECT THIS WILL HELP ENSURE SEQUENCE(EXOVF TO/CHIDD JWW 9/18/87)
LAX NO 13/3 CONTACT LAX STATION OPERATIONS FORPUSHBACK CLEARANCE AT GATES 70A, 708, 72A. 728, 74 AND

8( THRU 84. IF PUSHBACK FROM GATE 74 WILL INTRUDE INTOTWY SOUTH OF THE SATELLITE, CALL ORNO CNTRL ALSO FORCLEARANCE (01/25/88 JR PER GARY MEERMANS LAXFO)
LAX NO 13/4 WHEN POSSIBLE, AVOID FLYING OVER OR NEAR
THE HOLLYWOOD BOWL BETWEEN 1800-2400 PDT, MONDAYS THRUSUNDAYS. THE AREA IS LOCATED 5NM SE OF BUR AND 15NM NNEOF LAX AND IS VISUALLY DEFINED BY TWIN CROSSED WHITE
*.* END PART (11 OF 02 ***
EISEIR 111'24 6.'77 0634
1415272 AGENT V'OS ID 075143 FROM PID 2872 TO PlD 6'I
141526Z PID 2872 ID 075143 RTG KOS
. AU0I:'L'I 1191'.cI 2760/HOL
P : 1395-11 AUS-DEN (2216Z) RT: 1 ALTNT CO-
407-11 DEN-ONT (0127Z) RT: I ALTNT LAX
3o - 11 CINT-DEN (0405Z) kT: 1 ALTNT NA
PART (12 OF 02 PARTS; ***
SEARCHLIGHT BEAMS IN THE StY AND WHITE STROBE LIGHTS; ONTHE GROUND. EFF THRU 17SEP88.
(LAXFO-MEERMANS,TOMKO. 27JUN88)LAX NO 13/5 FDC 8/937 VOR RWY 7L/R PROC NALAX NO 99/9q WHEN TWY 80V CLSD DUE TO CONSTRUCTION,
TICOF RWY6L AVBL FM TWY 75V (7000FT AVBL). LDG RWY24RLAST EXIT TWY 75V (700OFT AVBL). OBTAIN MEISR WTSRWY6LX (700OFT AVBL TKOF) AND RWY24RX (700OFT AVBL LDG)FROM CHIDD OR CRT.(EXOVF JP 6/01/e8).
-------------------- DRIFTDOWN ALTERNATES---------------------OJT 1850 CLR 70 094/87/45/1208/002/FEW TCU AC CIOJT 1750 150 SCT 70 101/85/45/1908/005/ TCU DSNT E/ 114 1280 86GJT 1652 150 SCT 70 110/79/48/1209/007
GJT FT11 111818 80 SCT 250 SCT 1410. 20Z 80 SCT 250 SCT2810 SLOT CHC C70 BKN TRW-A 045. 04Z 130 SCT 1109. 06ZCLR 1310. 12Z VFR..
GJT NO 13/1 TOWER ,LSD 0400-1200Z(2200-O00OMST). WHNTWR CLSD/ ALL NAVAIDS MONITORED (04/03/88 JR)
OJT NO 13/2 SPECIAL TAKEOFF ENGINE OUT PROCEDURE..INSURE JNC VOR OPERATING PROPERLY (CHIDD 6/18/86DR)
LAS 1853 CLR 30 092/98/47/1912021/990LAS 1751 CLR 30 C96/96/49/2016024/991/ 303 83LAS 1651 CLR 30 097/94/50/1816024/991/HAZY
LAS FT11 111919 CLR 2118032. 04Z CLR 2014. 13Z VFR CLR..LAS. NCO 13/2 DUE TO TRAFFIC VOLUMES ATC WILL INCRS USE
OF RWY 07 DPTRS WHILE ON NORTH FLOW (IR/IL). TO REDUCETAXI COMPLEXITY, EXPECT ATC ROTS FOR RWY 07 DPTRS FM

TWY M OR TWY X (EXOVF JP 4/27/88)
PSP 1846 -X E: 96/M/0Q08/990/ HK2PSF 1750 -X 8 95/M/1207/991/ HK2PSP 1646 CLR 8 94/M/3604/991/ HK ALODS
PSP FTII 111919 CLR 1212 OCNL 5H. 012 CLR 3020. 06Z CLR.13Z VFR..
PSP NO 13/1 TOWER CLSD 0600-1400Z(2300-O700PDT). WHNTWR CLSD/CONTACT WEATHER OBSERVER ON 129.2 FOR WEATHERAND TRAFFIC INFORMATION, ALL NAVAIDS MONITORED
(04/0:/88 JR)PSP NO 13/2 WHEN DPTG AFTER TWR CLSD OBTAIN CLRNC BN
ONE OF THE FLWG: FM ATC: DURING APPCH INTO PSP ..OR..TELEPHONE BFR DPTR PSP PHONE NR 805-947-4101 .. OR..TRANSMIT ONT RADIO ON 122.1 AND RECEIVE ON 115.5 (PSFOMNI - ADJUST VOLUME TO MAX) ..OR.. IF THOSE FAILCONTACT CHIDD FOR FURTHER ASSISTANCE. WHEN DPTG AFTERTOWER CLSD BROADCAST ON FREO 119.7 (25AUG86TJK) IFEITHER ONE INACCESSABLE USE 1-800-992-7433 (RIVERSIDEFSS).
PEP NO 13/3 ADHERE STRICTLY TO INSTRUMENT APROACHPROCEDURES WHENEVER RADAR GUIDANCE IS NOT AVBL. WHENCLEARED FOR AN APPROACH, IF ON A UNPUBLISHED ROUTE OFRADAR VECTOR, MAINTAIN THE LAST ASSIGNED ALTITUDE UNTILESTABLISHED ON A PUBLISHED ROUTE OR INSTRUMENI APPROACH(11/25/86 J. NEFF)
FPE.F NO 13/4 WHEN ON APPCH TO RWY 30 ROST PSP APPCH TOTURN ON VASI AT CATHEDRAL CITY OR WITHIN 3NM (PER PSPTWR JPB 02/17/87)
PSF NO 13/5 WIDEBODY DIVERSIONS CAN BE HANDLED ON AREFUEL AND GO BASIS ONLY. (NO CARGO LOADERS AVAILABLE)(Tji .26JUNS7)
PSP NO 12/6 CREW CAN CALL EARLY FOR CLRNC 0650 LCL121.9
PSP NO 13/7 ALL PSP OPERATIONS NOW USE GATE 1 (LLCHIDE' 01/28/3)
PSP NO 13/8 8727 DPTG PSP ON PALM SPRINGS I DPTR SETCLMB THRUST IN LIEU OF QUIET EPR (02/01/88 JR PER TOMWYATT DENTK)
PSP NO 13/9 FDC: 8/1281 IFR TKOF MINS RWY 30 3000-2 OFSTD WITH MIN CLB OF 360 FT PER NM TO 4000. IFR DPTRPROC RWY 30 TURN RIGHT DRCT PSP VORTAC, THEN VIA V137TO TRM VORTAC. CLB TO MEA OR MCA FOR RTE OF FLT, ORHOLD E, RT, 2S7 INBND
PSP NO 13110 CRANE OPERATING 75' AGL, LOCATED APPROX1500' NE OF THE APPCH END RWY 12. OPERATES MON-FRI1300Z-2300Z UNTIL APROX 21JUN88. WILL BE LOWERED WHENNOT OPERATIONAL.(RK..6JUN)
--------------------- DEST AREA WEATHER-----------------------PUB 1850 CLR 90 090/87/50/1808/999/CB N CU SW-NWBJC 184" 80 SCT 65 86/48/1110/002TAD 1850 CLR 60 104/82/42/0605/O08/FEW CUPMD 1846 CLR 20 E2115/997/H ALQDSWJF 1850 CLR 30 126/86/45/2420/998RIV 1855 -X 3H 161/78/58/2902/003/H2$BD 1855 -X 21/2H 154/80/60/3002/H2
----------------- ENROUTE TERMINAL FORECASTS------------------OKC FT11 111717 40 SCT CO00 OVC 1610 CHC C20 OVC 2TRW.
03Z 100 SCT 250 SCT 1508. 112 VFR..DFW FTI1 111717 12 SCT C25 BKN 1808 OCNL C12 BKN 3R-F CHC
TRW. 20Z C30 BKN 1808 CHC CIO X 2TRW. 04Z CI5 OVC 1808
CHC TRW. 11Z IFR CIG TRW. 15Z MVFR..AMA FT11 111717 45 SCT 1808 SLOT CHC TRW AFT 21Z. 02Z 120
SCT 1608. 11Z VFR..

PUB FTX I 151 I9 li 0 SCJ :SC SET 1410 SLOT CHC C70 Si*NTRW-A 040 AFT 202. 052 120 ScT. 06Z CLR. 122 VFR..
VEFT11 AMD 1 11191S 1'"05Z 5;0 SCT 100. SCT C250 BKN 1210OCNL C50 BKN CHE TRW- 030. 032 60 SET 250 SO-T. 122 VFR NCONOC'I C..
P HY FT11 111818 CLR. 222 90 SCT 290S. 037 120 SCY 2908.('62 CLP. 122 VFR CLR..
------------ -- PIRERS------------------------------MLC LIA 10 ' PL.O 2,70010/TM 1728/FL?1U/TP Et737/TB4 LOT RIME2.17 10V' PFF 11's, 2-5' /TA -4!?/WV 2700311/TP SrTH
-------------ENRC'UTE NDTAM ----------------------------ENRCL'TE NiOTAM 1-3 EFF 1SAPR/15211 TO8/1091 Flit AIRWAY TX. V68: Vlfl COMFY TX TNT TO SAT VOPTAC MEA400:':. cEXODD 18APR83-:: AR)
ENR'IL'TE NOTAM 04 EFF O2MAY/1c51lZ TOrC S/1217 AIRWAYS, TX. V16l BETWEEN MILSAY /MOP/ %'ORTAC- AND'PC'LVA INT., TX. MOi:A 2500.
ENP:I'.TE NOITAN 215 Et-F 01APR'2151 2 TC, UFNV: > 74^ FRC'il TULaA, O4 VORFTAC TO CiWETA, O INT. MOCA-I: TO~
ENHO C!E NOTAM -21 EFF 27U0 42C UFEFDIC 21 1WHEN EL PASOC TX FSS IS OLSD THE FLWO AWY?; NOT AUITH:V2?::'> F* 1NC'N NMl. VOlRTAC TO EL PAE'p TY. VORTAC. V1,: TRUTH OPF
CCIN:EECIJ.ENl:E'i. NM. VORTAC TO NE;.::I4N TX. VORTAC. V560 NEWMAN TX.YCPRTAC, Ti-i CARL$BPAE NM. VORTAC.
ENRIJ T-E N':TAM -:4 EFF - TOCHART LO(Orl) GLENC' INI. REDESI':.. LEFT TURNS, 064 DEC, INBNI',
ENF':U1-TE NOTAM 12 EFF - TO,:NA (S.ANTA ANA) VOR 0)/! INDlEFINITE-LY
**END, PART 02. OF 02 t
FlOP[, 6.' '77 QA2
14152 32 A:.,EN1 KO'S ID' 0:75143 FROM Fill 287: TO PIt' 68"1I

141!?:07 AGENT fICS It: 07514?- FROM PIE 2872 TO PID 6S'1
14152' Z RID 2872 ID 07514? RTC KOS
SEA!!.SEAOOUA 111621 3313/KUS
WBM 236-11 SEA-DEN (2214Z) RT: I ALTNI CO'S
PART 01 OF 01 PART,=
************* ALERT ****** ALERT ****** ALERT ************
DEN LLWS ALERT FROM 112100Z TO 120300ZCONDITION;: FAVORABLE FOR DEVELOPMENT OF CONVECTIVE LLWS.. IFVIRGA, CB S OR RW ARE OBSERVED OR REPORTEi. EXPECT LLWS.
CO'-. LLWS ALERT FROM 1121'0Z TO 120300'!ZCOrDITIIN: FAVORABLE FOR DEVELOPMENT OF CONVECTIVE LLW-i.. IFVIRNC4 CB'':: OR RW ARE OBSERVED OR REPORTED, EXPECT LLWS.
------------------------ MAP FEATURE --------------------------MAP FEATURES UNITED STATES 11103Z-120000Z.IET CORE AT I 1/00Z .... NO WINDS GREATER THAN 71>:TS OBSERVED WITHGENERAL WESTERLY FLOW ACROSS NORTHERN 1/3 OF U.S. AND LIGHT AND'VARIABLE FLOW SOUTHERN 2/3 .... SURFACE PATTERN AT 11/06Z.... WEAlPACIFIC FRO:NT NEAR IDAHO/WASH BORDER.... SECOND FRONT ACROS-CENTRAL MICH THFU CHICAGO BECOMING STATIONARY ACROSSIOWA/NEBRASKA.... ASSOCIATED WX.... A.M. STRATUS WEST COASTALSTATION: .... WIDESPREAD A.M. HAZE/GF EAST 1/3 OF U.S ..... CB OTLF1Z-O!Z .... ISOLD P.M. CB S MOS :T OF EASTERN 2/3 U.S. EXCEPT NON:-EXPECTED MINN/WISC/MICH/NORTHERN ILL/NORTHERN
INDIANA.... GREATER THAN ISOLD COVERAGE EXPECTEDSD/NE/WY/MT/ID .... SECOND AREA GREATER THAN ISOLD PENN NORTHWARDTHRI NEW ENGLAND .... THIRD AREA GREATER THAN ISOLD ACROSS GULFCOASTAL STATES .... OPBWX/GH
------------------ OR I G-DEST-ALTNT-WEATHER--------------------SEA 1750 M16 BKN 40 OVC: IOR- 140/56/53/2209/995/RB20 21200 15//
54SEA 1650 M20 BKN 60 OVC 20 135/58/50/2112/993SEA 1549 M21 BKN 60 OVC 20 133/56/50/2013/193
SEA FTII 111010 13 SCT C22 OVC 2109 OCNL C13 BKN 5R-F CHCC6 BKN 3L-F. 04Z MVFR GIG..
SEA NO 13/1 ALL B-747'S TAXIING TO/FROM GATES N-3 ANDN-6 MUST TAXI ON THE NORTH AND EAST SIDE OF THE NORTHSATELLITE. SEAFO JM (JJD)
DEN 1750 CLP 60 085/84/46/0809/002/CB FRMG OMTNS S-NW/ 710 10035
DEN 1652 CLR 60 089/81/46/1308/003/C:U FRMG OMTNS S-NW
DEN 1552 CLR 60 096/76/48/2006/004DEN FT11 111218 0 SCtT 250 SCT 1612 SLOT CHC C70 BiN
TRW-A G40 AFT 20Z. 042 150 SCT 1910. 06Z CLR CIO0. 12ZVFP..
DEN N't ,/25 LDA LOC ?SF CITSzDEN NO 6/2c ILS DME 35R OTS

DEN Nr c,' :! LDA DME 35R OTSDEN NC 7-11 ALS 35R OTS TIL 152000DEN N 7/12 DEN ALS ?5R OTS TIL 152000
DEN N': 13/1 FOR PLISHBACK CLEARANCE AT GATE A-9 CALL
LIP RAMP ON 129.5. DEN PAGE 10-7 WILL BE CHANGED. (DENFO
PB C:HIliD JWW 6/16/88)DEN N' 13/2 FDC 8/2040 ILS 35R CRCLG VIS CAT C VIS 2
3/4, CAT D VIS 3. ALT MINS 900-3
DEN NO 13/3 CONSTRUCTION AREA - ON RAMP EAST ANDSOUTHEAST OF THE B CONCOURSE. AREA EXTENDING 300 FT OUTFRqM THE B CONCOURSE. THE VSR IS LOCATED AT THE EDGE OF
THE OUTAGE AREA. GATES 819 AND B21 ARE OUT OF SERVICE
WITH B20 TO BE OUT OF SERVICE BY 6/28/88. AREA ISLIGHTED AND BARACADED. TAXI W/CAUTION. DURATION,
A F' Rf. .30 DAYS. (CHIDD.GC)
CC:-, 1750 70 SCT 65 111/78/47/1307/010/ 705 1100 52Cc'- 1650 CLF 65 lI '/75/45/1406/01/FEW CLI SW-NW
C": 1551 IL 65 122/7?/51/1007/011/FEW CU SW-W
CC'! FTii i''1S1:3 70 SCT 250 SC:T 1510 SLOT CHC C60 E:NTRW-A G41: AFT 20Z. 05Z 120 SCT 0110. 06Z CLR 0110. 12Z
VFF..C:-' NC 1'/! USE CAUTION TAXIING INTO THE RAMP FROM
iHE SOUTH. TWY A3 SIGN IS LOCATED SOUTH OF TWY AS. THET.ve S'O.UITH OF THE SIGN IS A PRIVATE TWY AND IS NOT ALIZE
FiOiR: UAL Ai-FTO": Nit 1-/2 rCr NOT AUZD FOR PILOT TRAINING FROM
- -0.. 0 MDT
-DEST AREA WEATHER. 175', 15'1 /4_/190/005/ TCU DSNT El 114 1230 6c.Fpfilr 1751 ' LF '')/3/50/1606'001/EW CU SW-NW MDT CLI NW' 14
JC U-4F <', SCfT 60 7014411507/003/ FEW CZ NW KH ALNj$':
TP, 1'5. ,Lr 60' 1IS/7/ /43/1307/011
-ENROLITE TERMINAL FORECASTS
GEC FT11 111010 C250 BKN 2010. 19Z 50 SCT CICO 812N 2214C"-
. cc'0 BLN C:HI- C40 BLN RW-. 04Z VFR..Pi F i i 81I 100 SC.T 200 -BKN 3303. 002 CFF' 60 SCT
C-i10OC BIN .312 SLOT CHC RW-. 06Z 100 SCT C200 BKN 300s3.122 VFR CIG ABV 100..
RN': FTI1 111010 CLR. IZ 250 -BKN 2718G2S. 04Z VFR C:LR..IDA FTII 110c,0'-- 100 SCT 200 ;CT 2008. 21Z 60 SCT 100 JiSCT
C2':'c, BN 2(12 SLOT CHC: TRW- 035. 1OZ CFP 50 SCT C100 BKN2?15 SLOT CHC RW-. 12Z VFR CIG ABV 100..
.=-LC: FT1i 111818 CLR 1815028. 05Z CLR 1612019. 12Z VFRWND..
CY': FT11 111818 50 SCT 250 -EqiN 1710. 21Z 50 SCT 100 SCT
C250 BPN 1612 OCNL C50 BKN CHC TRW- 030. 03Z 60 SCT 250
SCT. 12Z VFR NO CIO..
-PIREPS
GEE• UA /OV GEG 180060/TM 1645/FL290/TP MDSO/TB MDT... ZSE
UAO?7 /OV 8FF 30$ 1650 F310/TB LT-MOD
ENROUTE NOTAMS
ENROUTE NOTAM 01 EFF IIJUL/1230Z TO 12JUL/02002A1011/88 VZSE WARNING AREA W570 LOCATED OFF THE COAST OF OREGON
ACTIVATED SFC THRU FL500
ENIIITE NOTAm 02 EFF 11JUL/1230Z TO 12JUL/2130ZAI11 .',IA : Z'E WARNING AREA W23"?A/B LOCATED OFF THE COAST OFWASHIN,,TO"qN ACTIVATED SFC THRU FL240
ENPC'L'TE NOTAM ':4 EFF - TO

CHART LO(09) GLENO INT, REDESIG, LEFT TURNS, 064 DEG INBNr
*** END PART 01 OF 01 ***
EISDR 111825 7317 05186

14152&Z PID 2872 ID 075143 RTG KOS
MLI IO.MLIOZUA 111913 187
WBM 862-11 MLI-DEN (2212Z) RT: 1 ALTNT COS
PART 01 OF 01 PARTS
*************** ALERT ****** ALERT ****** ALERT *************
DEN LLWS ALERT FROM 11210OZ TO 120300ZCONDITIONS FAVORABLE FOR DEVELOPMENT OF CONVECTIVE LLWS. IF
VIRGA, CB S OR RW ARE OBSERVED OR REPORTED, EXPECT LLWS.
CCO' LLWS ALERT FROM 112100Z TO 120300Z
CONDITIONS FAVORABLE FOR DEVELOPMENT OF CONVECTIVE LLWS. IF
V]RGA, CP'S OR RW ARE OBSERVED OR REPORTED, EXPECT LLWS.
- -MAP FEATURES
MAP FEATURES UNITED STATES 111835Z-120600Z
JET CORES AT 120OZ..FROM SLE(OREG) 350/26075 TO BOI(IDA)
420/26065. FROM OKC(OK) 380/25080 ro PIA(IL) 420/26065 TO
BIF(NY) 350/24075.. SURFACE AT 150OZ. .COLD FRONT SSWD FROM NRN
IDA TO OFF NRN CALIF COAST, FRONT MOVING EWD AT
20wNClTS..LAYERED CLOUDS/R-/F BEHIND FRONT FROM WASH SWD TO NRN
CALIF.. STRATUS OVER SRN CALIF COASTAL AREAS MOVING OFF-SHORE
EAPLY THEN MOVING BAC:V ONSHORE NEAR END OF PERIOD. COLD FRONT
EXTENDS SWWD FROM WRN NY TO NRN IL TO SRN NED THEN STATIONARY
NWWD THRU NERN WYO TO NWRN MONT COLD FRONT MOVING EWL AT 15-20
K.NOTS.,,FEW TO SCATTERED (CHC SEVERE) DEVELOPING VCNTY
STATIONARY FROM FRONT FROM MONT SEWD TO NRN NED. FEW TRW FROM
AZ/NMEX NEWD INTO SERN WYO..SCATTERED TRW/RW OVER MOST OF AREA
FROM TX/O:I NEWD INTO NEW ENGLAND AND EWD TO NRN FLA.CHC HEAVY
TO SEVERE TRW FROM SRN NEW ENGLAND TO SCAR BY 00Z.
- ORIG-DEST-ALTNT-WEATHER
MLI 1853 250 -3C:T 20 139/89/56/3606/996IFEW CU TCU AND CD TOPS
DSNT E-SEMLI 1753 250 -SC:T 20 144/88/55/3408/997/TCU E-S FEW CU ALQDS/
703 1202MLI 1652 250 -SCT 20 147/86/56/3208/998/TCU SE HRZN
MLI FT11 111717 CLR 3606 OCNL 40 SCT. 07Z 25 SCT 80 SCT.
09Z C25 BKN 80 BKN 1706 CHC C20 OVC 3RW/TRW. 11Z MVFR CIG
TRW..MLI NO 13/1 TOWER CLSD 04 00-1100Z(23O0-O600CDT).
WHN
TWR CLSD/ CONTACT UA PERSONNEL ON 131.2 FOR TRAFFIC AND
WEATHER INFORMATION, ILS 9 UNMONITORED (04/03/88 JR)
MLI NO 13/2 RAMP CONST PHASE-I NORTH RAMP CLOSED
FROM TXWY BRAVO TO TXWY ALPHA. TXWY BRAVO OPEN AT ALL
TIMES. TXWY ALPHA CLSD FROM NORTH RAMP TO RNWY 5-23.
PHASE-1 COMPLETION MID JUNE. RWS 5/16/88.
DEN 1851 CLR 50 078/86/47/0406/000/CB TCU S-N
DEN 1750 CLR 60 0S5/84/46/0809/002/CB FRMG OMTNS S-NW/ 710 100?

DEN 1652 CLR 60 089/81/46/1308/003/CU FRMG OMTNS S-NWDEN FTII 111818 90 SCT 250 SCT 1612 SLOT CHC C70 BKN
TRW-A 040 AFT 2OZ. 04Z 150 SCT 1910. 06Z CLR 1910. 12ZVFR..
DEN NO 6/25 LDA LOC 35R OTSDEN NO 6/26 ILS DME 35R OTSDEN NO 6/38 LDA DME 35R OTSDEN NO 7/12 DEN ALS 35R OTS TIL 152000DEN NO 13/1 FOR PUSHBACK CLEARANCE AT OATE A-8 CALL
UA RAMP ON 129.5. DEN PAGE 10-7 1ILL BE CHANGED. (DENFOPB CHIDD JWW 6/16,88)
DEN NO 13/2 FDC 8/2040 ILS 35R CRCLO VIS CAT C VIS 23/4, CAT D VIS 3. ALT MINS 900-3
DEN NO 13/3 CONSTRUCTION AREA - ON RAMP EAST ANDSOUTHEAST OF THE B CONCOURSE. AREA EXTENDING 300 FT OUTFROM THE B CONCOURSE. THE VSR IS LOCATED AT THE EDGE OFTHE OUTAGE AREA. GATES B19 AND 921 ARE OUT OF SERVICEWITH 820 TO BE OUT OF SERVICE BY 6/28/88. AREA IS
LIGHTED AND BARACADED. TAXI W/CAUTION. DURATION,APPROX. 30 DAYS. (CHIDD.GC)
CC:' 1850 80 SCT 65 104/80/46/1209/008C00 750 70 SCT 65 111/78/47/1307/010/ 705 1100 52CO 1650 C:LR 65 119/75/45/1406/011/FEW CU SW-NWCO FTII 101818 70 SCT 250 SC:T 1510 SLOT CHC: C60 BiN
TRW-A 040 AFT 2OZ. 05Z 120 SCT 0110. 06Z CLR 0110. 12ZVFR..
COS NO 13/1 USE CAUTION TAXIING INTO THE RAMP FROMTHE SOUTH. TWY A: SIGN IS LOCATED SOUTH OF TWY AS. THETWY SOUTH OF THE SIGN IS A PRIVATE TWY AND IS NOT AUZDFOR UAL AC:FT
'0 NO 13/2 CO NOT AUZ' FOR PILOT TRAINING FROM2300-0600 MDT
-DEST AREA WEATHERGJT 1850 CLR 70 094/87/45/1208/002/FEW TCU AC CIPUB 1850 CLR 00 090/87/50/1808/999/CB N CU SW-NW..'r 1843 80 SOT 65 86/48/1110/002
TAD 1850 CLR 60 104/82/42/0605/K8/FEW CU
----------------- ENROUTE TERMINAL FORECASTS-----------------ORE, FT11 111717 40 SCT 100 SCT 3110 OCNL C40 BKN 100 BKN.
19Z 40 SCT 3606. 00Z CLR. 11Z VFR. 132 MVFR CI..OMA FT11 111717 80 SCT 250 -BKN 1207 OCNL C80 BKN. 20Z
C80 BKN 1007 OCNL C20 OVC CHC CI00 VC ITRW. 06Z 80 SCT250 SCT 0906. i1Z VFR..
MSP FTIl 111717 40 SCT 250 SCT. OZ 100 SCT C250 BKN OCNLC100 BKN. 08Z CO BKN CHC C40 BKN RW-/TRW-. 11Z VFR TRW..
----------------------- ENROUTE NOTAMS------------------------ENROUTE NOTAM 50 EFF 30JUN/1988 TOCHART LO(08) PERRY IA NDB HOLDING DESIG, HOLD NORTHWEST. LEFTTURNS, 130 DEG INBND
ENROUTE NOTAM 34 EFF - TOCHART LO(09) GLENO INT, REDESIG, LEFT TURNS, 064 DEG INBND
** END PART 01 OF 01 .4.
EISDR 111916 6417 0798

14156Z PID 2872 ID 075143 RTO KOS
~I AHOC.IAHOUCIA 1 1 1cJ1 5 2699/HAL
WBM 949-11 IAH-DEN (2222Z) RT: 1 ALTNT COS
PART 01 OF 01 PARTS ***
****.********* ALERT ****** ALERT ****** ALERT **************** ******************************************************
DEN LLWS ALERT FROM 112100Z TO 120300ZCONDITIONS FAVORABLE FOR DEVELOPMENT OF CONVECTIVE LLWS. IFVIRA, CB S OR RW ARE OBSERVED OR REPORTED, EXPECT LLWS.
CO' LLWS ALERT FROM 112100Z TO 120300ZCONDITIONS FAVORABLE FOR DEVELOPMENT OF CONVECTIVE LLWS. IFVIRGA, CP'S OR RW ARE OBSERVED OR REPORTED, EXPECT LLWS.
------------------------ MAP FEATURES-------------------------MAP FEATURES UNITED STATES; 111835Z-120600ZJET CORES AT 120OZ..FROM SLE(OREG) 350/26075 TO BOI(IDA)420/26065..FROM OKC(Ok') 380/25080 TO PIA(IL) 420/26065 TOBUF(NY) 350/24075..SURFACE AT 150OZ..COLD FRONT SSWD FROM NRNIDA TO 'O'FF NRN CALIF COAST, FRONT MOVING EWD AT20INOT...LAYEFED CLOUD/R-/F BEHIND FRONT FROM WASH SWD TO NRNCALIF.. STRATUS OVER SRN CALIF COASTAL AREAS MOVING OFF-SHOREEARLY THEN MOVING BACK ONSHORE NEAR END OF PERIOD. COLD FRONTEYTENDS SWWD FROM WRN NY TO NRN IL TO SRN NEB THEN STATIONARYNWW[- THRU NEF:N WYO TO NWRN MONT COLD FRONT MOVING EWD AT 15-2KNOTS;..FEW TO SCATTERED (CHC SEVERE) DEVELOPING VCNTYSTATIONARY FROM FRONT FROM MONT SEWD TO NRN NEB. FEW TRW FROMAZ/NMEX NEWD INTO SERN WYO..SCATTERED TRW/RW OVER MOS:T OF AREAFROM TX/OK" NEWD INTO NEW ENGLAND AND EWD TO NRN FLA.CH: HEAVYTO SEVERE fRW FROM SRN NEW ENGLAND TO SCAR BY OOZ.
------------- -- ORIG-DEST-ALTNT-EATHER--------------------IAH 1852 E30 BKN 250 OVC 12 140/93/74/1809/995/THN SPOTS IOVCIAH 1752 30 SCT E250 OVC 12 147/92/74/1812/997/THN SPOTS IOVC./
002 1202 78IAH 1653 28 SCT E250 OVC 12 149/90/74/1512/999
IAH FT1' 111717 30 SC:T C80 BKN 1912020 OCNL C30 BKN CHC2TRW. 00Z 30 SCT C120 BN 1608 SLOT CHC TRW. 1lZ MVFR F.15Z MVFR CIO..
IAH NO 1/20 HIWAS OUTLET 116.6 OTSIAH NO 6/3 IAH ILS 32R GS OTSIAH NO 13/1 FDC 8/1004 ILS 8 CHO MISSED APCH
INSTRUCTIONS TO CLB TO 600 THEN CLBG LEFT TURN TO 2000HDG 035, FOR RADAR VECTORS TO DAS VORTAC OR AS ASSIGNEDBY ATC. ILS 9, ILS 14L AND VOR/DME 14L MISSED APCH CLBTO 2000 FOR RADAR VECTORS TO DAS VORTAC OR AS ASSIGNEDBY ATC. ILS 26 MISSED APCH CLB TO 600 THEN CLBO RIGHTTURN TO 2000 VIA HDO 305 FOR RADAR VECTORS TO TNVVORTAC, OR AS ASSIGNED BY ATC
IAH NO 13/2 FDC 8/1005 ILS 27, ILS 32R, VOR/DME 14LAND VOR/DME 32R MSA FROM IAH VORTAC 110-220 3100,20-110 2000
DEN; I551 CLR 50 078/96/47/6406/OO0/CB TCLU S-N

DEN 1750 CLR 60 085/84/46/0809/002/CB FRMG OMTNS S-NW/ 710 10035
DEN 1652 CLR 60 08O/81/46/1308/003/CU FRMG OMTNS S-NWDEN FTIl 111818 90 SCT 250 SCT 1612 SLOT CHC C70 BKN
TRW-A 040 AFT 2OZ. 04Z 150 SCT 1910. 06Z CLR 1910. 122VFR..
DEN NO 6/25 LDA LOC 35R OTSDEN NO 6/26 ILS DME 35R OTSDEN NO 6/39 LDA DME 35R OTSDEN NO 7/12 DEN ALS 35R OTS TIL 152000DEN NO 1?/1 FOR PUSHBACK CLEARANCE AT GATE A-8 CALL
UA RAMP ON 129.5. DEN PAGE 10-7 WILL BE CHANGED. (DENFOPB CHIDD JWW 6/16/89)
DEN NO 13/2 FDC 8/2040 IRS 35R CRCLG VIS CAT C VIS 23/4, CAT D VIS 3. ALT MINS 900-3
DEN NO 13/3 CONSTRUCTION AREA - ON RAMP EAST ANDSOUTHEAST OF THE B CONCOURSE. AREA EXTENDING 300 FT OUTFROM THE B CONCOURSE. THE VSR IS LOCATED AT THE EDGE OFTHE OUTAGE AREA. GATES 919 AND B21 ARE OUT OF SERVICEWITH B20 TO BE OUT OF SERVICE BY 6/28/89. AREA ISLIGHTED AND BARACADED. TAXI W/CAUTION. DURATION,APPROX. 30 DAYS. (CHIDD.GC)
COS 1850 80 SCT 65 104/80/46/1209/008COS 1750 70 SCT 65 111/78/47/1307/010/ 705 1100 52COS 165C0 C:LR 65 119/75/45/1406/011/FEW C .W-NW
COS FTII 101818 70 SCT 250 SCT 1510 SLL.," CHC C60 BKNTRW-A 040 AFT 20Z. 05Z 120 SCT 0110. 06Z CLR 0110. 12ZVFR..
COS NO 13/1 USE CAUTION TAXIING INTO THE RAMP FROMTHE SOUTH. TWY A3 SIGN IS LOCATED SOUTH OF TWY A3. THETWY SOUTH OF THE SIGN IS A PRIVATE TWY AND IS NOT AUZr'FOR UAL ACFT
COS NO 13/2 COS NOT AUZD FOR PILOT TRAINING FROM2300-0600 MDT
--------------------- DEST AREA WEATHER-----------------------GIT 1850 CLR 70 094/87/45/1208/002/FEW TCU AC CIPUE' 1850 CLR 90 090/87/5'/180'8/999/CB N CU SW-NWBJC 1848 90 SCT 65 96/48/1110/002TAD 1850 CLR 60 104/82/42/0605/008/FEW CU
-ENROUTE TERMINAL FORECASTS
MSY FTI1 111717 20 SCT 100 SCT C250 8KN 2208 OCNL C20 BKN100 BKN CHC CIO OVC ITRW 035. 04Z 10 SCT 20 SCT CeO BKN2106 OCNL CIO BKN C20 BKN 80 OVC CHC C10 OVC ITRW 035.11Z 10 SCT C20 BKN 80 OVC 3F OCNL C10 BKN 20 OVC SLOT CHCTRW. 12Z MVFR. 15Z VFR..
OKC FT11 111717 40 SCT CI0 OVC 1610 CHC C20 OVC 2TRW.03Z 100 SCT 250 SCT 1508. 1IZ VFR..
DFW FT11 111717 12 SCT C25 BKN 1808 OCNL C12 BKN 3R-F CHCTRW. 20Z C30 BKN 1808 CHC CI0 X 2TRW. 04Z C15 OVC 1808CHC TRW. 11Z IFR CIO TRW. 15Z MVFR..
PUB FT11 111818 90 SCT 250 SCT 1410 SLOT CHC C70 BKNTRW-A 040 AFT 20Z. 05Z 120 SCT. 06Z CLR. 12Z VFR..

P lREP$
MLC UA IC PCO 27C010/TM 1728/FL310/TP B737/TB LOT RIME
--- - - ENROUTE NOTAMS
EN:CtUTE NOTAM I-- EFF 18APR/1521Z TO;/10r:'I FDC AIRWAY TX. V6. V198 COMFY.TX INT TO SAT VORTAC MEA
4000. (ExcirD' 18APR88 AR)
ENROUTE NOTAM 04 EFF 02MAY/1951Z TOFDC 8/1217 AIRW4YS, TX. V161 BETWEEN MILSAY /MC!P/ VORTAC AND
POLVA INT., TX. MOCA 2500.
ENRC'LITE NOTAM 2- .FF 01APR/2151Z TO UFNFro: /',7 V74 FROM TULSA, OK. VORTAC TO OWETA, OK INT. MOC.A TO
READ 280C)FT
ENROUTL NC.-,IAM _':4 EFF - TOCHAF.T LO( '' ;-LEN':' INT. RF'E':.IG. LEFT TURNS, 064 DEC, INBND
END FA:r O; OF 01 **
EID : 6.C -!.41 14:'- 7 2
14; ;-:.-2 ,EI' 14 1;" ClI I (-'7514 -. FROiM PF r 2S.72 TO PID r4_.-.7:,1

2 141531Z AGENT KOS ID 075143 FROM PIC 2872 TO PID 6891
141531Z PIC 2872 ID 075143 RTO KOS
DSMO0.DSMOOUA 111907 346
WBM 305-11 DSM-DEN (2213Z) RT: I ALTNT COS
40?-11 DEN-BIL (00402) RT: I ALTNT GTF
BIL-GTF (01461) RT: I ALTNT BIL
* PART 01 OF 01 PARTS ***
** ** * ** ALERT ****** ALERT ****** ALERT *************t
DEN LLWS ALERT FROM 112100Z TO 120:00ZCONDITIONS FAVORABLE FOR DEVELOPMENT OF CONVECTIVE LLWS. IFVIRGA, CB'S OR RW ARE OBSERVED OR REPORTED, EXPECT LLW..
COS LLW$ ALERT FROM 1i21COZ TO 120300ZCONDITIONS FAVORABLE FOR DEVELOPMENT OF CONVECTIVE LLW.. IFVIRiA, CB'S OR RW ARE OBSERVED OR REPORTED, EXPECT LLWS.
PIL LLWS ALERT FROM 112200Z TO 120-:002CONDITIONS FAVORABLE FOR DEVELOPMENT OF CONVECTIVE LLWS. IFVIRGA, CE-S OR RW ARE OBSERVED OR REPORTED, EXPECT LLWS.
OTF LLW$ ALERT FROM 112200Z TO 120300ZCONDITIONS FAVORABLE FOR DEVELOPMENT OF CONVECTIVE LLWS. IFVIRGA, C'B'S OR RW ARE OBSERVED OR REPORTED, EXPECT LLWS.
------------------------ MAP FEATURES-------------------------MAP FEATURES UNITED STATES 111835Z-120600ZJET CORES AT 120OZ..FROM SLE(OREG) 350/26075 TO BOI(IDA)420/26065..FROM OKC(OK) 380/25080 TO PIA(IL) 420/26065 TOBUF(NY) 350/24075..SLRFACE AT 150OZ..COLD FRONT SSWD FROM NRNIDA TO OFF NRN CALIF COAST, FRONT MOVING EWD AT20KNOTS..LAYERED CLOUDS/R-/F BEHIND FRONT FROM WASH SWD TO NRNCALIF.. STRATUS OVER SRN CALIF COASTAL AREAS MOVING OFF-SHOREEARLY THEN MOVING BACK ONSHORE NEAR END OF PERIOD. COLD FRONTEXTENDS SWWD FROM WRN NY TO NRN IL TO SRN NEB THEN STATIONARYNWWD THRU NERN WYO TO NWRN MONT COLD FRONT MOVING EWD AT 15-20KNOTS..FEW TO SCATTERED (CHC SEVERE) DEVELOPING VCNTYSTATIONARY FROM FRONT FROM MONT SEWD TO NRN NEB. FEW TRW FROMAZ/NMEX NEWD INTO SERN WYO..SCATTERED TRW/RW OVER MOST OF AREA

FROM TX/OF' NEWD INTO NEW ENGLAND AND EWD T' NRN FLA.CH- HEAVY
TO SEVERE TRW FROM SRN NEW ENG'LAND TO SCAR BY O0Z.
-ORIO-DEST-ALTNT-WEATHER--------------------
D-:EM 1550 3:0 SCT 250 -BKN 15 156/83/64/3611/001/FEW CUDSM 1751 50i S.CT 250 -BKN 15 155/86/60/0106,/001/FEW CU/ 603 1151
64DSM 16.51 80 SCT 250 -BF:N 15 155/85/59/030,/001
DSM FTII 111717 80 SCT 250 -BKN 0806 OCNL CSO BKN SLOTCHC TRW-. 23Z 60 SCT 250 -BKN 1108 CHC C50 OVC 5TRW- AFTOZ. 11Z VFR..
DSM NO 13/I EFFECTIVE MAY 31 1988 FROM 1300 UNTIL2200 JUL 8 1988 PARTIAL RAMP RECONTRUCTION ON ELLIOTTFLYING SERVICE AND VAN DUSEN FBO APRONS. CAUTION: MEN
AND EOUIP WORfING ADJACENT ACTIVE TAXI LANES.(29JLIN*.-PAE)
DSM NO 13/2 SOUTH TERMINAL RAMP EXCAVATION WITH : FT
DEPRE.SION. TAXI AREA TO GATE A-2 BTWN AREA OF
CONS=TRUCTION AND TERM SUIDLING-TAXI LINE HAS, BEENPAINTED. (TIL ALIG15 .J.P.D. )
1- M NO 13/s: GATE A-4 OUT OF SERVICE UNTIL FURTHERNOTICE. (JPD 6/15)
DEN 1851 CLP 50 078/6/47/0406/000/C TC.U .-NDEN 1750 CLR 60 (:.4/4610809/002/CD FRMO, OMTNS S-NW/ 710 l,'C:t
DEN 16,52 CLR 60 O'/81/46/13T3/03/CL FRMG OMTN'., !-.-NWDEN FT11 111SIS 90 SCT 250 SCT 1612 SLOT CHC C70 BN
TRW-A 040 AFT 20Z. 047 150 SCT 1910. 0-Z CLR 1 10. 127VFP..
DEN NC- 6/25 LDA LOC'C 35R OT!DEN NO 6/26 ILS. DME ::5R OT5DEN NO 4/SS LDA DME 35R OTS
DEN NO 7/12 DEN ALS 35R OTS TIL 152000DEN NO 13/I FOR PUSHRACK CLEARANCE AT GATE A-8 CALL
UA RAMP ON 12-.5. DEN 'AGE 10-7 WILL BE CHANGED. ([DENFI:PB CHIDD JWW 6/16/8'-)
DEN NO 13/2 FDC: 8/2040 ILS 35R CRCLO VIS CAT C VIS 232/4. CAT D VIS 3. AL.T MINS 900-3
DEN NO 13:/3 CONSTRUCTION AREA - ON RAMP EAST ANDSOUTHEAST OF THE P CONCOURSE. AREA EXTENDING 300 FT OUTFROM THE B CONCOURSE. THE VSR IS LOCATED AT THE EDGE OF
THE OUTAGE AREA. GATES B19 AND B21 ARE OUT OF SERVICE
WITH B20 TO BE OiiT OF SERVICE BY 6/28/88. AREA I:
LIGHTED AND BARACADED. TAXI W/CAUTION. DURATION.APPROX. 30 DAYS. (CHIDD.GC)
CO'S 1850 80 SCT 65 104/80/46/1209/003
COS 1750 70 SCT 65 111/78/47/1307/010/ 705 1100 52COS 1650 CLR 65 119/75/45/1406/011/f-EW CU SW-NW
COS FT11 101918 70 SCT 250 SCT 1510 SLOT CHC C60 BK.N
TRW-A 040 AFT 2OZ. 05Z 120 SCT 0110. 06Z CLR 0110. 12ZVFR..
COS NO 13/1 USE CAUTION TAXINo INTO THE RAMP FROMTHE SOUTH. TWY A3 SIGN 15 LOCATED SOUTH OF TWY A3. THETWY SOUTH OF THE SIGN IS A PRIVATE TWY AND IS NOT AUZDFOR UAL ACFT
COS NO 13/2 COS NOT AUZD FOR PILOT TRAINING FROM
2300-0600 MDT
BIL 1550 120 SCT 250 -BKN 50 052/85/50/1709/980/ DSDNT CLI S-NWAND NE
BIL 1751 120 -SCT 250 -SCT 5 065/80/50/1404/98:/ TCU SE-SW/6191231 61
BIL 1649 120 SCT 250 -BKN 50 072/77/50/0906/985/ TCU OVR MTNS:8II. FT1I 111818 120 SCT 250 -BKN 0O12022 OC;NL 60 SCT 120

SCT. 23Z 60 SCT 120 SCT 0912022 OCNL 60 SCT C120 BIVN CH'-C:45 BKN TRW-A 040. 05Z 60) S-T C120 BKN 2807 C.HC C45 BkrTRW- 030. 12Z VFR TRW..
BIL NO 6/10 9R-27L/16-34 CLSD TIL 122300BIL NO 7/18 BIL 4-22 CLSDBIL NO 13/1 TOWER CL5D 0500-1200Z(2300-O600MDT). WHN
TWR CLSLD/C:ONTAC:T'BIL RADIO(FSS) ON 124.2 FOR TRAFFIC
AND WEATHER INFORMATION. ALL NAVAIDS MONITORED
(04/03/88 JR)
GTF 1850 120 SC.T 250 -OVC: 45 032/83/40/n7/973/TC -.W 04COASNE-E AND SW-NW
GTF 1750 200 -SCT 250 -OVC 45 041/81/48/1306/?76/ACCAS NE-E/819 1181 62
OTF 1650 120 SC:T 200 -SCT 250 -BKN 45 050/77/47/1904/978/AC:CASALO S VIRCA E
CTF FT11 111818 12( SCT 250 -BKN 2012022 OCNL 60 SCT 120SCT. 21Z 60 SCT 120 SCT 2712022 OCNL 60 SCT.0120 b:N i:H:
C:45 B1N TRW-A 040. OOZ 60 SCT C120 PKN 26140:4 OCNL 045BP:N TRW-A 040. 05Z 60 SCT C120 BKN 2514024 CHO C45 BrTRW- 030. 12Z VFR TRW..
GTF NO 5/2 16-34 CMSN 6350X150 ASPH/HIRLGTF NO 13/1 TOWER CLSD 0500-1200Z (2300-0600MDT)• WHN
TWR CLSD/ CONTACT GTF RADIIO(FSS) ON 118.7 FOR TRAFFIC
AND WEATHER INFORMATION, ILS 3 AND ILS 34 UNMONITIOREnr.
ILS 34 OUT OF SVC INDFLY (04/03/8)8 JR)
--------------------- DESi AREA WEATHER-----------------------G.JT 1:0 C:LR 70 094/87/45/128/002/FEW TCU AC CIPU 1E:50 CLR '0 090C/F7/50/1808/999/C8 N CU SW-NW.JC 1848 SO SCT 65 86/48/1110/002TAD 1-50 CLR 60 104/82/42/0605/08/FEW CUE I N 8.51 1 '. SET E250 BV-N 30 03'1/84 / 4 7/3507/-$0'_HI 8'50 80 SCT 25C, SCT 80 064/87/51/I01:/63PAP' I152 30 SCT 40 11S/78/5 /1215021/ 5PTM 1851 ESO BK[N -50 EON 40 036/NW/3,/IIO7/9851RW' NWMSO 1848 70 SCT 110 SCT 250 -OVC 30 040/81/46/3405'/7HLN 1852 80 SCT 150 SCT 200 SCT 300 -BKN 40 031/87/47/0811/97?/
BLDG CLl SW ACC:AS E
LWT 1852 100 SCT E200 BKN 50 M/82/49/I110/98/MDT C.U ALOD'.FCA 1854 65 SCT 100 SCT 250 SCT 40 036/77/53/3610/069/TCU $-NWHVR 1852 AMOS 70 SCT 120 SCT 200 SCT 250 -BKN 65 034/ 87/4 /
2104/96) P: WND ; 000 /WSHFT 04 ACCAS S+W RS 1848
----------------- ENROLITE TERMINAL FORECASTS:-----------------OMA FT11 111717 80 SCT 250 -BKN 1207 OCNL C80 BKN. 20Z
C.0 BKN 1007 OCNL C20 OVC CHC CIO OVC 1TRW. 06Z SO SCT250 SCT 0906. I1Z VFR..
MSP FT11 111717 40 SCT 250 SCT. OOZ 100 SC.T C250 BIKN OCNLC100 BKN. 08Z 08O BKN CHC C40 BKN RW-/TRW-. 11Z VFR TRW..
PUB FT11 111818 90 SCT 250 SCT 1410 SLOT CHC C70 BKN
TRW-A 040 AFT 2OZ. 05Z 120 SCT. 06Z CLR. 122 VFR..CYS FT1I 111818 50 SCT 250 -BKN 1710. 21Z 50 SCT 100 SCT
C250 BKN 1612 OCNL C50 BKN CHC TRW- 030. 03Z 60 SCT 250
SCT. 12Z VFR NO CIG..
CPR FT1I 111818 45 SCT 250 -WKN 2112. 21Z 45 SCT 250 -BKN
2112020 OCNL C45 BKN SLOT CHC TRW- 030. 03Z 50 SCT 250SCT. 12Z VFR NO CIO..
----------------------- ENROUTE NOTAMS------------------------ENROUTE NOTAM 50 EFF 30,JUN/'988 TO
CHART LO(08) PERRY IA NDB HOLDING DESIG, HOLD NORTHWEST. LEFT
TURNS. 130 DEG INBND
ENROUTE NOTAM 34 EFF - TOCHART LO(09) OLENO INT, REDESIO, LEFT TURNS, 064 DEG INBNr

APM'DIX 2 - Comuniications
a. Transcription of ATIS Messages
b. Transcription of Tower GCmmunications

AflS-X:
Stapleton Arri"8l information X-r.3y, two one four fiv ZuluTemi>pracure 85, de-WpoLnt 44, wind zero nine zero at threeAltimeter two niner niner five. Expect visual approach runwaystwo six left, two six right, lvnway two five right.Notice to Airmen: Use caution for construction on southeastcorner of the Bravo Concourse. Microburst advisories in effect.Low level windshear advisories in effectDoppler radar windshear demo in progress. VFR aircraft southand east contact Dener approach on 119.3, other VFR aircraft
.126.9. All aircraft advise on initial contact you haveinformation X-ray.
ATIS-Y
Stapleton Airport information Yankee. Two two zero zero Zulu.Temperature 84, dewpoint 54, wind calm. Altimeter two ninerniner six. Expect visual approach runway two six left, two sixright, and two five. Caution for construction southeast cornerof Bravo concourse. Microburst and low level %indshear advisoriesare in effect. Doppler radar windshear demonstration in progress.Convective SIGMET three six Charlie is in effect for Nebraska,and Eastern Colorado for an area of severe thunderstros. ContectDenver Flight Service for further details. VFR aircraft southand southeast, contact Denver Approach on 119.3, other VFR qircraft126.9. All aircraft advise on initial contact you have informationYankee.
ATIS-A
Stapletion Arrival information Alpha. Two two zero three Zu'u.Seventy five hundred scattered, estimated ceiling one two thousandbroken, two five thousand broken, visibility five zero, thunderstorm.Tei.perature 84, dewpoint 54, wind calm. Altimeter two niner niner six.Expect visual approach runway two six left, two six right. Runwaytwo five may be assigned. Use caution for construction area off southeastcorner of the Bravo Concourse. Convective SICMET 36 Charlie is in effectfor northeaswt Colorado. Contact Denver Fli;.ht Service for details.
Microburst arvisories and in effect. Low level windshear advisories arein effect. Doppler radar windshoar demo in progress. Advise on initialcontact you have information Alpha.

TRANSCRIPT OF TN ER m0rV.CATIONS, DE: LJ-2, 7,11/88
LC-2 Airborne:(Denver Tower)
22:07:0522:07:0622:07:0722:07:0822:07:0922:07:10
-22:07:1122:07:12 LA862: AnO Denver tower United 86222:07:13 just outside Altur, visual to22:07:14 the right, say your winds please22:07:15 and we re going to alpha 822:07:1622:07:1722:07:18 United 862 Denver Tower22:07:19 Runway two six right, Cleared22:07:20 to land, Microburst Alert,22:07:21 center field wind two two zero22:07:22 at niner, a four zero knot22:07:23 loss final reported by22:07:24 machine, no pilot report22:07:2522:07:2622:07:2722:07:2822:07:2922:07:3022:07:31 UA3q5: United 395 inside Altur22:07:3222:07:3322:07:3422:07:35 United 395 Denver Tower. Runway22:07:36 two six left, cleared to land.22:07:37 Wind two one zero at five, a four22:07:38 zero knot loss one mile final,22:07:39 Microburst Alert, not substantiated22:07:40 by -ircraft22:07:4122:07:4222:07:4322:07:44 UA395: United, uh, 39522:07:4522:07:46 U1" :ed 395, Say your gate22:07:4722:07:48 Unkiwn:Approach, we don't want to22:07:49 make the approach with a22:07:50 Microburst Alert22:07: 5122:07:52 'ho didn't want to make the22:07:53 um wio wants to go missed?22:07:5422:07:5522:07:56 UA862: Uh, 862, we'd like to go22:07:57 to the right if we can.22:07:5822:07:59

22:08:00 United 862, change to runway three22:08:01 five right, cleared to land. I
22:08:02 do hav: a Microburst Alert to that
22:08:03 runway, wind three five zero at22:08:04 fifteen, a forty knot loss on22:08:05 thrue mile final22:08:0622:08:0722:08:0822:08:0922:08:10 1A862: Uh, we don't wanna make any
22:08:11 approach. We'd like to go
22:08:12 ahead and hold somewhere
22:08:13 til you stop gettin' the
22:08:14 Microburst Alerts.
22:08:15 Standby22:08:1622:08:1722:08:1?22:08:1922:08:2922:08:2122:08:2222:08:2322:08:2422:08:25 United 862 turn right headinz22:08:26 zero four zero maintain 800022:08:2722:08:2822:08:2922:08:3022:08:3122:08:3222:08:3322:08:3422:08:3522:08:3622:08:3722:08:3822:08:3922:08:4022:08:4122:08:4222:08:4322:08:4422:08:4522:08:4622:08:4722:08:4822:08:4922:08:50 United 862 contact Denver22:08:51 Approach one two five point22:08:52 three22:08:5322:08:54 UA862: Twenty five three, United 862
22:08.5522:08:5622:08:5722:08:58 UA395: and Unitpd 395, we're missing22:08:59

22:09: 0022:09:0122:09:02 tP.it& 395, roger, fly runxay22:09:03 heading, climb maintain 700022:09:0422:09:05 UA395: 700022:09:0622:09:0722:09:0822:09:0922:09:10 United 395, turn right, heading22:09:11 zero one zero, climb maintain22:09:12 800022:09:13 UA395: Okay, say that heading again22:09:1422:09:1522:09:16 Turn right heading zero one22:09:17 zero, climb maintain 800022:09:18 United 39522:09:1922:09:20 UA395: Zero one zero, 8000, Unitee 39522:09:2122:09:2222:09:23 UA236: United 236 heavy, Sky Ranch22:09:24 for the ]pft one, we have22:09:25 Buffale r for gate22:09:2622:09:2722:09:28 United 236 heavy, Denver tower,22:09:29 Microburst Alert threshold wind22:09:30 one four 7zero at five expect a22:09:31 five zero knot loss two mile22:09:32 final, runway two six left22:09:33 cleared to land22:09:3422:09:35 UA236: Cleared to land22:09:3622:09:3722:09:3822:09:3922:09:4022:09:4122:09:4222:09:4322:09:4422:09:4522:09:4622:09:4722:09:4822:09:4922:09:5022:09:5122:09:5222:09:53 UlA395: And you say 8000 for22:09:54 United, uh, 39522:09:5522"09:5622:09:57 Yeah 395, affirmative,22:09:58 climb maintain 8000, heading22:09:59 zero one zero

22:10:0(:22: 10:0122:10:0222:10:0322:10:0422:10:0522:10:0622:10:0722:10:0822:10:0922:10:10
.22:10:1122:10:12 united 395 fly heading22:10:13 zero three zero for right22:10:14 now pl ise22:10:1522:10:1622:10:17 UA395: Okay, zero three zero, 395
22:10:1822:10:1922:10:2022:10:2122:10:2222:10:2322:10:2422:10:2522:10:2622:10:2722:10:2822:10:2922:10:3022:10:31 United 395 contact Denver Approach22:10:32 one two eight point zero five22:10:3322:10:34 UA395: One two eight zero five
22:10:3522:10:3622:10:3722:10:3822:10:3922:10:40 UA236: Uh, ve're going around
22:10:41 United 236 heavy22:10:4222:10:43 United 236 heavy, roger, fly22:10:44 runway heading climb maintain22:10:45 700022:10:4622:10:47 UA236: 700022:10:4822:10:4922:10:50 UA949: Hey tower, United uh 949
22:10:51 is marker inbound22:10:5222:10:5322:10:54 United 949 caution wake turbulence22:10:55 from the heavy DC-8 goir around
22:10:56 Microburst Alert threshold wind22:10:57 zero nine zero at three, expect a22:10:58 seven zero knot loss on a three22:10:59 mile final.

22:11:0022:11:0122:11:0222:11:0322:11:04 UA949: Unite 94922:11:0522:11:0622:11:0722:11:08 United uh 236 heavy right22:11:09 turn heading zero one zero22:11:10 climb maintain 800022:11:1122:11:1222:11:13 UA236: zero one zero roger22:11:14 236 heavy22:11:1522:11:1622:11:1722:11:1822:11:19 * unintelligible**22:11:2022:11:2122:11:2222:11:2322:11:2422:11:2522:11:2622:11:27 Uh, Microburst Alert rumwsy22:11:28 two six, threshold windh one five22:11:29 zero at five, expect an eight zero22:11:30 knot loss on a three mile final22:11:3122:11:3222:11:3322:11:3422:11:3522:11:3622:11:37 UA305: United 30---22:11:38 UA949: And United 949 we're going22:11:39 around22:11:4022:11:41 United 949 fly runway heading22:11:42 climb maintain 700022:11:4322:11:44 UA949: Climb 7000, United 94922:11:4522:11:4622:11:4722:11:4822:11:49 United 305 Microburst Alert22:11:50 threshold wind one six zero at22:11:51 six, expect an eight zero knot22:11:52 loss on three mile final22:11:53 Say request22:11:5422:11:5522:11:5622:11:5722:11:58 UA305: You say eight zero knots?22:11:59

2: 12:0O Aff irmativ,22:12:0122:12:02 Affirnative United 30522:12:0322:12:0422:12:05 UnImnn: And he's correct22:12:0622: 12:07 Unkrwr., (different): And we22:12:08 can confirm it.22:12:0922:12:10 United 305 What's your.22:12:11 request?22:12:12 UA395: United 305's going around22:12:1322:12:14 United 305 roger, fly runway22:12:15 headinq, climb maintain22:12:16 uh 7000 for now22:12:17 UA395: runway heading to 700022:12:18 United 30522:12:1922:12:20

APPENDIX 3 - Flight Drta Rev~ orders
a. FDR data Flight 395/1l
b. FDR data Flight 226/li
c. Fl3R date3 Flight 949/11
d.FDR dr-a F1 iant -:05,/) 1
To be supplied by acddenclum at a la;-.er da;te

0 '0 'NOIONIHSVM)9010NH03 jo flVJ3fl
O VOB A1J.BVS NOIllVi~OdSNVI. 1VNOIiVN
zrtz22i4: Y' §~ 'P -- I__ -- -~C_
- -~ - - - -- - - - - - 1
-00 to - 00
_~t 100
-- ~~~~1 V#- i - - - - - - _

'0 0 'NO.LDNIHSVMAk5OlONH)31J. O flY38fl
C O AJVS NOliVJ.8OdSNV81 IVNDIJ.VN
~~-1~D c~ 00 1-
_ _ _ _ _1'.00
I _X ~-- - -I -- - -- Z 00
Sgo -00
___ - - - - - - - - - - - - - -- ~ ~ LL
-- F - -
I- V I oo
--------------------------------------------- e I AOA---------- - - - - -I I I - --

Z 0'NOiONIHSVM)C91ONH03i o fV3fl9
%V9 I~V&NOlii8OdSNV~iI VNOI iVN
-1T-
-----------------I
S -to J - to
--------.- -i-~s -c - - - - - - --

,, ,i iI I
4 c SC.~
.405
00. 02c 03 . cc t -
00 -. oo- 0
00.012 L "
oo~IoI,.,o _p- . _. .__ .---
00 04 00
90 , ¢0
00 0,, 0 <"it fIF---'------- - I _
0-- o----"-dz1
00 P/--
ioo r o!
i -j- - - -- - - .
WASHINGTON, D. C.
/A I 'A,, -
--- €
0AI I' I
.0 9i40
1014.- - ---
~NATIONAL TRANSPORTATION SAFETY BOARD
BUREU OFTECHNOLOGYWASHINGTON, 0. C.
.OCAIOHw IEM~tS GIL. ICIIIIS I, I AISCNILI 14*1SAtE JILT II SoIl aecemlEMl SI, VIINOSN
$PESISR dNIlI A ll LIkES SEPlU! MS. 1 n-501
9l.V Ii

I l 106 1 3* JOG
*0 A 'NO19NIHSVM) OOONH)3i do flV3Ufl
OUVOG IkJ13 VS NOI1Vi8OdSNV~J. IVNOIJ.VN
0,mC
I F1
I - i~*~tl 00 te
Lip _--------- - - -- 1---- QC
-- - - - -7 -t -- -
- -- ( - -d - i -4 4 - -4------ -l ----
Liz2/1 -- .
d - - - - - - - - - - -3
P,-- -- - - - - - - - -so I

APPENDIX 4 - Training
a. Microburst Windshear Probability Guidelines(from. FAA Windshear Training Aid, Section 2)
b. Adverse Weather Section - Windshear (B-727, typicalall fleets)Issue. 15 July 1987, first inserted Surmmer, 1984
c. Surg-er Operations Bulletin (#175, B-727, tyoical'. fleets)Issued 1.6rch 15, 1988
d. Denver Low Level Windshear Alert System andTerminal Dopplcr W;eather Radar OperationalDemonstration (4177, B-727, typical all fleets)Issued June 24, 1988

TABLE I
MICROBURST WINDSHEAR PROBABILITY GUIDELINES
OBSERVATION PROBABILITY
OF WINDSHEAR
PRESENCE OF CONVECTIVE WEATHER NEAR INTENDED FLIGHT PATH:
- With localized strong winds (Tower reports orobserved blowing dust, rings of dust,tornado-like features, etc.) ......................... HIGH
- With heavy precipitation (Observed or radarindications of contour, red or attenuation shadow) ... HIGH
- With rainshower ...................................... MEDIUM- With lightning ....................................... MEDIUM- With virga ........................................... MEDIUM- With moderate or greater turbulence (reported or- radar indications) ................................... MEDIUM- With temperature/dew point spread between
30 and 50 degrees fahrenheit ......................... MEDIUM
ONBOARD WINDSHEAR DETECTION SYSTEM ALERT (Reported
or observed) .......................................... HIGH
PIREP OF AIRSPEED LOSS OR GAIN:
15 knots or greater .................................. HIGHLess than 15 knots ................................... MEDIUM
LLWAS ALERT/WIND VELOCITY CHANGE
20 knots or greater .................................. HIGHLess than 20 knots ................................... MEDIUM
FORECAST OF CONVECTIVE WEATHER .................................... LOW
NOTE: These guidelines apply to operations in the airport vicinity (within3 miles of the point of takeoff or landing along the intended flightpath and below 1000 feet AGL). The clues should be considered cumu-lative. If more than one is observed the probability weightingmhould be increased. The hazard increases with proximity to theconvective weather. Weather assessment should be made continuously.
CAUTION: CURRENTLY NO QUANTITATIVE MEANS EXISTS FOR DETERMINING THE PRESENCEOR INTENSITY OF MICROBURST WINDSHEAR. PILOTS ARE URGED TO EXERCISECAUTION IN DETERMINING A COURSE OF ACTION.
Page 36

ADDITIONAL PROCEDURESunrTED
[ WINDSHEAR AVOIDANCE IS THE FIRST PRIORITYUnited Airlines policy is to avoid areas of known
DEFINITIONS windshear, Consider one or more of the followingWINDSHEAR - Any rapid change in wind direction actions as appropriate:or velocity. - Delay takeoff until conditions improve.
SEVERE WINOSHEAn - A rapid change in wind - In flight, divert around the area of known windshear.
direction or velocity that results in airspeed changes - If windshear is indicated during approach, initiate a
greater than 15 knots, or vertical speed changes go-around or hold until conditions improve.greater than 500 fpm.
FLIGHT CREW ACTIONSFlight crew actions regarding windshear are dividedinto five areas: Avc.idance, evaluation, standardoperating techniques, precautions and recovery.The following flow chart summarizes the actionitems and presents the operational windsheardecision from the pilo*'s viewpoint.
Evaluate weather and condi-tions.
Any signs of windshear? -YES Reevaluate weather andNO SEARCH for all indications
NO of windshear.
Is it safe to continue? YES O Consider precautions.
NO
LAvoid or dlay
Follow established standard operating techniques.
Recover from inadvertent windshear encounter.
1. Thrust - Max rated2. Pitch - Rotate towards 15 Degrees3. Control flight path with pitch as necessary4. Maintain configuration
Report ttr encounter to the tower
LJI'L 15. 87 727 FLIGHT MANUAL 722
A-30 HANDBOOK

a I ADDITIONAL PROCEDURF"
WEATHER EVALUATION - TURBULENCE: Moderate or greater turbulence
Detection of windshear is difficult with today's may be associated with the outflow from atechnology. In order for the pilot to successfully microburst.avoid windshear, it is necessary to develop an - WEATHER RADAR EVIDENCE: Indications ofunderstanding of the causes and danger signals of weak (green) cells with bases 5000-15.000 feetwindshear. With the exception of a reliable PIREP, AGL which indicate weak precipitation, usuallythere is no single indicator which is conclusive proof VIRGA. In addition, in the DOPPLER mode, areasof a windshear Pilots should understand that the of red (doppler turbulence) surrounding weakmost dangerous form of windshear is a convective precipitation, may indicate microburst windshearmicroburst of either the dry or wet type. Some have conditions in their formative stages aloft.
been documented with wind changes in excess of - WINDSHEAR FORECAST: Potential for convec-150 knots' Because microbursts intensify for several tion; mid level moisture: very dry surface condi-minutes after they first impact the ground, the tions; 30OF to 50PF temperature/dew point spreadseverity may be up to twice as much as that which is (Windshear advisories are prepared by the UAinitially reported. Any airspeed change due to low Weather Center and are included in the weatheraltitude windshear should be immediately reported briefing message.),to ATC Dry microbursts are especially insidioussince they cannot be detected visually or with Danger Signals of Wet Thunderstorm Micro-conventional radar, bursts
- PIREPS: Actual wlndshear may be up to twice asCauses of Windshear % of Threat severe as the PIREP.
- LLWAS: LLWAS sensors are widely spacedConvective conditions may not defect all mlcrobursts In the airport.(thunderstorms, rain and and they are prone to false alarms.snow showers) 65% THUNDERSTORMS: In addition to the well known
hazards of thunderstorms, an estimated 5% ofFrontal systems 15% thunderstorms accompanied by heavy rain and/or
Low altitude jet streams 5 %/ lightning, contain embedded microbursts.
- LOCALIZED STRONG WINDS: Heavy rain, blow-
Strong or gusty surface winds 5% ing dust, rings of dust, dust devils, tornado likefeatures, and other evidence of strong local
All other causes (temperature outflow. Visual clues may be obscured by low
inversions, mountain waves, sea visibilities In wet thunderstorm mlcroburst sltua-
breeze circulations, unknown causes) 10% lions.- TURBULENCE: Moderate or greater turbulence
Danger Signals of Dry Microbursts may be associated with the outflow from a- PIREPS: Actual windshear may be up to twice as microburst.
severe as the PIREP. - WEATHER RADAR: Search the area above and- LLWAS: LL WAS sensors are widely spaced and along the takeoff and approach paths for heavy
may not detect al! milcrobursts In the airport area, precipitation.and they are prone to false alarms. - THUNDERSTORM FORECAST: Although no
- VIRGA techniques currently exist to forecast wet micro-
-TEMPERATURE/DEW POINT SPREAD of 30 to bursts, crews should consider the thunderstorm
500F. forecasts contained in the terminal forecasts and- LOCALIZED STRONG WINDS: Blowing dust, severe weather advisories as a possible indication
rings of dust, dust devils, tornado like features, and of the presence of wet microbursts.other evidence of strong local outflow near the
surface.
L722 T27 FLIGHT MANUAL .111 i 7
I I I I I I

ADDi rIONAL PROCEDURESunrreo
ICROBURST WINDSHEAR PROBABILITY MEDIUM PROBABILITYGUIDELINES Consideration should be given to avoiding. Pre-The following Table, designed specifically for cautions are appropriate.convective weather conditions, provides a subjectiveevaluation of various observational clues to aid in LOW PROBABILITYmaking appropriate real time windshear avoidance Consideration should be given to this observation.decisions. The observation weighting is categorized but a decision to avoid is not generally indicatedaccording to the following scale:
HIGH PROBABILITYCritical attention needs to be given to thisobservation. A decision to avoid (e.g. divert or delay)is appropriate.
PROBABILITYOBSERVATION OF WINDSHEAR
PRESENCE OF CONVECTIVE WEATHER NEAR INTENDED FLIGHT PATH:
- With localized strong winds(Tower reports or observed blowing dust, rings of dust, tornado-like features, etc.) ........... HIGH
- With heavy precipitation(Observed or radar indications of contour, red or attenuation shadow) ..... .............. HIGH
- With rainshower ............ .................................... MEDIUMWith liqhtning ............ ..................................... MEDIUMWith virga ............ ....................................... MEDIUM
- With moder2.e or greater turbulence (reported or radar indications) ... ............. .MEDIUM- With temperature/dew point spread between 30 to 50 degrees Fahrenheit .............. MEDIUM
ONBOARD WINDSHEAR DETECTION SYSTEM ALERT (Reported or observed) ............. HIGH
PIREP OF AIRSPEED LOSS OR GAIN:
- 15 knots or greater ........... ..................................... HIGH- Less than 15 knots .......... ................................... MEDIUM
LLWAS ALERT/WIND VELOCITY CHANGE
- 20 knots or greater ........... ..................................... HIGH- Less than 20 knots ......... ................................... .MEDIUM
FORECAST OF CONVECTIVE WEATHER ....... ........................... LOW
NOTEThese guidelines apply to operations in the airport vicinity (within 3 miles of the point of takeoff orlanding along the intended flight path and below 1000 feet altitude). The hazard increases withproximity to the convective weather. Weather assessment should be made continuously.
The clues should be considered cumulative. If more than one Is observed, the probablity weightingshould be increased.
CAUTIONCurrently no quantitative means exists for determining the presence or Intensity of microburstwindshear. Pilots are urged to exercise caution In determining a course of action.
• IL ].; K 727 FLIGHT MANUAL 7 nA-32 HANDBOOK

U AD'DITIONAt PROCEDURES
FSTANDARD OPERATING TECHNIQUES TakeoffCertain prccedures and techniques can prevent a - Use maximum takeoff thrust instead of riorma!dangerous flight path sitiition from developing, (reduced) thrusteven if unexpected windshear is inadvertently - Use the longest suitable runway.encountered. These procedures and techniques are - Consider using the recommended flap setting, 15"of such importance tnat they should be incorporated This flap setting provides the best overallinto each pilots personal standard operating tech- compromise for windshear recovery capabilitynques and practiced on every takeoff and landing, between an on the runway or airborne windshearwhether o not windshear is anticipated. It Is encounter.imnortant to develop a cockpit atmosphere which - Consider maximizing avail3ble margins betweenencourages awareness and effective crew coor- VR and stick shaker through runway selection, flapdnation, particularly at night and during marginal selection and delayed rotation. The delayedweather conditions, rotation speed must not exceed either: 1) the
runway limit VR speed or 2) a 20 knot increase. ForTakeoff example, if the actual grcss weight Is 150,000-. Be alert for any airspeed fluctuations during pounds and the runway limit is 160,000 pounds,
takeoff and initial climb. set the "bugs" for the actual gross weight, but- Know the all-engine initial climb pitch attitude. remember to rotate at the VR speed for the runway- Make a continuous rotation at the normal rotation limit weight. A normal continuous rotation to the
rate to this target pitch attitude for all non-engine target pitch attitude should be used.failure takeoffs. - Do not use any pitch mode of the flight director for
- Minimize reductions from the initial climb pitch takeoff.attitude until terrain and obstruction ciearance isassured Landing
- Develop ar awareness of normal values of - Achieve a stabilized approach by 1000 fet AGLairspeed attitude, vertical speed, and airs )eed - Consider using the recomrranded flap setting, 300buildup. - Add an approriate airspeed correction (applied in
- The pilot not flying should closely monitor the the same manner as gusts) up to a maximum of 20vertical flight path instruments such as vertical knots.speed ind altimeters and call out any deviations - Avoid large thrust reductions or trim changes infrom normal. response to sudden airspeed increases, as these
may be followed by airspeed decreases.Landing - Consider use of the autopilot for the approach to- Develop an awareness of normal values of vertical provide more monitorinq and recognition time.
speed. thrust, and pitch.- Cr:sscheck flight director commands using the RECOVERY FROM INADVERTENT WIND-
vertical flight path instruments. SHEAR ENCOUNTER- Know the recovery decision criteria and be The following action is recommended whenever
prepared to execute an immediate recovery if the flight path control beccmes marginal below 1000parameters ace exceeded. feet above the ground on takeoff or landing. As a
- The pilot not flying should closely monitor the guideline, marginal Ilight path control may bevertic3l flight path "rstruments such as vertical ind,ated by uncontrolled deviations from normalSpeoi dltimeters and glide slope displacement steady state flight conditions in excess of theand should call out any deviations from normal. following:
PRECAUTIONS - 15 knots indicated airspeedWhenever the probability of windshear exists, but 500 fpm vertical speedavoidsn'ice action is not considered necessary, the - 5 degrees pitch attitude,following precautions are recommended: 1 dot displacement from the glide slope, or
unusual throttle cuosition for a significant period of
L
time.
7 22 727 FLIGHT MANUAL JUL i5,/87HANDBOOK A-33

ADDITIONAL PROCEDURES
If flight path control becomes marginal at low 4. MAINTAIN CONFIGURATIONaltitude, accomplish the following procedure without Do not change flap, gear, or trim position untildelay The first two steps should be accomplished terrain contact is no longer a factorsimultaneously.
Note
1, THRUST - MAX RATED It is recognized that a change in flapAggressively position the throttles to ensure maxi- position may improve windshear recovery.mum rated thrust is attained. Avoid engine This procedure however, is not recom-overboost unless necessary to avoid ground mended, since the risk of moving thecontact. When airplane safety has been insured, flaps in the wrong direction or amount isadjust thrust to maintain engine parameters considered to be greater than the risk ofwithin specified limits encountering a shear so great that a flap
change is needed for recovery.NOTE
The following is to be used if an REPORT THE ENCOUNTERoverboost is required: Report the airspeed change, location, attitude and
aircraft type to ATC as soon as practical.If an engine limitation is exceeded, whenconditions permit, log maximum indica-tions, if known, and engine indications,after thrust is returned to the normalrange. Contact SAMPAC for assistancein evaluating the engine condition.
PITCH - ROTATE TOWARD 150Disengage the autopilot and rotate smoothly at anormal rate toward a target pitch attitude of 15degrees. Stop rotation immediately if stick shakeror buffet should occur.
If a windshear ir encountered on the runwayduring takeoff and an abort is not practical, rotatetoward 150 at the normal rate of rotation by nolater than 2000 feet of useable runway remaining.
3. CONTROL FLIGHT PATH WITH PITCH ASNECESSARY
Check vertical speed and altitude. If the airplaneis descending. adjust pitch attitude smoothly andin small increments to minimize altitude loss.Always respect sticK shaker and use Intermittentstick shaker as the upper limit for pitch attitude.Rapidly changirg vertical winds can causemomentary stick shaker actuation at any attitude.
Control pitch attitude in a smooth steady mannerto avoid overshooting the attitude at which stallwarning is initiated Do not use more pitch than isnecessary to contr<ol the vertical flight path. sincethe resulting high drag and inefficient anqle ofattaci, will cause a lower recovery At:,,jdeControl column forces necessary to control theL flight path may vary from a push force to a heavy
pull force Do not follow flight director commands
J1 I I- -7 727 FLIGHT MANUAL 722
A-34 HANDBOOK

aLWGB-727 FLIGHT MANUAL - HANDBOOKBULLETIN #175MARCH 15/88FROM: DENTK - FLIGHT STANDARDS AND TRAINING
Please insert following the BULLETINS tab. Record on the BulletinChecklist.
SUMMER OPERATIONS
GENERAL
Spring and summer are the times when convective weather presents thegreatest problems for United flights, resulting in traffic delays,re-routing, turbulence, turbulence related injuries and lessfrequent but more critical low level windshear.
Turbulence related incidents causing injury to passengers and/orflight crews from convective weather and CAT were down in 1987 to 68incidents compared to 87 incidents in 1986. While the trend isdown, we must continue to improve in this area.
Turbulence associated.with thunderstorms can be detected because ofthe radar's ability to observe water droplets. The intensity ofturbulence, in most cases varies directly with the intensity ofprecipitation.
Radar will detect various levels of precipitation within the storm.With the non-color radar in the contour mode, heavy rain fallrates are indicated by the well defined black core. On a colorradar, strong echos will be displayed by a yellow area or possiblya red area. Plan your deviation path early, and remember,turbulence can extend several thousand feet above a storm andoutward more than 20 miles. Refer to the FOM, pp. 109-112 for thesuggested margins for avoidance.
TURBULENCE
Clear Air Turbulence Forms in regions of vertical windshear andtemperature discontinuities. One part of the atmosphere that meetsthe above criteria is the tropopause. The layer at or just belowthe tropopause becomes a favored location for the development ofCAT. Other layers can develop similar wind/temperature profilesthat will result in clear air turbulence. Large temperature and/orwind variations, particularly over short distances, or any waveactivity, should be viewed as precursors to CAT.
Passenger/Flight Attendant Considerations In Turbulence Wheneverpossible, advise the First Flight Attendant before or shortly aftertakeoff of anticipated enroute turbulence so that activities can beplanned accordingly.
706 77 FLISNT MANUAL BULLETIN 0175NAIIOOK PAGE 1 o 8

Uuin
When Turbulence Is Encountered If light turbulence, turn on theseat belt sign and make a PA announcement to advise passengers oflight turbulence, and to request they fasten their seat belts.
If greater than light turbulence, advise the flight attendants oninterphone to check seat belts and then be seated.
INTERNATIONAL OPERATIONS
International Flight Folder Check the high level significantweather chart for areas of forecast turbulence. This also providesinformation on tropopause heights and jet core location, altitudeand speed.
Check the flight folder to see if any sigmet messages have beenincluded.
Flight Plan Forecast (FPF) Check the FPF for cruise altitude inrelationship to the tropopause, and look for any suspectwind/temperature patterns. Large changes in wind speed/directionbetween fix points are indicative of shears. Large temperaturechanges are indicative of tropopause penetration.
ENROUTE - INTERNATIONAL AND DOMESTIC
Check with ATC for reports of turbulence. Monitor temperature andwinds for rapid changes. Treat all wave activity as a possibleprecursor of CAT.
Forecasts of turbulent activity, CAT and wave action are availablefrom Dispatch and are on the weather briefing message.
High altitude charts also depict areas with the most pronouncedexposure to mountain wave turbulence. When mountain wave activityis forecast or reported, alternate tracks should be considered.
The best source for overall domestic thunderstorm information is theautomated radar summary chart. They are transmitted 45 minutesafter observation time and are available to crews at the majordomiciles.
WINDSHEAR
The causes of windshear are numerous. It is estimated that 20aircraft are likely to encounter microbursts at Stapleton Airportbelow 500 feet AGL in a typical summer. Approximately one half ofthe mlcrobursts are associated with weak convection, virga andmid-level clouds, characterized by little or no precipitation atthe surface. The remainder are associated with thunderstormconvection, characterized by moderate to heavy rain.
B7 FLIGHT MANUAL 706BULLETIN 175 NAUS|OOKPAGE 2 OF 8

aunirrmo
What The Crew Can DO
Crew actions are divided into three areas: Avoidance,Prevention and Recovery. Avoidance is common to the takeoffand approach and includes the assessment of conditions that promotethe correct decision. Prevention is divided into the takeoff andlanding phase and covers recognition and action that will keep awindshear encounter from developing into a more critical situation.Recovery includes specific procedural actions when preventativeaction is not successful or sudden flight path degradation occursunexpectedly.
Avoidance
Carefully access all available information such as pilot reports ofwindshear or turbulence, low level windshear alerts, and weatherreports including thunderstorm and virga activity. If severewindshear is indicated, delay takeoff or do not continue an approachuntil conditions improve. Severe windshear is that which producesairspeed changes greater than 15 knots or vertical speed changesgreater than 500 fpm.
Prevention-Takeoff
- Use the recommended flap setting and know the runway andperformance limits.
- Use max thrust.- If practical, use the longest suitable runway, provided it isclear of known windshear.
- Know the all engine initial climb pitch attitude.- Crew coordination and awareness is very important. Be alert forairspeed fluctuations during takeoff and initial climb. Suchfluctuations may be the first indication of windshear.
- The pilot not flying should be especially aware of vertical flightpath instruments and call out deviations from normal.
Prevention-Approach and Landing
- Use the minimum landing flap position consistent with field lengthand an appropriate airspeed wind correction up to the maxrecommended.
- Avoid large thrust reductions or trim changes in response tosudden airspeed increases, as these may be followed by airspeeddecreases.
- Closely monitor vertical flight path instruments.- Crew coordination and awareness is very important, particularly at
night or in marginal weather conditions, to ensure flight pathdegradation will be recognized immediately.
706 721 FLIGHT MANUAL BULLETIN #175HANDBOOK PAGE 3 OF 8

Recovery
The flight crew must make the determination of marginal flight pathcontrol using all the information available. This determination issubjective and based on the pilots' judgment of the situation.Marginal flight path control may be indicated by uncontrolledchanges from normal steady state flight conditions in excess of:
- 15 knots indicated airspeed,- 500 fpm vertical speed,- 5 degrees pitch attitude, or- 1 dot displacement from the glideslope
Accomplish the following procedure without delay whenever flightpath control becomes marginal.
Simultaneously:
- Disengage autothrottles and aggressively position thrust leversforward to ensure max rated thrust.Disengage the autopilot and rotate toward the target pitchattitude of 15 degrees.
- Control pitch attitude smoothly in small increments to minimizealtitude loss while respecting the stick shaker.
- Do not follow flight director commands.- Do not attempt to regain lost airspeed until terrain contact is no
longer a factor.- Do not change configuration until the vertical flight path is
under control. There are enough variables to handle withoutadding more.
- Assist other pilots by reporting windshear encounters. Accuratepilot reports can be a valuable clue to the severity of awindshear condition.
BULLETIN #175 M FLIGHT MANUAL 706PAGE 4 OF 8 NANDBOOK

UI
MICROBURST WIND SHEAR
Vertical Cross Section Of Microburst Winds
It800
OW\
600
RTRONG
0 .....- :CONE :I?*-
0 2000 4=0 600 M00 10.000 12,000 ft X1013120' = 4 kmn (MISOSCALE)
ABOVE DIAGRAM 10 to I VERTICAL EXAGGERATION
PREPARATION AND REVIEW
Good preparation, sound flight planning, and heightened awarenessare key factors in avoiding summer weather related incidents. Items
to consider while operating this spring and summer are:
- Discuss with your crew anticipated weather, turbulence, and
delays, and make sure that they are well briefed on their duties.
- Check the POSBD'S and the airport briefing page (SIRD/DD041/STA/Briefing) for your original destination and alternate airports.
- If the runway is wet and considered slippery, consider usingslippery runway V1 speeds.
706 7M7 FLIGT MAIUAL BULLETIN #175NAUOM K PAGE 5 OF 8

- Be aware of possible hot starts.- Consideration needs to be given to minimal use of brakes during
taxi. A long taxi in conjunction with a long takeoff roll couldcause problems if an abort was necessary. Proper taxi techniqueand planning is essential.
- Consideration needs to be given to temperature, runway selection,flap settings and thrust applications to assure the bestperformance.
- Assure that the radar is operating properly during preflight.- Have the cabin at a comfortable temperature before the passengersboard.
- During landing, be aware of possible hazards of landing on wetrunways with crosswinds or tailwinds.
- If possible, on landing use minimum braking with more reversethrust and longer rollouts.
REFFRENCES
1. Flight Manual1) Runway clutter adjustments2) Optional V1 for slippery runway3) Additional Procedures/Bulletins
-Severe Precipitation-Severe Turbulence-Static Discharge-Windshear-Weather Radar Operations
2. Operating gross weight manual, wet runway landing weights.
3. FOMpg. 1 52, 52.1 Pilot Briefing Page
59 Dispatching to Wet and Slippery Runways109-112.2 Weather, Thunderstorms, Turbulence, Radar113 Static Discharge114.1-.5 Braking Action and Runway Conditions
Far East chapter - Meteorology Section
4. Video1) Summer Operations2) Turbulence3) Windshear
While the material in this bulletin is not new, it is important thatwe review all of the procedures associated with Summer Operations.Advance preparation will assist in ensuring an impressive safetyrecord this year.
BULLETIN #175 M FLISUT MANUAL 706PAGE 6 OF 8 NAIO00K

Uunimo
B-727 OPERATIONAL CONSIDERATIONS
There is probably nothing more uncomfortable for a passenger than toboard an airplane that is too hot. On pushback, wait until theCaptain asks for #3 engine to be started before turning off the airconditioning packs. It takes approximately 10 seconds for the ductpressure to come up while keeping the much needed airflow in thecabin for the passengers. This summer let's pay particularattention to passenger comfort in our ongoing effort to give ourcustomers the best possible service.
Tire Pressure - Indications are only valid after tires, wheels andbrakes have cooled to ambient temperature. This usually requires atleast one hour after the airplane is parked. Considering the wayour airplanes are operated, most of the time you will get anaccurate reading only before the first flight of the day.
Performance Computations - Check the maximum brake energy (MBE)charts in the flight handbook and see if V1 should be adjusted or ifanother flap selection would be better. If the runway is wet,consider clutter corrections in the flight handbook (T-4-6). Ifthere is no clutter, consider the slippery runway V1 corrections inthe bulletins (soon to be moved into the flight handbook, T-6.1).Determine which flap positions are permissible for the gross weightand existing conditions and decide which flap position is mostsuitable for the particular takeoff and departure. (TR-12-6, FHBA-33).
Ozone - A 727 during April and May is susceptible to high ozoneconcentrations in the upper atmosphere. The maximum altitude we canfly is FL 390. There are also more restrictions for operations inCanada and Alaska. (FOM pg. 57 and 112.2)
Weather Radar - All of the 727's are equipped with C band radar.Color radar displays show different levels of precipitation bydifferent colors. 3 and 4 color radar indicators are installed onthe Advanced and Stretched airplanes. The 4-color sets will displaydoppler returns as magenta as opposed to the 3-color red display.It does not show dry clear air turbulence. If a magenta turbulencereturn is displayed, it should be interpreted as a precipitationreturn with a minimum horizontal component of 10 knots. Colordisplays do not require a contour mode, as the colors give clearindication of different precipitation levels. On the non-colorradars, switching between contour and normal helps in interpretingthe shape and density of storm cells. A red area is the equivalentof the black area displayed on the non-color radar screen in thecontour mode. With summer operations, we begin to get reports ofthe radar being left on when the crew leaves the airplane. Toensure an operable radar, sets should be turned off during taxi-in.
706 727 FLIGNT MANUAL BULLETIN #175NASOOK PAGE 7 OF 8

ULower Aft Body Overheat - With warmer weather comes an old problem,a lower aft body overheat at the blocks. The problem comes from hotAPU air going through the aft airstair area enroute to the packs,and no cool air getting into the area. On a Standard airplane, theaft airstair probably is up, :o you can get a ground man to lower itto admit some cooler air. On the long airplane, the airstair shouldbe down already, so you might not have many options. If you can geta gtound air conditioning unit, you can unload the APU by turningoff the packs. The only other thing you could try is to put someoneby the aft entry door to guard it, and then open the door to admitsome cool air to the airstair area. Failing that, the light shouldgo out during engine start, when the APU is no longer operating thepacks. If it doesn't go out by the completion of engine start, orcomes on during taxi out, there is a fault in the system whichshould be investigated and resolved.
Quick Turnarounds - (L&S-4, N-25) Our high altitude airports such asDEN, ABQ, SLC, and RNO are of particular concern. The 44 minutecooling period is measured block to block (In to Out time) and iscompletely independent of the amount of braking used. The FAA andBoeing have authorized the redispatching of the airplane without a44 minute waiting time, if a temperature check confirms that thebrakes do not contain enough energy to melt the thermal plugs. Youcan increase the chances for taking advantage of this method bysending the appropriate MR. code (32480) on ACARS as soon as it isdetermined that the actual landing weight will exceed the max.turnaround weight. Looking up these weights prior to descent andsending a message prior to landing will assist maintenance indetermining if a quicker turn is possible. Be sure and make awriteup in the airplane Flight Log.
References
Bulletins or T-6.1 V1 for Slippery RunwaysFHA-I, A-3 Radar OperationT&R 1-49, 50 Radar Panel (Color)T&R 11-12.1,.2 Radar Panel (Non-Color)FH A-28 Severe PrecipitationFH A-28 Static DischargeFH A-29 Severe TurbulenceFH A-30 WindshearFH A-23 Ozone ReductionFH A-22 Cabin Ground CoolingFH A-23 Takeoff with A/C Packs Off (ADV.,Str)L&S-4, N-25 Quick TurnaroundT&R 12-6 Takeoff Flap Position
BULLETIN #175 727 FLIGHT MANUAL 706
PAGE 8 OF 8 HANOOK

U
B-727 FLIGHT MANUAL - HANDBOOKBULLETIN #177JUN 24/88FROM: DENTK -FLIGHT STANDARDS AND TRAINING
Please insert following the BULLETINS tab. Record on the BulletinChec.kl ist.
DENVER LOW LEVEL WINDSHEAR ALERT SYSTEM (LLWAS) AND TERMINAL DOPPLERWEATHER RADAR (TDWR) OPERATIONAL DEMONSTRATION
The Federal Aviation Administration is scheduled to test a Dopplerweather radar system at Denver Stapleton International Airportbeginning approximately July 1, 1988, and continuin g through August.This system is called "Terminal Doppler Weather Radar," or TDWR.The TDWR operational demonstration will provide microburst andwindshear alerts identical to the present Denver LLWAS network.These alerts are runway specific and differentiate for "on-the-runway," "approach-zone," and "departure-zone" wind conditions. Thedeparture and approach-zone reports are divided into one-milesegments from the end of the runway.
An expanded LLWAS network is currently in use at Stapleton. Thissystem utilizes 12 sensors, and completed a successful demonstration
in the summer of 1987. The system will be used as a backup for theTDWR demonstration during the summer of 1988. The ultimate goal isthe complete integration of these two systems to provide comprehen-sive information to the pilot and controller. During the upcomingTDWR demonstration, the primary windshear alert sensor will be theDoppler radar, while the runway-oriented wind conditions will beprovided by the LLWAS. The TDWR demonstration will be between 1200MDT (1800 GMT) and 1900 MDT (0100 GMT) daily. During hours otherthan TDWR demonstration, the LLWAS will maintain continuouswindshear surveillance.
Under normal conditions, wind information issued to arrival aircraftwill be the threshold wind for the runway assigned. Departureaircraft will be issued centerfield wind.
The windshear messages used at Denver will comply with the following
format and examples:
FORMAT
I. THRESHOLD WIND (landing aircraft) - The wind from the sensorclosest to the runway threshold for arriving aircraft.
2. DEPARTURE WIND (departing aircraft) - The wind from thesensor closest to the departure end of the runway fordeparting aircraft.
3. TYPE OF WINDSHEAR - If the detection system identifies awindshear event as a microburst, the word "MICROBURST" willbe used. All other windshear events will be called
719 727 FLIGHT MANUALHANDBOOK BULLETIN #177
PAGE 1 OF 3

a
4. WIND SPEED CHANGE - The maximum wind speed change along thespecific runway axis will be reported. Wind speed loss willtake precedence over wind speed gain. In the case ofmicrobursts, this corresponds to the total change from thepoint of peak headwind to peak tailwind. Pilots should bealert to possible microbursts if they encounter increasingheadwinds.
.5. LOCATION - The approximate location of the windshear eventwill be given as it applies to each aircraft. Landingaircraft will receive messages for events along the approachpath or on the landing runway, while departing aircraft willreceive warnings for windshear or microbursts on thedeparture runway and in the departure zone. All alerts willbe specific for each runway.
EXAMPLES
1. A microburst event located on the runway will be issuedto an arriving aircraft:
"UNITED 226, MICROBURST AT ERT, THRESHOLD WIND TWOFOUR ZERO AT FIVE, TWO ZERO KNOT LOSS ON THE RUNWAY."
2. A windshear alert located one mile from the departure endof the runway issued to a departing aircraft:
"UNITED 210, WINDSHEAR ALERT, CENTERFIELD WIND TWO FOUR
ZERO AT FIVE, ONE FIVE KNOT GAIN, ONE MILE DEPARTURE."
NOTIFICATION OF TDWR DEMONSTRATION ON ATIS
During hours of the TDWR system operational demonstration,notification will be issued on Denver arrival and departure ATISwith the following words:
"DOPPLER RADAR WINDSHEAR DEMONSTRATION IN PROGRESS"
LIMITATIONS TO THE SYSTEM
1. The system is not able to detect microbursts before they impactnear ground level.
2. The LLWAS cannot detect windshear events that occur outside ofthe wind measuring network; however, events occurring on theedge of the network which are not able to be distinguishedbetween windshear and microbursts will be issued as "POSSIBLEWINDSHEAR OUTSIDE THE NETWORK." A windshear given to adeparting aircraft which is detected on the edge of the networkwill be issued: "UNITED 22, CENTERFIELD WIND TWO) FOUR ZERO ATFIVE, POSSIBLE WINDSHEAR OUTSIDE THE NETWORK.-
727 FLIGHT MANUAL 719BULLETIN #177 HANDBOOKPAGE 2 OF 3

Uunrmo
3. The LLWAS is designed to operate with as many as three sensorsinoperative; however, when one or more sensors are out ofservice and windshear/microburst activity is likely (e.g.,frontal activity, thunderstorms, pilot reports), the ATIS willinclude "LLWAS IMPAIRED FOR MICROBURST DETECTION."
4. The TDWR operational demonstration is designed to test thesuccess of Doppler radar to provide successful windshear alerts.The testing that occurred at Denver during the summer of 1987predicts that this system will provide greater than 90 percentprobability of detection and less than 5 percent false alarmdetections of microbursts. To ensure that the highest possiblelevel of safety is maintained during the demonstration, afull-time meteorologist will monitor both the TDWR system andthe LLWAS. The meteorologist will be able to insert or deletealert messages when detections are considered to be in error ormissing.
UA POLICY
During the conduct of this test, as is currently the case, a"Windshear" alert must be given serious consideration by the flightcrew. All pertinent factors relating to a planned takeoff orapproach must be critically examined before the specific course ofaction, e.g., normal procedures, precautions, or avoidance action isdecided upon. (See Flight Handbook Additional Procedures, WindshearSection)
A "Microburst" alert, however, clearly indicates that avoidanceaction is required. A FLIGHT MUST NOT DEPART NOR CONDUCT ANAPPROACH THROUGH AN AREA WHERE A MICROBURST ALERT IS IN EFFECT.Delay the takeoff or approach until the condition no longer existsalong your intended flight path.
NCAR QUESTIONNAIRE
Attached to this bulletin is a questionnaire prepared by theNational Center for Atmospheric Research (NCAR). Specifically, NCARis requesting that this questionnaire be completed and forwarded tothem, any time a flight encounters windshear below 1,000 ft. AGL inthe immediate terminal area or encounters thunderstorm relatedturbulence within 40 nautical miles of the airport. Your support inthis area is necessary to further their research and is encouraged.Extra copies of this questionnaire are available in the FOSR area atDENFO.
719 727 FLIGHT MANUALHANDBOOK BULLETIN #177
PAGE 3 OF 3

A QUESTIONNAIRE FOR PILOTS OPERATING INTO OR OUT OFDENVER STAPLETON INTERNATIONAL AIRPORT
SUMMER, 1988
INTRODUCTION
During the summer of 1988, several organizations, including the National Center forAtmospheric Research (NCAR) and the Massachusetts Institute of Technology Lincoln Labo-ratory, will embark on extensive testing of new technology designed to provide improved airportterminal area weather detection capability, with particular emphasis on low-altitude wind sheardetection and warnings for air traffic controllers and for pilots. In order to evaluate this newtechnology, we need the assistance of pilots to provide independent reports of wind shear andthunderstorm-related turbulence encounters in the Denver, Colorado, terminal area. Thesereports will be instrumental in helping us assess the development of the detection and warningsystem described below.
The detection system being tested by the Federal Aviation Administration is the TerminalDoppler (wind-measuring) Weather Radar (TDWR) system, which is expected to provide pilotswith accurate and timely detection of severe low-altitude wind shear events. The FAA isconducting an operational demonstration of the system after extensive testing at Memphis,Tennessee, Huntsville, Alabama, and last year, at Denver.
The system is particularly capable of detecting the microburst, a dangerous form of windshear that is caused by a sudden downdraft of air from a thunderstorm or a convective cloudof lesser intensity, which spreads out horizontally near the earth's surface and can cause severehead- and tail-wind changes for landing and departing aircraft.
The 1988 summer operational demonstration follows a successful test of an enhanced versionof the FAA Low-Level Wind Shear Alert System (LLWAS) during the summer of 1987. TheLLWAS system uses surface wind speed and direction sensing to measure wind shear at theearth's surface. During the 1987 demonstration, pilots were provided with wind shear alerts in anew runway-oriented message format that provided an estimate of wind shear intensity. Becauseof the high degree of success of the enhanced LLWAS, this system has now been commissioned atDenver. However, during this summer's Doppler weather radar test period, the LLWAS systemwill stand down as an alerting device to allow for a full and independent test of the more capableDoppler system. The Doppler radar detection system has the advantage of being able to detectwind shears above the surface and over a much wider area than the enhanced LLWAS system.
The TDWR operational demonstration will commence on 1 July and end on 31 August1988. During this period, the Denver Airport area will be extensively instrumented with Dopplerweather radars, numerous automatic ground-based weather stations, and a substantial capabilityto automatically generate wind shear detection and warning products with the goal of providingthis information to pilots.

YOUR HELP IS URGENTLY NEEDED
Critical to the TDWR operational demonstration will be independent suostantiation of thepresence of significant low-altitude wind shear. In addition, we require identification of anyturbulence encounters by aircraft, but only when these encounters occur within 40 nauticalmiles of Stapleton Airport, and only for turbulence encounters associated with thunderstormconditions. While the researchers involved in this program will have sensors that will be used tosubstantiate the quality of the products, feedback from pilots who actually encounter wind shearor thunderstorm-related turbulence is required. Two important benefits will thus be secured: (1)independent verification that significant wind shear or thunderstorm-related turbulence existed.so that a comparison can be made to the automated alert products; and (2) feedback regardingthe quality of the operational usefulness of the Doppler-derived runway-oriented wind shear alertmessages.
At your earliest convenience following an encounter with wind shear below 1000 ft AGL inthe immediate terminal area, or an encounter with thunderstorm-related turbulence within 40nautical miles of the airport, please fill out the attached questionnaire and drop it into any U.S.mailbox (postage is provided). The completed questionnaires will be delivered to:
Dr. John McCarthy, ManagerResearch Applications ProgramNational Center for Atmospheric ResearchP.O. Box 3000Boulder. Colorado 80307-3000
CONFIDENTIALITY
The purpose of the attached questionnaire is to obtain pilbt feedback on warnings orthe absence of warnings of wind shear and turbulence encountered in the Denver StapletonInternational Airport area, between 1 July and 31 August 1988. This information will not beused for any other purpose. Thank you for your attention to this critical aviation safety matter.

PILOT QUESTIONNAIREDENVER STAPLETON INTERNATIONAL AIRPORT
(For use between 1 July and 31 August 1988)
DATE __ AIRCRAFT TYPE __ FLIGHT NO. __ TAIL NO.
TRANSPONDER CODE __ PHASE OF FLIGHT (Circle): ARRIVAL DEPARTURE
WIND) SHEAR AND TURBULENCE ENCOUNTER INFORMATION
1. Did you encounter any significant wind shear below 1000 feet AGL during takeoff or approach?Yes - No
If "Yes", complete: Approximate time of encounter (Z)Airspeed Loss (-) and/or Gain (+) - KnotsAltitude of First Encounter _ Ft MSLAltitude Loss (-)'or Gain (+) FtLocation: - Over the runway
0-1 mile from the runway1-2 miles from the runway2-3 miles from the runwayBeyond 3 miles from the runway
2. Was a microburst or wind shear warning issued to you by ATC at any time during takeoff or approach?Yes - No - (Circle): Microburst Wind Shear
3. If you answered "Yes" to question 2, please complete the following:
Was the warning useful? Yes - No -
What windspeed loss or gain value did you rezeive from ATC as part of the warning?(-) or (+) Knots (Circle - or +).
What action(s) did you take after receiving the microburst or wind shear alert message (Please markall appropriate choices):
Made an avoidance decision by performing a go-around or delaying departure.Took precautionary action such as increasing approach refrence speed or departuretarget speed.Took no specific action.
- Other (Please indicate action in the space provided):
4. Did you encounter any moderate or greater thunderstorm-related turbulence within 40 nautical milesof Stapleton Airport? Yes - No -
If "Yes", complete: Time of encounter - (Z)Magnitude: Moderate - Severe - ExtremeAltitude of encounter - Ft MSLLocation (DEN VORTAC) Azimuth and Range
We are attempting to improve real-time low-altitude wind shear alerts. Please use the indicated spaceon the reverse side for any pertinent comments that you may have (e.g., what additional informationwould you like to see on alert messages). Remember, the contents of this questionnaire will be treatedin confidence. Please fold, seal and return this form to us. Your participation and assistance is greatlyappreciated!

SECOND FOLD - SEAL SHUT
NO POSTAGENECESSARY
IF MAILEDIN THE
UNITED STATES
BUSINESS REPLY MAIL _ _ _
FIRST CLASS PERMIT NO 612 BOULDER. CO
POSTAGE WILL BE PAID BY ADDRESSEE
National Center for Atmospheric ResearchAttn: Dr. John McCarthy, ManagerResearch Applications ProgramP. 0. Box 3000Boulder, CO 80307-9986
FIRST FOLDADD COMMENTS BELOW:

APPENDIX 5 - ATC/ARTSIII Radar
a. All aircraft profile, 22:07 - 22:08 UTC
b. All qircraft profile, 22:08 - 22:09 UTC
c. All aircraft profile, 22:09 - 22:10 LTC
d. All qircraft profile, 22:10 - 22:11 UTC
e. All aircraft profile, 22:11 - 22:12 UTC
f. All pircraft profile, 22:12 - 22:13 UrC

rasa
C,
Cp,
LLJ a
000
0
~~C:)
0<
0LL)
~CND
0
T -r0
00' 0 00 0 L 0*0- 0 0 - 0
*H- I99V IO

r-.jrj-4
r~01
(-I- af)0
LU~ 0
U-J CD 4
C+0
LUG' -
Uo Zzc-)-
-IQ C) N'0 -1
00000_0 0 0d U-.110OWN~~~ NI4-V I O

r-.z r-J r-J
r4 00
CI- 80
zzC)p
LU 0 I
r-V
(Nj 0z
CCD
CD 03
CCD
(NJ 0ao* -V o z0 ' 00 0 1
WN NI30NV8H18a

Nj r- rlC
00
Cr) U' cnX
Vu) x
u-JO
0"0
G
LU
0 -0
(NJJ~C\i C0
0Mp-CC
00 0 0 00 00 c 0Z
*VN NI 39NV8 H18ON

0-
00
elslU-
ZC'C)
CXJ
+ 0CC
X LU
C>:
t .0
0<
0LL
00
00*000*2oo ~ 00' 00, - 0 *1- 0' 0
W N NI9 NV HI 0

>< >< 0
o 0) ..
r-) -Z- (=
01) r.
C/),H-D
wc=
0 CD
-0
C0 P LU
C. C.
caa
0
0 0 0 00 00 1 0 -d- 011 0'VqO NI ONV H18N -

APPENDIX 6
a. TD4R Alarms, 22:05 - 22:13 t7PC 11 July 1988
b. GSD Depictionis (22:10 not available)
22:0522:0622:0722:0822:0922:1122:1222:13
c. Du~al Doppler Radar derived wind vectors
22 :06 :0222:06:5922 :08 :03
22: 09 :0022:10:0322:11:0022:11:58

TDWRLAR.S for ho-UL-88. hcu 22
SA. 3zRA 340 1 C 10k- 3M F WSA 35LA 260 3 !Ok- 3MF WSA 8A 280 3 !0k- tWY35RD 340 10 35LD 320 a WSA 8D 240 4 Gk- ;' Y_ LA 340 10 17tA 320 8 WSA 26A 240 4 !0k- IMF
'SA 17LD 340 13 !0k- IMD WSA 17RD 260 3 10k- IMD WSA 260 280 3 10k- RY
II-J ZL-88 M
MBA 25RA 330 12 35k- 3MF MBA 35LA Calm 35k- 2MF MBA 8A 280 3 35k- RIw'35RD 340 11 35LD 320 11 MBA 8D 230 3 35k- RwY17LA 340 11 17RA 320 11 MBA 26A 230 3 35k- IMF--
MBA 17LD 330 12 35k- 2MD MBA 17RD Calm 35k- 1MD MBA 260 280 3 35k- RWY
I,-JCL-98 :17M BA 35RA 3- 3 4Ok- 3MF MBA 35LA Calm 40k- 3MF MBA 8A 240 5 40k- IMF
3=PD 330 12 35.D 3:0 14 MBA 60 220 9 40k- RY7LA 320 12 17RA 320 14 MBA 26A 220 9 40k- IMF <_ =
M.A 17D 320 13 4'k- 2M: MBA 17RD Calm 40k-- IMD MBA 26D 240 5 40k- R.Y
SA 2A 30 "- 5C0 - 3MF MBA 37LA Cam 50k- 2MF MBA 8A 200 7 50k- 3:F35RD 320 14 MEA 35.3D 300 15 50k- RLWY MBA 80 220 11 50k- RW17LA 320 14 MBA 17RA 300 15 50k- RWY MBA 26A 220 11 50k- 2MF '
MBA 171-D 360 12 50k- 1MD MBA 17RD Calm 50k- RWY MBA 26D 200 7 50k- RWY
--JUL- 88 09:25
MBA 35RA 0 - 3MF MBA 35LA 160 7 60k- 3MF MBA BA 100 5 60k- 3MF35RD 320 12 MBA 35LD 310 15 60k- RWY MBA 80 110 5 60k- tWY1 71-A 320 12 MBA 17RA 310 !5 60k- RWY MBA 26A 110 5 60k- 3MEd6-
!A 17LD 010 11 63k- IM MBA 17RD 160 7 60k- RWY MBA 260 100 5 60k- RY
MBA -!-;RA 70k- 3MF MBA 35LA 180 7 70k- 2MF MBA 8A 040 6 70k- 3MFMTBA 3rRD 320 12 70k- RWY 14BA 35LD0 320 17 70k- RWY MBA 80 070 7 70k- RWYMBA !7LA 320 12 70k- RWY MBA 17RA 320 17 70k- EWY MBA 26A 070 7 70k- 3MF-MBA 17LO 360 11 70k- RWY MBA 17RD 180 7 70k- RIY MBA 260 040 6 70k- PWY
11-JUL-88
M.SA 35RA 23 8 80k- 3MF MBA 35LA 140 5 80k- 2MF MBA BA 050 4 80k- 3MFMBA 35RD 310 12 80k- RWY MBA 35LD 310 13 80k- RWY MBA 80 090 3 80k- RWYMBA 17LA 310 12 80k- RWY MBA 17RA 310 13 80k- RWY MBA 26A 090 3 80k- 3MF<-'
MBA 17LD 330 8 80k- RWY MBA 17RD 140 5 80k- RWY MBA 260 050 4 80k- RWY
I1-JUL-881; 212:24M.BA 35RA O"50 k- 3MF MBA 35LA Calm 80k- 3MF MBA BA 330 14 80k- 3MFMBA 35RD 310 13 45k- RWY MBA 35LD 290 14 80k- RWY MBA 8D 130 3 80k- RWYMBA 17LA 310 14 45k- RWY 1MBA 17RA 290 13 80k- IMF MBA 26A 130 3 80k- 3MFr-MBA 17L0 360 7 80k- RWY MBA 17RD Calm 80k- RWY MBA 26D 330 14 80k- RWY
!I-JU-88 2'MIBA 25RA 3.) 3 85k- 3MF MBA 35LA 190 3 85k- 3MF MBA BA 330 14 85k- 3MF,B 35RD 290 13 35k- RWY MBA 35LD 260 14 85k- RWY MBA 8D 130 3 83k- R;.Y-.BA 17LA 290 13 35k- RWY MBA 17RA 260 14 85k- IMF MBA 26A 130 3 85k- 3MF -
niBA 17.D 3150 3 85k- RWY MBA 17RD 190 3 85k- RWY MBA 26D 330 14 85k- RWY

Zi10S0 H41m ~ .~
/ ?I Il-. -

EJE U )
n'E) E)444 Ell,-
T 40) oI0 V4
Ul E)e 2I

) Elir4n aU
E4 C,.
PMj 0,E-
~, *:~ iri ~HU
*. 0S 1 0
'\ N--5

'A i $4 14
I %
) -. %-
5oi

14H 4IU:l
U)~~H C) m-4~ 7
o~ Is . E4 fl b
.......

) -2w& aP
g ~~ "' 41 E4M
u I
10 1

I ~ I do- o-
qv N 4
H, ~ kj~ 0 1NEW. I II

EA I
1. I
I:"WOO

55.. 0 * 0
.......-.........// ..//~ .'/ * II
*'/I *'
OKI. - 0*
l* 95 I. " " " I i t
1 I'Ai. R7 4'.WW7 I,.
o~~~~ Lf --
*~~- *.* .5 ri'
I% %
N I~i ID l ' 4oo - '
(lz/w 0o)

00 d..;A
S0 0
,7 7jt ;I 7= 21
I-~~ I~f
C)--huh-~t ddd di/ .Z
o! L]*--~~j4 j dd'
I \S... ..... -........... ~
44'O-
I I It I I
cl(i/ 01)1

'I :10
CC 0*011
~* .~ I,
of/ 0 '..
C).~'S'
lo22L;' s,
fff~ "O S '/
9 --
I liftd--~Z -...% I///I,5/4 1/ /
-- \,"' /I'4.95 0*st-
0 f 0 . oo
%% W6' ,o i
U; v' .:U( ft' r- V) (I / OT

I tI I I I I
002
cm/ i tE
CL-
zzz
o ~' A
0 U)- -- 6 - - , - - I~
o I t I 'o *9
N) D C 0 C) %0 CD a C) Q C)-'. ' C
Lo on 00 0 0; 0: 0 0; 0 0 0 0
(w01 1

, , a-0.9-
_----- zt-0j
- .. . i5~ F, -, //,=../ t * f/ 'I 'F 1/,v 0/ 1 oz
- Iu. - ------- ~IdN ~d~d~4dd91d-
o ~ ~ ~ ~ ~ ~ ~ ~ ~ 7 z r 7.~**~f j7-..-.Vor) .- . f ~ ,~ 0~F *-*~-- ~ \ 7/,' d A '
-~~~~~~~ .f %' ~~~ E
I . I/ .'//'. 't~%~ e
0~~A 0 0 0 0 0 0 0 0 0 0 Z
~ri -o r- I~ rt - o~ r Lfl rY~ - r g;
/N /o N IC3~/ 01)z

0 F '7
LUJ
I / 1/ 4111 /A A I
o . o
0 71,
/) p1 ) A O~ od 0
o 0 0 0 0 0 0 0 0 0 0 0 0C ) * * * aLf~ -O ) r .ij~ m - O ~ r'- u~ C , - - rr IJ
(NJ e*a -
('/w 01)

1/o If I ~ .
0 0 f -
001//(**~0 ~ I -
-L II i Z
Il 'It, 0
-~~~X *oz-eg,~_ _ _ / /
oa 0 0 0 0 00
goJ I%. IJ I I
(IG/w 01 1

APPENDIX 7 - Crew Statements
a. Captain's Report, UA862/11 July
b. Captain's Report, UA395/11 July
c. Supplementary Statement FromF/O of UA395
d. Captain's Report, UA949/11 July
e. Captain's Report, UA305/11 July

The following comments were provided by the flight crew ofFlight 862 relative to the microburst encounter:
The microburst alert given by Denver Tower when onfinalapproach at approx. 1000' AGL, Rwy. 26R. Visible rainshaft ahead. CB to the SW edge of the airport. Executed amissed approach and held in the clear until weatherimproved.
1wa

The following comments were provided by the flight crew ofFlight 395 relative to the microburst encounter:
On a visual approach to 26L at DEN, F/O was flying and wenoted and discussed conditions conducive to windshear.Considering these conditions, planned approach to be flown15-20 kts. above Ref. speed. As we approached 26L in thevicinity of 1000 ft. AGL, the following things happened invery rapid succession: 1) GPWS sounded twice (F/O madeslight shallowing of pitch and GPWS warning stopped); 2)tower reported microburst alert with wind speed loss of whatsounded like 50 kts., 3) another aircraft on freq. askedabout a visual to the 35 runways, 4) another aircraftreported breaking off his approach, and 5) what was virgabefore was now reaching ground. As I looked over at the35's to see if that might be a possibility, we almostsimultaneously encountered the rain that was now falling atthe airport. I called for firewall thrust and flight path,F/O executed windshear encounter SOP. It quickly becameapparent aircraft was climbing normally, so executed normalgo around SOP. Called tower, told them we were missing onrunway 26L, and were given instruction to turn right to 0100and climb to 8000 ft. Approach then vectored us out to thenortheast of DEN and cleared us to 14000 ft. Then we weregiven holding on the DEN 046/20-30. In the holding area Icalled dispatch to inform them of conditions at the airportand our holding location and LFC time. As we reached 14000ft., turbulence now reached the level of moderate. Flightattendants called and indicated numerous passengers wereexperiencing discomfort and airsickness and that they wereout of sick sacks. Approach was receiving severalcomplaints as to the turbulence and lightning that wasoccurring in the holding area, so approach vectored us tothe DEN 313/15-25 for holding, which was essentially in theclear with only light chop. Again called dispatch to informthem of our new holding location and our fuel status.Conditions started to improve around 2242Z. After anotheraircraft started an approach and everything appeared normal,we requested an approach and landed at 2253Z.
We were heavy and the ATIS was indicating a slight tail windand wind shear alert. Don and I discussed the approach andwe decided if anything to stay a little high and keep ourspeed 15 to 20 knots above ref. I was flying and configuredearly, but it was still not enough as we were a littlehigher than I would have liked over Altur. I used flaps 40for a short time, and as we approached the glide slope Iwent back to flaps 30 and came in with the power. We couldsee the cloud and virga over the runways. At some pointbelow 1000 ft the thwer announced that it was raining at thefield and then that there were indications of a 50 knot

shear. Another aircraft said they were going missedapproach and we got the 'Woop woop, pull up' warning. Ipulled up the nose and increased power from about 3000 lbs.to 4000 lbs. The warning ceased but the airspeed began todecrease. Don said, 'Firewall them, let's get out of here.'I did and the aircraft responded immediately. The go-aroundwas completed above 500 feet and at no time did the airspeeddecrease to ref.

The following comments were provided by the flight crew ofFlight 949 relative to the microburst encounter:
Approach corridor over Kowa. Crossed Kiowa at 15000 ft.,250 kts. Turned to north for vectors to land runway 26L.Cloud over Denver Area with breaks in cloud base, somevirga, and observed rain shaft over DEN airport while onnorth heading. Cleared for visual southeast of Buckley ANGBase to follow a DC-8 by 3-4 miles. Flight conditions -JFR, good vis. and fairly smooth. Briefed crew onpossibility of windshear. Took flaps and gear asapproaching Altura advised by DEN APP control 'raining atDEN airport.' Rainshower appeared light as you could seethrough it, seeing runway at all times. Was 200'-300' highon G.S. and carrying flaps 5 and 190 kts. Inside marker,observed DC-8 execute a go-around and comment maybe it wasbecause of windshear. Took flaps 25 ° smf jrstf ypert sfbodr'microburst alert'.

The following comments were provided by the flight crew ofFlight 305 relative to the microburst encounter:
On downwind to 26L we noticed a rain shower east-southeastof the approach. Turning final we experienced considerabledifficulty slowing the aircraft. While still east of theshower, Tower reported wind as calm - later 180/4 then160/6. Some aircraft ahead of us were executing go-arounds.Tower advised one pilot reported a loss of 80 knots. Bythis time we were at or just west of the shower about 1100feet - started our go-around. The go-around was relativelyflat and airspeed hard to gain - very choppy. Held north20-30 min. and landed 17L no problem.

SUBSTANTIATING DATA -- Appendices
APPENDIX 2 -- NASA Langley ReportProctor, F.H., Bowles, R.L., "Investigation of the Denver 11 July 1988 Microburst Storm with the
Three-Dimensional NASA-Langley Windshear Model," (Draft to be Submitted as aNASA Report) July 26, 1989.

INVESTIGATION OF THE DENVER 11 JULY 1988MICROBURST STORM WITH THE THREE-DIMENSIONAL
NASA-LANGLEY WINDSHEAR MODEL
F. H. Proctor
MESO, Inc.
Hampton, Virginia
and
R. L. Bowles
NASA Langley
Hampton, Virginia
DRAFT, TO BE SUBMITTED AS A NASA REPORT
July 26, 1989

TABLE OF CONTENTS
LIST O F TABLES ................................. iii
LIST OF FIGURES . ................................ iv
ABSTRACT . ..................................... viii
1. INTRODUCTION ................................. 1
2. MODEL DESCRIPTION ............................. 2
3. NUMERICAL SPECIFICATIONS AND INITIAL CONDITIONS 5
Numerical Domain and Grid Configuration .............. 5
Model Constants and Microphysical Parameters .......... 6
Initial Sounding ................................ 6
Initial Impulse ................................. 7
4. RESU LTS ................................... 8
Storm Characterisics .. ......................... 8
Evolution and Storm Structure ............... 9
Evolution of Storm Peak Values ............... 12
Driving Mechanism for the Intense Overhang Microburst .. 13
Detailed Structure of the Overhang Microburst .......... 15
Peak Velocity Differential: Matching of observed and
model time .. ........................ 17
Horizontal and Vertical Structure ............... 18
F-Factor Analyses .............................. 18
Reconstruction of Aircraft Trajectories and Comparison . .. 21
m • • mm m

5. SUMMARY AND CONCLUSIONS...................... 23
ACKNOWLEDGEMENTS............................. 25
REFERENCES.................................... 26

LIST OF TABLES
Table 1. Salient Characteristics of TASS .............
Table 2. Cloud Microphysical Interactions ............
Table 3. Comparison of Simulated and Observed Storm
C haracteristics ..........................................
Table 4. Comparison of Simulated and Observed Characteristicsof Most Intense Microburst .....................
Table 5. Axisymmetric Model Experiments - Sensitivity to Cooling
and Loading .............................................
Table 6. Summary of Simulated Characteristics...
iii

LIST OF FIGURES
Fig. 1. Input sounding plotted on Skew T-log p diagram; based on
2000 UTC 11 July 1988, Denver special sounding. Each fullwind barb equals 5 m/s or 10 knots.
Fig. 2. East-West vertical cross sections of radar reflectivity taken
near the center of the storm. Time is in minutes after model
initialization and x,y coordinates relative to position of initial
perturbation.
Fig. 3. Three dimensional perspectives of the lower 2 km of the
storm viewed from the southeast.
Fig. 4. East-West vertical cross sections of the simulated wind
vector field with radar reflectivity superimposed. The cross
sections are near the center of the storm at a) 47 min and
b) 52 min simulation time. Wind vectors in this and
subsequent figures are ground relative.
Fig. 5. As in Fig. 4a, but for snow field. The contour interval is 0.1
g m3, with peak values slightly greater than 1.6 g M-3 .
Fig. 6. Horizontal cross sections of the low-level wind vector field at
a) 47 min, b) 52 min, c) 56 min, and d) 60 min simulation
time. The horizontal fields are at 80 m AGL and north is in
the y direction.
Fig. 7. As in Fig. 6, but fields are isotachs of horizontal wind speed
at a) 52 min and b) 60 min simulation time. The contour
interval is 2 m/s.
iv

Fig. 8. As in Fig. 6 for a) 47 min and b) 52 min simulation time, but
at 2.25 km AGL.
Fig. 9. Time-height cross sections of storm peak values for a) radarreflectivity, b) downdraft velocity, c) updraft velocity. The
contour interval is 10 dBZ in a), 4 m/s in b), and 2 m/s in
c). Peak values of (vertical component) vorticity greater than
0.02 s' are shaded in a).
Fig. 10. Time evolution of peak velocity differential in most intense
microburst: Comparison between model data, TDWR
estimates, and aircraft flight recorder data. Data for TDWR
estimates provided by Campbell (1989), and datareconstructed from the four aircraft FDR provided by
Wingrove and Coppenbarger (1989).
Fig. 11. Horizontal cross sections at 180 m of the wind vector field
with radar reflectivity superimposed at a) 47 min (2206
UTC), b) 49 min (2208 UTC), c) 50 min (2209 UTC), d) 52min (2211 UTC) and e) 54 min simulation time (2213 UTC).
Area depicted is windowed around most intense microburst.
The contour interval for radar reflectivity is 5 dBZ.
Fig. 12 As in Fig. 11, but for 52 min (2211 UTC) at a) 80 m, b) 280
m, and c) 400 m AGL. Radar reflectivity depicted in a) only.
v

Fig. 13. Vertical east-west cross sections near the center of the
intense microburst for wind vectors at a) 47 min (2206 UTC),
b) 49 min (2208 UTC), c) 50 min (2209 UTC), d) 52 min
(2211 UTC), and e) 54 min simulation time (2213 UTC).
Area shown is windowed from model domain with the vertical
coordinate stretched relative to x coordinate.
Fig. 14. As in Fig. 13, but for vertical velocity at 52 min. The
contour interval is 1 m/s. Contours with negative values are
dashed.
Fig. 15. Comparison of peak low-level F-Factors vs time. Peak east-
west F-Factors below 280 m from model data are indicated
by thick solid line.
Fig. 16. As in Fig.15, but includes higher elevations.
Fig. 17. As in Fig. 13, but for east-west F-Factors at a) 47 min (2206
UTC), b) 49 min (2208 UTC), c) 50 min (2209 UTC), d) 51
min (2210 UTC), e) 52 min (2211 UTC), and f) 54 min
simulation time (2213 UTC). The contour interval is 0.05.
Fig. 18. Horizontal cross section at 80 m AGL of east-west F-Factors
at 52 min (2211 UTC).
Fig. 19. As in Fig. 18, but for north-south F-Factors.
Fig. 20. Aircraft positions relative to the runway (from Wingrove and
Coppenbarger 1989).
vi

Fig. 21. Horizontal wind profile along the flight path of 4 aircraft
(Modified from original figure from Wingrove and
Coppenbarger 1989). The dashed lines represent the wind
profiles reconstructed from the flight data recorders, whereas
the solid lines represent the model x-component winds along
the aircraft flight paths.
Fig. 22. As in Fig. 21, but for model F-Factors computed along the
flight paths of the aircraft.
vii

ABSTRACT
Near Denver on July 11, 1988 a moderate reflectivity thunderstorm
produced a microburst of unusual intensity during the test operation of the
Terminal Doppler Weather Radar (TDWR) system. Several aircraft had
inadvertent encounters with the microburst during final approach to
Stapleton Airport, but survived with no damage or injuries. This
microburst and its parent storm are investigated via simulation with the
Terminal Area Simulation System (TASS). Model results show that
intense multiple microbursts formed downwind of the main precipitation
shaft as sublimating snow fell out of overhanging clouds that were
sheared downstream from the main cell. Evolution and structure of the
storm and its microbursts, including hazard indices based on F-Factor, are
investigated in detail and compared with "observed" data from doppler
radar and aircraft flight-data recorders.
viii

1. INTRODUCTION
Presented in this report is a numerical simulation of an unusual
storm occurring near Denver on July 11, 1988, which was responsible for
five successive missed approaches by commercial aircraft. The structure
of the storm (as confirmed by doppler radar) is unusual in the sense of
previously documented case studies of cumulonimbus storms. The storm
was relatively small in vertical extent, long lived, of moderate radar
reflectivity, and accompanied by light precipitation amounts. However,
the most peculiar aspect of this persistent but benign appearing stormwas its generation of uncommonly-intense microbursts some distance
downstream from the primary precipitation area. One of these
microbursts had near fatal consequences on several of the commercial
aircraft attempting to land at Denver Stapleton airport between 2207 and
2213 UTC. Although there were no passenger injuries and no damage
to the aircraft, four successive jet airliners experienced inadvertent
encounters with an unusually intense wind shear during final approach.The aircraft successfully executed missed approaches with one airliner
descending to less than 30 m above ground level (AGL) at a distance of
about 1.3 km from the touchdown end of the runway (Ireland 1988).
Terminal Doppler Weather Radar (TDWR) at Stapleton was in test
operation during the storm and detected dangerous wind shear during the
attempted aircraft landings. The peak differential-velocity change detected
by TDWR of about 40 m/s (Klass 1989) is unusually strong relative to
typical Colorado microbursts and underscores the potential danger that
was faced by the approaching aircraft.
This report represents the model investigation of the storm.Parallel reports are being prepared by the National Center for
Atmospheric Research (NCAI) concerning the observational and radar
analysis of the storm, and by NASA Ames concerning the interpretation
of the aircraft flight recorder data.
1

2. MODEL DESCRIPTION
The numerical model used for this simulation is the Terminal Area
Simulation System' (TASS) which is documented in Proctor (1 987a). The
TASS model is a time-dependent, nonhydrostatic cloud model which
consists of 11 prognostic equations: three equations for momentum, one
equation each for pressure deviation and potential temperature, and six
coupled equations for continuity of water substance (vapor, cloud droplets,
ice crystals, hail/graupel, rain, and snow2 ). Salient characteristics of the
TASS model are listed in Table 1.
The TASS model subdivides the precipitating hydrometeors into
three bulk categories (hail or graupel, rain, and snow) each governed by
its own prognostic equation for continuity. As in Cotton et al. (1982), the
hail/graupel category is represented by either high-density hail or
moderate-density graupel, depending upon the particle diameter.
Parameterizations for numerous microphysical interactions and subsequent
latent heat exchanges are included in TASS and listed in Table 2.
The model has been applied extensively to the study of microbursts
(Proctor 1988a, 1988c, 1989a, and 1989b), and has been successfully
validated in five case studies of cumulonimbus convection -- ranging from
longlasting supercell hailstorms to short lived single-cell storms, including
the 1985 Dallas-Fort Worth Microburst storm (Proctor 1987b).
'Also known as the NASA-Langley Windshear Model
2Snow in the TASS model is treated as spherical, low-density graupel-like snow particles rather than dendritic flakes; see Proctor (1987a) fordetails.
2

Table 1. Salient characteristics of TASS
Compressible nonhydrostatic equation set
Three-dimensional staggered grid
Storm-following movable mesh
Second-order quadratic-conservative space differencing
Adams-Bashforth time differencing
Explicit time-splitting method of integration
Vertical grid-size stretching
Radiation boundary conditions applied to open lateral boundaries
Filter and Sponge applied to top four rows in order to diminishgravity wave reflection at top boundary
No explicit numerical filtering applied to interior points
Surface friction layer based on Monin-Obukhov Similarity theory
Smagorinsky subgrid-turbulence closure with Richardson numberdependence
Liquid and ice-phase microphysics
Inverse-exponential size distributions assumed for rain, hail/graupel,and snow
Wet and dry hail growth
Radar reflectivity diagnosed from model rain, snow, and hail/graupefields
Accumulated precipitation advected opposite of grid motion, so asto remain ground relative
Initialization from observed sounding with thermal impulse
3

Table 2. Cloud Microphysical Interactions
Accretion of cloud droplets by rain
Condensation of water vapor into cloud droplets
Berry-Reinhardt formulation for autoconversion of cloud dropletwater into rain
Evaporation of rain and cloud droplets
Spontaneous freezing of supercooled cloud droplets and rain
Initiation of cloud ice crystals
Ice crystal and snow growth due to riming
Vapor deposition and sublimation of hail/graupel, snow, and cloudice crystals
Accretion by hail/graupel of cloud droplets, cloud ice crystals, rain,and snow
Contact freezing of supercooled rain resulting from collisions withcloud ice crystals or snow
Production of hail/graupel from snow riming
Melting of cloud ice crystals, snow, and hail/graupel
Shedding of unfrozen water during hail wet growth
Shedding of water from melting hail/graupel and snow
Conversion of cloud ice crystals into snow
Accretion by snow of cloud droplets, cloud ice crystals, and rain
Evaporation or vapor condensation on melting hail/graupel andsnow
4

3. NUMERICAL SPECIFICATIONS AND INITIAL CONDITIONS
The model input conditions were chosen without prior knowledge
of the storm structure, and only one high-resolution experiment with the
3-D model was performed. Preliminary analysis of the results from this
simulation were presented in October, 1988 (Proctor 1988b), only months
after the actual event. The specific input specifications and initial
conditions for the numerical experiment are described below.
Numerical Domain and Grid Configuration
The dimension of the physical grid domain is 18 km in the west-
east direction (x-coordinate), 12 km in the south-north direction (y-
coordinate), and 10 km in the vertical direction (z-coordinate). The
domain is resolved by 36 vertically-stacked horizontal levels, each
separated by a vertical grid spacing stretching from 80 m near the ground
to 475 m near the top boundary. Each level is resolved by 92 x 62 grid
points with a uniform horizontal grid spacing of 200 m. These
specifications should be adequate to resolve most of the major features
of the microburst and its parent storm. [A smaller grid size would be
preferable, but presently, is limited by computational constraints (i.e.,
computer time).]
The model internally computes the translation of the storm and
correspondingly adjusts the movement of the grid. Thus if the modeled
storm changes direction and (or) speed, the translation of the grid is
adjusted to keep the storm centered within the domain. This procedure
allows a reduction of the domain size and reduces the magnitude of
numerical truncation error.
5

Model Constants and Microphysical Parameters
In running simulations with the TASS model, it is our philosophy to
refrain from readjusting constants so as to "tweak" the simulation and
force an a priori specification of the storm. However, a few of the model
constants are not invariant from case to case and are defined below.One set of constants important to the cloud microphysics is the
cloud droplet number density, nco, and their dispersion coefficient, a (see
Proctor 1987a). The values chosen for these two parameters are
respectively, 1000 cm3 and 0.15; values which are typical of continental
clouds and which may be expected in Colorado storms (e.g., Proctor
1987a).
The only other model constants in need of specification are the
surface roughness, set at 10 cm; and the latitude (which affects the value
of the coriolis parameter) which is chosen as 39.70 north.
Initial Sounding
The environmental conditions for the experiment (i.e., temperature,
humidity, wind speed and direction) are taken from the sounding shown
in Fig. 1. The input sounding is only slightly modified from the one
observed at Denver Stapleton, at 2000 UTC, just two hours before the
occurrence of the microburst. The low-level lapse rates for humidity and
temperature in Fig. 1 were slightly adjusted from the original sounding, in
order to agree with surface temperatures and cloud-base heights reported
just prior to the event.
The input sounding indicates a deep adiabatic layer extending from
the ground to about 5 km MSL (3.4 km AGL), dry air near the surface,
and high relative humidity near the top of the adiabatic layer. This type
6

of sounding is not unusual for the Denver area and is similar to othertypical "dry-microburst" soundings (e.g., Wakimoto 1985).
The vertical wind profile represented in Fig. 1 indicates light and
variable winds below 3.6 km MSL (2 km AGL), and west to northwest
winds with speeds greater than 12.5 m/s (25 knots) above 6.1 km MSL
(4.5 km AGL).
Initial Impulse
Cumulonimbus convection is initiated in the simulation by specifying
a thermal impulse within a horizontally-uniform, but vertically-varying
environment. As in previous case studies with the TASS model (Proctor
1987b), a spheroidal thermal impulse is specified at time zero with a peak
amplitude of 1.50 C, a diameter of 5 kin, and a depth of 2.5 km. Theinitial impulse is centered at 1.25 km above the ground and horizontally
within the domain.
7

4. RESULTS
The model results produced good quantitative and qualitative
agreement with observations of the major storm features. Some of the
comparisons are listed in Tables 3 and 4.
Table 3. Comparison of Simulated and Observed StormCharacteristics
Simulated Observed
Lifetime Long-lived Long-lived
Cloud Base (AGL) 3.5 km3 3.5 km
Cloud Top (AGL) 7.5 km 9 km
Precipitation Light Light
Radar Reflectivity 50 dBZ Moderate reflectivit
Translation (from) 2800 at 8.5 m/s 2700 at 10 m/s
Eastern Overhang Yes Yes
Rotation Present Yes Yes
Microbursts Multiple Multiple
'An input condition
Storm Characteristics
A persistent but relatively shallow storm develops soon after theinitial impulse is imposed. The cloud base of the storm is at 3.5 km AGL
8

(5.1 km MSL) which is about 300 m above the melting level 3. The cloud
top is at about 7.5 km AGL which is well below the tropopause level.
The 4 km thick cloud is composed of ice crystals and supercooled cloud
droplets, and generates precipitation mostly in the form of snow andgraupel. Rain is produced below the cloud-base level primarily from the
melting of falling snow and graupel. Updrafts in the storm are not much
greater than 10 m/s with much of the cloud and precipitation carried
downstream by the relatively strong winds aloft. The movement of themodeled storm is from the WNW at 8.5 m/s.
Evolution and Storm Structure
In Fig. 2 a time sequence of the storm radar reflectivity is depicted
in west-east vertical cross sections taken near the center of the storm.[The x,y coordinates indicated in the figure (ard subsequent figures) arerelative to the position of the initial temperature impulse specified at time
zero.] The main precipitation shaft, located on the western side of the
storm is persistent with time and has values of radar reflectivity greaterthan 40 dBZ. An overhang, roughly located between 2 and 7 km AGL,
extends eastward from the main precipitation shaft. After 40 minprecipitation begins to fall from the overhang, reaching the ground after
47 min and producing an intense microburst with a differential velocity of
over 40 m/s. Weaker microbursts are associated with the westernprecipitation shaft, even though it is associated with higher radar
reflectivity. Movement with time of the persistent western precipitation
shaft can be noted by the change in the x-coordinate position (Fig. 2).
However, note that the precipitation falling from the overhang (at x - 15km) has relatively little eastward movement. The location of the intense
overhang microburst, about 7 km to the east of the main cell, compares
favorably with observations of the actual event. As confirmed by radar,
'Height at which the temperature is 273.16 K.
9

Table 4. Comparison of Simulated and Observed Characteristic=of Most Intense Microburst
Simulated Observed
Maximum Velocity
Differential 37 - 42 m/s 34 - 42 m/sob
Maximum F-Factor 0.24 - 0.27 0.19 - 0.25a-b-c
Maximum Outflow Speed 22.3 rn/s 23 m/sd
Peak Radar Reflectivity 40 dBZ 38 dBZ
Peak Temperature Drop 50 C 80 Cd
Peak Pressure Increase 2.64 mb 2.5 mb
onfiguration of PidarEcho Elongated E-W Elongated E-W
Location 7 km downstream 8 km downstreamfrom main echo from main echo
Precipitation at Ground Very light rain Very light rain
Ring Vortex Yes Yes
Contains Multiple-DowndraftCenters Yes Yes
Expands to Macroburst Yes Yes
Source Region ofDowndraft (AGL) 3.5 - 4.5 km 3.5 - 4.5 kmc
'From TDWR measurements."From Aircraft FDR.cFrom Dual-Doppler analysis.dMeasured by PAM surface instruments.
10

the microburst (which was encountered by the four aircraft on approach
to Stapleton) actually fell from an overhang about 8 km east of the main
cell and produced a velocity differential of over 36 m/sl A sequence of
3-dimensional perspectives in Fig. 3 depicts the fallout of precipitationfrom the overhang as simulated in the model.
The main updraft, which generates much of the storm'sprecipitation, is located at the rear (western end) of the storm with roots
from the southern flank (not shown). Several weaker updrafts exist
upstream along the northern flank of the radar echo; however, it is
uncertain as to what influence they may have had on the storm.
Figure 4 shows a vertical cross section of the wind vector field prior
to the touchdown of the intense microburst (Fig. 4a) and five minutes laterat maximum outflow intensity (Fig. 4b)'. The snow-field corresponding toFig. 4a is shown in Fig. 5. It is apparent from these figures that stronger
winds aloft are acting to transport precipitation downstream from thewestern end of the storm. The composition of the precipitation above the
melting level is primarily graupel and hail in the western shaft, while being
primarily snow in the overhang. The latter is true since snow particles
have a relatively slow fall speed compared to either hail, graupel, or rain;
and therefore, can be transported more effectively downstream before
falling to lower levels. For this reason the downstream microburst iscomposed mostly of snow particles, which have the potential to rapidly
sublimate and produce an intense microburst under favorable
environmental conditions (e.g., Proctor 1989b). Figure 4 also indicateshorizontal convergence between 2.0 - 4.5 km AGL which is within the
upper portion of the intense microburst downdraft. In Fig. 4b, several
minutes after microburst touchdown, a well developed ring-vortex structure
is apparent near ground level.
'The main storm updraft lies just south of this cross section and is
apparent in Fig. 4 only between 5 and 7 km AGL.
11

The near-surface horizontal-wind field prior to and during the
intense microburst is shown in Fig. 6. At 47 min, only weak microbursts
associated with the western precipitation shaft are apparent; but several
minutes later, a vivid star-burst outflow pattern develops from the intense
overhang microburst (located at x - 15 km, y - -5 km). The outflow from
the intense microburst appears roughly symmetric early in its lifetime, but
grows more asymmetric as it expands with time. Other microbursts of
intermediate intensity are evident also, and their individual outflows appear
to coalesce as they expand with time.
The strongest low-level wind speeds are located on the southwest-
southern sides of the intense microburst, although strong winds are
prevalent on the eastern sides as well (Fig. 7). Peak outflow winds on
the western side show the greatest weakening with time, as the intense
microburst expands into a macroburst 5 and subsequently interacts with
other outflows.
At higher altitudes, horizontal wind vectors indicate the presence of
multiple vortices (e.g., Fig. 8). The presence of rotation in the actual
storm was inferred from single Doppler radar measurements, and along
with mid-level convergence, was used as a precursor for aiding in the
detection of the microburst event (Campbell 1989).
Evolution of Storm Peak Values
The time-height cross sections of domain-wide peak values are
shown in Fig. 9. Precipitation first reaches the ground at 30 min
simulation time, 13 min after the first 10 dBZ echo (Fig. 9a). Strong
downdrafts do not occur, however, until 50 min in the simulation (Fig. 9b),
corresponding to the descent of the strong microburst from the overhang
(cf. Fig. 2).
5A microburst becomes a macroburst if the horizontal distance
between diverging outflow peaks exceed 4 km.
12

Fig. 9c indicates that peak updraft speeds are persistent with time,
but do not exceed 11 m/s. An intensification of the upward velocity at low
levels after 50 min, is likely due to outflow interactions and the circulation
of the microburst ring-vortex.
Shaded areas in Fig. 9a represent peak values of the vertical
component of vorticity in excess of 0.02 s1. Downward propagation of
peak vorticity from the 4-5 km level coincides with downdraft intensification
and the development of the intense microburst (cf. Fig. 9b).
Operationally, rotation (about a vertical axis) is used as a possible
precursor for microbursts (e.g., Roberts and Wilson 1989); and in the 11
July case, Doppler measurements actually detected the descent of rotation
from storm mid-levels, just prior to the occurrence of the intense
microburst (Campbell 1989).
Driving Mechanism for the Intense Overhang Microburst
As noted earlier, the intense overhang microburst is associated with
snow, as well as very light rain produced from the melting snow. Physical
mechanisms, such as cooling due to sublimating snow, melting snow, and
rain evaporation are investigated by conducting additional experiments6
with the axisymmetric version of TASS 7
rThe additional experiments are set-up similar to those described inProctor (1988c, 1989b); i.e., an isolated microburst is initiated by allowingprecipitation to fall from the model top boundary located at 5 km AGL.Input conditions for these additional experiments assume: the Denversounding for environmental temperature and humidity (see Fig. 1); anda distribution of snow (specified at the model top boundary) which isapproximated from the time-dependent snow field in the 3-D simulation.
7The 3-D version of the model could have been used for theseadditional experiments, but doing so would have entailed largecomputation costs.
13

The baseline case, which is simulated with the axisymmetric model,
indicates similar values compared to the 3-D simulation (see Table 5).
The remaining experiments listed in Table 5 are conducted identical to the
baseline case, except that no cooling (or heating) is allowed for the
process being investigated. The integrated effect of each of the physical
processes is judged by comparing several of the key parameters (such
as KE -- the domain-integrated resolvable kinetic energy) with those of the
baseline case.
Table 5 indicates that the dominant process in driving the
microburst is cooling due to sublimation of snow. Turning off the cooling
due to rain evaporation had only a minor influence, while turning off the,-ooling from melting had almost no effect. Table 5 also indicates that
elimination of all the cooling processes also eliminates the microburst;
thus, other processes such as precipitation loading appear to have had
little if any influence on driving the microburst.
As discussed in Proctor (1989b), sublimating snow can effectively
generate intense microbursts, if within a typical dry-microburst environment
-- as is apparently true in this case. Also in Proctor (19d9b), it was
demonstrated that different types of precipitation can have a varying effect
on the intensity of a microburst. This may provide a clue as to the
reason why the microbursts associated with the western shaft were weak.
These microbursts were composed primarily of graupel and rain which
may have been less effective in generating intense downdrafts.
Detailed Structure of the Overhang Microburst
This section further examines the structure of the intense
microburst which dropped from the overhang. Comparisons of model
results with reconstructed and observed data from the actual event
suggest strong similarities with the microburst at Denver Stapleton which
forced four aircraft to initiate missed approaches.
14

TABLE 5. Axisymmetric model experiments - sensitivityto cooling and loading
MaximumMaximum Maximum SurfaceOutflow Downdraft PressureSpeed Speed Increase AV KEa
EXPERIMENT (m/s) (ms) (mb) (m/s) (10' 0 J)
3-D CASE 22.3 -16.9 2.76 42
AXISYMMETRIC EXPERIMENTS
BASE 22.5 -17.1 2.86 45 263
NO MELTING 22.1 -16.7 2.70 44 262
NO RAINEVAPORATION 21.3 -16.5 2.36 43 236
NO SUBLIMATION 13.0 -10.9 1.13 26 26
NO COOLING 0.1 -0.4 0.03 0.2 1
aDomain-integrated resolvable kinetic energy at time of maximum outflow.
15

Peak Velocity Differential: Matching of observed and model time
Fig. 10 shows the temporal distribution of the peak velocity
differential associated with the intense microburst. Three curves from the
model data are plotted; one each for 1) east-west segments, 2) north-
south segments and 3) northeast-southwest segments. The plotted values
represent the peak velocity differential, AV, along any 4 km segment in
a specified direction. Also plotted are the values from the TDWR radar
(located roughly southeast of the microburst), as well as and peak AV
reconstructed from the flight data recorders (FDR) of the four aircraft
which made east-west penetrations of the microburst. By temporally
matching the curves, we found that 2210 UTC corresponds to 51.25 min
simulation time (see Fig. 10).
Interestingly, data from the model, radar, and flight recorders are
in rough quantitative agreement. All show a sud&.c1 temporal increase in
the magnitude of AV, followed by a gradual decrease. The aircraft data,
however, do show a steeper decrease of AV following the time of
maximum intensity, although this in part may be due to the higher flight
trajectory of the last two aircraft which may have carried them above the
region of peak outflow. However, the model east-west segments,
compared to segments in other directions, do show a relatively steeper
decrease of AV following 52 min (2211 UTC) (Fig. 10).
Differences associated with the direction in which AV is calculated
are apparent in the model data after 50 min, due to flow asymmetries.
The strongest magnitudes of velocity differential (42 m/s) are associated
with the northeast to southwest segments. The maximum value of AV
along the east-west and the north-south segments are nearly the same
as the TDWR estimate of 37 m/s.
16

Horizontal and Vertical Structure
Figure 11 shows the detailed horizontal structure of the evolving
microburst at 180 m AGL. At 47 min, roughly 3 min before the first
encounter by the approaching aircraft, little evidence of outflow is present.
By 49 min, a weak radar echo is present at low-levels and outflow is
beginning to accelerate. Maximum intensity is reached at about 52 min,roughly the time of the second aircraft encounter. Note that after 50 min,
the outflow continues to expand in a roughly symmetrical pattern, even
through the radar echo elongates in the east-west direction. Interaction
with adjacent microbursts is evident at 54 min.
Figure 12 shows the horizontal flow structure of the microburst at
several altitudes above the ground. Note that the wind speeds decreasewith altitude, especially in the east-west direction. Hence, a Doppler-;-adar
beam which is centered a couple of hundred meters above the ground,
would detect a weaker and more asymmetric flow structure than what
actually occurred near ground level.
Figure 13 shows a time sequence of vertical west-east cross
sections taken near the center of the intense microburst. Note the
descent of the downdraft and subsequent intensification of its vortex-ring
structure. Other microburst downdrafts are apparent to the west; thus
-ircraft penetrating the intense microburst from the east would next
encounter extreme turbulence.
The vertical velocity field corresponding to Fig. 13d is depicted in
Fig 14. The mature microburst exhibits a double-peak downdraft with
upward motion along its eastern side. Peak downdraft speeds with
magnitudes of up to 15 m/s are located just below the 1 km level.
17

F-Factor Analyses
A primary threat of microbursts to aircraft is the single or combined
effect of the horizontal velocity shear and downdraft motion. Either of
these effects can penalize the performance of an aircraft, and possibly
result in a critical loss of altitude for arriving or departing aircraft. A very
useful parameter for indicating the severity of the wind shear and vertical
velocity on aircraft performance is the F-Factor (Bowles and Targ 1988):
F = g" DU/Dt - w/Va,
where DU/DT is the rate of change of the horizontal wind component
along the aircraft flight path, g is the acceleration due to gravity, w is the
vertical wind speed, and V, is the air speed of the aircraft. The first term
on the right side represents the contribution of wind shear to the
performance of the aircraft, while the second term represents the
contribution due to the vertical wind. Positive values of F indicate a
performance-decreasing condition, whereas negative values indicate a
performance-increasing situation. An F-Factor of 0.1 or greater is
considered hazardous for most jet transport aircraft (Targ and Bowles
1988).
The above formula can be approximated for easy application to
model data as:
F - g1Vg aU/aR - wN.,
where U/R is the horizontal velocity shear along the fight path, and V9
is the aircraft speed relative to the microburst. The above formula is
simplified further by assuming V. = Va = 75 m/s, a reasonable estimate
of the approach and departure speeds of commercial jetliners.
18

"East-west" F-Factors are computed using the above formula and
assuming horizontal east-west trajectories through the model data.
Similarly, "north-south" F-Factors are computed assuming horizontal north-
south trajectories. In Fig. 15, peak values of model east-west F-Factors
are plotted against time and show amazing agreement with F-Factors
estimated from both single Doppler radar (TDWR) and aircraft flight
recorder data8 . From the model data, peak values of east-west F-Factor
below 280 m AGL, exceed 0.1 after 48 min (2207 UTC) with an overallmaximum of 0.24 occurring at 51 min (2210 UTC). The F-Factor values
remain large, even at later times in the simulation, when the outflow has
expanded to become a macroburst. However, low-level F-Factor values
computed from Dual-Doppler radar data (Elmore 1989) appear to
underestimate values derived from the model, single Doppler, and aircraft
data. But for peak F-Factor at higher elevations, agreement with dual-
Doppler radar data is much better (Fig. 16). It may be speculated that
the dual-Doppler data analysis is either too coarse or overly smoothed,
such that the horizontal shear is underestimated. Thus at higher
elevations, where vertical velocity rather than horizontal shear is the
contributor to F-Factor, the comparison is much better.
Also, from Fig. 16 it is important to note that peak F-Factor values
exceed 0.1, several minutes in advance of strong outflow at the ground.Thus large values of F-Factors below 2 kin, but not yet at the surface,
may provide a useful precursor to microbursts (cf. Figs. 15 and 16).A time sequence of east-west F-Factor fields through the center of
the evolving microburst are shown in Fig. 17. Note that values of F-Factor greater than 0.2 first occur aloft (about 1 km AGL) early in
microburst lifetime. The peak values then descend groundward, and later
diminish in magnitude with time as the microburst outflow expands. As
8The F-Factors derived from aircraft measurements do not includevertical wind, whereas the other curves in Fig. 15 include a vertical windestimate at the indicated elevation.
19

suggested above, the descent of large F-Factor values from aloft may
provide a useful precursor.
Also in Fig. 17, performance enhancing areas (i.e., negative values
of F-Factor) can be found at low-levels along the periphery of the
microburst outflow. These areas can contribute to the danger of a
microburst encounter, by misleading the pilot and causing him to reduce
aircraft thrust levels.
Since microbursts are unlikely to be perfectly symmetric, the
magnitude and structure of the F-Factor fields can vary according to the
direction in which it is computed. For instance, even though the
microburst outflow is roughly symmetric at 52 min (e.g., Fig. 6b), the east-
west F-Factoi" field differs appreciably from the north-south F-Factor field
(Figs. 18 and 19).
Reconstruction of Aircraft Trajectories and Comparison
with Flight Recorder Data
As mentioned earlier, four aircraft had inadvertent encounters with
the microburst. For comparison, profiles are interpolated from the model
data following the same spatial coordinates as the aircraft (Fig. 20) and
at the time when the aircraft was near the center of the microburst [i.e.,
50 min (2208.75 UTC) for UAL 395, 52 min (2210.75 UTC) for UAL 236,
53 min (2211.75 UTC) for UAL 949, and 54 min (2212.75 UTC) for UAL
305.]9 From dual-Doppler radar data of the microburst (Sand 1988), the
airport runway is estimated to be 400-600 m north of the microburst
center; thus, relative to the model coordinates the runway is chosen at y
-4.5 km (see Figs. 11 and 18).
9'The model profiles are taken at an instant frozen in time, although
the aircraft traversed the actual microburst in about 30 to 60 s.
20

The model profiles show reasonable agreement with thereconstructed aircraft profiles, especially with regard to the diameter
between the major outflow peaks (Fig. 21). A strong shift between head
and tail winds is indicated for the first two aircraft, which encountered themicroburst at somewhat lower elevations than the following two (see Fig.20). As was true in the TASS simulation of the Dallas-Fort Worth
Microburst (Proctor 1987b, 1988a, 1988c), the model simulation capturesthe expansion rate of the microburst extremely well, but fails to reproduce
the high frequency oscillations'.
M "del F-Factors along the same coordinate positions as thehorizontal wind profiles are shown in Fig. 22. The model F-Factorsexceed 0.1 for each of the aircraft. The magnitude of F-Factors wouldhave been even larger if the profiles were taken further south, closer tothe center of the microburst where stronger downdraft speeds are located.
' 1This lack of agreement may be due to the coarseness of the gridmesh. The model experiment assumes a horizontal grid size of 200 mand cannot resolve wavelengths less than 400 m.
21

5. SUMMARY AND CONCLUSIONS
The multi-dimensional Terminal Area Simulation System has been
used in the investigation of the Denver, 11 July 1988 Microburst. Resultsfrom the model give good quantitative comparisons with observations aswell as reconstructed data from Doppler radars and aircraft flight data
recorders. Values of some of the parameters from the simulated storm
are listed in Table 6.
The model simulation indicates that the storm is of unusual
structure and produces multiple low- to moderate-reflectivity microbursts.One of these microbursts was unusually intense, containing strong
downdrafts, outflow, and wind shear; and was driven by cooling primarily
from sublimating snow. F-Factors in the most intense microburst
exceeded 0.2, even before ground contact. This suggests that F-Factors
also could be used as a precursor for strong wind shear at ground level.
The simulated microburst outflow displayed a rough symmetry near the
ground, becoming weaker and less symmetrical with altitude above 80 m.
This suggests potentia! issues for the Doppler analysis of such storms ii
the radar beam is either 1) too broad, 2) at too high of an elevation, or
3) obstructed at low levels by significant ground clutter.The model proves to be a useful tool in aircraft investigations,
since it provides useful insight into the storm and microburst structure,
and can provide information which is not always apparent from observed
data.
22

Table 6. Summary of Simulated Characteristics
Storm
Peak Updraft Speed 11 m/s
Lifetime Long-lived
Maximum Accumulated Precipitation 0.5 mm
Cloud Base / Top 3.5 km / 7.5 km
Propagation (from) 2800 at 8.5 m/s
Microburst
Maximum Outflow Speed (U ,) 22.3 m/s
Diameter between outflow peaksat time of UX 3.75 km
Maximum Velocity Differential 42 m/s
Maximum Radar Reflectivity 40 dBZ
Maximum Temperature Drop at Surface -5.00 C(-3.50 C, prior to U,,)
Maximum Pressure Increase at Surface 2.76 mb
Maximum Rain Rate 3 mm/hr
Maximum Downdraft Speed -16.8 m/s at 1 km AGL
Maximum F-Fact 0.24-0.27
23

ACKNOWLEDGEMENTS
This report has benefited from informal discussions with several
groups involved in the study of the 11 July case. In particular we would
like to thank Rod Wingrove and Richard Coppenbarger of NASA Ames for
providing data from their analysis of the aircraft flight recorder data; Steve
Campbell of MIT Lincoln Laboratory for providing data from his analysis
of the TDWR radar; and Kim Elmore, Marcia Politovich, and Wayne Sand
of NCAR for providing the Denver 2000 UTC special sounding used inFig. 1, as well as preliminary analyses from their radar and mesonet
network. We also would like to thank Mary Bousquet for her assistance
in producing many of the figures.
The work reported herein was supported by the NationalAeronautics and Space Administration under contract NASI -18858. Model
computations were carried out on the NASA-Langley Cyber VPS 32.
24

REFERENCES
Bowles, R. L., and R. Targ, 1988: Windshear detection and avoidance:
Airborne systems perspective, 16th Congress of the ICAS,
Jerusalem, Israel.
Campbell, S., 1989: Personal communication.
Cotton, W. R., M. A. Stephens, T. Nehrkorn, and G. J. Tripoli, 1982: The
Colorado State University three-dimensional cloud/mesoscale model
- 1982. Part II: An ice phase parameterization, J. de Rech. Atmos.,
16, 295-320.
Elmore, K., 1989: Personal communication.
Ireland, B., 1988: United Airlines flight safety investigation: Microburst
encounter July 11, 1988 Denver Colorado. United Airlines internal
report 88-46.
Klass, P. J., 1989: Microburst radar may spur review of tower's role in
aborting landings, Aviation Week & Space Technology, 130, No. 18,May, 79-80.
Proctor, F. H., 1987a: The Terminal Area Simulation System. Volume I:
Theoretical formulation, NASA Contractor Rep. 4046, NASA,
Washington, DC, 176 pp.
Proctor, F. H., 1987b: The Terminal Area Simulation System. Volume I:
Verification Experiments, NASA Contractor Rep. 4047, NASA,
Washington, DC, 112 pp.
25

Proctor, F. H., 1988a: Numerical simulation of the 2 August 1985 DFW
microburst with the three-dimensional Terminal Area Simulation
System, Preprints Joint Session of 15th Conf. on Severe Local
Storms and Eighth Conf. on Numerical Weather Pred, Baltimore,
Amer. Meteor. Soc., J99-J102.
Proctor, F. H., 1988b: Numerical simulation of the Denver 11 July 1988
microburst storm, Second Combined Manufacturers' and
Technologists'/ irborne Wind Shear Review Meeting, Williamsburg,
VA, NASA, Washington, DC.
Proctor, F. H., 1988c: Numerical simulations of an isolated microburst.
Part I: Dynamics and structure, J. Atmos. Sci., 45, 3137-3160.
Proctor, F. H., 1989a: A relation between peak temperature drop and
velocity differential in a microburst, Preprints Third International
Conf. on the Aviation Nea. System., Anaheim, Amer. Meteor. Soc.,
5-8.
Proctor, F. H., 1989b: Numerical simulations of an isolated microburst.
Part II: Sensitivity experiments, J. Atmos. Sci., 46, 2143-2165.
Roberts, R. D., and J. W. Wilson, 1989: A proposed microburst
nowcasting procedure using single-Doppler radar, J. Appl. Meteor.,
28, 285-303.
Sand, W., 1988: 11 July 1988 weather and resulting TDWR alarms atDenver, Colorado, Second Combined Manufacturers' and
Technologists' Airborne Wind Shear Review Meeting, Williamsburg,
VA, NASA, Washington, DC.
26

Targ, R., and R. L. Bowles, 1988: Investigation of airborne LIDAR for
avoidance of windshear hazards, Second Combined Manufacturers'
and Technologists' Airborne Wind Shear Review Meeting,
Williamsburg, VA, NASA, Washington, DC.
Wakimoto, R. M., 1985: Forecasting dry microburst activity over the High
Plains, Mon. Wea. Rev., 113, 1131-1143.
Wingrove, R., and R. Coppenbarger, 1989: Analysis of records from four
airliners in the Denver Microburst, July 11, 1988, Presented at theNASA/FAA July 11th Workshop, Boulder, Co.
27

100 '~1.
/-.15.0
/ / 1 4.3
IP 13.0
200 12.0
400.
600.
7L 00
8000
400
1000, I I II I5.0
TEPEAUR0(0
Fig 1 I pu s un in poted on Sk w -I g dag am5bse'o
200UC80u0188 evrseilsonig ahflwidbr9qui00i o 0kos

I1I JULY 1988 DENVER SIMULATIONEAST-WEST RADAR-REFLECTIVITY CROSS SECTIONS
0- 10-20 dbz 30-40 dbZ
U 20-30 dbz >I~ >40dbz
TIME= 1002 IME -19.02
10.0
6.0
2 .0
.0
TIME =15.02 TIME -51.02
10.0
8.0
E6.0
I 1.0
2.0 YiY
TIME V7.02 TIME = 51.0210.01 1
8.0~~ = i~ -1.6
8.0
i .0
2.0
.0
WEST x (KM) X (KMI) EAST
Fig. 2. East-West vertical cross sections of radar reflectivity taken nearthe center of the storm. Time is in minutes after modelinitialization and x,y coordinates relative to position of initialperturbation.

42.5 Min . 49 Min
45 Min5 i
47 Min 51 Min
Fig. 3. Three dimensional perspectives of the lower 2 km of the stormviewed from the southeast.

RR F T =E
rJ 10.0 00 f
.0
1 2.1 1.1 6.1 8. 1 10. 1 12.1 1 .1 18.1 18.1
CEN 7/11 Y = 1.RRF T =,'I 52.02
8.0 4 §L. 4 4 1
2.0 30
2.0
2.7 1.7 5.7 8.7 I10.7 12 .7 1 .7 16.7 18.7 20.7
S10 - 20 dbz Z 30-40 dbz
S20-30 dbZ J 4-50db
Fig. 4. East-West vertical cross sections of the simulated wind vectorfield with radar reflectivity superimposed. The cross sectionsare near the center of the storm at a) 47 min and b) 52 minsimulation time. Wind vectors in this and subsequent figuresare ground relative.

DEN7-1 1 Y=-5.2SNOW TIME 1 7.02
10.0
8.0
6.0
2.0
.1 2.1 4.1 6.1 8.1 10.1 12.1 19.1 16.1 18.1
X (K(M)
Fig. 5. As in Fig. 4a, but for snow field. The contour interval is 0.1 gin4 , with peak values slightly greater than 1.6 g mn4 .

0EN 7/ 1 Z= .08_____ _____TIME 1 '7.02
-2.1
~~~~~~ - Z4~.:22.-----------
-10.4 . .1 1. 2. 11 161 1.
DEN 7/11 Z= .08__ ____ TIME =52.02
14 % %% % %
-2.6
-' ~ ~ ~ ~ ' NA ~ .'5
-10 2 , 7___.7_10.7__1_.7_18.7
X (KM) 20 M/S
Fig. 6. Horizontal cross sections of the low-level wind vector field at a)47 min, b) 52 min, c) 56 min, and d) 60 min simulation time.The horizontal fields are at 80 m AGL and north is in the ydirection.

DEN 7/11 Z= .081.3_ TIME =56.00
-2 .7
-6.7
-10.7 '-i.6 6.6 8.6 10.6 12.6 li .6 16.6 18.6 20.6 22.6
DEN 7/11 Z= .081.2TIME =60.02
f t
-.8
-2.8 f'I tt
-8.8
-10.85. i tX (K M)
Fig. 6. Continued.

DEN 7111SPEED TIME =52.01
12.1
-6.6
-8.6
-10.6
2.7 4.7 6.7 8.7 10.7 12.7 11.7 16.7 18.7 20.7
DEN 7111SPEED TIME =60.02
1 .2
-. 8
-2.8 Q
-1.8B
-6.8
-10.8L5.0 7.0 9.0 11.0 13.0 15.0 17.0 19.0 21.0 23.0
X (KM)
Fig. 7. As in Fig. 6, but fields are isotachs of horizontal wind speed ata) 52 min and b) 60 min simulation time. The contour intervalis 2 rn/s.

DEN 7/11 Z= 2.211*6TIME =17.02
I a/d ~ ~ ' // 'i j /dii* I I %
a2 A
-2.1 . . .---- ..
Il If i a S aaa----------- - .....
-10 -Ij ------ ----- ''. ~ 'a,''
I I I a aI I1?I I' a'''
44 8 a a haaa.''''darVl Iaa a %a.aaaa'''
-1.6 7,as. %''-- %*%.. . . . .- %.% ''''
DE 7/1 1 = .2
-20.6 ''~
2.71. 67 87 0. 12~.7 11.7C 16 a I'f 'a'i .7.
84~~~~ (KM)~4 aa.'~a ~ -** a'a.a
1'.'aa'a~a~~~.\'.20 01.a~ M/S 's.''
Fig. 8. As in Fig 6 ora 4 mnan b'2 insmuatotmeuta
2.2 t'kr'a ." .........

7S 6
32
00 t0 20 30 10 so 60
10
9
6
- - 0
I
oJ A MAN'b0 10 2 -- o o 6
to '-
32. -
.. L
00 10 20 30 40 50 60
9IE(MN
Fi.9.Tm-hih cossetos fsor ek aus o )8aa
7elciiy )dwdatvlctc prf eoiy h6otu nevli 0dZi ) / nbad2msi )
Pea 5auso vria opnn) otc rae hn00NJl ar hddi4)

Model Time45 50 55 60
50I I I I
40"
-*--TDWR AV0. 30 ..... Model E-W AV
-...... a-- Model N-S AV
> 0/ --- x--- Model NE-SW AV2U- , Aircraft FDR AV
10-
0~2200 2205 2210 2215 2220
Actual Time
Fig. 10. Time evolution of peak velocity differential in most intensemicroburst: Comparison between model data, TDWR estimates,and aircraft flight recorder data. Data for TDWR estimatesprovided by Campbell (1989), and data reconstructed from thefour aircraft FDR provided by Wingrove and Coppenbarger(1989).

l~lt I I ,11 , at M, 0a A
71aaa a t a.. a, aa , 1, Iii % %1.NIii....1.ItIa aIaM 'I Ia, 'A 'I~ aaa,,~ a .........
a..., ~. .............. l,. I a,,
...... ~...............
............. .ZZI".........
.. .. ... Z......... .. . . . .
.......... ... aT..........t........ . . . . .. f ...
..........................
9. 35175 1. 4.5 18.5
X (KM) X (KM)20 M/S
Fig. 11. Horizontal cross sections at 180 m of the wind vector field withradar reflectivity superimposed at a) 47 min (2206 UTC), b) 49min (2208 UTC), c) 50 min (2209 UTC), d) 52 min (2211 UTO)and e) 54 min simulation time *(2213 UTO). Area depicted iswindowed around most intense mlcroburst. The contourinterval for radar reflectivity is 5 dBZ.

X (KM) ' 2.1? M
Fig. 11. Continued.

OEN7-11 Z =.06 DEN7-11 Z =.28
. . . . . .
-1.8~~~~ I 'llfjII'
-2.8 II' -7.8
.. . . . . .........----..
v'/ I '".... ... .. 2.
-2.8-
-6.8 ... ..
................................ . ...........
r ..... ...... . .
-8.8 1- 1 1 1
10.5 11.5 12.5 M3. 14.5 15.5 16.5 17.5 10.5
C X (KM) 0M/
Fig. 12. As in Fig. 11, but for 52 min (2211 UTO) at a) 80 m, b) 280 m, and c) 400 mn AGL. Radarreffectivity depicted in a) only.

U")
- N L!) N , ,, , , , Nct-~ ~~~ - nii'
- -*-*---b..-~ - I . . .- * - OF-~ 17 -*-.*-*.I** *-
'ij~~mx a 0/A .. N-
t r
-' /" 'AN o.. . C 0
C'4C- ~ N - Hcq
c~ I PA~''$._ U)
0~ 0 0 0 0n 0 0D 0
v;C. '''" .s L C cc9 . 0(aJ It -~ >w. 'i
Lu Aj S
- .-.- y
9E-4-~~t
CMU 0"eWII
-~ - I=~~A cm..U
A~~~~~~~( Z75 7i,,~ 2 98 A, ..
'~~~~~ IjS 9 99O,~ .
U)~-0'I~dI99999 N I
I J\ 0IP ''1 1111. cc
ft * ,,~ / A...- .. U c U)
z ti 9
&l1, F pL P P fL/.* d.
- ~ - 'A..-- .A--~- 1 "~I ~ 99
N. F I / CD / PL.U P - - 59.94 C
0Wq (7W"4) :z~

-EN7-1: Y =-5.2'
3.0 .. .5.C.2
S 2.0 34 \?j2
e . 1.7 3.7 IS5.7 17.7 19.7 21.7
20 DoMIS
Fig. 13. Continued.
OEN7-i1 Y=-.1
1.0 VT-,2*E =52.02
3.0
I.V0
6.7 8.7 10.-7 12.7 11.7 16.7 18.7 20.7
X (. m)
Fig. 14. As in Fig. 13, but for vertical velocity at 52 min. The contourinterval is 1 m/s. Contours with negative values are dashed.

MAX. F - FACTOR COMPARISON
0.25
0.20-
0.15-0
0.10-
0.05 uuiu~iiiAIRCRAFT FDR (WINGROVE)
*uuummmtTDWR ESTIMATE (BOWLES, EtevI 00m.)
-0-- DUAL DOPPLER (ELMORE,EIevlg0m.)
NASA MODEL(PROCTOR,Elev 280m.)
o.oo - I- I _ I I
ZZ04 2206 2208 2210 2212 2214 2216 2218
TIME (UTC)
Fig. 15. Ccmparison of peak low-level F-Factors vs time. Peak east-west F-Factors below 280 m from model data are indicated bythick solid line.

MAX.F-FACTOR COMPARISON AT HIGHER ELEVATIONS
0.30
0.25
0.20
F 0.15 A
0.10
00 DUAL DOPPLER Elev.=.69Km.(Elmore)
0.05 0 NASA MODEL Elev.<2Km.(Proctor)
A AIRCRAFT FDR (WINGROVE)
0.00 ... .. . . • , .. . . , . . . .
2200 2204 2208 2212 2216 2220TIME (UTC)
Fig. 16. As in Fig.15, but includes higher elevations.

VERTICAL WEST-EAST CROSS SECTIONS OFF-FACTOR
TIME 47.02 T IME =51 .024.0
\
j3J 0
Z.(0~
* 0
G. .1 i .1 10.1 12.1 14.1 16.1 18.1 6.2 8.2 10.2 12.2 11.2 16.2 18.2 20.2
TIME =90 IM 20
3.0
~2.0
1.0 ~'I.2 7.2 9.Z 11.2 03.2 iS Z 17,2 t9.2 6,7 8.7 10.7 1Z.1 11.7 11. 1.7 210.7
1 .0 '\\_
3.0
L -
2.0
x (KM) X (KM)
0 F > -2 *15 <F <.10
0j *2 < F < .15 F < - .10
Fig. 17. As in Fig. 13, but for east-west F-Factors at a) 47 min (2206UTC), b) 49 min (2208 UTO), c) 50 min (2209 UTC), d) 51 min(2210 UTO), e) 52 min (2211 UTO), and f) 54 min simulationtime (2213 UTO). The contour interval is 0.05.

Ml-
I I C\J
occo 0~
000
CN LL
C',
00
CD,
EE
co 0
C6
Zcj!:~ N.7PU

E U cm
0 (0
coZ
CC
eliLOO
0D(
ND (D 0~
I I

PATHS FOR 4 AIRLINERS AT DENVER, JULY 1119882-
PLANVIEWUAL 395
PLANVIEWUAL 236
0 UAL 949z
UAL 305
QATC RADAR SITE
z 0-
C/)
S900-
SIDE VIEW
6 00-
30-
DISTANCE FROM RUNWAY, nm EAST
Fi g. 20. Aircraft positions relative to the runway (from Wingrove andCoppenbarger 1989).

COMPARISON OF MODEL WINDS AND HORIZONTALWINDS RECONSTRUCTED FROM 4 AIRCRAFT
60
UAL 39540•
20-
0
-20A
.40
60t UAL 23640-
20.
0- 0
-20
Z -40--J 60
. o UAL 949
N 20,
o 0
" -20
-40
60
UAL 30540-
20-
0-
-20
-40--2 - 0 I 2 35 6
DISTANCE EAST OF RUNWAY (nm)
Fig. 21. Horizontal wind profile along the flight path of 4 aircraft (Modifiedfrom original figure from Wingrove and Coppenbarger 1989). Thedashed lines represent the wind profiles reconstructed from theflight data recorders, whereas the solid lines represent themodel x-component winds along the aircraft flight paths.

MODEL F-FACTORS ALONG RECONSTRUCTED FLIGHT PATHS
0.2"
fr 0.1.UAL 395
< 0.0-
U.
-02 ,
02
. 0.1
00 UAL 236< 0.0
41-U.
-0.1
-2 .1 3 4 5 6
02-
01 0.1.0I- UAL 949< 0.0
Ii.
-0.1
-02-2 -1 1 2 3 4 5
o 0.1002
UAL 305< 0.0
u. -0.1
-0.2-2 -1 0 1 2 3 4 5 6
DISTANCE EAST OF RUNWAY (nm)
Fig. 22. As in Fig. 21, but for model F-Factors computed along the flightpaths of the aircraft.

W&ea Cage Study,. Denwt, Colotado, Jul 11, IM6
SUBSTANTIATING DATA -- Appendices
APPENDIX 3 -- NASA Ames ReportCoppenbarger, R.A., Wingrove, R.C., "Analysis of Records From Four Airliners in the Denver
Microburst, July 11, 1988," AL4AA Paper 89-3354, August 14-16, 1989.

AIAA PAPER 89-3354, ATMOSPHERIC FLIGHT MECHANICS CONFERENCE
BOSTON, MA. ALGUST 14-16, 1989
ANALYSIS OF RECORDS FROM FOUR AIRLINERS IN THE DENVER MICROBURST, JULY 11, 1988
R. A. Copperhargcr* and R. C. Wingrove'NASA Ames Research Center, %loffett ,ield, California
Abstract been limited to microburst encounters involving singleaircraft, which can provide wind estimates only over short
Flight and radar position records are analyzed to time periods and along single trajectories.determine the winds encountered by four airliners thatpenetrated ' multi-cell microburst on approach to Recently, flight records have become available fromDenver's Stapleton International Airport. The four four airliners that penetrated a multi-cell microburst whileencounters provide information about the time-varying approaching Denver's Stapleton International Airport onchanges in the strength, size, and location of the the afternoon of July I1, 1988. In addition to themicroburst phenomenon. The results show significant availability of multiple flight records, this incident wasexpansion in the size of the microburst and indicate that unique because of the presence of Doppler weather radarthere were fluctuations in the internal wind velocity. At its that was being evaluated at Denver at the 'ime of the inci-peak strength, as experienced by the second aircraft, the dent. Meteorological soundings were also iailable beforemicroburst produced a head-wind-to-tail-wind shear of the incident and they were later used as initial conditions115 ft/sec. The wind patterns derived from the flight-data for an advanced flow-field simulation of the microburst.analysis are in general agreement with results derivedfrom Doppler weather radar and from a numerical The four aircraft, all operated by United Airlinesmicroburst simulation. The data from the four aircraft (UAL), were making visual approaches from the east. Ascomplement these other findings by providing a more shown in Fig. 1, in the order they approached, the aircraftdetailed analysis of the turbulent wind environment, were UAL 395 (a B-737), UAL 236 (a DC-8), UAL 949
(a B-727), and UAL 305 (a B-727). After encounteringIntroduction the microburst east of the runway threshold, all four air-
craft aborted their approaches and initiated go-arounds.4
Low-level microburst wind shear is a continuing Despite the strength of the microburst, there were noproblem that must be better understood in the interest of injuries to those aboard the airliners and no damage to theaircraft safety. 1-3 In recent years, research efforts have aircraft.included 1) the development of ground-based systems forthe detection of microburst activity, 2) the development of During the summer of 1988, Terminal Dopplermeteorological models to predict microburst flow fields, Weather Radar (TDWR) was in operation at Denver asand 3) the analysis of airline flight records of actual part of a test and demonstration project, sporsored by themicroburst encounters, to obtain high-resolution wind FAA, to detect wind shear in the terminal area.5 The pro-estimates along flight paths. Although these efforts have ject was carried out by the National Center for Atmo-proceeded in parallel, there has been no opportunity to spheric Research (NCAR) and the MIT Lincoln Labora-apply each approach to a single wind-shear event. Addi- tory. An additional Doppler radar site, operated by thetionally, previous analyses of airline flight records have University of North Dakota, together with the TDWR
radar, allowed a dual-Doppler analysis of the microburstwinds. Wind-velocity fields obtained from both single-Aerospace Engineer. Member AIAA. and dual-Doppler scans were provided by NCAR for
Copyright C 1989 by the American Institute of Aeronautic- and comparison with flight data.6 Measurements from surfaceAstronautics, Inc. No copyright is asserted in the United States wind sensors, situated in the vicinity of the approachunder Title 17, U.S. Code. The U.S. Goverrmuent has a royalty- paths, were also available.free license to exercise all rights under the copyright claimedherein for Governmental purposes. All other rights are reservedby the copyright owner.

Denver weather soundings, taken about 1 hr beforethe aircraft encounters with the microburst, were used to V i =Vx 2+y2initiate the Terminal Area Simulation System (TASS)numerical model. 7 This model, developed through thesupport of NASA Langley Research Center, provides a is derived from the ATC radar data, and the true airspeed,three-dimensional prediction of microburst winds.8 Va, is determined from the flight data. This equation
applies when the flight-path angle is small, and when thei e purpose of this paper is to present relevant wind difference between the ground-axis heading angle and the
ini_,,mation derived from the on-board flight records and wind-axis heading angle is small. This is a verv robustcompare it with data from the ground-based TDWR and solution and applies well along the trajectories consideredsurface wind sensors, and the TASS model. Through this in this report.analysis, a detailed history of the structure and develop-ment of the microburst is produced. Large-scale The horizontal wind components are determined ascharacteristics, such as size and shape, are depicted by theDoppler data, whereas small-scale characteristics, such asinternal turbulence and peak wind velocities, are shownby the flight data. W x =X - Va COS \a
The paper first describes the procedure used to calcu- WY = - Va sin '(2
late wind velocity from the flight data. The aircraft trajec-tories are then discussed, and the results are presented where the heading angle W4 a is measured from the aircraftshowing the important physical characteristics of the gyro and obtained from the foil data. This solution appliesmicroburst. Finally, flight-path winds are compared with under the same flight conditions noted for Eq. (1), but isthose obtained from the Doppler radar and the numerical more restrictive since it requires further conditionssimulation. wherein the roll and sideslip angles are small. These
conditions are generally met during the stabilized finalMethod of Analysis approach, but do not hold after the aircraft starts a turn,
typically over the approach end of the runway in a go-The aircraft data, obtained through the National around maneuver.
Transportation Safety Board, included both air trafficcontrol (ATC) radar position data and foil flight-recorder Results and Discussiondata. The radar data included range, azimuth, and mode-Ctransponded pressure altitude. From these data, the inertial Aircraft Trajectories and Speedscoordinates of each aircraft were reconstructed in aCartesian frame (x,y,h) with its origin at the end of run- The trajectories of the four aircraft, reconstructedway 26L at Stapleton. From the foil flight-recorder, pres- from the ATC radar data, are shown in Fig. 2. The uppersure altitude, indicated airspeed, heading, and normal plot in Fig. 2 shows a plan view (x,y), and the lower plotacceleration were obtained. The two data sets were syn- shows a side view (h,y). The approximate times at whichchronized through a time-history comparison of the on- each aircraft passed over the runway threshold are alsoboard recorded altitude and the ATC-transponded altitude. indicated in Fig. 2 (in minutes after the hour). Speed and
altitude profiles for each aircraft, presented as functions ofBecause of the limited data set, vertical winds were the distance from the threshold of runway 26L, are shown
not determined, and it was necessary to calculate horizon- in Figs. 3-6. In each of these figures, the upper plot showtal winds using specialized solutions (developed in Ref. 9) the true airspeed (Va) and the inertial ground speed (Vi).as follows. The winds along the aircraft flight path are The difference between these two curves is representativecalculated from of the winds encountered. The lower plots show the alti-
tude above-ground-level from both the flight recorder andthe ATC transponder. The microburst winds and subse-
Wfp = Vi - Va (1) quent go-around manuevers, as depicted in Figs. 3-6, arediscussed separately below for each of the four aircraft.
where the inertial ground speed UAL 395. At approximately 2.5 n. mi. east of run-way 26L, UAL 395 began experiencing an increasinghead wind (difference between airspeed and ground
2

speed), indicating its initial encounter with the microburst threshold (Fig. 5). This head wind increased to 60 ft/sec(Fig. 3). The head wind increased to 40 ft/sec and then over a distance of I n. mi. and was followed bybegan decreasing, eventually transitioning to a peak tail wind-velocity fluctuations similar to those experienced bywind of 30 ft/sec. Thus, the resulting head-wind-to-tail- UAL 236. UAL 949 encountered a maximum tail wind ofwind shear, AV, was 70 ft/sec, and occurred over a 25-sec 20 ft/sec, resulting in a AV of 80 ft/sec within a 45-secperiod, period.
Comments from the crew made after the incident The crew, flying the aircraft faster and higher thanindicate that the airplane was initially flown at a higher- normal, observed an increase in airspeed at the leadingthan-normal airspeed and above the glide slope in antici- edge of the microburst. The aircraft, as it encountered thepation of wind-shear conditions. At a distance of about downdraft, experienced a strong shock accompanied by aI n. mi. from the runway, a ground-proximity warning sudden loss in airspeed. In response, full power wassounded and the crew, observing that the airspeed had applied, and the aircraft was rotated and held at a pitchalso begun to decrease rapidly, applied takeoff thrust and angle of 15"-in accordance with standard wind-shearrotated the airplane to takeoff pitch attitude. The onset of recovery procedure. 3 The flight data show that the go-rain was noted at this point, the flaps were reduced to 15', around was initiated at an altitude of about 900 ft. with aand the landing gear was raised. During the rest of the go- sharp pull-up leading to a subsequent gain in altitude toaround, only light turbulence was observed. The flight approximately 1700 ft. Unlike UAL 236, airspeed wasdata show that the airplane came within 100 ft of the traded for altitude during the initial part of the go-around.ground as the go-around was initiated, near the center ofthe microburst. Upon the addition of thrust, both airspeed UAL 305 data in Fig. 6 show that UAL 305and altitude increased simultaneously and the aircraft experienc -d thl la:, severe wind shear, with a maximumrecovered normally. !:,ad wind of 45 ft/sec that eventually transitioned into a
tail wind of 25 ft/sec. This resulted in a AV of 65 ft/secUAL 236. The results show that UAL 236 encoun- within 40 sec. Like the previous two aircraft, UAL 305
tered a head wind, at a distance of about 2.8 n. mi. from .'o C.,perienced small-scale velocity fluctuations withinthe threshold, that increased rapidly to 80 ft/sec (Fig. 4). the core ol ute microburst.The head wind then decreased to a tail wind of 10 ft/secwithin a 15-sec period. During the next 25 sec, fluctua- After experiencing difficulty in slowing the aircrafttions in wind velocity were experienced bef'hre a peak tail down for the approach and hearing the prediction of anwind of 35 ft/sec was reached. The resulting AV was the 80-knot loss by air traffic control, the crew executed alargest of all four aircraft-- 115 ft/sec occurring within standard go-around procedure. During the go-around,35 sec. moderate turbulence was encountered and the aircraft did
not achieve its expected climb performance. Similar toAccording to the crew, the airplane w,,s initially UAL 236, UAL 305 remained at a fairly constant altitude
flown at an airspeed that was about 10 knots faster than while traversing the microburst (between 900 andnormal because of observed cloud activity and virga. 1,100 ft), while its airspeed increased.Upon entering the microburst, the airspeed suddenlyincreased and the power was pulled back. At idle thrust, Microburst Development and Structurethe crew noted that the aircraft appeared to be riding on asmooth wave with increasing airspeed. Anticipating the Figure 7 presents a comparison of the flight-pathsudden loss in airspeed, full power was applied. During winds for the four aircraft. As indicated in the abovethe recovery, moderate turbulence was encountered with discussion, the most intense wind shear was experiencedviolent jolts that appeared to move the airplane vertically by the second aircraft, UAL 236. The wind profiles sug-and laterally. The crew noted that the aircraft climbed gest that the microburst activity was spreading out duringvery slowly at first despite takeoff power and a nose-up the successive encounters. The distance between velocitypitch attitude. The flight data show that the go-around was peaks (maximum head wind and tail wind) was aboutinitiated at about 2 n. mi. east of runway 26L. During the 1.3 n. mi. at the time of the first aircraft encounter andsubsequent recovery, the data show that the aircraft grew steadily to over 2 n. mi. by the time of the fourthremained near a constant altitude of 700 ft, although its aircraft encounter. During this period of time, the centerairspeed increased markedly. of the activity was drifting eastward, moving from
approximately I n. mi. to 1.7 n. mi. east of the runwayUAL 949. UAL 949 encountrcd an increasing head threshold. Of greatest significance is the finding of
wind at a distance of about 3.5 n. mi. from the runway small-scale wind fluctuations that developed between the
3

time that UAL 395 and UAL 236 traversed the The lowest altitude at which Doppler-derived windsmicroburst. Comparing the wind profiles of the last three were available was approximately 600 ft AGL. To obtainaircraft (Fig. 7), these velocity fluctuations show a similar a comparison of flight-path winds at a lower altitude, datapattern, with peaks spaced about 0.4 n. mi. apart and from two surface wind sensors were also compared withoccurring near the center of the microburst. Parameters the flight data. The surface site closest to the runway wasdescribing the occurrence of these fluctuations are shown part of the LLWAS already in operation at Stapleton, andin Fig, 8. the other was part of the FLOWS mesonet. The winds
measured by the ground sensors are shown in comparisonFigure 8 shows the primary features of the wind pro- to those from two aircraft, UAL 949 and UAL 305, in
files evident in Fig.7, plotted in temporal and spatial Fig. 12. These two aircraft traversed the microburst atcoordinates for each aircraft. The positions, with respect close time intervals but with different trajectories,to the runway threshold, of maximum tail and head winds UAL 305 approaching 26R was about 0.25 n. mi. north offor each encounter are designated by DI and D2 , respec- the path on which UAL 949 was approaching 26L. Astively. Internal peak tail winds, describing the fluctuations shown, the flight-data-derived winds compare remarkablyobserved for UAL 236, UAL 949, and UAL 305, are des- well with those from the ground sites.ignated by d1 and d2.
Dual-Doppler data, constructed at -min intervals,Comparisons suggest that the microburst activity initially involved a
single cell with a second cell appearing some time later,The maximum AV encountered by the four aircraft, aligning with the first in the east-west direction. Both
compared with the maximum AV measured by the single Doppler data and flight data indicate that the secondTDWR Doppler radar, is shown in Fig. 9. As can be seen, microburst cell reached the surface at some p .- ,
the maximum AV's from the flight data are somewhat between the passage of UAL 395 and UAL 2.ju (aooutbelow those measured by the TDWR. This is to be 10.5 min after the hour). In Fig. 13, horizontal wind vec-expected, since the maximum AV reported by the TDWR tors, measured by the aircraft, are shown in comparisonis the maximum seen in any one direction by the radar. with the cell locations (depicted by circles). These cellResults suggest that most of the airplanes did not pene- locations were construed from the dual-Doppler data.trate the center of the microburst cell(s) and thus did notencounter maximum wind changes. The pattern of the winds encountered are shown to be
dependent on the track of each aircraft with respect to theWith a single Doppler radar such as the TDWR, only cells. The first aircraft, UAL 395, encountered a cell with
the radial component of the wind velocity can be mea- a center located to the south of its track. With two cellssured. To provide both components of the wind vectors, developing near the approach path, UAL 236 encounteredalong the flight path and in a given altitude plane, data the edge of the eastmost cell and proceeded to penetratefrom the additional weather radar site were utilized. The the center of the cell closest to the runway. By the timelocation of the two radar sites with respect to the runways the third aircraft, UAL 949, approached, the two cells hadat Stapleton is shown in Fig. 10. Flight-path winds result- drifted slightly in a southeasterly direction. UAL 949ing from the dual-Doppler analysis are shown in compari- passed through the northern section of the outermost cellson with those derived from the flight records in Fig. 11. and proceeded to pass just north of the center of theSince the minimum resolution of the Doppler data is innermost cell. The trajectory of the last aircraft, UAL0.25 km, the Doppler-derived winds are naturally more 305, passed well to the north of the center of bothsmoothed than those derived from the flight data. Addi- microburst cells. Note that this aircraft was approachingtional filtering results from the combination of data from 26R, and thus had a track farther north than the previousthe two Doppler radars and from the conversion from three aircraft.spherical to Cartesian coordinates. Because of thesmoothing involved, the Doppler data do not resolve sub- The fluctuations in wind velocity seen in the flighttie wind phenomena such as the velocity fluctuations data of the last three aircraft may have been the result ofmentioned earlier. Given these considerations, the either the second microburst cell or secondary ring vor-Doppler data and flight data show good agreement. tices contacting the ground. As described in Ref. 10, aFigure 1I also shows the flight-path winds predicted by microburst model based on a multiple-ring vortex struc-the numerical (TASS) simulation. This model, like the ture can predict horizontal wind fluctuations similar toDoppler data, does not show the internal wind fluctuations those seen here in the flight data. It appears most proba-present in the flight data because of a lack of resolution. ble, however, that the wind phenomenon encountered by
4

the aircraft resulted from the two adjacent microbursts 2 Fujita, T. T., "The Downburst," SMRP Researchcells. Paper 210, University of Chicago, Chicago Ill., 1985.
Concluding Remarks 3 "Windshear Training Aid," Federal AviationAdministration, Washington, D.C., 1987.
From the resulting wind profiles it is evident that verystrong microburst activity was encountered, with a peak 4 Ireland, B., "Microburst Encounter, July 11, 1988,"head-wind-to-tail-wind shear of 115 ft/sec. Since records United Airlines Flight Safety Investigation 88-46, Denver,from multiple air.-aft were available, the time-history Colo., Feb. 1989.development of the microburst phenomenon was evident.The center of the microburst cells moved from 1 n. mi. to 5"Terminal Doppler Weather Radar Operational1.7 n. mi. east of the runway threshold during the time of Demonstration," Federal Aviation Administration,the aircraft encounters. During this time, the size of the Washington, D.C., 1988.microburst (distance between wind velocity peaks) grewfrom 1.3 n. mi. to over 2 n. mi. A significant result of this 6 Sand, Wayne, "11 July Weather and Resultinganalysis is the finding of velocity fluctuations developing TDWR Alarms at Denver, Colorado," Presented at thewithin the microburst boundaries. The results for the last Second Combined Manufacturers' and Technologythree aircraft show that these internal fluctuations exhib- Airborne Wind Shear Review Meeting, Williamsburg,ited a similar pattern, with peaks spaced about 0.4 n. mi. Va., Oct. 1988.apart. The developing wind pattern measured from theaircraft is in general agreement with the measurements 7 Proctor, Fred H., "Numerical Simulation of thefrom the Doppler radar and with the analytical results Denver 11 July 1988 Microburst Storm," Presented at thefrom the numerical TASS model. The aircraft data com- Second Combined Manufacturers' and Technologyplement these other findings by providing a detailed anal- Airborne Wind Shear Review Meeting, Williamsburg,ysis of the internal velocity fluctuations. The Doppler data Va., Oct. 1988.were shown to not only validate the flight data but also toadd insight into the resulting wind profiles by suggesting 8 Proctor, Fred H., "Numerical Simulations of anthe presence of a secondary microburst cell. It is very Isolated Microburst. Part I. Dynamics and Structure,"possible that the appearance of this second downburst Journal of Atmospheric Sciences, Vol. 45, No. 21,caused the internal fluctuations in horizontal winds Nov. 1988.observed in the flight data of the latter three aircraft.Investigation into the behavior of the multi-cell 9 Bach, R. E. and Wingrove, R. C., "Equations formicroburst phenomenon is a subject for further research. Determining Aircraft Motions from Accident Data,"
NASA TM-78609, 1980.This unique incident at Denver offers a wealth of
information from both an operational and scientific stand- 10 Schultz, T. A., "A Multiple-Vortex-Ring Model ofpoint. From the experiences of the four aircraft, insight the DFW Microburst," Presented at the 26th Aerospaceinto the warning signs and appropriateness of flight pro- Sciences Meeting, Reno, Nev., Jan. 1988.cedures following an inadvertent microburst encountercan be gained. Knowledge gained from flight records andother sources concerning the detailed structure of themicroburst phenomenon can be used to create more real-istic simulator models and can aid in the development ofboth ground-based and airborne wind-shear detectionsystems.
References
1Low-Altitude Wind Shear and Its Hazard toAviation, National Academy of Sciences, NationalAcademy Press, Washington, D.C., 1983.

~C (((C ~ ~UAL 305
UAL 949
'j o'4UAL 238
\,.,o UAL 395
Fig. I Overview of theDenvermiroburst of July 11, 1988.
2
PLAN VIEWUA39
.... UAL 236
0
0-
C~ 3000SIDE VIEW
2000TIME, min
------- - - ---
-2 -1 ~ .0 123
DISTANCE FROM RUNWAY, nm EAST
Fig. 2 Airliner trujecwtiea.

450 -- AIRSPEED
400 -- GROUNDSPEED
250
CL
3 00
25
2- 000-
1000
0-2 -1 0 1 2- 3 4 5 6
DISTANCE FROM RUNWAY, nm EAST
Fig. 3 Speeds and aftioWe for UAL 395.
4501 - AIRSPEED
400--- GROUNDSPEED
o350-
250 I
3000 - RECORDER
4C, 0 TRANSPONDER
S2000-
00
-2 -1 0 1 2 3 4 5 6DISTANCE FROM RUNWAY, nm EAST
Fig. 4 Speeds and altda for UAL 236.
7

450AIRSPEED
400- GROUNDSPEED
O350
300---- -
250
3000 -RECORDER
0TRANSPONDER
Z 2000-
0a
t 1000-
0-2 -1 0 1 2 3 4 5 6
DISTANCE FROM RUNWAY, nm EAST
Fig. 5 Speed& ad algde for UAL 949.
450-ARPE
400-
O350-
300- ---
250-
3000-RECORDER0 TRANSPONDER
,.2000
S1000-
0-
-2 -1 0 1 2 3 4 56DISTANCE FROM RUNWAY, nm EAST
Fig. 6 Spec& L-4 uldtude for UAL 305.

40UAL 395
0-
-40J
40- UAL 236
0-
~-40
~40-
0-
-40
40UAL 306
0-
-40--1 0 1 2 3 4 5 6
DISTANCE FROM RUNWAY, nm EAST
Fig 7 Ftight-potb wind..

42 7 7\ D, d
< ,I i \ F1.' RWY
02 2
U.
502207 2208 2209 2210 2211 2212 2213 2214
TIME, GMT
Fig. 8 rune vwiagim of miavbwu ttim~
200-MAX &V FROM TDWR
-O0- AV ALONG FLIGHTPATH
150
100
II
50
012200 2205 2210 2215
TIME, GMT
Fig. 9 Maimum AV's along flight pah compared with ftoe from ThWR.
t0

8 ~i* ,* ' ' 'I I % \ t
6 -,,DOPPLER_ ________WEATHER
' -, RAOAR NO. 2
Z _"' _ "_"___ \\ \ V ' *4
C I. \%\\ -,,"%%.,%.
// " ,TERMINAL/i \ x\V!r "= DOPPLER
-2, , . . WEATHER-2 -. '. ..-. ' '''. \ .. .. .. " "- RADAR
N . %'' .... .:'.... , " " •4I-4 -2 0 2 4
DISTANCE FROM RUNWAY, nm EAST
F g. 10 Location of Doppler radar sites and derived wind pmtn a t ime 2211.:00.
11

-FLIGHT...................... DUAL-DOPPLER (REF. 6)----------------- SIMULATION (REF. 7)
40
-40
40- UA L 236
--40-
UAL 949
-40-
40-
0-
-40-1 0 1 2 3 4 5 6
DISTANCE FROM RUNWAY, rim EAST
Fig. I IPFlght-puth winds an! winds (rai dual-Doppler aid numerical imulation.
12

0 f ps
0z .5UA30E
I- S1 /1.
5GROUND SITES'
0 0.5 1 1.5 2 2.5 3 3.5 4DISTANCE FROM RUNWAY, nm EAST
Fig 12 Wind vecm from two ain compmnd with dwos meamd at two mfacs siteL
13
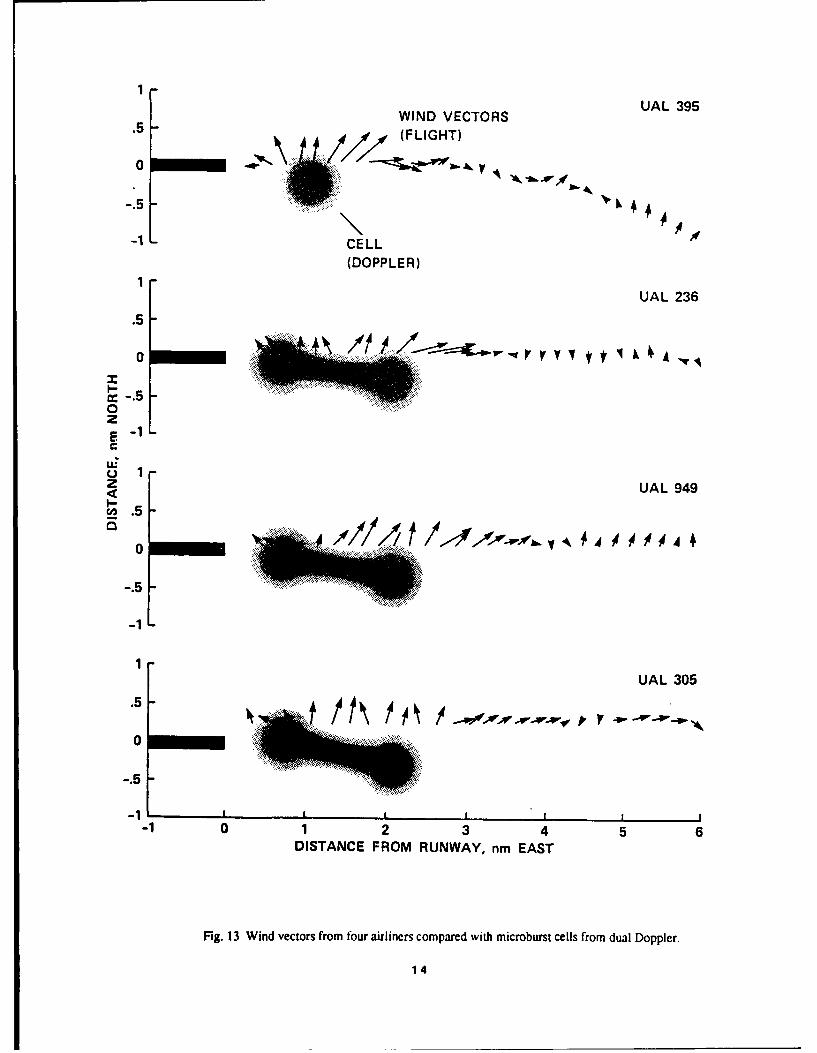
WIND VECTORSUA39.5 (FLIGHT)
0
-1 LCELL
(DOPPLER)
UAL 236.5
0zF,-
z UAL 949
"'5
-.5
-1L
1UAL 305
.5
-.5
-10 1 2 3 4 5 6DISTANCE FROM RUNWAY, nm EAST
Fig. 13 Wind vectors from four airliners compared with microburst cells from dual Doppler.
14

Wi.ab-a C- Sv~r D-aw, Cbrdo Jul 11. 1968
SUBSTANTIATING DATA -- Appendices
APPENDIX 4 -- MIT Lincoln Lab ReportIsaminger, M. A., "WEEKLY SITE SUMMARY," FL2 Radar Site, Denver, Colorado, MIT
Lincoln Laboratory.Campbell, S., Correspondence to Roland Bowles, dated 24 March 1989, containing velocity and
shear values from FLOWS for July 11, 1988, at Denver Stapleton Airport, MIT LincolnLaboratory.

Lincoln Lab Radar Weekly Site Summary'
Weather conditions were conducive to thunderstorms, thetemperature was warm. During the 7.1 hours that the TerminalDoppler Weather Radar (TDWR) was operating, it detected19 microbursts and three gust fronts. TDWR data were recorded ontape numbers 375 through 383, the following table is a summary.
Table I -- Doppler Weather Radar Site Summary
Event Time Location Deltav ReflectivityUTC ran/az m/s dBz
GF 2014 43/195 12MB 2017 32/210 12 25MB 2020 85/337 12 45MB 2059 20/152 20 10MB 2059 25/168 18MB 2140 32/305 16 20GF 2145 21/309 7GF 2149 26/280 13MB 2201 15/287 10 10MB 2209 5/312 26 30MB 2213 9/317 40 40MB 2211 3/311 18 15MB 2214 6/315 18 30MB 2215 11/302 24 40MB 2215 16/296 15 45MB 2220 20/293 12 40MB 2230 15/302 12 40MB 2232 13/284 15 20MB 2245 11/305 11 25MB 2304 14/085 18 40MB 2310 11/154 12 30MB 2348 66/321 16 25
Isaminger, M. A., "WEEKLY SITE SUMMARY," FL2 Radar Site,Denver, Colorado.

MASSACHUSETTS INSTITUTE OF TECHNOLOGYLINCOLN LABORATORY
LEXINGTON, MASSACHUSETTS 02173-007324 March 1989
Mr. Roland L. Bowles 43C-0992
NASA Langley Research CenterSIS 156A
Hampton, VA 23665
Dear Roland:
Ben Stevens and I want to thank you for the interesting visit we had with youand David Hinton on March 6th. Thanks especially to David for arranging thetime on the simulator and setting up the cases. The experience of flying throughevents of varied location and strength was very helpful in providing insight intothe microburst warning problem and motivated our subsequent discussion.
As promised, I am sending you the data on the July 11, 1988 microburst caseconcerning differential velocity and shear. The attached plot shows the velocityand shear values for the microburst alarm during the period 2205 MDT (firstalarm) through 2220 MDT. These data were derived by examining the shear seg-ments for each alarm to determine: 1) the segment with the largest differentialvelocity and 2) the segment with the largest shear. Recall that divergence(outflow) regions are made up of radial segments of generally increasing velocitywhich are associated together to form a two-dimensional region.
As you can see, the shea - value (although somewhat underestimated by thiscalculation) peaks earlier than the differential velocity. Referring to Figure 6 inthe paper by Elmore & Sand, it appears that the F factor is above the hazardlevel for the initial alarm at 2205.
Again, thanks for inviting us to Langley and we will look forward to seeingyou at Lincoln. If you have any questions or comments on the data, please call meat 617/981-3386 or leave a message at 617/981-7430.

-2-
Sincerely yours,
Steven D. CampbellStaff Member, Group 43
Attachments

11 July 88 Microburst
Maximum Velocity
3-
25
(mis-
200 22b5 2210 2215 22 0 22 5
Maximum Shear20
is
14
12
AV/,&R 10 wl(m/s/km)
4
2
1200 2205 2210 2215 2220 2225

11 July 88 Denver Microburst Alana Strengths
Maximumu Velocity Segment Maximum Shear Segmint
Time Velocity Distance Shear Velocity Distance ShearOWIY) (M/s) (kmn) (m/s/km) Wns) (kan) (ns/C)an
2205 12.8 1.7 7.6 10.9 1.1 10.1
2206 17.5 1.3 13.3 14.7 1.1 13.6
2207 18.7 2.4 7.8 16.8 1.3 12.7
2208 25.7 2.0 12.6 18.7 1.1 17.3
2209 31.7 3.1 10.2 2331.4 16.2
2210 24.6 1.9 12.8 16.8 1.0 17.5
2211 36.1 2.5 14.4 33.4 2.2 15.5
2212 36.9 2.9 12.8 31.5 2.3 13.8
2213 35.3 3.5 10.1 32.1 1.9 16.7
2214 35.3 3.5 10.1 32.1 1.9 16.7 (coast)
2215 24.3 1.9 12.7 21.7 1.3 16.4
2216 22.8 2.3 10.0 14.8 1.1 13.7
2217 24.6 3.0 8.2 19.2 1.3 14.5
2218 23.6 3.8 6.1 15.9 1.2 13.3
2219 22.5 4.0 5.7 18.8 1.4 13.1
2220 20.5 2.8 7.4 14.9 1.2 12.4
2221 24.3 2.5 9.6 12.7 1.0 13.2
2222 25.9 2.8 9.4 17.1 1.3 13.0
2223 25.4 3.4 7.6 17.1 1.1 15.8
2224 19.7 3.2 6.1 18.5 1.1 17.1
2225 18.7 2.3 8.2 16.1 1.0 16.8
2226 18.4 1.7 11.0 16.1 1.1 14.9
2227 19.2 1.7 11.4 11.6 1.0 12.0
2228 18.4 2.2 8.5 14.2 1.2 11.8
2229 15.9 2.3 7.0 12.2 1.2 10.2

Wumshear Cue Study. Denwer, Coceado. July 11, IMU
SUBSTANTIATING DATA -- Appendices
APPENDIX 5 -- NCAR ReportElmore, K.L., Politovich, M.K., Sand, W.R., "The 11 July 1988 Microburst at Stapleton
International Airport, Denver, Colorado," National Center for Atmospheric Research,November 1989.

The 11 July 1988 Microburst atStapleton International Airport, Denver, Colorado
KIMBERLY L. ELMORE, M. K. PoLIToVICH, W. R. SANDNational Center for Atmospheric Research*
P. 0. Box 3000Boulder, Colorado 80307
November 1989
*NCAR is sponsored by the National Science Foundation

The 11 July 1988 Microburst atStapleton International Airport, Denver, Colorado
K. L. Elmore, M. K. Politovich, and W. R. SandNational Center for Atmospheric Research'
P. 0. Box 3000Boulder, Colorado 80307
I. Introduction
Just after 4:00 PM local time on 11 July 1988, an intense microburst developed nearStapleton International Airport in Denver, Colorado. During this time, the TerminalDoppler Weather Radar (TDWR) Operational Test and Evaluation (OT&E), sponsoredby the Federal Aviation Administration (FAA), was in progress. The TDWR microburstdetection algorithm provided an accurate and timely warning of the microburst to the AirTraffic Control Tower (ATCT). However, four aircraft penetrated the microburst; theyfortunately traversed the microburst without serious incident.
A microburst is a strong, localized outflow from a precipitating convective cloud.Microbursts present a hazard to aviation due to abrupt changes in wind direction andstrong downdrafts contained within them. The operational microburst definition duringthe TDWR OT&E was a 20-kt wind speed loss over 4 km or less; wind speed losses areassumed to be manifested as airspeed losses. The largest such loss observed by Dopplerradar is 68 kt, which occurred during the 11 July microburst. The Doppler radar ni-croburst algorithm running on 11 July indicated an 85-kt loss. Refinements were made tothis algorithm in early August 1988 to improve its performance. The refined Algorithmreduced the 85-kt loss estimate to 70 kt, matching the dual-Doppler estimate used forground truth.
This technical report provides a compilation of available meterological data and somemeteorological interpretations of the intense microbursts that occurred on 11 July 1988 nearStapleton Airport. These discussions include data from National Weather Service (NWS)surface and upper air measurements, Cross-chain Loran Atmospheric Sounding System(CLASS, Lauritson et al., 1987), FAA-Lincoln Laboratory Operational Weather Studies(FLOWS) mesonet (Wolfson et al., 1987), Low-Level Windshear Alert System (LLWAS)(Wilson and Flueck, 1986), and data from the FL2 10-cm and UND 5-cm radars. The 11July weather events are presented in a descriptive narrative emphasizing the inicroburstoccurrence. Data and data sources are given and described. Using dual-Doppler three-dimensional analyses, the rnicroburst source region and the outflow evolution through itsdemise as a hazard are discussed.
' NCAR is sponsored by the National Science Foundation

Other agencies, groups, and authors providing technical reports on the 11 July mi-croburst include: Lincoln Laboratory, TDWR algorithm; National Aviation and SpaceAdministration (NASA), analysis of flight recorder data; MESO, Inc., numerical simula-tion of the event; the Federal Aviation Administration (FAA), flight recorder data analy-sis; and United Airlines, flight recorder data and pilot response. The information sourceshelped clarify the role of some of the physical mechanisms discussed in this report; in otherinstances, these served as a starting point for discussions presented here.
II. Available Data
A. Radar
FL2, a 10-cm wavelength Doppler radar operated by the Massachusetts Institute ofTechnology Lincoln Laboratory, was used as the test-bed instrument. Doppler radar mea-sures only radial wind components. Using wind measurements from the low-altitude scans(0.30, 0.40, and 0.50 elevation), the microburst algorithm flags segments along each beamthat meet microburst criteria. An NCAR-developed technique defines an all-encompassingbest fit ellipse that surrounds adjacent segments and records the maximum wind speedchange within the ellipse. This information is sent to the ATCT and displayed in bothgraphic and alphanumeric form (see Appendices A and B). The University of North Dakota(UND) 5-cm Doppler radar, located about 21 km north of FL2, gathered data during theproject. Scanning patterns of the two radars were coordinated to enable dual-Dopplerpost-analysis (see Fig. 1).
During the TDWR OT&E, dual-Doppler radar volume scans were completed approx-imately every 2.5 min and included elevation angles from 0.3 through 25.9°(UND) or 39.9*(FL2). The CEDRIC analysis package (Mohr et al., 1986) is used for three-dimensionalwind field synthesis and analysis. Two separate analyses are presented: a "high" and a"low" resolution analysis. The low-resolution analysis encompasses the greatest area andis intended to provide an overall depiction of storm morphology. It includes 14 volumesbeginning around 2148 and ending at 22202. The high-resolution analysis is useful forstudying the microburst structure and for comparison between radar data and aircraftor mesonet data. There are 9 high resolution analyses, beginning at 2200 and going to2220. All analyses are temporally spaced approximately 2.5 min apart. Raw input Dopplervelocities have been corrected for a deduced storm motion of 10 m s- 1 from 270 ° . Theresulting analyses show ground-relative winds.
The low-resolution, three-dimensional analysis has 400 m horizontal grid spacing and500 m vertical grid spacing. The lowest effective elevation angle is 0.3 from FL2, placingthe beam center approximately 190 m above the center of the airport. Each pulse volume isa truncated cone 1 in width and 120 m in radial length for FL2 and 250 m for UND. Overthe airport, both beams are roughly 150 m in diameter. UND scanning was synchronizedwith FL2 to enable three-dimensional, dual-Doppler wind analysis. For the high resolution
2 All times are UTC unless otherwise noted.

25.0
E 2o.0UND radaz
- 0
15.00 Stpeo nmway
C51.0 0*r- 0
0* 0
0.0 0LLWAS stations 0FL2 radar
c FLOWS stations
-5.0 I-30.0 -25.0 -20.0 -15.0 -10.0 -5.0 0.0
distance east of FU2 radar (kan)
rTCtTRE 1. Lorations of radars and sturface mesonet stations during the 198 TD)WR OT&Eat Stapleton International Airport, Denver, Colorado. The airport runways arealso shown.

analyses, all parameters are identical except the horizontal grid spacing, which is reducedto 250 m.
Both analyses use a one-pass Cressman objective analysis scheme (Cressman, 1959)to map radar-measured radial velocity components from spherical range-azimuth-elevationspace to gridded Cartesian space. In both cases, the Cressman influence radius is 1.3times the grid spacing, which should yield a good ratio between the variance induced bythe Cressman analysis and the pre-existing variance in the data (Stephens and Stitt, 1970;Stephens and Polan, 1971). Thus, the influence radius for the low-resolution analysis is520 m horizontally and 650 m vertically. For the high-resolution analysis, the horizontalinfluence radius is 325 m.
The grid domain extends from 1.8 km (0.19 km AGL) to 10.8 km (9.19 km AGL) inboth cases. The horizontal domain of the low-resolution analysis extends 2-30 km westand 1-23 km north of FL2. The high resolution analysis extends 2-16 km west and 1-13km north of FL2 and is roughly one quarter of the area covered by the low resolutionanalysis. Stapleton Airport lies approximately 10-14 km west and 6-13 km north of FL2;the microburst impact area is on southeast edge of Stapleton Airport and well-centered inboth analysis domains.
Before a consistent w component is calculated from the horizontal winds, u and vare filtered with a two-dimensional, three-point Shuman smoother (Shuman, 1955). Fivepasses are made through the data, yielding a 5 As (where s is the grid interval) horizontalspatial resolution at the half-amplitude points, as shown in Fig. 2. The Shuman filterresponse is given by:
RH = [(1 - sin 2(ir/L))(1 + sin 2 (ir/L))]5 ,
where L is in units of As. The low-resolution analysis resolves motions on a 2-kin scale(5 x 400 m) and the high-resolution analysis resolves motions on a 1.25-km scale (5 x 250m). Filtering is chosen to reasonably match the Cressman weighting function.
Another technique, developed by W. Wilson and K. Brislawn, uses a direct least-squares method to simultaneously map radar velocities from spherical to Cartesian spaceand provide u and v components; it has not yet been extended to provide full three-dimensional wind fields. This technique is used for low-altitude (190 m above ground levelor AGL) analyses spaced approximately 1 min apart (Appendix D).

0.
0
rz~ CD 0
q~it.
OD c4.
06- v
C)
OO~C~(D~~goN bo
-o~ooood dNOI.D~fl 3SNdS3
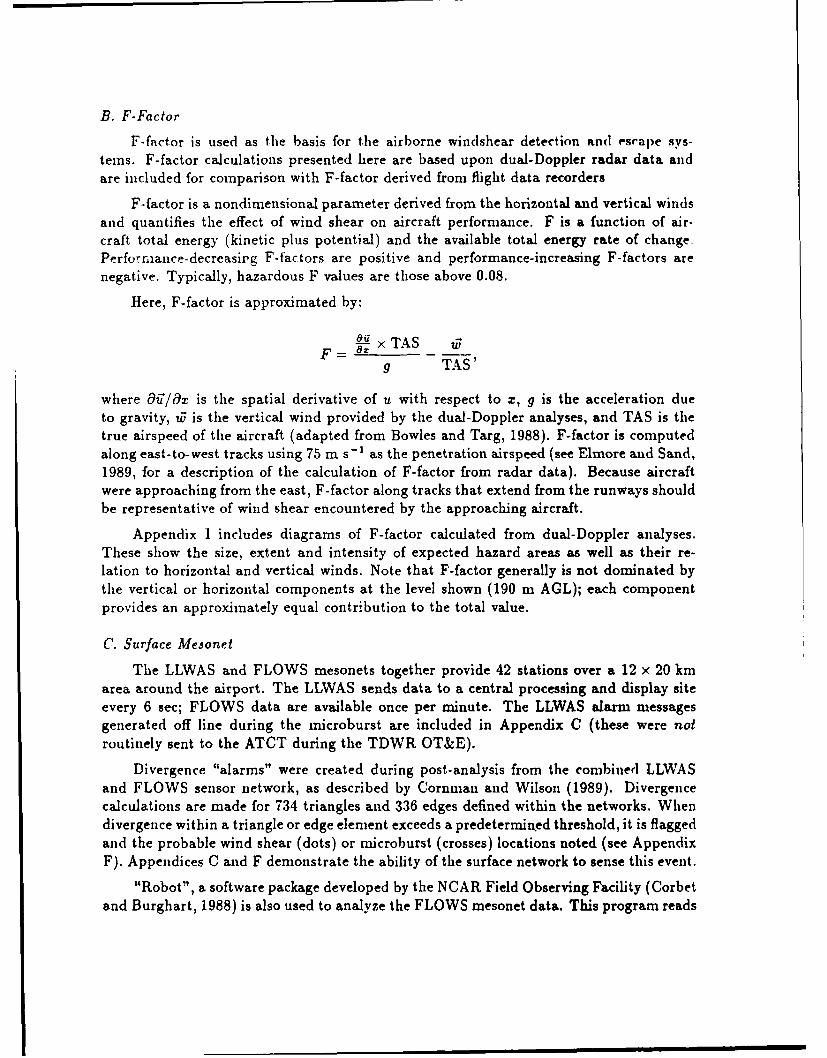
B. F-Factor
F-factor is used as the basis for the airborne windshear detection and escape sys-tems. F-factor calculations presented here are based upon dual-Doppler radar data andare included for comparison with F-factor derived from flight data recorders
F-factor is a nondimensional parameter derived from the horizontal and vertical windsand quantifies the effect of wind shear on aircraft performance. F is a function of air-craft total energy (kinetic plus potential) and the available total energy rate of change.Performance-decreasirg F-factors are positive and performance-increasing F-factors arenegative. Typically, hazardous F values are those above 0.08.
Here, F-factor is approximated by:
- x TAS ,j9 TAS'
where O&I/ax is the spatial derivative of u with respect to x, g is the acceleration dueto gravity, ti is the vertical wind provided by the dual-Doppler analyses, and TAS is thetrue airspeed of the aircraft (adapted from Bowles and Targ, 1988). F-factor is computedalong east-to-west tracks using 75 m s - I as the penetration airspeed (see Elmore and Sand,1989, for a description of the calculation of F-factor from radar data). Because aircraftwere approaching from the east, F-factor along tracks that extend from the runways shouldbe representative of wind shear encountered by the approaching aircraft.
Appendix I includes diagrams of F-factor calculated from dual-Doppler analyses.These show the size, extent and intensity of expected hazard areas as well as their re-lation to horizontal and vertical winds. Note that F-factor generally is not dominated bythe vertical or horizontal components at the level shown (190 m AGL); each componentprovides an approximately equal contribution to the total value.
C. Surface Mesonet
The LLWAS and FLOWS mesonets together provide 42 stations over a 12 x 20 kmarea around the airport. The LLWAS sends data to a central processing and display siteevery 6 sec; FLOWS data are available once per minute. The LLWAS alarm messagesgenerated off line during the microburst are included in Appendix C (these were notroutinely sent to the ATCT during the TDWR OT&E).
Divergence "alarms" were created during post-analysis from the combined LLWASand FLOWS sensor network, as described by Cornnman and Wilson (1989). Divergencecalculations are made for 734 triangles and 336 edges defined within the networks. Whendivergence within a triangle or edge element exceeds a predetermin ed threshold, it is flaggedand the probable wind shear (dots) or microburst (crosses) locations noted (see AppendixF). Appendices C and F demonstrate the ability of the surface network to sense this event.
"Robot", a software package developed by the NCAR Field Observing Facility (Corbetand Burghart, 1988) is also used to analyze the FLOWS mesonet data. This program reads

Common Mesonet Format (CMF) data and produces a number of outputs. Some of theseare contained in Appendix F.
To compare LLWAS winds to radar winds, LLWAS winds are projected onto radi-als from each radar. These projected winds are plotted against their nearest radar gateDoppler velocities in Appendix G.
III. Meteorological Conditions
A. Synoptic Setting
The major synoptic scale weather feature is a slowly-eastward-moving shallow troughover the western United States. Figures 3 and 4 show conditions at 50 kPa, 70 kPa, and85 kPa at 12 Z and 00 Z on 11 nad 12 July, respectively. At low levels (85 kPa), warmair is contained in the base of the trough. This feature is barely discernable at 70 kPaand vanishes above that level. Winds never exceed 10 m s- 1 at any level over Colorado,Wyoming or Utah and are generally westerly.
This westerly flow advects warm, moist air over the project area throughout the day.Figure 5 shows data from the National Oceanographic and Atmospheric Administration(NOAA) thermodynamic profiler located at Stapleton Airport. Using microwave radiom-etry, this instrument provides vertical temperature and moisture information; equivalentpotential temperature (0e) and mixing ratio contours plotted against height are also shown.
Throughout the day, moisture increase in a deep layer extending from the surface to over12 km MSL (10.4 km AGL) and reaches a maximum at 2200-2230. The maximum totalprecipitable water vapor content for the day is 1.05 cm.
Automatic Terminal Information Service (ATIS) weather messages are included in tileATCT voice tapes. Three messages were issued during the time of interest. ATIS-X, issuedat 2145, noted a temperature-dewpoint difference of 50*F. Large temperature-dewpointspreads indicate the potential for microburst activity. This difference decreased to 40*Ffor the ATIS-Y and ATIS-A messages that were broadcast at 2200 and 2203; which aircraftmonitored which broadcast is unknown. A complete description of aircraft operations isincluded in a report by Ireland (1989).

U-f ) I Lfl:
.~ ~ ~ .... ................
LO~
N2 x
L 1) I I
~~~........ .... ....... ........ ...... ..... .../c bO.
0*)CC)/ UoN \ KxL
Co ~ c I).O
........ C . . .... .... C
.. ~ A 0
r--
.... LfO .r 0

66 I 9VT 9961 -Iflf-ZT AO)U'91S VAVSIJOS
.r . .......
i-r).. . .. ...... .
loo ........ -T~
- -0' . ... ...........
......... .......
ct ~ ~ ......... r
V ........ ...... . ......... rTo'% \~ \ :
j
............4
\\\N ......
0LL.................... w .
C)(r.. .... .
I 1 , g

Lr)LO
C)----------Lr)
COe ..........
cr),opLOoo?5
I m00,
00-;rooo
Jf ........U-)
1 U')rr)
...............
........ .....
................... I ..... ...... ..... ...... .... ....
e coEP
w-4rij
............. ..... ........... ... ....................................... cco/
\CD... ........ ....... ........ C\2 LL.
co... ........ E-Ln
......... oLQ
........... ...... 0C\2
mLr)......... ..........
%9

ZE9C:'j7: 10 9961 -i-l I I AOIUVS MAVISUO01
ccc)
. ...... ..
1 (.0
U-) U' . -. . .........
7LA....... /0 ... t
CC)
..... ..... .. .. .. .. ... .. .. . ..
Ur)
.... ... ... ..
CT) v

TO'6Z:6C:TO 8961Iflf-11 AO)IuelS ,AVrSTuoa1
Uin-
; .........
-z
.. .. . . .........
: :..- r
72 ... / . ..... ........
..... ... ..........
en./.en
..... ...............
-- I ...... L
0
.% . ... ..
0 '4 '........
\, C)
00

4 T L4VCTO0 9661 -lflf-TI A03JU11S VAUISIUOS
... .. ... . .- -. .........
/ i.----.
E cr1a.L
U'
..... . .......
/F

B. Local Sounding Analysis
A ('LASS sounding site was located at the Weather Service Forecast Office, jist east
of Stapleton International Airport. Two soundings were obtained prior to the microburst:at 1700 and 2004. The 1700 sounding (Fig. 6) shows a nearly dry adiabatic lapse ratefrom 3.4 km MSL, (1.8 km AGL, 68 kPa) to 6.0 km MSL (4.4 km AGL, 49 kPa). A moistlayer (relative humidity greater than 50% ) exists between 5.4 and 6.1 km MSL (3.8 and5.5 km AGL, 52.5 kPa to 48.5 kPa). There is marginal moist convective instability in thissounding, with a Lifted Index (LI) of -2. The equilibrium level is near 8 km (6.4 km AGL,39 kPa). Equivalent potential temperature (9e) for both soundings is shown in Fig. 7; eachtrace is labelled accordingly. Above the moist layer, the atmosphere is quite dry and 0.decreases.
Wind structure at 1700 is also shown in Fig. 6 plotted along the right-hand side of
the sounding. There are two regions of significant winds: one centered near 3.3 km MSL(1.7 kin AGL, 70 kPa), with 10 m s- 1 winds from 2950, and a layer of northwesterly10 - 15 m s- i winds above 6.9 km MSL (5.3 km AGL, 43.6 kPa).
Considerable changes occur by 2004, as shown in Fig. 7. Below about 7.25 km MSL(5.65 kni AGL, 41.6 kPa), the entire sounding has moistened. The temperature lapse rate is
dry adiabatic from the surface to 4.8 km MSL (3.2 km AGL, 57.0 kPa). Stability for moistconvection remains relatively unchanged, with an LI of -2. The convective equilibrium levelis poorly defined in this sounding; a lifted parcel temperature matches the environmentaltemperature from about 7.2 km MSL (5.6 km AGL, 41.5 kPa) to nearly 9.5 km MSL (7.9kni AGL, 31.0 kPa).
Dewpoints have increased between 5.9 and 7.0 km MSL (4.3 and 5.4 km AG1, 50.0 to43.1 kPa), which affects the Ge profile by increasing Oe throughout the sounding (Fig. 8).
A sharp, absolute minimum Oe of 326 K is present at 7.2 km MSL (5.6 km AGL) anda relative minimum exists between 4.8 and 5.0 km MSL (3.2 and 3.4 km AGL). Thus,saturated parcels are potentially cold and will accelerate downward if they originate ateither 7.2 km MSL (5.6 km AGL) or just below 5 km MSL (3.4 km AGL).
Winds in the boundary layer are less than 5 m s- I and are southeasterly from 1.6 to2.0 km MSL (surface to 400 m AGL), becoming westerly above. Above 5.4 km MSL (3.8km AGL, 53.0 kPa), westerly winds abruptly increase to 10-15 m s- 1. Above 7.0 km MSL(5.4 kin AGL, 42.7 kPa), winds have a significantly stronger northerly component.
Using a surface mixing ratio of 6.2 g kg - ' and 31°C temperature, the lifted conden-sation level (cloud base) is 4.8 kin MSL (3.2 km AGL, 57.1 kPa), and the level of freeconvection is 4.9 kin MSL (3.3 km AGL, 56.4 kPa). Rising parcels retain their buoyancyto 8.0 km MSL (6.4 km AGL, 37.6 kPa).

C-
0 Lf0
01,* I
0) I-..AL

200410 ,1700
9 //
8U,,
S7E -
w 6 -
4
3
I, II21700 ~ 2004
320 330 340 350
6e (K)FIGURE 7. Equivalent potential temperature (8.) plotted against height from the 1700 and
2004 UTC CLASS soundings.

01-4
-4-
os
- 00
a) a6

(qmiu) 9Jnlss,9.5
0~C 0 0 00 0 0 0 Lf) 0 coV) LO C)- 0 c -
C\,
co ir
o 00C-4L0
C\2C ~ -4 1
0L o) -d 0-
-L- I~ V

Q o 0 0 C) 0- cQ 0- LO ~ 00 0 :)
C))
-4
C-,
1-7
co
co C Q C : DCoo I'0C
-4 - -id T'- -

B. Local Sounding Analysis
A 'LASS sounding site was located at the Weather Service Forecast Office, jiit eastof Stapleton International Airport. Two soundings were obtained prior to the microburst:at 1700 and 2004. The 1700 sounding (Fig. 6) shows a nearly dry adiabatic lapse ratefrom 3.4 km MSL, (1.8 km AGL, 68 kPa) to 6.0 km MSL (4.4 km AGL, 49 kPa). A moistlayer (relative humidity greater than 50% ) exists between 5.4 and 6.1 km MSL (3.8 and5.5 km AGL, 52.5 kPa to 48.5 kPa). There is marginal moist convective instability in thissounding, with a Lifted Index (LI) of -2. The equilibrium level is near 8 km (6.4 km AGL,39 kPa). Equivalent potential temperature (0,) for both soundings is shown in Fig. 7; eachtrace is labelled accordingly. Above the moist layer, the atmosphere is quite dry and 0edecreases.
Wind structure at 1700 is also shown in Fig. 6 plotted along the right-hand side ofthe sounding. There are two regions of significant winds: one centered near 3.3 km MSL(1.7 ki AGL, 70 kPa), with 10 m s- 1 winds from 2950, and a layer of northwesterly10 - 15 in s- 1 winds above 6.9 km MSL (5.3 km AGL, 43.6 kPa).
Considerable changes occur by 2004, as shown in Fig. 7. Below about 7.25 km MSL(5.65 km AGL, 41.6 kPa), the entire sounding has moistened. The temperature lapse rate isdry adiabatic from the surface to 4.8 km MSL (3.2 km AGL, 57.0 kPa). Stability for moistconvection remains relatively unchanged, with an LI of -2. The convective equilibrium levelis poorly defined in this sounding; a lifted parcel temperature matches the environmentaltemperature from about 7.2 km MSL (5.6 km AGL, 41.5 kPa) to nearly 9.5 km MSL (7.9km AGL, 31.0 kPa).
Dewpoints have increased between 5.9 and 7.0 km MSL (4.3 and 5.4 km AG1, 50.0 to43.1 kPa), which affects the 0, profile by increasing 0, throughout the sounding (Fig. 8).A sharp, absolute minimum Oe of 326 K is present at 7.2 km MSL (5.6 km AGL) anda relative minimum exists between 4.8 and 5.0 km MSL (3.2 and 3.4 km AGL). Thus,saturated parcels are potentially cold and will accelerate downward if they originate ateither 7.2 km MSL (5.6 km AGL) or just below 5 km MSL (3.4 km AGL).
Winds in the boundary layer are less than 5 m s- l and are southeasterly from 1.6 to2.0 km MSL (surface to 400 m AGL), becoming westerly above. Above 5.4 km MSL (3.8km AGL, 53.0 kPa), westerly winds abruptly increase to 10-15 m s- 1 . Above 7.0 kiu MSL(5.4 km AGL, 42.7 kPa), winds have a significantly stronger northerly component.
Using a surface mixing ratio of 6.2 g kg - 1 and 31"C temperature, the lifted conden-sation level (cloud base) is 4.8 kin MSL (3.2 km AGL, 57.1 kPa), and the level of freeconvection is 4.9 kin MSL (3.3 km AGL, 56.4 kPa). Rising parcels retain their buoyancyto 8.0 km MSL (6.4 km AOL, 37.6 kPa).
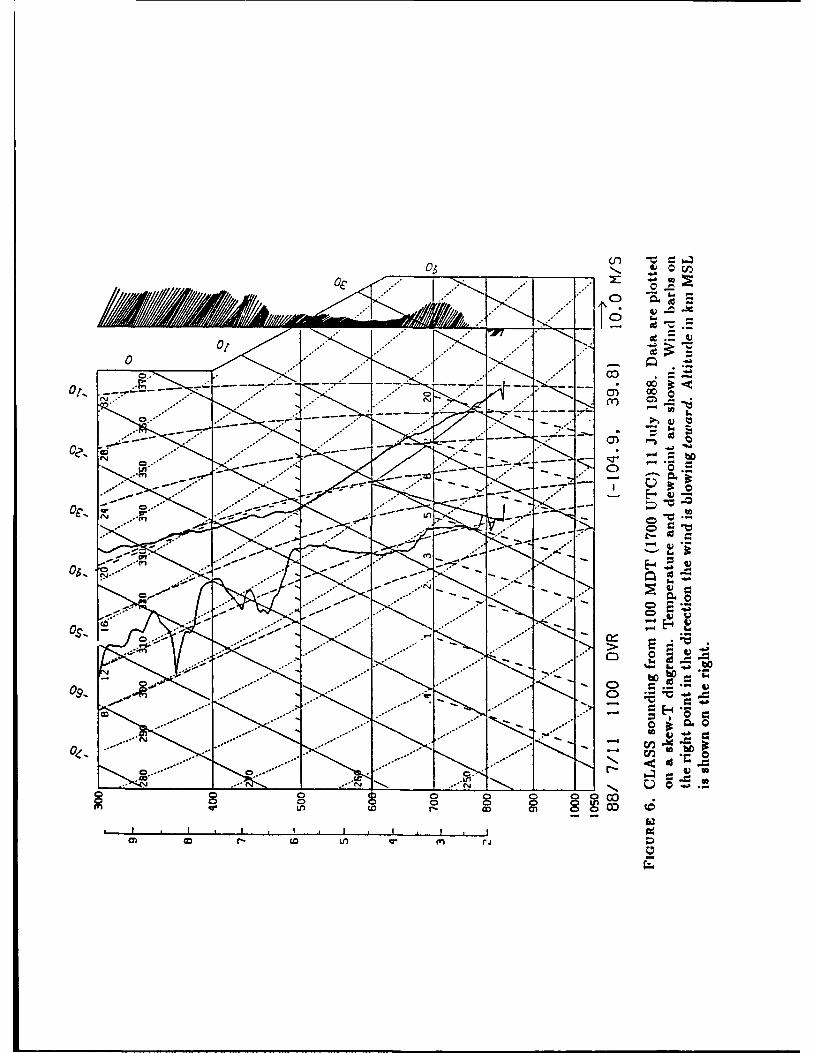
= b4
o or-
o 0 0CO 4O 1
* sII
0) 1 C Iflto

200410 - .. ,1700
9 //
i/
I' II
8
M 7E
w~ 60
4
2 -
1700-1 2004
320 330 340 350
6e (K)FIGURE 7. Equivalent potential temperature (0e) plotted against height from the 1700 and2004 UTC CLASS soundings.

06
001 0 0 00
I- L

IV. Microburst Observations
A. Overview
Figure 9 shows the expected headwind losses affecting arrivals to runway 26 (26A)derived from the TDWR algorithm operating on 11 July, the revised algorithm, the least-squares dual-Doppler post-analysis, and the LLWAS. Encounter times for the four aircraftthat penetrated the microburst are noted.
Direct least-squares dual-Doppler analyses provide wind speed loss estimates abovethe 10 m s- ' (20 kt) warning threshold at 2204. These analyses will resolve a wind speedloss above threshold along a direction other than directly toward or away from FL2. Therevised TDWR algorithm gives an initial warning at 2205, and the original TDWR firstalarmed 1 min later at 2206. The ending alarm times also differ, as do the maximumcalculated wind speed differences. The original TDWR maximum wind speed differenceis 85 kt, compared to the revised TDWR value of 70 kt and the direct least-squares dual-Doppler value of 68 kt. The maximum LLWAS wind speed loss, measured at the surfacerather than at 190 m aloft, is 45 kt. Reasons for the sudden increase in estimated windspeed loss near the end of the alarm period generated by the original TDWR algorithmare not known; the revised algorithm corrected this apparent error.
The first LLWAS microburst alarm occurred at 2210:42, nearly 5 niin after the firstTDWR alarm. There are two major reasons for this apparent discrepancy. First, theradar detected the microburst prior to its arrival at the surface. Second, the microburstwas east of the 26A threshold and so not optimally located for LLWAS detection. In fact,one of the LLWAS sensors was near the center of the microburst, effectively removing itfrom the network; winds there are never very strong. The microburst remained east ofthe other LLWAS stations. Westward progress of the microburst outflow at the surfaceappears to have been somewhat impeded by the northwesterly outflow from the main partof the storm.
Least-squares dual-Doppler radar analyses (centered 190 m above the airport) areshown in Appendix D. Horizontal wind vectors are provided on a 0.5 ki-resolution gridaround the airport for 1-min intervals covering the microburst detection period. Analysesof AV for the same time period are also shown. Contours indicate wind speed losses of atleast 10 m s- 1 over at most 4 km.
The first inicroburst begins at 2203 southeast of the airport. This event is not con-tained within in the airport alarm area. The TDWR algorithm detects it at 2204 (see theGSD displays in Appendix A). A larger, more intense microburst is first detected by theTDWR system at 2206. This event maintains a wind speed loss above microburst alarmlevels (10 m s- 1 or 20 kt) until 2248. In post-analysis, the revised algorithm changed theending alarm time to 2231. Operated off line, LLWAS did not i:-sue a microburst warninguntil 2210:42. The microburst develops rapidly, reacbing a maximum strength (in terms ofwind speed difference across the feature) at 2213. Later, it expands in size and is joined byseveral other microburst cores that extend to the west-northwest. Fiorn the least-squaresdual-Doppler analysis (Appendix D), a AV of at least 15 kt is maintained until 2239; AV

0
$WJIDID JjMO± 40 PU3 -.
qw teuossw peuiqwoo ;o PU3 ~'
(DW0
C,JN ,
EV 0
1- 0
SMH iM ]. POSAOJ 10 PU3 C~ 00 0a
w 00
cc 0~0
IC)
c e
$AS1 S!S 'SMCJ Al D -d X-c~
0)0SIIAIDuos SoflIwoA 481j.. 0
op 0 0 01PCM)A

of 10 kt or greater lasts until 2248. LLWAS-generated warnings were sporadic until thefinal one at 2249.
The following sections present histories of the microbursts and their parent reflectiv-ity cells using dual-Doppler and surface mesonet analyses. Three basic flow regimes existoutside the storm complex: light and variable winds from the surface up to 5 km MSL (3.4km AGL), westerly winds between 5 and 7 kin MSL (3.4 and 5.4 km AGL), and north-westerly winds above 7 km MSL (5.4 km AGL). Within the storm complex, environmentalwinds become relatively light. When necessary, feature locations are given as [x, yJ pairsrelative to FL2; the x coordinate is in km east, and the y coordinate is in km north of FL2.Stapleton airport runways are shown by heavy lines. Appendices H-J include analyses ofthe three-dimensional dual-Doppler radar data. The airport proper covers an area from-10 to -14 km in x and 6 to 13 km in y.
B. Microburst Origins: 2130-2202
During these discussions three reflectivity cores within the storm complex will beidentified: A, B and C. The microburst affecting airport operations emanated from coreC. These cores and other features are noted in the figures and in the Appendices.
The microburst-producing complex originated from two 60+ dBZ, cells which formedaround 2130 over the mountains 34 km west of Stapleton. These cells grew and movedsoutheastward. By 2147, single Doppler radar data show a line of divergence aloft near6.6 km MSL (5 km AGL), oriented northwest-southeast and moving to the southeast.Reflectivity at that level increases just west of Stapleton at 2155, and shortly afterwardslarge-scale cyclonic shear is evident at 4.6 km MSL (3 ki AGL) over the airport. Surfacewinds are north-northeasterly across the airport (see Appendix E), temperatures are 31-32°C across the FLOWS mesonet and the air is fairly dry, with 22-25% relative humidity(RH) values (see station plots in Appendix F.)
Between 2148 and 2200, no reflectivity values in excess of 10 dBZe are near the airportproper. Reflectivities correspond to those for clear air; there are no hydrometeors near thesurface. The general storm complex is located to the west, oriented in a north-southdirection. At 2148 a 30 dBZ, cell (core A in Appendices H-J) is well west of Stapleton at190 m AGL. By 2200, core A has intensified to 38 dBZe at 190 in AGL and remains westof Stapleton Airport. There is weak, large-scale outflow from the main storm complex;winds over the airport remain light, but have shifted from generally northerly to generallywesterly. However, no significant outflow is apparent on or near the runways. As wouldbe expected with this flow field, w and F are quiescent near the surface.
At 2200, a second core with a maximum reflectivity of 35.9 dBZe at 6.3 kin MSL (4.7km AGL) is just southeast of the runways (core B). This core is in an area of generallywesterly winds aloft, previously noted in the 2004 sounding. As is the case during thisentire analysis period, horizontal flow within large regions containing reflectivities greaterthan roughly 25 dBZ, is relatively weak. The 37.7 dBZ, core at [-22.8, 14.8] and 6.3 kmMSL (4.7 km AGL) is associated with core A (discussed above).

Maximum reflectivities in this storm are well aloft (9.3 km MSL, 7.7 km AGL) andbarely exceed 40 dBZ,. The 41.0 dBZ, core at this level is not associated with cnre A but.is a newly developing cell that soon extends to the surface. It is labelled core C and isassociated with a 21 m s- 1 updraft at 7.8 km MSL (6.2 km AGL), the strongest updraftin the domain. Because this updraft is quite vigorous, it remains relatively erect whileembedded within strong flow. Core A, the older cell, tilts appreciably with height.
Winds are northwesterly in the southern half of the grid and are generally westerly inthe northern half. The northeastern and eastern parts of the analysis domain are emptybecause there are no scans at elevation angles high enough to include data at such closeranges.
By 2202 two small reflectivity cores (B and C) appear near the surface. Core B,located southeast of the east-west runways, contains a 22.9 dBZ, maximum. It containsa weak microburst 2.5 km across with a maximum differential just above 10 m s- 1 . Thismicroburst was observed visually by one of the TDWR OT&E ATCT meteorologists fromthe Stapleton ATCT. The vertical velocity associated with this microburst is -3.3 m s- 1at 190 m AGL, and the maximum F is 0.11.
The second reflectivity core, C, is just east of the eastern end of the east-west runway.There is no outflow associated with it yet, but it becomes the dominant microburst.
In order to examine the relationship between the reflectivity cores, three-dimensionaldisplays of reflectivity contours were prepared. Reflectivity above 33 dBZ, is containedwithin the stacked horizontal contours (Figs. 10-12). the storm is viewed from the south-west; The viewer's coordinates are 40 km south, 78 km west of FL2 and at a height of20.8 km MSL (19.2 km AGL). Figures 10a-g shows these views for the first seven analysisperiods.
Core A is at the western extreme edge of the displayed domain (Fig. 10a). Core C firstappears aloft (6.8 km MSL, 5.2 km AGL) at 2158 (Fig. 10e). The perspective used for thesefigures somewhat obscures core C, shown by a heavy dot. A plume of hydrometeors forms a"bridge" of reflectivity which extends downwind (winds near the radar-detected storm topwere from the northwest) from a combination of cores A, B, and C. The updraft penetratesinto to the layer of northwesterly winds noted in the previous section. These winds havespread the hydrometeors (most likely graupel) along a line oriented from northwest tosoutheast.
Appendix J contains selected vertical cross sections through this storm. Locations foreach cross section are shown by the heavy lines in the corresponding figures from AppendixH. These cross sections are located roughly along the maximum reflectivity axis just abovethe surface. The horizontal axis in all these figures is labelled in km from the cross sectioncenter while the vertical axis is labelled in kni AGL. Locations of features are describedby their location on the horizontal axis and, where necessary, by their altitude.
Figure J1 shows core B aloft at 2148. Because this is the first analysis available,the origin of this core cannot be traced back prior to this time. The maximum updraftassociated with this core is 10 m s- ' at 6.8 km MSL (5.2 km AGL) just south of thecross section. There is no well defined downdraft associated with core B at this time. The

0Y00
m~ rn
-0'.
0 .- -
co go!
('i 00 S.0
.d
C)l 1. 00
e) 00 C400~ 0
4 . L.-. Q . '
;7j z~ C: C
0
0 - 00. i

LI
co
I -zI iM
z )
C) I
c)
Fe* z
--
Li
r-NJ
ODOD)

0L0(r)
LU_
toJ
r--
co L
LO
N>-

C
C-)
C
f-Jco0
U-J
(02
CD.
UU
Li
--
LF)
00

C
0
0
l,j
>- I
zo-
C
a)z
Lf CD
LUj
IN -
N>-

m
00 m
DIJ
Ci 0U-,
U-
N.)

0C0
m
NLJ
o 0(\ii
00 C
LJ
Nu
r- r-OD
0o

o b
0
in 1-4C)C1
LCU
oy
eqC) C4
C cj
C))
060-0
N4.
(0j 0Lu.) Ut
OD

LuJ
r4I
M
z
go
000

C-)
(yJ
o U-QCCJ
zcjm:00CD
Lo
CNJ
CDJ
C0
0D0X
rNJ LiJ
LLi
N-
N>-

00
uLJ
0
mCC
OC A.Z1
N.
zo
m Uz
0-r-rjN)-aLJ

C
M
LU~
CDC
r~I-
CC
m C;
C4
U-) (r
- r*
-, >:aD
00

C0
0Y'
N I
C,j
N U
C
00

M
C)
co
Ci
C',, 0 1'-C,,
0 V)~1
CISLJ
(NJ
03
00

best-defined downdraft in the analysis domain is associated with core A and is also on theorder of 10 m s- 1 at midlevels.
Core C first becomes apparent at 2158 (Fig. J5), 5.2 km above the surface (6.8 kmMSL). In structure it is similar to B in that the updraft supporting it is just to the south,albeit about 50% stronger with a maximum value of 16.5 m s- ' 7.3 km MSL (5.7 kmAGL). Descent of core C is clearly apparent by 2202 (Fig. J7). By this time core C iswithin a -5 m s - 1 downdraft. An 11 m s - ' updraft is associated with a 35 dBZ, core at7.8 kin MSL (6.2 km AGL). Core B has descended to the surface, but there is no outflowyet associated with it.
Appendix E shows a comparison between Doppler radar winds and LLWAS winds.In these figures, LLWAS winds have been projected onto a radial from the radar; radarwinds are then plotted alongside the projected LLWAS winds. Prior to the alarm period,which began at 2206, the two wind measurements show reasonable agreement, althoughthe radar-measured wind speeds tend to be higher than those from the surface; this isexpected due to urface friction.
C. Alarm Period: 2205-2215
The 2205 dual-Doppler radar analyses indicate significant changes in the storm struc-ture. The southeast microburst, B, at the 190 m AGL analysis level, has strengthened andexpanded, containing 15 m s- 1 wind speed differential over 4 km. Maximum reflectivityat its center is 32 dBZe, the maximum downdraft is -3.1 m s- 1, and the area containingdowndraft greater than -2.5 m s- ' has roughly doubled from the previous analysis period.Maximum F is about 0.10.
The main microburst is associated with C. Although not yet as strong as the earlierndcroburst, it contains a 12-13 m s- 1 wind speed difference over 2 km and a maximum Fof 0.08. This feature is associated with a small -2.5 m s-' downdraft.
At midlevels, Core B descends to 6.3 km (7.9 km MSL) by 2205 (see Fig. J8). Theupdraft in the area of lower reflectiviy (between the two cores, centered near 3 km AGL)increases in intensity; core B is now located on the interface between updraft and downdraftregions. The previously noted reflectivity bridge is clearly evident, emanating from coreC, which remains aloft. The connection to the decaying core A extends behind this crosssection to the northwest.
Significant differences between the radar and surface mesonet-measured winds becomeapparent by 2205. At the level of the lowest radar scan, winds in excess of 10 m s- 1
are measured; winds remain relatively calim at the surface. For example, station 93 (seeAppendix G), which is south of the airport, shows light and variable winds, but winds atthe radar scan level are 4 m s - 1 outbound from FL2 and 10 m s- 1 outbound from UND.
By 2207, the main microburst, C, is by far the most impressive of the two. Withincreased east-west extent and a second, stronger reflectivity core displaced eastward fromthe initial core, reflectivity has increased by 20 dBZe in the outflow region on the eastern
' Appendiz E shows LLWAS and FLOWS mesonet station number locations.

side of the microburst. Outflow intensity has also increased: from the eastern edge of theoutflow region to its center, the wind speed difference is 13-14 m s' over 2 km. Maximumdowndraft velocity is -3.4 m s-1; the maximum F of 0.09 is displaced slightly eastward,centered at [-8.0,6.6].
The southeast microburst is decaying rapidly; the maximum downdraft is barely -2.5ni s - 1 and reflectivity has decreased rapidly in both intensity and horizontal extent. Itshould be noted that this rnicroburst was exceptionally short lived, developing from quies-cence to its maximum value in only 2.5 min and then essentially disappearing only 5 minafterwards.
The core C microburst continues to intensify through 2210. The maximum downdraftis -4.5 in s- 1 extending from the eastern outflow edge to the center. Maximum wind speeddifference exceeds 15 m s- 1 over 3 km. Considerably more shear exists, 20-25 m s- 1, acrossthe micrt.'_ .st in the north-south direction. At 190 m AGL, maximum reflectivity withinthe outflow is 36 dBZ, (see Appendix I). A gust front from storms to the northwest isclearly evident in the northwest corner of the analysis grid. F has increased nearly 50%from 0.08 in the prior analysis to 0.11; in a span of 5 min, F within the main microburstgrew from practically zero to 0.11.
The strongest downdraft observed during the microburst, -13 m s - 1, occurs duringthe analysis centered at 2210. By this time, core C has descended to the lowest radarscan level. From there, it extends almost vertically up to 7.2 kni AGL, 8.8 km MSL (seeAppendix J). From 7.2 km AGL (8.8 km MSL), a reflectivity plume extends downwardand eastward (towards the right-hand side of the figure) and terminates at the microburstlocation. The cross section illustrating this also contains the 13 m s' downdraft at 2.2km AGL (3.8 km MSL). A radar bright band is centered near this level, caused by meltingof frozen hydrometeors (graupel) from core C. A similar feature is associated with core B.
By this time, the FLOWS mesonet begins to show evidence of the core C mcroburstat the surface. Between 2209 and 2210, the temperature at station F23 (see AppendixF) drops 6°C from 29 ° to 23°C, and the wind speed increases from 7 to 15 in s - '. Rel-ative humidity also increases from 24 to 43%. During the previous minute, wind speedincreased from 3 to 7 m s-1; these winds apparently indicate initial outflow arrival priorto any temperature or humidity signatures. Several other stations experienced wind speedincreases or abrupt wind direction changes from the previous minute, especially F21 andF22 (near the eastern and western edges of the niicroburst). These stations did not recordthe accompanying thermodynamic changes at this time, however. LLWAS station L7 (Ap-pendix G) records a sudden rise in wind speed near 2210. These wind speed fluctuationslag similar radar-measured winds by about 1 min; the first LLWAS alarm, a 35-kt loss on26A, occurs at 2210:42.
Maximum event intensity occurs within the 2212 dual-Doppler analysis. Reflectivitynear the surface peaked at 38.4 dBZe. The microburst has expanded and intensified;maximum east-to-west differential velocity is nearly 20 m s- ' over 3.8 kin, the maximumdowndraft at 190 m is -3.8 m s - and maximum F is 0.13. The nV analysis (see Appendix

D) shows an expected headwind loss of 33 m s- 1 (66 kt). This event is the strongestmnicroburst yet analyzed using dual-Doppler techniques.
Core C reflectivity increases to almost 39.7 dBZe, but outflow beneath it fails todevelop as rapidly or as strongly as core B. This may be due to weak pre-existing cooloutflow at the surface from the storm complex; core C is further to the west than B andthus is closer to the outflow from the main storm. Core A is not clearly apparent at thistime, being little more than a northwestward extension of the 30 dBZe contour.
At 6.3 km (7.9 km MSL), a single 35 dBZe reflectivity core clearly marks the mid levelof core C (see Appendix H). Two cyclonic circulations are associated with this core alongwith significant convergence on the southeast flank. Below this level is an area of generaldescent and above it are mostly weak updrafts.
At 9.3 km (10.9 km MSL), maximum reflectivity within core C is 30.7 dBZ, 7 dBless than the value at 2207. There is still some storm-top divergence associated with coreC, but the updraft beneath it has decreased to little more than 11 m s', a decrease of 2m s- 1 from its previously analyzed value.
Figures 1 la-d chronicle the vertical development of core C and the descent and inten-sification of core B. At 2205 reflectivity aloft is associated with B and is not yet reachingthe lowest analysis level. The first signs of core C reaching the surface appear at 2207and there is a clear link or "reflectivity bridge" between cores C and A. At 2210 core C isnot quite as erect as at 2207; careful inspection shows that the western extreme of core Chas shifted somewhat eastward above 7.3 km (8.9 km MSL). By 2212, core C has a morepronounced tilt, and reflectivity within core B continues to descend.
From 2210-2220, considerable spatial and temporal variations in wind speed are ap-parent in the LLWAS. This is especially evident in those stations near the edge of thenicroburst: LI, L2, L7, and L9. LLWAS stations report winds every 6 s and representpoint values at the surface, while the 1-min radar data resolution, along with the spatialaveraging that takes place within each range gate along a beam, causes temporal smooth-ing that tends to remove extremes in the wind measurements. Data from these stationsshow gustiness which is not resolved by radar measurements; LLWAS data shows highermaximum microburst wind speeds than those measured by the radars. LLWAS alarmsduring this time are sporadic and do not maintain a constant strength (AV = 10 m s'or 20 kt) as shown in Fig. 9. Cornman et al. (1989) discuss the significance of small-scalefluctuations in microburst winds.

D. Dissipation: 2215-2300
Alho ulgh 1his event maintains the defined microhurst strength through 222R (uqiligthe revised Lincoln Laboratory algorithm), the parent storm begins weakening well beforethis time. The storm collapses and downdrafts continue to "feed" the surface outflow.
By 2215, the niicroburst outflow expands further, extending past the analysis domaineastern edge. Core C has decreased in areal coverage somewhat while essentially main-taining peak reflectivity (37 dBZe). Outflow from C, constituting the main microburst,has become distorted by outflow from the main storm complex and is now quite complex.Maximum east-to-west velocity differential is down to 15-20 m s- 2 over 6-7 kin; the mi-croburst has expanded into a macroburst. Its presence is slowing the advance of a gustfront from the main storm complex: towards both the northeast and southwest the gustfront has advanced farther than in the immediate microburst/macroburst vicinity.
Two distinct downdraft maxima are apparent in the 2215 high-resolution horizontalcross section (Appendix I): near [-9.4,5.21 and [-5.0,7.0], with velocities of -3.2 and -3.0 m s-- , respectively. Because several downdrafts exist in close proximity, this may bethought of as a multiple rnicroburst event. The maximum F, 0.11 at this time, is locatedalmost coincident with the downdraft centered [-5.0,7.0]. A second maximum, 0.09, iscoincident with the downdraft at [-9.4,5.2].
Approaching from the northwest, the gust front occupies the northwest third of theanalysis grid. Associated with it is a performance-enhancing region, with peak F valuesof -0.07 to -0.09. The stiongest updraft associated with the gust front has decreased tolittle more than 11 m s-' from the prior 13 m s-1 maximum.
A'oft, a single reflectivity core is again observed at the 6.3 km AGL level (7.9 kmMSL), as shown in Appendix H. The convergence region southeast of the core remainsaccompanied by a weak downdraft, and in the northern part of the analysis grid flowremains generally northwesterly. Westerly winds, part of weak outflow from convectionto the west, have returned to the southern 4 km of the domain. The boundary of thesewesterlies is moving slowly eastward.
The 30 dBZ, contour has descended from 7.2 km to 6.7 km (8.8 km to 7.3 km MSL).A well-defined updraft no longer supports core C; none are visible in the vertical crosssection (Appendix J) nor present within a km to either side of it. A general area of 6-7m s- l updraft remains aloft, no longer ex:tending to the surface.
Flow throughout V region is generally northwesterly at 9.3 km (10.9 km MSL) andcore C, decreases rapidly in area and intensity (see Appendix H). Core C has also begunto accelerate southeastward. Its maximum reflectivity has decreased to 25.7 dBZ, almost5 dBZ, down from the previous scan.
The flow field at 2217, shown in Appendix I, has become quite complicated as themicroburst continues to expand. Reflectivities are decreasing with maxima of only 35 to 36dBZ,. Associated with the outflow region is a bow-echo pattern with minimum reflectivitynear [-9.2,7.4], indicating dry air eihtrainment aloft and hydrometeor extinction throughevaporation or sublimation.

A meaningful differential velocity estimate is difficult because much of the event isbeyond the eastern edge of the analysis domain. There are, however, two distinct hazardregions associated with this nicroburst: between [-2.0,6.81 and [-5.8,6.8] lies a windspeed loss of 20-22 m s- I over 3.8 kin, while between [-7.0,5.0] and [-10.2,5.0] a 10-12m s - 1 loss over 3.2 km exists. The strongest downdraft is -3.3 m s' at [-5.6,6.8].
Along with these two hazardous shear areas are two regions of significant F (seeAppendix I). The easternmost area contains F = 0.11 and the westernmost contains F =0.09; there is a third maximum at [8.2,6.81 where F is just below 0.09. None of these valuesare significantly different from the 2215 analysis.
The southeastward moving gust front is impinging upon the microburst outflow, re-sulting in a better defined (sharper) leading edge. A broad, northeast-southwest area ofnegative F values marks this region, with a -0.10 peak at [-11.0,8.8].
Most reflectivity in descending core B is close to the surface; core C remains suspendedaloft. A -10 m s- ' downdraft, the strongest in this cross section, is 1.7 km AGL (3.3 kmMSL) at 9 kni.
The reflectivity pattern clearly shows that this storm complex has entered the dissi-pation stage. The 30 dBZe contour has descended another 0.5 km. A reflectivity brightband is vertically centered at 1.7 km (3.3 km MSL), evidence that most hydrometeors inthis area are melting as they descend. There is general descent below 3.7 km AGL (5.3km MSL) from -3 kin to the right-hand edge of the cross section. Maximum downdraftintensity is -8.3 m s- I near 3 kin, vertically centered at 2 km (3.6 km MSL).
The last vertical cross section shown in Appendix J covers the analysis time centeredat 2220; it contains no significant updrafts, and there are none within 1 km of either sideof it. The storm is clearly collapsing: there is downdraft almost everywhere below 5 kmAOL (6.6 km MSL). Maximum reflectivity is located between 1.7 and 2 km AGL (3.3 and3.6 ki MSL), centered around the melting level.
Near the surface, the reflectivity pattern continues to evolve rapidly and is generallydecreasing, with a maximum value of 35.9 dBZ,. Surface outflow has expanded consider-ably and become quite complex, rendering any single velocity differential estimate inade-quate for hazard characterization. At 190 m AGL, most air is generally descending andthis analysis time contains the strongest downdrafts. The two strongest are at [-6.4,7.5]and [-4.0,6.6], which are both descending at -4.6 m s- '.
Due to these downdrafts, this analysis also contains the largest F values: 0.17 at[-4.0,7.0], 0.14 at [-6.6,8.0], and 0.12 at [-7.8,6.4]. Patterns of F near the surface arebecoming more complicated, further evidence that this is not a single event but a closelyspaced (temporally and spatially) collection of events.
Temperatures across the FLOWS mesonet slowly decline during this period. Themain nicroburst affected only a few stations, F23, F22 and possibly F21. The rest ofthe mesonet is affected by multiple outflow centers, which do not produce intense windsor temperature falls equivalent to the main nmicroburst. Temperatures decrease 5-8°Cwhile relative humidity increases by 8-21% over the mesonet. Southwesterly flow over the

northern and central stations and northwesterly flow over the extreme southern stations(Appendix F) refle't the general southeast-northwest outflow orientation.
The largest temperature drop is from 29°C to 210C at FLOWS station F23, occur-ring between 2209 and 2211. Proctor (1989) discusses a possible relation between themicroburst-induced surface temperature drop and the outflow wind speed. Using his tech-nique, an 8°C drop roughly corresponds to a 20 m s- i outflow, which is in fair agreementwith these observations. An earlier Fawbush and Miller (1954) formula yields a 25 m s- 1
estimate.
Storm dissipation is illustrated in Figs. 12a-c. By 2215, the area around core Bcontaining reflectivity greater than 33 dBZe has decreased substantially as have reflectivityvalues aloft in core C. A radar bright band develops by 2217, with an upper limit of 3.3 kmMSL (1.7 km AGL) in the radar analysis; the 0°C level from the 2004 sounding (Fig. 6)is 3.75 km (2.05 km AGL). Core C is tilting eastward at a steeper angle, and by 2220 theradar bright band increases more in area while core C rapidly decays.
After 2220, the microburst parent cell dissipates and leaves only weak, low-level di-vergence. The storm complex develops into a line and moves southeastward. Additionaloutflow from new cells, which are weaker than earlier cells, triggers convection on thesoutheast end of the line. As it moves away from the airport, the line becomes indistinct,and precipitation develops over a wide area.
E. Air Parcel Trajectory Analysis
Recail the 2004 sounding (Fig. 6) and the general minimum 6, area at 7 km MSL(5.4 km AGL). Also recall the presence of two distinct wind regimes at 7 and 10 km MSL(5.4 and 8.4 km AGL): westerly winds at 7 km MSL (5.4 km AGL) in the northern andsouthern thirds of the analysis grid, strong northwesterly winds above 10 km MSL (8.4km AGL), and weak flow within the active convection. The reflectivity plume most likelydevelops as the updraft penetrates the strong northwesterly winds above 10 km (8.4 kmAGL). As the updraft weakens above the equilibrium level, it is sheared downwind andthe hydrometeors carried up to that level (probably graupel) begin t' descend.
Figures 13-15 show air parcel trajectories computed using dual-Doppler-derived winds.The process of retrieving dual-Doppler winds removes ",vdrometeor motions using an as-sumed reflectivity-tern-inal fallspeed relationship. Thus, .he trajectories shown are airparcel trajectories and should not be confused with hydrometeor trajectories. Starting at2212 and computing traiectories back in time, air parcel locations at 2148 are determined.Parcels are initiated at 4.2 km MSL (400 m AOL). If initiated at heights much below this,many parcels exit the bottom of the grid (because w : 0.0 at 190 ni), terminating theirrespective trajectories. Many more trajectories than those displayed were examined, butthese are representative trajectories for most parcels within the microburst at 400 m AOLby 2212.
Three-dimensional perspective views of trajectory ribbons are shown in Fig. 13. Dis-tances along the z axis are stretched by a factor of 1.5 for these figures. Each axis islabelled with 25 tick marks. Thas, each tick mark represents 1.12 km in the z direction

6E:SS:11 =3w1±68-SZ-01 =31UO
01 :3tH
t0
r..
J~ -00 -
ato
000
0 a
.

and 0.88 km in the y direction. Each trajectory terminus is labelled with a vertical bar,and a short dash indicates where each of those bars intersects the surface. The bars thencontinue downward until they reach 0 km MSL. Trajectory ribbons are illustrated suchthat rotation along the path is indicated by twisting of the ribbon. Along these four tra-jectories there is little rotation until the parcels approach the ground where flow begins todiverge.
Figure 14a shows the same trajectories plotted with projections onto each of the threeorthogonal (x,y, z) surfaces. Vertical bars along these trajectories are plotted every 30 s.Air within the microburst at 2212 clearly originates well aloft and to the west of the surfaceoutflow.
Figure 14b shows the projection of each trajectory onto the y-z plane. On this figure,north is to the right so that the viewer is looking toward the west. Three of the parcelsoriginated at heights between 4.5 and 5.1 km (2.9 and 3.5 km AGL). The fourth, whichappears to have originated at 2.6 km (1.0 km AOL), in actuality did not; the trajectoryprematurely ended due to some missing data in one of the analysis volumes. Two of theparcels are clearly in updraft at 2200, the earliest analysis time available. None of theparcels are displaced appreciably north or south until they began to diverge at the surface.
Figure 14c shows parcel trajectories projected onto the z-z plane. East is to the rightin this figure; the viewer is looking north through the trajectory paths. All trajectoriesoriginate between 4.5 and 9 km west of their 2212 position. This places these parcelorigins west and slightly south of core B, as previously shown in Fig. 14b. This makessense because within the 2200 vertical cross section the maximum updraft is displacedsomewhat south of the cross section location.
In Fig. 14d, the track of each trajectory is projected onto the z-y plane, and horizontaldisplacements of each parcel can be clearly observed. Throughout the analysis time, untildiverging near the ground, these parcels were generally moving toward the east-northeast.
Figures 15a-k show the same air parcel trajectories broken into segments and overlaidon thret-dimensional reflectivity perspective plots. Using the information from earlier fig-ures, the general location of each trajectory can be deduced on these two-dimensional pro-jections. Each trajectory segment is computed over a 2.5-min time interval and projectedonto the reflectivity perspective plot that corresponds to the analyzed volume centeredon that 2.5 min span. For example, the trajectory segments shown in Fig. 15c indicatethe paths taken by the displayed air parcels during the time between roughly 2151:00 and2153:45, a 2.5-min span centered on 2152:15, the center time of the 2152 analysis.
Previous figures showed that all air parcel trajectories remained relatively well confinedto a narrow east-west corridor between about 5 and 7 km MSL (3.4 and 5.4 km AGL).Thus, these trajectories are south or, from this perspective, in front of, regions of reflectivitygreater than 33 dBZe.
Early in the analysis period, there are two groups of trajectories: those at midlevelsand those that are slowly ascending from 1-2 km AGL (2.6-3.6 km MSL). These twogroups merge between 2158 and 2200 at a height of 3.4-5.4 km AGL (5-7 km MSL).At this time, they intersect the developing reflectivity region. By 2202, the air parcel

61 =3WtJJ
01
V
L4 .
00- go
00~~I- ifi 1I
1 4)
It~a 11to t
1%4 t"

CJ
(W)0)

ZI =3&WS
I I II I I I I I I I I I I
CD U
00
cor
x D L
cc
a; U Cc
(W)4)0

6g-SZ-Ot :31jo3El =3Iwjj
0O0:
CD,
OD
coo
tr0
c("j
(W,4

.
cr-
14
(Nj 00
-~i V
I-)Zv4
.. 1
e~z
,wI 0
>- "
.,- 0 W

a;
.LA
0 )
"13
- a
N u
0j
04
LI
* •
-. .-
'J .-

c
6
C
C;
D
IIl
co x

0i
0
nL
r3 6
z
"' 0
03300JU

)
a-
LJ
OD1cc)

.0
M3
0,
zo
S0
C-0 oQ

Li
M
z
C)n
z C;
C) I
LI 1
0
r'i
(NJ
N II
o

D
n
eCj
7-:Lfo *
00 fl00r\I4
zU
0L
LOJ

en
NLJ
0 ocIII
0co
N *0
f- _
x I 'U
U,.
NLU
CL
fN-

0
co
r
0
a;j
0Z
0
I0
COU-o

C.'
I os.
- z)0
iC'
'I 2L- tJ

trajectories are clearly within the region of reflectivity greater than 33 dBZe and havebegun to descend. After this time, the region of high reflectivity rapidly descends and thedowndraft accelerates until it impinges upon the surface between 2210 and 2212, creatingthe microburst.
Figure 16 shows a set of 20 trajectories that are all initiated on a regular 0.75 x 0.75 kmgrid centered on the microburst at 2212. This figure shows that no parcel originated froma height above 6.25 km (4.65 km AGL); none of the origins were above the minimum Oelevel.
To examine this further, trajectories progressing forward with time are initiated withinthe general area that reverse trajectories indicate 2212 surface parcels originate at. How-ever, these air parcels were initiated at heights above 7.2 km (5.6 km AGL). The trajectoriesbegan at 2148. Of the 32 parcel locations chosen for this analysis, only a few descendeda significant distance. All parcels showed significant displacement to the south and eastand most ascended to near echo top. In general, it is likely that no air parcels originatingabove the minimum 0, level descended to the surface during this microburst. Yet, it isquite clear that the hydrometeors did come from above 7.2 km. The region responsible formost of the cooling and downdraft acceleration is the broad area of low 0, located between5 and 7 km MSL (3.4 and 5.4 km AGL).
Figure 17 presents a simplified, schematic evolution of this microburst prior to itsarrival at the surface. This figure depicts hydrometeor trajectories, not air parcel trajec-tories. Hydrometeors form and are carried upward in several strong convective updraftsthat exist in a region where environmental winds are generally light due to effects of pre-existing convection. As air parcels reach the equilibrium level, hydrometeors continue togrow until they become too heavy to be supported by the updrafts and begin slowly falling.However, the strong convective updrafts reach a level of strong northwesterly winds aloft.These winds then carry the hydrometeor plume east, but more importantly, south of thepreexisting convective area. Thus, as they descend these hydrometeors reach a level oflow 0, air that does not exist within the environment contaminated by convection. Asany liquid water evaporates and the frozen hydrometeors sublimate, air containing thembecomes very negatively buoyant and begins to accelerate rapidly downward, ultimatelyreaching the surface as a microburst.
V. Concluding Remarks
On 11 July 1988, atmospheric conditions were conducive to initiation and maintenanceof deep convection. The temperature lapse rate was nearly dry adiabatic to 5.2 km (4.6km AGL). Warm, moist air aloft advected into the area from the west throughout the dayand winds near the surface were generally easterly, which may have provided extra liftingat the edge of the mountains to aid in storm development. In the sounding analysis, threefeatures were evident which contributed significantly to the development of the intensemcroburst: a region of strong westerly winds with a maximum at 6.8-7.2 km (5.2-5.6 kmAGL), a sharp minimum in 8e at 7.2 km (5.6 km AGL) with a secondary minimum near

69-SZ-0l CUMn boI -3LJ U o
. .
o
oo
o U t~
0 -%d
Iq X
OD V-
0) C-0(WM)1

94.V
72 UC.; 0 a MI
0I ' m0Z~ ~ c : -I
1:2 La c a2 cm oS.w
0.08
ui- 2
r) *.~
0 .
10 FA4~0
.51.
31 v
00
4% 4
00

5 km (3.4 km AGL), and a high amount of mid-level (around 5-7.2 kin, 3.4-5.6 km AGL)moisture.
The parent storm was initiated over the mountains and then moved east-southeast.Updrafts within this complex carried hydrometeors well aloft into a region of strong north-westerlies. Slightly west-northwest of the airport a new cell developed that also containedstrong updrafts lifting precipitation particles, presumably graupel, high into the stormcomplex. These new hydrometeors were carried to the southeast as they reached the levelof strong northwesterly winds and merged with similar material from earlier convection tothe northwest. As they moved away from the main storm updraft, they fell through fairlymoist air, which retarded their sublimation rate. Near 7.2 km (5.6 km AGL), they reacheda drier layer containing strong westerly winds whele they began sublimating rapidly cre-ating a region of cool air which began to accelerate downward.
Two descending reflectivity cores were created in this manner. One was carried fartherto the east and eventually descended to the surface ahead of low-level outflow producedby the main storm cell. Since it descended onto a relatively undisturbed boundary layer,this outflow became quite intense, and created the strong microburst on 26A. The secondcore descended into a boundary layer heavily modified by storm outflow, which resultedboth in spreading it in a northwest-southeasterly elongation and diminishing its intensity.This was the larger and weaker microburst core south and west of the airport.
These microbursts lasted less than a half hour; outflow from the subsequent line ofcells lasted over an hour. The microbursts clearly originated from a core aloft whose devel-opment is observed in the dual-Doppler radar analyses. Furthermore, the main microburstclearly originated when a reflectivity core exited a region that had been heavily modifiedby pre-existing convection and entered a region retaining a region of low 0e air at mid levelsas described in the sounding analyses above. Because temperatures were below freezingin this region, the phase changes that occurred were sublimation and evaporation of su-percooled liquid water. Sublimation will more effectively cool air than evaporation alone.This sublimation appears to have created a very cold pool of air aloft much denser thanits environment, possibly explaining the rapid onset and unusual strength of this event.
This report describes the microburst development almost 25 minutes prior to its mostintense period over Stapleton International Airport and nearly 20 min before there wasany evidence of it at the surface. Core C appears after about 7 to 10 min of sustained 7-10I s-1 updraft in a region roughly between cores A and B. The forcing required to initiatethe parent updraft could have come from a convergence line that existed over the airportfor some time prior to this. It is not yet clear whether or not this updraft is surface-basedor whether it originated well above the surface aided by some forcing mechanism aloft.Further work is continuing on the the origins of this microburst.

Acknowledgements
The TDWR project. has henefited from the participation of many people. Tn particitlar,we would like to recognize contributions by Steve Campbell (Lincoln Laboratory), FredProctor (MESO, Inc.), Roland Bowles (NASA) and Rod Wingrove (NASA). Bob Irelandof United Airlines provided a thorough analysis of flight recorder data. Cleon Biter, asOperations Director for the 1988 TDWR OT&E, and John McCarthy, as the Directorof the RAP, contributed a great deal toward the success of the program. Dr. BorislavaStankov of NOAA provided the weather maps and profiler data. The help of PatriceKucera and Terry Trieu in radar data analysis is also acknowledged.
This work was is funded by NCAR, the National Science Foundation, and the FAA(through Interagency Agreement DTFAO1-82-Y-10513).
References
R. Bowles, and R. Targ, 1988: Windshear detection and avoidance: Airborne systemsperspective. 1 6 th Congress of the International Council of the Aeronautical Sciences,Jerusalem, Israel.
Corbet, J. and C. Burghart, 1988: A User's Manual for Robot. NCAR Field ObservingFacility internal publication, 52 pp. (available from NCAR/FOF, P.O. Box 3000, Boulder,CO 80307
Cornman, L.B., P.C. Kucera, M.R. Hjelmfelt and K.L. Elmore, 1989: Short time-scale fluc-tuations in microburst outflows as observed by Doppler radar and anemometers. Preprinti,24' Conference on Radar Meteorology, Tallahassee, Fla., 27-31 March 1989, Amer. Me-teor. Soc. , Boston, Mass., pp 150-153.
Cornman, L.B. and F.W. Wilson, 1989: Microburst detection from mesonet data. Preprinta,Third International Conference on the Aviation Weather System, January 30-February 3,Anaheim, Calif., Amer. Meteor. Soc., Boston, Mass., 35-40.
Cressman, G.P., 1959: An operational objective analysis system. Mon. Wea. Rev., 87,367-374.
Elmore, K.E., and W. R. Sand, 1989: A cursory study of F-factor applied to Doppler radar.Preprints, Third International Conference on the Aviation Weather System, January 30-February 3, Anaheim, Calif., Amer. Meteor. Soc., Boston, Mass., 130-134.
Fawbush, E.J. and R.C. Miller, 1954: A basis for forecasting peak wind gusts in non-frontal
thunderstorms. Bull. Amer. Meteor. Soc., 35, 13-19.
Ireland, B., 1989: Flight Safety Incident Investigation 88-46. United Airlines Report.
Lauritson, D, Z. Malekmadani, C. Moreland, R. McBeth, 1987: The Cross Chain LoranAtmospheric Sounding System (CLASS). Extended abstracts, Sixth Symposium Meteor.Obs. and Instruments., New Orleans, Amer. Meteor. Soc., Boston, Mass., 340-343.
Mohr, C.G., L.J. Miller, R.L. Vaughan and H.W. Frank, 1986: Merger of mesoscale datasets into a common Cartesian format for efficient and systematic analyses. J. Atmos. andOceanic Tech., 3, 143-161.

Proctor, F.H., 1989: A relationship between peak temperature drop and velocity differen-tial in a microburst. Preprints. Third International Conference on the Aviation WeatherSystem, January 30-February 3, Anaheim, Calif., Amer. Meteor. Soc., 5-8.
Shuman, F. G., 1955: A method of designing finite-different smoothing operators to meetspecification. Joint Numerical Weather Prediction Unit Tech. Memo.,no. 7.
Stephens, J.J. and A.L. Polan, 1971: Spectral modification by objective analysis. Mon. -Wea. Rev., 99, 374-378.
Stephens, J.J. and J.M. Stitt, 1970: Optimum influence radii for interpolation with themethod of successive corrections. Mon. Wea. Rev., 98, 680-687.
Wilson, F.W., Jr. and J. A. Flueck, 1986: A study of the methodology of low-altitude windshear detection with special emphasis on the Low Level Wind Shear concept. Report No.DOT/FAA/PM-86/4. U.S. Dept. of Transportation, Federal Aviation Administration,Washington, D.C.
Wolfson, M. M., J.T. DiStefano and B. E. Forman, 1987: The FLOWS (FAA-Lincoln Lab-oratory Operational Weather Studies) automatic weather station network in operation.Project Report ATC-134, MIT Lincoln Laboratory, Report NO. DOT/FAA/PM-85-27.U.S. Dept. of Transportation Federal Aviation Administration, Washington, D.C.

Figure Captions
FWWTRF 1. Locations of radars anti sulrface mesonet stations during the 1988 TDWR OT,&Eat Stapleton International Airport, Denver, Colorado. The airport runways arealso shown.
FIGURE 2. Response functions for Harming 5 pass and Liese 2 step filters used in dual-Doppler analyses techniques. The filtering function is plotted against the lengthscaled as number of data grid points.
FIGURE 3A-C. NWS upper level data plotted for 1200 UTC, 11 July 1988. a) 500 mb, b)700 mb and c) 850 mb. Solid lines are constant geopotential height; dashed linesare constant temperature.
FIGURE 4A-C. As in Fig. 3 but for 0000 UTC, 12 July 1988.
FIGURE 5. Data from the NOAA 6 channel microwave radiometer from 1100 UTC 11 July1988 through 1100 UTC 12 July 1988. Time runs from right to left. Potentialtemperature (0) and total water vapor mixing ratio (q) are shown from thesurface to nearly 12 km MSL.
FIGURE 6. CLASS sounding from 1100 MDT (1700 UTC) 11 July 1988. Data are plottedon a skew-T diagram. Temperature and dewpoint are shown. Wind barbs onthe right point in the direction the wind is blowing toward. Altitude in km MSLis shown on the right.
FIGURE 7. Equivalent potential temperature (0e) plotted against height from the 1700 and2004 UTC CLASS soundings.
FIGURE 8. As in Fig. 6 but for 1404 MDT (2004 UTC) 11 July 1988.
FIGURE 9. Events plotted against time for the 11 July 1988 microburst. A scale for windshear difference in knots is indicated on the left. Data sources are indicated.
FIGURE 1OA-G. Three-dimensional reflectivity perspective views of the microburst-produc-ing storm of 11 July 1988. The viewer is looking toward the northeast and islocated at 40 km west and 78 km south of FL2 and is 19.2 km MSL. The 33dBZe contour at discrete analysis levels (explained in the text) is contoured.
Analyses for 2148, 2150, 2152, 2155, 2158, 2200, and 2202 UTC during stormdevelopment, are shown.
FIGURE 11A-D. As in Fig. 10 but for 2205, 2207, 2210 and 2212 UTC during the microburstalarm period.
FIGURE 12A-C. As in Fig. 10 but for 2215, 2217 and 2220 UTC during storm dissipation.
FIGURE 13. Air parcel trajectories obtained from dual-Doppler analysis. The trajectoriesare shown in three dimensions with projections on a horizontal plane indicated.
Each tick mark along a trajectory ribbon indicates 30 s of travel.
FIGURE 14A-C. As in Fig. 13 but projections on the [z, y, z) surfaces are shown. Trajectoryprojections are shown on a) all three surfaces, b) the y - z surface, c) the z - zsurface and d) the z - y surface.

FIGURE 15A-K. Air parcel trajectory segments projected onto three-dimensional reflectivityperspective views for air parcels within the microburst at 2212. Each segment.traces an air parcel for a 2.5 min period centered on the analysis time indicated.
FIGURE 16. A set of 20 trajectories all initiated a 400 m AGL on a rectangular 4 x 5 gridwith 0.75 x 0.75 km spacing. All trajectories are initiated at 2212 and proceedbackwards in time. Time is along the horizontal axis while height is along thevertical axis.
FIGURE 17. A schematic diagram depicting the evolution of particle trajectories responsiblefor the 11 July microburst. The sounding to the left indicates 0e with heightnear the time of the microburst. Three-dimensional wind structure aloft maybe deduced by the wind vectors on the left-hand side of the figure immediatelyleft of the Oe sounding.

Appendix A: Geographical Situation Display (GSD)
These diagrams are printed directly from the display screen at the TDWRverifier's station and are the displays sent to the airport control tower.These cover the time period pertinent to the intense microbursts.
The runways are shown as elongated rectangles; when darkened theyindicate an alarmed state. Approaches to each runway, marked in 1 nmdivisions, are also shown and are highlighted when alarmed. Gust frontsare indicated by long curving lines, wind shear alerts by open ellipses andmicrobursts by darkened ellipses. The numerical values enclosed by thealarms indicate the maximum expected airspeed loss in kt. Precipitation isshown by shaded areas which correspond to the six Weather Service radarintensity levels. Range rings are in am.
The correct date and time are given by PDATE and MTIME near thebottom right of each display. The GSD microbursts are updated everyminute; the gust fronts are updated every 5 m-n and the last update timeis indicated by GTIME.
A-I

uca an
avatme a tlinu
mmn ima Airportsa raterstates
PDA!3: 07/11/06IuII: 21:34:01
Otxau 21:34:00
- LW
W= am
gas mr=u xj
ou m0gan: Su
-- ~ LuY47
WDI $71fl/e
WZ: 21:41:04Oln:s 2:44:02
&L0: DO
A- 2

SCAR GSD
a Vottag G a~t
PRWIVITAfl0N UMVP.
WIND SHIMl
/ 0*1: 09/03/93!UUZ: 18:23:13F0*11 07/11/33If?!IZ: 21:36:33
Onaa: 21!34.:01
NO~: tP
- .LABA: DO
- rInt o
SCAR C=0
NM..
wrn. ringsO AIrpe3too Intwltad
WZND wzum:
/ 9*1: 09/09/99
10*11: 07/11/33
/ V~fl:21:3102/ UPIS:21:34: 01
A-3

-*CAR GCM
WAI~ty
PUj~tpITAyZO. F4
(EDD (El
/ DAME o/@/OsTIM: Is: 27:30oFDATZ- 07/11/s.#
WffMam: 22:01:00
or~: up
LLUWg*00g
o arta a clime
WrAIingsU
o Intmtabo
t PE=TTmATZw LzVUA
/ / DA21: 0/09/Sg
LLMR#r 07/9/8
WZH: 22:01 s
A- 4

HCAM GSD
-PAN=
09 MS
0 vitao a ftime
gram ringsGWAirportr
v33C1PTAfOP Lzvf
M) o 93 (0)
DAMi 09/09/90
l/ x 10:29:2-. / poA~z: 07/11/10
/ Iyta: 22:02:17
No@~: upS99
0!: uppg1Cp: UP
ai D0uma in
- tnteSraen
DAM 89,9,4
TM. 1# N.-/on 7/19
/2940
tWA$: OW
..............~
A-5UY

ma otm
q'm rings
Whltepat
p3=cMmom LzvzU.
WIND SHIFT7:
V ATS: 09/09/89!1MR: 10:21:40pornZ: 07/1/98/ INS!l 22:04:01OTIM: 22:04:01
or~: uP- LLUAS: orU
- &A, O
NcMl am
S3M"
-~ .-rte a~!. rL!!
WAH imo ~rptas fl.0a zam.
71220 Lztu
oIN :u~STT
DV: "//3
A-nw 6711

u'M icings
a lntogtotes
DA222 *8/A/SIIU: T3:2:33"AT3: 07/11/60
01 Mr=: 22:04:01/ SrI.: 2:04:01
/ r. or- t~I: up
S.-..-DO
- ftt9s)
WCA1t -
-Overton 6 glum
/a ig
-5.Z~ft
a Iuterrtatoo
WIlD NUIY:
Il7m: 10:34r12
/ :A :
01: ViW
A- 7

NNA
a v~mtea a timewrn ringsIWAzpacta Iuteestaten
PUNG=FlTAZON LgVmA
WIND SNIr?:
DAM: 09/09/99
SUN: 19:39:02IPDATE: 07//SNIIUz: 22:06:01
WINS. 22:04.-01
SAW
- flta fa
3018030ut
3103tot
'Um
@MU/M E=RD WGJ
ar wg
,efl1 LLZWI.DO
A-8

\ N C) MAP
o Vtaa a f1maswAM rings
a Zfltaffuat...
FlUCIPITAIow Llvina
TZz:i - 17 2
I / WPOMI 07/11/10)ffZ=: 22:09:0@@ffM: 22: 09: 0
me! up
or:p or
-0 SA MR a
I,92 - - , .
va://947t2 18i1:S
OA~tR 07/1/mw MInqu
U'MNwx 2t!
ao Zmuwmt
pgwwmvZ up W~L -M3mwit rnm*
A--9

UOCAR am0
a-P
-~O M- M (D
a vlao f i x) 'Airports0 Zntmetate.
WMIFTAT 00 LNVUlA
/ DATx: "/09/84
PDATE: 07/11/IS
- / @fl): 22:09:00
/ r. or- PUECZp: O08
L1J55: "D I
a--- a
RAP
- ~1MR
a---- uc a 3
0mauwa ae
Wong 07M/10
--~~~ -------
A-10 1:0:0

- "CAR 99
(K CD M
11/ %OT 07/11/38at
- ~ FTT( I JZL
DcA22 090/2
3hN0z:i;4:3
I*kt 0/1I
30322 1:
M5: 2.O
-or
* ~~ml~rtM O uia
a/ bcm a1 1314
WINDB "DOG
Apxn 11114

-- - NCAR aW
or=aw.t. a fix".
FIPITAIow Lzvng
WmN NIVT:
DATE: 09/09/00TIM: 19:42:15POA2Z: 07/11/66
- N271111: 22:13:02
92Mm: 21:09.-00
LLW: orE
OCR m a D
'-S(9 0
PU PT-O S UANA
-nM 22!14!00
A- 12GD

- SUAPOK
Ir n in s i
0 201t.~tt.
waucvzTmmoU LzVuLu
Tim: 1644:12
DWnw: 22:1601CrI~MS 22-14:00
ula am
RFAI=
Mar-5--
D~m 40099
VIM 22.If:uso(1M 2214 0m uimO 8~
ump~
Mms* MOIR9/6
A-' 13

"CAR 030
Uww
a Interstatom
3 vmB~ZcTflwOu L3V=..
/ INS: to:43: 56- / 1DmT: SiA/li/S
- / IMuM: 22:18:02- / @!II: 22:14: 00
- 1DWI: W
- uc : DOM
WC c
o Vkwtmae S lor Amings
omozuztzoo LZVU.3
WIM PM
DM3: 09/09/96- / famt 16:44:44
/ S~: @1/11/SI
*/ ?I: 22:14: 00
- r or
A- 14

RCMR GMV
RAPOC
UrS 3CiZz3
( P iZpAION U VL
19N. I!48:21
/ FOATZ: 07/I1/S
Me orw
- CM- top
Tam". nf
XCART*10 i,3M ~
* ~'- I .'/ D~* ORAP= U
/~ ( Mo! 7/lU
WONU
A-iSse

"CAR CSO
NW
*r:.~ ~ - a rta a fixesWANN rings
tPEZCIPrTATIoWI LZ 7!LS
WIND UNIM?
/ DAT: 09/09/38
UDAT: 07/11/8S
Urr=: 22:2:9:O"NI: 22!183
U U-- uor: UP
LLNA: 0016
*CAR CMO
Mn ( D 0
A -0 ataca fixes
(. WNZIPZTAZON LVML
WIND NEXT
DAT: 09/09/88
TIMR: 18:9oo0FOAMZ 07/11/98
O)22:13-59
LLWS: DOWe
A- 16

ua a o xa
0 lato £ tate
3 ,3P=IltruIOU LZ'JWLa
U. / / DM3: 09/09/s*I IF I 0M3: 07/11/48MWin 22:22: 38
MUM 21: 3
WZI: or
WCAM WMD
I-4
(m I
Iz "/"/Is
ar. or
A-17

"CAR anO
RAPGE
-- - - CREEN
0 vartaa fixes3
G Airports
P1WIPTATZON LZVZ?.U
WIND UWifl:r
/ DATZ: 09/09/SCTIMn: 16:33:24
/* UDATZ: 07/11/CSWTIM: 22:23T3
OTIM: 22:23:59
LL"A : DOW~
- --- *'-y CAR amD
.5- '55*
5- Va"e c5
N""
(Th.. 09/09/99Eli) ! UApor
Glw up~
PAWhU?: 222p 0
LLNRU' OWi
lrit sw511n~
A- 18

*CAN anD
is wrAlrpartm0 In~ttAte.
P93=7PITATON LZVU.8
m to "-n
DAMZ 09/08f
TIME: 10:94:10iDA?!: @7/11/SO
O@1116 22:21:5
WU: or
w DaD
------------ 0- R4. (D, DUD
1~ - ~ PI\ w W 0im
Istuwtate,
pau1r1~mn0w LZYw*
vimD WIFT?
W@ime 22:24:97
tt
A- 1()

HM0 Vac j a 3t
atets te
Pw=72=r znw~
/DATZ: 09/09/90
/ S: 22:2
XCAm am
M/C
41
/SN
gram AluI
vmr2mas im.w
su: 1*i57130
WE: 22:26:5So
A- 20

-uCAll am
drm rilgUeSWAllportoa istrutotou
VITF1AIN LCVVL
5M: 09/09/08Tim: 13:33:234FOA22: 07/11/36WIIU: 22:23:56OEM6: 22:24M1
lUP: ?: P
pom: LW
WW
a Vanua a an
drama:
VMS 37/U/11SO
NM: 22:10: 02
:22:28:8
A- 21

- -__ ____$CAR am
0 Vg%" a Cim
gram clog-daazpow"
Data 0909/8
02=: 22:26:58
Mi: oru
- SCAR a
Am"
gzatcmua.
DOM: 09/0S/64
A-=, 2231S

Oclkmm
U-Wx-
or m sag
u*k IctInt~mt te
NC-WTT
-- I' \ EW 9/88Tis 19014
roz:07119
w rm 22! 2::22:26:t
Il In~gtipa
MIS1
I DM3:s a6/D/s~
TIMf: Wtos
1os~?: 07119
- Li..aB: Dam
O-!112!s
'U soror or
m~v!oL-' -. DO
O/vl Irn e
A-23 -

0 vaot* a gfts.
GrAirports
/* 2TW ~: Lo20:51:0
berm: 22:31:19
LLMl sl
cm M
0 vataa a rim".GwAft rings
0 intdctatme
Ml FMP2P22MaU LXUU.
TM: 121:06:09
PDA!Z 07/11/SO
LLa8 DOWE
A- 24

wc am W
a Vaa a 21m
rArptto
a zmtwrnzo zain
IPDM: 07i3Se
%2=: 22:24:S7
L8:DOWU
o ODm a) I)
a war&= 6 tl.
plmm rm@eseWoW, wi 044(a
A-25

ReA=-
20~ p~rtS o Lama
POA!Z 07/21/S1
Of= 22:33:09
ISC: 1wUNmS: Wu
0 o~tAs a fm
d!: 1Swg
0 Ist0at 62
A-: 26-09*I

aUm anM0
an Gi*a ED
um D!: 09/09/95TMU: 19:15:09pplaZ: 7/11/SMm: 22:40: 2
______ 3C OM
/i a
/3
- ww
um: somn
IM-L1178

CAM 030s
.,-TAZG &"=A
OM: 09/0900
TM: :@1U./S4
Ac=: 22:42:34Mn : 22;J:38:S
~an
/DO a
E!!flWl
A-: 28I.-2

N~ me mam
RAN
0 Vortoo a Ism
0 wa rin
- PDoM 07/11/80WM=: 22:45:00
-. or
I&OW: DOW
Lnm ame
- 30,RAM=
MIL
o inetn
L am: 07/11/S
OE: 22-41:28
* -~ or'up
A-29

- lANI
'mezmmowummew
TWO: 20:20:51
VOWZ: 071//6
NOm: Ow
N.. ,..' Zama: mWE
yena am
a-M
X/O
O0.as a Unsea- r~
WIm va
N2m: 22.: ST8
NO
A- 30

Inn am
.7 .M
o etf
Ira t"@ L
0 amerntAtm
I= mman:
Dm: 09/99198%= 0:ssI:3VW: @7/11/60
or: 22:8:17
VM= WWAM: OM
A- 31

Appendix B: TDWR Alphanumeric Alarms
Alphanumeric alarms from the TDWR algorithm are listed; all alarms for11 July 1988 are included.
For the TDWR alarms, the date and time at the top of the first columnare indicate when these were re-analyzed in playback mode. The date andtime at the top of the second column are the real date and the microburstalarm update time, from the third column, the real date and the gust frontalarm update time (only every 5 min).
The TDWR data are interpreted as:
WSA 35RA 200 8 10K+ RWY: Wind shear alert, runway 350 rightapproach, threshold winds from 200 * at 8 kt, expect airspeed gain of 10kt on the runway
MBA 35LA 230 6 35k- 3MF: Microburst alert, runway 350 left approach,threshold winds from 230 0 at 6 kt, expect airspeed loss of 35 kt on 3 milefinal
B-1

TDWR AI.AIIMS fr 3.-AUG-9A, hrmir 1511wapc-t:3lI-Al11;-R8 15:311:47 rob-t: NO)NE ge-l:: 1ONK
35HA 2114) 9 351,A 2110 9 GA I.U 7
3!;RI1 210U 8 35L1 190 5 So 200 6
17L.A 211 8 17RA 190 5 26A 20U 617LD 211 9 17R1) 200 9 260 Lao 7
1 IwapR :il-AIG-80 15:44:1 mhl: J-JIII- 21:35:02 gft: I-JU.-R 21:34:1111
WSA 351A 2013 8 Ink- RWY SLA 200 7 SA 200 S
WSA 3SHf 210 8 10k' RWY WSA 3SLO 220 6 ink, JMO So 1911 7
WSA 171A 210 8 10k- 2MF WSA I7HA 220 6 IOk- 3MF 26A 190 7
NSA 17LD 2UU 8 1Ok' HWY O 17RD 200 7 260 200 5
Ilwamt:30-AUG-88 15:49:26 ab-t:IL-JUL-88 21:40:03 gf t:1L-JUL-89 21:38:%9
35MA 200 7 3SLA 200 7 8A 201) 4
15"t 200 9 35LO 200 7 Al) 220 4
17 A 200 9 J7HA 200 7 . 26A 2211 4
17LD 200 7 17RD 200 7 26., 200 4
IJwa. _:30-AUG-R8 15:55:34 mh_t:1-JIlL-88 21:45204 gft:IJ-JUL-AS 21:44:112
NSA IHA 200 6 10k" HWY NSA 35LA 190 6 1Ok' HNW 8A 190 S
NSA .SHD 2110 6 10k' RNY : NSA 351.D 190 7 10k- RWY R0 1901 6
WSA 17LA 200 6 Ink- IMF WSA 17HA 190 7 I(k- 2MF 26A 190 6
NSA 171,0200 U 1Ok- RNY NSA 17RD 190 6 10k' HWY 260 190 S
TONk ALARMS for 30-AUG-98, hour J6Jlwas t.30-AUG-B8 16:01:32 mb-t:11-JU,-88 21:50:04 gf_t:)I-JU.-R8 21:49:00
35RA 200 7 * 35.% 200 5 SA 160 S35ND 190 3 35LD 200 5 a Un J90 6L7L.A 190 3 17RA 200 5 26A 190 C,
173.D 200 7 . 17340 200 5 260 160 5
Ilwas 11.'0-AIIUG-S 16:08.33 mb-t:11-JUL-S8 21:56:59 qft:tt-JUL-BU 21:54:11134RA 21)1 7 : 3SA 220 7 wSA $A J80 5 25k- ZMF35R0 190 4 35LD0 200 5 ,0 200 5176A 190 4 : JRA 201 5 26A 200 S
1760 200 7 O7RD 220 7 NSA 260 190 S 25k- tHU
liwas t:30-AUG-S8 16:10:57 mb-t:1-JUL-8 21:59:00 f-t:'l-JOI.-ma 21:54:0135RA 1t0 4 : 35t1A 220 6 UA 180 335140 1911 5 JSLU 2(10 5 n oD 200 6171A 190 S 170A 200 5 26A 200 6173.0 10 4 17ND 220 6 26D J80 3
11was t:30-AUG-°8 16:13:04 mh-t:11-JUL-8S 22:0t:00 qft:tLt-1UL-S 2105t900
354A 2110 5 WSA 3.LA L90 6 25k- .mr NSA RA 170 4 25k- 2mF1534j 2t0 a 35Lfr JAO 1 sfo 200 S171,A 21" R 17RA 140! 3 26A 200 517LU 2911 5 NSA 17RD L1 6 25k- 2D WNA 261) 170 4 25k- ImU
1I waw 1: Ill-AlIG-II 16:J4:11 mh t: I J.IIlL-UUR 22: 01:!%* gf lt:J t-JUlI-OR 21: 59t11UIiA 220 6 WSA ISLA 200 4 2Sk- 3MF @A 170 1
PtAD 2t1n 5 314.a) J90 6 AR 220 6L7LA 2110 5 17RA 190 6 26A 220 617L. 220 6 NSA 17RD 200 4 25k- 2MD 260 170 3
Ilwam t:30-AUG-88 16:15:0U mh-t:t-JUL-U 22:102:57 qf .tI-JUL-68 21:35900JiHA 190 5 WSA 351.A 170 3 25k- 3MF NSA NA 180 4 25k- 211F
35R0 200 4 3LD 170 S Il) 200 5171.A 2001 4 17RA 171) 5 26A 200 5171,0 190 5 WSA 7RD 171) 3 2%k- 2NI) NA 26.) 180 4 25k- IND
B-2

Ilwas t:30-AUU-RO 16:16:08 ob --L:L-im.I,-N 22:04;01 9f t:lJ-JUI.-RR 2.IN:BIIIflNSA 3SRA 190 6 25k- 3MF WSA 351.A 210 5 25k- 3mlr WVA NA 160 4 25k- 2347r
3514D 210 5 35L.0 l110 4 WSA 0ND 2211 6 25k- RWYt71.A 210 5 17MA I80 4 WSA 26A 220 6 2ik- HWY
WSA 17L.0 190 6 25k- 3MB.) WSA 17RD 21t) 5 25k- 1MG WSA 260 180 4 25k- HWY
llwag-t:30-AUG-88 16:17U09 mfbLt:11-JUL-SS 22:05:04 qf 1:t1-JU(L-SO 2t:59-0(0NBA 35HA OD 7 25k- 3MF NSA 35LA 210 4 25k- 334? WSA RA 190 4 25k- uIWY
3514D 210 6 351.0 210 5 WSA SU 200 5 2Sk- HWY17LA 210 6 t7B4A 210 5 NSA 26A 200 5 215k- mwv
WSA It7U 160 7 25k- 2MD NSA 1714U 210 4 25k- IMB) NSA 260 190 4 25k- HWY
Ilwas t3:3n-AIIG-89 16:17:29 mbLLI-JI.-BB 22:05:04 5 gtlf -,Bi.-1 22:114:111456 30A4 170 7 25k- 3MF WSA 3SI.A 2011 6 25k- 3MF NSA NA 1531 5 25k- H(WY
3S3W 203) 8 NSA 351.0 210 5 10k- HWY WSA 93) 200 5 25k- HWY17f.A 200 8 WSA 1714A 210 5 t0k. HWY NSA 26A 200 5 25k- HWY
WRA 171.0 )70 7 25k- 2MD NSA 37HV3 200 b 25k- JND WSA 2b3) 180 5 25k- HWoy
liwas It:30-AUG-88 16:18:23 ffbt:L-JUf,-SS 22:06:01 C qfL:11-JUtL-4S 22:04:111tlIBA 35HA (.80 3 35k- 3IM? MBA JISLA 200 6 35k- 334? MOA RA 170 5 15k- 1HWY
359U 20U1 8 WSA 351.0 200 5 10k. H4WY MOA S0 190 3 35k- HWYITIA 201 8 NSA 17RA 200 5 10k. RWY 1 MHA 26A J90 3 35~k- IMF
MbA 173. 0 S 5 35k- 2MV3 MbA 1793) 200 6 35k- 1340 3434 26f 170 5 35k- HWY
liwa. t:30-A00-88 16:L9%31 mbt:11-JUL,-8R 22:06:58 :F 91 t:JJ-JUJL-SB 22:04:01jNS8A 35RA 190 5 35k- 3M? MBA 351.A 220 5 35k- 3Mr MOA 8A 150 4 35k- IMF7
35140 200 6 NSA 35WO 200 4 10k. HWY NH14 SD 200 7 35k- HWY17LA6 200 6 NSA 1714A 200 4 t0k. HWY 3414 26A 200 7 35k- LMF
MVA 17LD 190 5 35k- 21ND 18A 17R0 220 5 35k- I340 NSA 260 150 4 35k- HWY
Ilwas t:311-AUG-SB 16i:20:39 tbt:1-J)1.-SB 22:08:03 1 gttI-JU.-88 22:04:01MH34 35R180is 5 35k- 3M? MPA 3SLA 230 6 35k- 234? P 114A @A 150 3 J31- 3343
35140 210 4 NSA 351.0 210 6 t0k. ANY MBJA 8) 220 7 S50k- HWY17LA 210 4 WSA 1714A 210 6 10k. HWY NBA 26A 220 7 10k- 234?
MSA 173.0 180 5 35k- 2MG NUA 1730 230 6 35k- IMND NSA 261) 150 3 35k- HWY
Iwas t:30-AUG-SB 16:21:53 mbIt:L1-J01.-RB 22:09:0 rll-oU.B 22:114:01MbA 35146 2U)1 7 35k- 3IM? 314A 351.A 230 5 35k- 234? HKA @A (:dIU 3sk- 3MV
35140 ealm KRA 351.0 J 011 3 l~k- HWY MIlA 89) 200 5 60k- HWY171.A 180 3 NSA 17MA 200 4 10k. HWY 3414 26A 200 5 (60k- .1MB
MbA 17L.3 210 8 35k- 2ND MBA O7RD1 230 4 35k- 1340 M14A 260 Calm 35k- HWY
l1was - :30-AUG-88 16:23:08 ob-ti11-JUL-88 22:10:03 qf_t:I(-J0..-A8 22:104:1NSA 35WA 210 5 1014. 3mr NSA 3SLA 200 4 10k. 3M? I MI4A SA 200 4 50k- 3311
35140 140 3 USA 351.0 210 7 10k. HWY NSIA 50 2011 7 Salt- HWY171.6 190 3 NSA 1796 210 7 10k. HWY NUA 26A 200 7 50lk- 3341
NSA 173. 210 5 10k. 1IN0 W BA 17140 200 4 LOk* HWY NSA 260 200 4 S~lk- HWY
llwam ft:3fI-AUG-@S 16:23:28 mbt:11-J30b-SB 22:20:03 qf t:11-Jlt.-88 22:00:00NSA 3514A 210 5 20k. 334? NSA 35tA 200 4 20k. 334? MA 111 200 5S 5k- 334,
35140 190 8 35WO 220 6 MbNA S0 200 6 50k- HWY171,A 190 S 17RA 220 6 *MHA 26A 200 6 50k- 334?
WSA 173.0 210 5 20k. 2340 WSA 1714D 200 4 20k. 14D NRA 260 200 5 50k- HWY
1iwom e.:3B-AUG-SB t124:09 ob-ft:1.1-JUL--SS 22:11:00 If-t:11-JU1L-NS 2210:0034A34 imA 213) 3 35kc- 3IM? NSA 351.6 200 5 35k- 234? PIMA BIA 190 4 Ii0k- 3347
35143: 1911 7 NBA 351.0 230 5 35k- H4WY N"A RD 200 5 70k- Hwy371.6 190 7 1 MBA 1714A 230 5 3Sk- HWY I MM4A 26A 200 5 70k- 3341'
NHA 171.0 210 3 35k- 1IN0 NBA 17140 200 5 33k- HWY MMNS 263) 190 4 I5k- HWY
Ilwassftt34-AUG-88 16s25:23 mb1:.J1-JIL,-0 22:11158 pf:i-.133.-MS 221B000NA 35146 200 7 45k- 310? NNA 351.6 200 6 45k- 234? NNA BIA 160 4 45k- IMBV
3514u 194 6 MBA 351.0 220 5 45k- HWY NSA SD 200 S 70k- HWY
171tA 19n 6 NS0A 1714A 220 5 45k- HWY NIBA 26A 200 5 79k- IMFMIIA 373.0 2001 7 45k- 140 MB8A 17RD 200 6 45k- HWY MNRA 26L, J An 4 &Sk- 4WY
lwau :30-AUG-SB 16:26:18 ob-t:11-JUL-S8 22:12:36 9ftt:L-.IUL-@S 22:99!00"HA 3514A 21U 5 35k- 334? "@A 35I.A 18o S 35k- 234? 34A4 BM 380 5 35kt- 3m?
15"41) calm NSA 351.3 220 7 3%k- HWY NSAA NB) 200 S 711k- HWY171.A calm MPA 17HA 220 7 3514- HWY MB'A 266 200 S 711k- IMB'
3434 17.3 210 5 3Sk- 1340 NSA 17143 180 5 35k- HWY 3414 263) 180 1 15k- HWY
B- 3

Ilwq .': 30-AluU-88 L6:27: -1t ml. t: I I-J.L.-88 22: J4 : 00 gfLI-I L-633.-8 22 - o9:UNBA 3561A 1903 6 45k- 3MF MBA 35LA 160 3 45k- 3MF NSA SA 170 3 45k- IMF
35HO0210 5 351.0 220 5 NRA 8D 210 5 70k- eHwyliLA 210 5 17HA 220 5 NSA 26A 2t0 5 70k- IMF
MbA 17LD 190 6 45k- IMD MBA 17R0 160 3 45k- IND NSA 260 170 3 45k- MWY
llwas-t:00-AUO-SS 16:29:40 mb_t?11-JUL-IS 22:15:02 gf-t:11-JUL,-SS 22:09:00MA 3SIIA 190 6 45k- 3sF NBA 35r.A 170 3 45k- 2N? NSA @A 170 3 45k- 3M?
35RD0 200 7 351.0 200 6 NSA SU 230 5 45k- HWYVI3A 200 7 17MA 200 6 MNSA 26A 230 3 43k- 3MP
NSA 17LD 190 6 45k- 150 MBA 17140 170 3 45k- 1533 NBA 260 170 3 43k- HWY
llwao-t:30-AUG-86 16t29:00 mb-t:11-JUL-88 22:15102 9ftt:l1-JOL,-8f 22-14:00NSA 35HA IS0 5 45k- 3M? NSA 35LA Calm 45k- 2m? NBA BA 170 3 45k- 3mvNSA 3514D 210 6 20k. HWY NSA 351.0 190 6 20k- HWY NRA 8D 220 4 45k- HWYNSA 171..A 210 6 20k- HWY NSA 17HA L90 6 20k- HWY NSA 26A 220 4 45k- 3M?MBA 17L10S 5 45k- IND KEA 17HU Calm 45k- IN0 NSA 260 170 3 45k- HWV
l1wan t:30-AUG-88 16s29:42 mb1t:L1-JUL-88 22:16:01 qf 1:t1-JU1L-SB 221t4.00KRA 39RA 190 S 45k- 3MF MBA ISLA 190 5 45k- 3MF M14A BA 170 5 45k- 3N?NSA 35331 230 7 20k+ HWY NSA 35WU 160 3 20k. HWY NSA 53) 210 5 45k- HWMYWSA 17LA 230 7 20k. RWY NSA 17RA 180 3 20k. HWY M14A 26A 210 S 45k- 3M3VNSA 1714) 190 5 45k- 2ND NBA 17140 190 5 45k- IND, NSA 260 170 5 45k- HWY
Ilwas t:30-AUG-OS 1600!45 *bttli-JUL-88 22:16:56 gft1-UIi.-Bs 22:14:00NBA 3SRA 190 7 50k- 3M? NSA 35LA 240 5 50k- 35? NSA BA 170 5 50k- HWYNSA 35340 240 3 20k- HWY NSA 35WO 1830 4 20k. HWY NSA SD 220 5 50k- HWYWSA 17LA 240 3 20k- RWY NSA 1714A 160 4 20k- RWY t NSA 26A 220 5S 5k- IMFNSJA 171.0 190 7 50k- 21,1 NSA 17RD0 240 5 50k- IND NSA 260 170 5 50k- HWY
Ilwau t:30-AUG-33 16:31:52 b15-tl-JJL-SS 22ttR:02 9f~:1.-J0L-SS8 22:14:013NSA 3KHA Calm 45k- 3s , NBA 3SLA 230 3 '5k- 33MV elA IA 160 4 45k- 35?NSA. 3540 200 7 20k+ HWY NSA 35LW 220 6 45k- HWY NSA 60 210 3 45k- HWYNSA 17f.A 200 7 20k. HWY NSMA 17MA 220 6 45k- HWY NHA 26A 210 3 45k- 353.'NSA 1761.1 Calm 45k- IND NSA 17140 230 3 45k- HWY NSA 260 160 4 45k- HWY
11WAR 1:3-~i;N 6:33:00 .3, t: IjI-.331.-NN 22: 1 i: 59 gf-fI1-.,oe.-RR 22:14:111)M14A 3g34A tqlj 5 45k- 3NF NSA 151.A 230 S 45lk- .1MV NSA RA 1701 4 45k- 10,10NSA 3SHU 1913 6 203k- HWY ","A 35131 21310 5 231k. HWY NHA 81) IOU 1 4%k- HWylISA 17LA 1933 6 20k- RNY WSA 17HA 2133 5 201k- HWY NNA 26A IRV R3 4%k- IMF'MHA 171.1 1930 5 45k- 2pND NSA 17140 2.10 5 45k- JND NSA 26U J70 4 45k- HWY
Ilwasv 1:333-AU)G-8S 16:33:54 *b-t:1I-JUL-SB 22:20:333 gft: 11-01b16-88 22 1,4: fillMSA ARHA 190 4 40k- 33.1 NBA 35I.A 210 6 403k- 31,11 NSA BA 160 5 49k- 353.WMA 15141) 1033 3 203k- HWY lISA 354.0 190 6 201k- HWY NSA RUj 1911 7 411k- HWYWSA 171.A 3N3O 3 233k. HWY WRA 17RA 10 6 21)k. HWY M14A 26A 193) 7 433k- 3)WMHA L1313 193) 4 403k- 2ND AMA 17140 21.11 6 40k- IF") NSA 260 160 5 40k- HWY
liwap t:1N1-AIG-RO 16:35:02 m.3, t.: II-Jll--@@ 22:20:59 9fL:J-.tji.-SS 22:133:59AMA 1914A 1q33 5 45k- 3M? NSA 354.A 200 5 45k- 3M? NSA NA 150 5 45k- 3MrNSA 35143) 210 6 20k- HWY NSA 35r4) 230 5 20k. HWY NSA 50 200 6 45k- HWYWHA 171.A 2133 6 203k. HWY NSA 17R3A 2331 5 20k. HWY NS1A 26A 200 6 45kt- 3M?M33A 179.0, P133 5 45k- 2ND NSA 17RU 2330 5 45k- INO NSlA 2611 150 5 45k- HWY
liwsmq U33-AlIG-SR l136:30o "_t, L I-JJL-81 22:2l:57 gCt-tI13-,3. 22:11$9VINA IF33A 1 011 5 20k- JM? NSA 351.A 2233 3 211k- 3Nr NSA RA ISO 5 Silk- 3MfW14A 15i33) 3733 4 211k- HWY NSA 35ho3 220) 4 20k- HWY NS4A "0 170 1 50k- HWYWHA 171.A I3I33 4 20k. HWY NSA 17RA 220 4 201r- HWY 1414K 16A 370 .1 ,.Ol- 3MI,WSA (1,11 1933 5 20k. HWY. NSA 17H3, 220 3 20k. HWY NSA 260) t53 5 S0k- Oft(
tlwax 3.:33-AU3I-98 J6:36:44 so3, t:l-JUL-AN 22:21:57 ?VS 9? t: 11-.U1.-NNl 22-10159%4.1A 514A 190 6; 203k- 3M? NSA 35LA~ 230 5 211k- 2mr NSA NA 160 3 Silk- 3N:'NSA 11143, 33313 5 211k- HWY NSA 351.0 210 4 21fk* HWY N"A 8D )SO 4 Silk- UNYIMIA 17f.A 1803 5 203k. HWY NSA t7HA 210 4 203k- HWY NSA 26A 1330 4 Silk- IM3F
NSA 171.0 1933 6 20k- HWY NSRA 17140 230 5 20k. HWY NA 260 160 5 Silk- lIWY
I IwA* I 3: 31-A3fI-Ri 16: 3A 1:3 mib.:1Il-.1.-88 22:23:59 9? t: I -Jut-a 22:10:59P10A 3533A 2133 4 431k- 3M? 0111A 3SLA 220 5 403k- 2N? N"A $A 1330 3 40k- .353.NSA 1550 210 7 40k- HWY N4SA 351,D Calm 40k- HWY NSA 60 200 4 40k- HWYMHA t7f.A 20U3 7 40k- HWY NRA 17MA C'alm 40k- HWY NSA 26A 200 4 40k- 3N3'PU0A 171,0 2133 4 40k- HWY MMA 17140 220 S 433k- MWY NSA 2h0 1S0 3 40k- HWY
B-3

ilwas t:.3(-AtIG-RR 16:39-26 mh-t:I J-JT.1-R 2 2 -25:112 qfl:: 1-ll-l 22:18 -59MHA 15HA 210 4 35k- 3117 MBA 3SL.A 220 5 35k- 3MV1 MHIA RA (70 .1 Aik- 310I7WSA 3540 210 6 20k- HWY NSA 351,0 Calm M4k HWY M14A 00 160 5 35k- HWYUSA L71.A 210 6 20k+ HWY WSA 17MA Calm 20k- HWY M64A 26A 180 S 35k- INVMUA 17L.0 210 4 35k- 1110 NBA 17HU 220 5 35k- 1110 M04A 2610 170 3 35k- HWY
tIwax t:30-AUG-SO 16:4ll28l mb-t:11-JU.-88 22:26:00 qft:1tI-JU1.-R8 22:21:59MHA 33RA 210 3 35k- 3117 WSA 351.A 210 4 20k- 2117 MHA RA LBO 3 35k- INVrWSA 350 220 6 20k- HWY WSA 35.13 170 3 20k- HWY MIJA RD 210 6 31k- HWYWMA 171.A 220 6 20k- HWY WSA IiHAN t7l1 I 201k- HWY MIIA 26A 210 6 35k- 3111'M11A 17U4) 210 3 35k- 1110 NSA 174U 210 4 20k- HWY "HA 260 180 .I 35k- HW%
Ilwau t:311-AUG-NO 16:41:21 *kb-t1-JUI.-SO 22:26:1111 gfL:J1-JUL-RNt 22t23:59MSA ANHA 220 3 35k- 3117 NSA ISL.A 210 3 20k. 2117 MHA NA calm 35k- IMFNSA 33HU 230 4 20k- HWY WSA 35LO 200 4 20k. HWY MbA 0)) 220 6 35k- HWYNSA 17LA 230 4 20k. HWY lISA 1714A 200 4 20k. IMF MHA 26A 220 6 15k- 1111imt 1710 220 3 35k- 1110 lSA 1741, 210 3 2ok- HWY M14A 260 calm 35~k- 14WY
liwas t:30-AUG-SO 16:41:48 mb-t:11-JULj-6O 22:26:57 qftull.rjO1-RO 22:2.1:59NUA 3SHA 200 4 35k- 3"17 lSA ISL.A Calm 25k- 311? MIA RA Calm 35k- 3111lISA 35HO 230 3 20k. RWY lISA 351,) Calmn 20k- HWY NBA go 210 5 35k- HWYWSA 17L.A 230 3 20k- HWY "$A 171A Calm 20k. 1111 t MHA 26A 210 5 35k- 3111NBA 171.0 200 4 35k- 2110 NSA 17ND Calm 25k- 2110 MdA 260 calm 35k- HWY
llwax t:39-AUG-OO 16:42:22 ubt:i1-JUL-88 22:26:57 gftt:11-.IUL.-NO 22:23:59KRA AtA 190 6 35k- 3M? lISA 35LA 210 5 25k- 3117 MBA SA Calm 35k- IMF7WSA 3%wu calm 20k- HWY WSA 351,n calm 20k- HWY MHA 8t) 210 7 35k- HWYWSA 171,A Calm 20k. IMP NSA t7HA Calm 20k- 111F MHA 26A 210 7 35k- IMF7MMA 171,11 190 6 35k- 2110 lSA 17R0 210 5 25k- 2190 MBA 260 Calmn 35k- HWY
tlwas t:30-AUG-88 16:42:43 mb ttt1-JU.-68 22:211:02 gf 1:11-JUL,-ON 22:2.1:59MHA 35H 19 5- 3117 WSA 35LA IRO 3 25k- 3111 M14 NA (*aim 35k- 3111WSA 35mu vat, 20k. HWY NISA 351.0 220 3 201k- HWY NBA 81) 200 6 15k- HWYNSA 171A Calm 20k- IMF WSA 17RA 220 3 20k. IMP MBA 26A 200 6 35k- 31NSA 17WO 190 4 35k- 1110 NSA 17ND ILB0 3 25k- 2110 MBA 266o Calm 35k- HWY
MBA 3504A 190 5 35k- .1MF WSA 351A 21111 5 25k- .31F MH4A BA 1711 3 35k- 3117WIA 3%41) Calm 20k- HWY WSA 351.0 230 5 2(1k. HWY M14A RD 220 7 35k- HWYMBA IU1A Calmn 20k. IMF NSA 1.7HA 2301 5 20k. 2117 MM 26A 2211 7 35k- IMFMBA 1710) 190 5 35k- 1110 WSA 1740 21)0 5 25k- 2110 MHA 260 1711 3 '.5k- HWPY
lvwas t:30-AUG-88 16:43:50 mb-1:11-JIJL-88 22:28:56 gf_1:11-JUL,-8O 22:23:59WSA 33HA 200 5 20k- IMF WSA 35LA 200 4 20k- 3M? MRA BA 160 S 30k- 3F17WSA 35ND Cam 20k. HWY NSA 35WA Cailm 20k. HWY MBA 61) 230 7 30k- HWYWSA 17EA Calm 20k. IMP N SA 17R4A Calm 20k- 2117 MBA 26A 230 7 30k- IMFwsA 17WO 200 5 20k- 3110 USA 17HO 200 4 20k- 2110 NSMA 261) 100 S 30k- HW"Y
llwax t1t30-AOG-88 16s44:37 .b t:lI-JUL-6O 220:02 gf:i.U-S22:23:59wvA 3SNA Calm 25k- 311? WBNA-35LA 180 3 25k- 3117F MHA NA 200 4 310k- 3117W8A 35iW0 189 S 20k. RUT NISA 35WO 220 6 20k- HWY I MHA 80 230 6 30k- HWYNSA t7L.A 180 5 20k. 11M? USA 17MA 220 6 20k- 2Mr MoA 26A 230 6 30k- .INVNBA 171.0 Calm 25k- 3110 1 SA 17R0 180 3 25k- 2ND0 MHA 2611 200 4 30k- HWY
Ilwas t:30-AUG-8S 16:45:04 ml tlL-JUI.-R6 22:31:-02 9t:1-5l-R22:20:50WSA 3514A 190 5 25k- 3117 NSA ISLA 220 6 25k- 3M? MHA BA 190 4 30k- 3111'
3540 L90 6 1 351.0 220 6 MBA 00 230 6o 10k- HWYMiA 190 6 17MA 2201 6 1 IHA 26A 230 6 .Ink- 3111
WSA 171.0 L90 5 25k- 3IN0 WSA 1740 220 6 25k- 2110 MIIA 260u 190 4 30k- HWY
Ilwas tt30-AUU-48 16:45:39 mb1-I1-O22:30:02 91 1:11-.IUL-88 22:26:56iNBA 350A 150 3 25k- 3117 WSA ISL.A 210 5 25k- 3117 MBA RA 1A0 4 30k- 311FWSA 3540 190 7 15k. HWY WSA 35t.0 230 6 15k. HWY MHA On 230 6 30k- HWYNSA 17LA 190 7 15k. HWY lISA LiSA 230 6 15k. HWY M14A 26A 230 6 30k- IMF7NSA 171.0 180 3 25k- 3110 z WSA 17HO 210 5 25k- 2110 MBA 260 160 4 30k- HWMY
IIwaa 1:3O-AUG0-SO 16:45:59 mb-t:11-JUL-6 22:30:58 9f_ 1-JUG-NO 22:20:5lISA I5HA 180 4 25k- 311F USA 351.A 210 S 25k- 3117 MHA MA 100 S 30k- HWYNSA 351w 200 6 15k. HWY WSMA 35U.) 230 4 15k. HWY 11MA 0I) 230 0; I0k- 1(WY"SA 171.A 2010 6 15k- HWY- WSA 17HA 230 4 15k. HWY MHA 26A 230 6 Ink- 311v
NSA 171.1) LBO 4 23k- 3MI0 W SA 1740 210 5 25k- 2"o? MHA 261) 180 S l0k- HWY
B- 4

Ilwa t:30-AUG-SN 16146t40 ml, L:ji-jUL,-SNl 22:30:58 sgtL I-IW. 22128:50NSA 350A 210 7 25k- 3M? WSA-35(A 230 7 25k- IMV MSA SA LBO 3 30k- HWYNSA 35HUJ 200 5 15k. HWY VISA 35LO Calm 15k. HWY MHA 0I) 230 6 30k- HWYNSA t7t.A 200 5 15k. HWY NSA 17RA Calm t5k. IMF MNA 26A 230 6 30k- IMFWSA 17111 210 7 25k- 3110 WSA LINO 2301 7 25k- 2ND "MA 260 J80 3 30k- HWY
llivejt:30-AUG-8jS16147:07 ub tilt-JUL,-SO 22:3t:57 qfltt.-jUl.-NS 22:28:58NSA .HA 2 10 4 5k- 3Mr WSA 351A 230 5 25k- 3MF WSA $A 1N0 3 25k- giWYNSA 33mv 190 4 t5k. HWY NSA 351.0 Calm t5k. HWY NBA No 230 5 25k- HWYWSA 17LA J90 4 15k- HWY WSA 17MA Calm 15k- LMr NSA 26A 230 5 29k- 31NSA 17LO1 210 4 25k- 3Mb NSA JIRO 230 5 25k- 2MhI NSA 260 180 3 25k- HWY
llwas t:3fl-AUGOR 16:47t40 mb_1:ill-JUG-SO 22:31:57 gftt:lI-.IUL-SN 22:26:58NSA ARHA Cal.m 25k- 3M? NSA 351A 240 5 25k- 3m? NSA NA 150 3.25k- HWYWSA 35RD 190 5 15k. HWY NSA 351.0 Calm J5k- HWY WHA nD 23o 3 25k- HWYNSA L71A 190 5 15k. tMF NSA LIMA Calm t5k. IMF NSA 26A 230 3 25k- IMFNSA 17UL0 Calm 25k- 3"D NSA ilou 240 5 25k- 2NID WSA 260 JSO 3 25k- HWY
llwaa-t:30-AUG-00 16:48:35 ab t:tl-JJ1-8S 22:31157 qf till-JUl,-SO 22:28:58NSA 35RA 190 6 25k- 3m? NSA 35LA 240 4 25k- 3MF NSA NA 170 5 25k- HWYNSA 35e.0 190 3 15k. HWY NSA 3510 190 3 15k- HWY NSA so) 270 3 25k- HWYWRA 171.A 19o 3 15k. IMF NSA L7IA 190 .3 15k. 2MV WSA 26A 270 3 25k- 3MrNSA 17w.1 1J0 6 25k- 3MD NSA JIRO 240 4 25k- 2MU NSA 260) 170 S 25k- HWY
Ilwa-t:01-AUG-BN 16:51:10 mb t-J1-10L-SS 2231:57 qgttji-sU.-flS 22:2@:58NSA 35HA Calm 25k- 3M? NSA 3SLA 230 5 25k- 3M? NSA NA 190 3 2Sk- HWY
3MU4 170 5 351.D realm kWSA 8o 230 4 25k- HWYM71A L10 5 ORHA Calm USA 26A 230 4 25k- AM?
NSA ?i7U Calmi 25k- 3ND NSA LIND 230 5 25k- 2"D NSA 260 J90 3 25k- HWY
B-s

Appendix C: Low Level Windshear Alarm System (LLWAS) Alarms
Alarms from the LLWAS at Stapleton are listed; all alarms for 11 July1988 are included.
These are coded in the same manner as for the TDWR alphanumericalarm messages.
C-1

LLVAS ALARMS for 11-JUL-SI. hour 1111-JUL-Il 21:21:01
3S3A ISLA S A3130 3SLO IsoIlLA 1734, i6k17LO 1730 3620
11-JUL-IS 21:23:17USA JSRA Ilk- 2KV VIA ISLA lek- in? & AVIA 30R 10k- IV? USVA 3ILD lk- NVT solUSA 17LA 10k- OV! USVA 17RA 10k- RUT IR26VIA 17LO Lek- RUT USVA 1710 10k- Ivy 260
11-JUL-IS 21:23:44352A I SlLA $ A3130 35SLO so017LA B 171.A 34A617LD 1710O B 26
LLWAS ALAINS for 11-JUL-lI. hour 22I1-JUL-I8 22:04:41VSA SRA lk- 2KV USVA )SLk lfk- IMF $ aVIA 3130 10k- IV? 9 VA SILO 10k- RVT solVIA 17LA 10k- NUT 9 s VIA slI ilk- IMP 36A1VIA 17LD 10k- OUT VIA 1730 I**- RV!T 240
11-JUL-I0 22:05;22VIA lSlA 10k- XX? 9 VA ILA 10k- INF 6 AVIA $Sao 10k- RV! 9 VA 35LD Ilk- 3M? 9soVIA 17LA 10k- BV? 9 SA 1735 1#k- RUT 26AVIA 17LO 10k- IV? USVA 1730 10k- RV!T 260
11-JUL-SI 22:01:16VIA 313k 10k- 2KF USVA SSLA iok- 1KV $ AVIA 3130 10k- IV! B VA 35Lb 10k- RUT solWIA 17LA 10k- BVT B VI 172A Lok- RUT USVA 26A l0k- RUTUIA 17L0 10k- XV1 B VA 1730 1#k- IV? B IA 260 Ilk- RUT
11-JUL-IS 22:06:02UIA JSRA 10k- 2KF I VA ISLk lk- IMF 9 VA IA 10k- IMFVIA 3130 10k- BVT I VA 35LO ISE- RUT USVA lb 10k- RUTVIA 17LA Lek- BUT USVA 173k 1#k-lW 111 VIA 26A lk- RUTVIA 17LO 10k- BUT asVI 1730 Ilk-lW 9U VIA 26b, ilk- IMR
11-JUL-IS 22:06:23UIA 313k 10k- 2KV W VA ISLk 1k- IM? $ AVIA 3130 105- BUT 9 VA SLO lk- RUT so5UIA 17LA 10k- BUT B VA 173A Ilk- RUT USVA 26k is&- mVVSA 17LD Ilk- BUT asVI 1733 lk- wV? USVA 260 Ilk- RUT
11-JUL-41 :206:j43ISRA I SILO & A3330 SSLo Illt7LA 171A USVA ISA 10k- SET17LO 1730D USVA 260 10k- "V!
11-JUL-S !Z:04:543SRA SLk. ORI)SROD SILD sol17LA I 173LA I 1617LO 178 age 36
11-JUL-SI 22:07t11VIA $SEA 10k- IMF 9 VA SILO lk- MR BIVIA S92D lek- RUT USVA SILl 10k- RUT 9soVIA 17LA 10k- OUT 9 SA 171k lk- IMF SSA6VIA IlLS 1RE- RU! USVI 1719 10k- MIFF 9 26
C- 2

L1-JUL-48 20:135RA ILA N SA $A 10k- OUT
3333 391.3 USA 60 l0k- RUT
17LA 17RA USA 16A 10k- 2267
111.0 1733D 263
11-JUL-06 22:06:19ISO& ISLA #A
3930 35L.3 so6171.3 172iA I&A17LD0 1733 zoo
11-JUL-66 22:08:46USA 352A L9k- 3267 pub NSA ISLA 19k- 3M? pub I SA $A 15k. 1267
3590 191.3 USA 63 19k* BUT
17LA 17RiA I SA ISA 19k. 1IMF
USA 17LD 15k- 1263 rob I SA 173D l9k- RUT pub USA 263 15k* RUT
11-JUL-58 22:08:53USA 35RA 19k- 3IMF USA ISLA 19k- 3267 I SA 6A 10k- IMF7
3SRO 35LO I SA 83 10k- RUT17LA 172iA USA ISA 10k- 2267
USA 17LD0 19k- 126D ' USA 1333 19k- RUT I SA 263 10k- RUT
11-JUL-48 22:09:00USA 359A 151- IMP pob 9 USA ISLA 19k- 3MP pub N SA $A 10k- 1267
3500 N SA 35LD 10k- IUT I SA 63 10k- NUT171.1 9 SA 17RA 10k- BUT N SA 26A 10k- 2267
NSA 171.0 Lk- IND3 pub N SA 1753 19k- BUT pub N SA 26D 16k- RUT
11-JUL-11 :::09:07USA 33.2 151- IMF7 pub N SA ISLA 13k- IMP gob N SA BA Lok- IMP
35RD 391.3 USA so 10k- RUWT171.1 172IAI USA 36A 19k- 2267
USAX IILD l5k- 1IN0 pub N SA 1733 19k- BUT pub N SA 263 19k- BUT
11-JUL-33 ::-9:13USA 3531 Llk- 2267 USA ISLA 13k- S26Y 9 SA #A Ilk- 1267
35RD 3SLD USA g3 10k- RUT1 71 9A 1711L USA 36A 10k- 2267
USA 172.D 132- 1260 N SA 1733 19k- BUT N SA 263 10k- BUT
11-JUL-IS 2:09:34USA 3901 152:- IMP 9 USA 39SLA 199- 3267 9 SA BA 10k- IMP
3930 391.3 9 SA 80 10k- BUT pub17LA I 173A 9 SA 26A 19k- 2267 pub
USA 131.0 15k- 1260D USA 1733 159- BUT I USA Ig3 19k- SUT
11-JUL-68 22:09:41USA )S3A 19k- 3267 9 SA 39SLA 19k- 3367 NSA $A 10k- IMP
3930 9 SL 39. SA 83 10k- SOT17LA 17liA 9 SA ISA 19k- 2267
USA 171.0 19k- 1260 9 SA 1733 19k- BUT 9 SA 26D 19k- OUT
11-JUL-89 " -47USA 33SA 1%k N.. SA ISLA 13k- 326F N SA @A M0- 1117
35RD 391.3 9 SA 63 10k- BUT pub17LA L IMA 9 USA IGA 19k- 2267 pub
USA 17LD0 15k- 1263 I SA 1733 19k- RUT 9 USA 263 13k- BUT
11-JUL-65 22:09:54USA 393A 10k- IMP 9 SA ISLA 10k- 3267 9 SA @A lob- 1IRV
3930 391.3 9 SA 63 ilk. mUT17LA I LISA 9 SA 36A 10k- 226
USA 171.D I**- 1263 N SA 1733, 10k- BUWT 9 USA 263 10k- BUWT
11-JUL-66 22:10:01USA 3SRA 10k- IMF USA ISLA 1$k- 3267 USA BA 10k- IMF rob
3930 391.3 N SA 53 10k- MU17LA 17RlA 9 SA 34A 16k- 1267
USA 171.3 10k- 2263 I SA 1733 109- 1263 9 SA 263 10k- BUT gub
11-JUL-8 22:10:14USA J33A 10k- 3267 9 SA ISLA Solt- 267 # A
17. LA 172A 263USA 171.0 19k- 1263 11Us, 1703 10k- RUT 9 USA 243 low- DUT
USA 3931 11k- 9267 N SA ILA Ink- 3267 $ A
356D SIL 33. 95LIL.A I 172A 36iA
USA 171.0 19k- I263D USA 1733, 1$k- BUT 9 SA 263 10k- Dom
11-JUL-68 :::10:3SUSA 3SR.; Ilk- 3267 N SA ISL.A ilk- I267 $A
3530 391.3 to6
17LA1 173A 26iA
USA 171.3 II.- 1263 USA 1733 Ilk- RUT 9 NSA 269 344- BUT
11-JUL-86 22:16t42USA 293* 10k- 1267 N SA ISLA 20k-3M I" NSA $A Ilk- OUT
3933 9 SL RD. I NA 03 39k- mU
17LA LID N7* SA IS&A 3S- 3267
USA 171.3 Lek- 1263D USA 1133 Lek- N SA Igo ISk- "UT
C- 3

USA 3SI 10k I M NSA 35LA 10k- IMP NSMA $A 35k- PVT,::30 k M 35L0 NBA so 35k- BUT17LA 17RiA RDMA 26A 3Sk- 3M?
USA 17LD 10k- awl USA 1730 10k- BUT I NSA 260 35k- ART
11-JUL-IS 22:11:02USA 35MA Lok- 3M? USA ISLA 18k- IM? I MA BA 30k- BUT
333 si 35LO I MBA 40 30k- PVT17LA 170iA NSMA 24A 3*k- 3M?
USA 17LO Loh- IMND USA 1730 10k- PVT I MA 380 3*k- PVT
11-JUL-80 22:11:09USA 3SBA Lou- 3M? USA ISLA 10k- 3M? NSMA $A 25k- PVT
3S30 35ILO I MA S3 35k- OUT17LA 17RiA RDMA 2GA 25k- 3Mr
USA 17LD 10k- IND USA 1733 10k- PUT USMA 23 35k- PUT
11-JUL-86 22:11:2335RA I SLA I USA BA 28k# SM? pub3530 ISLO I UBA 00 30k+ Owl pub17LA I liA I USA 26A 20k. 3M?111LD 1730 USA 28D 20k+ BUT pub
11-JUL-S 22:11:3035NA I SLA NSUA tA 28k. SM? pub35RD 35SLD USA ID 20k. PVTIILA 17IiA I USA 36A 20k+ 3M?17LD 1739D USA 30D 29k+ NUT pubk
11-JUL-11 :2:11:433 5 :. I SLA USA BA 2$k. OUT3 58 Ft 351.0 I USA ID 20k* PUTlI7LA 17RA I SA 26A 20k. 3MrIILa 1733 N SA 230 20k. aUT
11-JUL-11 : :11:573 5 .\ 5L USA BA 16k- 3M?3592 35SLOI USA 80 10k- PVT1 7,LA g lilA *$UA 36A 10k- 3M?17L0 1730 I USA 25D 10k- BU'T
11-JUL-8S 2:12:0435A I SLA NSMA BA 35k- 3MF360I PD 3L MDA 83 25k- PVT
17LA 1 71A N SA 36A 25k- IMF17LD 1730D MBA 260 25k- PVT
11-JUL-88 2:1:17USA 35RA 15k- 3MF USA 3SLA 15k- 3M? RDMA BA 25k- 3m?USA 3530 18k- RUT USA 3510 10k- XWT MBA 00 25k- BU"USA 17LA 10k- PVT USA 172A 10k- BVT RDMA 24A 2Sk- 3M?USA 17LD Ilk- BUT USA 1730 1Sk- BUT f MIA 380 25k- BUT
11-JUL-8S 22t12:31USA 332A 10k- 3M? USA 3SLA 10k- 3M? I MA BA 25k- 3M?USA 3530 L0k- PVT USA ISLD 10k- BUT NSMA 8o 25k- RUTUSA 17LA 10k- PUT I USA 17RA 10k- BUT RNA 26A 23k- IM?USA 17LO 10k- PVT USA 1730 10k- PVT I MA 260 23k- PUT
L1-JUL-4S 22!12:44USA ISA 10k- 3M? USA ISLA 10h- 3M? RDMA $A 21k- IM?USA 3530 Lou- BUwl USA 3SL3 16k- PVT RDNA 80 23k- PVTUSA 17LA 10k- 3W! USA 173a, 10k- PVT NSMA 26A 25k- 3MFUSA 171D 10k- awl USA L10, 10k- PUT NSMA 20 25k- 3W!
11-JUL-88 22:121USA 35RA 10k- 3M? USA ISLA 10k- 3M? USA BA 10k-BUTl
3530 I USA 3SLD 1Ok- PVT USA 88 10k- BUT17 LA NSUA 17MA 19k- PVT USA 26A 10k- SM?
USA 1710 10k- IND USA 1730 18k- BUT I SA 260 IGO- BUT
11-JUL-66 22:53:05USA ISPA 10k- 3M? USA SSLA &Ok- 2x? N BASA $253k- BUT
3160 USA 3.0 14k- PVT NSMA 863S2k- 3W?1iLA I SA 17%A Ilk- 3W? NSMA 36A 25k- IMF
USA 1710 14k- IND USA 1710 10k- BUT RNA SOB 35k- OUT
Il-JUL-i: ::t13:11USA 359.. tlk- 3M? USA ISLA 10k- 3M?4F NSA BA 251k- SW!
35R0 I SLD IRMA 80 35h- BUT17LA 178iA RDNA BOA 35k- 3M?
USA 17LO 14k- IND I UA 170 10k- MU RDMA 368 23k- MU
11-JUL-88 ::31:IUSA 3 55P. Llk- 3M? USA ISLA 10k- 3M? I SA GA 1sk- IMF gok
35e ISLO USA 80 l0k- Bt17LA I 171A I USA 26A 10k- 3M?
USA 17L0 ILl)- LSD USA 1733 10k- PuTrl USA 268 10k- BUT gob
11-JUL-IS 22:13:32USA 3SA 10k- 3M4? USA ISLA 50k- IM? USA IA 30k.* SM? psb
3130 3 5LD0 USA 6b ISO+ BUT17LA 172A VIUA 34A 3lk. ImpUSA 17L.0 10k- Ing g SA 1738 10k- BUR USA 268 10k- BUm rob
C-4

11-JUL-48 22:13:31USA Ise A 10b- IMF? USA ISLA l0k- 211? N SA #A ask. DWI
I00D SLO N SA to 2sk* awl17LA 172iA N SA 2a ask. 211?
NSA 17LO 10k- 1IN0 USA 17RD 10k- AUY USA 260 10k- RUT
11-JUL-Se 22:13:45USA 3SRA 10k- 311? I SA ISLA 10k- 21? USA $A 25k+ OUT
35RD SLD I SA So 20k. OUT17LA IliA g SA 26A 10k- 3M?
USA 17LD 10k- 1IN0D USA 1700 10k- OUT I USA 260 10k- Owl
11-JUL-IS 22!13 :92USA 35RA 15k- 3MF g SA JSLA 150- 2117 g SA $A 20k* 1IMF
35R0 SOLD USA ID 251k. Swl17LA I 172A I SA 26A 20k- SM?
USA 17LD 15k- OUY W SA 1700 10k- Owl N SA 240 20k- Owl
11-JUL-I8 22:13:09MSA 3SRA 25k- SM? RDNA ISLA 25k- 211? NSA $A 20k- 211?
3500 SOLD NSA so 20k- OUT17LA 17RA j NSA 26A 20k- 511?
NSA IlLD 25k- Owl NSA 17R0 25k- OUT NSA 240 I0k- Owl
11-JUL-8I 22:14:06NSA 33RA 25k- 311? NSA ISLA 20k- 211? ORNA #A a0k- 211?
35RD NSA SLO 20k- Owl N SA so 20k- Owl17LA I NSA 1711A 20k- Owl NSA 36A 20k- 511?
MISA 17LO Z0k- Owl NSA 1700 20k- Owl NSA 26D 25k- RUT
11-JUL-1. :::14:12USA 35RA :lk- IMF USA ISLA 20k- 2IM? VIUA $A 10*- 211?USA 307P' L~k- OUT 1 USA 35LD 150- OUT USA 80 10k- OUTUSA 17L;. 1%I- OUT I SA IINA 15k- 311? I SA 24A 20k- 211?USA 17LD 20k- OUT N SA 1720 20k- OUT USA 260 20k- Owl
11-JUL-IS :::t4:19US A 3 5 P.'I- SM? USA )SLA 20k- 211? USA &A a0k- 111F
3501 W SA SILO 10k- Owl N SA 50 10k- OwlI'LA I USA 172A 15k- Owl 9 SA 26A 10k- 2IM?
USA 17LZ !');- 1110 USA 1700 20k- Owl USA 240 13W- Owl
11-JUL-SO :::14:26USA 35RA 20k- 51MF USA ISLA 20k- 2M1? N SA $A 10k- IMF?
3000 UOA SLO 10k- Owl N SA 50 10k- OUT17LA I SA 172A 100- Okwl W SA 24A 10k- 211?
USA 17LD 20k- Owl USA 17s0 20k- Owl N SA 260 10k- Rwl
11-JUL-48 22:14:33USA LIRA 20k- 311? g UA IOLA 20k- 211? USA sA 10k- 1IMF
3500 I SA SOLO 10k- Owl 9 SA SD 10k- Owl17LA W SA 17RA 10k- 211P 9 SA 26A 10k- 311?
USA 17LO 20k- Owl USA 1730 20k- Owl NSA 240 10k- Owl
11-JUL-8S 22:14:40USA 35RA 20k- 3M? 9 SA ISLA 20k- IMF? USA $A 10k- 211?
35RD 9 SA 35LO 10k- Owl I SA 00 10k- Owl17LA W SA 1700 15k- 211? 9 SA 2EA 10k- 511?
USA 17LO 20k- OWl W SA 1700 20k- OUT I USA 2S0 15k- Owl
11-JUL-SI 22:14:47USA 35RA 20k- SMP 9 SA ISLA 20k- IMF? USA 8A 10k- 21M?USA I500 20k- Owl NSA SOLO 20k- OwlT USA so 15k- OwlUSA 17LA 20k- OUT I SA 172A 20k- 3M? USA SEA 10k- SN?USA 17LO 20k- Owl 9 SA 1700 a0k- OUT 9 USA 240 10k- Owl
11-JUL-S8 22:14:03USA 35RA 20k- 511? 9 SA ISLA 20k- IM? 9 SA $A 10k- 511?USA 3500 20k- OUT 9 USA SOLO 20k- OUT I SA s0 10k- OwlVIA 17LA 20k- OUT N SA 172A 200- 211? " SA 24A 15k- SN?USA 17L0 20k- Owl 9 SA 1700 205- OWl 9 SA 260 10k- OUT
11-JUL-IS 22:15:07USA 3ORA 25k- IM? USA lOLA6 20k- SM? USA $A 15k- 211?USA 5000 150- Owl 9 SA JSLo, 10k- Owl 9 SA 50 10k- OWlUSA liLA 15k- Owl USA 112A 10k- 311? USA SEA 15k- SN?USA 17LO 29k- Owl USA 1700 a0k- OUT 9 SA 260 10k- OUT
USA 350, 03k- 511? NSUA ISLA 10k- SN? N SA IA 15k- 2n?USA )SR0 15k- Owl USA ISLO 10k- Owl USA 80 10k- Owl pubUSA 17LA 13k- Owl USA 1711A 10k- 511? 9 SA 34A 10k- JNyUSA kILD 15k- Owl USA 1700 10k- OUWT I SA 240 10k- OUT
11-JULI-S3 :::15:21USA I!5A 121'- SM? 9 SA ISLA 10k- 511? 9 e US $A 10k- Sn?USA 3550 15.- RUT 9 USA SILO 10k- OUT I USA 50 10k- OUT pobkUSA 1ILA 15k- OUT 9 SA 170A 15k- SM? USA IEA 10k- IMP DabUSA IlLD 15k- Owl USA 1700 10lk- OURT 5 USA ago 10k- OUT
11-JUL-SI 2::20~USA 3SOA Ilk- SM? I SA ISLA 100- SN? V SA @A 10k- 211?USA 5050 10k- OUT 9 SA SILO Ilk- Owl USA 00 10k- OUTf pubUSA 17LA 10k- Ol USA, 17aA 10k- 511? USA 34A 10k- IN? pobUSA 1iLO 10k- Owl 9 UA, 1703 Ilk- OUT N SA 560 10k- OU"
C-5

11-JUL-8I 22:15:42USASA 1 5kAI:- ::? g UA 3;LA 15k- N S A1k
USA 53015k-IVY I V A 501k: IVZMUA 601k R ~I k
VS hD 5k IY UA 71 1k IV T UA 30 15- IVTYu
VSIA 1'IA 15k- 3M? pib 17A2SA I::- 211? pb I S A I::1- 21?rpuUS A 5015- VY I SA 5L 1 Wk IVY g VA ID: 10k- 210 pUS 17LD Isk- OUT I SA Il157 M S IA1k N
11-JUL-0122100
WSA .:,I 15k- 21? VA 3SLA 15k- 111? pe NIA IA 10k- ZN?
VA 350 1kSIYI VA 35LO 15k- IVT N SA ID 15k- IUTVYUSA ilLA 5k- IN? UA 17:A I;k- ZM? NSVA IGA 15t- IVYpuVSA L7LO 15k- IVY pu VA 171 15k - WTY VI UA 260 I0k- ZVI
11-JUL-01 j22:16:02US A :..A l5k- N? NSVA ISLA 15k- ZN? VIA IA 10k- 2m?USA 3501- 1V ; VI AL0 15k- IVY NSVA ID I- IVYUSA 17LA 15k- IVY j S VI 71 1sk- ZN Ir VA Za 210, k- ZN?USA 17LO 15k- RUT VSA 173D 15k- AVY USVA 300 20k- IVY
I 1-JUL-Il 3216::9VS SSA 15k 3N USA 35LA 15k- ZN? USVA IA 15k- IMFVSA ;:10 I::- I USVA 33LD 15k- IVT VIA 2D 15k- OVTUS A 17LA 15k - RUT NSVA 1lilA 13k- ZN? VA 3:A 20k- ZN?VIA 17LO15 LSk-RT USVA 171 15k- IVY N SA 2 0 20k- RVY
11-JUL-8 2216:23UA3.A I~; NS I VA ISLA 15k- ZN? VIA IA 15k- ZN?
USA 35:. L,- IVF 0 VA :SLO 15k- IUT VIA ID 15k- IVYVIA 1LA I21 IV. I VIA lAIk- IVF VIA IA 20k- ZNFWS A I LD 1k- IVVA 171 15- IVY I VA 26D 20k- PVT
11-JUL-I!! -:4WS A ; 5 A L2 I MF I VA 3SLA 15k- 3M? NSVA IA Ilk- IN?USA SRC1 L - WV I VA " LD 10k- IVY I VA ID 15k- BUT
US NS. ) RT I VA 17RA Isk- IVT I VA SEA 20k- 3M?USA 17LD Isk- 1.1 I VA 171 15k- IVY : UA 2 0 30k- IVY
VI A 3O 15 - 3Mr NS VISLA 15k- ZN? VIA IA 15k- IN?VIA 3510 10k- IVY VIA 3510 10k- IVY VSA SD 15k- IVYVUASA 1 k IVY VA 17:A I:k- IV:VATI I M?
VIA:W SIO1k IY I VA 173 15k - WVY I VA 26 15kIV
11-JUL-Il 2::44:
US ISA 15 - S I VA ISLA 15k- 2N? NSVA IA Ilk- IVYWA3:5.10 k_ VIrTNA 35LD 10k- IVY USVA I0 l~k- IVYNS 1LA I~k RWINA 172A 10k- IVY NSVA IA 15k- 3M?
VIA 17LD 15k- INT VIA 171D 15k- IVY VIA 250 13k- RUT
11-JUL-01 22:10:50VIA ]itSlA1k- 3M? SVA ISLA 15k- SM? I VA $A l~k- IVY
31L V:A a I 10- IV I VI IA :0k IVLiA W: VI0lAik V I 10k *m
NSA IiLD 15k- 1IND VSA 1710 I5k- IVY VIA 260 1lk- IVY
11-JUL-Il 22:1:57SA IS-M SISLA 15k VIA w I A lek- IVY
553A I L SIOk OU VSA 80 Ilk- lUT17LA NS 17:A I:: VI NA 2:A I:k- 3MfII 1LD 15-INI S 170 D IVI UA 2 0 Ilk- AVY
11-JUL-Il 22:17:0435IA 15 lLA IS IA ;: W
3510 11. AIL ID UIl.,L:A I ::AA ::A I:17LD 173D A 20 IW
11-JUL-86 22:17:14lSIA I 1 SLA VA IA 3k N351 D SILO I IS D5.lv17LA. 172A $ A 313k N17LO I 17 10 VI 3 36- V
VA35:A 3-3? I VA IA1k M USA IA3k N
IA 7LA 17-IY I VA171A Il- VSIVA 26A 3k- ZM? robVIA hD 13-IY I VA1733 Il- VSIVA 310 ak- %VY
VIA lS:A I3k- IM VI NA ISLA 15h- 2M? NSVA IA ask- aNpVI A 35 LI I % - IVY USVA 3ILD Ilk- IVY VIA ODII h M5 V pubVI A 17LA 1i;. IVT NSVA 17RA I0k- IVY W5 3I6SA Z5k- 3M? pobVSA 17LD 1~ IV WT VIA 17R0 10k- IVY USVA 260 33k- IVY
11-JUL-Il1 I:
VI LSI 3k 3M? VIA ISLA 10k- 2M? NSVA IA l5k. IN?IA P.! 350 0IVY WT VIA SLO lk-IVY VIA 19 351. IVY pub
USA 17LA 10h- AVY USVA 1ilA 10k- IVY VIA 36A sit* IMF pubVIA 11L0 10k- IVY NSVA 1730 Ilk- IUY NSVA 300 36k- IVY
C- 6

I1-JUL-80 22:18:46USA 335* 10k- IN? N SA ISLA 10k- 3M? USA @A 30k. RUT
)S3o MID. N SA S0 ilk. SW? gob
LILA 173A I USA 2GA 300. 3M? pub
USA 17LD 10k- 31N0 USA 1720 10k- &RD N SA 260 30k* OUT
11-JUL-88 22:18:33NSA ISA 10k- Stir USA SILA 10k- 3mr 13UA $A 30k# RUT
3330 3SLO USA Go 35k. RUT sob
LILA I 173A N SA isA 30k# ZN? rob
USA LILD 10k- 2ND N SA 1730 10k- IND USA 263 Isk- RUT
11-JUL-4S 22:19:00USA JSRA 10k- 3SN? -I SA ISLA 10k- IN? N SA $A 29k* Ru!
33RD I 311.3 USA SD 25k. SU? pub17LA I 173*A USA asA 35k+ 2M? pub
NSA 17L.3 10k- IND I SA 1730 10k- RUT USA 260 l3k. RUT
11-JUL-55 22:19-07USA SA 10k- IN? N SA ISLA 10k- 3MF N SA @A 13k- 2N?
3330 331.0 N SA 53 13k- SW! robIfLA I 173A N SA 34A 13k- IN? pub
USA 171.3 10k- IND N SA 1730 10k- Eu? USA 260 13k- wU!
11-JUL-68 22:19:14USX 3SNA 13k- 3m? N SA ISLA 15k- IM? N SA @A 30k. Eu?
JSRD 331.0 USA SD 30k# RU! pub
17LA I75 IR SA 25* 13k- 3M? pub
USA 171.0 L~k- IND I SA 1733 13k- RU? USA 263 13k- RU?
11-JUL-11 :::19!20USA 35SA !!k- 3N? N SA ISLA Isk- SR? USA $a 30k# RUT
35NO 351.0 I SA SD 30k+ aRU pub17.;. I 17RA N SA 26A 30k. iN? gob
USA I1LD Ilk- IND USA 1730 13k- SR USA 240 34k. RU!
11-JVL-13 :::19!27USA lSRA t; IMF USA ISLA 13k- SHP N SA $A 30k4 RU!
ISR 331.0 N SA 50 30k+ NU! pub17LA I 17A N SA ZSA 30k. 3M? pub
USA 171.3 L3.- IND N SA 1733 Ilk- RU! N SA 26D 13k- 21!
USA 3SR). 15k- 31N? pub I SA ISLA Ilk- 3M? pub I SA IA 13k- IN?
3333 31.3 USA S0 13k- RU! pub
17LA I 173A N SA ISA 13k- an? pub
USA 171.0 Ilk- IND pub USA 1733 13k- IVY sob us USA 26 s1k- RU!
11-JUL-88 22:19!41NSA ISM& 20k- INF pub USA ISLA a0k- IN? psb N SA OA 23k. RU!
2533o S ILO, N SA 53 25k. RU! pub1iLA 171A N SA 36A 23k. ZN? gob
USA 171.3 20k- RU! pub N SA 1730 20k- RUT rob I UA 243 25k. RUT
11-JUL-55 2213:33USA SSRA 20k- 3Mr rub I SA 33SLA 20k- 3M? pub I NSA @A 23k- 2N?
3333 331.0 NSA so ask- RU!17L& 17MA RDNA 26A M3- SNy
USA 171.3 20k- RU! pub I SA 1733 20*- RUT rob NSA 260 25k- RU!
11-351.-4S 22,20:01USA 213* 13k- INV N SA ISLA 13k- 3? NA #A 25k- aN?
332D I 131. NSA sD 2sk- NU!liLA 17IRA I NSA 36A 25k- SNP
USA 171.0 13k-Ru? UNSA 1730 15k- aU" N SA 243 23k- RU!
11-JUL-56 22:20:08NSA SA 13k- 39N' I SA SILA 13k- 3M? as N @A 5* k- any
Ma5 SIL 331 N to 5 2k- RUT17L* 1 7RA RDNA 34A 21k- INr
USA 171.0 13k- IND N SA 1730 13k- a"! NsA ago ask- RU!
11-JVL-88 2213215us& 313*6 ask- INr I SA ISLA 30k- SNay NSA $A 23k- 3N?
39R0 31.0 RDNA to 33k- RU!
17LA I 173A NSA 25* ask- IRV
USA 17L.3 20k- IND N SA 17R0 30k- SW moNS 263 ask- RU!
ONA lSAA 3k- IM? USA 33* 3b- SOW USA $A Ifk. RUT
3SRD I 31.0 USA S0 Ilk. UN Sob17LA. 173a USA 26). 301+ IMP gob
USA M17I.3 2k- RU! N SA 1730 ask- oU! N SA 240, 3k, SUR
11-JUL-OS Z::#:NSA 3sRA :k. IN? NSA ISLA Ilk- IN? RDNA $A 33k- IN?
SIND 29L Nls SA as ask- an?171.A 1 72A U SA ISA 25k- IN?
NSA 171.0 lik- RU! NA 1733 25k- aU" no& 23 23k- MR!
11-301.-6S 22:2142NSA 39RA 23k- sN? NSA ISLA 25k- IMP NSA IA 33k- 3M?
2330 I NSA SILO 23k- BUT RDSA 53 33k- Su17) R NA 173A a3k- But* 6 3k M
NSA 171.0 A9k- WAU! ma NSa 351- a" S 532k U
C- 7

11-JUL-40 22:22:04NSA )SRA 36k- IMF RDNA ISLA 30k- IN? NSA $A 30k- IMFUSA 332D 15k- awl NSA 35L.0 23k- RUTi NSA so 30k- awlUSA 17L.A 13k- RUT RA 17MA I5k- RUT RA IA 30k- IMFNBA 17L.0 30k- RUT RDNA 1730 30k- RUT NSA 260 30k- Rv,
11-JUL-SI 22:22:24NBA ]SPA 30k- 3KV NSA ISLA 30k- 3KV NSA $A 30k- IKVUSA 33RD 15k- RU! NSA 3SLD 25k- RUT RDNA SD 30k- RUTUSA 17LA 15k- BU! NBA 17RA 29k- BUT NSKA 26A 30k- 1KFRBA 17LD 30k- RUT NSA 1710 30k- RU! RDNA 260 36k- MU
11-JUL-IS 22:22:31NBA 3SNA 3Sk- 3IMF NBA ISLA 35k- 3KV NA IA )5k- 3KVUSA 33RDo 15k- RU! RDNA 35LD0 25k- RU! NoA so 35k- RUSA I7LA6 15k- RUT " NA 170A 23k- BUT NBA 26A 33k- 1KVNSA 17L.0 35k- AU! NBA 1709 35k- RUT RDNA 200 35k- MU
11-JUL-SI 22:22:44NBA 33RA 30k- IMF NSA ISLA 30k- IKV RDNA @A 30k- 2Kv,USA 3SRD 15k- BUT RDNA 351.0 25k- RUT RDNA 00 30k- RUTUSA 17LA 13k- RW! MONB 17%A 25k- RUT NBA 26A 3@k- 1KVRBA 1710 30k- RUT NDA 1730 30k- RUT RBA 26D 30k- PVT
11-JUL-55 22:22:31NSA 35SA 30k- 3KV NSA ISLA 30k- 3KV NA $A 30k- 2XrUSA 350 10k- RUT NBA 35L.0 25k- PVT NBA SD 39k- BUTUSA 17LA L~k- RUT NBA 171A 25k- RUT asNB 26A 36k- SM!NBA 11LD 30k- RUT NBA 17*0 30k- RUT NBA 260 30k- BUT
11-JUL-i I :::22:35NBA 335:. 25k- IV O NA 35LA 25k- 3KV NBA $A 25k- IKVUSA 3SR tlk- RUT RA 351.0 23k- PVT RDNA 50 25k- DIMUSA 17LA L-4- RUT NBA 172A 23k- RUT NBA ZSA IS&- OU!NBA 1710 :5k- RUT asNB 1730 25k- OUT RDNA 26D 25k- Owl
NSA 334:. :z.- 3mr NBA ISLA Z3k- 3KV NBA IA 25k- IN?USA !571: 1 - RUT USA 331.0 10k- RUT MBA ID 23k- BUFFUSA N .L7.lz- BUT I USA IIVA 10k- RUT RDNA ISA 25k- awlNBA 1710 :!k- RUT J NA 1730 29k- 3W! NBA 360 25k- RUT
NDA 23RA 30k- 3KV NBA ISL.A 34k- SI NBA IA 30k- 2KVUSA 33RD 10k- RUT RDNA 351.0 25k- OUT NBA 50 30k- BUTUSA 17L.A t0k- RU!T NRA 17WA 35k- 3UT I NBA 25A 30k- IKVNBA 17LD 30k- BUT I NSA 171R0 30k- OUT NBA 200 34k- OUT
11-JUL-I0 22:23:32NBA 3SRA 30k- IMF I NA ISLA 30k- 3KV RDNA IA 30k- 2nr
3530 NBA 351.0 23k- RUT NBA on 30k- BUTIILA NBA 17A 35k- OUT NBA 26A 30k- RM
NSA 17L.0 30k- IND NBA 1 730 30k- RUT RDNA 260 j0k- RUT!
11-JUL-SI 22:23:30NBA 33RA 25k- 3KV USNA ISLA 25k- IMF NBA $A ask- ?"T
35RD I 351.0 NBA 50 255- MU17LA 172iA NBA ISA 25k- BUT
RBA 17LD0 25k- IND NBA 1730O 25k- RUT NBA 260 25k- BUT
11-JUL-SI 22:23:43USA 3311A 15k- 3KV NSVA ISLA Ilk- 3KV I SA IA 3k. MRl
33RD I 351.0 U SA 00 35k# BlUT gob17LA I IMA USA 26A 353# =F? gab
USA 17L.013k- IND USA no0 15k- BUT I SA 260, lot# MR
11-JUL-SI 22:23:52USA 35RA 15k- 3KV VIA ISLA 15k- IMV USA $a 30k. 3OFT
3530 331.0 NSA ID 30k, RU! gob17LA 1711A USA 26A 30k+ 3KV gob
USA 171.0 13k- IND g VIA, 1730 15k- RU! NWUA 250 30k* BUT
11-JUL-I8 22:23:50USA 35RA 15k- 3NV USA ISLA 13k- 3KV USA IA. 29k# BUR
35RD I SL U5.SVA so ask. BUR Feb17LA I 171.1 USA 26A 353. 2KV pib
USA 1710 Ilk- IND USA 17RD 13k- 3W!T USA 340 25k# MU
11-JUL-:7 :::24:13UsA 3sR.A 13k- 3KV USA ISLA 13k- 3KV USA *A 25k. BUT
3)SAO 351.0 USA I0 35k. RUIT gob17LA 1 72A I USA 24A 3k. 2KV gob
USA 1710 Ilk- RUT N SA 1730 Ilk- RINT I USA ISO 29k. RUI
11-JUL-93 :!:4:110USA 35.:. IV,- -IMF USA ISLA1 10k- 3KV USVA I& Ilk* BUT
)Sao I 351. USA 00 IS&* MU gobI1L.; 1 7RA I USA 26A 30k# ZNr pib
USA 1710 L)k- IND g USA 1730 Ilk- MIW USA 23 Ilk* RM
11-JUL-23 2::24:26USA ISIA 13k- 3KV USA 3ISLA 15k- 3KV N SA a& Set* IN
33RD I 351.0 VIA 60 30k. RU! pib17LA I72A USVA 26A 30k# 3KV gob
USA 171.0 15k- RUT USA 1720 1Sk- RUT USVA t60 I0k. Not
C- 8

vs A SOR 1k- MN? U SA ISLA 20k- IMF NSA $A 25k- IN?
355 3LO ::NA 00 Ilk: lI"
I 7LA 171A. I NS ,1 2k- 3 m?
USA I 7L0 20k- RUT I SA 1730 20k- IVY NSA 10 IS.- awl
11-JUL-IS 22:24,40VWASOI ::a k- AN? VIA ISLA I3k- IM? NSA IA I3k- IN?
330ISOLO I NSA 30 Ilk- Rvi
tL1 % 17 A RDNA 26A 2:k: ZN?
USA 17L' 23k- aVl USVA 1730 25k- SKY MR&S 26D 2 k- OUT
11-JUL-1 22:24:47usA, lilA 23k- 3M? VSA ISLA 23k- 3NT NSA @A 23k- IN?
AI 3330 10k- IVY VA 35LO 10k- OUT NSA So 23k- lIW
VUASA 1 0k- IY I VA 17lA 10k- IVY IRNA :6A 23k- N
VIA% 17L. 3: IVUSVA 1730 2 5k- RUT NSA 260 23k- OUT
I11-JUL-81 22:2::53USA ik3lA 20k- 3M? VsIA L 20k- IMF ADNSA $A 23k- IMF
USA .3R I0k lI USVA 3;L0 10k- Rvi KohSA 23k- IVY
US ILA 10k- Wvi g I 71 0-IY S 1 3k N
:SA 2L 0k- IVYT I VA 102k-IVY I NA 210 2 RkUTV
11-JUL-08 22: 2::7USA lA 20 3M US VISlLA 20k- M S A2k N
isR 9 VA 3SOLD 10k- BVY 9 NSA 60 2lk- lvi
LILA VIA 172A 10k- RUT RDNA 26A 25k- iW
VSA I ILD :Ok- 1Mb VIA 1710 20k- RUT nthS 21D 23k- RUT
11-JUL-11 -:25:14 MRS 311RA 15k- 3my NSA ISLA 2Sk- 3M? R NA $A 23k- N
3-.0 NSA 35LO 25k- RUT NA IV 25 k- am?
17LA. NSA 171RA 23k- OUT NSA 26A 23k- IVl
NSA 11%0 25k- END NSA 1720 25k- IVY NSA 210 23k- lvi
11-AUL-l I- I M S3LA 33k- 3M? NSA $A 25k- 3M?
3.:I NSA 35LO 23k- IVY RDNA 00 25k- IVYRl.I NA 17IA 23k- IN? NSA 26A 23k- lil?
NSA I LD :51- 1351 NSA 1710 25k- IVY I NSA 210 23k- SV?
11-JUL-9S 22:2;:42- MkS l~A 2k 1N US VISLA 25k- 3M? RDNA $A a3k- N
VIA 10% 13k- lvI VA 35LD 13k- IVY NSA 50 25k- RVY
USA 1lILA 13k- IN? U SA 172A 133- ZN? RDNA 36)6 23k- 2M
VIA 17LO 25k- RUT USVA 171D 23k- RUT NSA 210 2sk- IVY
I11-JUL-t 22:23:4tS A 1 23k UNSIVA ISLA 25k- SMF I VA $A 13k- 2N?
VIA ]:A.. 3k I VY A USA 35LD 13k- IVY I A $0 13k- OUT Deb
VIA 17LA 13k- IT VA 17lA 13k- 3MF USA 21A 13k- 3M? gob
VIA 17LO 23k- .1VY "$ is 171 2k- IVY USA 210 13k- IVY
11-JUL-88 32:23:3VIA :::A I::- 3mr *:VA ::LA 2::: :.Nr USVA IA 23k. lvi
USA 330 1- avi VIA OLD 1I V I VSA S0 23k# WV! pob
USA 17LA 10k- IMF USA 171A 16k- IN? I USA 26A 23k. IM? pib
.SA 17 L 23- lvWIVA 171D 25k- lvi USA 210 10k- IVY
11-JUL-SO 2:25:02USA 3RA 2 k: 3M? VIA ISLA Ilk- 3MF USVA IA is** IN?
VIA 33 Ik- VY AS VISLO 13k-IVYI W SA 40 ask* IVT gob
VIA lILA. 10.- INT US VI 1A Ilk- ZN? VIA SIA 23k# IN? pab
VIA 17LD 33k- IVY 9 VA 1710 25k- SVY USVA 21D Ilk- IVY
31JL-SI 22:26:09,VIAJ 3112- FM US VISLA 23k- N? R NA IA 3k- an?
VIA lIL 13- INIlVA 7 a3- 3M? NSA SA ask- lvi
VI A 17LA 23k- I W VA 1710 23k- IVY AD NS A 2 53k- OUT
NA S7ll2-SN Its 17RDSL 33k- SN? NA Ia 35k- 2NT
USI A 30 15k - OD 5 NA 3OLO 25k- IVY NSA lb 39k- lvi
VI A 'TL Ilkk- IN? I NSA 178A 25k- 3M? U sA 36A M3- IN?
NSA 17LD 25k- al NSA 1720 23k- BUT INA 21D 30k- IVY
tI-JU1L-I: ::24
SS:A 33.' k- SMASA ISLA 23k- SN? NSA $A 30k- SN?VI 'I3 I" - lvi 9 NSA SOL0 25k- IVY NSA 8D Elk- SIT
31SA IlL. I--1: - IN? RDNA 1711A 35k- 3M? "&NA 36A Sea- IN?
NSA IP;LD 2 Sk- OUT RDNA 172D 25k- BVY NSA lob )lk- OVY
11-JUL-Il :::21!29NSA 315%, :!k- in? RDNA ISLA 23k- SN? RDNA @A ask- 23WUS A 51 L3.- OUT RDNA S3LD 33k- BVT ::NA lb ::: IVY
WSI LA I'. INF NSA lilA 23k- IMF I NA :11 3k INF
NA 3* b- N? 5 NSA ISLA 2sk- SN? NSA CL 23k- IN?
USA 17LA 10k- IN? NSA 17*1 23k- 3M? 9 NSA m1 30k- aN?
No&A M Ii 2k- SI ASNA 1750 Ink- IVY NSA 160 35k- AVY
C-9

1L-JUL-40 22:26:432SA 35iA 25k- 3Mr W USA 3SLA 2Sk- 3M? NBA $A 2Sk- 2MF
USA 35D 10k- BW' I USA 35LD 10k- OUY MBA 80 2Sk- IlVUSA 17LA 10k- 2mr I USA 17:A 10k- 2M RDA 24A 35k- 2MWWSA ILD 25- OUT $A 13D0 25k- ART ISA 26D 25k- UiY
11-JUL-48 22:27:03MBA 351A 25k- INr R MNA ISLA 2Sk- M? NBA @A 30k- 2MFWSA 35:D 10k- BUY I MBA 21LD 2Sk- OUT I NBA SD 30k- mwYWSA 3;LA 10k- 181 I MBA Il:A 25k- IMF I MBA 26A 30k- 2MWMBA 17LD 25k- RY A MBA 171D 2Sk- iVY I RBA 260 30k- OUT
11-JUL-88 22:27:10::A ;5A 25k- 3Mr MBA ISLA 25k- IMF MA $A 30k- IMFWSA 351R 1Sk- IWY MBA )5LD 25k- Ry MBA ID 3Ok- &WYUSA 1iLA 15k- IMr MBA 17lA 2Sk- ZM? MIA 35A 30k- IMFMBA 17LD 25k- IWY MBA 173D 25k- Ivy RA 26D 30k- IVY
11-JUL-8 22:27:30MBA OSBA 25k- SMr RBA 35LA 25k- 3Mr I MBA IA 30k- 21MUSA 35:D 15k- IVY MBA 35LD 25k- RUT N MBA &D 30k- OUTUSA iLA 15k- Y MBA lIlA 2Sk- Rl RBA 26A 30k- 2MWMBA 171LD 2sk- RWT BA 1710 25k- aw i MBA 34D 3Ok- Oi
11-JUL-80 22:27:44MBA 35RA 2Sk- 3M? :SA 3 A 25k- 3MR I MBA &A 30k- 2MFWSA 350 10k- BUy I MBA 35LD 25k- 1R T MNA 40 30k- OUTWSA 1 7LA 10k- IWY MB AIlNA 25k- OUY R MBA 26A 30k- 2MWMBA -kLS 25- WIV R MBA 171D 25k- OUT I NIA 26D 30k- l1i
11-JUL-! ":27:51MBA 35R ..Sk- 31?mr HA ISLA 25k- 3R NA SA 30k- 2R
3552' MBA 35LD 25k- IVT I MBA SD 30k- RiILA MBA 17RA 25k- DRY MSA 26A 30k- 2Mr
MA I'LD S k- 'D MBA 171D 25k- lR MBA 26D 30k- Oi
11-JUL-3 2 '.8:05MBA )50, I - 3Mr MBA 3SLA 2Sk- 311? MBA IA )Ok- IMF
3 5 MBA 35LD 25k- RiT N MBA lb 30k- IVYIL.MDA 271A 2sk- BUY I NA 26A 30k- 2MF
MBA I7LD :- RWY MBA 171D 25k- OUT H NIA 260 30k- Ovi
11-JUL-31 :::Z:11MBA 35R 3Ok- M? I MBA ISLA 30k- 3M? MBA BA 30k- 2MV
35RD I MBA 351D 30k- iT I MBA 00 30k- lU17LA R MBA 17.A 30k- :UT MBA ::A :0k- 2MW
MRA 17lD 30k- RWT I MiA 171D 30k- lWY MBA 20 30k- IVY
11-JUL-81 22:20:18MBA 351A 35k- 3Mr I MBA ISLA 35k- IMF g MBA BA 3Sk- IMF
3510 I MBA 351D 35k- IVY I MBA 80 3Sk- virL A A lA 35k- BUY I MBA 26A 35k- 2M?
MBA 17LD 3Sk- 11 A MA 1 35k- MBA 26D 3Sk- OVT
11-JUL-08 22:20:25MBA 351A 35k- 3M? I MDA ISLA 35k- 3MY NSA IA 3Sk- 2MFWSA 35RD I0k- BWY I MBA 3SLD 3Sk- OUY MBA 9D 3Sk- lviVIA ILA I0k- BUY I MBA l7iA 35k- lvi T MBA 26A 3Sk- IMFMBA 17LD 3Sk- ID I MBA 171D 35k- OUT MA 240 35k- IY
11-JUL-8 22:28:32MBA 3:RA 40k- O M MBA 35LA 40k- 3MF NBA IA 40k- 2MWUSA D510 15k- Avi I MA 351.D 40k- RT MA iD 44k- OlVIA 7LA 1:k- RWU I MBA 171A 40k- lvi I MBA ZIA 40k- 1rMBA 17L0 40k- RUT I MBA 1710 40k- iVY 9 MBA 240 40k- RI
11-JUL-80 22:21:39MBA 1::A 40k- Mr N MBA 35LA 40k- 3M? 9 MBA BA 4Ok- 2MWWSA 35115k- i I MBA 31.D 40k- NS A MBA ID 40k- BUTUSA 1.A iSk- iWY I MBA A71A 40k- iVW 7 NBA 24A 401- 2MWMBA L7D 40k- Rlv I MBA 1710 40k- lWWT MBA 2D 40k- iJ
11-JUL-81 22:28:45MBA 250A I0k- 3M? I MIA ISLA 40k- IMF " BA IA 4ok- IM?wSA 3583 ; 5k- 1: T I hBA 3LD 48k- iVr I MBA OD 40k- :WTWSA 11LA 15k- 'vi I MBA l7lA 40k- V| MBA : A 40k- 3MrMBA 7 :0k- iwA I MBA 1710 40k- l1i I MA 26D 40k- OvT
11-JUL-lI .2:24:52MBA 15. I .- SM? I MBA ISLA 45k- 3M? r MA BA 45k- IMFV A I. , 30- IVY I MBA 3S1D 45k- IVi Y MBA ID 45k- BlWSA LILA 15- i I MBA I7BA 45k- VUT MBA OIA 45k- IMWMBA 1L1 Ilk- tY I MBA 1710 45k- IU MBA 260 4Sk- lvT
11-JUL-Il '9 :0(MBA 17RA0., - IM? I MB) ISLA 45k- 3M? 9 MBA IA 45k- IMFWSA 3S0. Zlt- lvi I MBA 35LD 43k- OUT I RA ID 45k- lUTUSA 1 L, 21k- IVY I MBA 1BA 4Sk- BUT | RDA 34A 45k- 3MFMBA 171. - UY L RBA 1710 4Sk- IT N SA I4D 49k- I"
11-JUL-I, :;:20:L2MBA lSlA 40k- IM? I MBA SLA 40k- IMF MBA $A 48k- IMFVIA OS k- IVY I MBA 31LD 40k- liT | MBA ID 44k- lviWSA lLA ISkl VT I MBA :7lA 40k- I: : MBA hA 4Ok- 5MWMBA 171. 40k- BiU I RNA 171D 4Ok- UY i MA 348 4ok- Blr
C- 10

11-JUL-:6 22:29:26MBA 3SRA 3Sk- 3M? I NBA 3SLA 3Sk- 3Mr NBA $A 3$k- 2MrWSA 510 15k- It I MBA 3:0 35k- 1:: MBA ID 3k- :VrNSA 17LA 5k- WY N BA lIRA 35k- IVY I MA 26A 39k- 3MrKBA hiD 35k- RIY MBA 170 35k- IVY I IBA 260 3Sk- IVY
11-JUL-88 22:29:33MBA 35 A 3Sk- 3Mr N MSA ISLA 35k- 3M? ::A :A 39k- 23M
35RD I MBA 3SLA 35- : WY 7BA iD 3Ik- IVr17LA K BA 17RA 3'k- Wy BA I6A 31k- 3M?
NSA 17LO 35k- IND NBA 11RD 3k- .VY BA 260 35k- RlY
IL-JUL-68 22:29:40MBA 351A 30k- 3My N MBA ISLA 30k- 3Mr I MBA BA 3Ok- ZNr
3510 N MBA 1 LO 30kD s- VY MBA 60 30k- OV17LA I MBA IlRA 30k- IWY I MBA "A 30k- 3R
MBA h7LD l0k- IMD I MBA 171D 30k- lvi I MBA 260 30k- IlV
11-JUL-86 22:29:41
MOA 3SBA 3Sk- 3M? I MBA 3SLA 3Sk- 3M? I MBA BA 35k- 2HN350 N MBA ISLO 35k- RWY NBA $0 3Sk- IwYIlLA MBA lilA 35k- IVY I NBA 26A 3k- 3M?
PIA 17LO 35k- R1W I MBA 1710 35k- D VY I MBA 260 3 k- IWV
11-JUL-86 2.:30:00MBA 3SRA 3k- 3M? I NBA 3SLA 35k- 3M? I RBA IA 35k- Nr
:SA 3560 15k- AMT NBA 3;LD 3:9- IWT I MBA 60 3k- IVTWSA ILA I5k- VY I MBA lilA 3 k- VY MBA 26A 39k- 3M?NBA 17LD 3i- I Y M BA I73D 35k- IWY R BA 26D 3Sk- IVeY
13-JUL-i: ::30114MB A 35R.. i:- 3M? NSA 39LA 30k 3M? I NSA IA 30k- 2M?NSA 355 ii)- IVY I MBA 3RLD 30k- IVY I MBA 60 30k-IVYNSA lII L - IY MB A I 3k- 1 : : MB I 26A 30k- 3MFNBA IL D 301- k RWI NSA 102D 30k- IVY NBA 26D 30k- IVY
11-JUL-13 30:27MB A 3 :1 - 3M? M NBA 35LA 25k- 3]M I NSA $A 29k- 2mNwSA 351RD - RWY MBA 3;LD 25k- RWY I RBA 8D I:k- IWYwSA LL.' 13-- SVY I MBA AI BA :A 2k- 3NMBA 1 -.- RV, I MBA 1730 25k- IVY I NBA 260 2 k- MVY
11-JUL-33 :-':30:48MBA 35. 21k- 3M? I NBA ISLA 25k- 3Mr I NBA $A 25k- 3M?
3510 I NBA 3LD 39k- IWY I NBA 6D 2k- I117LA MIA 7RA 29k- IVY I MBA 26A 25k- 3M?
MBA 17LD 25k- IMD N MSA 17itD 2k- IY NSA 260 2k- AVY
11-JUL-80 22:30:;SMBA 3S6A 25k- 3 MBA 35LA 2Sk- 3M? MBA $A 30k- 2M?
3910 I NSA 3SLD 25k- IVY RDA A0 30k- IVY17LA I NSA 17IA 2:k- IVY I MBA 2k 3:0k- 3MP
MBA 17LD 2Sk- IMD I NBA 17 0 23k- IVY BA 260 30k- IVY
11-JUL-80 22:31:08
MBA 39RA 25k- 3M? NBA 3LA 25k- 3M? K BA BA 25k- 2M3RD D ; NBA 35LD 25k- Iw MBA 6D 29k- IVYITLA I N:A lilA 25k- :Y I XB 26A 29k- 3P
NBA 17LD 25k- IMD R NBA 171D 2 k- IT I MBA 26D 25k- IWY
11-JUL-8 22:31:22MBA 391A 2Sk- 3M? R NDA 3LA 25k- 3MF I NBA @A 2Sk- 2Nr
35A D I NSA 35LD 25k- IVY I N AD 80 25k- lRV
17LA I NBA 17RA 2Sk- IWY I RBA 26A 2Sk- 3M?RBA lTLD 25k- IW I +NBA 17RD 25k- IWT i RA 260 23k- IVY
11-JUL-8 22:31:29RBA 3:1A 2Sk- 3M? I NBA 3LA 25k- 3N? RBA $A 2$k- 2MF
3910 I MBA 35LD 25k- IVT MSA 0 2Sk- IWT17LA I NSA I7RA 2Sk- lVY MBA 26A 2Sk- 3R
NBA 17LO 25k- IND NDA 172D 23k- IVY I MBA 26D 25k- IVT
11-JUL-68 22:31:35
NBA 356A 25k- 3M? 9 NBA 2LA 25k- 3MY I NBA $A 2sk- IM?35D I NSA 35LD 29k- IWY NBA B0 2Sk- IVT
LILA NBA 17tA 25k- IVY I NBA 29A 25k- INr
NBA 17LO Z5k- IMD NSA 172D 25k- WY I NBA 260 2Sk- IVY
11-JUL-l' :.31:42NBA 15P . .k. i- M I NB MA )LA 25k- 3M? RDNA BA I3k- 3N?
3 55 I MBA 33LD 25k- IVY I MSA AD 23k- IVTiLA I NA 1i7A 25k- IVY I N:A ::A 3k- IVt
MBA 17LD 25k- IND I NBA 1710 25k- IY I NSA 26D 5k- IVl
11-JUL-13 ::1:96MBA 3A6:.ZS,- 3M? M RBA 3SLA 29k- 3M NIA IA III- IR
35D NIA 33LD 25k- BV | NBA AD 39k- DIt17 IL MBA IA 29k- VY I NBA 2A 35k- IR
MBA ILD :'.- 1M 9 NIA 1730 25k- AVY 1 MBA 260 k 1y
I-JUL-15 2::)2:02KBA |IRA 30k- 3M? I NBA 25LA 30k- 3M? M NIA *A 20k- 2N?
3510 9 NIA iSLO 3k- IVY : :AA i3 '6k- Ir
I'L I NSA :;'A 30k- IVY NBA ZIA 30k- IN?
MBA IlLD Ok- IMD I NSA 17D 30k- IWT N NA 26D 3k- rY
C-11

11-JUL-88 22:32:09RDA 35RA 30k- 3107 "*NA ISLA 30k- 3Imp I 1A sA 30k- ZN?
35RD I NSA 35LD 30k- RUYT NSA to 30k- 2vi17LA I NBA LIRA 30k- IVy RDNA 26A 30k- 1IMF
RDA 17LD 30k- RUT I NA 1730 30k- IUT NSA 260 30k- IVY
11-JUL-SB 22:32:23MBA 331A 30k- 3107 NSA ISLA 30k- 31mp NSA $A 30k- 210r
3310 I NA 35LO 30k- IVY N&A 0D 30k- IUY17LA I NSA LIRA 30k- IUY I NSA 26A 30k- 1107
RDA 17LD 30k- 1IN0D NSA 1720 IOU- IVY RDNA 24D 30k- IVY
11-JUL-88 22:32:36NSA 35RA 25k- 3107 NSA ISLA 25k- 310? NSA $A Z5k- 2107
3330 MDNA 35LD 25k- IVY NSA so Z5k- IVY17LA I NSA 17RA 23k- SI RDA 26A 2sk- 1IM7
NSA 17LD 25k- IVY RDNA 17R0 25k- IVY NSA 240 25k- Iv!
11-JUL-92 22:32:43MIA 35IA 25k- 3107 MINA ISLA 23k- 3107 NSA $A 25k- 1IM7
3330 RDNA 35LD 23k- RUT NSA ID 2$k- BUT17LA R NA 17RA 25k- IUY RDNA 26A 25k- 1I07
NBA 17LO 25k- IVY RDNA 1730 25k- IVy RDNA 260 25k- BUY
11-JUL-88 22:32:30USA 35RA 20k- 310p USA ISLA 20k- 310? N SA $A 25k- 1107
3330 USA 35LO 15k- IVY vs. US o0 25k- AUY17LA. N SA LIRA 13k- 110MF USA 24A 25k- 1107
NSA 17LO 25k- RVY N SA 1730 20k- BUY N SA 240 25k- IVY
VSA 3331 lik- IVY USA 35LA 15k- IVY USA BA 25k- IMF
USA I7LA. 1.- IVY N SA 17MA 15k- 1IM7 USA 24A 23k- 1IM7NSA -LD LS:- IVY I SA 17R0 15k- aUl N SA 260 25k- IVY
11-JUL-11 ::3:10VIA, 35.,, It- 3107 N SA ISLA 15k- 3107P USA $A 25k- 2107VIA S0P.1 ..- ANY USA 35LD 15k- IVY V SA 00 25k- BUYUSA 17LA 13..- IVY N SA 17lA 15k- 1107 N SA 26A 23k- 1107VIA 17L0 I'~. IVY N SA 1730 15k- aVy I SA 260 Z3k- RUT
11-JUL-83 22:33:24USA 35RA 20k- 3107 N SA ISLA 20k- 3107 USA 8A 25k- 2107USA 3550 13k- RUT USA 33L0 15k- &MY USA so 25k- IVYUSA 17LA 15k- 1107 USA 178A 15k- 2107 USA IGA 23k- 110?USA 17LD 20k- IVY N SA 1710 20k- IVY I USA 240 23k- IVY
11-JUL-08 22:3351USA 35MA 20k- 3107 N SA ISLA 20k- 3107 USA IA 20k- 2107USA 3530 15k- IVY USA 35LD 15k- RVY USA ID020k-IVYTUSA LILA 13k- 1107 N SA LIRA 13k- 2107 N SA 26A 20k- 1107USA 17LD 20k- IFT N SA 1720 20k- SI USA 260 20k- IVY
11-JUL-88 22:34:12USA 353A 20k- 310F N SA ISLA 0k- 210F USA IA 15k- 2107USA 3530 10k- IVY N SA 3SLO 10k- RVY USA 50 13k- IVYUSA 17LA 10k- 1107 N SA LIRA 10k- 2107 USA 26A 15k- 2107US& 17LO 20k- IVYT NSVA 1730 20k- *MY N SA 240 15k- IVY
11-JUL-SB 22:34:10USA 35lA 20k- 3107 I SA ISLA 20k- 2107 NSA BA 23k- 2107VSA 3530 10k- IVY N SA 35LD 10k- RVY RDNA 80 25k- IVYVIA 17LA 10k- 1107 N SA 172A 10k- 2107 NSA 24A 23k- 2107USA 17L0 20k- IVY I SA 1720 20k- RI NBA 34D 25k- IVY
11-JUL-IS 22:34:32USA 533A 20k- 3107 USA ISLA IRA- I107 RDNA $A 25k- 2107USA 3330 10k- IVY N SA JSLO 10k- IVY NSA so ask- IVYUSA 17LA 100- IMP7 N SA 17lA 10k- 2107 NA 26A 23k- 3107USA 1LL 20k- RVY USA 1730 20k- IVY RDNA 263 23k- IVY
11-JUL-IS 22:34:39USA 35RA 23k- 3107 N SA ISLA 25k- 3107 NBA IA 25k- I107VSA 3330 100- IVY N SA 35LD Ilk- RVY NSA ID 23k- BUYVSA 17LA 10k- 1IM7 N SA LIRA 10k- 2107 NA 24A Ilk- 2107USA 17L0 2Sk- IVY USA 1730 25k- VY R NA 240 23k- RVY
11-JUL-11 ::34:53VIA 33IA. 23k- 3107F USA ISLA IS&- 2107 N SA IA 15k- 2107USA 3SAC Ilk- RUY USA 3SL 10k- IVY USA IV 15k- IVYUSA LILA 14k- 1IMF USA 173A 10k- I107 USVA 26A 15k- 3107USA% 17LD 25k- IVY I USA 1730 23k- BVY USA 213 15k- WAY
11-JUL-03 :.''1:07NSA 350.' - 5107 W SA ISLA 3k- 3107 VIA BA 13k- 3107USA 3SAO 1)" IVY NSVA ISL0 10k- IVY N SA S0 13k- IVYVIA LILA LIlk- 1IM7P USA 171.A 10k- 2107 USA 16A 13k- I107VIA 17LD Z5k- BUY USA 1730 25k- BUY USVA 240 15k- IVY
USAL 35RA 23k- 3Im7p USA ISLA Ilk- I107 RDNA $A 21k- 2107WOO LO3U10- IVY VIA 3L IlLS1k- IVY RDNA is 3k- IVY
V 17 LA Lk:- 1107 VIUA 171 Ilk- 3IMP MINA 24A 25h- 3107VSA "17LD I5k- &VY USVA 1733 21k- RVY RDNA 340 350- IVY
C-I12

it-IIIL-0627333USA 3saA 2sk- 3M? USA ISLA 2 Sit- 3mr ASA 0A )0k- n
USA 3530 10k- KUT gUSA 35LO 10k- NUT RDA 003-NV
USA 11LA l0k- :UV USA 17RA low- awl NSMA 26A 30k- 3m?
USA 1710 13k- NUT IUSA 1730 2sk- NU NA26 0k V
it-JUL-$$ 234:01WSA 3SNA 25k- 3M? USA 33LA 25k- 3M? NSMA 4A 2Sk- 2"r
USA 35RD 10k- BUT USA 351 10k- NUT NSA go 23k- RUT
USA 17LA 10k- NUT 17A:iA 10k- BUT ::NA 2:X 2::- ZNr
U:A OLD0 25k- NUT gUA732k-NT IMA 260 23k U
l1-juL-NB 22:36:08 S AIk M
UA 35NA 30k- IN? USA ISLA 30k- 3M? as M soN 29k- ZN?
USA I501k V USA 3ISA 10ll- NUT RDNA 26A 35k- NUT
US iA 0 NU S itA a0k NUSMA 360 35k- NT
USA 17LD 30k- NUT USA 110 30k- NUT RA202k U
1-JUL-88 22!34:13NA $ Ik 9
USA lISA 2k- 3M? USAISLA 23k- 3M? INA NArk N
USA 35R0 10k- NUT USA aSL 0k gUoA N 25k- NV!T
UA 35RD 10*- NUT .SA 3LS 10k- RUT NSA 2k2k N
US A I Lo Ow-NV USA IN %A lk- NUT NSA 26h 23k- NMF
NSAU-N 260 2k- aw
USA 3L1as 230- N? USA ISLA 30k- 3M? RDA :A :::- ZN?
USRA 3 0-NT IUAOL k- IN NT I SA ND 30-NT
USAliL 0- NT IUSA ::A11 NT INA 26A 30k: ZNT
US 7, 2k SA A 1 R0- UT NA203k U
A -'l;L 3011 02
USA 3I. I L - 3M? US A I RD 3k 3M? I s NBA60 30k- IN?
UI- 11L_ 1.* NUT4 IRSD3101k-!NA s0 30k- NUT
US. 357L I I2- NUT I USA lSA 3 - N TI N A2k 30k- N?
USA !PC0 301- NUT USA 1730 30k- NUT NSA 260 Sak- NUrT
NSA0L77 266:40- 1
USA 3L5; ;k- M? US 7:SA IS%- SMIFNATA 0- N
USA ~ R 33W. - U SA31 3k U A 030k- NUT
USA 1.LD O'k- NT UA1730 30k- NUT NSA 260 3k U
11JL : :::36:49US SA30-I? IUSA ISLA 30k- N? RNSA :A 10,k-N
USA 030 0- U USA OSLO 10k- NUT INSA 30 30- IVY
USAliA 01 NT RDS 7*00-I? INA 36A 00*- ZN?
US5A L1. 30L NUr USA 1730 IS*- InUTA303* U
Vi SA3k- 3M? SA ORLD 3k- RU? RNA NA0 30k- ZN?
1U 3 3 1 ! NT( UA OL 13- NUDNA $A 30*- NMF
USA 31LA 5k- NUT USA 17LA 3k - 3M? RDA ItA 30k- ZN?
USA 171 0. - NUT k USA 173 30* No UT NA303k U
NS SNA2k-ZNT NSA RA1 2*- XN MA ::A :k- N
SA lLA 10k NU _ NWA 175 23- IN? A 2*300-ZN
NA I71,0 3k- UT U SA 17No 3 X- UT N IA 26 11k-N"
it-JUL-10 22:37:37
NSA isNA 3@k- 3m? I SA ISLA 70k- )M? ::MA :A 3 IMFZN
US 33 1k-NT USA OSLO 23k- NUT 9NA O 30k BT
USA I LILA1k- BUT NS 73 3k N? 9NA 26A 30k- ZN?NBA IIL 23k- NT I NS 1730 23k- NV NA36 0k U
USA IA 10-O? IUAISA3k M NSA NA0 3k- RN?
USA 333 10-NT:UA OLO 0-NU NA 130- T
US 11: 10:- NU"T USA 1730 30k- NT 9NA303k U
ll-JVL-18 22:7:30 NA)L 51 M D
N:A 3i 2k- ON? Lo N 2 315k- IN? :S A :2k-ZN?1.1
UA );L0 1k- UT 9 S2SO23-NT 9NA 603k-NU
USA %iL 1k- NT 9NA ISA 25k- IN? 9NA 6*3k-3M
NS 7, 5-NT INSA 1730 25k_ NT RNA 60 3k- NT
NS- tA s 3 2%. '%1- OI NA ISLA 25k- IN? NSA A* Ik- IN?
USA Ism0 &O- RUT ::NA SLO 25k- SV! ::NA NOA 3k- NUT
USA 17LA Ik- NUT NSA IlNA 3k- IN? 9 S 6 30 N
NA 17L,0 Z30- UT 9NSA 17RD 33*- NT 9NA302k
1-JUL-90 223:41SA ISIB:.l:- in? USA ISLA30k- M? RDNA 6* IS- MF
U:A 330 I*:- BT 9USA ISLO Ilk1- NUs NA .33-U
USA I LA 10-NT 9USA 173* ;ck- IN 9t RA 26* 3k- 3M?
USA IL 17. a0-WBT I USA 173 3k- NUT? NSA 26D 3k- NT
USA NA 35*- IN? I S SLA Zsk- IM? NA A 3:%- 3M?
UA 33 I:-NU UAOLO 1:: NUT" 9NA S 01k NUTUA IlLa 1:- BU2 S 7*1k N B 6. 30k 3M
UA 17110 2s*- NT Ua 1710 33k- SNT 9NA303k
A CSA ~- JTNS 3::

I-JUL-Il 22:31:32USA 3SA 23k- 3Mr I USA 35LA 25k- 3MF M IRA &A 23k- IN?
USA 35RD 10k- RWT I USA 33LD 10k- PUT I NRA 80 25k- PUTUSA 1ILA 1Ok- RWT U USA l7RA L0k- IM NSA 2GA 25k- IMFUSA 17LD 25k- RUT I USA 17AD 23k- RT g NSA 260 25k- RUT
t1-JUL-I8 22:36:38USA ASRA 2Sk- IMF USA 3S.A 25k- IMF NSA #A 23k- IMFUSA SIRD 10k- RUT g USA OSLD 10k- RUT RDA so 23k- RUT
USA 1ILA 10k- RUT I USA 17RA Ilk- PUT I NSA 26A 23k- 3MrUSA 17L0 25k- IWT USA 17R0 25k- PUT I NSA 260 35k- RUT
11-JUL-48 22:36:52USA 35RA 2Sk- 3MF USA ISLA 25k- AN I NSA GA 2Sk- 3MPUSA 35RD 10k- RUT U USA 33LD 10k- RUT | NSA 80 25k- RUTUSA 17LA 10k- PUT N USA 172A 10k- IM F NSA ZGA 23k- 3MFUSA 17LD 25k- RWT | USA 1710 2Sk- IT | NSA 260 Ask- RUT
11-JUL-1 22:38:59USA 3SRA 25k- 3M J WSA ISLA 25k- 3MP R SA A 25k- IMFUSA 35RD 15k- PUT I USA 35LO 15k- RUT I NSA 10 23k- IVYUSA 17LA 13k- RUT I USA 17RA 13k- 1M F RA 26A 25k- 3M?USA OLD 25k- RVT USA 17R0 2Sk- RWT I NSA 260 25k- RUT
11-JUL-Il 22:39:12USA 3SRA 20k- 3MP USA 3LA 30k- SN? I NSA $A 25k- 3M?USA 35RD Sk- RUT NSA 3$LD 1Sk- RUW T NRA S0 2Sk- RUTUSA I7LA ISk- RUT U USA 171A 1Sk- IN? 9 NSA 26A 33k- RUTUSA 1ILO :lk- IY | USA 1780 2Ok- RW * NSA 2SD Ik- Bur
11-JUL-i: :::39:26WSA 35P. :1k- 3M? N SA 3LA 20k- 3M? I NA $A 25k- 3M?USA 35p. Lk- RUT USA 3IL 13k- RUT I NSA s0 2Sk- Rn
USA 1iLA Lk- RUT I USA 17RA 15k- IN? I NSA 36A 25k- i?USA 17LD :Ok- RUT I USA 17RD 20k- IWT I NRA 260 25k- RUT
11-JUL-13 39:33WSA l5R 2k- 3my I USA ISLA 20k- IM i RA $A 2Sk- IMFUSA 35R : - PUT I UPA 39LD 15k- IT I NRA 80 2Sk- RWSA L-L. I:,- RUT U USA 172A 15k- AI RA 24A 25k- 3M?
USA 1".L :I%- RUT U USA 17RD 20k- IWT | NRA 260 2Sk- RUT
11-JUL-93 22:39:53USA 35RA :Ok- 3MP I VIA ISLA 20ok- AM P NDA iA 3Sk- am?USA 3SRD 1Sk- RUT V USA 35L0 13k- RUT 9 NSA ID $Ok- RUTUSA 1ILA 15k- RUT | USA 17RA ISk- IN F NRA 26A $0k- 3MFUSA 17L 20k- RUT 9 USA 170D 20k- RUT N NSA 26 3Sk- RUT
11-JUL-88 22:40:00USA ASRA 20k- 3M? USA ISLA 30k- AM? P NRA IA I0k- 3M?USA 3SRD 1Sk- RUT 9 USA 331. 1Sk- RWT N NSA 0 30k- RUTUSA 17LA 1Sk- IRT 9 USA 1IA 15k- IN? NSA 3SA 30k- 3M?USA 17LD 20k- RUT I USA 171D 20k- RUT i NRA 30 I3k- RUT
11-JUL-8 22:40:07USA 3RA 20k- 3M? I USA ISLA 3Sk- 3M P NRA iA 2Sk- SH?USA 35RD lSk- RUT U USA SILO lSk- RUT NSA D Sk- RUTUSA 17LA 1Sk- IVY 9 USA 1IRA 13k- IN? R NA 26A isk- INFUSA 17L0 20k- RUT 9 USA 17R0 20k- RUT 9 NRA 260 2k- IT
11-JuL-8 22:40:13USA SIRA ISk- 3M? I USA ISLA 1Sk- 3M? RNA $A 2$k- IMFUSA 35RD 1Sk- RUT 9 USA ISLD 1k- RVT NSA I0 k- MUSA 17LA ISk- IT | USA I7RA 13k- IM? NSA 2A 23k- 3M?USA 17LD 13k- RUT R NSA 171D 13k- IT RA 360 23k- IT
11-JUL-90 22:40:20USA 3SRA 20k- 3M? N USA ISLA 20k- AMP NSA iA 23k- SM?USA 35RD ISk- RVT 9 USA SIL ISk- RUT NSA #03 Sk- RUYUSA l7LA 1Sk- RUT I USA 17iA ISk- IMP 9 MIA 2SA 33k- 3MPUSA 17LD 20k- RUT | USA 171D 20k- RUT 9 NSA 260 39k- RUT
I-JUL-88 22:40:34USA 35RA 20k- IM? USA ISLA 20k- 3M? P USA IA 1Sk- ampUSA 3SRD 20k- RUT J USA 33L0 20k- RUT 9 USA Io 1Sk- RUTUSA ILA 20k- RUT N USA 17A 26k- IM VIA 34A IIk- SMPUSA 17LD 20k- IT 9 USA 1710 30k- RUT USA 360 sk- IUT
11-JUL-11 :::40:41
USA 30.. :')k- 3M? USA ISLA 29k- SM? USA IA 1k- 3M?USA )IND tik- RUT USA 3SLD ISk- RUT 9 USA lb INk- PUTUSA 17LA 13k- NUT 9 USA 17LA Isk- IN? VIA IGA 1sk- 3M?USA ILO ZOk- RVT I USA 171D 36k- RI USA IS Ask- RUT
I-JUL-13 :::11:01USA SI*R* :3*-. M? V USA ISLA 33k- 3M? USA BA Ask- 3MWUSA 35RC L3,- RUT 9 USA 35L0 1k- RIF USA I0 Ask- RUUSA 1ILA Ilk- RUT N USA 17tA 1lk- IN? USA ISA iSk- IN?USA 17LD S3k- RUT V USA 1730 33k- RUT USA 360 Isk- RUT
11-JUL-18 :::i1:22USA ASIA 23k- SMP 9 USA ISLA 2k- IM? N SA OA ISk- 3"?USA 3SRD ISk- RUT 1 0IA 3SLO ISk- WUT USA 00 ISk- RUTUSA 17LA ISk- RVT 9 USA AIDA 13k- IN? USA III 1k- IM?USA 17LD 23k- RVT V UIA 1710 21k- RUT 9 USA 260 Ask- *UT
C-14

W SA ISLA 20k- IN? N I OA20 N SA $A 15h- IN?
WSA 17LA 15k- :IT? WWSA :;LA0 I::- :WT W. UA 2 A ;Wk SN
:IA 173.0 20k- lvi US VA 173 20k-T US A 240 1:.- : kayI - W
11-JUL-98 22:41:49 M%S I 25k NNSIVA ISLA 2k N S A1k N
WS ,, 1 I 5k ?VS I 330Ik- IMF NSA $A 13k- V
VIA~~~ :iA1k
v I 11 3-I! g UA :A :WT SNUSA Is:. Ik- =! US 702k V I UA 201k V
US IA 25- N I A :SLA 2Sk- SN? I SA I 1:k-::VIA ILA0 15k- al I VA SIL ISk- Kvi I VA IO "l-I
NSA 1LDL Ilk- lvi NSVA 17RA 15k- lvi SIA IAO Ilk- ON?
WS 1 3.0 25k SA I LA 71 2k- lvi USVA 2I0 15k- lIM
11-JUL-&I 122:42:24N:S JSO 25k- SN? I NA :;LA 2k: ONT 9 NA I 25- N
USA 1i11 I,:_ I NSA liA 3- vg NA XA T:- N
NSA 17LO 25k- Iwv! NSA 17.0 1,k- IV! U SA *60 21k- IVT
11-JvL-I22:42:37
NS , S A 2k N I RNA ISLA 25k- SN? R NA $A a5k- 23?
VSA IS.l 15k- ,WVr ::NA 353.0 2:k- Nvi 9 NA 02-lv
W9SA tiLA 10k- I I NAlA2k- lvi ::NAA as5k-NNSA I'LL' ask- lvi a sA 1710 25k- Owl R NA 140 25k _lvi
li-JUL-9 22:42::7NAIL51-IN S hak MNa 3::A; 1-: :.N? NSA JSLA 25k- SN? NSA IA 25k- ZN?
USA 151.A L'k- lvi Mik NS A IO Sk- OUT NSA 40A 25k- lIM
RSA I Ll 2'k- awl iNsA 171D 25k- OUT NSA 290 25k- lIT
11-JUL-SI : 054:;NSA ISP. :'k - S? I NSA ILA 25k- SN? I NSA IA 21k- ZNF
USA 35LD Lk- NYi NSA SILO 25k- NWT NSA 40 25k- lvi
VSA ILA. lik- IU! I NA l7lA 25k- IN? I NA ) A 25k- IN?
NSA R~~!~-I9 NSA 17R0 25k- RWT NSA20 2S'-N 01k- 2vi
NSA 35p'. 2k- IN, NSA ISLA ask- INF NSA IA 25k- 2R7
US 350 L'.k- RV! NSA SILO 21k- lvi NSA ID 23k- Ol
.SA I ILA Lkt- lvi NSA 17lA 35k- 13? NSA ;:A ZSk- 1N?
NSA LL 2!k- IVY R NA 1710 25k- lvi I SA 26 25-lv
11-JUL-SI 2:!43:25
NSA% ;;XA 25k- 3N? NSA ILA I0k- SN? NSA IA ask- ZN?
USA D1 1::- al :% NS ISLD a0k- IV! NSA to ask- OUT
SA 17LA I k DWI NSA R7A 30k- IN? NSA 24A a0k- ZN?
NSA 17Lo 30k- al INSA 173 20k- al NSA 240 30k- RW!
11-JUL-S 22:43:25NSA::A 30k- SN? NSA SSLA 30k- SN? RD&S IA I0k- IN?
UA 350 15k- IV? I NSA SILO 34k- DWI I NS 30klv
US A 17LA 15k- liI NA 17lA 30k- liM BONA 244 IOU- ZN?
NSA 173.0 30:- SKI IIA 1710 50k- lvi RDA 240 30k- iN
11-JUL-Il 22143t32
NIA InA 2R-DN 9 NA ISLA 23k- SN? NSA IA 5k N
SA 331 D, k l NSA 3. 0 2k- lvi I A to0IOU- am?
VSA 17LA % 01- lvi RDNA 17lA I5k :: I NA ::A 23k- ZN?
NSA 1730 2k- WWI NSA 1710 ):k- viWT I NA 20 25-WT
11-JUL-SI 22:44139
MNSA 3::A 25k SN NSA ILA 25k- SN? RDA Ia alk- ZN?
550 a NSA 3553. 25k- viW N13A 80 23kt- al
liA 1LA 10 V NSA lilA 25k- i I NSA 26A 25k- an?
NSA 173.0 25k- INS NSA 1730 25k- lvi RDNA 260 ask- OUT
11-JUL-4 322:44:40NSA 3l.I2kS ? NAlLAk- - SN 3 N S A 25k- 2N?
351 D NA 55. 5k- v NSA 50 *$k- lviT
LiLA I NA 17"A 21k li NSA 34a 21k- ZNr
NSA 173.0 ask- lIP NSA 17.0 25k- lvi I A 240 25k- SI
11-JUL-12 :2:45401NSA SA *5k- IN? I A ILA 21k- INF NSA IA *5k- ZN?
SRO11 5k V NSA SLO a5k- lvi no NSA 50 k- SW!
VIA L.L% 14 li I NA 17:A 25k- lvRWNA 4 25k-IN
NSA 17LO ask- lvi ::NA 170 o 5k viN I NA 20 hl- BUT
11-JUL-IS ::1:4f
NSA :::." I5k- IN? NSA ILA ask- IN? NSA IA a3k- IN?
A SS NtA 53.0D 21k- lvi NSA s ak- av?
U LA I 1: N NSA 17lA 25k- OUT N SA 24A 25k- IN?
NSA 17L.0 I51- INwl NSA 1710o Ilk- lvi RDNA 540 Isk- WV!
11-JUL-US :::4:1RNSA 5551 21k- SN? NSA 3SLA Ilk- 3N? NSA IA 2sk- IN?
S0l ::NA :ILD 25k- lI 3 NA 5 Ik v
171 NA lIA 351- DI 9 : N A 2A 2k SN
NSA 173.0 21k- IND INA 1720, ask- vI I NSA 240 a1k- lvi
c-1s

NSA 3so SIk- MNr NA ISLA 23k- 2N? NoA $A 25k- IN?
150 I NASLD 2:k- :111T NA a 5-f
NSA 1710 25k- IND NA 1730 23k- BUT g NA 260 ask- awl
11-JUL-I 22:4::34lnA3k 5k- SN? NSA ISLA 25k- SN? IA $A Ilk- INF
ID I NA I73A 2k SWT ::NA SE ::k- :N?
NSA 17L0 Ilk- IND NSA 1730D 25k- BUT NA 260 ask- M"1
11-JUL-I 22:49:43NSA 532 2k- 3N? RDNA ISLA 23k- SN? R SA 1A Ilk- In?
3550 R NB ;SLD Z1k- INT I NA 90 I5k- a"ULI LA I NA 17:A 2::- BUT Mal N :$SA 25kSN
NA 17LO 25k- IND RDUA 1730 a5- awl g SA d6o a"- W
11-JUL-6 22:46:00NBA D 55A k- SN? NSA ISLA 25k- N? NA $A 25k- IN?
550NAA 35L0 25k- RUT RDNA SD I3k- 35117Lk NSA 17:A 2:k- :WT I A SEA Z5k- SN?
NSA 17LO 2sh- IAD I SA 173a 25k- RU! J UA 250 25k- RW!
US i l S1k- 3NM VIUA ISLA 15k- SN? I SA $A 15k- IN?is:,, 5 510 USA 00 15k- BUT171 LA 173A RNUA 26A 15k- SN?
USA 1710 Ilk- IND I SA 1710 15k- SW? USA 260 15k- RIFT
US A 35a., :.)k- IN? VIUA ISLA 20k- JN? I A IA Ilk- IN?35RD 35SLD USA ID 15k- ZI17 L,.I A II& USA 26A 13k- SN?
USA 17.0 :0k_ IND RNA 1730 20k- Sill I SA 210 15k- RIFT
WSA 35P., imp- SNRNA ISLA 20k- SN? USA $A 15k- IN?
1LA. 172A 5 USA 26A 13k- SN?WSJ% 1,LD IND USA 1730 Zak- aUT RNVA ISO, 15k- 3UT
11-JUL-33 Z::47:31WSA, SR. 13k- SN? USA ISLA 15k- SN? M SA IA 15k- IMF
35R50 SLO I SA 01k: RIFT1i~ I7S: 5 : U :.ASA Ilk- IN?
USA 17LD 155- IAND USA 1)0 I5k- ZVI USA 260 15k- 51111
11-JUL-08 22:47:38USA , so, 20ok- SN? MIUA ISLA 20k- SN? RNUA I& 15k- IN?
IS3 so 5313 USA S0 15k- lilT.ILA 17%k USA 26* 13k: IN?
USA 17LO 20k- IAD I SA 173 D2Id- RU! I SA a60 1k RIFT
11-JUL-38 22:47:51RNA 353k 505- SN? 5 SA ISLA 2*k- SN? USA SA Ilk- IN?
11110 31SLO I USA S0 15k- SUIliL. I ISA *$UA 36A 15k- SNP
USA 1710 20k- 3W! 5 SA 1733 50k- awl USA 24D 15k- Sw!
11-JUL-IS22475
U S I5A2k N? RNUA ISLA INN- INF USA GA 15k- flU!5530 SLO USA 10 15k- 511!17LA IIR 17k UA 24A Ilk- SN?
USA 175.0 2*k- IRV M SA 172D III- SW! USA 23 Ask- ZVI
11-JUL-9S 22:40:05USA 353k 30k- IN? USA ISLA 20k- SN? I A IA 15k- RW!
31D " UA 35.0 lok- NWT VIUA to 15k- 3aw!171A RNUA 172A &Oh- SW! USA I6* Ilk- SN?
USA 17L0 20k- RU! USA 1733 24k- ZVI RNUA age Ilk- aw!
11-JUL-03 22:312US A SISA 20k N USA 311k 24k- SNHP USA uA 15k- m"1
3530 USA 3513 15k- 111" W SA D3 15k- SW!IILA I USA 17RA 1Sk- RU! " UA mE ilk- SN?IS 1710 24k- IND I SA 1733 26k- MV " UA ISO0 15k- MI
US ," D ~ - N U SA IL 2k- SN? " U A 80 l k- RUT3530 USA S7LA Ilk- RUT RNUA SA ilk- 3U1
RN A OZk N USA 1720 10k- MUT RNUA 26k 16k- SN
WSA *$025 IS I UA 17L3 I0k- SHP " UA 263 Ilk- BUT
USA 7LA RD& 11S1 SASLA lot- SN? USA 26A Ilk- 5IMFA17.0 lk INSMA 5315 Ilk- Ii! USA 365 lot- Sw"
"SA ILA 5 t USA ISLA act- BHT " UA UE 1Nk- IN?
US Ilk20-SN USA ISL &Ok- SN? I SA 6A Ilk- IN?35L.0 5 SA III& Isk- awl " UA 05A ilk- 3"r
USA 1710 29k- 5111 USA 1730 20k- mul 5 UA 260 lob- w"3
C-lb6

VIA JIMA. 24k- IMF USVA 35&.1 2*k- 311? USA $A &Ok- IMF
ISS0 USA 2110 Lek- OUT UsA I0 100- VW
1LCA .1 VA JIMA. 100- BUT USA 36A. 10%- 3MF
VIA 1110 39k- IND USVA 17ao 20k- OUT USVA 269 Lek- m"!
11-JUL-os 22:49:37VIA iSIA l0k- IMF 9 VA 391.A 2ok- 237 VIA IA 10z- OUT
3130 9 SA 3110 10k- IV! USVA 60 10k- a"!
17LA USVA 17MA lk- 21WT 9 VA lAIk
USA 17LD 20k- 1Mb USVA 1730 20k- OUT I VA 20 10k- OUT
11-JOL-49 22:49:34352h 39t.A USVA IA l0k- SV!
350I 35LD USVA to 100- ftv!
171 I l~A USVA 36A Lk- IMP
17LD 170 USVA ISO ISO- OUT
11-JUL-Il 22:49:54I11 IR ISLA1 0 A
33R0 35SLD goI
17LA I 1731 I 51.
17LD 1730 D 260
C-17

Appendix D: Low Level dual Doppler Analyses:Wind vectors and AV
These are 1 min resolution low level (approximately 190 m AGL) dualDoppler analyses on a 0.5 km-spaced Cartesian grid during the time of themicrobursts. Minutes after 2200 UTC are shown in each diagram's upperleft hand column. Stapleton runways are indicated.
These diagrams show horizontal wind vectors and contoured AV values'forthe 11 July microbursts. A routine was implemented which searched forthe maximum wind velocity losk across a a 2 km radius circle centered ateach grid point. This maximum AV was assigned to the point, then thosevalues were contoured to obtain the diagrams shown here.
The lowest contoured level is a AV of 10 m s- 1 (20 kt) , and the contourinterval is 2.5 m s- ' (5 kt). The first contour corresponds to the originalTDWR microburst alarm level and revised TDWR "wind shear" alarmlevel. Light shading denotes AV of 15 m s- 1 which corresponds to therevised TDWR "microburst" alarm. The darker shading indicates AV of25 m s- 1, the solid area is at /V 35 m s- 1.
This analysis was performed using the NCAR CEDRIC radar analysispackage. Missing data from each individual radar were first filled using amedian filling technique, then unfolded, then smoothed. The smoothingtechnique averaged 1 adjacent gate on each side of the beam, and 2 alongthe beam for FL2, and 1Xl for UND. The smoothed data were thenremapped onto a Cartesian grid with 0.5 km resolution, then the velocitycomponents from each radar used to find the true horizontal wind velocity.This routine was a streamlined version of the processing package describedin the text and was uscd for the summer's ground-trutling exercise.
D-1

.............. .. . ..
....... . . . . .
.-
S-- ....... ~. ........... NSS ~ -
. . . . . . .. . . . ....
''"' N IL----- - - --...
- - - - - - - - -- -
z'
0 W..\ :08zz7V(i, :09,Z I. . .
%*%*t .S*.S ~\\ .~ YA\% '.~~~N'SS s'.~NN ''Z. . .
00.SN Z\ ~ ... .-- .: ;;zIUzMS~~
M N. ....
-.- Z.Z.1*'-.n --~ - - -N-.- - - - -
N N i .~
-.v\NN.N'S.
NNN'S
SS \\5N.-.
~555 5' 55 -N
5.." "c.'.....v -\',N'~"D-1~

'Yz22:16 k\x'
i~:2 t,
' ... - -' ' .. . tt~~t' ' ./i
r ~ ~ ~ 777~~~ //77
w -.. ________ .>........ ......1 . - p - -1 - -,. . . - - . ". .. ^
- - _ ...... , , ... ....,.
.. _ ----. ... . :~--.. - -- =-. .. -- __ .. .. ... ,,
ir .,4 \ a~
'lilt- - - - . . . , . . .. , ,, , " - -- - - " . . . .-- It? -,, ; .t~ . -a.- a '*' I \ " '
._" ,< .w ,___--- .-- "==: .,/ f€ ,; ... i -"" . , .. ... ......a..-a .a.-. . -. a. --.. -_---
- ..-- .-..- ,, ... -.. .,, .-... ... , ,.-- ;.,..,.-.-, -. ,--, ,.. ... a ' ... , .. ... , -, A A -- $.a ..... a ,/' .
.. .- , .-- -.. ,aaaa',aa,...\,, - ;! ., , . . , . .. . .. , ."af//// g l.S., , ,,z
__ .. . . . : r ....... ata, a ,<,,,d i ll, \' !. / fi
a....' 'a,;JJ _ .- ".. saat? _ h _ -. ...... \\ ' - ''k/ J -' a "'
... ... )-. / / -'\t- . a-a aa\_ ,,. \,,y''a \\ f . a:2 t ,," a\.. "--' ' a '
*~~~~~~~~ ON ,aaaa
.... . _ ,=,, ,,.... / :......./ 4." as.*.... a,,, a a . -:-a4: :.a... ,¢, .d f . ,.. ' a,.. ,.€}7J a A a"/!- t .. d '/7 .,aa .aI< Il ,/#i € -// - 5,i'ag-(\a. i 7a t-
I ,, / //t.- ~ ~ A A ~ ast I / -A A- /'z .- . . /7 I t #.I /.A
a ,,[I ,.A554.NAA . A a,,,.,, ... a ~~tsH a ttP;5SA " ;,/z ,:,II''a///!/ 7 ,,.
. .... -: .. . a,.. ' a\\aal,/,,,,. .-. ..- . a... ..4.4 a t -//,/,,,; .. . . .. . . .. . /' f a,if/. A ,;
-,' a t, ,- .a ...."/ - -. a,',, a, a 1 . -a .a aa5-'- \ a ,/ .- a aaaa-.,aa • ' "" ... .f "-[ i a----,,\/ a . . " , ... . ,¢ AA _ .... Ai II /? . ,
" -"-'-,-,--,-.- N . . .. - ------- "aa'"" ' \ a.a. .. ,. ~ .' ' -- . " '\ ',5 -..... a'"' .. . .--.--. , . .
--- --- 2 9--* a 'j'-a-aa-a-~. A -.a , sa I ata . 30
Ia ~~~~~ ~ ~ ~ / %Itf~i Y -aa-~ ~7.
at. ~z-~~~ Z --. a
Saa. A
X\1 A. ~ ~ -- ~ a /- i a ,.,
/AA ~ A -~% /~f /1 'D-3f

""22:31 . . -t" __ .____-,,,I d., . d .* ,. ... ,,.Ig / . ., 'K,, .. . '; = , .
S.•.-. S.Sllss.. ,,. ,
'... S.ISSS%.''S555S. _SS*-. .... , . . " -,'I. f ill,
N. .......% h , , ,,,, 1 .J, .,. ,"I'''\\"iIN Z' z.5SS..\\:.\
........-J _ ____........ .. .. ... ''I '' "............... .- *, ; ---- , . . ------ :. . . . . ... . . . .. .- ' ' - -
, # /#l",% * NN' I//1##C ¢l
. " , I I - /
.Z. 5i 5 t.. ......',':4
. ...55 55 .SS5 .. .. "" ." 5*5 "" 5'" " "'" " \',, 5* 51 5* .*" ! ." " 5 . ..... "" '
\Z1 '5.-' 'Z5 5' s~
55.-.S.'.S.SS,, '\: ' \5.'. S /\/,- .:. 55s , l :: 's.:5 :: I .
5',,Z ... '..
/ ....... . : [ll l/ t . ..... . ,,5551 I/I/I...... X
.. .......... ,.....*- . .... ......... ........ -- ;;-- .. .. ............ , -,// .j<
........ Z........ ... .............
.............., \ ... .. ................ ;:, .............~~~~~~~.......... ,,, ,,--,-.--,-----......................S..... ........ , .:.". **.... -:"":.".'," 5, ' .'',",55 ' 5' .%' t--- ' ' .. ,:","'" ',: ,s,5,,5,, .S", .'. 4.-" . : ...... :...f'r',,
--,,, , ,.... :44\ . ..-,-, ; : .. . . . ., x\ , -- ,,' _,
..43...............,,\,, '.'., II
',5... )* li t / t l , 't ti l/ , .s . s s .i w ~ ll i I.,.. .... Jtl//"t45/ , 3 . .5 ,. '. ifZf., .. . .: /. ',; h!w'. > '.,, ,,,,, 5 .5 / // 'i '. x. .. .. , ... 5' ... .. . , , .. ,,, . 5 , ,t',/ . .5... ,.... ,,1,1/,
..S5,.~ S,,, ,,,, ,, . , 555,,,5,,,, 11... . s,: :: . ". s, s SSS :i '. . . ,,,5, ,5;' '.... 55 ,,I, 5 ,55.... , ..... ,//lC ./ z . :s''55As.. i 1 "/'I pl
* 5.. .. . . , ,/, - , .. . . . ........... ,,,-...... ~~~~~~~~~...... ......................,,,,,,.A...... ..55 .. ,,, --ff~ . ............ , t) . ..... ..... ......... . .tli~t . ....... ,.... .,
................~~~~~~............. . .:: ... :...::=:::: '' . .: :::.. :: :=.:--- .... 5 : : ::::::::: :::::::.. --. - -: ]i.. : !.,i i' :::: ... ...........
............. ... .....--- : ........-..... ........ :- -. .......... -.4. --.... ........... ..... 4.e ! ~ ~i::iii:::!i--" .:: .. .... :'......".......... 55SSS**S *:; . .......... ... ..:, . .'.'..':' ,;:/;,. . , . ' ....n. . '" "*' S . S,,"'-',',l , ".C% . ..... 55555.. ... . .... ,,. . ...... , SsS S., ., .,5 = ... 55... , . /, S*,,r,.•, "47. *55. 5 ... . 5 "2 .. .f/:* 5 , S. 5 ,, ,.,,5. S. '...s ...'s ..... *55. s5. ,,,,.... .. .... ........ " '.. .: ' ' 5*' ,5 5 .. .... ' ....p . .' I. . ... . .... . J .~ s s, ......- , 1 , ' ,,,, ... 5 .... II 1 "......" . ' " " ...
sIsls. i l .555i1/ L It,,,,sIs...........,., ss ff/ ls/ * **5.S~*..555*. ~ *' z .. ...... ,,...... tt ,.
mwl "N
:' ss' , .. ' ::,. s , •' " ..... " " ."
.... ....... ,.. J,.J,. ...... '. s '..... ,,..// / . .. . . ............ //#
. . .S*tt tt .... 5..... - - .....t t* # ##//// ,• *• t ti.. ...... - -1 /4/#.....- .5.t::::: : : ......... ,.... ,..... ... ,......... .. ..,, ~
. . . . . . . . . .%*.... ....... ... 55... ..... .....
.. . . ,.. .. .... . ::::: : : ,-'. . . 55555,,,,. . .:: .;: .: : : .. .. .. . .... .... .. . ..:: : :: : =
D-4

11 22:01 :02 0
:04 :05
:06
:07 :08 :09
II
. .. :1 2
:13 :14
15

22:16 C " ' ~ :1
:22 .23:2
C>N
:28 :9:30
4o4,
D- 6

22:31 3V" :33~2--
(J)6 - 37
6 :4
D- 7

Appendix E: Combined LLWAS/FLOWS Surface Mesonet Winds
Wind vectors (pointing in the direction the wind is blowing toward) areshown in these plots for the times pertaining to the microburst. "L"numbers are LLWAS stations and "F" numbers are FLOWS stations. Ascale wind vector is shown on each plot. The Stapleton runways are shown.The plots are centered at the centerpoint (Li) of the runways and theaxes are labelled in km away from that center. Dots indicate approximateareas for microbursts causing divegence levels above threshold value(approximately the TDWR "wind shear" alarm level) and crosses indicatethose areas for stronger divergence (approximately TDWR "microburst"alarm level). Station F13 was not operating correctly throughout the timeperiod.
E-1

Appendix J: Combined LLWAS-FLOWS Mesonet Data
Wind vectors (pointing in the direction the wind is blowing toward) areshown in these plots for the times pertaining to the microburst. "L"numbers are LLWAS stations and "F" numbers are FLOWS stations. Ascale wind vector is shown on each plot. The Stapleton runways are shown.The plots are centered at the centerpoint (Li) of the runways and theaxes are labelled in km away from that center. Dots indicate approximateareas for microbursts causing divegence levels above threshold value(approximately the TDWR "wind shear" alarm level) and crosses indicatethose areas for stronger divergence (approximately TDWR "rnicroburst"alarm level). Station F13 was not operating correctly throughout the timeperiod.
E-2

88/07/11-22:03:00 LLWRS-FLOWS MESONET (km x km)
10 I I
0, 1 F2 F q
, 1F1 , /,,,
, 1 \ F l91.12 ' 1/.7-
10.
\ F 3 F= I
13
•u1 L, 6a , i g F
I I
v
j l a /Fig
L1 L 7
Uil r r -l~l' -. . .- .-- \
21 v IZ
-10 0 to
E -30 II ' s , ,
":o P2I3-,l~ I
E- 3

88/07/11-22:05:00 LLWAS-FLOWS MESONET (km x kmi
10 ,
F,\ I 2
F3 F4
F S9 L G S 7,
L \
t I
LI - ZZ
F26 8
-to 0 10
88/07/11-22:06:00 LLWRS-FLOWS MESONET Writ x kmn)
10
F \ F\ i
L12 L 7l
L ,t I , . ,2=
L ,P9
117
o ... 1,0,,. / 9
-4
I *
-ta 0 10
88/0/11-2:0:00 LWE-FL EOE k m

88/07/11-22:07:00 LLWNS-FLOWS ME5ONET (km x km)
10 I I I
F 9 L FIO /71
7116
I U' I S Fi
: L>.Jd 7 rl 20'
L12 L 7I9
LII ZZ FZ' - -...... L 0I /
/ '
LID - F"
I9
1 27
1177I L2 i .
-10 0 10
88/07/11-22:08:00 LLWRS-FLOIS MESONET (km x km)
10 I I
"S\ "\ "77
F 9 F O
*I \ L\ il0 2ls
... 17
0 M 'I\ 20-
L.9LII ,\ "W . -r' "~ .,. / g72
LIO . ..
S/7
rIn 17 12,11
10 I I-10 0 I0

88/07/11-22:09:00 LLWfS-FLOWS MESONET (km x km)
10I 0, I F 2 , I
,,\ ,,\ ,,\ "i\
'\ "F,"F "
Pg L\
FI. .3 ., . .:I
IZ\ 11 L;6ri0. F ,L I F12 F2
I. k I *
"'"\l F22"
10* * *
F S L F S \ P
* . L.L.,.. I
F26 FI Fig
I - - - I
-10 0 10
88/07/11-22: 10: 00 LLWS-FLOW MESONET (km x km)
|0 I I I ' I
IF I"\F 7"\"
L S z I FIO
fix ... iri fill
0 .leis. L I l\ F 20
_-LI LI FN
F I | U
-10 0I,
E-6

88/07/11-22:11:00 LLWRS-FLOWS MESONET Ikm x kin)
10F IO F 2 F I I
F I FLI 52 FIO fi
Iri s \ : F\
F17E
.Nl I" , .Z.Li 12,
"L"D t +L IZ . l 17 .I Z
L. +' + + + + INL ,, ,, + * *
t 4+44+ F +
i,4
F28~PV27
-tO 0 10
88/07/11-22:12:00 LLWAS-FLOWS MESONET (km x km)
10
"S\ "6\~\ " FS\
FIS i V iS l
t. .1 .. ., . ,V .3
Lit 1 . ,1 .
,7
I L 5
-tO 0 IO
E-h

88/07/11-22:13:00 LLWAS-FLOWS MESONET (km x km)
10 F
L . 5 FI Fi
ILI% L" " 'S
L 4 - . ,L. /L 120
LIZ~ L 92
Il ,I . " + + + + + + /
+ q.&& +LIIF2
i. .... +-..4•4•4.
LaO 1 ,23
-to 0 10
88/07/11-22:14:00 LLWAS-FLOWS MESONET (km x km)
10'9 I
"S\ ,.-,,,Pt\ ,.\
IF L S 1
'12 T- L ?
Xl 1.2 L PLt 4.
I '* .I - - . I *
L 3
# o ... .. + + ,,.
-10 0 10E-8

88/07/11-22:15:00 LLWRS-FLOWS MESONET (km x kmi)IO mi,-' I , !
10
PSF 4
F .\L, ... ..
• . . . .. . . IGL I'I
LI ~ L L7
L ..L . . . . --. .9 . . . . F23
.... Fi rz:
-to~ 0 1
88/0/1122:6:0 LLW-FLOW MEOE •k x km
109
F L 5 I i
\, :
I *
-0 0 O
88/07/11-22":16:00 LLWRqS-FLOWS MESONET (km x km)
\\vI0n
V,. I ,.0<,\ ,,\
"7----
o 0 ,:0LIZ : "E-9
"\::1,: :\,,,:/,
r ,
' I * I * I I
-to 0 D0E-9

88/07/11-22:17:00 LLWAS-FLOWS MESONET (km x km)
10 I I
F ~~ I 3 F 4
F 13 -fig
L 3 l ~P13, "FIB
FIB Fig
IO
Io\.,. , . ....... ."
F24\~ 2
F26/
I
-10 0 t0
88/07/11-22:18:00 LLWAS-FLOWS MESONET (km x km)
o I 4 i
.. .fig
** 15 v I I O\- ' -
I
o I *
L 10
-to 0 to
E-10

88/07/11-22:19:00 LLWAS-FLOWS MESONET (km x km)
10 I '
F 3 F
F s 6~ a 21- F 8
, , ... ' --fo F,, ,,
3 /li l - ,A F .. --
r • t e + + +
LIO
\ I
F26
-100 10
88/07/11-22:20:00 LLWAS-FLOWS MESONET (km x km)0I Z 1120
L2 \L7 . . ,L -.-.--- \ :: +
•2 Va . Fn
m\ /,/,P27/ Z]
i I , I I
-10 0 to
E-11

88/07/11-22:21:00 LLWRS-FLONS MESONET (km x km)
101.
F~~~ S r 3-
_ FIS \
Fla FIS
.. .. .t.2,.' .. .0tl , F, ,, ,.. ....g"'
L l . . . . .t - - -. . . . -. . , . .F2LIZ - - L IL
FZS
F26 F.Z s
I I , tI
-t0 0 10
88/07/11-22:22:00 LLWRS-FLOWS MESONET (km x km)
10
F I - JZ--'K ~'
F i s/ F 2 ..----"\
Pig k is FIG
..L F
--,.-.. FO U.,I,
LILZ
A2.2
• * " I .. .*
-10 0 10
E-12

88/07/11-22:22 :00 LLWfl.-FLOVIS MESONET (km x km)
10
F . - 'i - FI"
F 9 L 5 F 10---
I. FI F II /
F13 F FI5
0 LFI B I..~2.
/I F 19
, 2 XF, + + + +
I ,
Htb 0 tO
88/07/11-22:23:00 LLWRS-FLOWS MESONET (km x km)
10OFIsI< 3 F-.N
F 1 F
L 3fi FIB
FIB \.,2, .7+ + +
LI ...... ....--... $+ +U1. . . . . . .
* * +
-10 0 to
E-13

88/07/11-22:21:00 LLWRS-FLOWS MESONET (km x km)
3 4
L S - F a
F I I lo --.... /
FISF IS41 t Fi
L 3
FIBig . 20
&12 -..71, . . :7:
LI " *, :" . . " " " z
F24 .
F7 . .
-10 00
88/07/11-22:25:00 LLWRS-FLOWS MESONET (km x km]
10 --- -I-
IF~
fil
Fil -l Fig
r. g.Fill
* • LIZ +
* +
+I\ + * zl
FMs
-t0 0 10E-14

88/07/11-22:26:00 LLWS-FLOWS MESONET (km x km)
0 I , I I ,*
M I Its*..**J
F a .---.
0 • I • • •, 2
. ... .
\L\
724
F26 2 7 20
-IO I
-t0 0 10
88/07/11-22:27:00 LLWRS-FLOWS MESONET (km x km)
10 ,
F 3 ----
pis
L it * 71fLI ........ ...........
• .: "" n3
*24\/ON
/727
* ,I I I
-tO 0 10E-15

88/07/11-22:28:00 LLWAS-FLOWS MESONET (km x km]tO, I I I
FF a
F 9F
LF 3
F 14FIFIB/
.*TI . 2.. . . . .,-" 23
"I ' I a ' " I
+ + + L - ,9 ~ e .
F27
-10 0 10
88/07/11-22:29:00 LLNAS-FLOWS MESONET (km x km)
10 , , ,
F IIF 3
IF S
IF~ ~ ~ 9 l ---
L1 3 2
'<L: :" :++ I' ++ + . . . . . .P
+#4 + + +N.
+ +, + . .* ., Z++
F25 2 f
\ 1 27 P2
I i I
-tO 0 10
E-16

88/07/11-22:30:00 LLWRS-FLONS MESONET (km x km]
10 I I '
: I, - 8 :
Fla/ /.A>-. FIG'
03 1 F20/
0 FIa *
LII .... + + , FZZ
F11
F26 F
ZI
,I I I I I
-10 0 10
88/07/11-22:31:00 LLWNS-FLOWS MESONET (km x km)
10 I ' I
F, , 2 .,,.
-
o ,, LI 4<I
* 's
-I0 0 IOE-17

88/07/11-22:32:00 LLWRS-FLOWS MESONET (kin x kin)o I ,-I -
10.1F 2 3
F g F fit
F6
FLi t..... - FI /
.<, : , . J ::::o ~F-IS*
LIZ ••
..... ...
* ,, *F::1 .
FZ6
" FZ:, /F''e
-10 0 10
88/07/11-22:33:00 LLWRS-FLOWS MESONET (km x km)
10
iOF I F Z F
F s FSF
,f.ie ,/O t /o I/ / ..
'Ll,, . F2Isi::: " LS/ ;,
" l 4l ....... . ..
*F269
-10 0 IO
E-18

88/07/11-22:3q:00 LLWAS-FLOWS MESONET (km x km)
10 #m = '=
F0 I ' I i F 4
- Ft "' 6 7FF17
. / / '' I Iz /
F13. F16 /
7I6 F 20
S . .. .:* . . • ..•*Fd ... B...7 .
126
-10 0 10
88/07/11-22:35:00 LLWRS-FLOWS MESONET (km x km)
10 I I I
i B F10 L I I
01 0 I0
-12.L .. . /F2
10 * 0

88/07/11-22:36:00 LLW:S-FLOWS ME3ONET (km x km)
10 I I
F 9 ~ 1 1
. .S . . F lF l. F/ig .
.,i .. . " " ",1 22 .,
.... + - ,.. .F++..•L19 +,..
. . .• F21 . . . . .
S I I i
-10 10
88/07/11-22:37:00 LLWRS-FLOWS MESONET (km x km
0 I I I I
S ,/r e
o',...l * •P/20
* "* *l * * .. . . . .. II
+ •• + + + "I"
+49+. . . .
t I I *( I P2I
-tO 0 10
E-20

88/07/11-22:38:00 LLWAS-FLOWS MESOMET (km x km)]
10
L S It.I. F 2
FI Fig
. . LI 9
.F FS.\e27\\
-to 0 10
88/07/11-22:39:00 LLWAS-FLOWS MESONET (km x km)]
1011
FF
F~~~ SZ.7 i
L >
L12/;: 72
7222
726 F2 j2
-100 10
E- 21

88/07/11-22:qO:00 LLWRS-FLONS MESONET Ikm x km)
10
A 2S
,O , ZI,P/ °S •/ I/~
iFill
.. IZ -.. . 7Lit: f1.8 ----- L / F~Z
. " .. ............
I .
F26 \ F 2
-10 0 10
88/07/11-22:l1:00 LLWPS-FLOWS MESONET (km x km)
10!0 , ' F I , 2"
PI Flo2 Fit
S Fie
L1 L : *FI . ~ // •/
*~~~ L~Z .:T:~ ..
.1 . , . : . 1 .. .,.9
I I-to 0 10

88/07/11-22:42:00 LL!-,qS-FLOW, rESONET fI,,m x km)
F i F Z/ F3
-/ F68
14
L122
. . . . . -- '9. 2
F24
-10 1 10
I10Z I / * ,
'S6
1~ lI: FIOS' 1
2 ~ 7.16L.
1 22/
. L6 12S
-t0 0 10
E-23

88/07/11-22A:OO:0 LLWRS-FLOWS MESONET (km x kmn)
10
FIO Pa
. . 2. . .L.72
'24
25 F2S\
-10 0 10
88/07/11-22:qS:00 LLWRS-FLOWS MESONET (km x kin)
10
L Z FL X's7/
E- 24..

Appendix F: Surface sensor measurements from FLOWS
These plots show time series of temperature, relative humidity, averageand maximum wind speed and wind direction (from true north) for theFLOWS mesonet stations. Axes are marked in the appropriate units.
The station locations are shown in Appendix J. Station F30 was located atthe FL2 radar.
F-1

--STATION I o4 xOP ljzC? TV"
PtJLOO 30 11?OUWh4
22000 61JL4
PLOT OF MINDOMC1113 (WIOI NZUKVE 110(WA)
30.0- ,- 16 6
546.6
J LaO O 604.6L ?SPIMATUEZ ITOITi. UunITY? 1 (191911
STATION 103 orPRfOJUC? Town
Ili 8 OP it- 3o 11-SUL- 4341
2i 0!00)
(1*11.
_ _ _ _ _ _ _ _ _ _ _ _ _1 .
36
sellIt" f WID otge~tn 46.6l
L9.0-
34 PO? P 3? 63.3 1fl66A?36 3?) 66N041 I UVk
is..
F- 2

--- STATION 1#2 Or PROJCe'? ?DWO -
(0
34.0
2
PLO. OF 0 30 O I1.OE 1 01
10. oj10.0
PLOT or 11 SnOL £1 10).AUR NAZINUN supirND 11 P1NAI.
23-0 0 11100
4..
2. PLOT O o T WIND TKNPIA?£I1 14 ?) U RIZ? I Ilf
-jul.-001(11/3-I
149.
100.
286-
10. j. 0.6
IS0.0.
PLOTor 61 40I tXVINTIVE(TOTI. UM10.V
11. _ _____ _F-3

$?Alto* Its or PmoJIcr Tom --
Z L-JUL-68 LI- U.-88(*oZ12 - 6!08 22,1 :64
0-to-
120 ____________
] 11).4 OP 53/ 8133CZOU WOZI).
is ) ( N/3I
t. 07 16_.0
PLOT of wilD 5p3D i55103. mulNUN WIND 5133D IWIA.Z). i
Do - " (PCTI
30 1-s...40.0
26.0
PLOT Of 03? OLS TSKYMATWI0S ITDOM), nII 2 ?T I MI3S).
F-4

STAION 106 or pIOJZC? TOVS--
It-JUL-$$ I I-JUL-OS12004 12:30-66
240 __ _ _ _ _ __ _ _ _ _
i1
PLOT OF WIND 01SI~O0 f *l
PLOT or WIND Spila, RUMPI. HI~lUM VIED 8153 (VILAX) .
4.4
24
PAlr12 or WIND 0uI~iDM~lf (wv~fl,. ____
tm/sp-t11'9
0.6
40.0
FIAT UP OUT sOL I"RSaffiE I TORTl. ENIOZIT I1111 mu.
F-5

SIAIO0AJ OtFUOVC IL-4
300
PLOT Of WIND AIO WZ)
____________________19.6
...... .....
STTO 117O20GZ1 TWN-
&I-SaL-60Y;!166
21
,:,L fWISID DZICIL@E tUIfl.
PLOT Of WINDO SFREM0 USFS) gv; 09 "s N SF323wn M (1"
Be.0. 50.0
so.0. 1*- 0--0.0
JL .
F-6

-- TATION It* at PEOJ9CT TOWR -
IDE)
PLOT1 ;F WIND clPEED o Wl. ANNVE PE WA
-,A ci 0
16.6
PLOT of OWff SOLD rznpISA?uas i7411 DNDT I #50163) -1.
-- STATION III Of PaUJECY TM -
vo:61 00!0 V2,ED6
10"6
PLOT Or IS E WI sso4llD . ZNNVE PE WA
lUG CI I PCY
16.0 to.@*
30.0-4s.6
i. -,1.
F-7

LI-JUL-li 1-j L-ss320000 22!22!68
030)j
124
300 -1O t IDI ORIN/21imI
15. 0 -%- L .
PLOT or WIND OPSE0 (IPv). NAAiuN WIND state (UNAZ.
16.61-5.28.0-1
24 0 430.0
PL.OT Of DOW B*Ll ?INPILA?330 (1031). EVIWIS? A MilNl).
-STATION 12 OF PSOJUCY ?6 -
30
206
120.
a.
340-
310,
LIOT OF 0ID PEDVPO 89,71= 91 1TVON 0133 T 13 15-6.
(00 CIF-8

-- STATION 114 orF ROJSCI To"Iit- UL-64SS'V-23040 00:0:0
24
PLOT OF WINO 0929CTION fWO102.
4NS'82- 1il.4
10.0- $0.0
18. 0.01
29.0,
20..6
PLOT Of OUT SOLID YKRIIRAU0B ITM311. RUNSI? 01TTrI Eumi 1. .
11-Jut-00 11-jut-.
112.
PLOT of W789 DIReCYZON (WfoupS.
10.0. 15.10.4. to.1
-1------. 40.0
0..PLOT or OUT OWLA TBAPIZAT014 IfTI 0012 IT 310? fo3311..10
F-9

-- STATION 114 or PSOJOCI To" -
11-M-066
IDE*I** -
30.
24.
PLOT OF MIND01 C?1-= Mv.l
110.8
40.
P30JWC 130.
OL-46LIt-lyk 0:00 2
346
40.
of PLOT Of WIND DZ3UCIIOS l00238.
30 0'.
30.62-0
PLOT B731OLSINEATONS I Trir P. 33033111 1 i~u
F-10

STATION I&@ ofrmojsci TMM
1 '00 ________________ 22:3000
13.6
3 4 -- - -.- -- - -- - -
~~S.6
t. ?O 15 95 010.NkO W220 11115 lummZI. .
PLOT Or WIND SOLS9 INSAUE itl.IPSI!I(S.
STATIONl t13 OF PR@JICT TOSS
ite - L6 O
to.
306
246
136
Is.*- 5.
30.0.
24.6
306 IOf Oaf SOLOU VSNPSAIVNX I 35!IWIl 1(U.
F-11

B TAtIoo is* of PIOJEC? ToWN --it- UL-481 0
300
240
POT Of oine OZSIcfra@U 30153a.
P&0? 0l urge S1191 lurF I. SUISU "3 WNo sF13 333
~4..
3 .0-
2.
3..ilIt.
* FOT Of- -091 ROTA ?5LUR95A10 i TR1. NZI1111 L11 1.
-TTtl ta1U0 of1 @1 waJc? Its"11-.191-68 W
530 3
Is
123
10.0f' A
PLOT OF 011111 $INCON 111179 . " RDsoe4 1
too~N l Nil I
14.
SWT OP4 WIN O SF133 LWN I TOUT1. VVDI*T IU IIN S 9113 ONI
F- 12

STArtOR 122 Of PROlIC? ?DWI--
(0651-.
Is.
10. orvvo6.STOF-otl
S.0.0
PLOT or vivo $Pag3 Mrs133. -MAT ms ND 133613 (03101I
is..
PLOT or 361 SOLD W?331D3101063 7(tiII. all3131?1 L(1914113.
-SWAWtOg 13 OF FROJICT TWV
20
130
10.9..
is..
PLOT or WIN3 xv333 l03133, 4 U 0636933(3103
(04 el-
2.0
F-13

-- SAION 124 Of PSOJSC? To" --
11-JUL-68 11-JVL-4632:00-04 22,10:*o
300
in/W
150.
Fro-, 09 313 3 1 0 1 -."1 VM IM)
is. s1. 1 -$4 0
-4.6
10 I 130PLOT OF OUT SOL&5 TSAP91LATWUS I(TORT. FR~~IBIT1 I I Muni.
STTO L110 29 Of FUOJICT 153
11-JUL-40Il-s
240
120
10.4
PL. T Or ias.1*i*.pa (a)
I3" c2' Ile? I
3G.&- ..
20.0
*4.0.0
F-14

STATION 114 Of PlOjSCT TOWS -
11-10t.-Il t 1-JWL-SI
3,01
24
PLOT Of WIND DISPIED IVSOI SzuaWN SISINAD
L9 A- 10
--IAO 1.0PPSJC WN
40 1-30.-I
360-
.45.
26.0
#LOT or D~ST SpiL$ IWIPSI. NAN NONrj WINS t? S I 4uAjl.
STAIO L2 rC)61cTTW
to
20.5.- 1
F-i5

STATION III or PlOile? Tow -1
IL-JUL-84 LI-J L-43
4060 21 - 0:06 22:30:00________
a-
30-
240-
I 20
PLOT of25 Nino ?ZO SOaci win).
In/S?109
IC
PLCOP IED PUD 0) MAXNUN WIND 51620 tv11k).
24.-3.
220.
--l 1*03I4.PPSJC?70
IL-JUL-80 I1-SUL-863~ 6!0 22: 0:00
soe240
123
15.
PLOY P 525 OISEYIOOIS.*4
ISN, cl IC
20.0 [ 0
4 0.024.0..0
F-16

1..t-as 11JL-84
10.
24w
to.______________
12 ____________________
Of vivo_____________________
11.0:1 1.0
30.01 0.
34. F03 S39 003.NIIW 03 F5 (mz.S
(0 PL O at Da PCI"Ua UIIT g
35.5 JF017

Appendix G: LLWAS/Doppler Radar Winds
These plots show wind speeds from the twelve LLWAS stations and fromthe FL2 and UND radars. U (easterly) and V (northerly) components areshown for the 6 sec LLWAS data in the upper panels. The lower panelsshow the wind components in the radial direction from each of the twoproject radars, with the 1 min radar data, from the gate nearest eachLLWAS station, superimposed as asterisks.
LLWAS station locations are shown in Apendix E..
G-1

88/ /11LLWRS SLoI~ion= 120.0
10.0
E 0.0.........
-10.0
-20.0
-10.0
-0.0
21:45 22:00 22:15S 22-:30 22: !S
<- Tim~e (hours) -
10.0
0.0
C-: -10.0
-20.0
o 10.0
0.0ala
> -10.0
-20.021:45 MOO0 22:15 22:30 22:45
G-2

88/ 7/11LLWRS SLot~ion= 2
10.0
Vj)
& 0.0
-10.0
-20.01 I I I I I I I I I I I I
& O 0
> 10.0
20.0
21:6s Z2:00 Z2: 15 22:30 22:45
<- Tim~e (hour's)
10.0
-10.0
-20.0
C~ 10.0z0.0
> -10.0
-20.0 f l
21:4S 22-: 00 Z2: Is 2: 30 22:IS
G- 3

88/ /t tLLWPS SLot ion= 3
20.0
10.0
=> -10.0
-20.0
- 0.0
-10.0
-20.021:4S 22:00 22:1IS 22:30 Z2:45
<- Time (hours]
20.0 I
10.0
-10.
20.0
C) 10.0
0.0
:> -10.0
-20.01tI IIII
21:45 22:00 21:15s 22:30 22: 45
G-4

88/ /11LLWPS SLct ion= 4
20.0
E 0.0
10.0
E a
> -10.0
-20.0
20.0
E 0.0
20.0
-20.020.0 U I I I I I I I I I I I I I I I I A I I I I I I i I I I I I I I I I I I I I I I I I I I I I I I I
o) 10.0z
0.0
S -10.
-0.
21: 45 22: 00 22:1IS 22:30 22: 45

88/ /11LLWAS SLot iorn 5
10.0
E 0.0
-10.0
-20.020. 0
10.0
-10.0
-20.0 II
21:45 22:00 22:15 22:30 22:45
<- Timre (hours) -
20.0 r rI I I I- I I I I j I I I
CJ 10.0
0.0
> -1.0
-20.020.0
CM 10.0z
-10.0 a
-10.0 1 1 1 . *111 . II 11 :1 1 IA II
21: 4S 22:00 2215 22: 30 22: 45
G-6

7/11 LLWAS SLation= 6
__ 10.0
0.0
-10.0
-20.01 1
2 0.0
-10.0
-20.0
-10.o
20.0
-20.0
S 10.0
- 0.0
-1
> 10.0
-0.0
21:45 22:00 22:15S 22:30 22:45
G-7

88/ /11LLWPS SLat ion= 7
10.0
E 0.0v
-10.0
-20.0
2 0.0
10.
E 0.0
> 10.0
-20.01 1 1 1 1 f I I I I I I I I f 1 1
21:45 22:00 22:15 22:30 22:45
<- Time (hours) -
N 0.0 U 33
10.0
U - .
-10.0
-20.0
CD 10.0z
0.0
> -10.0
-20.021:45 22:00 22:3IS 2-1:30 22:45
G- 8

88/ 7/11 LLWPS SLotion= 8
10.0
10.0
-10.0
-20.0
- 0.0
> 10.0
E 20.0 v
21: is -4:00 22:15 22:30 22:45
<- Time8 (hours) -
20.0 11T'~I 1 1 1 1 1 Ilt l i j l i l l i l
10.0
-
> -c.0
-20. 0 1111i 11111111 ii IiililiIi iI Il
C 10.0z
- 0.0
> -0.0
-20. 021:45s ZZ: 00 Z2:15S 22:30 22: i5
G- 9

88/ /11LLWPS SLion= 9
20.0
10.0
-10.0
-20.0
- 10.0
> -10.0
-20.021: is 22: 00 22:15 22:30 22: is
<- Time (hours) -
20.0 T
(J 10.0
-:0. 0 U 11IL1f l
- 10.0
- 10.0
-20.021:11s 22: 00 22:5 IS22:30 22:15s
G-10

0 88/ 7/11 LLWAS SLotion=1O
I0. -7 -7-7-T-1
__ 10.0
E 0.0 -v
-10.0 1 ! 9 iIII
-20.0
- 10.0
-20.021:is 22: 00 22:1IS 22:30 22: is
<- Time (hours) -
20.0 9
(J 10.0
- 0.0 £
-10.0 *
20.0
> -10.0
-20.02 1:4-I 221:00 22:15S 22: 30 Z2: qS

8;3/ 7 /li LLWflS Sain
10.0
E 0.0A
D -10.0
-20.0
- 10.00~)
-10.0
-20.021:45 22:00 22:5 isZ2:.30 2I: 45
<- Time (hours) -
10.0 fS
L 10.0
-20.0 II
M 10.0
2:
0.0
:> -10.0
-20.0ZI:45 21: 00 21:5 2s2: 30 22:45

8 8/ 7/1 LLWPS SLotion=1?
E 0.0
-10.0
E_ 0.0
-10. 0
-20.0
10.0
LE.. 0.0
C-0.
> -10. 0
-20.0
D 10.0
-0.0 "
-0.0
C)G 13.

Appendix H: Dual Doppler Radar Low Resolution Analyses
These plots show horizontal wind vectors with radar reflectivity contoursoverlaid for 0.19, 4.69 and 7.69 km AGL (1.8, 6.3 and 9.3 km MSL). Xalld Y axis labels are in km east and north of the FL2 radar, respectively.The top line above each plot gives the date, time, altitude ACL andoverlay field. On the right are the contour levels (values followed by 's')and maximum field value (value followed by 'x'). A scale wind vectoris provided in the lower right hand corner. Relative minima ('L') andmaxima ('H') of the contoured field are indicated on the diagrams.
The analysis techniques used to produce these plots are described in thetext.
H- 1

LUJ M N Cr) (
~~~~cZ~. . . LO.. .. ~., 4 $ 4 4 4 4
1 4 4 ) 4 4 4 4 4 4 10
it : . . . . . . .Cr =~- * 44 4 4 4 4 4 4 4 4 4 1 k
x .
,crco
- - --------------. . . .
0--------------------------------- -- ~..,....
- a--- -- - -- -- -- -- - -- -- -- -... . . . . .
------------ I -------
-- - - -0--------------.~ - ... .. CD-C= -- - - --. .= (.
CD) (f .....-)
-- -- - --- -- ......... .[~ ***~*- , * - ---------- --
--- Af: ........... o >:-J . . .. .5 .. . . . . .t . .. . .
J) . .. . . . . ..
~ ~ u
C) m
- A *v" "p - i (0 - o IN (
(O rL( - - .-
CC)). (=

CD C L ;U -UJi -- NC' CO)Dj C:)I I ii 11 ii 1 1 11 1 I I 111
co0M C)~
6 . V
(Yn
oT 0 ff
IJCC)
C))
t) If fA f f
-o ffC/ Of
f ffff
Z jL N
- U) CO U) Cr) CO >L~ LL - - -
ZD t q t

C') C) CD Cl C) C) X
0;I N C MM
CT)
c.c\
0*0
0I 0-
z0
z CUJ
0
U- , ,
0- ft f f >:
-
I co
-n uP - ... r

(0: 0 0u0
0 ) -0 -- 4 C)V
0 -- - -. . ~ .a . a ... . . .
------------- 4 4
OX
0c --- - ------ .... . ... 4. .j
OY j .... L--- ---- ------- ........
z- - -- - C-- -6 .-.
-- -- - -- ...
- ~ . .A-..a.., .v............... -- - ......... . 04
- .....................
C5. - - - - - :----.--- - .a - v. $f j9% j
N 0 ... -.......................
W_) -- - - - -

CD CA CA CA CA 0A )
(.D 6 L( 6 O ULf)L
-L 0 7 N
I ).0 f
>< f-
9fff
C) . .N
- ) A
.( 9J
fo t
Cf) C'J N - -
UW-)

0D 0 0U10 0 0
0 ) C) 0 N(DC
-j - .(j M M
coo
)
(0
r
CO~)
z
-Z
OC)VI L) w
UO 0)
0 _j ), 4J4......
L ) 0J 1.
V) _j)F)" xqj
f. WRv7r00f A f
(Y*) - a) c-cm - ) t ULOr) lj (N

0 0 0 00( 0 0
N~J C: f i l I I I 'L..1 1' I)~ II '11 1 * * I I I I J /\
0 ------. ppi.a)
0V4 1P4 . 4 . ~ ) 1 4E44
cr-- - -- - - - - - - - - a - - - -
- - - - - - ::. :: : : ..................................... : :: : :
-- - : -
: : : - . . ..
: . . 0
S- -5 - -t -5 - - - - -. . . . . ., j .. . .
......... ..-.
z C ) . ... . . . a a~ . . . .. .-
C;- -- - - - -e a - -a -
~a................. IL
-JLL
(NJ,
-~~~ ~~~~ . . . . . .a.. .** W ..~. .. .f* .
- . .. . . . . . . . .., a .
A~. )

0
OC)Io
~0
.xfN~f~~ PP t P Ps, WPp Iittq 1 t
_N .
i Nk
f to f f t f t % # NN
f f) N ff tI 0 0) N PI 0V f .f0~ t N -f -w f -Off
- Z 0f f 4 A

0 00 0 0 xf
0 D C)0 C C "
0
(.0;
x00F
0 0
II 0
- -
z-J
M 0-C)
0OA)
NO Io 401"rCC) - p
LWr

C) ) ) ) o r-
--- - -- --
II - - --------- - . . . . ...........
cr .. . .- ,D*
.....* ...... ... .. , o . . .
x .. . . .. . .
-- - - - - - - ------------
---------- - ------- . . . . . . . ..
aa.....
It ~ ~ ------ - --- .aaaaaaaaaaaaaaaaaaaaaaaaaaaa ...... . ..
*~~-- - ----~f --- --- -- ..a ~ .....a. . . . .. . . . . . . . .
r a fl ~ -:::o-
-~~~~~. . . . L A A . . - -aa J*J)Z~~~~~. ...........~a.... .99~AAAA..........
0 A 5",A SA . .9 OD .... ()4-.j. ..L ,) CDZa7*AaA
Lr CD U)- - - - - AA AA A . . .- .
LO
LI A
If) ) 0 0 ' P Os A A imp A P
00i
CO Co
WAW

N -1- (Nr)(r) (rrC:0
c'
fit i f I p 0 p
t(0
0l0
U- Z '
C) V) 4. 1 , f
r) q~ j -
I> A ~

CD Ql 0f C) 0
LU - - (\j (2 11(-1(
t C4 r 1 r1r1-r-11T f1I I I II I III II 11 j ---- l l ] I if 1 11 i I r:
m
*C)
zcr
C'6
C)
C'
z i C '
ID6 LU
D 2
D PP)U) CP---
CO) >. III'IN
U)
WIW
LO U

C) CD (D CZ) CD C) C)
LL CC) rI) 5, F
N* VF F T F T -1 TTFTT 77TY: iIT T7-rT-r-
CI . , . , 4 4
............................
: : : . . . . . - C
H-- --------- -------- --- --- - - -~-
CC) ~
- ... .. . . .-
LL . L- -
(~~~ -_-t-,-qA .
_t- Z . . . . . . . LCD .-
LL- - -
CDJ
co~ --j..A. f,-~ 44t. -A y
CC) iIw
CC)4 LL C ;
CC) r CY ) > I)-Crf i
T
cWc

0 x NC C C C C!.0
C0 DLnC o nO
IIcc
If) x%
C:)
-o-
z ) I N f
'I ) Wt f

0 C> 0O0 0 0
LLU ~~~cJrm
CDO CIT
Cr,a) X
to
a.>
U Z L
OC)
If, LULrH 0CY)4
No
-O 0L- r- I~ I I. I If (?) .
f0n r,,J tjJ -r - 1--
CE WA~ A

tntoQoDof
LLU
(= - -- .. .. . .. . .. .... .... 1
............. A..........9..
- - - - - - -- - - - -- -. . .. . . . . . .
----------------- - -- 9 9
X- - -0--------------.-A .. . ~. - -. .. .. ... : : .
X - - - - - I - -- 1 1 . . . . . . 1 : - ... . ... .
- - - .- - - - --
-~~ ~ ~ ----
AO, -- - - - -
z .1fm ~ ~ ~ ...... j

0~ CD 0 0 0 0 rN
N J - -II I T II I
mcO C ) c o
II I
. ... ... . t t .,
F 9,,. .0
t .'C) fO It I off$F ffFF.
LJ - Z ' ''
f 4 Lj7I
AY

LO Cl U' U) Cl U') C'
ID CD
-a))
><
)
C; r0
z C
CDD
- - L * U
f f
0
04... - - - - - . ~ ' - - -)
lkr , .
o - p p
-Y a)c-i-)~~ ~~ uJ C ~)

0 D U- .. LO
.s.. C a3
C) .e4) f f f f s a ..... . . .
-- - - -- - -----. tit
O~ ~~~~ .aa .. .~WA ..~ 9 ~ D . . .a
-o -- - --- - .- $ p , N f P N -$ -a - - --
co - -- - ~ -f w. u1
e9 '9
e\Jj
9 9- -. -.,,, a a 9W9* 99V ~ L
W))

0 n000 0 00
f II
. . . . . ... . i q lt o
tt.l
.. . . .. .p I
rj ,,'4R) t f
0W. v
%. V, W. kr II
If) tf N It I

0~ ~ 0 0U0 0 0 xC)i -- N 0 0 0 w
C)~~ 6 C
CT)
x I~
((0
~ o '-~- C)
C00C).
z )Flo03C
Z) *N- 0 0. .. . .N
NC0)
0Li
ODN0 .--. ~
Nr
aY) P, N
0
C) N - - -
cr WAI A

0 tn J 1
00
N.n
Xi -- - -- -- -. -A-
060)
~~ . . . . .. .An f .
z z L>2n
c r~ j -4 14 - 4 , -

uLJ M M Mcr
CO 0
X* It)
CY ) t4
C)A ff0
0
0( u.J
Z~~I - Lsf %f
)o $ 10/1 8 U I
0.-(It
0
mo -, 'k 'k Iim -C i. Y
f. CN J N - It -I
Lr)~~ ~ ~ ~ ~ f A

0 00 ODOLA
C) O A L O Acc)_ _ _ _ _ _ _ _ _ _ _ _ _ _
CD.0i iil l 11111111 iili ii ~i hI (,
a)
r~
C A
C; 0-
C(f)
IN -
r-
0
N 00
r CA - f. N A ( .) N L O
fl) N - - - - .,
)F~o, -- 4fj

0 / U0 U (n (A (A (A (A 0
LU ------ ~fl~
-------------------------------------. .', < p*
---------------.-
m-- - - .-C~ - - - - -
- ---- - - - - - -- -~- - *
p0 p 0 p9 t ttf tP f 9 f ~,, .
r~~~~F fff f. 0 .
ff t.. f ~ 5 f ff f . . . . . .
f f t t i f f. .. t R*PA f~f p pN f
f f A A A L ' PL 'J$
t- fff
LD f -
C!)I -~ 'v- - - - -
r~j f .p

L(~~~ 0U0~L00
r'Jco
- 0 cff\
I0 f f
Vo ,
0 x
LU A~ t .)U
0 P.0 RIW
0).
Cr) CA N)N L 1 ) m *.LA C) \ - - -
a:uMA

oA oA o (n oA oA x
C)f 0CD0 0 0 "
NJ C:)eNc~c~
0 C1-
0) C)
I'I
C) 0-z0
co.0)
co00
00II 0i
ttq
ftU.
CC)Q:
f f. f
IF t-OVIl q
N t t i t f .. .- AN
CD LLi
00 Pi AACD)~f~
N r: CN~
CC W)

LJ (" 'Yl' Cr'j CD 77-1'm
9#tt~
m~-*9 f
\XI(.Ik a a a,
c f f9 f\
00
A
Q 14Z f~ P P A~
9 '' f t 9f 9
A pCD . ;
-~ k\ 9 It t t t?/.-
CT q 9r 9,t *...A -
--- *f ---ACD
Q0 W LLLJLLLLI.LCC) -CD- ~ (1 - C~ - i '' *~
enFI-cr~

U.) I) tnV.) ) If) 0I X
CD 0 D 0 Lf l 0 Lf \j
LU - - ' (NJ m~ ('1 Cr
x 0f
f f CC)
Po 00 -- ., a~s' --
mpV, I / Pl P. fa P, )r.( f.$
C) .*~A .~ S~Z~~ aF L
A1Xo;71 Z ', ' a4i f
Oz 0 /f t ~ fL t
m f
co f )! q I L attt
~~~~-~~ . . .b - .* .' - . .5 . . S ai.C ' ' ' 1
I
N~ ~~ ~ ~~~~~~ ~ ~a.,,, * ~ .. *aa t N
f f
CC) f A.-a 11 *tt;tIs,,X.
CD ~~.
cr) r. r- n N r - C--> If r
U) r~ r~j - -

0C)CDC 000 CL
0
LtU')
C\J
C)
0) z -t 0-O
c'JJ
) (f)
--N ui "*wa
0L!- t A
A X. A,-.
N CC) - .
- -
-(""
0 I XN
C- 0) N pf f ) N iCC) 0' . . . .
t f 00 A p 1 0

i) CD.9
-- -.- N
C5 J
CD 99* FA f ~ .. ,9
r, 4 f I)f
t f rr -{' ,r p
-cr :) ;: f '4 ±.. t-.. 0. $ f 4 . . . 7 4 -.
00. wt f944'WN
f' t -; :- -- , AI >&.I9 r- ~ )A~~.CQ A9 4 9449/f-. .. * ~ ~ ~ 9' 9 .%
~9.) ~ .$ ' ~ * 94 9 9 ~~IV~. * -* . 'I,, ,, ..- ~ ~ .99 .9 f A
CC' U-. J 1l I L IJ I 1 LIiAi .L..L....L.L.L.LJCID CDm
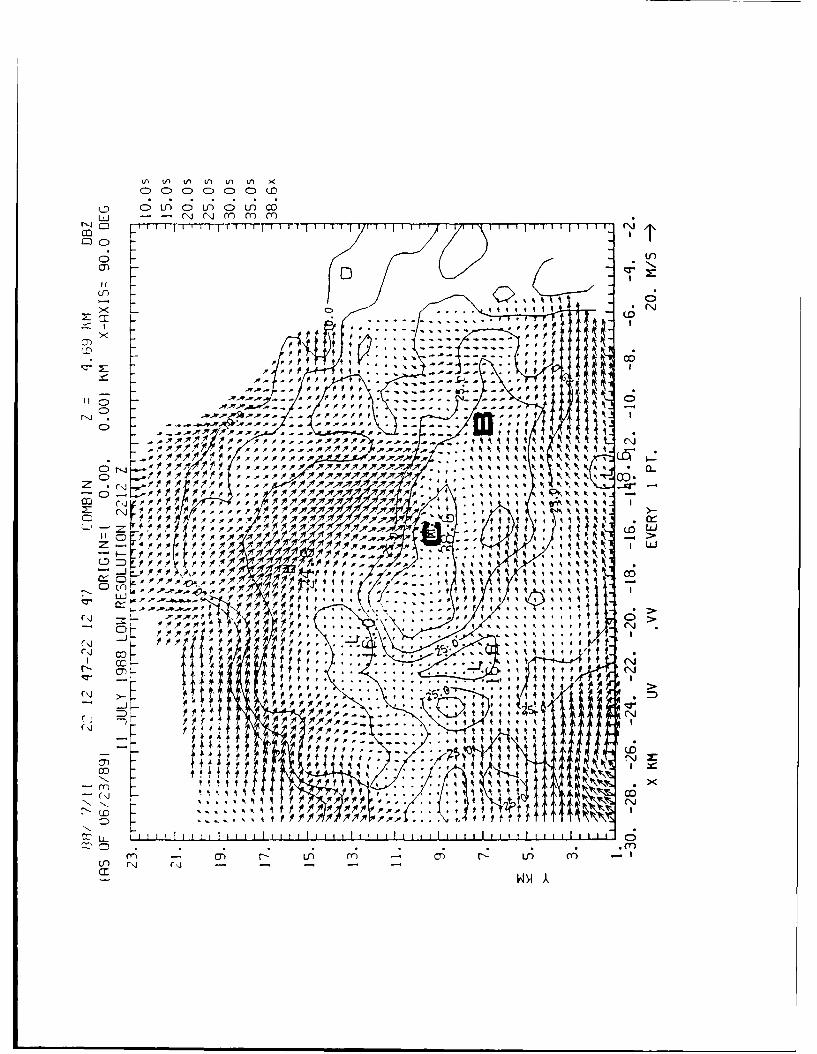
C: C (I) If) C >C0 0 0 0 0 m
U3 0~~LO
LU -- rJ~ mLO
CC)
ii t
o~ t .
L -L-p-pf Mffz 1) ' k'
o -'V - Ii'
Z' 7 Lf/
(C=:: ccL.
c'J >-q
I- tv 1f
f f ~"f . .. .. . . &. . t
CP)~~~ 0N (
t f /H

CDl4cn
C" N,
CD
CT)
lql
z
z CM
CD 4
GL
OD'
ODh 4 ,,' E$jt
Y ) - Ar-tPm- a ~- O O~00P of Cl1 -
N, w,,sFF f A ppf

Ln 0 0 0 n
tIJtl DA H1
>< -- -*A- - -A $
-
a : , 1 0.. . . . . . ."
.- .- .n .n .- .m . .b .
0-)
t~~N .0f o

L~OLAOU1OL~n
C) C)C DC DC
Nj C3
M~ (T
LO t t '1
C) s..W A .p*'..*.. A
At PROP P '.pm0 k tAA A A A It I
t f i t -
i* . .~ .$ t 1f 14 It I
LA z A' As,# 10 X st tP~ I* t I I I It it *
$9O 'k, I q .T. .
f f t . F ... t
07 f fF
-t f
i-i 01 f
A A f t f
"N
000
cv.) ~~~~a - u)N L .) N L v)CAr'j rq.
cr WMA

C,, c.l C) C) CD~ C4
Li.J - -,N N (Y.) (Y)t-04II I I F j > C: '- ~ T' T -- rTT CNj
T~
CF)
CFD
(0i
NE ~*~-~CO
0 "A,-. -
rslj -~. , Of~
0
LrLU
N®r
0-
N Lo
PP
CO;, (= .. mm U (
0or ~a:4

LD C) U) C) U')LLJ ,Nkt t I a lil.
CC) r f I 'ICD C:)
LO
I P P, f 0A A A
A A A A p f FC;
X L6m CF . ..... P A A r,I A A vj -x .......... I ;
(x;t P f t f I )o f
C:) C;f t
C)A
I t fc: t f f f fC; F o I t A A o-A .0 Xz t AOAc)
f f
+ LC) UJCD
f f f f 0,4 -1'Aw 7 uj
ZD_QF
CC)CD (f)
uj
IN 'Ir >CD f
('j t f f fco01) t AA X )f
0 A.A 10 )f At i I f t f )VIA 0q q 9 1 f I >
v IV WIN0 t P )p 10 )o A.P X
AA, A f )l 10 IWCIA A AAA A
A 'O.W.0A A 0 A
mA p p f 0 q
'IV Xm
- - - - - - - - - - - - - - pdrIffC:) ."AAA, IN IW
00 LLCO cn
rr) CT) r- Lf) cr;cr
wm

LU - -- j N ( m m r
.1f /
)Off-Y . .......- 11:.:~
, ), 'o 'N* o
z -- I ~
z
f t~ ti tt
U) 44
: ICDco-C'-.. ..
=) :N - - .,
fI tM I

0) C)Cl
-L - (,j ('.I (,j
CD
cci
0 1
x~
r~r
M: (Y) -yO
* -
-- -- A O ICD ~ . -r..
7UttJ 1 10 zo~
i-I:~~~~ -- ;;w;;ID~~~~~~~~ An 14~T ,, $P 9F// o/~< a.
CD
N cow)~ ~ i>
ODi f #*A
-j
CD 4CC)
Af f IVA-N
z- I-x f,* tf ,, r r
CO; - r- N -In cr-i r- CT) Nmn CT) Nj (j - - -
i W)4 A,

0, 0 n X
C)C)C)C)4*
C) It
0Y)
00
-I-q
z C
0Al~x. A 'S0
a:))
N -j fo X A
0Op
(.D xj N - -pp-
m:N

V) Ln LO tn ??\ 'n x
,: cz, 1 C'! \CC) L C) Lr) Lo
LL) - r1i N r w .AAA- .. ff4-r'J CD -r7-rTy 1, 1, 1- f; L- O; , M .1 t f Im it 4 1 1 f , , o,
Pf f f t 1 1, lk 0jo )o )v $ )o f 0 f f f % IL V ,
N "OPIO),Pfff t I 'A lkC)') JO f 0 f f
k 1, C;
lkcr- t
I q , fX . . . . . . t i
f I
OD
t I
f f f f tCD
NJC)
_q:+
ef Ato
ff
C) ff ACY
C:)U z LLJ
I i fz LL)
Ct CD
r- CD Ln NLLJ "Iffof PF
CD C\jr'i -jCj 9 t 0 A I ACl) r\jco-
CD 'o ZDC\i ...-J.rj A 0 A
=zij
A A X
- - - - - - - - - - cor\j
C)
OD LL.CO CD CC)
C r LjV)
W)4

C) CD C) Cfl (r ) C
CD000
14J ------- ff
Co6
01C
C -- - - -- - o-I -4 -pftIq
t I
z 744fi - >.~
-o -t - .- F P 14 .. jo q 'iI t ,, I~~ITT ~ ~ ~ . 1 1w. rprr ' %- ,.t~ ". I * i
CD ff ,
0r. L i~ f% $w *.i f . . q
I .- I t~ f/$ f ' % -i f
00 -%pffft
f AlN: A~ -f ft
o Lo
N r- C
r) j N - -
a-WM

-j -j -) -j -j i .4 -j Ln )C
If If Ii If If If If If If I- If fI
CC
. . . . . .. . . . , 4 1 . f . 1 76 1
f at t tttf ~t taf I ttI
3S t~ t ~ t a a a . .
(D --. . .~. . .. .P P .l a .a. .
.Z .~ . . . .' . .... k * p .P ......t
. . . . .. . . . . .. ,
ff 0 -f PP P p , p . .. .... . .
LLLi
C)0 - - - - -t -p A A A A A A A
CD >
-V -W~...V.A -, vF Pw w .0 C) *~...9.-
-ol'--F~-- W A A A X
LP... . .
CC O'J ( U)
( - WA H)A

LLO CD4
0 cJr)~- :-f---
C) m
* ------
C) ,
.... I O
C)---
C) -* -
-- 6
CD s- - -- - - - - - - - - - - - - - -
00*
0 -- - - I ------ , I ----------
CO - LL11 I, II1 11 1 111 1
(n Co(m0
WA"- .

Appendix I: Dual Doppler Radar High Resolution Analyses
These plots show hiorzontal wind] vectors with radar reflectivity, verticalvelocity arnd eaist--west F-factor contours overlaid for 0.19 kin AOL (1.8kin MISL). X and Y axis labels are in kin east and north of the FL2 radar,respectively. The l-op line above each plot gives the date, time, altitudeAG.L and ovwrlav field. (Disregard the title 'low resoluition' on the thirdline above the plots.) On the right are the contour levels (values followedby 's') and maximum field value (value followed by 'x'). A scale windvector is provi led in the lower right hand corner. Relative inininia ('L)and maxima ('H') of the contoured field are indicated on the diagrains.
The anialYsis techniques used to p~rodluce these plots are described in thetext.

C, U; , >
LfL C)
449 44
I ' 4k -1
4 4* ** 4
. . . . .
. ... . . . . . . . .
.- .- . . . . . . . . . . , ~ t9... . . .. . . . . . . .. ..
-~~~ C) . .. . . .
(C .4 ~ , . . 4.. . . . 9................. 0
.D p .44 9 . . . . .. . .
- f t t f F p .' .' . .' .' 9 ' 9 . . . , i
CD . . .. . .' .' . . . .~ . . .
::D - - - - - - . . . .' .' .' .' . .9 C 4 A A A ~ A
CD - ' ' 9 9 ' 9 ~ ' P 4 A
CC) A A A
CD f A w w - - - - - -
w A A) A X

(n V) 0 (nC) - Cl C) CP
CD111 I I I I I 1 <
02 .ts , ,, . . . . . . .'
t *
CY . . . .~ . . .' .
A Ia
'Ij t~J. . qA. . P q It N .
rf~9j* a*T rf t tt t$~ t . *k
CD f
. .. . . . . . . . . . . . . . .
0C D ., t 9T . . . . .A*.A .
.. JC)' -.- -9 , 9 a 9 * A . W A A A J A j 4 7A-
-- -- A -1 f . ... . . . . .. . . P 0
CD -WA A -V, t.9f,
00 -lw V.OUq. vA .0 0 A A. - A X- 000 .~ . .. .. . . m AP 'N A A A A A XA
I'. . A .* . . .I oAA
N 0~~~. 0r 0
w X o ff , C(AmI - "'
co -W"I

-i 4i i -J 4i 4i 4i 41 0m, m-U)- U, Ul 0 U, M L
C3D r- r -w± Mn N -M C:
~ A? 7'7 )~ I' - . *. . . . . . . . .
.F t f* * * * t f '
XI~.uAA,o ~ ~ ~ ~ ~ ~ ~ ~ I It$............ , * W, ~ t f ~..
C3j* .uAA.* *...............,,to )r 14 )f A
. .\ . . . . . . . , % v*
S 9 . . . . . . . . . . . . " 1 9 t f f f I* i P lk..
C; i -W w -W . . . . . . # . . . .. . ..W . .* A A A .A
Z ~ . . . * . . . . .I............ 1 A .'A.A.A. AAA
Z - 4 - -- - q . ... . .$ . . . . AAI A$ r
- L)(NJ >. t~..~ A A t p f f9 f f I p I p f ). p F F AAAFP
wJ 0 F 1 f t f f t f P 0 f 0 f 0 F0 .' - - .-F - - - -
- w$~ q * # P W A A A A A. w A A
C* 00 ~. o. A A w 0 A A $- C6 00 A AX-1 F .........
0 0 0 0 0j I0
(t)f C **
OD W

0 C t) CD ( l x J 0 C C .0 ILD J 0 NJ ,1' (D tOD 0 (J
ILL I I I I I I I I I ICD i I I I I I F I I I f IF I I I I I I I I I I I I I I I I I I I I I I I I I I I I I I I I I I I I IF
11,0 ,--" C:/tAJJ J-o-'- - -- .'- . .. .. .v- "., o..-;'"
,, :::::: ::::::::::: , (. ..-. , ....... ", : .. .....---- ,- ,-.--, ." ' -- ,
g× -' " ,
7Y - -')C" r ' - -- 0-- - ....
---- - ---- -
/ (P - ,. -. ,- -
° " -- ",--,,---- ......... . . .
", '" ' -' I o° 0 0 ' ."
, .---,-,-. .
-- -- -- -- ---- C
CO ---- ------- -- - , ,
a ll " - " ..j .CCC
I N 0--------(.
C)A LK)'
0z j . ... , ,5 0rl *CJ , " -- " . °' -
" cj .-- . . .-. I' " , - . ., . - '
i"'-9 7 " -i--i~
CO 0
-- . --- c, ,.... ,...: ,. - ...
* .j c ' ' ,
,U - -- .. , . _
(NJ >.. - ....
C - -- . - -° - , o -. ::
Co -
-- W A A

m F*r t t
DOi 14.t CDA o# 4 1 ddfN i
lk '
If ~ FW F P p F $ F $ . . . . . . .
CO . .. . . .
.-. . . . . . .P . . .~k . . .
* w .jo )U p o-
Ptt
O~ A~w P . . . . . . . t t ' . C4
.t . .
C O o . . .. . . . , P t If I t ~ t4 p4 p ,
z ww w", - ---- ' , t t t 't f .)
Of CDn w--r -w "CV t t q .
001
-) (o
00
0 0 .....
'v' o o P p
VpI AA

C. cl "
X . . .. . .. . .
or f~4 ,, P :94 f If f0
. . I
o .*A A . . k'
. . . . . . .
Cl p . . . .A' . . * ~~R' . .
U)~~ t f'. fCO~ ~~~ .±. . . . . -.II . . . .
C) . 0 .A 1 4 9 4 1 -Z ~ ~~~ ~ ~ ~ .=) .. ,.*.A . .W .. . f0 1pppf4 # - 4 fU) f t f f. , .. *f , , . . 1
C if i.. .. . . . .u .W .- A . .A .
U, t -f I t

J .J . J . . .J .J J.J 4f (' In In I
C) w LO 9. J C w w 0 r' (.D C1 D w'-C
( ----- --- 0 0 000----, -Lii I I I I I I I I I I II I I I I 1 1 i I I I I [ I I I I
o ,, -.,-..> :- .' ,-. -- - - -:'4 . - - - -
S- - -.-.- - - - . . - ,-I -. *3
----- ---- ----- O:.----- -- . / ,,----
-- --- 2 0-r7,', , . ". • ,- --*' , 33 3 -- 3 -"- -" "- -I .,
) " .. . . "-" ",:;- ,... .. . , ,', ,*.
3-----------------~
- ---------- 3
0, • ,-----------
/ ...... - .200
3i 0
.-.r,1. J_/ , "*I.. .. , 33•., - -' .
F ' , , .- ,- - 3 -z- 1-- -",,3,* . "---- *,. 3 . - ", -I-
.-- --- , '- "- - -- 3-- 'I C -... , / '- .. .. . . . . .
-- E.. ....... "... . -~ - \ -",b ', , , 3 '-
-. -- ....... -. -- \ i I ',3• ".
3:: .. .. [, I \3/ -' ^, 1- - . ',^3 , 33..i ,,,, , 3
/" , 03 o .. .. . ," / 3
•- ,* ,,3. ;" ,,S
LI ..,z-------------------'---..3,
3)F I, II ,, , Ii -i 3 0 - %
OD ,-I ,3CC CD~JI 3-D
(n1 >C - ' ' *,* _ _Cc3WA33

0 (0
.0 .0 . . . . .
0 o *
CD .~ .0. .
0 Z ..... I, .j . cm 'L'J
0.1 ,F ..
L y) - -~ - --
U') 19 -U,..*
(/I o /0 f- I IU) A v /I /I /1 /5 A A
(NJ A(N o *- A AX
00 01 0 0
O - - CN 9

-. -1 -1 -1 -.1 -1 -. .12 ,.,' . . . . . . . . .
"-' " V1 ?' P P p p . . . .. .p *-
- >o .,.'' ,- :; , ; , ,•j T' V.f, , .,.,
.,.......,,, ................... ) W A A ,. .. . . . . . ..
0 ,,,*" " . . . . . " " " "" '" ' ' ' . . . . , I I
,z .. -. ........... ... ._4.,_. ,;,-,.,. .. .. ,, ,4
t
144 t
- z ~ ~ ~ - . . . . . . . . .5 . . .
- I ll . . .a .a . .. l..l..l..l . l.t. C
S-. . .. . .- . . I- -
-- N a ' £ .a -
w ~ w1 . .. i
if CD fp ft ft Ar- fe g' (A f. . . . .P . . .
Of A AA
0
N 0
0 0 c 4r 1 "
14 0 -4A/ 14' 0t

0w (zD C (- --- -0 00 0 : 00 C)--
C3 f I I I I I I II
• o -- ---- ...... ", ,- - - .-
a)...... . ........ .. .--'""-':-i''::: ::--'' ,.-....."-,." -::'
,- -----------
X t
II -- -- - .-- ,," - .- ,
o* . " '- - ,'-,- ,. I , - .- ,-, ,, ' .. .. . . . . .I - t
,- - , * .. . . .... 0 ,X(
O, X ,-------.-it --. Zoo
) m
- j '
C) - O-S - , I ,, ,
C --- -.
• , - . ,, , .- "- -, 0. .
'0 3o --------.-
0 'C~\! ~ .4O -
0 1 - 00-
-- , 00 . .
*-* I--14. S -----I' - --- - - -- --
------ -- -------
II * I cr C -
I I SW I -A

0LJ -u r m mC
NJf CD)111! 411PIF-mf4
'0)
zX
- - t /I;-,~
>,<c-n
--A-A
'ILI ~ ~Nu:l
0
c~c o 0 06(ICD~-0 NC
a:- fl flW

LD rrJ-~- e'i r~- c'q eje l
M I%4 j V r 1 4
(7)j4 ? A.,- ,Y\N
XC)
;o 4 t t W f kAZ *o A~ * 4 ;# f4* f~ t f %. . . . ** -
- ) 0 v .0 ff - A 0 f .~ ...
o )r A , .P A A . . * . . . .
C; C) 6N' . 1 t. ..... . . . . 4b
" W-I 0 .d V. . . . A $ *1 .y . ... . .* . .. OF
CLu Ap 'T W 'm.~ A A I
- .A .t . .. ... APJ
- ,~ "V I-. ----
4 ,0 >
o >.
- ~ ~ ~ ~ ~ ~ r V - .At$$ VF$
Y.)

-j ..j .j .. J . j . j . j . j . j .j Un (o Uo ( t x
LLO 1a / 0 -
X ---- ---0c. :.::- , *
C) ---- - --- ---- - -P - '-
0 00L' l
CDa
C)a PatC-
000
#IN0
0 '.?
'aO CD 0 )C)C
(n Ma f-bc a
WA Aa

LI) V) LM~ Lo tLn V, X
LU
0~U)
CJ
c4.-
'w
C* /*/4 , I A - - OvL';af ';p -w-V'... - '~
C-
crJ - W

P~- tP !Pl ! in~ P Lf P L P (7C
I r I
t N It~j
O'- ---- --
6,2 ~A AA .4 k
C) --. ~ t C,C- ,.- AA
m~~r )~ . A '- ' '
CD"L I LJ jS.
C) ~~ ~ A - A ~ '3j71 A
C) 21~~~,9* . . A - A t- ZD ' -*AA
c~ : AvA'~.9 ~ 9A 9 4 ~ A Af , ~ -
, j 4- (Di 9A, - *~A. * A,
/I A -2 .w'-W
- C
CC) /I-f C).WI A

C) mD 'O 17 rNJ C) m D C7, fT (J C) (NJ mr'O C C) (Nj fo
I II C)CD I I T I I T I I I I I I If I I I - =
Ecri
C) 00b l
CDD
--- -- -- -- -- C
Q Co - ---- -- -----
NJ ) -- -- - -- -- - -- -- -- ZOO
I CD
30 C)C) CDCDrC
Lo >f 00 *I Oa,- -- -- W4

V, 0 (P, (P (P
C) Cw.ci1f
fY
C -1H 4%(n
1a bCl
~T- ITr1Z A- e

~F) LO U- f U- " U L
~ K ~ .C A,
(Y) (
vn v ly II -- "-
)< :)
2c p
~ C)
Z~ el
C) -F -c'
CD (j 71 I 1I,%c $ *r-
C' '-Z 1 ~ 1 ~A~ L,
I C) -1/ A A ~ p p ~, :
p Y1L/LAA /A)
If) U
* '' ,
Lr
U)-,2 , Af
CC)A ~~,%,r i,
C) 0 A'I
CO CDC C) CD~
(n (I;- I -
a:)

C-) CO CD tv (,'j CD co (D i CD (NJ 1 Lor C O C) (\j
LI.J I -r - - - - - 7TI- I T I I
77
C0) ID* ~
---------
-- ---- ----
"CD - D
0,,00CD
----------
CD -- 0C
:D C)
Cr CD- ~ CCDCD-
CD
CD '
ODC
CDA -------- - :----- -----
00 j - 02-
CD N
f) >..Lf
E W~l A

U')- I L I :
LLZ - -.kA
I--
CD
A-,
CD 7, *
A LU
CD, * 1C
AA A V ~"4rn

-) -1 -j -t -j -j j -j (n x
LP LP) Lfl Ll U- LP ') Ul U-) U)
UD1 C) C 'jr
C; 4f;1- / '/ ~ iI~ \A\
to T'I )
X . . . .'.4
rjX
C0-'A- / f l q 4
c.~ 9fl - f- -
-A Al A''~
C D ,
CD 4 4 -A--- ,. -.
00cCID
o:)LL~~~~-, r jAt i 1 j iLLJ L J L L
0 (9 Q
77 ~ ~ \ 7W7" -

.Ji -J ..I . 4 .4 . 4 . f (f) L (n (jn v) oP x
LUJ I I I f I C)
0 %
OC:)
c0- KK
C) C
0
-J
0
-o
00
LnC) 0CD00
CC) U r cOD -) Cp C C )C)C

LJ J'(N (CD.
CT'))
'CD
C A
(Je , ol A(
lk)
J,
gy A, A

a-C)
FC
r'j
6 C DC)3
liti
((\J
LD)
C)
a-ii
Cp
C))
0 ) 000 -D 0-)
toY Ck

CD CC) QD 'Zi C :)c'c co (D r'.J (\j (D c n coT (D CC ) (.0 OD a:)r\! C'J -- - -: C
LLJ I I I I I I C 0
-7 -T -T -r-7- I I I I I I I I I I I f T I
/1
(D(
C> ----
004.
z 6 C- It
CDl - ----
LLJ 90
-j I--
--- -- - - -
O-i C)--------
CY- - ic
r- j T--,-i- --- ------ --- ----- ~
00
7- - I7
WAA

Appendix J: Dual Doppler Radar Vertical Cross-sections
These plots show vertical cross-sections of radar data along the lines
indicated on the plots in Appendix H. The plotted wind vectors represent
the horizontal and vertical components within the displayed plane. X and
Y axis labels are in kin east from the centerpoint of the cross-section,
and the altitude AGL in kni, respectively. The top line above each plot
gives the date, time, and overlay field. On the right are the contour levels
(values followed by 's') and maxiuinin field value (value followed by 'x').
A scale wind vector is provided in the lower right hand corner. Relative
minima ('L') and maxima ('1-') for the contoured field are indicated on the
diagrams.
The analysis techniques used to produce these plots are described in the
text..
J-1

0 0 0 0 0 0 (x
N j I
6 . 0 L
0 xCx
It))
00 1.0 o C 11) 0
W~A Z

0L * ~ (\ M0f
M:co
C
t t* . N
OO
zS' Sk k t A -
CD*
(0 co f 10 -w) Z-

0
C:)
0
C;U
NN
CC L6~) N

(.D L.A L LA L LA )
Li- flYU1OU r)
CD 0
o-
Cl f
CD L
-
c
'p ~ .J
C;>
NL

Cr Cn C ~UC Cla*
C c, .nc n
CZ) IT I~ I
c) it
T< t t * *
CC00
>- C9 W
5 & .C 1i ~ r c .
a: tz0

C) ) C) (D A U0 (D
0 ou ou V; r-:
0
IC
(IIlk
It'
0 9
0 l
CDf t - -
00
0
(n) 0 r- (.6 U V: (Yl; N -WA z

((D 0f0 C)0 C 00
U,10,
o 0% 0 9
z0 %
z ~LU
IN
r-u,0z
0 * 0* 0
NJ Q -~ D U
CID

00000 0 0 0
00C' .. LO
o -
IIO:
S-) .. .
U;-
C)
f0 u
r 3) N
w~I z

0 0 000
00 0 04
(Ni N M Mf
0 C3O~ N
-) 9 4
co(A;
x0)
IL0 P -
0A
110
0 C9 . . .
0L
N
0n u
LL
& u f A
UlM CZ

0 00 L OUnQU1QLO
LfL
*C
x
M " C
I
C) x )®rat
CD 00
0) e:: C
- - - (N
CD .

C) C 00C C 0 00 CDN
J Dco
S F L
o or ~
0
Ilk It qI
C)i
C)
zz
N l -~ .
C:)
00
N
S 5 S6
I- ~O u~ ~ N -2
W)4 Z

0
LL N M M
co~
7 ow0,
~LO
00
If C # p p . 0
>-C9 ~ N ( A
C) C W4 0Z

000C)~~~ .0 0 C)00
o LPPNJ , : tm I~
C3 C)
X qt 0 o, p p p C
of C$)$
C) .. . . . .~ t .~ F $ P F
o I F F
0 0
00p tr CD
4 It 04 it
t~ If
NO L
CD() "rZP l ~fun 0cr.WA

C) 0 (D D C)0 C
-- I NN mf mO 114 d
c -0II f
X Pt7
- $1
ca - .a
CD ' , . .
-:CDI~P * ' . Fo a f . .
It r
cu-i
oIto
cci
-,
(fI C) CJ N- LOi )Ji r C N -
cc W)4 Z
SU.S. GOVERNMENT PRINTINGOFPFICE. 1IWO- 7 1 7- 0 00 -0 3 955
Related Documents