Doctoral Thesis Spectroscopic Study on Enhancement of Water- Window X-ray Radiation Emitted from Laser- Produced Gold Plasmas (レーザー生成金プラズマからの水の窓域X線放射増大に関する分光研究) JOHN Christian Graduate School of Engineering Department of Mechanical Science and Engineering Hiroshima University September 2020

Welcome message from author
This document is posted to help you gain knowledge. Please leave a comment to let me know what you think about it! Share it to your friends and learn new things together.
Transcript
Doctoral Thesis
Spectroscopic Study on Enhancement of Water-Window X-ray Radiation Emitted from Laser-
Produced Gold Plasmas
(レーザー生成金プラズマからの水の窓域X線放射増大に関する分光研究)
JOHN Christian
Graduate School of Engineering Department of Mechanical Science and Engineering
Hiroshima University
September 2020


Spectroscopic Study on Enhancement of Water-Window X-ray Radiation Emitted from Laser-
Produced Gold Plasmas
(レーザー生成金プラズマからの水の窓域X線放射増大に関する分光研究)
Hiroshima University Graduate School of Engineering
Dissertation
Submitted to the Department of Mechanical Science and Engineering in Partial Fulfillment of the Requirements
for the Degree of
Doctor of Engineering
学位取得年月 2020年9月 JOHN Christian

iv
v
PREFACE
X-ray microscopy has attracted great attentions since it allows for observation of the inner structure of materials and of biological cells. In particular, water-window (WW) soft X-ray (wavelength: 2.3-4.4 nm) having drastic change of transmission between carbon and water – the main constituents of living organisms –achieves a high imaging contrast. In order to observe an intact and vivid specimen with a high spatial resolution, a bright X-ray is required, whereas the blurring effects occurred in the specimen has to be suppressed by using nanosecond X-ray pulses. One of the candidates for intense and short X-ray pulse is laser-produced plasmas. However, the conversion efficiency from laser energy to X-ray is even weak (for WW X-ray wavelengths: ~1%), which hinders the realization of practical X-ray microscope.
Recently, it was found that the enhancement of WW soft X-rays from laser-produced gold plasmas was observed under N2 atmospheres. However, the laser used was 100-J class high-power laser, and the repetition rate was 3 hours/shot. In order to provide an affordable, tabletop X-ray microscope suitable to laboratory base experiments, a commercial joule-class, 10 Hz laser system would be preferable. The new finding on the X-ray enhancement and requirements for compact X-ray microscopes motivated to conduct more sophisticated experiment and simulation. The objectives of the present thesis research are as follows:
(1) Confirmation that this phenomenon occurs by a compact laser system, (2) Enhancement of X-ray yields and identification of the mechanism, (3) Installation of the various X-ray diagnostic apparatus and development of reliable
radiation hydrodynamics simulation code for Au plasma. The enhancement of WW soft X-rays emitted from Au laser plasmas under various
gaseous surroundings (N2, O2, Ne, He, Ar) was investigated. A gold slab target was irradiated with a Nd:YAG laser pulse (wavelength: 1064 nm, duration: 7 ns, energy: <1 J). Emission spectroscopy was carried out to measure the X-rays from Au plasmas. The results showed that with increasing N2 gas pressure the WW X-ray yields were also increased. Thus, the result observed by the high-power laser was reproduced by the low energy laser system. At 400-Pa N2 atmosphere, the yield became higher by 13 times than that in vacuum. Considering that this trend was obtained only in N2 atmospheres, thus the reason for this enhancement should be found in atomic structure attributed to the nitrogen atom/molecule.
In order to clarify the enhancement mechanism, the radiation hydrodynamics simulation was conducted to investigate plasma parameters. In addition, the flexible atomic code was employed to align the spectra from various charged Au ions. By considering the results obtained by the experiments and simulation data comprehensively, the underlying physical mechanism responsible for the increase was revealed. First, the photoionization of N 1s inner-
vi
shell electron by broadband X-rays created many Auger electrons because it’s cross section is very high (~1 Mbarn). The Auger electrons with quasi monochromatic energy of 360 eV caused state selective collisional excitations of 4d-4f and 4f-5g in Au21+ and Au22+ ions, and subsequent intense radiative decay resulted in the X-ray enhancement of 345-375 eV photons. Consequently, the energy down-conversion of hard X-ray could be main reason for the enhancement in WW soft X-ray.
For more comprehensive understanding of the enhancement mechanism and further intense X-ray emission, a sophisticated radiation hydrodynamics simulation code incorporated with reliable opacity data and N2 gas effects is necessary. Therefore, X-ray diagnostic tools were installed in a vacuum chamber to measure the spatiotemporal emission profile and X-ray spectra with a high dispersion, by which reliability of the simulation code was validated. A grazing incident spectrometer equipped with a toroidal mirror and flat field grating measured the spectral profile and provided 2D image of a given wavelength. A pinhole camera with thin foil filters observed direct X-ray images. In addition, the temporal evolution and emission energy of the laser plasma X-ray were determined by two Si detectors. On the other hand, 2D radiation hydrodynamics simulation (Star2D) for laser plasma was significantly improved and became applicable to Au laser plasmas. The experimental data were in excellent agreement with the simulation results. Thus, the development of the reliable laser plasma simulation code was successfully achieved.
The results obtained throughout this thesis absolutely contributes to development of a more intense, short pulse laser plasma X-ray radiation source, by which a compact, low cost X-ray microscope will be realized and provides a powerful tool for various scientific fields in near future.
vii
ACKNOWLEDGEMENT
First of all, I would like to express my sincere gratitude to my doctoral supervisor Prof. Namba for his continuous guidance throughout the course of my PhD study and also for the helpful advices on non-related topics. His patience and neutrality combined with immense knowledge and first-class experimental skill were always exemplary to students and scholars of all grades. He was the teacher that I have looked for, for so many years. This great relationship of student and master became only possible by the action of Prof. Endo, to whom I owe so much, was it he who established the connection in the first place and made my undertaking only possible. My sincere thank also goes to Prof. Johzaki, Prof. Sunahara, Prof. Kishimoto and Prof. Hasegawa, from whom I have learned much and received insightful comments and encouragement in experimental and theoretical regards. I also appreciated the kind support from Prof. Nishiyama, as he provided us with useful experimental equipment and methods. I further thank my fellows in our plasma science lab, Mr. Odagiri, Mr. Kakunaka, Mr. Matsumoto, Ms. Jang, Mr. Morishita, Ms. Yokoro, Mr. Yamaguchi, Mr. Oh, Mr. Cho, Mr. Murakami, Mr. Shinmori, and the technician Dr. Matsukado. The student support group around Mrs. Yamasaki and Mrs. Tani always provided me with kind and professional advice and helped me to deal with all the problems that come along in the daily life of a foreign student in Japan. Last but not least, I would like to thank my family, that they visited us from Germany as often as they could and sent us creative little presents from a distance for my loved ones throughout the three years of hard study. I further acknowledge the support that the family of my wife gave us since we came to Japan. My deepest gratitude and utmost admiration go to my children and my wife, as they endured the strict time of a frequently absent father, who became irascible over the years and had not much to offer. They provided me the base on which I could stand, even in difficult times of illness, stress, and defeat. I bow deeply in front of my children, of whom I have stolen so much time with their father and apologize for the absence for the sake of my great learning. I admire them, do they still smile at me and accept me as a father. And the heavy burden that I have imposed on the shoulders of my wife shall be released from now on and forever.

viii
On my quest for finding the truth What is an engineer? To those, who think the engineer is a better plumber: No, he is not. To those, who think the engineer is a theoretical artisan: How could that ever work? To those, who think the engineer is a substitute physicist: Far from it. To those, who think the engineer’s business is an evil mixture of bad architecture and non-working inventions: Not even close. To those, who respect the variety of education and personality, I can say: The engineer is a person who loves nature, calculations, and technology. He is an open-minded guy trying to get his head around the really complicated stuff that others do not even dream of! But most of all, he is someone who gets hands and brain painfully involved to paw the path to our future. – Christian –
ix
TABLE OF CONTENTS 1 INTRODUCTION .................................................................................................................................. 1
1.1 X-RAY AND X-RAY MICROSCOPE ................................................................................................................... 1 1.2 PLASMA X-RAY SOURCE .............................................................................................................................. 5
1.2.1 X-ray tubes .................................................................................................................................. 5 1.2.2 Pinch plasma ............................................................................................................................. 10 1.2.3 Electron-gun ............................................................................................................................. 13 1.2.4 Synchrotron radiation ............................................................................................................... 15 1.2.5 Laser plasma X-ray ................................................................................................................... 17
1.3 OBJECTIVES ............................................................................................................................................ 28 1.3.1 Requirements on soft X-ray source ........................................................................................... 29 1.3.2 State of the art compact LPP SXR-sources ................................................................................ 33
APPENDIX-I .................................................................................................................................................. 41
2 THEORETICAL FRAMEWORK ............................................................................................................. 53
2.1 OUTLINE OF THIS CHAPTER ........................................................................................................................ 53 2.2 RADIATION OF HOT DENSE PLASMA ............................................................................................................. 53
2.2.1 Definition of an ideal plasma .................................................................................................... 53 2.2.2 Thermodynamic equilibrium states .......................................................................................... 54 2.2.3 Collisional processes ................................................................................................................. 57 2.2.4 Radiative processes .................................................................................................................. 59 2.2.5 Line-broadening mechanisms ................................................................................................... 62 2.2.6 Unresolved transition-array ...................................................................................................... 63 2.2.7 Opacity ...................................................................................................................................... 66 2.2.8 Plasma models .......................................................................................................................... 68
2.3 LASER MATTER/PLASMA INTERACTION ......................................................................................................... 71 2.3.1 General remarks ....................................................................................................................... 71 2.3.2 Optical breakdown ................................................................................................................... 72 2.3.3 Plasma expansion ..................................................................................................................... 73 2.3.4 Plasma heating mechanisms .................................................................................................... 74 2.3.5 Electron temperature ................................................................................................................ 78
APPENDIX-II ................................................................................................................................................. 81
3 SOFT X-RAY ENHANCEMENT IN GAS ATMOSPHERES ......................................................................... 93
3.1 OUTLINE OF THIS CHAPTER ........................................................................................................................ 93 3.2 EXPERIMENTAL SETUP .............................................................................................................................. 95
3.2.1 Gas-filling .................................................................................................................................. 96 3.2.2 Calibration of spectral axis ....................................................................................................... 98
3.3 NUMERICAL SIMULATION .......................................................................................................................... 99 3.3.1 Star2D code .............................................................................................................................. 99 3.3.2 Ray-Tracing Method ............................................................................................................... 108
x
3.3.3 Collisional-Radiative Model .................................................................................................... 113 3.3.4 Flexible Atomic Code ............................................................................................................... 116
3.4 RESULTS AND DISCUSSION ....................................................................................................................... 117 3.4.1 Experimental results ............................................................................................................... 117 3.4.2 Simulation results ................................................................................................................... 126 3.4.3 Enhancement mechanism ....................................................................................................... 127
3.5 CONCLUSIONS ...................................................................................................................................... 132 APPENDIX-III .............................................................................................................................................. 133
4 ADVANCED DIAGNOSTIC METHODS................................................................................................ 141
4.1 OUTLINE OF THIS CHAPTER ...................................................................................................................... 141 4.2 EXPERIMENTAL SETUP ............................................................................................................................ 141
4.2.1 Overview ................................................................................................................................. 141 4.2.2 Non-diagnostic equipment ..................................................................................................... 143 4.2.3 Spatially resolved spectroscopy .............................................................................................. 146 4.2.4 Pinhole imaging ...................................................................................................................... 149 4.2.5 Photodetectors ....................................................................................................................... 153
4.3 EXPERIMENTAL RESULTS AND DISCUSSION .................................................................................................. 159 4.3.1 UTA and ionic stages .............................................................................................................. 159 4.3.2 Pinhole image ......................................................................................................................... 177 4.3.3 X-ray pulse duration and energy ............................................................................................. 181 4.3.4 Spatiotemporal behavior ........................................................................................................ 184 4.3.5 Emission profiles ..................................................................................................................... 186 4.3.6 Self-absorption........................................................................................................................ 187
4.4 SUMMARY COMPARISON ........................................................................................................................ 189 APPENDIX-IV .............................................................................................................................................. 191
5 SUMMARY ...................................................................................................................................... 205
APPENDIX-V ............................................................................................................................................. 207
Part I: Supplementary information ....................................................................................................... 207 Part II: Gaussian beams ........................................................................................................................ 214 Part III: Working in the lab .................................................................................................................... 222 Part IV: Useful charts and tables ........................................................................................................... 229
BIBLIOGRAPHY ......................................................................................................................................... 236


1
1 INTRODUCTION
1.1 X-ray and X-ray microscope
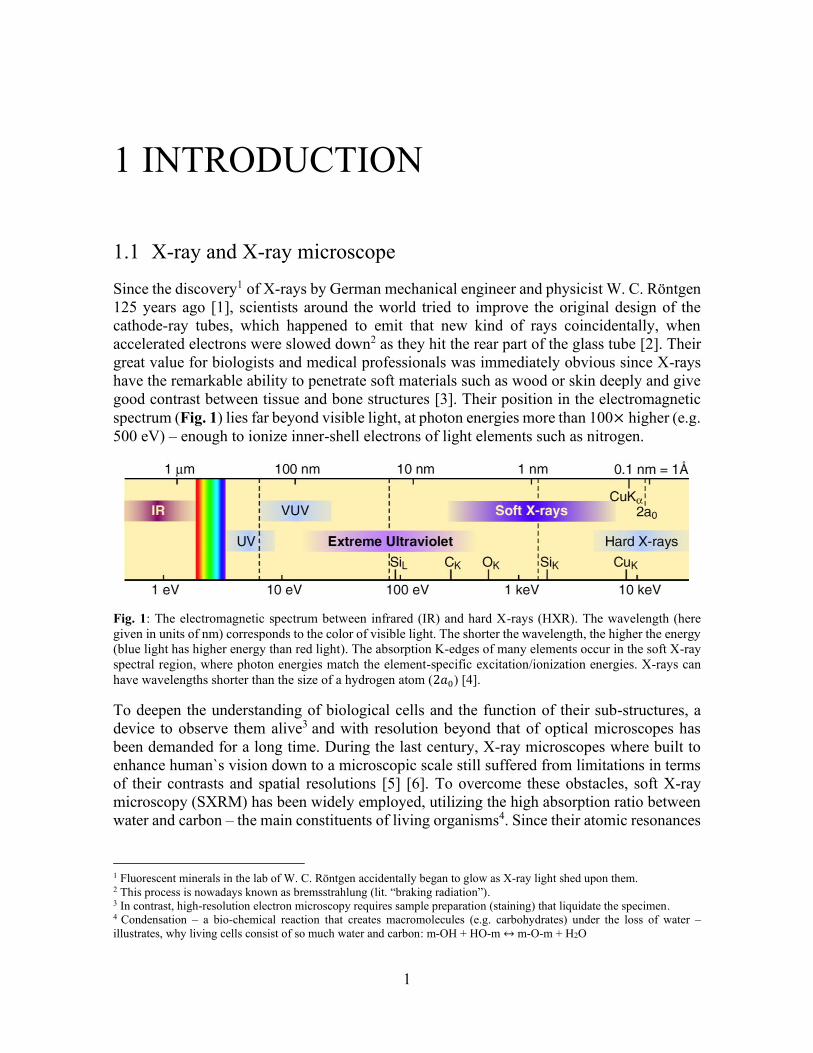
Since the discovery1 of X-rays by German mechanical engineer and physicist W. C. Röntgen 125 years ago [1], scientists around the world tried to improve the original design of the cathode-ray tubes, which happened to emit that new kind of rays coincidentally, when accelerated electrons were slowed down2 as they hit the rear part of the glass tube [2]. Their great value for biologists and medical professionals was immediately obvious since X-rays have the remarkable ability to penetrate soft materials such as wood or skin deeply and give good contrast between tissue and bone structures [3]. Their position in the electromagnetic spectrum (Fig. 1) lies far beyond visible light, at photon energies more than 100× higher (e.g. 500 eV) – enough to ionize inner-shell electrons of light elements such as nitrogen.
Fig. 1: The electromagnetic spectrum between infrared (IR) and hard X-rays (HXR). The wavelength (here given in units of nm) corresponds to the color of visible light. The shorter the wavelength, the higher the energy (blue light has higher energy than red light). The absorption K-edges of many elements occur in the soft X-ray spectral region, where photon energies match the element-specific excitation/ionization energies. X-rays can have wavelengths shorter than the size of a hydrogen atom (2𝑎0) [4].
To deepen the understanding of biological cells and the function of their sub-structures, a device to observe them alive3 and with resolution beyond that of optical microscopes has been demanded for a long time. During the last century, X-ray microscopes where built to enhance human`s vision down to a microscopic scale still suffered from limitations in terms of their contrasts and spatial resolutions [5] [6]. To overcome these obstacles, soft X-ray microscopy (SXRM) has been widely employed, utilizing the high absorption ratio between water and carbon – the main constituents of living organisms4. Since their atomic resonances
1 Fluorescent minerals in the lab of W. C. Röntgen accidentally began to glow as X-ray light shed upon them. 2 This process is nowadays known as bremsstrahlung (lit. “braking radiation”). 3 In contrast, high-resolution electron microscopy requires sample preparation (staining) that liquidate the specimen. 4 Condensation – a bio-chemical reaction that creates macromolecules (e.g. carbohydrates) under the loss of water – illustrates, why living cells consist of so much water and carbon: m-OH + HO-m ↔ m-O-m + H2O
2
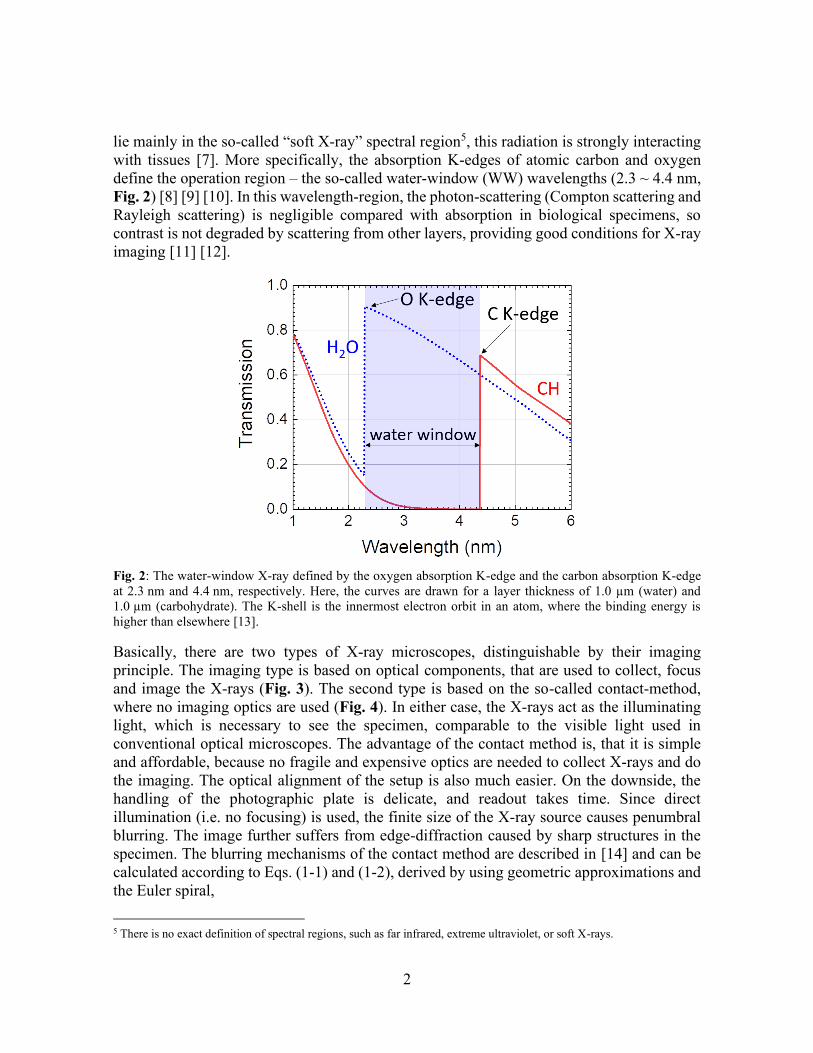
lie mainly in the so-called “soft X-ray” spectral region5, this radiation is strongly interacting with tissues [7]. More specifically, the absorption K-edges of atomic carbon and oxygen define the operation region – the so-called water-window (WW) wavelengths (2.3 ~ 4.4 nm, Fig. 2) [8] [9] [10]. In this wavelength-region, the photon-scattering (Compton scattering and Rayleigh scattering) is negligible compared with absorption in biological specimens, so contrast is not degraded by scattering from other layers, providing good conditions for X-ray imaging [11] [12].
Fig. 2: The water-window X-ray defined by the oxygen absorption K-edge and the carbon absorption K-edge at 2.3 nm and 4.4 nm, respectively. Here, the curves are drawn for a layer thickness of 1.0 µm (water) and 1.0 µm (carbohydrate). The K-shell is the innermost electron orbit in an atom, where the binding energy is higher than elsewhere [13].
Basically, there are two types of X-ray microscopes, distinguishable by their imaging principle. The imaging type is based on optical components, that are used to collect, focus and image the X-rays (Fig. 3). The second type is based on the so-called contact-method, where no imaging optics are used (Fig. 4). In either case, the X-rays act as the illuminating light, which is necessary to see the specimen, comparable to the visible light used in conventional optical microscopes. The advantage of the contact method is, that it is simple and affordable, because no fragile and expensive optics are needed to collect X-rays and do the imaging. The optical alignment of the setup is also much easier. On the downside, the handling of the photographic plate is delicate, and readout takes time. Since direct illumination (i.e. no focusing) is used, the finite size of the X-ray source causes penumbral blurring. The image further suffers from edge-diffraction caused by sharp structures in the specimen. The blurring mechanisms of the contact method are described in [14] and can be calculated according to Eqs. (1-1) and (1-2), derived by using geometric approximations and the Euler spiral,
5 There is no exact definition of spectral regions, such as far infrared, extreme ultraviolet, or soft X-rays.
3
𝛿f = √ℎ𝜆 , (1-1)
𝛿p = 𝐷ℎ/𝑑 , (1-2)
where 𝛿f and 𝛿p stand for diffraction blurring and penumbral blurring, respectively. 𝐷 resembles the diameter of the X-ray source, 𝑑 is the distance between the X-ray source and the specimen, and ℎ is the distance between the specimen and the photoresist. Diffraction6 is the ability of light to enter geometrical shadow regions, when it “bends” around sharp contours, such as corners, apertures or slits.
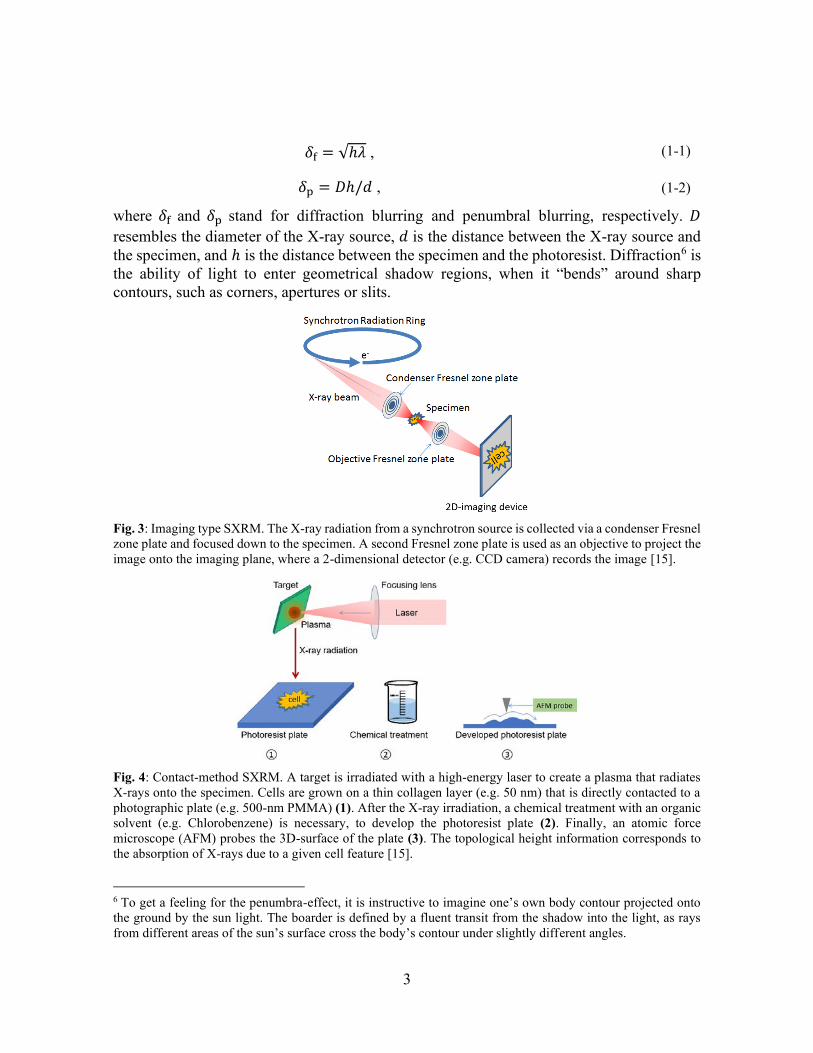
Fig. 3: Imaging type SXRM. The X-ray radiation from a synchrotron source is collected via a condenser Fresnel zone plate and focused down to the specimen. A second Fresnel zone plate is used as an objective to project the image onto the imaging plane, where a 2-dimensional detector (e.g. CCD camera) records the image [15].
Fig. 4: Contact-method SXRM. A target is irradiated with a high-energy laser to create a plasma that radiates X-rays onto the specimen. Cells are grown on a thin collagen layer (e.g. 50 nm) that is directly contacted to a photographic plate (e.g. 500-nm PMMA) (1). After the X-ray irradiation, a chemical treatment with an organic solvent (e.g. Chlorobenzene) is necessary, to develop the photoresist plate (2). Finally, an atomic force microscope (AFM) probes the 3D-surface of the plate (3). The topological height information corresponds to the absorption of X-rays due to a given cell feature [15].
6 To get a feeling for the penumbra-effect, it is instructive to imagine one’s own body contour projected onto the ground by the sun light. The boarder is defined by a fluent transit from the shadow into the light, as rays from different areas of the sun’s surface cross the body’s contour under slightly different angles.
4
In recent years, in order to provide SXRM with brilliant radiation of WW soft X-rays, the X-rays generated in large synchrotron radiation and free electron laser facilities have been utilized, by which spatial resolutions up to 10 nm have been demonstrated so far [16] [17]. Brilliance is defined by Eq. (1-3) and describes the photon flux of a certain spectral band in a given direction concentrated on a spot.
Brilliance ∶= [photons
s∙mm2∙mrad2∙0.1%BW] . (1-3)
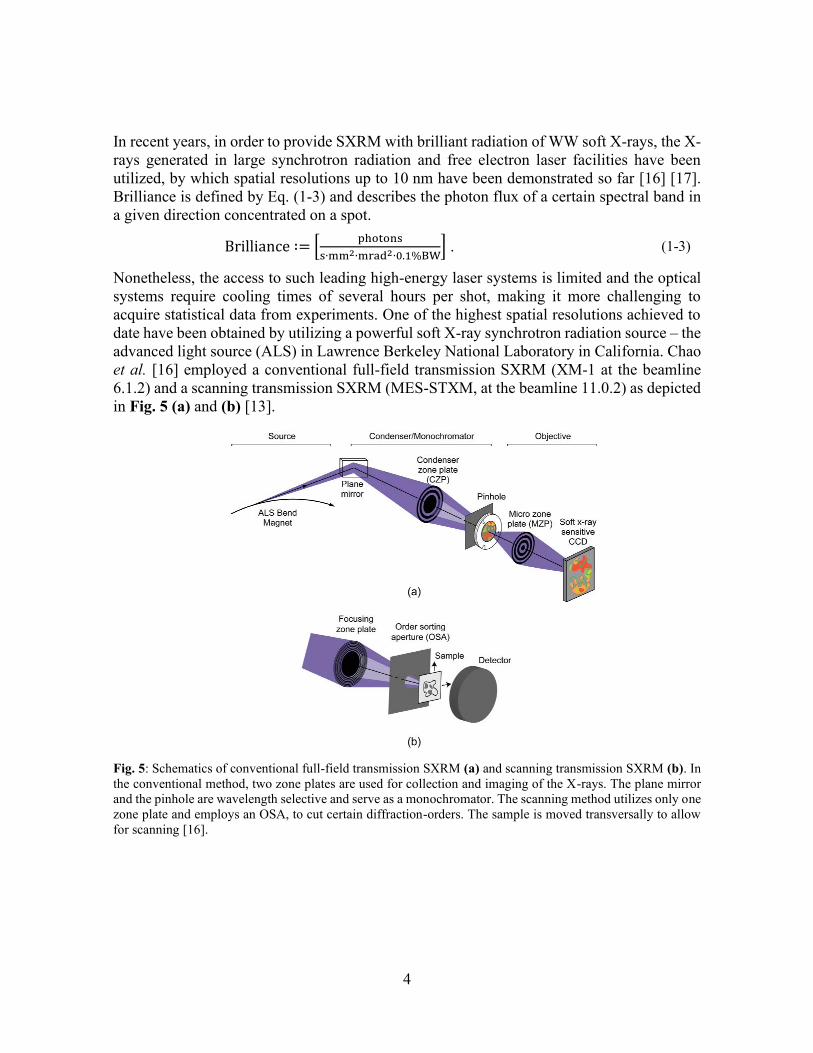
Nonetheless, the access to such leading high-energy laser systems is limited and the optical systems require cooling times of several hours per shot, making it more challenging to acquire statistical data from experiments. One of the highest spatial resolutions achieved to date have been obtained by utilizing a powerful soft X-ray synchrotron radiation source – the advanced light source (ALS) in Lawrence Berkeley National Laboratory in California. Chao et al. [16] employed a conventional full-field transmission SXRM (XM-1 at the beamline 6.1.2) and a scanning transmission SXRM (MES-STXM, at the beamline 11.0.2) as depicted in Fig. 5 (a) and (b) [13].
Fig. 5: Schematics of conventional full-field transmission SXRM (a) and scanning transmission SXRM (b). In the conventional method, two zone plates are used for collection and imaging of the X-rays. The plane mirror and the pinhole are wavelength selective and serve as a monochromator. The scanning method utilizes only one zone plate and employs an OSA, to cut certain diffraction-orders. The sample is moved transversally to allow for scanning [16].
5
1.2 Plasma X-ray source
The various kinds of X-ray sources can be grouped by their methods of generation, namely discharge sources (current-driven), electron-impact sources (particle beam), and laser-produced sources (light-matter interaction). Each of these technologies comes in a variety of executions. The most important designs will be presented in the following.
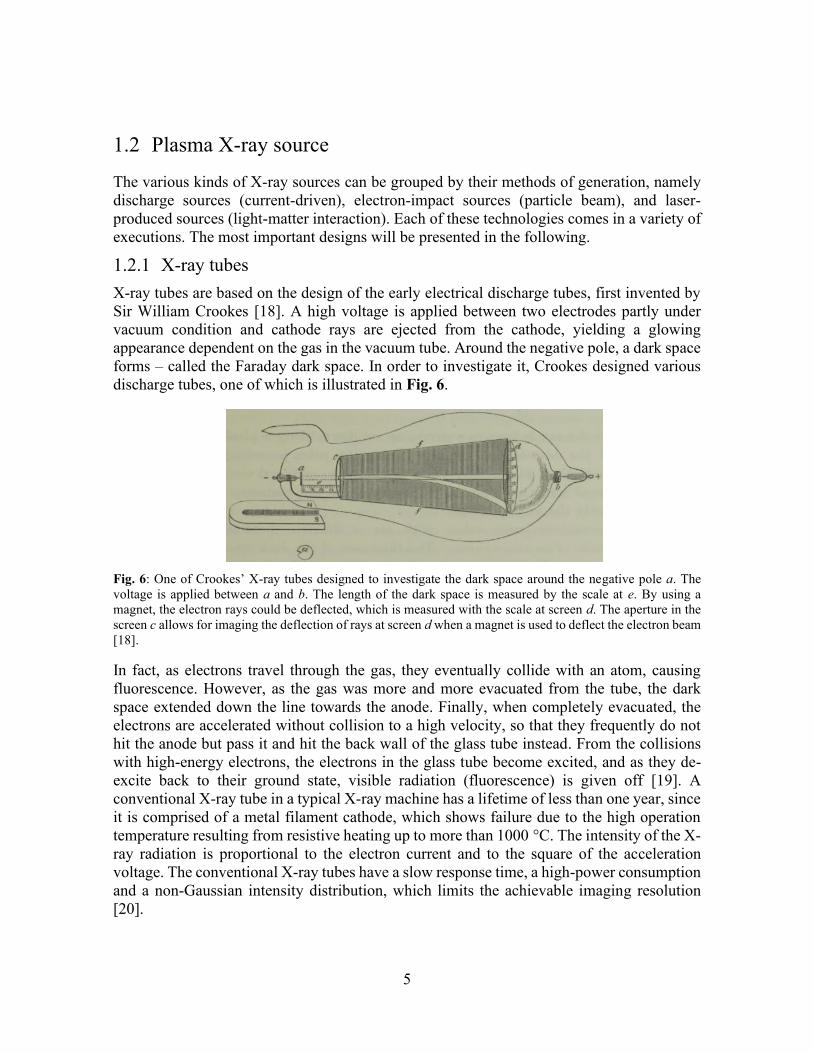
1.2.1 X-ray tubes X-ray tubes are based on the design of the early electrical discharge tubes, first invented by Sir William Crookes [18]. A high voltage is applied between two electrodes partly under vacuum condition and cathode rays are ejected from the cathode, yielding a glowing appearance dependent on the gas in the vacuum tube. Around the negative pole, a dark space forms – called the Faraday dark space. In order to investigate it, Crookes designed various discharge tubes, one of which is illustrated in Fig. 6.
Fig. 6: One of Crookes’ X-ray tubes designed to investigate the dark space around the negative pole a. The voltage is applied between a and b. The length of the dark space is measured by the scale at e. By using a magnet, the electron rays could be deflected, which is measured with the scale at screen d. The aperture in the screen c allows for imaging the deflection of rays at screen d when a magnet is used to deflect the electron beam [18].
In fact, as electrons travel through the gas, they eventually collide with an atom, causing fluorescence. However, as the gas was more and more evacuated from the tube, the dark space extended down the line towards the anode. Finally, when completely evacuated, the electrons are accelerated without collision to a high velocity, so that they frequently do not hit the anode but pass it and hit the back wall of the glass tube instead. From the collisions with high-energy electrons, the electrons in the glass tube become excited, and as they de-excite back to their ground state, visible radiation (fluorescence) is given off [19]. A conventional X-ray tube in a typical X-ray machine has a lifetime of less than one year, since it is comprised of a metal filament cathode, which shows failure due to the high operation temperature resulting from resistive heating up to more than 1000 °C. The intensity of the X-ray radiation is proportional to the electron current and to the square of the acceleration voltage. The conventional X-ray tubes have a slow response time, a high-power consumption and a non-Gaussian intensity distribution, which limits the achievable imaging resolution [20].
6
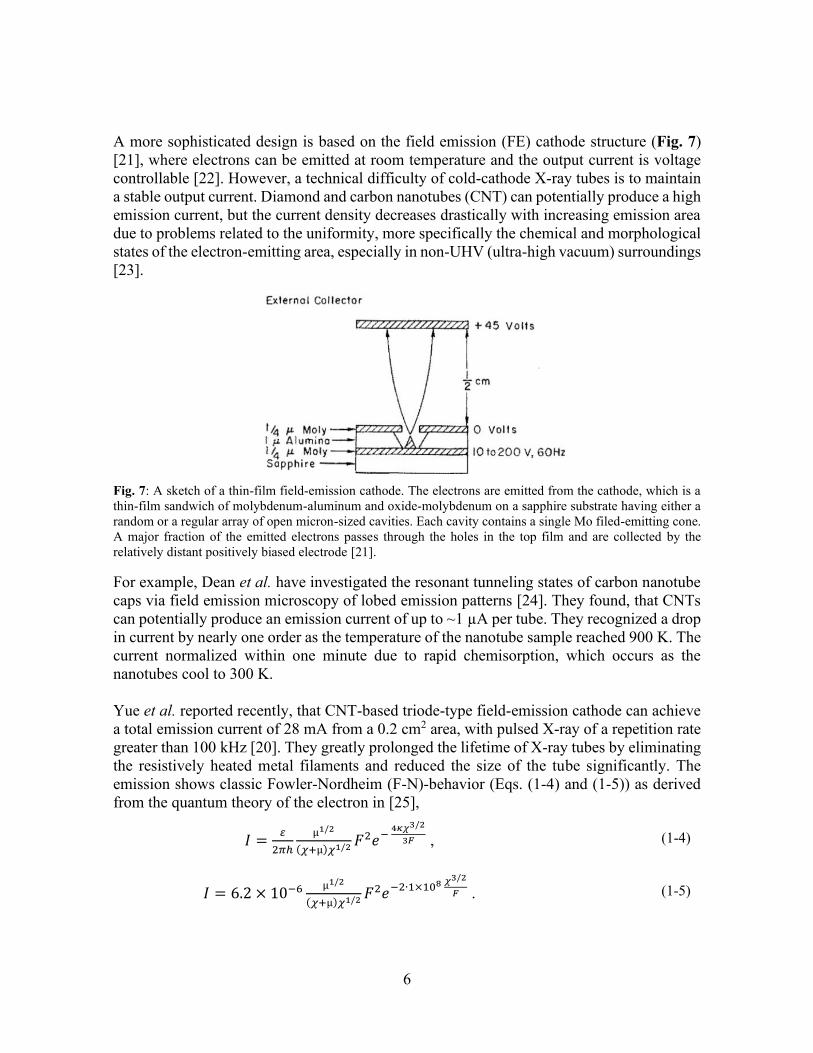
A more sophisticated design is based on the field emission (FE) cathode structure (Fig. 7) [21], where electrons can be emitted at room temperature and the output current is voltage controllable [22]. However, a technical difficulty of cold-cathode X-ray tubes is to maintain a stable output current. Diamond and carbon nanotubes (CNT) can potentially produce a high emission current, but the current density decreases drastically with increasing emission area due to problems related to the uniformity, more specifically the chemical and morphological states of the electron-emitting area, especially in non-UHV (ultra-high vacuum) surroundings [23].
Fig. 7: A sketch of a thin-film field-emission cathode. The electrons are emitted from the cathode, which is a thin-film sandwich of molybdenum-aluminum and oxide-molybdenum on a sapphire substrate having either a random or a regular array of open micron-sized cavities. Each cavity contains a single Mo filed-emitting cone. A major fraction of the emitted electrons passes through the holes in the top film and are collected by the relatively distant positively biased electrode [21].
For example, Dean et al. have investigated the resonant tunneling states of carbon nanotube caps via field emission microscopy of lobed emission patterns [24]. They found, that CNTs can potentially produce an emission current of up to ~1 µA per tube. They recognized a drop in current by nearly one order as the temperature of the nanotube sample reached 900 K. The current normalized within one minute due to rapid chemisorption, which occurs as the nanotubes cool to 300 K. Yue et al. reported recently, that CNT-based triode-type field-emission cathode can achieve a total emission current of 28 mA from a 0.2 cm2 area, with pulsed X-ray of a repetition rate greater than 100 kHz [20]. They greatly prolonged the lifetime of X-ray tubes by eliminating the resistively heated metal filaments and reduced the size of the tube significantly. The emission shows classic Fowler-Nordheim (F-N)-behavior (Eqs. (1-4) and (1-5)) as derived from the quantum theory of the electron in [25],
𝐼 =𝜀
2𝜋ℎ
µ1/2
(𝜒+µ)𝜒1/2 𝐹2𝑒− 4𝜅𝜒3/2
3𝐹 , (1-4)
𝐼 = 6.2 × 10⁻⁶ µ1/2
(𝜒+µ)𝜒1/2𝐹2𝑒−2∙1×108
𝜒3/2
𝐹 . (1-5)
7
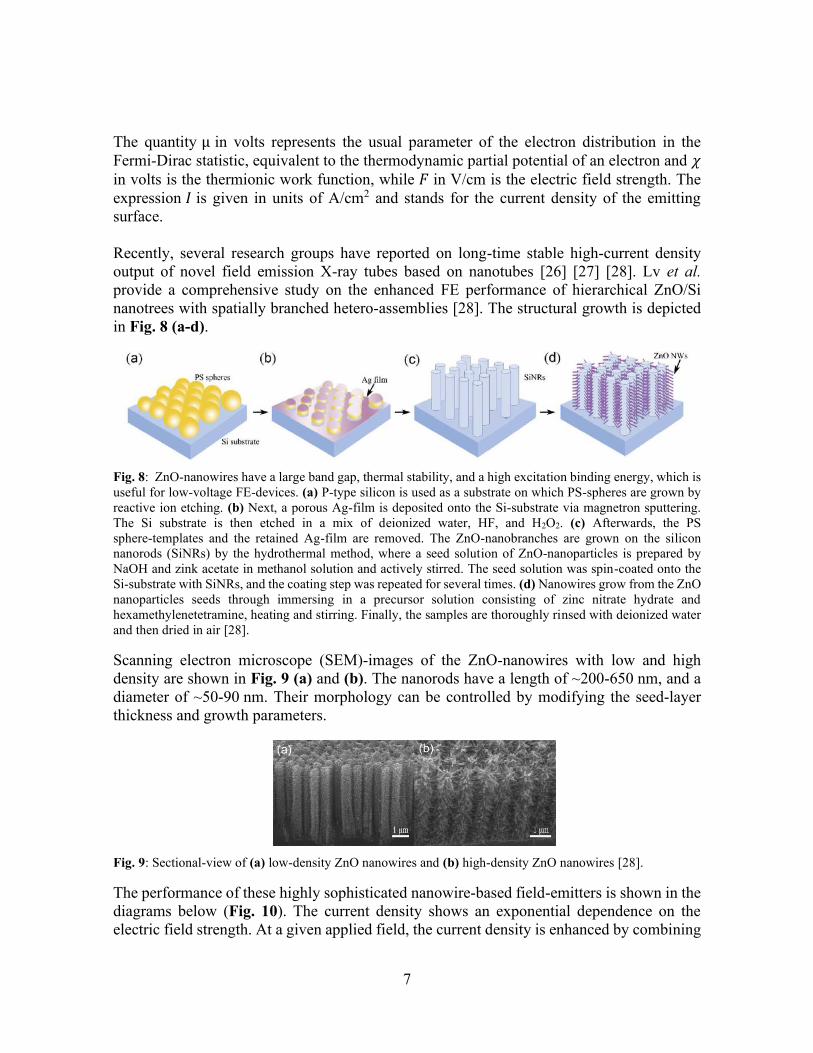
The quantity µ in volts represents the usual parameter of the electron distribution in the Fermi-Dirac statistic, equivalent to the thermodynamic partial potential of an electron and 𝜒 in volts is the thermionic work function, while 𝐹 in V/cm is the electric field strength. The expression 𝐼 is given in units of A/cm2 and stands for the current density of the emitting surface. Recently, several research groups have reported on long-time stable high-current density output of novel field emission X-ray tubes based on nanotubes [26] [27] [28]. Lv et al. provide a comprehensive study on the enhanced FE performance of hierarchical ZnO/Si nanotrees with spatially branched hetero-assemblies [28]. The structural growth is depicted in Fig. 8 (a-d).
Fig. 8: ZnO-nanowires have a large band gap, thermal stability, and a high excitation binding energy, which is useful for low-voltage FE-devices. (a) P-type silicon is used as a substrate on which PS-spheres are grown by reactive ion etching. (b) Next, a porous Ag-film is deposited onto the Si-substrate via magnetron sputtering. The Si substrate is then etched in a mix of deionized water, HF, and H2O2. (c) Afterwards, the PS sphere-templates and the retained Ag-film are removed. The ZnO-nanobranches are grown on the silicon nanorods (SiNRs) by the hydrothermal method, where a seed solution of ZnO-nanoparticles is prepared by NaOH and zink acetate in methanol solution and actively stirred. The seed solution was spin-coated onto the Si-substrate with SiNRs, and the coating step was repeated for several times. (d) Nanowires grow from the ZnO nanoparticles seeds through immersing in a precursor solution consisting of zinc nitrate hydrate and hexamethylenetetramine, heating and stirring. Finally, the samples are thoroughly rinsed with deionized water and then dried in air [28].
Scanning electron microscope (SEM)-images of the ZnO-nanowires with low and high density are shown in Fig. 9 (a) and (b). The nanorods have a length of ~200-650 nm, and a diameter of ~50-90 nm. Their morphology can be controlled by modifying the seed-layer thickness and growth parameters.
Fig. 9: Sectional-view of (a) low-density ZnO nanowires and (b) high-density ZnO nanowires [28].
The performance of these highly sophisticated nanowire-based field-emitters is shown in the diagrams below (Fig. 10). The current density shows an exponential dependence on the electric field strength. At a given applied field, the current density is enhanced by combining
8
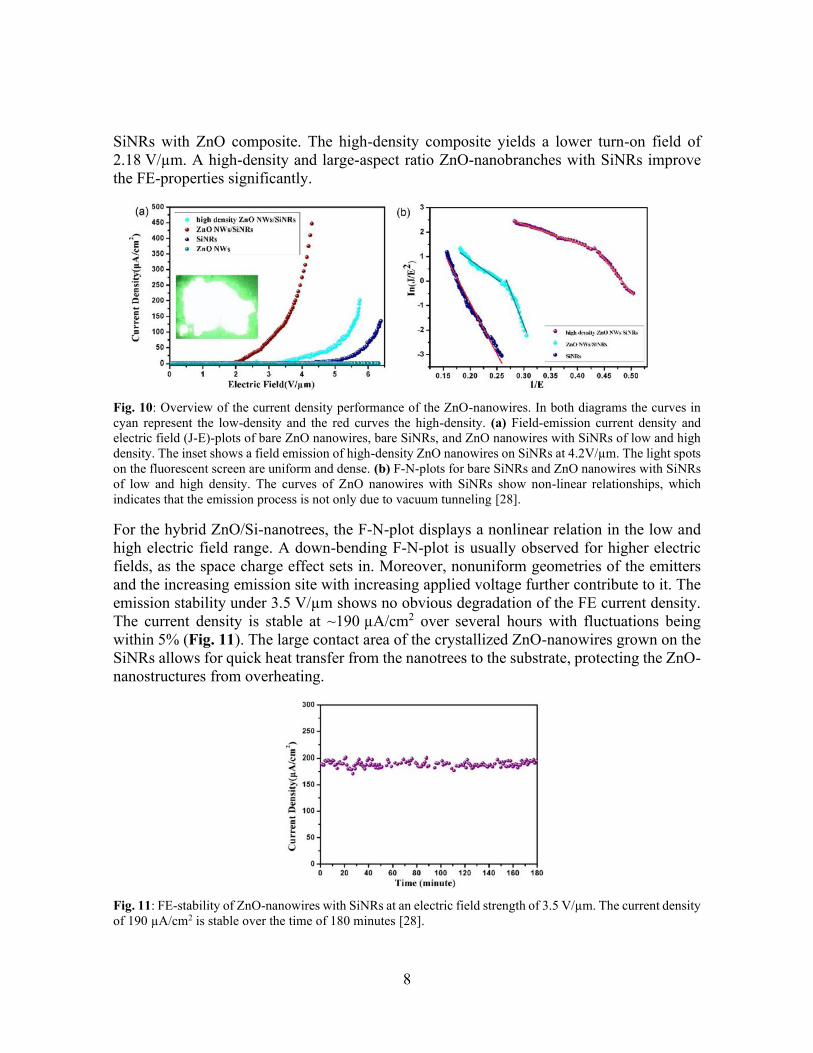
SiNRs with ZnO composite. The high-density composite yields a lower turn-on field of 2.18 V/µm. A high-density and large-aspect ratio ZnO-nanobranches with SiNRs improve the FE-properties significantly.
Fig. 10: Overview of the current density performance of the ZnO-nanowires. In both diagrams the curves in cyan represent the low-density and the red curves the high-density. (a) Field-emission current density and electric field (J-E)-plots of bare ZnO nanowires, bare SiNRs, and ZnO nanowires with SiNRs of low and high density. The inset shows a field emission of high-density ZnO nanowires on SiNRs at 4.2V/µm. The light spots on the fluorescent screen are uniform and dense. (b) F-N-plots for bare SiNRs and ZnO nanowires with SiNRs of low and high density. The curves of ZnO nanowires with SiNRs show non-linear relationships, which indicates that the emission process is not only due to vacuum tunneling [28].
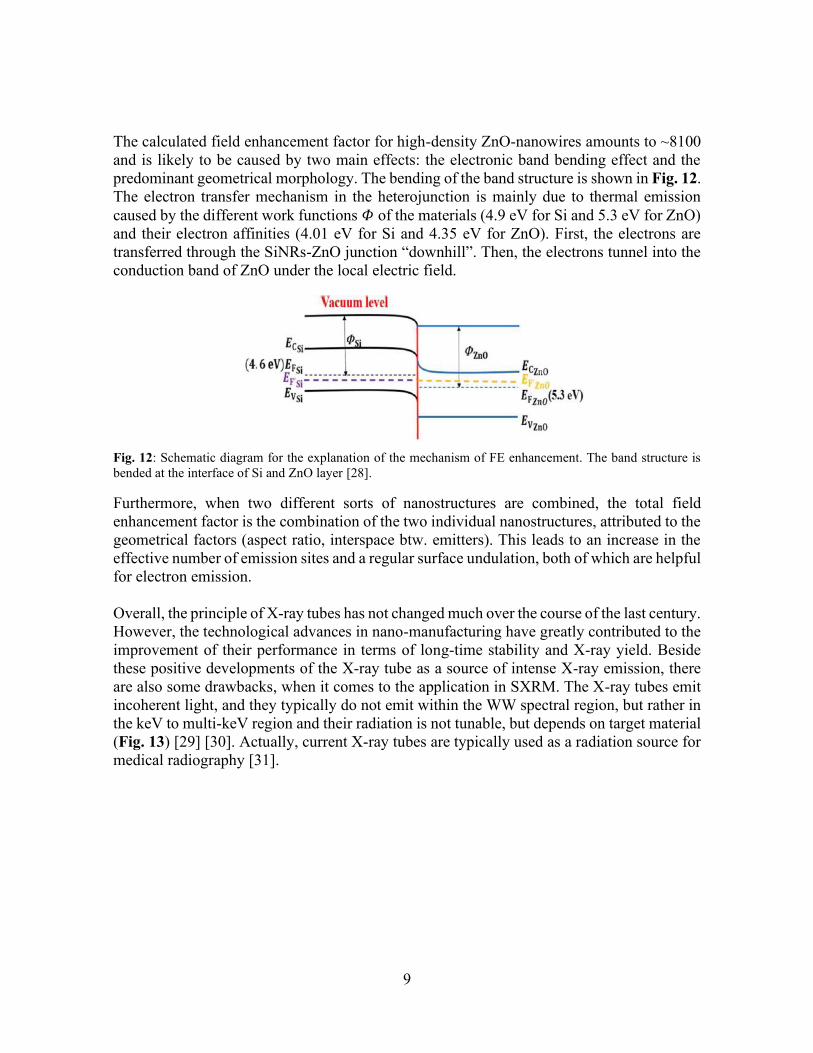
For the hybrid ZnO/Si-nanotrees, the F-N-plot displays a nonlinear relation in the low and high electric field range. A down-bending F-N-plot is usually observed for higher electric fields, as the space charge effect sets in. Moreover, nonuniform geometries of the emitters and the increasing emission site with increasing applied voltage further contribute to it. The emission stability under 3.5 V/µm shows no obvious degradation of the FE current density. The current density is stable at ~190 µA/cm2 over several hours with fluctuations being within 5% (Fig. 11). The large contact area of the crystallized ZnO-nanowires grown on the SiNRs allows for quick heat transfer from the nanotrees to the substrate, protecting the ZnO-nanostructures from overheating.
Fig. 11: FE-stability of ZnO-nanowires with SiNRs at an electric field strength of 3.5 V/µm. The current density of 190 µA/cm2 is stable over the time of 180 minutes [28].
9
The calculated field enhancement factor for high-density ZnO-nanowires amounts to ~8100 and is likely to be caused by two main effects: the electronic band bending effect and the predominant geometrical morphology. The bending of the band structure is shown in Fig. 12. The electron transfer mechanism in the heterojunction is mainly due to thermal emission caused by the different work functions 𝛷 of the materials (4.9 eV for Si and 5.3 eV for ZnO) and their electron affinities (4.01 eV for Si and 4.35 eV for ZnO). First, the electrons are transferred through the SiNRs-ZnO junction “downhill”. Then, the electrons tunnel into the conduction band of ZnO under the local electric field.
Fig. 12: Schematic diagram for the explanation of the mechanism of FE enhancement. The band structure is bended at the interface of Si and ZnO layer [28].
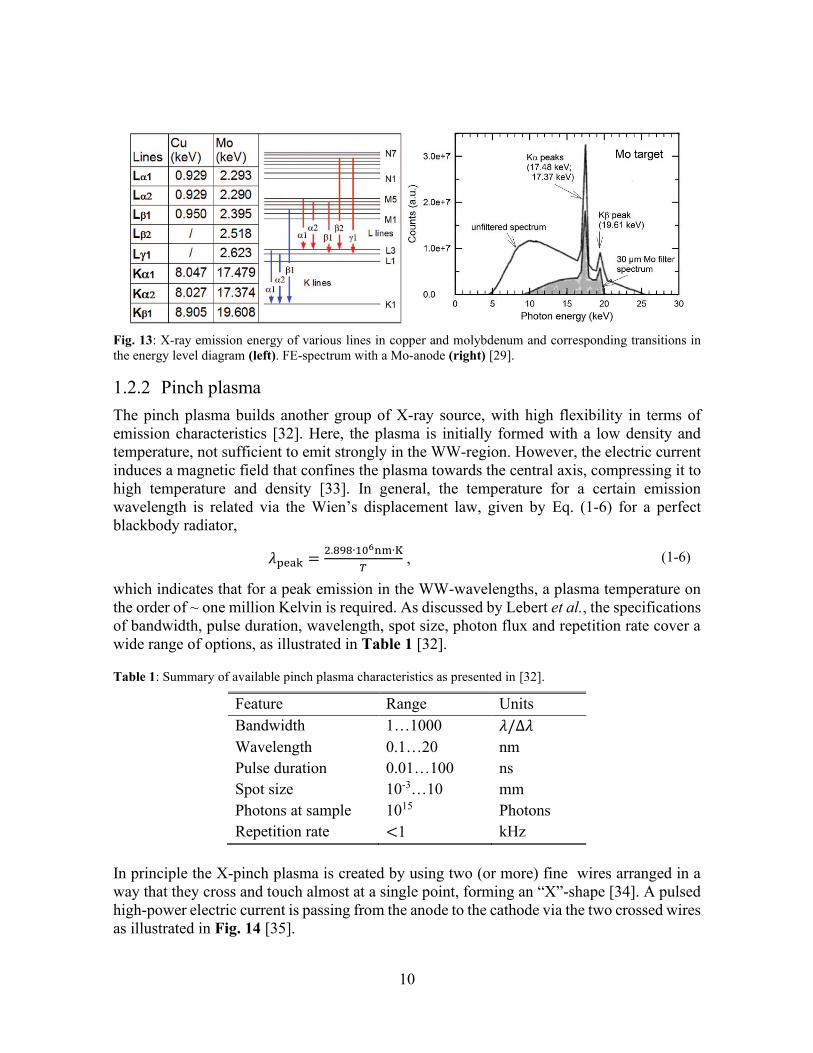
Furthermore, when two different sorts of nanostructures are combined, the total field enhancement factor is the combination of the two individual nanostructures, attributed to the geometrical factors (aspect ratio, interspace btw. emitters). This leads to an increase in the effective number of emission sites and a regular surface undulation, both of which are helpful for electron emission. Overall, the principle of X-ray tubes has not changed much over the course of the last century. However, the technological advances in nano-manufacturing have greatly contributed to the improvement of their performance in terms of long-time stability and X-ray yield. Beside these positive developments of the X-ray tube as a source of intense X-ray emission, there are also some drawbacks, when it comes to the application in SXRM. The X-ray tubes emit incoherent light, and they typically do not emit within the WW spectral region, but rather in the keV to multi-keV region and their radiation is not tunable, but depends on target material (Fig. 13) [29] [30]. Actually, current X-ray tubes are typically used as a radiation source for medical radiography [31].
10
Fig. 13: X-ray emission energy of various lines in copper and molybdenum and corresponding transitions in the energy level diagram (left). FE-spectrum with a Mo-anode (right) [29].
1.2.2 Pinch plasma The pinch plasma builds another group of X-ray source, with high flexibility in terms of emission characteristics [32]. Here, the plasma is initially formed with a low density and temperature, not sufficient to emit strongly in the WW-region. However, the electric current induces a magnetic field that confines the plasma towards the central axis, compressing it to high temperature and density [33]. In general, the temperature for a certain emission wavelength is related via the Wien’s displacement law, given by Eq. (1-6) for a perfect blackbody radiator,
𝜆peak =2.898∙106nm∙K
𝑇 , (1-6)
which indicates that for a peak emission in the WW-wavelengths, a plasma temperature on the order of ~ one million Kelvin is required. As discussed by Lebert et al., the specifications of bandwidth, pulse duration, wavelength, spot size, photon flux and repetition rate cover a wide range of options, as illustrated in Table 1 [32].
Table 1: Summary of available pinch plasma characteristics as presented in [32].
Feature Range Units Bandwidth 1…1000 𝜆/∆𝜆 Wavelength 0.1…20 nm Pulse duration 0.01…100 ns Spot size 10-3…10 mm Photons at sample 1015 Photons Repetition rate <1 kHz
In principle the X-pinch plasma is created by using two (or more) fine wires arranged in a way that they cross and touch almost at a single point, forming an “X”-shape [34]. A pulsed high-power electric current is passing from the anode to the cathode via the two crossed wires as illustrated in Fig. 14 [35].
11
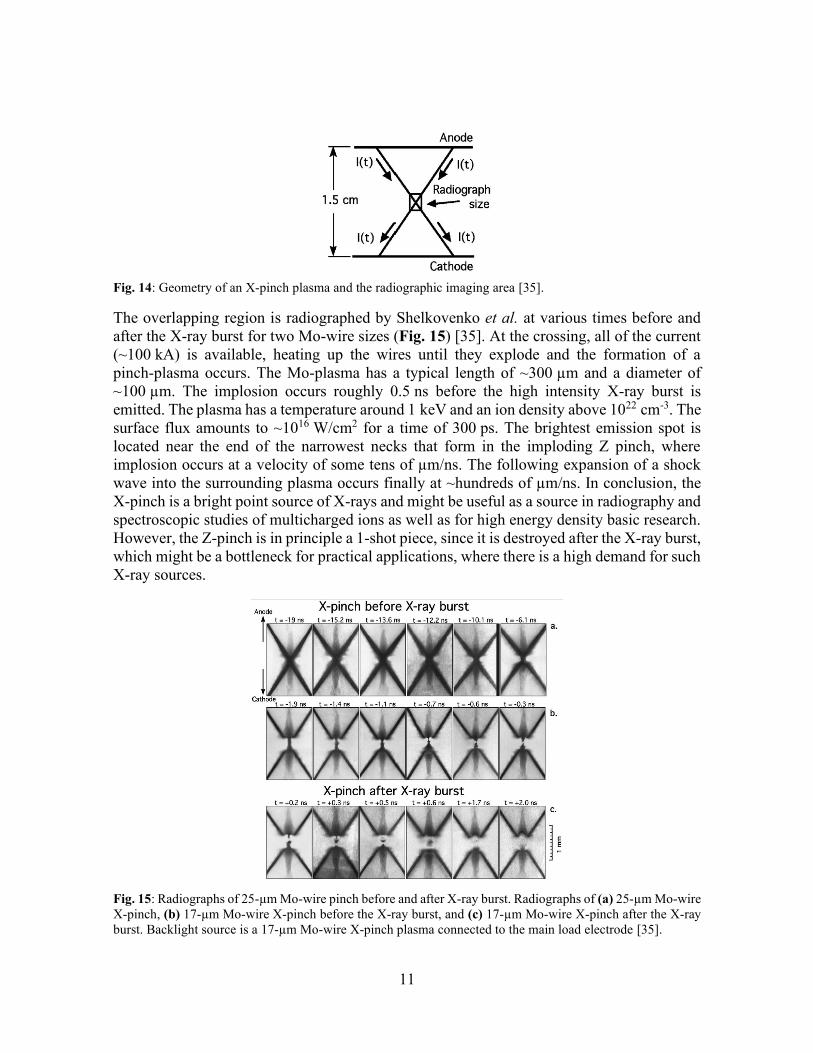
Fig. 14: Geometry of an X-pinch plasma and the radiographic imaging area [35].
The overlapping region is radiographed by Shelkovenko et al. at various times before and after the X-ray burst for two Mo-wire sizes (Fig. 15) [35]. At the crossing, all of the current (~100 kA) is available, heating up the wires until they explode and the formation of a pinch-plasma occurs. The Mo-plasma has a typical length of ~300 µm and a diameter of ~100 µm. The implosion occurs roughly 0.5 ns before the high intensity X-ray burst is emitted. The plasma has a temperature around 1 keV and an ion density above 1022 cm-3. The surface flux amounts to ~1016 W/cm2 for a time of 300 ps. The brightest emission spot is located near the end of the narrowest necks that form in the imploding Z pinch, where implosion occurs at a velocity of some tens of µm/ns. The following expansion of a shock wave into the surrounding plasma occurs finally at ~hundreds of µm/ns. In conclusion, the X-pinch is a bright point source of X-rays and might be useful as a source in radiography and spectroscopic studies of multicharged ions as well as for high energy density basic research. However, the Z-pinch is in principle a 1-shot piece, since it is destroyed after the X-ray burst, which might be a bottleneck for practical applications, where there is a high demand for such X-ray sources.
Fig. 15: Radiographs of 25-µm Mo-wire pinch before and after X-ray burst. Radiographs of (a) 25-µm Mo-wire X-pinch, (b) 17-µm Mo-wire X-pinch before the X-ray burst, and (c) 17-µm Mo-wire X-pinch after the X-ray burst. Backlight source is a 17-µm Mo-wire X-pinch plasma connected to the main load electrode [35].
12
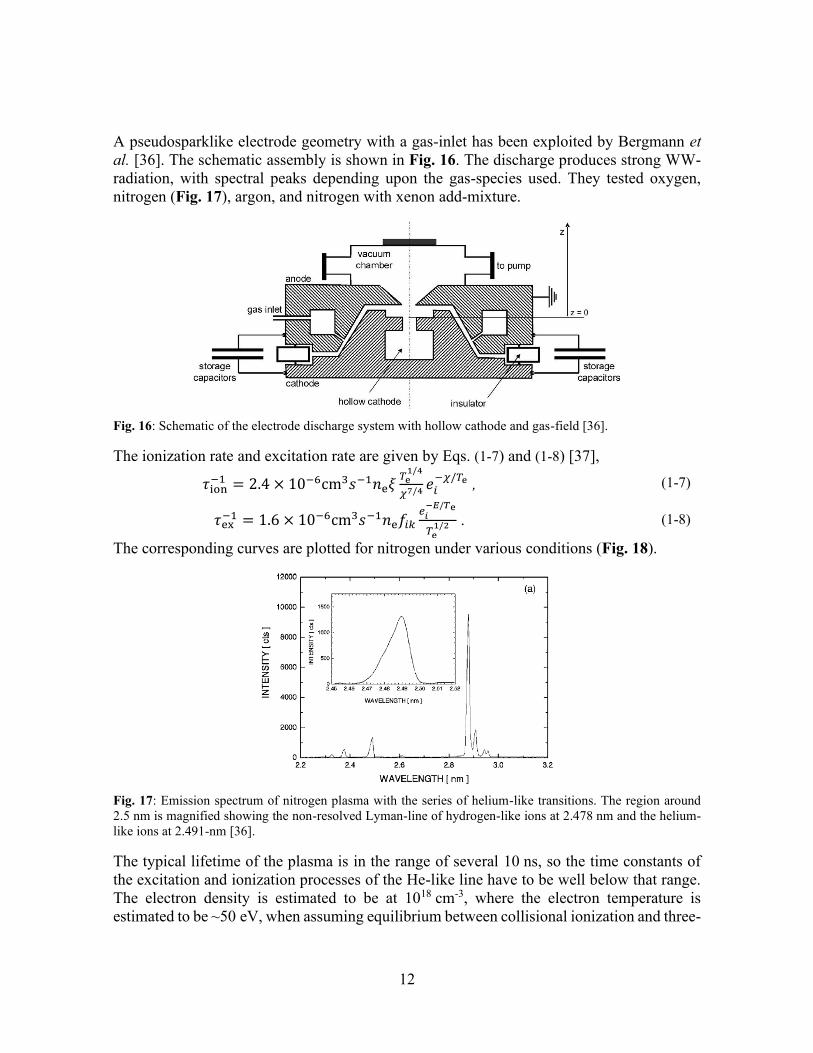
A pseudosparklike electrode geometry with a gas-inlet has been exploited by Bergmann et al. [36]. The schematic assembly is shown in Fig. 16. The discharge produces strong WW-radiation, with spectral peaks depending upon the gas-species used. They tested oxygen, nitrogen (Fig. 17), argon, and nitrogen with xenon add-mixture.
Fig. 16: Schematic of the electrode discharge system with hollow cathode and gas-field [36].
The ionization rate and excitation rate are given by Eqs. (1-7) and (1-8) [37],
𝜏ion−1 = 2.4 × 10⁻⁶cm3𝑠−1𝑛e𝜉
𝑇e1/4
𝜒7/4𝑒𝑖
−𝜒/𝑇e , (1-7)
𝜏ex−1 = 1.6 × 10⁻⁶cm3𝑠−1𝑛e𝑓𝑖𝑘
𝑒𝑖−𝐸/𝑇e
𝑇e1/2 . (1-8)
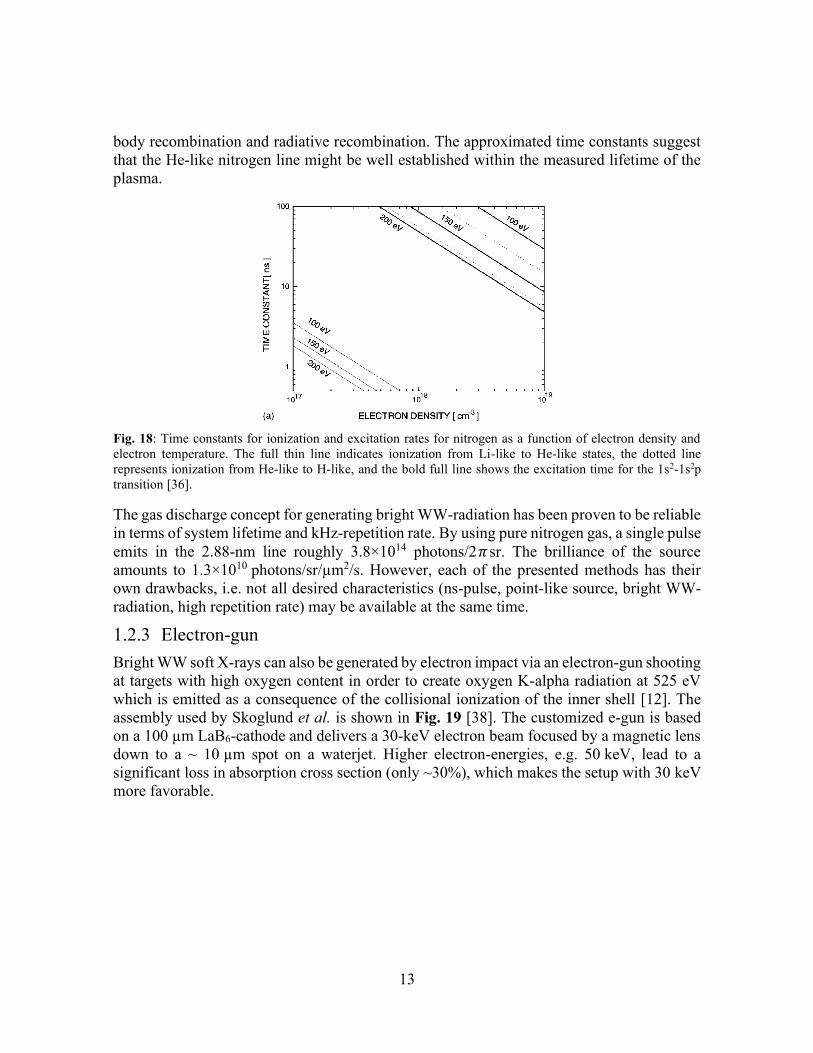
The corresponding curves are plotted for nitrogen under various conditions (Fig. 18).
Fig. 17: Emission spectrum of nitrogen plasma with the series of helium-like transitions. The region around 2.5 nm is magnified showing the non-resolved Lyman-line of hydrogen-like ions at 2.478 nm and the helium-like ions at 2.491-nm [36].
The typical lifetime of the plasma is in the range of several 10 ns, so the time constants of the excitation and ionization processes of the He-like line have to be well below that range. The electron density is estimated to be at 1018 cm-3, where the electron temperature is estimated to be ~50 eV, when assuming equilibrium between collisional ionization and three-
13
body recombination and radiative recombination. The approximated time constants suggest that the He-like nitrogen line might be well established within the measured lifetime of the plasma.
Fig. 18: Time constants for ionization and excitation rates for nitrogen as a function of electron density and electron temperature. The full thin line indicates ionization from Li-like to He-like states, the dotted line represents ionization from He-like to H-like, and the bold full line shows the excitation time for the 1s2-1s2p transition [36].
The gas discharge concept for generating bright WW-radiation has been proven to be reliable in terms of system lifetime and kHz-repetition rate. By using pure nitrogen gas, a single pulse emits in the 2.88-nm line roughly 3.8×10¹⁴ photons/2𝜋 sr. The brilliance of the source amounts to 1.3×10¹⁰ photons/sr/µm2/s. However, each of the presented methods has their own drawbacks, i.e. not all desired characteristics (ns-pulse, point-like source, bright WW-radiation, high repetition rate) may be available at the same time.
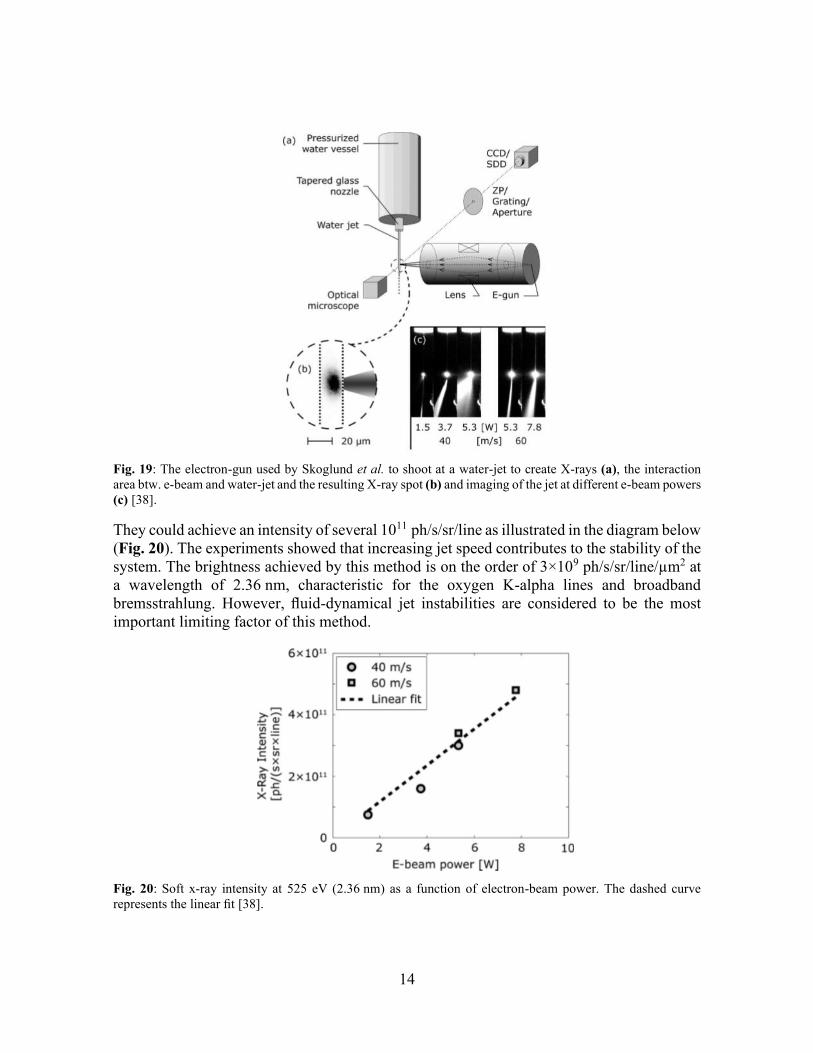
1.2.3 Electron-gun Bright WW soft X-rays can also be generated by electron impact via an electron-gun shooting at targets with high oxygen content in order to create oxygen K-alpha radiation at 525 eV which is emitted as a consequence of the collisional ionization of the inner shell [12]. The assembly used by Skoglund et al. is shown in Fig. 19 [38]. The customized e-gun is based on a 100 µm LaB6-cathode and delivers a 30-keV electron beam focused by a magnetic lens down to a ~ 10 µm spot on a waterjet. Higher electron-energies, e.g. 50 keV, lead to a significant loss in absorption cross section (only ~30%), which makes the setup with 30 keV more favorable.
14
Fig. 19: The electron-gun used by Skoglund et al. to shoot at a water-jet to create X-rays (a), the interaction area btw. e-beam and water-jet and the resulting X-ray spot (b) and imaging of the jet at different e-beam powers (c) [38].
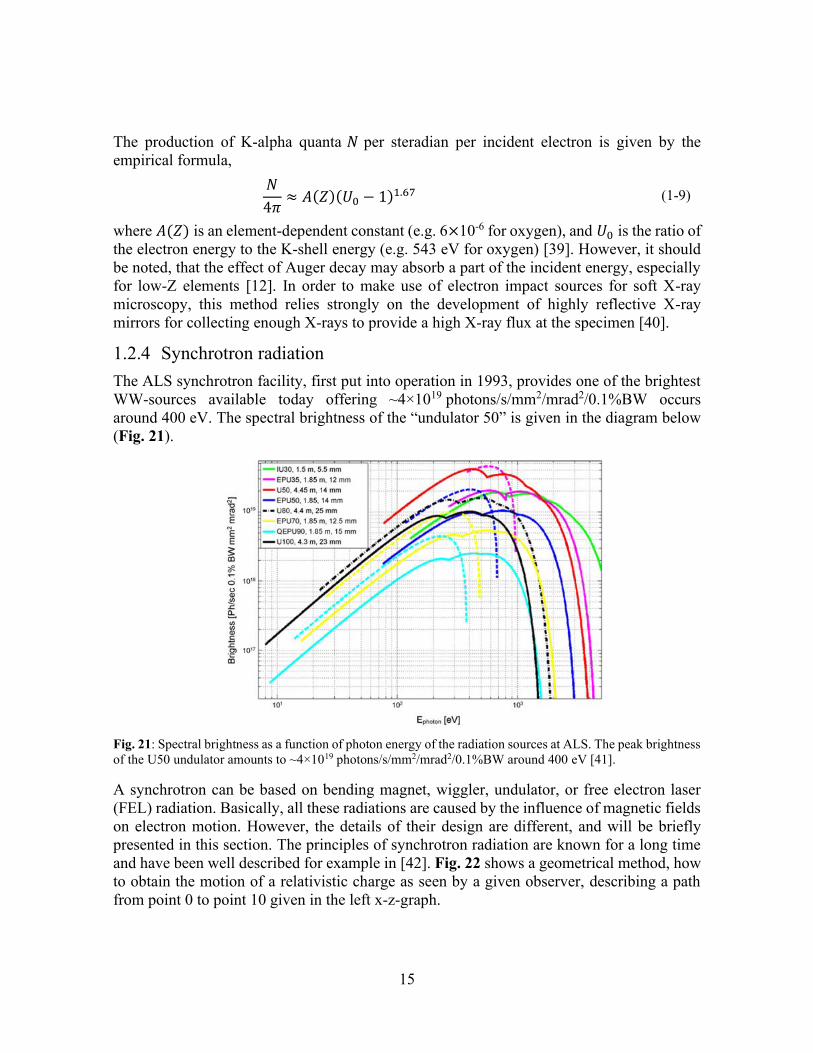
They could achieve an intensity of several 1011 ph/s/sr/line as illustrated in the diagram below (Fig. 20). The experiments showed that increasing jet speed contributes to the stability of the system. The brightness achieved by this method is on the order of 3×10⁹ ph/s/sr/line/µm2 at a wavelength of 2.36 nm, characteristic for the oxygen K-alpha lines and broadband bremsstrahlung. However, fluid-dynamical jet instabilities are considered to be the most important limiting factor of this method.
Fig. 20: Soft x-ray intensity at 525 eV (2.36 nm) as a function of electron-beam power. The dashed curve represents the linear fit [38].
15
The production of K-alpha quanta 𝑁 per steradian per incident electron is given by the empirical formula,
𝑁
4𝜋≈ 𝐴(𝑍)(𝑈0 − 1)1.67 (1-9)
where 𝐴(𝑍) is an element-dependent constant (e.g. 6×10⁻⁶ for oxygen), and 𝑈0 is the ratio of the electron energy to the K-shell energy (e.g. 543 eV for oxygen) [39]. However, it should be noted, that the effect of Auger decay may absorb a part of the incident energy, especially for low-Z elements [12]. In order to make use of electron impact sources for soft X-ray microscopy, this method relies strongly on the development of highly reflective X-ray mirrors for collecting enough X-rays to provide a high X-ray flux at the specimen [40].
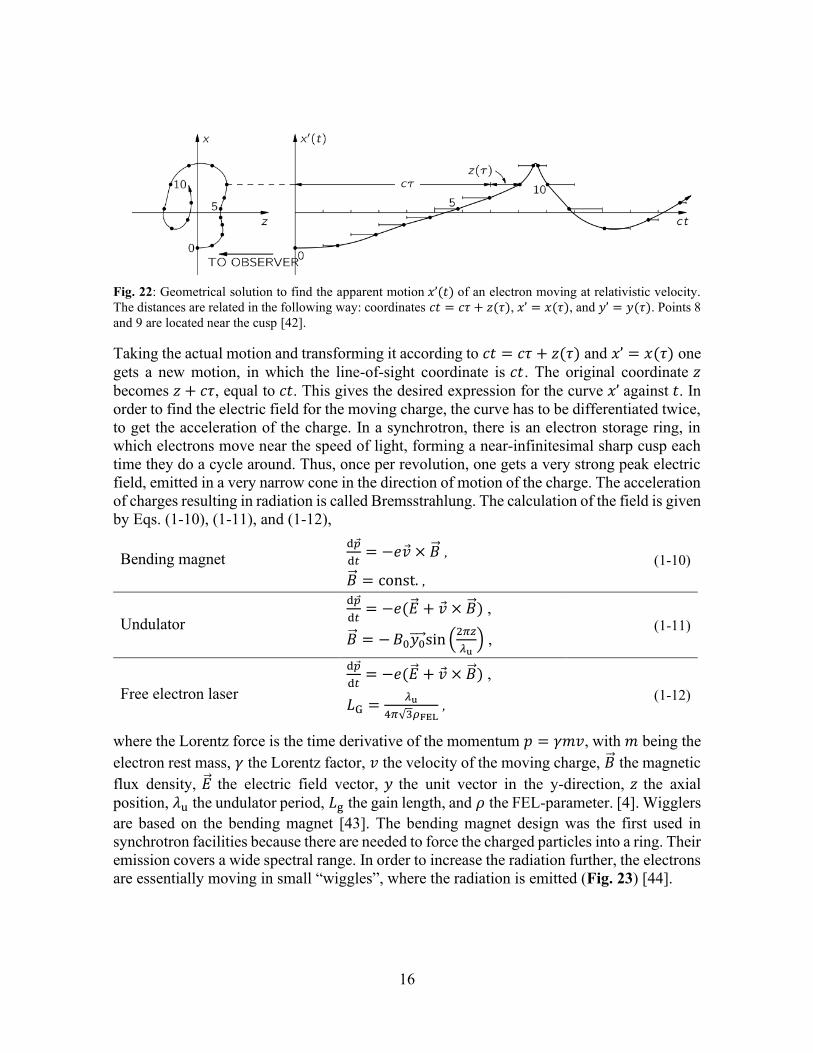
1.2.4 Synchrotron radiation The ALS synchrotron facility, first put into operation in 1993, provides one of the brightest WW-sources available today offering ~4×10¹⁹ photons/s/mm2/mrad2/0.1%BW occurs around 400 eV. The spectral brightness of the “undulator 50” is given in the diagram below (Fig. 21).
Fig. 21: Spectral brightness as a function of photon energy of the radiation sources at ALS. The peak brightness of the U50 undulator amounts to ~4×10¹⁹ photons/s/mm2/mrad2/0.1%BW around 400 eV [41].
A synchrotron can be based on bending magnet, wiggler, undulator, or free electron laser (FEL) radiation. Basically, all these radiations are caused by the influence of magnetic fields on electron motion. However, the details of their design are different, and will be briefly presented in this section. The principles of synchrotron radiation are known for a long time and have been well described for example in [42]. Fig. 22 shows a geometrical method, how to obtain the motion of a relativistic charge as seen by a given observer, describing a path from point 0 to point 10 given in the left x-z-graph.
16
Fig. 22: Geometrical solution to find the apparent motion 𝑥’(𝑡) of an electron moving at relativistic velocity. The distances are related in the following way: coordinates 𝑐𝑡 = 𝑐𝜏 + 𝑧(𝜏), 𝑥’ = 𝑥(𝜏), and 𝑦’ = 𝑦(𝜏). Points 8 and 9 are located near the cusp [42].
Taking the actual motion and transforming it according to 𝑐𝑡 = 𝑐𝜏 + 𝑧(𝜏) and 𝑥’ = 𝑥(𝜏) one gets a new motion, in which the line-of-sight coordinate is 𝑐𝑡. The original coordinate 𝑧 becomes 𝑧 + 𝑐𝜏, equal to 𝑐𝑡. This gives the desired expression for the curve 𝑥’ against 𝑡. In order to find the electric field for the moving charge, the curve has to be differentiated twice, to get the acceleration of the charge. In a synchrotron, there is an electron storage ring, in which electrons move near the speed of light, forming a near-infinitesimal sharp cusp each time they do a cycle around. Thus, once per revolution, one gets a very strong peak electric field, emitted in a very narrow cone in the direction of motion of the charge. The acceleration of charges resulting in radiation is called Bremsstrahlung. The calculation of the field is given by Eqs. (1-10), (1-11), and (1-12),
Bending magnet d��
d𝑡= −𝑒�� × �� ,
�� = const. , (1-10)
Undulator d��
d𝑡= −𝑒(�� + �� × ��) ,
�� = − 𝐵0𝑦0sin (2𝜋𝑧
𝜆u) ,
(1-11)
Free electron laser
d��
d𝑡= −𝑒(�� + �� × ��) ,
𝐿G =𝜆u
4𝜋√3𝜌FEL , (1-12)
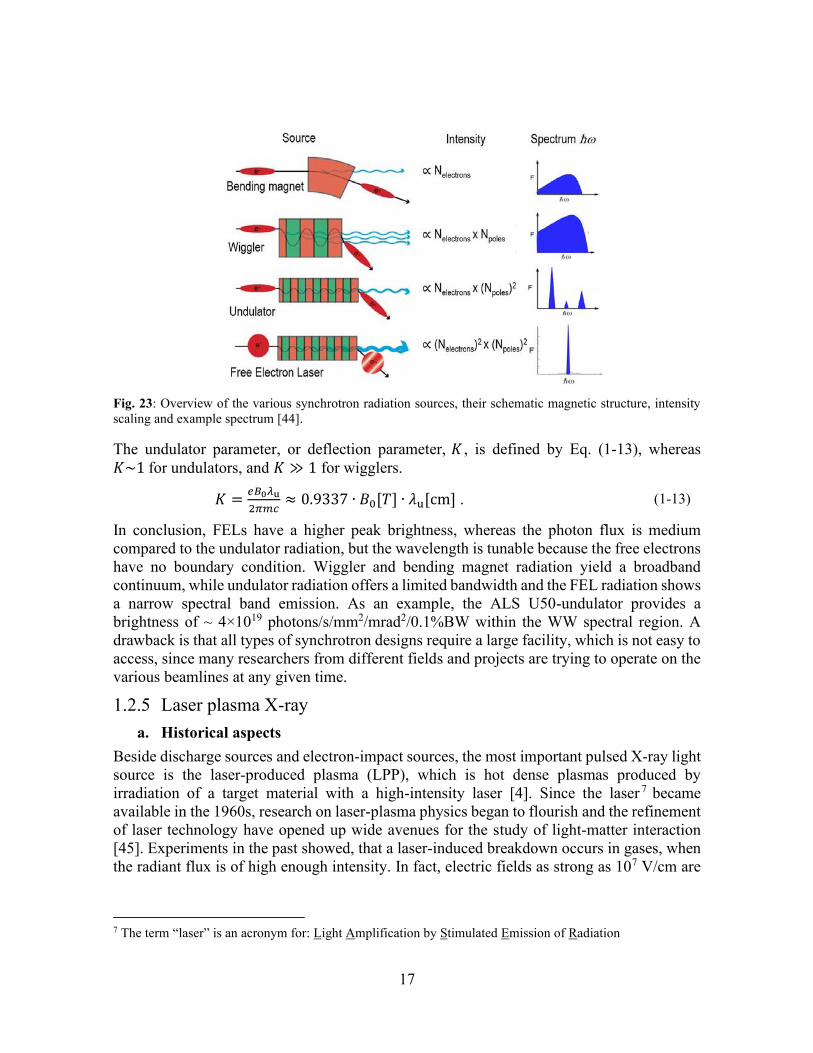
where the Lorentz force is the time derivative of the momentum 𝑝 = 𝛾𝑚𝑣, with 𝑚 being the electron rest mass, 𝛾 the Lorentz factor, 𝑣 the velocity of the moving charge, �� the magnetic flux density, �� the electric field vector, 𝑦 the unit vector in the y-direction, 𝑧 the axial position, 𝜆u the undulator period, 𝐿g the gain length, and 𝜌 the FEL-parameter. [4]. Wigglers are based on the bending magnet [43]. The bending magnet design was the first used in synchrotron facilities because there are needed to force the charged particles into a ring. Their emission covers a wide spectral range. In order to increase the radiation further, the electrons are essentially moving in small “wiggles”, where the radiation is emitted (Fig. 23) [44].
17
Fig. 23: Overview of the various synchrotron radiation sources, their schematic magnetic structure, intensity scaling and example spectrum [44].
The undulator parameter, or deflection parameter, 𝐾 , is defined by Eq. (1-13), whereas 𝐾~1 for undulators, and 𝐾 ≫ 1 for wigglers.
𝐾 =𝑒𝐵0𝜆u
2𝜋𝑚𝑐≈ 0.9337 ∙ 𝐵0[𝑇] ∙ 𝜆u[cm] . (1-13)
In conclusion, FELs have a higher peak brightness, whereas the photon flux is medium compared to the undulator radiation, but the wavelength is tunable because the free electrons have no boundary condition. Wiggler and bending magnet radiation yield a broadband continuum, while undulator radiation offers a limited bandwidth and the FEL radiation shows a narrow spectral band emission. As an example, the ALS U50-undulator provides a brightness of ~ 4×10¹⁹ photons/s/mm2/mrad2/0.1%BW within the WW spectral region. A drawback is that all types of synchrotron designs require a large facility, which is not easy to access, since many researchers from different fields and projects are trying to operate on the various beamlines at any given time.
1.2.5 Laser plasma X-ray a. Historical aspects
Beside discharge sources and electron-impact sources, the most important pulsed X-ray light source is the laser-produced plasma (LPP), which is hot dense plasmas produced by irradiation of a target material with a high-intensity laser [4]. Since the laser 7 became available in the 1960s, research on laser-plasma physics began to flourish and the refinement of laser technology have opened up wide avenues for the study of light-matter interaction [45]. Experiments in the past showed, that a laser-induced breakdown occurs in gases, when the radiant flux is of high enough intensity. In fact, electric fields as strong as 107 V/cm are
7 The term “laser” is an acronym for: Light Amplification by Stimulated Emission of Radiation
18
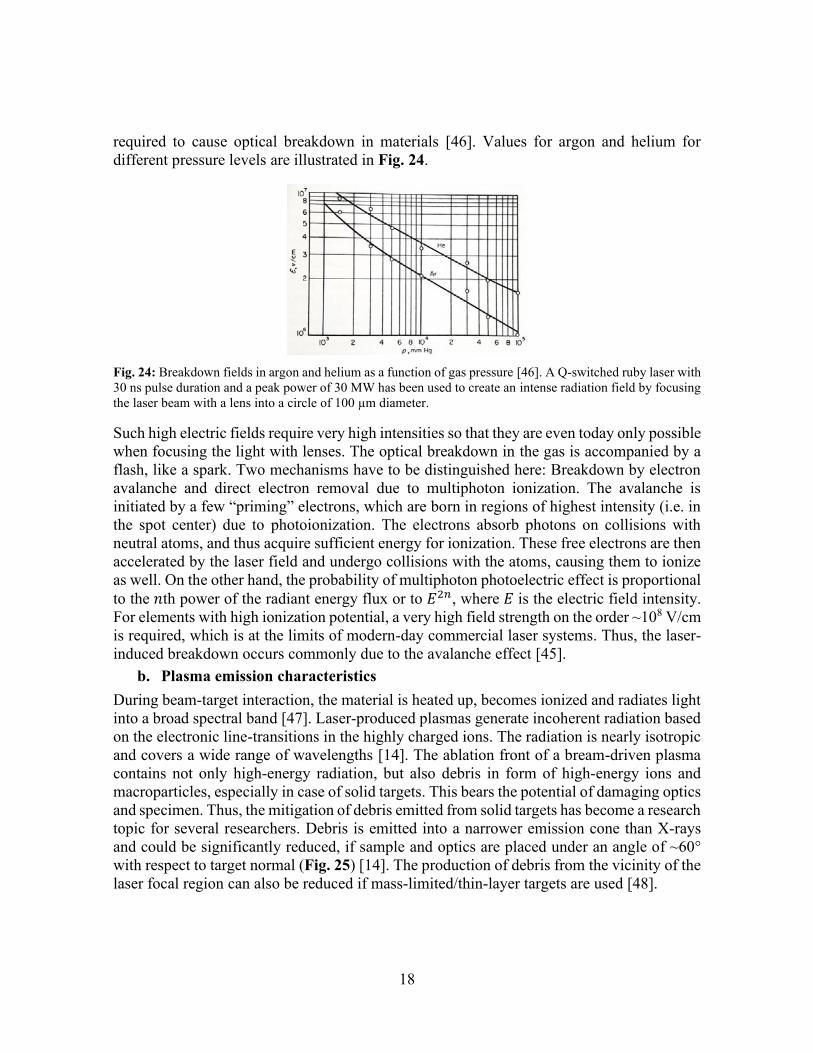
required to cause optical breakdown in materials [46]. Values for argon and helium for different pressure levels are illustrated in Fig. 24.
Fig. 24: Breakdown fields in argon and helium as a function of gas pressure [46]. A Q-switched ruby laser with 30 ns pulse duration and a peak power of 30 MW has been used to create an intense radiation field by focusing the laser beam with a lens into a circle of 100 µm diameter.
Such high electric fields require very high intensities so that they are even today only possible when focusing the light with lenses. The optical breakdown in the gas is accompanied by a flash, like a spark. Two mechanisms have to be distinguished here: Breakdown by electron avalanche and direct electron removal due to multiphoton ionization. The avalanche is initiated by a few “priming” electrons, which are born in regions of highest intensity (i.e. in the spot center) due to photoionization. The electrons absorb photons on collisions with neutral atoms, and thus acquire sufficient energy for ionization. These free electrons are then accelerated by the laser field and undergo collisions with the atoms, causing them to ionize as well. On the other hand, the probability of multiphoton photoelectric effect is proportional to the 𝑛th power of the radiant energy flux or to 𝐸2𝑛, where 𝐸 is the electric field intensity. For elements with high ionization potential, a very high field strength on the order ~108 V/cm is required, which is at the limits of modern-day commercial laser systems. Thus, the laser-induced breakdown occurs commonly due to the avalanche effect [45].
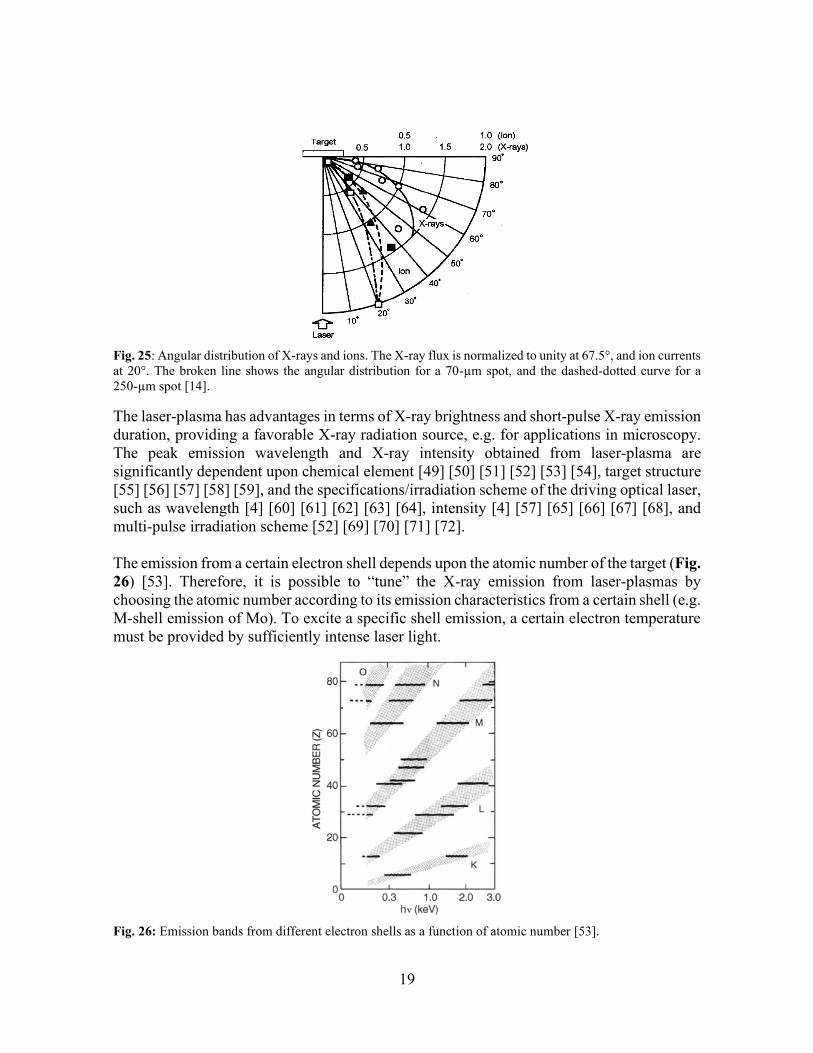
b. Plasma emission characteristics During beam-target interaction, the material is heated up, becomes ionized and radiates light into a broad spectral band [47]. Laser-produced plasmas generate incoherent radiation based on the electronic line-transitions in the highly charged ions. The radiation is nearly isotropic and covers a wide range of wavelengths [14]. The ablation front of a bream-driven plasma contains not only high-energy radiation, but also debris in form of high-energy ions and macroparticles, especially in case of solid targets. This bears the potential of damaging optics and specimen. Thus, the mitigation of debris emitted from solid targets has become a research topic for several researchers. Debris is emitted into a narrower emission cone than X-rays and could be significantly reduced, if sample and optics are placed under an angle of ~60° with respect to target normal (Fig. 25) [14]. The production of debris from the vicinity of the laser focal region can also be reduced if mass-limited/thin-layer targets are used [48].
19
Fig. 25: Angular distribution of X-rays and ions. The X-ray flux is normalized to unity at 67.5°, and ion currents at 20°. The broken line shows the angular distribution for a 70-µm spot, and the dashed-dotted curve for a 250-µm spot [14].
The laser-plasma has advantages in terms of X-ray brightness and short-pulse X-ray emission duration, providing a favorable X-ray radiation source, e.g. for applications in microscopy. The peak emission wavelength and X-ray intensity obtained from laser-plasma are significantly dependent upon chemical element [49] [50] [51] [52] [53] [54], target structure [55] [56] [57] [58] [59], and the specifications/irradiation scheme of the driving optical laser, such as wavelength [4] [60] [61] [62] [63] [64], intensity [4] [57] [65] [66] [67] [68], and multi-pulse irradiation scheme [52] [69] [70] [71] [72]. The emission from a certain electron shell depends upon the atomic number of the target (Fig. 26) [53]. Therefore, it is possible to “tune” the X-ray emission from laser-plasmas by choosing the atomic number according to its emission characteristics from a certain shell (e.g. M-shell emission of Mo). To excite a specific shell emission, a certain electron temperature must be provided by sufficiently intense laser light.
Fig. 26: Emission bands from different electron shells as a function of atomic number [53].
20
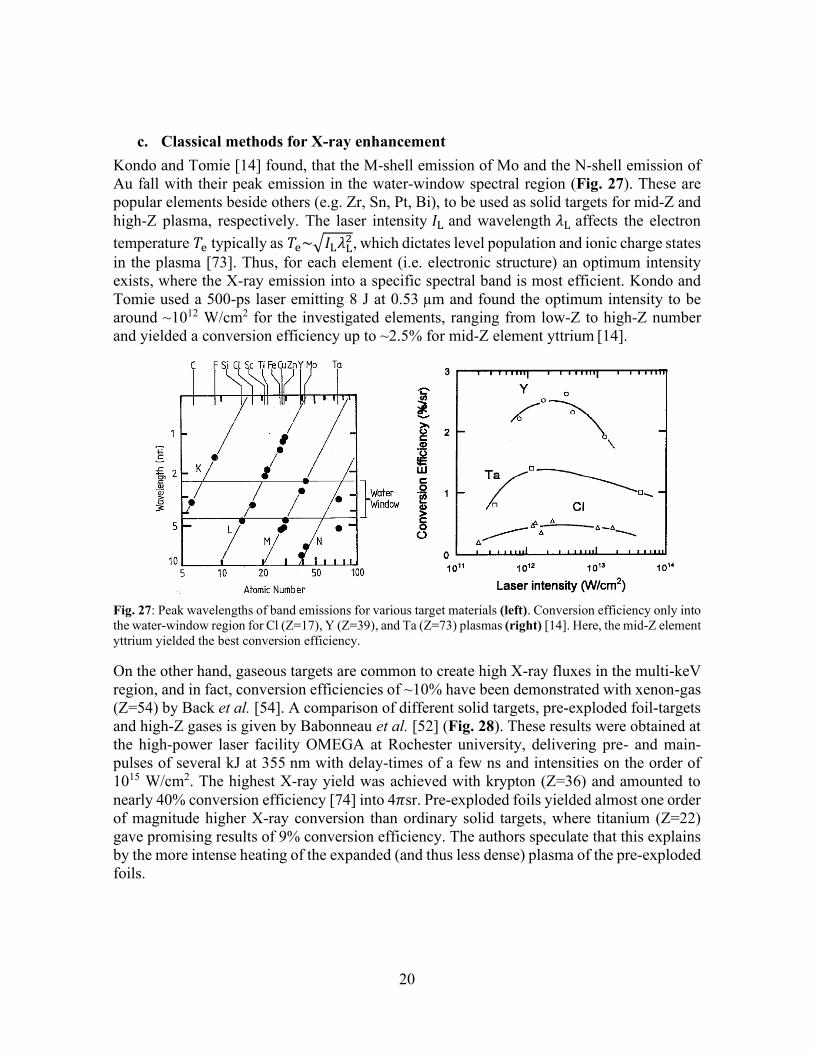
c. Classical methods for X-ray enhancement Kondo and Tomie [14] found, that the M-shell emission of Mo and the N-shell emission of Au fall with their peak emission in the water-window spectral region (Fig. 27). These are popular elements beside others (e.g. Zr, Sn, Pt, Bi), to be used as solid targets for mid-Z and high-Z plasma, respectively. The laser intensity 𝐼L and wavelength 𝜆L affects the electron temperature 𝑇e typically as 𝑇e~√𝐼L𝜆L
2, which dictates level population and ionic charge states in the plasma [73]. Thus, for each element (i.e. electronic structure) an optimum intensity exists, where the X-ray emission into a specific spectral band is most efficient. Kondo and Tomie used a 500-ps laser emitting 8 J at 0.53 µm and found the optimum intensity to be around ~1012 W/cm2 for the investigated elements, ranging from low-Z to high-Z number and yielded a conversion efficiency up to ~2.5% for mid-Z element yttrium [14].
Fig. 27: Peak wavelengths of band emissions for various target materials (left). Conversion efficiency only into the water-window region for Cl (Z=17), Y (Z=39), and Ta (Z=73) plasmas (right) [14]. Here, the mid-Z element yttrium yielded the best conversion efficiency.
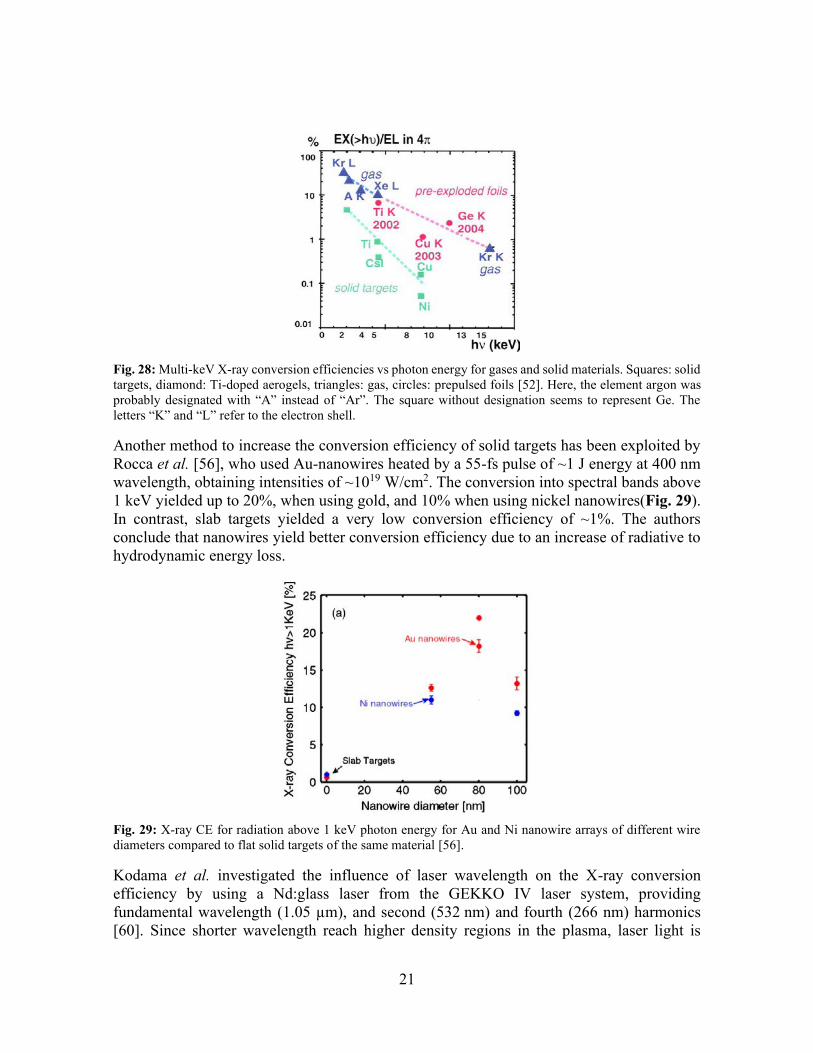
On the other hand, gaseous targets are common to create high X-ray fluxes in the multi-keV region, and in fact, conversion efficiencies of ~10% have been demonstrated with xenon-gas (Z=54) by Back et al. [54]. A comparison of different solid targets, pre-exploded foil-targets and high-Z gases is given by Babonneau et al. [52] (Fig. 28). These results were obtained at the high-power laser facility OMEGA at Rochester university, delivering pre- and main-pulses of several kJ at 355 nm with delay-times of a few ns and intensities on the order of 1015 W/cm2. The highest X-ray yield was achieved with krypton (Z=36) and amounted to nearly 40% conversion efficiency [74] into 4𝜋sr. Pre-exploded foils yielded almost one order of magnitude higher X-ray conversion than ordinary solid targets, where titanium (Z=22) gave promising results of 9% conversion efficiency. The authors speculate that this explains by the more intense heating of the expanded (and thus less dense) plasma of the pre-exploded foils.
21
Fig. 28: Multi-keV X-ray conversion efficiencies vs photon energy for gases and solid materials. Squares: solid targets, diamond: Ti-doped aerogels, triangles: gas, circles: prepulsed foils [52]. Here, the element argon was probably designated with “A” instead of “Ar”. The square without designation seems to represent Ge. The letters “K” and “L” refer to the electron shell.
Another method to increase the conversion efficiency of solid targets has been exploited by Rocca et al. [56], who used Au-nanowires heated by a 55-fs pulse of ~1 J energy at 400 nm wavelength, obtaining intensities of ~1019 W/cm2. The conversion into spectral bands above 1 keV yielded up to 20%, when using gold, and 10% when using nickel nanowires(Fig. 29). In contrast, slab targets yielded a very low conversion efficiency of ~1%. The authors conclude that nanowires yield better conversion efficiency due to an increase of radiative to hydrodynamic energy loss.
Fig. 29: X-ray CE for radiation above 1 keV photon energy for Au and Ni nanowire arrays of different wire diameters compared to flat solid targets of the same material [56].
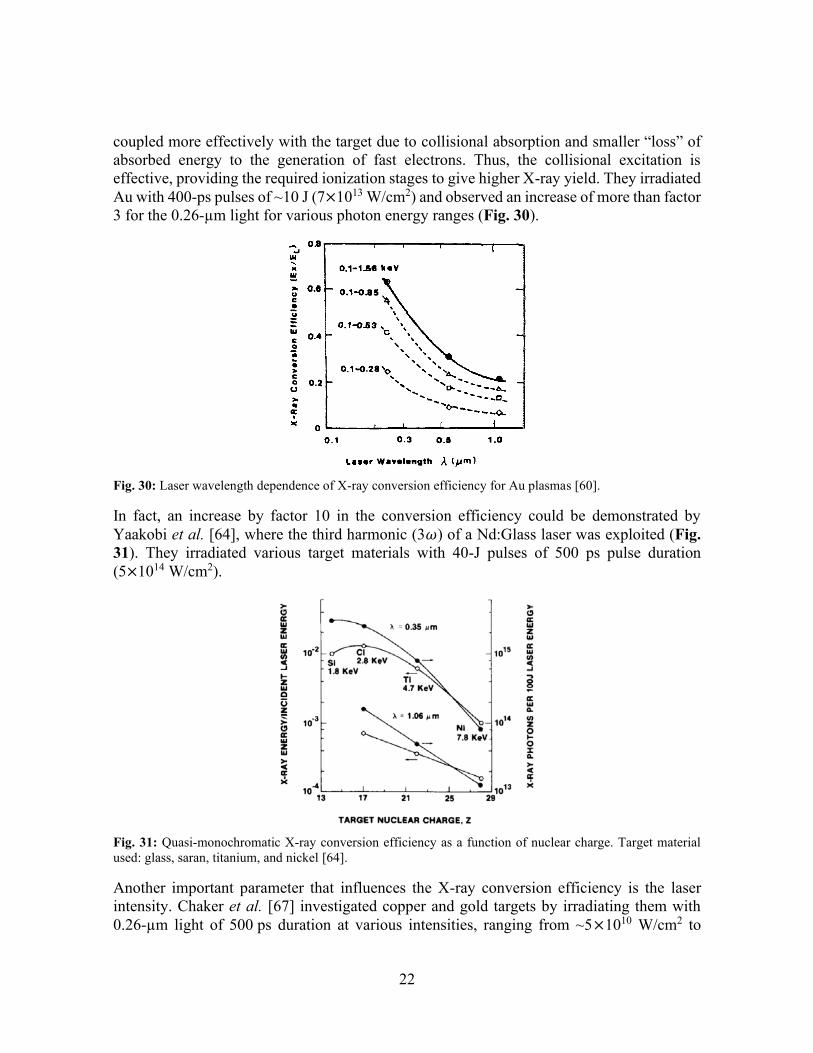
Kodama et al. investigated the influence of laser wavelength on the X-ray conversion efficiency by using a Nd:glass laser from the GEKKO IV laser system, providing fundamental wavelength (1.05 µm), and second (532 nm) and fourth (266 nm) harmonics [60]. Since shorter wavelength reach higher density regions in the plasma, laser light is
22
coupled more effectively with the target due to collisional absorption and smaller “loss” of absorbed energy to the generation of fast electrons. Thus, the collisional excitation is effective, providing the required ionization stages to give higher X-ray yield. They irradiated Au with 400-ps pulses of ~10 J (7×10¹³ W/cm2) and observed an increase of more than factor 3 for the 0.26-µm light for various photon energy ranges (Fig. 30).
Fig. 30: Laser wavelength dependence of X-ray conversion efficiency for Au plasmas [60].
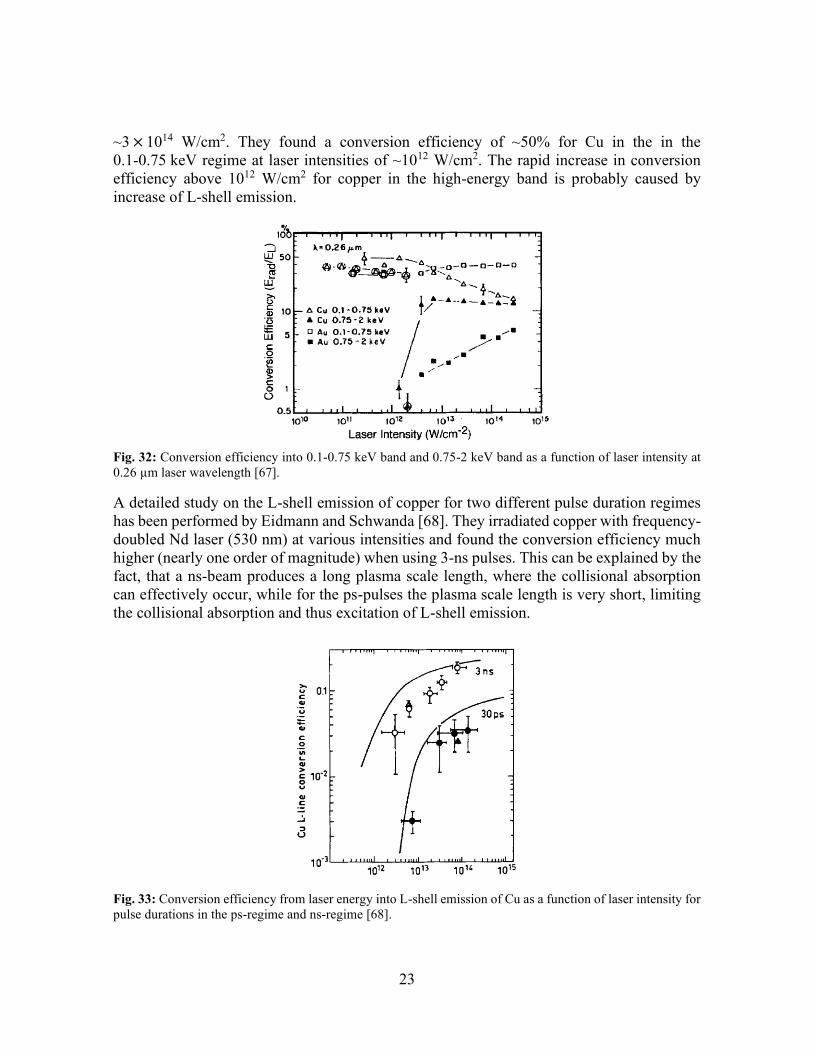
In fact, an increase by factor 10 in the conversion efficiency could be demonstrated by Yaakobi et al. [64], where the third harmonic (3𝜔) of a Nd:Glass laser was exploited (Fig. 31). They irradiated various target materials with 40-J pulses of 500 ps pulse duration (5×10¹⁴ W/cm2).
Fig. 31: Quasi-monochromatic X-ray conversion efficiency as a function of nuclear charge. Target material used: glass, saran, titanium, and nickel [64].
Another important parameter that influences the X-ray conversion efficiency is the laser intensity. Chaker et al. [67] investigated copper and gold targets by irradiating them with 0.26-µm light of 500 ps duration at various intensities, ranging from ~5×10¹⁰ W/cm2 to
23
~3 × 10¹⁴ W/cm2. They found a conversion efficiency of ~50% for Cu in the in the 0.1-0.75 keV regime at laser intensities of ~1012 W/cm2. The rapid increase in conversion efficiency above 1012 W/cm2 for copper in the high-energy band is probably caused by increase of L-shell emission.
Fig. 32: Conversion efficiency into 0.1-0.75 keV band and 0.75-2 keV band as a function of laser intensity at 0.26 µm laser wavelength [67].
A detailed study on the L-shell emission of copper for two different pulse duration regimes has been performed by Eidmann and Schwanda [68]. They irradiated copper with frequency-doubled Nd laser (530 nm) at various intensities and found the conversion efficiency much higher (nearly one order of magnitude) when using 3-ns pulses. This can be explained by the fact, that a ns-beam produces a long plasma scale length, where the collisional absorption can effectively occur, while for the ps-pulses the plasma scale length is very short, limiting the collisional absorption and thus excitation of L-shell emission.
Fig. 33: Conversion efficiency from laser energy into L-shell emission of Cu as a function of laser intensity for pulse durations in the ps-regime and ns-regime [68].
24
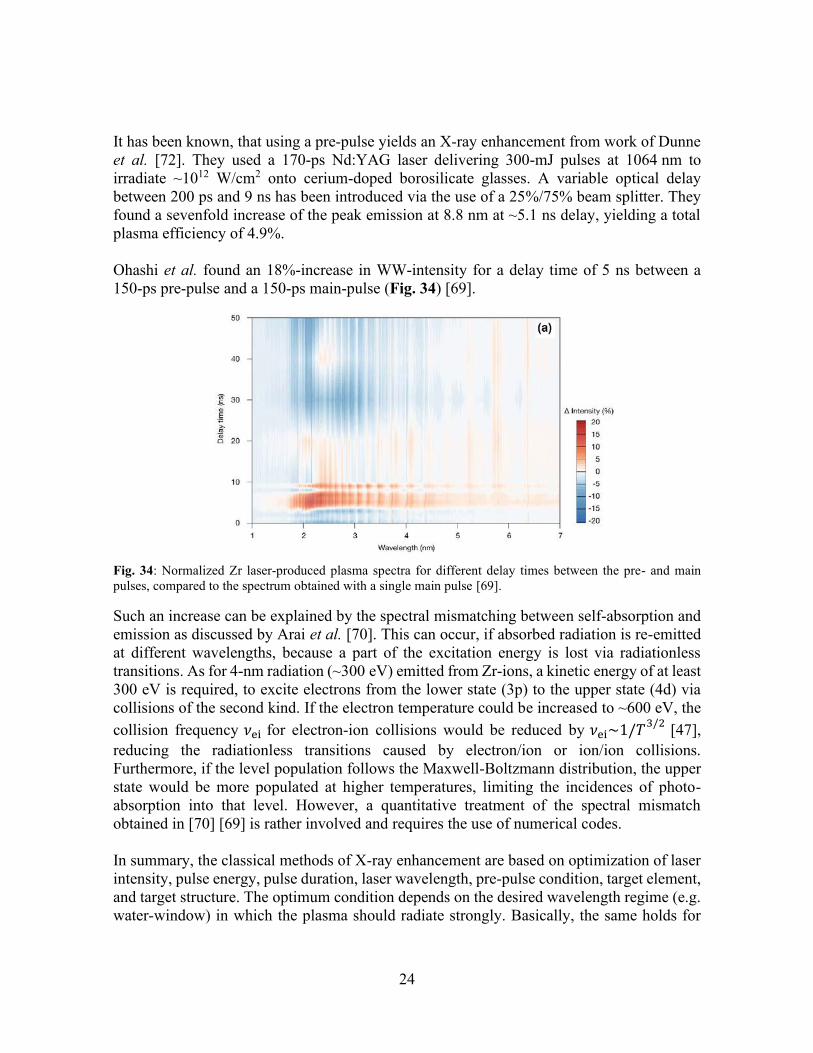
It has been known, that using a pre-pulse yields an X-ray enhancement from work of Dunne et al. [72]. They used a 170-ps Nd:YAG laser delivering 300-mJ pulses at 1064 nm to irradiate ~1012 W/cm2 onto cerium-doped borosilicate glasses. A variable optical delay between 200 ps and 9 ns has been introduced via the use of a 25%/75% beam splitter. They found a sevenfold increase of the peak emission at 8.8 nm at ~5.1 ns delay, yielding a total plasma efficiency of 4.9%. Ohashi et al. found an 18%-increase in WW-intensity for a delay time of 5 ns between a 150-ps pre-pulse and a 150-ps main-pulse (Fig. 34) [69].
Fig. 34: Normalized Zr laser-produced plasma spectra for different delay times between the pre- and main pulses, compared to the spectrum obtained with a single main pulse [69].
Such an increase can be explained by the spectral mismatching between self-absorption and emission as discussed by Arai et al. [70]. This can occur, if absorbed radiation is re-emitted at different wavelengths, because a part of the excitation energy is lost via radiationless transitions. As for 4-nm radiation (~300 eV) emitted from Zr-ions, a kinetic energy of at least 300 eV is required, to excite electrons from the lower state (3p) to the upper state (4d) via collisions of the second kind. If the electron temperature could be increased to ~600 eV, the collision frequency 𝜈ei for electron-ion collisions would be reduced by 𝜈ei~1/𝑇
3/2 [47], reducing the radiationless transitions caused by electron/ion or ion/ion collisions. Furthermore, if the level population follows the Maxwell-Boltzmann distribution, the upper state would be more populated at higher temperatures, limiting the incidences of photo-absorption into that level. However, a quantitative treatment of the spectral mismatch obtained in [70] [69] is rather involved and requires the use of numerical codes. In summary, the classical methods of X-ray enhancement are based on optimization of laser intensity, pulse energy, pulse duration, laser wavelength, pre-pulse condition, target element, and target structure. The optimum condition depends on the desired wavelength regime (e.g. water-window) in which the plasma should radiate strongly. Basically, the same holds for
25
fusion targets and X-ray amplifiers, however, since they are very distinct methods, they will be treated separately in the following sections. The novel X-ray enhancement method discovered by Kado et al. [75], will be treated in chapter 3 in detail.
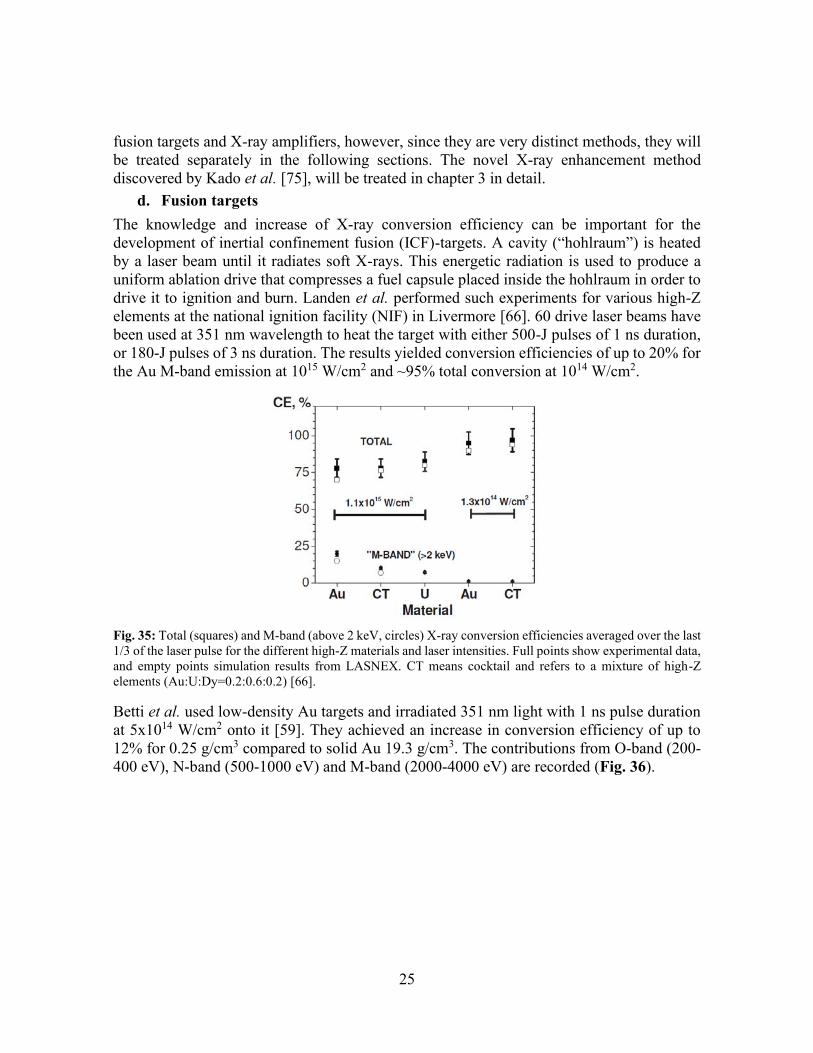
d. Fusion targets The knowledge and increase of X-ray conversion efficiency can be important for the development of inertial confinement fusion (ICF)-targets. A cavity (“hohlraum”) is heated by a laser beam until it radiates soft X-rays. This energetic radiation is used to produce a uniform ablation drive that compresses a fuel capsule placed inside the hohlraum in order to drive it to ignition and burn. Landen et al. performed such experiments for various high-Z elements at the national ignition facility (NIF) in Livermore [66]. 60 drive laser beams have been used at 351 nm wavelength to heat the target with either 500-J pulses of 1 ns duration, or 180-J pulses of 3 ns duration. The results yielded conversion efficiencies of up to 20% for the Au M-band emission at 1015 W/cm2 and ~95% total conversion at 1014 W/cm2.
Fig. 35: Total (squares) and M-band (above 2 keV, circles) X-ray conversion efficiencies averaged over the last 1/3 of the laser pulse for the different high-Z materials and laser intensities. Full points show experimental data, and empty points simulation results from LASNEX. CT means cocktail and refers to a mixture of high-Z elements (Au:U:Dy=0.2:0.6:0.2) [66].
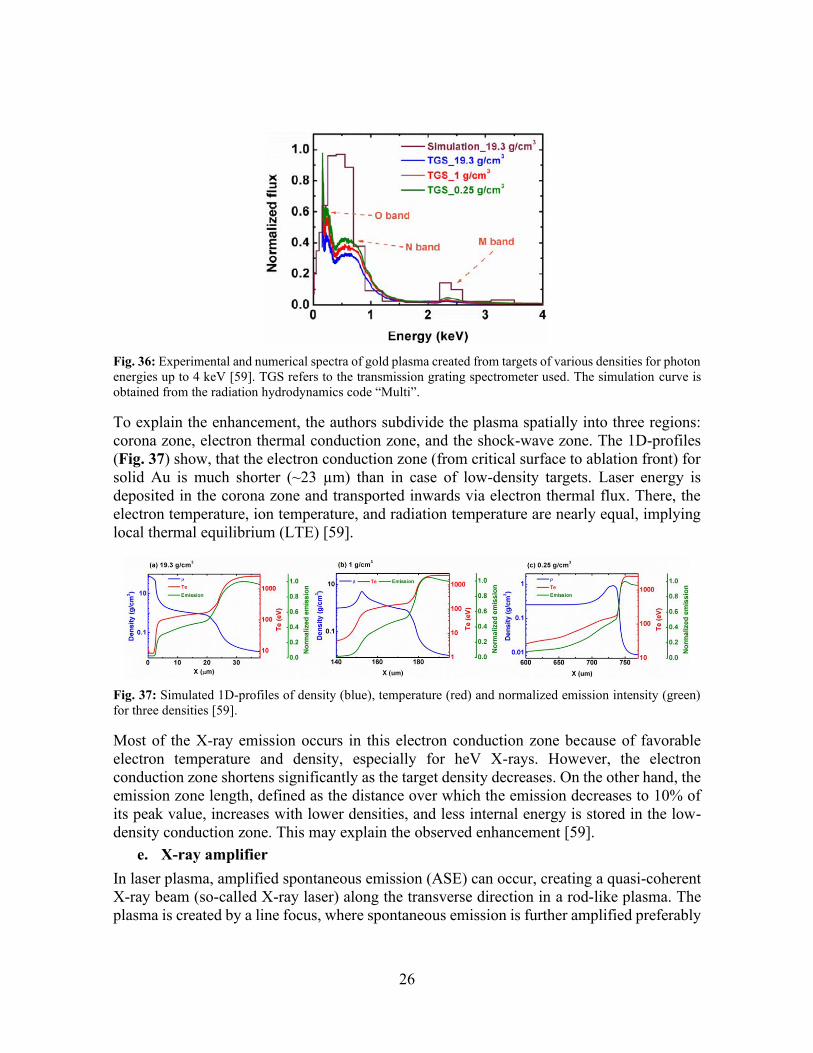
Betti et al. used low-density Au targets and irradiated 351 nm light with 1 ns pulse duration at 5x10¹⁴ W/cm2 onto it [59]. They achieved an increase in conversion efficiency of up to 12% for 0.25 g/cm3 compared to solid Au 19.3 g/cm3. The contributions from O-band (200-400 eV), N-band (500-1000 eV) and M-band (2000-4000 eV) are recorded (Fig. 36).
26
Fig. 36: Experimental and numerical spectra of gold plasma created from targets of various densities for photon energies up to 4 keV [59]. TGS refers to the transmission grating spectrometer used. The simulation curve is obtained from the radiation hydrodynamics code “Multi”.
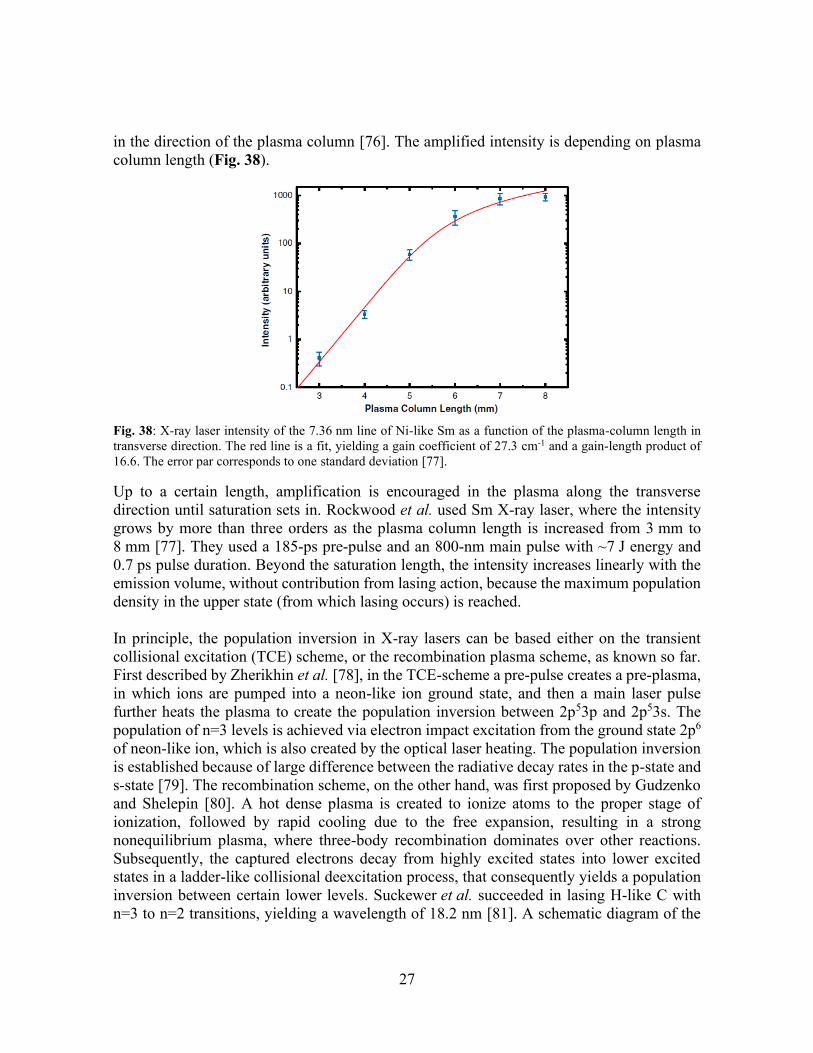
To explain the enhancement, the authors subdivide the plasma spatially into three regions: corona zone, electron thermal conduction zone, and the shock-wave zone. The 1D-profiles (Fig. 37) show, that the electron conduction zone (from critical surface to ablation front) for solid Au is much shorter (~23 µm) than in case of low-density targets. Laser energy is deposited in the corona zone and transported inwards via electron thermal flux. There, the electron temperature, ion temperature, and radiation temperature are nearly equal, implying local thermal equilibrium (LTE) [59].
Fig. 37: Simulated 1D-profiles of density (blue), temperature (red) and normalized emission intensity (green) for three densities [59].
Most of the X-ray emission occurs in this electron conduction zone because of favorable electron temperature and density, especially for heV X-rays. However, the electron conduction zone shortens significantly as the target density decreases. On the other hand, the emission zone length, defined as the distance over which the emission decreases to 10% of its peak value, increases with lower densities, and less internal energy is stored in the low-density conduction zone. This may explain the observed enhancement [59].
e. X-ray amplifier In laser plasma, amplified spontaneous emission (ASE) can occur, creating a quasi-coherent X-ray beam (so-called X-ray laser) along the transverse direction in a rod-like plasma. The plasma is created by a line focus, where spontaneous emission is further amplified preferably
27
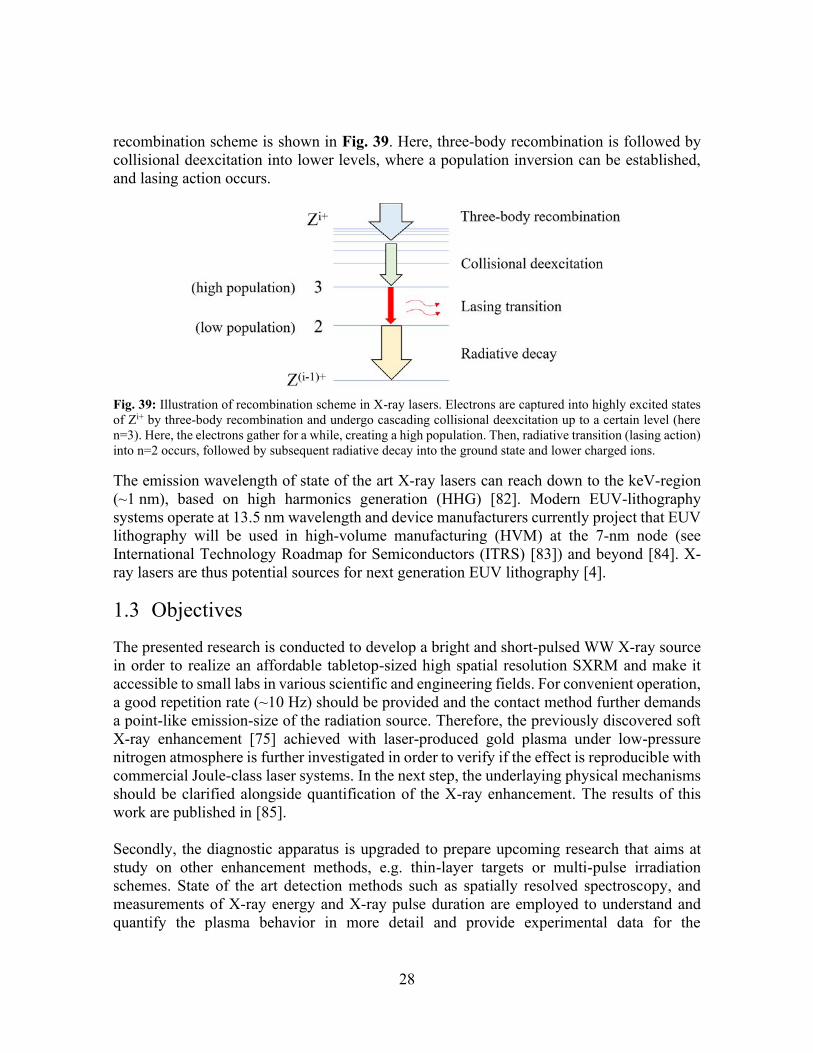
in the direction of the plasma column [76]. The amplified intensity is depending on plasma column length (Fig. 38).
Fig. 38: X-ray laser intensity of the 7.36 nm line of Ni-like Sm as a function of the plasma-column length in transverse direction. The red line is a fit, yielding a gain coefficient of 27.3 cm-1 and a gain-length product of 16.6. The error par corresponds to one standard deviation [77].
Up to a certain length, amplification is encouraged in the plasma along the transverse direction until saturation sets in. Rockwood et al. used Sm X-ray laser, where the intensity grows by more than three orders as the plasma column length is increased from 3 mm to 8 mm [77]. They used a 185-ps pre-pulse and an 800-nm main pulse with ~7 J energy and 0.7 ps pulse duration. Beyond the saturation length, the intensity increases linearly with the emission volume, without contribution from lasing action, because the maximum population density in the upper state (from which lasing occurs) is reached. In principle, the population inversion in X-ray lasers can be based either on the transient collisional excitation (TCE) scheme, or the recombination plasma scheme, as known so far. First described by Zherikhin et al. [78], in the TCE-scheme a pre-pulse creates a pre-plasma, in which ions are pumped into a neon-like ion ground state, and then a main laser pulse further heats the plasma to create the population inversion between 2p53p and 2p53s. The population of n=3 levels is achieved via electron impact excitation from the ground state 2p6 of neon-like ion, which is also created by the optical laser heating. The population inversion is established because of large difference between the radiative decay rates in the p-state and s-state [79]. The recombination scheme, on the other hand, was first proposed by Gudzenko and Shelepin [80]. A hot dense plasma is created to ionize atoms to the proper stage of ionization, followed by rapid cooling due to the free expansion, resulting in a strong nonequilibrium plasma, where three-body recombination dominates over other reactions. Subsequently, the captured electrons decay from highly excited states into lower excited states in a ladder-like collisional deexcitation process, that consequently yields a population inversion between certain lower levels. Suckewer et al. succeeded in lasing H-like C with n=3 to n=2 transitions, yielding a wavelength of 18.2 nm [81]. A schematic diagram of the
28
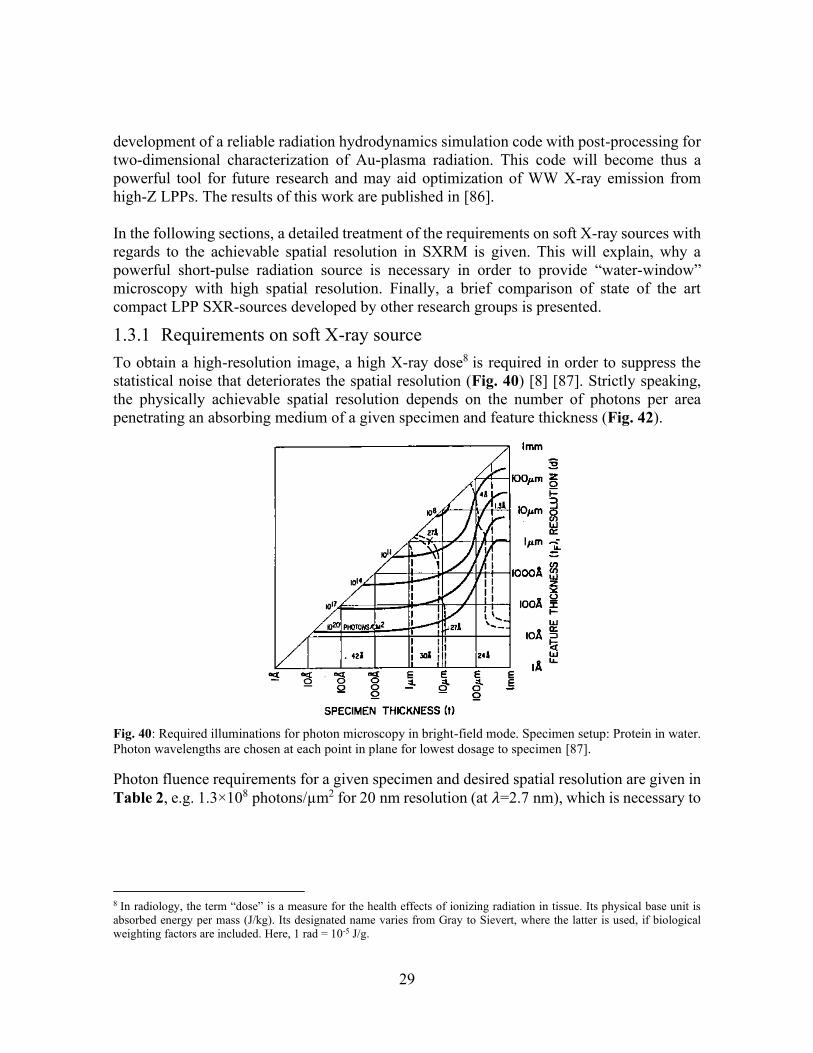
recombination scheme is shown in Fig. 39. Here, three-body recombination is followed by collisional deexcitation into lower levels, where a population inversion can be established, and lasing action occurs.
Fig. 39: Illustration of recombination scheme in X-ray lasers. Electrons are captured into highly excited states of Zi+ by three-body recombination and undergo cascading collisional deexcitation up to a certain level (here n=3). Here, the electrons gather for a while, creating a high population. Then, radiative transition (lasing action) into n=2 occurs, followed by subsequent radiative decay into the ground state and lower charged ions.
The emission wavelength of state of the art X-ray lasers can reach down to the keV-region (~1 nm), based on high harmonics generation (HHG) [82]. Modern EUV-lithography systems operate at 13.5 nm wavelength and device manufacturers currently project that EUV lithography will be used in high-volume manufacturing (HVM) at the 7-nm node (see International Technology Roadmap for Semiconductors (ITRS) [83]) and beyond [84]. X-ray lasers are thus potential sources for next generation EUV lithography [4].
1.3 Objectives
The presented research is conducted to develop a bright and short-pulsed WW X-ray source in order to realize an affordable tabletop-sized high spatial resolution SXRM and make it accessible to small labs in various scientific and engineering fields. For convenient operation, a good repetition rate (~10 Hz) should be provided and the contact method further demands a point-like emission-size of the radiation source. Therefore, the previously discovered soft X-ray enhancement [75] achieved with laser-produced gold plasma under low-pressure nitrogen atmosphere is further investigated in order to verify if the effect is reproducible with commercial Joule-class laser systems. In the next step, the underlaying physical mechanisms should be clarified alongside quantification of the X-ray enhancement. The results of this work are published in [85]. Secondly, the diagnostic apparatus is upgraded to prepare upcoming research that aims at study on other enhancement methods, e.g. thin-layer targets or multi-pulse irradiation schemes. State of the art detection methods such as spatially resolved spectroscopy, and measurements of X-ray energy and X-ray pulse duration are employed to understand and quantify the plasma behavior in more detail and provide experimental data for the
29
development of a reliable radiation hydrodynamics simulation code with post-processing for two-dimensional characterization of Au-plasma radiation. This code will become thus a powerful tool for future research and may aid optimization of WW X-ray emission from high-Z LPPs. The results of this work are published in [86]. In the following sections, a detailed treatment of the requirements on soft X-ray sources with regards to the achievable spatial resolution in SXRM is given. This will explain, why a powerful short-pulse radiation source is necessary in order to provide “water-window” microscopy with high spatial resolution. Finally, a brief comparison of state of the art compact LPP SXR-sources developed by other research groups is presented.
1.3.1 Requirements on soft X-ray source To obtain a high-resolution image, a high X-ray dose8 is required in order to suppress the statistical noise that deteriorates the spatial resolution (Fig. 40) [8] [87]. Strictly speaking, the physically achievable spatial resolution depends on the number of photons per area penetrating an absorbing medium of a given specimen and feature thickness (Fig. 42).
Fig. 40: Required illuminations for photon microscopy in bright-field mode. Specimen setup: Protein in water. Photon wavelengths are chosen at each point in plane for lowest dosage to specimen [87].
Photon fluence requirements for a given specimen and desired spatial resolution are given in Table 2, e.g. 1.3×10⁸ photons/µm2 for 20 nm resolution (at 𝜆=2.7 nm), which is necessary to
8 In radiology, the term “dose” is a measure for the health effects of ionizing radiation in tissue. Its physical base unit is absorbed energy per mass (J/kg). Its designated name varies from Gray to Sievert, where the latter is used, if biological weighting factors are included. Here, 1 rad = 10-5 J/g.
30
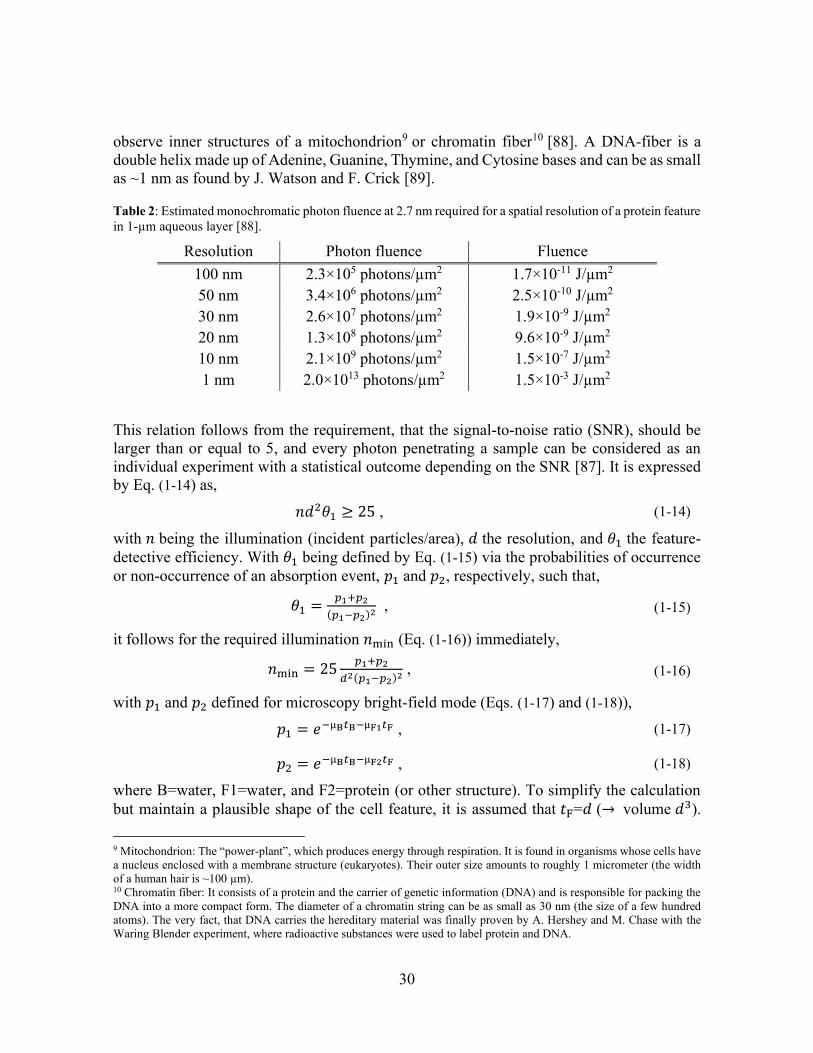
observe inner structures of a mitochondrion9 or chromatin fiber10 [88]. A DNA-fiber is a double helix made up of Adenine, Guanine, Thymine, and Cytosine bases and can be as small as ~1 nm as found by J. Watson and F. Crick [89].
Table 2: Estimated monochromatic photon fluence at 2.7 nm required for a spatial resolution of a protein feature in 1-µm aqueous layer [88].
Resolution Photon fluence Fluence 100 nm 2.3×10⁵ photons/µm2 1.7×10⁻¹¹ J/µm2 50 nm 3.4×10⁶ photons/µm2 2.5×10⁻¹⁰ J/µm2 30 nm 2.6×10⁷ photons/µm2 1.9×10⁻⁹ J/µm2 20 nm 1.3×10⁸ photons/µm2 9.6×10⁻⁹ J/µm2 10 nm 2.1×10⁹ photons/µm2 1.5×10⁻⁷ J/µm2 1 nm 2.0×10¹³ photons/µm2 1.5×10⁻³ J/µm2
This relation follows from the requirement, that the signal-to-noise ratio (SNR), should be larger than or equal to 5, and every photon penetrating a sample can be considered as an individual experiment with a statistical outcome depending on the SNR [87]. It is expressed by Eq. (1-14) as,
𝑛𝑑2𝜃1 ≥ 25 , (1-14)
with 𝑛 being the illumination (incident particles/area), 𝑑 the resolution, and 𝜃1 the feature-detective efficiency. With 𝜃1 being defined by Eq. (1-15) via the probabilities of occurrence or non-occurrence of an absorption event, 𝑝1 and 𝑝2, respectively, such that,
𝜃1 =𝑝1+𝑝2
(𝑝1−𝑝2)2 , (1-15)
it follows for the required illumination 𝑛min (Eq. (1-16)) immediately,
𝑛min = 25𝑝1+𝑝2
𝑑2(𝑝1−𝑝2)2 , (1-16)
with 𝑝1 and 𝑝2 defined for microscopy bright-field mode (Eqs. (1-17) and (1-18)),
𝑝1 = 𝑒−µB𝑡B−µF1𝑡F , (1-17)
𝑝2 = 𝑒−µB𝑡B−µF2𝑡F , (1-18)
where B=water, F1=water, and F2=protein (or other structure). To simplify the calculation but maintain a plausible shape of the cell feature, it is assumed that 𝑡F=𝑑 (→ volume 𝑑3).
9 Mitochondrion: The “power-plant”, which produces energy through respiration. It is found in organisms whose cells have a nucleus enclosed with a membrane structure (eukaryotes). Their outer size amounts to roughly 1 micrometer (the width of a human hair is ~100 µm). 10 Chromatin fiber: It consists of a protein and the carrier of genetic information (DNA) and is responsible for packing the DNA into a more compact form. The diameter of a chromatin string can be as small as 30 nm (the size of a few hundred atoms). The very fact, that DNA carries the hereditary material was finally proven by A. Hershey and M. Chase with the Waring Blender experiment, where radioactive substances were used to label protein and DNA.
31
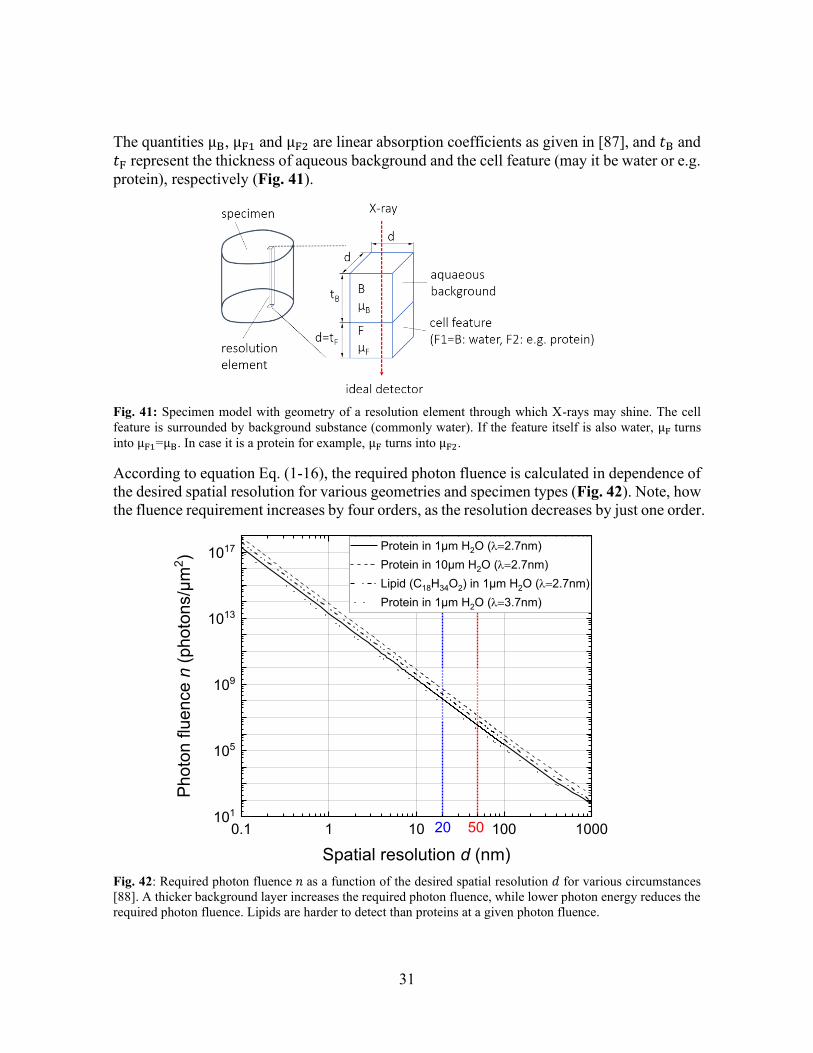
The quantities µB, µF1 and µF2 are linear absorption coefficients as given in [87], and 𝑡B and 𝑡F represent the thickness of aqueous background and the cell feature (may it be water or e.g. protein), respectively (Fig. 41).
Fig. 41: Specimen model with geometry of a resolution element through which X-rays may shine. The cell feature is surrounded by background substance (commonly water). If the feature itself is also water, µF turns into µF1=µB. In case it is a protein for example, µF turns into µF2.
According to equation Eq. (1-16), the required photon fluence is calculated in dependence of the desired spatial resolution for various geometries and specimen types (Fig. 42). Note, how the fluence requirement increases by four orders, as the resolution decreases by just one order.
0.1 1 10 100 1000101
105
109
1013
1017 Protein in 1µm H2O (l=2.7nm) Protein in 10µm H2O (l=2.7nm) Lipid (C18H34O2) in 1µm H2O (l=2.7nm) Protein in 1µm H2O (l=3.7nm)
Phot
on fl
uenc
e n
(pho
tons
/µm
2 )
Spatial resolution d (nm)5020
Fig. 42: Required photon fluence 𝑛 as a function of the desired spatial resolution 𝑑 for various circumstances [88]. A thicker background layer increases the required photon fluence, while lower photon energy reduces the required photon fluence. Lipids are harder to detect than proteins at a given photon fluence.
32
Sayre et al. [8] further assume, that the radiation dose in the specimen is a reliable index of specimen damage. 109 rad represents the maximum dosage consistent with structural survival of an unfixed biological specimen, equivalent to 104 J/g. The specimen is assumed to consist of two layers (F1=water, F2=protein). The photon irradiation in bright-field mode yields at 𝑡=5 µm a dosage advantage by more than 104:1 compared with electron beam (for unstained specimen), which underlines the power of ultrasoft X-rays. Now, in order to observe a 30-nm chromatin-fiber, the required photon fluence amounts to ~2.6×10⁷ photons/µm2. By converting the photon number to energy according to Eqs. (1-22) and (1-23) [4],
1J ⇒ 5. 034× 1015 × 𝜆 [ nm ] , (1-19)
1photon⇒ 1. 99× 10−16 J / 𝜆 [ nm ] , (1-20)
a fluence 𝐹 =1.9×10⁻⁹ J/µm2 is required to obtain 30 nm spatial resolution. The absorbed amount of energy (Eq. (1-21)) depends upon the absorption coefficient µ, feature depth 𝑑, and absorption area 𝑑2,
𝐸 abs= 𝐹 𝑑2(1− 𝑒−µ𝑑) , (1-21)
and yields a dosage 𝐷 (Eq. (1-22)) in a fixed volume element 𝑑3 according to,
𝐷 =𝐸 abs
𝜌 𝑑 3 ≤ 104J
g , (1-22)
where 𝜌 is the density of the feature. The average density of protein is 1.35× 10⁻¹² g/µm3 [90]. As listed in Table 3, the dosage received by a chromatin fiber would be above the damage threshold by a factor of ~4 in order to resolve its shape.
Table 3: Absorbed energy and received dosage by a specimen of fixed geometry with volume (0.03 µm)3, absorption area (0.03 µm)2 and depth 0.03 µm.
Resolution 𝑑 Absorbed energy [J] Dosage received [J/g] 50 nm 1.2× 10⁻¹⁴ 3.3× 10² 30 nm 9.2× 10⁻¹⁴ 2.5× 10³ 20 nm 4.6× 10⁻¹³ 1.3× 10⁴
This means, that up to ~20 nm resolution, the dosage is not high enough to cause structural damage, so the irradiation time can be arbitrary long. However, as soon as the dosage surpasses 104 J/g, structural damages set in. Thermal effects could induce such damages, potentially blurring the image. To avoid this, the exposure time should be limited to “freeze” the motion induced by thermal effects. A rough estimate for the required exposure time is now derived from thermal conductivity. In analogy to the discharge of a capacitor, the thermalization time is given by Eqs. (1-23), (1-24), (1-25), and (1-26) [91],
𝜏 = 𝑅𝐶 , (1-23)
with,
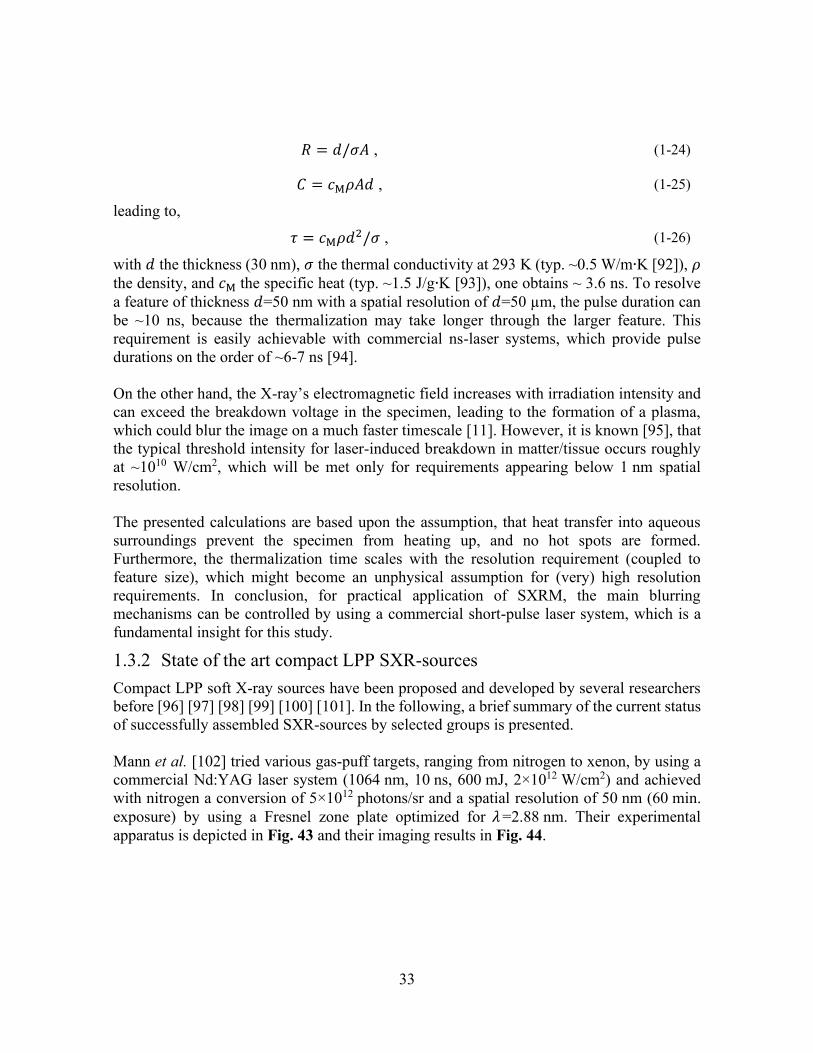
33
𝑅 = 𝑑/𝜎𝐴 , (1-24)
𝐶 = 𝑐M𝜌𝐴𝑑 , (1-25)
leading to,
𝜏 = 𝑐M𝜌𝑑2/𝜎 , (1-26)
with 𝑑 the thickness (30 nm), 𝜎 the thermal conductivity at 293 K (typ. ~0.5 W/m∙K [92]), 𝜌 the density, and 𝑐M the specific heat (typ. ~1.5 J/g∙K [93]), one obtains ~ 3.6 ns. To resolve a feature of thickness 𝑑=50 nm with a spatial resolution of 𝑑=50 µm, the pulse duration can be ~10 ns, because the thermalization may take longer through the larger feature. This requirement is easily achievable with commercial ns-laser systems, which provide pulse durations on the order of ~6-7 ns [94]. On the other hand, the X-ray’s electromagnetic field increases with irradiation intensity and can exceed the breakdown voltage in the specimen, leading to the formation of a plasma, which could blur the image on a much faster timescale [11]. However, it is known [95], that the typical threshold intensity for laser-induced breakdown in matter/tissue occurs roughly at ~1010 W/cm2, which will be met only for requirements appearing below 1 nm spatial resolution. The presented calculations are based upon the assumption, that heat transfer into aqueous surroundings prevent the specimen from heating up, and no hot spots are formed. Furthermore, the thermalization time scales with the resolution requirement (coupled to feature size), which might become an unphysical assumption for (very) high resolution requirements. In conclusion, for practical application of SXRM, the main blurring mechanisms can be controlled by using a commercial short-pulse laser system, which is a fundamental insight for this study.
1.3.2 State of the art compact LPP SXR-sources Compact LPP soft X-ray sources have been proposed and developed by several researchers before [96] [97] [98] [99] [100] [101]. In the following, a brief summary of the current status of successfully assembled SXR-sources by selected groups is presented. Mann et al. [102] tried various gas-puff targets, ranging from nitrogen to xenon, by using a commercial Nd:YAG laser system (1064 nm, 10 ns, 600 mJ, 2×10¹² W/cm2) and achieved with nitrogen a conversion of 5×10¹² photons/sr and a spatial resolution of 50 nm (60 min. exposure) by using a Fresnel zone plate optimized for 𝜆 =2.88 nm. Their experimental apparatus is depicted in Fig. 43 and their imaging results in Fig. 44.
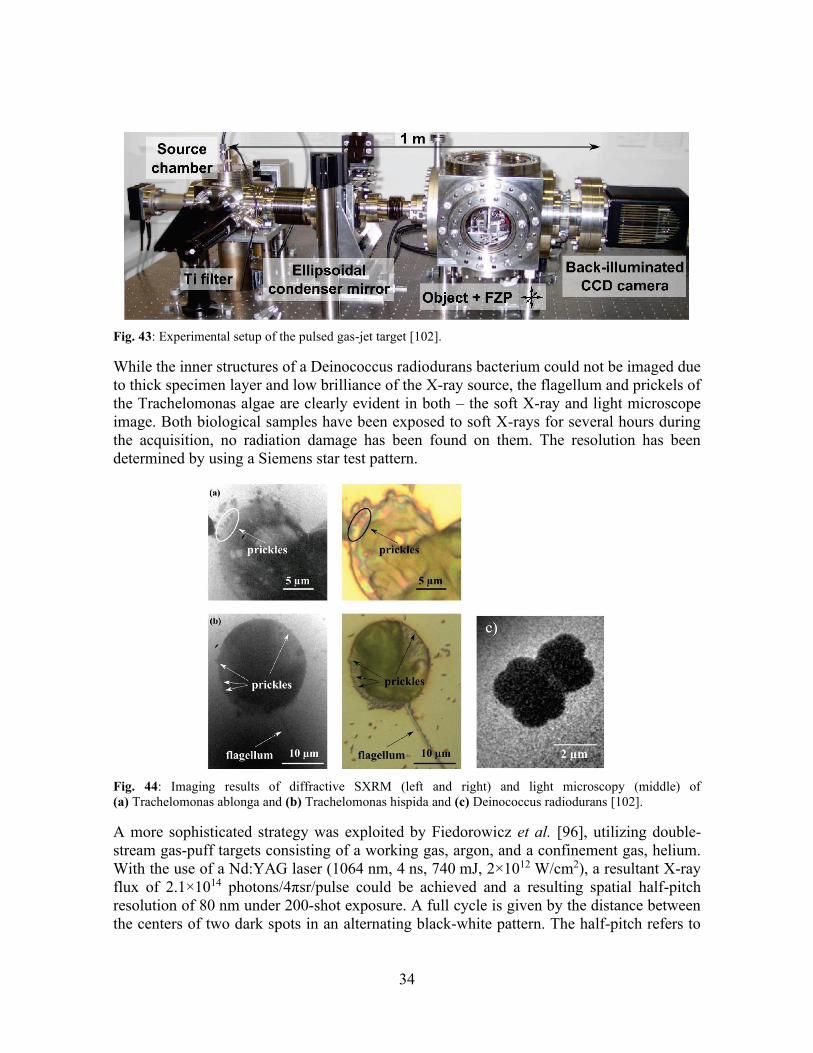
34
Fig. 43: Experimental setup of the pulsed gas-jet target [102].
While the inner structures of a Deinococcus radiodurans bacterium could not be imaged due to thick specimen layer and low brilliance of the X-ray source, the flagellum and prickels of the Trachelomonas algae are clearly evident in both – the soft X-ray and light microscope image. Both biological samples have been exposed to soft X-rays for several hours during the acquisition, no radiation damage has been found on them. The resolution has been determined by using a Siemens star test pattern.
Fig. 44: Imaging results of diffractive SXRM (left and right) and light microscopy (middle) of (a) Trachelomonas ablonga and (b) Trachelomonas hispida and (c) Deinococcus radiodurans [102].
A more sophisticated strategy was exploited by Fiedorowicz et al. [96], utilizing double-stream gas-puff targets consisting of a working gas, argon, and a confinement gas, helium. With the use of a Nd:YAG laser (1064 nm, 4 ns, 740 mJ, 2×10¹² W/cm2), a resultant X-ray flux of 2.1×10¹⁴ photons/4πsr/pulse could be achieved and a resulting spatial half-pitch resolution of 80 nm under 200-shot exposure. A full cycle is given by the distance between the centers of two dark spots in an alternating black-white pattern. The half-pitch refers to
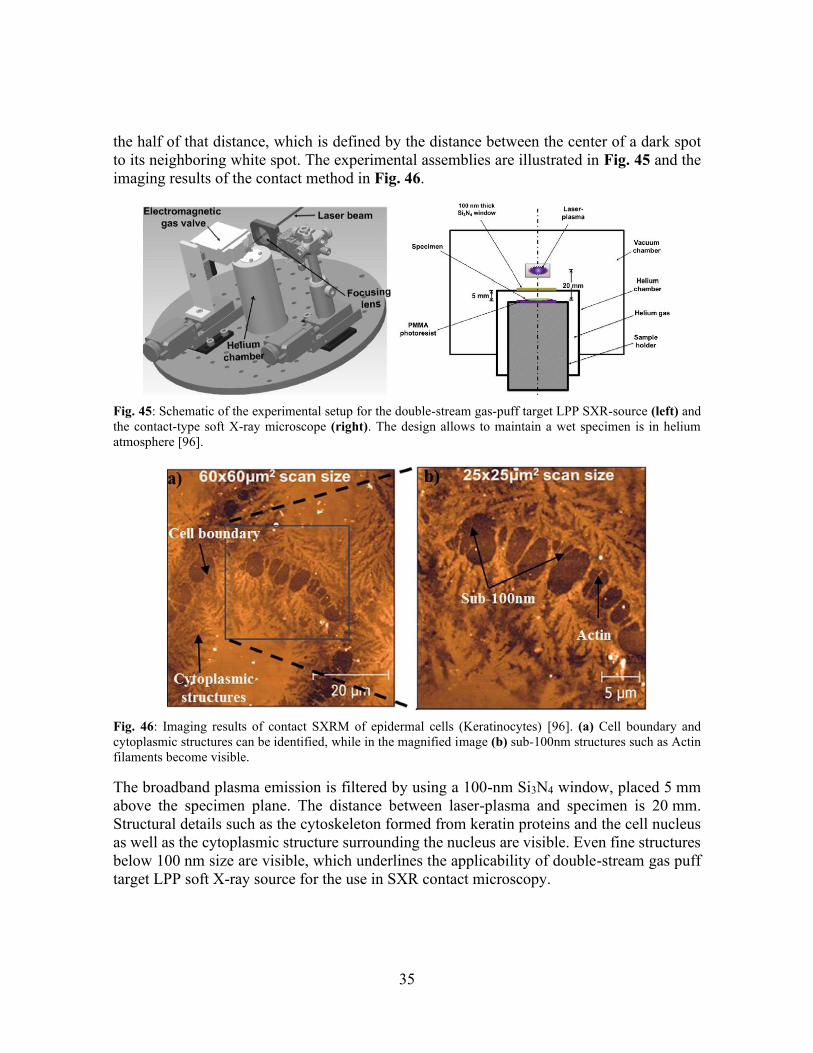
35
the half of that distance, which is defined by the distance between the center of a dark spot to its neighboring white spot. The experimental assemblies are illustrated in Fig. 45 and the imaging results of the contact method in Fig. 46.
Fig. 45: Schematic of the experimental setup for the double-stream gas-puff target LPP SXR-source (left) and the contact-type soft X-ray microscope (right). The design allows to maintain a wet specimen is in helium atmosphere [96].
Fig. 46: Imaging results of contact SXRM of epidermal cells (Keratinocytes) [96]. (a) Cell boundary and cytoplasmic structures can be identified, while in the magnified image (b) sub-100nm structures such as Actin filaments become visible.
The broadband plasma emission is filtered by using a 100-nm Si3N4 window, placed 5 mm above the specimen plane. The distance between laser-plasma and specimen is 20 mm. Structural details such as the cytoskeleton formed from keratin proteins and the cell nucleus as well as the cytoplasmic structure surrounding the nucleus are visible. Even fine structures below 100 nm size are visible, which underlines the applicability of double-stream gas puff target LPP soft X-ray source for the use in SXR contact microscopy.
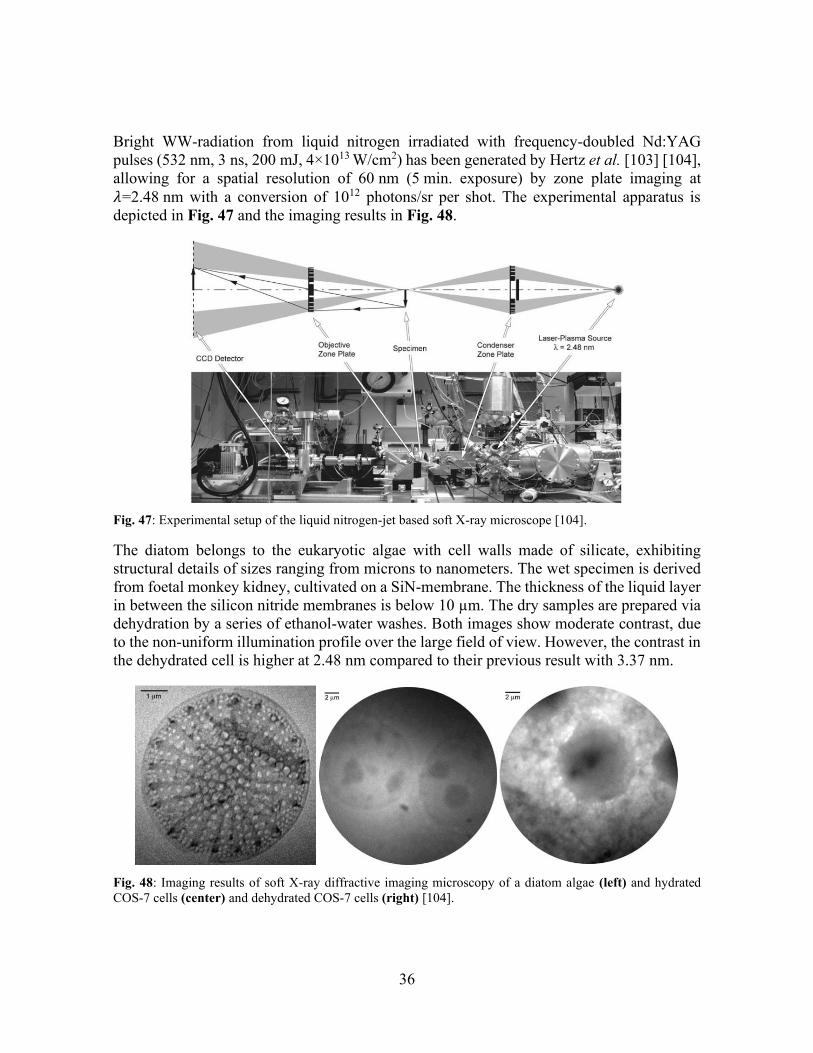
36
Bright WW-radiation from liquid nitrogen irradiated with frequency-doubled Nd:YAG pulses (532 nm, 3 ns, 200 mJ, 4×10¹³ W/cm2) has been generated by Hertz et al. [103] [104], allowing for a spatial resolution of 60 nm (5 min. exposure) by zone plate imaging at 𝜆=2.48 nm with a conversion of 1012 photons/sr per shot. The experimental apparatus is depicted in Fig. 47 and the imaging results in Fig. 48.
Fig. 47: Experimental setup of the liquid nitrogen-jet based soft X-ray microscope [104].
The diatom belongs to the eukaryotic algae with cell walls made of silicate, exhibiting structural details of sizes ranging from microns to nanometers. The wet specimen is derived from foetal monkey kidney, cultivated on a SiN-membrane. The thickness of the liquid layer in between the silicon nitride membranes is below 10 µm. The dry samples are prepared via dehydration by a series of ethanol-water washes. Both images show moderate contrast, due to the non-uniform illumination profile over the large field of view. However, the contrast in the dehydrated cell is higher at 2.48 nm compared to their previous result with 3.37 nm.
Fig. 48: Imaging results of soft X-ray diffractive imaging microscopy of a diatom algae (left) and hydrated COS-7 cells (center) and dehydrated COS-7 cells (right) [104].
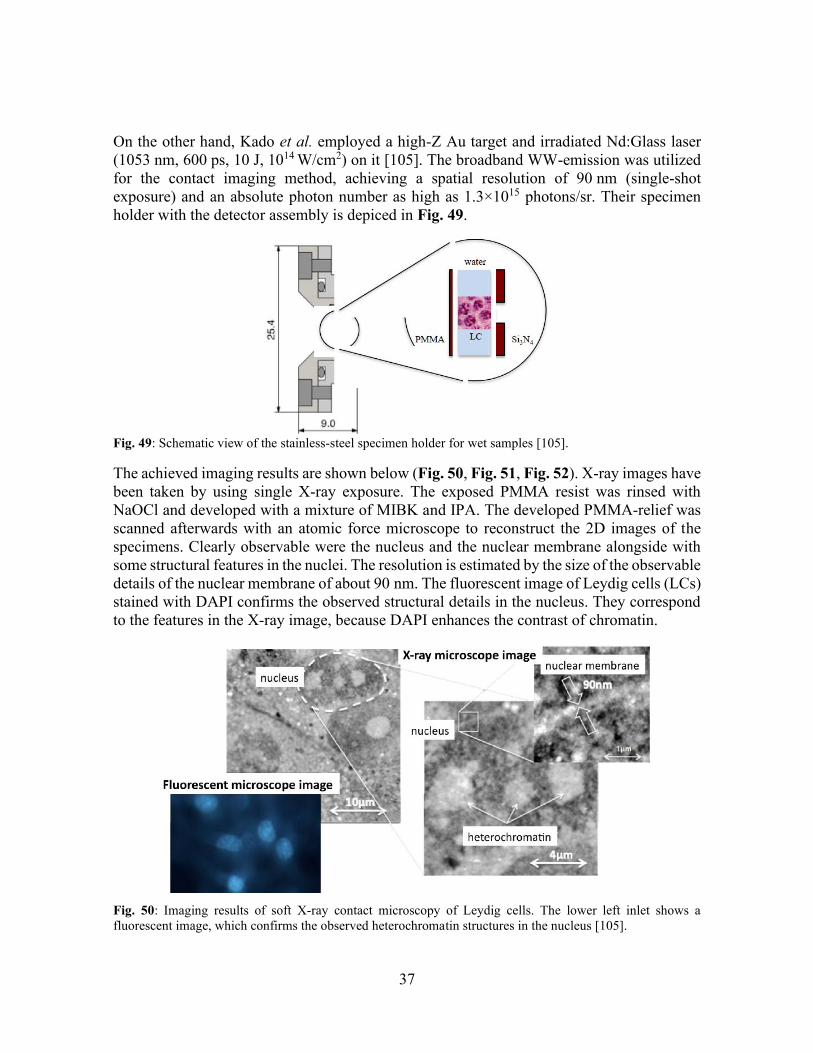
37
On the other hand, Kado et al. employed a high-Z Au target and irradiated Nd:Glass laser (1053 nm, 600 ps, 10 J, 1014 W/cm2) on it [105]. The broadband WW-emission was utilized for the contact imaging method, achieving a spatial resolution of 90 nm (single-shot exposure) and an absolute photon number as high as 1.3×10¹⁵ photons/sr. Their specimen holder with the detector assembly is depiced in Fig. 49.
Fig. 49: Schematic view of the stainless-steel specimen holder for wet samples [105].
The achieved imaging results are shown below (Fig. 50, Fig. 51, Fig. 52). X-ray images have been taken by using single X-ray exposure. The exposed PMMA resist was rinsed with NaOCl and developed with a mixture of MIBK and IPA. The developed PMMA-relief was scanned afterwards with an atomic force microscope to reconstruct the 2D images of the specimens. Clearly observable were the nucleus and the nuclear membrane alongside with some structural features in the nuclei. The resolution is estimated by the size of the observable details of the nuclear membrane of about 90 nm. The fluorescent image of Leydig cells (LCs) stained with DAPI confirms the observed structural details in the nucleus. They correspond to the features in the X-ray image, because DAPI enhances the contrast of chromatin.
Fig. 50: Imaging results of soft X-ray contact microscopy of Leydig cells. The lower left inlet shows a fluorescent image, which confirms the observed heterochromatin structures in the nucleus [105].
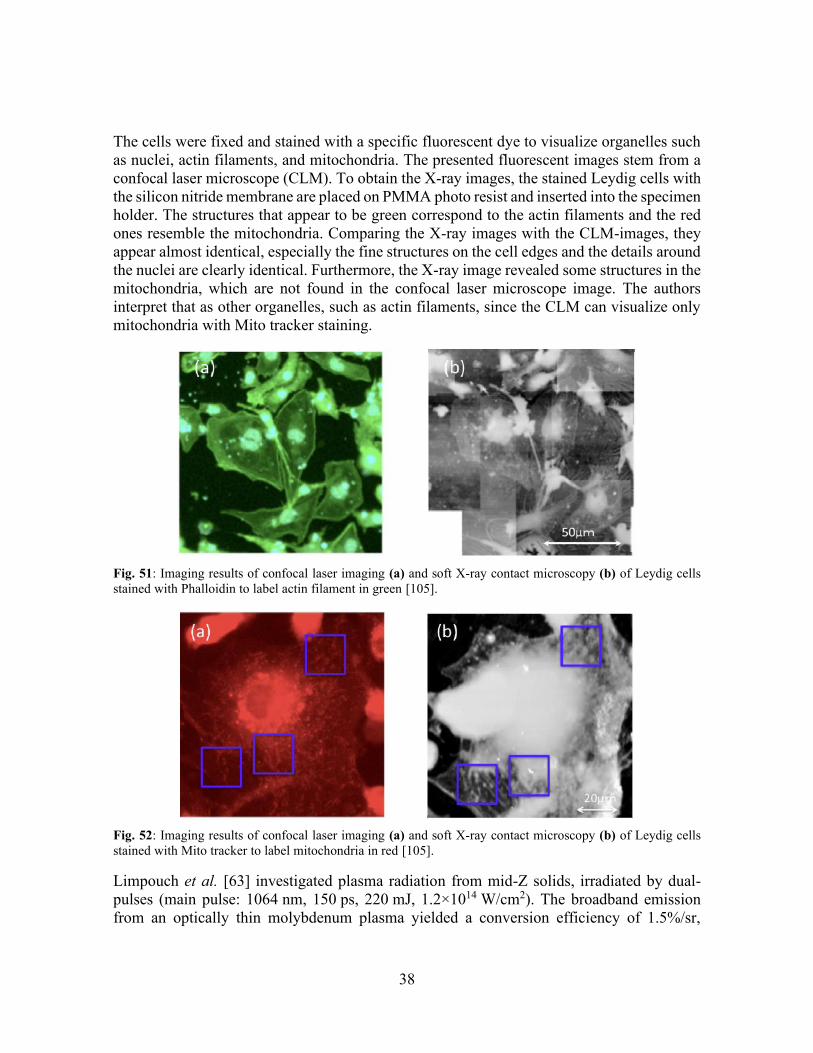
38
The cells were fixed and stained with a specific fluorescent dye to visualize organelles such as nuclei, actin filaments, and mitochondria. The presented fluorescent images stem from a confocal laser microscope (CLM). To obtain the X-ray images, the stained Leydig cells with the silicon nitride membrane are placed on PMMA photo resist and inserted into the specimen holder. The structures that appear to be green correspond to the actin filaments and the red ones resemble the mitochondria. Comparing the X-ray images with the CLM-images, they appear almost identical, especially the fine structures on the cell edges and the details around the nuclei are clearly identical. Furthermore, the X-ray image revealed some structures in the mitochondria, which are not found in the confocal laser microscope image. The authors interpret that as other organelles, such as actin filaments, since the CLM can visualize only mitochondria with Mito tracker staining.
Fig. 51: Imaging results of confocal laser imaging (a) and soft X-ray contact microscopy (b) of Leydig cells stained with Phalloidin to label actin filament in green [105].
Fig. 52: Imaging results of confocal laser imaging (a) and soft X-ray contact microscopy (b) of Leydig cells stained with Mito tracker to label mitochondria in red [105].
Limpouch et al. [63] investigated plasma radiation from mid-Z solids, irradiated by dual-pulses (main pulse: 1064 nm, 150 ps, 220 mJ, 1.2×10¹⁴ W/cm2). The broadband emission from an optically thin molybdenum plasma yielded a conversion efficiency of 1.5%/sr,
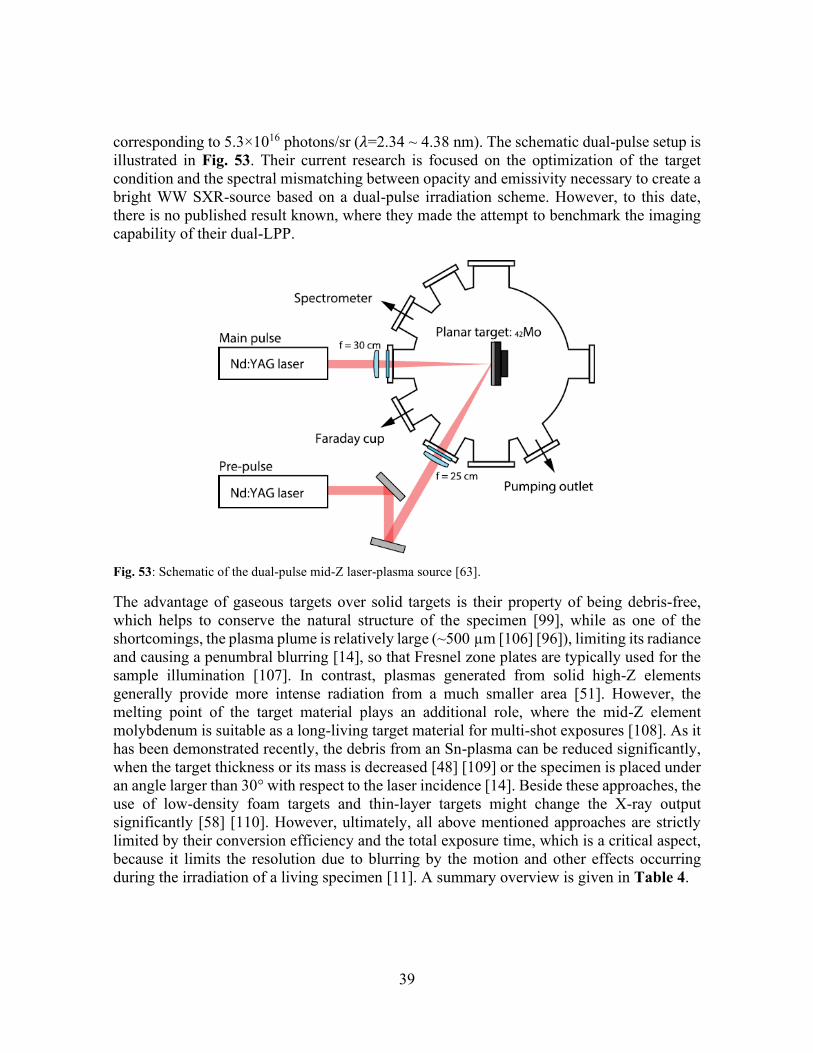
39
corresponding to 5.3×10¹⁶ photons/sr (𝜆=2.34 ~ 4.38 nm). The schematic dual-pulse setup is illustrated in Fig. 53. Their current research is focused on the optimization of the target condition and the spectral mismatching between opacity and emissivity necessary to create a bright WW SXR-source based on a dual-pulse irradiation scheme. However, to this date, there is no published result known, where they made the attempt to benchmark the imaging capability of their dual-LPP.
Fig. 53: Schematic of the dual-pulse mid-Z laser-plasma source [63].
The advantage of gaseous targets over solid targets is their property of being debris-free, which helps to conserve the natural structure of the specimen [99], while as one of the shortcomings, the plasma plume is relatively large (~500 µm [106] [96]), limiting its radiance and causing a penumbral blurring [14], so that Fresnel zone plates are typically used for the sample illumination [107]. In contrast, plasmas generated from solid high-Z elements generally provide more intense radiation from a much smaller area [51]. However, the melting point of the target material plays an additional role, where the mid-Z element molybdenum is suitable as a long-living target material for multi-shot exposures [108]. As it has been demonstrated recently, the debris from an Sn-plasma can be reduced significantly, when the target thickness or its mass is decreased [48] [109] or the specimen is placed under an angle larger than 30° with respect to the laser incidence [14]. Beside these approaches, the use of low-density foam targets and thin-layer targets might change the X-ray output significantly [58] [110]. However, ultimately, all above mentioned approaches are strictly limited by their conversion efficiency and the total exposure time, which is a critical aspect, because it limits the resolution due to blurring by the motion and other effects occurring during the irradiation of a living specimen [11]. A summary overview is given in Table 4.
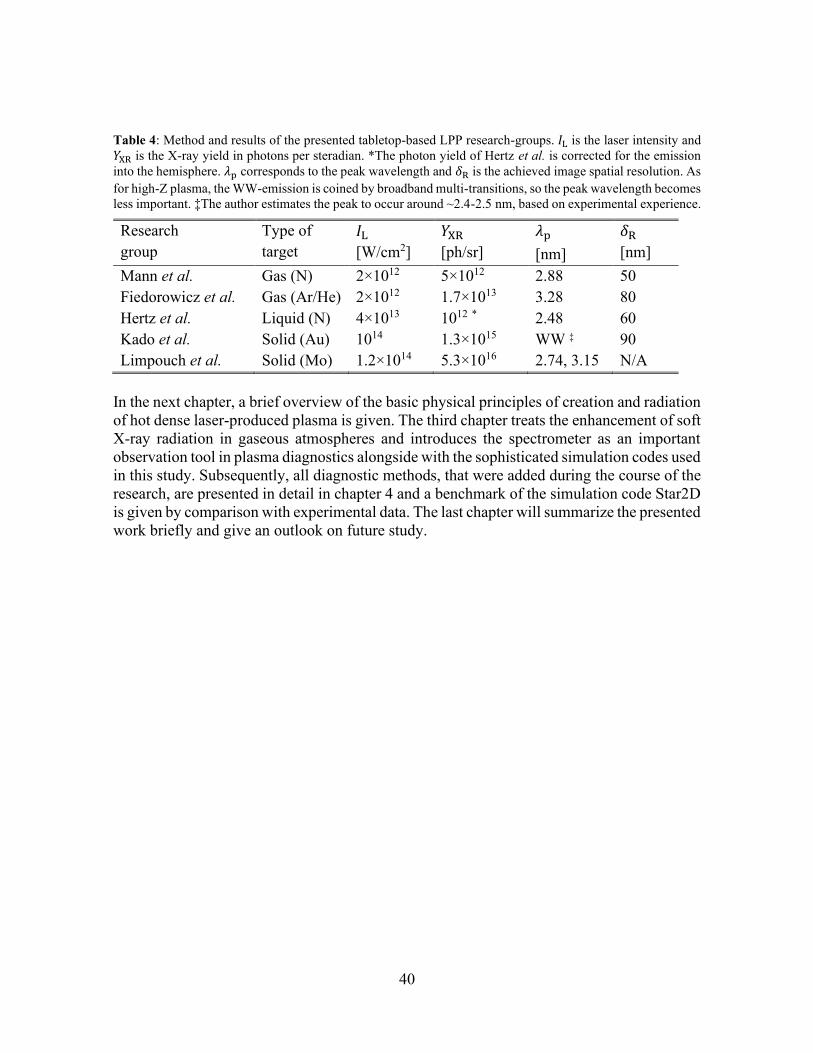
40
Table 4: Method and results of the presented tabletop-based LPP research-groups. 𝐼L is the laser intensity and 𝑌XR is the X-ray yield in photons per steradian. *The photon yield of Hertz et al. is corrected for the emission into the hemisphere. 𝜆p corresponds to the peak wavelength and 𝛿R is the achieved image spatial resolution. As for high-Z plasma, the WW-emission is coined by broadband multi-transitions, so the peak wavelength becomes less important. ‡The author estimates the peak to occur around ~2.4-2.5 nm, based on experimental experience.
Research group
Type of target
𝐼L [W/cm2]
𝑌XR [ph/sr]
𝜆p [nm]
𝛿R [nm]
Mann et al. Gas (N) 2×10¹² 5×10¹² 2.88 50 Fiedorowicz et al. Gas (Ar/He) 2×10¹² 1.7×10¹³ 3.28 80 Hertz et al. Liquid (N) 4×10¹³ 1012 * 2.48 60 Kado et al. Solid (Au) 1014 1.3×10¹⁵ WW ‡ 90 Limpouch et al. Solid (Mo) 1.2×10¹⁴ 5.3×10¹⁶ 2.74, 3.15 N/A
In the next chapter, a brief overview of the basic physical principles of creation and radiation of hot dense laser-produced plasma is given. The third chapter treats the enhancement of soft X-ray radiation in gaseous atmospheres and introduces the spectrometer as an important observation tool in plasma diagnostics alongside with the sophisticated simulation codes used in this study. Subsequently, all diagnostic methods, that were added during the course of the research, are presented in detail in chapter 4 and a benchmark of the simulation code Star2D is given by comparison with experimental data. The last chapter will summarize the presented work briefly and give an outlook on future study.
41
APPENDIX-I
a. Diffractive optics Traditional refractive lenses do not work in the X-ray regime, because the absorption is too high. Consequently, diffractive, or reflective optics are used instead. The Fresnel zone plate is a diffractive lens (Fig. 54), while Wolter-type objectives, Schwarzschild objectives and multilayer mirror designs belong to the X-ray reflective components [111] [112] [113]. In general, a Fresnel zone plate’s resolving power is determined by its outermost zone width ∆𝑟, zone placement, and the diffraction order 𝑚 used. The diffraction limited resolution 𝛿𝑓 is then given by Eq. (1-27). In addition to that, the zone plate is chromatic, so that the spectral purity needs to be at least equal to the total number of zones 𝑁 in the zone plate times the diffraction order, as expressed below by Eq. (1-28).
𝛿f = ∆𝑟/𝑚 , (1-27)
𝜆/∆𝜆 ≥ 𝑚𝑁 . (1-28)
The transmission microscope uses 1.75 nm (707 eV) wavelength from the ALS bending magnet in order to irradiate a Mo/Si multilayer test object. The zone plate features an outermost zone width ∆𝑟 of 30 nm, created with an electron beam lithographic system (CXRO Nanowriter) with a single PMMA resist layer [114]. The condenser zone plates (CZP) are made in gold and have a diameter of 9.8 mm and a central stop of 7 mm in diameter. The micro zone plate (MZP) comes with a 12-nm outermost zone width and has no central stop. The ratio of the numerical apertures of CZP to MZP defines the achievable object contrast measured by the degree of imaging coherence 𝜎 as given in Eq. (1-29). In ideal case it is zero and the imaging is perfectly coherent, while the achieved partial coherence factor actually amounts to 0.4. Applying the Rayleigh-criterion of 15.3% image contrast, the resolution is found to be 9 nm half-period.
𝜎 = 𝑁𝐴CZP/𝑁𝐴MZP . (1-29)
The scanning microscope uses an undulator, a grating monochromator, and a spatial filter to produce nearly spatially coherent soft X-rays of 1.77 nm wavelength (700 eV) on a focusing zone plate (FZP). The FZP features 1700 zones with a central stop of 50 µm diameter, and a focal length of 1135 µm at the used wavelength. At 11 nm half-pitch, the absolute image contrast yielded ~13%. The zone plate’s efficiency depends nonlinearly upon the duty cycle between open and zones and amounts to ~10% at equal width of both zones. [13]
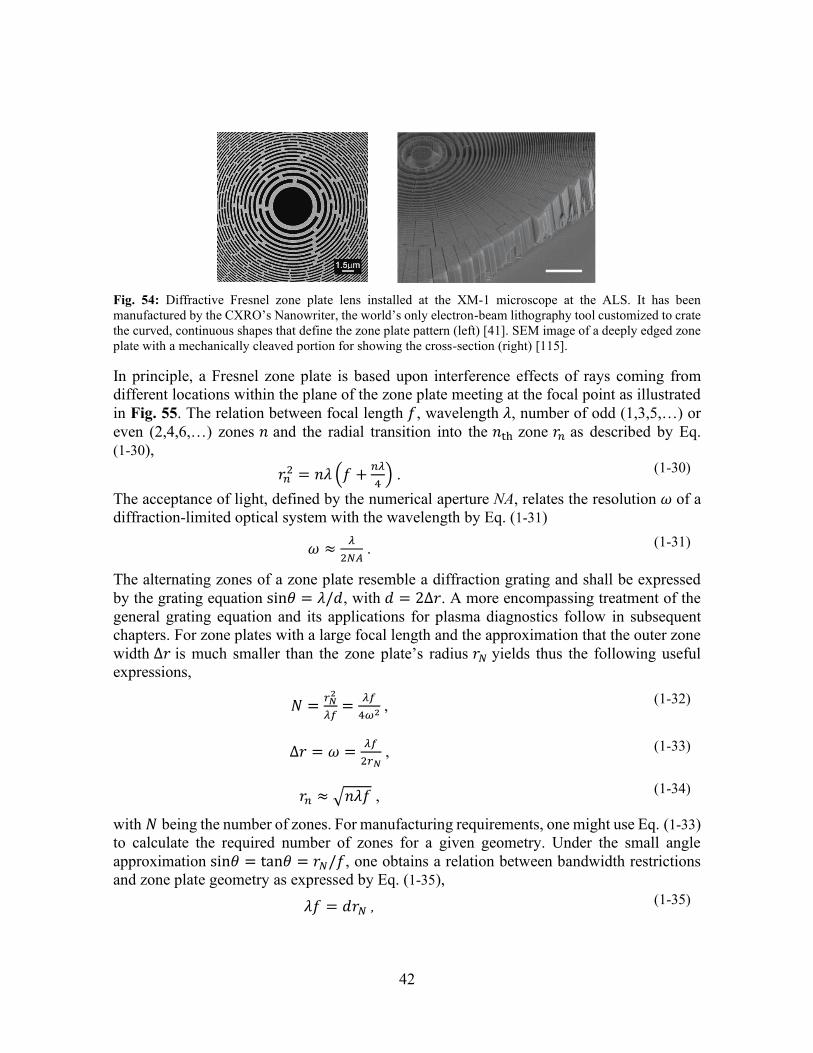
42
Fig. 54: Diffractive Fresnel zone plate lens installed at the XM-1 microscope at the ALS. It has been manufactured by the CXRO’s Nanowriter, the world’s only electron-beam lithography tool customized to crate the curved, continuous shapes that define the zone plate pattern (left) [41]. SEM image of a deeply edged zone plate with a mechanically cleaved portion for showing the cross-section (right) [115].
In principle, a Fresnel zone plate is based upon interference effects of rays coming from different locations within the plane of the zone plate meeting at the focal point as illustrated in Fig. 55. The relation between focal length 𝑓, wavelength 𝜆, number of odd (1,3,5,…) or even (2,4,6,…) zones 𝑛 and the radial transition into the 𝑛th zone 𝑟𝑛 as described by Eq. (1-30),
𝑟𝑛2 = 𝑛𝜆 (𝑓 +
𝑛𝜆
4) . (1-30)
The acceptance of light, defined by the numerical aperture NA, relates the resolution 𝜔 of a diffraction-limited optical system with the wavelength by Eq. (1-31)
𝜔 ≈𝜆
2𝑁𝐴 . (1-31)
The alternating zones of a zone plate resemble a diffraction grating and shall be expressed by the grating equation sin𝜃 = 𝜆/𝑑, with 𝑑 = 2∆𝑟. A more encompassing treatment of the general grating equation and its applications for plasma diagnostics follow in subsequent chapters. For zone plates with a large focal length and the approximation that the outer zone width ∆𝑟 is much smaller than the zone plate’s radius 𝑟𝑁 yields thus the following useful expressions,
𝑁 =𝑟𝑁
2
𝜆𝑓=
𝜆𝑓
4𝜔2 , (1-32)
∆𝑟 = 𝜔 =𝜆𝑓
2𝑟𝑁 , (1-33)
𝑟𝑛 ≈ √𝑛𝜆𝑓 , (1-34)
with 𝑁 being the number of zones. For manufacturing requirements, one might use Eq. (1-33) to calculate the required number of zones for a given geometry. Under the small angle approximation sin𝜃 = tan𝜃 = 𝑟𝑁/𝑓, one obtains a relation between bandwidth restrictions and zone plate geometry as expressed by Eq. (1-35),
𝜆𝑓 = 𝑑𝑟𝑁 , (1-35)
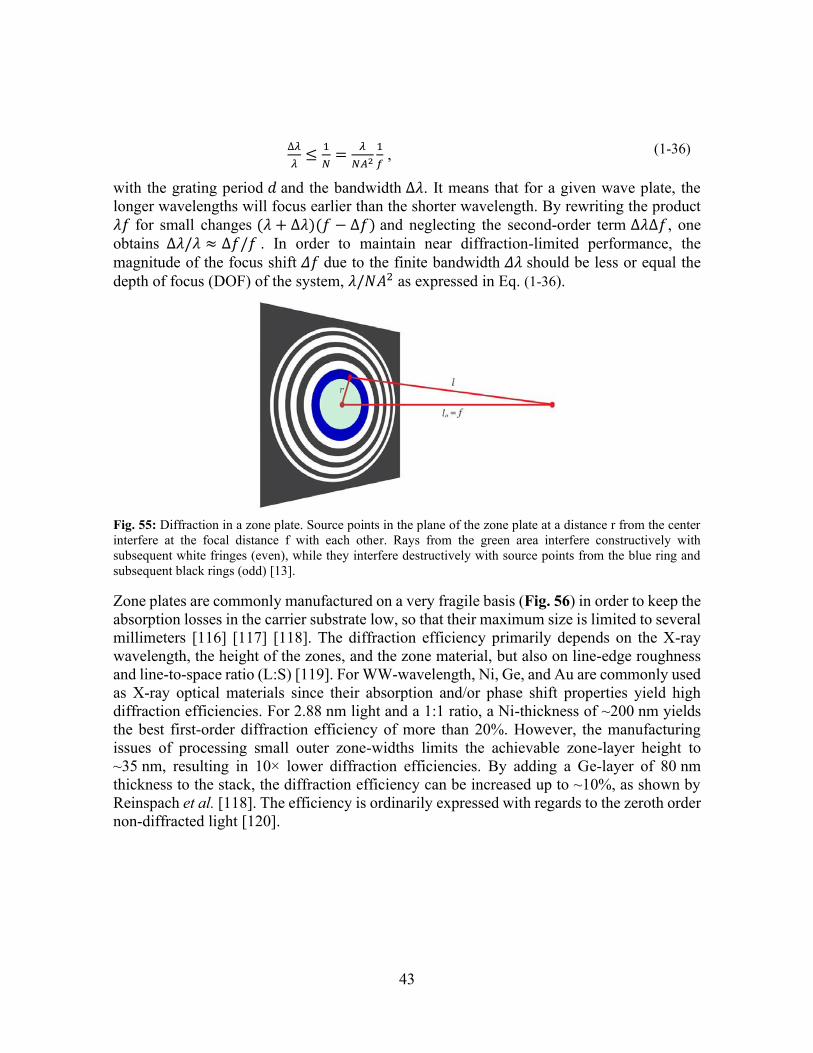
43
∆𝜆
𝜆≤
1
𝑁=
𝜆
𝑁𝐴2
1
𝑓 , (1-36)
with the grating period 𝑑 and the bandwidth ∆𝜆. It means that for a given wave plate, the longer wavelengths will focus earlier than the shorter wavelength. By rewriting the product 𝜆𝑓 for small changes (𝜆 + ∆𝜆)(𝑓 − ∆𝑓) and neglecting the second-order term ∆𝜆∆𝑓, one obtains ∆𝜆/𝜆 ≈ ∆𝑓/𝑓 . In order to maintain near diffraction-limited performance, the magnitude of the focus shift 𝛥𝑓 due to the finite bandwidth 𝛥𝜆 should be less or equal the depth of focus (DOF) of the system, 𝜆/𝑁𝐴2 as expressed in Eq. (1-36).
Fig. 55: Diffraction in a zone plate. Source points in the plane of the zone plate at a distance r from the center interfere at the focal distance f with each other. Rays from the green area interfere constructively with subsequent white fringes (even), while they interfere destructively with source points from the blue ring and subsequent black rings (odd) [13].
Zone plates are commonly manufactured on a very fragile basis (Fig. 56) in order to keep the absorption losses in the carrier substrate low, so that their maximum size is limited to several millimeters [116] [117] [118]. The diffraction efficiency primarily depends on the X-ray wavelength, the height of the zones, and the zone material, but also on line-edge roughness and line-to-space ratio (L:S) [119]. For WW-wavelength, Ni, Ge, and Au are commonly used as X-ray optical materials since their absorption and/or phase shift properties yield high diffraction efficiencies. For 2.88 nm light and a 1:1 ratio, a Ni-thickness of ~200 nm yields the best first-order diffraction efficiency of more than 20%. However, the manufacturing issues of processing small outer zone-widths limits the achievable zone-layer height to ~35 nm, resulting in 10× lower diffraction efficiencies. By adding a Ge-layer of 80 nm thickness to the stack, the diffraction efficiency can be increased up to ~10%, as shown by Reinspach et al. [118]. The efficiency is ordinarily expressed with regards to the zeroth order non-diffracted light [120].
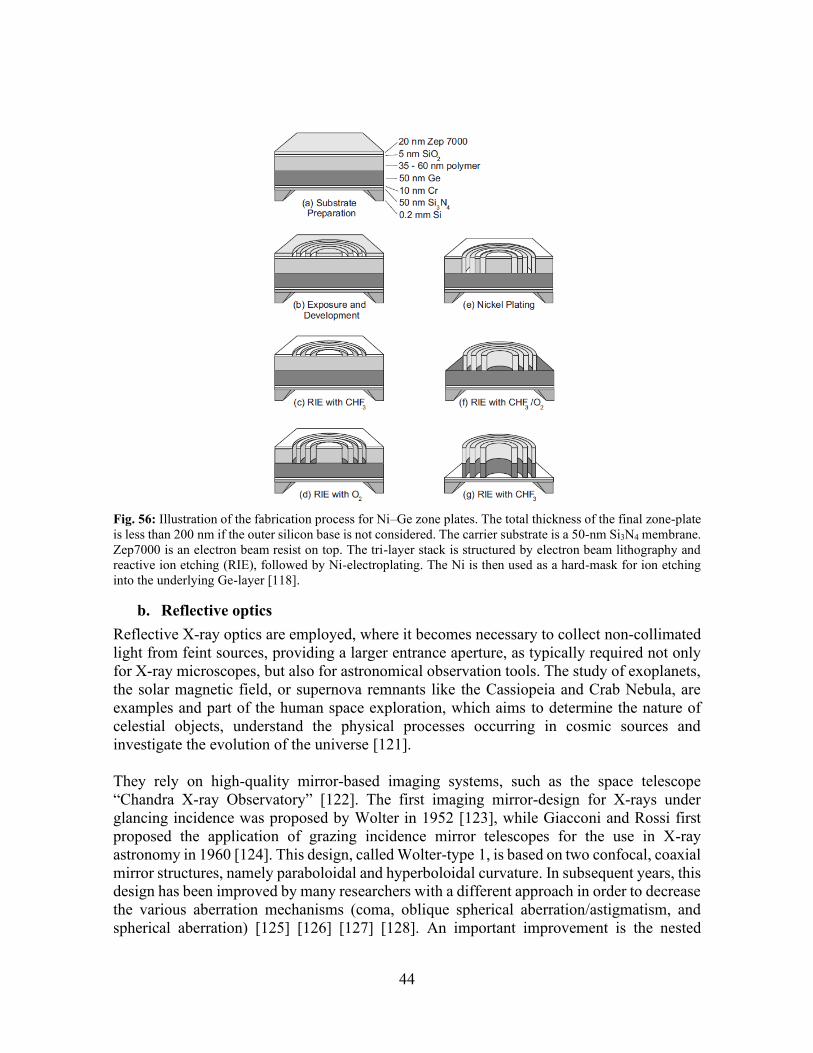
44
Fig. 56: Illustration of the fabrication process for Ni–Ge zone plates. The total thickness of the final zone-plate is less than 200 nm if the outer silicon base is not considered. The carrier substrate is a 50-nm Si3N4 membrane. Zep7000 is an electron beam resist on top. The tri-layer stack is structured by electron beam lithography and reactive ion etching (RIE), followed by Ni-electroplating. The Ni is then used as a hard-mask for ion etching into the underlying Ge-layer [118].
b. Reflective optics Reflective X-ray optics are employed, where it becomes necessary to collect non-collimated light from feint sources, providing a larger entrance aperture, as typically required not only for X-ray microscopes, but also for astronomical observation tools. The study of exoplanets, the solar magnetic field, or supernova remnants like the Cassiopeia and Crab Nebula, are examples and part of the human space exploration, which aims to determine the nature of celestial objects, understand the physical processes occurring in cosmic sources and investigate the evolution of the universe [121]. They rely on high-quality mirror-based imaging systems, such as the space telescope “Chandra X-ray Observatory” [122]. The first imaging mirror-design for X-rays under glancing incidence was proposed by Wolter in 1952 [123], while Giacconi and Rossi first proposed the application of grazing incidence mirror telescopes for the use in X-ray astronomy in 1960 [124]. This design, called Wolter-type 1, is based on two confocal, coaxial mirror structures, namely paraboloidal and hyperboloidal curvature. In subsequent years, this design has been improved by many researchers with a different approach in order to decrease the various aberration mechanisms (coma, oblique spherical aberration/astigmatism, and spherical aberration) [125] [126] [127] [128]. An important improvement is the nested
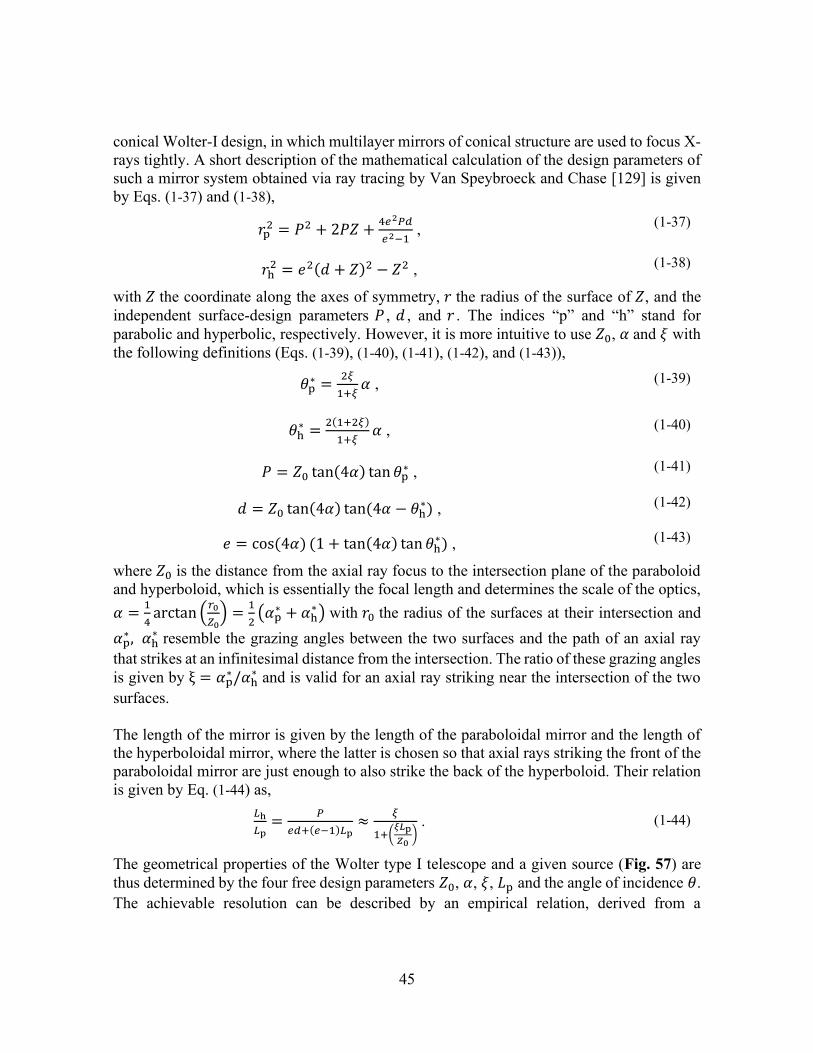
45
conical Wolter-I design, in which multilayer mirrors of conical structure are used to focus X-rays tightly. A short description of the mathematical calculation of the design parameters of such a mirror system obtained via ray tracing by Van Speybroeck and Chase [129] is given by Eqs. (1-37) and (1-38),
𝑟p2 = 𝑃2 + 2𝑃𝑍 +
4𝑒2𝑃𝑑
𝑒2−1 , (1-37)
𝑟h2 = 𝑒2(𝑑 + 𝑍)2 − 𝑍2 , (1-38)
with 𝑍 the coordinate along the axes of symmetry, 𝑟 the radius of the surface of 𝑍, and the independent surface-design parameters 𝑃 , 𝑑 , and 𝑟 . The indices “p” and “h” stand for parabolic and hyperbolic, respectively. However, it is more intuitive to use 𝑍0, 𝛼 and 𝜉 with the following definitions (Eqs. (1-39), (1-40), (1-41), (1-42), and (1-43)),
𝜃p∗ =
2𝜉
1+𝜉𝛼 , (1-39)
𝜃h∗ =
2(1+2𝜉)
1+𝜉𝛼 , (1-40)
𝑃 = 𝑍0 tan(4𝛼) tan 𝜃p∗ , (1-41)
𝑑 = 𝑍0 tan(4𝛼) tan(4𝛼 − 𝜃h∗) , (1-42)
𝑒 = cos(4𝛼) (1 + tan(4𝛼) tan 𝜃h∗) , (1-43)
where 𝑍0 is the distance from the axial ray focus to the intersection plane of the paraboloid and hyperboloid, which is essentially the focal length and determines the scale of the optics, 𝛼 =
1
4arctan (
𝑟0
𝑍0) =
1
2(𝛼p
∗ + 𝛼h∗ ) with 𝑟0 the radius of the surfaces at their intersection and
𝛼p∗ , 𝛼h
∗ resemble the grazing angles between the two surfaces and the path of an axial ray that strikes at an infinitesimal distance from the intersection. The ratio of these grazing angles is given by ξ = 𝛼p
∗/𝛼h∗ and is valid for an axial ray striking near the intersection of the two
surfaces. The length of the mirror is given by the length of the paraboloidal mirror and the length of the hyperboloidal mirror, where the latter is chosen so that axial rays striking the front of the paraboloidal mirror are just enough to also strike the back of the hyperboloid. Their relation is given by Eq. (1-44) as,
𝐿h
𝐿p=
𝑃
𝑒𝑑+(𝑒−1)𝐿p≈
𝜉
1+(𝜉𝐿p
𝑍0) . (1-44)
The geometrical properties of the Wolter type I telescope and a given source (Fig. 57) are thus determined by the four free design parameters 𝑍0, 𝛼, 𝜉, 𝐿p and the angle of incidence 𝜃. The achievable resolution can be described by an empirical relation, derived from a
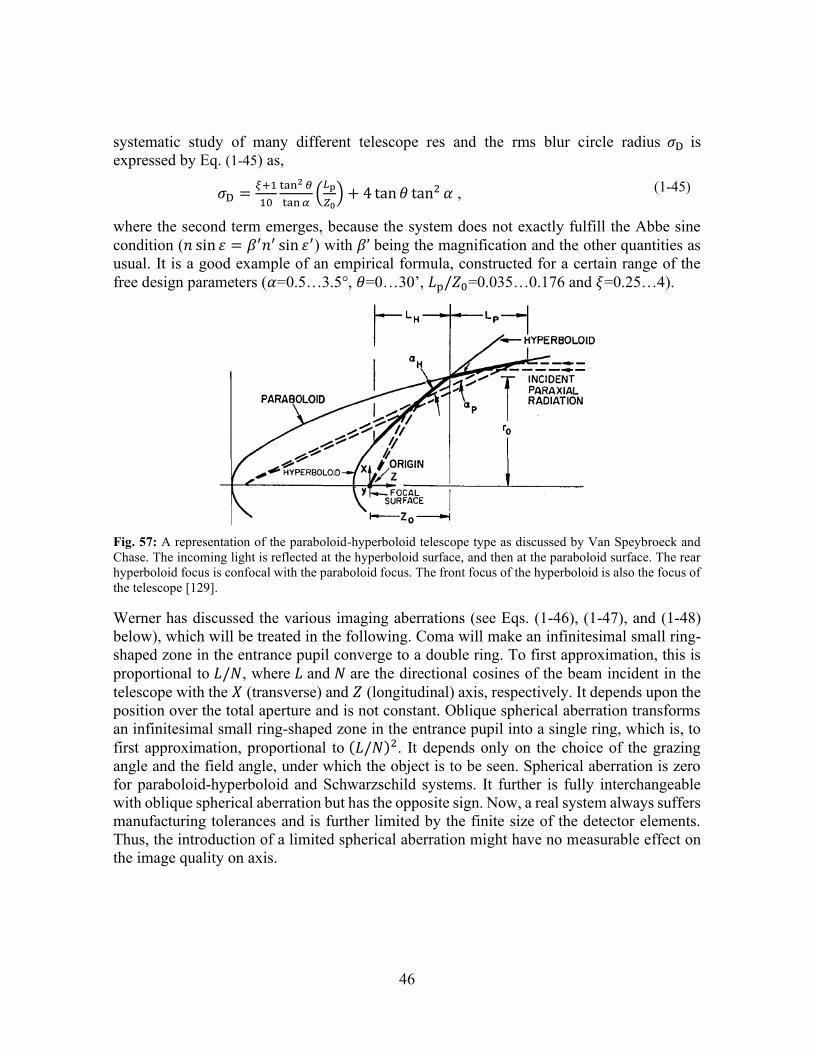
46
systematic study of many different telescope res and the rms blur circle radius 𝜎D is expressed by Eq. (1-45) as,
𝜎D =𝜉+1
10
tan2 𝜃
tan 𝛼(
𝐿p
𝑍0) + 4 tan 𝜃 tan2 𝛼 , (1-45)
where the second term emerges, because the system does not exactly fulfill the Abbe sine condition (𝑛 sin 휀 = 𝛽′𝑛′ sin 휀′) with 𝛽’ being the magnification and the other quantities as usual. It is a good example of an empirical formula, constructed for a certain range of the free design parameters (𝛼=0.5…3.5°, 𝜃=0…30’, 𝐿p/𝑍0=0.035…0.176 and 𝜉=0.25…4).
Fig. 57: A representation of the paraboloid-hyperboloid telescope type as discussed by Van Speybroeck and Chase. The incoming light is reflected at the hyperboloid surface, and then at the paraboloid surface. The rear hyperboloid focus is confocal with the paraboloid focus. The front focus of the hyperboloid is also the focus of the telescope [129].
Werner has discussed the various imaging aberrations (see Eqs. (1-46), (1-47), and (1-48) below), which will be treated in the following. Coma will make an infinitesimal small ring-shaped zone in the entrance pupil converge to a double ring. To first approximation, this is proportional to 𝐿/𝑁, where 𝐿 and 𝑁 are the directional cosines of the beam incident in the telescope with the 𝑋 (transverse) and 𝑍 (longitudinal) axis, respectively. It depends upon the position over the total aperture and is not constant. Oblique spherical aberration transforms an infinitesimal small ring-shaped zone in the entrance pupil into a single ring, which is, to first approximation, proportional to (𝐿/𝑁)2. It depends only on the choice of the grazing angle and the field angle, under which the object is to be seen. Spherical aberration is zero for paraboloid-hyperboloid and Schwarzschild systems. It further is fully interchangeable with oblique spherical aberration but has the opposite sign. Now, a real system always suffers manufacturing tolerances and is further limited by the finite size of the detector elements. Thus, the introduction of a limited spherical aberration might have no measurable effect on the image quality on axis.
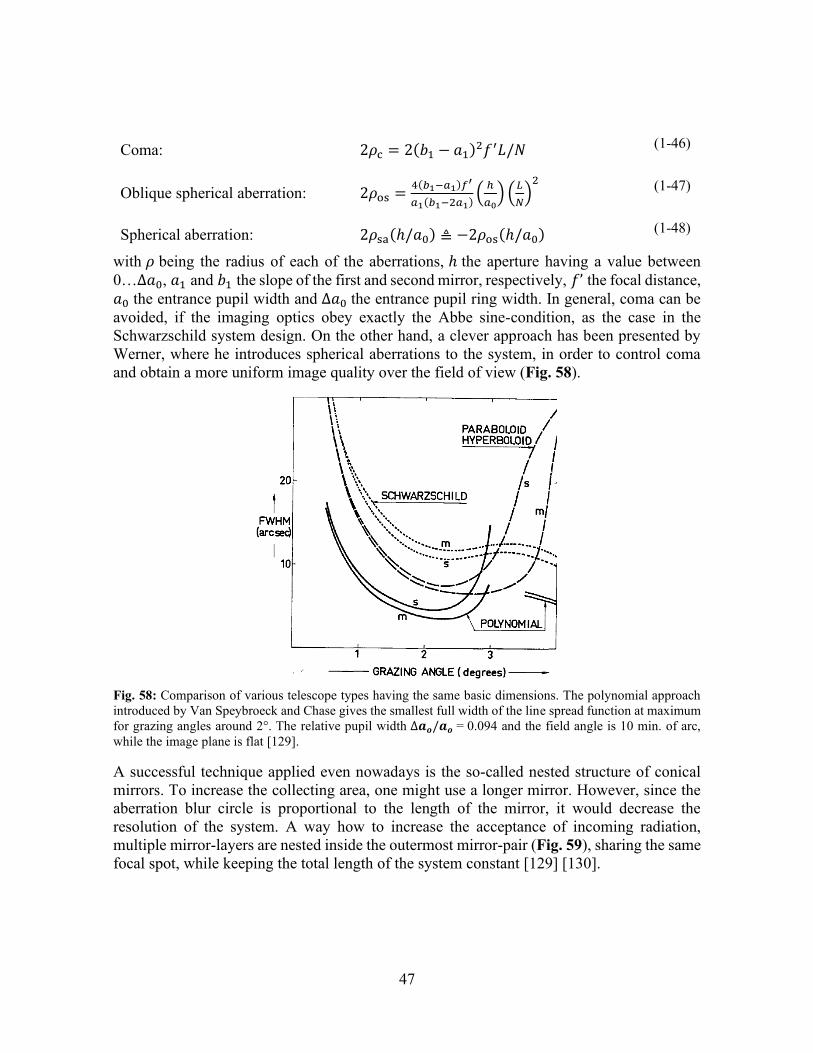
47
Coma: 2𝜌c = 2(𝑏1 − 𝑎1)2𝑓′𝐿/𝑁 (1-46)
Oblique spherical aberration: 2𝜌os =4(𝑏1−𝑎1)𝑓′
𝑎1(𝑏1−2𝑎1)(
ℎ
𝑎0) (
𝐿
𝑁)
2
(1-47)
Spherical aberration: 2𝜌sa(ℎ/𝑎0) ≜ −2𝜌os(ℎ/𝑎0) (1-48)
with 𝜌 being the radius of each of the aberrations, ℎ the aperture having a value between 0…∆𝑎0, 𝑎1 and 𝑏1 the slope of the first and second mirror, respectively, 𝑓’ the focal distance, 𝑎0 the entrance pupil width and ∆𝑎0 the entrance pupil ring width. In general, coma can be avoided, if the imaging optics obey exactly the Abbe sine-condition, as the case in the Schwarzschild system design. On the other hand, a clever approach has been presented by Werner, where he introduces spherical aberrations to the system, in order to control coma and obtain a more uniform image quality over the field of view (Fig. 58).
Fig. 58: Comparison of various telescope types having the same basic dimensions. The polynomial approach introduced by Van Speybroeck and Chase gives the smallest full width of the line spread function at maximum for grazing angles around 2°. The relative pupil width ∆𝒂𝒐/𝒂𝒐 = 0.094 and the field angle is 10 min. of arc, while the image plane is flat [129].
A successful technique applied even nowadays is the so-called nested structure of conical mirrors. To increase the collecting area, one might use a longer mirror. However, since the aberration blur circle is proportional to the length of the mirror, it would decrease the resolution of the system. A way how to increase the acceptance of incoming radiation, multiple mirror-layers are nested inside the outermost mirror-pair (Fig. 59), sharing the same focal spot, while keeping the total length of the system constant [129] [130].
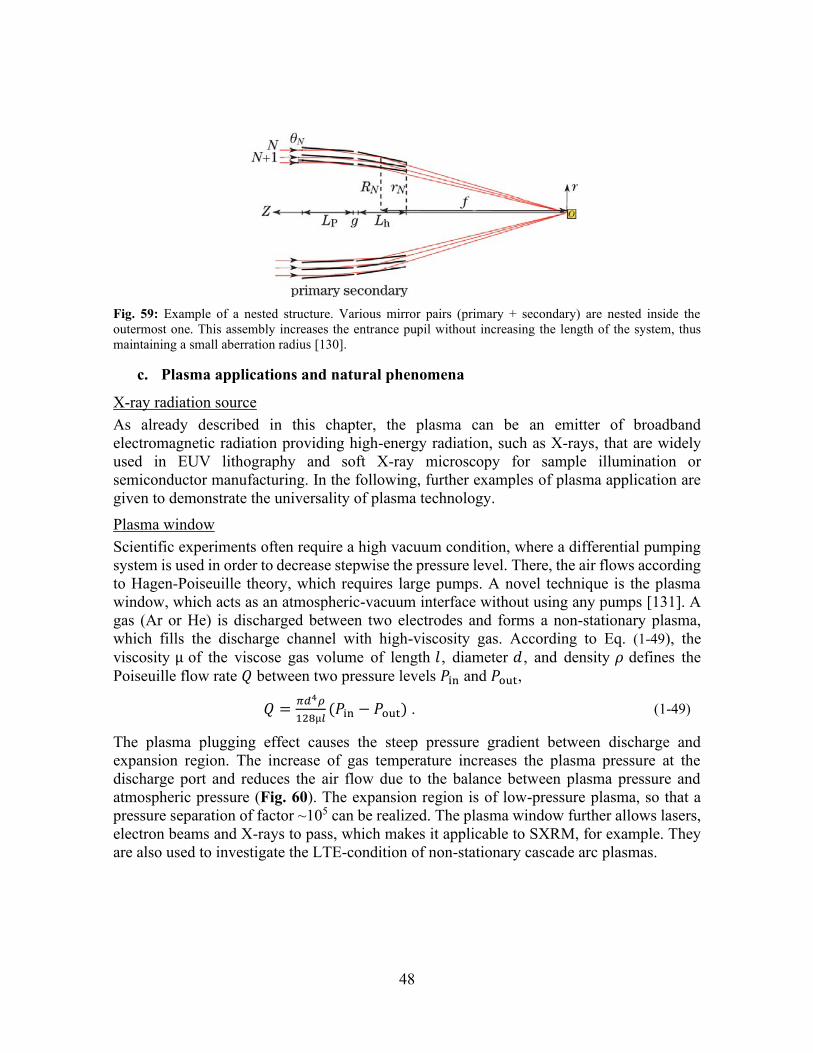
48
Fig. 59: Example of a nested structure. Various mirror pairs (primary + secondary) are nested inside the outermost one. This assembly increases the entrance pupil without increasing the length of the system, thus maintaining a small aberration radius [130].
c. Plasma applications and natural phenomena
X-ray radiation source As already described in this chapter, the plasma can be an emitter of broadband electromagnetic radiation providing high-energy radiation, such as X-rays, that are widely used in EUV lithography and soft X-ray microscopy for sample illumination or semiconductor manufacturing. In the following, further examples of plasma application are given to demonstrate the universality of plasma technology. Plasma window Scientific experiments often require a high vacuum condition, where a differential pumping system is used in order to decrease stepwise the pressure level. There, the air flows according to Hagen-Poiseuille theory, which requires large pumps. A novel technique is the plasma window, which acts as an atmospheric-vacuum interface without using any pumps [131]. A gas (Ar or He) is discharged between two electrodes and forms a non-stationary plasma, which fills the discharge channel with high-viscosity gas. According to Eq. (1-49), the viscosity µ of the viscose gas volume of length 𝑙 , diameter 𝑑 , and density 𝜌 defines the Poiseuille flow rate 𝑄 between two pressure levels 𝑃in and 𝑃out,
𝑄 =𝜋𝑑4𝜌
128µ𝑙(𝑃in − 𝑃out) . (1-49)
The plasma plugging effect causes the steep pressure gradient between discharge and expansion region. The increase of gas temperature increases the plasma pressure at the discharge port and reduces the air flow due to the balance between plasma pressure and atmospheric pressure (Fig. 60). The expansion region is of low-pressure plasma, so that a pressure separation of factor ~105 can be realized. The plasma window further allows lasers, electron beams and X-rays to pass, which makes it applicable to SXRM, for example. They are also used to investigate the LTE-condition of non-stationary cascade arc plasmas.
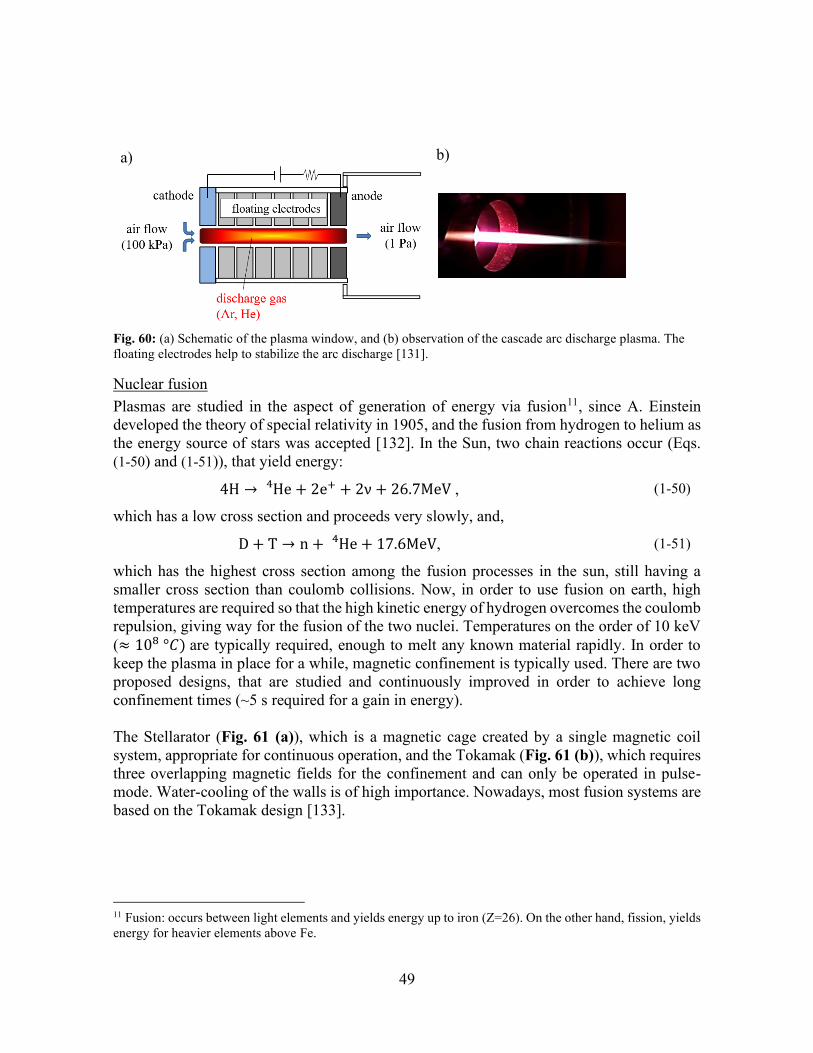
49
a)
b)
Fig. 60: (a) Schematic of the plasma window, and (b) observation of the cascade arc discharge plasma. The floating electrodes help to stabilize the arc discharge [131].
Nuclear fusion Plasmas are studied in the aspect of generation of energy via fusion11, since A. Einstein developed the theory of special relativity in 1905, and the fusion from hydrogen to helium as the energy source of stars was accepted [132]. In the Sun, two chain reactions occur (Eqs. (1-50) and (1-51)), that yield energy:
4H → He4 + 2e+ + 2ν + 26.7MeV , (1-50)
which has a low cross section and proceeds very slowly, and,
D + T → n + He4 + 17.6MeV, (1-51)
which has the highest cross section among the fusion processes in the sun, still having a smaller cross section than coulomb collisions. Now, in order to use fusion on earth, high temperatures are required so that the high kinetic energy of hydrogen overcomes the coulomb repulsion, giving way for the fusion of the two nuclei. Temperatures on the order of 10 keV (≈ 108 °𝐶) are typically required, enough to melt any known material rapidly. In order to keep the plasma in place for a while, magnetic confinement is typically used. There are two proposed designs, that are studied and continuously improved in order to achieve long confinement times (~5 s required for a gain in energy). The Stellarator (Fig. 61 (a)), which is a magnetic cage created by a single magnetic coil system, appropriate for continuous operation, and the Tokamak (Fig. 61 (b)), which requires three overlapping magnetic fields for the confinement and can only be operated in pulse-mode. Water-cooling of the walls is of high importance. Nowadays, most fusion systems are based on the Tokamak design [133].
11 Fusion: occurs between light elements and yields energy up to iron (Z=26). On the other hand, fission, yields energy for heavier elements above Fe.
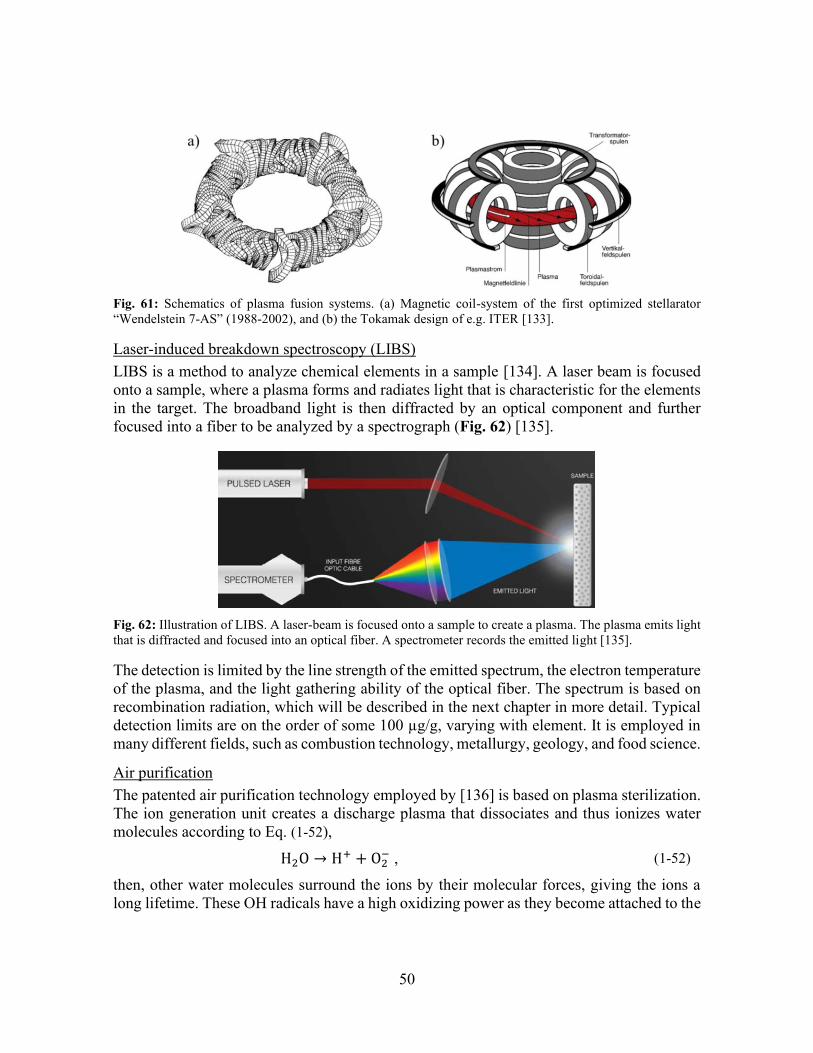
50
Fig. 61: Schematics of plasma fusion systems. (a) Magnetic coil-system of the first optimized stellarator “Wendelstein 7-AS” (1988-2002), and (b) the Tokamak design of e.g. ITER [133].
Laser-induced breakdown spectroscopy (LIBS) LIBS is a method to analyze chemical elements in a sample [134]. A laser beam is focused onto a sample, where a plasma forms and radiates light that is characteristic for the elements in the target. The broadband light is then diffracted by an optical component and further focused into a fiber to be analyzed by a spectrograph (Fig. 62) [135].
Fig. 62: Illustration of LIBS. A laser-beam is focused onto a sample to create a plasma. The plasma emits light that is diffracted and focused into an optical fiber. A spectrometer records the emitted light [135].
The detection is limited by the line strength of the emitted spectrum, the electron temperature of the plasma, and the light gathering ability of the optical fiber. The spectrum is based on recombination radiation, which will be described in the next chapter in more detail. Typical detection limits are on the order of some 100 µg/g, varying with element. It is employed in many different fields, such as combustion technology, metallurgy, geology, and food science.
Air purification The patented air purification technology employed by [136] is based on plasma sterilization. The ion generation unit creates a discharge plasma that dissociates and thus ionizes water molecules according to Eq. (1-52),
H2O → H+ + O2− , (1-52)
then, other water molecules surround the ions by their molecular forces, giving the ions a long lifetime. These OH radicals have a high oxidizing power as they become attached to the
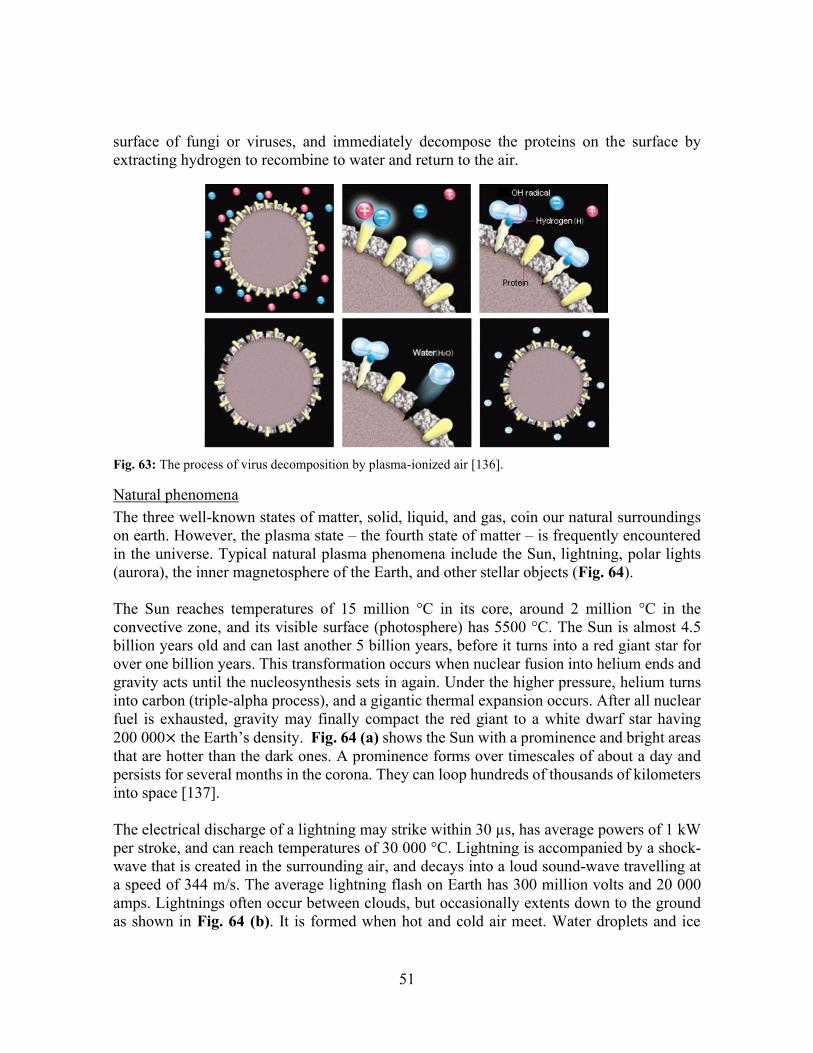
51
surface of fungi or viruses, and immediately decompose the proteins on the surface by extracting hydrogen to recombine to water and return to the air.
Fig. 63: The process of virus decomposition by plasma-ionized air [136].
Natural phenomena The three well-known states of matter, solid, liquid, and gas, coin our natural surroundings on earth. However, the plasma state – the fourth state of matter – is frequently encountered in the universe. Typical natural plasma phenomena include the Sun, lightning, polar lights (aurora), the inner magnetosphere of the Earth, and other stellar objects (Fig. 64). The Sun reaches temperatures of 15 million °C in its core, around 2 million °C in the convective zone, and its visible surface (photosphere) has 5500 °C. The Sun is almost 4.5 billion years old and can last another 5 billion years, before it turns into a red giant star for over one billion years. This transformation occurs when nuclear fusion into helium ends and gravity acts until the nucleosynthesis sets in again. Under the higher pressure, helium turns into carbon (triple-alpha process), and a gigantic thermal expansion occurs. After all nuclear fuel is exhausted, gravity may finally compact the red giant to a white dwarf star having 200 000× the Earth’s density. Fig. 64 (a) shows the Sun with a prominence and bright areas that are hotter than the dark ones. A prominence forms over timescales of about a day and persists for several months in the corona. They can loop hundreds of thousands of kilometers into space [137]. The electrical discharge of a lightning may strike within 30 µs, has average powers of 1 kW per stroke, and can reach temperatures of 30 000 °C. Lightning is accompanied by a shock-wave that is created in the surrounding air, and decays into a loud sound-wave travelling at a speed of 344 m/s. The average lightning flash on Earth has 300 million volts and 20 000 amps. Lightnings often occur between clouds, but occasionally extents down to the ground as shown in Fig. 64 (b). It is formed when hot and cold air meet. Water droplets and ice
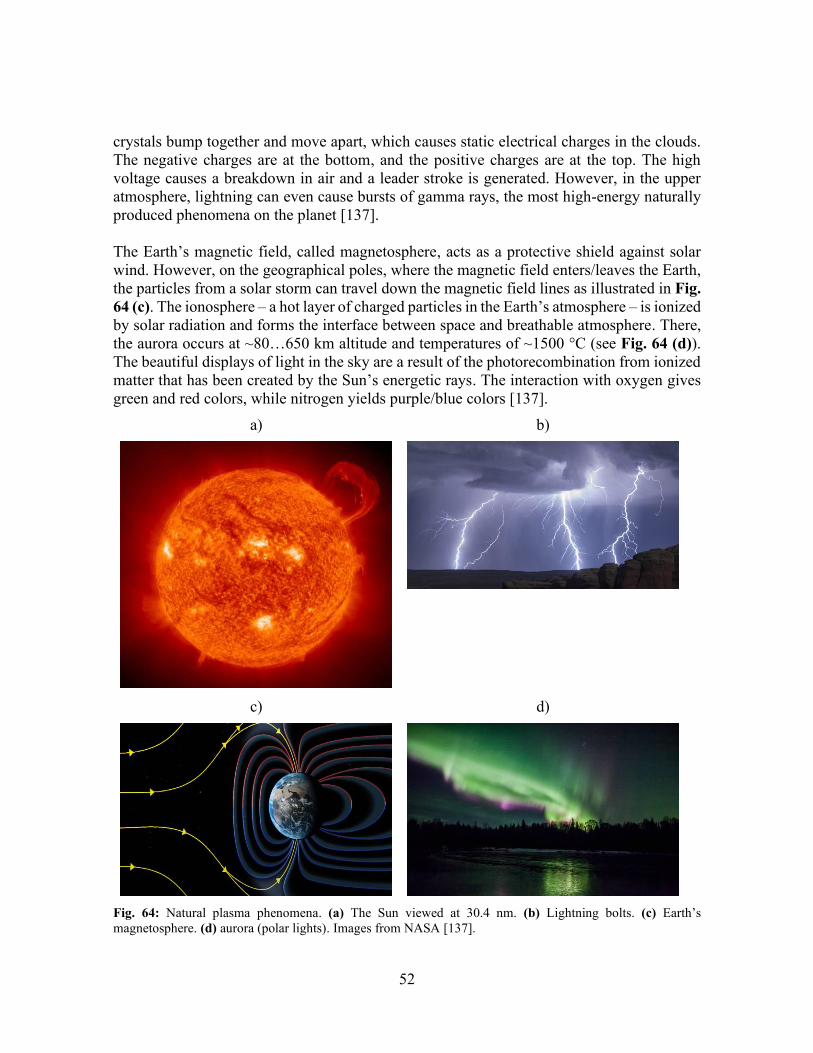
52
crystals bump together and move apart, which causes static electrical charges in the clouds. The negative charges are at the bottom, and the positive charges are at the top. The high voltage causes a breakdown in air and a leader stroke is generated. However, in the upper atmosphere, lightning can even cause bursts of gamma rays, the most high-energy naturally produced phenomena on the planet [137]. The Earth’s magnetic field, called magnetosphere, acts as a protective shield against solar wind. However, on the geographical poles, where the magnetic field enters/leaves the Earth, the particles from a solar storm can travel down the magnetic field lines as illustrated in Fig. 64 (c). The ionosphere – a hot layer of charged particles in the Earth’s atmosphere – is ionized by solar radiation and forms the interface between space and breathable atmosphere. There, the aurora occurs at ~80…650 km altitude and temperatures of ~1500 °C (see Fig. 64 (d)). The beautiful displays of light in the sky are a result of the photorecombination from ionized matter that has been created by the Sun’s energetic rays. The interaction with oxygen gives green and red colors, while nitrogen yields purple/blue colors [137].
a)
b)
c)
d)
Fig. 64: Natural plasma phenomena. (a) The Sun viewed at 30.4 nm. (b) Lightning bolts. (c) Earth’s magnetosphere. (d) aurora (polar lights). Images from NASA [137].
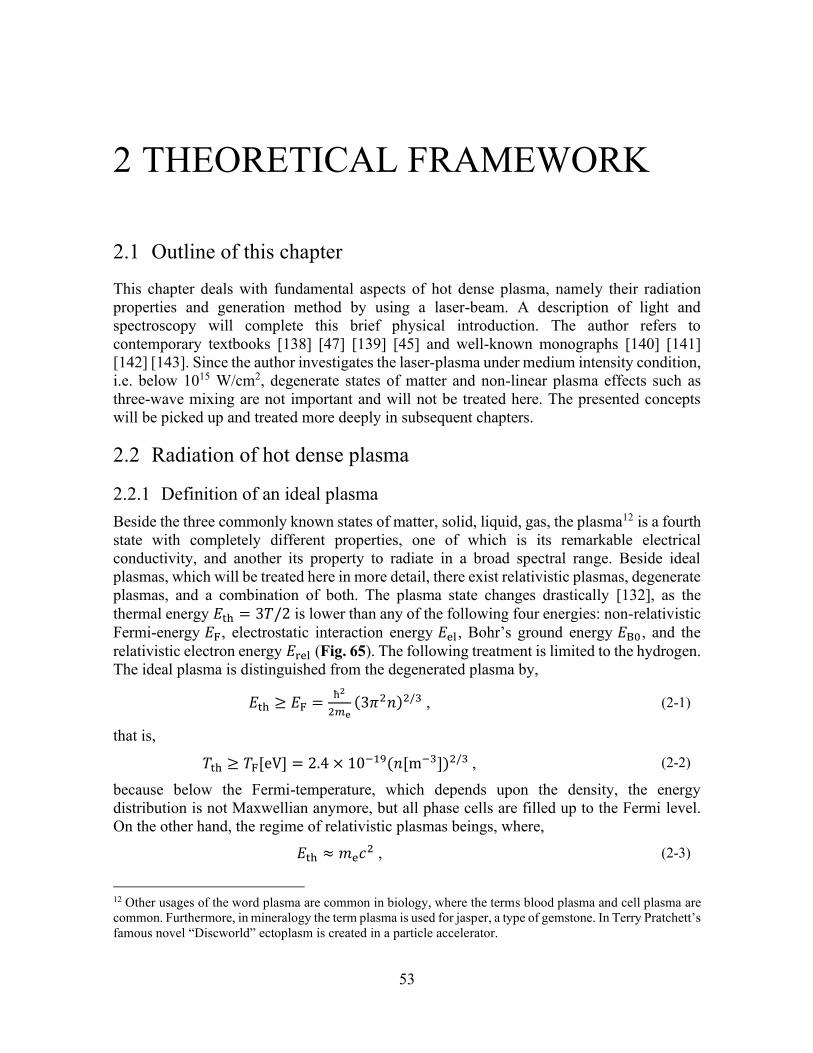
53
2 THEORETICAL FRAMEWORK
2.1 Outline of this chapter
This chapter deals with fundamental aspects of hot dense plasma, namely their radiation properties and generation method by using a laser-beam. A description of light and spectroscopy will complete this brief physical introduction. The author refers to contemporary textbooks [138] [47] [139] [45] and well-known monographs [140] [141] [142] [143]. Since the author investigates the laser-plasma under medium intensity condition, i.e. below 1015 W/cm2, degenerate states of matter and non-linear plasma effects such as three-wave mixing are not important and will not be treated here. The presented concepts will be picked up and treated more deeply in subsequent chapters.
2.2 Radiation of hot dense plasma
2.2.1 Definition of an ideal plasma Beside the three commonly known states of matter, solid, liquid, gas, the plasma12 is a fourth state with completely different properties, one of which is its remarkable electrical conductivity, and another its property to radiate in a broad spectral range. Beside ideal plasmas, which will be treated here in more detail, there exist relativistic plasmas, degenerate plasmas, and a combination of both. The plasma state changes drastically [132], as the thermal energy 𝐸th = 3𝑇/2 is lower than any of the following four energies: non-relativistic Fermi-energy 𝐸F, electrostatic interaction energy 𝐸el, Bohr’s ground energy 𝐸B0, and the relativistic electron energy 𝐸rel (Fig. 65). The following treatment is limited to the hydrogen. The ideal plasma is distinguished from the degenerated plasma by,
𝐸th ≥ 𝐸F =ħ2
2𝑚e(3𝜋2𝑛)2/3 , (2-1)
that is,
𝑇th ≥ 𝑇F[eV] = 2.4 × 10⁻¹⁹(𝑛[m−3])2/3 , (2-2)
because below the Fermi-temperature, which depends upon the density, the energy distribution is not Maxwellian anymore, but all phase cells are filled up to the Fermi level. On the other hand, the regime of relativistic plasmas beings, where,
𝐸th ≈ 𝑚e𝑐2 , (2-3)
12 Other usages of the word plasma are common in biology, where the terms blood plasma and cell plasma are common. Furthermore, in mineralogy the term plasma is used for jasper, a type of gemstone. In Terry Pratchett’s famous novel “Discworld” ectoplasm is created in a particle accelerator.
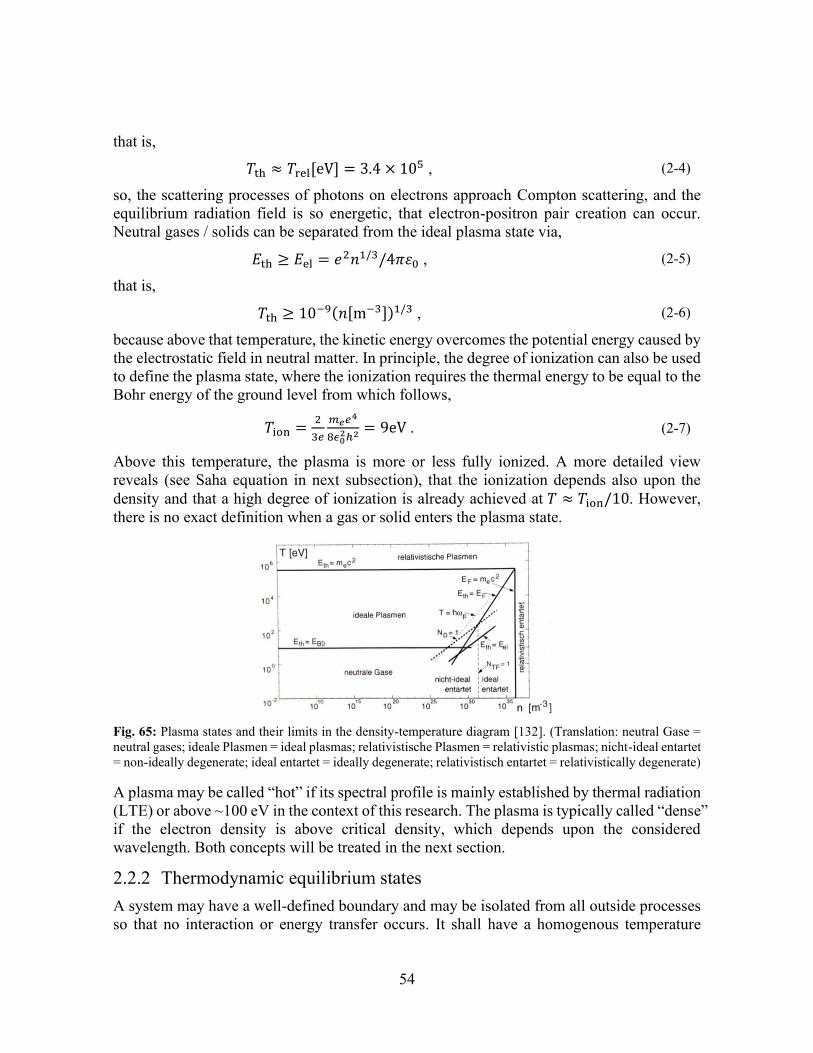
54
that is,
𝑇th ≈ 𝑇rel[eV] = 3.4 × 10⁵ , (2-4)
so, the scattering processes of photons on electrons approach Compton scattering, and the equilibrium radiation field is so energetic, that electron-positron pair creation can occur. Neutral gases / solids can be separated from the ideal plasma state via,
𝐸th ≥ 𝐸el = 𝑒2𝑛1/3/4𝜋휀0 , (2-5)
that is,
𝑇th ≥ 10−9(𝑛[m−3])1/3 , (2-6)
because above that temperature, the kinetic energy overcomes the potential energy caused by the electrostatic field in neutral matter. In principle, the degree of ionization can also be used to define the plasma state, where the ionization requires the thermal energy to be equal to the Bohr energy of the ground level from which follows,
𝑇ion =2
3𝑒
𝑚𝑒𝑒4
8𝜖02ℎ2 = 9eV . (2-7)
Above this temperature, the plasma is more or less fully ionized. A more detailed view reveals (see Saha equation in next subsection), that the ionization depends also upon the density and that a high degree of ionization is already achieved at 𝑇 ≈ 𝑇ion/10. However, there is no exact definition when a gas or solid enters the plasma state.
Fig. 65: Plasma states and their limits in the density-temperature diagram [132]. (Translation: neutral Gase = neutral gases; ideale Plasmen = ideal plasmas; relativistische Plasmen = relativistic plasmas; nicht-ideal entartet = non-ideally degenerate; ideal entartet = ideally degenerate; relativistisch entartet = relativistically degenerate)
A plasma may be called “hot” if its spectral profile is mainly established by thermal radiation (LTE) or above ~100 eV in the context of this research. The plasma is typically called “dense” if the electron density is above critical density, which depends upon the considered wavelength. Both concepts will be treated in the next section.
2.2.2 Thermodynamic equilibrium states A system may have a well-defined boundary and may be isolated from all outside processes so that no interaction or energy transfer occurs. It shall have a homogenous temperature
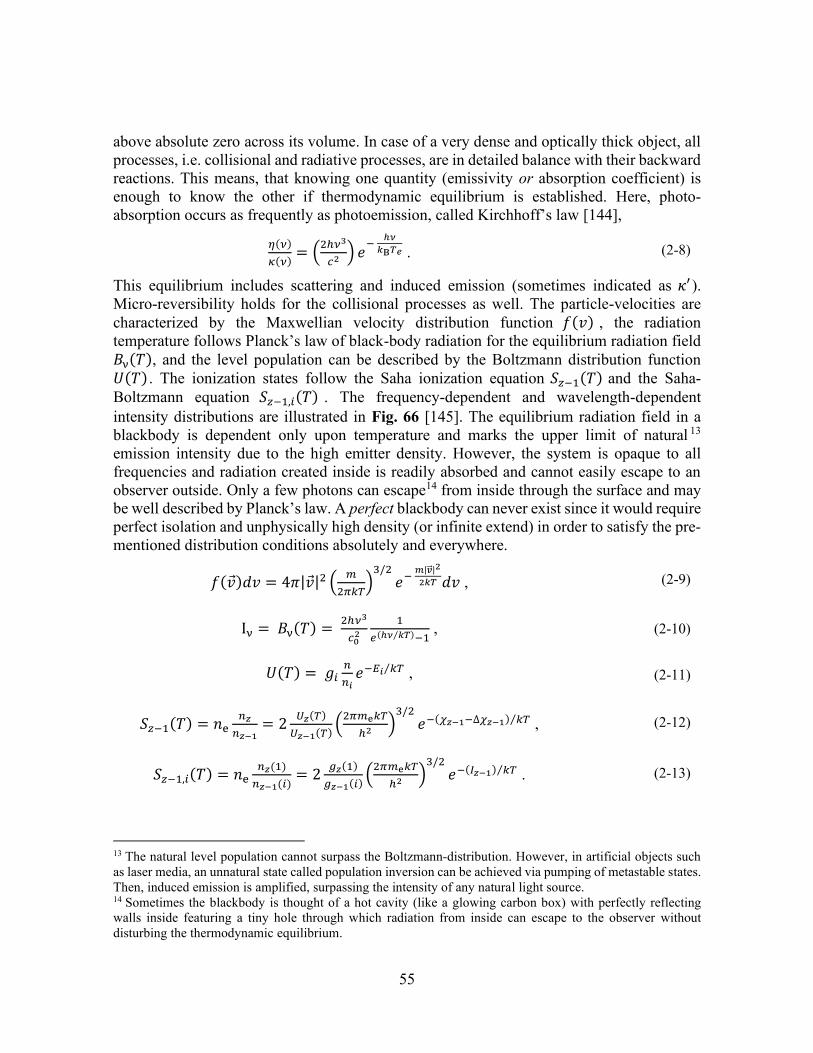
55
above absolute zero across its volume. In case of a very dense and optically thick object, all processes, i.e. collisional and radiative processes, are in detailed balance with their backward reactions. This means, that knowing one quantity (emissivity or absorption coefficient) is enough to know the other if thermodynamic equilibrium is established. Here, photo-absorption occurs as frequently as photoemission, called Kirchhoff’s law [144],
𝜂(𝜈)
𝜅(𝜈)= (
2ℎ𝜈3
𝑐2 ) 𝑒−
ℎ𝜈
𝑘B𝑇𝑒 . (2-8)
This equilibrium includes scattering and induced emission (sometimes indicated as 𝜅′). Micro-reversibility holds for the collisional processes as well. The particle-velocities are characterized by the Maxwellian velocity distribution function 𝑓(𝑣) , the radiation temperature follows Planck’s law of black-body radiation for the equilibrium radiation field 𝐵ν(𝑇), and the level population can be described by the Boltzmann distribution function 𝑈(𝑇). The ionization states follow the Saha ionization equation 𝑆𝑧−1(𝑇) and the Saha-Boltzmann equation 𝑆𝑧−1,𝑖(𝑇) . The frequency-dependent and wavelength-dependent intensity distributions are illustrated in Fig. 66 [145]. The equilibrium radiation field in a blackbody is dependent only upon temperature and marks the upper limit of natural 13 emission intensity due to the high emitter density. However, the system is opaque to all frequencies and radiation created inside is readily absorbed and cannot easily escape to an observer outside. Only a few photons can escape14 from inside through the surface and may be well described by Planck’s law. A perfect blackbody can never exist since it would require perfect isolation and unphysically high density (or infinite extend) in order to satisfy the pre-mentioned distribution conditions absolutely and everywhere.
𝑓(��)𝑑𝑣 = 4𝜋|��|2 (𝑚
2𝜋𝑘𝑇)
3/2
𝑒− 𝑚|��|2
2𝑘𝑇 𝑑𝑣 , (2-9)
Iν = 𝐵ν(𝑇) = 2ℎ𝜈3
𝑐02
1
𝑒(ℎ𝜈 𝑘𝑇⁄ )−1 , (2-10)
𝑈(𝑇) = 𝑔𝑖𝑛
𝑛𝑖𝑒−𝐸𝑖 𝑘𝑇⁄ , (2-11)
𝑆𝑧−1(𝑇) = 𝑛e𝑛𝑧
𝑛𝑧−1= 2
𝑈𝑧(𝑇)
𝑈𝑧−1(𝑇)(
2𝜋𝑚e𝑘𝑇
ℎ2 )3/2
𝑒−(𝜒𝑧−1−∆𝜒𝑧−1) 𝑘𝑇⁄ , (2-12)
𝑆𝑧−1,𝑖(𝑇) = 𝑛e𝑛𝑧(1)
𝑛𝑧−1(𝑖)= 2
𝑔𝑧(1)
𝑔𝑧−1(𝑖)(
2𝜋𝑚e𝑘𝑇
ℎ2)
3/2
𝑒−(𝐼𝑧−1) 𝑘𝑇⁄ . (2-13)
13 The natural level population cannot surpass the Boltzmann-distribution. However, in artificial objects such as laser media, an unnatural state called population inversion can be achieved via pumping of metastable states. Then, induced emission is amplified, surpassing the intensity of any natural light source. 14 Sometimes the blackbody is thought of a hot cavity (like a glowing carbon box) with perfectly reflecting walls inside featuring a tiny hole through which radiation from inside can escape to the observer without disturbing the thermodynamic equilibrium.
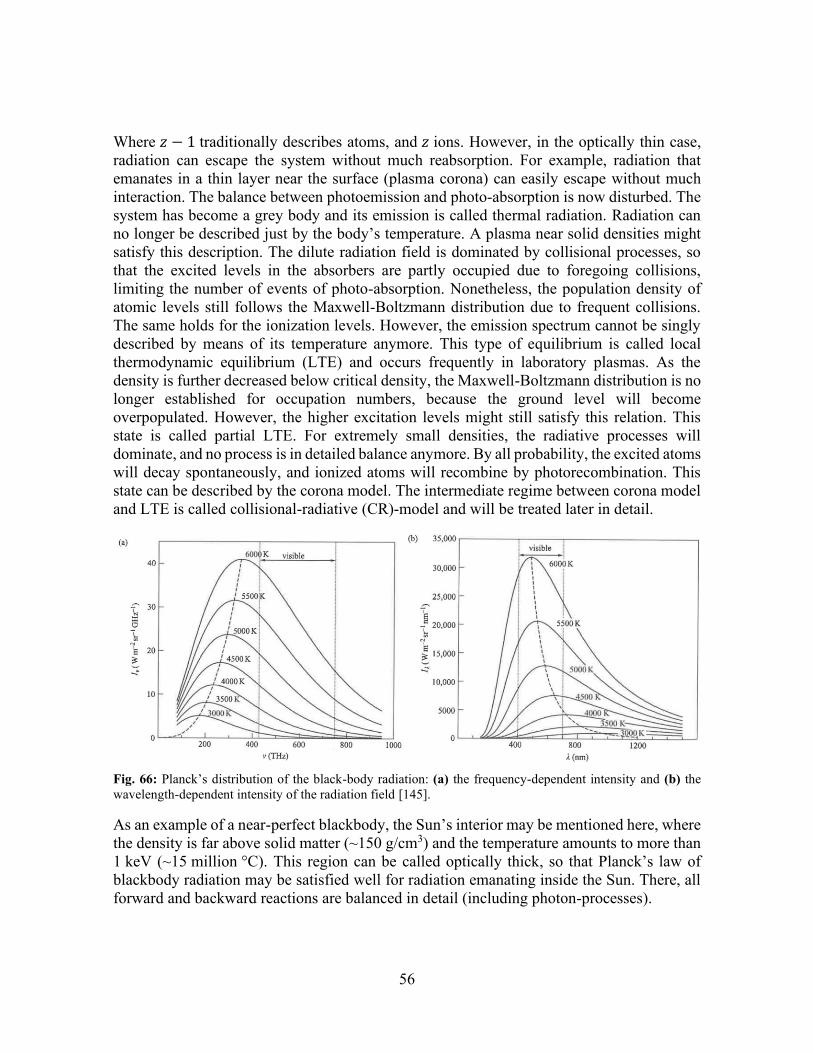
56
Where 𝑧 − 1 traditionally describes atoms, and 𝑧 ions. However, in the optically thin case, radiation can escape the system without much reabsorption. For example, radiation that emanates in a thin layer near the surface (plasma corona) can easily escape without much interaction. The balance between photoemission and photo-absorption is now disturbed. The system has become a grey body and its emission is called thermal radiation. Radiation can no longer be described just by the body’s temperature. A plasma near solid densities might satisfy this description. The dilute radiation field is dominated by collisional processes, so that the excited levels in the absorbers are partly occupied due to foregoing collisions, limiting the number of events of photo-absorption. Nonetheless, the population density of atomic levels still follows the Maxwell-Boltzmann distribution due to frequent collisions. The same holds for the ionization levels. However, the emission spectrum cannot be singly described by means of its temperature anymore. This type of equilibrium is called local thermodynamic equilibrium (LTE) and occurs frequently in laboratory plasmas. As the density is further decreased below critical density, the Maxwell-Boltzmann distribution is no longer established for occupation numbers, because the ground level will become overpopulated. However, the higher excitation levels might still satisfy this relation. This state is called partial LTE. For extremely small densities, the radiative processes will dominate, and no process is in detailed balance anymore. By all probability, the excited atoms will decay spontaneously, and ionized atoms will recombine by photorecombination. This state can be described by the corona model. The intermediate regime between corona model and LTE is called collisional-radiative (CR)-model and will be treated later in detail.
Fig. 66: Planck’s distribution of the black-body radiation: (a) the frequency-dependent intensity and (b) the wavelength-dependent intensity of the radiation field [145].
As an example of a near-perfect blackbody, the Sun’s interior may be mentioned here, where the density is far above solid matter (~150 g/cm3) and the temperature amounts to more than 1 keV (~15 million °C). This region can be called optically thick, so that Planck’s law of blackbody radiation may be satisfied well for radiation emanating inside the Sun. There, all forward and backward reactions are balanced in detail (including photon-processes).
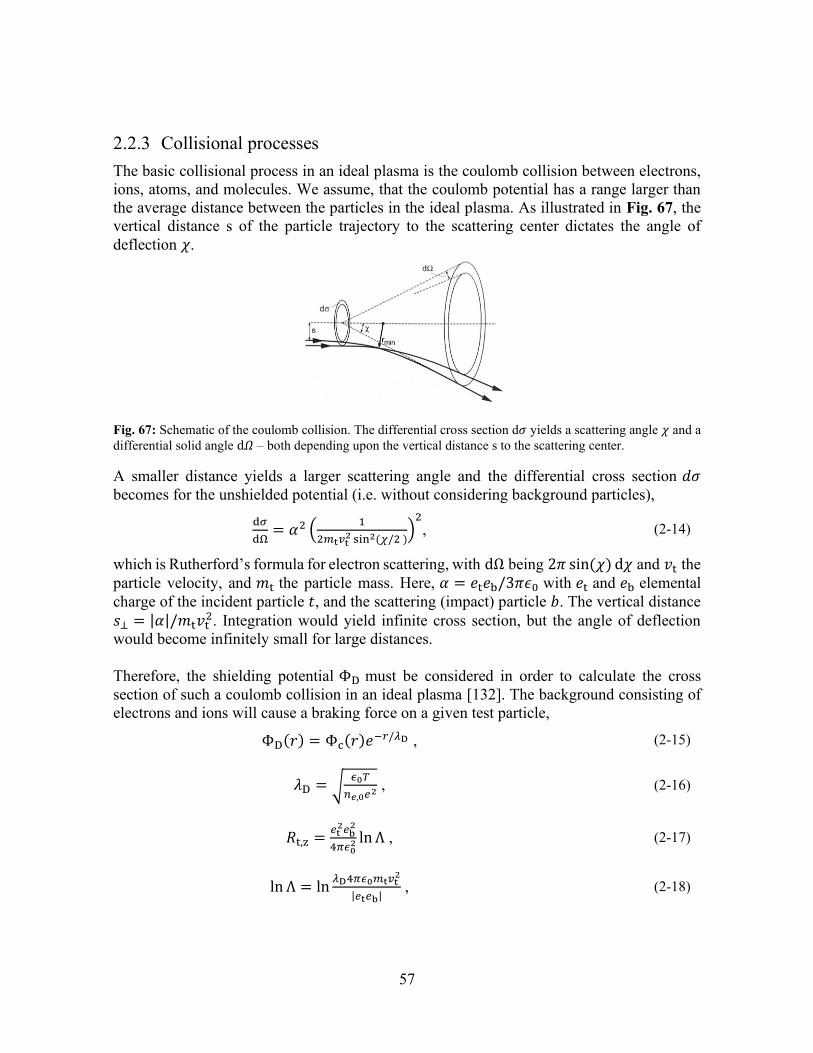
57
2.2.3 Collisional processes The basic collisional process in an ideal plasma is the coulomb collision between electrons, ions, atoms, and molecules. We assume, that the coulomb potential has a range larger than the average distance between the particles in the ideal plasma. As illustrated in Fig. 67, the vertical distance s of the particle trajectory to the scattering center dictates the angle of deflection 𝜒.
Fig. 67: Schematic of the coulomb collision. The differential cross section d𝜎 yields a scattering angle 𝜒 and a differential solid angle d𝛺 – both depending upon the vertical distance s to the scattering center.
A smaller distance yields a larger scattering angle and the differential cross section 𝑑𝜎 becomes for the unshielded potential (i.e. without considering background particles),
d𝜎
dΩ= 𝛼2 (
1
2𝑚t𝑣t2 sin2(𝜒/2 )
)2
, (2-14)
which is Rutherford’s formula for electron scattering, with dΩ being 2𝜋 sin(𝜒) d𝜒 and 𝑣t the particle velocity, and 𝑚t the particle mass. Here, 𝛼 = 𝑒t𝑒b/3𝜋𝜖0 with 𝑒t and 𝑒b elemental charge of the incident particle 𝑡, and the scattering (impact) particle 𝑏. The vertical distance 𝑠⊥ = |𝛼|/𝑚t𝑣t
2. Integration would yield infinite cross section, but the angle of deflection would become infinitely small for large distances. Therefore, the shielding potential ΦD must be considered in order to calculate the cross section of such a coulomb collision in an ideal plasma [132]. The background consisting of electrons and ions will cause a braking force on a given test particle,
ΦD(𝑟) = Φc(𝑟)𝑒−𝑟/𝜆D , (2-15)
𝜆D = √𝜖0𝑇
𝑛𝑒,0𝑒2 , (2-16)
𝑅t,z =𝑒t
2𝑒b2
4𝜋𝜖02 ln Λ , (2-17)
ln Λ = ln𝜆D4𝜋𝜖0𝑚t𝑣t
2
|𝑒t𝑒b| , (2-18)
58
with Φc being the undisturbed coulomb potential with a potential energy 𝑒tΦc =𝑒t𝑒b/4𝜋𝜖0𝑟, the Debye-length 𝜆D, the shielding (braking) force 𝑅t,z, the colliding particle 𝑒t, the stationary particle 𝑒b upon which the impact happens, and the coulomb logarithm Λ. It is assumed that the particles follow the Maxwell-Boltzmann velocity distribution, which is fulfilled in the absence of external fields. It can further be shown [132] that the electrical conductivity is given by,
𝜎 = |𝑗
��| =
3𝜖02(2𝜋𝑇e)3/2
ln Λ 𝑒2𝑚e1/2
𝑍2 , (2-19)
and the free mean path length 𝜆f of thermal electrons,
𝜆f ≈ 1016𝑇2[eV2]/𝑛[m−3] , (2-20)
which is independent of the mass of the participating particles. In the center of the sun, for example, the free mean path is on the order of µm, while in thin and hot plasmas it can become larger than 106 m, leading to a very good electrical conductivity. This is in contrast to the temperature-dependence of the conductivity in metals, which decreases with rising temperature due to the lattice vibrations (phonons), which do not exist in ideal plasmas. Elastic and inelastic collisions occur in the plasma, the latter called electron impact excitation and electron impact ionization with their counterparts, the electronic deexcitation and three-body recombination. Special forms include auto ionization and dielectronic recombination. In hot plasma-states of at least solid-state density and low electron energies, the dominant recombination process is three-body recombination, which is competitive to the radiative capture. First, the free electron is captured into a highly excited state of the ion, while exceeding energy is given off to a second free electron in the close surrounding. Then, the excited state decays via distant coulomb collisions subsequently into the lower states. As the ladder-like (radiationless) decay goes on, the chance for a radiative transition becomes higher because of the nucleus’ attractive force. This process is terminated in the ground level. Thus, the brightest emission is expected to emerge in the lower-density regions, as will be seen in the next chapter. The collisional rates of impact excitation (ie) [45], impact ionization (ii) [47], and three-body recombination (3br) [47] are given by,
β𝑖+1,𝑛3br ≈ 3.9 × 10⁻²⁸|𝐸𝑛|−7/4𝑇−5/4 [
cm6
s] , (2-21)
𝐶𝑖,𝑛ii = 2.4 × 10⁻⁶|𝐸𝑛|−7/4𝑇1/4𝑒−|𝐸𝑛|/𝑇 [
cm
s] , (2-22)
β𝑛′,𝑛ie =
2×10⁻⁴
𝑇°1/2
1
𝑛3𝑛′5(𝑛−2−𝑛′−2)4(1 − 𝑥𝑛𝑛′𝑒𝑥
𝑛𝑛′ 𝐸1(𝑥𝑛𝑛′)) [cm3
s] . (2-23)
Beside these basic collisional processes, there occur a variety of fundamental radiative processes in a plasma as well.
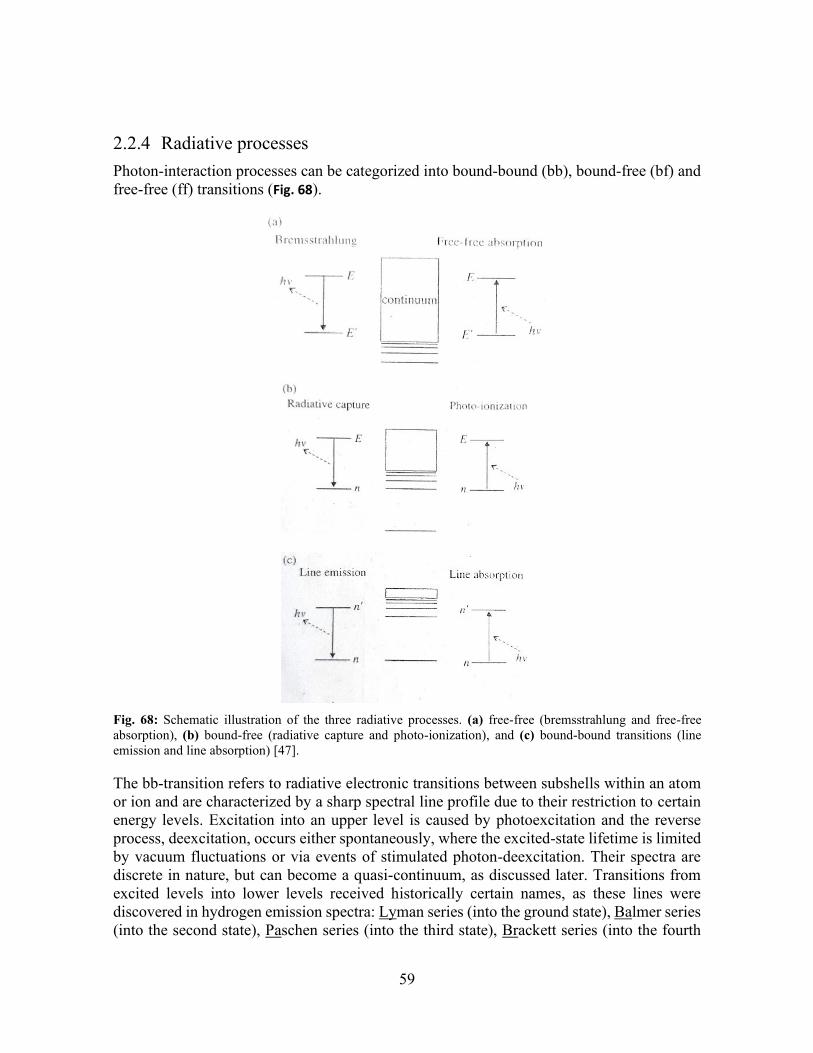
59
2.2.4 Radiative processes Photon-interaction processes can be categorized into bound-bound (bb), bound-free (bf) and free-free (ff) transitions (Fig. 68).
Fig. 68: Schematic illustration of the three radiative processes. (a) free-free (bremsstrahlung and free-free absorption), (b) bound-free (radiative capture and photo-ionization), and (c) bound-bound transitions (line emission and line absorption) [47].
The bb-transition refers to radiative electronic transitions between subshells within an atom or ion and are characterized by a sharp spectral line profile due to their restriction to certain energy levels. Excitation into an upper level is caused by photoexcitation and the reverse process, deexcitation, occurs either spontaneously, where the excited-state lifetime is limited by vacuum fluctuations or via events of stimulated photon-deexcitation. Their spectra are discrete in nature, but can become a quasi-continuum, as discussed later. Transitions from excited levels into lower levels received historically certain names, as these lines were discovered in hydrogen emission spectra: Lyman series (into the ground state), Balmer series (into the second state), Paschen series (into the third state), Brackett series (into the fourth
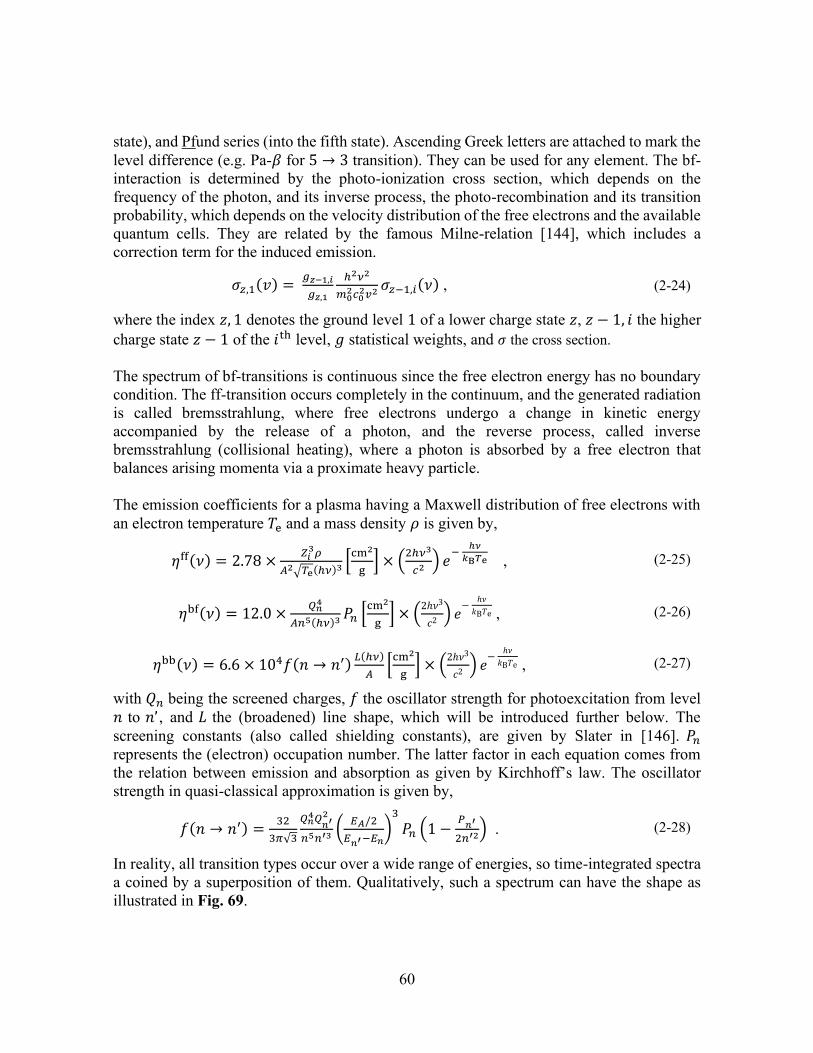
60
state), and Pfund series (into the fifth state). Ascending Greek letters are attached to mark the level difference (e.g. Pa-𝛽 for 5 → 3 transition). They can be used for any element. The bf-interaction is determined by the photo-ionization cross section, which depends on the frequency of the photon, and its inverse process, the photo-recombination and its transition probability, which depends on the velocity distribution of the free electrons and the available quantum cells. They are related by the famous Milne-relation [144], which includes a correction term for the induced emission.
𝜎𝑧,1(𝑣) = 𝑔𝑧−1,𝑖
𝑔𝑧,1
ℎ2𝜈2
𝑚02𝑐0
2𝑣2 𝜎𝑧−1,𝑖(𝜈) , (2-24)
where the index 𝑧, 1 denotes the ground level 1 of a lower charge state 𝑧, 𝑧 − 1, 𝑖 the higher charge state 𝑧 − 1 of the 𝑖th level, 𝑔 statistical weights, and 𝜎 the cross section. The spectrum of bf-transitions is continuous since the free electron energy has no boundary condition. The ff-transition occurs completely in the continuum, and the generated radiation is called bremsstrahlung, where free electrons undergo a change in kinetic energy accompanied by the release of a photon, and the reverse process, called inverse bremsstrahlung (collisional heating), where a photon is absorbed by a free electron that balances arising momenta via a proximate heavy particle. The emission coefficients for a plasma having a Maxwell distribution of free electrons with an electron temperature 𝑇e and a mass density 𝜌 is given by,
𝜂ff(𝜈) = 2.78 ×𝑍𝑖
3𝜌
𝐴2√𝑇e(ℎ𝜈)3 [cm2
g] × (
2ℎ𝜈3
𝑐2 ) 𝑒−
ℎ𝜈
𝑘B𝑇e , (2-25)
𝜂bf(𝜈) = 12.0 ×𝑄𝑛
4
𝐴𝑛5(ℎ𝜈)3 𝑃𝑛 [cm2
g] × (
2ℎ𝜈3
𝑐2) 𝑒
− ℎ𝜈
𝑘B𝑇e , (2-26)
𝜂bb(𝜈) = 6.6 × 10⁴𝑓(𝑛 → 𝑛′)𝐿(ℎ𝜈)
𝐴[
cm2
g] × (
2ℎ𝜈3
𝑐2) 𝑒
− ℎ𝜈
𝑘B𝑇e , (2-27)
with 𝑄𝑛 being the screened charges, 𝑓 the oscillator strength for photoexcitation from level 𝑛 to 𝑛’, and 𝐿 the (broadened) line shape, which will be introduced further below. The screening constants (also called shielding constants), are given by Slater in [146]. 𝑃𝑛 represents the (electron) occupation number. The latter factor in each equation comes from the relation between emission and absorption as given by Kirchhoff’s law. The oscillator strength in quasi-classical approximation is given by,
𝑓(𝑛 → 𝑛′) =32
3𝜋√3
𝑄𝑛4𝑄
𝑛′2
𝑛5𝑛′3(
𝐸𝐴/2
𝐸𝑛′−𝐸𝑛)
3
𝑃𝑛 (1 −𝑃
𝑛′
2𝑛′2) . (2-28)
In reality, all transition types occur over a wide range of energies, so time-integrated spectra a coined by a superposition of them. Qualitatively, such a spectrum can have the shape as illustrated in Fig. 69.
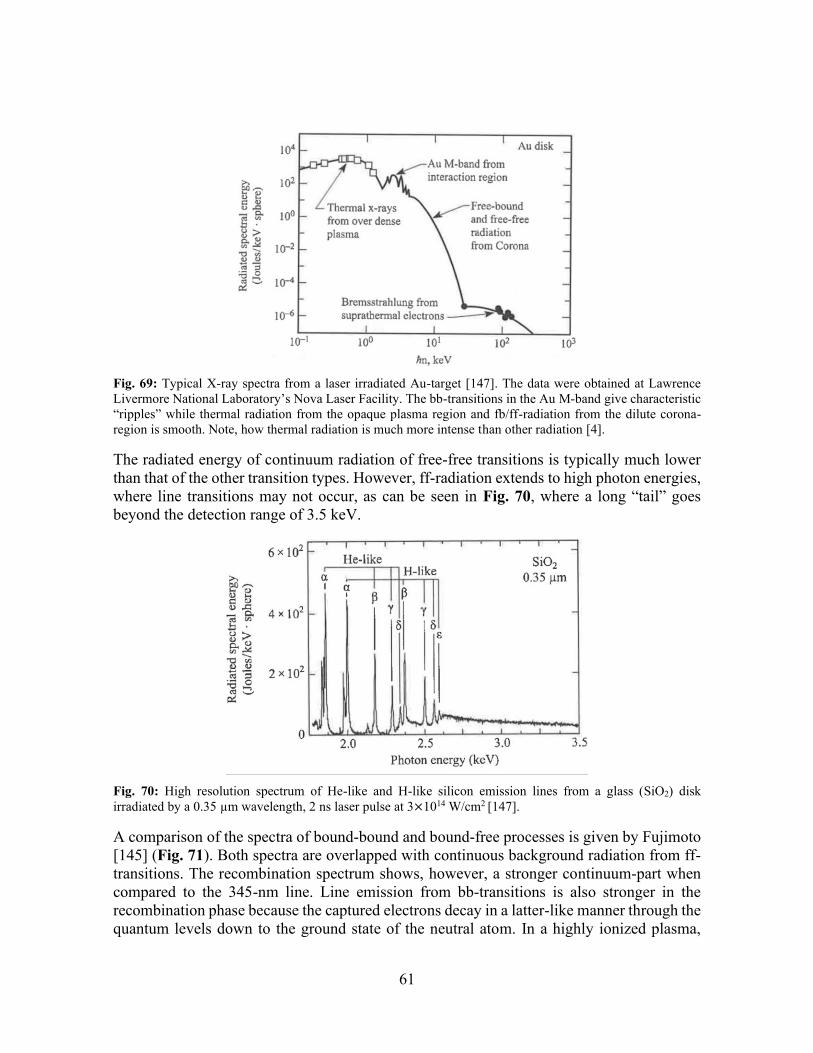
61
Fig. 69: Typical X-ray spectra from a laser irradiated Au-target [147]. The data were obtained at Lawrence Livermore National Laboratory’s Nova Laser Facility. The bb-transitions in the Au M-band give characteristic “ripples” while thermal radiation from the opaque plasma region and fb/ff-radiation from the dilute corona-region is smooth. Note, how thermal radiation is much more intense than other radiation [4].
The radiated energy of continuum radiation of free-free transitions is typically much lower than that of the other transition types. However, ff-radiation extends to high photon energies, where line transitions may not occur, as can be seen in Fig. 70, where a long “tail” goes beyond the detection range of 3.5 keV.
Fig. 70: High resolution spectrum of He-like and H-like silicon emission lines from a glass (SiO2) disk irradiated by a 0.35 µm wavelength, 2 ns laser pulse at 3×10¹⁴ W/cm2 [147].
A comparison of the spectra of bound-bound and bound-free processes is given by Fujimoto [145] (Fig. 71). Both spectra are overlapped with continuous background radiation from ff-transitions. The recombination spectrum shows, however, a stronger continuum-part when compared to the 345-nm line. Line emission from bb-transitions is also stronger in the recombination phase because the captured electrons decay in a latter-like manner through the quantum levels down to the ground state of the neutral atom. In a highly ionized plasma,
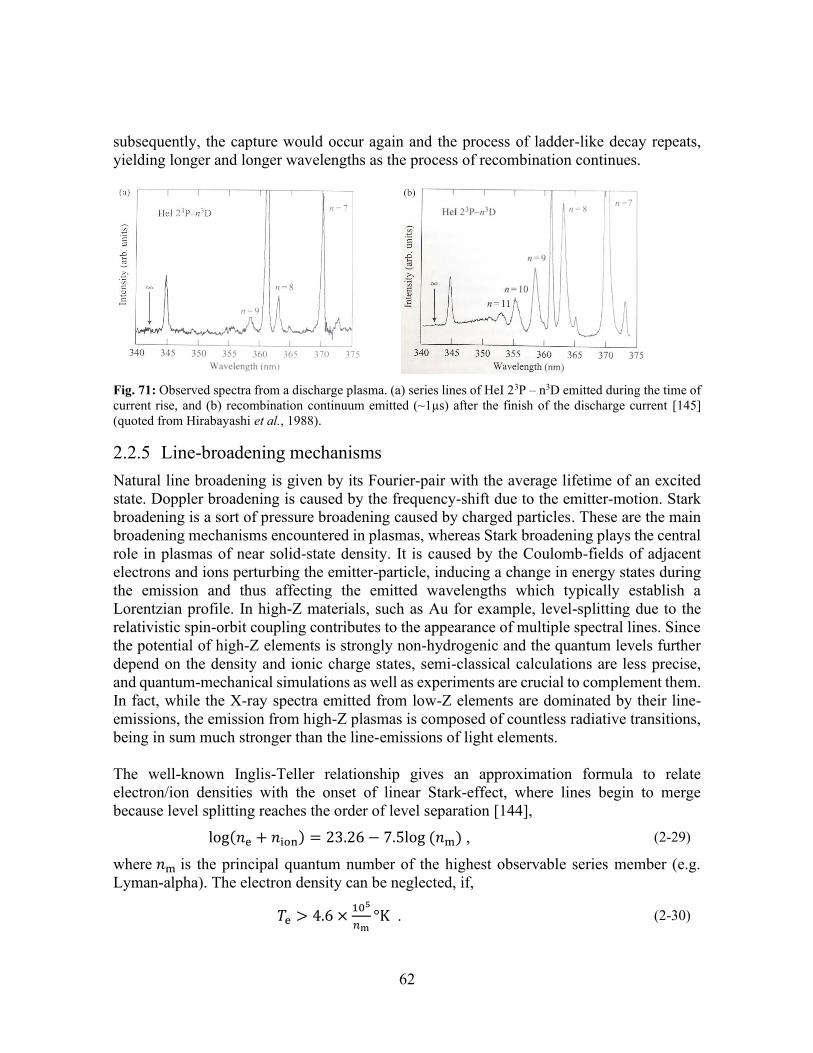
62
subsequently, the capture would occur again and the process of ladder-like decay repeats, yielding longer and longer wavelengths as the process of recombination continues.
Fig. 71: Observed spectra from a discharge plasma. (a) series lines of HeI 23P – n3D emitted during the time of current rise, and (b) recombination continuum emitted (~1µs) after the finish of the discharge current [145] (quoted from Hirabayashi et al., 1988).
2.2.5 Line-broadening mechanisms Natural line broadening is given by its Fourier-pair with the average lifetime of an excited state. Doppler broadening is caused by the frequency-shift due to the emitter-motion. Stark broadening is a sort of pressure broadening caused by charged particles. These are the main broadening mechanisms encountered in plasmas, whereas Stark broadening plays the central role in plasmas of near solid-state density. It is caused by the Coulomb-fields of adjacent electrons and ions perturbing the emitter-particle, inducing a change in energy states during the emission and thus affecting the emitted wavelengths which typically establish a Lorentzian profile. In high-Z materials, such as Au for example, level-splitting due to the relativistic spin-orbit coupling contributes to the appearance of multiple spectral lines. Since the potential of high-Z elements is strongly non-hydrogenic and the quantum levels further depend on the density and ionic charge states, semi-classical calculations are less precise, and quantum-mechanical simulations as well as experiments are crucial to complement them. In fact, while the X-ray spectra emitted from low-Z elements are dominated by their line-emissions, the emission from high-Z plasmas is composed of countless radiative transitions, being in sum much stronger than the line-emissions of light elements. The well-known Inglis-Teller relationship gives an approximation formula to relate electron/ion densities with the onset of linear Stark-effect, where lines begin to merge because level splitting reaches the order of level separation [144],
log(𝑛e + 𝑛ion) = 23.26 − 7.5log (𝑛m) , (2-29)
where 𝑛m is the principal quantum number of the highest observable series member (e.g. Lyman-alpha). The electron density can be neglected, if,
𝑇e > 4.6 ×10⁵
𝑛m°K . (2-30)
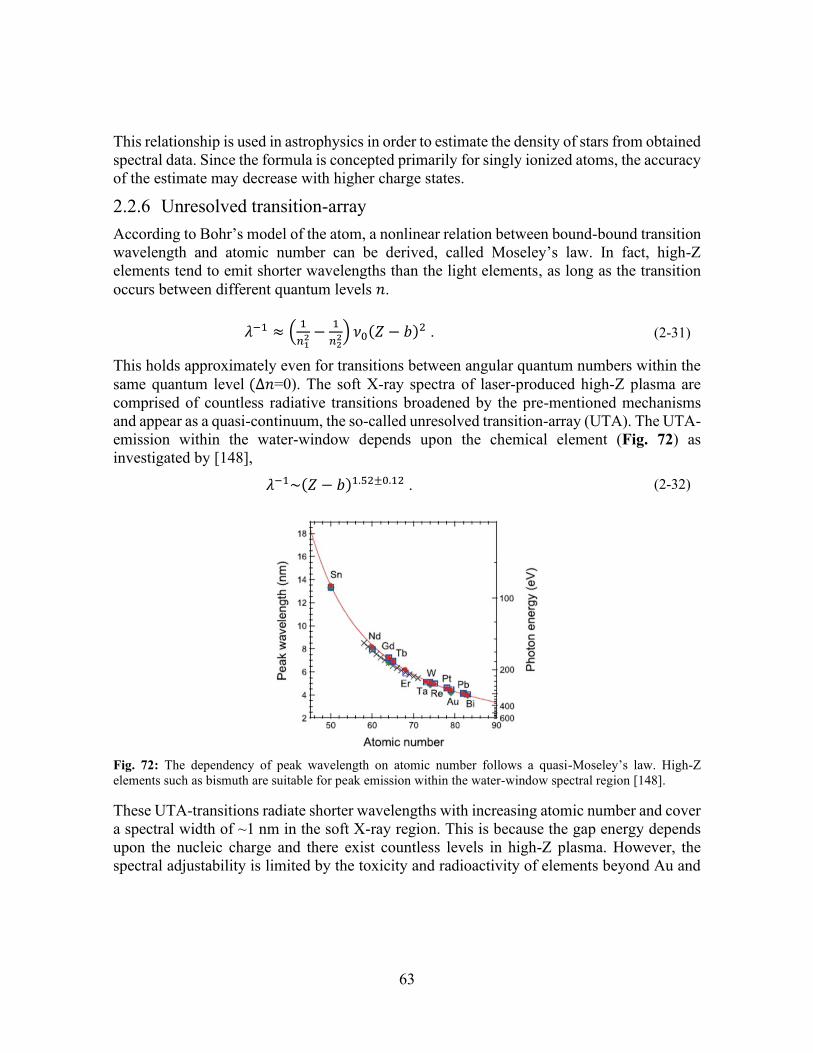
63
This relationship is used in astrophysics in order to estimate the density of stars from obtained spectral data. Since the formula is concepted primarily for singly ionized atoms, the accuracy of the estimate may decrease with higher charge states.
2.2.6 Unresolved transition-array According to Bohr’s model of the atom, a nonlinear relation between bound-bound transition wavelength and atomic number can be derived, called Moseley’s law. In fact, high-Z elements tend to emit shorter wavelengths than the light elements, as long as the transition occurs between different quantum levels 𝑛.
𝜆−1 ≈ (1
𝑛12 −
1
𝑛22) 𝜈0(𝑍 − 𝑏)2 . (2-31)
This holds approximately even for transitions between angular quantum numbers within the same quantum level (∆𝑛=0). The soft X-ray spectra of laser-produced high-Z plasma are comprised of countless radiative transitions broadened by the pre-mentioned mechanisms and appear as a quasi-continuum, the so-called unresolved transition-array (UTA). The UTA-emission within the water-window depends upon the chemical element (Fig. 72) as investigated by [148],
𝜆−1~(𝑍 − 𝑏)1.52±0.12 . (2-32)
Fig. 72: The dependency of peak wavelength on atomic number follows a quasi-Moseley’s law. High-Z elements such as bismuth are suitable for peak emission within the water-window spectral region [148].
These UTA-transitions radiate shorter wavelengths with increasing atomic number and cover a spectral width of ~1 nm in the soft X-ray region. This is because the gap energy depends upon the nucleic charge and there exist countless levels in high-Z plasma. However, the spectral adjustability is limited by the toxicity and radioactivity of elements beyond Au and
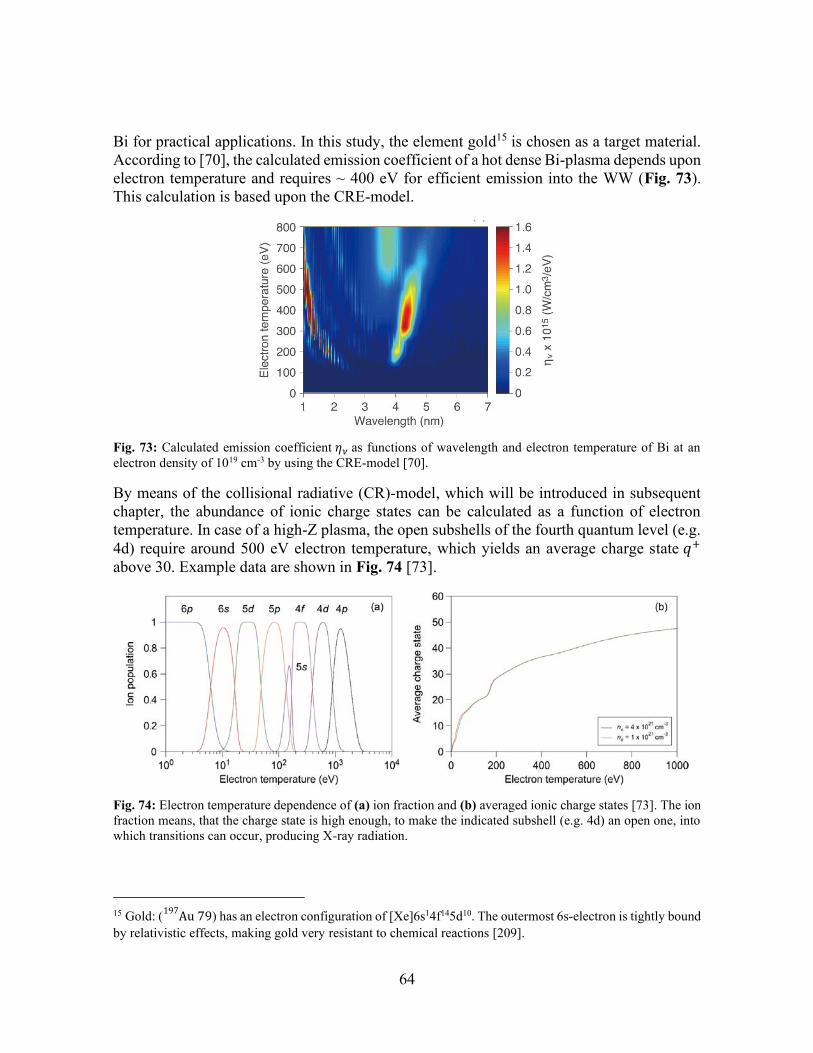
64
Bi for practical applications. In this study, the element gold15 is chosen as a target material. According to [70], the calculated emission coefficient of a hot dense Bi-plasma depends upon electron temperature and requires ~ 400 eV for efficient emission into the WW (Fig. 73). This calculation is based upon the CRE-model.
Fig. 73: Calculated emission coefficient 𝜂𝜈 as functions of wavelength and electron temperature of Bi at an electron density of 1019 cm-3 by using the CRE-model [70].
By means of the collisional radiative (CR)-model, which will be introduced in subsequent chapter, the abundance of ionic charge states can be calculated as a function of electron temperature. In case of a high-Z plasma, the open subshells of the fourth quantum level (e.g. 4d) require around 500 eV electron temperature, which yields an average charge state 𝑞+ above 30. Example data are shown in Fig. 74 [73].
Fig. 74: Electron temperature dependence of (a) ion fraction and (b) averaged ionic charge states [73]. The ion fraction means, that the charge state is high enough, to make the indicated subshell (e.g. 4d) an open one, into which transitions can occur, producing X-ray radiation.
15 Gold: ( Au 79
197 ) has an electron configuration of [Xe]6s14f145d10. The outermost 6s-electron is tightly bound by relativistic effects, making gold very resistant to chemical reactions [209].
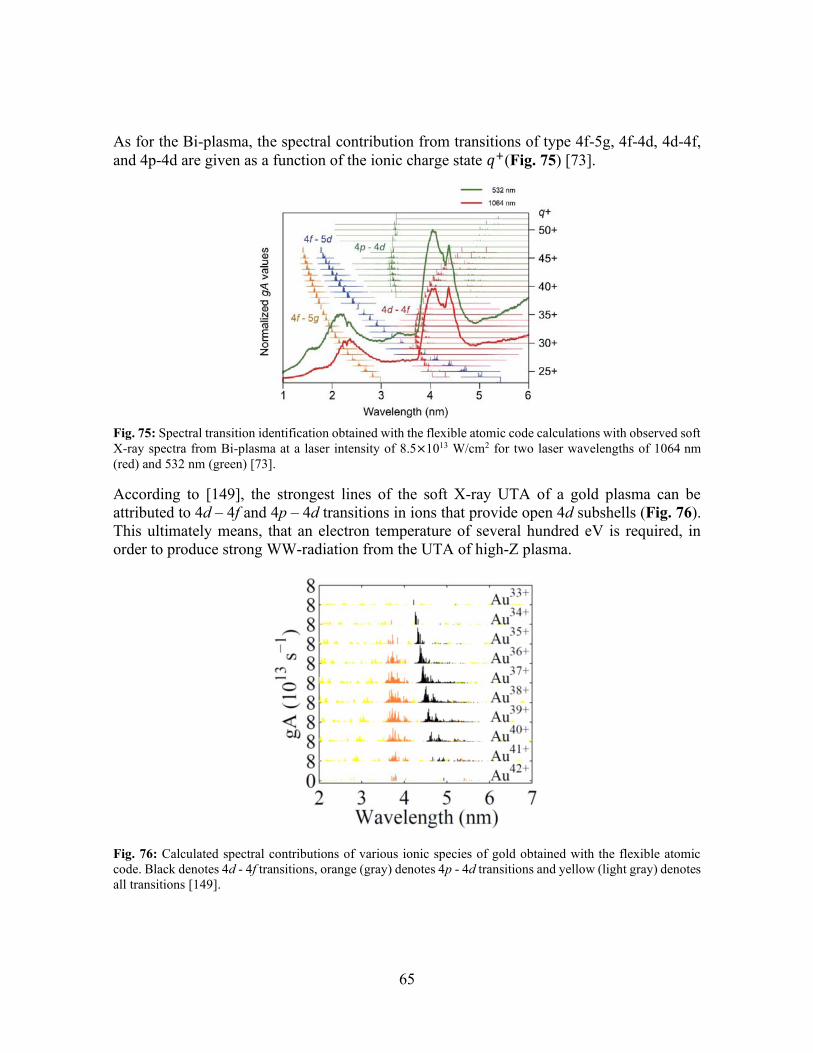
65
As for the Bi-plasma, the spectral contribution from transitions of type 4f-5g, 4f-4d, 4d-4f, and 4p-4d are given as a function of the ionic charge state 𝑞+(Fig. 75) [73].
Fig. 75: Spectral transition identification obtained with the flexible atomic code calculations with observed soft X-ray spectra from Bi-plasma at a laser intensity of 8.5×10¹³ W/cm2 for two laser wavelengths of 1064 nm (red) and 532 nm (green) [73].
According to [149], the strongest lines of the soft X-ray UTA of a gold plasma can be attributed to 4d – 4f and 4p – 4d transitions in ions that provide open 4d subshells (Fig. 76). This ultimately means, that an electron temperature of several hundred eV is required, in order to produce strong WW-radiation from the UTA of high-Z plasma.
Fig. 76: Calculated spectral contributions of various ionic species of gold obtained with the flexible atomic code. Black denotes 4d - 4f transitions, orange (gray) denotes 4p - 4d transitions and yellow (light gray) denotes all transitions [149].
66
According to recent work reported in [50], electron temperatures as high as 600 eV are required in a high-Z plasma, in order to populate the WW UTA-emission at 4 nm and 800 eV for a 3-nm emission, respectively. It is further advisable to keep the ion densities as low as possible to reduce opacity effects. In Au-plasma, the UTA from ∆𝑛=0 transitions in 4𝑑-subshells do not overlap with the WW-region, being found at around 4.5 nm. However, there is another fairly strong UTA radiating in the WW spectral region, which will be characterized in the next chapter by employing a variety of diagnostic and simulation methods. Finally, it should be noted, that the emission from light elements is very different from the UTA of high-Z elements. A light element such as carbon yields a line spectrum, which yields much less X-rays in a given wavelength region. This very fact is due to the transition probabilities that coin the spectrum.
2.2.7 Opacity In plasma, self-absorption is encouraged by the spectral matching between emissivity and absorption coefficient. In principle, the absorption of radiation in the laser-plasma is followed by scattering or extinction, whereas scattering preserves the photon energy, while the extinction causes a re-emission of the absorbed photon at a different wavelength due to induced emission or collisions of the second kind or further excitation. The radiative transfer of a certain spectral band through a hot dense plasma layer depends thus on its optical thickness. The optical thickness influences the absorption 𝜅′(𝜈) and determines the penetration depth of radiation of intensity 𝐼𝜈 through an opaque plasma layer of thickness 𝑧 and can be described by the radiation transfer equation,
d𝐼𝜈(𝑧)
d𝑧= 𝜀𝜈(𝑧) − 𝜅′(𝜈, 𝑧)𝐼𝜈(𝑧) , (2-33)
𝐼ν(𝑧0) = 𝐼ν(0)𝑒−∫ 𝜅′(𝜈,𝑧)d𝑧
𝑧00 + ∫ 𝜀ν(𝑧)𝑒
−∫ 𝜅′(𝜈,𝑧)d𝑧𝑧00 d𝑧
𝑧00
, (2-34)
where 𝜀ν stands for the emission coefficient (spontaneous emission). The coefficients for emission and absorption are typically taken from a table based on experimental values. As will be seen in subsequent chapters, the solution to this equation yields a simple and handy expression that is used for simulation in this study. A famous example of the opacity effect is the selective absorption occurring in the corona of the Sun, where impurities in the gas undergo photoionization, leading to the well-known Fraunhofer-lines [150]. In Fig. 77, the spectrum of the Sun is shown mainly in the range from violet to red, where dark vertical lines appear at some specific wavelengths / colors. They correspond to the light that was absorbed in the corona of the Sun and could not reach the detector, thus appearing dark. The opacity of the Sun is for these lines very high.
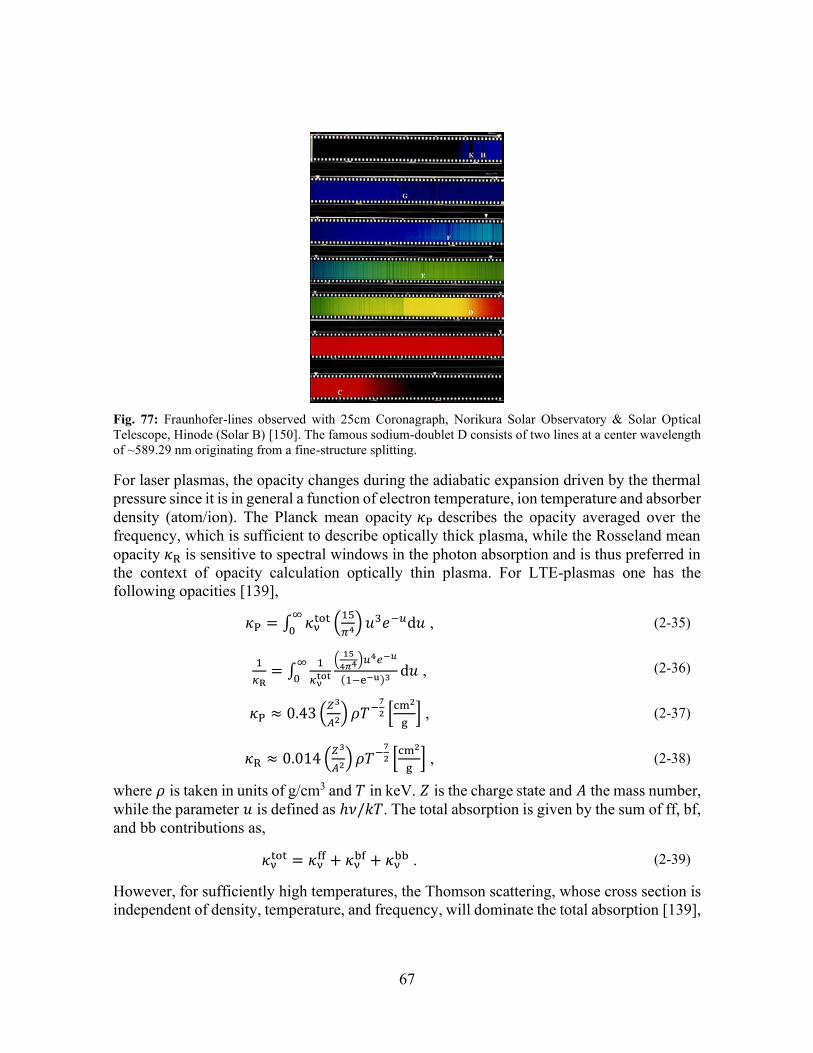
67
Fig. 77: Fraunhofer-lines observed with 25cm Coronagraph, Norikura Solar Observatory & Solar Optical Telescope, Hinode (Solar B) [150]. The famous sodium-doublet D consists of two lines at a center wavelength of ~589.29 nm originating from a fine-structure splitting.
For laser plasmas, the opacity changes during the adiabatic expansion driven by the thermal pressure since it is in general a function of electron temperature, ion temperature and absorber density (atom/ion). The Planck mean opacity 𝜅P describes the opacity averaged over the frequency, which is sufficient to describe optically thick plasma, while the Rosseland mean opacity 𝜅R is sensitive to spectral windows in the photon absorption and is thus preferred in the context of opacity calculation optically thin plasma. For LTE-plasmas one has the following opacities [139],
𝜅P = ∫ 𝜅νtot (
15
𝜋4) 𝑢3𝑒−𝑢d𝑢∞
0 , (2-35)
1
𝜅R= ∫
1
𝜅νtot
(15
4𝜋4)𝑢4𝑒−𝑢
(1−e−u)3 d𝑢∞
0 , (2-36)
𝜅P ≈ 0.43 (𝑍3
𝐴2) 𝜌𝑇−
7
2 [cm2
g] , (2-37)
𝜅R ≈ 0.014 (𝑍3
𝐴2) 𝜌𝑇−
7
2 [cm2
g] , (2-38)
where 𝜌 is taken in units of g/cm3 and 𝑇 in keV. 𝑍 is the charge state and 𝐴 the mass number, while the parameter 𝑢 is defined as ℎ𝜈/𝑘𝑇. The total absorption is given by the sum of ff, bf, and bb contributions as,
𝜅νtot = 𝜅ν
ff + 𝜅νbf + 𝜅ν
bb . (2-39)
However, for sufficiently high temperatures, the Thomson scattering, whose cross section is independent of density, temperature, and frequency, will dominate the total absorption [139],
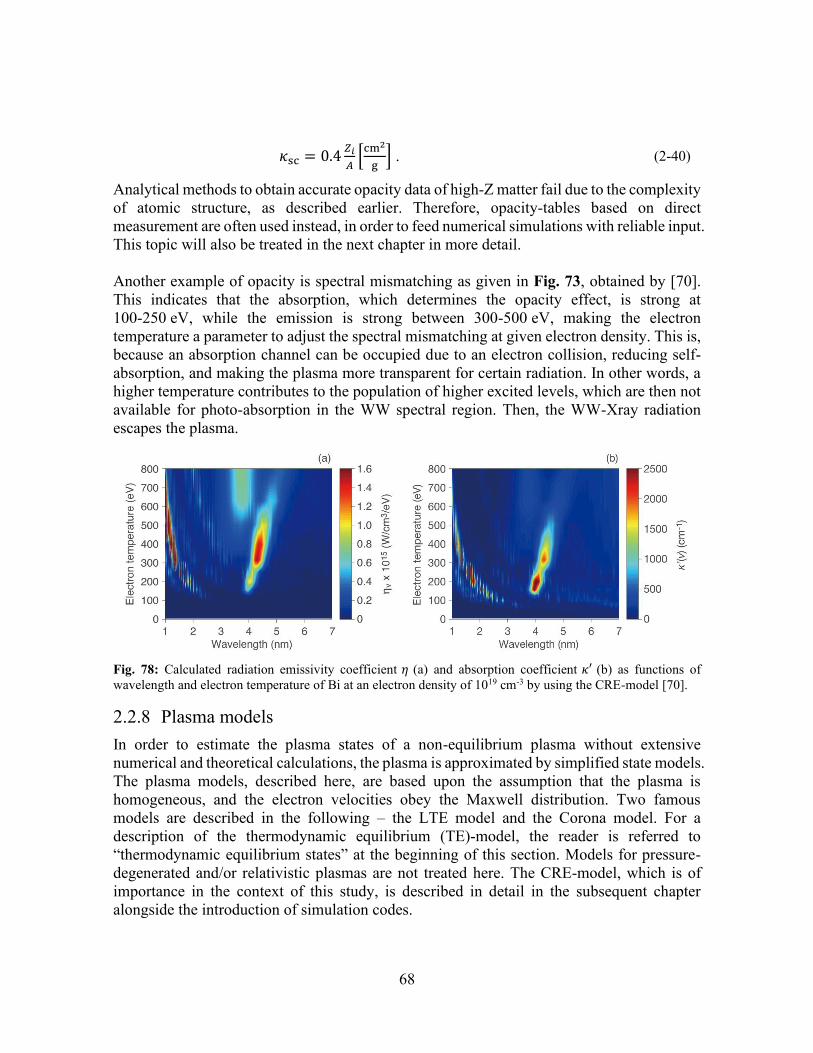
68
𝜅sc = 0.4𝑍𝑖
𝐴[
cm2
g] . (2-40)
Analytical methods to obtain accurate opacity data of high-Z matter fail due to the complexity of atomic structure, as described earlier. Therefore, opacity-tables based on direct measurement are often used instead, in order to feed numerical simulations with reliable input. This topic will also be treated in the next chapter in more detail. Another example of opacity is spectral mismatching as given in Fig. 73, obtained by [70]. This indicates that the absorption, which determines the opacity effect, is strong at 100-250 eV, while the emission is strong between 300-500 eV, making the electron temperature a parameter to adjust the spectral mismatching at given electron density. This is, because an absorption channel can be occupied due to an electron collision, reducing self-absorption, and making the plasma more transparent for certain radiation. In other words, a higher temperature contributes to the population of higher excited levels, which are then not available for photo-absorption in the WW spectral region. Then, the WW-Xray radiation escapes the plasma.
Fig. 78: Calculated radiation emissivity coefficient 𝜂 (a) and absorption coefficient 𝜅′ (b) as functions of wavelength and electron temperature of Bi at an electron density of 1019 cm-3 by using the CRE-model [70].
2.2.8 Plasma models In order to estimate the plasma states of a non-equilibrium plasma without extensive numerical and theoretical calculations, the plasma is approximated by simplified state models. The plasma models, described here, are based upon the assumption that the plasma is homogeneous, and the electron velocities obey the Maxwell distribution. Two famous models are described in the following – the LTE model and the Corona model. For a description of the thermodynamic equilibrium (TE)-model, the reader is referred to “thermodynamic equilibrium states” at the beginning of this section. Models for pressure-degenerated and/or relativistic plasmas are not treated here. The CRE-model, which is of importance in the context of this study, is described in detail in the subsequent chapter alongside the introduction of simulation codes.
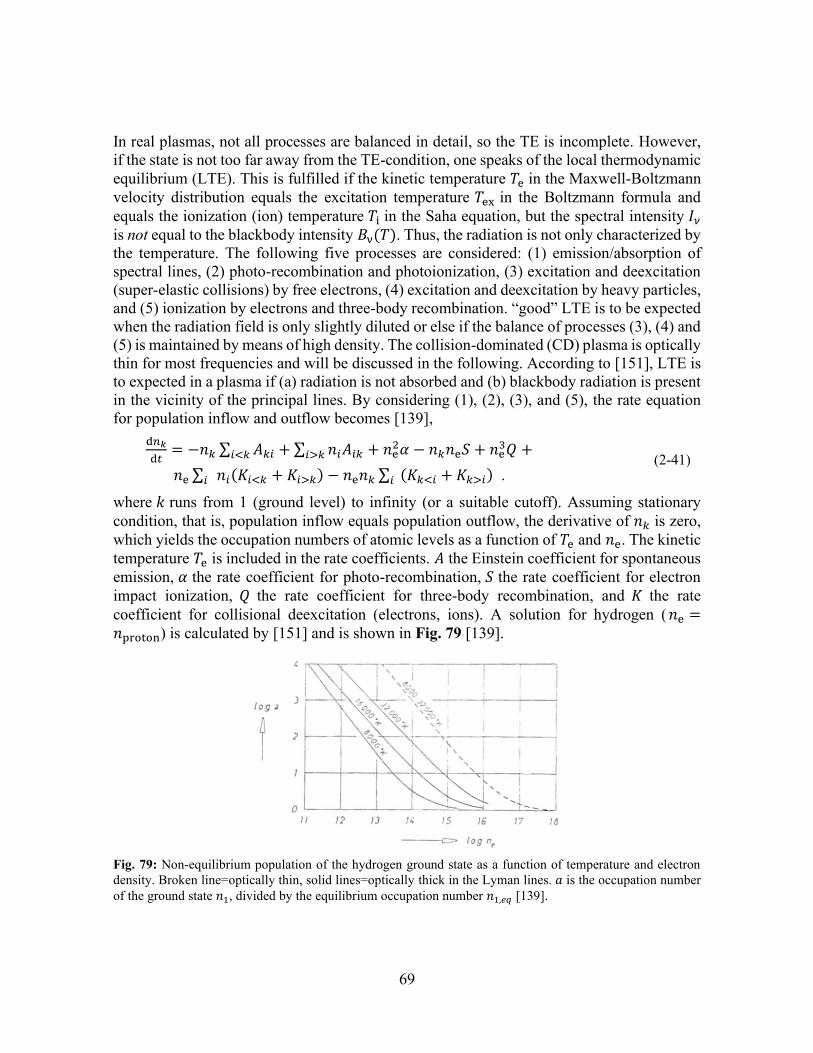
69
In real plasmas, not all processes are balanced in detail, so the TE is incomplete. However, if the state is not too far away from the TE-condition, one speaks of the local thermodynamic equilibrium (LTE). This is fulfilled if the kinetic temperature 𝑇e in the Maxwell-Boltzmann velocity distribution equals the excitation temperature 𝑇ex in the Boltzmann formula and equals the ionization (ion) temperature 𝑇i in the Saha equation, but the spectral intensity 𝐼𝜈 is not equal to the blackbody intensity 𝐵ν(𝑇). Thus, the radiation is not only characterized by the temperature. The following five processes are considered: (1) emission/absorption of spectral lines, (2) photo-recombination and photoionization, (3) excitation and deexcitation (super-elastic collisions) by free electrons, (4) excitation and deexcitation by heavy particles, and (5) ionization by electrons and three-body recombination. “good” LTE is to be expected when the radiation field is only slightly diluted or else if the balance of processes (3), (4) and (5) is maintained by means of high density. The collision-dominated (CD) plasma is optically thin for most frequencies and will be discussed in the following. According to [151], LTE is to expected in a plasma if (a) radiation is not absorbed and (b) blackbody radiation is present in the vicinity of the principal lines. By considering (1), (2), (3), and (5), the rate equation for population inflow and outflow becomes [139],
d𝑛𝑘
d𝑡= −𝑛𝑘 ∑ 𝐴𝑘𝑖 + ∑ 𝑛𝑖𝐴𝑖𝑘 + 𝑛e
2𝛼 − 𝑛𝑘𝑛e𝑆 + 𝑛e3𝑄 +𝑖>𝑘𝑖<𝑘
𝑛e ∑ 𝑛𝑖(𝐾𝑖<𝑘 + 𝐾𝑖>𝑘) − 𝑛e𝑛𝑘 ∑ (𝐾𝑘<𝑖 + 𝐾𝑘>𝑖)𝑖𝑖 . (2-41)
where 𝑘 runs from 1 (ground level) to infinity (or a suitable cutoff). Assuming stationary condition, that is, population inflow equals population outflow, the derivative of 𝑛𝑘 is zero, which yields the occupation numbers of atomic levels as a function of 𝑇e and 𝑛e. The kinetic temperature 𝑇e is included in the rate coefficients. 𝐴 the Einstein coefficient for spontaneous emission, 𝛼 the rate coefficient for photo-recombination, 𝑆 the rate coefficient for electron impact ionization, 𝑄 the rate coefficient for three-body recombination, and 𝐾 the rate coefficient for collisional deexcitation (electrons, ions). A solution for hydrogen ( 𝑛e =𝑛proton) is calculated by [151] and is shown in Fig. 79 [139].
Fig. 79: Non-equilibrium population of the hydrogen ground state as a function of temperature and electron density. Broken line=optically thin, solid lines=optically thick in the Lyman lines. 𝑎 is the occupation number of the ground state 𝑛1, divided by the equilibrium occupation number 𝑛1,𝑒𝑞 [139].
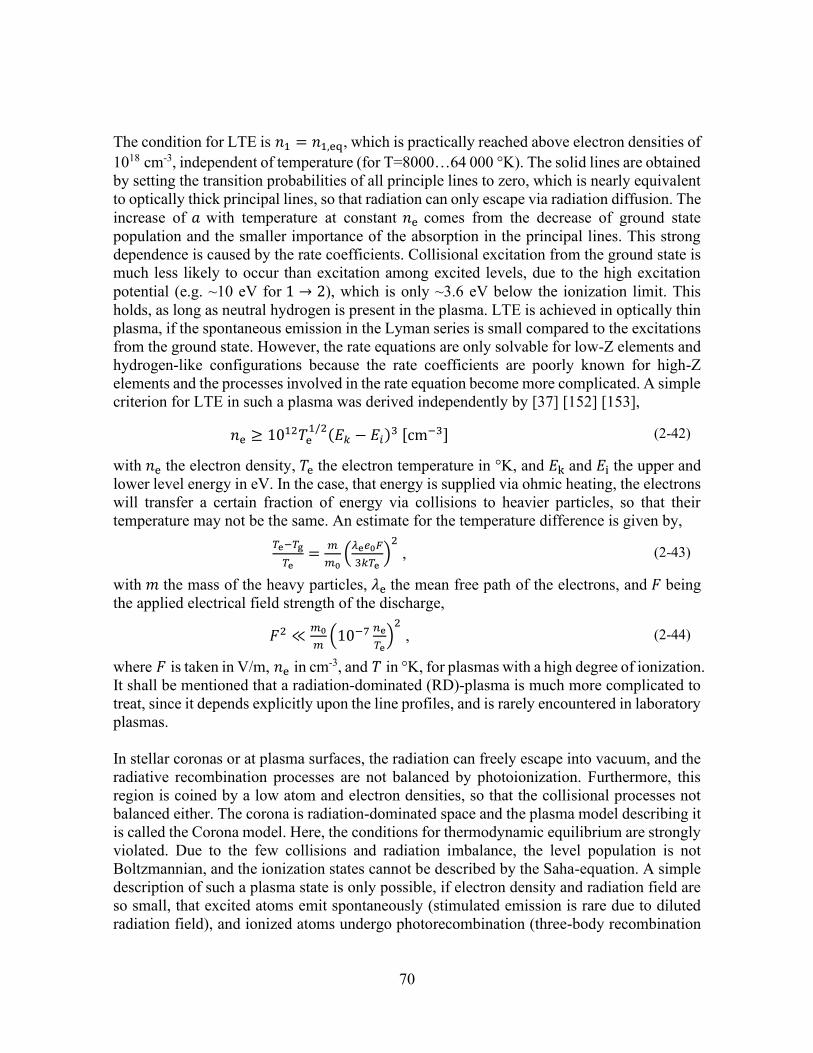
70
The condition for LTE is 𝑛1 = 𝑛1,eq, which is practically reached above electron densities of 1018 cm-3, independent of temperature (for T=8000…64 000 °K). The solid lines are obtained by setting the transition probabilities of all principle lines to zero, which is nearly equivalent to optically thick principal lines, so that radiation can only escape via radiation diffusion. The increase of 𝑎 with temperature at constant 𝑛e comes from the decrease of ground state population and the smaller importance of the absorption in the principal lines. This strong dependence is caused by the rate coefficients. Collisional excitation from the ground state is much less likely to occur than excitation among excited levels, due to the high excitation potential (e.g. ~10 eV for 1 → 2), which is only ~3.6 eV below the ionization limit. This holds, as long as neutral hydrogen is present in the plasma. LTE is achieved in optically thin plasma, if the spontaneous emission in the Lyman series is small compared to the excitations from the ground state. However, the rate equations are only solvable for low-Z elements and hydrogen-like configurations because the rate coefficients are poorly known for high-Z elements and the processes involved in the rate equation become more complicated. A simple criterion for LTE in such a plasma was derived independently by [37] [152] [153],
𝑛e ≥ 1012𝑇e1/2(𝐸𝑘 − 𝐸𝑖)3 [cm−3] (2-42)
with 𝑛e the electron density, 𝑇e the electron temperature in °K, and 𝐸k and 𝐸i the upper and lower level energy in eV. In the case, that energy is supplied via ohmic heating, the electrons will transfer a certain fraction of energy via collisions to heavier particles, so that their temperature may not be the same. An estimate for the temperature difference is given by,
𝑇e−𝑇g
𝑇e=
𝑚
𝑚0(
𝜆e𝑒0𝐹
3𝑘𝑇e)
2
, (2-43)
with 𝑚 the mass of the heavy particles, 𝜆e the mean free path of the electrons, and 𝐹 being the applied electrical field strength of the discharge,
𝐹2 ≪𝑚0
𝑚(10−7 𝑛e
𝑇e)
2
, (2-44)
where 𝐹 is taken in V/m, 𝑛e in cm-3, and 𝑇 in °K, for plasmas with a high degree of ionization. It shall be mentioned that a radiation-dominated (RD)-plasma is much more complicated to treat, since it depends explicitly upon the line profiles, and is rarely encountered in laboratory plasmas. In stellar coronas or at plasma surfaces, the radiation can freely escape into vacuum, and the radiative recombination processes are not balanced by photoionization. Furthermore, this region is coined by a low atom and electron densities, so that the collisional processes not balanced either. The corona is radiation-dominated space and the plasma model describing it is called the Corona model. Here, the conditions for thermodynamic equilibrium are strongly violated. Due to the few collisions and radiation imbalance, the level population is not Boltzmannian, and the ionization states cannot be described by the Saha-equation. A simple description of such a plasma state is only possible, if electron density and radiation field are so small, that excited atoms emit spontaneously (stimulated emission is rare due to diluted radiation field), and ionized atoms undergo photorecombination (three-body recombination
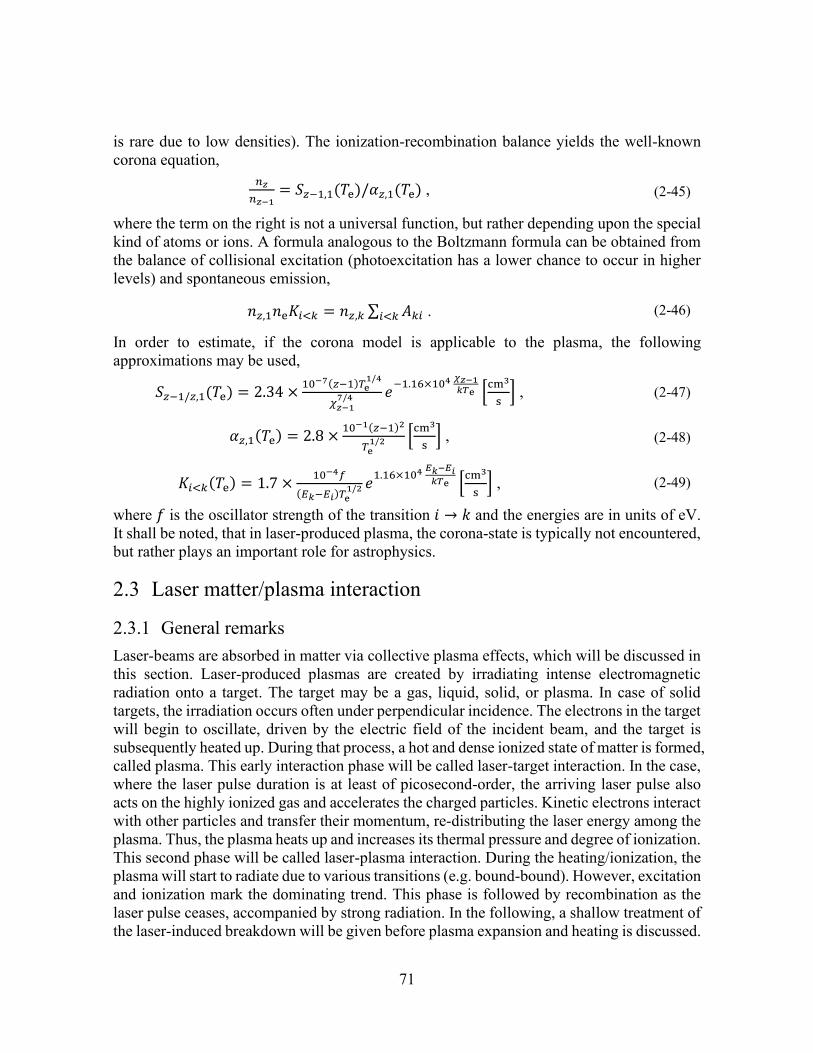
71
is rare due to low densities). The ionization-recombination balance yields the well-known corona equation,
𝑛𝑧
𝑛𝑧−1= 𝑆𝑧−1,1(𝑇e)/𝛼𝑧,1(𝑇e) , (2-45)
where the term on the right is not a universal function, but rather depending upon the special kind of atoms or ions. A formula analogous to the Boltzmann formula can be obtained from the balance of collisional excitation (photoexcitation has a lower chance to occur in higher levels) and spontaneous emission,
𝑛𝑧,1𝑛e𝐾𝑖<𝑘 = 𝑛𝑧,𝑘 ∑ 𝐴𝑘𝑖𝑖<𝑘 . (2-46)
In order to estimate, if the corona model is applicable to the plasma, the following approximations may be used,
𝑆𝑧−1/𝑧,1(𝑇e) = 2.34 ×10⁻⁷(𝑧−1)𝑇e
1/4
𝜒𝑧−17/4 𝑒
−1.16×10⁴ 𝜒𝑧−1𝑘𝑇e [
cm3
s] , (2-47)
𝛼𝑧,1(𝑇e) = 2.8 ×10⁻¹(𝑧−1)2
𝑇e1/2 [
cm3
s] , (2-48)
𝐾𝑖<𝑘(𝑇e) = 1.7 ×10⁻⁴𝑓
(𝐸𝑘−𝐸𝑖)𝑇e1/2 𝑒
1.16×10⁴ 𝐸𝑘−𝐸𝑖
𝑘𝑇e [cm3
s] , (2-49)
where 𝑓 is the oscillator strength of the transition 𝑖 → 𝑘 and the energies are in units of eV. It shall be noted, that in laser-produced plasma, the corona-state is typically not encountered, but rather plays an important role for astrophysics.
2.3 Laser matter/plasma interaction
2.3.1 General remarks Laser-beams are absorbed in matter via collective plasma effects, which will be discussed in this section. Laser-produced plasmas are created by irradiating intense electromagnetic radiation onto a target. The target may be a gas, liquid, solid, or plasma. In case of solid targets, the irradiation occurs often under perpendicular incidence. The electrons in the target will begin to oscillate, driven by the electric field of the incident beam, and the target is subsequently heated up. During that process, a hot and dense ionized state of matter is formed, called plasma. This early interaction phase will be called laser-target interaction. In the case, where the laser pulse duration is at least of picosecond-order, the arriving laser pulse also acts on the highly ionized gas and accelerates the charged particles. Kinetic electrons interact with other particles and transfer their momentum, re-distributing the laser energy among the plasma. Thus, the plasma heats up and increases its thermal pressure and degree of ionization. This second phase will be called laser-plasma interaction. During the heating/ionization, the plasma will start to radiate due to various transitions (e.g. bound-bound). However, excitation and ionization mark the dominating trend. This phase is followed by recombination as the laser pulse ceases, accompanied by strong radiation. In the following, a shallow treatment of the laser-induced breakdown will be given before plasma expansion and heating is discussed.
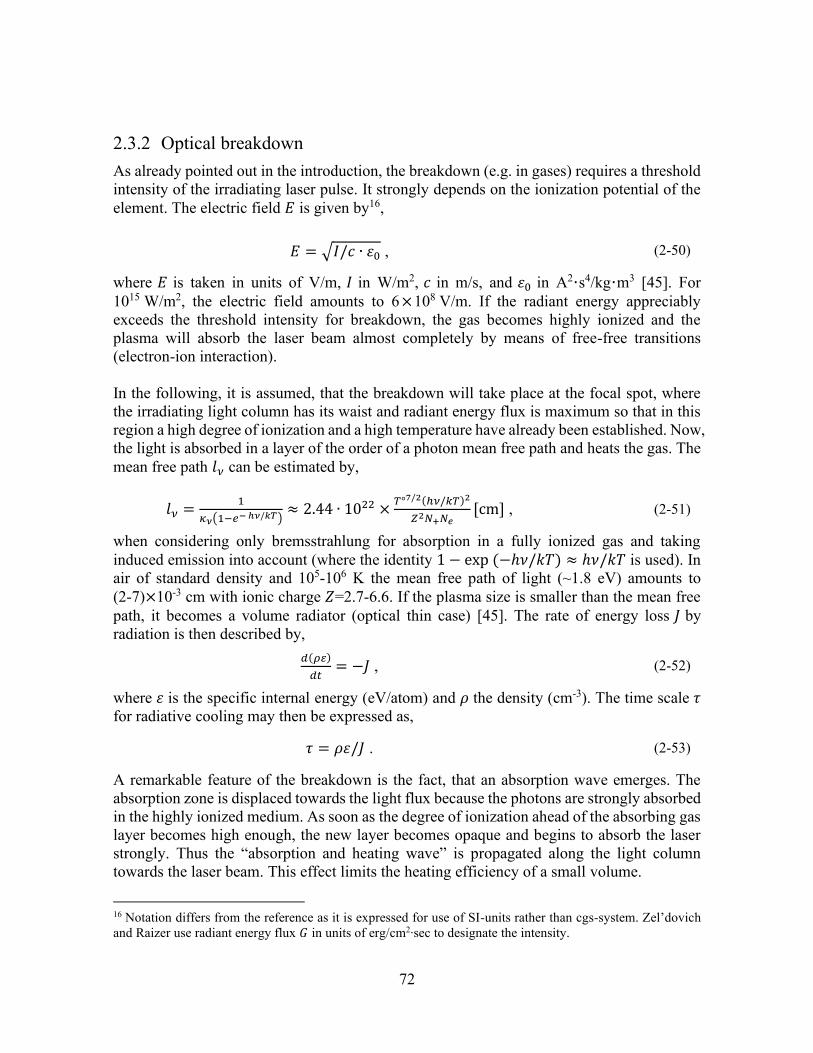
72
2.3.2 Optical breakdown As already pointed out in the introduction, the breakdown (e.g. in gases) requires a threshold intensity of the irradiating laser pulse. It strongly depends on the ionization potential of the element. The electric field 𝐸 is given by16,
𝐸 = √𝐼/𝑐 ∙ 휀0 , (2-50)
where 𝐸 is taken in units of V/m, 𝐼 in W/m2, 𝑐 in m/s, and 휀0 in A2∙s4/kg∙m3 [45]. For 1015 W/m2, the electric field amounts to 6×10⁸ V/m. If the radiant energy appreciably exceeds the threshold intensity for breakdown, the gas becomes highly ionized and the plasma will absorb the laser beam almost completely by means of free-free transitions (electron-ion interaction). In the following, it is assumed, that the breakdown will take place at the focal spot, where the irradiating light column has its waist and radiant energy flux is maximum so that in this region a high degree of ionization and a high temperature have already been established. Now, the light is absorbed in a layer of the order of a photon mean free path and heats the gas. The mean free path 𝑙𝜈 can be estimated by,
𝑙𝜈 =1
𝜅𝜈(1−𝑒− ℎ𝜈/𝑘𝑇)≈ 2.44 ∙ 1022 ×
𝑇°7/2(ℎ𝜈/𝑘𝑇)2
𝑍2𝑁+𝑁𝑒[cm] , (2-51)
when considering only bremsstrahlung for absorption in a fully ionized gas and taking induced emission into account (where the identity 1 − exp (−ℎ𝜈/𝑘𝑇) ≈ ℎ𝜈/𝑘𝑇 is used). In air of standard density and 105-106 K the mean free path of light (~1.8 eV) amounts to (2-7)×10-3 cm with ionic charge 𝑍=2.7-6.6. If the plasma size is smaller than the mean free path, it becomes a volume radiator (optical thin case) [45]. The rate of energy loss 𝐽 by radiation is then described by,
𝑑(𝜌𝜀)
𝑑𝑡= −𝐽 , (2-52)
where 휀 is the specific internal energy (eV/atom) and 𝜌 the density (cm-3). The time scale 𝜏 for radiative cooling may then be expressed as,
𝜏 = 𝜌휀/𝐽 . (2-53)
A remarkable feature of the breakdown is the fact, that an absorption wave emerges. The absorption zone is displaced towards the light flux because the photons are strongly absorbed in the highly ionized medium. As soon as the degree of ionization ahead of the absorbing gas layer becomes high enough, the new layer becomes opaque and begins to absorb the laser strongly. Thus the “absorption and heating wave” is propagated along the light column towards the laser beam. This effect limits the heating efficiency of a small volume.
16 Notation differs from the reference as it is expressed for use of SI-units rather than cgs-system. Zel’dovich and Raizer use radiant energy flux 𝐺 in units of erg/cm2∙sec to designate the intensity.
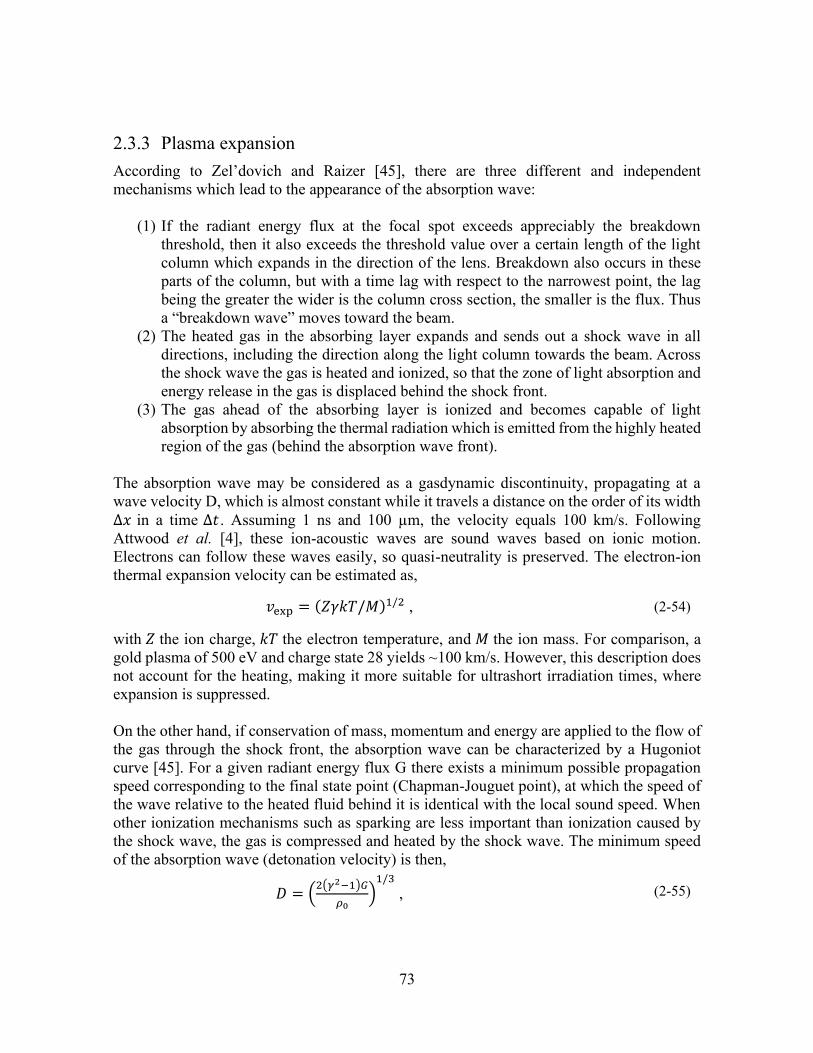
73
2.3.3 Plasma expansion According to Zel’dovich and Raizer [45], there are three different and independent mechanisms which lead to the appearance of the absorption wave:
(1) If the radiant energy flux at the focal spot exceeds appreciably the breakdown threshold, then it also exceeds the threshold value over a certain length of the light column which expands in the direction of the lens. Breakdown also occurs in these parts of the column, but with a time lag with respect to the narrowest point, the lag being the greater the wider is the column cross section, the smaller is the flux. Thus a “breakdown wave” moves toward the beam.
(2) The heated gas in the absorbing layer expands and sends out a shock wave in all directions, including the direction along the light column towards the beam. Across the shock wave the gas is heated and ionized, so that the zone of light absorption and energy release in the gas is displaced behind the shock front.
(3) The gas ahead of the absorbing layer is ionized and becomes capable of light absorption by absorbing the thermal radiation which is emitted from the highly heated region of the gas (behind the absorption wave front).
The absorption wave may be considered as a gasdynamic discontinuity, propagating at a wave velocity D, which is almost constant while it travels a distance on the order of its width ∆𝑥 in a time ∆𝑡 . Assuming 1 ns and 100 µm, the velocity equals 100 km/s. Following Attwood et al. [4], these ion-acoustic waves are sound waves based on ionic motion. Electrons can follow these waves easily, so quasi-neutrality is preserved. The electron-ion thermal expansion velocity can be estimated as,
𝑣exp = (𝑍𝛾𝑘𝑇/𝑀)1/2 , (2-54)
with 𝑍 the ion charge, 𝑘𝑇 the electron temperature, and 𝑀 the ion mass. For comparison, a gold plasma of 500 eV and charge state 28 yields ~100 km/s. However, this description does not account for the heating, making it more suitable for ultrashort irradiation times, where expansion is suppressed. On the other hand, if conservation of mass, momentum and energy are applied to the flow of the gas through the shock front, the absorption wave can be characterized by a Hugoniot curve [45]. For a given radiant energy flux G there exists a minimum possible propagation speed corresponding to the final state point (Chapman-Jouguet point), at which the speed of the wave relative to the heated fluid behind it is identical with the local sound speed. When other ionization mechanisms such as sparking are less important than ionization caused by the shock wave, the gas is compressed and heated by the shock wave. The minimum speed of the absorption wave (detonation velocity) is then,
𝐷 = (2(𝛾2−1)𝐺
𝜌0)
1/3
, (2-55)
74
where 𝛾 is the heat capacity ratio equal to (𝑓+2)/𝑓, where 𝑓 is the degree of freedom, G the intensity (W/cm2) and 𝜌0 the density (g/cm3). The heating in this state has the maximum possible value of,
휀 =22/3𝛾
(𝛾2−1)1/3(𝛾+1)(
𝐺
𝜌0)
2/3
. (2-56)
If other ionization mechanisms such as breakdown yield a wave propagation speed higher than the detonation velocity, then no shock wave is formed in the light column [45]. The gas, absorbing the light flux, goes then from an initial state to a final state by continuous heating and compression. In this case the wave propagates with a supersonic velocity relative to the gas behind it17. The speed of the “breakdown” wave can be estimated from the relation,
𝐷 = 𝑟0/𝑡𝑐 tan 𝛼 , (2-57)
with 𝑟0 being the radius of the beam waist (focal spot), 𝛼 the half-angle of the light column, and 𝑡c the time for the initial breakdown at the focal spot, measured from some effective start of the laser pulse. Assuming 10-2 cm, 0.1 rad and 10-8 s, the breakdown wave moves with 100 km/s. However, under different conditions (e.g. by using a short focal length lens), the speed may decrease drastically. In case of 4×10⁻³ cm, 1 rad and 7×10⁻⁹ s, the breakdown velocity is only 6 km/s, while the detonation speed is more than 100 km/s. This indicates, that under such circumstances, the breakdown mechanism plays no role for the absorption wave. The breakdown mechanism is the principal mechanism and determines the motion of the absorption wave for powerful short laser pulses when using long focal-length lenses [45]. One may ask for the optimum irradiation time to keep opacity effects for X-ray emission low. In the extreme case of continuous-wave irradiation, the irradiation intensity of would be too low to create charge states high enough for sufficient soft X-ray radiation. In the case of nanosecond pulses, the plasma is allowed to expand and cool, while the irradiation lasts, but the colder regions in the expanded plasma will show some degree of optical thickness. However, in the case of multi-picosecond irradiation, the plasma expansion could be sufficiently suppressed, providing an optically thin condition for soft X-rays. Pulse energies are high enough for a good X-ray yield (as opposed to fs-laser pulses) and may provide high enough electron temperature to generate lots of X-ray emitters.
2.3.4 Plasma heating mechanisms a. Collisional absorption
In beam-driven plasmas, the collisional absorption (bremsstrahlung), based on ohmic heating, is the preferred heating mechanism. It can absorb the majority of the incident laser energy and deposit it into the electrons, which thermalize then locally into ionic motion. The important parameter is the critical density 𝑛c , which strongly depends on the laser wavelength 𝜆L,
17 Hydrodynamic states involving ionization by a shock wave, but with a speed exceeding that of a detonation are not achieved. The motion behind the wave in this case would be subsonic and the expansion of the heated gas behind the wave would immediately weaken the wave, bringing it to the state of “normal detonation” [4].
75
𝑛c =𝜋𝑚e𝑐2
𝑒2𝜆L2 ≈ 1.1 ×
1021
𝜆L2 [cm3] . (2-58)
As light travels through the ablating plasma, it will be reflected at the critical density layer. For the fundamental Nd:YAG laser wavelength, the density becomes ~1021 cm-3, which is high enough, to make collisional absorption the dominant process. The (collisional) absorption coefficient 𝐾 can be obtained by,
𝐾 =𝜈ec
𝑐(
𝑛e
𝑛c)
2
/√1 − 𝑛e/𝑛c , (2-59)
with the collision frequency given by,
𝜈ec =1
𝜏e=
4√2𝜋
3
𝑛c𝑍i𝑒4 ln Λe
𝑚e1/2(𝑘B𝑇e)3/2
, (2-60)
𝜈ec
𝑐≈
25𝑍𝑖
𝜆L2𝑇e
3/2 [cm−1] , (2-61)
for 𝜆L in units of µm, and 𝑇e in keV. Here, the coulomb logarithm is estimated to be ~8 from the relation,
ln Λe = 7.1 − 0.5 ln 𝑛e + ln 𝑇e (𝑇e ≥ 10 eV) . (2-62)
Alternatively, the absorption coefficient can be obtained by considering the cross section of free-free photon absorption 𝜅ν
ff,
𝐾 = 𝜌𝜅νff (1 − 𝑒
−ℎ𝜈
𝑘B𝑇e) /√1 − 𝜔p2/𝜔L
2 , (2-63)
with 𝜌 the density, 𝜔p and 𝜔L the plasma and laser frequency, respectively. The absorption generally depends on the laser photon energy, plasma temperatures and densities and decreases for high laser intensities drastically. The short-wavelength light deposits its energy into regions of higher density and lower plasma temperature. Both features enhance collisional absorption. Oblique incidence generally causes the laser beam to be reflected at a lower density region, e.g. at 𝑛e/2 for 45°, so that the heating occurs more in the lower-density region further away from the target surface (see resonance absorption). From the Newtonian equation for the motion of the electron,
𝑚e�� = 𝑒𝐸0 cos 𝜔𝑡 + 𝐶col , (2-64)
it follows, that the collisional term 𝐶col will cause a phase shift in the electron motion, such that 𝑥~𝑒𝐸0(𝑚e𝜔2)−1cos (𝜔𝑡 − 𝜑0) . This means, that the Coulomb collision induces a phase shift in the electrons with respect to the laser oscillating field. Thus, the electron still has kinetic energy, even when the laser light is turned off (otherwise it would suddenly stop moving). During and after laser irradiation, the electrons undergo many collisions, causing local heating leading to ionization.
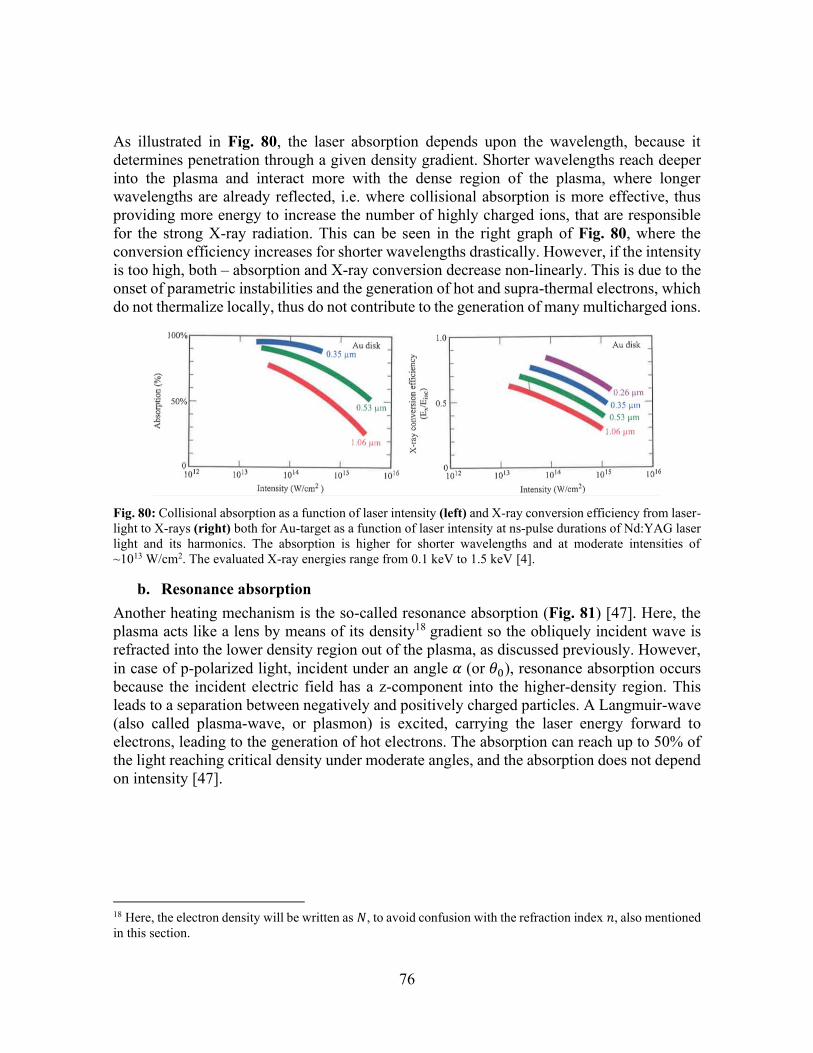
76
As illustrated in Fig. 80, the laser absorption depends upon the wavelength, because it determines penetration through a given density gradient. Shorter wavelengths reach deeper into the plasma and interact more with the dense region of the plasma, where longer wavelengths are already reflected, i.e. where collisional absorption is more effective, thus providing more energy to increase the number of highly charged ions, that are responsible for the strong X-ray radiation. This can be seen in the right graph of Fig. 80, where the conversion efficiency increases for shorter wavelengths drastically. However, if the intensity is too high, both – absorption and X-ray conversion decrease non-linearly. This is due to the onset of parametric instabilities and the generation of hot and supra-thermal electrons, which do not thermalize locally, thus do not contribute to the generation of many multicharged ions.
Fig. 80: Collisional absorption as a function of laser intensity (left) and X-ray conversion efficiency from laser-light to X-rays (right) both for Au-target as a function of laser intensity at ns-pulse durations of Nd:YAG laser light and its harmonics. The absorption is higher for shorter wavelengths and at moderate intensities of ~1013 W/cm2. The evaluated X-ray energies range from 0.1 keV to 1.5 keV [4].
b. Resonance absorption Another heating mechanism is the so-called resonance absorption (Fig. 81) [47]. Here, the plasma acts like a lens by means of its density18 gradient so the obliquely incident wave is refracted into the lower density region out of the plasma, as discussed previously. However, in case of p-polarized light, incident under an angle 𝛼 (or 𝜃0), resonance absorption occurs because the incident electric field has a z-component into the higher-density region. This leads to a separation between negatively and positively charged particles. A Langmuir-wave (also called plasma-wave, or plasmon) is excited, carrying the laser energy forward to electrons, leading to the generation of hot electrons. The absorption can reach up to 50% of the light reaching critical density under moderate angles, and the absorption does not depend on intensity [47].
18 Here, the electron density will be written as 𝑁, to avoid confusion with the refraction index 𝑛, also mentioned in this section.
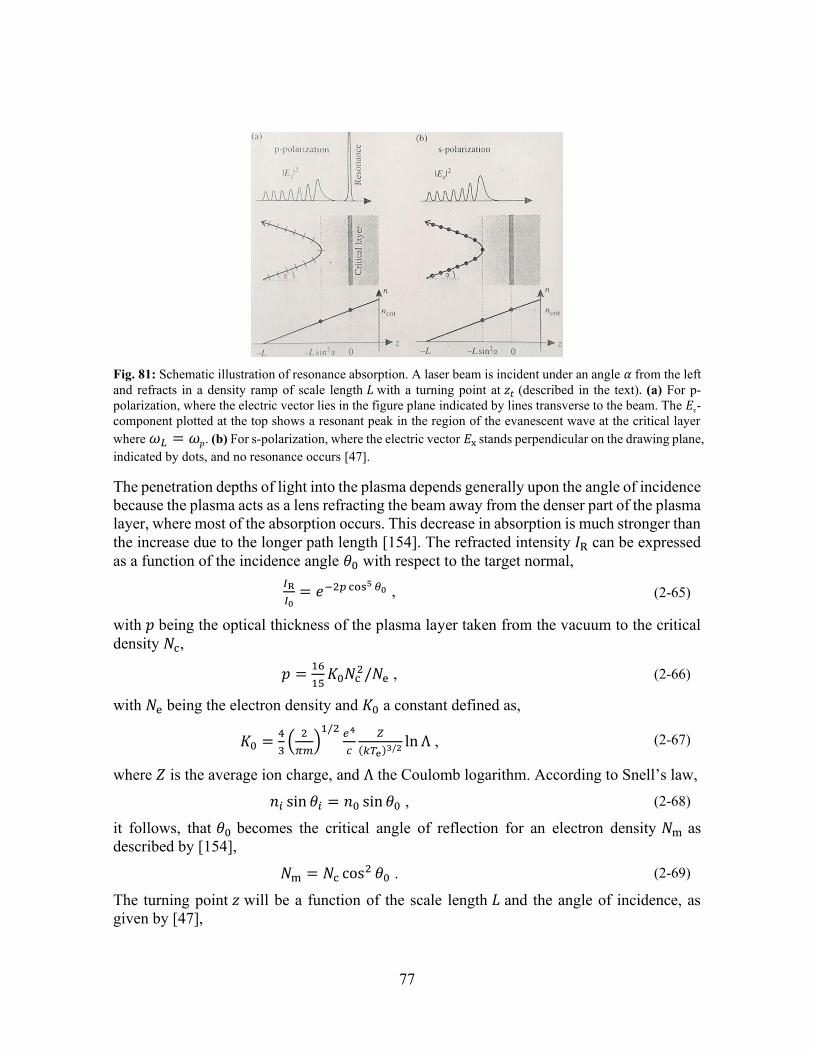
77
Fig. 81: Schematic illustration of resonance absorption. A laser beam is incident under an angle 𝛼 from the left and refracts in a density ramp of scale length 𝐿 with a turning point at 𝑧𝑡 (described in the text). (a) For p-polarization, where the electric vector lies in the figure plane indicated by lines transverse to the beam. The 𝐸z-component plotted at the top shows a resonant peak in the region of the evanescent wave at the critical layer where 𝜔𝐿 = 𝜔𝑝. (b) For s-polarization, where the electric vector 𝐸x stands perpendicular on the drawing plane, indicated by dots, and no resonance occurs [47].
The penetration depths of light into the plasma depends generally upon the angle of incidence because the plasma acts as a lens refracting the beam away from the denser part of the plasma layer, where most of the absorption occurs. This decrease in absorption is much stronger than the increase due to the longer path length [154]. The refracted intensity 𝐼R can be expressed as a function of the incidence angle 𝜃0 with respect to the target normal,
𝐼R
𝐼0= 𝑒−2𝑝 cos5 𝜃0 , (2-65)
with 𝑝 being the optical thickness of the plasma layer taken from the vacuum to the critical density 𝑁c,
𝑝 =16
15𝐾0𝑁c
2/𝑁e , (2-66)
with 𝑁e being the electron density and 𝐾0 a constant defined as,
𝐾0 =4
3(
2
𝜋𝑚)
1/2 𝑒4
𝑐
𝑍
(𝑘𝑇e)3/2ln Λ , (2-67)
where 𝑍 is the average ion charge, and Λ the Coulomb logarithm. According to Snell’s law,
𝑛𝑖 sin 𝜃𝑖 = 𝑛0 sin 𝜃0 , (2-68)
it follows, that 𝜃0 becomes the critical angle of reflection for an electron density 𝑁m as described by [154],
𝑁m = 𝑁c cos2 𝜃0 . (2-69)
The turning point 𝑧 will be a function of the scale length 𝐿 and the angle of incidence, as given by [47],
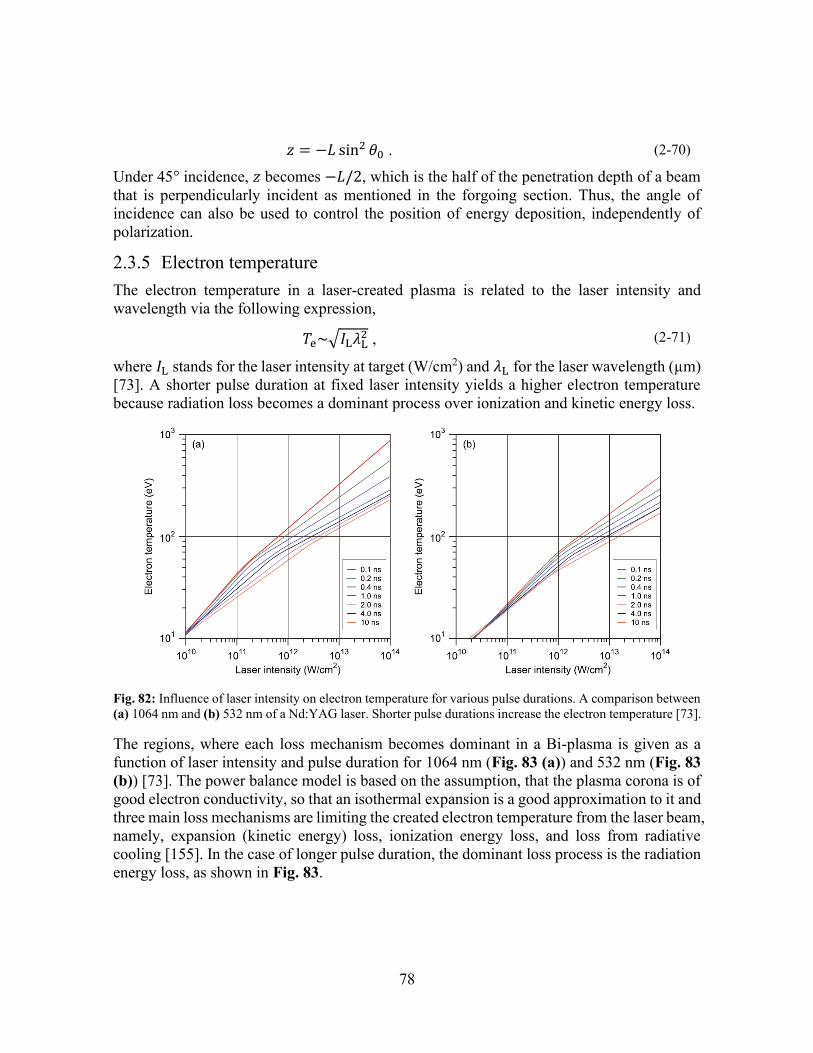
78
𝑧 = −𝐿 sin2 𝜃0 . (2-70)
Under 45° incidence, 𝑧 becomes −𝐿/2, which is the half of the penetration depth of a beam that is perpendicularly incident as mentioned in the forgoing section. Thus, the angle of incidence can also be used to control the position of energy deposition, independently of polarization.
2.3.5 Electron temperature The electron temperature in a laser-created plasma is related to the laser intensity and wavelength via the following expression,
𝑇e~√𝐼L𝜆L2 , (2-71)
where 𝐼L stands for the laser intensity at target (W/cm2) and 𝜆L for the laser wavelength (µm) [73]. A shorter pulse duration at fixed laser intensity yields a higher electron temperature because radiation loss becomes a dominant process over ionization and kinetic energy loss.
Fig. 82: Influence of laser intensity on electron temperature for various pulse durations. A comparison between (a) 1064 nm and (b) 532 nm of a Nd:YAG laser. Shorter pulse durations increase the electron temperature [73].
The regions, where each loss mechanism becomes dominant in a Bi-plasma is given as a function of laser intensity and pulse duration for 1064 nm (Fig. 83 (a)) and 532 nm (Fig. 83 (b)) [73]. The power balance model is based on the assumption, that the plasma corona is of good electron conductivity, so that an isothermal expansion is a good approximation to it and three main loss mechanisms are limiting the created electron temperature from the laser beam, namely, expansion (kinetic energy) loss, ionization energy loss, and loss from radiative cooling [155]. In the case of longer pulse duration, the dominant loss process is the radiation energy loss, as shown in Fig. 83.
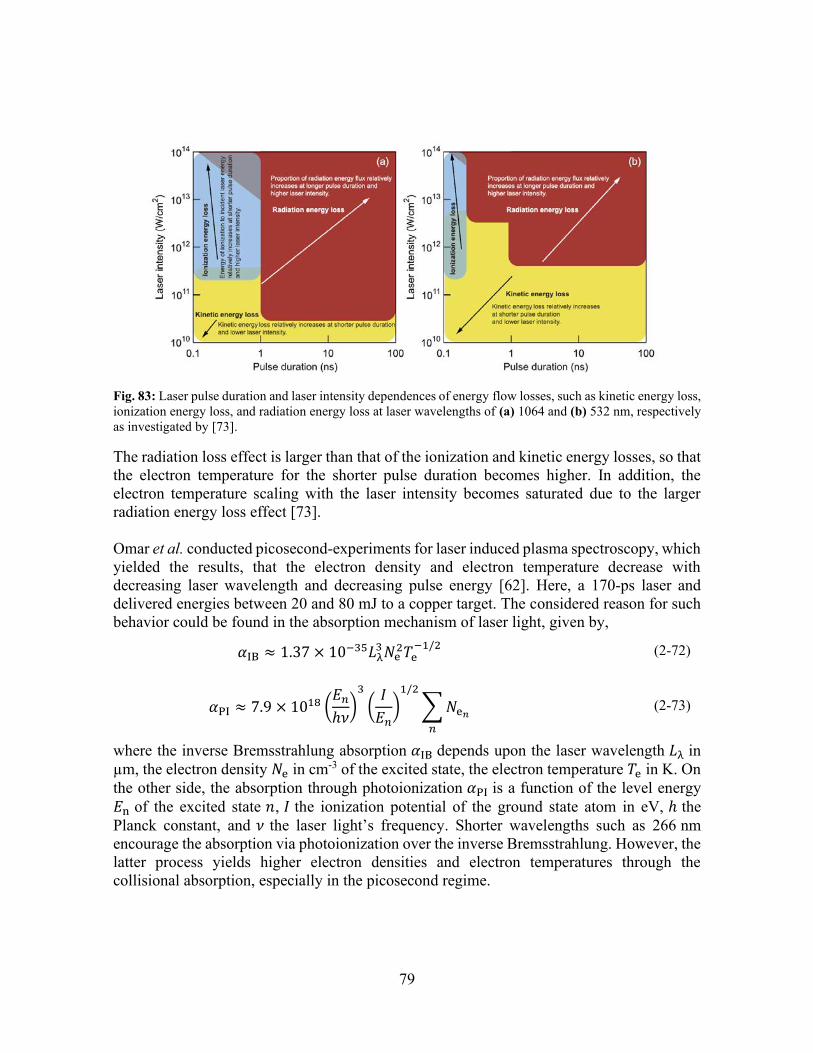
79
Fig. 83: Laser pulse duration and laser intensity dependences of energy flow losses, such as kinetic energy loss, ionization energy loss, and radiation energy loss at laser wavelengths of (a) 1064 and (b) 532 nm, respectively as investigated by [73].
The radiation loss effect is larger than that of the ionization and kinetic energy losses, so that the electron temperature for the shorter pulse duration becomes higher. In addition, the electron temperature scaling with the laser intensity becomes saturated due to the larger radiation energy loss effect [73]. Omar et al. conducted picosecond-experiments for laser induced plasma spectroscopy, which yielded the results, that the electron density and electron temperature decrease with decreasing laser wavelength and decreasing pulse energy [62]. Here, a 170-ps laser and delivered energies between 20 and 80 mJ to a copper target. The considered reason for such behavior could be found in the absorption mechanism of laser light, given by,
𝛼IB ≈ 1.37 × 10⁻³⁵𝐿λ3 𝑁e
2𝑇e−1/2 (2-72)
𝛼PI ≈ 7.9 × 10¹⁸ (𝐸𝑛
ℎ𝜈)
3
(𝐼
𝐸𝑛)
1/2
∑ 𝑁e𝑛
𝑛
(2-73)
where the inverse Bremsstrahlung absorption 𝛼IB depends upon the laser wavelength 𝐿λ in µm, the electron density 𝑁e in cm-3 of the excited state, the electron temperature 𝑇e in K. On the other side, the absorption through photoionization 𝛼PI is a function of the level energy 𝐸n of the excited state 𝑛, 𝐼 the ionization potential of the ground state atom in eV, ℎ the Planck constant, and 𝜈 the laser light’s frequency. Shorter wavelengths such as 266 nm encourage the absorption via photoionization over the inverse Bremsstrahlung. However, the latter process yields higher electron densities and electron temperatures through the collisional absorption, especially in the picosecond regime.
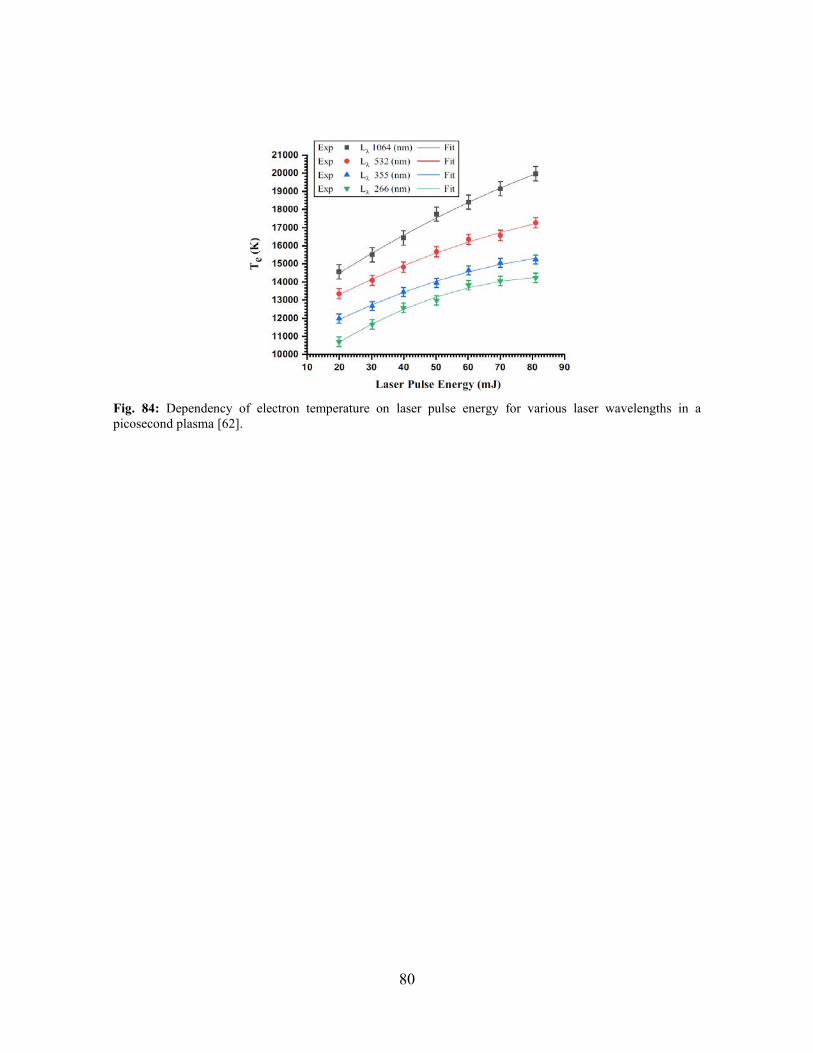
80
Fig. 84: Dependency of electron temperature on laser pulse energy for various laser wavelengths in a picosecond plasma [62].
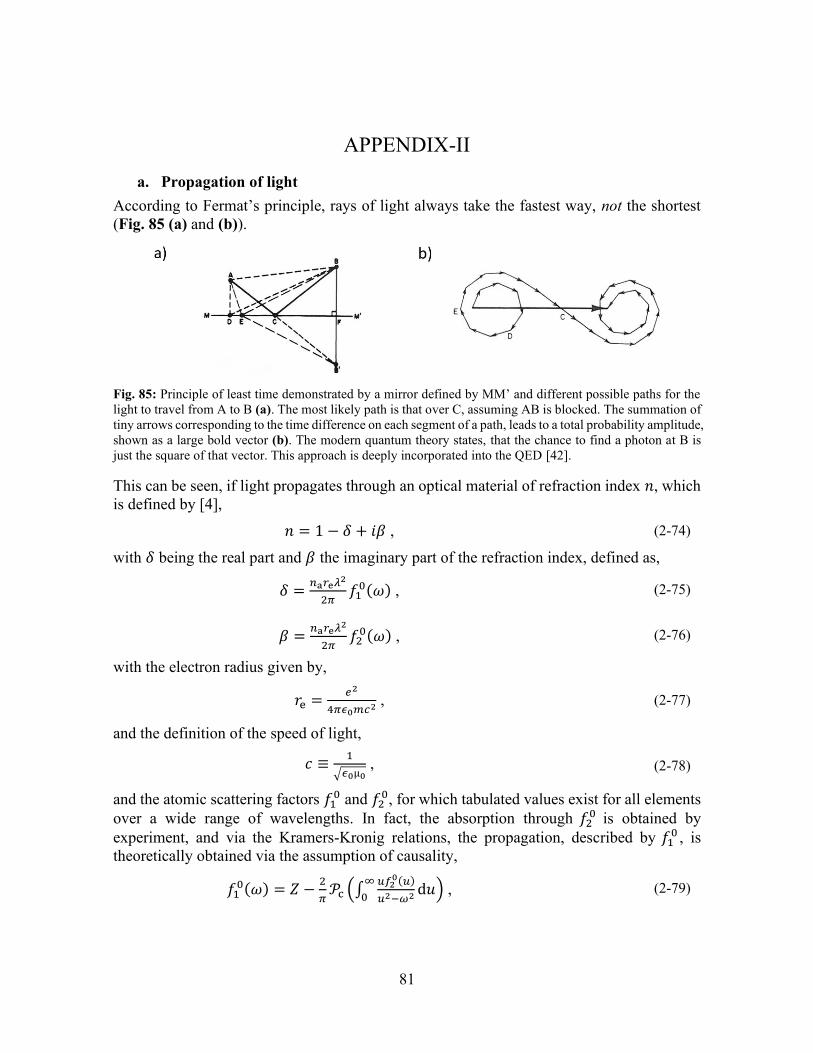
81
APPENDIX-II
a. Propagation of light According to Fermat’s principle, rays of light always take the fastest way, not the shortest (Fig. 85 (a) and (b)).
Fig. 85: Principle of least time demonstrated by a mirror defined by MM’ and different possible paths for the light to travel from A to B (a). The most likely path is that over C, assuming AB is blocked. The summation of tiny arrows corresponding to the time difference on each segment of a path, leads to a total probability amplitude, shown as a large bold vector (b). The modern quantum theory states, that the chance to find a photon at B is just the square of that vector. This approach is deeply incorporated into the QED [42].
This can be seen, if light propagates through an optical material of refraction index 𝑛, which is defined by [4],
𝑛 = 1 − 𝛿 + 𝑖𝛽 , (2-74)
with 𝛿 being the real part and 𝛽 the imaginary part of the refraction index, defined as,
𝛿 =𝑛a𝑟e𝜆2
2𝜋𝑓1
0(𝜔) , (2-75)
𝛽 =𝑛a𝑟e𝜆2
2𝜋𝑓2
0(𝜔) , (2-76)
with the electron radius given by,
𝑟e =𝑒2
4𝜋𝜖0𝑚𝑐2 , (2-77)
and the definition of the speed of light,
𝑐 ≡1
√𝜖0µ0 , (2-78)
and the atomic scattering factors 𝑓10 and 𝑓2
0, for which tabulated values exist for all elements over a wide range of wavelengths. In fact, the absorption through 𝑓2
0 is obtained by experiment, and via the Kramers-Kronig relations, the propagation, described by 𝑓1
0 , is theoretically obtained via the assumption of causality,
𝑓10(𝜔) = 𝑍 −
2
𝜋𝒫c (∫
𝑢𝑓20(𝑢)
𝑢2−𝜔2d𝑢
∞
0) , (2-79)
82
𝑓20(𝜔) =
𝐴𝑚u
2𝑟e𝜆µ(𝜔) , (2-80)
𝑓0(𝜔) = 𝑓10(𝜔) − 𝑖𝑓2
0(𝜔) , (2-81)
where 𝒫c is the Cauchy principal value, which behaves like “1/𝑥” except for the singularity at 𝑢2 = 𝜔2 where it is zero, 𝑍 the atomic number, 𝑚u the atomic mass unit, 𝑟𝑒 the classical electron radius, µ the photon frequency (energy) dependent mass absorption coefficient, and 𝑓0 the complex atomic scattering factor, where the superscript 0 indicates the simplification of scattering in the long wavelength or the forward scattering limit [4]. Light passing through an optical component of 𝑛 > 1 is slowed down to 𝑣 by the scattering events in the material by the factor 𝑛(𝜈), which is the frequency-dependent refraction index,
𝑐 = 𝜈0𝜆 = 𝑛(𝜈)𝑣 . (2-82)
The wavelength of the light propagating in the material changes compared to its vacuum wavelength 𝜆0, while its frequency 𝜈0 remains constant according to,
𝜆 = 𝜆0/𝑛(𝜈) , (2-83)
To connect smoothly and continuously the light-field as it passes through an optical surface, its velocity changes inside the material, and thus refraction must occur. Refraction necessitates absorption, and from the interlinkage between absorption and dispersion as given by the Kramers-Kronig relations, refraction is also frequency-dependent. This phenomenon is called dispersion. A convex lens, for example, is able to focus light into a spot by means of its curvature, where light from an object arrives under different angles due to the finite size of the lens, but is refracted differently so as to merge together in the same region behind the lens, called focal plane. In other words, if we satisfy the light to have equal times (the least times!) from the source to the focus point, then multiple paths (and not only the straight) will add up to the total probability for light taking a path – in fact, any path that leads through the lens and results in the least travel time. This is a fundamental insight introduced by R. P. Feynman, as discussed below. The relation between focal length and lens curvature is given by the lens-maker’s formula,
1
𝑓= (𝑛 − 1) [
1
𝑅1−
1
𝑅2+
(𝑛−1)𝑑
𝑛𝑅1𝑅2] , (2-84)
from which a simplified formula for thin lenses surrounded by air is readily derived, 1
𝑓= (𝑛 − 1) (
1
𝑅1−
1
𝑅2) . (2-85)
Here, 𝑅1 and 𝑅2 (negative) are curvature radii of the lens, 𝑛 the refraction index, 𝑑 the thickness of the lens, and 𝑓 the resulting focal length.
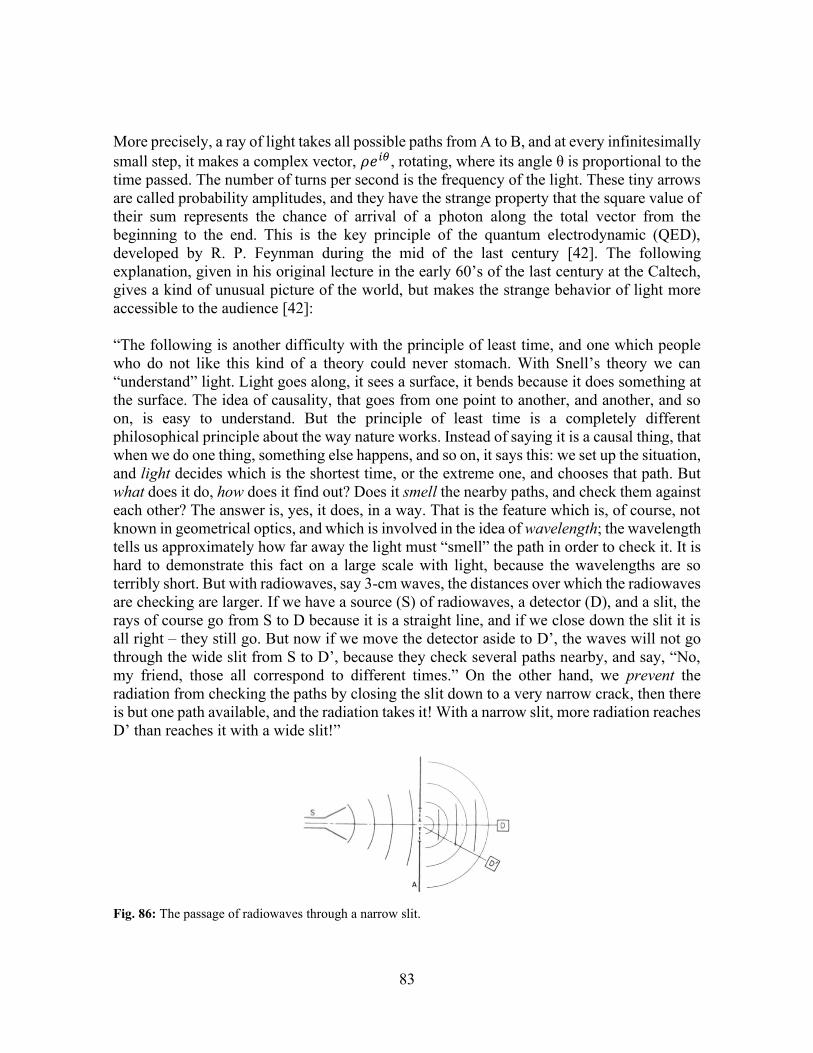
83
More precisely, a ray of light takes all possible paths from A to B, and at every infinitesimally small step, it makes a complex vector, 𝜌𝑒𝑖𝜃, rotating, where its angle θ is proportional to the time passed. The number of turns per second is the frequency of the light. These tiny arrows are called probability amplitudes, and they have the strange property that the square value of their sum represents the chance of arrival of a photon along the total vector from the beginning to the end. This is the key principle of the quantum electrodynamic (QED), developed by R. P. Feynman during the mid of the last century [42]. The following explanation, given in his original lecture in the early 60’s of the last century at the Caltech, gives a kind of unusual picture of the world, but makes the strange behavior of light more accessible to the audience [42]: “The following is another difficulty with the principle of least time, and one which people who do not like this kind of a theory could never stomach. With Snell’s theory we can “understand” light. Light goes along, it sees a surface, it bends because it does something at the surface. The idea of causality, that goes from one point to another, and another, and so on, is easy to understand. But the principle of least time is a completely different philosophical principle about the way nature works. Instead of saying it is a causal thing, that when we do one thing, something else happens, and so on, it says this: we set up the situation, and light decides which is the shortest time, or the extreme one, and chooses that path. But what does it do, how does it find out? Does it smell the nearby paths, and check them against each other? The answer is, yes, it does, in a way. That is the feature which is, of course, not known in geometrical optics, and which is involved in the idea of wavelength; the wavelength tells us approximately how far away the light must “smell” the path in order to check it. It is hard to demonstrate this fact on a large scale with light, because the wavelengths are so terribly short. But with radiowaves, say 3-cm waves, the distances over which the radiowaves are checking are larger. If we have a source (S) of radiowaves, a detector (D), and a slit, the rays of course go from S to D because it is a straight line, and if we close down the slit it is all right – they still go. But now if we move the detector aside to D’, the waves will not go through the wide slit from S to D’, because they check several paths nearby, and say, “No, my friend, those all correspond to different times.” On the other hand, we prevent the radiation from checking the paths by closing the slit down to a very narrow crack, then there is but one path available, and the radiation takes it! With a narrow slit, more radiation reaches D’ than reaches it with a wide slit!”
Fig. 86: The passage of radiowaves through a narrow slit.
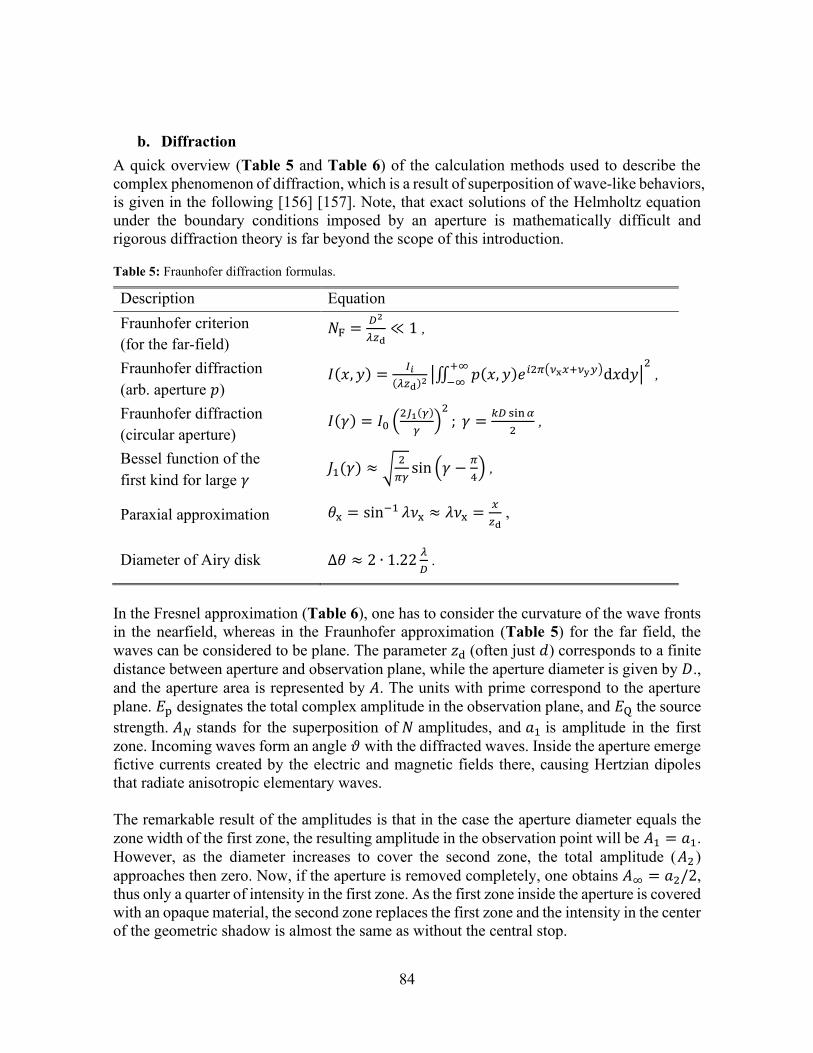
84
b. Diffraction A quick overview (Table 5 and Table 6) of the calculation methods used to describe the complex phenomenon of diffraction, which is a result of superposition of wave-like behaviors, is given in the following [156] [157]. Note, that exact solutions of the Helmholtz equation under the boundary conditions imposed by an aperture is mathematically difficult and rigorous diffraction theory is far beyond the scope of this introduction.
Table 5: Fraunhofer diffraction formulas.
Description Equation Fraunhofer criterion (for the far-field)
𝑁F =𝐷2
𝜆𝑧d≪ 1 ,
Fraunhofer diffraction (arb. aperture 𝑝)
𝐼(𝑥, 𝑦) =𝐼𝑖
(𝜆𝑧d)2 |∬ 𝑝(𝑥, 𝑦)𝑒𝑖2𝜋(𝜈x𝑥+𝜈y𝑦)d𝑥d𝑦+∞
−∞|
2 ,
Fraunhofer diffraction (circular aperture)
𝐼(𝛾) = 𝐼0 (2𝐽1(𝛾)
𝛾)
2
; 𝛾 =𝑘𝐷 sin 𝛼
2 ,
Bessel function of the first kind for large 𝛾
𝐽1(𝛾) ≈ √2
𝜋𝛾sin (𝛾 −
𝜋
4) ,
Paraxial approximation 𝜃x = sin−1 𝜆𝜈x ≈ 𝜆𝜈x =𝑥
𝑧d ,
Diameter of Airy disk ∆𝜃 ≈ 2 ∙ 1.22𝜆
𝐷 .
In the Fresnel approximation (Table 6), one has to consider the curvature of the wave fronts in the nearfield, whereas in the Fraunhofer approximation (Table 5) for the far field, the waves can be considered to be plane. The parameter 𝑧d (often just 𝑑) corresponds to a finite distance between aperture and observation plane, while the aperture diameter is given by 𝐷., and the aperture area is represented by 𝐴. The units with prime correspond to the aperture plane. 𝐸p designates the total complex amplitude in the observation plane, and 𝐸Q the source strength. 𝐴𝑁 stands for the superposition of 𝑁 amplitudes, and 𝑎1 is amplitude in the first zone. Incoming waves form an angle 𝜗 with the diffracted waves. Inside the aperture emerge fictive currents created by the electric and magnetic fields there, causing Hertzian dipoles that radiate anisotropic elementary waves. The remarkable result of the amplitudes is that in the case the aperture diameter equals the zone width of the first zone, the resulting amplitude in the observation point will be 𝐴1 = 𝑎1. However, as the diameter increases to cover the second zone, the total amplitude (𝐴2 ) approaches then zero. Now, if the aperture is removed completely, one obtains 𝐴∞ = 𝑎2/2, thus only a quarter of intensity in the first zone. As the first zone inside the aperture is covered with an opaque material, the second zone replaces the first zone and the intensity in the center of the geometric shadow is almost the same as without the central stop.
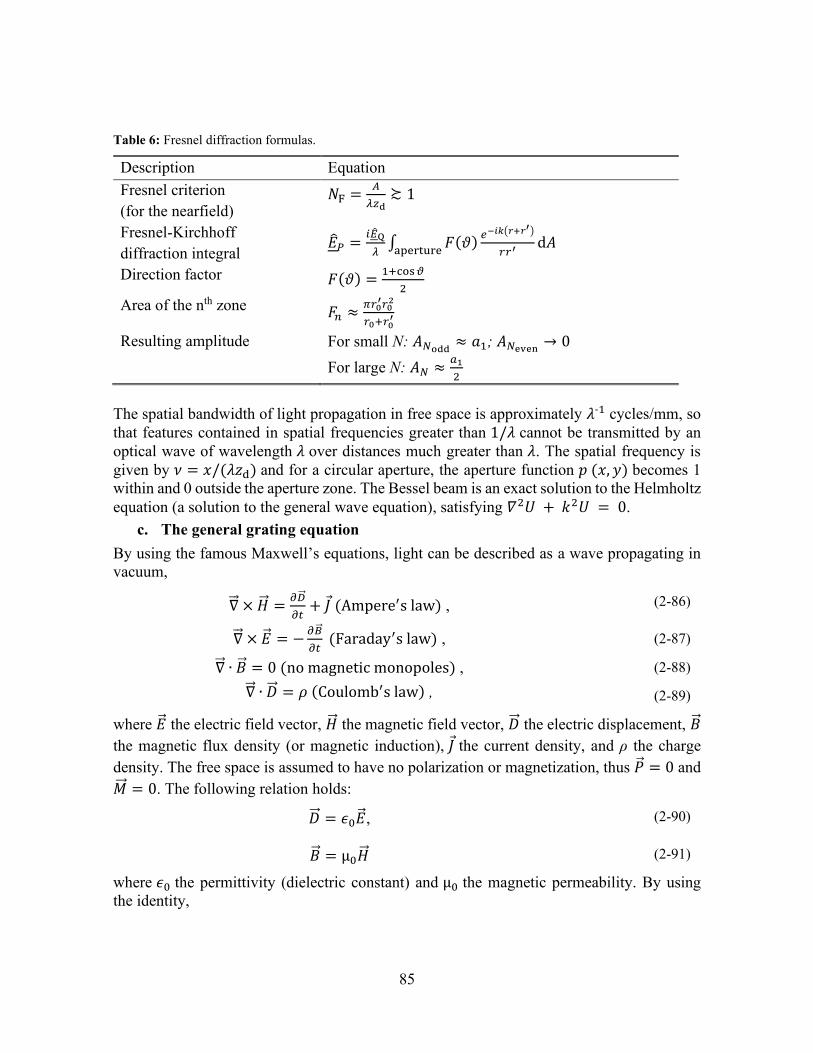
85
Table 6: Fresnel diffraction formulas.
Description Equation Fresnel criterion (for the nearfield)
𝑁F =𝐴
𝜆𝑧d≿ 1
Fresnel-Kirchhoff diffraction integral
��𝑃 =𝑖��Q
𝜆∫ 𝐹(𝜗)
𝑒−𝑖𝑘(𝑟+𝑟′)
𝑟𝑟′ d𝐴aperture
Direction factor 𝐹(𝜗) =1+cos 𝜗
2
Area of the nth zone 𝐹𝑛 ≈𝜋𝑟0
′𝑟02
𝑟0+𝑟0′
Resulting amplitude For small N: 𝐴𝑁odd≈ 𝑎1; 𝐴𝑁even
→ 0 For large N: 𝐴𝑁 ≈
𝑎1
2
The spatial bandwidth of light propagation in free space is approximately 𝜆-1 cycles/mm, so that features contained in spatial frequencies greater than 1/𝜆 cannot be transmitted by an optical wave of wavelength 𝜆 over distances much greater than 𝜆. The spatial frequency is given by 𝜈 = 𝑥/(𝜆𝑧d) and for a circular aperture, the aperture function 𝑝 (𝑥, 𝑦) becomes 1 within and 0 outside the aperture zone. The Bessel beam is an exact solution to the Helmholtz equation (a solution to the general wave equation), satisfying 𝛻2𝑈 + 𝑘2𝑈 = 0.
c. The general grating equation By using the famous Maxwell’s equations, light can be described as a wave propagating in vacuum,
∇ × �� =𝜕��
𝜕𝑡+ 𝐽 (Ampere′s law) , (2-86)
∇ × �� = −𝜕��
𝜕𝑡 (Faraday′s law) , (2-87)
∇ ∙ �� = 0 (no magnetic monopoles) , (2-88)
∇ ∙ �� = 𝜌 (Coulomb′s law) , (2-89)
where �� the electric field vector, �� the magnetic field vector, �� the electric displacement, �� the magnetic flux density (or magnetic induction), 𝐽 the current density, and ρ the charge density. The free space is assumed to have no polarization or magnetization, thus �� = 0 and �� = 0. The following relation holds:
�� = 𝜖0��, (2-90)
�� = µ0�� (2-91)
where 𝜖0 the permittivity (dielectric constant) and µ0 the magnetic permeability. By using the identity,
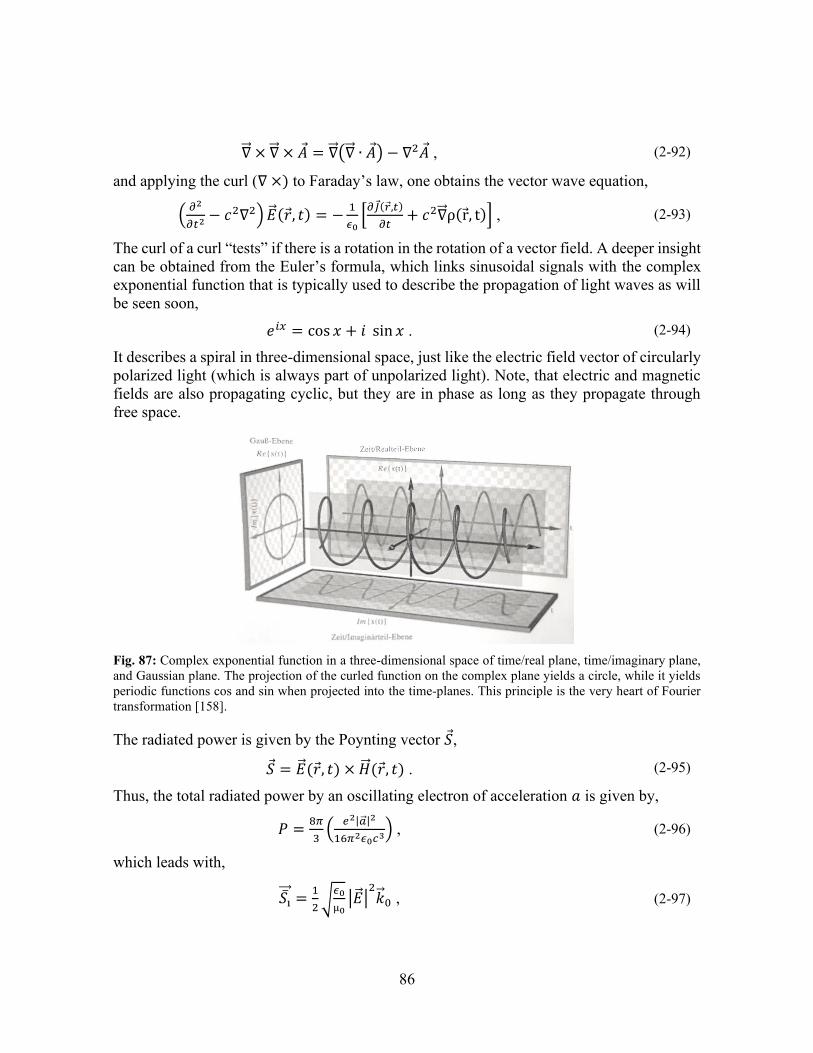
86
∇ × ∇ × 𝐴 = ∇(∇ ∙ 𝐴) − ∇2𝐴 , (2-92)
and applying the curl (∇ ×) to Faraday’s law, one obtains the vector wave equation,
(𝜕2
𝜕𝑡2 − 𝑐2∇2) ��(𝑟, 𝑡) = −1
𝜖0[
𝜕𝐽(𝑟,𝑡)
𝜕𝑡+ 𝑐2∇ρ(r, t)] , (2-93)
The curl of a curl “tests” if there is a rotation in the rotation of a vector field. A deeper insight can be obtained from the Euler’s formula, which links sinusoidal signals with the complex exponential function that is typically used to describe the propagation of light waves as will be seen soon,
𝑒𝑖𝑥 = cos 𝑥 + 𝑖 sin 𝑥 . (2-94)
It describes a spiral in three-dimensional space, just like the electric field vector of circularly polarized light (which is always part of unpolarized light). Note, that electric and magnetic fields are also propagating cyclic, but they are in phase as long as they propagate through free space.
Fig. 87: Complex exponential function in a three-dimensional space of time/real plane, time/imaginary plane, and Gaussian plane. The projection of the curled function on the complex plane yields a circle, while it yields periodic functions cos and sin when projected into the time-planes. This principle is the very heart of Fourier transformation [158].
The radiated power is given by the Poynting vector 𝑆,
𝑆 = ��(𝑟, 𝑡) × ��(𝑟, 𝑡) . (2-95)
Thus, the total radiated power by an oscillating electron of acceleration 𝑎 is given by,
𝑃 =8𝜋
3(
𝑒2|��|2
16𝜋2𝜖0𝑐3) , (2-96)
which leads with,
𝑆i =
1
2√
𝜖0
µ0|��|
2��0 , (2-97)
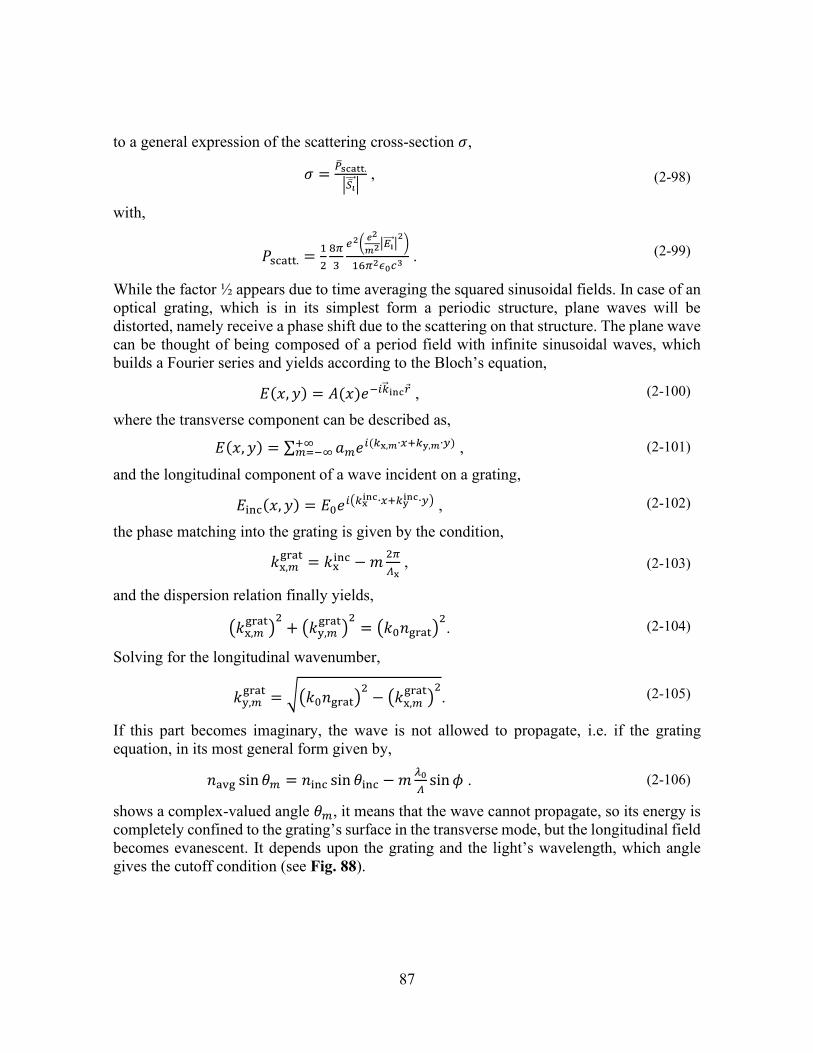
87
to a general expression of the scattering cross-section 𝜎,
𝜎 =��scatt.
|��𝑖 |
, (2-98)
with,
𝑃scatt. =1
2
8𝜋
3
𝑒2(𝑒2
𝑚2|𝐸i |2
)
16𝜋2𝜖0𝑐3 . (2-99)
While the factor ½ appears due to time averaging the squared sinusoidal fields. In case of an optical grating, which is in its simplest form a periodic structure, plane waves will be distorted, namely receive a phase shift due to the scattering on that structure. The plane wave can be thought of being composed of a period field with infinite sinusoidal waves, which builds a Fourier series and yields according to the Bloch’s equation,
𝐸(𝑥, 𝑦) = 𝐴(𝑥)𝑒−𝑖��inc𝑟 , (2-100)
where the transverse component can be described as,
𝐸(𝑥, 𝑦) = ∑ 𝑎𝑚𝑒𝑖(𝑘x,𝑚∙𝑥+𝑘y,𝑚∙𝑦)+∞𝑚=−∞ , (2-101)
and the longitudinal component of a wave incident on a grating,
𝐸inc(𝑥, 𝑦) = 𝐸0𝑒𝑖(𝑘xinc∙𝑥+𝑘y
inc∙𝑦) , (2-102)
the phase matching into the grating is given by the condition,
𝑘x,𝑚grat
= 𝑘xinc − 𝑚
2𝜋
𝛬x , (2-103)
and the dispersion relation finally yields,
(𝑘x,𝑚grat
)2
+ (𝑘y,𝑚grat
)2
= (𝑘0𝑛grat)2. (2-104)
Solving for the longitudinal wavenumber,
𝑘y,𝑚grat
= √(𝑘0𝑛grat)2
− (𝑘x,𝑚grat
)2. (2-105)
If this part becomes imaginary, the wave is not allowed to propagate, i.e. if the grating equation, in its most general form given by,
𝑛avg sin 𝜃𝑚 = 𝑛inc sin 𝜃inc − 𝑚𝜆0
𝛬sin 𝜙 . (2-106)
shows a complex-valued angle 𝜃𝑚, it means that the wave cannot propagate, so its energy is completely confined to the grating’s surface in the transverse mode, but the longitudinal field becomes evanescent. It depends upon the grating and the light’s wavelength, which angle gives the cutoff condition (see Fig. 88).
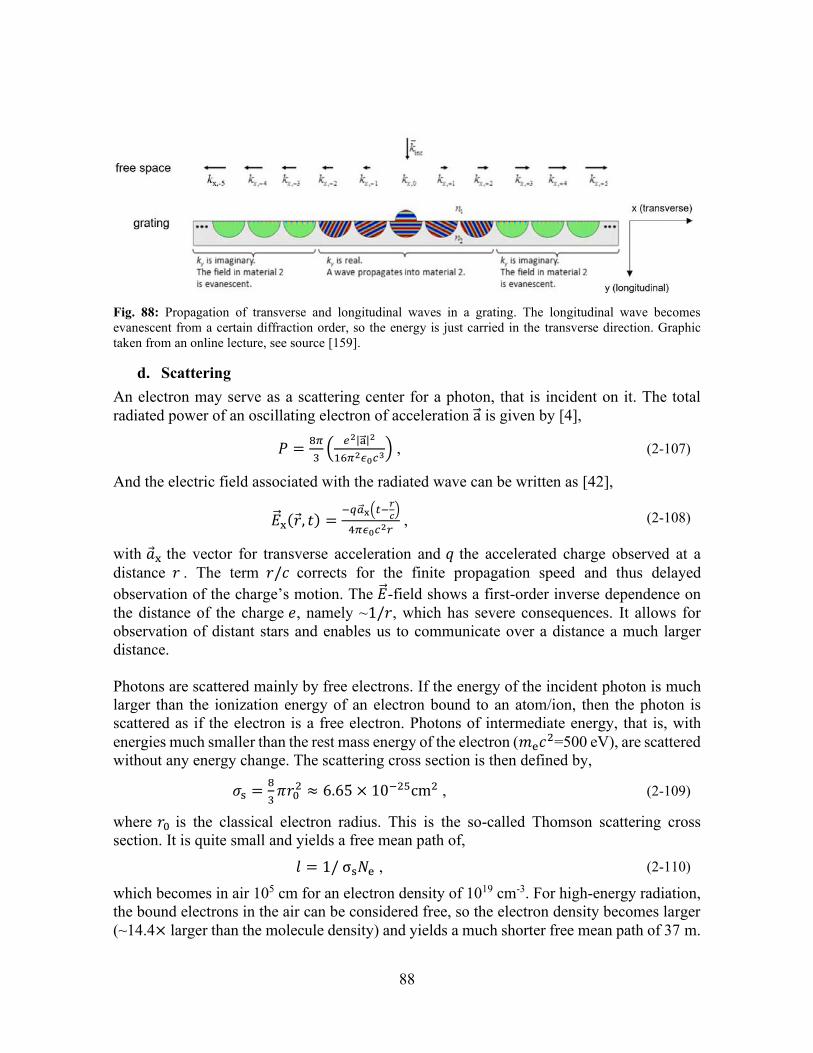
88
Fig. 88: Propagation of transverse and longitudinal waves in a grating. The longitudinal wave becomes evanescent from a certain diffraction order, so the energy is just carried in the transverse direction. Graphic taken from an online lecture, see source [159].
d. Scattering An electron may serve as a scattering center for a photon, that is incident on it. The total radiated power of an oscillating electron of acceleration a is given by [4],
𝑃 =8𝜋
3(
𝑒2|a|2
16𝜋2𝜖0𝑐3) , (2-107)
And the electric field associated with the radiated wave can be written as [42],
��x(𝑟, 𝑡) =−𝑞��x(𝑡−
𝑟
𝑐)
4𝜋𝜖0𝑐2𝑟 , (2-108)
with ��x the vector for transverse acceleration and 𝑞 the accelerated charge observed at a distance 𝑟 . The term 𝑟/𝑐 corrects for the finite propagation speed and thus delayed observation of the charge’s motion. The ��-field shows a first-order inverse dependence on the distance of the charge 𝑒, namely ~1/𝑟, which has severe consequences. It allows for observation of distant stars and enables us to communicate over a distance a much larger distance. Photons are scattered mainly by free electrons. If the energy of the incident photon is much larger than the ionization energy of an electron bound to an atom/ion, then the photon is scattered as if the electron is a free electron. Photons of intermediate energy, that is, with energies much smaller than the rest mass energy of the electron (𝑚e𝑐2=500 eV), are scattered without any energy change. The scattering cross section is then defined by,
𝜎s =8
3𝜋𝑟0
2 ≈ 6.65 × 10⁻²⁵cm2 , (2-109)
where 𝑟0 is the classical electron radius. This is the so-called Thomson scattering cross section. It is quite small and yields a free mean path of,
𝑙 = 1/ σs𝑁e , (2-110)
which becomes in air 105 cm for an electron density of 1019 cm-3. For high-energy radiation, the bound electrons in the air can be considered free, so the electron density becomes larger (~14.4× larger than the molecule density) and yields a much shorter free mean path of 37 m.
89
For very high photon energies, the scattering cross section deviates from the presented one [45]. Compton scattering can take place as,
𝛾 + 𝑒 = 𝛾′ + 𝑒′ , (2-111)
where a gamma photon interacts with an electron, resulting in a change in photon energy and electron energy. This means, that not only the light is scattered, it is also changed in its wavelength. For a given energy and momentum before the scattering event, the conservation laws result in a statistical distribution of scattering directions [45]. The cross section 𝑆 given by Klein-Nishina yields [160],
𝑆 =2𝜋𝑁𝑒4
𝑚2𝑐4
1+𝛼
𝛼2 [2(1+𝛼)
1+2𝛼−
1
𝛼log(1 + 2𝛼)], (2-112)
with 𝛼 = ℎ𝜈/𝑚𝑐2 and N the number of electrons in a volume unit. In the high-frequency limit it yields the cross section for Compton scattering (e.g. for X-rays). In case of resonant scattering, where a photon is absorbed via photoexcitation and then reemitted by the subsequent radiative decay, the emission direction becomes random. For photons of frequency (energy) much lower than the resonance frequency, Lord Rayleigh first described the cross section by [4],
𝜎R =8𝜋
3𝑟e
2(𝜔/𝜔s)4 =8𝜋
3𝑟e
2(𝜆s/𝜆)4 , (2-113)
where the index s indicates the point of resonance. The strong fourth-power wavelength-dependence is the cause for the blue nitrogen sky on earth, because blue light is scattered much more than the longer wavelengths of red light. This form of scattering is called Rayleigh-scattering and describes elastic scattering of light by small spheres. The scattering cross section for unpolarized light can be calculated by [161],
𝜎R =2𝜋5
3
𝑑6
𝜆4 (𝑛2−1
𝑛2+2)
2
, (2-114)
where 𝑛 is the refractive index of the light in the sphere of diameter 𝑑. This approximation breaks down, as soon as the particle size becomes larger than ~10% of the size of the wavelength, and the Mie-regime is entered.
e. The momentum of light The effects of the magnetic field in an electromagnetic wave are small and begin to play a role in laser-plasmas at very high intensities (e.g. 1020 W/cm2). In the following, the momentum of light is presented briefly as explained by the great teacher in [42]. The magnetic field is at right angles to the electric field. The electric field drives electric charges to oscillation, which is also at right angles to the magnetic field. The magnetic field acts only on a moving charge. The force felt by the particles is in the direction of the propagation of light and given by 𝐹 = 𝑞𝑣𝐵. This driving force is called radiation pressure or light pressure. The strength of the magnetic field is the same as the strength of the electric field divided by c. Since everything is oscillating, we need to take the time average, ⟨𝐹⟩ = 𝑞⟨𝑣𝐸⟩/𝑐. The charge 𝑞 times the field 𝐸 is the electric force on a charge, and the force on the charge times the velocity is the work d𝑊/d𝑡 being done on the charge. Therefore, the “pushing
90
momentum” that is delivered per second by the light, is equal to 1/𝑐 times the energy absorbed from the light per second! In any circumstance where light is being absorbed, there is a pressure. The momentum that the light delivers is always equal to the energy that is absorbed divided by 𝑐,
⟨𝐹⟩ =d𝑊/d𝑡
𝑐 . (2-115)
When light is emitted from a source, there is a recoil effect: the same thing in reverse. If light is reflected normally from a mirror, we get twice the force. The energy of a light-particle is a constant times the frequency, 𝑊 = ℎ𝜈. The momentum carried by the photon is then,
𝑝 =𝑊
𝑐= ℎ𝜔/2𝜋𝑐 = ℎ𝑘/2𝜋 , (2-116)
and it is aligned with the propagation direction. This is a very general relation, since in quantum mechanics all particles, not only photons, exhibit wavelike properties, but the frequency and wave number of the waves is related to the energy and momentum of particles even when 𝑝 is not equal to 𝑊/𝑐 (called the deBroglie relations).
f. Spectroscopic notation The statistical weight (also called “degeneracy”) of atomic levels is often considered for calculation of cross sections, as will be seen later. The statistical weight of hydrogen is simply given by,
𝑔𝑛 = 2𝑛2 , (2-117)
while for the general case it is given by,
𝑔 = (2𝐽 + 1) , (2-118)
where J is the total angular momentum quantum number, given by,
𝐽 = �� + 𝑆 = (2𝐿 + 1)(2𝑆 + 1) , (2-119)
with 𝑆 being the total spin quantum number, and 𝐿 the total orbital quantum number. 𝐽 can be thought of the sum of the total orbital angular momentum and the total electron spins. An electron can have a spin up or down, counted as +1/2 or − 1/2. Since usually electron shells are completely filled in the lower levels, only the last shell, that is not completely filled, is enough to be considered. For example, a shell with one electron contributes equally to the statistical weight than a shell that is almost filled and just missing one electron. The Russel-Sanders term symbol is given by,
𝑛2𝑆+1𝐿𝐽 , (2-120)
which is also called the spectroscopic notation of a quantum configuration. The following orbital notation is used: 𝑠 for 𝑙=0, 𝑝 for 𝑙=1, 𝑑 for 𝑙=2, 𝑓 for 𝑙=3, etc. The spectroscopic notation for molecules uses greek letters (Σ, Π, Δ, Φ, etc.).
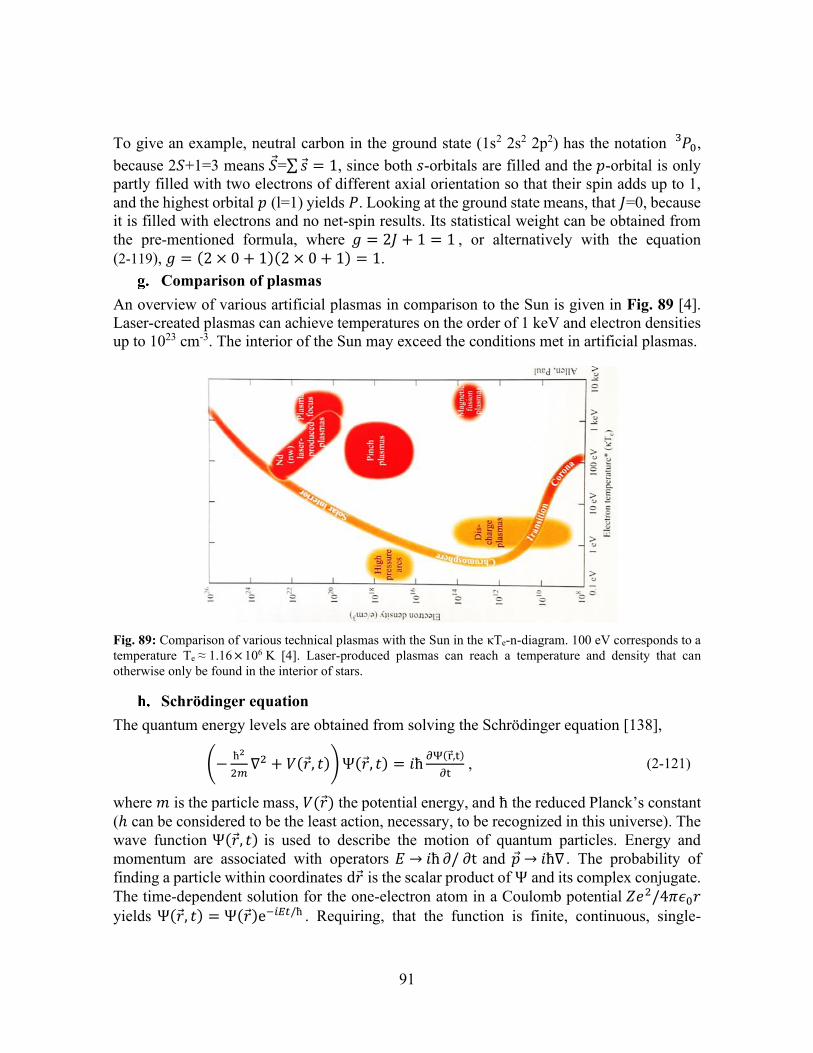
91
To give an example, neutral carbon in the ground state (1s2 2s2 2p2) has the notation 𝑃03 ,
because 2𝑆+1=3 means 𝑆=∑𝑠 = 1, since both 𝑠-orbitals are filled and the 𝑝-orbital is only partly filled with two electrons of different axial orientation so that their spin adds up to 1, and the highest orbital 𝑝 (l=1) yields 𝑃. Looking at the ground state means, that 𝐽=0, because it is filled with electrons and no net-spin results. Its statistical weight can be obtained from the pre-mentioned formula, where 𝑔 = 2𝐽 + 1 = 1 , or alternatively with the equation (2-119), 𝑔 = (2 × 0 + 1)(2 × 0 + 1) = 1.
Comparison of plasmas An overview of various artificial plasmas in comparison to the Sun is given in Fig. 89 [4]. Laser-created plasmas can achieve temperatures on the order of 1 keV and electron densities up to 1023 cm-3. The interior of the Sun may exceed the conditions met in artificial plasmas.
Fig. 89: Comparison of various technical plasmas with the Sun in the κTe-n-diagram. 100 eV corresponds to a temperature Te ≈ 1.16×10⁶ K [4]. Laser-produced plasmas can reach a temperature and density that can otherwise only be found in the interior of stars.
Schrödinger equation The quantum energy levels are obtained from solving the Schrödinger equation [138],
(−ħ2
2𝑚∇2 + 𝑉(𝑟, 𝑡))Ψ(𝑟, 𝑡) = 𝑖ħ
𝜕Ψ(r,t)
∂t , (2-121)
where 𝑚 is the particle mass, 𝑉(𝑟) the potential energy, and ħ the reduced Planck’s constant (ℎ can be considered to be the least action, necessary, to be recognized in this universe). The wave function Ψ(𝑟, 𝑡) is used to describe the motion of quantum particles. Energy and momentum are associated with operators 𝐸 → 𝑖ħ ∂/ ∂t and �� → 𝑖ħ∇ . The probability of finding a particle within coordinates d𝑟 is the scalar product of Ψ and its complex conjugate. The time-dependent solution for the one-electron atom in a Coulomb potential 𝑍𝑒2/4𝜋𝜖0𝑟 yields Ψ(𝑟, 𝑡) = Ψ(𝑟)e−𝑖𝐸𝑡/ħ . Requiring, that the function is finite, continuous, single-
92
valued, and normalizable introduces the principal quantum number 𝑛 , orbital quantum number 𝑙, and magnetic quantum number 𝑚𝑙. To account for Pauli’s exclusion principle, where no two electrons are allowed to have an identical set of quantum numbers, a fourth quantum number is introduced, 𝑚𝑠 . Negative energies correspond to bound levels, and positive energies to free electrons with continuous states [4]. In quantum mechanics, the idea of superposition of (matter-)waves according to Huygens’ principle is correct, however, in optics, it is replaced by Kirchhoff’s modification, which requires both the amplitude and its derivate to be known on the adjacent surface because the wave equation of light is second order in time, so action cannot replace time [42].
Lagrangian formalism The Lagrangian formalism enables one to describe a system by means of the principle of least action, and without knowing the forces in the system exactly. The Euler-Lagrange equation is given by,
𝑑
𝑑𝑡
𝜕𝐿
𝜕��−
𝜕𝐿
𝜕𝑥 = 0 , (2-122)
where 𝐿 denotes a function 𝐿 of which partial derivatives are calculated. This function can be the difference of potential and kinetic energy, for example. If they are known (e.g. 𝑚𝑔𝑥, 𝑚𝑣2/2), one can easily derive the Galilean equations of motion �� = −𝑔, �� = −𝑔𝑡, 𝑥 =−𝑔𝑡2/2 (example taken from J. M. Gaßner). Furthermore, Lagrangian coordinates can be used to track the motion of a parcel in a flow field. To characterize an ablation drive in a laser-produced plasma, particle tracing in Lagrangian coordinates may be useful, because a crater at the target may be partly formed by melting/evaporation, and partly by a shock-front propagating into the target surface.
Lorentz transformation In order to transform coordinates from one frame of reference to another, moving at a constant velocity 𝑣, the following transformation equations are used [4]:
𝑡′ = 𝛾(𝑡 − 𝑣𝑥/𝑐2) , (2-123)
𝑥′ = 𝛾(𝑥 − 𝑣𝑡) , (2-124)
𝑦′ = 𝑦 (2-125)
𝑧′ = 𝑧 (2-126)
where the prime indicates the other frame in which an event occurs. The Lorentz-factor 𝛾 can be expressed as 1/√(1 − 𝑣2/𝑐2) . Often, the ratio 𝑣/𝑐 is called 𝛽 and substituted into the above equations. The Lorentz contraction length yields 𝐿′ = 𝐿/𝛾. H. Poincaré was the first to recognize the importance of Lorentz transformation, which laid the foundation of special theory of relativity.
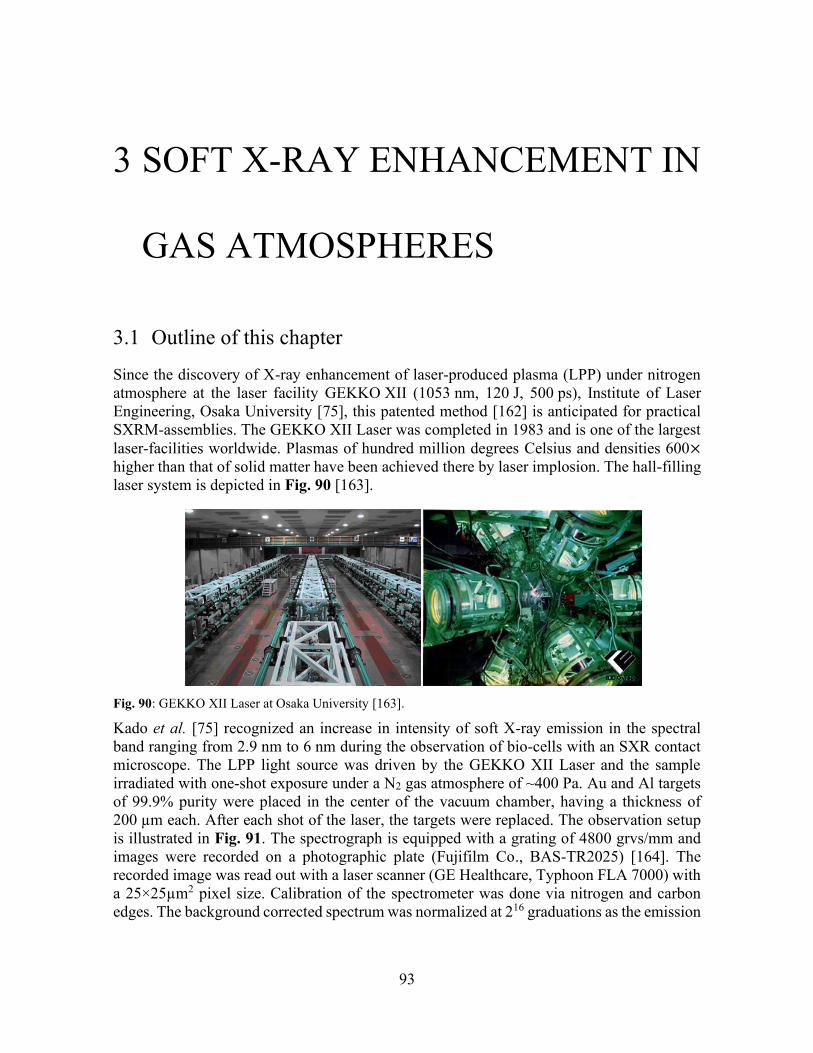
93
3 SOFT X-RAY ENHANCEMENT IN
GAS ATMOSPHERES
3.1 Outline of this chapter
Since the discovery of X-ray enhancement of laser-produced plasma (LPP) under nitrogen atmosphere at the laser facility GEKKO XII (1053 nm, 120 J, 500 ps), Institute of Laser Engineering, Osaka University [75], this patented method [162] is anticipated for practical SXRM-assemblies. The GEKKO XII Laser was completed in 1983 and is one of the largest laser-facilities worldwide. Plasmas of hundred million degrees Celsius and densities 600× higher than that of solid matter have been achieved there by laser implosion. The hall-filling laser system is depicted in Fig. 90 [163].
Fig. 90: GEKKO XII Laser at Osaka University [163].
Kado et al. [75] recognized an increase in intensity of soft X-ray emission in the spectral band ranging from 2.9 nm to 6 nm during the observation of bio-cells with an SXR contact microscope. The LPP light source was driven by the GEKKO XII Laser and the sample irradiated with one-shot exposure under a N2 gas atmosphere of ~400 Pa. Au and Al targets of 99.9% purity were placed in the center of the vacuum chamber, having a thickness of 200 µm each. After each shot of the laser, the targets were replaced. The observation setup is illustrated in Fig. 91. The spectrograph is equipped with a grating of 4800 grvs/mm and images were recorded on a photographic plate (Fujifilm Co., BAS-TR2025) [164]. The recorded image was read out with a laser scanner (GE Healthcare, Typhoon FLA 7000) with a 25×25µm2 pixel size. Calibration of the spectrometer was done via nitrogen and carbon edges. The background corrected spectrum was normalized at 216 graduations as the emission
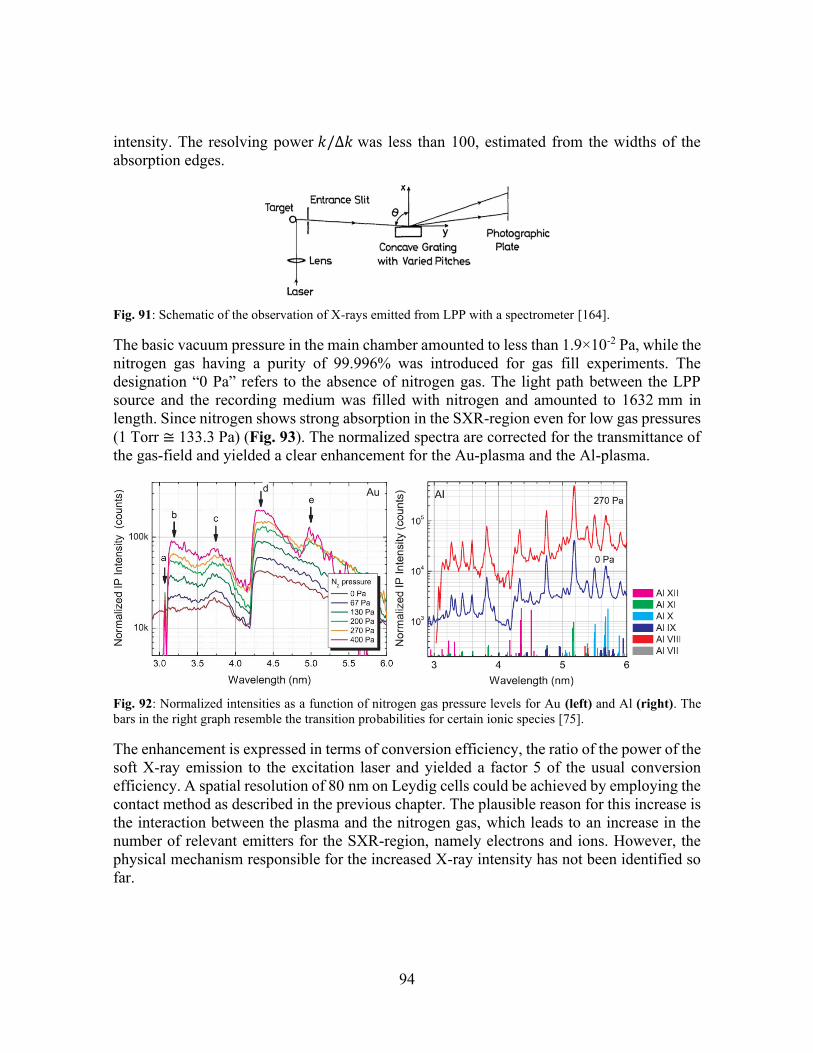
94
intensity. The resolving power 𝑘/∆𝑘 was less than 100, estimated from the widths of the absorption edges.
Fig. 91: Schematic of the observation of X-rays emitted from LPP with a spectrometer [164].
The basic vacuum pressure in the main chamber amounted to less than 1.9×10⁻² Pa, while the nitrogen gas having a purity of 99.996% was introduced for gas fill experiments. The designation “0 Pa” refers to the absence of nitrogen gas. The light path between the LPP source and the recording medium was filled with nitrogen and amounted to 1632 mm in length. Since nitrogen shows strong absorption in the SXR-region even for low gas pressures (1 Torr ≅ 133.3 Pa) (Fig. 93). The normalized spectra are corrected for the transmittance of the gas-field and yielded a clear enhancement for the Au-plasma and the Al-plasma.
Fig. 92: Normalized intensities as a function of nitrogen gas pressure levels for Au (left) and Al (right). The bars in the right graph resemble the transition probabilities for certain ionic species [75].
The enhancement is expressed in terms of conversion efficiency, the ratio of the power of the soft X-ray emission to the excitation laser and yielded a factor 5 of the usual conversion efficiency. A spatial resolution of 80 nm on Leydig cells could be achieved by employing the contact method as described in the previous chapter. The plausible reason for this increase is the interaction between the plasma and the nitrogen gas, which leads to an increase in the number of relevant emitters for the SXR-region, namely electrons and ions. However, the physical mechanism responsible for the increased X-ray intensity has not been identified so far.
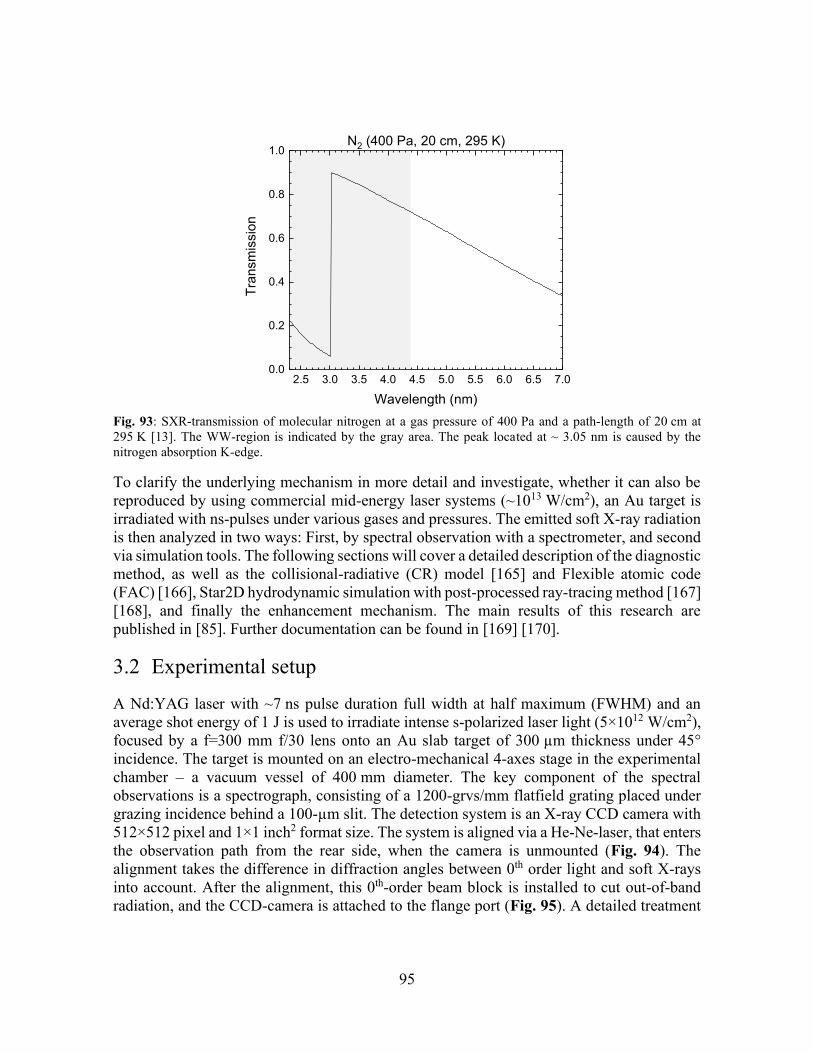
95
2.5 3.0 3.5 4.0 4.5 5.0 5.5 6.0 6.5 7.00.0
0.2
0.4
0.6
0.8
1.0
Tran
smis
sion
Wavelength (nm)
N2 (400 Pa, 20 cm, 295 K)
Fig. 93: SXR-transmission of molecular nitrogen at a gas pressure of 400 Pa and a path-length of 20 cm at 295 K [13]. The WW-region is indicated by the gray area. The peak located at ~ 3.05 nm is caused by the nitrogen absorption K-edge.
To clarify the underlying mechanism in more detail and investigate, whether it can also be reproduced by using commercial mid-energy laser systems (~1013 W/cm2), an Au target is irradiated with ns-pulses under various gases and pressures. The emitted soft X-ray radiation is then analyzed in two ways: First, by spectral observation with a spectrometer, and second via simulation tools. The following sections will cover a detailed description of the diagnostic method, as well as the collisional-radiative (CR) model [165] and Flexible atomic code (FAC) [166], Star2D hydrodynamic simulation with post-processed ray-tracing method [167] [168], and finally the enhancement mechanism. The main results of this research are published in [85]. Further documentation can be found in [169] [170].
3.2 Experimental setup
A Nd:YAG laser with ~7 ns pulse duration full width at half maximum (FWHM) and an average shot energy of 1 J is used to irradiate intense s-polarized laser light (5×10¹² W/cm2), focused by a f=300 mm f/30 lens onto an Au slab target of 300 µm thickness under 45° incidence. The target is mounted on an electro-mechanical 4-axes stage in the experimental chamber – a vacuum vessel of 400 mm diameter. The key component of the spectral observations is a spectrograph, consisting of a 1200-grvs/mm flatfield grating placed under grazing incidence behind a 100-µm slit. The detection system is an X-ray CCD camera with 512×512 pixel and 1×1 inch2 format size. The system is aligned via a He-Ne-laser, that enters the observation path from the rear side, when the camera is unmounted (Fig. 94). The alignment takes the difference in diffraction angles between 0th order light and soft X-rays into account. After the alignment, this 0th-order beam block is installed to cut out-of-band radiation, and the CCD-camera is attached to the flange port (Fig. 95). A detailed treatment
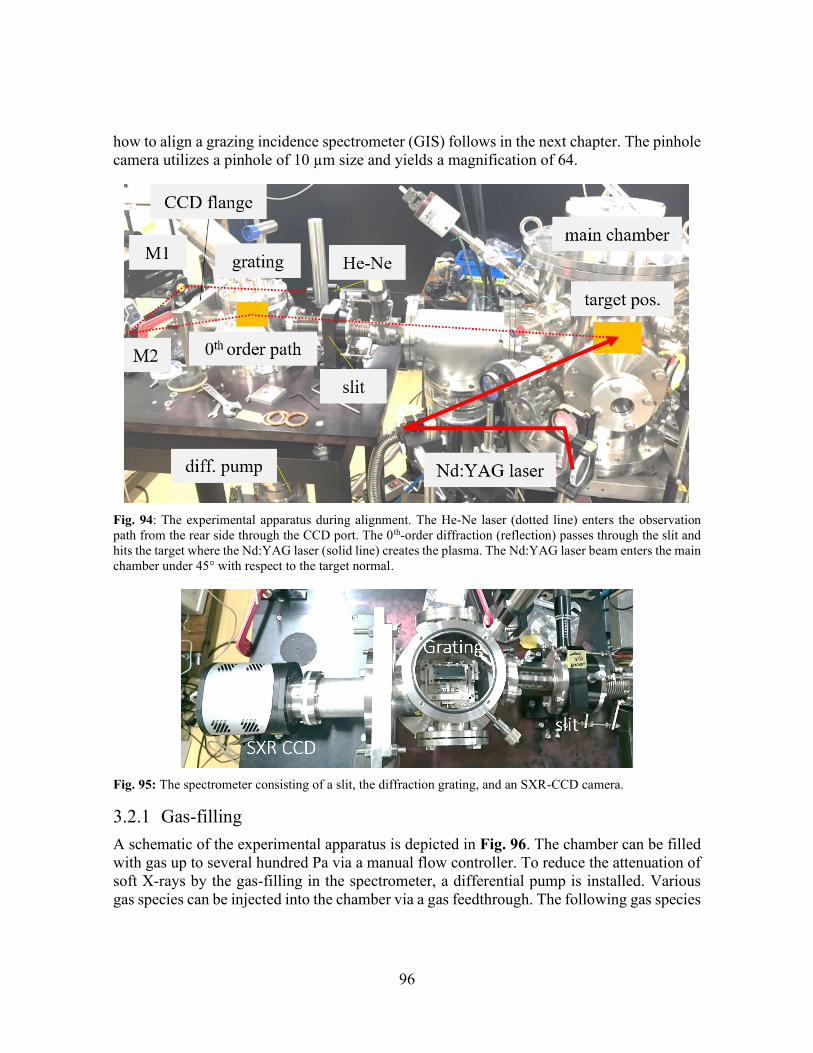
96
how to align a grazing incidence spectrometer (GIS) follows in the next chapter. The pinhole camera utilizes a pinhole of 10 µm size and yields a magnification of 64.
Fig. 94: The experimental apparatus during alignment. The He-Ne laser (dotted line) enters the observation path from the rear side through the CCD port. The 0th-order diffraction (reflection) passes through the slit and hits the target where the Nd:YAG laser (solid line) creates the plasma. The Nd:YAG laser beam enters the main chamber under 45° with respect to the target normal.
Fig. 95: The spectrometer consisting of a slit, the diffraction grating, and an SXR-CCD camera.
3.2.1 Gas-filling A schematic of the experimental apparatus is depicted in Fig. 96. The chamber can be filled with gas up to several hundred Pa via a manual flow controller. To reduce the attenuation of soft X-rays by the gas-filling in the spectrometer, a differential pump is installed. Various gas species can be injected into the chamber via a gas feedthrough. The following gas species
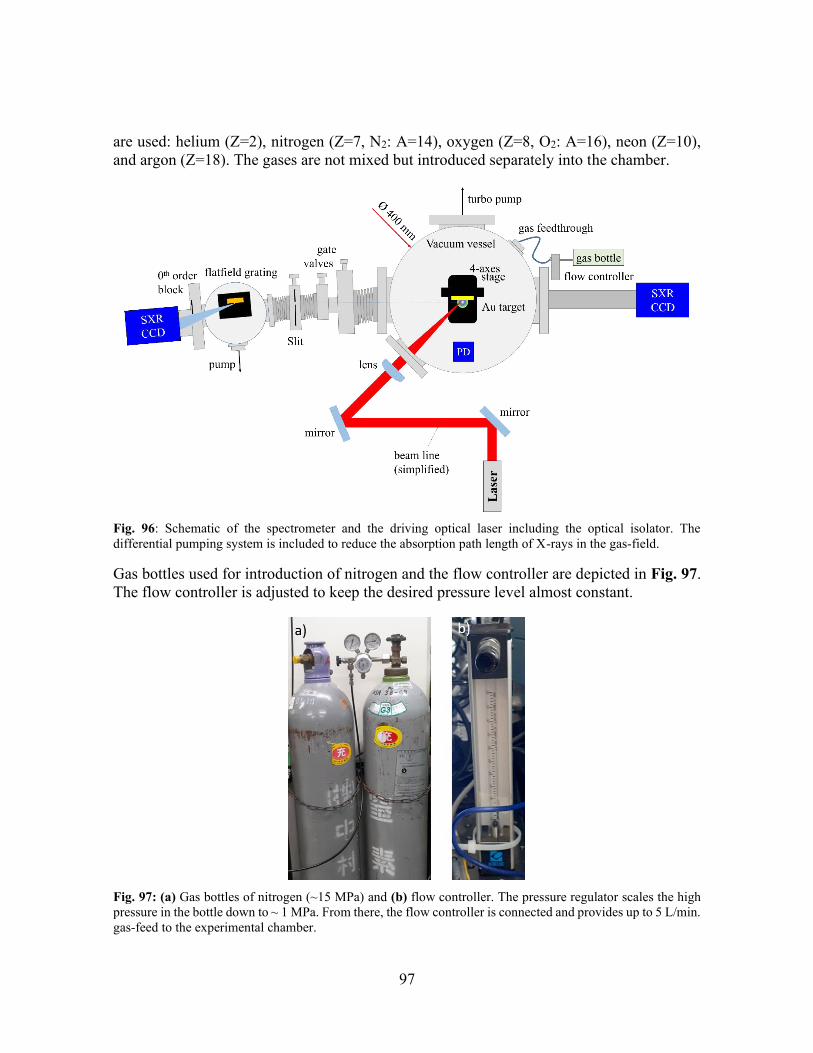
97
are used: helium (Z=2), nitrogen (Z=7, N2: A=14), oxygen (Z=8, O2: A=16), neon (Z=10), and argon (Z=18). The gases are not mixed but introduced separately into the chamber.
Fig. 96: Schematic of the spectrometer and the driving optical laser including the optical isolator. The differential pumping system is included to reduce the absorption path length of X-rays in the gas-field.
Gas bottles used for introduction of nitrogen and the flow controller are depicted in Fig. 97. The flow controller is adjusted to keep the desired pressure level almost constant.
Fig. 97: (a) Gas bottles of nitrogen (~15 MPa) and (b) flow controller. The pressure regulator scales the high pressure in the bottle down to ~ 1 MPa. From there, the flow controller is connected and provides up to 5 L/min. gas-feed to the experimental chamber.
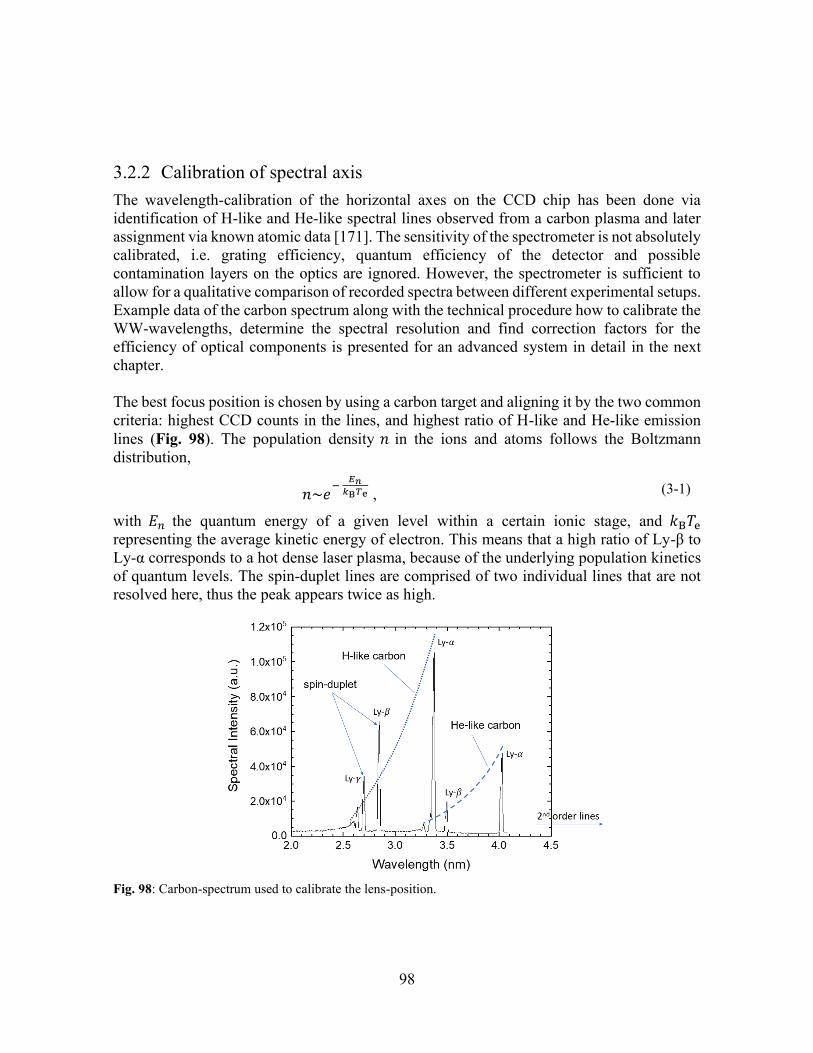
98
3.2.2 Calibration of spectral axis The wavelength-calibration of the horizontal axes on the CCD chip has been done via identification of H-like and He-like spectral lines observed from a carbon plasma and later assignment via known atomic data [171]. The sensitivity of the spectrometer is not absolutely calibrated, i.e. grating efficiency, quantum efficiency of the detector and possible contamination layers on the optics are ignored. However, the spectrometer is sufficient to allow for a qualitative comparison of recorded spectra between different experimental setups. Example data of the carbon spectrum along with the technical procedure how to calibrate the WW-wavelengths, determine the spectral resolution and find correction factors for the efficiency of optical components is presented for an advanced system in detail in the next chapter. The best focus position is chosen by using a carbon target and aligning it by the two common criteria: highest CCD counts in the lines, and highest ratio of H-like and He-like emission lines (Fig. 98). The population density 𝑛 in the ions and atoms follows the Boltzmann distribution,
𝑛~𝑒−
𝐸𝑛𝑘B𝑇e , (3-1)
with 𝐸𝑛 the quantum energy of a given level within a certain ionic stage, and 𝑘B𝑇e representing the average kinetic energy of electron. This means that a high ratio of Ly-β to Ly-α corresponds to a hot dense laser plasma, because of the underlying population kinetics of quantum levels. The spin-duplet lines are comprised of two individual lines that are not resolved here, thus the peak appears twice as high.
Fig. 98: Carbon-spectrum used to calibrate the lens-position.
99
The simplified grating equation for reflection gratings, according to which the GIS works, is given by,
𝑑(sin 𝛼 + sin 𝛽) = 𝑚𝜆 , (3-2)
with 𝑑 being the grating constant, 𝛼 and 𝛽 being the angle of incidence and angle of diffraction with respect to the grating’s surface normal, respectively, and 𝑚 the diffraction order of wavelength 𝜆.
3.3 Numerical simulation
3.3.1 Star2D code Throughout this text, the experimental results are compared with numerical simulations to understand the physical dynamics and radiation properties of laser-produced hot dense plasma. During the investigations of the soft X-ray enhancement effect by using a nitrogen gas-field, the Star1D-code is used to acquire information about electron density and electron temperature in the hot dense Au-plasma, while for later studies the Star2D-code is used [167] [168]. In this section, the principles of the radiation-hydrodynamics simulation Star2D are treated. The main difference to Star1D is, that Star2D calculates the plasma dynamics in two dimensions, instead of one. The code is based on the one-fluid two-temperature model, where electrons and ions are treated with individual temperatures. The energy transfer from laser into the target is treated with the simple one-dimensional ray tracing. The simulation assumes collisional absorption (inverse bremsstrahlung) as the heating mechanism, and is further based upon the screened hydrogen model, which assumes spherical shape of all electron shells, which deviates for the high-Z elements such as Au. This model provides the code with information on emission/absorption and charge states. The global equation of state (EOS)-model describes pressure and internal energy over wide ranges of density and temperature and is available for more than 150 materials in a table, called SESAME EOS [172]. This table contains calculated values that are fitted by experimental data. Due to the complexity of atomic structure, analytical solutions are difficult, especially for the high-Z elements. The simulation further uses the Spitzer-Härm diffusion coefficient to account for electrical and thermal conductivity, which are computed for completely ionized gases with a wide variety of mean ionic charges [173]. The radiation transport is solved by the multi-group flux-limited diffusion model [174].
a. Screened hydrogen model The screened hydrogen model describes the level densities of hydrogenic ions in (3-3), which is an important relation to connect the discrete spectrum with the continuous spectrum. Here, 𝐸𝑛 represents the quantum energies, 𝑛 the quantum numbers, 𝐸A the atomic energy unit (27.20 eV), 𝑄𝑛 the effective charge that accounts for the screening of the nuclear charge 𝑍 by inner electrons located in shells with quantum number 𝑚 smaller than 𝑛 or equal, 𝑃𝑚 the numbers of electrons populating shell 𝑚, and 𝜎𝑛𝑚 the matrix representing a fixed set of screening constants describing all atoms and ions. The shielding constants are approximate values on a semi-empirical basis described by Slater in the early last century [146]. The
100
approximation for the total energy of an atom or ion, which is the energy required to remove all electrons from the nucleus to infinite distance, is given by 𝐸t ≈ −[(𝑍 − 𝑠)/𝑛]2 with 𝑍 being the nuclear charge and 𝑠 the screening constant. The author recommends the screening constants given by More as presented in [175] and in different presentation in [47].
d𝐸𝑛
d𝑛=
𝐸A
𝑛3 𝑄𝑛2 =
𝑚𝑒4
𝑛3ħ2(𝑍 − ∑ 𝜎𝑛𝑚𝑃𝑚𝑚≤𝑛 )2 . (3-3)
b. SESAME equation of state
A detailed treatment of SESAME EOS is given in the book of Fortov et al. [176]. In principle, the employed theories are able to treat the plasma as solid, fluid, or gas and connect these phases smoothly. A shallow treatment is given in the appendix of this chapter, together with a short comparison of other EOS, that describe the plasma as a solid (Phonon-EOS), fluid (Cowan’s EOS), or gas (Thomas-Fermi electron gas).
c. Fluid description of the plasma Following Attwood and Sakdinawat [4], the fluid dynamic of a plasma is described by the continuity equation,
∂𝑛𝑗
∂𝑡+ ∇ ∙ (𝑛𝑗 ��) = 0 , (3-4)
which follows from the collisionless Vlasov equation for electrons and expresses the conservation of particles 𝑛𝑗 with the slowly varying average velocity ��. To account for the conservation of momentum, the fluid mechanical momentum equation for charged particles is defined by,
𝑚 (∂
∂𝑡+ 𝑣��
∙ ∇) 𝑣�� = −
1
𝑛𝑗∇𝑃𝑗 − 𝑞𝑗(�� + 𝑣��
× ��) . (3-5)
Including friction between particles would lead to the Navier-Stokes equation of hydrodynamics, with an additional viscous force term µ(∇)2�� on the right side of the equation. 𝑃𝑗 resembles the pressure of the charged particle species 𝑗. Neglecting the viscosity and inter-particle collisions, the plasma can be described by the Maxwell-Euler equations on a fluid-level (see Appendix). The fluid description is completed by the conservation of energy, as given by,
𝑛𝑗 [∂
∂𝑡+ �� ∙ ∇] 𝑈𝑗 + (��𝑗
∙ ∇) ∙ �� + ∇ ∙ 𝑄𝑗 = 0 . (3-6)
The symbols ��𝑗 , 𝑈𝑗 and 𝑄𝐽
stand for the pressure dyad, random thermal energy, and the thermal flux vector, respectively. For an isotropic plasma, the thermal energy flux is zero, and from the perfect gas relation for partial pressures one has 𝑃𝑗 = 𝑛𝑗𝜅𝑇𝑗 with 𝜅 being the Boltzmann constant. The adiabatic condition between pressure and density for plasma processes such as wave motions, i.e. without heat or mass transfer to the surroundings, is given by,
101
𝑃𝑗
𝑃0𝑗= (
𝑛𝑗
𝑛0𝑗)
𝛾
, (3-7)
where the index 0 indicates the initial background values of pressure and density. The thermodynamic ratio of specific heats 𝛾 assumes values of 1 + 2/𝑁 with 𝑁 degrees of freedom (DOF), e.g. 𝛾 = 5/3 for a monoatomic system with three translational DOF, or 𝛾 =7/3 for diatomic molecules with two additional DOFs for one rotational and one vibrational mode, for polyatomic molecules one assumes three translational DOF and three rotational DOF, thus 𝛾 = 8/3, and for unbound electrons with infinite DOF, so that 𝛾 = 1 [4]. The plasma expansion can be described by the isothermal expansion of a hot fluid with two species – electrons and ions. The resultant expansion velocity of electrons is limited by the inert ions with high mass, so that the non-velocity term in the continuity equation, i.e. the temporal density fluctuations become dominant. One can then define the electron-ion thermal expansion velocity as,
𝑣exp = √(𝑍𝛾𝜅𝑇e
𝑀) = 0.217√
𝑍𝜅𝑇e
𝑀 [
µm
ps] , (3-8)
when taking the ionic charge 𝑍 in units of ten, 𝜅𝑇e in keV, the ion mass 𝑀 in units of 20 times that of a proton, and 𝛾 taken as 1, since the hot dense plasma consists mainly of free particles, thus with high average DOF.
d. Collisional effects The Spitzer-Härm diffusion coefficients account for thermal and electrical conductivity phenomena in a completely ionized electron-proton gas. They include interactions between electrons/electrons and protons/electrons. The particle’s free mean path is coined by the Brownian motion and many distant encounters might occur during the free mean path, causing tiny deflections that need to be summed up. The velocity distribution function 𝑓𝑟 of particles of type 𝑟 interacting with particles of different types 𝑠 thus changes slowly over time and is determined by the Boltzmann’s equation given by Chapman and Cowling [177] as described by,
∂𝑓𝑟
∂𝑡+ ∑ 𝑣𝑟𝑖
∂𝑓𝑟
∂𝑥𝑖+ ∑ 𝐹𝑟𝑖
∂𝑓𝑟
∂𝑣𝑟𝑖= ∑ (
∂e𝑓𝑟
∂𝑡)
s𝑠𝑖𝑖 . (3-9)
Here, 𝑣𝑟𝑖 is the component of velocity of an 𝑟th particle in direction 𝑖, and 𝐹𝑟𝑖 is the force per unit mass on a particle of type 𝑟, while the quantity (∂e𝑓𝑟/ ∂𝑡)s resembles the change in 𝑓𝑟 produced by encounters of 𝑟 particles with 𝑠 particles. The function 𝑓𝑟 starts with the Maxwellian velocity distribution function (which is nothing else as the Boltzmann distribution applied to free particles) and adds a second term to account for the change due to the interactions,
𝑓𝑟 = 𝑓𝑟(0)
+ 𝑓𝑟(1) . (3-10)
The definition of the Maxwellian velocity distribution function and the interaction term are given by,
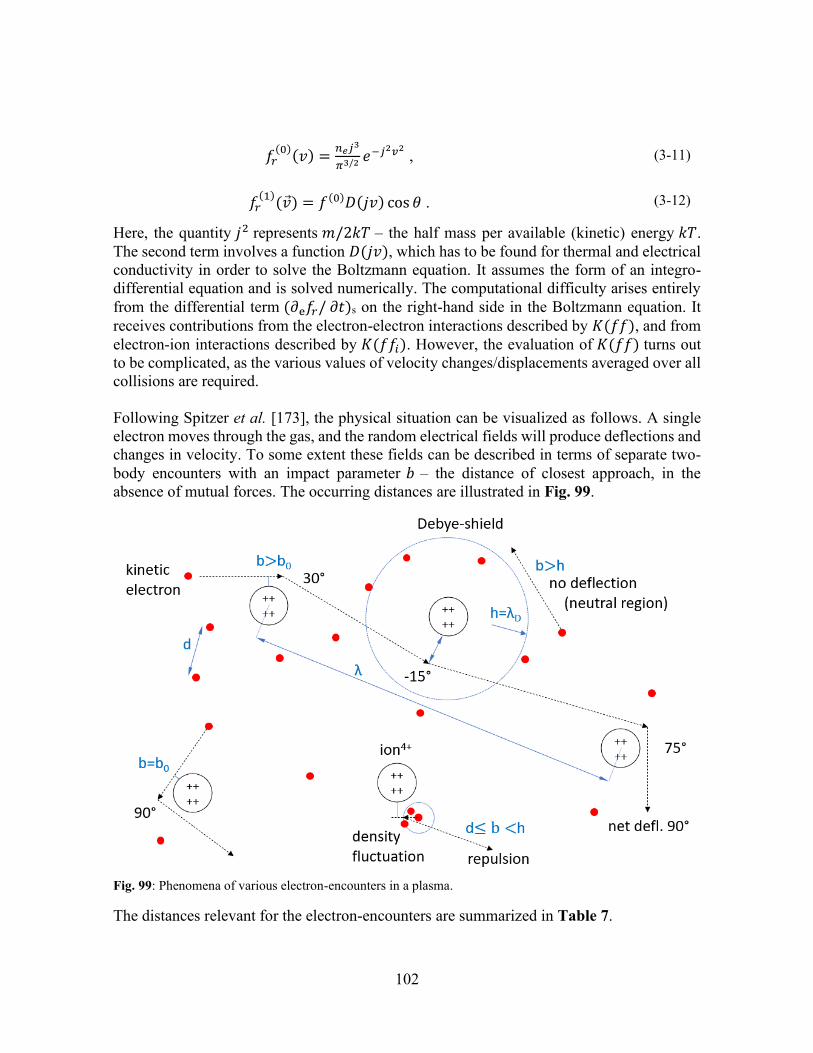
102
𝑓𝑟(0)(𝑣) =
𝑛𝑒𝑗3
𝜋3/2 𝑒−𝑗2𝑣2 , (3-11)
𝑓𝑟(1)
(��) = 𝑓(0)𝐷(𝑗𝑣) cos 휃 . (3-12)
Here, the quantity 𝑗2 represents 𝑚/2𝑘𝑇 – the half mass per available (kinetic) energy 𝑘𝑇. The second term involves a function 𝐷(𝑗𝑣), which has to be found for thermal and electrical conductivity in order to solve the Boltzmann equation. It assumes the form of an integro-differential equation and is solved numerically. The computational difficulty arises entirely from the differential term (∂e𝑓𝑟/ ∂𝑡)s on the right-hand side in the Boltzmann equation. It receives contributions from the electron-electron interactions described by 𝐾(𝑓𝑓), and from electron-ion interactions described by 𝐾(𝑓𝑓𝑖). However, the evaluation of 𝐾(𝑓𝑓) turns out to be complicated, as the various values of velocity changes/displacements averaged over all collisions are required. Following Spitzer et al. [173], the physical situation can be visualized as follows. A single electron moves through the gas, and the random electrical fields will produce deflections and changes in velocity. To some extent these fields can be described in terms of separate two-body encounters with an impact parameter 𝑏 – the distance of closest approach, in the absence of mutual forces. The occurring distances are illustrated in Fig. 99.
Fig. 99: Phenomena of various electron-encounters in a plasma.
The distances relevant for the electron-encounters are summarized in Table 7.
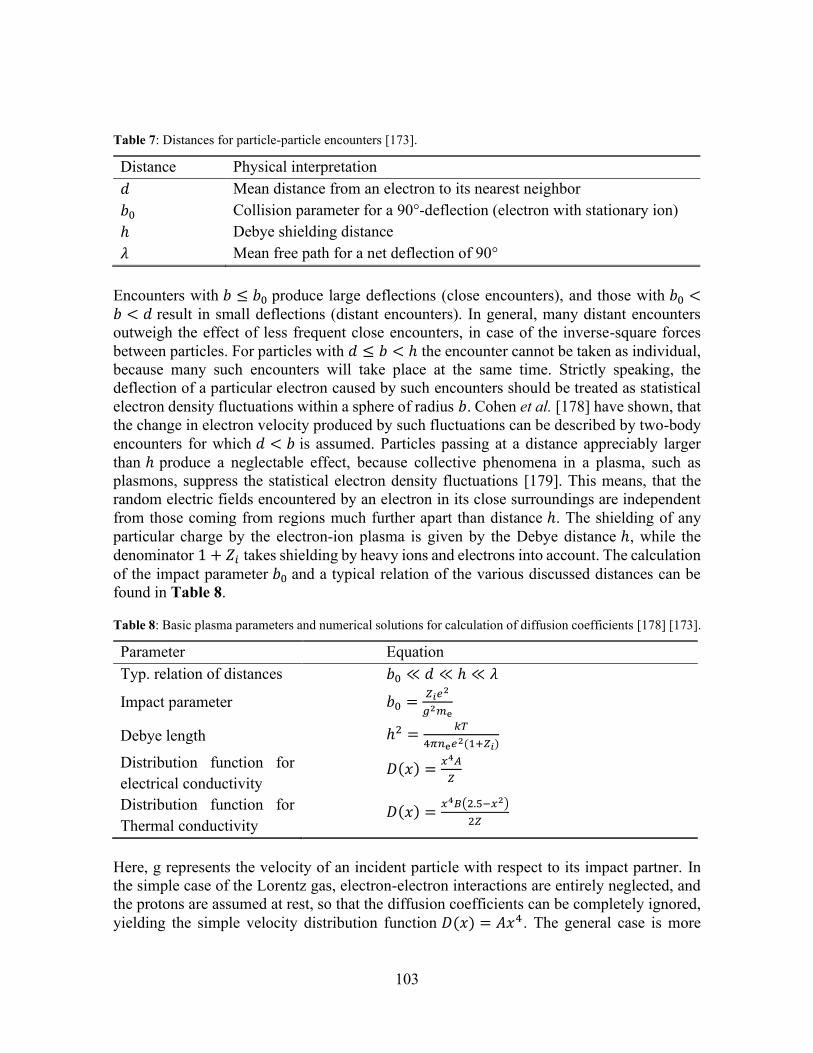
103
Table 7: Distances for particle-particle encounters [173].
Distance Physical interpretation 𝑑 Mean distance from an electron to its nearest neighbor 𝑏0 Collision parameter for a 90°-deflection (electron with stationary ion) ℎ Debye shielding distance 𝜆 Mean free path for a net deflection of 90°
Encounters with 𝑏 ≤ 𝑏0 produce large deflections (close encounters), and those with 𝑏0 <𝑏 < 𝑑 result in small deflections (distant encounters). In general, many distant encounters outweigh the effect of less frequent close encounters, in case of the inverse-square forces between particles. For particles with 𝑑 ≤ 𝑏 < ℎ the encounter cannot be taken as individual, because many such encounters will take place at the same time. Strictly speaking, the deflection of a particular electron caused by such encounters should be treated as statistical electron density fluctuations within a sphere of radius 𝑏. Cohen et al. [178] have shown, that the change in electron velocity produced by such fluctuations can be described by two-body encounters for which 𝑑 < 𝑏 is assumed. Particles passing at a distance appreciably larger than ℎ produce a neglectable effect, because collective phenomena in a plasma, such as plasmons, suppress the statistical electron density fluctuations [179]. This means, that the random electric fields encountered by an electron in its close surroundings are independent from those coming from regions much further apart than distance ℎ. The shielding of any particular charge by the electron-ion plasma is given by the Debye distance ℎ, while the denominator 1 + 𝑍𝑖 takes shielding by heavy ions and electrons into account. The calculation of the impact parameter 𝑏0 and a typical relation of the various discussed distances can be found in Table 8.
Table 8: Basic plasma parameters and numerical solutions for calculation of diffusion coefficients [178] [173].
Parameter Equation Typ. relation of distances 𝑏0 ≪ 𝑑 ≪ ℎ ≪ 𝜆
Impact parameter 𝑏0 =𝑍𝑖𝑒2
𝑔2𝑚e
Debye length ℎ2 =𝑘𝑇
4𝜋𝑛e𝑒2(1+𝑍𝑖)
Distribution function for electrical conductivity
𝐷(𝑥) =𝑥4𝐴
𝑍
Distribution function for Thermal conductivity
𝐷(𝑥) =𝑥4𝐵(2.5−𝑥2)
2𝑍
Here, g represents the velocity of an incident particle with respect to its impact partner. In the simple case of the Lorentz gas, electron-electron interactions are entirely neglected, and the protons are assumed at rest, so that the diffusion coefficients can be completely ignored, yielding the simple velocity distribution function 𝐷(𝑥) = 𝐴𝑥4 . The general case is more
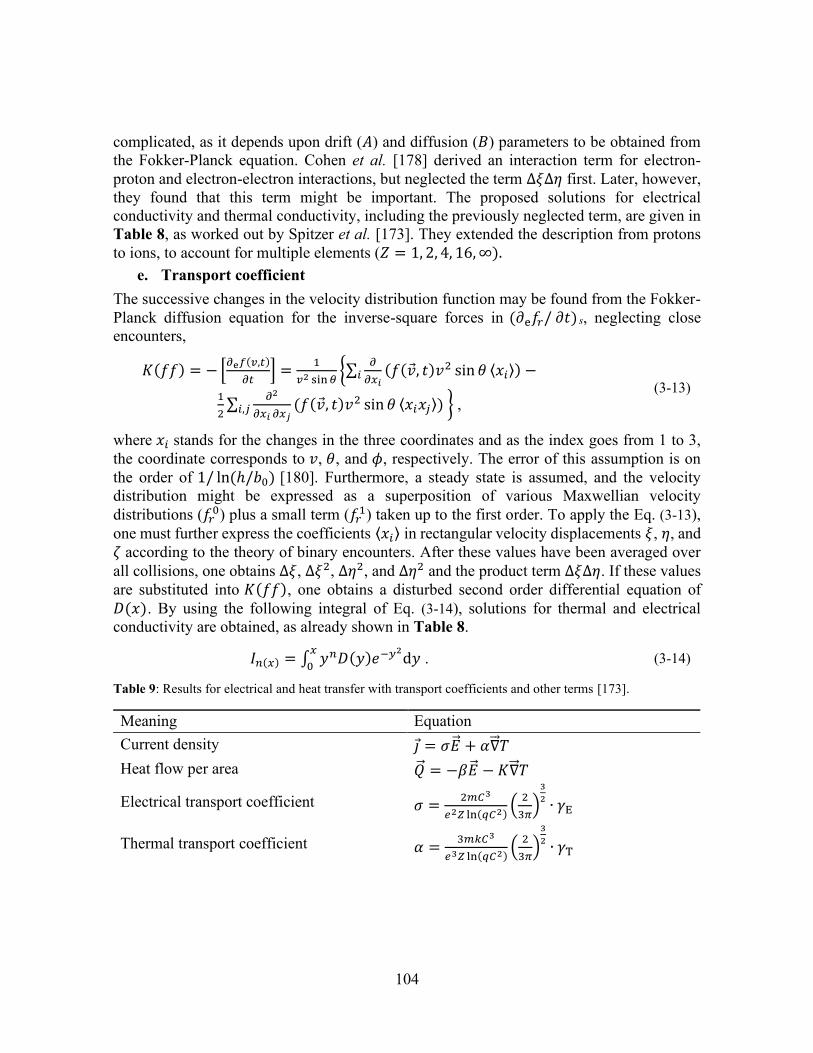
104
complicated, as it depends upon drift (𝐴) and diffusion (𝐵) parameters to be obtained from the Fokker-Planck equation. Cohen et al. [178] derived an interaction term for electron-proton and electron-electron interactions, but neglected the term ∆𝜉∆휂 first. Later, however, they found that this term might be important. The proposed solutions for electrical conductivity and thermal conductivity, including the previously neglected term, are given in Table 8, as worked out by Spitzer et al. [173]. They extended the description from protons to ions, to account for multiple elements (𝑍 = 1, 2, 4, 16, ∞).
e. Transport coefficient The successive changes in the velocity distribution function may be found from the Fokker-Planck diffusion equation for the inverse-square forces in (∂e𝑓𝑟/ ∂𝑡) s, neglecting close encounters,
𝐾(𝑓𝑓) = − [∂e𝑓(𝑣,𝑡)
∂𝑡] =
1
𝑣2 sin 𝜃{∑
∂
∂𝑥𝑖(𝑓(��, 𝑡)𝑣2 sin 휃 ⟨𝑥𝑖⟩) −𝑖
1
2∑
∂2
∂𝑥𝑖 ∂𝑥𝑗(𝑓(��, 𝑡)𝑣2 sin 휃 ⟨𝑥𝑖𝑥𝑗⟩𝑖,𝑗 ) } ,
(3-13)
where 𝑥𝑖 stands for the changes in the three coordinates and as the index goes from 1 to 3, the coordinate corresponds to 𝑣, 휃, and 𝜙, respectively. The error of this assumption is on the order of 1/ ln(ℎ/𝑏0) [180]. Furthermore, a steady state is assumed, and the velocity distribution might be expressed as a superposition of various Maxwellian velocity distributions (𝑓𝑟
0) plus a small term (𝑓𝑟1) taken up to the first order. To apply the Eq. (3-13),
one must further express the coefficients ⟨𝑥𝑖⟩ in rectangular velocity displacements 𝜉, 휂, and 휁 according to the theory of binary encounters. After these values have been averaged over all collisions, one obtains ∆𝜉, ∆𝜉2, ∆휂2, and ∆휂2 and the product term ∆𝜉∆휂. If these values are substituted into 𝐾(𝑓𝑓), one obtains a disturbed second order differential equation of 𝐷(𝑥). By using the following integral of Eq. (3-14), solutions for thermal and electrical conductivity are obtained, as already shown in Table 8.
𝐼𝑛(𝑥) = ∫ 𝑦𝑛𝐷(𝑦)𝑒−𝑦2d𝑦
𝑥
0 . (3-14)
Table 9: Results for electrical and heat transfer with transport coefficients and other terms [173].
Meaning Equation Current density 𝑗 = 𝜎�� + 𝛼∇𝑇 Heat flow per area �� = −𝛽�� − 𝐾∇𝑇
Electrical transport coefficient 𝜎 =2𝑚𝐶3
𝑒2𝑍 ln(𝑞𝐶2)(
2
3𝜋)
3
2∙ 𝛾E
Thermal transport coefficient 𝛼 =3𝑚𝑘𝐶3
𝑒3𝑍 ln(𝑞𝐶2)(
2
3𝜋)
3
2∙ 𝛾T
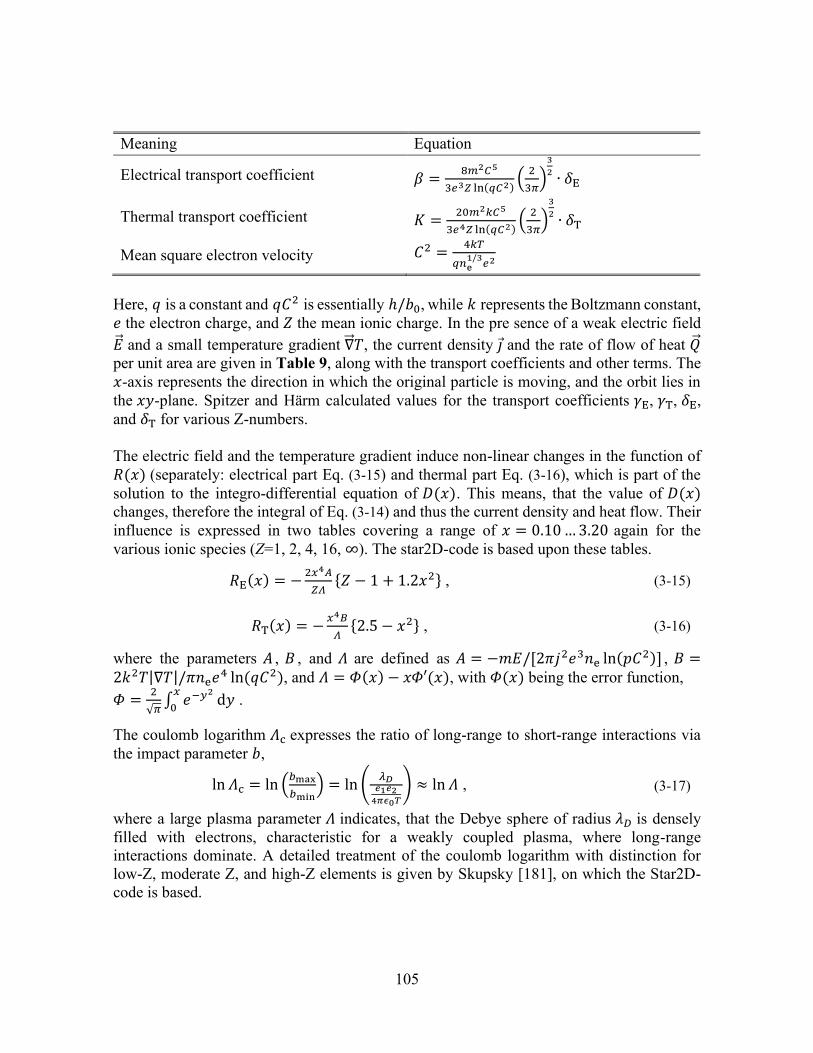
105
Meaning Equation
Electrical transport coefficient 𝛽 =8𝑚2𝐶5
3𝑒3𝑍 ln(𝑞𝐶2)(
2
3𝜋)
3
2∙ 𝛿E
Thermal transport coefficient 𝐾 =20𝑚2𝑘𝐶5
3𝑒4𝑍 ln(𝑞𝐶2)(
2
3𝜋)
3
2∙ 𝛿T
Mean square electron velocity 𝐶2 =4𝑘𝑇
𝑞𝑛e1/3
𝑒2
Here, 𝑞 is a constant and 𝑞𝐶2 is essentially ℎ/𝑏0, while 𝑘 represents the Boltzmann constant, 𝑒 the electron charge, and 𝑍 the mean ionic charge. In the pre sence of a weak electric field �� and a small temperature gradient ∇𝑇, the current density 𝑗 and the rate of flow of heat �� per unit area are given in Table 9, along with the transport coefficients and other terms. The 𝑥-axis represents the direction in which the original particle is moving, and the orbit lies in the 𝑥𝑦-plane. Spitzer and Härm calculated values for the transport coefficients 𝛾E, 𝛾T, 𝛿E, and 𝛿T for various Z-numbers. The electric field and the temperature gradient induce non-linear changes in the function of 𝑅(𝑥) (separately: electrical part Eq. (3-15) and thermal part Eq. (3-16), which is part of the solution to the integro-differential equation of 𝐷(𝑥). This means, that the value of 𝐷(𝑥) changes, therefore the integral of Eq. (3-14) and thus the current density and heat flow. Their influence is expressed in two tables covering a range of 𝑥 = 0.10 … 3.20 again for the various ionic species (Z=1, 2, 4, 16, ∞). The star2D-code is based upon these tables.
𝑅E(𝑥) = −2𝑥4𝐴
𝑍𝛬{𝑍 − 1 + 1.2𝑥2} , (3-15)
𝑅T(𝑥) = −𝑥4𝐵
𝛬{2.5 − 𝑥2} , (3-16)
where the parameters 𝐴 , 𝐵 , and 𝛬 are defined as 𝐴 = −𝑚𝐸/[2𝜋𝑗2𝑒3𝑛e ln(𝑝𝐶2)] , 𝐵 =2𝑘2𝑇|∇𝑇|/𝜋𝑛e𝑒4 ln(𝑞𝐶2), and 𝛬 = 𝛷(𝑥) − 𝑥𝛷′(𝑥), with 𝛷(𝑥) being the error function, 𝛷 =
2
√𝜋∫ 𝑒−𝑦2𝑥
0d𝑦 .
The coulomb logarithm 𝛬c expresses the ratio of long-range to short-range interactions via the impact parameter 𝑏,
ln 𝛬c = ln (𝑏max
𝑏min) = ln (
𝜆𝐷𝑒1𝑒2
4𝜋𝜖0𝑇
) ≈ ln 𝛬 , (3-17)
where a large plasma parameter 𝛬 indicates, that the Debye sphere of radius 𝜆𝐷 is densely filled with electrons, characteristic for a weakly coupled plasma, where long-range interactions dominate. A detailed treatment of the coulomb logarithm with distinction for low-Z, moderate Z, and high-Z elements is given by Skupsky [181], on which the Star2D-code is based.
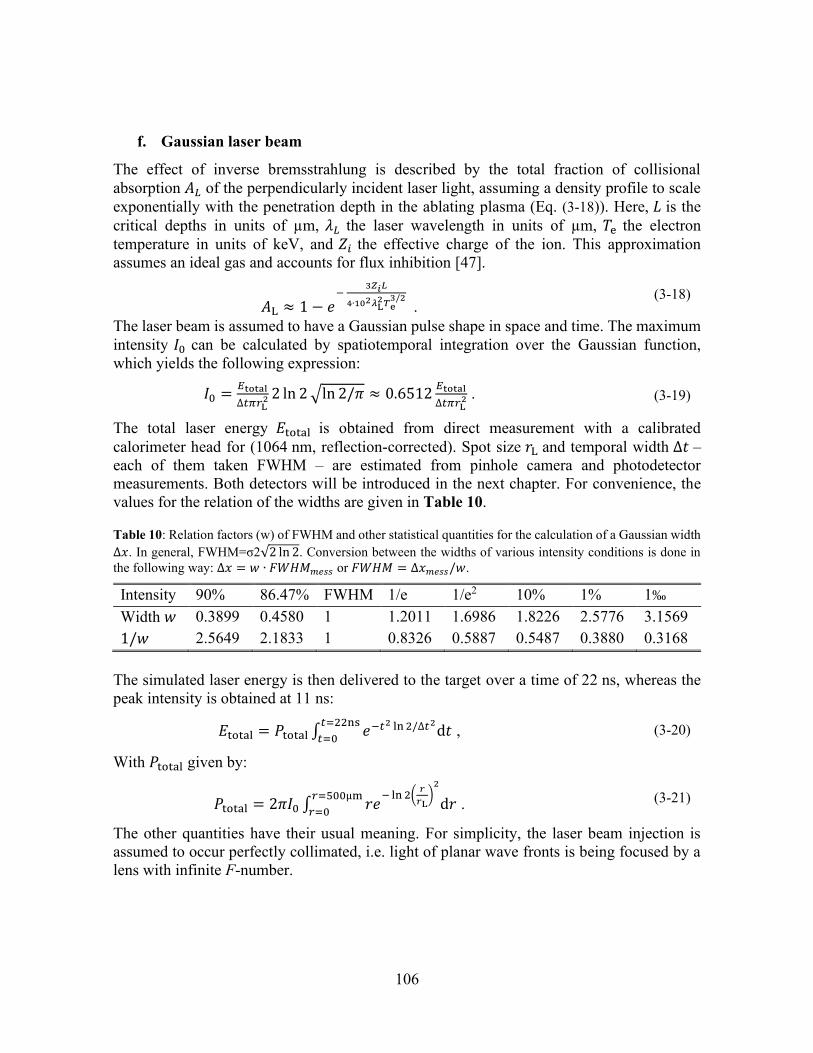
106
f. Gaussian laser beam
The effect of inverse bremsstrahlung is described by the total fraction of collisional absorption 𝐴𝐿 of the perpendicularly incident laser light, assuming a density profile to scale exponentially with the penetration depth in the ablating plasma (Eq. (3-18)). Here, 𝐿 is the critical depths in units of µm, 𝜆𝐿 the laser wavelength in units of µm, 𝑇e the electron temperature in units of keV, and 𝑍𝑖 the effective charge of the ion. This approximation assumes an ideal gas and accounts for flux inhibition [47].
𝐴L ≈ 1 − 𝑒−
3𝑍𝑖𝐿
4∙102𝜆L2𝑇e
3/2 .
(3-18)
The laser beam is assumed to have a Gaussian pulse shape in space and time. The maximum intensity 𝐼0 can be calculated by spatiotemporal integration over the Gaussian function, which yields the following expression:
𝐼0 =𝐸total
∆𝑡𝜋𝑟L2 2 ln 2 √ln 2/𝜋 ≈ 0.6512
𝐸total
∆𝑡𝜋𝑟L2 . (3-19)
The total laser energy 𝐸total is obtained from direct measurement with a calibrated calorimeter head for (1064 nm, reflection-corrected). Spot size 𝑟L and temporal width ∆𝑡 – each of them taken FWHM – are estimated from pinhole camera and photodetector measurements. Both detectors will be introduced in the next chapter. For convenience, the values for the relation of the widths are given in Table 10.
Table 10: Relation factors (w) of FWHM and other statistical quantities for the calculation of a Gaussian width ∆𝑥. In general, FWHM=σ2√2 ln 2. Conversion between the widths of various intensity conditions is done in the following way: ∆𝑥 = 𝑤 ∙ 𝐹𝑊𝐻𝑀𝑚𝑒𝑠𝑠 or 𝐹𝑊𝐻𝑀 = ∆𝑥𝑚𝑒𝑠𝑠/𝑤.
Intensity 90% 86.47% FWHM 1/e 1/e2 10% 1% 1‰ Width 𝑤 0.3899 0.4580 1 1.2011 1.6986 1.8226 2.5776 3.1569 1/𝑤 2.5649 2.1833 1 0.8326 0.5887 0.5487 0.3880 0.3168
The simulated laser energy is then delivered to the target over a time of 22 ns, whereas the peak intensity is obtained at 11 ns:
𝐸total = 𝑃total ∫ 𝑒−𝑡2 ln 2/∆𝑡2d𝑡
𝑡=22ns
𝑡=0 , (3-20)
With 𝑃total given by:
𝑃total = 2𝜋𝐼0 ∫ 𝑟𝑒− ln 2(
𝑟
𝑟L)
2
d𝑟𝑟=500µm
𝑟=0 . (3-21)
The other quantities have their usual meaning. For simplicity, the laser beam injection is assumed to occur perfectly collimated, i.e. light of planar wave fronts is being focused by a lens with infinite F-number.
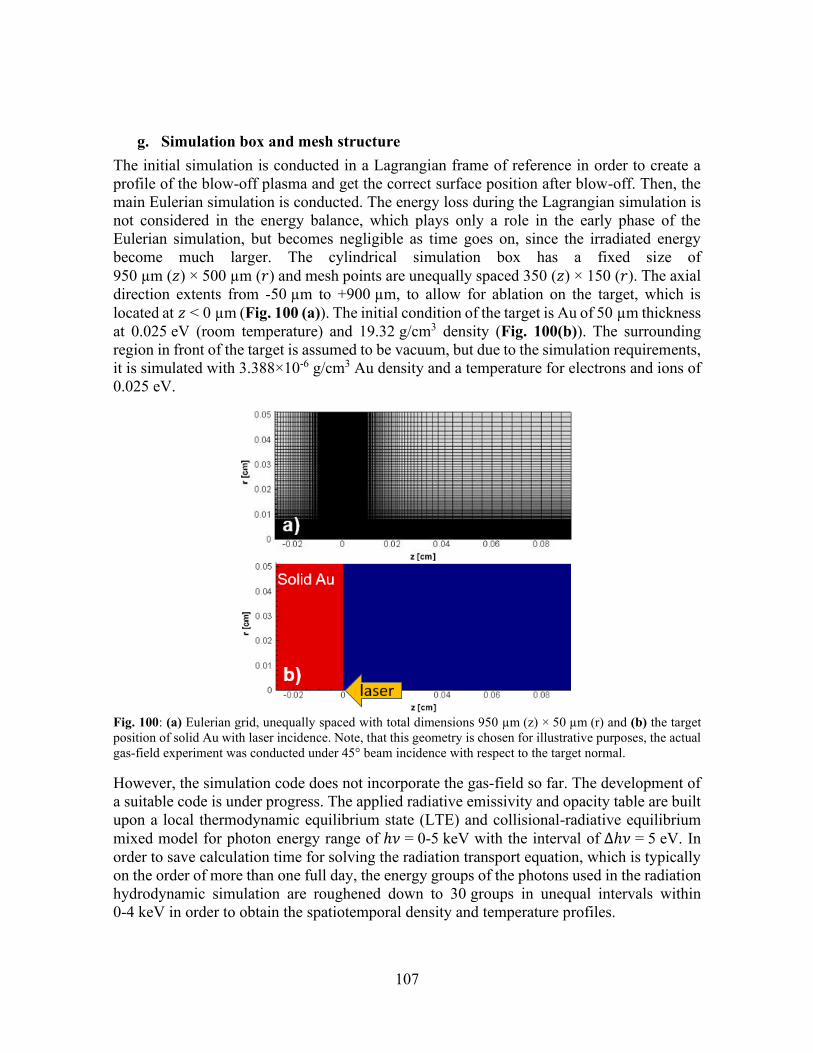
107
g. Simulation box and mesh structure The initial simulation is conducted in a Lagrangian frame of reference in order to create a profile of the blow-off plasma and get the correct surface position after blow-off. Then, the main Eulerian simulation is conducted. The energy loss during the Lagrangian simulation is not considered in the energy balance, which plays only a role in the early phase of the Eulerian simulation, but becomes negligible as time goes on, since the irradiated energy become much larger. The cylindrical simulation box has a fixed size of 950 µm (𝑧) × 500 µm (𝑟) and mesh points are unequally spaced 350 (𝑧) × 150 (𝑟). The axial direction extents from -50 µm to +900 µm, to allow for ablation on the target, which is located at 𝑧 < 0 µm (Fig. 100 (a)). The initial condition of the target is Au of 50 µm thickness at 0.025 eV (room temperature) and 19.32 g/cm3 density (Fig. 100(b)). The surrounding region in front of the target is assumed to be vacuum, but due to the simulation requirements, it is simulated with 3.388×10⁻⁶ g/cm3 Au density and a temperature for electrons and ions of 0.025 eV.
Fig. 100: (a) Eulerian grid, unequally spaced with total dimensions 950 µm (z) × 50 µm (r) and (b) the target position of solid Au with laser incidence. Note, that this geometry is chosen for illustrative purposes, the actual gas-field experiment was conducted under 45° beam incidence with respect to the target normal.
However, the simulation code does not incorporate the gas-field so far. The development of a suitable code is under progress. The applied radiative emissivity and opacity table are built upon a local thermodynamic equilibrium state (LTE) and collisional-radiative equilibrium mixed model for photon energy range of ℎ𝜈 = 0-5 keV with the interval of ∆ℎ𝜈 = 5 eV. In order to save calculation time for solving the radiation transport equation, which is typically on the order of more than one full day, the energy groups of the photons used in the radiation hydrodynamic simulation are roughened down to 30 groups in unequal intervals within 0-4 keV in order to obtain the spatiotemporal density and temperature profiles.
108
3.3.2 Ray-Tracing Method This method is not available for the gas-field experiment, but it is a useful tool to simulate the emission size, emission spectrum and self-absorption in the context of radiation-hydrodynamics as will be seen in the next chapter, and is thus presented in this section. Basically, the ray-tracing allows one to obtain information about the spectrum including self-absorption, which is determined by the balance the difference between emissivity and absorption coefficient.
a. Radiative processes in plasma and their cross sections The basic radiative processes in a plasma can be described via the reaction equations as given in Table 11.
Table 11: Radiative processes in plasmas. The asterisk denotes an excited state and the apostrophe a change in kinetic energy.
Radiative Process Equation Description Free-free (ff)
𝐴𝑍+ + 𝑒− ↔ 𝐴𝑍+ + 𝑒−‘ + ℎ𝜈 → Bremsstrahlung ← Inverse Bremsstrahlung
Bound-free / free-bound (bf / fb)
𝐴𝑍+ + 𝑒− ↔ 𝐴(𝑍−1)+ + ℎ𝜈 → Radiative Recombination ← Photo-Ionization
Bound-bound (bb)
𝐴𝑍+∗ ↔ 𝐴𝑍+ + ℎ𝜈 → Radiative Decay ← Photo-Excitation
Rates from state 𝐴 to state 𝐵 and vice versa are expressed by Fermi’s golden rule (Eqs. (3-23) and (3-24). The principle of detailed balance is applicable, if micro-reversability can be assumed,
𝑅(𝐴→𝐵)
𝑅(𝐵→𝐴)=
d𝑍𝐵(𝐸)/d𝐸
d𝑍𝐴(𝐸)/d𝐸 . (3-22)
It connects absorption and emission processes. d𝑍/d𝐸 is the final number of states 𝑍 per unit energy 𝐸 and the term in brackets the interaction matrix element.
𝑅(𝐴 → 𝐵) =2𝜋
ħ|⟨𝐵|𝐻int|𝐴⟩|2d𝑍𝐵(𝐸)/d𝐸 , (3-23)
𝑅(𝐵 → 𝐴) =2𝜋
ħ|⟨𝐴|𝐻int|𝐵⟩|2d𝑍𝐴(𝐸)/d𝐸 . (3-24)
The computation of the ratio of two processes linked via micro-reversibility depends only upon the density of final states. A brief overview of such states is given in Table 12. The volume 𝑉 equals inverse density 1/𝑛. As for the photon, that volume can be imagined as the cubic of the resonator length valid for a standing wave, since for other configurations, the wave could not exist. An overview of cross sections 𝜎 for radiative processes is given in Table 13. By using the relation of Einstein coefficients,
109
𝐴(𝑛’ − 𝑛) = 𝐵(𝑛 − 𝑛’)8𝜋ℎ𝑣3
𝑐3
𝑔𝑛
𝑔𝑛′ , (3-25)
where the Einstein coefficient 𝐴 is related to the spontaneous emission, and the Einstein coefficient 𝐵 to the absorption and induced emission, which is considered as negative absorption. 𝐴 is given by,
𝐴𝑛𝑛′ =64𝜋4
3
𝜈𝑛𝑛′3
ℎ𝑐3{
1
𝑔𝑛∑ (𝑛′𝛼′|𝒅|𝑛, 𝛼)
2𝛼𝛼′ } , (3-26)
with 𝛼 and 𝛼′ being quantum numbers, 𝑛 and 𝑛’ are quantum levels, and 𝒅 represents the matrix element of the dipole moment, and 𝑔𝑛 is the statistical weight of the 𝑛th level.
Table 12: Density of states of photons and electrons for free and bound condition [47].
Final state Density of states
Non-relativistic free electron d𝑍(𝐸e)
d𝐸e=
8𝜋𝑉e𝑝e2
ℎ3𝑣e
Photon d𝑍(ℎ𝜈)
dℎ𝜈=
8𝜋𝑉ν𝜈2
ℎ𝑐3
Bound electron (bb) (emission / excitation)
𝑔𝑛d𝑍(ℎ𝜈)
dℎ𝜈
𝑔𝑛′
𝛤=
𝑔𝑛′𝑢ν𝑉ν
ℎ2𝜈
Bound electron (fb / bf) (emission / ionization)
𝑛e𝑣ed𝑍(𝐸e)
d𝐸e 𝑛ν𝑐
d𝑍(ℎ𝜈)
dℎ𝜈
Where 𝛤 represents the line width, 𝑢ν the energy density, and 𝑉ν the volume occupied by photons.
Table 13: Semi-classical cross section and opacity of radiative processes, where shielding effects are not considered [47].
Cross section Opacity
𝜎(𝐸 → 𝐸∗) = ∫32𝜋2𝑍𝑖
2𝑒6
3√3𝑚e2𝑐3𝑣e
2ℎ𝜈d𝜈 𝜅ν
ff = 2.78𝑍𝑖
3𝜌
𝐴2√𝑇e(ℎ𝜈)3
cm2
g
𝜎(𝐸 → 𝑛, ℎ𝜈) =8𝜋
3√3𝛼f
3𝑎B2 𝐸A
𝐸
𝐸A
ℎ𝜈
𝑄𝑛4
𝑛3 (1 −𝑃𝑛
2𝑛2) N/A
𝜎(𝑛, ℎ𝜈 → 𝐸) =64𝜋
3√3𝛼f
𝑛𝑎B2
𝑄𝑛2 (
𝑄𝑛2𝐸A
2𝑛2
1
ℎ𝜈)
3
𝑃𝑛 𝜅νbf = 12.0
𝑄𝑛4
𝐴𝑛5(ℎ𝜈)3 𝑃𝑛cm2
g
𝜎(𝑛′ → 𝑛, ℎ𝜈) =8𝜋𝜈2
𝑐2
𝑔𝑛
𝑔𝑛′
32
3𝜋√3
𝑄𝑛4𝑄
𝑛′2
𝑛5𝑛′3
× (𝐸A
2(𝐸𝑛′−𝐸𝑛))
3
𝑃𝑛 (1 −𝑃
𝑛′
2𝑛′2) N/A
110
Cross section Opacity
𝜎(𝑛, ℎ𝜈 → 𝑛′) =𝜋𝑒2
𝑚e𝐶
32
3𝜋√3
𝑄𝑛4𝑄
𝑛′2
𝑛5𝑛′3
× (𝐸A
2(𝐸𝑛′−𝐸𝑛))
3
𝑃𝑛 (1 −𝑃
𝑛′
2𝑛′2)
𝜅νbb = 6.6 × 10⁴ 32
3𝜋√3
𝑄𝑛4𝑄
𝑛′2
𝑛5𝑛′3
× (𝐸A
2(𝐸𝑛′−𝐸𝑛))
3
𝑃𝑛 (1 −𝑃
𝑛′
2𝑛′2)
×𝐿(ℎ𝜈)
𝐴
cm2
g
Where 𝛼𝑓 stands for the fine structure constant equal to 2𝜋𝑒2/ℎ𝑐, 𝛼B the Bohr radius, equal to ℎ2/2𝜋𝑚e𝑒2, and 𝑄𝑛 and 𝑄𝑛′ the unscreened charges in orbit 𝑛 and 𝑛’. For hydrogen-like ions 𝑄𝑛 = 𝑍 and 𝐸𝑛/𝐸𝐴 = −𝑍2/2𝑛2 . 𝑃𝑛 and 𝑃𝑛′ represent the occupation numbers of level 𝑛 and 𝑛’. The frequency-dependent total absorption coefficient 𝜅′(𝜈) can be expressed as the ratio of the emission coefficient 휀ν (often 휂𝜈) and the intensity of the equilibrium radiation field 𝐼ν =𝐵ν(𝑇) given by Planck, valid for a refractive index greater than unity [144]. The prime indicates that the absorption coefficient takes scattering and stimulated emission into account. From Kirchhoff’s law (Eq. (3-27)) it becomes clear, that the spectral intensity of Planck’s blackbody radiation gives the upper limit of any natural radiation, may it be caused by free-free, free-bound, or bound-bound transitions. As the emission becomes zero, the absorption also vanishes, and as the emission approaches the blackbody intensity, the absorption becomes unity.
𝜅′(𝜈)[m−1] =𝜀ν
𝐵ν(𝑇)=
𝜀ν
2ℎ𝜈3
𝑐2 (𝑒−
ℎ𝜈𝑘B𝑇e−1)
. (3-27)
Scattering is not treated in Star2D or ray-tracing, since the absorption processes dominate. The backward propagation and absorption of reflected light from the critical surface is considered.
b. Line broadening mechanism The spectral line broadening caused by Doppler shift can be Gaussian if based on Maxwellian velocity distribution [139] and dictates the line shape 𝐿(ℎ𝜈) given by [47],
𝐿(ℎ𝜈) =√𝐴𝑚p𝑐2
𝐸𝑛𝑛′√2𝜋𝑘B𝑇i𝑒
− (𝐸𝑛𝑛′−ℎ𝜈)2
2𝛤𝐷2 , (3-28)
while the treatment of Stark broadening ∆𝜆 is more complicated, especially for the heavier elements. Griem conducted encompassing work in that field and tabulated the parameters 𝛼 and 𝜔 for various temperatures and Z-numbers. However, his work is limited to the spectral regime between UV-light and IR-light, excluding X-ray wavelengths. The total half-width of atomic lines is approximately given by [142],
111
∆𝜆1/2[nm] = 2 [1 + 1.75 × 10⁻⁴𝑁e
1
4𝛼 (1 − 0.068𝑁e
1
6𝑇−1
2)]
× 10−17𝜔𝑁e . (3-29)
Stark broadening plays a substantial role in dense high-Z plasma, while Doppler broadening becomes important for hot low-Z plasma. The natural line width of a dipole-oscillator is determined by its interaction with the radiation field or the vacuum, causing the excited atomic states to be no longer strictly stationary so that the radiation decays exponentially over time at a rate 𝛾, yielding a Lorentzian profile 𝐼(𝜔) [145],
𝐼(𝜔)𝑑𝜔 =𝛾
2𝜋
1
(𝜔−𝜔0)2+(𝛾/2)2 𝑑𝜔 , (3-30)
The natural broadening is almost always inferior to the other pre-mentioned broadening mechanisms, and often neglected. The plasma radiation hydrodynamics depend on the total absorption coefficient 𝜅ν
tot,
𝜅νtot = 𝜅ν
ff + 𝜅νbf + 𝜅ν
bb , (3-31)
which yields the frequency-averaged Planck mean opacity to describe high-density plasma as encountered in stellar interiors or inertial confinement fusion (ICF). To make the opacity sensitive to spectral windows in the photon absorption, the Rossland mean opacity is used. Both opacity styles are incorporated in the SESAME EOS. In general, the low opacity regime dominates the transport of radiation. Here, the Rossland mean opacity becomes more important for an accurate description.
c. Radiative transfer Using the spatial profiles obtained at each 0.1 ns time step and the original emissivity and opacity table consisting of 1000 hν-groups within and without the WW-region, the one-dimensional (1D) ray tracing simulation is carried out. The radiation transfer equation is solved in the direction parallel to the target surface at various 𝑧-positions in order to obtain the radiation emission profiles as seen through a titanium-filter of 500 µm thickness and without filter. The z-position follows in 3D-space the vertical ordinate 𝑧. The equation of radiative transfer is given in the following by,
d𝐼ν(𝑧)
d𝑧= 휀ν(𝑧) − 𝜅′(𝜈, 𝑧)𝐼ν(𝑧) , (3-32)
𝐼ν(𝑧0) = 𝐼ν(0)𝑒− ∫ 𝜅′(𝜈,𝑧)d𝑧𝑧0
0 + ∫ 휀ν(𝑧)𝑒− ∫ 𝜅′(𝜈,𝑧)d𝑧𝑧0
0 d𝑧𝑧0
0 , (3-33)
with 𝐼(0) ≠ 0 signifies that the intensity 𝐼(0) originates outside the plasma. The coefficients for emission and absorption are taken from a table developed by Sunahara et al. [182] [167] [168]. Integration is done for each grid cell, while the coefficients for emission and absorption are selected individually in accordance with the EOS. The relative weakening of a parallel ray along a path element d𝑧 is proportional to this element as given by,
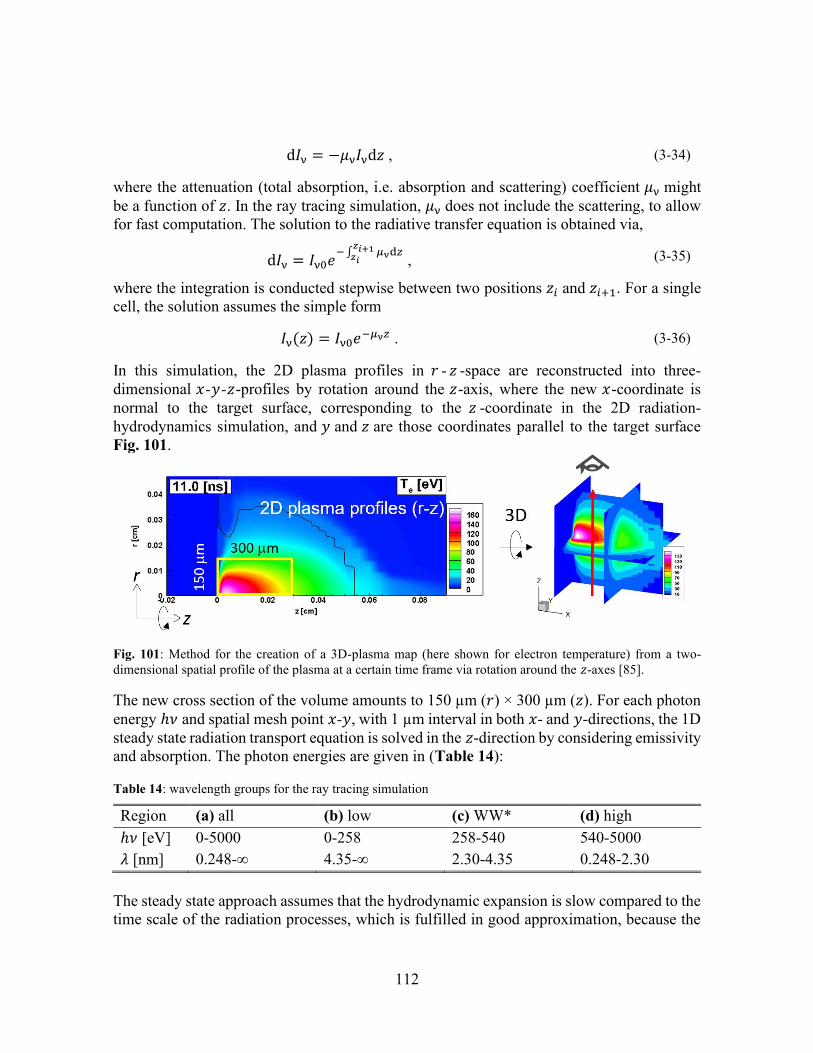
112
d𝐼ν = −𝜇ν𝐼νd𝑧 , (3-34)
where the attenuation (total absorption, i.e. absorption and scattering) coefficient 𝜇ν might be a function of 𝑧. In the ray tracing simulation, 𝜇ν does not include the scattering, to allow for fast computation. The solution to the radiative transfer equation is obtained via,
d𝐼ν = 𝐼ν0𝑒− ∫ 𝜇νd𝑧
𝑧𝑖+1𝑧𝑖 , (3-35)
where the integration is conducted stepwise between two positions 𝑧𝑖 and 𝑧𝑖+1. For a single cell, the solution assumes the simple form
𝐼ν(𝑧) = 𝐼ν0𝑒−𝜇ν𝑧 . (3-36)
In this simulation, the 2D plasma profiles in 𝑟 - 𝑧 -space are reconstructed into three-dimensional 𝑥-𝑦-𝑧-profiles by rotation around the 𝑧-axis, where the new 𝑥-coordinate is normal to the target surface, corresponding to the 𝑧 -coordinate in the 2D radiation-hydrodynamics simulation, and 𝑦 and 𝑧 are those coordinates parallel to the target surface Fig. 101.
Fig. 101: Method for the creation of a 3D-plasma map (here shown for electron temperature) from a two-dimensional spatial profile of the plasma at a certain time frame via rotation around the 𝑧-axes [85].
The new cross section of the volume amounts to 150 µm (𝑟) × 300 µm (𝑧). For each photon energy ℎ𝜈 and spatial mesh point 𝑥-𝑦, with 1 µm interval in both 𝑥- and 𝑦-directions, the 1D steady state radiation transport equation is solved in the 𝑧-direction by considering emissivity and absorption. The photon energies are given in (Table 14):
Table 14: wavelength groups for the ray tracing simulation
Region (a) all (b) low (c) WW* (d) high ℎ𝜈 [eV] 0-5000 0-258 258-540 540-5000 𝜆 [nm] 0.248-∞ 4.35-∞ 2.30-4.35 0.248-2.30
The steady state approach assumes that the hydrodynamic expansion is slow compared to the time scale of the radiation processes, which is fulfilled in good approximation, because the
113
expansion time is on the order of 5×10⁴ m/s (equals 500 nm/ps) [4], while the time of radiation to pass through the plasma volume of ~30 µm via forward scattering events is defined by the light speed in vacuum (300 µm/ps), which yields ~100 fs, and the time needed for absorption and reemission in the forward photon-scattering, which might be on the order of sub-fs, depending on the details of the ionic configuration [183]. Taking an emitter-density of 1021 /cm3 and, for simplicity, the reported cross section for photo-absorption in neutral Au of 3×10-18 cm2 [184], which gives 1000 events/cm (3 events/30 µm), yielding an negligible amount. Thus, the total radiation transport speed yields approximately 30 µm/100 fs (equals ~30 µm/ps), which is more than 50× faster than the expansion. The radiation transport equation is solved for all 220 timeframes. In the cases where the radiative processes occur on much shorter timescale than the plasma expansion, the stationary non-LTE approach is applicable. The simulation can be run with and without opacity data, revealing the contribution of self-absorption in the WW-spectrum.
3.3.3 Collisional-Radiative Model While the Boltzmann distribution describes the population density of excited and ground state in an atom or ion, the Saha ionization equation describes on the other hand the population density of two subsequent ion charge states, i.e. the ionization in dependence of the electron temperature. Combining these two equations, the Saha-Boltzmann equation is obtained, which provides great use in spectroscopy, since line intensities of subsequent ionic stages can easily be related to the electron temperature and densities in these levels and the involved transition probabilities [185]. Together with the Boltzmann equation, which describes the statistical behavior of a thermodynamic system, and Planck’s law of blackbody radiation, these five equations assume complete TE in a plasma. The CR-model is employed, in order to determine the ion density and population density of the excited states, while the Corona model and LTE-model are used to describe a radiation-dominated plasma and a collision-dominated plasma, respectively. It is thus an intermediate regime model, where collisional and radiative processes need to be taken in account. This model requires calculation of density and temperature-dependent rate coefficients, to give a statement on the ion density and population density. These include electron impact excitation, electron impact deexcitation, Einstein coefficient 𝐴, electron impact ionization, three-body recombination, and radiative recombination. The consideration of autoionization plays an important role, which is necessary to receive reasonable results for multicharged ion systems [165]. On the other hand, the photo-absorption processes are not considered, because they play a minor role in the intermedium regime. Furthermore, this model assumes Boltzmann statistics for the population of levels and ignores free-free processes. The rate equation for the temporal evolution of the population in level 𝑝 is described as:
d
d𝑡𝑛(𝑝) = ∑ 𝐶(𝑞, 𝑝)𝑛e𝑛(𝑞) − {[∑ 𝐹(𝑝, 𝑞) + ∑ 𝐶(𝑝, 𝑞) +𝑞>𝑝𝑞<𝑝𝑞<𝑝
𝑆(𝑝)]𝑛e + ∑ 𝐴(𝑝, 𝑞)𝑞<𝑝 }𝑛(𝑝) + ∑ [𝐹(𝑞, 𝑝)𝑛e + 𝐴(𝑞, 𝑝)𝑛(𝑞)] +𝑞>𝑝
[𝛼(𝑝)𝑛e + 𝛽(𝑝)]𝑛𝑧𝑛e ,
(3-37)
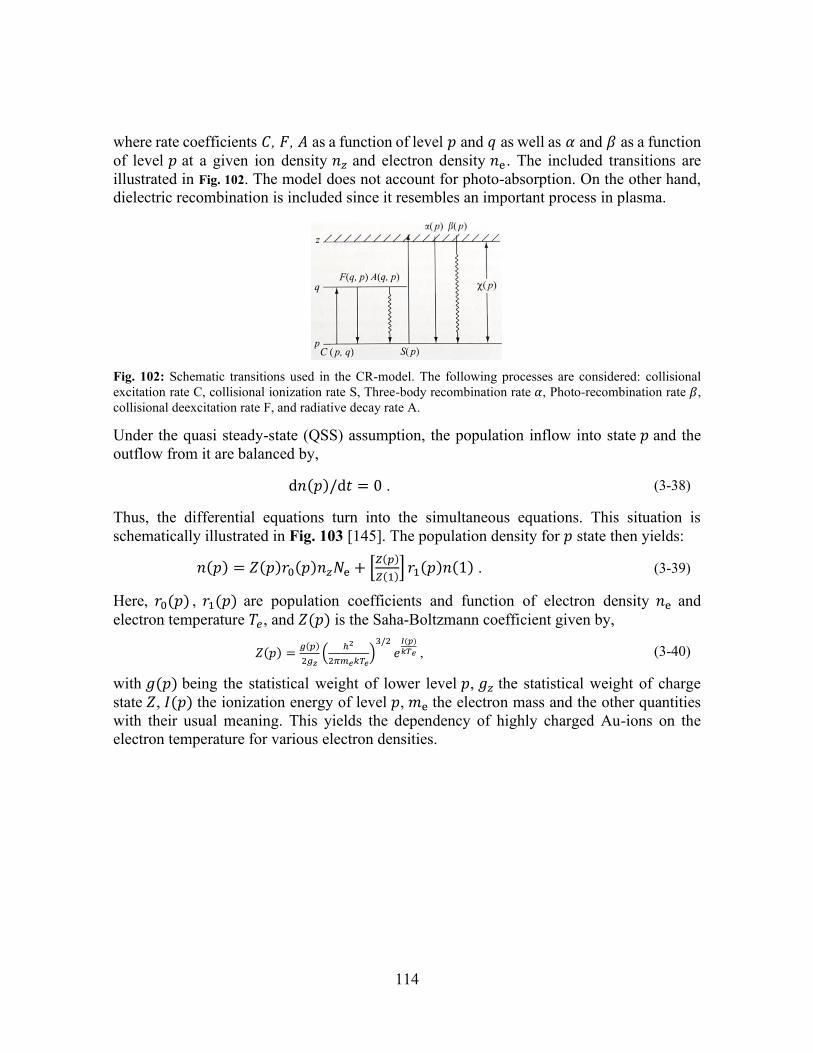
114
where rate coefficients 𝐶, 𝐹, 𝐴 as a function of level 𝑝 and 𝑞 as well as 𝛼 and 𝛽 as a function of level 𝑝 at a given ion density 𝑛𝑧 and electron density 𝑛e . The included transitions are illustrated in Fig. 102. The model does not account for photo-absorption. On the other hand, dielectric recombination is included since it resembles an important process in plasma.
Fig. 102: Schematic transitions used in the CR-model. The following processes are considered: collisional excitation rate C, collisional ionization rate S, Three-body recombination rate 𝛼, Photo-recombination rate 𝛽, collisional deexcitation rate F, and radiative decay rate A.
Under the quasi steady-state (QSS) assumption, the population inflow into state 𝑝 and the outflow from it are balanced by,
d𝑛(𝑝)/d𝑡 = 0 . (3-38)
Thus, the differential equations turn into the simultaneous equations. This situation is schematically illustrated in Fig. 103 [145]. The population density for 𝑝 state then yields:
𝑛(𝑝) = 𝑍(𝑝)𝑟0(𝑝)𝑛𝑧𝑁e + [𝑍(𝑝)
𝑍(1)] 𝑟1(𝑝)𝑛(1) . (3-39)
Here, 𝑟0(𝑝) , 𝑟1(𝑝) are population coefficients and function of electron density 𝑛e and electron temperature 𝑇𝑒, and 𝑍(𝑝) is the Saha-Boltzmann coefficient given by,
𝑍(𝑝) =𝑔(𝑝)
2𝑔𝑧(
ℎ2
2𝜋𝑚𝑒𝑘𝑇𝑒)
3/2
𝑒𝐼(𝑝)
𝑘𝑇𝑒 , (3-40)
with 𝑔(𝑝) being the statistical weight of lower level 𝑝, 𝑔𝑧 the statistical weight of charge state 𝑍, 𝐼(𝑝) the ionization energy of level 𝑝, 𝑚e the electron mass and the other quantities with their usual meaning. This yields the dependency of highly charged Au-ions on the electron temperature for various electron densities.
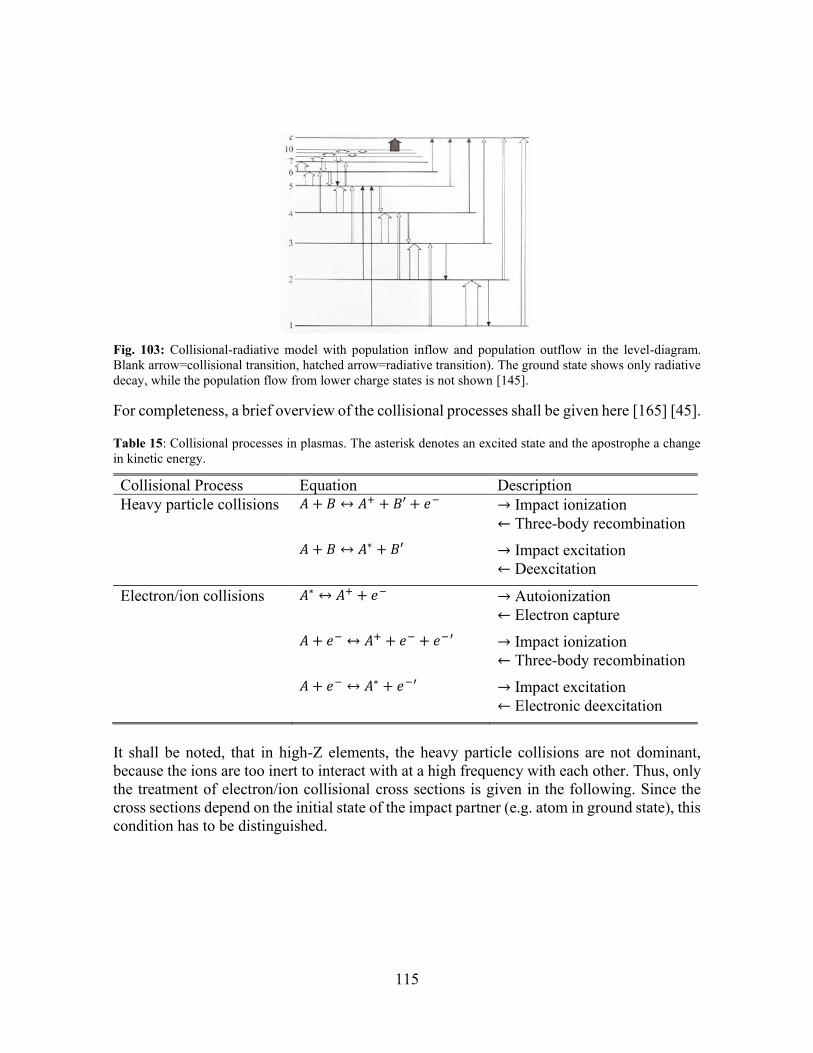
115
Fig. 103: Collisional-radiative model with population inflow and population outflow in the level-diagram. Blank arrow=collisional transition, hatched arrow=radiative transition). The ground state shows only radiative decay, while the population flow from lower charge states is not shown [145].
For completeness, a brief overview of the collisional processes shall be given here [165] [45].
Table 15: Collisional processes in plasmas. The asterisk denotes an excited state and the apostrophe a change in kinetic energy.
Collisional Process Equation Description Heavy particle collisions 𝐴 + 𝐵 ↔ 𝐴+ + 𝐵′ + 𝑒− → Impact ionization
← Three-body recombination 𝐴 + 𝐵 ↔ 𝐴∗ + 𝐵′ → Impact excitation
← Deexcitation
Electron/ion collisions 𝐴∗ ↔ 𝐴+ + 𝑒− → Autoionization ← Electron capture
𝐴 + 𝑒− ↔ 𝐴+ + 𝑒− + 𝑒−′ → Impact ionization ← Three-body recombination
𝐴 + 𝑒− ↔ 𝐴∗ + 𝑒−′ → Impact excitation ← Electronic deexcitation
It shall be noted, that in high-Z elements, the heavy particle collisions are not dominant, because the ions are too inert to interact with at a high frequency with each other. Thus, only the treatment of electron/ion collisional cross sections is given in the following. Since the cross sections depend on the initial state of the impact partner (e.g. atom in ground state), this condition has to be distinguished.
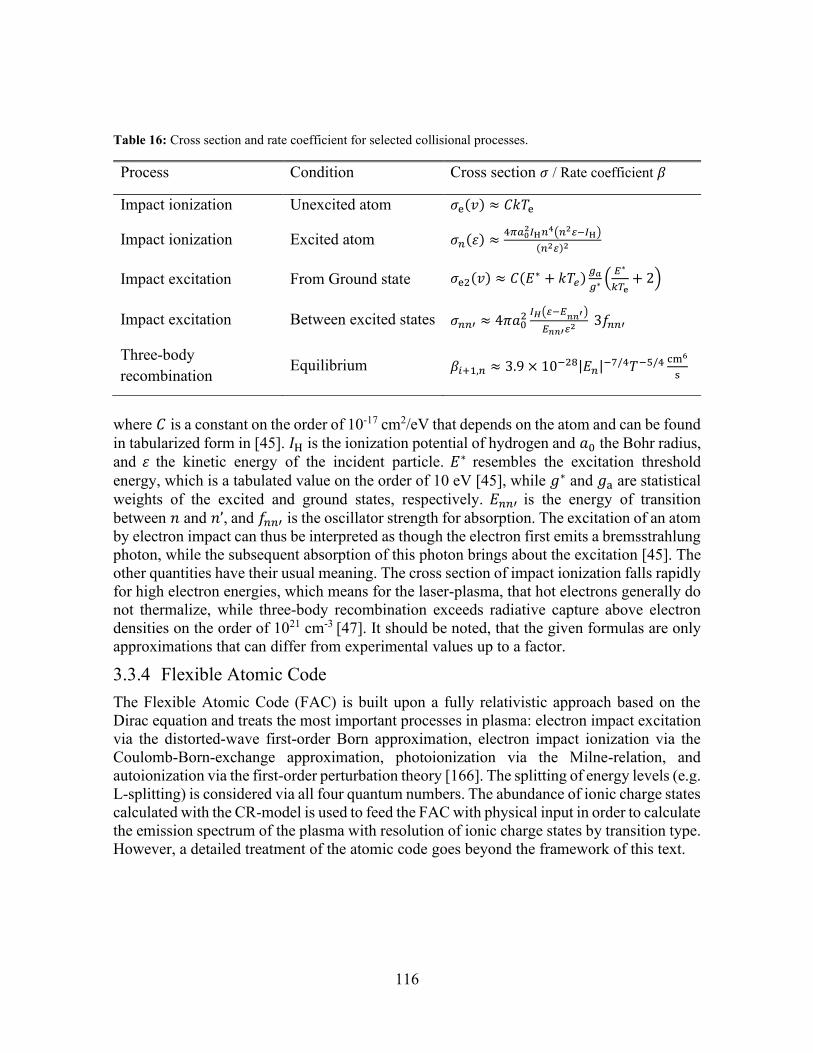
116
Table 16: Cross section and rate coefficient for selected collisional processes.
Process Condition Cross section 𝜎 / Rate coefficient 𝛽
Impact ionization Unexcited atom 𝜎e(𝑣) ≈ 𝐶𝑘𝑇e
Impact ionization Excited atom 𝜎𝑛(휀) ≈4𝜋𝑎0
2𝐼H𝑛4(𝑛2𝜀−𝐼H)
(𝑛2𝜀)2
Impact excitation From Ground state 𝜎e2(𝑣) ≈ 𝐶(𝐸∗ + 𝑘𝑇𝑒)𝑔𝑎
𝑔∗ (𝐸∗
𝑘𝑇e+ 2)
Impact excitation Between excited states 𝜎𝑛𝑛′ ≈ 4𝜋𝑎02 𝐼𝐻(𝜀−𝐸
𝑛𝑛′)
𝐸𝑛𝑛′𝜀2 3𝑓𝑛𝑛′
Three-body recombination Equilibrium 𝛽𝑖+1,𝑛 ≈ 3.9 × 10⁻²⁸|𝐸𝑛|−7/4𝑇−5/4 cm6
s
where 𝐶 is a constant on the order of 10-17 cm2/eV that depends on the atom and can be found in tabularized form in [45]. 𝐼H is the ionization potential of hydrogen and 𝑎0 the Bohr radius, and 휀 the kinetic energy of the incident particle. 𝐸∗ resembles the excitation threshold energy, which is a tabulated value on the order of 10 eV [45], while 𝑔∗ and 𝑔a are statistical weights of the excited and ground states, respectively. 𝐸𝑛𝑛′ is the energy of transition between 𝑛 and 𝑛’, and 𝑓𝑛𝑛′ is the oscillator strength for absorption. The excitation of an atom by electron impact can thus be interpreted as though the electron first emits a bremsstrahlung photon, while the subsequent absorption of this photon brings about the excitation [45]. The other quantities have their usual meaning. The cross section of impact ionization falls rapidly for high electron energies, which means for the laser-plasma, that hot electrons generally do not thermalize, while three-body recombination exceeds radiative capture above electron densities on the order of 1021 cm-3 [47]. It should be noted, that the given formulas are only approximations that can differ from experimental values up to a factor.
3.3.4 Flexible Atomic Code The Flexible Atomic Code (FAC) is built upon a fully relativistic approach based on the Dirac equation and treats the most important processes in plasma: electron impact excitation via the distorted-wave first-order Born approximation, electron impact ionization via the Coulomb-Born-exchange approximation, photoionization via the Milne-relation, and autoionization via the first-order perturbation theory [166]. The splitting of energy levels (e.g. L-splitting) is considered via all four quantum numbers. The abundance of ionic charge states calculated with the CR-model is used to feed the FAC with physical input in order to calculate the emission spectrum of the plasma with resolution of ionic charge states by transition type. However, a detailed treatment of the atomic code goes beyond the framework of this text.
117
3.4 Results and discussion
3.4.1 Experimental results a. Nitrogen gas-field
X-ray spectra from Au plasma have been measured for various nitrogen gas pressures (Fig. 104(a)). These spectra feature a dip, which can be attributed to the nitrogen absorption K-edge, occurring at 3.02 nm (except for 0-Pa). The spectral intensity at 50 Pa and 100 Pa is slightly below the 0-Pa spectrum, while the spectra for pressure levels above 320 Pa clearly show an increase over the 0-Pa spectrum with increasing gas pressure, especially in the WW-region. The X-ray transmission of molecular nitrogen is given for selected pressures in Fig. 104(b). The calibrated X-ray yield has been determined under distinct conditions, namely, at 2.73 nm, 3.11 nm (Fig. 105), and weighted over the WW-region (Fig. 106). The X-ray yield is normalized to vacuum condition (0 Pa). First, we examine the 3.11-nm line19 , because efficient X-ray Cr/Sc-multilayer mirrors for the WW spectral region can show high reflectivity (~25%) at 3.11 nm wavelength [186]. The calibrated X-ray yield decreases up to 125 Pa, and then starts to increase until it becomes unity around 250 Pa. The X-ray yield then increases further up to a factor of 3.6 at 410 Pa (Fig. 105 (a)). For the 2.73-nm wavelength a similar trend can be observed, where the minimum X-ray yield is around 75 Pa, and becomes unity near 250 Pa. From there the X-ray yield increases until it reaches a factor 37 at 410 Pa (Fig. 105 (b)). The weighted X-ray yield within the WW (Fig. 106) first decrease up to 50 Pa, and then increase with pressure up to factor 15 at 410 Pa. It should be noted that for the region below the K-edge (e.g. 2.73 nm), small variations in the gas parameters will lead to larger differences due to the exponential dependency of transmission curve and the transmission data near the K-edge are not precisely known. The values obtained above the K-edge, however, are much less sensitive to variations and thus a reliable indicator of the enhancement.
19 Furthermore, the calibration of X-ray yield above the K-edge yields a conservative value and is less sensitive to changes in the pressure level, yielding a more robust value for the enhancement factor.
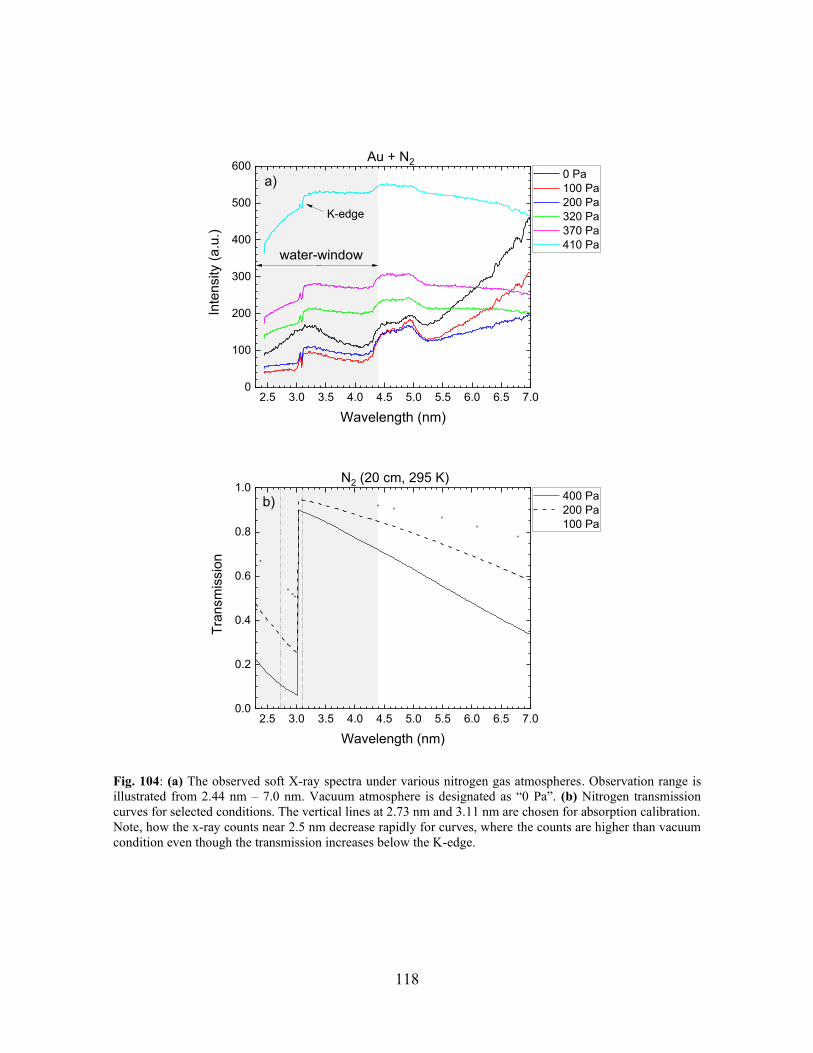
118
Fig. 104: (a) The observed soft X-ray spectra under various nitrogen gas atmospheres. Observation range is illustrated from 2.44 nm – 7.0 nm. Vacuum atmosphere is designated as “0 Pa”. (b) Nitrogen transmission curves for selected conditions. The vertical lines at 2.73 nm and 3.11 nm are chosen for absorption calibration. Note, how the x-ray counts near 2.5 nm decrease rapidly for curves, where the counts are higher than vacuum condition even though the transmission increases below the K-edge.
2.5 3.0 3.5 4.0 4.5 5.0 5.5 6.0 6.5 7.00
100
200
300
400
500
600
Wavelength (nm)
Inte
nsity
(a.u
.)
0 Pa 100 Pa 200 Pa 320 Pa 370 Pa 410 Pa
Au + N2
a)
water-window
K-edge
2.5 3.0 3.5 4.0 4.5 5.0 5.5 6.0 6.5 7.00.0
0.2
0.4
0.6
0.8
1.0 400 Pa 200 Pa 100 Pa
Tran
smis
sion
Wavelength (nm)
b)
N2 (20 cm, 295 K)
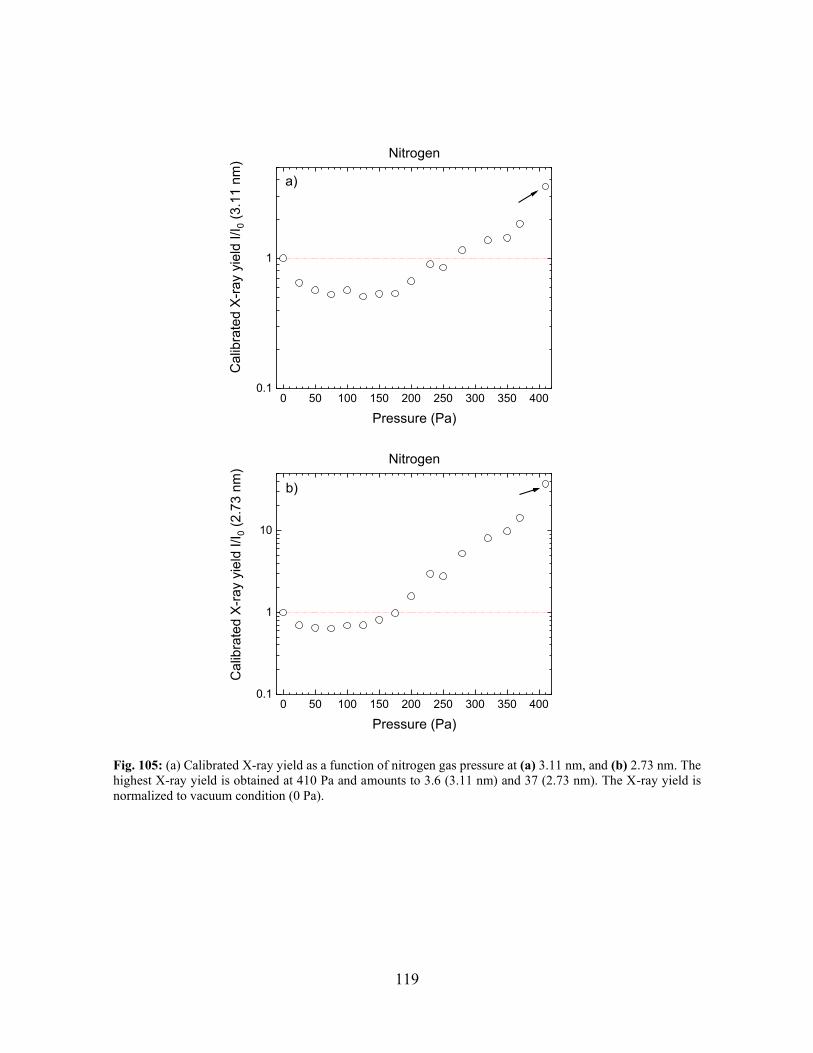
119
Fig. 105: (a) Calibrated X-ray yield as a function of nitrogen gas pressure at (a) 3.11 nm, and (b) 2.73 nm. The highest X-ray yield is obtained at 410 Pa and amounts to 3.6 (3.11 nm) and 37 (2.73 nm). The X-ray yield is normalized to vacuum condition (0 Pa).
0 50 100 150 200 250 300 350 4000.1
1
Nitrogen
Cal
ibra
ted
X-ra
y yi
eld
I/I0 (
3.11
nm
)
Pressure (Pa)
a)
0 50 100 150 200 250 300 350 4000.1
1
10
Nitrogen
Cal
ibra
ted
X-ra
y yi
eld
I/I0 (
2.73
nm
)
Pressure (Pa)
b)
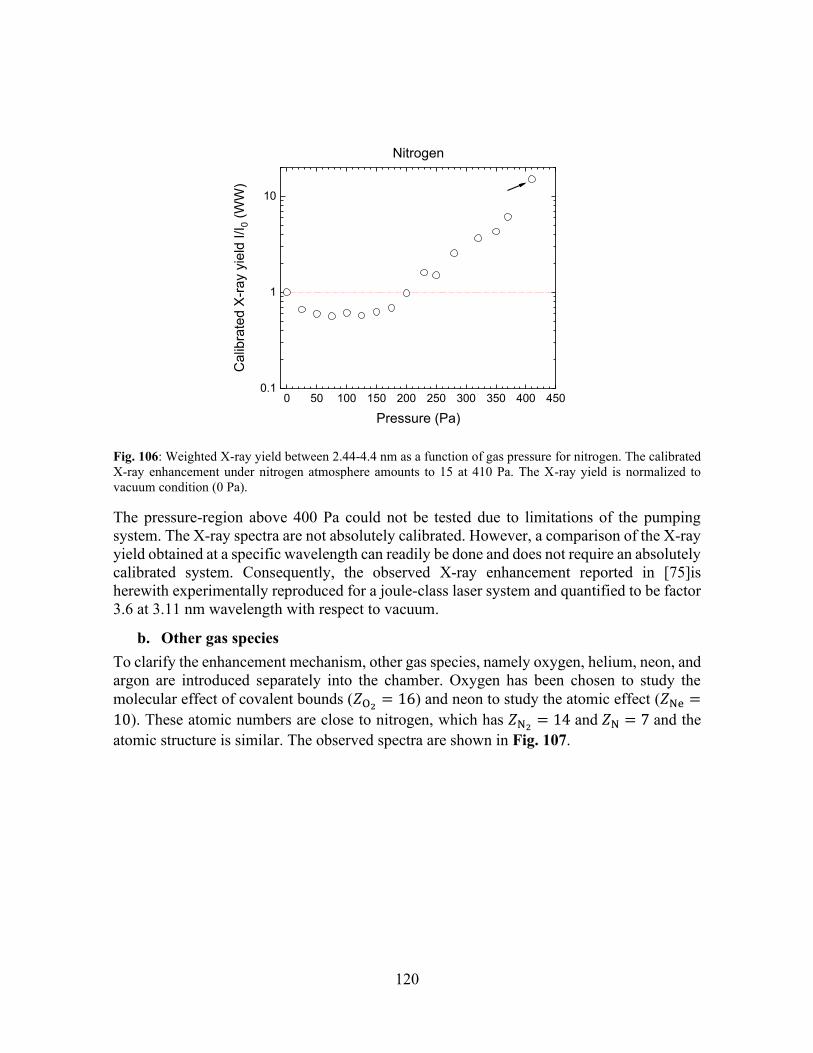
120
Fig. 106: Weighted X-ray yield between 2.44-4.4 nm as a function of gas pressure for nitrogen. The calibrated X-ray enhancement under nitrogen atmosphere amounts to 15 at 410 Pa. The X-ray yield is normalized to vacuum condition (0 Pa).
The pressure-region above 400 Pa could not be tested due to limitations of the pumping system. The X-ray spectra are not absolutely calibrated. However, a comparison of the X-ray yield obtained at a specific wavelength can readily be done and does not require an absolutely calibrated system. Consequently, the observed X-ray enhancement reported in [75]is herewith experimentally reproduced for a joule-class laser system and quantified to be factor 3.6 at 3.11 nm wavelength with respect to vacuum.
b. Other gas species To clarify the enhancement mechanism, other gas species, namely oxygen, helium, neon, and argon are introduced separately into the chamber. Oxygen has been chosen to study the molecular effect of covalent bounds (𝑍O2
= 16) and neon to study the atomic effect (𝑍Ne =
10). These atomic numbers are close to nitrogen, which has 𝑍N2= 14 and 𝑍N = 7 and the
atomic structure is similar. The observed spectra are shown in Fig. 107.
0 50 100 150 200 250 300 350 400 4500.1
1
10
Nitrogen
Cal
ibra
ted
X-ra
y yi
eld
I/I0 (
WW
)
Pressure (Pa)
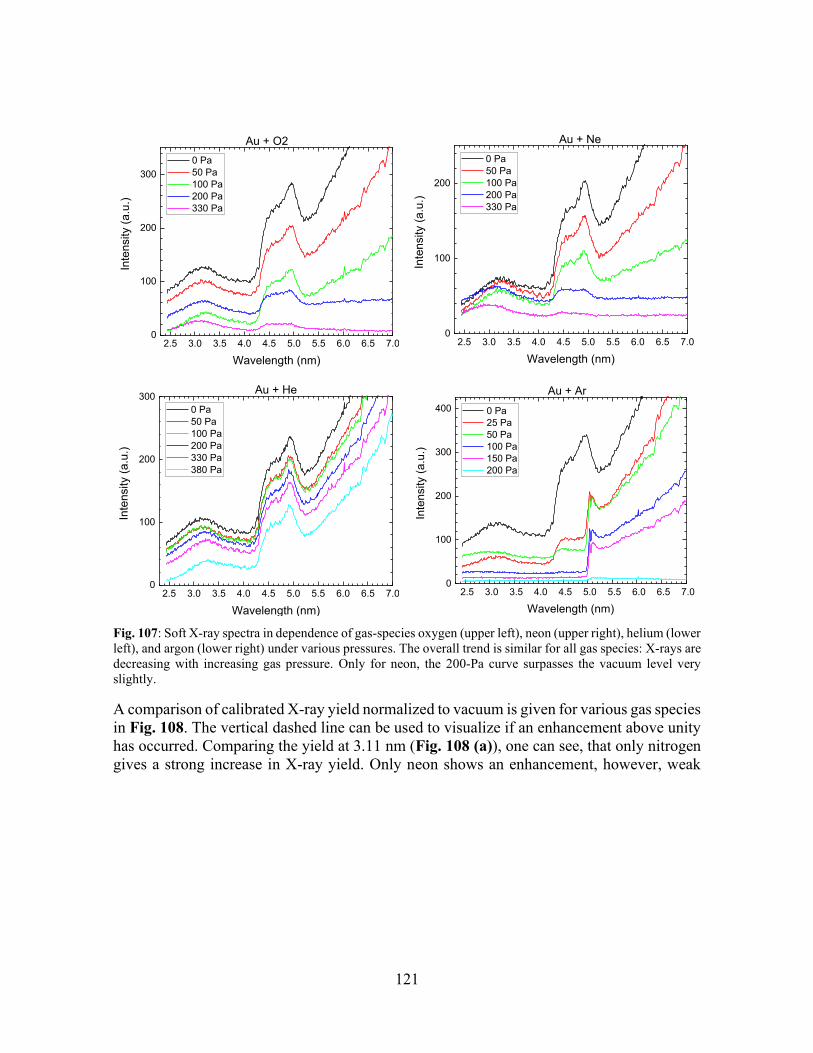
121
Fig. 107: Soft X-ray spectra in dependence of gas-species oxygen (upper left), neon (upper right), helium (lower left), and argon (lower right) under various pressures. The overall trend is similar for all gas species: X-rays are decreasing with increasing gas pressure. Only for neon, the 200-Pa curve surpasses the vacuum level very slightly.
A comparison of calibrated X-ray yield normalized to vacuum is given for various gas species in Fig. 108. The vertical dashed line can be used to visualize if an enhancement above unity has occurred. Comparing the yield at 3.11 nm (Fig. 108 (a)), one can see, that only nitrogen gives a strong increase in X-ray yield. Only neon shows an enhancement, however, weak
2.5 3.0 3.5 4.0 4.5 5.0 5.5 6.0 6.5 7.00
100
200
300
Inte
nsity
(a.u
.)
Wavelength (nm)
0 Pa 50 Pa 100 Pa 200 Pa 330 Pa
Au + O2
2.5 3.0 3.5 4.0 4.5 5.0 5.5 6.0 6.5 7.00
100
200
Inte
nsity
(a.u
.)
Wavelength (nm)
0 Pa 50 Pa 100 Pa 200 Pa 330 Pa
Au + Ne
2.5 3.0 3.5 4.0 4.5 5.0 5.5 6.0 6.5 7.00
100
200
300
Inte
nsity
(a.u
.)
Wavelength (nm)
0 Pa 50 Pa 100 Pa 200 Pa 330 Pa 380 Pa
Au + He
2.5 3.0 3.5 4.0 4.5 5.0 5.5 6.0 6.5 7.00
100
200
300
400In
tens
ity (a
.u.)
Wavelength (nm)
0 Pa 25 Pa 50 Pa 100 Pa 150 Pa 200 Pa
Au + Ar
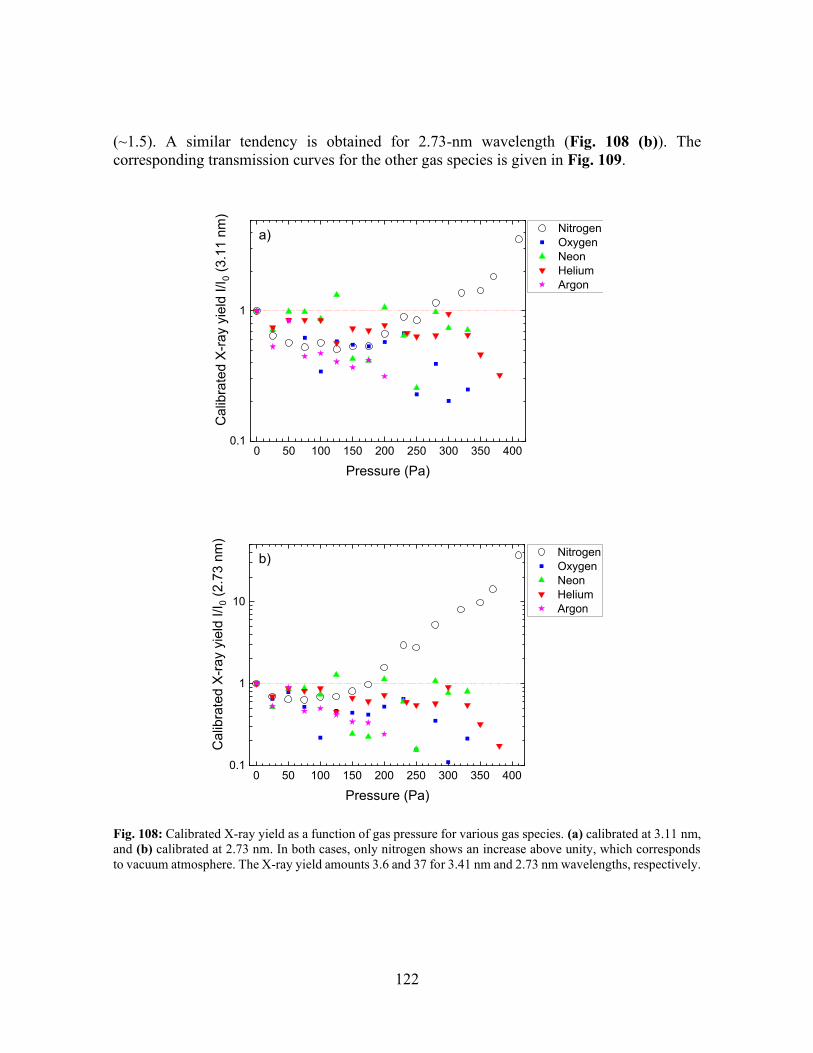
122
(~1.5). A similar tendency is obtained for 2.73-nm wavelength (Fig. 108 (b)). The corresponding transmission curves for the other gas species is given in Fig. 109.
Fig. 108: Calibrated X-ray yield as a function of gas pressure for various gas species. (a) calibrated at 3.11 nm, and (b) calibrated at 2.73 nm. In both cases, only nitrogen shows an increase above unity, which corresponds to vacuum atmosphere. The X-ray yield amounts 3.6 and 37 for 3.41 nm and 2.73 nm wavelengths, respectively.
0 50 100 150 200 250 300 350 4000.1
1
Nitrogen Oxygen Neon Helium Argon
Cal
ibra
ted
X-ra
y yi
eld
I/I0 (
3.11
nm
)
Pressure (Pa)
a)
0 50 100 150 200 250 300 350 4000.1
1
10
Nitrogen Oxygen Neon Helium Argon
Cal
ibra
ted
X-ra
y yi
eld
I/I0 (
2.73
nm
)
Pressure (Pa)
b)
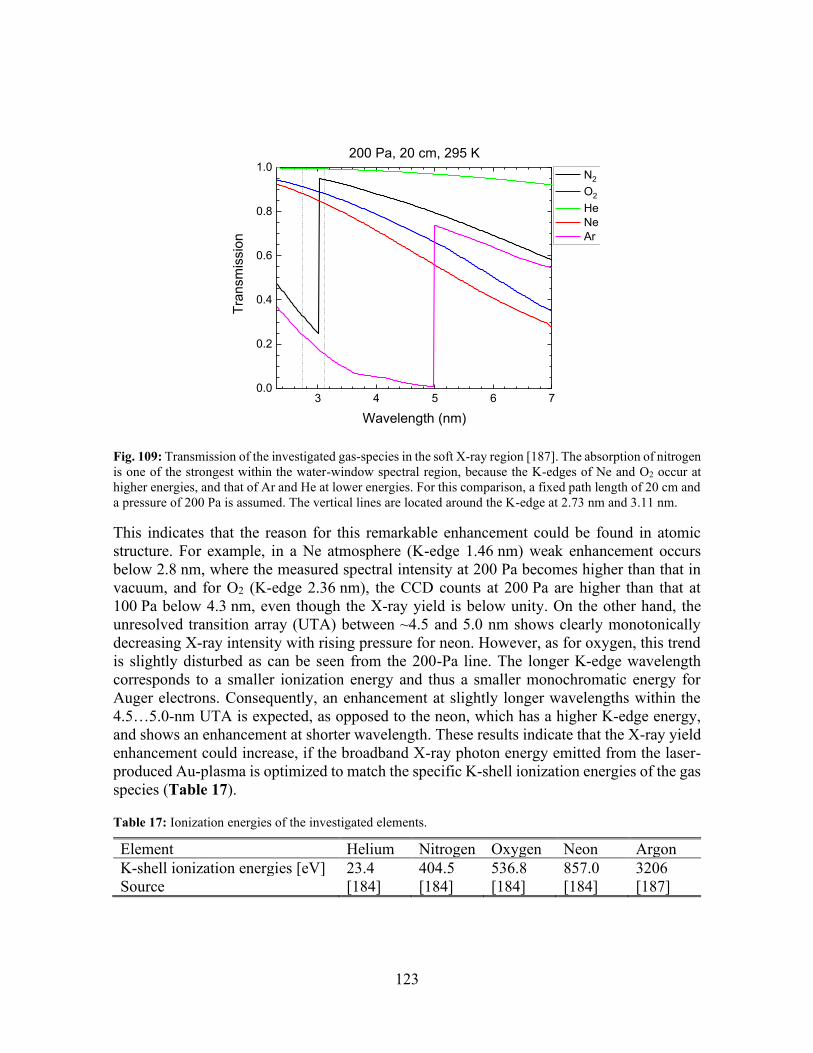
123
Fig. 109: Transmission of the investigated gas-species in the soft X-ray region [187]. The absorption of nitrogen is one of the strongest within the water-window spectral region, because the K-edges of Ne and O2 occur at higher energies, and that of Ar and He at lower energies. For this comparison, a fixed path length of 20 cm and a pressure of 200 Pa is assumed. The vertical lines are located around the K-edge at 2.73 nm and 3.11 nm.
This indicates that the reason for this remarkable enhancement could be found in atomic structure. For example, in a Ne atmosphere (K-edge 1.46 nm) weak enhancement occurs below 2.8 nm, where the measured spectral intensity at 200 Pa becomes higher than that in vacuum, and for O2 (K-edge 2.36 nm), the CCD counts at 200 Pa are higher than that at 100 Pa below 4.3 nm, even though the X-ray yield is below unity. On the other hand, the unresolved transition array (UTA) between ~4.5 and 5.0 nm shows clearly monotonically decreasing X-ray intensity with rising pressure for neon. However, as for oxygen, this trend is slightly disturbed as can be seen from the 200-Pa line. The longer K-edge wavelength corresponds to a smaller ionization energy and thus a smaller monochromatic energy for Auger electrons. Consequently, an enhancement at slightly longer wavelengths within the 4.5…5.0-nm UTA is expected, as opposed to the neon, which has a higher K-edge energy, and shows an enhancement at shorter wavelength. These results indicate that the X-ray yield enhancement could increase, if the broadband X-ray photon energy emitted from the laser-produced Au-plasma is optimized to match the specific K-shell ionization energies of the gas species (Table 17).
Table 17: Ionization energies of the investigated elements.
Element Helium Nitrogen Oxygen Neon Argon K-shell ionization energies [eV] 23.4 404.5 536.8 857.0 3206 Source [184] [184] [184] [184] [187]
3 4 5 6 70.0
0.2
0.4
0.6
0.8
1.0200 Pa, 20 cm, 295 K
Tran
smis
sion
Wavelength (nm)
N2
O2
He Ne Ar
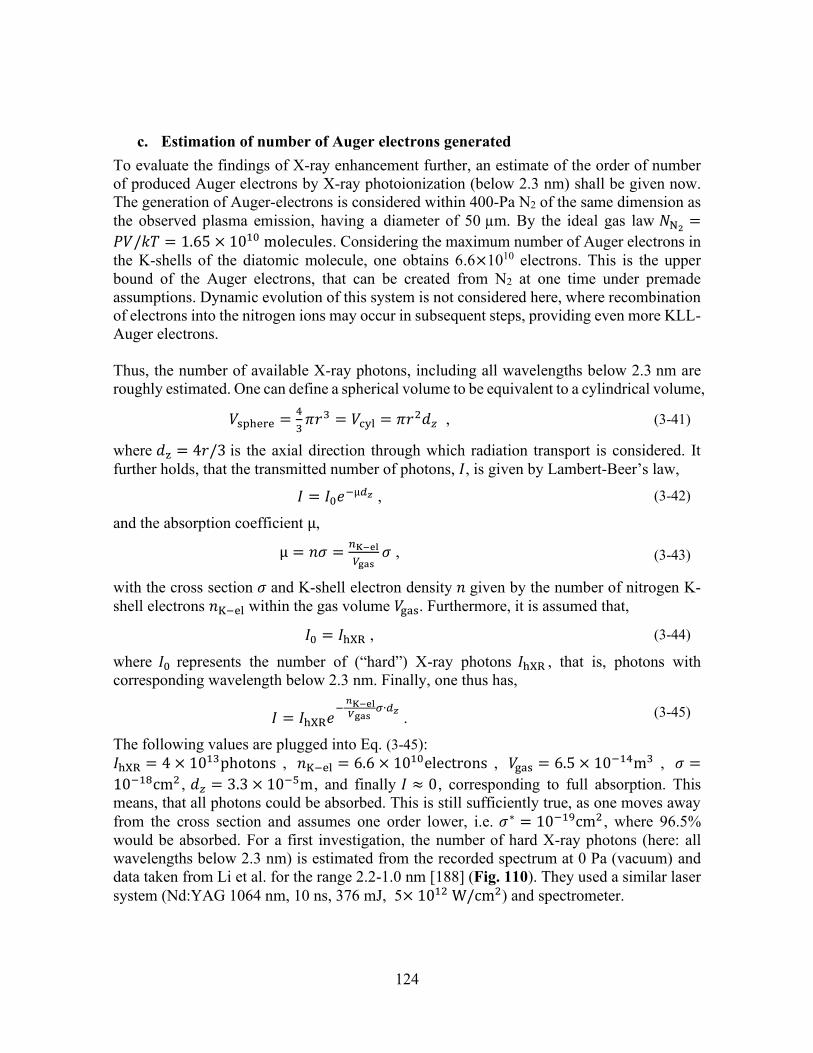
124
c. Estimation of number of Auger electrons generated To evaluate the findings of X-ray enhancement further, an estimate of the order of number of produced Auger electrons by X-ray photoionization (below 2.3 nm) shall be given now. The generation of Auger-electrons is considered within 400-Pa N2 of the same dimension as the observed plasma emission, having a diameter of 50 µm. By the ideal gas law 𝑁N2
=
𝑃𝑉/𝑘𝑇 = 1.65 × 10¹⁰ molecules. Considering the maximum number of Auger electrons in the K-shells of the diatomic molecule, one obtains 6.6×10¹⁰ electrons. This is the upper bound of the Auger electrons, that can be created from N2 at one time under premade assumptions. Dynamic evolution of this system is not considered here, where recombination of electrons into the nitrogen ions may occur in subsequent steps, providing even more KLL-Auger electrons. Thus, the number of available X-ray photons, including all wavelengths below 2.3 nm are roughly estimated. One can define a spherical volume to be equivalent to a cylindrical volume,
𝑉sphere =4
3𝜋𝑟3 = 𝑉cyl = 𝜋𝑟2𝑑𝑧 , (3-41)
where 𝑑z = 4𝑟/3 is the axial direction through which radiation transport is considered. It further holds, that the transmitted number of photons, 𝐼, is given by Lambert-Beer’s law,
𝐼 = 𝐼0𝑒−µ𝑑𝑧 , (3-42)
and the absorption coefficient µ,
µ = 𝑛𝜎 =𝑛K−el
𝑉gas𝜎 , (3-43)
with the cross section 𝜎 and K-shell electron density 𝑛 given by the number of nitrogen K-shell electrons 𝑛K−el within the gas volume 𝑉gas. Furthermore, it is assumed that,
𝐼0 = 𝐼hXR , (3-44)
where 𝐼0 represents the number of (“hard”) X-ray photons 𝐼hXR , that is, photons with corresponding wavelength below 2.3 nm. Finally, one thus has,
𝐼 = 𝐼hXR𝑒−
𝑛K−el𝑉gas
𝜎∙𝑑𝑧 . (3-45)
The following values are plugged into Eq. (3-45): 𝐼hXR = 4 × 10¹³photons , 𝑛K−el = 6.6 × 10¹⁰electrons , 𝑉gas = 6.5 × 10⁻¹⁴m3 , 𝜎 =
10−18cm2 , 𝑑𝑧 = 3.3 × 10⁻⁵m, and finally 𝐼 ≈ 0, corresponding to full absorption. This means, that all photons could be absorbed. This is still sufficiently true, as one moves away from the cross section and assumes one order lower, i.e. 𝜎∗ = 10−19cm2 , where 96.5% would be absorbed. For a first investigation, the number of hard X-ray photons (here: all wavelengths below 2.3 nm) is estimated from the recorded spectrum at 0 Pa (vacuum) and data taken from Li et al. for the range 2.2-1.0 nm [188] (Fig. 110). They used a similar laser system (Nd:YAG 1064 nm, 10 ns, 376 mJ, 5× 10¹² W/cm2) and spectrometer.
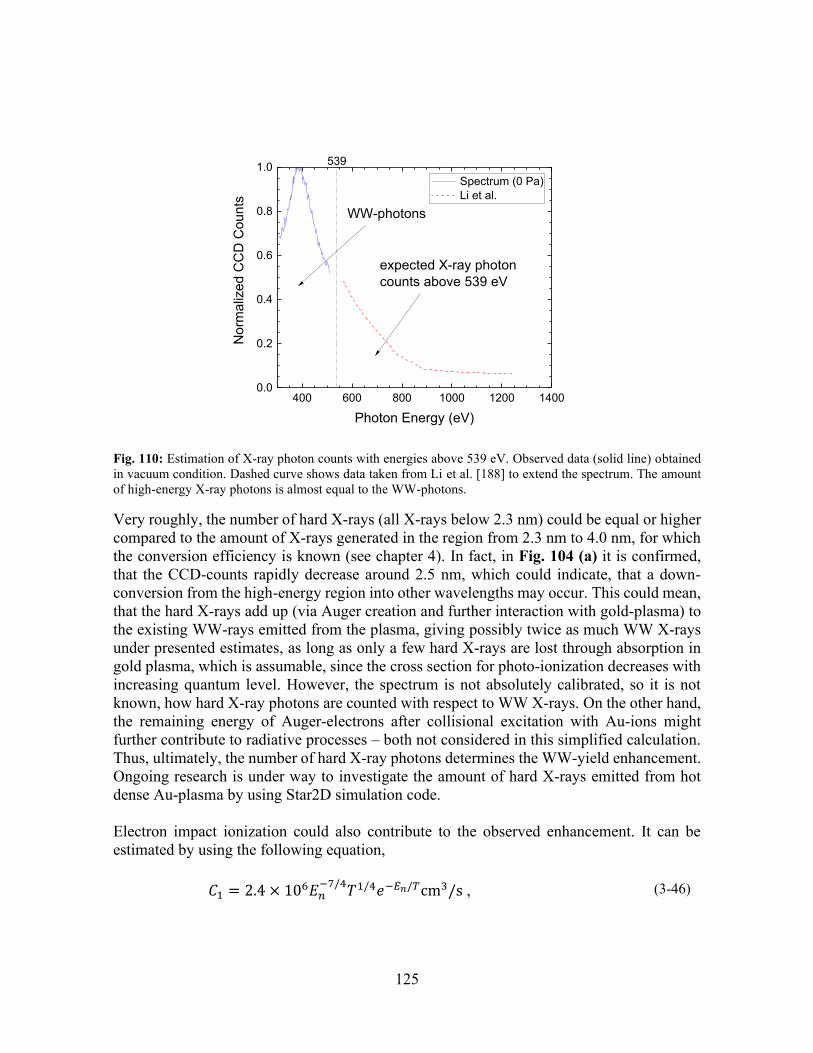
125
400 600 800 1000 1200 14000.0
0.2
0.4
0.6
0.8
1.0
Nor
mal
ized
CC
D C
ount
s
Photon Energy (eV)
Spectrum (0 Pa) Li et al.
539
expected X-ray photoncounts above 539 eV
WW-photons
Fig. 110: Estimation of X-ray photon counts with energies above 539 eV. Observed data (solid line) obtained in vacuum condition. Dashed curve shows data taken from Li et al. [188] to extend the spectrum. The amount of high-energy X-ray photons is almost equal to the WW-photons.
Very roughly, the number of hard X-rays (all X-rays below 2.3 nm) could be equal or higher compared to the amount of X-rays generated in the region from 2.3 nm to 4.0 nm, for which the conversion efficiency is known (see chapter 4). In fact, in Fig. 104 (a) it is confirmed, that the CCD-counts rapidly decrease around 2.5 nm, which could indicate, that a down-conversion from the high-energy region into other wavelengths may occur. This could mean, that the hard X-rays add up (via Auger creation and further interaction with gold-plasma) to the existing WW-rays emitted from the plasma, giving possibly twice as much WW X-rays under presented estimates, as long as only a few hard X-rays are lost through absorption in gold plasma, which is assumable, since the cross section for photo-ionization decreases with increasing quantum level. However, the spectrum is not absolutely calibrated, so it is not known, how hard X-ray photons are counted with respect to WW X-rays. On the other hand, the remaining energy of Auger-electrons after collisional excitation with Au-ions might further contribute to radiative processes – both not considered in this simplified calculation. Thus, ultimately, the number of hard X-ray photons determines the WW-yield enhancement. Ongoing research is under way to investigate the amount of hard X-rays emitted from hot dense Au-plasma by using Star2D simulation code. Electron impact ionization could also contribute to the observed enhancement. It can be estimated by using the following equation,
𝐶1 = 2.4 × 10⁶𝐸𝑛−7/4
𝑇1/4𝑒−𝐸𝑛/𝑇cm3/s , (3-46)
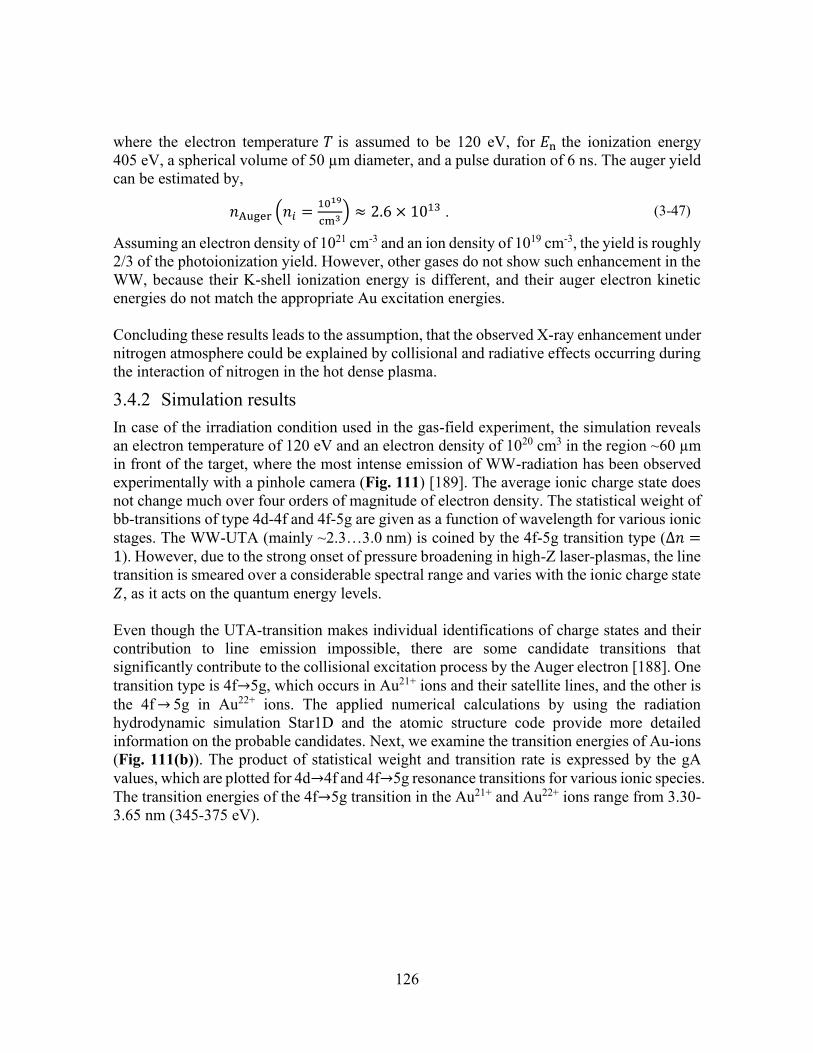
126
where the electron temperature 𝑇 is assumed to be 120 eV, for 𝐸n the ionization energy 405 eV, a spherical volume of 50 µm diameter, and a pulse duration of 6 ns. The auger yield can be estimated by,
𝑛Auger (𝑛𝑖 =1019
cm3) ≈ 2.6 × 10¹³ . (3-47)
Assuming an electron density of 1021 cm-3 and an ion density of 1019 cm-3, the yield is roughly 2/3 of the photoionization yield. However, other gases do not show such enhancement in the WW, because their K-shell ionization energy is different, and their auger electron kinetic energies do not match the appropriate Au excitation energies. Concluding these results leads to the assumption, that the observed X-ray enhancement under nitrogen atmosphere could be explained by collisional and radiative effects occurring during the interaction of nitrogen in the hot dense plasma.
3.4.2 Simulation results In case of the irradiation condition used in the gas-field experiment, the simulation reveals an electron temperature of 120 eV and an electron density of 1020 cm3 in the region ~60 µm in front of the target, where the most intense emission of WW-radiation has been observed experimentally with a pinhole camera (Fig. 111) [189]. The average ionic charge state does not change much over four orders of magnitude of electron density. The statistical weight of bb-transitions of type 4d-4f and 4f-5g are given as a function of wavelength for various ionic stages. The WW-UTA (mainly ~2.3…3.0 nm) is coined by the 4f-5g transition type (∆𝑛 =1). However, due to the strong onset of pressure broadening in high-Z laser-plasmas, the line transition is smeared over a considerable spectral range and varies with the ionic charge state 𝑍, as it acts on the quantum energy levels. Even though the UTA-transition makes individual identifications of charge states and their contribution to line emission impossible, there are some candidate transitions that significantly contribute to the collisional excitation process by the Auger electron [188]. One transition type is 4f→5g, which occurs in Au21+ ions and their satellite lines, and the other is the 4f → 5g in Au22+ ions. The applied numerical calculations by using the radiation hydrodynamic simulation Star1D and the atomic structure code provide more detailed information on the probable candidates. Next, we examine the transition energies of Au-ions (Fig. 111(b)). The product of statistical weight and transition rate is expressed by the gA values, which are plotted for 4d→4f and 4f→5g resonance transitions for various ionic species. The transition energies of the 4f→5g transition in the Au21+ and Au22+ ions range from 3.30-3.65 nm (345-375 eV).
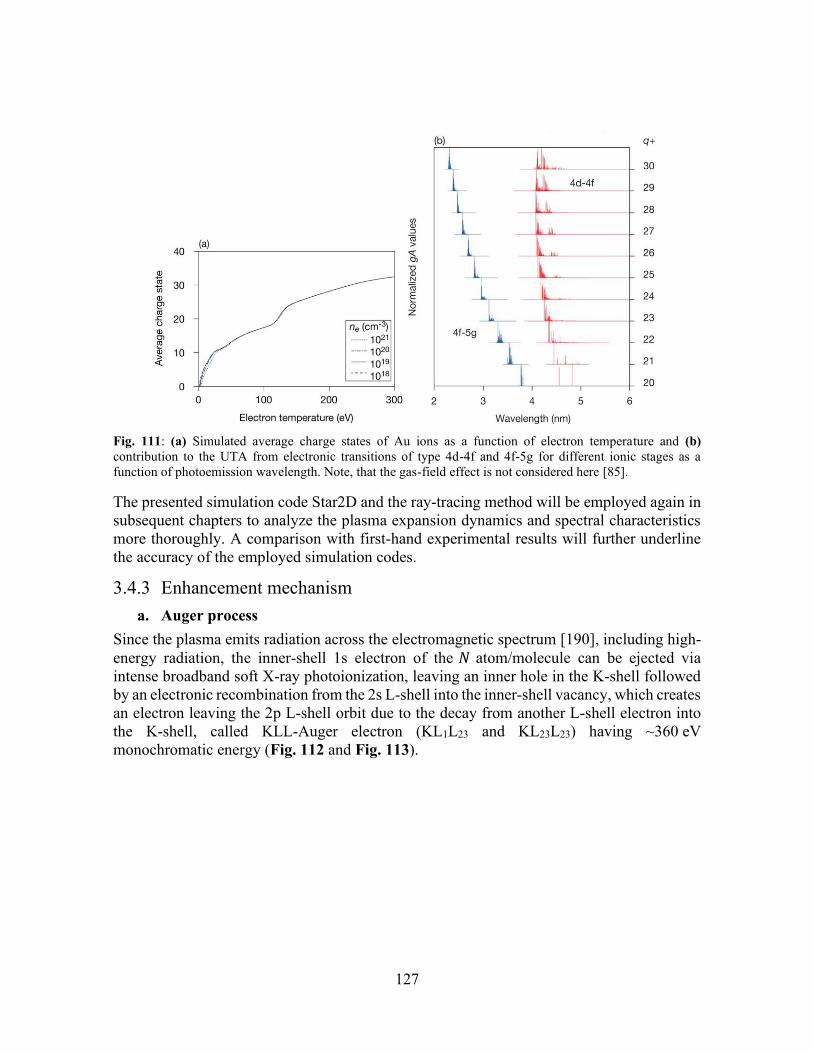
127
Fig. 111: (a) Simulated average charge states of Au ions as a function of electron temperature and (b) contribution to the UTA from electronic transitions of type 4d-4f and 4f-5g for different ionic stages as a function of photoemission wavelength. Note, that the gas-field effect is not considered here [85].
The presented simulation code Star2D and the ray-tracing method will be employed again in subsequent chapters to analyze the plasma expansion dynamics and spectral characteristics more thoroughly. A comparison with first-hand experimental results will further underline the accuracy of the employed simulation codes.
3.4.3 Enhancement mechanism a. Auger process
Since the plasma emits radiation across the electromagnetic spectrum [190], including high-energy radiation, the inner-shell 1s electron of the 𝑁 atom/molecule can be ejected via intense broadband soft X-ray photoionization, leaving an inner hole in the K-shell followed by an electronic recombination from the 2s L-shell into the inner-shell vacancy, which creates an electron leaving the 2p L-shell orbit due to the decay from another L-shell electron into the K-shell, called KLL-Auger electron (KL1L23 and KL23L23) having ~360 eV monochromatic energy (Fig. 112 and Fig. 113).
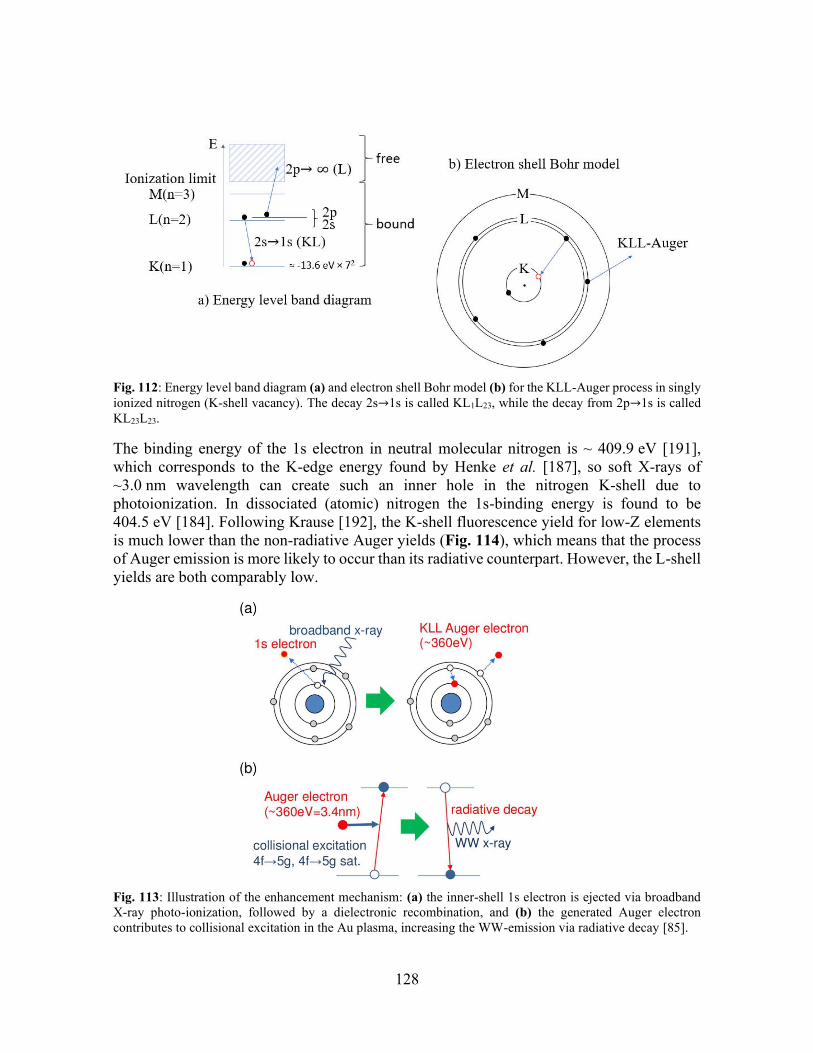
128
Fig. 112: Energy level band diagram (a) and electron shell Bohr model (b) for the KLL-Auger process in singly ionized nitrogen (K-shell vacancy). The decay 2s→1s is called KL1L23, while the decay from 2p→1s is called KL23L23.
The binding energy of the 1s electron in neutral molecular nitrogen is ~ 409.9 eV [191], which corresponds to the K-edge energy found by Henke et al. [187], so soft X-rays of ~3.0 nm wavelength can create such an inner hole in the nitrogen K-shell due to photoionization. In dissociated (atomic) nitrogen the 1s-binding energy is found to be 404.5 eV [184]. Following Krause [192], the K-shell fluorescence yield for low-Z elements is much lower than the non-radiative Auger yields (Fig. 114), which means that the process of Auger emission is more likely to occur than its radiative counterpart. However, the L-shell yields are both comparably low.
Fig. 113: Illustration of the enhancement mechanism: (a) the inner-shell 1s electron is ejected via broadband X-ray photo-ionization, followed by a dielectronic recombination, and (b) the generated Auger electron contributes to collisional excitation in the Au plasma, increasing the WW-emission via radiative decay [85].
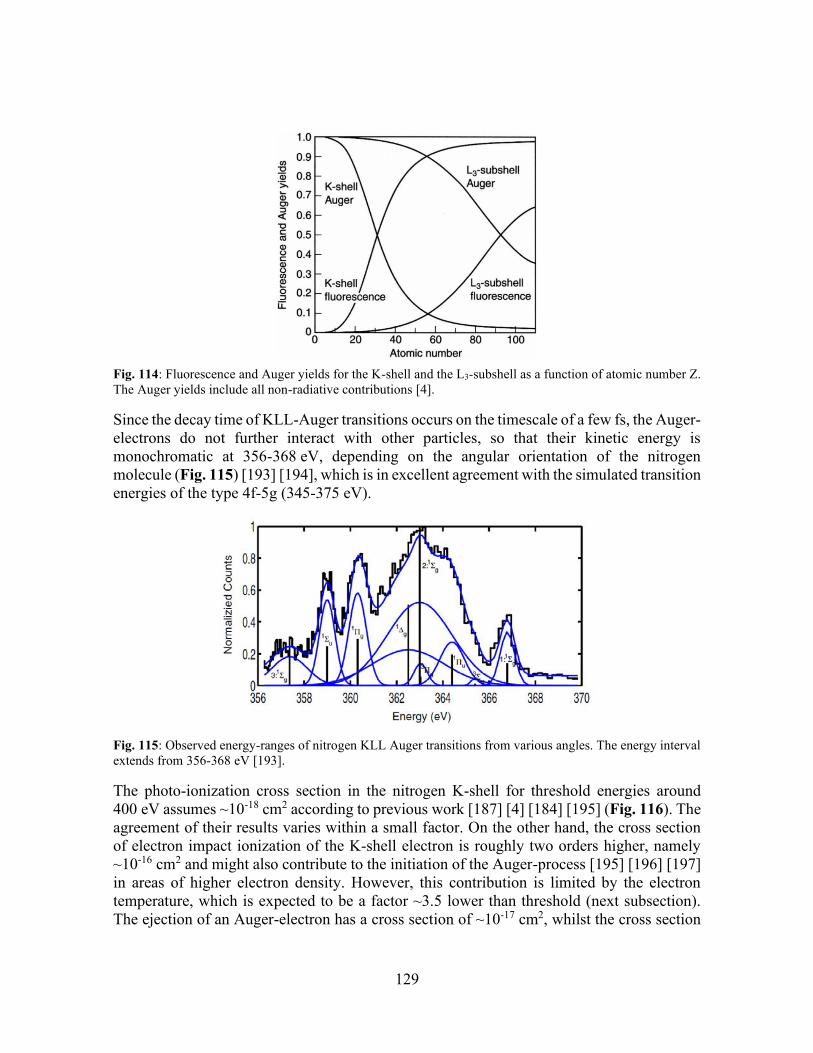
129
Fig. 114: Fluorescence and Auger yields for the K-shell and the L3-subshell as a function of atomic number Z. The Auger yields include all non-radiative contributions [4].
Since the decay time of KLL-Auger transitions occurs on the timescale of a few fs, the Auger-electrons do not further interact with other particles, so that their kinetic energy is monochromatic at 356-368 eV, depending on the angular orientation of the nitrogen molecule (Fig. 115) [193] [194], which is in excellent agreement with the simulated transition energies of the type 4f-5g (345-375 eV).
Fig. 115: Observed energy-ranges of nitrogen KLL Auger transitions from various angles. The energy interval extends from 356-368 eV [193].
The photo-ionization cross section in the nitrogen K-shell for threshold energies around 400 eV assumes ~10-18 cm2 according to previous work [187] [4] [184] [195] (Fig. 116). The agreement of their results varies within a small factor. On the other hand, the cross section of electron impact ionization of the K-shell electron is roughly two orders higher, namely ~10-16 cm2 and might also contribute to the initiation of the Auger-process [195] [196] [197] in areas of higher electron density. However, this contribution is limited by the electron temperature, which is expected to be a factor ~3.5 lower than threshold (next subsection). The ejection of an Auger-electron has a cross section of ~10-17 cm2, whilst the cross section
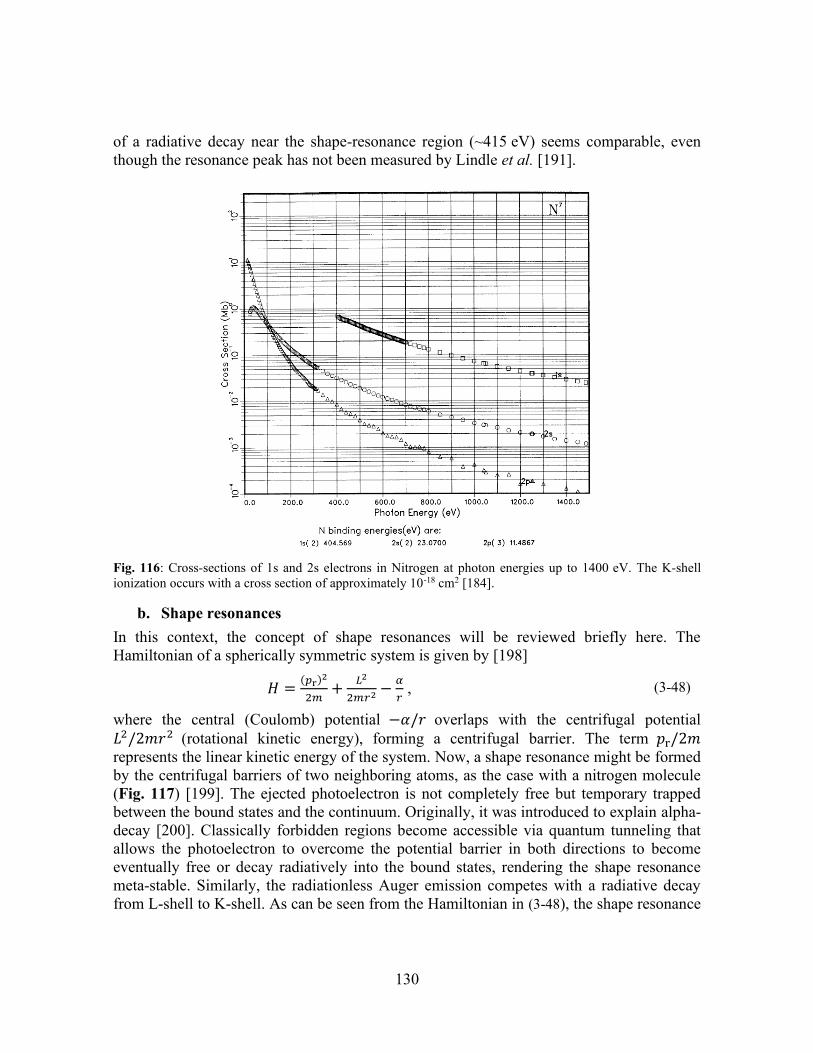
130
of a radiative decay near the shape-resonance region (~415 eV) seems comparable, even though the resonance peak has not been measured by Lindle et al. [191].
Fig. 116: Cross-sections of 1s and 2s electrons in Nitrogen at photon energies up to 1400 eV. The K-shell ionization occurs with a cross section of approximately 10-18 cm2 [184].
b. Shape resonances In this context, the concept of shape resonances will be reviewed briefly here. The Hamiltonian of a spherically symmetric system is given by [198]
𝐻 =(𝑝r)2
2𝑚+
𝐿2
2𝑚𝑟2 −𝛼
𝑟 , (3-48)
where the central (Coulomb) potential −𝛼/𝑟 overlaps with the centrifugal potential 𝐿2/2𝑚𝑟2 (rotational kinetic energy), forming a centrifugal barrier. The term 𝑝r/2𝑚 represents the linear kinetic energy of the system. Now, a shape resonance might be formed by the centrifugal barriers of two neighboring atoms, as the case with a nitrogen molecule (Fig. 117) [199]. The ejected photoelectron is not completely free but temporary trapped between the bound states and the continuum. Originally, it was introduced to explain alpha-decay [200]. Classically forbidden regions become accessible via quantum tunneling that allows the photoelectron to overcome the potential barrier in both directions to become eventually free or decay radiatively into the bound states, rendering the shape resonance meta-stable. Similarly, the radiationless Auger emission competes with a radiative decay from L-shell to K-shell. As can be seen from the Hamiltonian in (3-48), the shape resonance
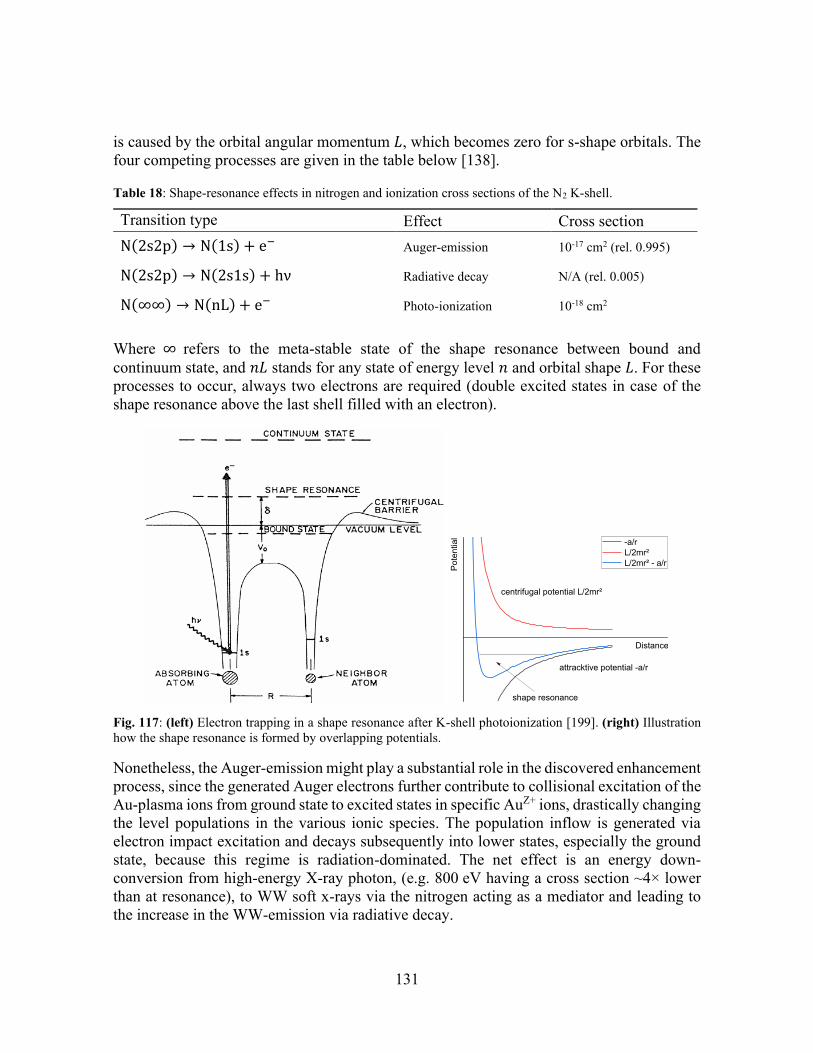
131
is caused by the orbital angular momentum 𝐿, which becomes zero for s-shape orbitals. The four competing processes are given in the table below [138].
Table 18: Shape-resonance effects in nitrogen and ionization cross sections of the N2 K-shell.
Transition type Effect Cross section N(2s2p) → N(1s) + e− Auger-emission 10-17 cm2 (rel. 0.995)
N(2s2p) → N(2s1s) + hν Radiative decay N/A (rel. 0.005)
N(∞∞) → N(nL) + e− Photo-ionization 10-18 cm2
Where ∞ refers to the meta-stable state of the shape resonance between bound and continuum state, and 𝑛𝐿 stands for any state of energy level 𝑛 and orbital shape 𝐿. For these processes to occur, always two electrons are required (double excited states in case of the shape resonance above the last shell filled with an electron).
Fig. 117: (left) Electron trapping in a shape resonance after K-shell photoionization [199]. (right) Illustration how the shape resonance is formed by overlapping potentials.
Nonetheless, the Auger-emission might play a substantial role in the discovered enhancement process, since the generated Auger electrons further contribute to collisional excitation of the Au-plasma ions from ground state to excited states in specific AuZ+ ions, drastically changing the level populations in the various ionic species. The population inflow is generated via electron impact excitation and decays subsequently into lower states, especially the ground state, because this regime is radiation-dominated. The net effect is an energy down-conversion from high-energy X-ray photon, (e.g. 800 eV having a cross section ~4× lower than at resonance), to WW soft x-rays via the nitrogen acting as a mediator and leading to the increase in the WW-emission via radiative decay.
Pote
ntia
l
Distance
-a/r L/2mr² L/2mr² - a/r
attracktive potential -a/r
centrifugal potential L/2mr²
shape resonance
132
3.5 Conclusions
The previously discovered enhancement of soft X-rays emitted from laser-produced gold plasma under N2-atmosphere was confirmed and found to be 3.6 times higher than in vacuum, at a gas pressure of 410 Pa evaluated for 3.11 nm radiation. The simulation codes Star2D and FAC helped to retrieve important plasma parameters and aided to clarify the physical mechanism responsible for the enhancement. Putting all information together, a consistent atomic picture of the processes underpinning the enhancement could be found. First, broadband X-rays ionize the K-shell electrons of nitrogen, followed by Auger emission (~360 eV). Then, the Auger electrons undergo collisional excitations with Au21+ and Au22+ ions, causing 4d-4f and 4f-5g transitions. Subsequently, radiative decay processes cause strong emission of WW X-rays at photon energies of 345-375 eV, matching the monochromatic kinetic energy of Auger electrons well. Consequently, the energy down-conversion from high-energy X-ray photons to WW-photons can be expected as a crucial factor for the observed enhancement. Furthermore, collisional processes are not found to be dominant. This was further solidified by introduction of other gas species, where no enhancement was observed. Finally, an order-estimate underlined the theory. These results indicate that the enhancement in X-ray yield at a given wavelength could be obtained by optimizing the X-ray photon energy emitted from the LPP, the atomic structure and the gas pressure. Therefore, an increase in X-ray yield for other gases may be expected by providing a higher plasma temperature and higher emitter density. As for the N2 atmosphere, the enhancement could open up new perspectives for laboratory-sized soft X-ray microscopes. However, a clever technical design is required to suppress the photo-absorption, especially that of water-window X-rays, that is inherent to the gas-field. One of the solutions could be a gas-injection nozzle placed in vacuum in the proximity of the target and ejects a given volume of gas with a certain pressure of several hundred Pa in a limited area. Previous research showed that a more sophisticated nozzle-design is required, in order to realize [169]. Another promising method is the use of Au-surface covered with cryogenic nitrogen to directly provide the potential source of Auger electrons. This evades the problem of the absorption by the gas-field completely since nitrogen would be provided only where required. Nonetheless, the presented research has provided clear evidence of the enhancement discovered by Ejima et al. [75] and can easily be reproduced even by a Joule-class laser system. The enhancement occurs also in other gas species – however, their contribution to X-ray yield was found to be much weaker for same irradiation condition. Ultimately, this study helped to clarify the nature of the enhancement mechanism – the production of Auger electrons by broadband X-rays and their further contribution to the Au level populations via collisional interaction.
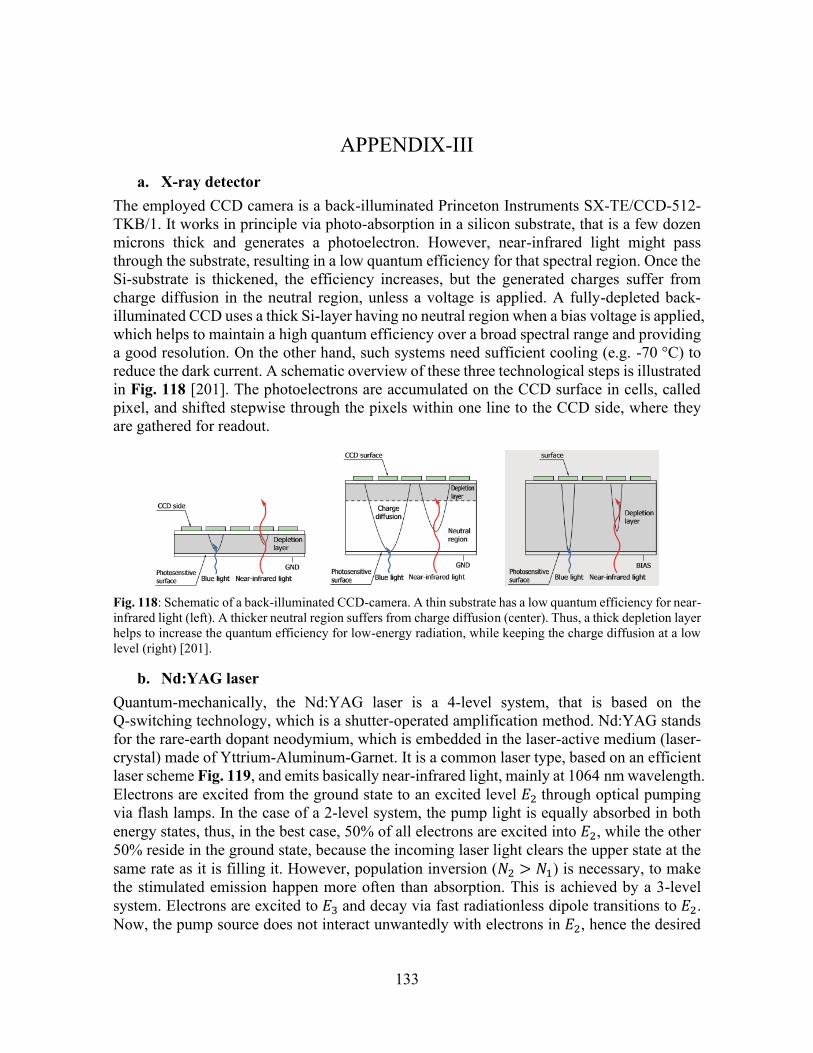
133
APPENDIX-III
a. X-ray detector The employed CCD camera is a back-illuminated Princeton Instruments SX-TE/CCD-512-TKB/1. It works in principle via photo-absorption in a silicon substrate, that is a few dozen microns thick and generates a photoelectron. However, near-infrared light might pass through the substrate, resulting in a low quantum efficiency for that spectral region. Once the Si-substrate is thickened, the efficiency increases, but the generated charges suffer from charge diffusion in the neutral region, unless a voltage is applied. A fully-depleted back-illuminated CCD uses a thick Si-layer having no neutral region when a bias voltage is applied, which helps to maintain a high quantum efficiency over a broad spectral range and providing a good resolution. On the other hand, such systems need sufficient cooling (e.g. -70 °C) to reduce the dark current. A schematic overview of these three technological steps is illustrated in Fig. 118 [201]. The photoelectrons are accumulated on the CCD surface in cells, called pixel, and shifted stepwise through the pixels within one line to the CCD side, where they are gathered for readout.
Fig. 118: Schematic of a back-illuminated CCD-camera. A thin substrate has a low quantum efficiency for near-infrared light (left). A thicker neutral region suffers from charge diffusion (center). Thus, a thick depletion layer helps to increase the quantum efficiency for low-energy radiation, while keeping the charge diffusion at a low level (right) [201].
b. Nd:YAG laser Quantum-mechanically, the Nd:YAG laser is a 4-level system, that is based on the Q-switching technology, which is a shutter-operated amplification method. Nd:YAG stands for the rare-earth dopant neodymium, which is embedded in the laser-active medium (laser-crystal) made of Yttrium-Aluminum-Garnet. It is a common laser type, based on an efficient laser scheme Fig. 119, and emits basically near-infrared light, mainly at 1064 nm wavelength. Electrons are excited from the ground state to an excited level 𝐸2 through optical pumping via flash lamps. In the case of a 2-level system, the pump light is equally absorbed in both energy states, thus, in the best case, 50% of all electrons are excited into 𝐸2, while the other 50% reside in the ground state, because the incoming laser light clears the upper state at the same rate as it is filling it. However, population inversion (𝑁2 > 𝑁1) is necessary, to make the stimulated emission happen more often than absorption. This is achieved by a 3-level system. Electrons are excited to 𝐸3 and decay via fast radiationless dipole transitions to 𝐸2. Now, the pump source does not interact unwantedly with electrons in 𝐸2, hence the desired
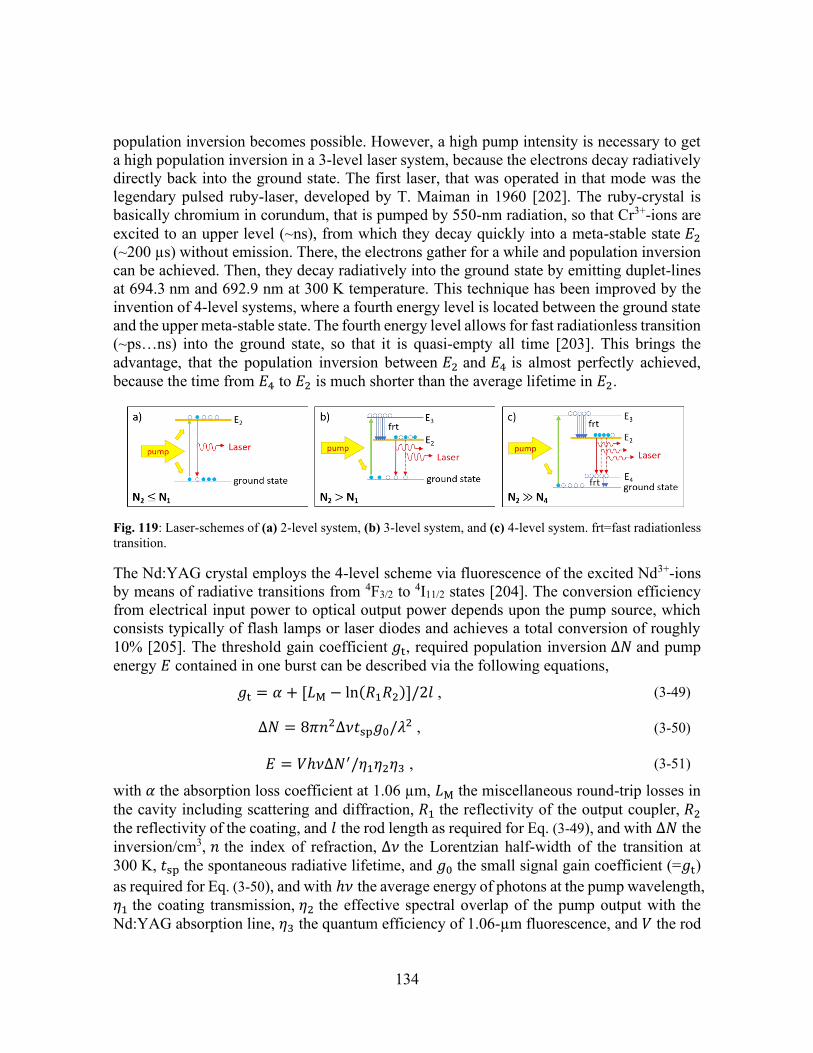
134
population inversion becomes possible. However, a high pump intensity is necessary to get a high population inversion in a 3-level laser system, because the electrons decay radiatively directly back into the ground state. The first laser, that was operated in that mode was the legendary pulsed ruby-laser, developed by T. Maiman in 1960 [202]. The ruby-crystal is basically chromium in corundum, that is pumped by 550-nm radiation, so that Cr3+-ions are excited to an upper level (~ns), from which they decay quickly into a meta-stable state 𝐸2 (~200 µs) without emission. There, the electrons gather for a while and population inversion can be achieved. Then, they decay radiatively into the ground state by emitting duplet-lines at 694.3 nm and 692.9 nm at 300 K temperature. This technique has been improved by the invention of 4-level systems, where a fourth energy level is located between the ground state and the upper meta-stable state. The fourth energy level allows for fast radiationless transition (~ps…ns) into the ground state, so that it is quasi-empty all time [203]. This brings the advantage, that the population inversion between 𝐸2 and 𝐸4 is almost perfectly achieved, because the time from 𝐸4 to 𝐸2 is much shorter than the average lifetime in 𝐸2.
Fig. 119: Laser-schemes of (a) 2-level system, (b) 3-level system, and (c) 4-level system. frt=fast radiationless transition.
The Nd:YAG crystal employs the 4-level scheme via fluorescence of the excited Nd3+-ions by means of radiative transitions from 4F3/2 to 4I11/2 states [204]. The conversion efficiency from electrical input power to optical output power depends upon the pump source, which consists typically of flash lamps or laser diodes and achieves a total conversion of roughly 10% [205]. The threshold gain coefficient 𝑔t, required population inversion ∆𝑁 and pump energy 𝐸 contained in one burst can be described via the following equations,
𝑔t = 𝛼 + [𝐿M − ln(𝑅1𝑅2)]/2𝑙 , (3-49)
∆𝑁 = 8𝜋𝑛2∆𝜈𝑡sp𝑔0/𝜆2 , (3-50)
𝐸 = 𝑉ℎ𝜈∆𝑁′/휂1휂2휂3 , (3-51)
with 𝛼 the absorption loss coefficient at 1.06 µm, 𝐿M the miscellaneous round-trip losses in the cavity including scattering and diffraction, 𝑅1 the reflectivity of the output coupler, 𝑅2 the reflectivity of the coating, and 𝑙 the rod length as required for Eq. (3-49), and with ∆𝑁 the inversion/cm3, 𝑛 the index of refraction, ∆𝜈 the Lorentzian half-width of the transition at 300 K, 𝑡sp the spontaneous radiative lifetime, and 𝑔0 the small signal gain coefficient (=𝑔t) as required for Eq. (3-50), and with ℎ𝜈 the average energy of photons at the pump wavelength, 휂1 the coating transmission, 휂2 the effective spectral overlap of the pump output with the Nd:YAG absorption line, 휂3 the quantum efficiency of 1.06-µm fluorescence, and 𝑉 the rod
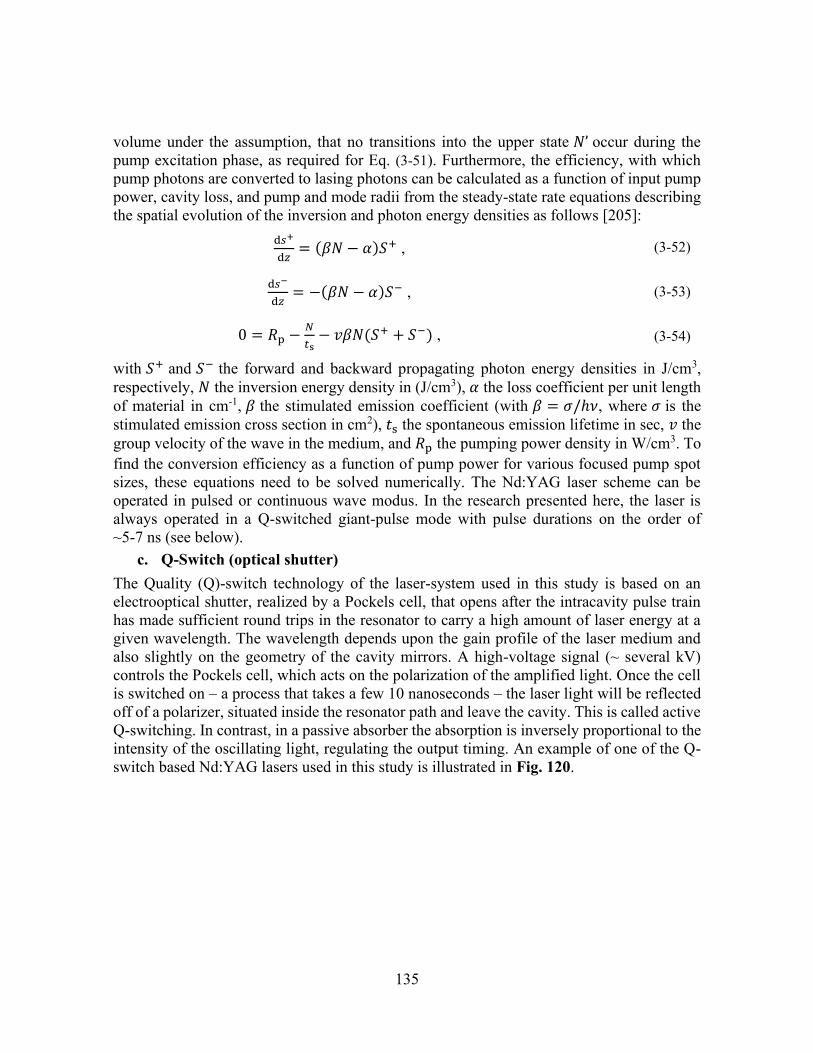
135
volume under the assumption, that no transitions into the upper state 𝑁’ occur during the pump excitation phase, as required for Eq. (3-51). Furthermore, the efficiency, with which pump photons are converted to lasing photons can be calculated as a function of input pump power, cavity loss, and pump and mode radii from the steady-state rate equations describing the spatial evolution of the inversion and photon energy densities as follows [205]:
d𝑠+
d𝑧= (𝛽𝑁 − 𝛼)𝑆+ , (3-52)
d𝑠−
d𝑧= −(𝛽𝑁 − 𝛼)𝑆− , (3-53)
0 = 𝑅p −𝑁
𝑡s− 𝑣𝛽𝑁(𝑆+ + 𝑆−) , (3-54)
with 𝑆+ and 𝑆− the forward and backward propagating photon energy densities in J/cm3, respectively, 𝑁 the inversion energy density in (J/cm3), 𝛼 the loss coefficient per unit length of material in cm-1, 𝛽 the stimulated emission coefficient (with 𝛽 = 𝜎/ℎ𝜈, where 𝜎 is the stimulated emission cross section in cm2), 𝑡s the spontaneous emission lifetime in sec, 𝑣 the group velocity of the wave in the medium, and 𝑅p the pumping power density in W/cm3. To find the conversion efficiency as a function of pump power for various focused pump spot sizes, these equations need to be solved numerically. The Nd:YAG laser scheme can be operated in pulsed or continuous wave modus. In the research presented here, the laser is always operated in a Q-switched giant-pulse mode with pulse durations on the order of ~5-7 ns (see below).
c. Q-Switch (optical shutter) The Quality (Q)-switch technology of the laser-system used in this study is based on an electrooptical shutter, realized by a Pockels cell, that opens after the intracavity pulse train has made sufficient round trips in the resonator to carry a high amount of laser energy at a given wavelength. The wavelength depends upon the gain profile of the laser medium and also slightly on the geometry of the cavity mirrors. A high-voltage signal (~ several kV) controls the Pockels cell, which acts on the polarization of the amplified light. Once the cell is switched on – a process that takes a few 10 nanoseconds – the laser light will be reflected off of a polarizer, situated inside the resonator path and leave the cavity. This is called active Q-switching. In contrast, in a passive absorber the absorption is inversely proportional to the intensity of the oscillating light, regulating the output timing. An example of one of the Q-switch based Nd:YAG lasers used in this study is illustrated in Fig. 120.
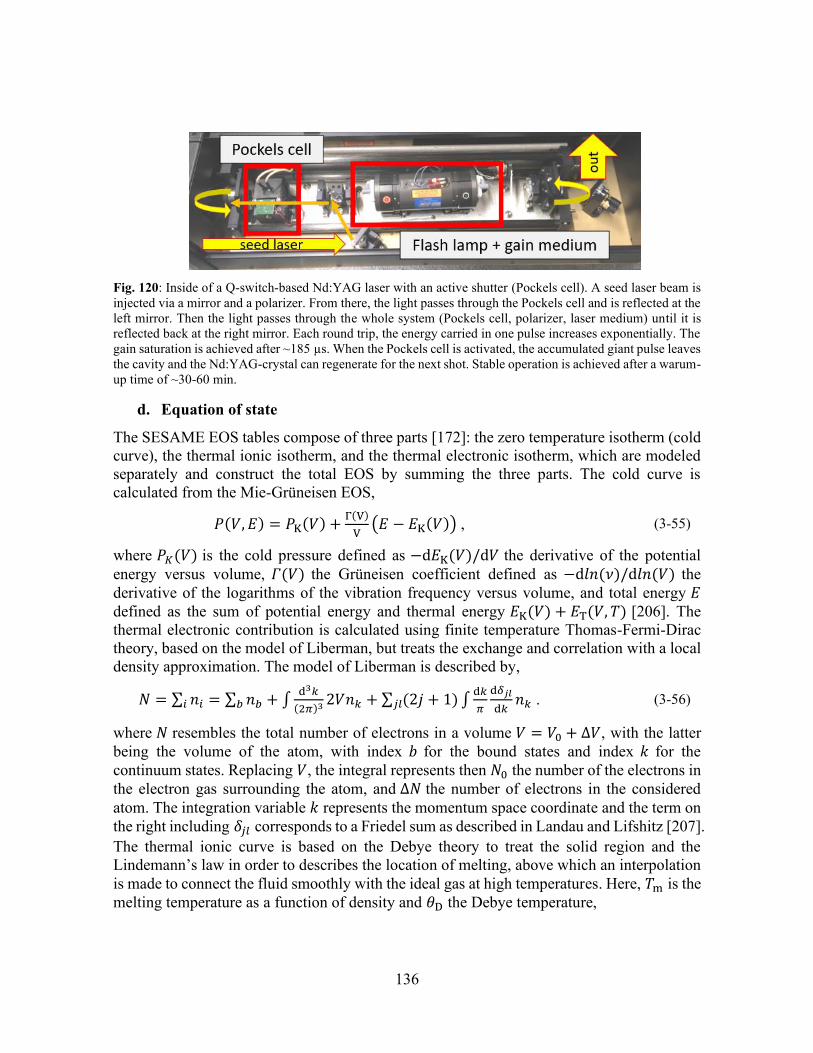
136
Fig. 120: Inside of a Q-switch-based Nd:YAG laser with an active shutter (Pockels cell). A seed laser beam is injected via a mirror and a polarizer. From there, the light passes through the Pockels cell and is reflected at the left mirror. Then the light passes through the whole system (Pockels cell, polarizer, laser medium) until it is reflected back at the right mirror. Each round trip, the energy carried in one pulse increases exponentially. The gain saturation is achieved after ~185 µs. When the Pockels cell is activated, the accumulated giant pulse leaves the cavity and the Nd:YAG-crystal can regenerate for the next shot. Stable operation is achieved after a warum-up time of ~30-60 min.
d. Equation of state
The SESAME EOS tables compose of three parts [172]: the zero temperature isotherm (cold curve), the thermal ionic isotherm, and the thermal electronic isotherm, which are modeled separately and construct the total EOS by summing the three parts. The cold curve is calculated from the Mie-Grüneisen EOS,
𝑃(𝑉, 𝐸) = 𝑃K(𝑉) +Γ(V)
V(𝐸 − 𝐸K(𝑉)) , (3-55)
where 𝑃𝐾(𝑉) is the cold pressure defined as −d𝐸K(𝑉)/d𝑉 the derivative of the potential energy versus volume, 𝛤(𝑉) the Grüneisen coefficient defined as −d𝑙𝑛(𝜈)/d𝑙𝑛(𝑉) the derivative of the logarithms of the vibration frequency versus volume, and total energy 𝐸 defined as the sum of potential energy and thermal energy 𝐸K(𝑉) + 𝐸T(𝑉, 𝑇) [206]. The thermal electronic contribution is calculated using finite temperature Thomas-Fermi-Dirac theory, based on the model of Liberman, but treats the exchange and correlation with a local density approximation. The model of Liberman is described by,
𝑁 = ∑ 𝑛𝑖 = ∑ 𝑛𝑏 + ∫d3𝑘
(2𝜋)3 2𝑉𝑛𝑘 + ∑ (2𝑗 + 1) ∫d𝑘
𝜋
d𝛿𝑗𝑙
d𝑘𝑛𝑘𝑗𝑙𝑏𝑖 . (3-56)
where 𝑁 resembles the total number of electrons in a volume 𝑉 = 𝑉0 + ∆𝑉, with the latter being the volume of the atom, with index 𝑏 for the bound states and index 𝑘 for the continuum states. Replacing 𝑉, the integral represents then 𝑁0 the number of the electrons in the electron gas surrounding the atom, and ∆𝑁 the number of electrons in the considered atom. The integration variable 𝑘 represents the momentum space coordinate and the term on the right including 𝛿𝑗𝑙 corresponds to a Friedel sum as described in Landau and Lifshitz [207]. The thermal ionic curve is based on the Debye theory to treat the solid region and the Lindemann’s law in order to describes the location of melting, above which an interpolation is made to connect the fluid smoothly with the ideal gas at high temperatures. Here, 𝑇m is the melting temperature as a function of density and 휃D the Debye temperature,
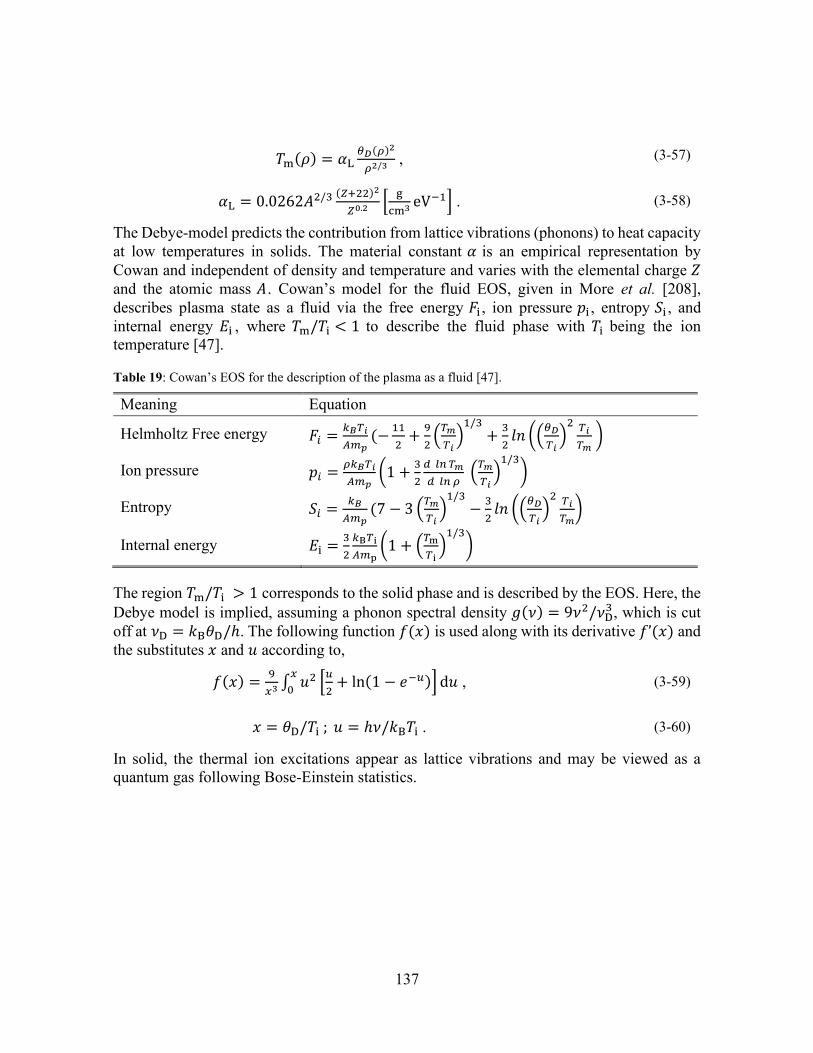
137
𝑇m(𝜌) = 𝛼L𝜃𝐷(𝜌)2
𝜌2/3 , (3-57)
𝛼L = 0.0262𝐴2/3 (𝑍+22)2
𝑍0.2[
g
cm3eV−1] . (3-58)
The Debye-model predicts the contribution from lattice vibrations (phonons) to heat capacity at low temperatures in solids. The material constant 𝛼 is an empirical representation by Cowan and independent of density and temperature and varies with the elemental charge 𝑍 and the atomic mass 𝐴. Cowan’s model for the fluid EOS, given in More et al. [208], describes plasma state as a fluid via the free energy 𝐹i , ion pressure 𝑝i , entropy 𝑆i , and internal energy 𝐸i , where 𝑇m/𝑇i < 1 to describe the fluid phase with 𝑇i being the ion temperature [47].
Table 19: Cowan’s EOS for the description of the plasma as a fluid [47].
Meaning Equation
Helmholtz Free energy 𝐹𝑖 =𝑘𝐵𝑇𝑖
𝐴𝑚𝑝(−
11
2+
9
2(
𝑇𝑚
𝑇𝑖)
1/3
+3
2𝑙𝑛 ((
𝜃𝐷
𝑇𝑖)
2 𝑇𝑖
𝑇𝑚 )
Ion pressure 𝑝𝑖 =𝜌𝑘𝐵𝑇𝑖
𝐴𝑚𝑝(1 +
3
2
𝑑 𝑙𝑛 𝑇𝑚
𝑑 𝑙𝑛 𝜌 (
𝑇𝑚
𝑇𝑖)
1/3)
Entropy 𝑆𝑖 =𝑘𝐵
𝐴𝑚𝑝(7 − 3 (
𝑇𝑚
𝑇𝑖)
1/3
−3
2𝑙𝑛 ((
𝜃𝐷
𝑇𝑖)
2 𝑇𝑖
𝑇𝑚)
Internal energy 𝐸i =3
2
𝑘B𝑇i
𝐴𝑚p(1 + (
𝑇m
𝑇i)
1/3)
The region 𝑇m/𝑇i > 1 corresponds to the solid phase and is described by the EOS. Here, the Debye model is implied, assuming a phonon spectral density 𝑔(𝜈) = 9𝜈2/𝜈D
3 , which is cut off at 𝜈D = 𝑘B휃D/ℎ. The following function 𝑓(𝑥) is used along with its derivative 𝑓’(𝑥) and the substitutes 𝑥 and 𝑢 according to,
𝑓(𝑥) =9
𝑥3 ∫ 𝑢2 [𝑢
2+ ln(1 − 𝑒−𝑢)] d𝑢
𝑥
0 , (3-59)
𝑥 = 휃D/𝑇i ; 𝑢 = ℎ𝜈/𝑘B𝑇i . (3-60)
In solid, the thermal ion excitations appear as lattice vibrations and may be viewed as a quantum gas following Bose-Einstein statistics.
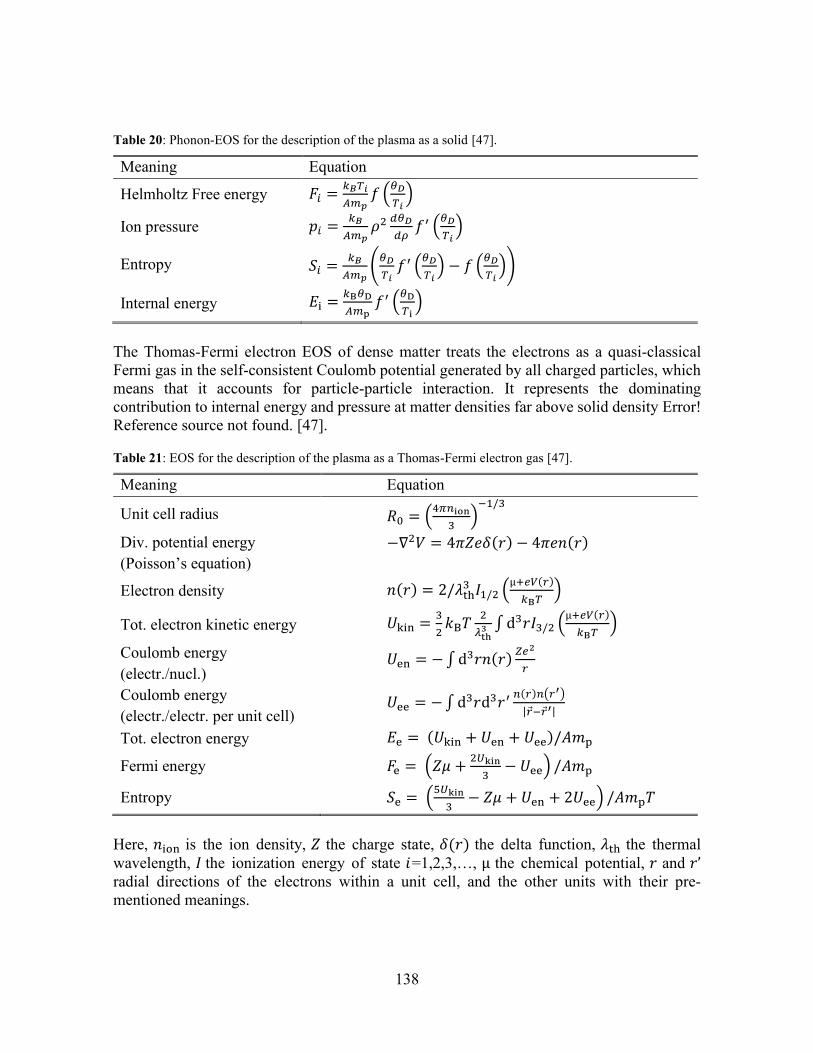
138
Table 20: Phonon-EOS for the description of the plasma as a solid [47].
Meaning Equation
Helmholtz Free energy 𝐹𝑖 =𝑘𝐵𝑇𝑖
𝐴𝑚𝑝𝑓 (
𝜃𝐷
𝑇𝑖)
Ion pressure 𝑝𝑖 =𝑘𝐵
𝐴𝑚𝑝𝜌2 𝑑𝜃𝐷
𝑑𝜌𝑓′ (
𝜃𝐷
𝑇𝑖)
Entropy 𝑆𝑖 =𝑘𝐵
𝐴𝑚𝑝(
𝜃𝐷
𝑇𝑖𝑓′ (
𝜃𝐷
𝑇𝑖) − 𝑓 (
𝜃𝐷
𝑇𝑖))
Internal energy 𝐸i =𝑘B𝜃D
𝐴𝑚p𝑓′ (
𝜃D
𝑇i)
The Thomas-Fermi electron EOS of dense matter treats the electrons as a quasi-classical Fermi gas in the self-consistent Coulomb potential generated by all charged particles, which means that it accounts for particle-particle interaction. It represents the dominating contribution to internal energy and pressure at matter densities far above solid density Error! Reference source not found. [47].
Table 21: EOS for the description of the plasma as a Thomas-Fermi electron gas [47].
Meaning Equation
Unit cell radius 𝑅0 = (4𝜋𝑛ion
3)
−1/3
Div. potential energy (Poisson’s equation)
−∇2𝑉 = 4𝜋𝑍𝑒𝛿(𝑟) − 4𝜋𝑒𝑛(𝑟)
Electron density 𝑛(𝑟) = 2/𝜆th3 𝐼1/2 (
µ+𝑒𝑉(𝑟)
𝑘B𝑇)
Tot. electron kinetic energy 𝑈kin =3
2𝑘B𝑇
2
𝜆th3 ∫ d3𝑟𝐼3/2 (
µ+𝑒𝑉(𝑟)
𝑘B𝑇)
Coulomb energy (electr./nucl.)
𝑈en = − ∫ d3𝑟𝑛(𝑟)𝑍𝑒2
𝑟
Coulomb energy (electr./electr. per unit cell)
𝑈ee = − ∫ d3𝑟d3𝑟′ 𝑛(𝑟)𝑛(𝑟′)
|𝑟−𝑟′|
Tot. electron energy 𝐸e = (𝑈kin + 𝑈en + 𝑈ee)/𝐴𝑚p
Fermi energy 𝐹e = (𝑍𝜇 +2𝑈kin
3− 𝑈ee) /𝐴𝑚p
Entropy 𝑆e = (5𝑈kin
3− 𝑍𝜇 + 𝑈en + 2𝑈ee) /𝐴𝑚p𝑇
Here, 𝑛ion is the ion density, 𝑍 the charge state, 𝛿(𝑟) the delta function, 𝜆th the thermal wavelength, 𝐼 the ionization energy of state 𝑖=1,2,3,…, µ the chemical potential, 𝑟 and 𝑟’ radial directions of the electrons within a unit cell, and the other units with their pre-mentioned meanings.
139
Maxwell-Euler Equations The Maxwell-Euler equations are used to describe the relation between charges and electromagnetic fields in plasmas.
∇ × �� =∂��
∂𝑡+ ∑ 𝑞𝑗𝑛𝑗𝑣𝑗 𝑗 , (3-61)
∇ × �� = −∂��
∂𝑡 , (3-62)
∇ ∙ �� = ∑ 𝑞𝑗𝑛𝑗𝑗 , (3-63)
∇ ∙ �� = 0 . (3-64)
Here, for electrons 𝑞 = −𝑒 and for ions 𝑞 = +𝑒𝑍 holds. Furthermore, the relations �� = 𝜖0�� and �� = µ0�� are applicable for an unpolarized (�� = 0) and non-magnetized (�� = 0) plasma, where 𝜖0 is the permittivity and µ0 the permeability of the free space. �� is the electric displacement field (or electric induction), 𝐸 the electric field, �� the magnetic field strength and �� the magnetic field (or magnetic flux density).
Born-approximation The flexible atomic code used in this study utilizes the Born-approximation, which is described in the following briefly. Scattering can be described by,
Ψ(𝑟) = Φ(𝑟) + Ψscattering(𝑟) = 𝑒𝑖𝑘𝑧 + 𝑓(𝜃, 𝜙)𝑒𝑖𝑘𝑟/𝑟 , (3-65)
where the full energy eigenstate is expressed in terms of the incident wave Φ and the scattered wave Ψscattering. The function 𝑓(𝜃, 𝜙) resembles the scattering amplitude (so that the differential cross section d𝜎 = |𝑓𝑘(𝜃, 𝜙)|2dΩ). It is valid in case 𝑟 ≫ 𝑎, with 𝑎 being the finite range of the scattering potential. The exponential functions are exact solutions to the time-independent Schrödinger equation, and the function 𝑓(𝜃, 𝜙) is an approximate solution, enough to represent the physics of scattering. In case of forward scattering (𝜃 = 0), the cross section becomes,
𝜎 =4𝜋
𝑘2∑ (2𝑙 + 1) sin2 𝛿𝑙𝑙 , (3-66)
where 𝑙 describes the partial waves, which yield an infinite sum (𝑙 = 0…∞) and 𝛿 represents the phase shift between them. The calculation of the phase shift involves spherical Bessel functions and is not treated further here. The integral scattering equation can be written as,
Ψ(𝑟) = Ψ0(𝑟) + ∫𝑑𝑟′𝐺(𝑟 − 𝑟′)𝑈(𝑟)Ψ(𝑟′) , (3-67)
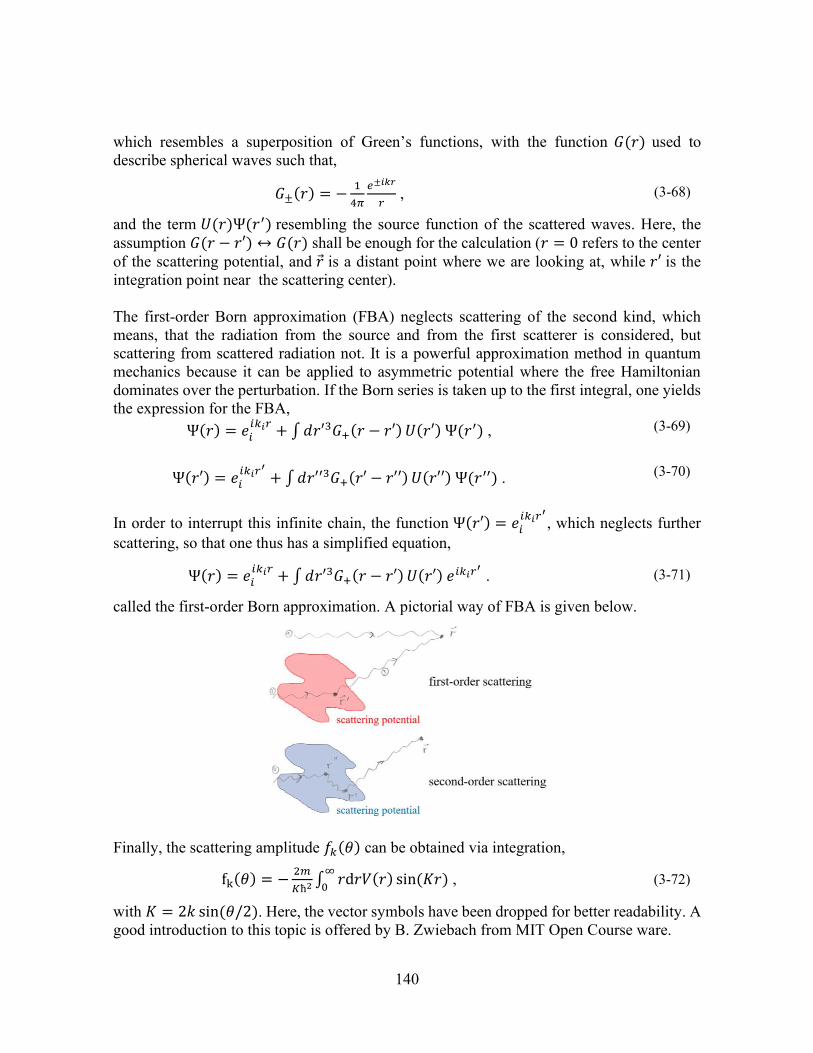
140
which resembles a superposition of Green’s functions, with the function 𝐺(𝑟) used to describe spherical waves such that,
𝐺±(𝑟) = −1
4𝜋
𝑒±𝑖𝑘𝑟
𝑟 , (3-68)
and the term 𝑈(𝑟)Ψ(𝑟′) resembling the source function of the scattered waves. Here, the assumption 𝐺(𝑟 − 𝑟′) ↔ 𝐺(𝑟) shall be enough for the calculation (𝑟 = 0 refers to the center of the scattering potential, and 𝑟 is a distant point where we are looking at, while 𝑟′ is the integration point near the scattering center). The first-order Born approximation (FBA) neglects scattering of the second kind, which means, that the radiation from the source and from the first scatterer is considered, but scattering from scattered radiation not. It is a powerful approximation method in quantum mechanics because it can be applied to asymmetric potential where the free Hamiltonian dominates over the perturbation. If the Born series is taken up to the first integral, one yields the expression for the FBA,
Ψ(𝑟) = 𝑒𝑖𝑖𝑘𝑖𝑟 + ∫𝑑𝑟′3𝐺+(𝑟 − 𝑟′) 𝑈(𝑟′) Ψ(𝑟′) , (3-69)
Ψ(𝑟′) = 𝑒𝑖𝑖𝑘𝑖𝑟
′
+ ∫𝑑𝑟′′3𝐺+(𝑟′ − 𝑟′′) 𝑈(𝑟′′) Ψ(𝑟′′) . (3-70)
In order to interrupt this infinite chain, the function Ψ(𝑟′) = 𝑒𝑖𝑖𝑘𝑖𝑟
′
, which neglects further scattering, so that one thus has a simplified equation,
Ψ(𝑟) = 𝑒𝑖𝑖𝑘𝑖𝑟 + ∫𝑑𝑟′3𝐺+(𝑟 − 𝑟′) 𝑈(𝑟′) 𝑒𝑖𝑘𝑖𝑟
′ . (3-71)
called the first-order Born approximation. A pictorial way of FBA is given below.
Finally, the scattering amplitude 𝑓𝑘(𝜃) can be obtained via integration,
fk(𝜃) = −2𝑚
𝐾ħ2 ∫ 𝑟d𝑟𝑉(𝑟) sin(𝐾𝑟)∞
0 , (3-72)
with 𝐾 = 2𝑘 sin(𝜃/2). Here, the vector symbols have been dropped for better readability. A good introduction to this topic is offered by B. Zwiebach from MIT Open Course ware.
141
4 ADVANCED DIAGNOSTIC
METHODS
4.1 Outline of this chapter
As pointed out in the foregoing chapter, the key apparatus for (laser-)plasma diagnostics is the spectrometer. However, the presented system in chapter 3 has been significantly modified and improved, in order to create a multi-dimensional observation tool, which features not only spectral measurements, but offers now two methods for time-integrated plasma imaging – pinhole imaging and imaging spectrometry – and makes temporal measurements of laser-pulse and WW X-ray emission possible. A calibrated energy detector is used to determine the conversion efficiency from laser energy to emitted WW X-rays, placed under ~30° with respect to target normal. The chamber is evacuated by using dry pumps and turbo-molecular pumps in order to create an atmosphere of ~10 mPa. Two stage-controllers allow for convenient target- and lens manipulation from outside the chamber. A schematic diagram of the assembly is depicted in Fig. 121. A solid slab target (Au) is irradiated with intense laser light under perpendicular incidence. The most important aspects of the observation systems are given in the following subchapters along with technical and physical explanations. The experimental data that have been obtained with this equipment will be presented and compared with the radiation hydrodynamics code Star2D and the ray tracing method, as previously introduced. These simulation tools help to estimate plasma parameters and spectral characteristics that cannot easily be measured with the current apparatus. A direct comparison between experimental data and simulation results allow to validate the Star2D code.
4.2 Experimental setup
4.2.1 Overview The experimental apparatus is illustrated schematically in Fig. 121 and the actual setup in Fig. 122. The target inside the chamber is irradiated with a laser pulse and the plasma is observed with a spectrometer, a pinhole camara and photodetectors. The diagnostic methods will be treated in subsequent sections.
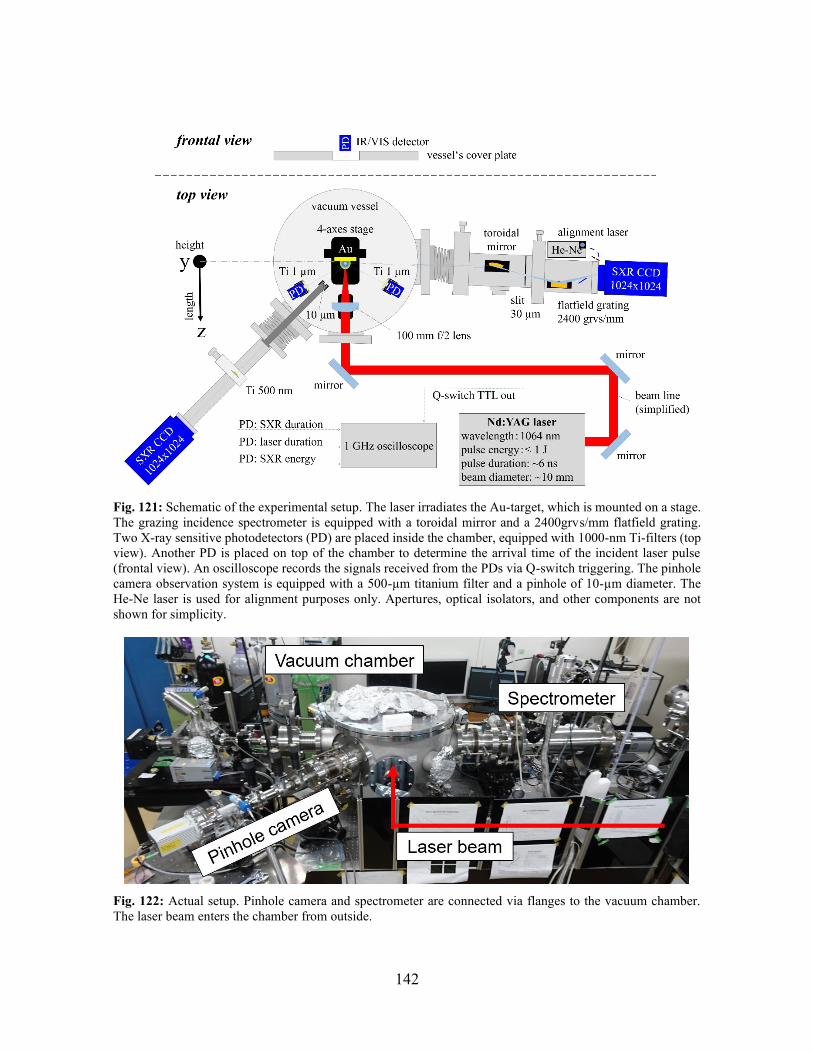
142
Fig. 121: Schematic of the experimental setup. The laser irradiates the Au-target, which is mounted on a stage. The grazing incidence spectrometer is equipped with a toroidal mirror and a 2400grvs/mm flatfield grating. Two X-ray sensitive photodetectors (PD) are placed inside the chamber, equipped with 1000-nm Ti-filters (top view). Another PD is placed on top of the chamber to determine the arrival time of the incident laser pulse (frontal view). An oscilloscope records the signals received from the PDs via Q-switch triggering. The pinhole camera observation system is equipped with a 500-µm titanium filter and a pinhole of 10-µm diameter. The He-Ne laser is used for alignment purposes only. Apertures, optical isolators, and other components are not shown for simplicity.
Fig. 122: Actual setup. Pinhole camera and spectrometer are connected via flanges to the vacuum chamber. The laser beam enters the chamber from outside.
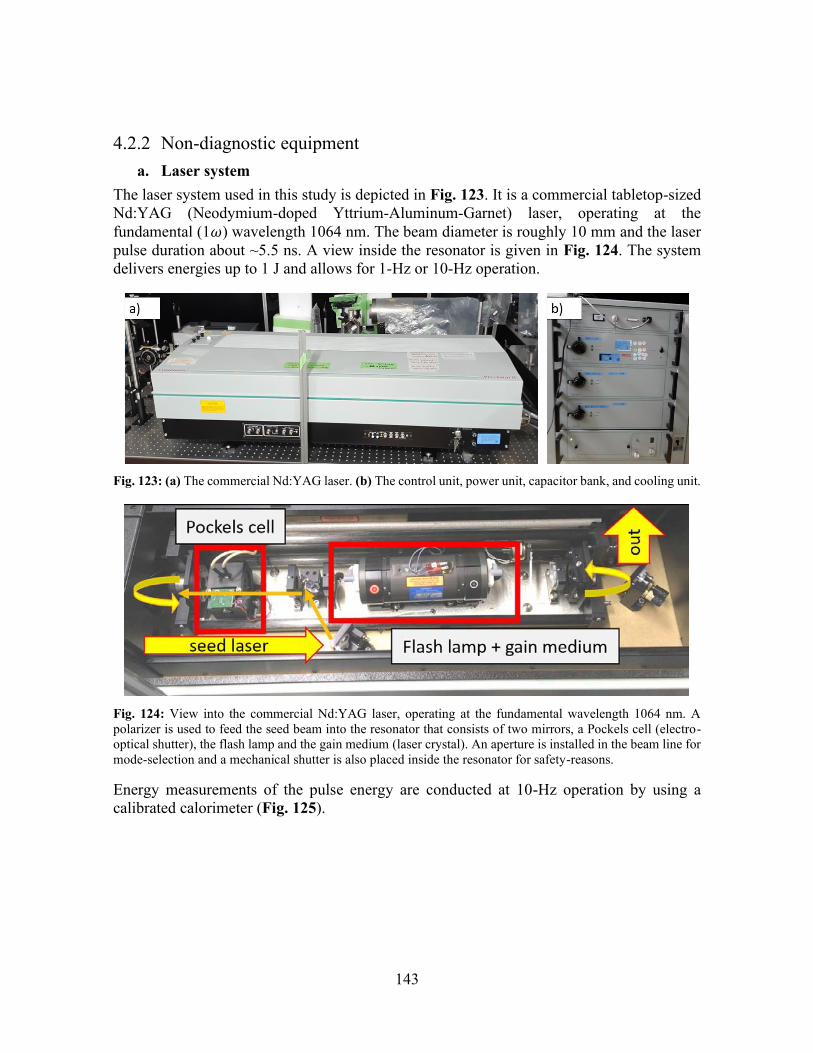
143
4.2.2 Non-diagnostic equipment a. Laser system
The laser system used in this study is depicted in Fig. 123. It is a commercial tabletop-sized Nd:YAG (Neodymium-doped Yttrium-Aluminum-Garnet) laser, operating at the fundamental (1𝜔) wavelength 1064 nm. The beam diameter is roughly 10 mm and the laser pulse duration about ~5.5 ns. A view inside the resonator is given in Fig. 124. The system delivers energies up to 1 J and allows for 1-Hz or 10-Hz operation.
Fig. 123: (a) The commercial Nd:YAG laser. (b) The control unit, power unit, capacitor bank, and cooling unit.
Fig. 124: View into the commercial Nd:YAG laser, operating at the fundamental wavelength 1064 nm. A polarizer is used to feed the seed beam into the resonator that consists of two mirrors, a Pockels cell (electro-optical shutter), the flash lamp and the gain medium (laser crystal). An aperture is installed in the beam line for mode-selection and a mechanical shutter is also placed inside the resonator for safety-reasons.
Energy measurements of the pulse energy are conducted at 10-Hz operation by using a calibrated calorimeter (Fig. 125).
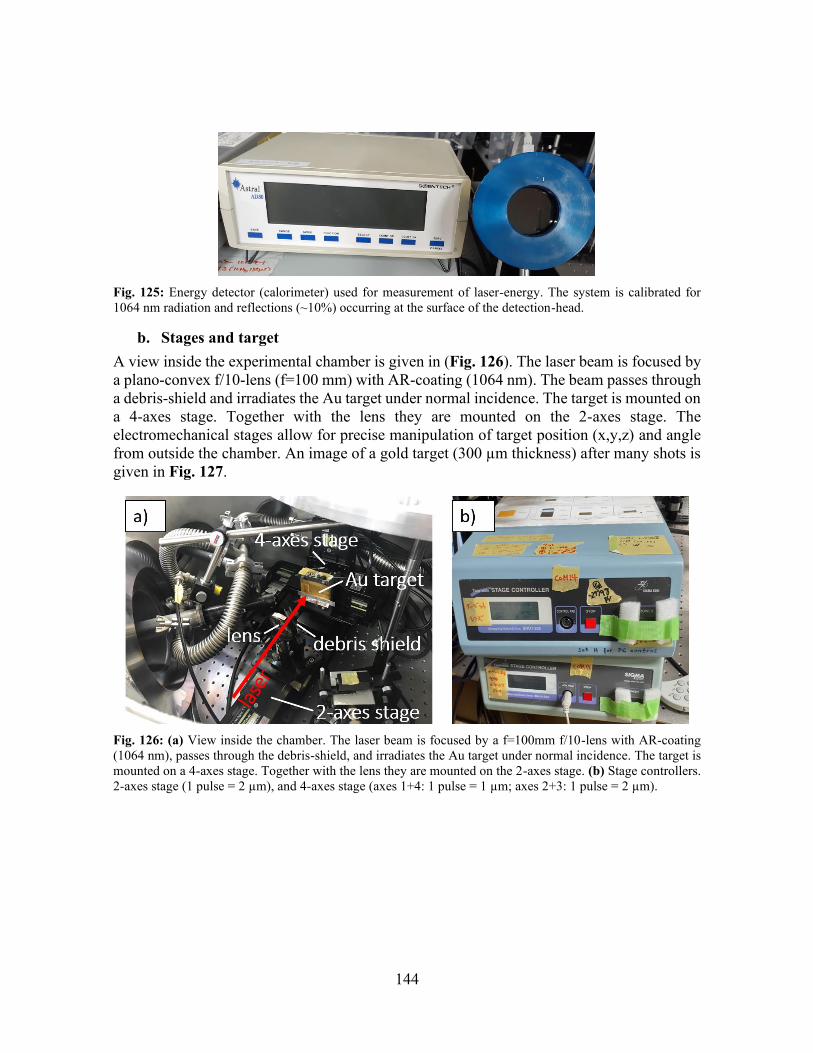
144
Fig. 125: Energy detector (calorimeter) used for measurement of laser-energy. The system is calibrated for 1064 nm radiation and reflections (~10%) occurring at the surface of the detection-head.
b. Stages and target A view inside the experimental chamber is given in (Fig. 126). The laser beam is focused by a plano-convex f/10-lens (f=100 mm) with AR-coating (1064 nm). The beam passes through a debris-shield and irradiates the Au target under normal incidence. The target is mounted on a 4-axes stage. Together with the lens they are mounted on the 2-axes stage. The electromechanical stages allow for precise manipulation of target position (x,y,z) and angle from outside the chamber. An image of a gold target (300 µm thickness) after many shots is given in Fig. 127.
Fig. 126: (a) View inside the chamber. The laser beam is focused by a f=100mm f/10-lens with AR-coating (1064 nm), passes through the debris-shield, and irradiates the Au target under normal incidence. The target is mounted on a 4-axes stage. Together with the lens they are mounted on the 2-axes stage. (b) Stage controllers. 2-axes stage (1 pulse = 2 µm), and 4-axes stage (axes 1+4: 1 pulse = 1 µm; axes 2+3: 1 pulse = 2 µm).
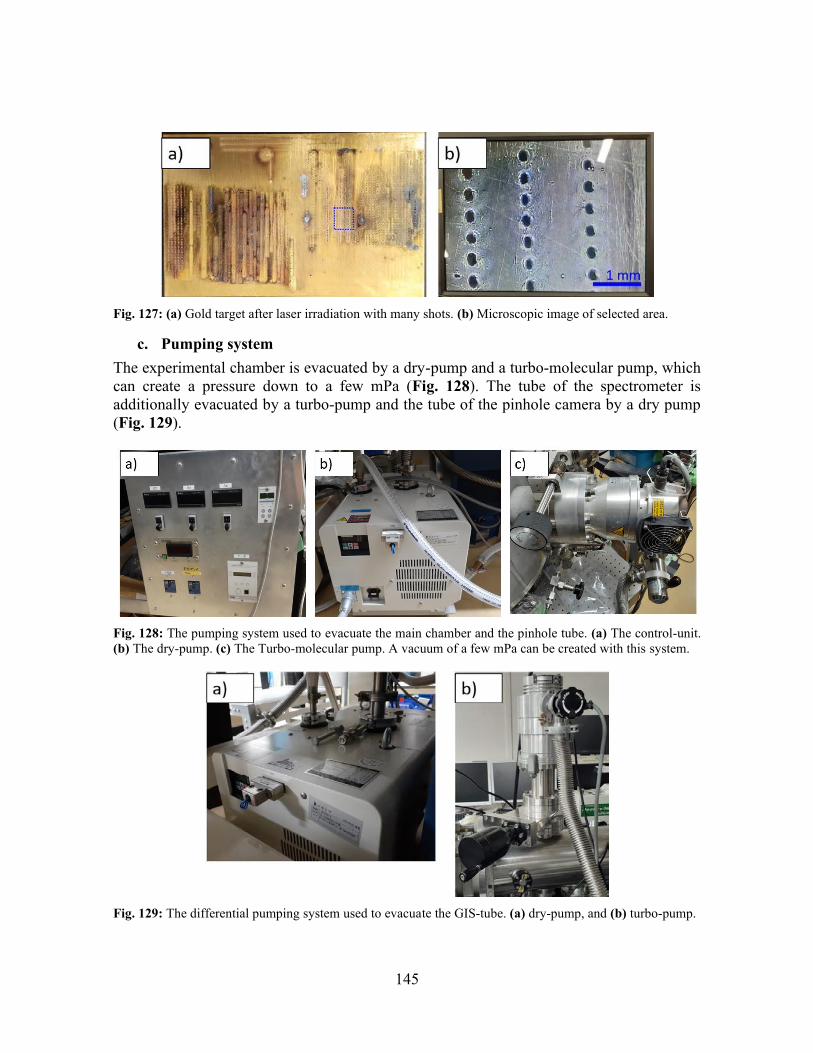
145
Fig. 127: (a) Gold target after laser irradiation with many shots. (b) Microscopic image of selected area.
c. Pumping system The experimental chamber is evacuated by a dry-pump and a turbo-molecular pump, which can create a pressure down to a few mPa (Fig. 128). The tube of the spectrometer is additionally evacuated by a turbo-pump and the tube of the pinhole camera by a dry pump (Fig. 129).
Fig. 128: The pumping system used to evacuate the main chamber and the pinhole tube. (a) The control-unit. (b) The dry-pump. (c) The Turbo-molecular pump. A vacuum of a few mPa can be created with this system.
Fig. 129: The differential pumping system used to evacuate the GIS-tube. (a) dry-pump, and (b) turbo-pump.
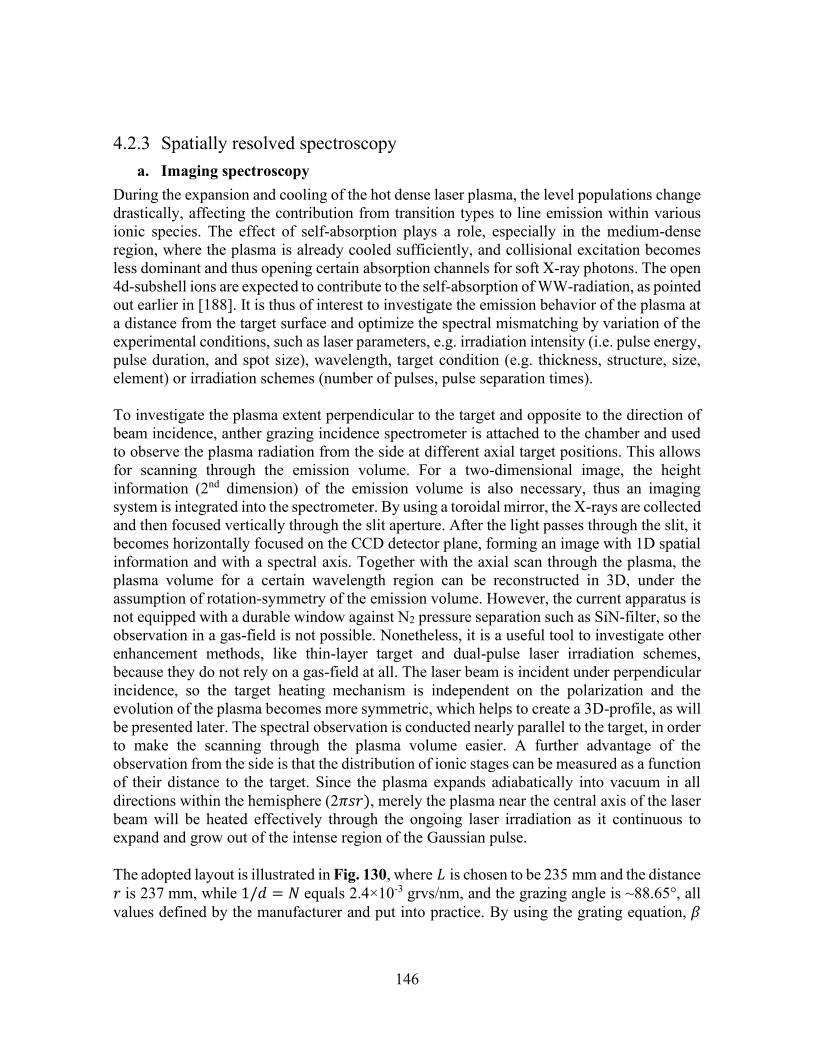
146
4.2.3 Spatially resolved spectroscopy a. Imaging spectroscopy
During the expansion and cooling of the hot dense laser plasma, the level populations change drastically, affecting the contribution from transition types to line emission within various ionic species. The effect of self-absorption plays a role, especially in the medium-dense region, where the plasma is already cooled sufficiently, and collisional excitation becomes less dominant and thus opening certain absorption channels for soft X-ray photons. The open 4d-subshell ions are expected to contribute to the self-absorption of WW-radiation, as pointed out earlier in [188]. It is thus of interest to investigate the emission behavior of the plasma at a distance from the target surface and optimize the spectral mismatching by variation of the experimental conditions, such as laser parameters, e.g. irradiation intensity (i.e. pulse energy, pulse duration, and spot size), wavelength, target condition (e.g. thickness, structure, size, element) or irradiation schemes (number of pulses, pulse separation times). To investigate the plasma extent perpendicular to the target and opposite to the direction of beam incidence, anther grazing incidence spectrometer is attached to the chamber and used to observe the plasma radiation from the side at different axial target positions. This allows for scanning through the emission volume. For a two-dimensional image, the height information (2nd dimension) of the emission volume is also necessary, thus an imaging system is integrated into the spectrometer. By using a toroidal mirror, the X-rays are collected and then focused vertically through the slit aperture. After the light passes through the slit, it becomes horizontally focused on the CCD detector plane, forming an image with 1D spatial information and with a spectral axis. Together with the axial scan through the plasma, the plasma volume for a certain wavelength region can be reconstructed in 3D, under the assumption of rotation-symmetry of the emission volume. However, the current apparatus is not equipped with a durable window against N2 pressure separation such as SiN-filter, so the observation in a gas-field is not possible. Nonetheless, it is a useful tool to investigate other enhancement methods, like thin-layer target and dual-pulse laser irradiation schemes, because they do not rely on a gas-field at all. The laser beam is incident under perpendicular incidence, so the target heating mechanism is independent on the polarization and the evolution of the plasma becomes more symmetric, which helps to create a 3D-profile, as will be presented later. The spectral observation is conducted nearly parallel to the target, in order to make the scanning through the plasma volume easier. A further advantage of the observation from the side is that the distribution of ionic stages can be measured as a function of their distance to the target. Since the plasma expands adiabatically into vacuum in all directions within the hemisphere (2𝜋𝑠𝑟), merely the plasma near the central axis of the laser beam will be heated effectively through the ongoing laser irradiation as it continuous to expand and grow out of the intense region of the Gaussian pulse. The adopted layout is illustrated in Fig. 130, where 𝐿 is chosen to be 235 mm and the distance 𝑟 is 237 mm, while 1/𝑑 = 𝑁 equals 2.4×10⁻³ grvs/nm, and the grazing angle is ~88.65°, all values defined by the manufacturer and put into practice. By using the grating equation, 𝛽
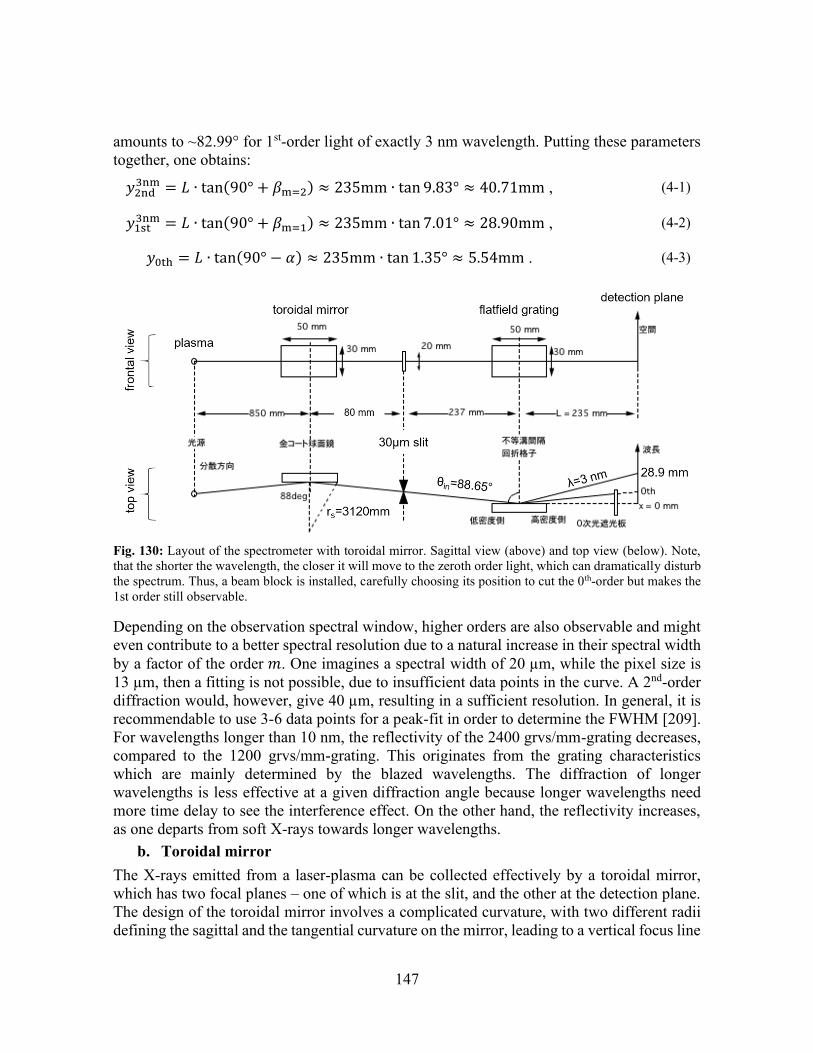
147
amounts to ~82.99° for 1st-order light of exactly 3 nm wavelength. Putting these parameters together, one obtains:
𝑦2nd3nm = 𝐿 ∙ tan(90° + 𝛽m=2) ≈ 235mm ∙ tan 9.83° ≈ 40.71mm , (4-1)
𝑦1st3nm = 𝐿 ∙ tan(90° + 𝛽m=1) ≈ 235mm ∙ tan 7.01° ≈ 28.90mm , (4-2)
𝑦0th = 𝐿 ∙ tan(90° − 𝛼) ≈ 235mm ∙ tan 1.35° ≈ 5.54mm . (4-3)
Fig. 130: Layout of the spectrometer with toroidal mirror. Sagittal view (above) and top view (below). Note, that the shorter the wavelength, the closer it will move to the zeroth order light, which can dramatically disturb the spectrum. Thus, a beam block is installed, carefully choosing its position to cut the 0th-order but makes the 1st order still observable.
Depending on the observation spectral window, higher orders are also observable and might even contribute to a better spectral resolution due to a natural increase in their spectral width by a factor of the order 𝑚. One imagines a spectral width of 20 µm, while the pixel size is 13 µm, then a fitting is not possible, due to insufficient data points in the curve. A 2nd-order diffraction would, however, give 40 µm, resulting in a sufficient resolution. In general, it is recommendable to use 3-6 data points for a peak-fit in order to determine the FWHM [209]. For wavelengths longer than 10 nm, the reflectivity of the 2400 grvs/mm-grating decreases, compared to the 1200 grvs/mm-grating. This originates from the grating characteristics which are mainly determined by the blazed wavelengths. The diffraction of longer wavelengths is less effective at a given diffraction angle because longer wavelengths need more time delay to see the interference effect. On the other hand, the reflectivity increases, as one departs from soft X-rays towards longer wavelengths.
b. Toroidal mirror The X-rays emitted from a laser-plasma can be collected effectively by a toroidal mirror, which has two focal planes – one of which is at the slit, and the other at the detection plane. The design of the toroidal mirror involves a complicated curvature, with two different radii defining the sagittal and the tangential curvature on the mirror, leading to a vertical focus line
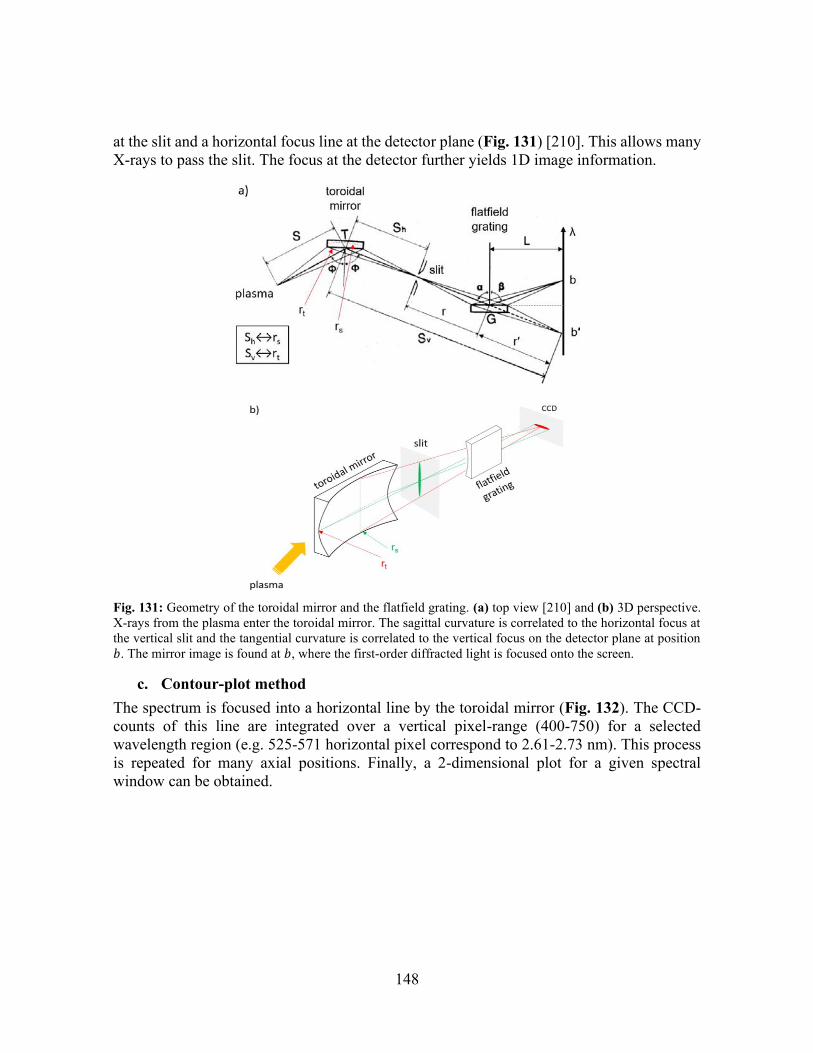
148
at the slit and a horizontal focus line at the detector plane (Fig. 131) [210]. This allows many X-rays to pass the slit. The focus at the detector further yields 1D image information.
Fig. 131: Geometry of the toroidal mirror and the flatfield grating. (a) top view [210] and (b) 3D perspective. X-rays from the plasma enter the toroidal mirror. The sagittal curvature is correlated to the horizontal focus at the vertical slit and the tangential curvature is correlated to the vertical focus on the detector plane at position 𝑏. The mirror image is found at 𝑏, where the first-order diffracted light is focused onto the screen.
c. Contour-plot method The spectrum is focused into a horizontal line by the toroidal mirror (Fig. 132). The CCD-counts of this line are integrated over a vertical pixel-range (400-750) for a selected wavelength region (e.g. 525-571 horizontal pixel correspond to 2.61-2.73 nm). This process is repeated for many axial positions. Finally, a 2-dimensional plot for a given spectral window can be obtained.
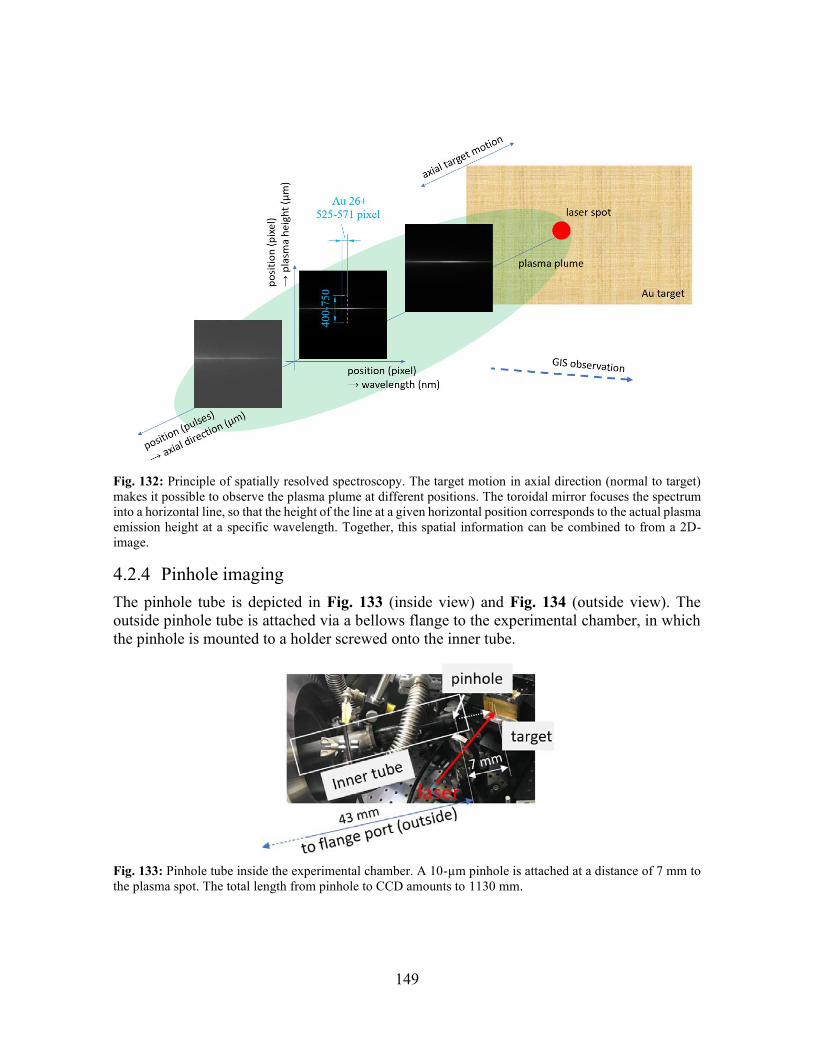
149
Fig. 132: Principle of spatially resolved spectroscopy. The target motion in axial direction (normal to target) makes it possible to observe the plasma plume at different positions. The toroidal mirror focuses the spectrum into a horizontal line, so that the height of the line at a given horizontal position corresponds to the actual plasma emission height at a specific wavelength. Together, this spatial information can be combined to from a 2D-image.
4.2.4 Pinhole imaging The pinhole tube is depicted in Fig. 133 (inside view) and Fig. 134 (outside view). The outside pinhole tube is attached via a bellows flange to the experimental chamber, in which the pinhole is mounted to a holder screwed onto the inner tube.
Fig. 133: Pinhole tube inside the experimental chamber. A 10-µm pinhole is attached at a distance of 7 mm to the plasma spot. The total length from pinhole to CCD amounts to 1130 mm.
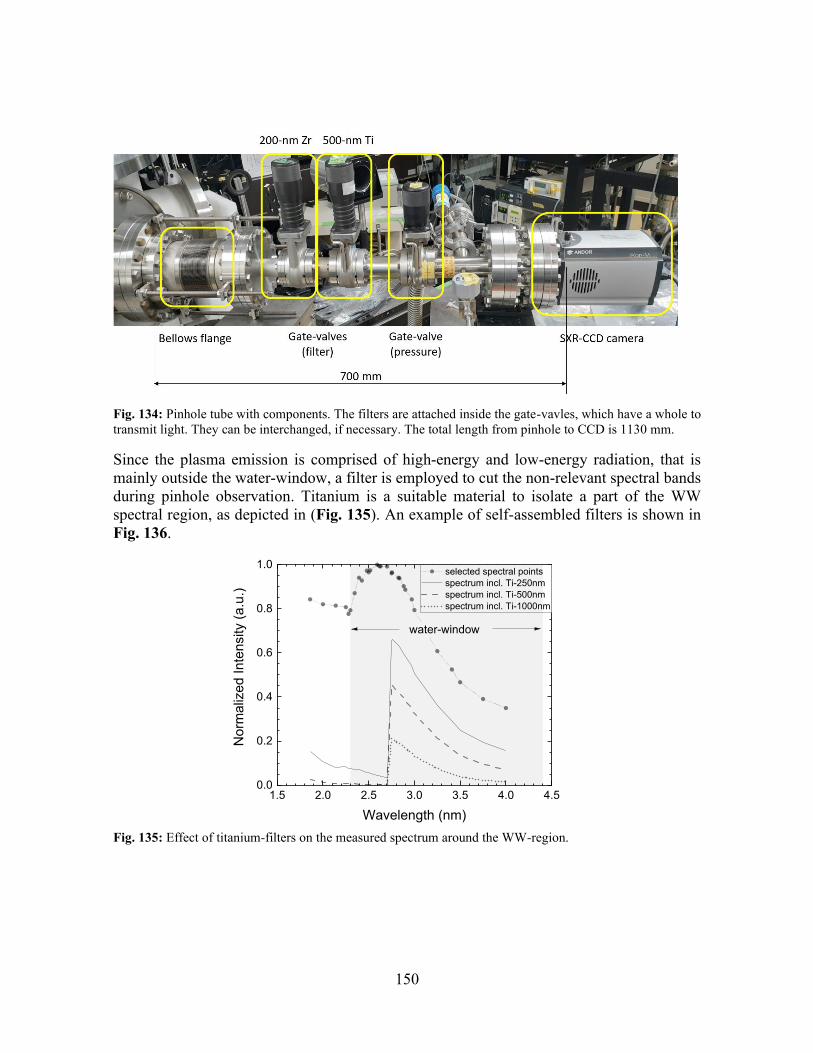
150
Fig. 134: Pinhole tube with components. The filters are attached inside the gate-vavles, which have a whole to transmit light. They can be interchanged, if necessary. The total length from pinhole to CCD is 1130 mm.
Since the plasma emission is comprised of high-energy and low-energy radiation, that is mainly outside the water-window, a filter is employed to cut the non-relevant spectral bands during pinhole observation. Titanium is a suitable material to isolate a part of the WW spectral region, as depicted in (Fig. 135). An example of self-assembled filters is shown in Fig. 136.
1.5 2.0 2.5 3.0 3.5 4.0 4.50.0
0.2
0.4
0.6
0.8
1.0
Nor
mal
ized
Inte
nsity
(a.u
.)
Wavelength (nm)
selected spectral points spectrum incl. Ti-250nm spectrum incl. Ti-500nm spectrum incl. Ti-1000nm
water-window
Fig. 135: Effect of titanium-filters on the measured spectrum around the WW-region.
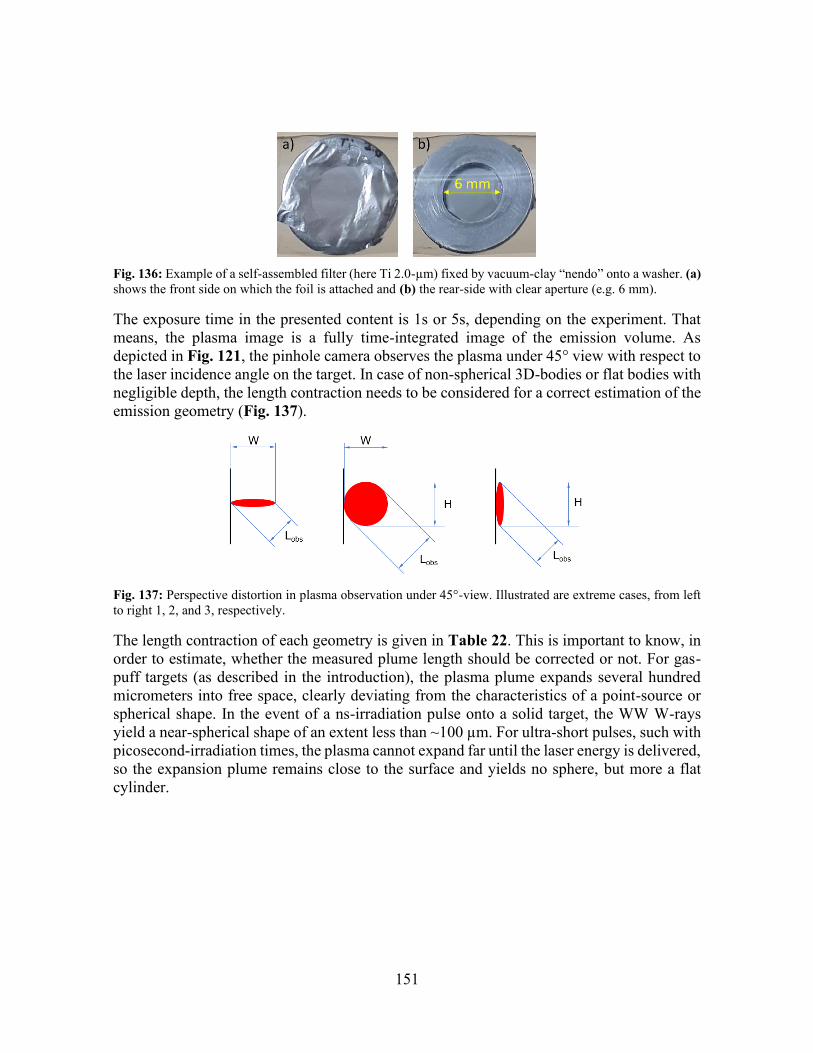
151
Fig. 136: Example of a self-assembled filter (here Ti 2.0-µm) fixed by vacuum-clay “nendo” onto a washer. (a) shows the front side on which the foil is attached and (b) the rear-side with clear aperture (e.g. 6 mm).
The exposure time in the presented content is 1s or 5s, depending on the experiment. That means, the plasma image is a fully time-integrated image of the emission volume. As depicted in Fig. 121, the pinhole camera observes the plasma under 45° view with respect to the laser incidence angle on the target. In case of non-spherical 3D-bodies or flat bodies with negligible depth, the length contraction needs to be considered for a correct estimation of the emission geometry (Fig. 137).
Fig. 137: Perspective distortion in plasma observation under 45°-view. Illustrated are extreme cases, from left to right 1, 2, and 3, respectively.
The length contraction of each geometry is given in Table 22. This is important to know, in order to estimate, whether the measured plume length should be corrected or not. For gas-puff targets (as described in the introduction), the plasma plume expands several hundred micrometers into free space, clearly deviating from the characteristics of a point-source or spherical shape. In the event of a ns-irradiation pulse onto a solid target, the WW W-rays yield a near-spherical shape of an extent less than ~100 µm. For ultra-short pulses, such with picosecond-irradiation times, the plasma cannot expand far until the laser energy is delivered, so the expansion plume remains close to the surface and yields no sphere, but more a flat cylinder.
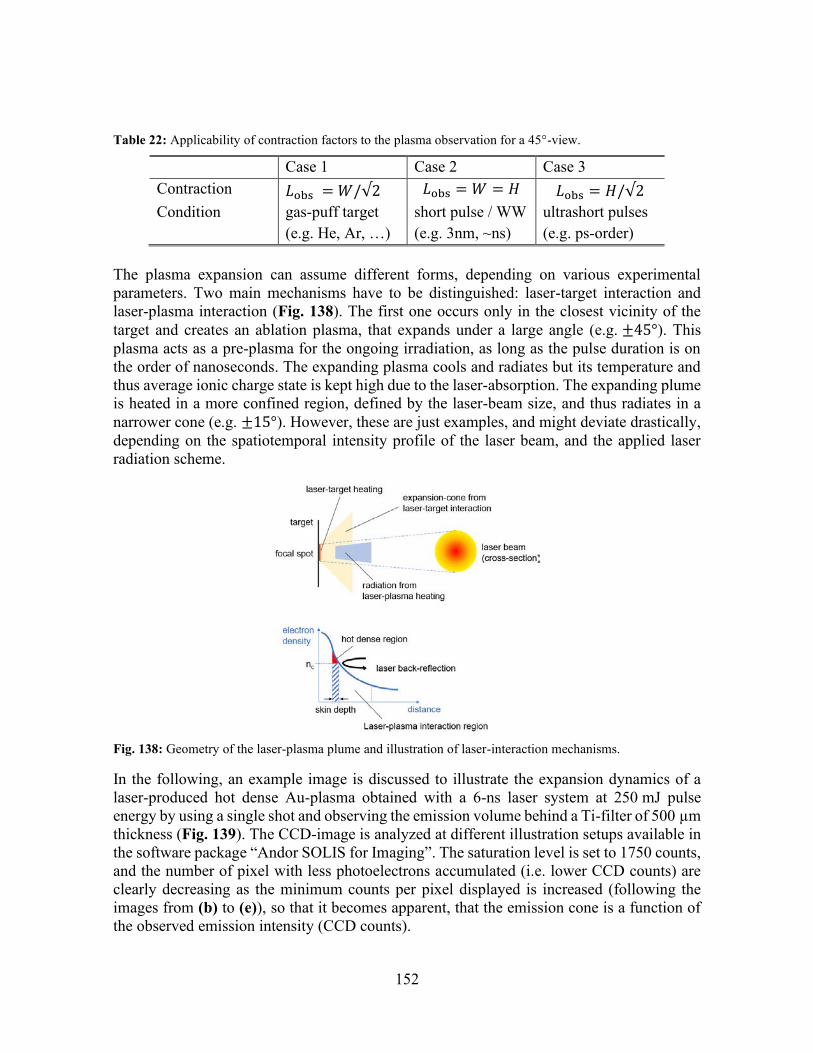
152
Table 22: Applicability of contraction factors to the plasma observation for a 45°-view.
Case 1 Case 2 Case 3 Contraction 𝐿obs = 𝑊/√2 𝐿obs = 𝑊 = 𝐻 𝐿obs = 𝐻/√2 Condition gas-puff target
(e.g. He, Ar, …) short pulse / WW (e.g. 3nm, ~ns)
ultrashort pulses (e.g. ps-order)
The plasma expansion can assume different forms, depending on various experimental parameters. Two main mechanisms have to be distinguished: laser-target interaction and laser-plasma interaction (Fig. 138). The first one occurs only in the closest vicinity of the target and creates an ablation plasma, that expands under a large angle (e.g. ±45°). This plasma acts as a pre-plasma for the ongoing irradiation, as long as the pulse duration is on the order of nanoseconds. The expanding plasma cools and radiates but its temperature and thus average ionic charge state is kept high due to the laser-absorption. The expanding plume is heated in a more confined region, defined by the laser-beam size, and thus radiates in a narrower cone (e.g. ±15°). However, these are just examples, and might deviate drastically, depending on the spatiotemporal intensity profile of the laser beam, and the applied laser radiation scheme.
Fig. 138: Geometry of the laser-plasma plume and illustration of laser-interaction mechanisms.
In the following, an example image is discussed to illustrate the expansion dynamics of a laser-produced hot dense Au-plasma obtained with a 6-ns laser system at 250 mJ pulse energy by using a single shot and observing the emission volume behind a Ti-filter of 500 µm thickness (Fig. 139). The CCD-image is analyzed at different illustration setups available in the software package “Andor SOLIS for Imaging”. The saturation level is set to 1750 counts, and the number of pixel with less photoelectrons accumulated (i.e. lower CCD counts) are clearly decreasing as the minimum counts per pixel displayed is increased (following the images from (b) to (e)), so that it becomes apparent, that the emission cone is a function of the observed emission intensity (CCD counts).
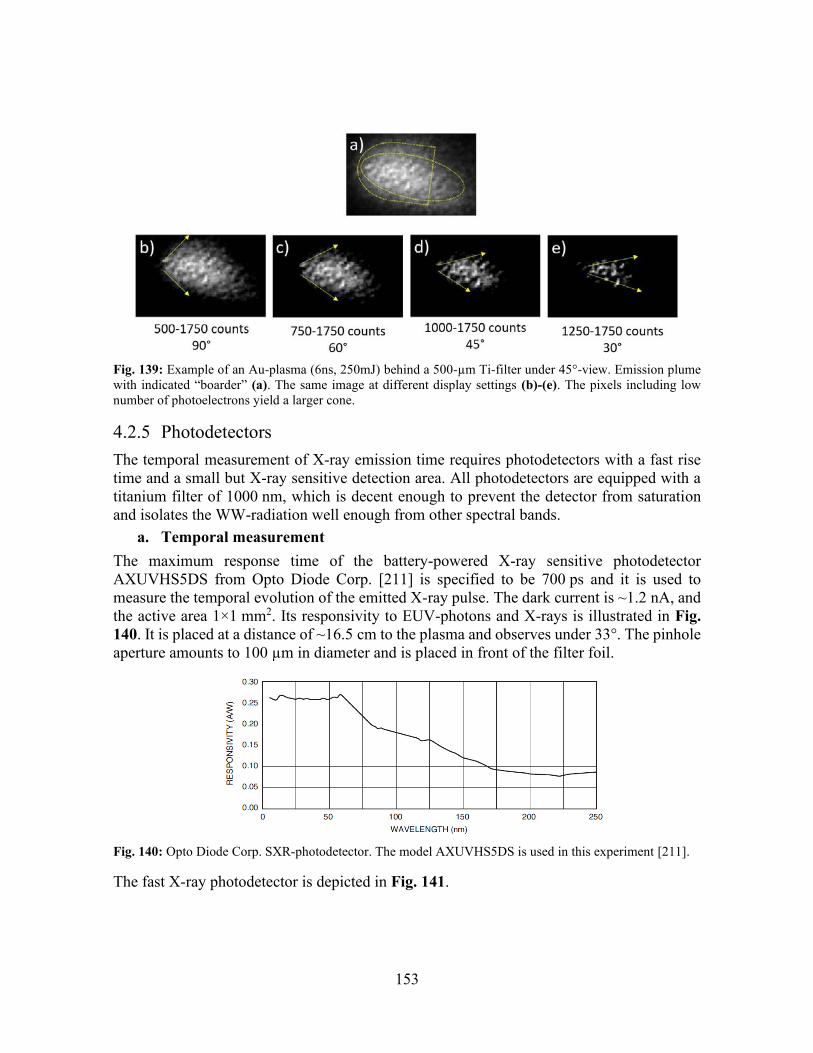
153
Fig. 139: Example of an Au-plasma (6ns, 250mJ) behind a 500-µm Ti-filter under 45°-view. Emission plume with indicated “boarder” (a). The same image at different display settings (b)-(e). The pixels including low number of photoelectrons yield a larger cone.
4.2.5 Photodetectors The temporal measurement of X-ray emission time requires photodetectors with a fast rise time and a small but X-ray sensitive detection area. All photodetectors are equipped with a titanium filter of 1000 nm, which is decent enough to prevent the detector from saturation and isolates the WW-radiation well enough from other spectral bands.
a. Temporal measurement The maximum response time of the battery-powered X-ray sensitive photodetector AXUVHS5DS from Opto Diode Corp. [211] is specified to be 700 ps and it is used to measure the temporal evolution of the emitted X-ray pulse. The dark current is ~1.2 nA, and the active area 1×1 mm2. Its responsivity to EUV-photons and X-rays is illustrated in Fig. 140. It is placed at a distance of ~16.5 cm to the plasma and observes under 33°. The pinhole aperture amounts to 100 µm in diameter and is placed in front of the filter foil.
Fig. 140: Opto Diode Corp. SXR-photodetector. The model AXUVHS5DS is used in this experiment [211].
The fast X-ray photodetector is depicted in Fig. 141.
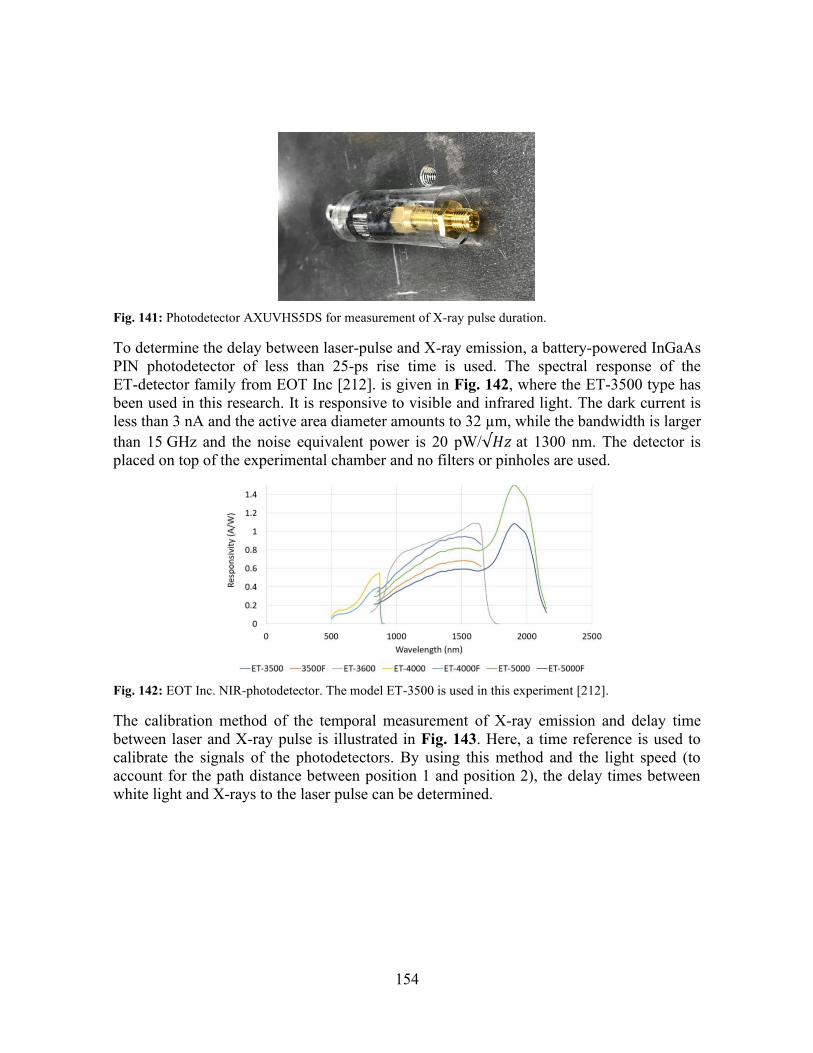
154
Fig. 141: Photodetector AXUVHS5DS for measurement of X-ray pulse duration.
To determine the delay between laser-pulse and X-ray emission, a battery-powered InGaAs PIN photodetector of less than 25-ps rise time is used. The spectral response of the ET-detector family from EOT Inc [212]. is given in Fig. 142, where the ET-3500 type has been used in this research. It is responsive to visible and infrared light. The dark current is less than 3 nA and the active area diameter amounts to 32 µm, while the bandwidth is larger than 15 GHz and the noise equivalent power is 20 pW/√𝐻𝑧 at 1300 nm. The detector is placed on top of the experimental chamber and no filters or pinholes are used.
Fig. 142: EOT Inc. NIR-photodetector. The model ET-3500 is used in this experiment [212].
The calibration method of the temporal measurement of X-ray emission and delay time between laser and X-ray pulse is illustrated in Fig. 143. Here, a time reference is used to calibrate the signals of the photodetectors. By using this method and the light speed (to account for the path distance between position 1 and position 2), the delay times between white light and X-rays to the laser pulse can be determined.
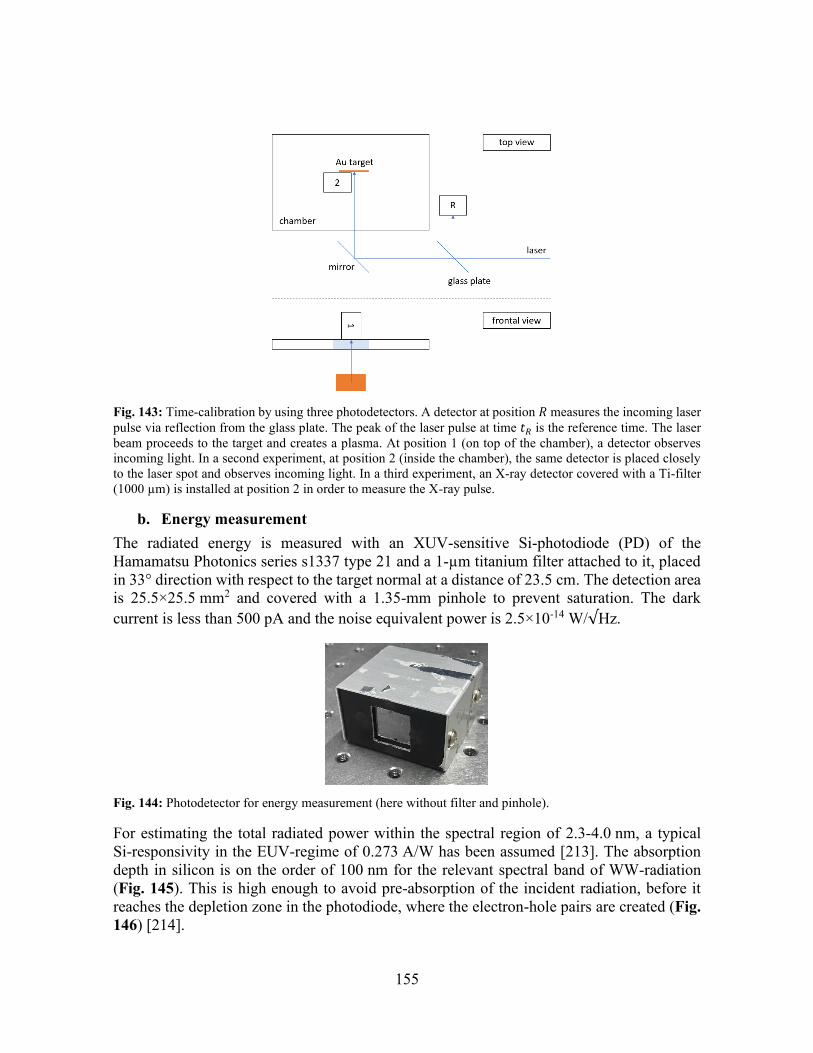
155
Fig. 143: Time-calibration by using three photodetectors. A detector at position 𝑅 measures the incoming laser pulse via reflection from the glass plate. The peak of the laser pulse at time 𝑡𝑅 is the reference time. The laser beam proceeds to the target and creates a plasma. At position 1 (on top of the chamber), a detector observes incoming light. In a second experiment, at position 2 (inside the chamber), the same detector is placed closely to the laser spot and observes incoming light. In a third experiment, an X-ray detector covered with a Ti-filter (1000 µm) is installed at position 2 in order to measure the X-ray pulse.
b. Energy measurement The radiated energy is measured with an XUV-sensitive Si-photodiode (PD) of the Hamamatsu Photonics series s1337 type 21 and a 1-µm titanium filter attached to it, placed in 33° direction with respect to the target normal at a distance of 23.5 cm. The detection area is 25.5×25.5 mm2 and covered with a 1.35-mm pinhole to prevent saturation. The dark current is less than 500 pA and the noise equivalent power is 2.5×10⁻¹⁴ W/√Hz.
Fig. 144: Photodetector for energy measurement (here without filter and pinhole).
For estimating the total radiated power within the spectral region of 2.3-4.0 nm, a typical Si-responsivity in the EUV-regime of 0.273 A/W has been assumed [213]. The absorption depth in silicon is on the order of 100 nm for the relevant spectral band of WW-radiation (Fig. 145). This is high enough to avoid pre-absorption of the incident radiation, before it reaches the depletion zone in the photodiode, where the electron-hole pairs are created (Fig. 146) [214].
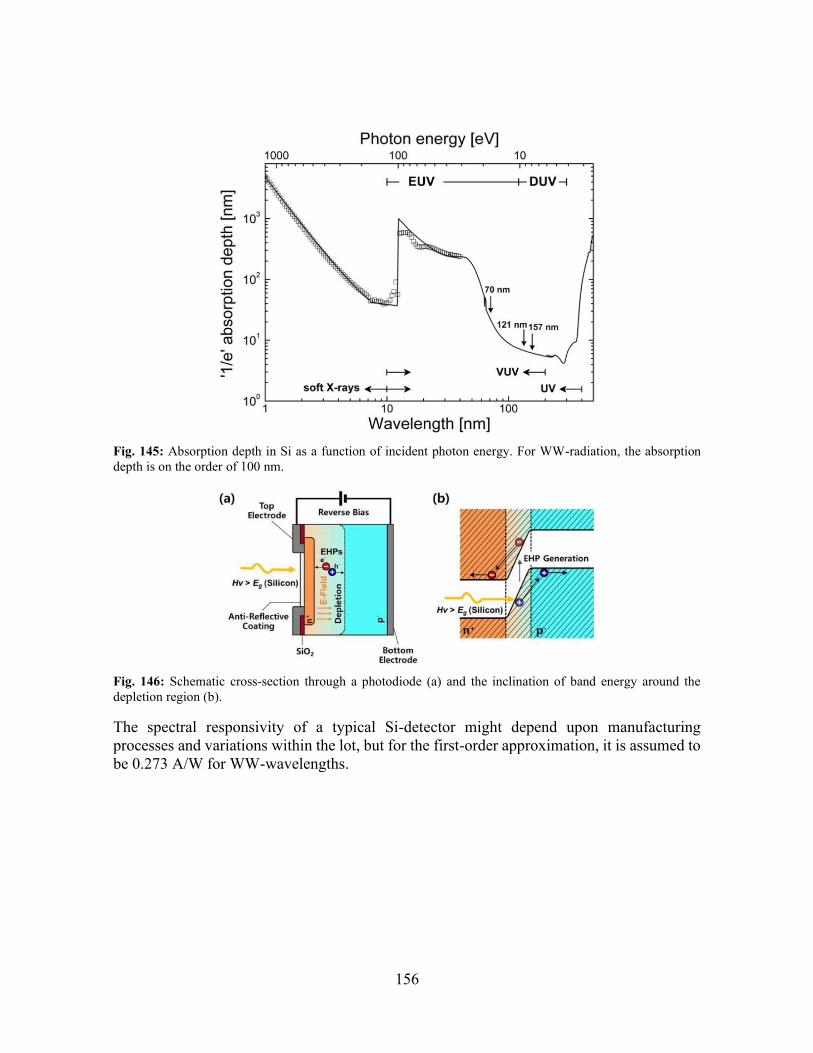
156
Fig. 145: Absorption depth in Si as a function of incident photon energy. For WW-radiation, the absorption depth is on the order of 100 nm.
Fig. 146: Schematic cross-section through a photodiode (a) and the inclination of band energy around the depletion region (b).
The spectral responsivity of a typical Si-detector might depend upon manufacturing processes and variations within the lot, but for the first-order approximation, it is assumed to be 0.273 A/W for WW-wavelengths.
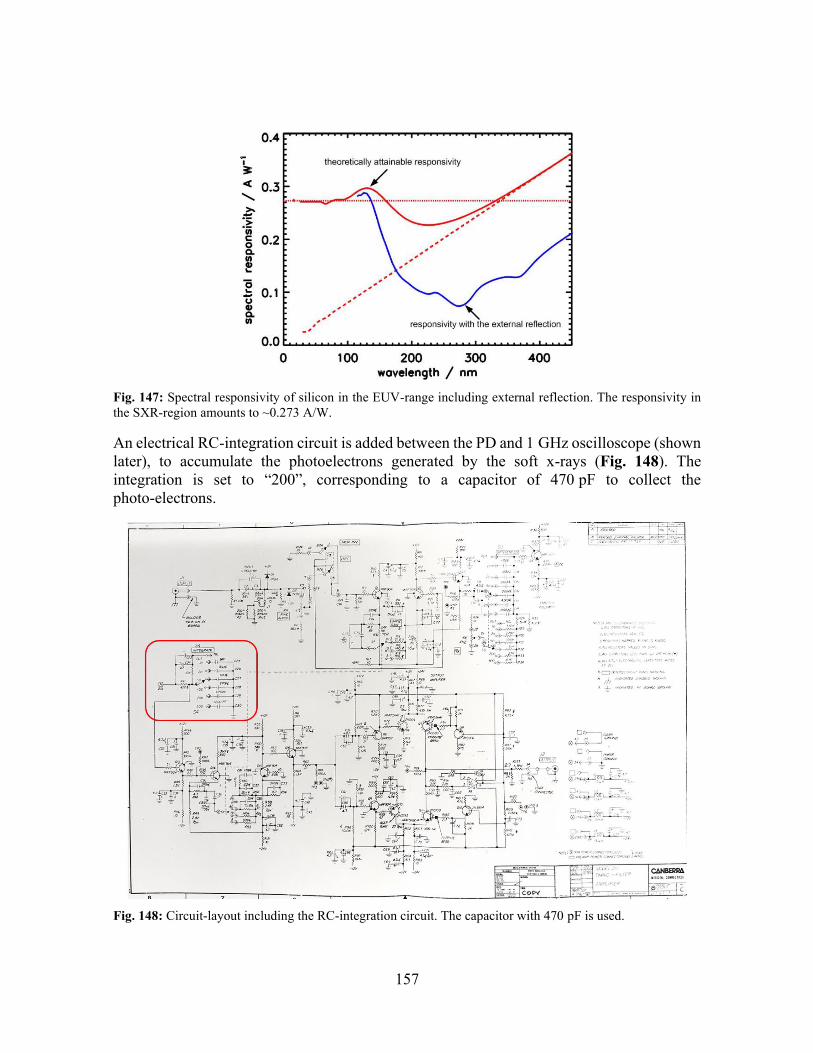
157
Fig. 147: Spectral responsivity of silicon in the EUV-range including external reflection. The responsivity in the SXR-region amounts to ~0.273 A/W.
An electrical RC-integration circuit is added between the PD and 1 GHz oscilloscope (shown later), to accumulate the photoelectrons generated by the soft x-rays (Fig. 148). The integration is set to “200”, corresponding to a capacitor of 470 pF to collect the photo-electrons.
Fig. 148: Circuit-layout including the RC-integration circuit. The capacitor with 470 pF is used.
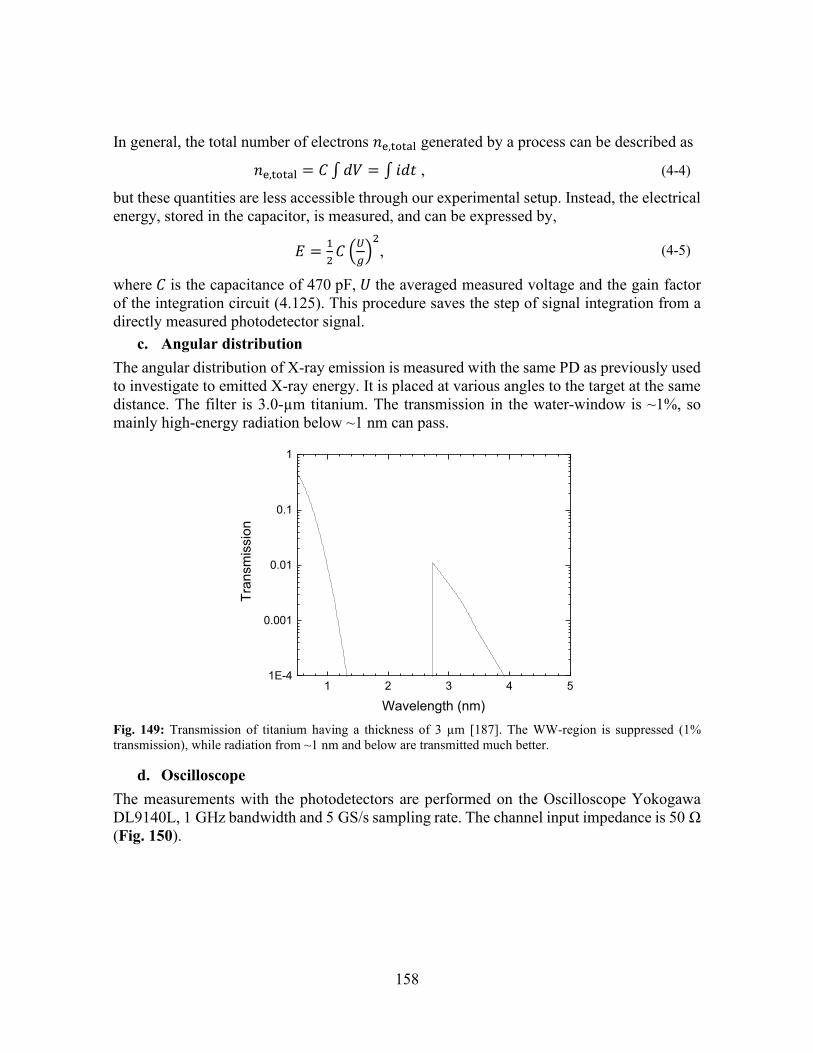
158
In general, the total number of electrons 𝑛e,total generated by a process can be described as
𝑛e,total = 𝐶 ∫ 𝑑𝑉 = ∫ 𝑖𝑑𝑡 , (4-4)
but these quantities are less accessible through our experimental setup. Instead, the electrical energy, stored in the capacitor, is measured, and can be expressed by,
𝐸 =1
2𝐶 (
𝑈
𝑔)
2
, (4-5)
where 𝐶 is the capacitance of 470 pF, 𝑈 the averaged measured voltage and the gain factor of the integration circuit (4.125). This procedure saves the step of signal integration from a directly measured photodetector signal.
c. Angular distribution The angular distribution of X-ray emission is measured with the same PD as previously used to investigate to emitted X-ray energy. It is placed at various angles to the target at the same distance. The filter is 3.0-µm titanium. The transmission in the water-window is ~1%, so mainly high-energy radiation below ~1 nm can pass.
1 2 3 4 51E-4
0.001
0.01
0.1
1
Tran
smis
sion
Wavelength (nm) Fig. 149: Transmission of titanium having a thickness of 3 µm [187]. The WW-region is suppressed (1% transmission), while radiation from ~1 nm and below are transmitted much better.
d. Oscilloscope The measurements with the photodetectors are performed on the Oscilloscope Yokogawa DL9140L, 1 GHz bandwidth and 5 GS/s sampling rate. The channel input impedance is 50 Ω (Fig. 150).
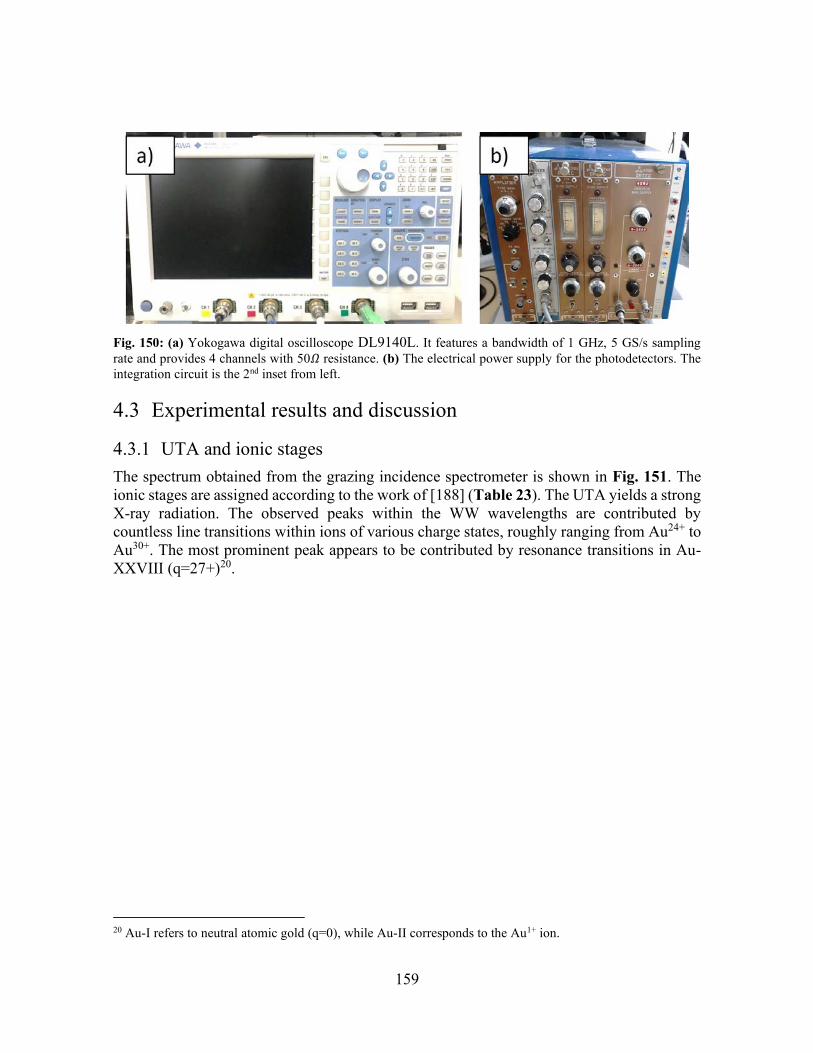
159
Fig. 150: (a) Yokogawa digital oscilloscope DL9140L. It features a bandwidth of 1 GHz, 5 GS/s sampling rate and provides 4 channels with 50𝛺 resistance. (b) The electrical power supply for the photodetectors. The integration circuit is the 2nd inset from left.
4.3 Experimental results and discussion
4.3.1 UTA and ionic stages The spectrum obtained from the grazing incidence spectrometer is shown in Fig. 151. The ionic stages are assigned according to the work of [188] (Table 23). The UTA yields a strong X-ray radiation. The observed peaks within the WW wavelengths are contributed by countless line transitions within ions of various charge states, roughly ranging from Au24+ to Au30+. The most prominent peak appears to be contributed by resonance transitions in Au-XXVIII (q=27+)20.
20 Au-I refers to neutral atomic gold (q=0), while Au-II corresponds to the Au1+ ion.
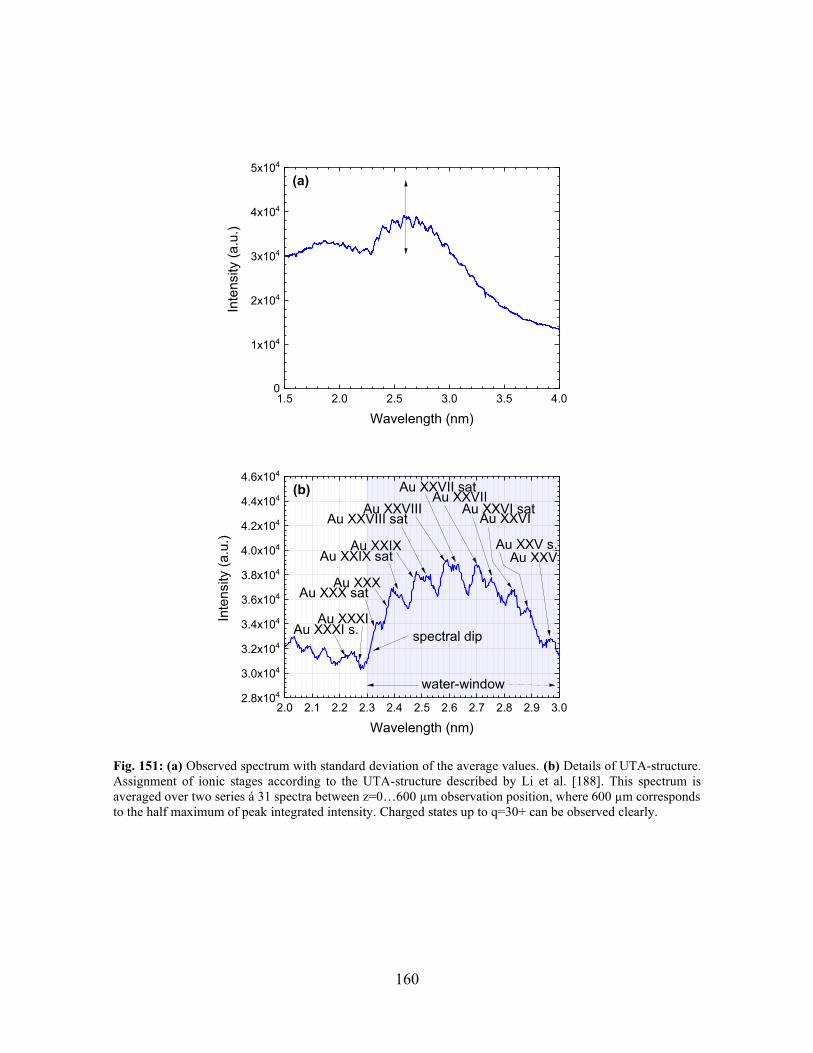
160
1.5 2.0 2.5 3.0 3.5 4.00
1x10⁴
2x10⁴
3x10⁴
4x10⁴
5x10⁴
Inte
nsity
(a.u
.)
Wavelength (nm)
(a)
2.0 2.1 2.2 2.3 2.4 2.5 2.6 2.7 2.8 2.9 3.02.8x104
3.0x10⁴
3.2x10⁴
3.4x10⁴
3.6x10⁴
3.8x10⁴
4.0x10⁴
4.2x10⁴
4.4x10⁴
4.6x10⁴
Inte
nsity
(a.u
.)
Wavelength (nm)
Au XXVIIIAu XXVII sat
Au XXVIII sat
Au XXIXAu XXIX sat
Au XXXAu XXX sat
Au XXVIIAu XXVI sat
Au XXVI
Au XXXIAu XXXI s.
Au XXV s.Au XXV
spectral dip
water-window
(b)
Fig. 151: (a) Observed spectrum with standard deviation of the average values. (b) Details of UTA-structure. Assignment of ionic stages according to the UTA-structure described by Li et al. [188]. This spectrum is averaged over two series á 31 spectra between z=0…600 µm observation position, where 600 µm corresponds to the half maximum of peak integrated intensity. Charged states up to q=30+ can be observed clearly.
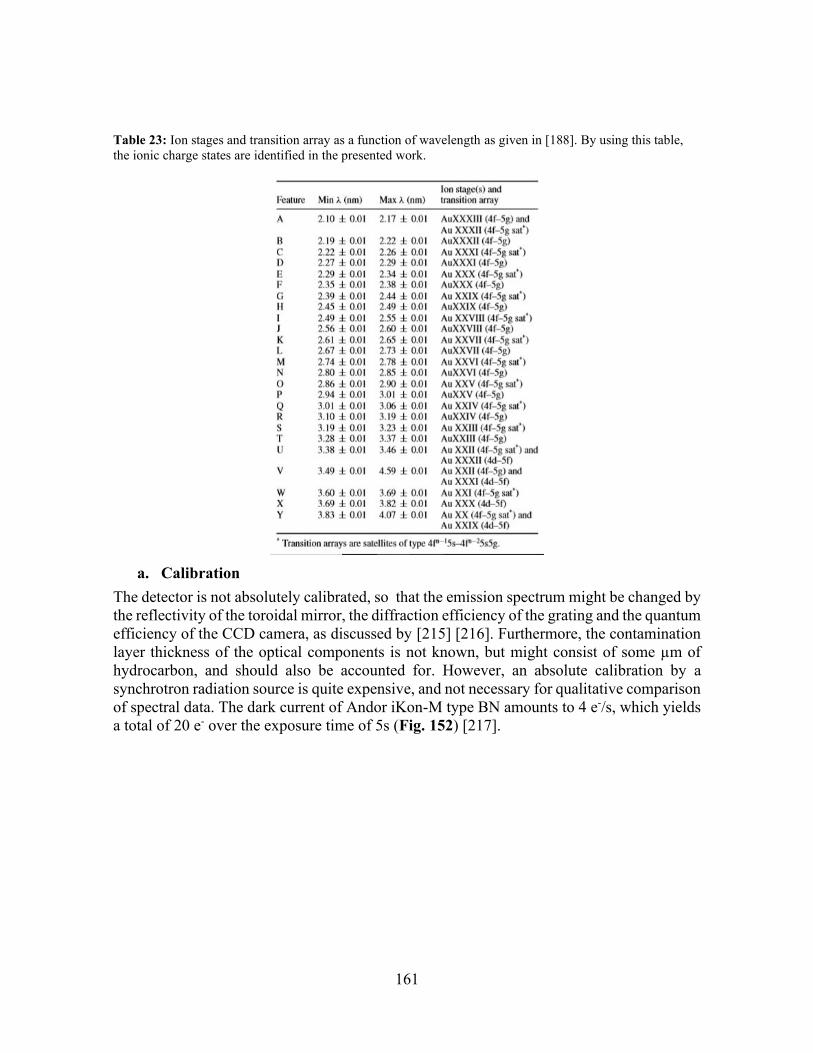
161
Table 23: Ion stages and transition array as a function of wavelength as given in [188]. By using this table, the ionic charge states are identified in the presented work.
a. Calibration
The detector is not absolutely calibrated, so that the emission spectrum might be changed by the reflectivity of the toroidal mirror, the diffraction efficiency of the grating and the quantum efficiency of the CCD camera, as discussed by [215] [216]. Furthermore, the contamination layer thickness of the optical components is not known, but might consist of some µm of hydrocarbon, and should also be accounted for. However, an absolute calibration by a synchrotron radiation source is quite expensive, and not necessary for qualitative comparison of spectral data. The dark current of Andor iKon-M type BN amounts to 4 e-/s, which yields a total of 20 e- over the exposure time of 5s (Fig. 152) [217].
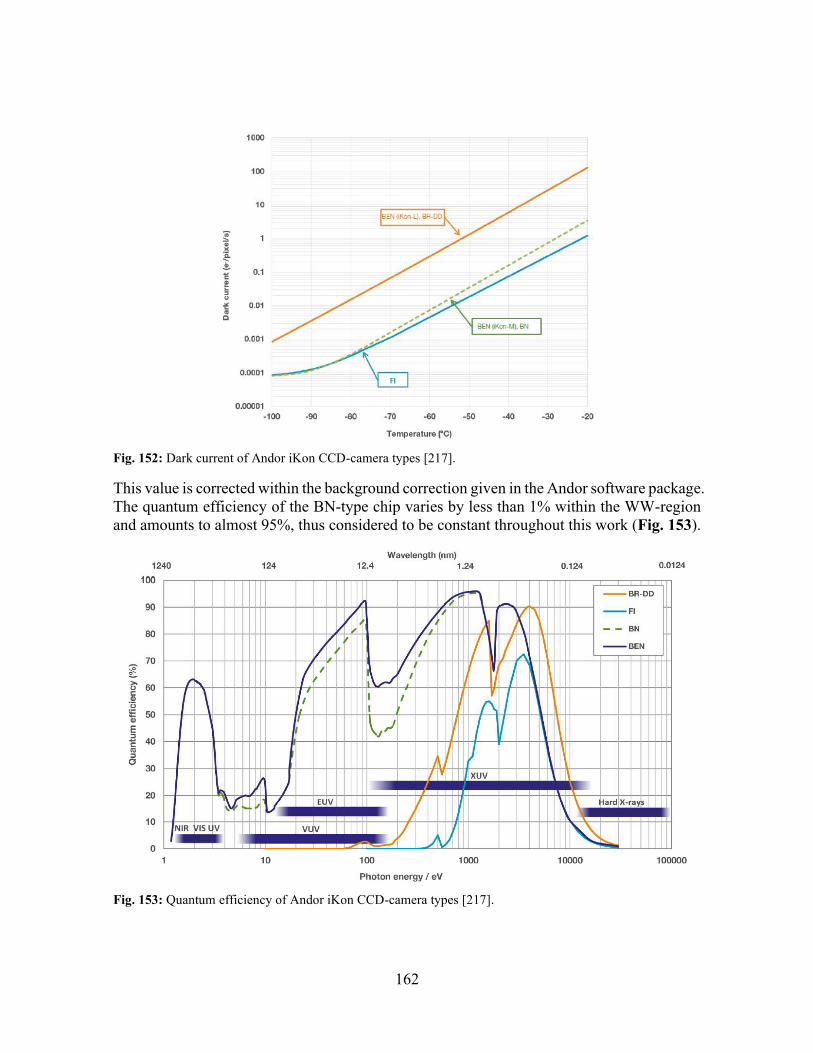
162
Fig. 152: Dark current of Andor iKon CCD-camera types [217].
This value is corrected within the background correction given in the Andor software package. The quantum efficiency of the BN-type chip varies by less than 1% within the WW-region and amounts to almost 95%, thus considered to be constant throughout this work (Fig. 153).
Fig. 153: Quantum efficiency of Andor iKon CCD-camera types [217].
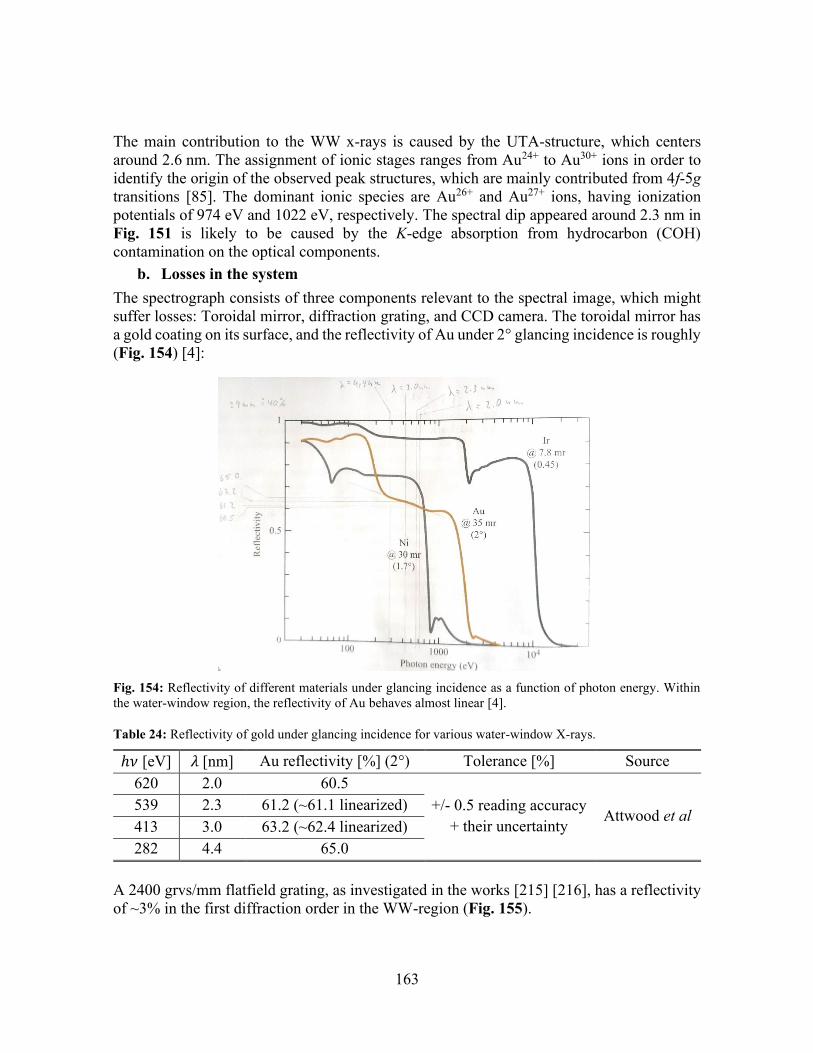
163
The main contribution to the WW x-rays is caused by the UTA-structure, which centers around 2.6 nm. The assignment of ionic stages ranges from Au24+ to Au30+ ions in order to identify the origin of the observed peak structures, which are mainly contributed from 4f-5g transitions [85]. The dominant ionic species are Au26+ and Au27+ ions, having ionization potentials of 974 eV and 1022 eV, respectively. The spectral dip appeared around 2.3 nm in Fig. 151 is likely to be caused by the K-edge absorption from hydrocarbon (COH) contamination on the optical components.
b. Losses in the system The spectrograph consists of three components relevant to the spectral image, which might suffer losses: Toroidal mirror, diffraction grating, and CCD camera. The toroidal mirror has a gold coating on its surface, and the reflectivity of Au under 2° glancing incidence is roughly (Fig. 154) [4]:
Fig. 154: Reflectivity of different materials under glancing incidence as a function of photon energy. Within the water-window region, the reflectivity of Au behaves almost linear [4].
Table 24: Reflectivity of gold under glancing incidence for various water-window X-rays.
ℎ𝜈 [eV] 𝜆 [nm] Au reflectivity [%] (2°) Tolerance [%] Source 620 2.0 60.5
+/- 0.5 reading accuracy + their uncertainty Attwood et al
539 2.3 61.2 (~61.1 linearized) 413 3.0 63.2 (~62.4 linearized) 282 4.4 65.0
A 2400 grvs/mm flatfield grating, as investigated in the works [215] [216], has a reflectivity of ~3% in the first diffraction order in the WW-region (Fig. 155).
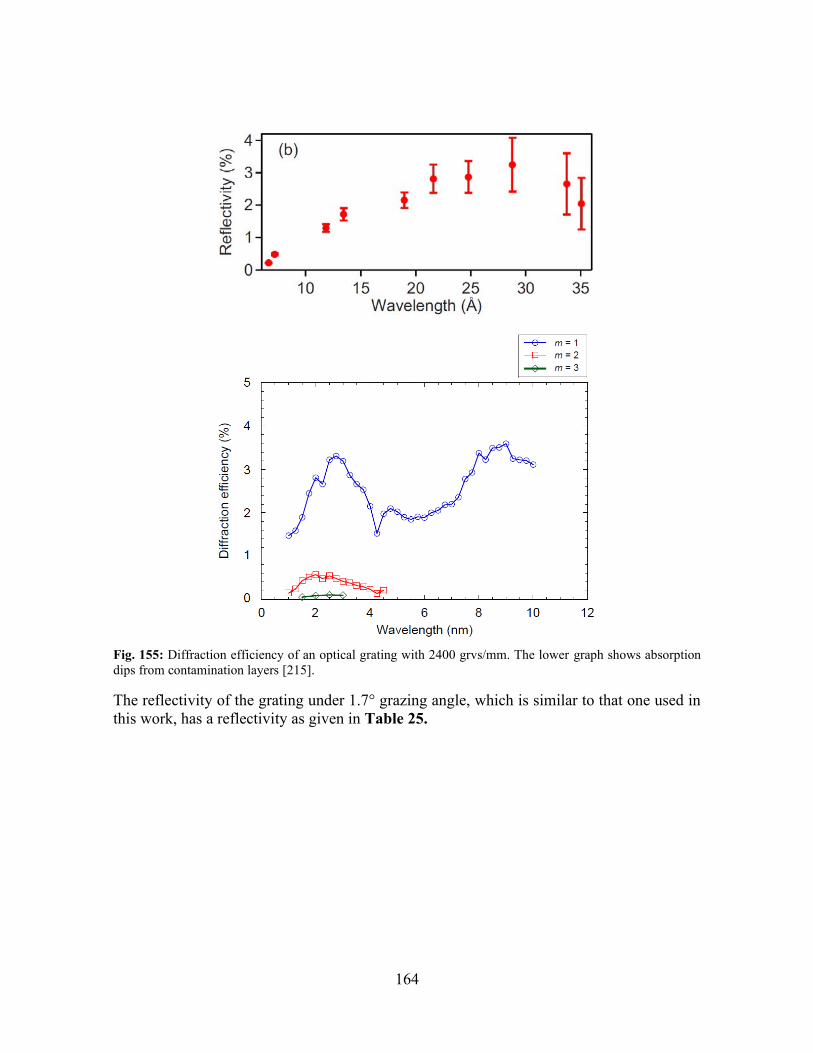
164
Fig. 155: Diffraction efficiency of an optical grating with 2400 grvs/mm. The lower graph shows absorption dips from contamination layers [215].
The reflectivity of the grating under 1.7° grazing angle, which is similar to that one used in this work, has a reflectivity as given in Table 25.
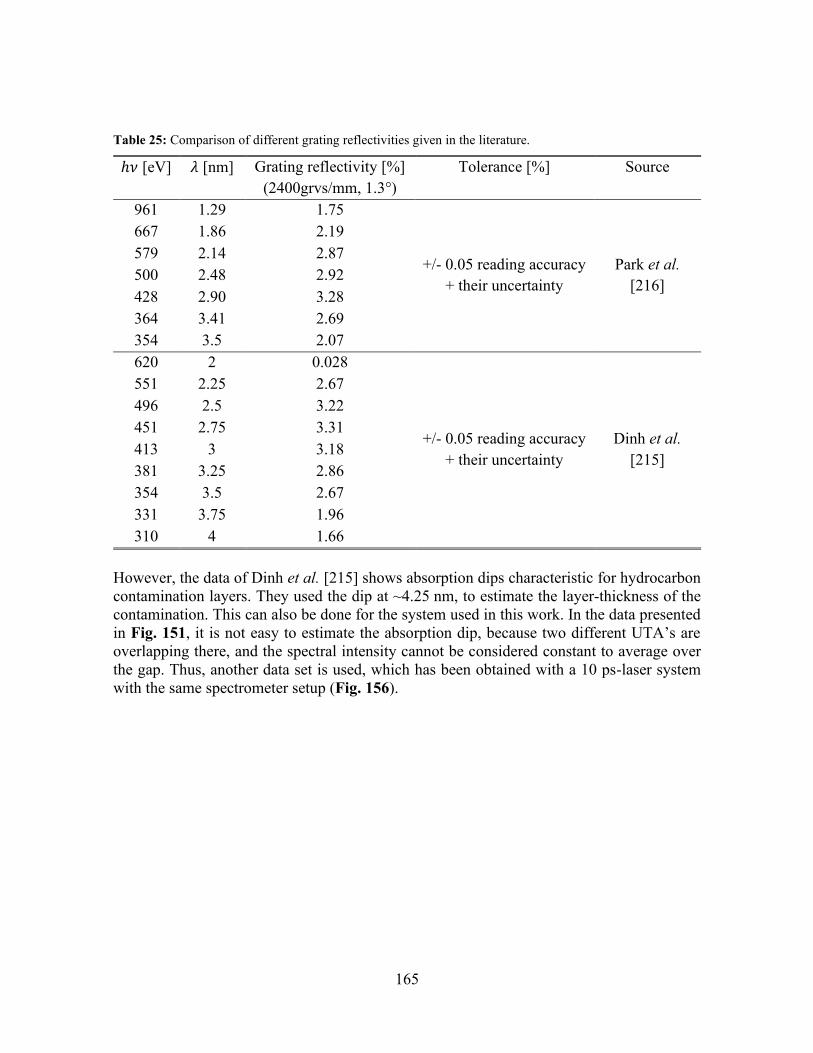
165
Table 25: Comparison of different grating reflectivities given in the literature.
ℎ𝜈 [eV] 𝜆 [nm] Grating reflectivity [%] (2400grvs/mm, 1.3°)
Tolerance [%] Source
961 1.29 1.75
+/- 0.05 reading accuracy + their uncertainty
Park et al. [216]
667 1.86 2.19 579 2.14 2.87 500 2.48 2.92 428 2.90 3.28 364 3.41 2.69 354 3.5 2.07 620 2 0.028
+/- 0.05 reading accuracy + their uncertainty
Dinh et al. [215]
551 2.25 2.67 496 2.5 3.22 451 2.75 3.31 413 3 3.18 381 3.25 2.86 354 3.5 2.67 331 3.75 1.96 310 4 1.66
However, the data of Dinh et al. [215] shows absorption dips characteristic for hydrocarbon contamination layers. They used the dip at ~4.25 nm, to estimate the layer-thickness of the contamination. This can also be done for the system used in this work. In the data presented in Fig. 151, it is not easy to estimate the absorption dip, because two different UTA’s are overlapping there, and the spectral intensity cannot be considered constant to average over the gap. Thus, another data set is used, which has been obtained with a 10 ps-laser system with the same spectrometer setup (Fig. 156).
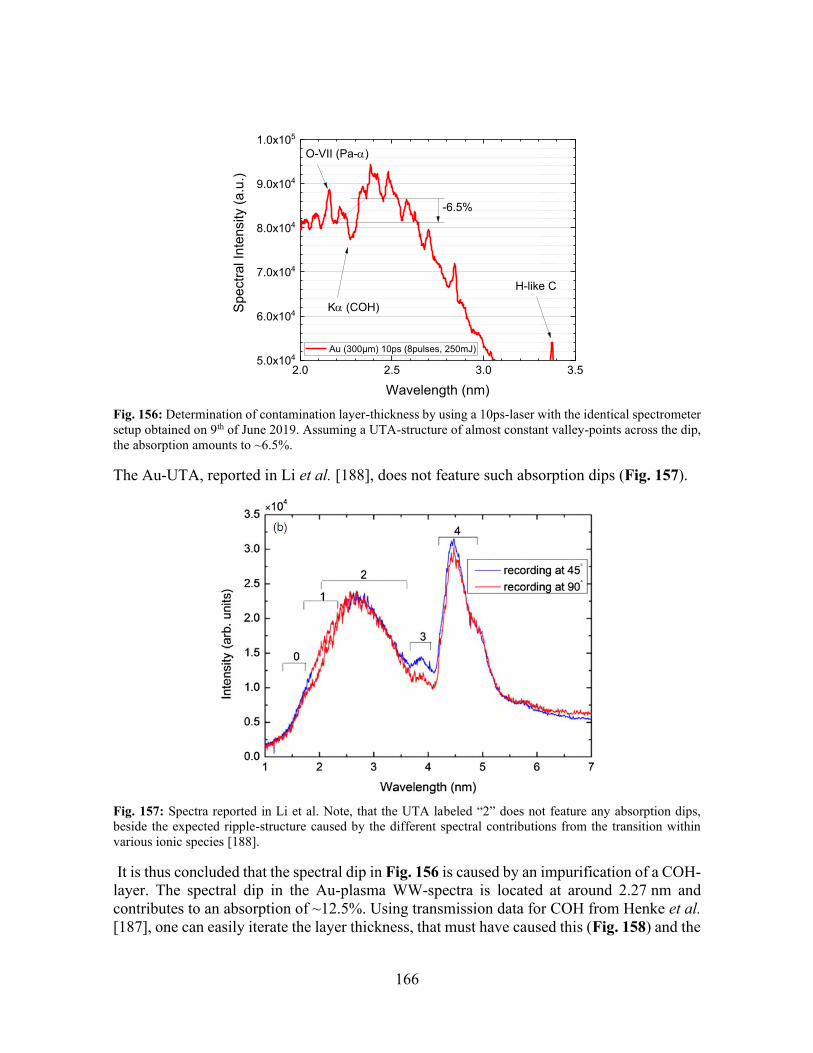
166
2.0 2.5 3.0 3.55.0x104
6.0x10⁴
7.0x10⁴
8.0x10⁴
9.0x10⁴
1.0x10⁵
Spec
tral I
nten
sity
(a.u
.)
Wavelength (nm)
Au (300µm) 10ps (8pulses, 250mJ)
Ka (COH)
O-VII (Pa-a)
H-like C
-6.5%
Fig. 156: Determination of contamination layer-thickness by using a 10ps-laser with the identical spectrometer setup obtained on 9th of June 2019. Assuming a UTA-structure of almost constant valley-points across the dip, the absorption amounts to ~6.5%.
The Au-UTA, reported in Li et al. [188], does not feature such absorption dips (Fig. 157).
Fig. 157: Spectra reported in Li et al. Note, that the UTA labeled “2” does not feature any absorption dips, beside the expected ripple-structure caused by the different spectral contributions from the transition within various ionic species [188].
It is thus concluded that the spectral dip in Fig. 156 is caused by an impurification of a COH-layer. The spectral dip in the Au-plasma WW-spectra is located at around 2.27 nm and contributes to an absorption of ~12.5%. Using transmission data for COH from Henke et al. [187], one can easily iterate the layer thickness, that must have caused this (Fig. 158) and the
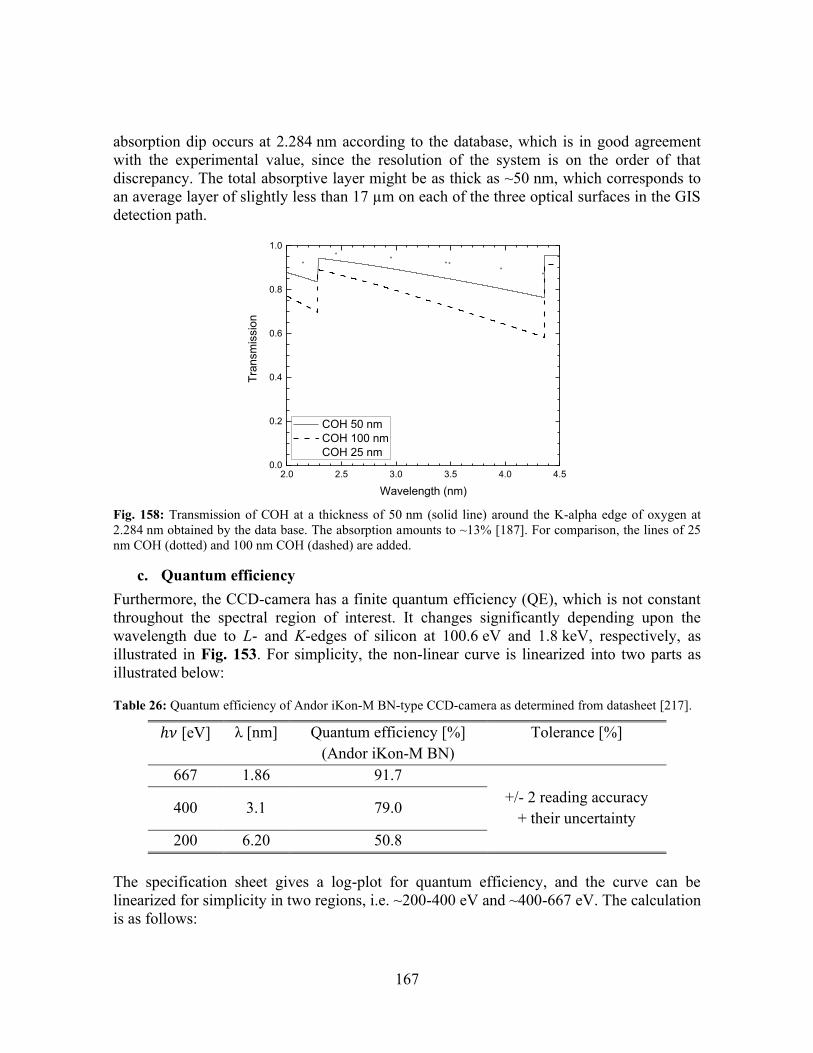
167
absorption dip occurs at 2.284 nm according to the database, which is in good agreement with the experimental value, since the resolution of the system is on the order of that discrepancy. The total absorptive layer might be as thick as ~50 nm, which corresponds to an average layer of slightly less than 17 µm on each of the three optical surfaces in the GIS detection path.
2.0 2.5 3.0 3.5 4.0 4.50.0
0.2
0.4
0.6
0.8
1.0
COH 50 nm COH 100 nm COH 25 nm
Tran
smis
sion
Wavelength (nm) Fig. 158: Transmission of COH at a thickness of 50 nm (solid line) around the K-alpha edge of oxygen at 2.284 nm obtained by the data base. The absorption amounts to ~13% [187]. For comparison, the lines of 25 nm COH (dotted) and 100 nm COH (dashed) are added.
c. Quantum efficiency Furthermore, the CCD-camera has a finite quantum efficiency (QE), which is not constant throughout the spectral region of interest. It changes significantly depending upon the wavelength due to L- and K-edges of silicon at 100.6 eV and 1.8 keV, respectively, as illustrated in Fig. 153. For simplicity, the non-linear curve is linearized into two parts as illustrated below:
Table 26: Quantum efficiency of Andor iKon-M BN-type CCD-camera as determined from datasheet [217].
ℎ𝜈 [eV] λ [nm] Quantum efficiency [%] (Andor iKon-M BN)
Tolerance [%]
667 1.86 91.7 +/- 2 reading accuracy
+ their uncertainty 400 3.1 79.0
200 6.20 50.8 The specification sheet gives a log-plot for quantum efficiency, and the curve can be linearized for simplicity in two regions, i.e. ~200-400 eV and ~400-667 eV. The calculation is as follows:
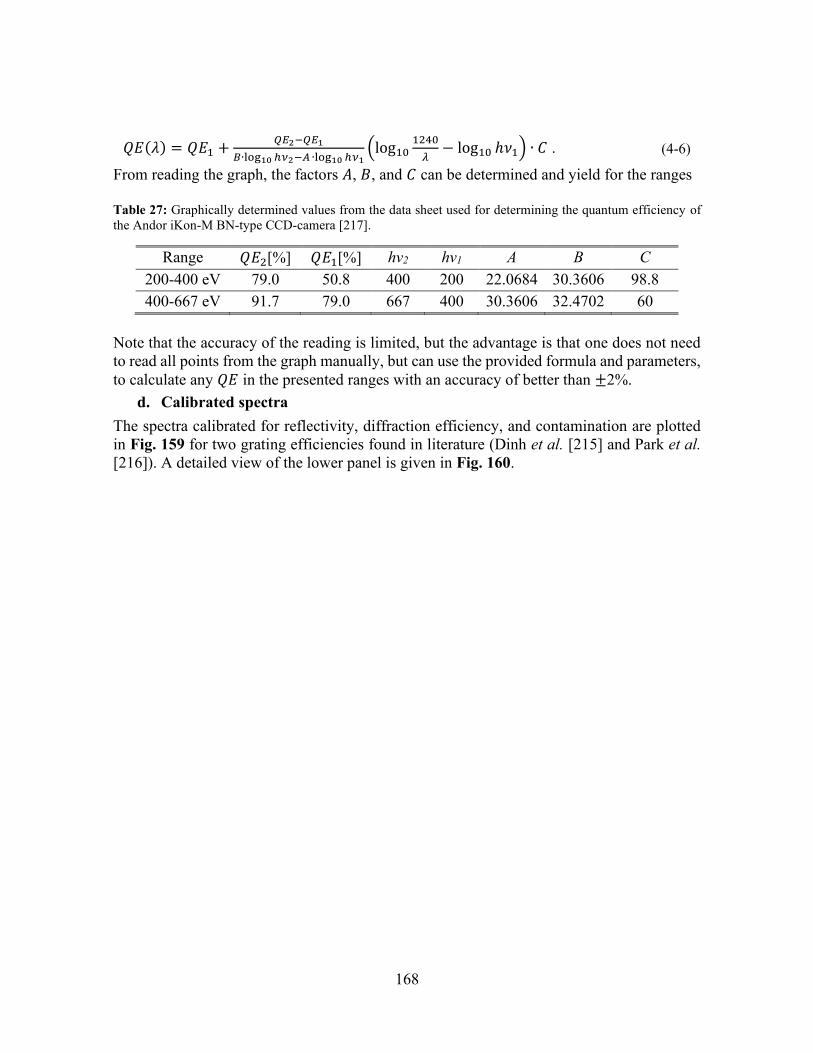
168
𝑄𝐸(𝜆) = 𝑄𝐸1 +𝑄𝐸2−𝑄𝐸1
𝐵∙log10 ℎ𝜈2−𝐴 ∙log10 ℎ𝜈1(log10
1240
𝜆− log10 ℎ𝜈1) ∙ 𝐶 . (4-6)
From reading the graph, the factors 𝐴, 𝐵, and 𝐶 can be determined and yield for the ranges Table 27: Graphically determined values from the data sheet used for determining the quantum efficiency of the Andor iKon-M BN-type CCD-camera [217].
Range 𝑄𝐸2[%] 𝑄𝐸1[%] hν2 hν1 A B C 200-400 eV 79.0 50.8 400 200 22.0684 30.3606 98.8 400-667 eV 91.7 79.0 667 400 30.3606 32.4702 60
Note that the accuracy of the reading is limited, but the advantage is that one does not need to read all points from the graph manually, but can use the provided formula and parameters, to calculate any 𝑄𝐸 in the presented ranges with an accuracy of better than ±2%.
d. Calibrated spectra The spectra calibrated for reflectivity, diffraction efficiency, and contamination are plotted in Fig. 159 for two grating efficiencies found in literature (Dinh et al. [215] and Park et al. [216]). A detailed view of the lower panel is given in Fig. 160.
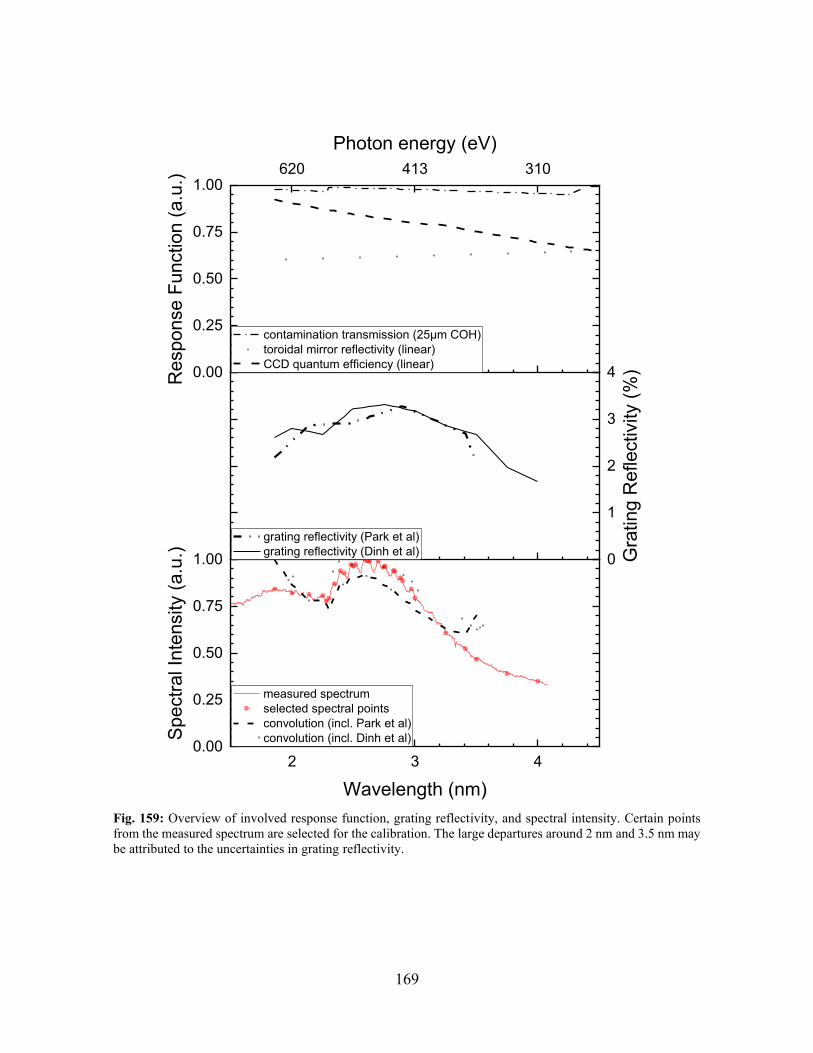
169
2 3 40.00
0.25
0.50
0.75
1.00 0
1
2
3
4
620 413 310
0.00
0.25
0.50
0.75
1.00
Spec
tral I
nten
sity
(a.u
.)
Wavelength (nm)
measured spectrum selected spectral points convolution (incl. Park et al) convolution (incl. Dinh et al)
Res
pons
e Fu
nctio
n (a
.u.)
Gra
ting
Ref
lect
ivity
(%)
grating reflectivity (Park et al) grating reflectivity (Dinh et al)
Photon energy (eV)
contamination transmission (25µm COH) toroidal mirror reflectivity (linear) CCD quantum efficiency (linear)
Fig. 159: Overview of involved response function, grating reflectivity, and spectral intensity. Certain points from the measured spectrum are selected for the calibration. The large departures around 2 nm and 3.5 nm may be attributed to the uncertainties in grating reflectivity.
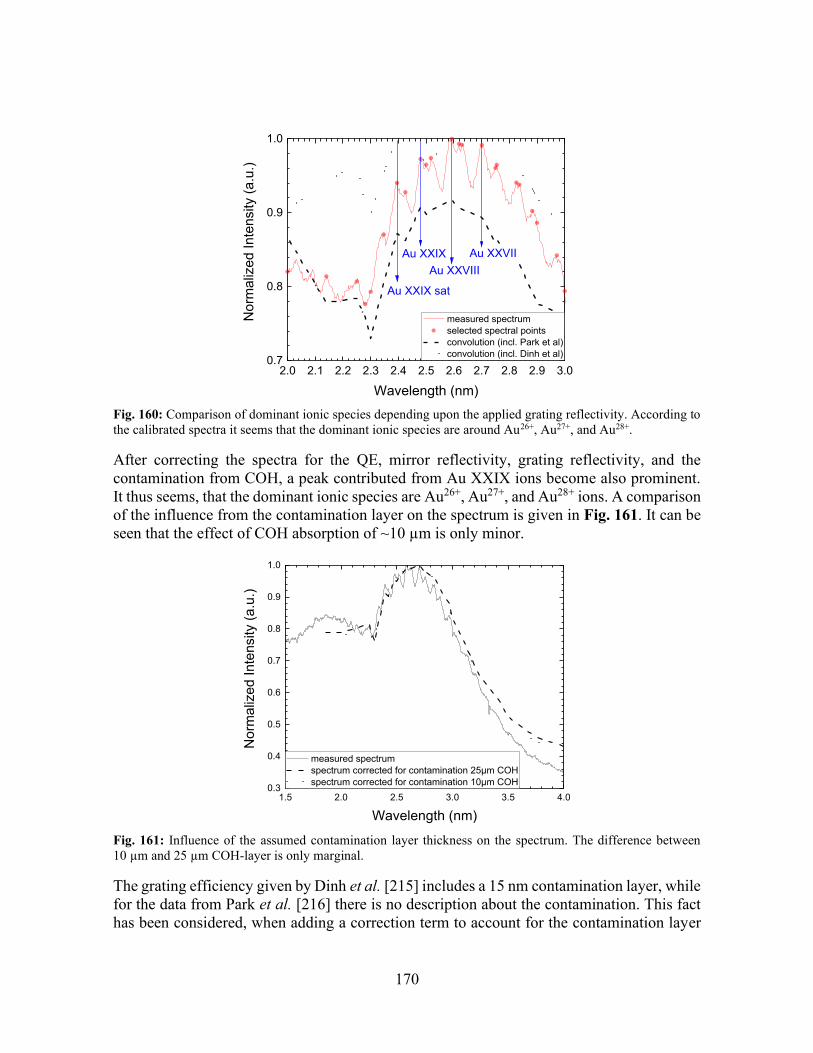
170
2.0 2.1 2.2 2.3 2.4 2.5 2.6 2.7 2.8 2.9 3.00.7
0.8
0.9
1.0
Nor
mal
ized
Inte
nsity
(a.u
.)
Wavelength (nm)
measured spectrum selected spectral points convolution (incl. Park et al) convolution (incl. Dinh et al)
Au XXIX sat
Au XXIXAu XXVIII
Au XXVII
Fig. 160: Comparison of dominant ionic species depending upon the applied grating reflectivity. According to the calibrated spectra it seems that the dominant ionic species are around Au26+, Au27+, and Au28+.
After correcting the spectra for the QE, mirror reflectivity, grating reflectivity, and the contamination from COH, a peak contributed from Au XXIX ions become also prominent. It thus seems, that the dominant ionic species are Au26+, Au27+, and Au28+ ions. A comparison of the influence from the contamination layer on the spectrum is given in Fig. 161. It can be seen that the effect of COH absorption of ~10 µm is only minor.
1.5 2.0 2.5 3.0 3.5 4.00.3
0.4
0.5
0.6
0.7
0.8
0.9
1.0
Nor
mal
ized
Inte
nsity
(a.u
.)
Wavelength (nm)
measured spectrum spectrum corrected for contamination 25µm COH spectrum corrected for contamination 10µm COH
Fig. 161: Influence of the assumed contamination layer thickness on the spectrum. The difference between 10 µm and 25 µm COH-layer is only marginal.
The grating efficiency given by Dinh et al. [215] includes a 15 nm contamination layer, while for the data from Park et al. [216] there is no description about the contamination. This fact has been considered, when adding a correction term to account for the contamination layer
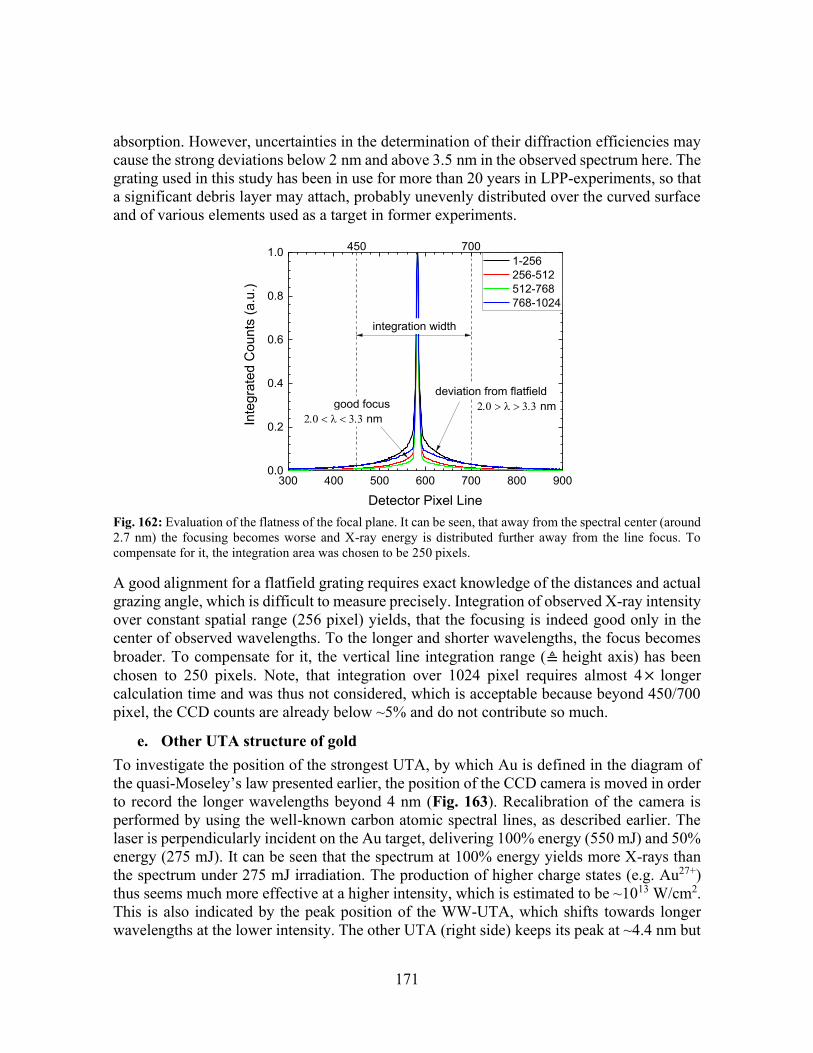
171
absorption. However, uncertainties in the determination of their diffraction efficiencies may cause the strong deviations below 2 nm and above 3.5 nm in the observed spectrum here. The grating used in this study has been in use for more than 20 years in LPP-experiments, so that a significant debris layer may attach, probably unevenly distributed over the curved surface and of various elements used as a target in former experiments.
300 400 500 600 700 800 9000.0
0.2
0.4
0.6
0.8
1.0 1-256 256-512 512-768 768-1024
Inte
grat
ed C
ount
s (a
.u.)
Detector Pixel Line
450 700
integration width
deviation from flatfieldgood focus
2.0 < l < 3.3 nm2.0 > l > 3.3 nm
Fig. 162: Evaluation of the flatness of the focal plane. It can be seen, that away from the spectral center (around 2.7 nm) the focusing becomes worse and X-ray energy is distributed further away from the line focus. To compensate for it, the integration area was chosen to be 250 pixels.
A good alignment for a flatfield grating requires exact knowledge of the distances and actual grazing angle, which is difficult to measure precisely. Integration of observed X-ray intensity over constant spatial range (256 pixel) yields, that the focusing is indeed good only in the center of observed wavelengths. To the longer and shorter wavelengths, the focus becomes broader. To compensate for it, the vertical line integration range (≜ height axis) has been chosen to 250 pixels. Note, that integration over 1024 pixel requires almost 4× longer calculation time and was thus not considered, which is acceptable because beyond 450/700 pixel, the CCD counts are already below ~5% and do not contribute so much.
e. Other UTA structure of gold To investigate the position of the strongest UTA, by which Au is defined in the diagram of the quasi-Moseley’s law presented earlier, the position of the CCD camera is moved in order to record the longer wavelengths beyond 4 nm (Fig. 163). Recalibration of the camera is performed by using the well-known carbon atomic spectral lines, as described earlier. The laser is perpendicularly incident on the Au target, delivering 100% energy (550 mJ) and 50% energy (275 mJ). It can be seen that the spectrum at 100% energy yields more X-rays than the spectrum under 275 mJ irradiation. The production of higher charge states (e.g. Au27+) thus seems much more effective at a higher intensity, which is estimated to be ~1013 W/cm2. This is also indicated by the peak position of the WW-UTA, which shifts towards longer wavelengths at the lower intensity. The other UTA (right side) keeps its peak at ~4.4 nm but
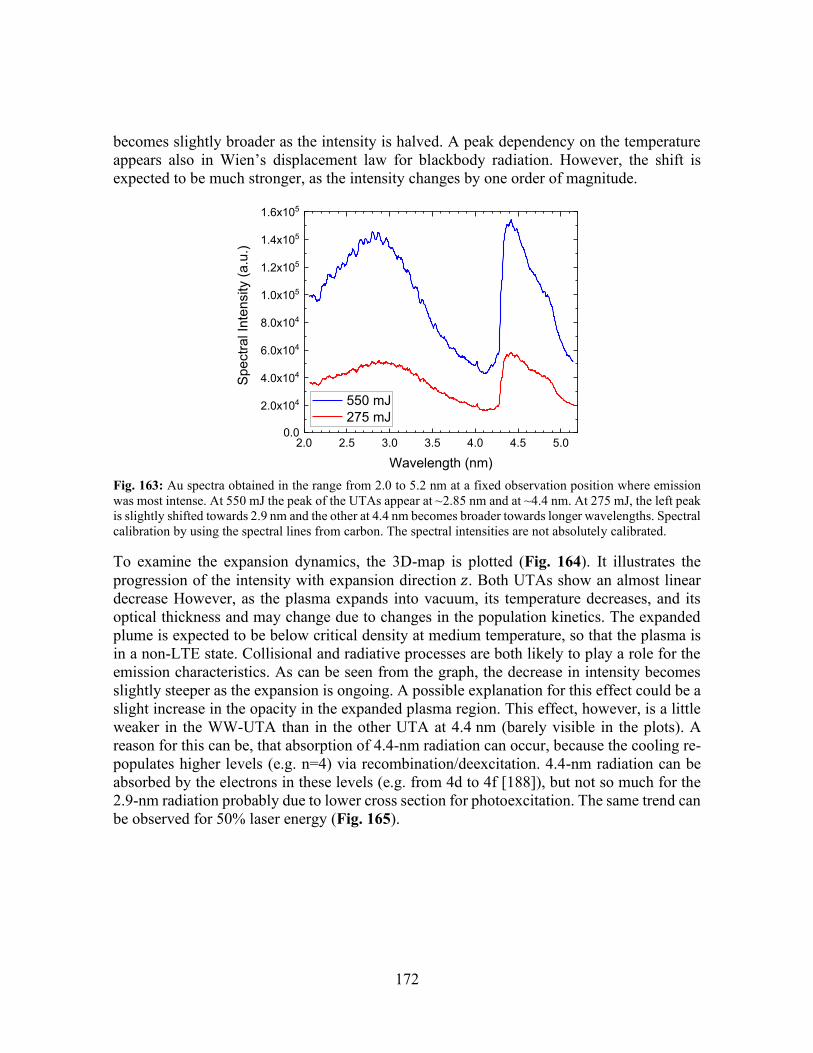
172
becomes slightly broader as the intensity is halved. A peak dependency on the temperature appears also in Wien’s displacement law for blackbody radiation. However, the shift is expected to be much stronger, as the intensity changes by one order of magnitude.
2.0 2.5 3.0 3.5 4.0 4.5 5.00.0
2.0x10⁴
4.0x10⁴
6.0x10⁴
8.0x10⁴
1.0x10⁵
1.2x10⁵
1.4x10⁵
1.6x10⁵
Spec
tral I
nten
sity
(a.u
.)
Wavelength (nm)
550 mJ 275 mJ
Fig. 163: Au spectra obtained in the range from 2.0 to 5.2 nm at a fixed observation position where emission was most intense. At 550 mJ the peak of the UTAs appear at ~2.85 nm and at ~4.4 nm. At 275 mJ, the left peak is slightly shifted towards 2.9 nm and the other at 4.4 nm becomes broader towards longer wavelengths. Spectral calibration by using the spectral lines from carbon. The spectral intensities are not absolutely calibrated.
To examine the expansion dynamics, the 3D-map is plotted (Fig. 164). It illustrates the progression of the intensity with expansion direction 𝑧. Both UTAs show an almost linear decrease However, as the plasma expands into vacuum, its temperature decreases, and its optical thickness and may change due to changes in the population kinetics. The expanded plume is expected to be below critical density at medium temperature, so that the plasma is in a non-LTE state. Collisional and radiative processes are both likely to play a role for the emission characteristics. As can be seen from the graph, the decrease in intensity becomes slightly steeper as the expansion is ongoing. A possible explanation for this effect could be a slight increase in the opacity in the expanded plasma region. This effect, however, is a little weaker in the WW-UTA than in the other UTA at 4.4 nm (barely visible in the plots). A reason for this can be, that absorption of 4.4-nm radiation can occur, because the cooling re-populates higher levels (e.g. n=4) via recombination/deexcitation. 4.4-nm radiation can be absorbed by the electrons in these levels (e.g. from 4d to 4f [188]), but not so much for the 2.9-nm radiation probably due to lower cross section for photoexcitation. The same trend can be observed for 50% laser energy (Fig. 165).
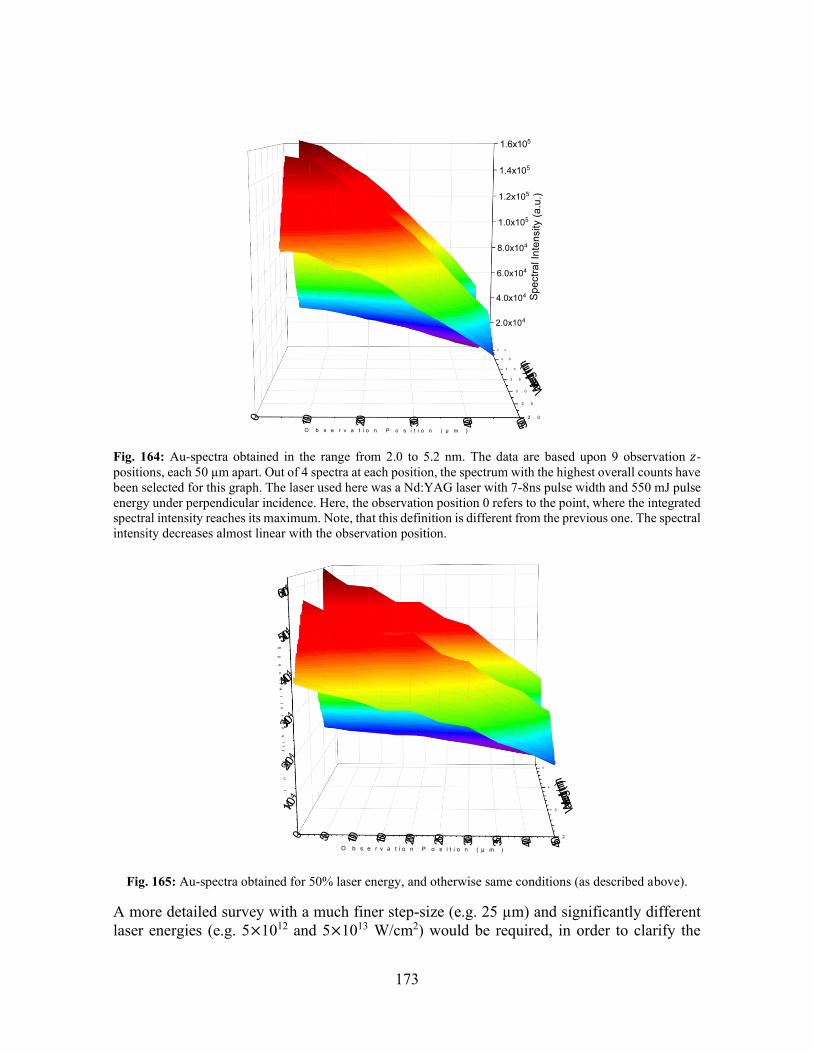
173
Fig. 164: Au-spectra obtained in the range from 2.0 to 5.2 nm. The data are based upon 9 observation 𝑧-positions, each 50 µm apart. Out of 4 spectra at each position, the spectrum with the highest overall counts have been selected for this graph. The laser used here was a Nd:YAG laser with 7-8ns pulse width and 550 mJ pulse energy under perpendicular incidence. Here, the observation position 0 refers to the point, where the integrated spectral intensity reaches its maximum. Note, that this definition is different from the previous one. The spectral intensity decreases almost linear with the observation position.
Fig. 165: Au-spectra obtained for 50% laser energy, and otherwise same conditions (as described above).
A more detailed survey with a much finer step-size (e.g. 25 µm) and significantly different laser energies (e.g. 5×10¹² and 5×10¹³ W/cm2) would be required, in order to clarify the
5 . 0
4 . 5
4 . 0
3 . 5
3 . 0
2 . 5
2 . 00 100 200 300 400 500
2.0x10⁴
4.0x10⁴
6.0x10⁴
8.0x10⁴
1.0x10⁵
1.2x10⁵
1.4x10⁵
1.6x10⁵
O b s e r v a t i o n P o s i t i o n ( µ m )
Spec
tral I
nten
sity
(a.u
.)Wave
length (nm)
0 50 100 150 200 250 300 350 400 450
2
3
4
5
1x10⁴
2x10⁴
3x10⁴
4x10⁴
5x10⁴
6x10⁴Wave
length (nm)
Sp
ec
tr
al
I
nt
en
si
ty
(
a.
u.
)
O b s e r v a t i o n P o s i t i o n ( µ m )
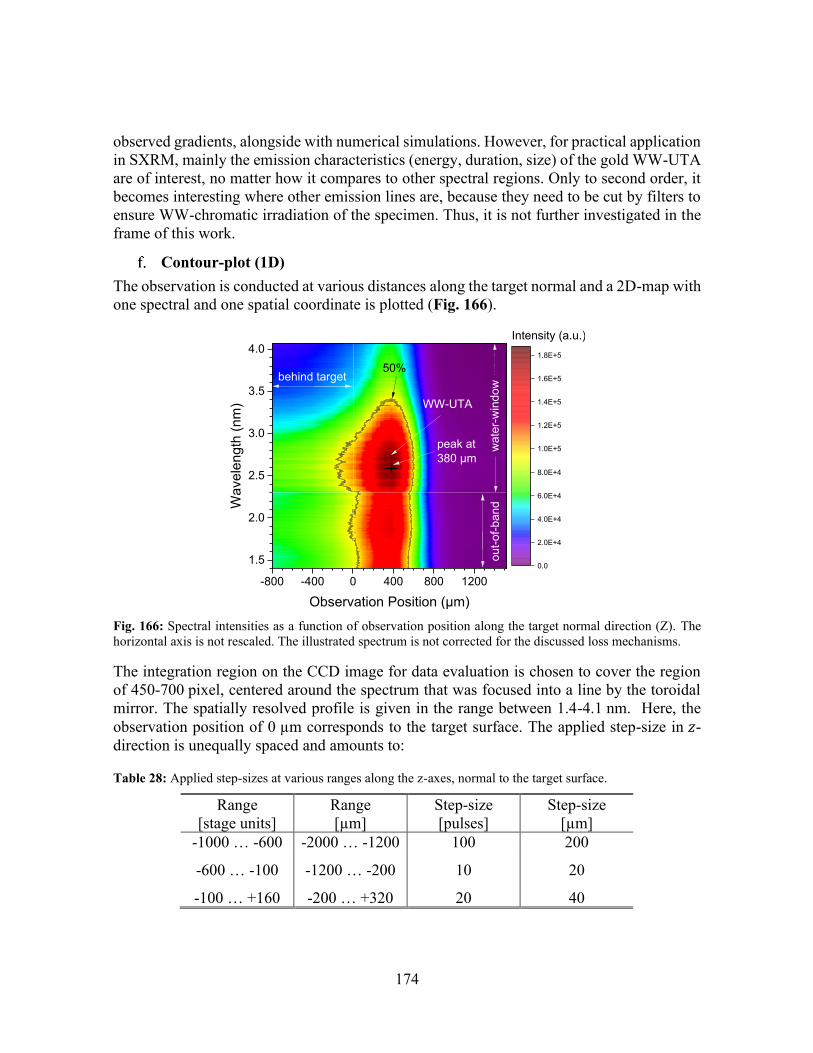
174
observed gradients, alongside with numerical simulations. However, for practical application in SXRM, mainly the emission characteristics (energy, duration, size) of the gold WW-UTA are of interest, no matter how it compares to other spectral regions. Only to second order, it becomes interesting where other emission lines are, because they need to be cut by filters to ensure WW-chromatic irradiation of the specimen. Thus, it is not further investigated in the frame of this work.
Contour-plot (1D) The observation is conducted at various distances along the target normal and a 2D-map with one spectral and one spatial coordinate is plotted (Fig. 166).
Fig. 166: Spectral intensities as a function of observation position along the target normal direction (Z). The horizontal axis is not rescaled. The illustrated spectrum is not corrected for the discussed loss mechanisms.
The integration region on the CCD image for data evaluation is chosen to cover the region of 450-700 pixel, centered around the spectrum that was focused into a line by the toroidal mirror. The spatially resolved profile is given in the range between 1.4-4.1 nm. Here, the observation position of 0 µm corresponds to the target surface. The applied step-size in 𝑧-direction is unequally spaced and amounts to:
Table 28: Applied step-sizes at various ranges along the z-axes, normal to the target surface.
Range [stage units]
Range [µm]
Step-size [pulses]
Step-size [µm]
-1000 … -600 -2000 … -1200 100 200
-600 … -100 -1200 … -200 10 20
-100 … +160 -200 … +320 20 40
-800 -400 0 400 800 1200
1.5
2.0
2.5
3.0
3.5
4.0
Observation Position (µm)
Wav
elen
gth
(nm
)
0.0
2.0E+4
4.0E+4
6.0E+4
8.0E+4
1.0E+5
1.2E+5
1.4E+5
1.6E+5
1.8E+5
Intensity (a.u.)
behind target
out-o
f-ban
dw
ater
-win
dow
WW-UTA
50%
peak at380 µm
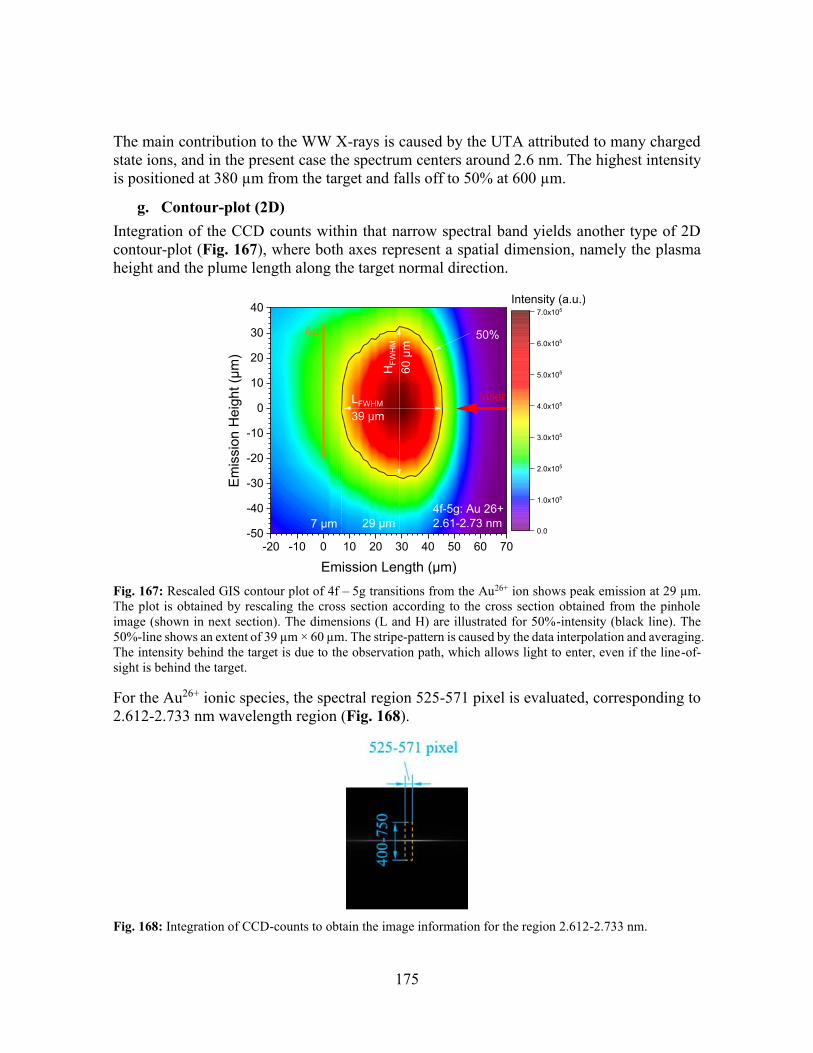
175
The main contribution to the WW X-rays is caused by the UTA attributed to many charged state ions, and in the present case the spectrum centers around 2.6 nm. The highest intensity is positioned at 380 µm from the target and falls off to 50% at 600 µm.
g. Contour-plot (2D) Integration of the CCD counts within that narrow spectral band yields another type of 2D contour-plot (Fig. 167), where both axes represent a spatial dimension, namely the plasma height and the plume length along the target normal direction.
Fig. 167: Rescaled GIS contour plot of 4f – 5g transitions from the Au26+ ion shows peak emission at 29 µm. The plot is obtained by rescaling the cross section according to the cross section obtained from the pinhole image (shown in next section). The dimensions (L and H) are illustrated for 50%-intensity (black line). The 50%-line shows an extent of 39 µm × 60 µm. The stripe-pattern is caused by the data interpolation and averaging. The intensity behind the target is due to the observation path, which allows light to enter, even if the line-of-sight is behind the target.
For the Au26+ ionic species, the spectral region 525-571 pixel is evaluated, corresponding to 2.612-2.733 nm wavelength region (Fig. 168).
Fig. 168: Integration of CCD-counts to obtain the image information for the region 2.612-2.733 nm.
-20 -10 0 10 20 30 40 50 60 70-50
-40
-30
-20
-10
0
10
20
30
40
Emission Length (µm)
Emis
sion
Hei
ght (
µm)
0.0
1.0x10⁵
2.0x10⁵
3.0x10⁵
4.0x10⁵
5.0x10⁵
6.0x10⁵
7.0x10⁵Intensity (a.u.)
4f-5g: Au 26+2.61-2.73 nm
laser
50%Au
29 µm
LFWHM 39 µm
HFW
HM
60 µ
m
7 µm
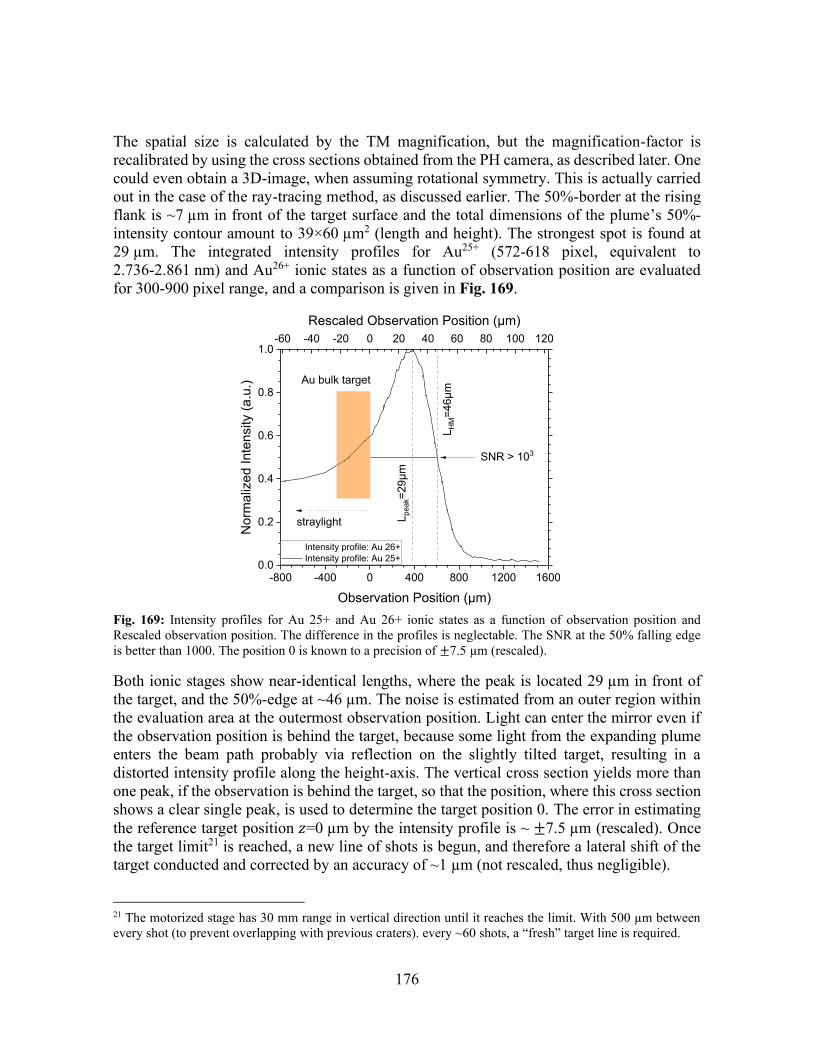
176
The spatial size is calculated by the TM magnification, but the magnification-factor is recalibrated by using the cross sections obtained from the PH camera, as described later. One could even obtain a 3D-image, when assuming rotational symmetry. This is actually carried out in the case of the ray-tracing method, as discussed earlier. The 50%-border at the rising flank is ~7 µm in front of the target surface and the total dimensions of the plume’s 50%-intensity contour amount to 39×60 µm2 (length and height). The strongest spot is found at 29 µm. The integrated intensity profiles for Au25+ (572-618 pixel, equivalent to 2.736-2.861 nm) and Au26+ ionic states as a function of observation position are evaluated for 300-900 pixel range, and a comparison is given in Fig. 169.
-800 -400 0 400 800 1200 16000.0
0.2
0.4
0.6
0.8
1.0
Intensity profile: Au 26+ Intensity profile: Au 25+
Observation Position (µm)
Nor
mal
ized
Inte
nsity
(a.u
.) Au bulk target
SNR > 103
straylight
-60 -40 -20 0 20 40 60 80 100 120Rescaled Observation Position (µm)
L HM
=46µ
m
L pea
k=29
µm
Fig. 169: Intensity profiles for Au 25+ and Au 26+ ionic states as a function of observation position and Rescaled observation position. The difference in the profiles is neglectable. The SNR at the 50% falling edge is better than 1000. The position 0 is known to a precision of ±7.5 µm (rescaled).
Both ionic stages show near-identical lengths, where the peak is located 29 µm in front of the target, and the 50%-edge at ~46 µm. The noise is estimated from an outer region within the evaluation area at the outermost observation position. Light can enter the mirror even if the observation position is behind the target, because some light from the expanding plume enters the beam path probably via reflection on the slightly tilted target, resulting in a distorted intensity profile along the height-axis. The vertical cross section yields more than one peak, if the observation is behind the target, so that the position, where this cross section shows a clear single peak, is used to determine the target position 0. The error in estimating the reference target position 𝑧=0 µm by the intensity profile is ~ ±7.5 µm (rescaled). Once the target limit21 is reached, a new line of shots is begun, and therefore a lateral shift of the target conducted and corrected by an accuracy of ~1 µm (not rescaled, thus negligible).
21 The motorized stage has 30 mm range in vertical direction until it reaches the limit. With 500 µm between every shot (to prevent overlapping with previous craters). every ~60 shots, a “fresh” target line is required.
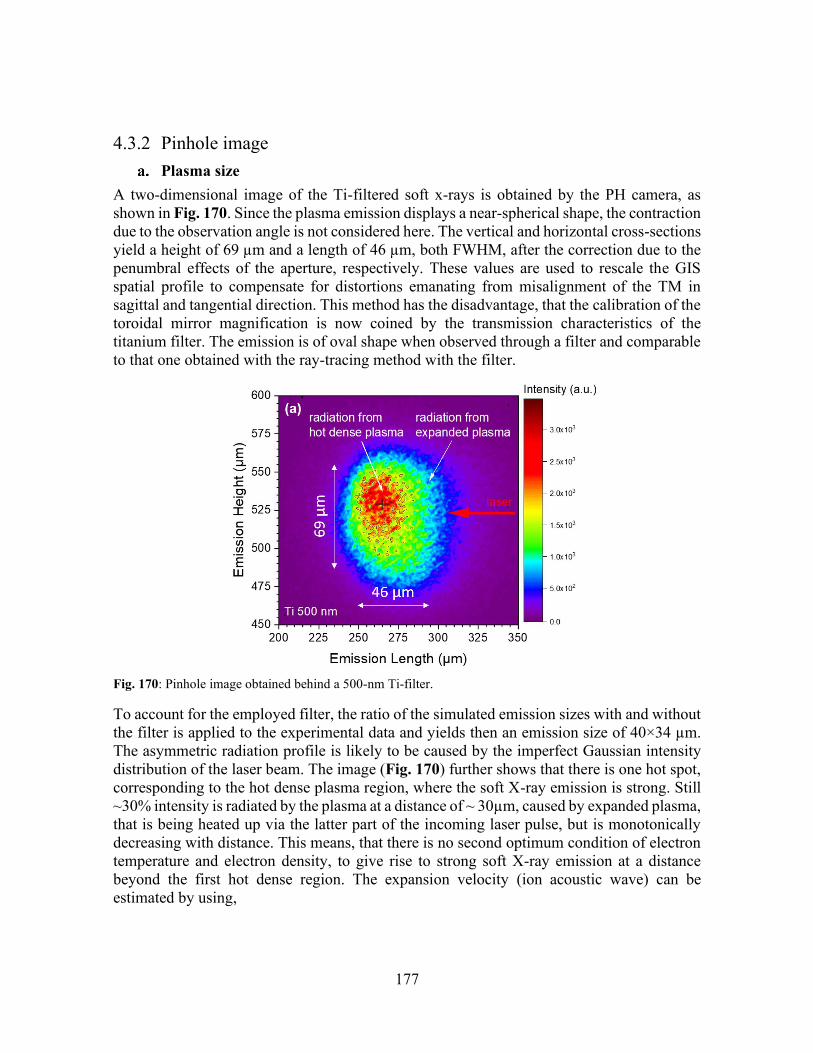
177
4.3.2 Pinhole image Plasma size
A two-dimensional image of the Ti-filtered soft x-rays is obtained by the PH camera, as shown in Fig. 170. Since the plasma emission displays a near-spherical shape, the contraction due to the observation angle is not considered here. The vertical and horizontal cross-sections yield a height of 69 µm and a length of 46 µm, both FWHM, after the correction due to the penumbral effects of the aperture, respectively. These values are used to rescale the GIS spatial profile to compensate for distortions emanating from misalignment of the TM in sagittal and tangential direction. This method has the disadvantage, that the calibration of the toroidal mirror magnification is now coined by the transmission characteristics of the titanium filter. The emission is of oval shape when observed through a filter and comparable to that one obtained with the ray-tracing method with the filter.
Fig. 170: Pinhole image obtained behind a 500-nm Ti-filter.
To account for the employed filter, the ratio of the simulated emission sizes with and without the filter is applied to the experimental data and yields then an emission size of 40×34 µm. The asymmetric radiation profile is likely to be caused by the imperfect Gaussian intensity distribution of the laser beam. The image (Fig. 170) further shows that there is one hot spot, corresponding to the hot dense plasma region, where the soft X-ray emission is strong. Still ~30% intensity is radiated by the plasma at a distance of ~ 30µm, caused by expanded plasma, that is being heated up via the latter part of the incoming laser pulse, but is monotonically decreasing with distance. This means, that there is no second optimum condition of electron temperature and electron density, to give rise to strong soft X-ray emission at a distance beyond the first hot dense region. The expansion velocity (ion acoustic wave) can be estimated by using,
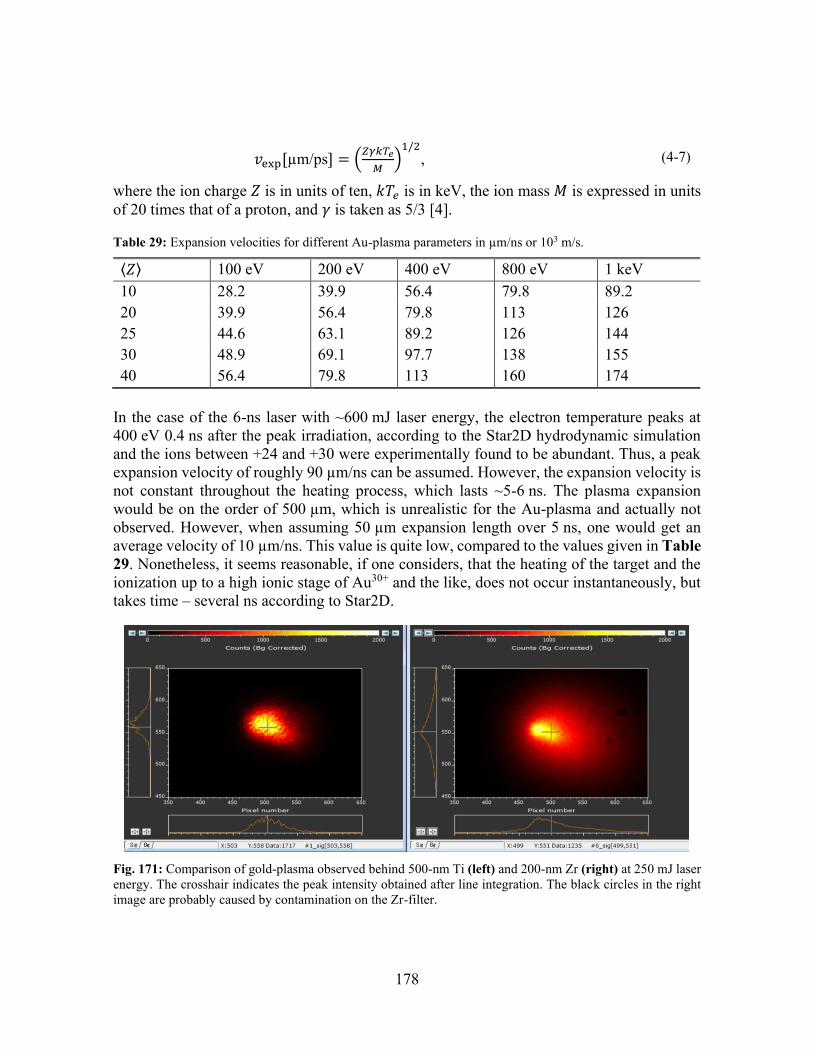
178
𝑣exp[µm/ps] = (𝑍𝛾𝑘𝑇𝑒
𝑀)
1/2
, (4-7)
where the ion charge 𝑍 is in units of ten, 𝑘𝑇𝑒 is in keV, the ion mass 𝑀 is expressed in units of 20 times that of a proton, and 𝛾 is taken as 5/3 [4].
Table 29: Expansion velocities for different Au-plasma parameters in µm/ns or 103 m/s.
⟨𝑍⟩ 100 eV 200 eV 400 eV 800 eV 1 keV 10 28.2 39.9 56.4 79.8 89.2 20 39.9 56.4 79.8 113 126 25 44.6 63.1 89.2 126 144 30 48.9 69.1 97.7 138 155 40 56.4 79.8 113 160 174
In the case of the 6-ns laser with ~600 mJ laser energy, the electron temperature peaks at 400 eV 0.4 ns after the peak irradiation, according to the Star2D hydrodynamic simulation and the ions between +24 and +30 were experimentally found to be abundant. Thus, a peak expansion velocity of roughly 90 µm/ns can be assumed. However, the expansion velocity is not constant throughout the heating process, which lasts ~5-6 ns. The plasma expansion would be on the order of 500 µm, which is unrealistic for the Au-plasma and actually not observed. However, when assuming 50 µm expansion length over 5 ns, one would get an average velocity of 10 µm/ns. This value is quite low, compared to the values given in Table 29. Nonetheless, it seems reasonable, if one considers, that the heating of the target and the ionization up to a high ionic stage of Au30+ and the like, does not occur instantaneously, but takes time – several ns according to Star2D.
Fig. 171: Comparison of gold-plasma observed behind 500-nm Ti (left) and 200-nm Zr (right) at 250 mJ laser energy. The crosshair indicates the peak intensity obtained after line integration. The black circles in the right image are probably caused by contamination on the Zr-filter.
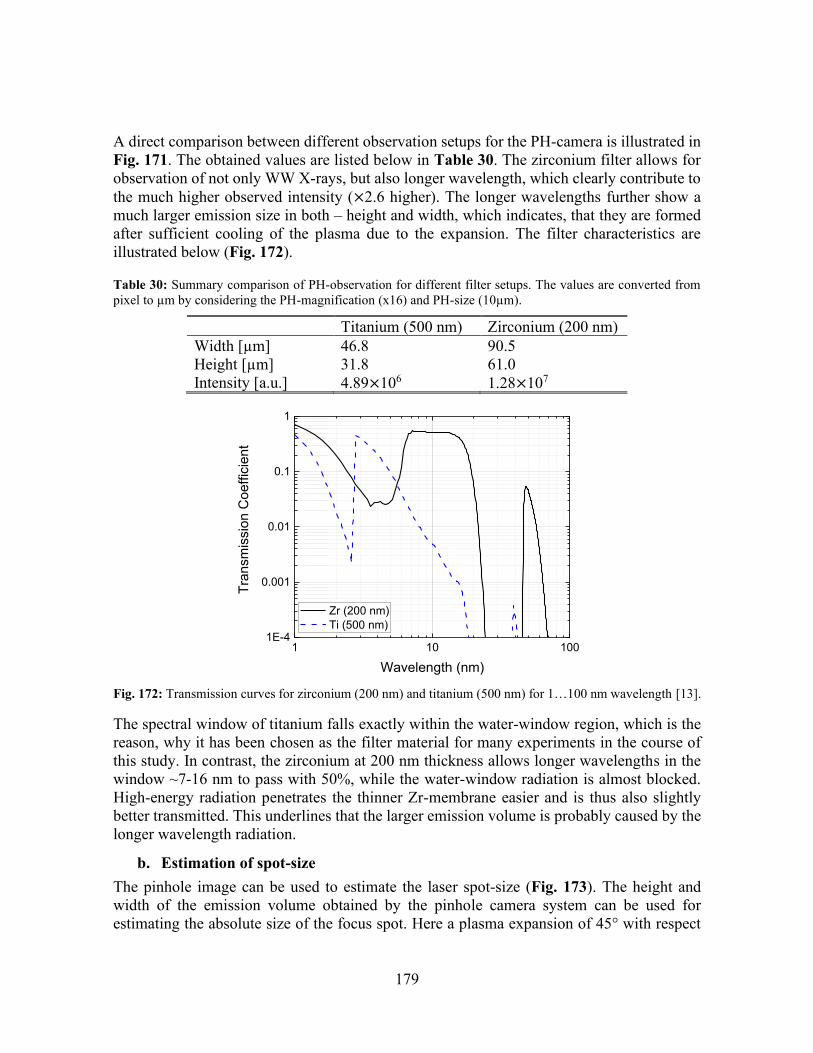
179
A direct comparison between different observation setups for the PH-camera is illustrated in Fig. 171. The obtained values are listed below in Table 30. The zirconium filter allows for observation of not only WW X-rays, but also longer wavelength, which clearly contribute to the much higher observed intensity (×2.6 higher). The longer wavelengths further show a much larger emission size in both – height and width, which indicates, that they are formed after sufficient cooling of the plasma due to the expansion. The filter characteristics are illustrated below (Fig. 172).
Table 30: Summary comparison of PH-observation for different filter setups. The values are converted from pixel to µm by considering the PH-magnification (x16) and PH-size (10µm).
Titanium (500 nm) Zirconium (200 nm) Width [µm] 46.8 90.5 Height [µm] 31.8 61.0 Intensity [a.u.] 4.89×10⁶ 1.28×10⁷
Fig. 172: Transmission curves for zirconium (200 nm) and titanium (500 nm) for 1…100 nm wavelength [13].
The spectral window of titanium falls exactly within the water-window region, which is the reason, why it has been chosen as the filter material for many experiments in the course of this study. In contrast, the zirconium at 200 nm thickness allows longer wavelengths in the window ~7-16 nm to pass with 50%, while the water-window radiation is almost blocked. High-energy radiation penetrates the thinner Zr-membrane easier and is thus also slightly better transmitted. This underlines that the larger emission volume is probably caused by the longer wavelength radiation.
b. Estimation of spot-size The pinhole image can be used to estimate the laser spot-size (Fig. 173). The height and width of the emission volume obtained by the pinhole camera system can be used for estimating the absolute size of the focus spot. Here a plasma expansion of 45° with respect
1 10 1001E-4
0.001
0.01
0.1
1
Tran
smis
sion
Coe
ffici
ent
Wavelength (nm)
Zr (200 nm) Ti (500 nm)
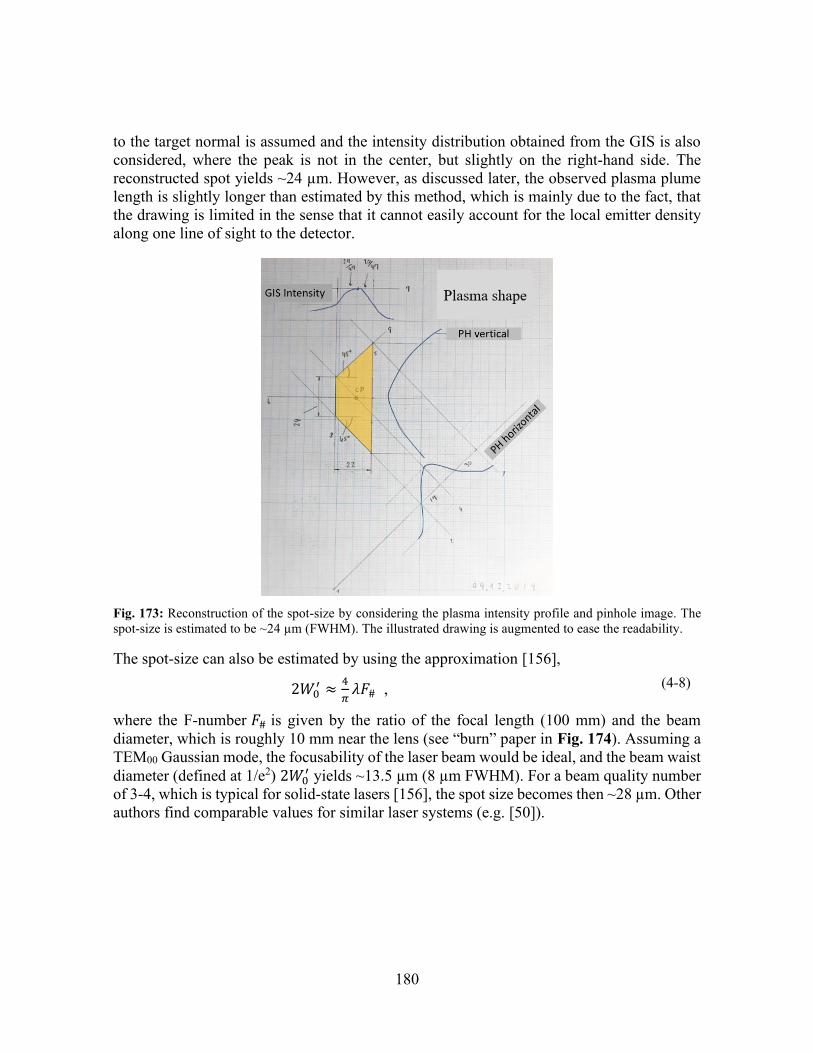
180
to the target normal is assumed and the intensity distribution obtained from the GIS is also considered, where the peak is not in the center, but slightly on the right-hand side. The reconstructed spot yields ~24 µm. However, as discussed later, the observed plasma plume length is slightly longer than estimated by this method, which is mainly due to the fact, that the drawing is limited in the sense that it cannot easily account for the local emitter density along one line of sight to the detector.
Fig. 173: Reconstruction of the spot-size by considering the plasma intensity profile and pinhole image. The spot-size is estimated to be ~24 µm (FWHM). The illustrated drawing is augmented to ease the readability.
The spot-size can also be estimated by using the approximation [156],
2𝑊0′ ≈
4
𝜋𝜆𝐹# , (4-8)
where the F-number 𝐹# is given by the ratio of the focal length (100 mm) and the beam diameter, which is roughly 10 mm near the lens (see “burn” paper in Fig. 174). Assuming a TEM00 Gaussian mode, the focusability of the laser beam would be ideal, and the beam waist diameter (defined at 1/e2) 2𝑊0
′ yields ~13.5 µm (8 µm FWHM). For a beam quality number of 3-4, which is typical for solid-state lasers [156], the spot size becomes then ~28 µm. Other authors find comparable values for similar laser systems (e.g. [50]).
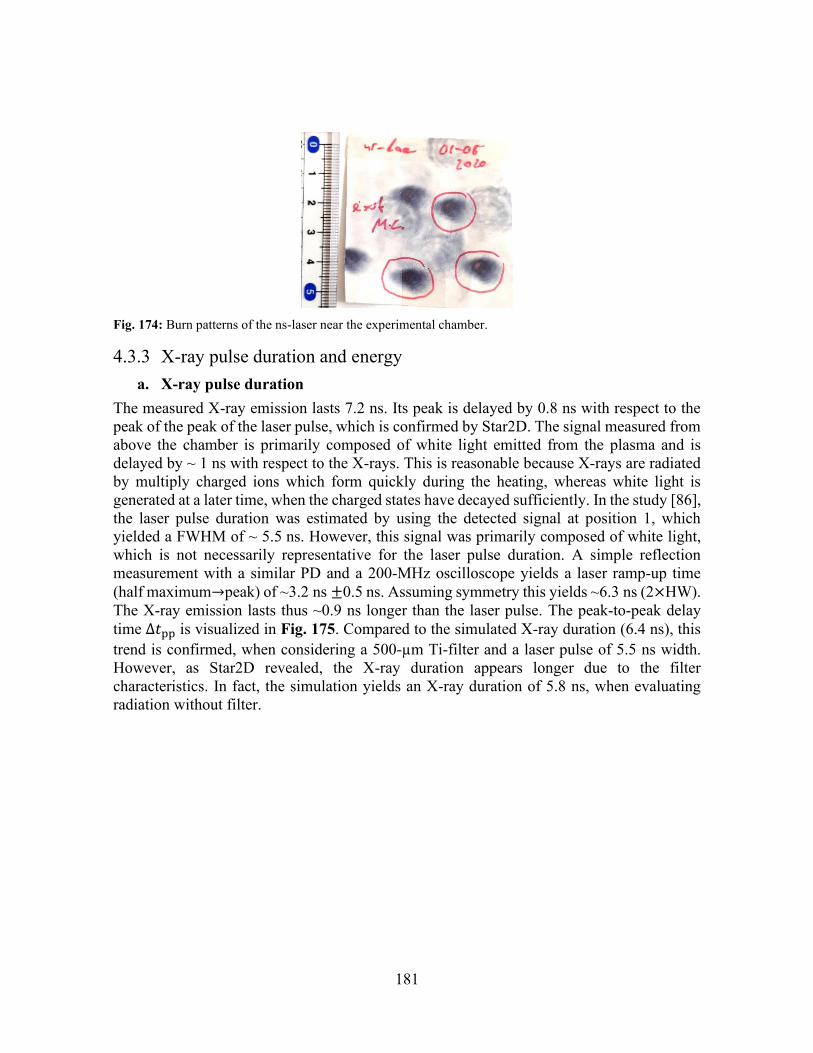
181
Fig. 174: Burn patterns of the ns-laser near the experimental chamber.
4.3.3 X-ray pulse duration and energy a. X-ray pulse duration
The measured X-ray emission lasts 7.2 ns. Its peak is delayed by 0.8 ns with respect to the peak of the peak of the laser pulse, which is confirmed by Star2D. The signal measured from above the chamber is primarily composed of white light emitted from the plasma and is delayed by ~ 1 ns with respect to the X-rays. This is reasonable because X-rays are radiated by multiply charged ions which form quickly during the heating, whereas white light is generated at a later time, when the charged states have decayed sufficiently. In the study [86], the laser pulse duration was estimated by using the detected signal at position 1, which yielded a FWHM of ~ 5.5 ns. However, this signal was primarily composed of white light, which is not necessarily representative for the laser pulse duration. A simple reflection measurement with a similar PD and a 200-MHz oscilloscope yields a laser ramp-up time (half maximum→peak) of ~3.2 ns ±0.5 ns. Assuming symmetry this yields ~6.3 ns (2×HW). The X-ray emission lasts thus ~0.9 ns longer than the laser pulse. The peak-to-peak delay time ∆𝑡pp is visualized in Fig. 175. Compared to the simulated X-ray duration (6.4 ns), this trend is confirmed, when considering a 500-µm Ti-filter and a laser pulse of 5.5 ns width. However, as Star2D revealed, the X-ray duration appears longer due to the filter characteristics. In fact, the simulation yields an X-ray duration of 5.8 ns, when evaluating radiation without filter.
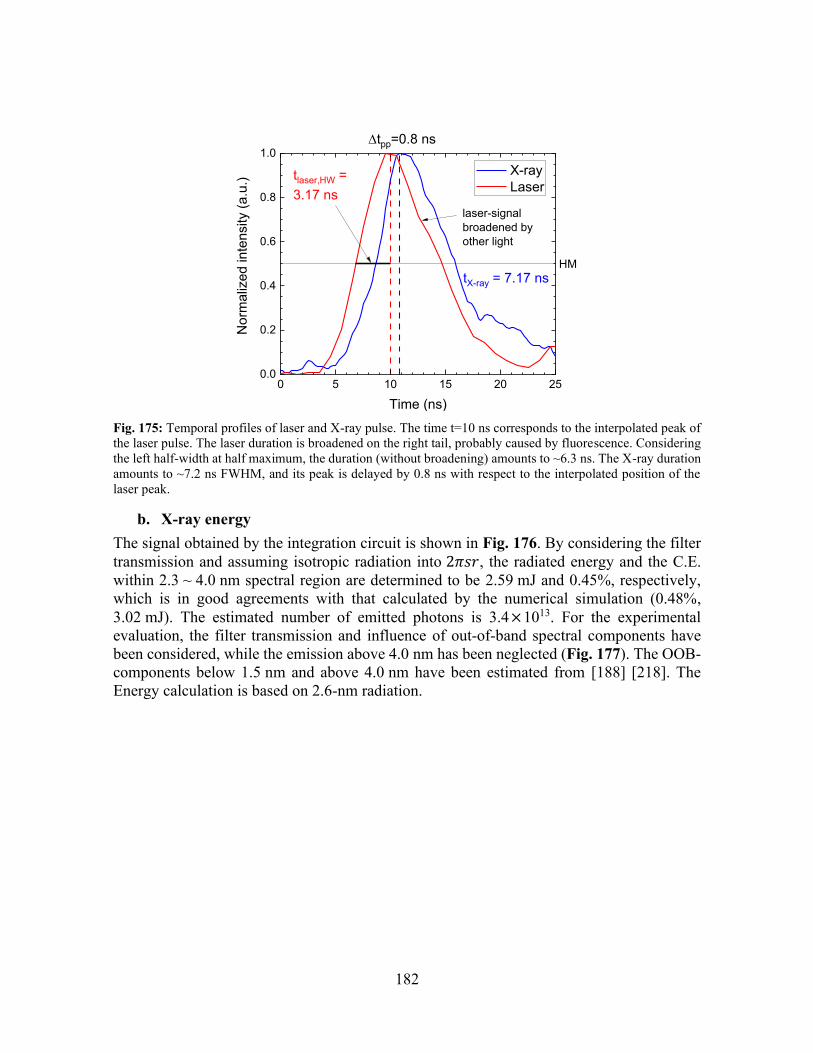
182
Fig. 175: Temporal profiles of laser and X-ray pulse. The time t=10 ns corresponds to the interpolated peak of the laser pulse. The laser duration is broadened on the right tail, probably caused by fluorescence. Considering the left half-width at half maximum, the duration (without broadening) amounts to ~6.3 ns. The X-ray duration amounts to ~7.2 ns FWHM, and its peak is delayed by 0.8 ns with respect to the interpolated position of the laser peak.
b. X-ray energy The signal obtained by the integration circuit is shown in Fig. 176. By considering the filter transmission and assuming isotropic radiation into 2𝜋𝑠𝑟, the radiated energy and the C.E. within 2.3 ~ 4.0 nm spectral region are determined to be 2.59 mJ and 0.45%, respectively, which is in good agreements with that calculated by the numerical simulation (0.48%, 3.02 mJ). The estimated number of emitted photons is 3.4×10¹³. For the experimental evaluation, the filter transmission and influence of out-of-band spectral components have been considered, while the emission above 4.0 nm has been neglected (Fig. 177). The OOB-components below 1.5 nm and above 4.0 nm have been estimated from [188] [218]. The Energy calculation is based on 2.6-nm radiation.
0 5 10 15 20 250.0
0.2
0.4
0.6
0.8
1.0
Nor
mal
ized
inte
nsity
(a.u
.)
Time (ns)
X-ray Laser
tX-ray = 7.17 nsHM
tlaser,HW =3.17 ns
Dtpp=0.8 ns
laser-signalbroadened byother light
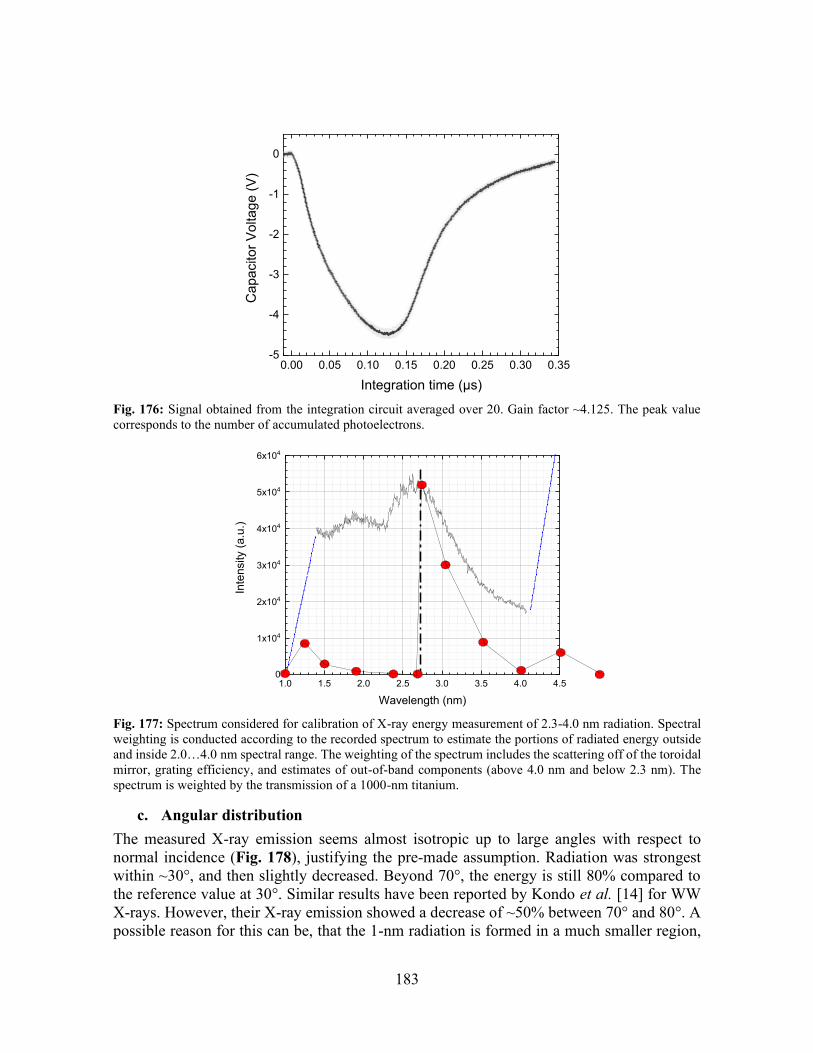
183
Fig. 176: Signal obtained from the integration circuit averaged over 20. Gain factor ~4.125. The peak value corresponds to the number of accumulated photoelectrons.
1.0 1.5 2.0 2.5 3.0 3.5 4.0 4.50
1x10⁴
2x10⁴
3x10⁴
4x10⁴
5x10⁴
6x10⁴
Inte
nsity
(a.u
.)
Wavelength (nm) Fig. 177: Spectrum considered for calibration of X-ray energy measurement of 2.3-4.0 nm radiation. Spectral weighting is conducted according to the recorded spectrum to estimate the portions of radiated energy outside and inside 2.0…4.0 nm spectral range. The weighting of the spectrum includes the scattering off of the toroidal mirror, grating efficiency, and estimates of out-of-band components (above 4.0 nm and below 2.3 nm). The spectrum is weighted by the transmission of a 1000-nm titanium.
c. Angular distribution The measured X-ray emission seems almost isotropic up to large angles with respect to normal incidence (Fig. 178), justifying the pre-made assumption. Radiation was strongest within ~30°, and then slightly decreased. Beyond 70°, the energy is still 80% compared to the reference value at 30°. Similar results have been reported by Kondo et al. [14] for WW X-rays. However, their X-ray emission showed a decrease of ~50% between 70° and 80°. A possible reason for this can be, that the 1-nm radiation is formed in a much smaller region,
0.00 0.05 0.10 0.15 0.20 0.25 0.30 0.35-5
-4
-3
-2
-1
0
Cap
acito
r Vol
tage
(V)
Integration time (µs)
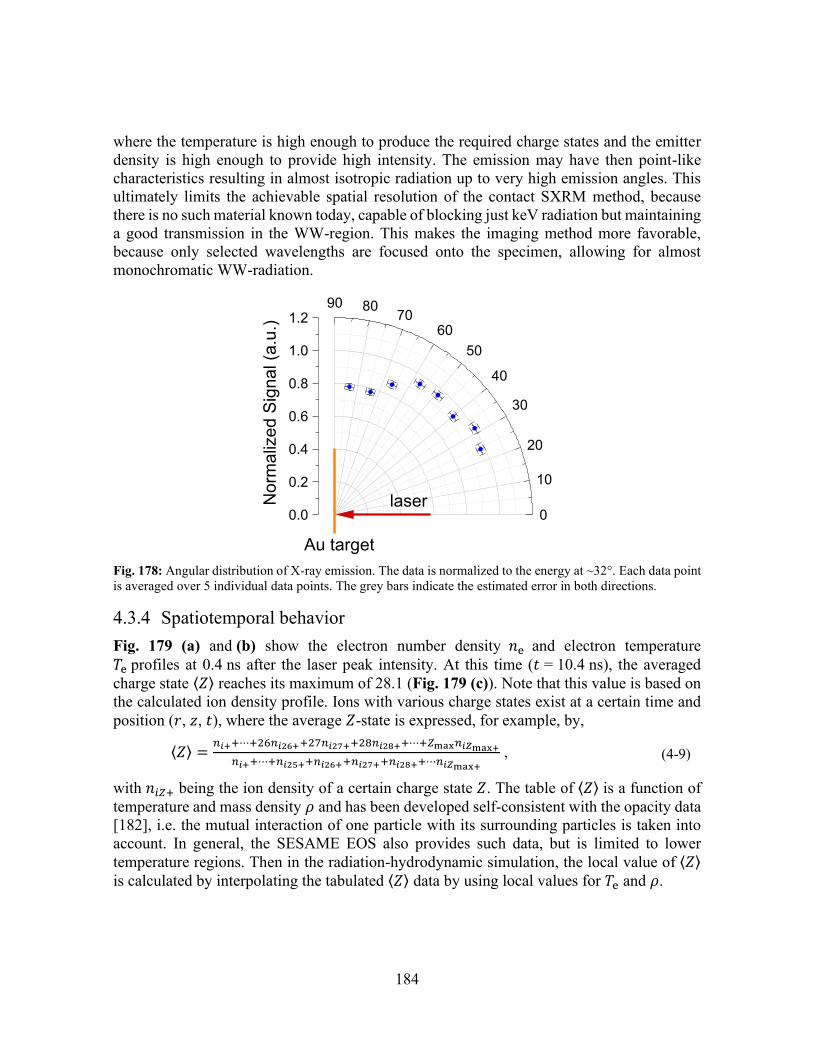
184
where the temperature is high enough to produce the required charge states and the emitter density is high enough to provide high intensity. The emission may have then point-like characteristics resulting in almost isotropic radiation up to very high emission angles. This ultimately limits the achievable spatial resolution of the contact SXRM method, because there is no such material known today, capable of blocking just keV radiation but maintaining a good transmission in the WW-region. This makes the imaging method more favorable, because only selected wavelengths are focused onto the specimen, allowing for almost monochromatic WW-radiation.
0
10
20
30
40
5060
708090
0.0
0.2
0.4
0.6
0.8
1.0
1.2
Nor
mal
ized
Sig
nal (
a.u.
)
laser
Au target Fig. 178: Angular distribution of X-ray emission. The data is normalized to the energy at ~32°. Each data point is averaged over 5 individual data points. The grey bars indicate the estimated error in both directions.
4.3.4 Spatiotemporal behavior Fig. 179 (a) and (b) show the electron number density 𝑛e and electron temperature 𝑇e profiles at 0.4 ns after the laser peak intensity. At this time (𝑡 = 10.4 ns), the averaged charge state ⟨𝑍⟩ reaches its maximum of 28.1 (Fig. 179 (c)). Note that this value is based on the calculated ion density profile. Ions with various charge states exist at a certain time and position (𝑟, 𝑧, 𝑡), where the average 𝑍-state is expressed, for example, by,
⟨𝑍⟩ =𝑛𝑖++⋯+26𝑛𝑖26++27𝑛𝑖27++28𝑛𝑖28++⋯+𝑍max𝑛𝑖𝑍max+
𝑛𝑖++⋯+𝑛𝑖25++𝑛𝑖26++𝑛𝑖27++𝑛𝑖28++⋯𝑛𝑖𝑍max+
, (4-9)
with 𝑛𝑖𝑍+ being the ion density of a certain charge state 𝑍. The table of ⟨𝑍⟩ is a function of temperature and mass density 𝜌 and has been developed self-consistent with the opacity data [182], i.e. the mutual interaction of one particle with its surrounding particles is taken into account. In general, the SESAME EOS also provides such data, but is limited to lower temperature regions. Then in the radiation-hydrodynamic simulation, the local value of ⟨𝑍⟩ is calculated by interpolating the tabulated ⟨𝑍⟩ data by using local values for 𝑇e and 𝜌.
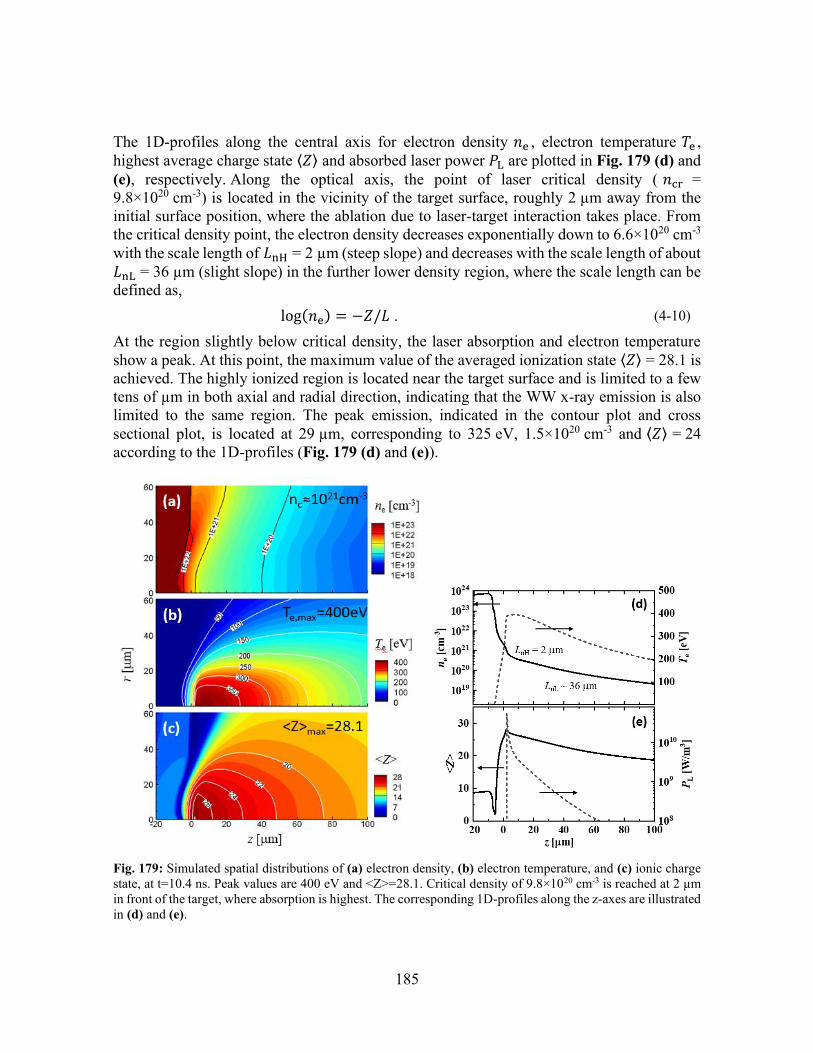
185
The 1D-profiles along the central axis for electron density 𝑛e , electron temperature 𝑇e , highest average charge state ⟨𝑍⟩ and absorbed laser power 𝑃L are plotted in Fig. 179 (d) and (e), respectively. Along the optical axis, the point of laser critical density ( 𝑛cr = 9.8×1020 cm-3) is located in the vicinity of the target surface, roughly 2 µm away from the initial surface position, where the ablation due to laser-target interaction takes place. From the critical density point, the electron density decreases exponentially down to 6.6×1020 cm-3 with the scale length of 𝐿nH = 2 µm (steep slope) and decreases with the scale length of about 𝐿nL = 36 µm (slight slope) in the further lower density region, where the scale length can be defined as,
log(𝑛e) = −𝑍/𝐿 . (4-10)
At the region slightly below critical density, the laser absorption and electron temperature show a peak. At this point, the maximum value of the averaged ionization state ⟨𝑍⟩ = 28.1 is achieved. The highly ionized region is located near the target surface and is limited to a few tens of µm in both axial and radial direction, indicating that the WW x-ray emission is also limited to the same region. The peak emission, indicated in the contour plot and cross sectional plot, is located at 29 µm, corresponding to 325 eV, 1.5×1020 cm-3 and ⟨𝑍⟩ = 24 according to the 1D-profiles (Fig. 179 (d) and (e)).
Fig. 179: Simulated spatial distributions of (a) electron density, (b) electron temperature, and (c) ionic charge state, at t=10.4 ns. Peak values are 400 eV and <Z>=28.1. Critical density of 9.8×1020 cm-3 is reached at 2 µm in front of the target, where absorption is highest. The corresponding 1D-profiles along the z-axes are illustrated in (d) and (e).
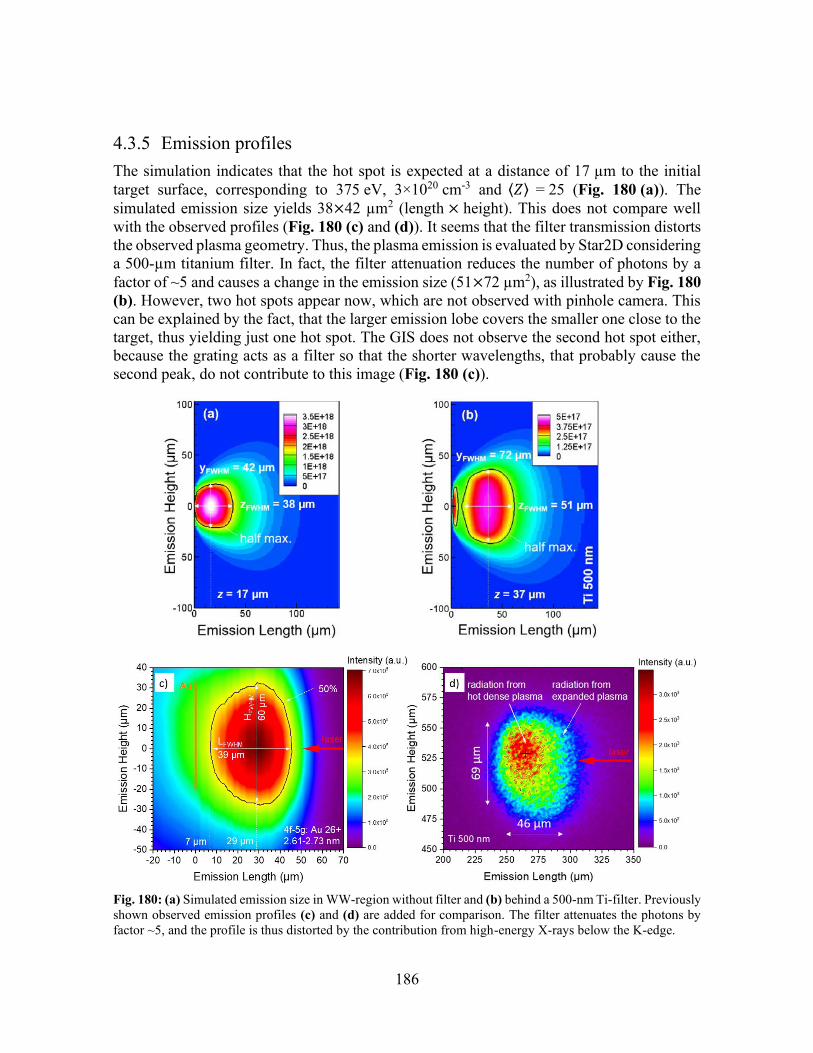
186
4.3.5 Emission profiles The simulation indicates that the hot spot is expected at a distance of 17 µm to the initial target surface, corresponding to 375 eV, 3×1020 cm-3 and ⟨𝑍⟩ = 25 (Fig. 180 (a)). The simulated emission size yields 38×42 µm2 (length × height). This does not compare well with the observed profiles (Fig. 180 (c) and (d)). It seems that the filter transmission distorts the observed plasma geometry. Thus, the plasma emission is evaluated by Star2D considering a 500-µm titanium filter. In fact, the filter attenuation reduces the number of photons by a factor of ~5 and causes a change in the emission size (51×72 µm2), as illustrated by Fig. 180 (b). However, two hot spots appear now, which are not observed with pinhole camera. This can be explained by the fact, that the larger emission lobe covers the smaller one close to the target, thus yielding just one hot spot. The GIS does not observe the second hot spot either, because the grating acts as a filter so that the shorter wavelengths, that probably cause the second peak, do not contribute to this image (Fig. 180 (c)).
Fig. 180: (a) Simulated emission size in WW-region without filter and (b) behind a 500-nm Ti-filter. Previously shown observed emission profiles (c) and (d) are added for comparison. The filter attenuates the photons by factor ~5, and the profile is thus distorted by the contribution from high-energy X-rays below the K-edge.
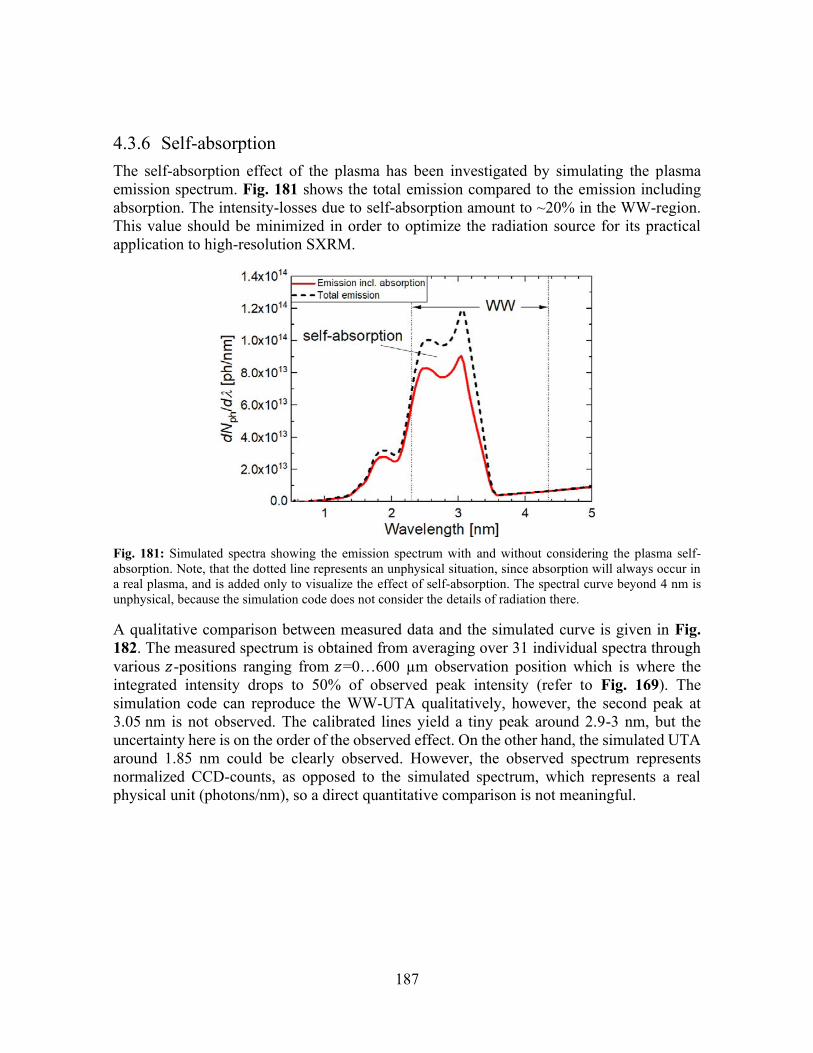
187
4.3.6 Self-absorption The self-absorption effect of the plasma has been investigated by simulating the plasma emission spectrum. Fig. 181 shows the total emission compared to the emission including absorption. The intensity-losses due to self-absorption amount to ~20% in the WW-region. This value should be minimized in order to optimize the radiation source for its practical application to high-resolution SXRM.
Fig. 181: Simulated spectra showing the emission spectrum with and without considering the plasma self-absorption. Note, that the dotted line represents an unphysical situation, since absorption will always occur in a real plasma, and is added only to visualize the effect of self-absorption. The spectral curve beyond 4 nm is unphysical, because the simulation code does not consider the details of radiation there.
A qualitative comparison between measured data and the simulated curve is given in Fig. 182. The measured spectrum is obtained from averaging over 31 individual spectra through various 𝑧-positions ranging from 𝑧=0…600 µm observation position which is where the integrated intensity drops to 50% of observed peak intensity (refer to Fig. 169). The simulation code can reproduce the WW-UTA qualitatively, however, the second peak at 3.05 nm is not observed. The calibrated lines yield a tiny peak around 2.9-3 nm, but the uncertainty here is on the order of the observed effect. On the other hand, the simulated UTA around 1.85 nm could be clearly observed. However, the observed spectrum represents normalized CCD-counts, as opposed to the simulated spectrum, which represents a real physical unit (photons/nm), so a direct quantitative comparison is not meaningful.
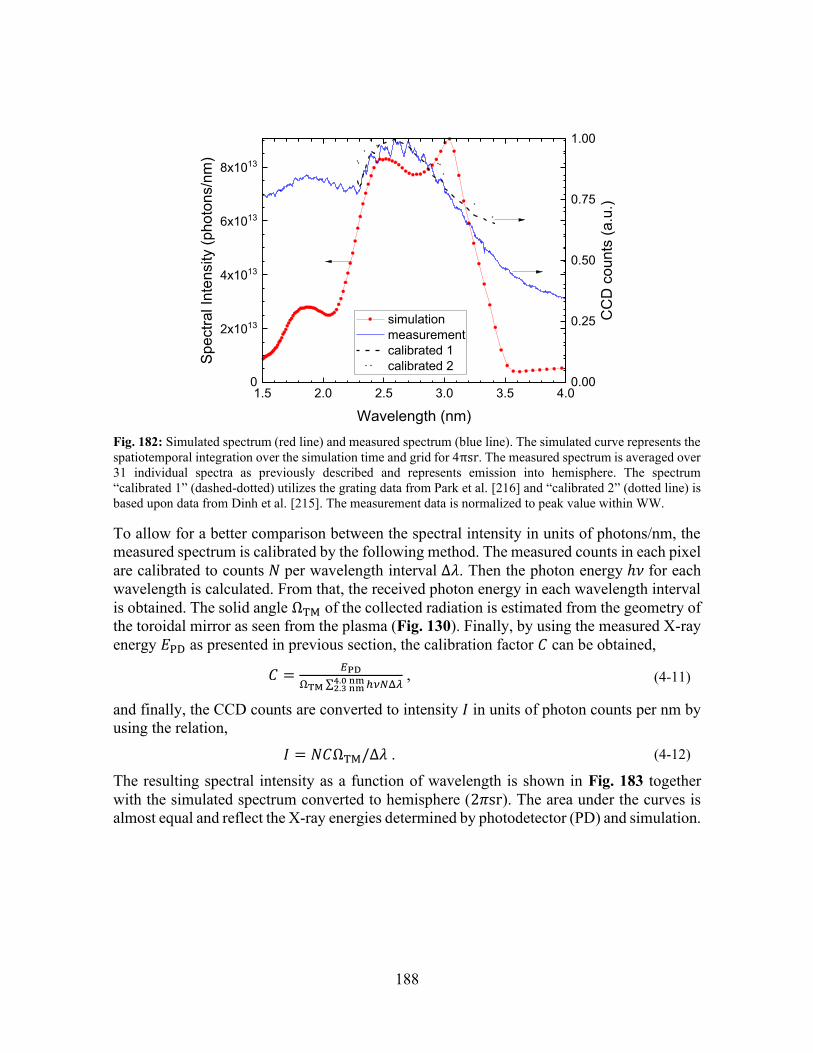
188
1.5 2.0 2.5 3.0 3.5 4.00
2x10¹³
4x10¹³
6x10¹³
8x10¹³
simulation measurement calibrated 1 calibrated 2
Wavelength (nm)
Spec
tral I
nten
sity
(pho
tons
/nm
)
0.00
0.25
0.50
0.75
1.00
CC
D c
ount
s (a
.u.)
Fig. 182: Simulated spectrum (red line) and measured spectrum (blue line). The simulated curve represents the spatiotemporal integration over the simulation time and grid for 4πsr. The measured spectrum is averaged over 31 individual spectra as previously described and represents emission into hemisphere. The spectrum “calibrated 1” (dashed-dotted) utilizes the grating data from Park et al. [216] and “calibrated 2” (dotted line) is based upon data from Dinh et al. [215]. The measurement data is normalized to peak value within WW.
To allow for a better comparison between the spectral intensity in units of photons/nm, the measured spectrum is calibrated by the following method. The measured counts in each pixel are calibrated to counts 𝑁 per wavelength interval ∆𝜆. Then the photon energy ℎ𝜈 for each wavelength is calculated. From that, the received photon energy in each wavelength interval is obtained. The solid angle ΩTM of the collected radiation is estimated from the geometry of the toroidal mirror as seen from the plasma (Fig. 130). Finally, by using the measured X-ray energy 𝐸PD as presented in previous section, the calibration factor 𝐶 can be obtained,
𝐶 =𝐸PD
ΩTM ∑ ℎ𝜈𝑁Δ𝜆4.0 nm2.3 nm
, (4-11)
and finally, the CCD counts are converted to intensity 𝐼 in units of photon counts per nm by using the relation,
𝐼 = 𝑁𝐶ΩTM/Δ𝜆 . (4-12)
The resulting spectral intensity as a function of wavelength is shown in Fig. 183 together with the simulated spectrum converted to hemisphere (2𝜋sr). The area under the curves is almost equal and reflect the X-ray energies determined by photodetector (PD) and simulation.
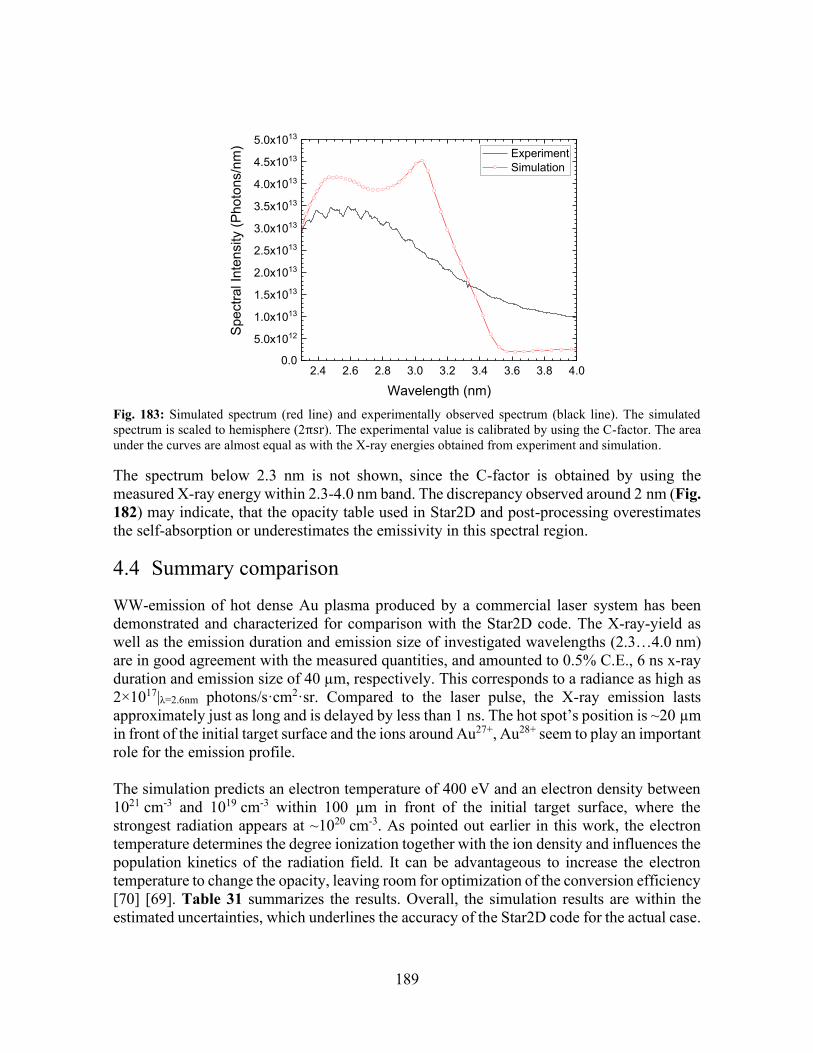
189
2.4 2.6 2.8 3.0 3.2 3.4 3.6 3.8 4.00.0
5.0x10¹²
1.0x10¹³
1.5x10¹³
2.0x10¹³
2.5x10¹³
3.0x10¹³
3.5x10¹³
4.0x10¹³
4.5x10¹³
5.0x10¹³
Spec
tral I
nten
sity
(Pho
tons
/nm
)
Wavelength (nm)
Experiment Simulation
Fig. 183: Simulated spectrum (red line) and experimentally observed spectrum (black line). The simulated spectrum is scaled to hemisphere (2πsr). The experimental value is calibrated by using the C-factor. The area under the curves are almost equal as with the X-ray energies obtained from experiment and simulation.
The spectrum below 2.3 nm is not shown, since the C-factor is obtained by using the measured X-ray energy within 2.3-4.0 nm band. The discrepancy observed around 2 nm (Fig. 182) may indicate, that the opacity table used in Star2D and post-processing overestimates the self-absorption or underestimates the emissivity in this spectral region.
4.4 Summary comparison
WW-emission of hot dense Au plasma produced by a commercial laser system has been demonstrated and characterized for comparison with the Star2D code. The X-ray-yield as well as the emission duration and emission size of investigated wavelengths (2.3…4.0 nm) are in good agreement with the measured quantities, and amounted to 0.5% C.E., 6 ns x-ray duration and emission size of 40 µm, respectively. This corresponds to a radiance as high as 2×10¹⁷|λ=2.6nm photons/s·cm2·sr. Compared to the laser pulse, the X-ray emission lasts approximately just as long and is delayed by less than 1 ns. The hot spot’s position is ~20 µm in front of the initial target surface and the ions around Au27+, Au28+ seem to play an important role for the emission profile. The simulation predicts an electron temperature of 400 eV and an electron density between 1021 cm-3 and 1019 cm-3 within 100 µm in front of the initial target surface, where the strongest radiation appears at ~1020 cm-3. As pointed out earlier in this work, the electron temperature determines the degree ionization together with the ion density and influences the population kinetics of the radiation field. It can be advantageous to increase the electron temperature to change the opacity, leaving room for optimization of the conversion efficiency [70] [69]. Table 31 summarizes the results. Overall, the simulation results are within the estimated uncertainties, which underlines the accuracy of the Star2D code for the actual case.
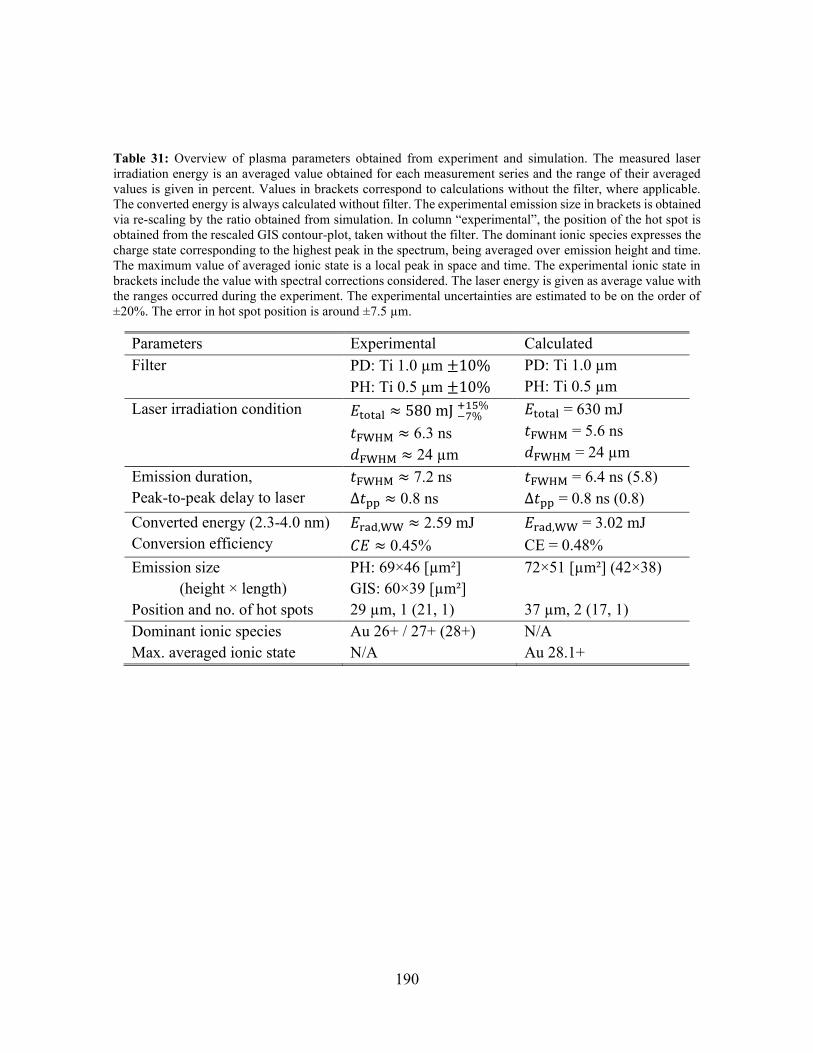
190
Table 31: Overview of plasma parameters obtained from experiment and simulation. The measured laser irradiation energy is an averaged value obtained for each measurement series and the range of their averaged values is given in percent. Values in brackets correspond to calculations without the filter, where applicable. The converted energy is always calculated without filter. The experimental emission size in brackets is obtained via re-scaling by the ratio obtained from simulation. In column “experimental”, the position of the hot spot is obtained from the rescaled GIS contour-plot, taken without the filter. The dominant ionic species expresses the charge state corresponding to the highest peak in the spectrum, being averaged over emission height and time. The maximum value of averaged ionic state is a local peak in space and time. The experimental ionic state in brackets include the value with spectral corrections considered. The laser energy is given as average value with the ranges occurred during the experiment. The experimental uncertainties are estimated to be on the order of ±20%. The error in hot spot position is around ±7.5 µm.
Parameters Experimental Calculated Filter PD: Ti 1.0 µm ±10%
PH: Ti 0.5 µm ±10% PD: Ti 1.0 µm PH: Ti 0.5 µm
Laser irradiation condition 𝐸total ≈ 580 mJ −7%+15%
𝑡FWHM ≈ 6.3 ns 𝑑FWHM ≈ 24 µm
𝐸total = 630 mJ 𝑡FWHM = 5.6 ns 𝑑FWHM = 24 µm
Emission duration, Peak-to-peak delay to laser
𝑡FWHM ≈ 7.2 ns ∆𝑡pp ≈ 0.8 ns
𝑡FWHM = 6.4 ns (5.8) ∆𝑡pp = 0.8 ns (0.8)
Converted energy (2.3-4.0 nm) Conversion efficiency
𝐸rad,WW ≈ 2.59 mJ 𝐶𝐸 ≈ 0.45%
𝐸rad,WW = 3.02 mJ CE = 0.48%
Emission size (height × length) Position and no. of hot spots
PH: 69×46 [µm²] GIS: 60×39 [µm²] 29 µm, 1 (21, 1)
72×51 [µm²] (42×38) 37 µm, 2 (17, 1)
Dominant ionic species Max. averaged ionic state
Au 26+ / 27+ (28+) N/A
N/A Au 28.1+
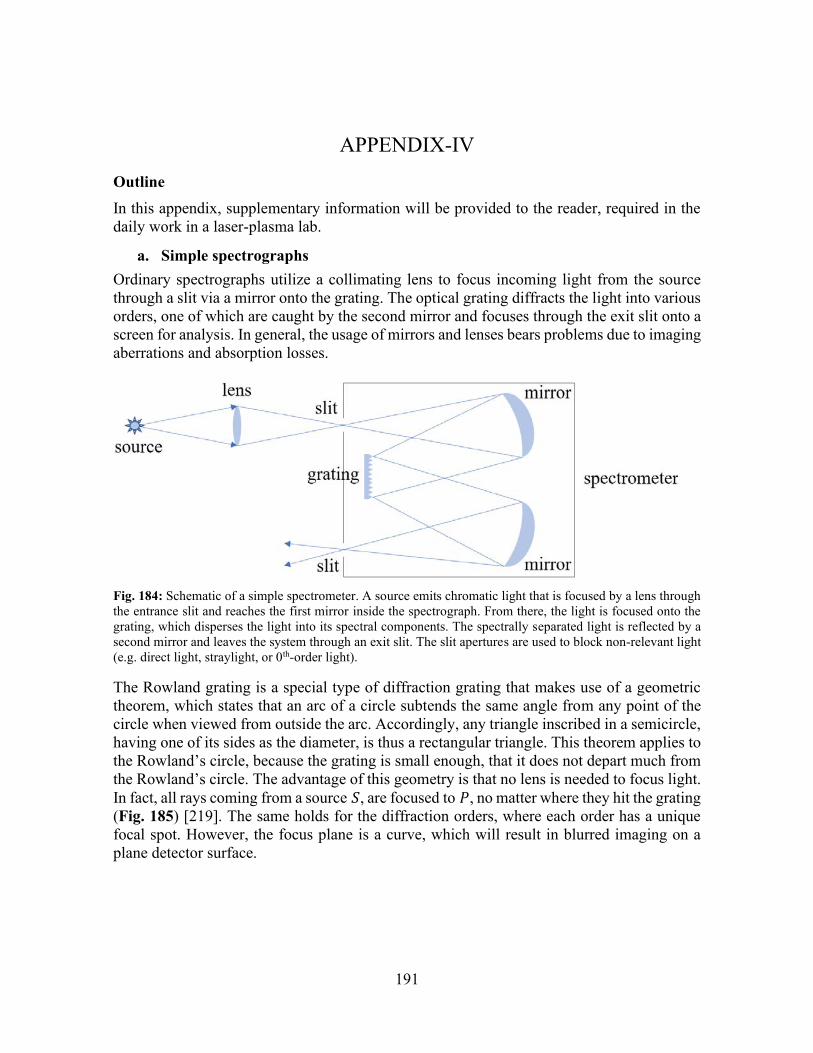
191
APPENDIX-IV
Outline In this appendix, supplementary information will be provided to the reader, required in the daily work in a laser-plasma lab.
a. Simple spectrographs Ordinary spectrographs utilize a collimating lens to focus incoming light from the source through a slit via a mirror onto the grating. The optical grating diffracts the light into various orders, one of which are caught by the second mirror and focuses through the exit slit onto a screen for analysis. In general, the usage of mirrors and lenses bears problems due to imaging aberrations and absorption losses.
Fig. 184: Schematic of a simple spectrometer. A source emits chromatic light that is focused by a lens through the entrance slit and reaches the first mirror inside the spectrograph. From there, the light is focused onto the grating, which disperses the light into its spectral components. The spectrally separated light is reflected by a second mirror and leaves the system through an exit slit. The slit apertures are used to block non-relevant light (e.g. direct light, straylight, or 0th-order light).
The Rowland grating is a special type of diffraction grating that makes use of a geometric theorem, which states that an arc of a circle subtends the same angle from any point of the circle when viewed from outside the arc. Accordingly, any triangle inscribed in a semicircle, having one of its sides as the diameter, is thus a rectangular triangle. This theorem applies to the Rowland’s circle, because the grating is small enough, that it does not depart much from the Rowland’s circle. The advantage of this geometry is that no lens is needed to focus light. In fact, all rays coming from a source 𝑆, are focused to 𝑃, no matter where they hit the grating (Fig. 185) [219]. The same holds for the diffraction orders, where each order has a unique focal spot. However, the focus plane is a curve, which will result in blurred imaging on a plane detector surface.
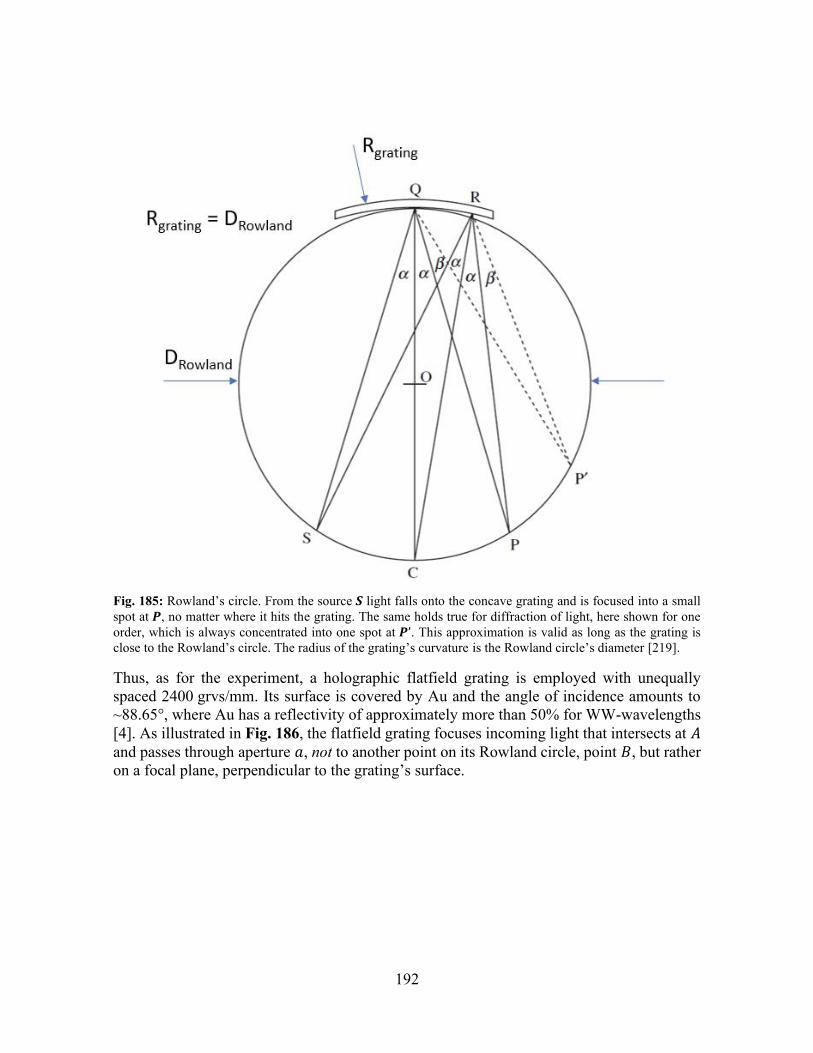
192
Fig. 185: Rowland’s circle. From the source 𝑺 light falls onto the concave grating and is focused into a small spot at 𝑷, no matter where it hits the grating. The same holds true for diffraction of light, here shown for one order, which is always concentrated into one spot at 𝑷’. This approximation is valid as long as the grating is close to the Rowland’s circle. The radius of the grating’s curvature is the Rowland circle’s diameter [219].
Thus, as for the experiment, a holographic flatfield grating is employed with unequally spaced 2400 grvs/mm. Its surface is covered by Au and the angle of incidence amounts to ~88.65°, where Au has a reflectivity of approximately more than 50% for WW-wavelengths [4]. As illustrated in Fig. 186, the flatfield grating focuses incoming light that intersects at 𝐴 and passes through aperture 𝑎, not to another point on its Rowland circle, point 𝐵, but rather on a focal plane, perpendicular to the grating’s surface.
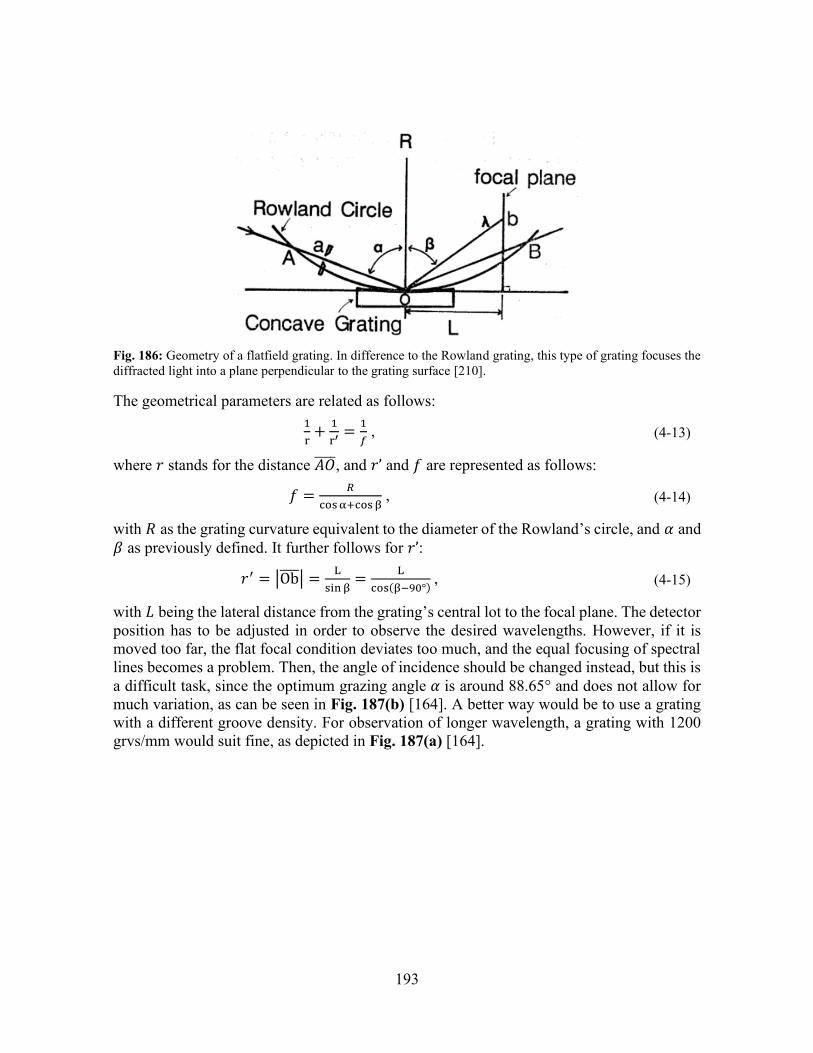
193
Fig. 186: Geometry of a flatfield grating. In difference to the Rowland grating, this type of grating focuses the diffracted light into a plane perpendicular to the grating surface [210].
The geometrical parameters are related as follows: 1
r+
1
r′ =1
𝑓 , (4-13)
where 𝑟 stands for the distance 𝐴𝑂 , and 𝑟’ and 𝑓 are represented as follows:
𝑓 =𝑅
cos α+cos β , (4-14)
with 𝑅 as the grating curvature equivalent to the diameter of the Rowland’s circle, and 𝛼 and 𝛽 as previously defined. It further follows for 𝑟’:
𝑟′ = |Ob | =L
sin β=
L
cos(β−90°) , (4-15)
with 𝐿 being the lateral distance from the grating’s central lot to the focal plane. The detector position has to be adjusted in order to observe the desired wavelengths. However, if it is moved too far, the flat focal condition deviates too much, and the equal focusing of spectral lines becomes a problem. Then, the angle of incidence should be changed instead, but this is a difficult task, since the optimum grazing angle 𝛼 is around 88.65° and does not allow for much variation, as can be seen in Fig. 187(b) [164]. A better way would be to use a grating with a different groove density. For observation of longer wavelength, a grating with 1200 grvs/mm would suit fine, as depicted in Fig. 187(a) [164].
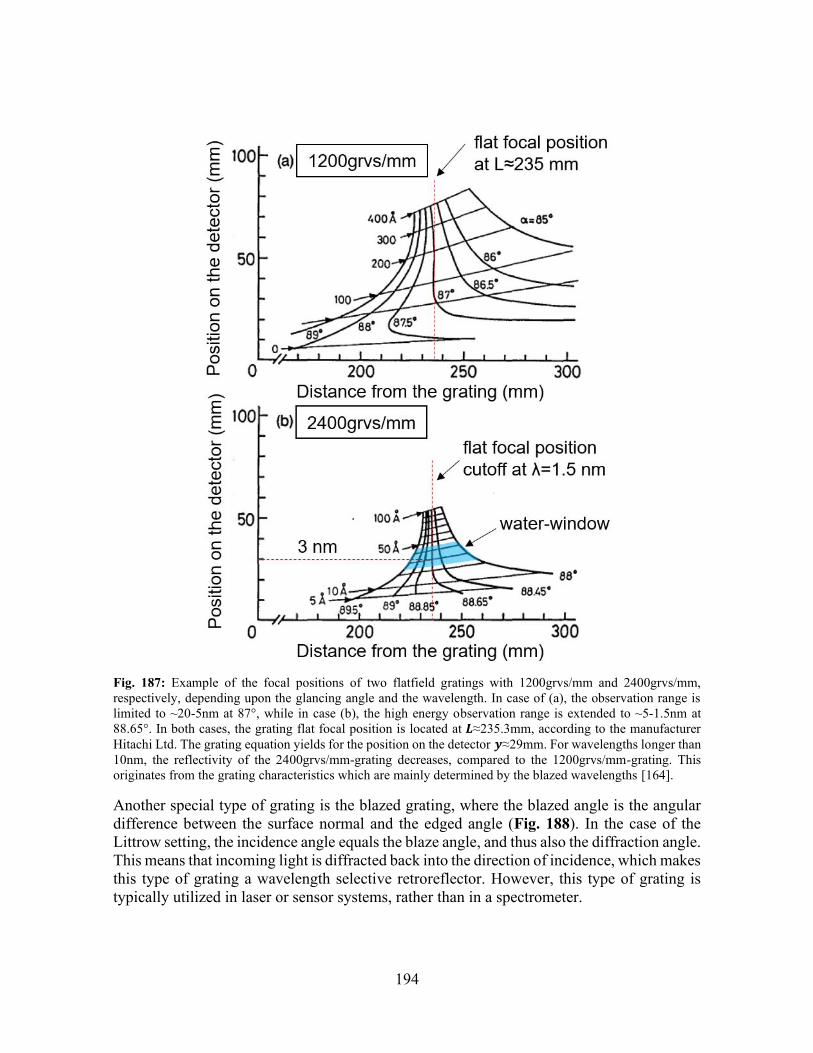
194
Fig. 187: Example of the focal positions of two flatfield gratings with 1200grvs/mm and 2400grvs/mm, respectively, depending upon the glancing angle and the wavelength. In case of (a), the observation range is limited to ~20-5nm at 87°, while in case (b), the high energy observation range is extended to ~5-1.5nm at 88.65°. In both cases, the grating flat focal position is located at 𝑳≈235.3mm, according to the manufacturer Hitachi Ltd. The grating equation yields for the position on the detector 𝒚≈29mm. For wavelengths longer than 10nm, the reflectivity of the 2400grvs/mm-grating decreases, compared to the 1200grvs/mm-grating. This originates from the grating characteristics which are mainly determined by the blazed wavelengths [164].
Another special type of grating is the blazed grating, where the blazed angle is the angular difference between the surface normal and the edged angle (Fig. 188). In the case of the Littrow setting, the incidence angle equals the blaze angle, and thus also the diffraction angle. This means that incoming light is diffracted back into the direction of incidence, which makes this type of grating a wavelength selective retroreflector. However, this type of grating is typically utilized in laser or sensor systems, rather than in a spectrometer.
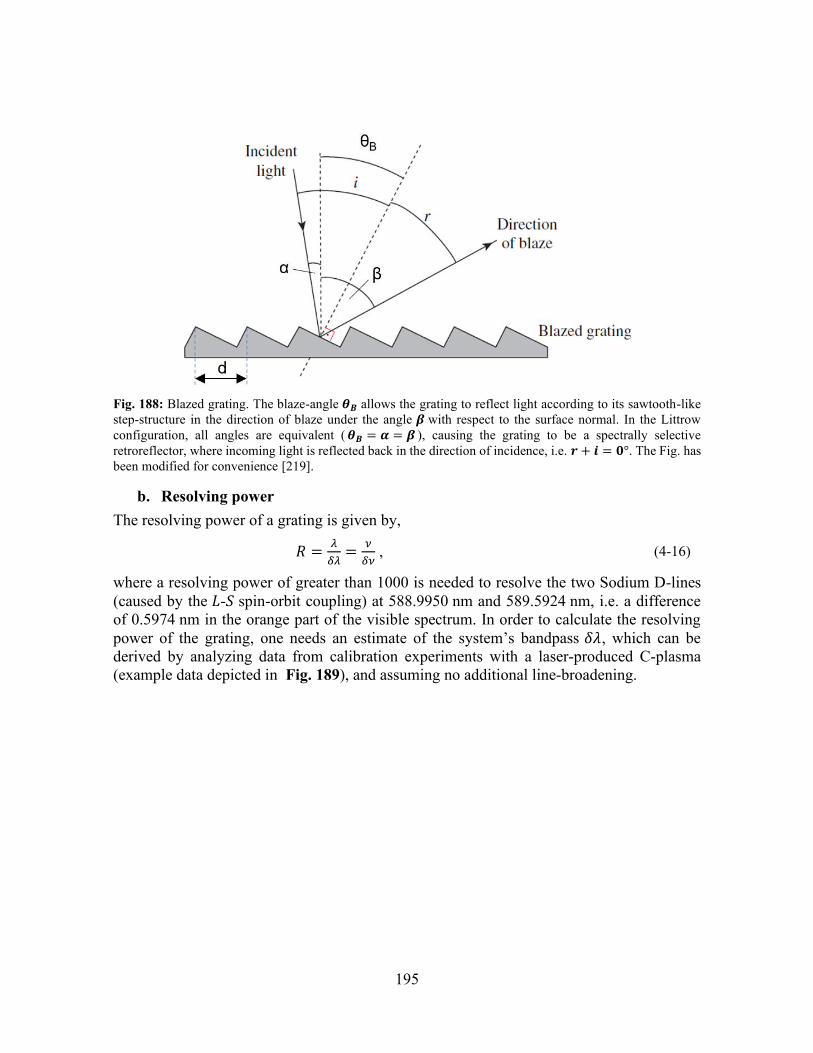
195
Fig. 188: Blazed grating. The blaze-angle 𝜽𝑩 allows the grating to reflect light according to its sawtooth-like step-structure in the direction of blaze under the angle 𝜷 with respect to the surface normal. In the Littrow configuration, all angles are equivalent ( 𝜽𝑩 = 𝜶 = 𝜷 ), causing the grating to be a spectrally selective retroreflector, where incoming light is reflected back in the direction of incidence, i.e. 𝒓 + 𝒊 = 𝟎°. The Fig. has been modified for convenience [219].
b. Resolving power The resolving power of a grating is given by,
𝑅 =𝜆
𝛿𝜆=
𝜈
𝛿𝜈 , (4-16)
where a resolving power of greater than 1000 is needed to resolve the two Sodium D-lines (caused by the 𝐿-𝑆 spin-orbit coupling) at 588.9950 nm and 589.5924 nm, i.e. a difference of 0.5974 nm in the orange part of the visible spectrum. In order to calculate the resolving power of the grating, one needs an estimate of the system’s bandpass 𝛿𝜆, which can be derived by analyzing data from calibration experiments with a laser-produced C-plasma (example data depicted in Fig. 189), and assuming no additional line-broadening.
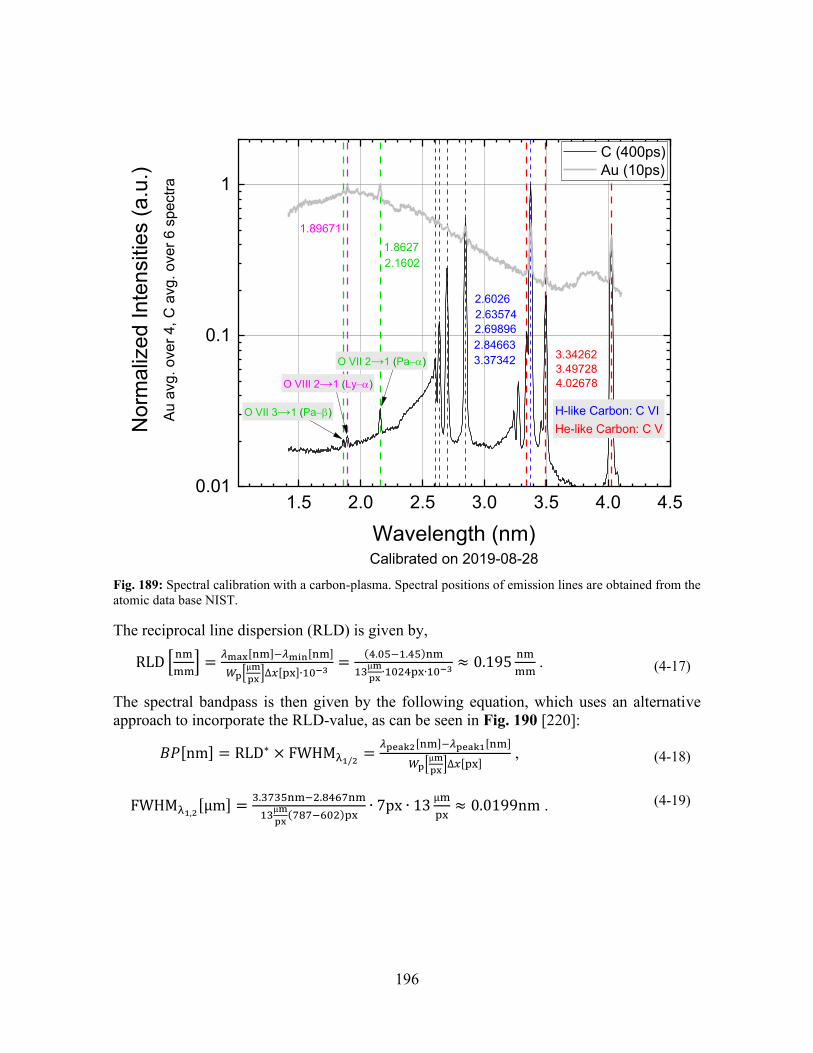
196
Fig. 189: Spectral calibration with a carbon-plasma. Spectral positions of emission lines are obtained from the atomic data base NIST.
The reciprocal line dispersion (RLD) is given by,
RLD [nm
mm] =
𝜆max[nm]−𝜆min[nm]
𝑊p[µm
px]∆𝑥[px]∙10−3
=(4.05−1.45)nm
13µm
px∙1024px∙10−3
≈ 0.195nm
mm . (4-17)
The spectral bandpass is then given by the following equation, which uses an alternative approach to incorporate the RLD-value, as can be seen in Fig. 190 [220]:
𝐵𝑃[nm] = RLD∗ × FWHMλ1/2=
𝜆peak2[nm]−𝜆peak1[nm]
𝑊p[µm
px]∆𝑥[px]
, (4-18)
FWHMλ1,2[µm] =
3.3735nm−2.8467nm
13µm
px(787−602)px
∙ 7px ∙ 13µm
px≈ 0.0199nm . (4-19)
1.5 2.0 2.5 3.0 3.5 4.0 4.50.01
0.1
1
GIS Calibration and Oxygen IdentificationN
orm
aliz
ed In
tens
ities
(a.u
.)Au
avg
. ove
r 4, C
avg
. ove
r 6 s
pect
ra
Wavelength (nm)Calibrated on 2019-08-28
C (400ps) Au (10ps)
2.1602
1.89671
2.635742.6026
2.698962.846633.37342 3.34262
3.497284.02678
H-like Carbon: C VIHe-like Carbon: C V
1.8627
O VII 2→1 (Pa-a)
O VIII 2→1 (Ly-a)
O VII 3→1 (Pa-b)
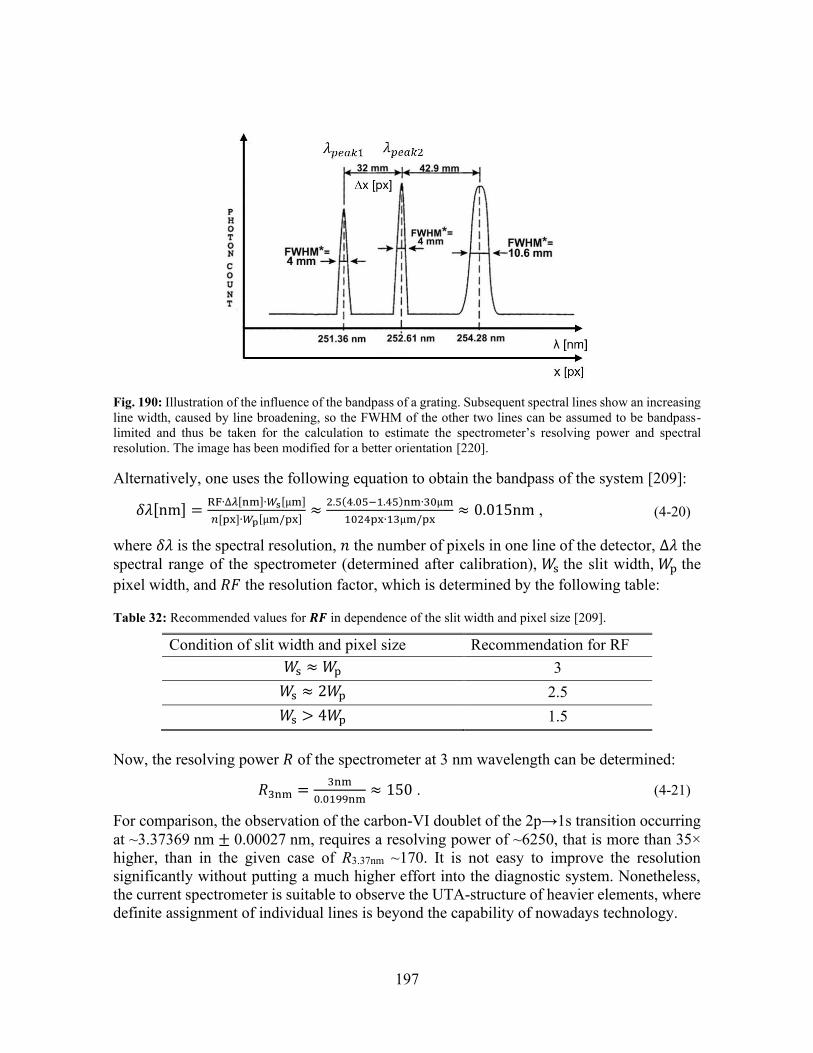
197
Fig. 190: Illustration of the influence of the bandpass of a grating. Subsequent spectral lines show an increasing line width, caused by line broadening, so the FWHM of the other two lines can be assumed to be bandpass-limited and thus be taken for the calculation to estimate the spectrometer’s resolving power and spectral resolution. The image has been modified for a better orientation [220].
Alternatively, one uses the following equation to obtain the bandpass of the system [209]:
𝛿𝜆[nm] =RF∙∆𝜆[nm]∙𝑊s[µm]
𝑛[px]∙𝑊p[µm/px]≈
2.5(4.05−1.45)nm∙30µm
1024px∙13µm/px≈ 0.015nm , (4-20)
where 𝛿𝜆 is the spectral resolution, 𝑛 the number of pixels in one line of the detector, ∆𝜆 the spectral range of the spectrometer (determined after calibration), 𝑊s the slit width, 𝑊p the pixel width, and 𝑅𝐹 the resolution factor, which is determined by the following table:
Table 32: Recommended values for 𝑹𝑭 in dependence of the slit width and pixel size [209].
Condition of slit width and pixel size Recommendation for RF 𝑊s ≈ 𝑊p 3
𝑊s ≈ 2𝑊p 2.5 𝑊s > 4𝑊p 1.5
Now, the resolving power 𝑅 of the spectrometer at 3 nm wavelength can be determined:
𝑅3nm =3nm
0.0199nm≈ 150 . (4-21)
For comparison, the observation of the carbon-VI doublet of the 2p→1s transition occurring at ~3.37369 nm ± 0.00027 nm, requires a resolving power of ~6250, that is more than 35× higher, than in the given case of R3.37nm ~170. It is not easy to improve the resolution significantly without putting a much higher effort into the diagnostic system. Nonetheless, the current spectrometer is suitable to observe the UTA-structure of heavier elements, where definite assignment of individual lines is beyond the capability of nowadays technology.
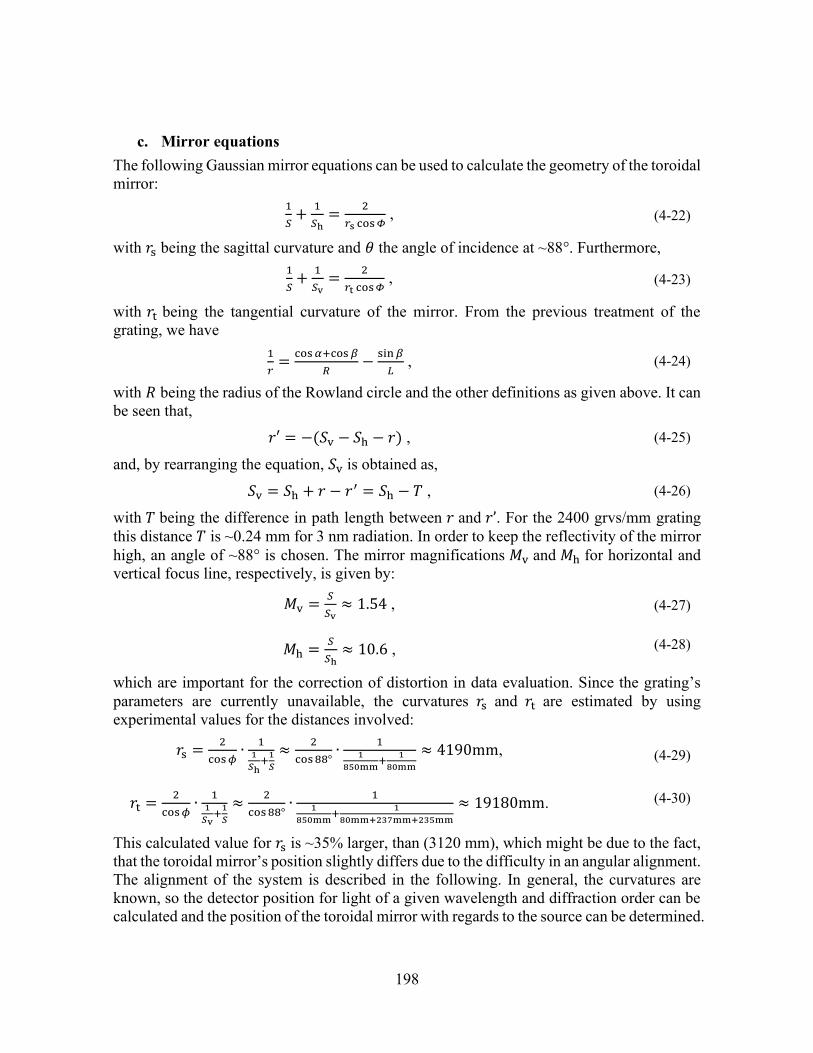
198
c. Mirror equations The following Gaussian mirror equations can be used to calculate the geometry of the toroidal mirror:
1
𝑆+
1
𝑆h=
2
𝑟s cos 𝛷 , (4-22)
with 𝑟s being the sagittal curvature and 𝜃 the angle of incidence at ~88°. Furthermore, 1
𝑆+
1
𝑆v=
2
𝑟t cos 𝛷 , (4-23)
with 𝑟t being the tangential curvature of the mirror. From the previous treatment of the grating, we have
1
𝑟=
cos 𝛼+cos 𝛽
𝑅−
sin 𝛽
𝐿 , (4-24)
with 𝑅 being the radius of the Rowland circle and the other definitions as given above. It can be seen that,
𝑟′ = −(𝑆v − 𝑆h − 𝑟) , (4-25)
and, by rearranging the equation, 𝑆v is obtained as,
𝑆v = 𝑆h + 𝑟 − 𝑟′ = 𝑆h − 𝑇 , (4-26)
with 𝑇 being the difference in path length between 𝑟 and 𝑟’. For the 2400 grvs/mm grating this distance 𝑇 is ~0.24 mm for 3 nm radiation. In order to keep the reflectivity of the mirror high, an angle of ~88° is chosen. The mirror magnifications 𝑀v and 𝑀h for horizontal and vertical focus line, respectively, is given by:
𝑀v =𝑆
𝑆v≈ 1.54 , (4-27)
𝑀h =𝑆
𝑆h≈ 10.6 , (4-28)
which are important for the correction of distortion in data evaluation. Since the grating’s parameters are currently unavailable, the curvatures 𝑟s and 𝑟t are estimated by using experimental values for the distances involved:
𝑟s =2
cos 𝜙∙
11
𝑆h+
1
𝑆
≈2
cos 88°∙
11
850mm+
1
80mm
≈ 4190mm, (4-29)
𝑟t =2
cos 𝜙∙
11
𝑆v+
1
𝑆
≈2
cos 88°∙
11
850mm+
1
80mm+237mm+235mm
≈ 19180mm. (4-30)
This calculated value for 𝑟s is ~35% larger, than (3120 mm), which might be due to the fact, that the toroidal mirror’s position slightly differs due to the difficulty in an angular alignment. The alignment of the system is described in the following. In general, the curvatures are known, so the detector position for light of a given wavelength and diffraction order can be calculated and the position of the toroidal mirror with regards to the source can be determined.
199
d. Alignment of a spectrometer The correct positioning of the flatfield grating and the toroidal mirror is a quite difficult task, since very narrow angles are involved and not too much variation in the distances and angles is allowed for a good focusing condition. Furthermore, the whole equipment in the spectrometer tube is heavy and has no fine-adjustment stage to be moved on but has to be positioned by hand before the alignment can begin. In the first step, the geometrical condition of the flatfield grating and the path between radiation source (plasma) and toroidal mirror should be calculated roughly. Then, a mirror is inserted between toroidal mirror and detector-plane and a He-Ne pilot-laser beam is injected. The beam alignment is practically done via two mirrors, in order to control angle and position of the point of reflection and make the beam fit through slit and flatfield grating. The beam at the detection plane marks the 0th-order light (reflection), as depicted in Fig. 191 (top). Next, the mirror will be removed, and the He-Ne laser is used to shoot from the rear side through the detection plane using the same light path as previously. Now, the toroidal mirror's position can be determined (Fig. 191 center). A horizontal slit aperture should be installed at the detection plane and the reflected laser-beam is then observed on a screen (preferably a white sheet of paper). By that, one can determine if the lateral target position, where the plasma will evolve later, is correct. If the alignment of the toroidal mirror is wrong, the plasma image is distorted and becomes weak and doubled, instead of one clear and sharp spectral line (Fig. 191 bottom).
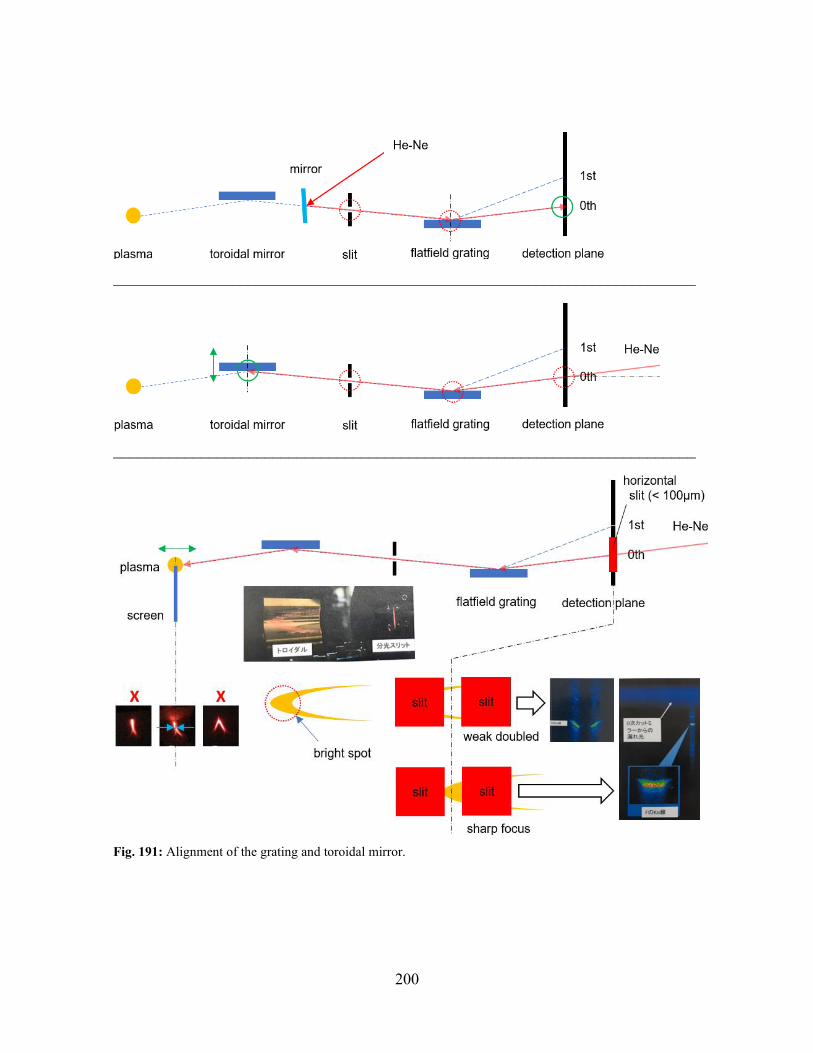
200
_________________________________________________________________________
_________________________________________________________________________
Fig. 191: Alignment of the grating and toroidal mirror.
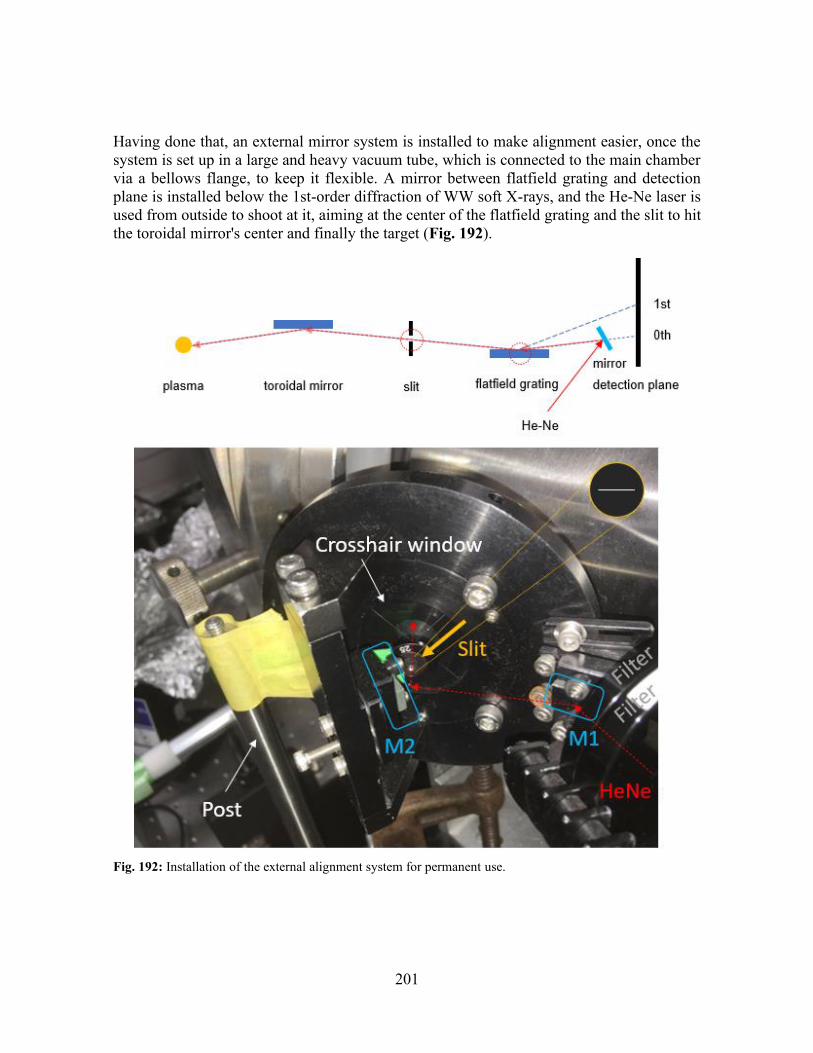
201
Having done that, an external mirror system is installed to make alignment easier, once the system is set up in a large and heavy vacuum tube, which is connected to the main chamber via a bellows flange, to keep it flexible. A mirror between flatfield grating and detection plane is installed below the 1st-order diffraction of WW soft X-rays, and the He-Ne laser is used from outside to shoot at it, aiming at the center of the flatfield grating and the slit to hit the toroidal mirror's center and finally the target (Fig. 192).
Fig. 192: Installation of the external alignment system for permanent use.
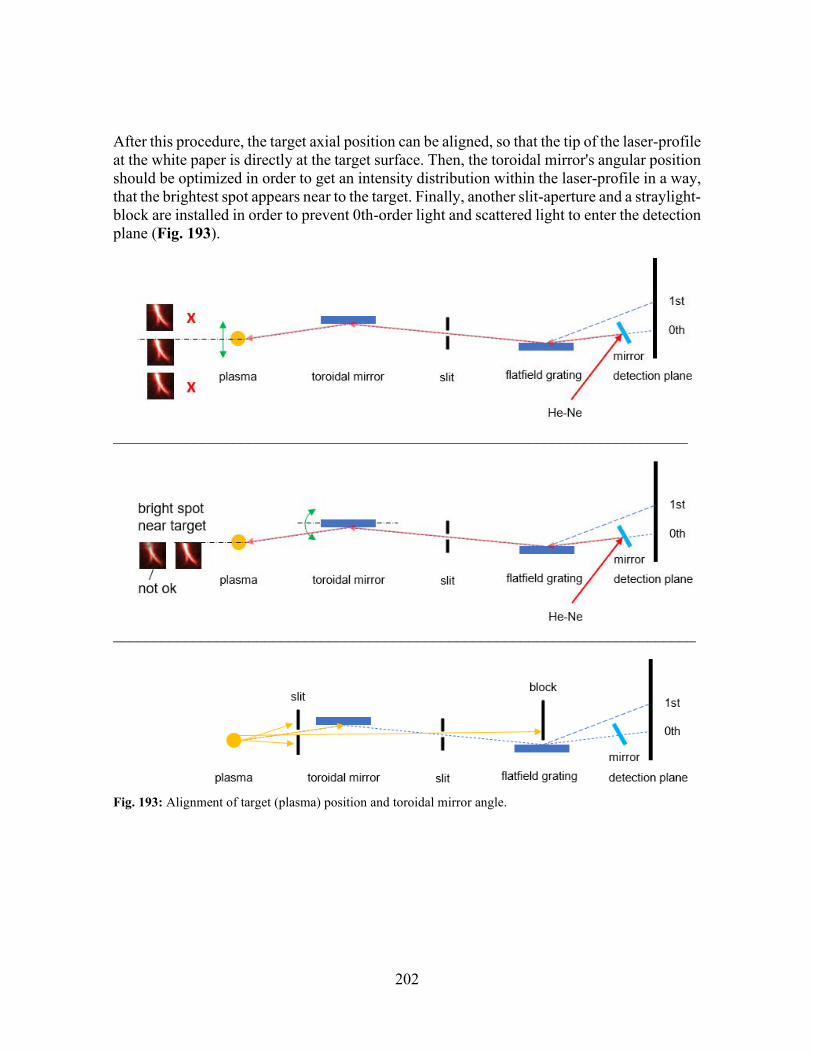
202
After this procedure, the target axial position can be aligned, so that the tip of the laser-profile at the white paper is directly at the target surface. Then, the toroidal mirror's angular position should be optimized in order to get an intensity distribution within the laser-profile in a way, that the brightest spot appears near to the target. Finally, another slit-aperture and a straylight-block are installed in order to prevent 0th-order light and scattered light to enter the detection plane (Fig. 193).
________________________________________________________________________
_________________________________________________________________________
Fig. 193: Alignment of target (plasma) position and toroidal mirror angle.
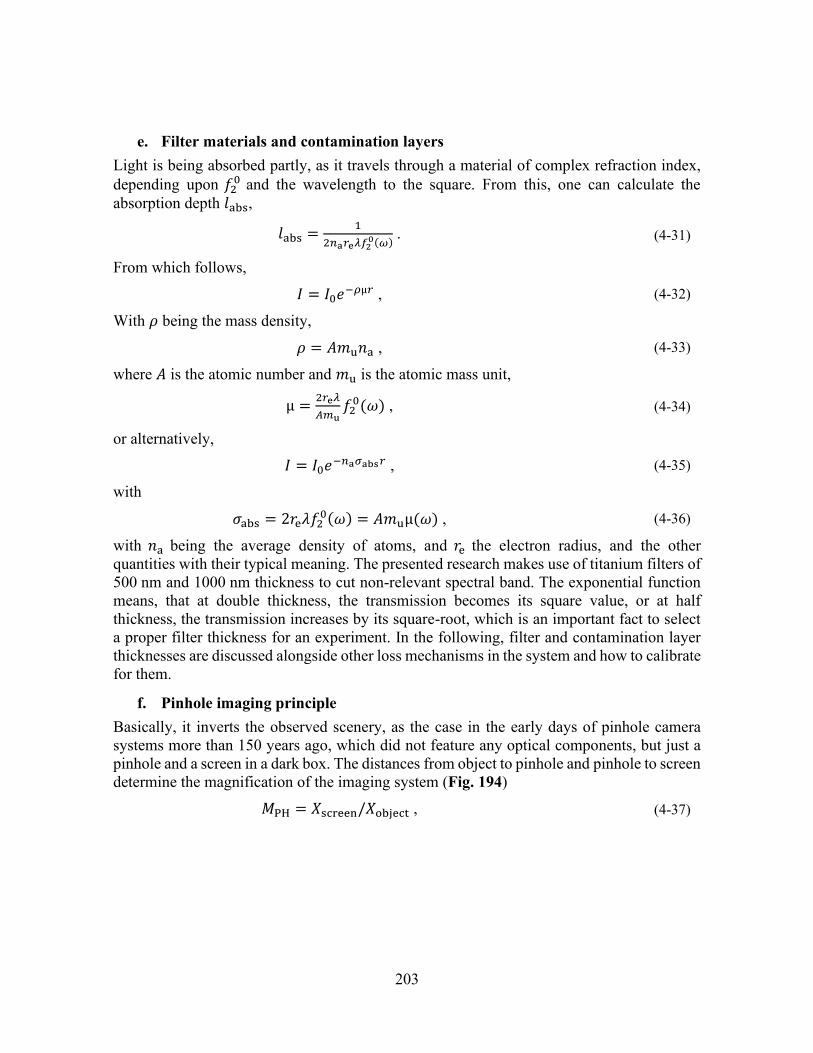
203
e. Filter materials and contamination layers Light is being absorbed partly, as it travels through a material of complex refraction index, depending upon 𝑓2
0 and the wavelength to the square. From this, one can calculate the absorption depth 𝑙abs,
𝑙abs =1
2𝑛a𝑟e𝜆𝑓20(𝜔)
. (4-31)
From which follows,
𝐼 = 𝐼0𝑒−𝜌µ𝑟 , (4-32)
With 𝜌 being the mass density,
𝜌 = 𝐴𝑚u𝑛a , (4-33)
where 𝐴 is the atomic number and 𝑚u is the atomic mass unit,
µ =2𝑟e𝜆
𝐴𝑚u𝑓2
0(𝜔) , (4-34)
or alternatively,
𝐼 = 𝐼0𝑒−𝑛a𝜎abs𝑟 , (4-35)
with
𝜎abs = 2𝑟e𝜆𝑓20(𝜔) = 𝐴𝑚uµ(𝜔) , (4-36)
with 𝑛a being the average density of atoms, and 𝑟e the electron radius, and the other quantities with their typical meaning. The presented research makes use of titanium filters of 500 nm and 1000 nm thickness to cut non-relevant spectral band. The exponential function means, that at double thickness, the transmission becomes its square value, or at half thickness, the transmission increases by its square-root, which is an important fact to select a proper filter thickness for an experiment. In the following, filter and contamination layer thicknesses are discussed alongside other loss mechanisms in the system and how to calibrate for them.
f. Pinhole imaging principle Basically, it inverts the observed scenery, as the case in the early days of pinhole camera systems more than 150 years ago, which did not feature any optical components, but just a pinhole and a screen in a dark box. The distances from object to pinhole and pinhole to screen determine the magnification of the imaging system (Fig. 194)
𝑀PH = 𝑋screen/𝑋object , (4-37)
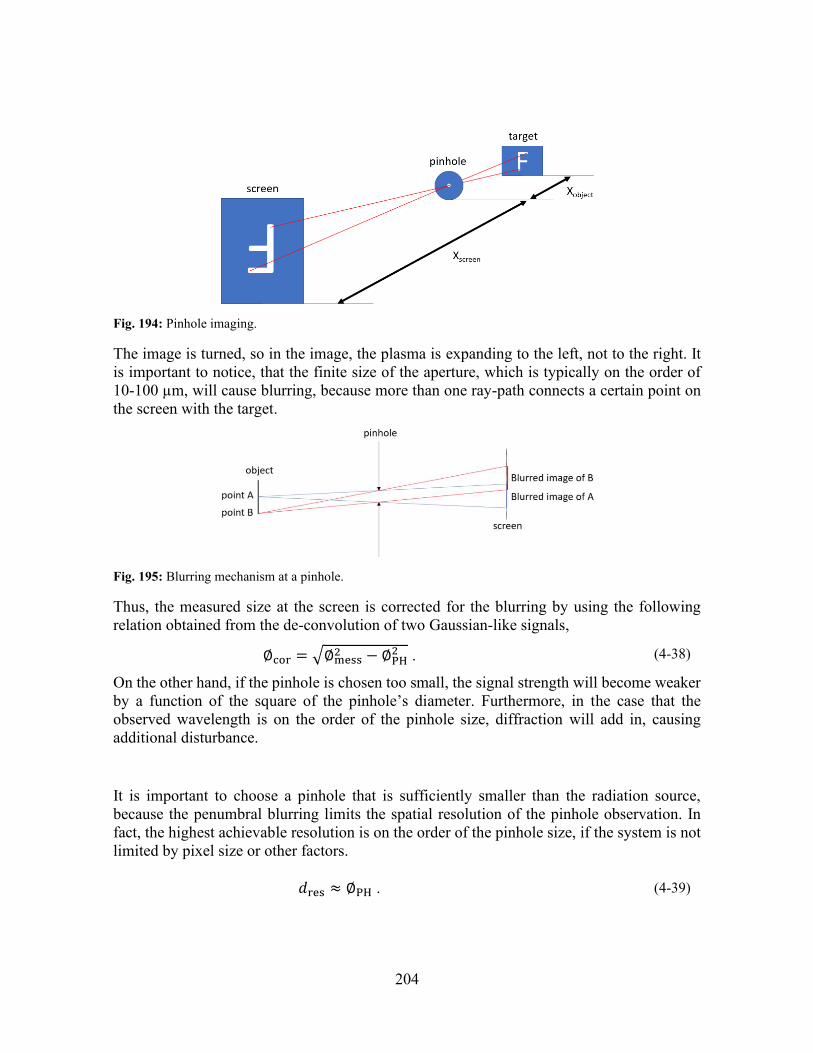
204
Fig. 194: Pinhole imaging.
The image is turned, so in the image, the plasma is expanding to the left, not to the right. It is important to notice, that the finite size of the aperture, which is typically on the order of 10-100 µm, will cause blurring, because more than one ray-path connects a certain point on the screen with the target.
Fig. 195: Blurring mechanism at a pinhole.
Thus, the measured size at the screen is corrected for the blurring by using the following relation obtained from the de-convolution of two Gaussian-like signals,
∅cor = √∅mess2 − ∅PH
2 . (4-38)
On the other hand, if the pinhole is chosen too small, the signal strength will become weaker by a function of the square of the pinhole’s diameter. Furthermore, in the case that the observed wavelength is on the order of the pinhole size, diffraction will add in, causing additional disturbance.
It is important to choose a pinhole that is sufficiently smaller than the radiation source, because the penumbral blurring limits the spatial resolution of the pinhole observation. In fact, the highest achievable resolution is on the order of the pinhole size, if the system is not limited by pixel size or other factors.
𝑑res ≈ ∅PH . (4-39)
205
5 SUMMARY
Soft X-ray microscopes (SXRM) operating in the Water-window (WW) spectral region (wavelength: ~2.3-4.4 nm) allow for good imaging contrast between carbon and water – the main constituents of living organisms. To increase the spatial resolution of SXRMs, a bright source of WW X-rays is required. A candidate light source is the pulsed laser-produced plasma (LPP). However, conversion efficiency from laser light into WW X-rays is still limited (~1%), so that the widespread use of this technology is inhibited. Recently, a novel method for enhancement of X-ray yield was discovered, where a laser-produced gold plasma was created with a 100-J laser under low-pressure nitrogen atmosphere.
Therefore, the presented research is conducted to investigate, whether this enhancement is reproducible by using a commercial Joule-class LPP, evaluate the X-ray yield and find the physical reason for such enhancement. In the second part, the diagnostic apparatus has been improved and encompassing plasma characterization under vacuum condition was carried out. A reliable radiation hydrodynamics simulation code for Au plasma could be developed to allow for more detailed investigation of plasma parameters. This study, ultimately, serves the purpose, to provide the scientific community with a bright WW X-ray source for use in SXRM.
The enhancement of soft X-ray yield obtained from gold LPP under N2-atmosphere has been confirmed by utilizing a tabletop-sized Joule-class laser, and the enhancement was evaluated to be 3.6 times higher than in vacuum when using 410-Pa N2 atmosphere and considering the wavelength 3.11 nm. Other gas species (O2, Ne, He, Ar) were also tested, however, an increase in the WW X-ray yield was not observed. By these results, it can be inferred that the physical reason for the X-ray enhancement could be found in the atomic structure of nitrogen.
In order to clarify the enhancement mechanism, the radiation hydrodynamics simulation was carried out to investigate more plasma parameters. In addition, the flexible atomic code was employed to retrieve the spectra of various ionic species. Considering the simulation results and experimental data, the underlaying physical mechanism responsible for the WW X-ray increase was elucidated:
1. First, broadband plasma X-rays (energies above ~410 eV) ionize the K-shell electrons of nitrogen with a high cross section (1 Mbarn).
2. Next, Auger-electrons with a monochromatic kinetic energy of 360 eV are generated. 3. Subsequently, the Auger electrons cause state selective collisional excitations of 4d-4f
and 4f-5g in Au21+ and Au22+ ions. 4. Finally, intense radiative decay into the WW X-ray spectral region occurs at photon
energies of 345-375 eV, leading to the strong X-ray enhancement.
206
Consequently, the energy down-conversion from X-ray photons above ionization threshold energy could play a salient role for the observed X-ray enhancement. An order-estimate of the X-ray yield underlined the theory, while the competitive mechanism, collisional ionization, was found to contribute much less. Although the X-ray absorption in the surrounding gas strictly limits the applicability of this method, improvements of the gas feeding method, e.g. employing a small injection nozzle to drive a pulsed gas jet or using a target with a cryogenic nitrogen coating, could help to bear for practical use.
To deepen the understanding of the discovered X-ray enhancement and investigate in other state of the art enhancement methods, e.g. multi-pulse irradiation schemes, the diagnostic apparatus has been upgraded and allows now for spatially resolved spectroscopy via a high-resolution grazing incidence spectrometer equipped with a toroidal mirror and a flatfield grating, as well as measurement of X-ray energy and X-ray pulse duration by two Si-photodetectors. The simulated emission size (~40 µm), X-ray duration (~6 ns) as well as laser-to-X-ray conversion efficiency (~0.5%) and average ionic charge state (Au28+), could be calculated and were found in well agreement with the experiment. Thus, the Star2D code was successfully evaluated.
By the results of this study it could be advisable to increase the electron temperature, in order to provide more high-energy X-ray photons in order to maximize the production of KLL-Auger electrons and consequently increase the WW X-ray yield. This might be easily achieved if a higher pulse energy is used (e.g. 1-2 Joule) but focused into a larger spot, to provide the optimum intensity for collisional absorption. Other options include a pulse train of 100-ps pulses irradiated into an expanding pre-plasma created by a ns-pulse. A suitable setup has already been realized in the laboratory, partly during the course of this study, where two such laser systems have been successfully synchronized spatiotemporally.
Finally, a prototype imaging/contact SXRM has to be set up. Assuming a factor-3.6 enhancement of WW-emission, the expected spatial resolution of the contact-type SXRM operating at 3 nm wavelength could be on the order of 100 nm (~2.3×10⁵ ph/µm2) if isotropic radiation and a point-like emission behavior is assumed and blurring is neglected. On the other hand, by using an imaging-type SXRM based on a ∅ =1-mm Fresnel zone plate (f=-100mm/10mm) with 10% diffraction efficiency, the achievable resolution could be 50 nm (3.9×10⁶ ph/µm2), again neglecting blurring mechanisms and imaging aberrations arising from manufacturing tolerances.
All in all, the presented research provides a solid ground on which the development of a bright X-ray source could be driven further, and where a prototype tabletop soft X-ray microscope is within reach, potentially providing a high spatial resolution required for cutting-edge research in the field of biology and medicine. This, ultimately, gives the technology a new perspective and hopefully fosters peaceful research around the globe.
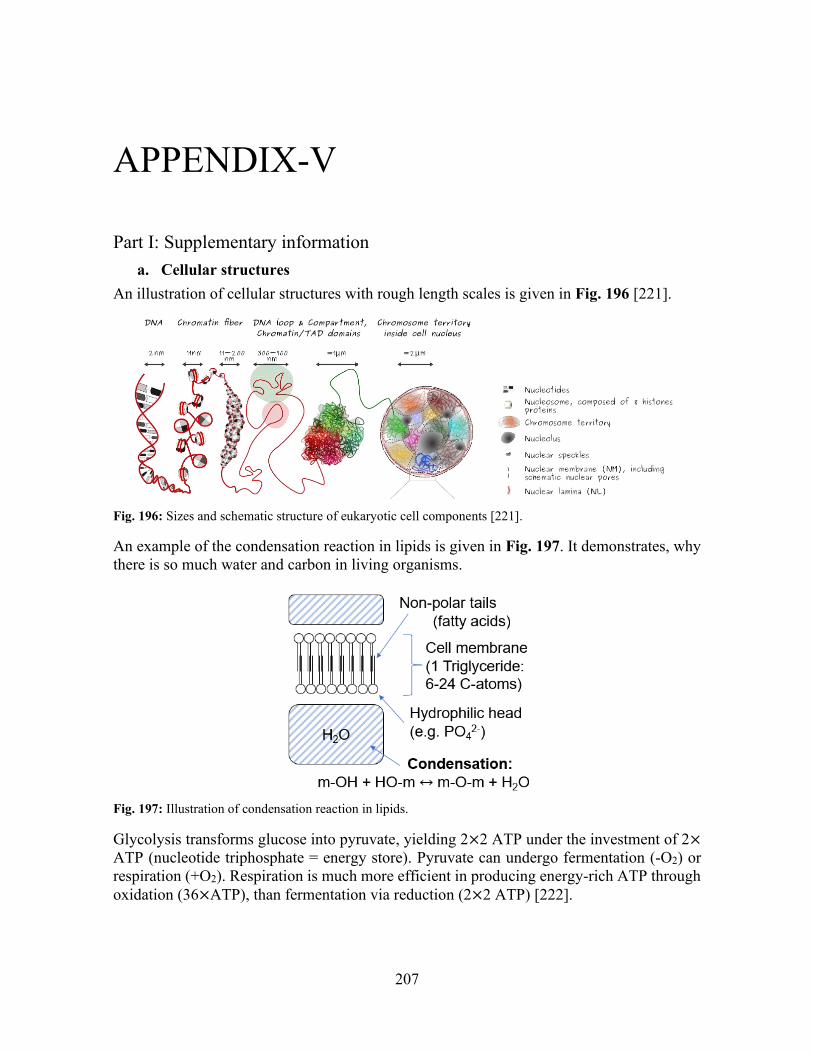
207
APPENDIX-V
Part I: Supplementary information a. Cellular structures
An illustration of cellular structures with rough length scales is given in Fig. 196 [221].
Fig. 196: Sizes and schematic structure of eukaryotic cell components [221].
An example of the condensation reaction in lipids is given in Fig. 197. It demonstrates, why there is so much water and carbon in living organisms.
Fig. 197: Illustration of condensation reaction in lipids.
Glycolysis transforms glucose into pyruvate, yielding 2×2 ATP under the investment of 2× ATP (nucleotide triphosphate = energy store). Pyruvate can undergo fermentation (-O2) or respiration (+O2). Respiration is much more efficient in producing energy-rich ATP through oxidation (36×ATP), than fermentation via reduction (2×2 ATP) [222].
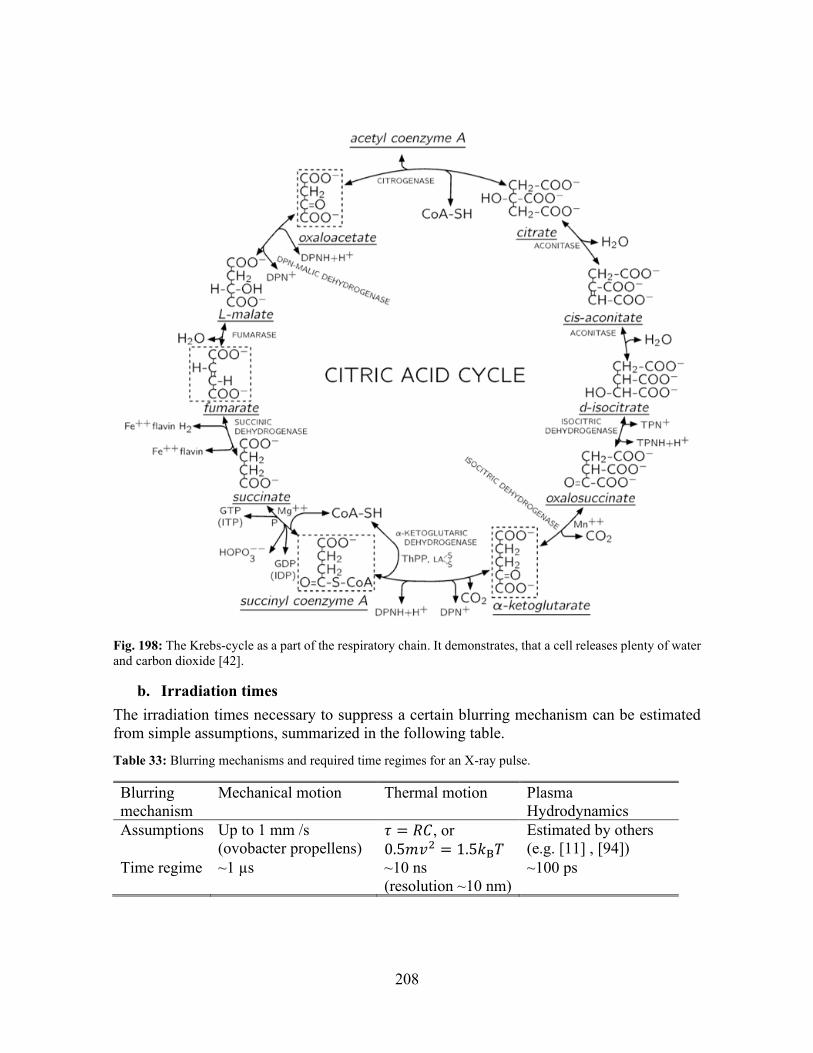
208
Fig. 198: The Krebs-cycle as a part of the respiratory chain. It demonstrates, that a cell releases plenty of water and carbon dioxide [42].
b. Irradiation times The irradiation times necessary to suppress a certain blurring mechanism can be estimated from simple assumptions, summarized in the following table.
Table 33: Blurring mechanisms and required time regimes for an X-ray pulse.
Blurring mechanism
Mechanical motion Thermal motion Plasma Hydrodynamics
Assumptions Up to 1 mm /s (ovobacter propellens)
𝜏 = 𝑅𝐶, or 0.5𝑚𝑣2 = 1.5𝑘B𝑇
Estimated by others (e.g. [11] , [94])
Time regime ~1 µs ~10 ns (resolution ~10 nm)
~100 ps
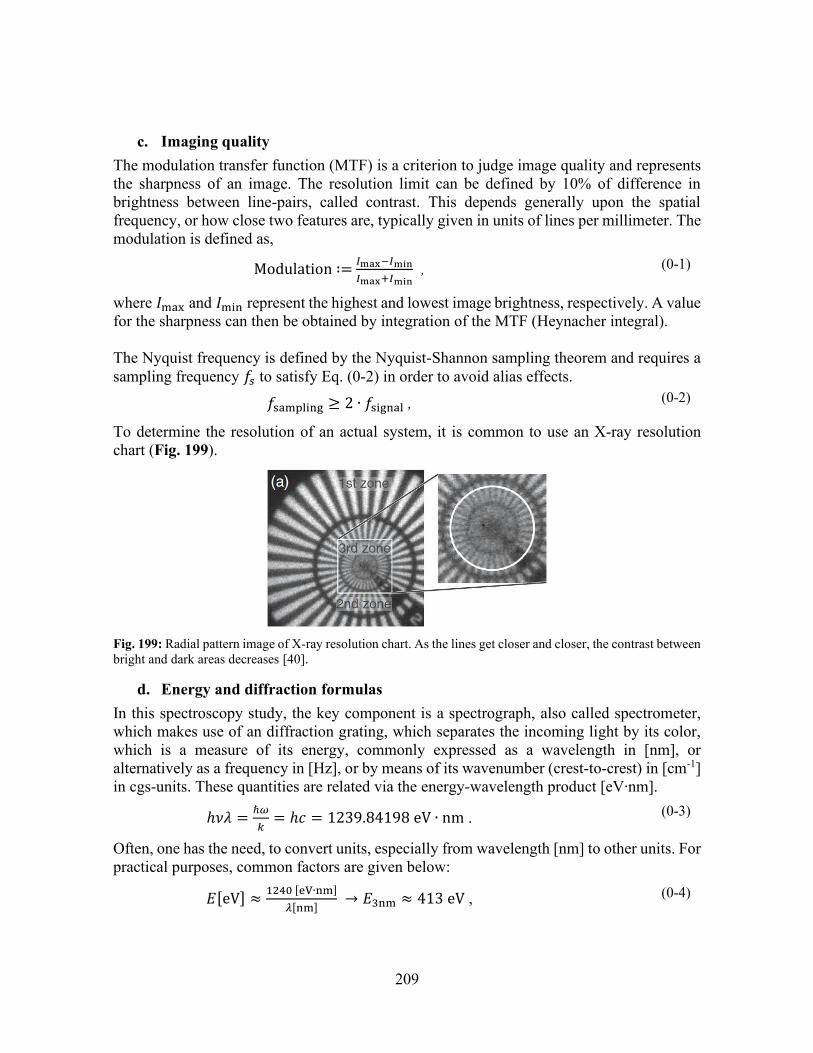
209
c. Imaging quality The modulation transfer function (MTF) is a criterion to judge image quality and represents the sharpness of an image. The resolution limit can be defined by 10% of difference in brightness between line-pairs, called contrast. This depends generally upon the spatial frequency, or how close two features are, typically given in units of lines per millimeter. The modulation is defined as,
Modulation ∶=𝐼max−𝐼min
𝐼max+𝐼min , (0-1)
where 𝐼max and 𝐼min represent the highest and lowest image brightness, respectively. A value for the sharpness can then be obtained by integration of the MTF (Heynacher integral). The Nyquist frequency is defined by the Nyquist-Shannon sampling theorem and requires a sampling frequency 𝑓𝑠 to satisfy Eq. (0-2) in order to avoid alias effects.
𝑓sampling ≥ 2 ∙ 𝑓signal , (0-2)
To determine the resolution of an actual system, it is common to use an X-ray resolution chart (Fig. 199).
Fig. 199: Radial pattern image of X-ray resolution chart. As the lines get closer and closer, the contrast between bright and dark areas decreases [40].
d. Energy and diffraction formulas In this spectroscopy study, the key component is a spectrograph, also called spectrometer, which makes use of an diffraction grating, which separates the incoming light by its color, which is a measure of its energy, commonly expressed as a wavelength in [nm], or alternatively as a frequency in [Hz], or by means of its wavenumber (crest-to-crest) in [cm-1] in cgs-units. These quantities are related via the energy-wavelength product [eV∙nm].
ℎ𝜈𝜆 =ℏ𝜔
𝑘= ℎ𝑐 = 1239.84198 eV ∙ nm . (0-3)
Often, one has the need, to convert units, especially from wavelength [nm] to other units. For practical purposes, common factors are given below:
𝐸[eV] ≈1240 [eV∙nm]
𝜆[nm] → 𝐸3nm ≈ 413 eV , (0-4)
210
𝜈[Hz] =𝐸[eV]
ℎ[eV∙s]≈
2.998
𝜆[nm]× 1017 → 𝜈3nm ≈ 1017Hz , (0-5)
𝑘 [1
cm] =
1
𝜆[nm]∙ 107 ≈
𝜈[Hz]
2.998 ∙ 10−10 → 𝑘3nm ≈ 3.33 × 106 cm−1 . (0-6)
Furthermore, energy can be expressed in a variety of units, such as [J], [N∙m], [kg∙m2/s2], [W∙s], [V∙A∙s], but is in atomic physics commonly given in [eV] or in astrophysical contexts in [erg]. These units are connected in the following way:
1[J] = 107[erg] = 6,242 ∙ 1018[eV] , (0-7)
1[eV] = 1,6022 ∙ 10−12[erg] = 1,6022 ∙ 10−19[J], (0-8)
with ℎ=4.135667696×10⁻¹⁵ eV∙s and 𝑐=299 792 458 m/s. Since wavelength and frequency are connected inversely via light speed 𝑐, the following relation between their intervals is given by:
∆𝜈 = −𝑐
𝜆2 ∆𝜆 .
In this work, the spectral information in diagrams will be expressed by wavelength in [nm]. For observation of soft X-ray spectra, a diffraction grating is typically used under a shallow angle of incidence, and the general grating equation, which applies to reflection gratings and is given by:
𝑑(sin 𝛼 + sin 𝛽) = 𝑚𝜆 , (0-9)
with the line spacing 𝑑, or alternatively rearranged:
𝛽 = arcsin (𝑚𝜆[nm] ∙ 10−6 ∙ 𝑁 [grvs
mm] − sin 𝛼) , (0-10)
whereas 𝛼 and 𝛽 represent the angle of incidence and the diffraction angle for a given diffraction order 𝑚, both with respect to the target normal, respectively. The grating’s groove density 𝑁 is often given in grvs/mm. Note that for a transmission grating, the grating equation is similar up to the plus-sign, which then turns into a minus-sign. It does not affect the calculation of the magnitude of 𝛽, so that just the sign will be inversed.
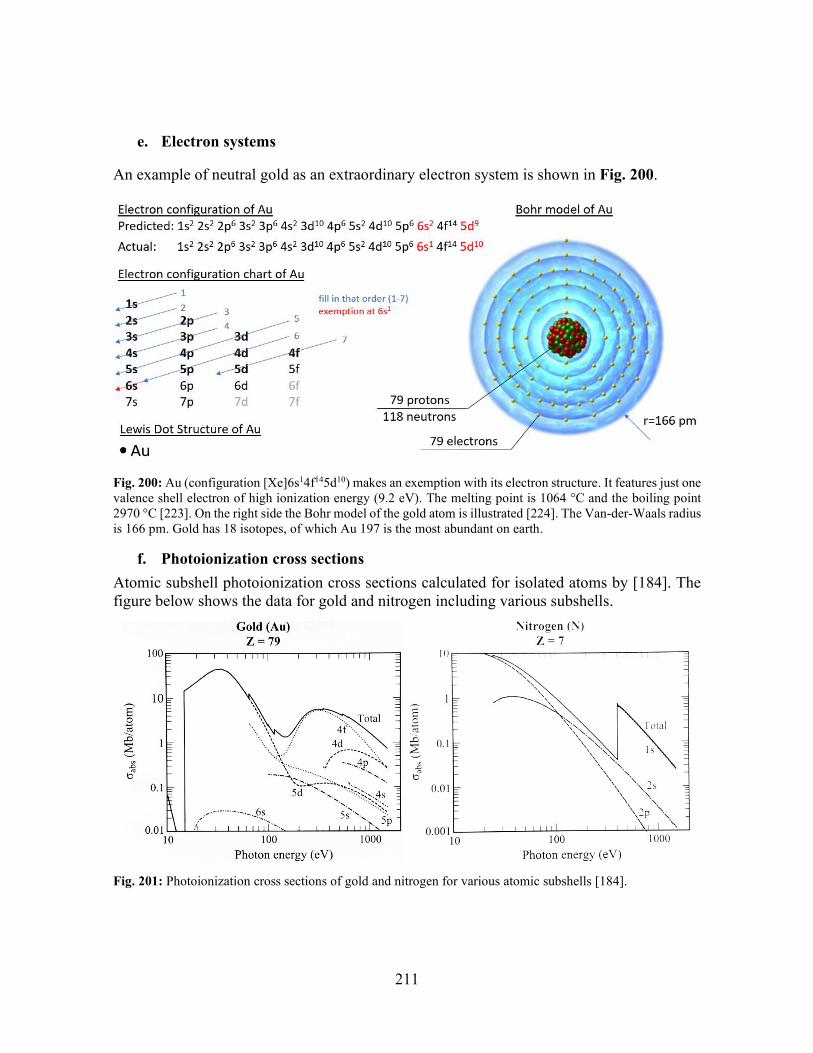
211
e. Electron systems
An example of neutral gold as an extraordinary electron system is shown in Fig. 200.
Fig. 200: Au (configuration [Xe]6s14f145d10) makes an exemption with its electron structure. It features just one valence shell electron of high ionization energy (9.2 eV). The melting point is 1064 °C and the boiling point 2970 °C [223]. On the right side the Bohr model of the gold atom is illustrated [224]. The Van-der-Waals radius is 166 pm. Gold has 18 isotopes, of which Au 197 is the most abundant on earth.
f. Photoionization cross sections Atomic subshell photoionization cross sections calculated for isolated atoms by [184]. The figure below shows the data for gold and nitrogen including various subshells.
Fig. 201: Photoionization cross sections of gold and nitrogen for various atomic subshells [184].
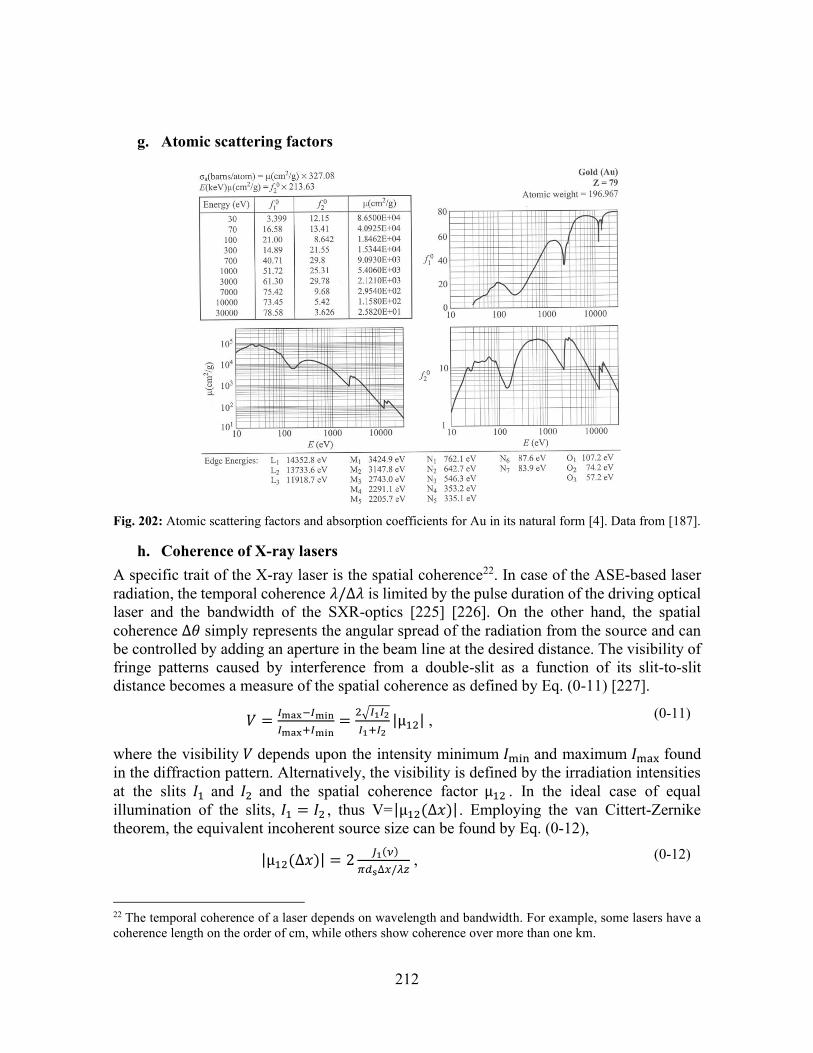
212
g. Atomic scattering factors
Fig. 202: Atomic scattering factors and absorption coefficients for Au in its natural form [4]. Data from [187].
h. Coherence of X-ray lasers A specific trait of the X-ray laser is the spatial coherence22. In case of the ASE-based laser radiation, the temporal coherence 𝜆/∆𝜆 is limited by the pulse duration of the driving optical laser and the bandwidth of the SXR-optics [225] [226]. On the other hand, the spatial coherence ∆𝜃 simply represents the angular spread of the radiation from the source and can be controlled by adding an aperture in the beam line at the desired distance. The visibility of fringe patterns caused by interference from a double-slit as a function of its slit-to-slit distance becomes a measure of the spatial coherence as defined by Eq. (0-11) [227].
𝑉 =𝐼max−𝐼min
𝐼max+𝐼min=
2√𝐼1𝐼2
𝐼1+𝐼2|µ12| , (0-11)
where the visibility 𝑉 depends upon the intensity minimum 𝐼min and maximum 𝐼max found in the diffraction pattern. Alternatively, the visibility is defined by the irradiation intensities at the slits 𝐼1 and 𝐼2 and the spatial coherence factor µ12 . In the ideal case of equal illumination of the slits, 𝐼1 = 𝐼2 , thus V=|µ12(∆𝑥)| . Employing the van Cittert-Zernike theorem, the equivalent incoherent source size can be found by Eq. (0-12),
|µ12(∆𝑥)| = 2 𝐽1(𝜈)
𝜋𝑑s∆𝑥/𝜆𝑧 , (0-12)
22 The temporal coherence of a laser depends on wavelength and bandwidth. For example, some lasers have a coherence length on the order of cm, while others show coherence over more than one km.
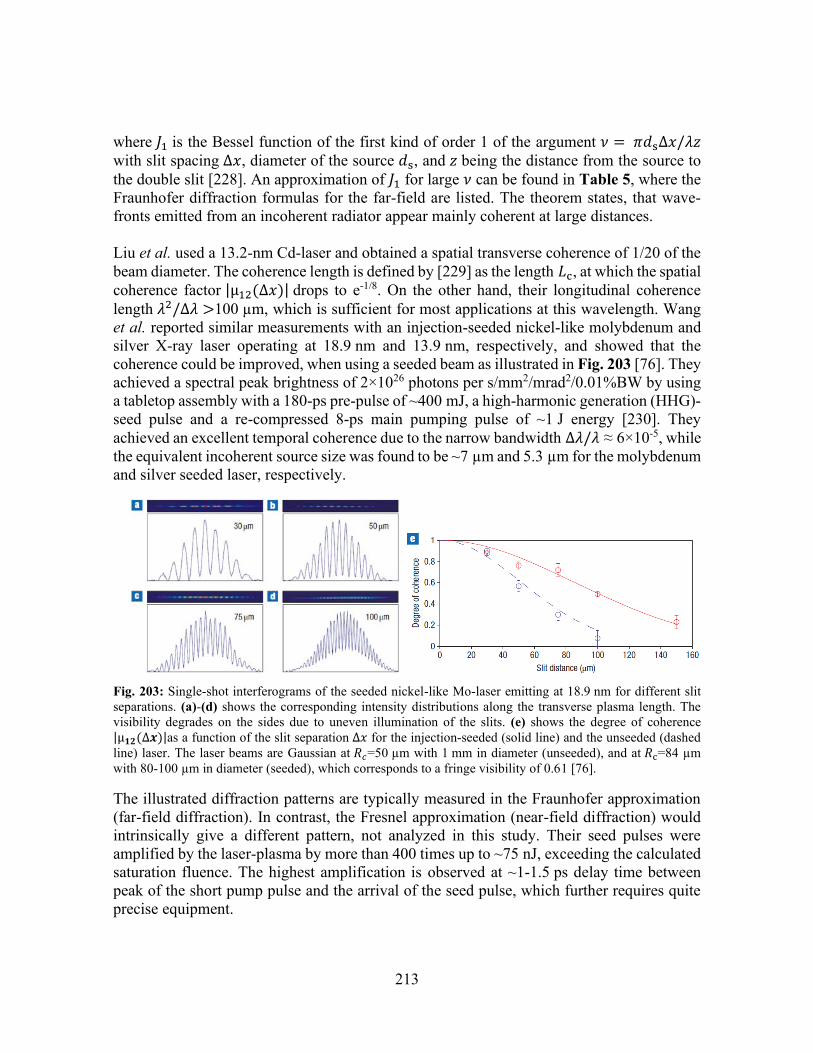
213
where 𝐽1 is the Bessel function of the first kind of order 1 of the argument 𝜈 = 𝜋𝑑s∆𝑥/𝜆𝑧 with slit spacing ∆𝑥, diameter of the source 𝑑s, and 𝑧 being the distance from the source to the double slit [228]. An approximation of 𝐽1 for large 𝜈 can be found in Table 5, where the Fraunhofer diffraction formulas for the far-field are listed. The theorem states, that wave-fronts emitted from an incoherent radiator appear mainly coherent at large distances. Liu et al. used a 13.2-nm Cd-laser and obtained a spatial transverse coherence of 1/20 of the beam diameter. The coherence length is defined by [229] as the length 𝐿c, at which the spatial coherence factor |µ12(∆𝑥)| drops to e-1/8. On the other hand, their longitudinal coherence length 𝜆2/∆𝜆 >100 µm, which is sufficient for most applications at this wavelength. Wang et al. reported similar measurements with an injection-seeded nickel-like molybdenum and silver X-ray laser operating at 18.9 nm and 13.9 nm, respectively, and showed that the coherence could be improved, when using a seeded beam as illustrated in Fig. 203 [76]. They achieved a spectral peak brightness of 2×1026 photons per s/mm2/mrad2/0.01%BW by using a tabletop assembly with a 180-ps pre-pulse of ~400 mJ, a high-harmonic generation (HHG)-seed pulse and a re-compressed 8-ps main pumping pulse of ~1 J energy [230]. They achieved an excellent temporal coherence due to the narrow bandwidth ∆𝜆/𝜆 ≈ 6×10⁻⁵, while the equivalent incoherent source size was found to be ~7 µm and 5.3 µm for the molybdenum and silver seeded laser, respectively.
Fig. 203: Single-shot interferograms of the seeded nickel-like Mo-laser emitting at 18.9 nm for different slit separations. (a)-(d) shows the corresponding intensity distributions along the transverse plasma length. The visibility degrades on the sides due to uneven illumination of the slits. (e) shows the degree of coherence |µ𝟏𝟐(∆𝒙)|as a function of the slit separation ∆𝑥 for the injection-seeded (solid line) and the unseeded (dashed line) laser. The laser beams are Gaussian at 𝑅𝑐=50 µm with 1 mm in diameter (unseeded), and at 𝑅c=84 µm with 80-100 µm in diameter (seeded), which corresponds to a fringe visibility of 0.61 [76].
The illustrated diffraction patterns are typically measured in the Fraunhofer approximation (far-field diffraction). In contrast, the Fresnel approximation (near-field diffraction) would intrinsically give a different pattern, not analyzed in this study. Their seed pulses were amplified by the laser-plasma by more than 400 times up to ~75 nJ, exceeding the calculated saturation fluence. The highest amplification is observed at ~1-1.5 ps delay time between peak of the short pump pulse and the arrival of the seed pulse, which further requires quite precise equipment.
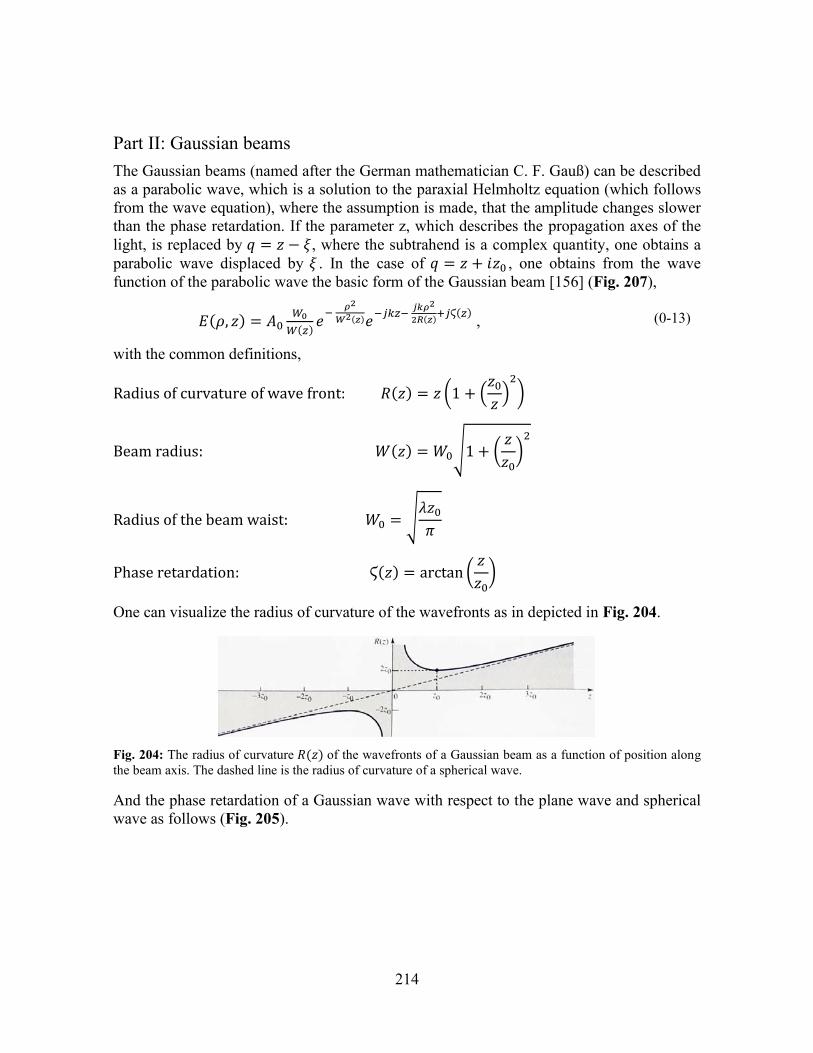
214
Part II: Gaussian beams The Gaussian beams (named after the German mathematician C. F. Gauß) can be described as a parabolic wave, which is a solution to the paraxial Helmholtz equation (which follows from the wave equation), where the assumption is made, that the amplitude changes slower than the phase retardation. If the parameter z, which describes the propagation axes of the light, is replaced by 𝑞 = 𝑧 − 𝜉, where the subtrahend is a complex quantity, one obtains a parabolic wave displaced by 𝜉 . In the case of 𝑞 = 𝑧 + 𝑖𝑧0 , one obtains from the wave function of the parabolic wave the basic form of the Gaussian beam [156] (Fig. 207),
𝐸(𝜌, 𝑧) = 𝐴0𝑊0
𝑊(𝑧)𝑒
− 𝜌2
𝑊2(𝑧)𝑒−𝑗𝑘𝑧−
𝑗𝑘𝜌2
2𝑅(𝑧)+𝑗Ϛ(𝑧) , (0-13)
with the common definitions,
Radius of curvature of wave front: 𝑅(𝑧) = 𝑧 (1 + (𝑧0
𝑧)
2
)
Beam radius: 𝑊(𝑧) = 𝑊0√1 + (𝑧
𝑧0)
2
Radius of the beam waist: 𝑊0 = √𝜆𝑧0
𝜋
Phase retardation: Ϛ(𝑧) = arctan (𝑧
𝑧0)
One can visualize the radius of curvature of the wavefronts as in depicted in Fig. 204.
Fig. 204: The radius of curvature 𝑅(𝑧) of the wavefronts of a Gaussian beam as a function of position along the beam axis. The dashed line is the radius of curvature of a spherical wave.
And the phase retardation of a Gaussian wave with respect to the plane wave and spherical wave as follows (Fig. 205).
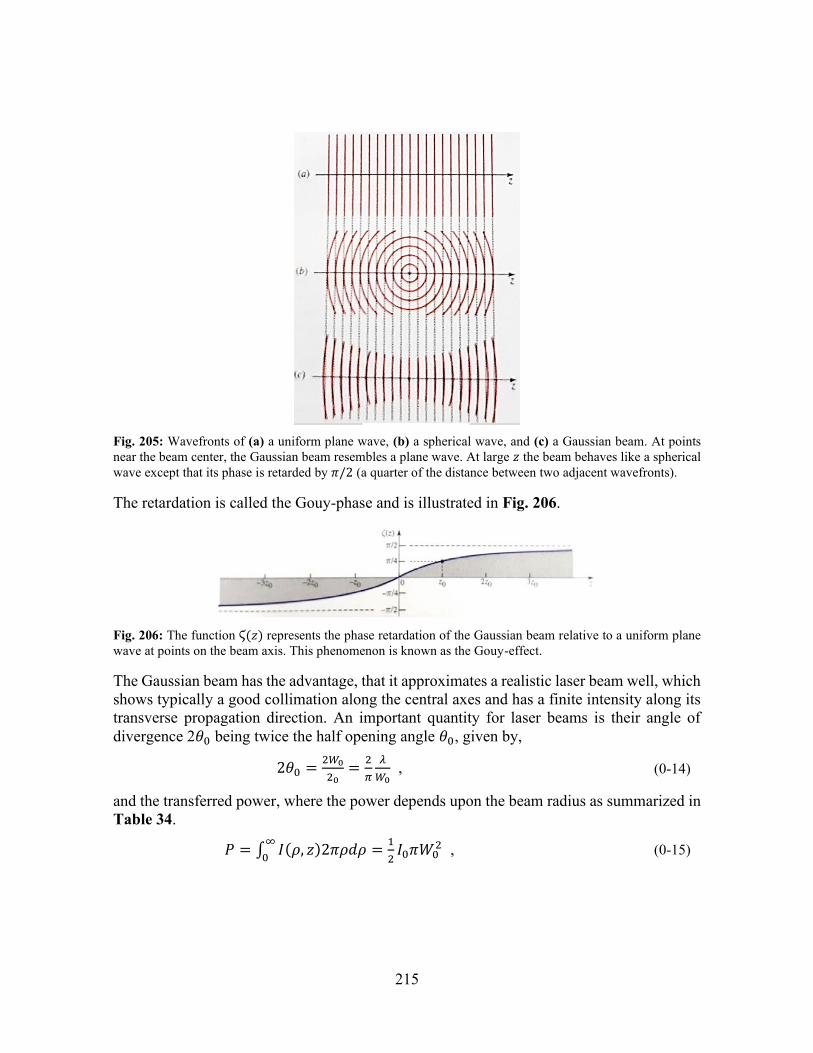
215
Fig. 205: Wavefronts of (a) a uniform plane wave, (b) a spherical wave, and (c) a Gaussian beam. At points near the beam center, the Gaussian beam resembles a plane wave. At large 𝑧 the beam behaves like a spherical wave except that its phase is retarded by 𝜋/2 (a quarter of the distance between two adjacent wavefronts).
The retardation is called the Gouy-phase and is illustrated in Fig. 206.
Fig. 206: The function Ϛ(𝑧) represents the phase retardation of the Gaussian beam relative to a uniform plane wave at points on the beam axis. This phenomenon is known as the Gouy-effect.
The Gaussian beam has the advantage, that it approximates a realistic laser beam well, which shows typically a good collimation along the central axes and has a finite intensity along its transverse propagation direction. An important quantity for laser beams is their angle of divergence 2𝜃0 being twice the half opening angle 𝜃0, given by,
2𝜃0 =2𝑊0
20=
2
𝜋
𝜆
𝑊0 , (0-14)
and the transferred power, where the power depends upon the beam radius as summarized in Table 34.
𝑃 = ∫ 𝐼(𝜌, 𝑧)2𝜋𝜌𝑑𝜌 =1
2𝐼0𝜋𝑊0
2∞
0 , (0-15)
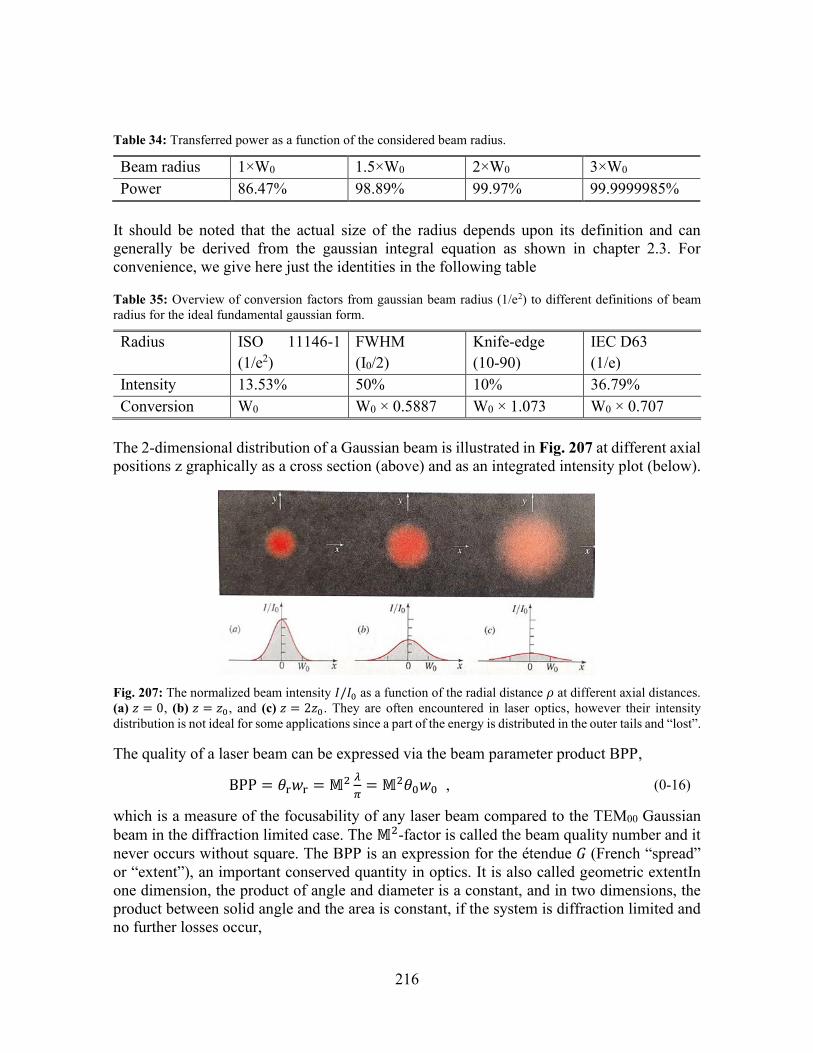
216
Table 34: Transferred power as a function of the considered beam radius.
Beam radius 1×W0 1.5×W0 2×W0 3×W0 Power 86.47% 98.89% 99.97% 99.9999985%
It should be noted that the actual size of the radius depends upon its definition and can generally be derived from the gaussian integral equation as shown in chapter 2.3. For convenience, we give here just the identities in the following table
Table 35: Overview of conversion factors from gaussian beam radius (1/e2) to different definitions of beam radius for the ideal fundamental gaussian form.
Radius ISO 11146-1 (1/e2)
FWHM (I0/2)
Knife-edge (10-90)
IEC D63 (1/e)
Intensity 13.53% 50% 10% 36.79% Conversion W0 W0 × 0.5887 W0 × 1.073 W0 × 0.707
The 2-dimensional distribution of a Gaussian beam is illustrated in Fig. 207 at different axial positions z graphically as a cross section (above) and as an integrated intensity plot (below).
Fig. 207: The normalized beam intensity 𝐼/𝐼0 as a function of the radial distance 𝜌 at different axial distances. (a) 𝑧 = 0, (b) 𝑧 = 𝑧0 , and (c) 𝑧 = 2𝑧0 . They are often encountered in laser optics, however their intensity distribution is not ideal for some applications since a part of the energy is distributed in the outer tails and “lost”.
The quality of a laser beam can be expressed via the beam parameter product BPP,
BPP = 𝜃r𝑤r = 𝕄2 𝜆
𝜋= 𝕄2𝜃0𝑤0 , (0-16)
which is a measure of the focusability of any laser beam compared to the TEM00 Gaussian beam in the diffraction limited case. The 𝕄2-factor is called the beam quality number and it never occurs without square. The BPP is an expression for the étendue 𝐺 (French “spread” or “extent”), an important conserved quantity in optics. It is also called geometric extentIn one dimension, the product of angle and diameter is a constant, and in two dimensions, the product between solid angle and the area is constant, if the system is diffraction limited and no further losses occur,
217
𝐺[mm ∙ rad] = 𝜃 ∙ ∅ = const. (1D − case) , (0-17)
𝐺[mm2 ∙ sterad] = 𝛺 ∙ 𝐴 = const. (2D − case) , (0-18)
or more general,
𝑑𝐺 = 𝑛2𝑑𝐴 ∙ cos 𝛼 ∙ 𝑑𝛺 . (0-19)
It means, that a smaller spot size is always accompanied by a larger angular spread and vice versa and this cannot be avoided by the nature of the Etendue. This means, that two sources of twice the area and power of one source at the same distance cannot increase the optical radiance (light flux (or optical power) per unit area and solid angle), because a larger emission area goes along with an increase in the solid angle under which the source is seen by an object. The Etendue of a system, even with perfect optical components, never decreases. It just describes how “spread” a bundle of light is. The better it is collimated, the easier it is to collect it and the lower its initial Etendue. On the other hand, if one observes the sun through a telescope, the radiance (or in photometry called luminance and corrected for the spectral sensitivity 𝑉(𝜆) of the human “norm” eye) does not change, because the larger area appears with the same brightness due to the larger light gathering ability of the telescope compared to the observation with the naked eye, and the radiance of the sun is further independent of the distance [203]. Nonetheless, it is more hazardous to illuminate a larger areal of the retina (at given intensity), because the heat-conduction in the central area of the illuminated spot will be limited and thermal damages might occur much faster. The photometric law is given by,
𝑑2𝜙𝑒 = 𝐿 ∙𝑑𝐴1∙cos 𝛼1∙𝑑𝐴2∙cos 𝛼2
𝑟2 𝛺0 , (0-20)
𝜙𝑒[𝑊] = 𝐿 ∙ 𝐴eff ∙ 𝛺 = 𝐿 ∙ 𝐺 , (0-21)
with 𝛺0 = 1𝑠𝑟 and the angles 𝛼 the of incidence and observation to or from the area normal direction. The relation between photometric (v) and radiometric (e) quantities is given below, where the function 𝑉(𝜆) is the CIE (Commission Internationale de l’Éclairage) photopic luminosity function, the photometric radiation equivalent 𝐾𝑚 = 683 lm/W, and the summation is done with a 5-nm interval ∆𝜆.
𝜙𝑣 = 𝐾m ∑ 𝜙𝑒(𝜆) ∙ 𝑉(𝜆) ∙ ∆𝜆780nm380nm . (0-22)
These are important facts for optical designs of radiation sources and laser safety considerations. In the ideal case, the Etendue of the source matches that of the optical system, through which the radiation should pass. Otherwise, the system is either overdesigned or limiting the light transmission.
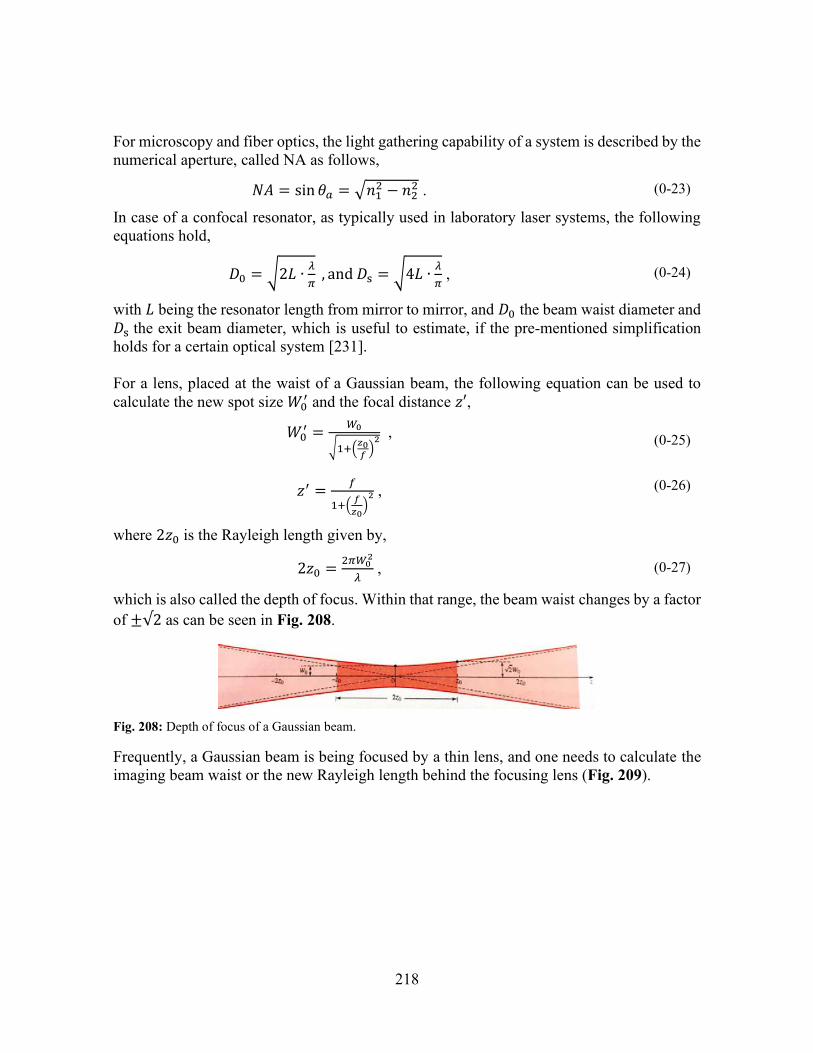
218
For microscopy and fiber optics, the light gathering capability of a system is described by the numerical aperture, called NA as follows,
𝑁𝐴 = sin 𝜃𝑎 = √𝑛12 − 𝑛2
2 . (0-23)
In case of a confocal resonator, as typically used in laboratory laser systems, the following equations hold,
𝐷0 = √2𝐿 ∙𝜆
𝜋 , and 𝐷s = √4𝐿 ∙
𝜆
𝜋 , (0-24)
with 𝐿 being the resonator length from mirror to mirror, and 𝐷0 the beam waist diameter and 𝐷s the exit beam diameter, which is useful to estimate, if the pre-mentioned simplification holds for a certain optical system [231]. For a lens, placed at the waist of a Gaussian beam, the following equation can be used to calculate the new spot size 𝑊0
′ and the focal distance 𝑧′,
𝑊0′ =
𝑊0
√1+(𝑧0𝑓
)2 , (0-25)
𝑧′ =𝑓
1+(𝑓
𝑧0)
2 , (0-26)
where 2𝑧0 is the Rayleigh length given by,
2𝑧0 =2𝜋𝑊0
2
𝜆 , (0-27)
which is also called the depth of focus. Within that range, the beam waist changes by a factor of ±√2 as can be seen in Fig. 208.
Fig. 208: Depth of focus of a Gaussian beam.
Frequently, a Gaussian beam is being focused by a thin lens, and one needs to calculate the imaging beam waist or the new Rayleigh length behind the focusing lens (Fig. 209).
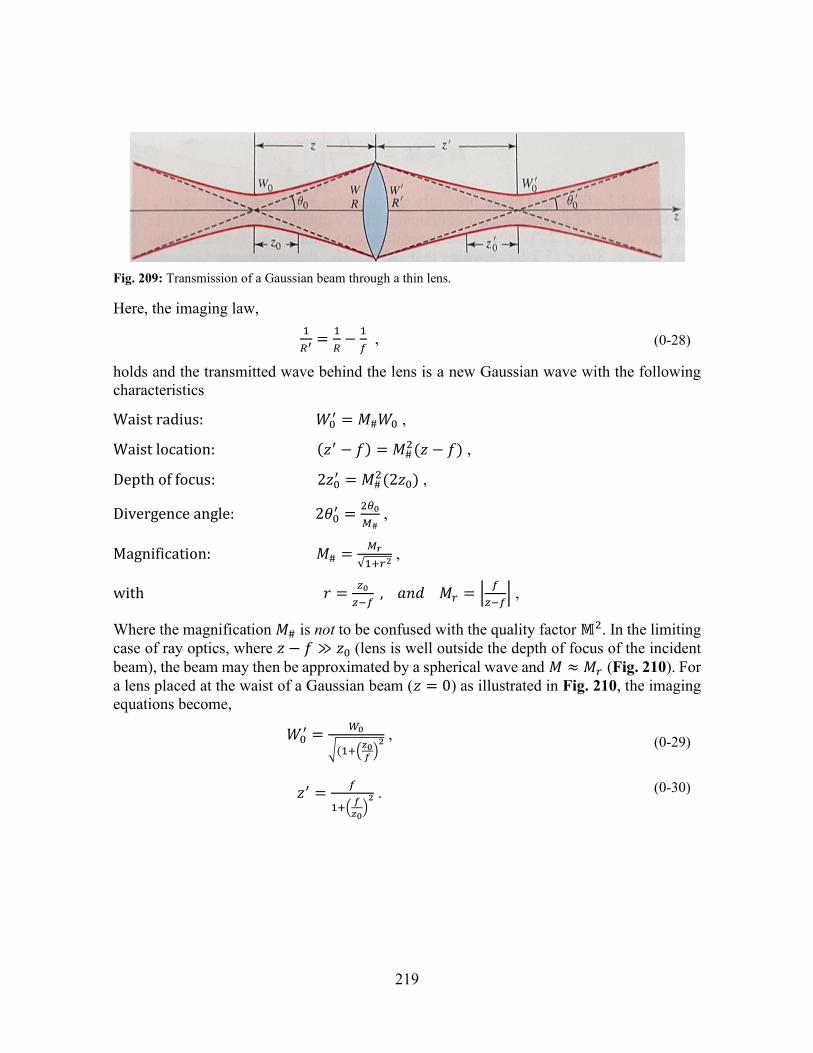
219
Fig. 209: Transmission of a Gaussian beam through a thin lens.
Here, the imaging law, 1
𝑅′ =1
𝑅−
1
𝑓 , (0-28)
holds and the transmitted wave behind the lens is a new Gaussian wave with the following characteristics
Waist radius: 𝑊0′ = 𝑀#𝑊0 ,
Waist location: (𝑧′ − 𝑓) = 𝑀#2(𝑧 − 𝑓) ,
Depth of focus: 2𝑧0′ = 𝑀#
2(2𝑧0) ,
Divergence angle: 2𝜃0′ =
2𝜃0
𝑀# ,
Magnification: 𝑀# =𝑀𝑟
√1+𝑟2 ,
with 𝑟 =𝑧0
𝑧−𝑓 , 𝑎𝑛𝑑 𝑀𝑟 = |
𝑓
𝑧−𝑓| ,
Where the magnification 𝑀# is not to be confused with the quality factor 𝕄2. In the limiting case of ray optics, where 𝑧 − 𝑓 ≫ 𝑧0 (lens is well outside the depth of focus of the incident beam), the beam may then be approximated by a spherical wave and 𝑀 ≈ 𝑀𝑟 (Fig. 210). For a lens placed at the waist of a Gaussian beam (𝑧 = 0) as illustrated in Fig. 210, the imaging equations become,
𝑊0′ =
𝑊0
√(1+(𝑧0𝑓
)2 , (0-29)
𝑧′ =𝑓
1+(𝑓
𝑧0)
2 . (0-30)
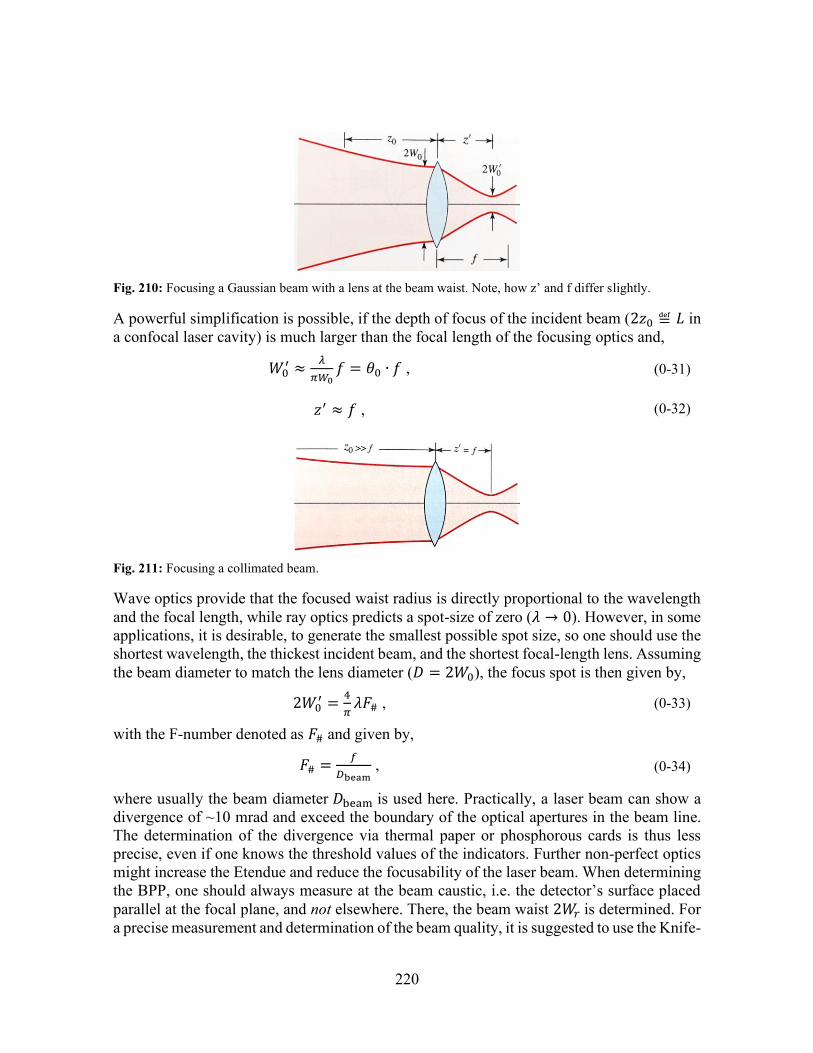
220
Fig. 210: Focusing a Gaussian beam with a lens at the beam waist. Note, how z’ and f differ slightly.
A powerful simplification is possible, if the depth of focus of the incident beam (2𝑧0 ≝ 𝐿 in a confocal laser cavity) is much larger than the focal length of the focusing optics and,
𝑊0′ ≈
𝜆
𝜋𝑊0𝑓 = 𝜃0 ∙ 𝑓 , (0-31)
𝑧′ ≈ 𝑓 , (0-32)
Fig. 211: Focusing a collimated beam.
Wave optics provide that the focused waist radius is directly proportional to the wavelength and the focal length, while ray optics predicts a spot-size of zero (𝜆 → 0). However, in some applications, it is desirable, to generate the smallest possible spot size, so one should use the shortest wavelength, the thickest incident beam, and the shortest focal-length lens. Assuming the beam diameter to match the lens diameter (𝐷 = 2𝑊0), the focus spot is then given by,
2𝑊0′ =
4
𝜋𝜆𝐹# , (0-33)
with the F-number denoted as 𝐹# and given by,
𝐹# =𝑓
𝐷beam , (0-34)
where usually the beam diameter 𝐷beam is used here. Practically, a laser beam can show a divergence of ~10 mrad and exceed the boundary of the optical apertures in the beam line. The determination of the divergence via thermal paper or phosphorous cards is thus less precise, even if one knows the threshold values of the indicators. Further non-perfect optics might increase the Etendue and reduce the focusability of the laser beam. When determining the BPP, one should always measure at the beam caustic, i.e. the detector’s surface placed parallel at the focal plane, and not elsewhere. There, the beam waist 2𝑊𝑟 is determined. For a precise measurement and determination of the beam quality, it is suggested to use the Knife-
221
edge method and measure the beam diameter at 1/e2-intensity at various positions, but at least 5 within the Rayleigh length, and 5 outside 2× the Rayleigh length (ISO 11146). One might then use a fit function, such as,
𝑊(𝑧) = 𝑊0√1 + (𝑧 − 𝑆)2 𝜃0′2
𝑊0′2 , (0-35)
with 𝑆 being a correction for the position of the knife-edge on the axes along which it is moved, to obtain the parameters 𝜃0
′ and 𝑊0′. Alternatively, one can obtain the divergence via,
𝜃0′ = √
𝜆
𝜋𝑧𝑚 . (0-36)
where 𝑧𝑚 is the measured Rayleigh range. In either case, one should use a high-quality focal lens and a CCD-camera with a pixel-size that is ~3-6× smaller than the beam waist (FWHM). Especially the usage of beam expanders – of which there are two common types, namely the Keplerian type (two convex lenses) and the Gallileian type (a concave lens and a convex lens) – influence the beam size, but the focusability of the resulting beam cannot be increased. However, beam expanders are frequently used to allow for fiber coupling or to reduce the risk of reaching the damage threshold of some optical components. The Gallileian type beam expander creates no internal focus and is thus suitable for shot pulse laser applications, because breakdown is avoided.
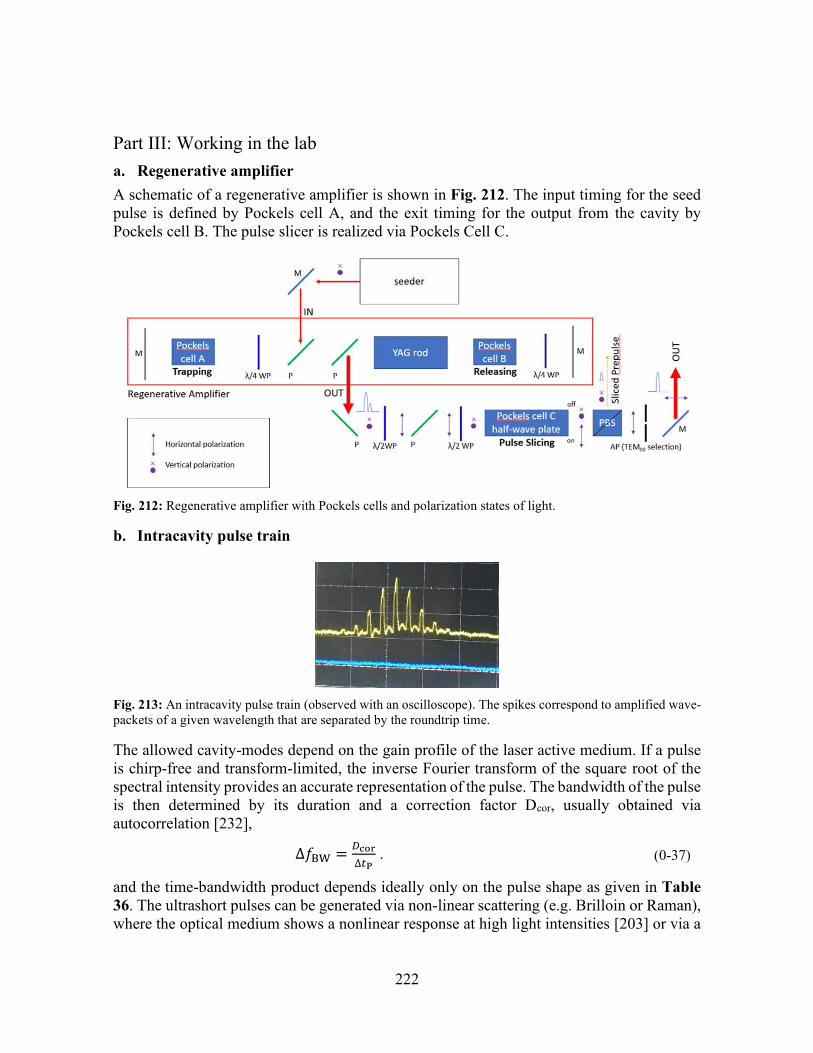
222
Part III: Working in the lab a. Regenerative amplifier A schematic of a regenerative amplifier is shown in Fig. 212. The input timing for the seed pulse is defined by Pockels cell A, and the exit timing for the output from the cavity by Pockels cell B. The pulse slicer is realized via Pockels Cell C.
Fig. 212: Regenerative amplifier with Pockels cells and polarization states of light.
b. Intracavity pulse train
Fig. 213: An intracavity pulse train (observed with an oscilloscope). The spikes correspond to amplified wave-packets of a given wavelength that are separated by the roundtrip time.
The allowed cavity-modes depend on the gain profile of the laser active medium. If a pulse is chirp-free and transform-limited, the inverse Fourier transform of the square root of the spectral intensity provides an accurate representation of the pulse. The bandwidth of the pulse is then determined by its duration and a correction factor Dcor, usually obtained via autocorrelation [232],
∆𝑓BW =𝐷cor
∆𝑡P . (0-37)
and the time-bandwidth product depends ideally only on the pulse shape as given in Table 36. The ultrashort pulses can be generated via non-linear scattering (e.g. Brilloin or Raman), where the optical medium shows a nonlinear response at high light intensities [203] or via a
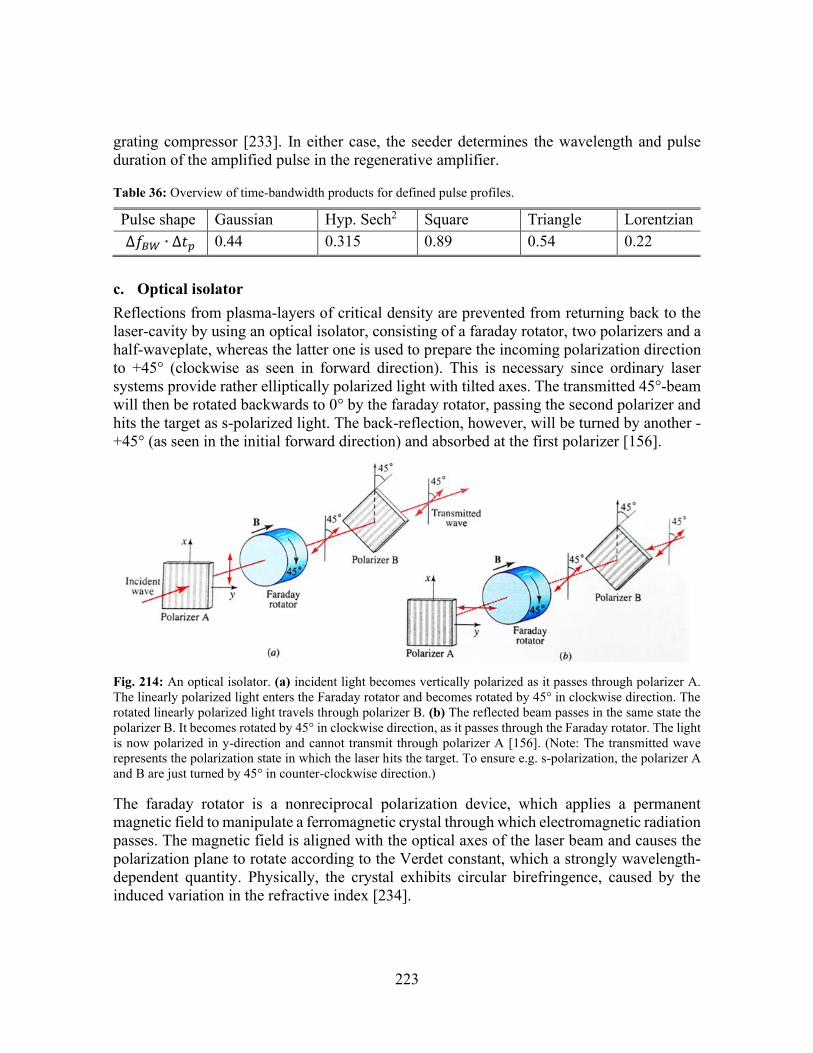
223
grating compressor [233]. In either case, the seeder determines the wavelength and pulse duration of the amplified pulse in the regenerative amplifier.
Table 36: Overview of time-bandwidth products for defined pulse profiles.
Pulse shape Gaussian Hyp. Sech2 Square Triangle Lorentzian ∆𝑓𝐵𝑊 ∙ ∆𝑡𝑝 0.44 0.315 0.89 0.54 0.22
c. Optical isolator Reflections from plasma-layers of critical density are prevented from returning back to the laser-cavity by using an optical isolator, consisting of a faraday rotator, two polarizers and a half-waveplate, whereas the latter one is used to prepare the incoming polarization direction to +45° (clockwise as seen in forward direction). This is necessary since ordinary laser systems provide rather elliptically polarized light with tilted axes. The transmitted 45°-beam will then be rotated backwards to 0° by the faraday rotator, passing the second polarizer and hits the target as s-polarized light. The back-reflection, however, will be turned by another -+45° (as seen in the initial forward direction) and absorbed at the first polarizer [156].
Fig. 214: An optical isolator. (a) incident light becomes vertically polarized as it passes through polarizer A. The linearly polarized light enters the Faraday rotator and becomes rotated by 45° in clockwise direction. The rotated linearly polarized light travels through polarizer B. (b) The reflected beam passes in the same state the polarizer B. It becomes rotated by 45° in clockwise direction, as it passes through the Faraday rotator. The light is now polarized in y-direction and cannot transmit through polarizer A [156]. (Note: The transmitted wave represents the polarization state in which the laser hits the target. To ensure e.g. s-polarization, the polarizer A and B are just turned by 45° in counter-clockwise direction.)
The faraday rotator is a nonreciprocal polarization device, which applies a permanent magnetic field to manipulate a ferromagnetic crystal through which electromagnetic radiation passes. The magnetic field is aligned with the optical axes of the laser beam and causes the polarization plane to rotate according to the Verdet constant, which a strongly wavelength-dependent quantity. Physically, the crystal exhibits circular birefringence, caused by the induced variation in the refractive index [234].
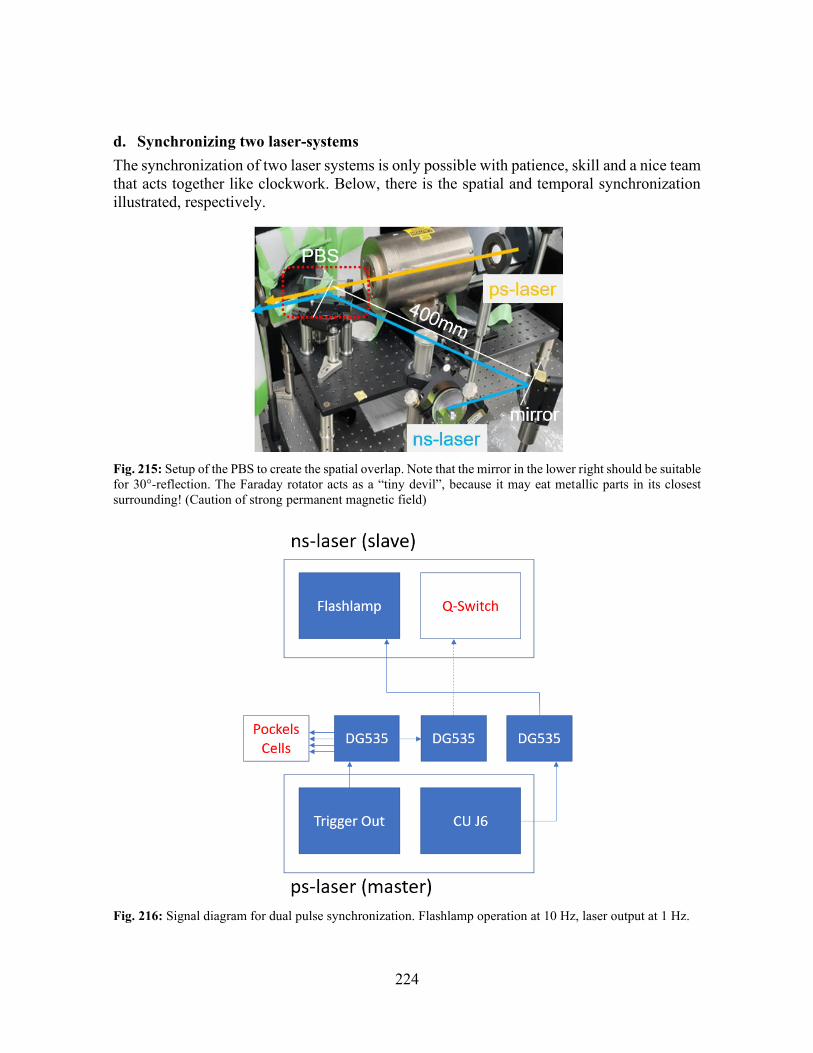
224
d. Synchronizing two laser-systems The synchronization of two laser systems is only possible with patience, skill and a nice team that acts together like clockwork. Below, there is the spatial and temporal synchronization illustrated, respectively.
Fig. 215: Setup of the PBS to create the spatial overlap. Note that the mirror in the lower right should be suitable for 30°-reflection. The Faraday rotator acts as a “tiny devil”, because it may eat metallic parts in its closest surrounding! (Caution of strong permanent magnetic field)
Fig. 216: Signal diagram for dual pulse synchronization. Flashlamp operation at 10 Hz, laser output at 1 Hz.
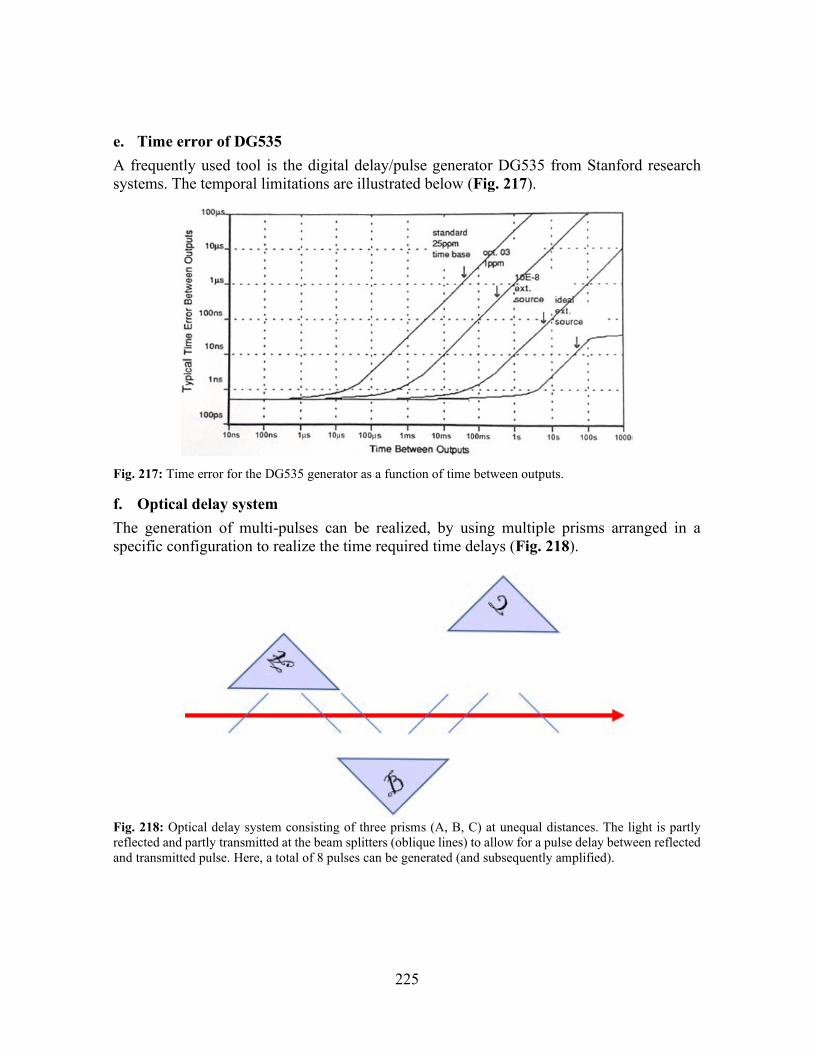
225
e. Time error of DG535 A frequently used tool is the digital delay/pulse generator DG535 from Stanford research systems. The temporal limitations are illustrated below (Fig. 217).
Fig. 217: Time error for the DG535 generator as a function of time between outputs.
f. Optical delay system The generation of multi-pulses can be realized, by using multiple prisms arranged in a specific configuration to realize the time required time delays (Fig. 218).
Fig. 218: Optical delay system consisting of three prisms (A, B, C) at unequal distances. The light is partly reflected and partly transmitted at the beam splitters (oblique lines) to allow for a pulse delay between reflected and transmitted pulse. Here, a total of 8 pulses can be generated (and subsequently amplified).
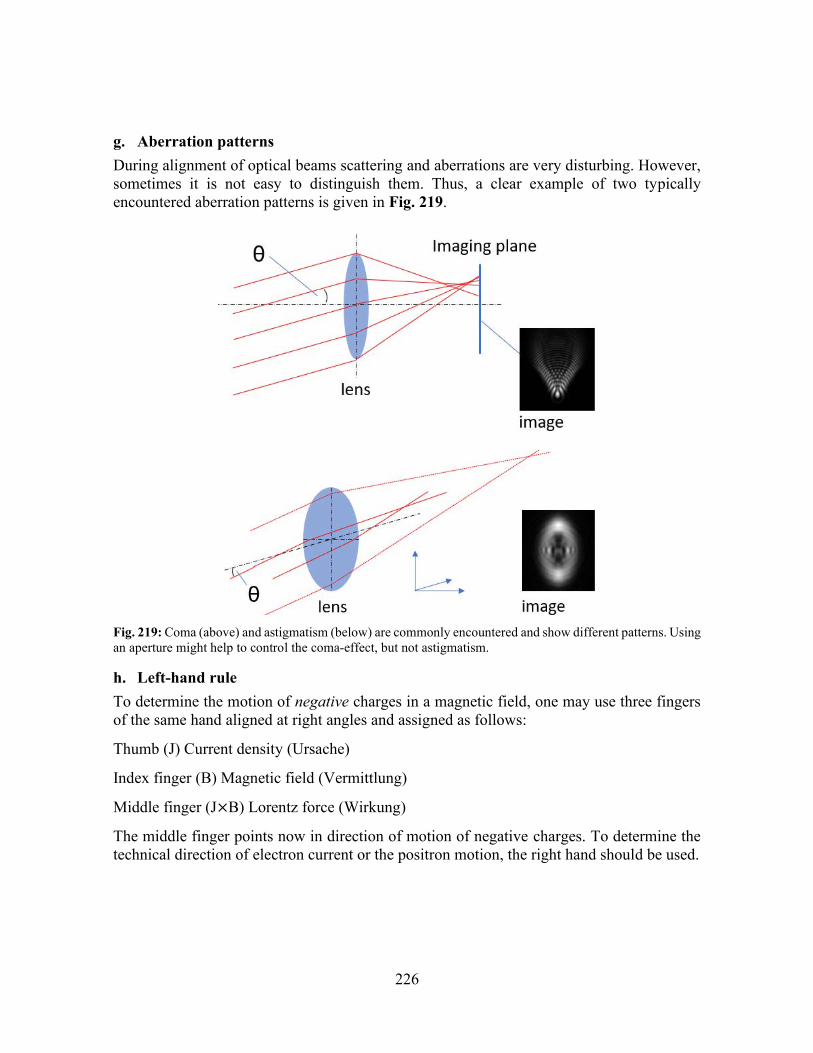
226
g. Aberration patterns During alignment of optical beams scattering and aberrations are very disturbing. However, sometimes it is not easy to distinguish them. Thus, a clear example of two typically encountered aberration patterns is given in Fig. 219.
Fig. 219: Coma (above) and astigmatism (below) are commonly encountered and show different patterns. Using an aperture might help to control the coma-effect, but not astigmatism.
h. Left-hand rule To determine the motion of negative charges in a magnetic field, one may use three fingers of the same hand aligned at right angles and assigned as follows:
Thumb (J) Current density (Ursache)
Index finger (B) Magnetic field (Vermittlung)
Middle finger (J×B) Lorentz force (Wirkung)
The middle finger points now in direction of motion of negative charges. To determine the technical direction of electron current or the positron motion, the right hand should be used.

227
i. Flange ports In order to provide a good sealing, O-rings and gaskets are used in the lab. Large O-rings may require soft stretching from time to time, as they depend on temperature and jump out easily, if cover is opened and room temperature is too low. Copper gaskets are also used for some flanges. However, their handling is more delicate (refer to Fig. 220).
Fig. 220: A CCD-camera is tightened by using a torque key and a wrench of size 13. Set the torque to 50 Ncm and proceed as depicted right throughout all 16 screws. Then, set the torque to 75 Ncm and repeat the process. Finally, use 100 Ncm. The copper gasket can be used twice, however, when using the second time, it should be torqued with 75 Ncm / 100 Ncm / 125 Ncm. When using two wrenches, always pull them apart to avoid injury.
j. Infrared conversion Since the laser beam is invisible to the human eye, there are distinct methods, how to visualize the beam (Fig. 221).
Fig. 221: Tools how to make the IR-beam visible. Thermal “burn”-paper (left), Phosphor-card (center), and IR-view (right). Thermal paper is useful to record the beam pattern, while the thermal paper is better used for alignment purposes. The IR-viewer can be used to visualize reflections, which can be useful for alignment.
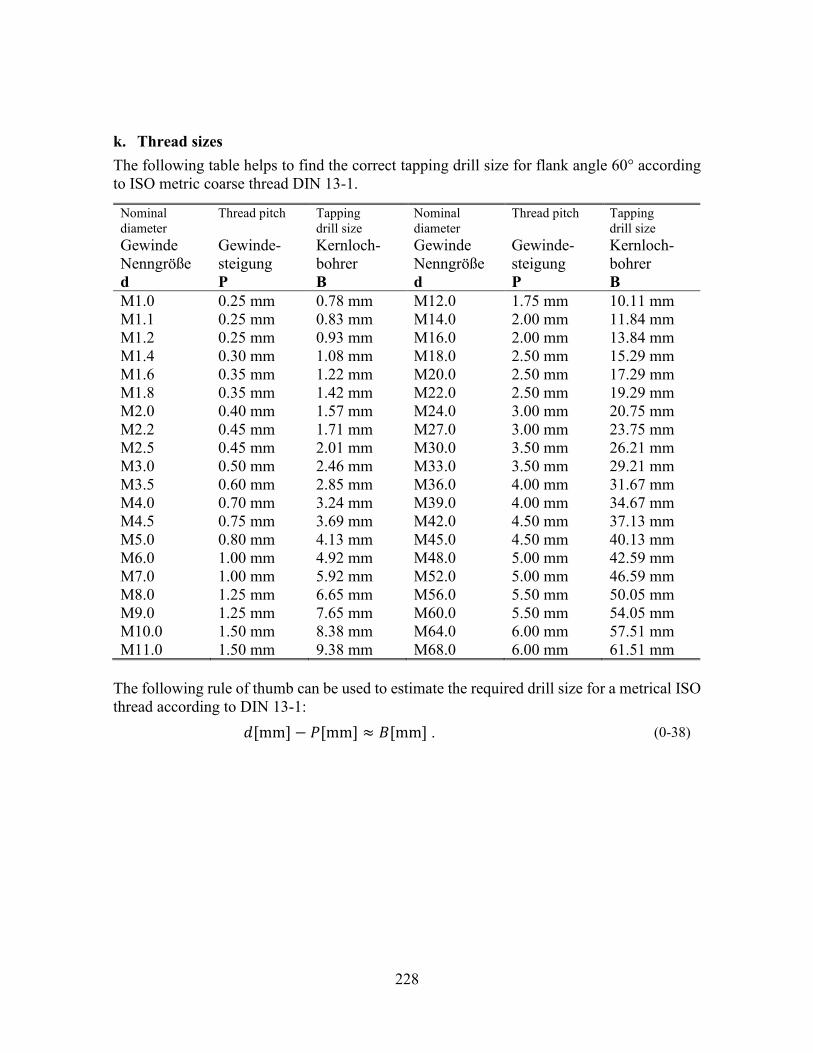
228
k. Thread sizes The following table helps to find the correct tapping drill size for flank angle 60° according to ISO metric coarse thread DIN 13-1.
Nominal diameter
Thread pitch Tapping drill size
Nominal diameter
Thread pitch Tapping drill size
Gewinde Nenngröße
Gewinde-steigung
Kernloch-bohrer
Gewinde Nenngröße
Gewinde-steigung
Kernloch-bohrer
d P B d P B M1.0 0.25 mm 0.78 mm M12.0 1.75 mm 10.11 mm M1.1 0.25 mm 0.83 mm M14.0 2.00 mm 11.84 mm M1.2 0.25 mm 0.93 mm M16.0 2.00 mm 13.84 mm M1.4 0.30 mm 1.08 mm M18.0 2.50 mm 15.29 mm M1.6 0.35 mm 1.22 mm M20.0 2.50 mm 17.29 mm M1.8 0.35 mm 1.42 mm M22.0 2.50 mm 19.29 mm M2.0 0.40 mm 1.57 mm M24.0 3.00 mm 20.75 mm M2.2 0.45 mm 1.71 mm M27.0 3.00 mm 23.75 mm M2.5 0.45 mm 2.01 mm M30.0 3.50 mm 26.21 mm M3.0 0.50 mm 2.46 mm M33.0 3.50 mm 29.21 mm M3.5 0.60 mm 2.85 mm M36.0 4.00 mm 31.67 mm M4.0 0.70 mm 3.24 mm M39.0 4.00 mm 34.67 mm M4.5 0.75 mm 3.69 mm M42.0 4.50 mm 37.13 mm M5.0 0.80 mm 4.13 mm M45.0 4.50 mm 40.13 mm M6.0 1.00 mm 4.92 mm M48.0 5.00 mm 42.59 mm M7.0 1.00 mm 5.92 mm M52.0 5.00 mm 46.59 mm M8.0 1.25 mm 6.65 mm M56.0 5.50 mm 50.05 mm M9.0 1.25 mm 7.65 mm M60.0 5.50 mm 54.05 mm M10.0 1.50 mm 8.38 mm M64.0 6.00 mm 57.51 mm M11.0 1.50 mm 9.38 mm M68.0 6.00 mm 61.51 mm
The following rule of thumb can be used to estimate the required drill size for a metrical ISO thread according to DIN 13-1:
𝑑[mm] − 𝑃[mm] ≈ 𝐵[mm] . (0-38)
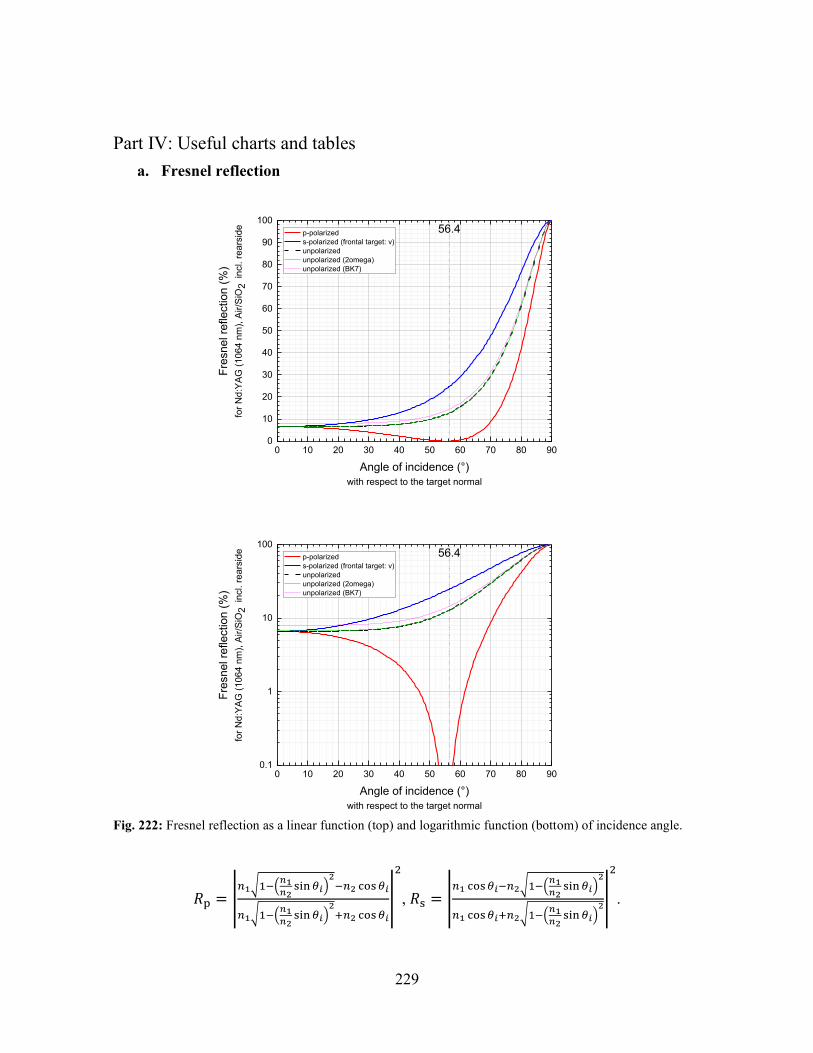
229
Part IV: Useful charts and tables a. Fresnel reflection
0 10 20 30 40 50 60 70 80 900
10
20
30
40
50
60
70
80
90
100Fr
esne
l ref
lect
ion
(%)
for N
d:YA
G (1
064
nm),
Air/S
iO2
incl
. rea
rsid
e
Angle of incidence (°)with respect to the target normal
p-polarized s-polarized (frontal target: v) unpolarized unpolarized (2omega) unpolarized (BK7)
56.4
0 10 20 30 40 50 60 70 80 900.1
1
10
100
Fres
nel r
efle
ctio
n (%
)fo
r Nd:
YAG
(106
4 nm
), Ai
r/SiO
2 in
cl. r
ears
ide
Angle of incidence (°)with respect to the target normal
p-polarized s-polarized (frontal target: v) unpolarized unpolarized (2omega) unpolarized (BK7)
56.4
Fig. 222: Fresnel reflection as a linear function (top) and logarithmic function (bottom) of incidence angle.
𝑅p = |𝑛1√1−(
𝑛1𝑛2
sin 𝜃𝑖)2
−𝑛2 cos 𝜃𝑖
𝑛1√1−(𝑛1𝑛2
sin 𝜃𝑖)2
+𝑛2 cos 𝜃𝑖
|
2
, 𝑅s = |𝑛1 cos 𝜃𝑖−𝑛2√1−(
𝑛1𝑛2
sin 𝜃𝑖)2
𝑛1 cos 𝜃𝑖+𝑛2√1−(𝑛1𝑛2
sin 𝜃𝑖)2|
2
.
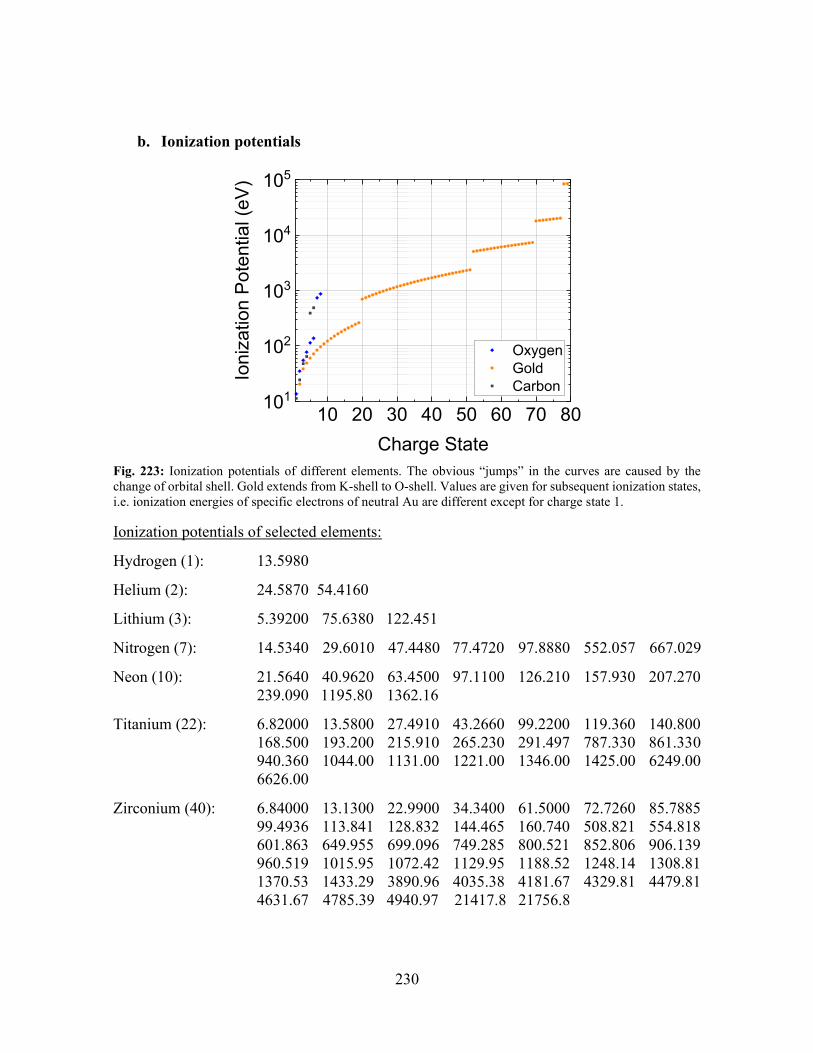
230
b. Ionization potentials
10 20 30 40 50 60 70 80101
102
103
104
105
Ioni
zatio
n Po
tent
ial (
eV)
Charge State
Oxygen Gold Carbon
Fig. 223: Ionization potentials of different elements. The obvious “jumps” in the curves are caused by the change of orbital shell. Gold extends from K-shell to O-shell. Values are given for subsequent ionization states, i.e. ionization energies of specific electrons of neutral Au are different except for charge state 1.
Ionization potentials of selected elements:
Hydrogen (1): 13.5980
Helium (2): 24.5870 54.4160
Lithium (3): 5.39200 75.6380 122.451
Nitrogen (7): 14.5340 29.6010 47.4480 77.4720 97.8880 552.057 667.029
Neon (10): 21.5640 40.9620 63.4500 97.1100 126.210 157.930 207.270 239.090 1195.80 1362.16
Titanium (22): 6.82000 13.5800 27.4910 43.2660 99.2200 119.360 140.800 168.500 193.200 215.910 265.230 291.497 787.330 861.330 940.360 1044.00 1131.00 1221.00 1346.00 1425.00 6249.00 6626.00
Zirconium (40): 6.84000 13.1300 22.9900 34.3400 61.5000 72.7260 85.7885 99.4936 113.841 128.832 144.465 160.740 508.821 554.818 601.863 649.955 699.096 749.285 800.521 852.806 906.139 960.519 1015.95 1072.42 1129.95 1188.52 1248.14 1308.81 1370.53 1433.29 3890.96 4035.38 4181.67 4329.81 4479.81 4631.67 4785.39 4940.97 21417.8 21756.8
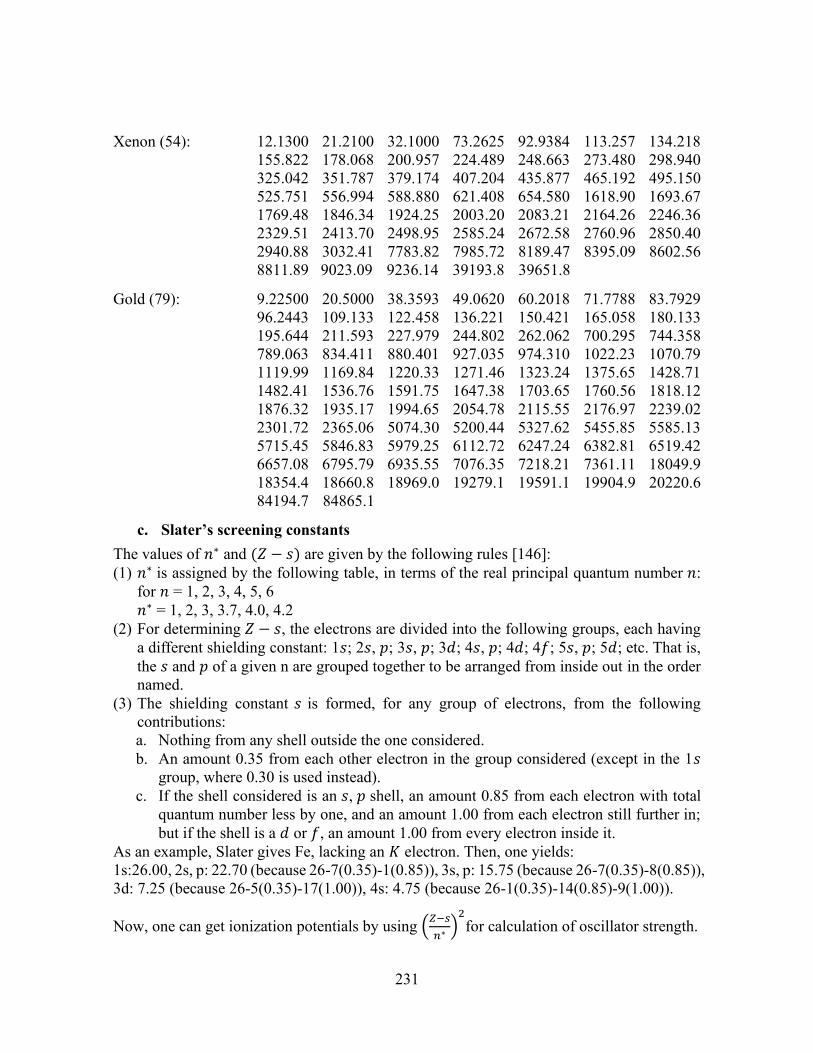
231
Xenon (54): 12.1300 21.2100 32.1000 73.2625 92.9384 113.257 134.218 155.822 178.068 200.957 224.489 248.663 273.480 298.940 325.042 351.787 379.174 407.204 435.877 465.192 495.150 525.751 556.994 588.880 621.408 654.580 1618.90 1693.67 1769.48 1846.34 1924.25 2003.20 2083.21 2164.26 2246.36 2329.51 2413.70 2498.95 2585.24 2672.58 2760.96 2850.40 2940.88 3032.41 7783.82 7985.72 8189.47 8395.09 8602.56 8811.89 9023.09 9236.14 39193.8 39651.8
Gold (79): 9.22500 20.5000 38.3593 49.0620 60.2018 71.7788 83.7929 96.2443 109.133 122.458 136.221 150.421 165.058 180.133 195.644 211.593 227.979 244.802 262.062 700.295 744.358 789.063 834.411 880.401 927.035 974.310 1022.23 1070.79 1119.99 1169.84 1220.33 1271.46 1323.24 1375.65 1428.71 1482.41 1536.76 1591.75 1647.38 1703.65 1760.56 1818.12 1876.32 1935.17 1994.65 2054.78 2115.55 2176.97 2239.02 2301.72 2365.06 5074.30 5200.44 5327.62 5455.85 5585.13 5715.45 5846.83 5979.25 6112.72 6247.24 6382.81 6519.42 6657.08 6795.79 6935.55 7076.35 7218.21 7361.11 18049.9 18354.4 18660.8 18969.0 19279.1 19591.1 19904.9 20220.6 84194.7 84865.1
c. Slater’s screening constants The values of 𝑛∗ and (𝑍 − 𝑠) are given by the following rules [146]: (1) 𝑛∗ is assigned by the following table, in terms of the real principal quantum number 𝑛:
for 𝑛 = 1, 2, 3, 4, 5, 6 𝑛∗ = 1, 2, 3, 3.7, 4.0, 4.2
(2) For determining 𝑍 − 𝑠, the electrons are divided into the following groups, each having a different shielding constant: 1𝑠; 2𝑠, 𝑝; 3𝑠, 𝑝; 3𝑑; 4𝑠, 𝑝; 4𝑑; 4𝑓; 5𝑠, 𝑝; 5𝑑; etc. That is, the 𝑠 and 𝑝 of a given n are grouped together to be arranged from inside out in the order named.
(3) The shielding constant 𝑠 is formed, for any group of electrons, from the following contributions: a. Nothing from any shell outside the one considered. b. An amount 0.35 from each other electron in the group considered (except in the 1𝑠
group, where 0.30 is used instead). c. If the shell considered is an 𝑠, 𝑝 shell, an amount 0.85 from each electron with total
quantum number less by one, and an amount 1.00 from each electron still further in; but if the shell is a 𝑑 or 𝑓, an amount 1.00 from every electron inside it.
As an example, Slater gives Fe, lacking an 𝐾 electron. Then, one yields: 1s:26.00, 2s, p: 22.70 (because 26-7(0.35)-1(0.85)), 3s, p: 15.75 (because 26-7(0.35)-8(0.85)), 3d: 7.25 (because 26-5(0.35)-17(1.00)), 4s: 4.75 (because 26-1(0.35)-14(0.85)-9(1.00)).
Now, one can get ionization potentials by using (𝑍−𝑠
𝑛∗ )2
for calculation of oscillator strength.
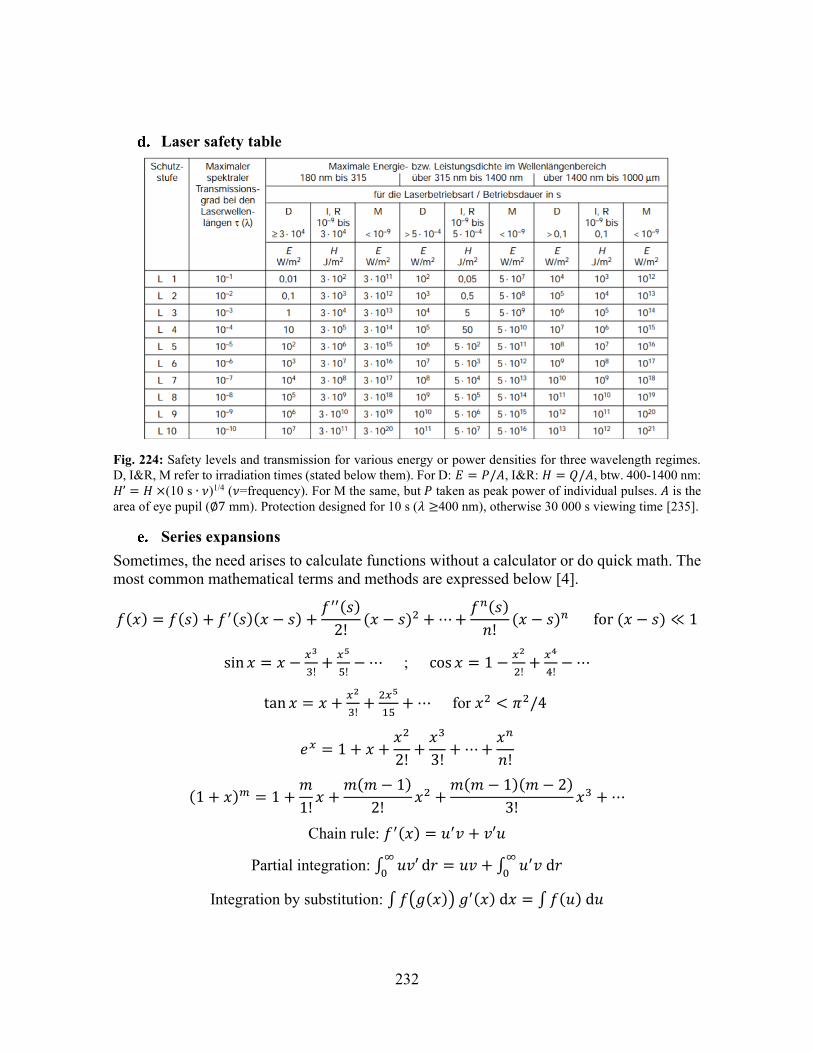
232
Laser safety table
Fig. 224: Safety levels and transmission for various energy or power densities for three wavelength regimes. D, I&R, M refer to irradiation times (stated below them). For D: 𝐸 = 𝑃/𝐴, I&R: 𝐻 = 𝑄/𝐴, btw. 400-1400 nm: 𝐻’ = 𝐻 ×(10 s ∙ 𝜈)1/4 (𝜈=frequency). For M the same, but 𝑃 taken as peak power of individual pulses. 𝐴 is the area of eye pupil (∅7 mm). Protection designed for 10 s (𝜆 ≥400 nm), otherwise 30 000 s viewing time [235].
Series expansions Sometimes, the need arises to calculate functions without a calculator or do quick math. The most common mathematical terms and methods are expressed below [4].
𝑓(𝑥) = 𝑓(𝑠) + 𝑓′(𝑠)(𝑥 − 𝑠) +𝑓′′(𝑠)
2!(𝑥 − 𝑠)2 + ⋯ +
𝑓𝑛(𝑠)
𝑛!(𝑥 − 𝑠)𝑛 for (𝑥 − 𝑠) ≪ 1
sin 𝑥 = 𝑥 −𝑥3
3!+
𝑥5
5!− ⋯ ; cos 𝑥 = 1 −
𝑥2
2!+
𝑥4
4!− ⋯
tan 𝑥 = 𝑥 +𝑥2
3!+
2𝑥5
15+ ⋯ for 𝑥2 < 𝜋2/4
𝑒𝑥 = 1 + 𝑥 +𝑥2
2!+
𝑥3
3!+ ⋯ +
𝑥𝑛
𝑛!
(1 + 𝑥)𝑚 = 1 +𝑚
1!𝑥 +
𝑚(𝑚 − 1)
2!𝑥2 +
𝑚(𝑚 − 1)(𝑚 − 2)
3!𝑥3 + ⋯
Chain rule: 𝑓′(𝑥) = 𝑢′𝑣 + 𝑣′𝑢
Partial integration: ∫ 𝑢𝑣′∞
0d𝑟 = 𝑢𝑣 + ∫ 𝑢′𝑣 d𝑟
∞
0
Integration by substitution: ∫ 𝑓(𝑔(𝑥)) 𝑔′(𝑥) d𝑥 = ∫ 𝑓(𝑢) d𝑢
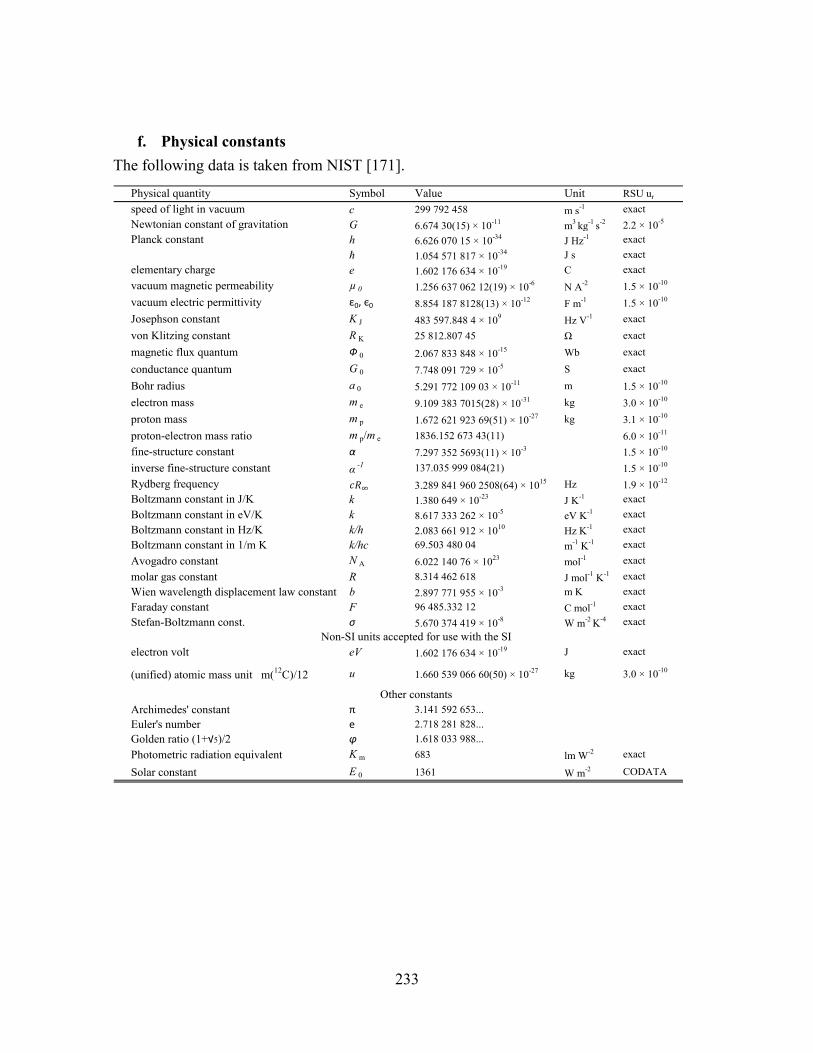
233
f. Physical constants The following data is taken from NIST [171].
Symbolc 299 792 458 m s-1
G 6.674 30(15) × 10-11 m3 kg-1 s-2
h 6.626 070 15 × 10-34 J Hz-1
ℏ 1.054 571 817 × 10-34 J se 1.602 176 634 × 10-19 Cµ 0 1.256 637 062 12(19) × 10-6 N A-2
ε0, є0 8.854 187 8128(13) × 10-12 F m-1
K J 483 597.848 4 × 10⁹ Hz V-1
R K 25 812.807 45 ΩФ 0 2.067 833 848 × 10-15 Wb
conductance quantum G 0 7.748 091 729 × 10-5 SBohr radius a 0 5.291 772 109 03 × 10-11 melectron mass m e 9.109 383 7015(28) × 10-31 kgproton mass m p 1.672 621 923 69(51) × 10-27 kgproton-electron mass ratio m p/m e 1836.152 673 43(11)fine-structure constant α 7.297 352 5693(11) × 10-3
inverse fine-structure constant α -1 137.035 999 084(21)
3.289 841 960 2508(64) × 1015 Hzk 1.380 649 × 10-23 J K-1
Boltzmann constant in eV/K k 8.617 333 262 × 10-5 eV K-1
Boltzmann constant in Hz/K k/h 2.083 661 912 × 1010 Hz K-1
Boltzmann constant in 1/m K k/hc 69.503 480 04 m-1 K-1
Avogadro constant N A 6.022 140 76 × 1023 mol-1
molar gas constant R 8.314 462 618 J mol-1 K-1
Wien wavelength displacement law constant b 2.897 771 955 × 10-3 m KFaraday constant F 96 485.332 12 C mol-1
Stefan-Boltzmann const. σ 5.670 374 419 × 10-8 W m-2 K-4
electron volt eV 1.602 176 634 × 10-19 J
(unified) atomic mass unit m(12C)/12 u 1.660 539 066 60(50) × 10-27 kg
Archimedes' constant π 3.141 592 653...Euler's number e 2.718 281 828...Golden ratio (1+√5)/2 φ 1.618 033 988...Photometric radiation equivalent K m 683 lm W-2
Solar constant E 0 1361 W m-2
Other constants
exact
Unitspeed of light in vacuum Newtonian constant of gravitation 2.2 × 10⁻⁵
magnetic flux quantum
RSU urPhysical quantityexact
Value
exactexactexact1.5 × 10-10
1.5 × 10⁻¹⁰
exactexact
Non-SI units accepted for use with the SI
Planck constant
elementary chargevacuum magnetic permeability vacuum electric permittivity Josephson constantvon Klitzing constant
Boltzmann constant in J/KRydberg frequency
exactexact
3.0 × 10-101.5 × 10⁻¹⁰
3.1 × 10⁻¹⁰
6.0 × 10⁻¹¹
1.5 × 10⁻¹⁰
1.5 × 10⁻¹⁰
1.9 × 10⁻¹²
exact
CODATA
exact
exactexact
exactexact
exact
exactexactexact
3.0 × 10⁻¹⁰
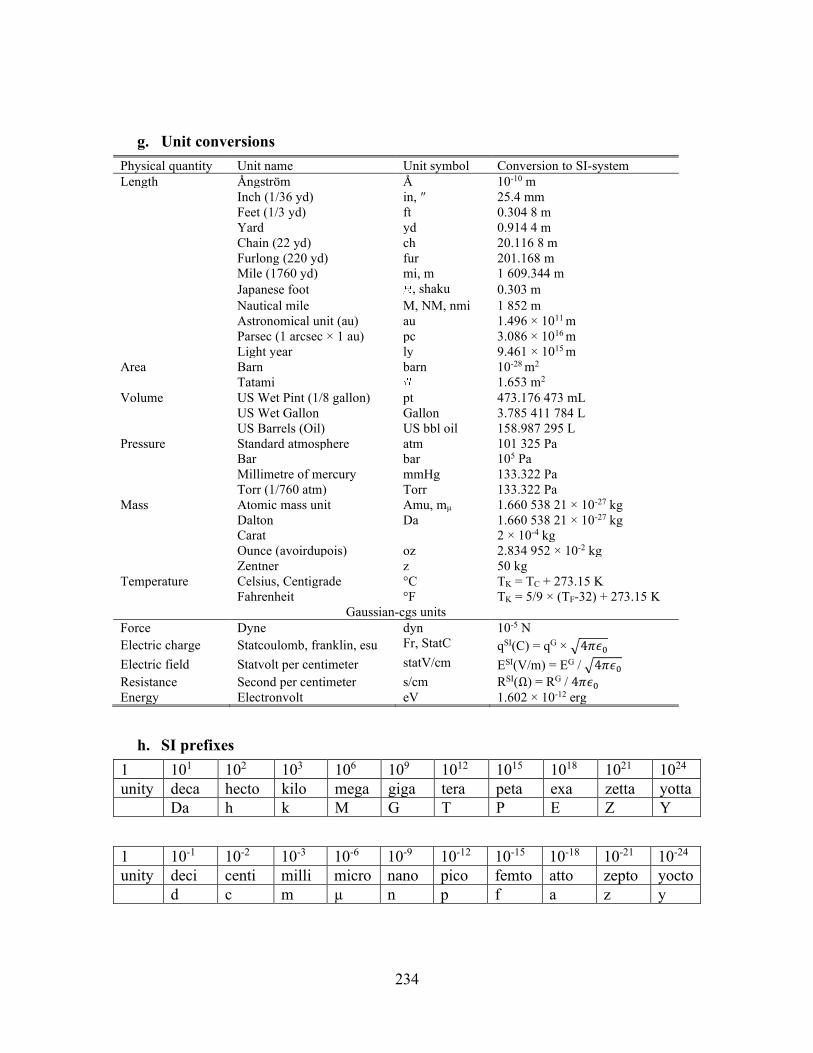
234
g. Unit conversions Physical quantity Unit name Unit symbol Conversion to SI-system Length Ångström Å 10-10 m Inch (1/36 yd) in, ″ 25.4 mm Feet (1/3 yd) ft 0.304 8 m Yard yd 0.914 4 m Chain (22 yd) ch 20.116 8 m Furlong (220 yd) fur 201.168 m Mile (1760 yd) mi, m 1 609.344 m Japanese foot , shaku 0.303 m Nautical mile M, NM, nmi 1 852 m Astronomical unit (au) au 1.496 × 10¹¹ m Parsec (1 arcsec × 1 au) pc 3.086 × 10¹⁶ m Light year ly 9.461 × 10¹⁵ m Area Barn barn 10-28 m2 Tatami 1.653 m2 Volume US Wet Pint (1/8 gallon) pt 473.176 473 mL US Wet Gallon Gallon 3.785 411 784 L US Barrels (Oil) US bbl oil 158.987 295 L Pressure Standard atmosphere atm 101 325 Pa Bar bar 105 Pa Millimetre of mercury mmHg 133.322 Pa Torr (1/760 atm) Torr 133.322 Pa Mass Atomic mass unit Amu, mμ 1.660 538 21 × 10-27 kg Dalton Da 1.660 538 21 × 10-27 kg Carat 2 × 10⁻⁴ kg Ounce (avoirdupois) oz 2.834 952 × 10-2 kg Zentner z 50 kg Temperature Celsius, Centigrade °C TK = TC + 273.15 K Fahrenheit °F TK = 5/9 × (TF-32) + 273.15 K
Gaussian-cgs units Force Dyne dyn 10-5 N Electric charge Statcoulomb, franklin, esu Fr, StatC qSI(C) = qG × √4𝜋𝜖0 Electric field Statvolt per centimeter statV/cm ESI(V/m) = EG / √4𝜋𝜖0 Resistance Second per centimeter s/cm RSI(Ω) = RG / 4𝜋𝜖0 Energy Electronvolt eV 1.602 × 10⁻¹² erg
h. SI prefixes 1 101 102 103 106 109 1012 1015 1018 1021 1024 unity deca hecto kilo mega giga tera peta exa zetta yotta Da h k M G T P E Z Y
1 10-1 10-2 10-3 10-6 10-9 10-12 10-15 10-18 10-21 10-24 unity deci centi milli micro nano pico femto atto zepto yocto d c m µ n p f a z y
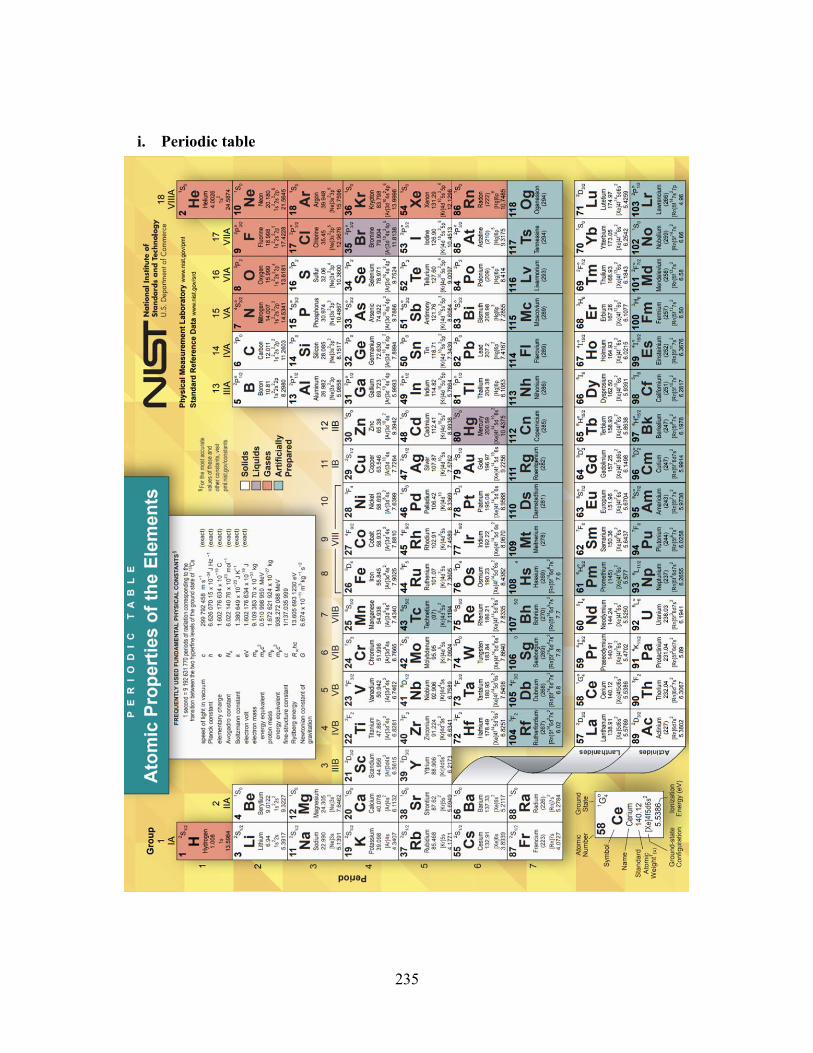
235
i. Periodic table
236
BIBLIOGRAPHY
[1] W. C. Röntgen, "On a New Kind of Rays," Nature, vol. 53, p. 274, 1896. [2] S. P. Newberry, History of X-ray Microscopy, Berlin Heidelberg: Springer-Verlag,
1987. [3] P. Goby, "New Application of the X-rays: Micro-radiography," C. R. Acad. Sci. Paris,
vol. 156, p. 686, 1913. [4] D. Attwood, A. Sakdinawat, X-rays and extreme ultraviolet radiation: Principles and
applications, vol. Second edition, Cambridge, New York: Cambridge University Press, 2016.
[5] J. Kirz and C. Jacobsen, "The history and future of x-ray microscopy," J. Phys. Conf. Ser., vol. 186, no. 1, 2009.
[6] P. Lamarque, "Historadiography: A new application of X-rays," Radiology, vol. 27, no. 5, 1936.
[7] P. Lamarque and J. Turchini, C. R. Soc. Biol. Paris, vol. 122, p. 294, 1936. [8] D. Sayre, J. Kirz, R. Feder, D. M. Kim, and E. Spiller, "Potential operating region for
ultrasoft x-ray microscopy of biological materials," Science, vol. 196, no. 4296, p. 1339, 1977.
[9] L. Beese, R. Feder, and D. Sayre, "Contact X-ray microscopy: A new technique for imaging cellular fine structure," Biophysical Society, vol. 49, p. 259, 1986.
[10] T. Tomie, H. Shimizu, T. Majima, T. Kanayama, M. Yamada, and E. Miura, Proc. SPIE, vol. 1741, no. 118, 1992.
[11] J. C. Solem, "Imaging biological specimens with high-intensity soft x rays," Opt. Soc. Am. B, vol. 3, no. 11, p. 1551, 1986.
[12] J. P. M. a. J. S. J. F. Adam, "Table-top water window transmission x-ray microscopy: review of the key issues, and conceptual design of an instrument for biology," Rev. Sci. Instrum., vol. 76, p. 091301, 2005.
[13] "The Center for X-ray Optics," Lawrence Berkeley National Laboratory, [Online]. Available: http://www.cxro.lbl.gov/. [Accessed June 2020].
[14] H. Kondo and T. Tomie, "Optimization of a laser-plasma x-ray source for contact x-ray microscopy," J. Appl. Phys., vol. 75, no. 8, p. 3798, 1994.
[15] M. Kishimoto, and S. Namba, Development of water-window soft x-ray microscope for imaging hydrated cellular organelles in QST, Higashihiroshima, 2018.
237
[16] W. Chao, P. Fischer, T. Tyliszczak, S. Rekawa, E. Anderson, and P. Naulleau, "Real space soft x-ray imaging at 10 nm spatial resolution," Optics Express, vol. 20, no. 9, 2012.
[17] R. Medenwaldt and E. Uggerhøj, "Description of an x-ray microscope with 30 nm resolution," Review of Scientific Instruments, vol. 69, no. 8, p. 2974, 1998.
[18] W. Crookes, "On the Illumination of Lines of Molecular Pressure, and the Trajectory of Molecules," Philosophical Transactions, vol. 170, pp. 135-164, 1878.
[19] B. Halton, "Some Unremembered Chemists," Chemistry in New Zealand, vol. 82, no. 2, p. 85, 2018.
[20] G. Z. Yue, Q. Qiu, B. Gao, Y. Cheng, J. Zhang, H. Shimoda, S. Chang, J. P. Lu, and O. Zhou, "Generation of continuous and pulsed diagnostic imaging x-ray radiation using a carbon-nanotube-based field-emission cathode," Applied Physics Letters, vol. 81, p. 355, 2002.
[21] C. A. Spindt, "A Thin-Film Field-Emission Cathode," Journal of Applied Physics, vol. 39, p. 3504, 1968.
[22] a. C. S. I. Brodie, "Vacuum Microelectronics," Advances in Electronics and Electron Physics, vol. 83, no. 1, p. 106, 1992.
[23] H. Sugie, M. Tanemura, V. Fillip, K. Iwata, K. Takahashi, and F: Okuyama, "Carbon nanotubes as electron source in an x-ray tube," Applied Physics Letters, vol. 78, p. 2578, 2001.
[24] K. A. Dean, and B. R. Chalamala, "Field emission microscopy of carbon nanotube caps," Journal of applied physics, vol. 85, p. 3832, 1999.
[25] R. H. Fowler, and L. Nordheim, "Electron Emission in Intense Electric Fields," Royal Society, vol. 119, no. 781, p. 173, 1928.
[26] J.-W. Jeong, J.-T. Kang, S. Choi, J.-W. Kim, S. Ahn, and Y.-H. Song, "A digital miniature x-ray tube with a high-density triode carbon nanotube field emitter," Applied Physics Letters, vol. 102, p. 023504, 2013.
[27] Y. Agrawal, G. Kedawat, P. Kumar, J. Dwivedi, V. N. Singh, R. K. Gupta, and B. K. Gupta, "High-Performance Stable Field Emission with Ultralow Turn on Voltage from rGO Conformal Coated TiO2 Nanotubes 3D Arrays," Scientific Reports, vol. 5, no. 11612, 2015.
[28] S. Lv, Z. Li, C. Chen, J. Liao, G. Wang, M. Li, and W. Miao, "Enhanced Field Emission Performance of Hierarchical ZnO/So Nanotrees with Spatially Branched Heteroassemblies," ACS Applied Materials and Interfaces, vol. 7, p. 13564, 2015.
[29] B. Diop, and V. T. Binh, "Quasi-monochromatic field-emission x-ray source," Review of Scientific Instruments, vol. 83, p. 094704, 2012.
[30] G. G. Poludniowski, "Calculation of x-ray spectra emerging from an x-ray tube. Part II. X-ray production and filtration in x-ray targets," Medical Physics, vol. 34, no. 6, p. 2175, 2007.
238
[31] D. Chen, X. Song, Z. Zhang, Z. Li, J. She, S. Deng, N. Xu, and J. Chen, "Transmission type flat-panel X-ray source using ZnO nanowire field emitters," Applied Physics Letters, vol. 107, p. 243105, 2015.
[32] R. Lebert, D. Rothweiler, A. Engel, K. Bergmann, and W. Neff, "Pinch plasmas as intense EUV sources for laboratory applications," Optical and Quantum Electronics, vol. 28, p. 241, 1996.
[33] W. H. Bennett, "Magnetically Self-Focussing Streams," Physical Review, vol. 45, p. 890, 1934.
[34] D. Mosher, S. J. Stephanakis, I. M. Vitkovitsky, C. M. Dozier, L. S. Levine, and D. J. Nagel, "X radiation from high-energy-density exploded-wire discharges," Applied Physics Letters, vol. 23, p. 429, 1973.
[35] T. A. Shelkovenko, D. B. Sinars, S. A. Pikuz, and D. A. Hammer, "Radiographic and spectroscopic studies of X-pinch plasma implosion dynamics and x-ray burst emission characteristics," Physics of Plasmas, vol. 8, p. 1305, 2001.
[36] K. Bergmann, F. Küpper, and M. Benk, "Soft x-ray emission from a pulsed gas discharge in a pseudosparklike electrode geometry," Journal of Applied Physics, vol. 103, p. 123304, 2008.
[37] R. W. P. M. Whirter, Plasma Diagnostic Techniques, New York: Academic, 1965, p. 201.
[38] P. Skoglund, U. Lundström, U. Vogt, and H. M. Hertz, "High-brightness water-window electron-impact liquid-jet microfocus source," Applied Physics Letters, vol. 96, p. 084103, 2010.
[39] M. Green and V. E. Cosslett, "Measurements of K, L, and M shell x-ray production efficiencies," Br. J. Appl. Phys., vol. 1, p. 425, 1968.
[40] S. Ohsuka, A. Ohba, S. Onoda, K. Nakamoto, T. Nakano, M. Miyoshi, K. Soda, and T. Hamakubo, "Laboratory-size three-dimensional x-ray microscope with Wolter type I mirror optics and an electron-impact water window x-ray source," Review of Scientific Instruments, vol. 85, p. 093701, 2014.
[41] B. Lab, "Advanced Light Source," [Online]. Available: https://als.lbl.gov/. [Accessed July 2020].
[42] R. P. Feynman, R. B. Leighton, and M. Sands, The Feynman Lectures on Physics, The definite edition (2006) ed., vol. I, A. Black, Ed., Pearson Addison Wesley, 1963.
[43] "Photon Science," DESY, [Online]. Available: https://photon-science.desy.de/research/students__teaching/primers/synchrotron_radiation/. [Accessed June 2020].
[44] "Brookhaven National Laboratory," U.S. Department of Energy (Office of Science), [Online]. Available: https://www.bnl.gov/ps/userguide/lectures/. [Accessed June 2020].
[45] Y. B. Zel'dovich, and Y. P. Raizer, Physics of shock waves and high-temperature hydrodynamic phenomena, Mineola, New York: Dover Publicatins, Inc., 2002.
239
[46] R. G. Meyerand Jr., and A. F. Haught, "Gas breakdown at optical frequencies," Phys. Rev. Letters, vol. 11, p. 401, 1963.
[47] S. Atzeni and J. Meyer-ter-Vehn, "10. Hot Dense Matter and 11. Beam-Target interaction," in The Physics of Inertial Fusion, Clarendon Press, 2004.
[48] S. Namba, S. Fujioka, H. Nishimura, Y. Yasuda, K. Nagai, N. Miyanaga, Y. Izawa, K. Mima, andK. Takiyama, "Spectroscopic study of debris mitigation with minimum-mass Sn laser plasma for extreme ultraviolet lithography," Applied Physics Letters, vol. 88, no. 171503, 2006.
[49] H. Nishimura, T. Endo, H. Shiraga, Y. Kato, and S. Nakai, "X-ray emission from high-Z mixture plasmas generated with intense blue laser light," Applied Physics Letter, vol. 62, p. 1344, 1993.
[50] T. Higashiguchi, T. Otsuka, N. Yugami, W. Jiang, A. Endo, B. Li, P. Dunne, and G. O’Sullivan, "Feasibility study of broadband efficient “water window” source," Applied Physics Letters, vol. 100, no. 014103, 2012.
[51] T.-H. Dinh, Y. Suzuki, G. Arai, B. Li, P. Dunne, G. O'Sullivan, S. Fujioka, N. Hasegawa, T. Kawachi, M. Nishikino, and T. Higashiguchi, "Temporal behavior of unresolved transition array emission in water window soft x-ray spectral region from multiply charged ions," Applied Physics Letter, vol. 107, p. 121101, 2015.
[52] D. Babonneau, M. Primout, F. GIrard, J.-P. Jadaud, M. Naudy, B. Villette, S. Depierreux, C. Blancard, G: Faussurier, K. B. Fournier, L. Suter, R: Kauffman, S. Glenzer, M. C. Miller, J. Grün, and J. Davis, "Efficient multi-keV X-ray sources from laser-exploded metallic thin foils," Physics of Plasmas, vol. 15, p. 092702, 2008.
[53] T. Mochizuki, and C. Yamanaka, "Efficient Soft X-ray Generation in Short Wavelength Laser Produced Plasmas," Proc. SPIE, vol. 733, no. 23, 1987.
[54] C. A. Back, J. Grun, C. Decker, L. J. Suter, J. Davis, O. L. Landen, R. Wallace, W. W. Hsing, J. M. Laming, U. Feldman, M. C. Miller, and C. Wuest, "Efficient Multi-keV Unterdense Laser-Produced Plasma Radiators," Physics Review Letters, vol. 87, no. 27, p. 275003, 2001.
[55] S. P. Gordon, T. D. Donnelly, A. Sullivan, H. Hamster, and R. W. Falcone, "X-rays from Microstructured Targets Heated by Femtosecond Lasers," Optics Letter, vol. 19, no. 7, p. 484, 1994.
[56] R. Hollinger, C. Bargsten, V. N. Shlyaptsev, V. Kaymak, A. Pukhov, M. G. Capeluto, S. Wang, A. Townsend, A. Prieto, P. Stockton, A. Curtis, and J. J. Rocca, "Efficient picosecond x-ray pulse generation from plasmas in the radiation dominated regime," optica, vol. 4, no. 11, p. 1344, 2017.
[57] G. Kulcsár, D. AlMawlawi, F: W: Budnik, P. R. Herman, M. Moskovits, L. Zhao, and R. S. Marjoribanks, "Intense Picosecond X-ray Pulses from Laser Plasmas by Use of Nanostructured "Velvet" Targets," Physical Review Letters, vol. 84, no. 22, p. 5149, 2000.
[58] H. Hara, H. Kawasaki, T. Tamura, T. Hatano, T. Ejima, W. Jiang, H. Ohashi, S. Namba, A. Sunahara, A. Sasaki, M. Nishikino, G. O'Sullivan, and T. Higashiguchi,
240
"Emission of water-window soft x-rays under optically thin conditions using low-density foam targets," Optics Letters, vol. 43, no. 15, p. 3750, 2018.
[59] W. Shang, J. Yang, W. Zhang, Y. Dong, Z. Li, B. Deng. T. Zhu, C. Huang, X. Zhan, L. Guo, R. Yu, S. Li, S. Jiang, S. Liu, F. Wang, Y. Doing, B. Zhang, and R. Betti, "Experimental demonstration of laser to x-ray conversion enhancements with low density gold targets," Applied Physics Letters, vol. 102, p. 094105, 2013.
[60] R. Kodama, K. Okada, N. Ikeda, M. Mineo, K. A. Tanaka, T. Mochizuki, and C. Yamanaka, "Soft x-ray emission from ω0, 2ω0, and 4ω0 laser-produced plasmas," Journal of Applied Physics, vol. 59, no. 9, p. 3050, 1986.
[61] T. Otsuka, D: Kilbane, T. Higashiguchi, N. Yugami, T. Yatagai, W. Jiang, A. Endo, P. Dunne, and G. O'Sullivan, "Systematic investigation of self-absorption and conversion efficiency of 6.7nm extreme ultraviolet sources," Applied Physics Letters, vol. 97, p. 231503, 2010.
[62] M. Fikry, W. Tawfik, and M. M. Omar, "Investigation on the effects of laser parameters on the plasma profile of copper using picosecond laser induced plasma spectroscopy," Optical and Quantum Electronics, vol. 52, p. 249, 2020.
[63] R. Lokasani, G. Arai, Y. Kondo, H. Hara, T-H. Dinh, T. Ejima, T. Hatano, W. Jiang, T. Makimura, B. Li, P. Dunne, G. O'Sullivan, T. Higashiguchi, and J. Limpouch, "Soft X-ray emission from molybdenum plasmas generated by dual laser pulses," Applied Physics Letters, vol. 109, no. 194103, 2016.
[64] B. Yaakobi, P. Bourke, Y. Conturie, J. Delettrez, J. M. Forsyth, R. D. Frankel, L. M. Goldman, R. L. McCrory, W. Seka, and J. M. Soures, "High X-ray conversion efficiency with target irradiation by a frequency tripled Nd: Glass laser," Optics Communications, vol. 38, no. 3, p. 196, 1981.
[65] M. Müller, F.-C. Kühl, P. Großmann, P. Vrba, and K. Mann, "Emission properties of ns and ps laser-induced soft x-ray sources using pulsed gas jets," Optics Express, vol. 21, no. 10, p. 12831, 2013.
[66] E. L. Dewald, M. Rosen, S. H. Glenzer, L. J. Suter, F. Girard, J. P. Jadaud, J. Schein, C. Constantin, F. Wagon, G. Huser, P. Neumayer, and O. L. Landen, "X-ray conversion efficiency of high-Z hohlraum wall materials for indirect drive ignition," Physics of Plasmas, vol. 15, p. 072706, 2008.
[67] M. Chaker, H. Pepin, V: Bareau, S. Boily, B. Lafontaine, R. Fabbro, I. Toubhans, B. Faral, J. F. Currie, D. Nagel, and M. Peckerar, "Laser created X-ray sources for microlithography," Proc. SPIE, vol. 733, p. 58, 1986.
[68] K. Eidmann, and W. Schwanda, "Conversion of laser light into soft X-rays with 3-ns and 30-ps laser pulses," Laser and particle beams, vol. 9, no. 2, p. 551, 1991.
[69] H. Ohashi, H. Hara, G. Arai, T. Hatano, T. Ejima, C. Suzuki, S. Namba, A. Sasaki, M. Nishikino, G. O'Sullivan, and T. Higashiguchi, "Spectral dynamics of soft X-ray emission in dual-laser-produced medium Z-plasma," Applied Physics B, vol. 124, no. 193, 2018.
241
[70] G. Arai, H. Hara, T. Hatano, T. Ejima, W. Jiang, H. Ohashi, S. Namba, A. Sunahara, A. Sasaki, M. Nishikino, G. O'Sullivan, and T. Higashiguchi, "Intense water-window soft x-ray emission by spectral control using dual laser pulses," Optics Express, vol. 26, no. 21, p. 27748, 2018.
[71] J. Son, M. Cho, D. Kim. B. Ahn, and J. Kim, "Prepulse effect on laser-induced water-window radiation from a liquid nitrogen jet," Applied Physics Letters, vol. 90, p. 261502, 2007.
[72] P. Dunne, G. O'Sullivan, and D. O'Reilly, "Prepulse-enhanced narrow bandwidth soft X-ray emission from a low debris, subnanosecond, laser plasma source," Applied Physics Letters, vol. 76, p. 34, 2000.
[73] H. Kawasaki, A. Sunahara, Y. Shimada, T. Ejima, W. Jiang, G. O'Sullivan, M. Nishikino, S. Namba, and T. Higashiguchi, "Electron temperature and soft X-ray intensity scaling in laser heavy element plasma interaction," AIP Advances, vol. 10, no. 065306, 2020.
[74] K. B. Fournier, C. Constantin, C. A. Back, L. Suter, H.-K. Chung, M. C. Miller, D. H. Froula, G. Gregori, S. H. GLenzer, E. L. Dewald, and O. L. Landen, "Electron-density scaling of conversion efficiency of laser energy into L-shell X-rays," Journal of Quantitative Spectroscopy and Radiative Transfer, vol. 99, no. 1-3, p. 186, 2006.
[75] M. Kado, M. Kishimoto, K. Shinohara, T. Ejima, "Increase of the emission of laser-produced plasmas under N2 gas atmosphere in the 2.9–6 nm region," Applied physics letters, vol. 111, no. 054102, 2017.
[76] Y. Wang, E. Granados, F. Pedaci, D. Alessi, B. Luther, M. Berrill, and J. J. Rocca, "Phase-coherent, injection-seeded, table-top soft-X-ray lasers at 18.9 nm and 13.9 nm," Nature Photonics, vol. 2, p. 94, 2008.
[77] A. Rockwood, Y. Wang, S. Wang, M. Berrill, V. N. Shlyaptsev, and J. J. Rocca, "Compact gain-saturated x-ray lasers down to 6.85 nm and amplification down to 5.85 nm," Optica, vol. 5, no. 3, p. 257, 2018.
[78] A. Zherikhin, K. Koshelev, and V. Letokhov, "Gain in the far vacuum ultraviolet region due to transitions in multiply charged ions," Soviet Journal of Quantum Mechanics, vol. 6, no. 82, 1976.
[79] T. A. Weaver et al., "Demonstration of a Soft X-ray Amplifier," Physical Review Letters, vol. 54, p. 110, 1984.
[80] L. I. Gudzenko, and L. A. Shelepin, "Negative Absorption in a nonequilibrium hydrogen plasma," Soviet Physics JETP, vol. 18, no. 4, 1964.
[81] S. Suckewer, C. H. Skinner, H. Milchberg, C. Keane, and D. Voorhees, "Amplification of Stimulated Soft-X-Ray Emission in a Confined Plasma Column," Physical Review Letters, vol. 55, no. 17, p. 1753, 1985.
[82] T. Popmintchev et al., "Bright Coherent Ultrahigh Harmonics in the keV X-ray Regime from Mid-Infrared Femtosecond Lasers," Science, vol. 336, no. 6086, p. 1287, 2012.
242
[83] "International Technology Roadmap for Semiconductors (ITRS) Roadmap," [Online]. Available: http://www.itrs2.net/itrs-reports.html. [Accessed August 2020].
[84] D. Brown et al., "Light sources for high-volume manufacturing EUV lithography: technology, performance, and power scaling," Advanced Optical Technologies, vol. 6, no. 3-4, 2017.
[85] C. John, M. Kishimoto, T. Johzaki, T. Higashiguchi, N. Kakunaka, Y. Matsumoto, N. Hasegawa, M. Nishikino, T. Ejima, A. Sunahara, T. Endo, and S. Namba, "Enhancement of water-window soft x-ray emission from laser-produced Au plasma under low-pressure nitrogen atmosphere," Optics Letters, vol. 44, no. 6, p. 1439, 2019.
[86] C. John, M. Kishimoto, Y. Matsumoto, T. Morishita, T. Higashiguchi, T. Endo, A. Sunahara, T. Johzaki, and S. Namba, "Observation of water-window soft x-ray emission from laser-produced Au plasma under optically thin condition," in Inertial Fusion Sciences and Applications 2019, Osaka, 2020.
[87] D. Sayre, J. Kirz, R. Feder, D. M. Kim, and E. Spiller, "Transmission microscopy of unmodified biological materials: comparative radiation dosages with electrons and ultrasoft x-ray photons," Ultramicroscopy, vol. 2, p. 337, 1977.
[88] M. Kado, "Presentation "Intense laser-plasma soft-X-ray sources and application for biological X-ray microscopy"," in ASHULA, Lonavala, India, 2015.
[89] J. D. Watson, and F. H. C. Crick, "Molecular structure of Nucleic Acids," Nature, vol. 171, p. 737, 1953.
[90] H. Fischer, I. Polikarpov, and A. F. Craievich, "Average protein density is a molecular-weight-dependent function," Protein Science, vol. 13, no. 10, p. 2825, 2004.
[91] X. Xu, "University of Nebraska-Lincoln," [Online]. Available: https://xiaoshanxu.unl.edu. [Accessed July 2020].
[92] M. Zhang, J. Chen, Z. Che, J. Lu, Z. Zhong, L. Yang, and H. Zhao, "Determination of thermal conductivities of biological tissue protein," in 2010 3rd International Conference on Biomedical Engineering and Informatics, Yantai, 2010.
[93] P. H. Yang, and J. A. Rupley, "Protein--water interactions. Heat capacity of the lysozyme--water system," Biochemistry, vol. 18, no. 12, p. 2654, 1979.
[94] R. A. London, M. D. Rosen, and J. E. Trebes, "Wavelength choice for soft x-ray laser holography of biological samples," Applied Optics, vol. 28, no. 15, p. 3397, 1989.
[95] B. Denker, and E. Shklovsky, Handbook of solid-state lasers: Materials, systems, and applications, Oxford, Cambridge, Philadelphia, New Dehli: Woodhead Publishing Limited, 2013, p. 581.
[96] M. G. Ayele, P. W. Wachulak, J. Czwartos, D. Adjei, A. Bartnik, Ł. Wegrzynski, M. Szczurek, L. Pina, and H. Fiedorowicz, "Development and characterization of a laser-plasma soft X-ray source for contact microscopy," Nuclear Instruments and Methods in Physics Research B, vol. 411, p. 35, 2017.
243
[97] T. W. Ford, A. D. Stead, R. A. Cotton, "Soft x-ray contact microscopy of biological materials," Electron Microscopy Reviews, vol. 4, no. 2, p. 269, 1991.
[98] M. Kado, H. Daido, Y. Yamamoto, K. Shinohara, and M. C. Richardson, "Development of a laser plasma x-ray microscope to observe live hydrated biological specimens," Laser Phys. Lett., vol. 3, no. 4, pp. 205-207, 2006.
[99] H. Fiedorowicz, A. Bartnik, and Z. Patron, "X-ray emission from laser-irradiated gas puff targets," Appl. Phys. Lett., vol. 62, p. 2778, 1993.
[100] T. Majima, "Soft X-ray imaging of living cells in water: flash contact soft X-ray microscope," Trends in Analytical Chemistry, vol. 23, no. 7, p. 520, 2004.
[101] P. Albertano, L. Reale, L. Palladino, A. Reale, R. Cotton, S. Bollanti, P. Di Lazzaro, F. Flora, N. Lisi, A. Nottola, K. Vigli Papadaki, T. Letardi, D. Batani, A. Conti, M. Moret, and A. Grilli, "X-ray contact microscopy using an excimer laser plasma source with different target materials and laser pulse durations," Journal of Microscopy, vol. 187, no. 2, p. 96, 1997.
[102] M. Müller, T. Mey, J. Niemeyer, M. Lorenz, and K. Mann, "Table-top soft X-ray microscopy with a laser-induced plasma source based on a pulsed gas-jet," AIP Conference Proceedings, vol. 1764, no. 030003, p. 1, 2016.
[103] P. A. C. Jansson, U. Vogt, and H. M. Hertz, "Liquid-nitrogen-jet laser-plasma source for compact soft x-ray microscopy," Review of Scientific Instruments, vol. 76, no. 043503, 2005.
[104] P. A. C. Takman, H. Stollberg, G. A. Johansson, A. Holmberg, M. Lindblom, and H. M. Hertz, "High-resolution compact X-ray microscopy," Journal of Microscopy, vol. 226, p. 175, 2007.
[105] M. Kado, M. Ishino, S. Tamotsu, K. Yasuda, M. Kishimoto, M. Nishikino, Y. Kinjo, and K. Shinohara, "Observation of Organelles in Leydig Cells by Contact Soft X-Ray Microscopy with a Laser Plasma X-Ray Source," AIP Conference Proceedings, vol. 1365, p. 391, 2011.
[106] M. Müller, T. Mey, J. Niemeyer, and K. Mann, "Table-top soft x-ray microscope using laser-induced plasma from a pulsed gas jet," Optics Express, vol. 22, no. 19, p. 23489, 2014.
[107] P. W. Wachulak, A. Torrisi, W. Krauze, A. Bartnik, J. Kostecki, M. Maisano, A. M. Sciortino, and H. Fiedorowicz, "A "water window" tomography based on a laser-plasma double-stream gas-puff target soft X-ray source," Applied Physics B, vol. 125, no. 70, 2019.
[108] T. Tamura, G. Arai, Y. Kondo, H. Hara, T. Hatano, T. Ejima, W. Jiang, C. Suzuki, G. O’Sullivan, and T. Higashiguchi, "Selection of target elements for laser-produced plasma soft x-ray sorces," Optics Letters, vol. 43, no. 9, p. 2042, 2018.
[109] S. J. Haney, K. W. Berger, G. D. Kubiak, P. D. Rockett, and J. Hunter, "Prototype high-speed tape target transport for a laser plasma soft-x-ray projection lithography source," Applied Optics, vol. 32, no. 34, p. 6934, 1993.
244
[110] M. M. Murnane and H. C. Kapteyn, "Generation of efficient ultrafast laser-plasma x-ray sources," Physics of Fluids B: Plasma Physics, vol. 3, p. 2409, 1991.
[111] K. S. Chon, Y. Namba, and K.-H. Yoon, "Optimization of a Wolter type I mirror for a soft X-ray microscope," Precision Engineering, vol. 30, p. 223, 2006.
[112] K. Murakami, T. Oshino, H. Nakamura, M. Ohtani, and H. Nagata, "Schwarzschild microscope for carbon K alpha radiation," Applied Optics, vol. 32, no. 34, p. 7057, 1993.
[113] H. Kumagai, Y. Tanaka, M. Murata, Y. Masuda, and T. Shinagawa, "Novel TiO2/ZnO multilayer mirrors at "water-window" wavelengths fabricated by atomic layer epitaxy," Journal of Physics: Condensed Matter, vol. 22, no. 474008, 2010.
[114] P. Fischer, "Viewing spin structures with soft X-ray microscopy," Materials today, vol. 13, no. 9, 2010.
[115] C. Chang and A. Sakdinawat, "Ultra-high aspect ratio high-resolution nanofabrication for hard X-ray diffractive optics," nature communications, vol. 5:4243, 2014.
[116] W. Chao, J. Kim, S. Rekawa, P. Fischer, and E. H. Anderson, "Demonstration of 12 nm Resolution Fresnel Zone Plate Lens based Soft X-ray Microscopy," Optics Express, vol. 17, no. 20, p. 17669, 2009.
[117] E. H. Anderson, D. L. Olynick, B. Harteneck, E. Veklerov, G. Denbeaux, W. Chao, A. Lucero, L. Johnson, and D. Attwood, "Nanofabrication and diffractive optics for high-resolution x-ray applications," Journal of Vacuum Science and Technology, vol. 18, no. 6, p. 2970, 2000.
[118] J. Reinspach, M. Lindblom, M. Bertilson, O. von Hofsten, H. M. Hertz, and A. Holmberg, "13 nm high-efficiency nickel-germanium soft x-ray zone plates," Journal of Vacuum Science and Technology, vol. 29, no. 1, p. 011012, 2011.
[119] J. Kirz, "Phase zone plates for x rays and the extreme uv," Journal of the optical society of america, vol. 64, no. 3, 1974.
[120] M. C. Bertilson, P. A. C. Takman, A. Holmberg, U. Vogt, and H. M. Hertz, "Laboratory arrangement for soft x-ray zone plate efficiency measurements," Review of scientific instruments, vol. 78, p. 026103, 2007.
[121] M. C. Weisskopf, S. L. O'Dell, and R. F. Elsner, "Advanced X-ray Astrophysics Facility AXAF - an overview," SPIE, vol. 2515, no. 312, p. 312, 1995.
[122] "Chandra X-ray Observatory," NASA, [Online]. Available: https://chandra.harvard.edu/about/specs.html. [Accessed June 2020].
[123] H. Wolter, "Spiegelsysteme streifenden Einfalls als abbildende Optiken für Röntgenstrahlen," Annalen der Physik, vol. 445, no. 286, 1952.
[124] R. Giaconi and B. Rossi,, "A "telescope" for soft X-ray astronomy," Journal of Geophysical Research, vol. 65, p. 773, 1960.
[125] K. Nariai, "Geometrical aberration of a generalized Wolter type I telescope," Applied Optics, vol. 26, no. 20, p. 4428, 1987.
245
[126] J. D. Mangus, and J. H. Underwood, "Optical Design of a Glancing Incidence X-ray Telescope," Applied Optics, vol. 8, no. 1, p. 95, 1969.
[127] W. Werner, "Imaging properties of Wolter I type x-ray telescopes," Applied Optics, vol. 16, no. 3, p. 764, 1977.
[128] T. T. Saha, "Transverse ray aberrations for paraboloid-hyperboloid telescopes," Applied Optics, vol. 24, no. 12, p. 1856, 1985.
[129] L. P. Van Speybroeck, and R. C. Chase, "Design Parameters of Paraboloid-Hyperboloid Telescopes for X-ray Astronomy," Applied Optics, vol. 11, no. 2, p. 440, 1972.
[130] B. Mu, H. Liu, H. Jin, X. Yang, F. Wang, W. Li, H. Chen, and Z. Wang, "Optimization of geometrical design of nested conical Wolter-I X-ray telescope," Chinese Optics Letters, vol. 10, no. 10, p. 103401, 2012.
[131] S. Namba, Y. Iwamoto, Y. Asano, T. Shugyo, K. Fukuyama, N. Ikoma, H. Okuno, N. Tamura, and T. Endo, "High-density cascade arc plasma sources for application to plasma windows for virtual vacuum interfaces," Physics of Plasmas, vol. 25, no. 11, p. 113511, 2018.
[132] M. Kaufmann, Plasmaphysik und Fusionsforschung, 2nd Edition ed., Wiesbaden: Springer Spektrum, 2013.
[133] "Max-Planck-Institut für Plasmaphysik," [Online]. Available: https://www.ipp.mpg.de. [Accessed August 2020].
[134] A. W. Miziolek, V. Palleschi, and I. Schechter, Laser Induced Breakdown Spectroscopy., New York: Cambridge University Press, 2006.
[135] "HITACHI: What is Laser Induced Breakdown Spectroscopy (LIBS)?," [Online]. Available: https://hha.hitachi-hightech.com/. [Accessed August 2020].
[136] SHARP, "Plasmacluster Ion Generator (Patent No. 3680121)," [Online]. Available: https://jp.sharp/products/living/pcig/en/prod01/. [Accessed August 2020].
[137] "NASA, NASA Science, and NASA Earth Data," [Online]. Available: https://www.nasa.gov. [Accessed August 2020].
[138] B. H. Bransden and C. J. Joachain, Physics of Atoms and Molecules, Prentice Hall, 2003.
[139] W. Lochte-Holtgreven, Plasma Diagnostics, AIP Press, 1995. [140] S. Chandrasekhar, Radiative Transfer, Clarendon Press, 1950. [141] A. Unsöld, Physik der Sternatmosphären, Springer-Verlag, 1955. [142] H. R. Griem, Plasma Spectroscopy, McGraw-Hill Book Company, 1964. [143] L. Landau, "On the Vibrations of the Electronic Plasma," Journal of Physics, vol. X,
no. 1, p. 25, 1946. [144] J. Richter, "Radiation of Hot Gases," in Plasma Diagnostics, AIP Press, 1995. [145] T. Fujimoto, Plasma Spectroscopy, vol. International Series of Monographs on
Physics 123, Oxford: Clarendon Press and Oxford University Press, 2004.
246
[146] J. C. Slater, "Atomic Shielding Constants," Physical Review, vol. 36, p. 57, 1930. [147] R. Kaufmann, "Chapter 3: X-ray Radiatino from Laser Plasma," in Physics of Laser
Plasma, a. S. W. A. Rubenchik, Ed., Amsterdam, 1991. [148] H. Ohashi, T. Higashiguchi, Y. Suzuki, G. Arai, Y. Otani, T. Yatagai, B. Li, P. Dunne,
G. O'Sullivan, W. Jiang, A. Endo, H. A. Sakaue, D. Kato, I. Murakami, N. Tamura, S. Sudo, F. Koike, and C. Suzuki, ""Erratum: "Quasi-Moseley's law for strong narrow bandwith soft x-ray sources containing higher charge-state ions" [Appl. Phys. Lett. 104, 234107 (2014)]"," Applied Physics Letters, vol. 106, no. 169903, 2015.
[149] D. Kilbane, "Transition wavelengths and unresolved transition array statistics of ions with Z = 72-89," Journal of Physics B: Atomic, Molecular and Optical Physics, vol. 44, no. 16, p. 165006, 2011.
[150] Y. Katsukawa, "National Astronomical Observatory of Japan (NAOJ): Public Relations Center," [Online]. Available: prc.nao.ac.jp. [Accessed July 2020].
[151] D. R. Bates, A. E. Kingston, and R. W. P. McWhirter, Proc. Roy. Soc. Ser., vol. A267/A270, p. 297/155, 1962.
[152] H. R. Griem, Phys. Rev., vol. 131, p. 1170, 1963. [153] R. Wilson, Quant. Spectr. Radiative Transfer, vol. 2, p. 477, 1962. [154] J. W. Shearer, "Effect of Oblique Incidence on Optical Absorption of Laser Light by
a Plasma," The Physics of Fluids, vol. 14, p. 183, 1971. [155] K. Nishihara et al, "Plasma physics and radiation hydrodynamics in developing an
extreme ultraviolet light source for lithography," Physics of Plasmas, vol. 15, no. 056708, 2008.
[156] B. E. A. Saleh and M. C. Teich, Fundamentals of Photonics, Wiley, 2007. [157] F. Pedrotti, L. Pedrotti, W. Bausch, H. Schmidt, Optik für Ingenieure (amer. original
title: Introduction to Optics), 3rd ed., Heidelberg: Springer Verlag, 2002. [158] N. Stockhausen, Signalverarbeitung (transl. "signal processing"), Munich, 2007. [159] R. C. Rumpf, "UTEB M-Lab (CEM lectures)," [Online]. Available:
http://emlab.utep.edu. [Accessed June 2020]. [160] O. Klein, and Y. Nishina, "Über die Streuung von Strahlung durch freie Electronen
nach der neuen relativistischen Quantendynamik von Dirac," Z. Phys., vol. 52, no. 11-12, p. 853, 1929.
[161] A. J. Cox, "An experiment to measure Mie and Rayleigh total scattering cross sections," American Journal of Physics, vol. 70, no. 6, p. 620, 2002.
[162] T. E. M. K. a. K. S. M. Kishimoto, "Soft x-ray light source, exposure tool, and microscope". Patent PCT/JP2017/12554, 28 March 2017.
[163] "Institute of Laser Engineering Osaka University," [Online]. Available: https://www.ile.osaka-u.ac.jp. [Accessed July 2020].
247
[164] N. Nakano, H. Kuroda, T. Kita, and T. Harada, "Development of a flat-field grazing-incidence XUV spectrometer and its application in picosecond XUV spectroscopy," Applied Optics, vol. 23, no. 14, p. 2386, 1984.
[165] A. Bar-Shalom, J. Oreg, and M. Klapisch, "Non-LTE superconfiguration collisional radiative model," Journal of Quantitative Spectroscopy and Radiative Transfer, vol. 58, no. 4-6, p. 427, 1997.
[166] M. F. Gu, "The flexible atomic code," Canadian Journal of Physics, vol. 86, p. 675, 2008.
[167] A. Sunahara, K. Nishihara, and A. Sasaki, "Optimization of Extreme Ultra-Violet Emission from Laser-produced Tin Plasmas Based on Radiation Hydrodynamic Simulations," Plasma Fusion Res., vol. Rapid Commun. 1, p. 001, 2006.
[168] A. Sunahara, T. Asahina, H. Nagatomo, R. Hanayama, H. Tanaka, K. Mima, Y. Kato, and S. Nakai, "Efficient Laser Acceleration of Deuteron Ions Through Optimization of Pre-plasma Formation for Neutron Source Development," Plasma Physics and Controlled Fusion , vol. 61, no. 2, 2019.
[169] M. Odagiri, "レーザープラズマからの高輝度 X 線放射に関する研究 ," Hiroshima University, 2018.
[170] N. Kakunaka, "レーザー生成金プラズマからの軟 X 線発生の高出力化に関す
る研究," Hiroshima University, 2019.
[171] Y. Ralchenko, "National Institute of Standards and Technology - Spectral Data Base," [Online]. Available: https://www.nist.gov/pml/atomic-spectra-database. [Accessed 2018].
[172] "SESAME, the LANL equation of state database, Los Alamos National Laboratory, LA-UR-92-3407," 1992.
[173] L. Spitzer and R. Härm, "Transport Phenomena in a Completely Ionized Gas," Phys. Rev., vol. 89, p. 977, 1953.
[174] D. Salzmann, Atomic Physics in Hot Plasmas, New York: Oxford University Press, 1998.
[175] R. M. More, "Electronic energy-levels in dense plasmas," Journal of Quantitative Spectroscopy and Radiative Transfer, vol. 27, no. 3, p. 345, 1982.
[176] V. E. Fortov, and I. T. Iakubov, The Physics of Non-Ideal Plasma, World Scientific Pub Co Inc, 1998.
[177] S. Chapman, and T. G. Cowling, The Mathematical Theory of Non-Uniform Gases, London: Cambridge University Press, 1939.
[178] R. S. Cohen, L. Spitzer (Jr.), P. McR. Routly, "The Electrical Conductivity of an Ionized Gas*," Physical Review, vol. 80, no. 2, p. 230, 1950.
[179] D. Pines, and D. Bohm, "A Collective Description of Electron Interactions: II. Collective vs Individual Particle Aspecs of the Interactions," Physical Review, vol. 85, p. 338, 1952.
248
[180] S. Chandrasekhar, "Stochastic Problems in Physics and Astronomy," Reviews of Modern Physics, vol. 15, no. 1, 1943.
[181] S. Skupsky, ""Coulomb logarithm" for inverse-bremsstrahlung laser absorption," Physical Review A, vol. 36, no. 12, p. 5701, 1987.
[182] A. Sunahara, A. Saaski, and K. Nishihara, "Two Dimensional Radiation Hydrodynamic Simulation for Extreme Ultra-Violet Emission from Laser-produced Tin Plasmas," in IFSA2007, 2008.
[183] K. Honda, K. Mima, and F. Koike, "M-shell x-ray spectra of laser-produced gold plasmas," Physical Review E, vol. 55, no. 4, p. 4594, 1997.
[184] J. J. Yeh and L. Lindau, "Atomic subshell photoionization cross sections and asymmetry parameters: 1 ≤ Z ≤ 103," Atomic Data and Nuclear Data Tables, vol. 32, no. 1, 1985.
[185] M. Corsi, G. Cristoforetti, M. Hidalgo, D. Iriarte, S. Legnaioli, V. Palleschi, A. Salvetti, and E. Tognoni, "Effect of Laser-Induced Crater Depth in Laser-Induced Breakdown Spectroscopy Emission Features," Applied Spectroscopy, vol. 59, no. 7, p. 853, 2005.
[186] F. Eriksson, G. A. Johansson, H. M. Hertz, E. M. Gullikson, U. Kreissig, J. Birch, "14.5% near-normal incidence reflectance of Cr/Sc x-ray multilayer mirrors for the water window," Optics Letters, vol. 28, no. 24, p. 2494, 2003.
[187] B. L. Henke, E. M. Gullikson and J. C. Davis, "X-Ray Interactions: Photoabsorption, Scattering, Transmission, and Reflection at E = 50-30,000 eV, Z = 1-92," Atomic Data and Nucl. Data Tables, vol. 54, no. 181, 1993.
[188] B. Li, T. Higashiguchi, T. Otsuka, N. Yugami, P. Dunne, D. Kilbane, E. Sokell, and G. O'Sullivan, "Analysis of laser produced plasmas of gold," J. Phys. B: At. Mol. Opt. Phys., vol. 47, no. 075001, 2014.
[189] D. Colombant and G. F. Tonon, "X-ray emission in laser-produced plasmas," Journal of Applied Physics, vol. 44, p. 3524, 1973.
[190] D. G. Stearns, O. L. Landen, E. M. Campbell, and J. H. Scofield, "Generation of ultrashort x-ray pulses," Physical Review A, vol. 37, no. 5, p. 1684, 1988.
[191] D. W. Lindle, C. M. Truesdale, P. H. Kobrin, T. A. Ferrett, P. A. Heimann, U. Becker, H. G: Kerkhoff, and D. A. Shirley, "Nitrogen K-shell photoemission and Auger emission from N2 and NO," The Journal of Chemical Physics, vol. 81, p. 5375, 1984.
[192] M. O. Krause, "Atomic Radiative and Radiationless Yields for K and L Shells," Journal of Physical and Chemical Reference Data, vol. 8, p. 307, 1979.
[193] J. P. Cryan and R. N. Coffee, "Molecular frame Auger electron energy spectrum from N2," Journal of Physics B: Molecular Optical Physics, vol. 45, p. 055601, 2012.
[194] E. J. McGuire, "K-Shell Auger Transition Rates and Fluorescence Yields for Elements Be-Ar," The Physical Review, vol. 181 (second series), no. 1, 1969.
[195] Y. Itikawa, M. Hayashi, A. Ichimura, K. Onda, K. Sakimoto, K. Takayanagi, M. Nakamura, H. Nishimura, and T. Takayanagi, "Cross Sections for Collisions of
249
Electrons and Photons with Nitrogen Molecules," Journal of Physical and Chemical Reference Data, vol. 15, no. 985, 1986.
[196] Y.-K. Kim and J.-P. Desclaux, "Ionization of carbon, nitrogen, and oxygen by electron impact," Physical Review A, vol. 66, p. 012708, 2002.
[197] Y. Itikawa, "Cross Sections for Electron Collisions with Nitrogen Molecules," Japanese Physical Chemical Reference Data, vol. 35, no. 1, 2006.
[198] H. Shimoyama, "Hirophysics," [Online]. Available: http://hirophysics.com/nuclearparticle/memorandom/centrifugal-barrier.pdf. [Accessed July 2020].
[199] F. Sette, J. Stöhr, A. P. Hitchkock, "Determination of intramolecular bond lengths in gas phase molecules from K shell shape resonances," The Journal of chemical physics, vol. 81, p. 4906, 1984.
[200] J. M. Combes, P. Duclos, M. Klein, and R. Seiler, "The Shape Resonance," Communications in Mathematical Physics, vol. 110, p. 215, 1987.
[201] "Hamamatsu," Hamamatsu Photonics, [Online]. Available: https://www.hamamatsu.com/resources/pdf/ssd/s10747-0909_kmpd1117e.pdf. [Accessed July 2020].
[202] T. Maiman, "Stimulated Optical Radiation in Ruby," Nature, vol. 187, p. 494, 1960. [203] R. Paschottka, "RP Photonics Encyclopedia," [Online]. Available: https://www.rp-
photonics.com. [Accessed 26 May 2020]. [204] J. E. Geusic, H. M. Marcos, and L. G. Van Uitert, "Laser Oscillations in Nd-doped
Yttrium Aluminium, Yttrium Gallium and Gadolinium Garnets," Applied Physics Letters, vol. 4, p. 182, 1964.
[205] D. L. Sipes, "Highly efficient neodymium: yttrium aluminum garnet laser end pumped by a semiconductor laser array," Applied Physics Letters, vol. 47, p. 74, 1985.
[206] O. Heuzé, "General form of t he Mie-Grüneisen equation of state," Comptes Rendus Mecanique, vol. 340, p. 679, 2012.
[207] L. D. Landau, and E. M. Lifshitz, Quantum Mechanics: Non-relativistic Theory, Second edition, revised and enlarged ed., vol. Volume 3 of Course of Theoretical Physics, Oxford London Edinburgh New York Paris Frankfurt: Pergamon Press, 1959.
[208] R. M. More, K. H. Warren, D. A. Young, and G. B. Zimmerman, "A new quotidian euqation state (QEOS) for hot dense matter," Physics of Fluids, vol. 31, p. 3059, 1988.
[209] D. G. Rabus, Optofluidics Systems Technology, Berlin/boston: Walter de Gruyter GmbH, 2014.
[210] 安藤剛三, "平面結像型斜入射分光写真器の製作," 分光研究, vol. 38, no. 6, p. 432, 1989.
[211] "Opto Diode," Opto Diode Corp., [Online]. Available: https://optodiode.com. [Accessed 2020].
250
[212] "Photodetectors from EOT," Electro-Optics Technology Inc., [Online]. Available: www.eotech.com. [Accessed 2020].
[213] L. Shi, S. Nihtianov, F. Scholze, A. Gottwald, and L. K. Nanver, "High-Sensitivity High-Stability Silicon Photodiodes for DUV, VUV and EUV Spectral Ranges," Proc. of SPIE: UV, X-Ray, and Gamma-Ray Space Instrumentation for Astronomy XVII, vol. 8145, no. 81450N, 2011.
[214] K. Kim, S. Yoon, M. Seo, S. Lee, H. Cho, M. Meyyappan, and C.-K. Baek, "Whispering gallery modes enhance the near-infrared photoresponse of hourglass-shaped silicon nanowire photodiodes," Nature Electronics, vol. 2, p. 572, 2019.
[215] T.-H. Dinh, Y. Kondo, T. Tamura, Y. Ono, G. Arai, H. Oikawa, S. Ohta, K. Kitano, T. Ejima, T. Hatano, and T. Higashiguchi, "Diffraction efficiency of a 2400-lines/mm flat-field grating for spectroscopy of highly charged ion plasma emission in soft x-ray spectral region from 1 to 10 nm," Phot. Fact. Act. Rep., vol. 2015, no. 33 B, 2016.
[216] J. Park, G. V. Brown, M. B. Schneider, H. A. Baldis, P. Beiersdorfer, K. V. Cone,R. L. Kelley, C. A. Kilbourne, E. W. Magee, M. J. May, and F. S. Porter, "Calibration of a flat field soft x-ray grating spectrometer for laser produced plasmas," Review of scientific instruments, vol. 81, pp. 10E319-1, 2010.
[217] Andor, Datasheet: Andor iKon-M/L SO Series, Oxford Instruments. [218] T. Morishita, "レーザー生成プラズマからの X 線計測用結晶分光器の開発,"
Hiroshima University, 2019. [219] F. G. Smith, T. A. King, and D. Wilkins, Optics and Photonics, 2nd ed., West Sussex:
Wiley, 2007. [220] HORIBA, "Horiba," HORIBA, [Online]. Available:
https://www.horiba.com/en_en/bandpass-resolution/. [Accessed June 2020]. [221] A. Brunet, "Annaël BRUNET, Researcher/Data scientist in BioPhysics," [Online].
Available: https://abrunet.com. [Accessed June 2020]. [222] E. Lander, R. Weinberg, T. Jacks, H. Sive, G. Walker, P. Chisholm, M. Mischke,
"MIT open courseware," Massachusetts Institute of Technology, [Online]. Available: https://ocw.mit.edu/courses/biology/. [Accessed March 2020].
[223] "Los Alamos National Laboratory," [Online]. Available: https://periodic.lanl.gov/79.shtml. [Accessed September 2020].
[224] N. Estrada, "Thinglink," [Online]. Available: https://www.thinglink.com/. [Accessed September 2020].
[225] M. Zürch, R. Jung, C. Späth, J. Tümmler, A. Guggenmos, D. Attwood, U. Kleineberg, H. Stiel, and C. Spielmann, "Transverse Coherence Limited Coherent Diffraction Imaging using a Molybdenum Soft X-ray Laser Pumped at Moderate Pump Energies," Scientific Reports, vol. 7, no. 5314, 2017.
[226] J. Miao, T. Ishikawa, E. H. Anderson, K. O. Hodgson, "Phase retrieval of diffraction patterns from noncrystalline samples using the oversampling method," Physical Review B, vol. 67, p. 174104, 2003.
251
[227] Y. Liu, Y. Wang, M. A. Larotonda, B. M. Luther, J. J. Rocca, and D. T. Attwood, "Spatial coherence measurements of a 13.2 nm transient nickel-like cadmium soft X-ray laser pumped at grazing incidence," Optics Express, vol. 14, no. 26, p. 12872, 2006.
[228] P. Lu, E. Fill, Y. Li, J. Maruhn, and G. Pretzler, "Spatial coherence of prepulse-induced neonlike x-ray lasers," Physical Review A, vol. 58, no. 1, p. 628, 1998.
[229] A. Lucianetti, K. A. Janulewicz, R. Kroemer, G.Priebe, J. Tümmler, W. Sandner, P. V. Nickles, and V. I. Redkorechev, "Transverse spatial coherence of a transient nickellike silver soft-x-ray laser pumped by a single picosecond laser pulse," Optics Letters, vol. 29, no. 8, p. 881, 2004.
[230] Y. Wang, M. A. Larotonda, B. M. Luther, D. Alessi, M. Berrill, V. N. Shlyaptsev, and J. J. Rocca, "Demonstration of high-repitition rate tabletop soft-x-ray lasers with saturation output at wavelengths down to 13.9 nm and gain down to 10.9 nm," Physical Review A, vol. 72, p. 053807, 2005.
[231] G. Schröder and H. Treiber, Technische Optik Grundlagen und Anwendungen, 10th ed., Vogel Buchverlag, 2007.
[232] Coherent Inc., [Online]. Available: https://www.coherent.com/assets/pdf/Technical-Bulletin-Chirped-Pulses-and-the-Meaning-of-Fourier-Transform-Limited.pdf. [Accessed June 2020].
[233] D. Strickland and G. Mourou, "Compression of Amplified Chriped Optical Pulses," Optics Communications, vol. 56, no. 3, 1985.
[234] K. Padmaraju, "Rochester University," [Online]. Available: https://www.pas.rochester.edu. [Accessed 26 May 2020].
[235] GUV-V B 2: Unfallverhütungsvorschrift Laserstrahlung, Gesetzliche Unfallversicherung, 1997.
[236] N. Bartlett, "Relativistic Effects and the Chemistry of Gold*," Gold Bulletin, vol. 31, no. 1, p. 22, 1998.

252

253
INDEX
A
Abbe sine condition
46
Aberrations 47, 226 Ablation 18, 26,
185 Absorption 32, 81,
106 Absorption depth 203 Absorption K-edge 1, 95 Abundance of ionic charge states
64
Adiabatic condition 100 Air purification 50 Airy disk 84 Alignment of spectrometer
200
Ampere’s law 85 Angular distribution
184
Atomic scattering factors
81, 212
Auger process 127 Autoionization 115 Average charge state
184
B
Band structure 9 Beam parameter product
216
Bessel function 84 Blackbody radiation
55
Blazed grating 195 Bohr model (gold) 211 Boltzmann distribution
55
Bremsstrahlung 108 Born approximation
139
Brilliance 4
C
Calibration 155, 169, 188, 196
Calorimeter 144
CCD camera 133 Cellular structures 207 Centrifugal potential
130
Citric acid cycle 208 Coherence 212 Collision frequency 24 Collisional absorption
74
Collisional processes
115
Collisional- radiative model
113
Coma 47 Complex exponential function
86
Compton scattering 89 Condensation reaction
207
Contact-method microscope
3
Contamination 165, 203 Continuity equation 100 Contour-plot method
148, 175
Conversion efficiency
20, 76
Corona equation 71 Corona model 68 Coulomb collision 57 Coulomb logarithm 105 Coulomb’s law 85 Critical density 75 Crookes tube 5 Cross section 109, 116,
130, 211
D
Dark current 161 Debye-length 57, 103 Deexcitation 115 Degree of freedom 101 Depth of focus 43 Detonation velocity 73 Diffraction blurring 3 Diffraction efficiency
164
Diffractive optics 41 Discharge 70 Dispersion 82, 196 DNA 30 Dose 29
E
Einstein coefficients
109
Electron capture 115 Electron configuration chart (gold)
211
Electron density 77 Electron system (gold)
211
Electron temperature
20, 78
Electron- encounters
102
Electron-gun 13 Emission coefficients
60
Energy levels 10, 59, 128, 134
Entropy 137 Equation of state 136 Etendue 217 Euler’s formula 86 Excited state 58, 108,
113
F
Faraday rotator 223 Faraday’s law 85 Fermat’s principle 81 Fermi-energy 53 Flange ports 227 Flatfield grating 194 Flatness 171 Fluid description of the plasma
100
Fluorescence 5, 37, 128, 134
F-number 220 Fokker-Planck diffusion equation
104
Fraunhofer diffraction
84
Free mean path 58, 88 Fresnel diffraction 84 Fresnel reflection 229 Fresnel-Kirchhoff diffraction integral
85
Fusion targets 25 FWHM 106, 216
254
G
Gaussian beams 106, 214 Gouy-phase 215 Grating equation 85 Ground state 91, 133
H
Huygens’ principle 92 Hyperbolic mirror 45
I
Ideal gas law 124 Imaging law 219 Imaging quality 209 Imaging spectroscopy
146
Imaging-type microscope
3
Impact excitation 115 Impact ionization 115, 125 Impact parameter 102, 105 Index of refraction 81 Induced emission 109 Infrared conversion 227 Inglis-Teller relationship
62
Intracavity pulse train
222
Inverse Bremsstrahlung
108
Ionic stages 161, 185 Ionization energies 123, 230
K
Kirchhoff’s law 55 Kramers-Kronig relations
81
L
Lagrange formalism
92
Lambert-Beer’s law
124
Laser principle 133 Laser plasma X-ray 17 Laser resonator 143 Laser safety table 232 Laser spot size 220 Laser-induced breakdown spectroscopy
50
Left-hand rule, Fleming’s
226
Lens maker’s formula
82
Lewis dot structure (gold)
211
Line broadening 62, 110 Longitudinal wave 87, 213 Lorentz force 16 Lorentzian profile 111 Lorentz transformation
92
Loss effects 78 LTE-model 68
M
Maxwell-Euler equations
139
Maxwell velocity distribution
55
Mie-Grüneisen EOS
136
Milne relation 60 Mirror equations 198 Modulation transfer function
209
Moseley’s law 63
N
Nanowires 7 Natural plasmas 51 Nested mirrors 47 Newtonian equation of motion
75
Nuclear fusion 49 Nucleosynthesis 49 Numerical Aperture
218
Nyquist-Shannon sampling theorem
209
O
Oblique spherical aberration
47
Opacity 66, 109 Optical breakdown 72 Optical delay system
225
Optical thickness 56, 67 Oscillator strength 60, 71,
116 Oscilloscope 159
P Parabolic mirror 45 Paraxial approximation
84
Penumbral blurring 3 Periodic table 235 Photodetector 153, 155 Photo- accumulation
158
Photo-excitation 108 Photo-ionization 108 Photometric law 217 Physical constants 234 Pinch plasma 10 Pinhole imaging 177, 203 Planck mean opacity
67
Planck’s law 55 Plasma applications 48 Plasma emission 18 Plasma expansion 73, 152 Plasma states 53, 91 Plasma window 48 Pockels cell 135, 143,
222 Poisson’s equation 138 Polarization 77, 222 Potential barrier 130 Poynting vector 86 Pumping system 145
Q
Q-switch 135 Quantum efficiency 161, 167 Quasi steady-state 114
R
Radiated power 88 Radiation pressure 89 Radiative decay 108 Radiative processes (ff, bf/fb, bb)
59, 108
Radiative recombination
108
Radiative transfer 111 Rate coefficients 12, 58,
69, 114, 116
Rayleigh length 218 Rayleigh scattering 89 Ray-tracing 108 Recombination scheme
28
255
Reflective optics 44 Reflectivity (gold) 163 Regenerative amplifier
222
Repetition rate v, 6, 10, 13
Resolving power 195 Resonance absorption
76
Rosseland mean opacity
67
Rowland’s circle 192
S
Sagittal curvature 148 Saha ionization equation
55
Saha-Boltzmann equation
55
Scale length 77, 185 Scattering 57, 81,
88, 139 Schrödinger equation
91
Screened hydrogen model
99
Self-absorption 24, 146, 187
Series expansions 232 SESAME equation of state
100
Shape resonance 130 Signal-to-noise ratio
30
Slater’s screening constants
231
Small signal gain 134 Snell’s law 77 Soft X-rays 1 Spatial resolution 30 Specimen model 31 Spectral bandpass 197 Spectral calibration 98 Spectrograph 191 Spectroscopic notation
90
Spherical aberration
47
Spitzer-Härm diffusion
101
Spontaneous emission
109
Star2D simulation box
107
Stark broadening 111 Statistical weight 91 SXRM comparison 40 Synchronization 224 Synchrotron radiation
15
T
Tangential curvature
148
Target (gold) 145 Telescope types 47 Temporal resolution
208
Thermal energy 53 Thermal expansion velocity
101, 178
Thermodynamic equilibrium
54, 113
Thomson scattering 88 Thread sizes 228 Three-body recombination
115
Time-bandwidth products
223
Time-error (DG535)
225
Toroidal mirror 147 Torque key 227 Transient collisional excitation scheme
27
Transition 10, 28, 59, 114
Transmission curves
2, 95, 118, 123, 150, 158, 167, 179
Transport coefficients
104
Transverse wave 87, 215
U
Unit conversions 209, 234 Unresolved transition array
63, 127, 160, 172
V
van Cittert-Zernike theorem
212
Vlasov equation 100
W
Water-window 2 Wavefront 215 Wavelength 78, 82 Waveplate 223 Wave equation 86 Wien’s displacement law
10
Work function 9
X
X-ray amplifier 26 X-ray detector 133, 153 X-ray enhancement 20, 117 X-ray tubes 5
Z
Zone plates 41


Related Documents