Window of Opportunity: socioeconomic consequences of demographic changes in Brazil. * Bernardo L. Queiroz [email protected] CEDEPLAR/UFMG Cassio M. Turra [email protected] CEDEPLAR-UFMG Preliminary Draft May 21, 2010 Abstract In the last few decades , Brazil has experienced major demographic changes. From a young age structure in the 1970, the population is gradually shifting to an older distribution. The transformation in the population age structure can have important impacts on economic growth. This paper estimates the demographic dividends in Brazil, and shows that demographic changes could have positive impacts on economic growth, but lack of investments in human capital and poor institution could lead to a slower growth than what could be expected from the population change. We also analyzed two components of the * This research is part of the project Macroeconomic Demography of Intergenerational Transfers. The project is a collaborative international effort supported by the NIA and IDRC Canada. More information at www.ntaccounts.org. 1

Window of Opportunity: socioeconomic consequences of ... · Window of Opportunity: socioeconomic consequences of demographic changes in Brazil.∗ Bernardo L. Queiroz [email protected]
Jan 28, 2019
Welcome message from author
This document is posted to help you gain knowledge. Please leave a comment to let me know what you think about it! Share it to your friends and learn new things together.
Transcript
Window of Opportunity: socioeconomic
consequences of demographic changes in
Brazil.∗
Bernardo L. Queiroz
[email protected]/UFMG
Cassio M. Turra
Preliminary Draft
May 21, 2010
Abstract
In the last few decades , Brazil has experienced major demographicchanges. From a young age structure in the 1970, the population isgradually shifting to an older distribution. The transformation in thepopulation age structure can have important impacts on economicgrowth. This paper estimates the demographic dividends in Brazil,and shows that demographic changes could have positive impacts oneconomic growth, but lack of investments in human capital and poorinstitution could lead to a slower growth than what could be expectedfrom the population change. We also analyzed two components of the
∗This research is part of the project Macroeconomic Demography of Intergenerational
Transfers. The project is a collaborative international effort supported by the NIA andIDRC Canada. More information at www.ntaccounts.org.
1

first demographic dividend: private and public. We observe that highpublic transfers to the elderly reduces the magnitude and duration ofthe fiscal dividend and could also harm the realization of the seconddividend.
2
1 Introduction
This paper analyzes the relationship between changes in population age struc-ture and economic growth in Brazil between 1970 and 2050. This paper buildson previous analyzes Queiroz, Turra, and Perez (2006). This version includesnew estimates of the life-cycle deficit following the NTA methodology andupdated population projections. We were also able to estimate dividends forthe public and private sector separately, and provide a brief analysis of theimpact of population changes on the public pension system.
While we know some facts about population growth and economic de-velopment, we know little about the interactions between population agestructure and changes in demographic variables on economic growth. Thetransformation in population age structure can have important impacts onthe economic growth, a phenomenon called demographic dividends. The risein the share of working age population and individual responses to popula-tion aging can lead to these dividends. We use income and consumption ageprofiles, in conjunction with population projections, to study the macroe-conomic consequences of population changes in Brazil. We estimate thedemographic dividends, analyzed the first and second dividend, provide analternative view by looking at public and private dividends and discuss thegap between observed economic growth and potential growth given by thedividends.
The consequences of changes in population age structure have regainedinterest in recent years (Cutler, Poterba, Sheiner, Summers, and Akerlof1990; Bloom, Canning, and Sevilla 2003; Lee 2003b). Demographers andeconomists alike are interested in examining the extent to which interactionsbetween population age structure and both fertility and mortality declinesyield economic development. First, several studies indicated the role of pop-ulation dynamics (age structure) on economic growth. For example, Bloomand Williamson (1997) showed that part of the Asian economic miracle wasexplained because the working-age population grew at faster rates than thedependent population from 1960 to 1995. They find that changes in pop-ulation age structure account to about one-third of the observed economicgrowth in Asia during that period. Second, the early 1990s brought a dif-ferent issue to demographers and economists in developed countries. Whatwould be the impacts of population aging in the developed world? Cutler,Poterba, Sheiner, Summers, and Akerlof (1990) investigated whether popu-lation aging is a challenge or an opportunity to economic development. They
3
showed that the changing age structure can bring benefits to the society fortwo reasons: lower dependency ratio means more resources to be invested inthe economy; and increase longevity affects working age population savingsbehavior creating positive effects on the income level.
The demographic dividend or demographic bonus has been recently pre-sented as a combination of two separate dividends (Mason and Lee Forth-coming). The first dividend is usually related to a temporary increase in theshare of the population that is of working age and can be effectively measuredby increases in the ratio of producers to consumers in the population (Mason2005). The second dividend, which has gone virtually unnoticed among mostscholars, comes in succession to the first dividend and is related to the cre-ation of wealth that arises in response to population aging. The magnitudeof this effect depends largely on how wealth is created (Mason 2005). Rapidcapital accumulation or larger transfers from younger generations, privateand public, can meet consumption demands of an increasing elderly popu-lation. Only in societies where capital-deepening prevails will the effects ofpopulation aging ultimately increase the output per effective consumer (Lee,Mason, and Miller 2003).
Unfortunately, the demographic dividends are not automatic and dependon institutions and policies to transform changes in population age struc-ture into economic growth (Bloom and Canning 2001; Bloom and Canning2004). For example, it is fundamental that the labor market creates enoughopportunities for the growing working age population, and that a developedfinancial market exists to fulfill individual’s willingness to save (Mason 2005).Therefore, it comes as no surprise that some emerging economies that couldbenefit substantially from the demographic transition are also the ones thatare more likely to fail in taking advantage of this process (Mason 2005).
Despite unabated interest among researchers in issues pertaining to macroe-conomic consequences of population aging in developed countries, little isknown about these issues in emerging economies. Brazil is one example ofan important context for elaborating linkages between economic and popu-lation changes that has not been fully examined yet. Brazil has been char-acterized by rapid demographic changes (de Carvalho and Wong 1999), suchas rapid fertility decline and improvements in life expectancy (Figure 1 ).From a young quasi-stable age distribution in 1970, the distribution hasbeen gradually shifting to an older one. This transition in age structure im-plies in rapid growth of the working age population until 2045, from whichthe first dividend arises (Wong and de Carvalho 2005). Indeed, in a recent
4
analysis, Rios-Neto (2004), using income data from Brazilian municipalities,shows that the association between working age population growth and in-come growth was positive and significant during the period 1991-2000. Yet,we expect that income growth would be greater if Brazil had stronger in-stitutions, macroeconomic stability and more appropriate policies in place.Unfortunately, there are strong forces promoting stagnation (Pritchett 1997).
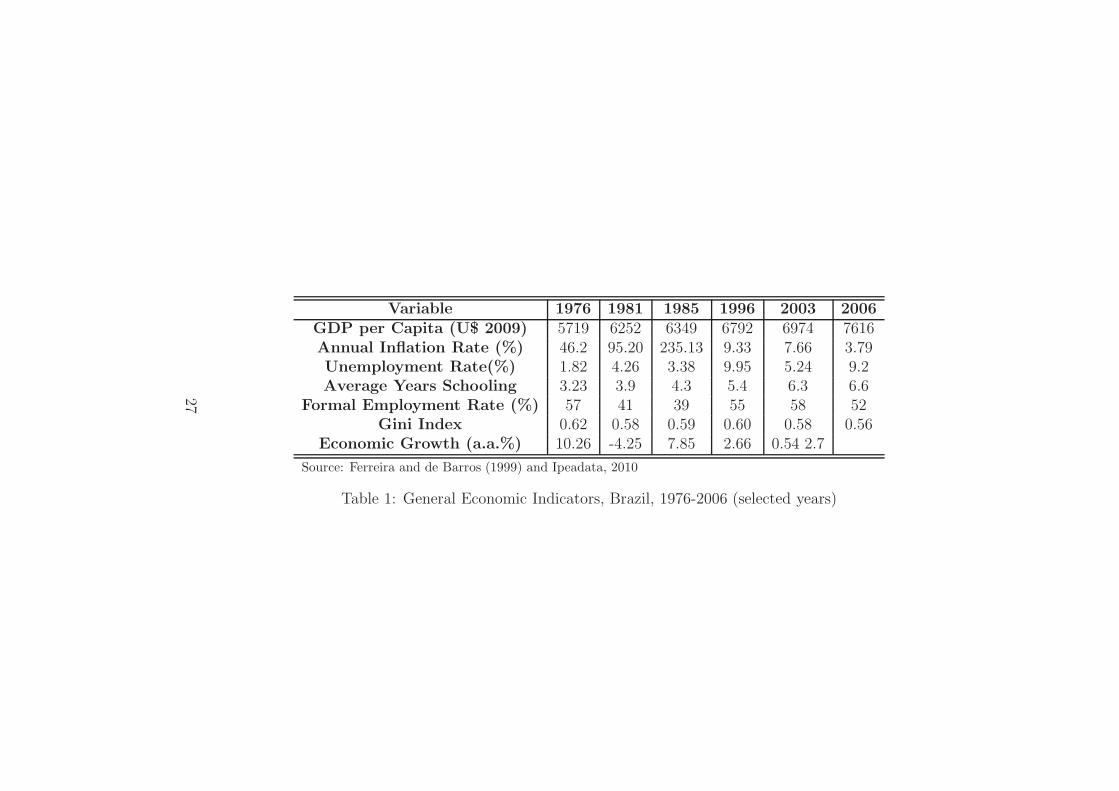
Since 1980 the economy has been stagnant, with an annual growth rateof 2,17%, compared to a strong average annual rate of 7,5% in 1950-1980.Indeed, the years between 1980 and 1993 were characterized by macroeco-nomic instability and successive attempts to combat high inflation rates. Itwas only in 1994 that a successful economic plan consolidated price stability.In recent years, several other factors have jeopardized economic growth andput at risk the demographic dividends. First, the rising ratios of public debtas a share of GDP (56% in 2002) have reduced the fiscal capability of thepublic sector to invest in human capital. At the same time, large publictransfers to the elderly that have been recently documented in Brazil (Turraand Rios-Neto 2001), may represent an extra burden for future working agepopulations, reducing the ability and willingness of workers to save for futureconsumption. Third, income inequality has been persistent over the past fewdecades. Brazil has a much higher Gini coefficient (0.56) than the averagecoefficient for Latin America (0.4), and despite some improvements in edu-cational attainment, educational levels remain remarkably low. Finally, thelabor market has not been able to absorb the growing working age popula-tion. During the last two decades unemployment and informality rates haveincreased (Table 1 ).
Despite the growing interest in this area, we are not aware of any studyaiming to quantify the demographic dividends and to explain possible rea-sons for the inability to exploit the dividends in Brazil. In an influentialstudy, de Carvalho and Wong (1999) pointed out the need for policy makersto respond ahead of time in order to benefit from increases in working agepopulation. Turra and Rios-Neto (2001) demonstrate that fiscal gains fromdemographic changes are transitory and may not last long given current pub-lic policies. (Turra and Queiroz 2009) show how the absence of appropriatepolicies mitigate temporary benefits of population change, and aggravate ad-verse effects of population aging, in the case of the Brazilian social securitysystem.
In this paper we show that almost 100% of the economic growth between1970 and 2010 in Brazil could be explained by the demographic dividends.
5
Our findings, however, suggest that most of this contribution was concen-trated in the 1970s; in the last two decades the economy has not takenadvantage of the demographic changes. We speculate that low investmentsin human capital and the lack of proper social and economic institutions areresponsible for jeopardizing the demographic dividends in the country.
2 Demographic Dividends
The first dividend arises and dissipates as changes in age structure interactwith the lifecycle of production and consumption (Mason 2005; Mason andLee Forthcoming). The first dividend is related to a temporary increase inthe share of the working age population and can be effectively measuredby increases in the ratio of producers to consumers in the population. Inthis sense, it measures increases in income due to the growth of working agepopulation. The first dividend is temporary and not always positive. Aspopulation ages and the share of the elderly grows faster than the workingage group, output growth will be depressed.
The first dividend might generate positive impacts to the family andgovernment. Families benefit from having more adults able to receive incomeand less individuals depending on transfers, and the government benefits froma increase in the pool of tax payers and smaller number of beneficiaries ofpublic transfers. We follow (Bixby and Robles 2008) and estimate privateand public dividends, as part of the first dividend. We also estimate separatedividends from public education and public pension systems 1. The private(familial) first dividend is estimated by increases in the household supportratio, that is given by the variation in the rate of household producers lessthe variation in the beneficiaries of private inter-vivos transfers. The publicdividend is given by the changes in the ratio between effective tax payersand effective beneficiaries from public transfers. We also estimate separatedividends from education and social security, as components of the totalpublic first dividend.
The second dividend comes in succession to the first dividend and isrelated to the creation of wealth that arises in response to population aging(Mason and Lee Forthcoming; Mason 2005). With rising elderly population,
1They are the most important public transfer programs in Brazil, have important im-pact of general well-being and are heavily affected by changes in population age structure.We discuss in more detail the characteristics of the public programs below.
6
consumption in the future can only be maintained by accumulating capitalor transfer wealth (Lee 1994). The accumulation of capital also influenceseconomic growth, whereas transfers do not. It is important to note, however,that accumulation of capital does not need to be as high as when workingage population is growing at rapid rates. Since there are fewer number ofeffective producers, the amount of capital necessary to keep capital-laborratio constant is reduced.
We follow Mason and Lee (Forthcoming) to formalize the demographicdividends. According to the authors, output per effective consumer can beexpressed by Equation 1:
Yt
Nt
=Lt
Nt
∗
Yt
Lt
(1)
where Yt is the total output, Nt is the effective number of producers, andLt is the effective number of consumers. The effective number of producers isthe population weighted by the age income profile, and the effective number ofconsumers is the population weighted by the age consumption profile (Cutler,Poterba, Sheiner, Summers, and Akerlof 1990; Mason 2005). The supportratio is given by the ratio of effective producers (Nt) to the number of effectiveconsumers (Lt).
By taking the natural log of both sides of Equation 1 and deriving itin respect to time, Mason and Lee (Forthcoming) obtain rates of growth(Equation 2):
yt = Lt − Nt + yl
t(2)
Therefore, the rate of growth in output per effective consumer is equalto the sum of two components. The first component, given by the differencebetween the growth in the number of effective producers and growth in thenumber of effective consumers (i.e. the rate of growth of the support ratio), isthe first dividend. The second component - the rate of growth of productivityreflects increases in the ratio of capital-labor and therefore, represents thesecond dividend. Mason (2005) shows that the rate of growth of productivityis proportional to the ratio of capital to labor income when both capital andtransfer wealth grow at the same rate (i.e. when there are no changes inintergenerational transfer policy). Given that the accumulation of wealth inyear t for the cohort born in year b=t-a or earlier is defined by the differencebetween the present value of future lifetime consumption and future lifetime
7
production (Equation 3):
W (<= b, t) = C(t)PV C <= b, t) − Y l(t)PV L(<= b, t) (3)
the ratio of capital to labor income can be easily estimated by dividing theexpression above by labor income and manipulating algebraically its terms,so that (Equation 4)(Mason 2005):
w(<= b, t) = [c(t)/yl(t)]PV C(<= b, t)/L(t)ePV L(<= b, t)/L(t) (4)
The second dividend is different the first in one main point: it is nottransitory since capital deepening has permanent effect on income. However,they share an important similarity: both depend on institutions and policiesto be realized (Mason and Lee Forthcoming; Bloom and Canning 2001).
3 Data and Methods
Estimates of the demographic dividends require both income and consump-tion age profiles. The results in this paper are based on age profiles estimatedusing Brazilian data. We make extensive use of the Living and StandardsMeasurement Survey of Brazil (PPV) to estimate age schedules of economicflows. The PPV was carried out between 1996 and 1997 by the Braziliancensus office in a joint project with the World Bank. With a sample sizeof 4940 households, the PPV is representative of 70 percent of the nationalpopulation and 75 percent of GDP (Turra 2000). The survey contains acomprehensive and comparable set of demographic and economic variables,including detailed information on household budget and expenditures. Wealso make use of administrative records, which provide us with informationon taxes and public spending on education, health care and social security in1996. More information about the data can be found elsewhere (Turra 2000;Turra and Rios-Neto 2001).
We follow the methodology developed developed by the National Trans-fers Accounts project (www.ntaccounts.org) to perform the calculations. Briefly,to estimate age profiles of consumption we apply different rules dependingon how data on expenditures were colleted in the survey (i.e. individual orhousehold data). Out-of-pocket expenditures on education and health werereported for all respondents and thus, are drawn directly from the survey.
8
Expenditures on cigarettes are allocated proportionally among adults aged15 and older in the household. Expenditures on children and adult apparelare distributed proportionally among persons between ages 0 and 15 and per-sons aged 15+, respectively. Following the Lee transfer framework, the ageconsumption profile also includes (1) the mean value of public consumptionby age (e.g. public spending on education and health), and (2) the valueof services provided by consumer durables and housing. All the age profilesestimated are then adjusted by aggregated values in the National Incomeand Product Accounts.
Information on labor earnings is collected for all individuals ages 10 andolder who worked for pay during the survey’s reference week. Labor earningsare self-reported and include income before taxes from all jobs held duringthe reference week as well as the value of fringe benefits. To estimate laborearnings we include both employment and self-employment income. For self-employed individuals, we assume that 2/3 of their earnings is labor incomeand 1/3 is return to capital (Lee and Mason 2004).
4 Demographic Transition in Brazil
The panels of Figure 1 display some of the main features of the demographicchanges that have occurred in Brazil over the last decades. Figure 1 alsodepicts future demographic scenarios. The demographic transition startedwith mortality improvements in the 1930s, which were followed by fertilitydeclines in the later 1960s. Despite the delayed onset, the demographictransition in Brazil has been characterized by rapid changes (de Carvalhoand Wong 1999; de Carvalho 1997/1998). The total fertility rate has reducedby more than half since 1970 (5.3 to 2.12 in 2000) and life expectancy at birthhas improved steadily: from 57.5 years in 1970 to 70.3 years in 2000. From ayoung quasi-stable age structure in 1970, the age distribution has graduallyshifted to an older distribution. Until 2000, the most important changes werethe decline in the share of the young and a rise in the share of the workingage population. Significant increases in the elderly population are expectedto occur only in the next decades. The projections indicate that by 2050,the population aged 65 and older will represent about 18 percent of the totalpopulation, compared to 3 percent in 1970. These shifts in the age structurecan be seen in the dependency ratios, which follow a well documented pattern:the total dependency ratio will decline until 2010 following the decline in the
9
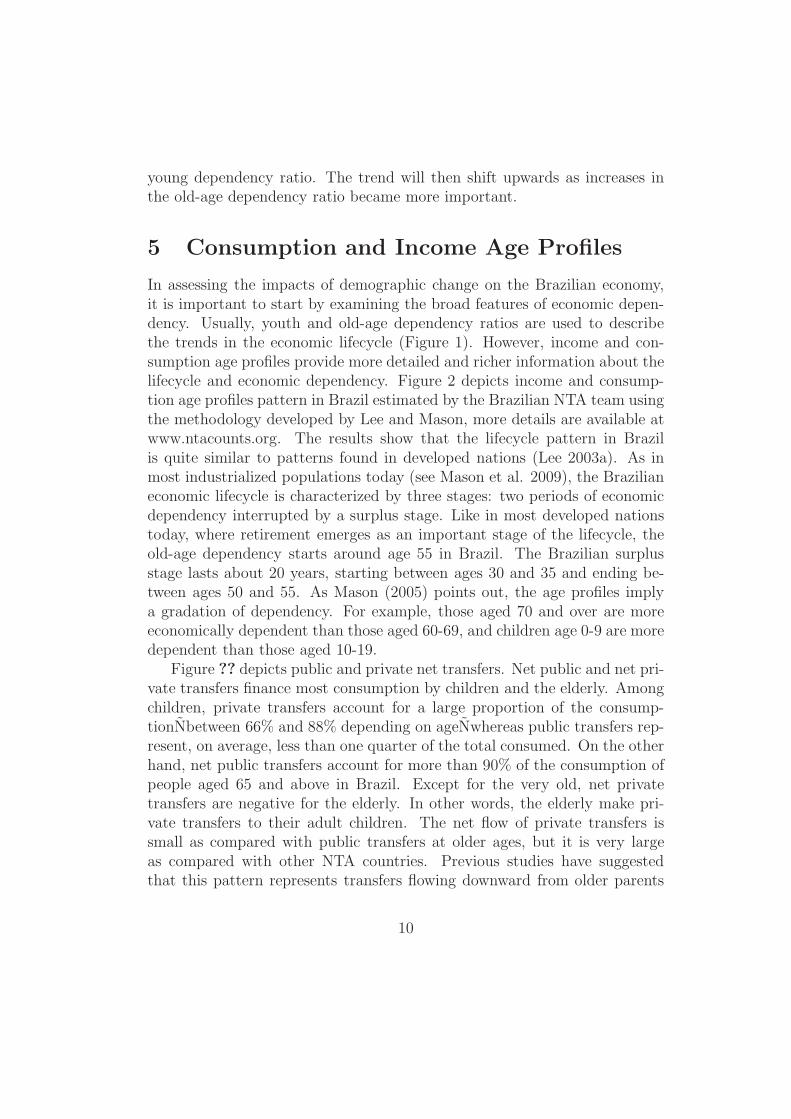
young dependency ratio. The trend will then shift upwards as increases inthe old-age dependency ratio became more important.
5 Consumption and Income Age Profiles
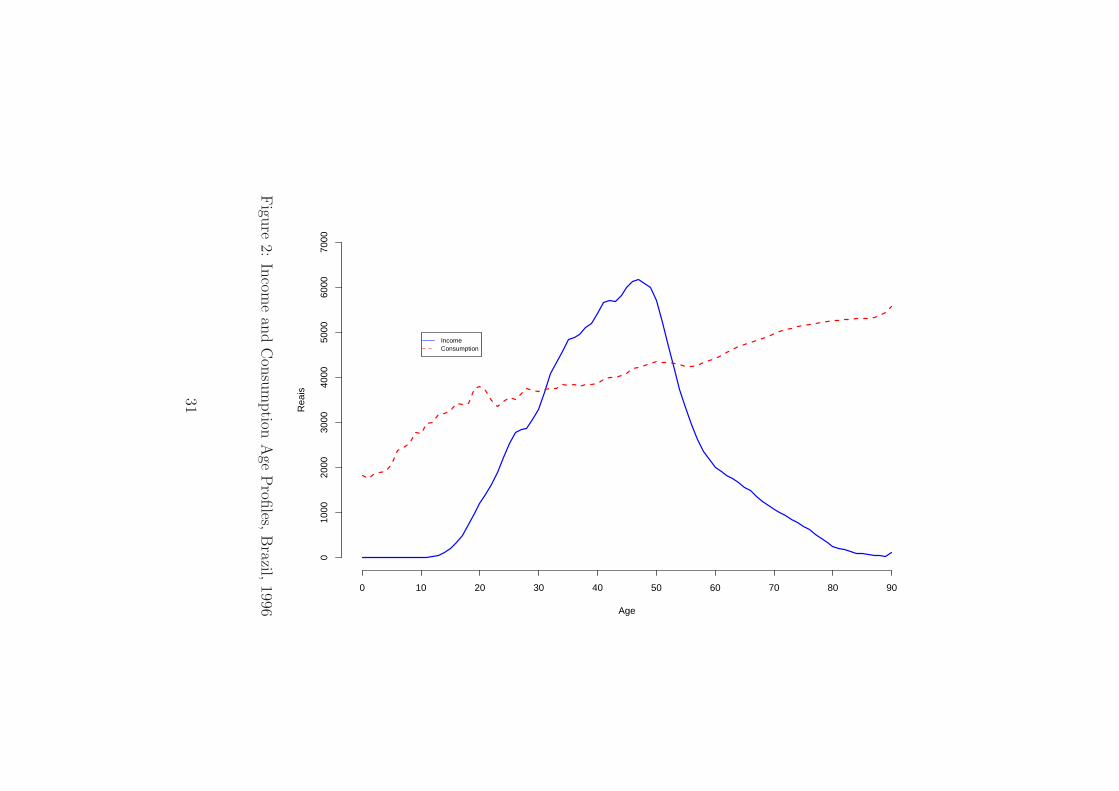
In assessing the impacts of demographic change on the Brazilian economy,it is important to start by examining the broad features of economic depen-dency. Usually, youth and old-age dependency ratios are used to describethe trends in the economic lifecycle (Figure 1). However, income and con-sumption age profiles provide more detailed and richer information about thelifecycle and economic dependency. Figure 2 depicts income and consump-tion age profiles pattern in Brazil estimated by the Brazilian NTA team usingthe methodology developed by Lee and Mason, more details are available atwww.ntacounts.org. The results show that the lifecycle pattern in Brazilis quite similar to patterns found in developed nations (Lee 2003a). As inmost industrialized populations today (see Mason et al. 2009), the Brazilianeconomic lifecycle is characterized by three stages: two periods of economicdependency interrupted by a surplus stage. Like in most developed nationstoday, where retirement emerges as an important stage of the lifecycle, theold-age dependency starts around age 55 in Brazil. The Brazilian surplusstage lasts about 20 years, starting between ages 30 and 35 and ending be-tween ages 50 and 55. As Mason (2005) points out, the age profiles implya gradation of dependency. For example, those aged 70 and over are moreeconomically dependent than those aged 60-69, and children age 0-9 are moredependent than those aged 10-19.
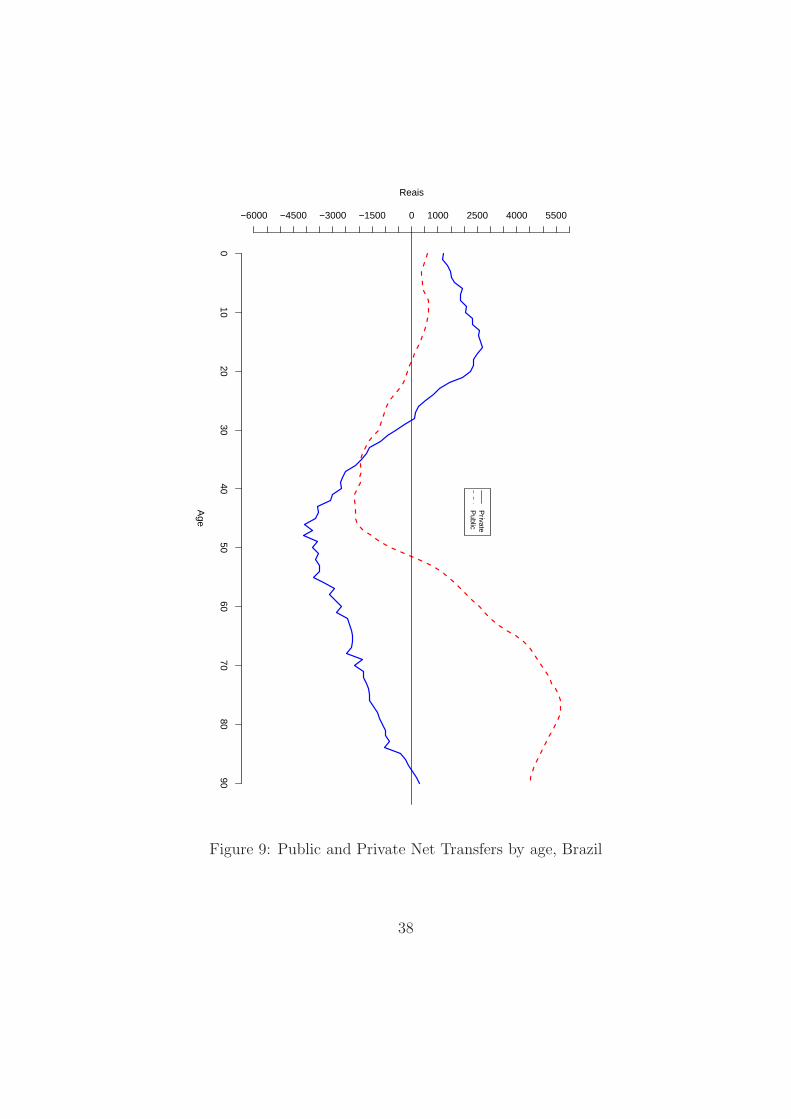
Figure ?? depicts public and private net transfers. Net public and net pri-vate transfers finance most consumption by children and the elderly. Amongchildren, private transfers account for a large proportion of the consump-tionNbetween 66% and 88% depending on ageNwhereas public transfers rep-resent, on average, less than one quarter of the total consumed. On the otherhand, net public transfers account for more than 90% of the consumption ofpeople aged 65 and above in Brazil. Except for the very old, net privatetransfers are negative for the elderly. In other words, the elderly make pri-vate transfers to their adult children. The net flow of private transfers issmall as compared with public transfers at older ages, but it is very largeas compared with other NTA countries. Previous studies have suggestedthat this pattern represents transfers flowing downward from older parents
10
to adult offspring and that it may be an indirect effect of the substantialsupport that the elderly receive from the public sector in Brazil (Camarano2003, Saad 2004).
In a recent article, Turra, Queiroz, and Rios-Neto (2010) showed thatthe elderly in Brazil receive much higher per capita public transfers thando children. The ratio of net per capita public transfers (i.e. public ex-penditures net of taxes paid) for the elderly (ages 65+) to net per capitapublic transfers for children (ages 015) in Brazil is between 2.5 and 8 timeslarger than the ratios estimated for the U.S, Japan and selected Europeanand Latin American countries. Turra, Queiroz, and Rios-Neto (2010) showthat at ages below 5, public health care is the largest source of consumption,accounting for about a quarter of all public transfers received. Between ages5 and 15, public education becomes the largest age-related component, rep-resenting about 40% of public expenditures. As mentioned before, the lackof a minimum retirement age creates incentives to early retirement, resultingin pension benefits paid to both private workers and public servants beginto rise steeply around age 40 and reach their high plateau by age 75, whenthey represent 86% of the total public inflows.
More interestingly, Turra and Queiroz (2005) analyzed the Brazilian in-tergenerational transfer systems by educational level of the household headand observed different patterns of private and public transfers. They showedthat private transfers are more important for wealthy children than for poorerone. Children from less well-off household rely heavily on public transfer (ed-ucation). However, a completely different results is observed for the elderly.Regardless of socioeconomic level, elderly consumption depends on publictransfers, mainly social security and health care.
6 Overview of Public Transfer System in Brazil
Over the last century, most industrialized countries and some developing na-tions have established universal social insurance programs. Social insuranceprograms provide public welfare support for the population through in-kindand cash transfers. These programs guarantee both the well-being of theelderly and the development of the young generations and can help reduceinequality and promote economic growth (Lee and Mason, 2004). In Brazil,public welfare support reached about 21% of GDP in 2002, considering allgovernment levels (Brasil 2003), an amount that is comparable to social ex-
11
penditures in most developed countries. While social security benefits andother forms of elderly support represented about 12% of GDP, public ex-penditures on education and health amounted to 5.5% and 3.5% of GDP in2002, respectively (Camargo, 2004).
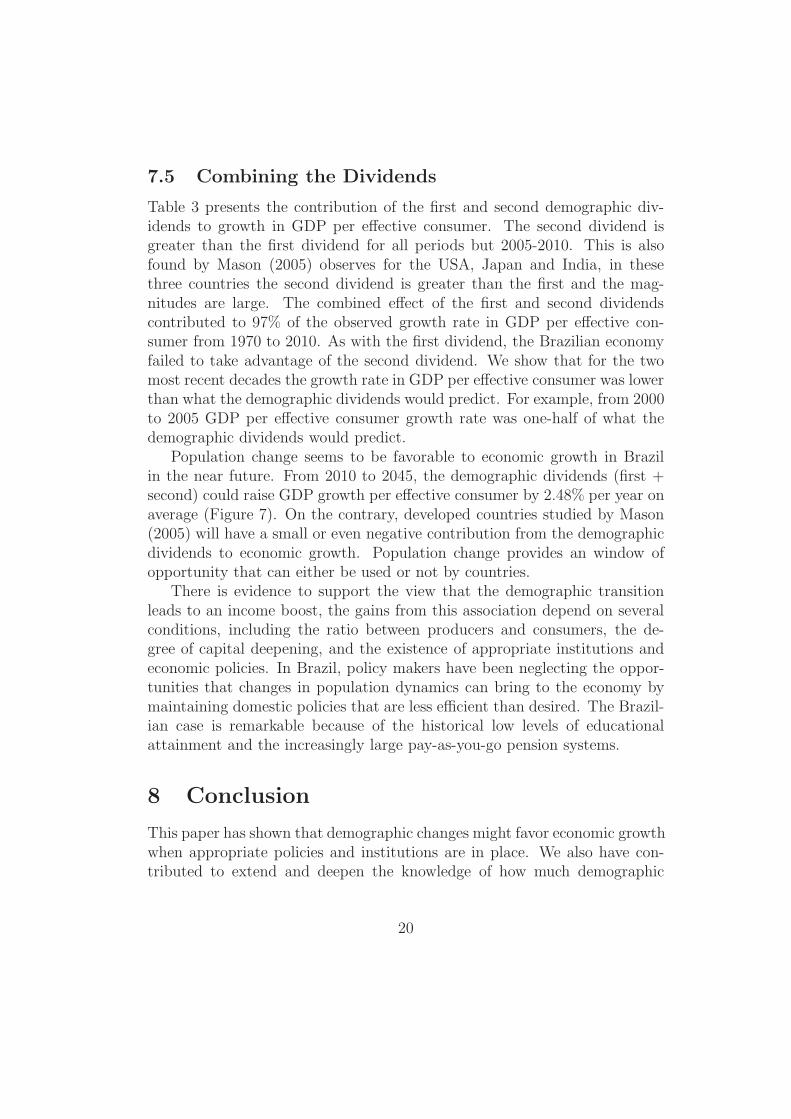
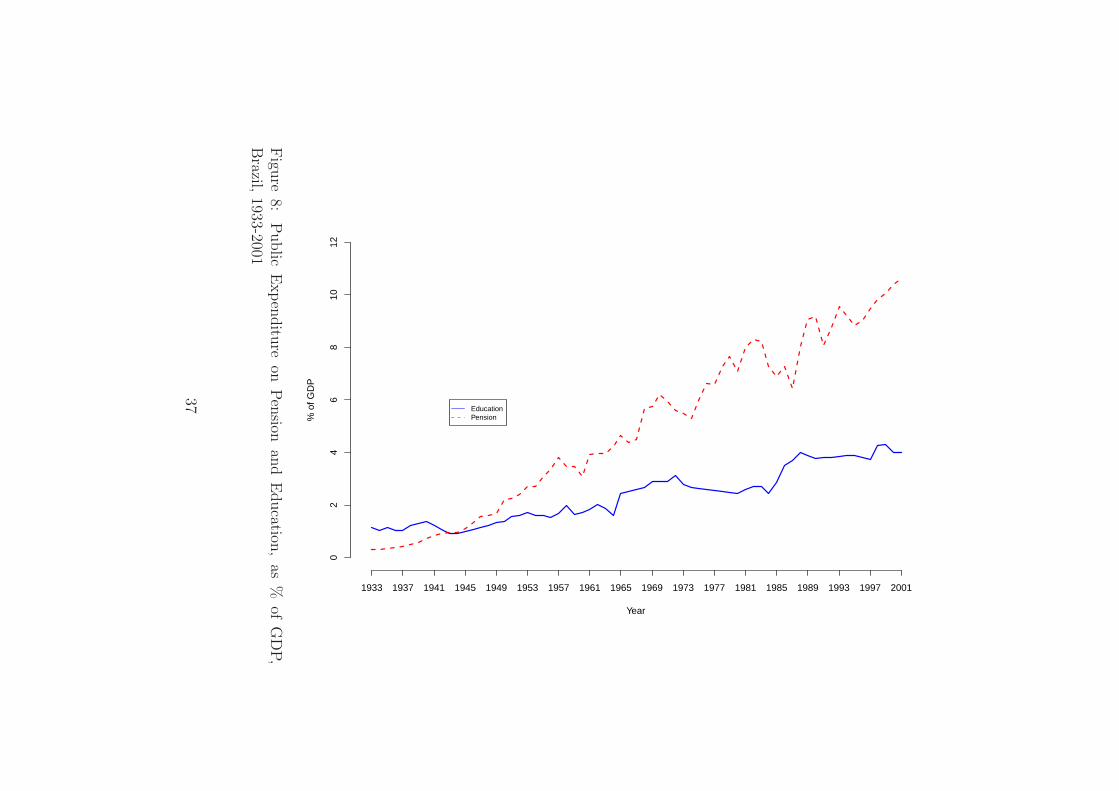
The historical evolution of total expenditures on public education andpensions (general system and public servants) is shown in Figure 9. Sincethe 1940s, expenditures on pensions (currently around 10% of the GDP)have been by far larger than expenditures on public education (currentlyaround 4%). One should note that these are crude measures and do notaccount for compositional effects. Thus, since the Brazilian population wasvery young during the XX century, the discrepancies are certainly mostlylarger when controlling for age structure. The rise of public expenditures oneducation in Brazil started much later than in other nations. In Brazil, theconsolidation of primary public education did not occur before most of theelderly population had begun receiving retirement benefits.
6.1 Social Security
In Brazil, most pension systems are based on the PAYGO system. The coun-try has also a large non-contributory system, with means-tested eligibility.The pension system is divided in three segments: general system, civil ser-vants system, and private funded system. The general pension system wascentralized only in 1966, when the House of Representatives approved theSocial Security Ordinary Law. The National Social Security Administration,INPS, incorporated all the revenues and expenditures from sector-specificprograms as well as its assets and liabilities. Another major change duringthis time was in the scheme of the program, which changed from a capitaliza-tion system to a PAYGO. The last major change in regulation happened withthe 1988 Constitution, which extended mandatory social security coverageto most of the excluded groups, including rural workers, without requiringequivalent increases in revenues from contributions. Other measures madethe system more generous than before: establishing the minimum wage asthe lowest benefit paid by the system, indexing all pensions to the minimumwage, and reducing the minimum age of retirement.
The general system was conceived when rapid population growth and lowlife expectancy combined to sustain the program. In recent decades, however,the ratio workers/retirees has declined. The ratio was 30:1 in 1940, declinedto 5:1 in the 1960s, was 1.7:1 in 2000, and is projected to be 1:1 by 2013. In
12
2000, the PAYGO system had 27 million workers contributing and 16 mil-lion beneficiaries. About 77% of the population aged 60 and above receivesome sort of pension benefit (Queiroz 2005). Until 1998, full pension benefitswere granted to all workers who have contributed for 10 years to the system,have reached normal retirement age (65 for men and 60 for women - Old-AgePension Benefit), or could prove that they have been working for a certainnumber of years (35 for men and 30 for women, but without requirement ofcontribution over that time - Length of Service Pension Benefit). In addition,special retirement schemes existed that granted proportional retirement ben-efits for individuals who had worked for 30 and 25 years, for men and womenrespectively. The benefits were computed based on the last 36 months ofactivity (Brazil 2002). The level of benefits is relatively high. Old-age bene-fits recipients receive, on average, 3 times the minimum wage, and length ofservice benefits is 2.5 times higher than old-age benefits (Queiroz, Turra, andPerez 2006). In 1998, after years of political debate a significant reform wasapproved in order to help solve the programOs fiscal imbalance. The mainchange was the introduction of a new methodology to calculate pension ben-efits based on an actuarial rule. The new benefit computation is based onthe Swedish Notional Defined Benefit Program and takes into account longerearnings history, the life expectancy at age of retirement, and a coefficientthat creates disincentives to early retirement. A minimum retirement agehas not yet been approved for workers in the private sector (Brazil 2003).
Alongside the general pension system, civil servants have their own pen-sion program. Although smaller in absolute numbers when compared to thegeneral program, expenditures with the civil servants program are not trivial,reaching 4.7% of GDP in 2002 (Queiroz 2005). The program is a complexchain of federal, state and local systems, including special programs to dif-ferent civil servant categories. There are two main advantages in the civilservant system: higher replacement rates and shorter time of contributionto receive full pension benefits. The program deficit is high and has beenincreasing over the past decade. In addition the program has very high de-pendency ratio. That is, few active workers to retiree, which increases doubtsabout its future sustainability.
6.2 Public Education System
Education is certainly the most effective program to reduce inequality andimprove the life standard of a population. The 1988 Constitution determined
13
that the Federal government should spend 18% of its budget on education,while the states and municipalities should spend 25%. In general, primaryeducation is provided by the municipalities (3.6% of GDP), while state levelgovernment is responsible for secondary education (0.8% of GDP) and thecentral government funds most of the public higher education (0.5% of GDP)(Camargo 2004; Almeida 2001). Since 1971, 8 years of primary educationhas been mandatory. Since 2000, almost all children aged 7 to 14 havebeen enrolled in school, but many problems have persisted including graderetention and school drop-out after age 15.
Although the Brazilian government spends similar percentage of GDPon education than other countries, the pattern of expenditures per pupil isdramatically different. For example, while in Brazil per pupil expenditureson higher education are about 14 times larger than on primary education, inOECD countries the ratio is only 2.7, emphasizing the unequal distributionof public resources by level of education in Brazil (Almeida 2001).
In recent years some programs have been created to improve the qualityand coverage of basic education. For example, the FUNDEF is an educa-tional fund that was created to (1) increase investments on basic/primaryeducation, (2) guarantee a minimum amount of expenditures per pupil inprimary education, and (3) allocate resources from richer areas to poorerones. In addition, the ’bolsa-escola’, a means-tested conditional cash trans-fer, was implemented to incentive families to keep children aged 7 to 14 inschool. Finally, the federal government has developed new curricular guide-lines and established a system of performance evaluation for school and stu-dents (Schwartzman 2003).
7 The Demographic Dividends
7.1 The First Demographic Dividend
The first dividend is related to a temporary increase in the share of work-ing age population and it is effectively measured by increases in the ratioof producers to consumers in the population. Estimates of the first demo-graphic dividend use age profiles of income and consumption and populationage distributions. The results presented here were estimated using Brazilianprofiles for 1996 (Figure 2). We assume that this cross-sectional profile isconstant during the period of analysis (1970-2050). This assumption ignores
14
how socioeconomic development might affect the patterns of income and con-sumption in the future. Also, we are assuming that demographic changes willnot affect the arrangements of intergenerational transfers (Preston, Heuve-line, and Guillot 2001), nor how the expansion of public programs mightaffect patterns of consumption (Becker and Murphy 1988). In this paper, weare mainly concerned on how demographic changes can have impacts on eco-nomic growth. On further research we are considering alternative scenarios.
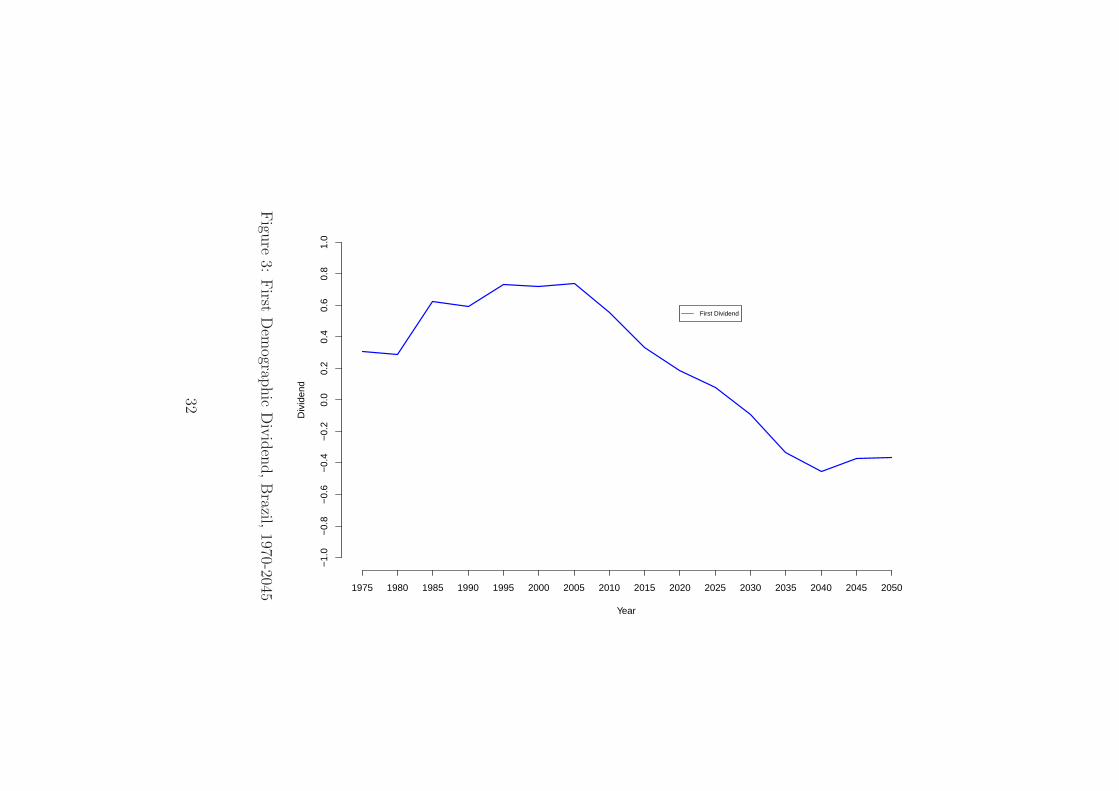
Figure 3 presents the support ratio and the first dividend. The two ver-tical lines indicate when the growth rate of the support ratio turns negative(i.e. the first dividend equals to zero), in 2026. The support ratios (effectiveproducers to effective consumers) in Brazil are unfavorable during the 1970sand 1980s. High fertility rates and declining infant and child mortality ledto a larger proportion of children, about 50% of the population under age 20during this period, causing the low support ratio.
From the late 1990s on the country experience a rapid rise in the supportratio lasting until 2040. These improvements in the support ratio are causedby the fertility decline since 1970s and the consequent increase in working agepopulation (Figure 1). The trend in the Brazilian support ratio shares somesimilarities with the Indian experience, shown in Mason (2005). They bothhave only one peak contrary to the US experience, and the rise in the supportratio starts later in these two countries compared to the United States andJapan. However, the rate of growth of the support ratio is faster in Brazilthan in Indian because fertility decline in India was much slower than inBrazil. BrazilianOs support ratio peaks in 2010 while support ratio in Indiawill not peak until 2040 ((Mason 2005).
The first dividend, the rate of growth of the support ratio, is shownin Figure 3. Brazil has one clear period of demographic dividend, startingin 1975 and lasting until 2025. The dividend is strongly positive duringthose decades. In this period the economy should have grown at about0.6% per year on average due to the first dividend only. The effects ofpopulation aging are already observed after 2005, when the first dividendstarts to decline, but they are more evident after 2025 when it turns negative.The first demographic dividend after 2025 will be a drag to economic growth.
Figure 4 compares the duration of the first dividend in Brazil with othercountries. The first dividend in Brazil will last longer than what is observed inindustrialized countries. The first dividend in Brazil is about 20 years longerthan the developed world experience. Mason (2005) shows that the firstdividend last for 30 years in both Japan and the USA, and it is already being
15
a drag to economic growth since 2000. The dividend in Brazil is shorter thanother developing nations, more specifically Asian countries. For exemple, thefirst dividend in India started in 1975 and it is expected to last until 2040(about 15 years longer than in Brazil).
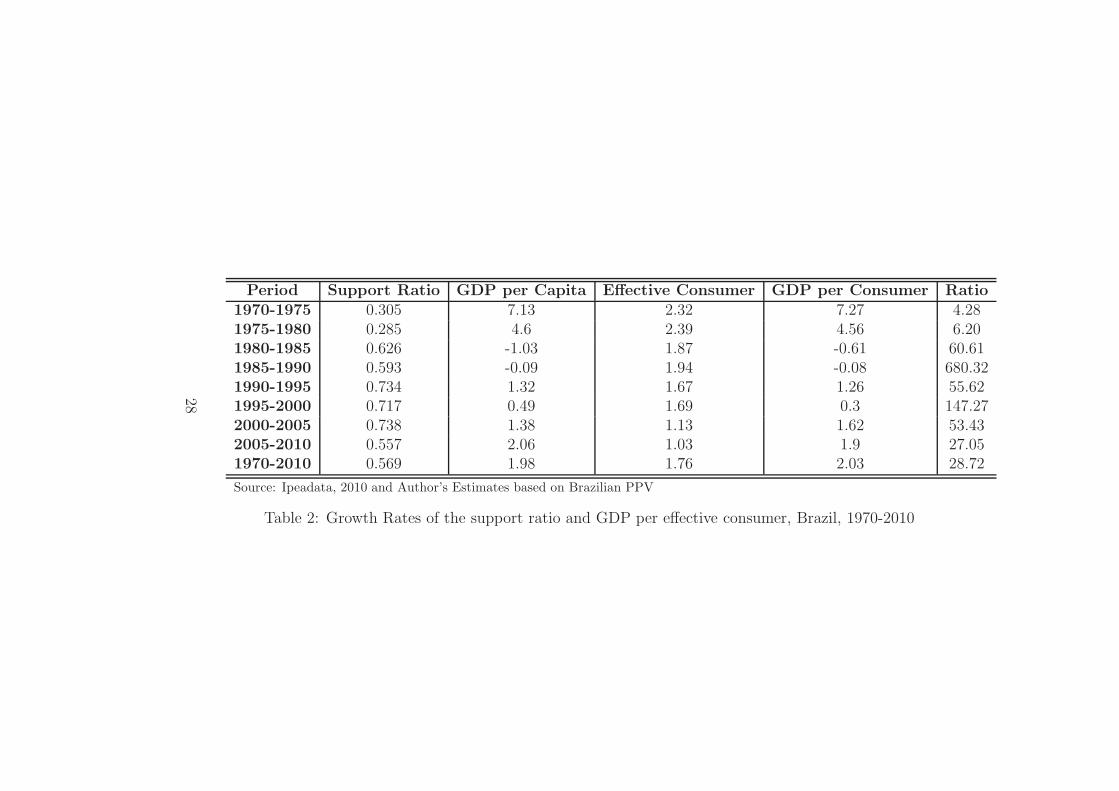
Table 2 shows the potential impact of the first demographic dividend onactual economic growth. We follow Mason (2005) to analyze the contributionof the dividends on economic growth. The table reports the first dividend(growth rate of the support ratio), the growth rate of GDP per capital,growth rate of GDP per effective consumer, and the contribution of the firstdividend to the observed economic growth rate. GDP per effective consumeris a better measure rather than GDP per capita because it incorporates theeffects of demographic changes on population consumption and needs (Mason2005).
The results presented in the table show some interesting patterns of theBrazilian economic growth from 1970 to 2000. During this period the declinein fertility rate and the consequent increase in working age population led toan increase in GDP per effective consumer of 0.6% per year on average. Inthe future the expected changes in the Brazilian population age structure willlead to a negative effect on economic growth. From 2020 to 2040 Brazil willexperience a negative effect, 0.4% per year on average, on potential economicgrowth.
The first dividend contributed to almost 30% of the observed economicgrowth from 1970 to 2010. The first dividends contribution in Brazil is greaterthan the ones observed in Japan, India and the United States. Mason (2005)estimates the contribution of the growth rate of the support ratio in 20% forthe United States and about 10% for India during the same period. However,Table 3 shows that Brazil failed to take better advantage of the process inrecent years. Most of the contribution of the first dividend is from 1970 to1980. In the 1980s and 1990s the growth rate of support ratio could have ledto an increase of the GDP per effective consumer of 2.5% and 2.4% per year,respectively. However, the observed economic growth was smaller than thefirst dividend alone. The growth rate of GDP per effective consumer from1980 to 1990 was negative 0.61% per year, and from 1990 to 2000 it was0.08% per year.
16
7.2 First Dividend: public and private
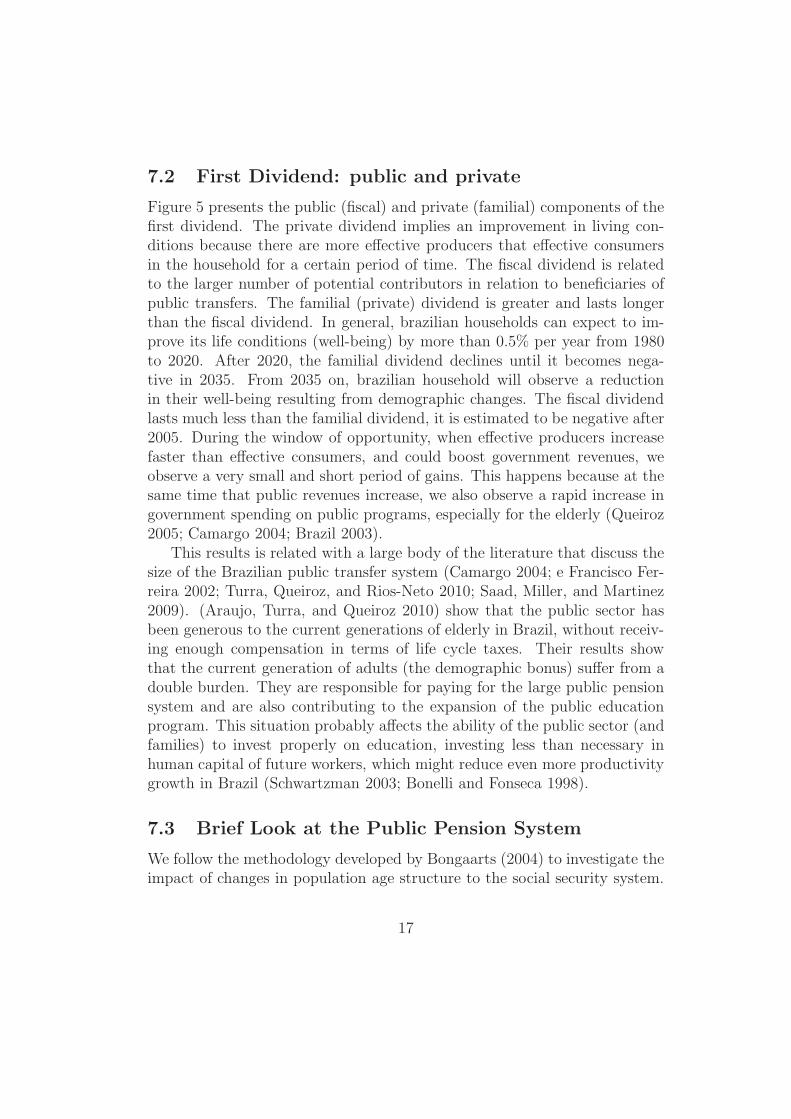
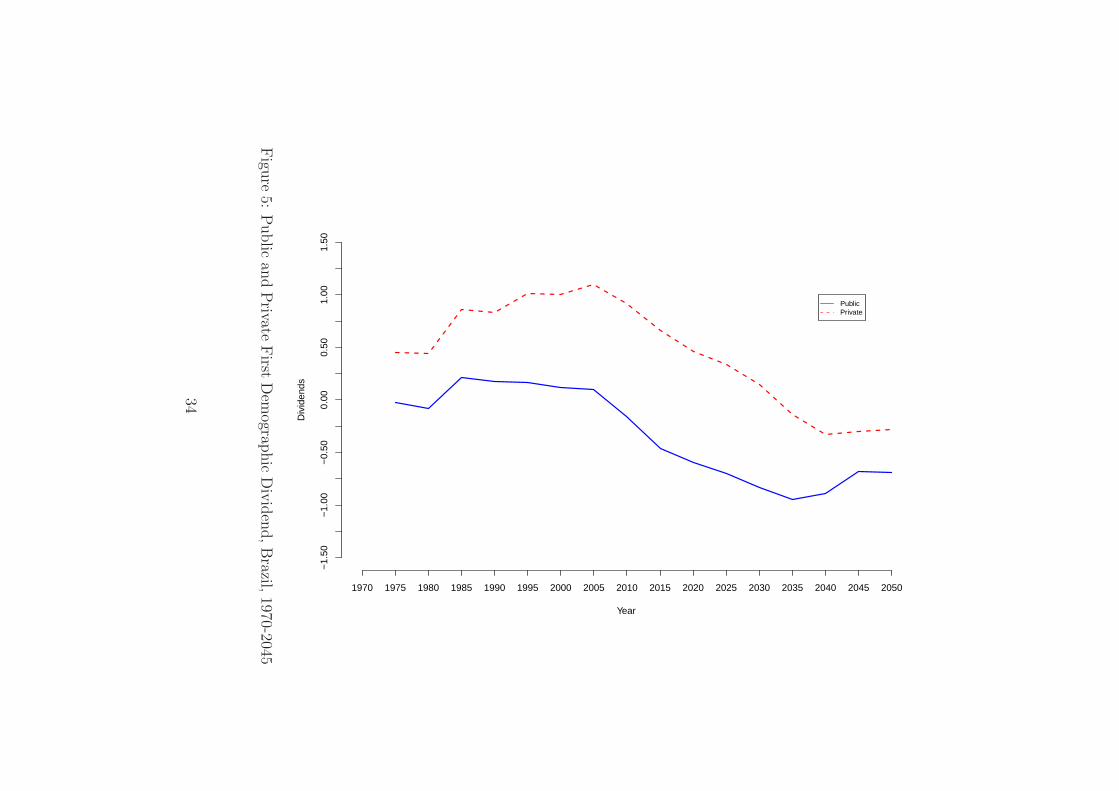
Figure 5 presents the public (fiscal) and private (familial) components of thefirst dividend. The private dividend implies an improvement in living con-ditions because there are more effective producers that effective consumersin the household for a certain period of time. The fiscal dividend is relatedto the larger number of potential contributors in relation to beneficiaries ofpublic transfers. The familial (private) dividend is greater and lasts longerthan the fiscal dividend. In general, brazilian households can expect to im-prove its life conditions (well-being) by more than 0.5% per year from 1980to 2020. After 2020, the familial dividend declines until it becomes nega-tive in 2035. From 2035 on, brazilian household will observe a reductionin their well-being resulting from demographic changes. The fiscal dividendlasts much less than the familial dividend, it is estimated to be negative after2005. During the window of opportunity, when effective producers increasefaster than effective consumers, and could boost government revenues, weobserve a very small and short period of gains. This happens because at thesame time that public revenues increase, we also observe a rapid increase ingovernment spending on public programs, especially for the elderly (Queiroz2005; Camargo 2004; Brazil 2003).
This results is related with a large body of the literature that discuss thesize of the Brazilian public transfer system (Camargo 2004; e Francisco Fer-reira 2002; Turra, Queiroz, and Rios-Neto 2010; Saad, Miller, and Martinez2009). (Araujo, Turra, and Queiroz 2010) show that the public sector hasbeen generous to the current generations of elderly in Brazil, without receiv-ing enough compensation in terms of life cycle taxes. Their results showthat the current generation of adults (the demographic bonus) suffer from adouble burden. They are responsible for paying for the large public pensionsystem and are also contributing to the expansion of the public educationprogram. This situation probably affects the ability of the public sector (andfamilies) to invest properly on education, investing less than necessary inhuman capital of future workers, which might reduce even more productivitygrowth in Brazil (Schwartzman 2003; Bonelli and Fonseca 1998).
7.3 Brief Look at the Public Pension System
We follow the methodology developed by Bongaarts (2004) to investigate theimpact of changes in population age structure to the social security system.
17
Bongaarts (2004) proposed the use of a more accurate measure to relate theweight of pensioners in a economy: the ratio of pensioners to workers (PWR).The PWR is directed related to the old-age dependency ratio and the pen-sioner ratio (number of pensioners to the population aged 65 and above),and it is indirectly related to the employment ratio (ratio of workers makingcontributions to the population aged 15 to 64). The data for population inBrazil were obtained from the National Statistics Office (IBGE). The datafrom pensioners and contributors were obtained from the Ministerio da Prev-idencia Social (MPAS). We considered only the benefits that were consideredactive by MPAS and contributions made by individuals.
PWR is much larger than the usual old-age dependency ratio for all coun-tries, ranging from 0.27 in the United States to 0.71 in Italy. PWR in Brazilis affected by the high level of informality in the labor market, early re-tirement ages, and generosity of the public pension system. The number ofpensioners per worker rises substantially with time, as it would be expectedby the rapid process of population aging in Brazil (shown by the rise in old-age dependency ratio). In 2050, PWR is projected to reach 1.23, that is,123 pensioners per 100 workers. The trend in Brazil is similar to what isprojected for Italy where PWR is projected to be 1.55 in 2050. PWR inBrazil is project to be the second highest among the countries analyzed here(based on Bongaarts estimates). For instance, the ratio in the US is projectto reach 0.46 in 2050 compared to 0.27 in 2000. The effects of age structureon the pace of population ageing (i.e. population momentum) have providedextra time for social security; about 25 years until pensioner per worker ratioreaches levels that will be unsustainable to the system and to the economy.
The findings reveal that Brazilian policy makers have made decisionsthat are poorly grounded on a technical basis and overlooked the temporarynature of the demographic transition. By granting new forms of benefitswithout requiring contribution (e.g., inclusion of rural workers in 1988) andby not approving reforms to encourage tax payments, policy makers havereduced the benefits of the demographic transition and aggravated financialissues from population aging.
18
7.4 The Second Demographic Dividend2
To estimate the second dividend we follow Mason (2005) and apply severalsimplifying assumptions. First, we measure the ratio of capital to laborincome at ages 50 and older to represent the wealth accumulated over theindividual life cycle. Second, although we assume that the age patterns ofconsumption and labor income do to not change over time, we do allowconsumption and income levels to increase by 1.5% a year. To estimatethe present values of consumption and labor income we further assume arate of interest of 3% in order to keep our results consistent with previousapplications of the model (Mason 2005). Finally, to translate changes in theratio of capital to labor income into productive growth we assume that theelasticity of labor income with respect to capital is 0.5. As indicated above,on further research we are considering alternative scenarios.
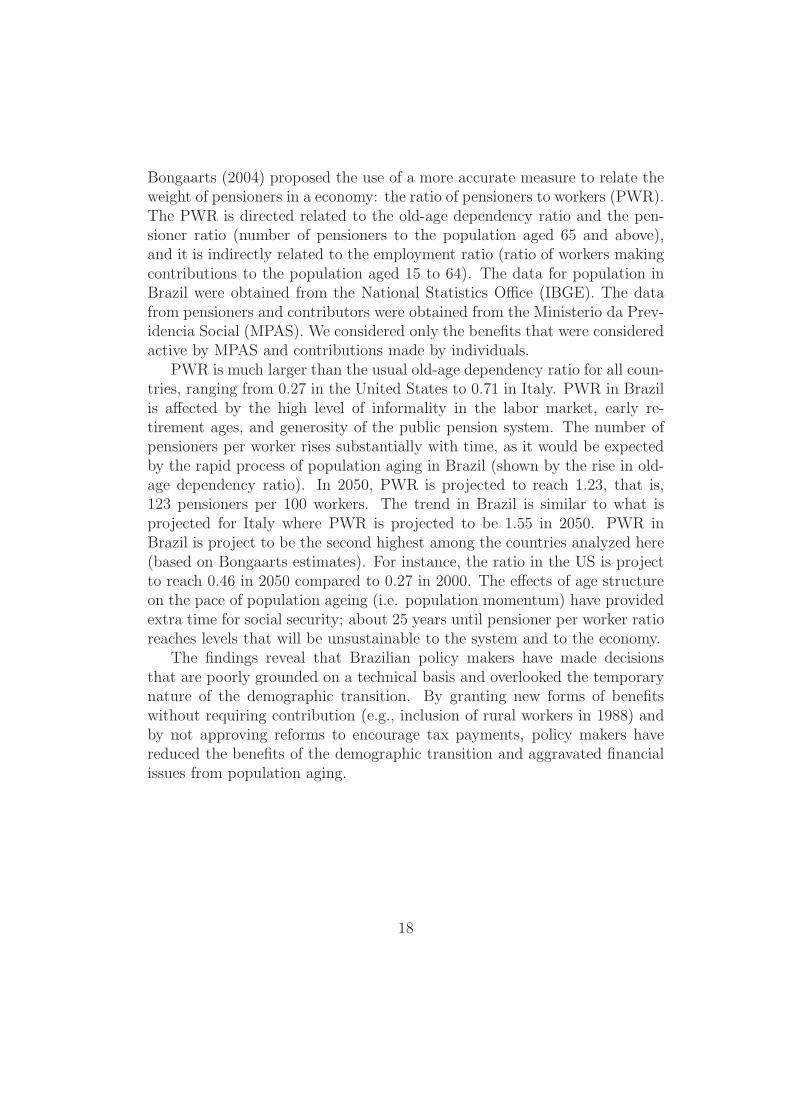
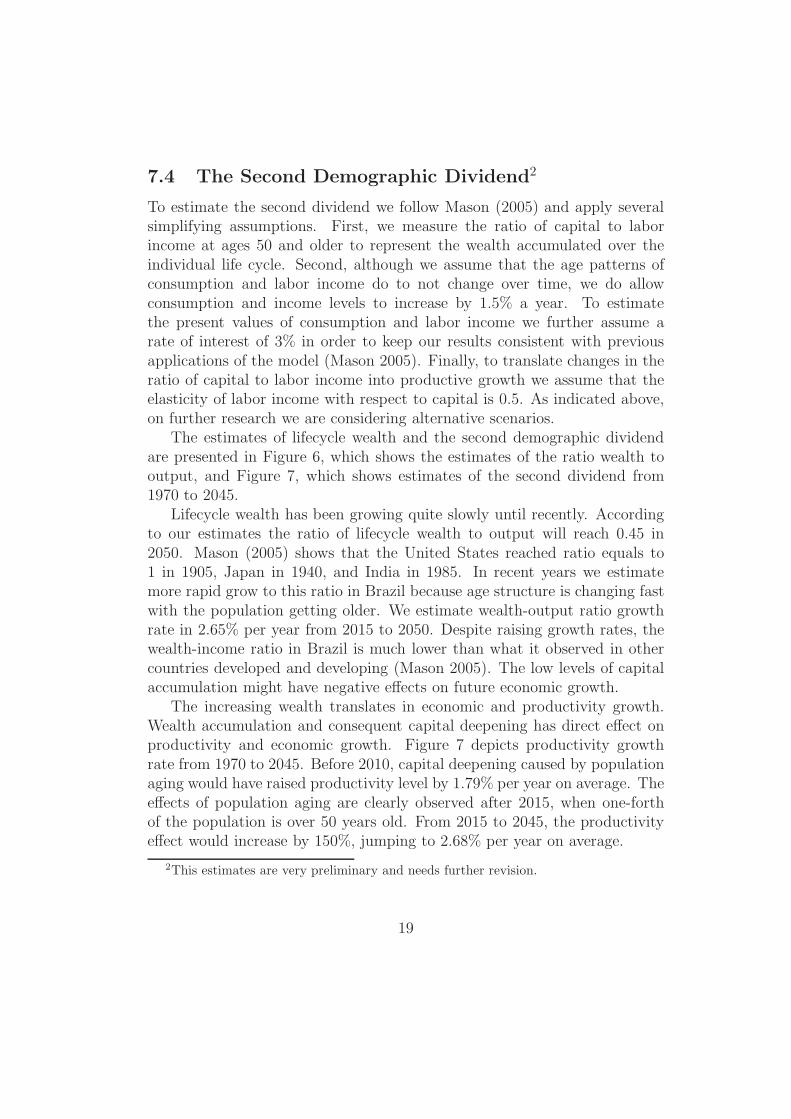
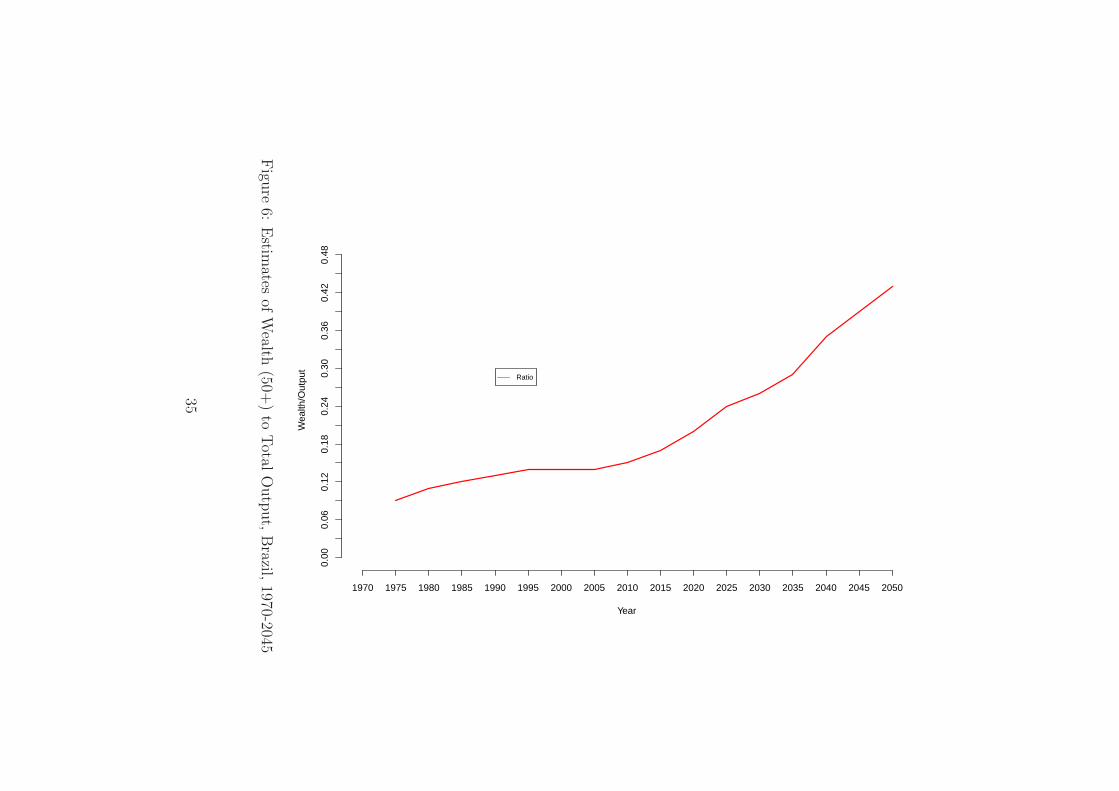
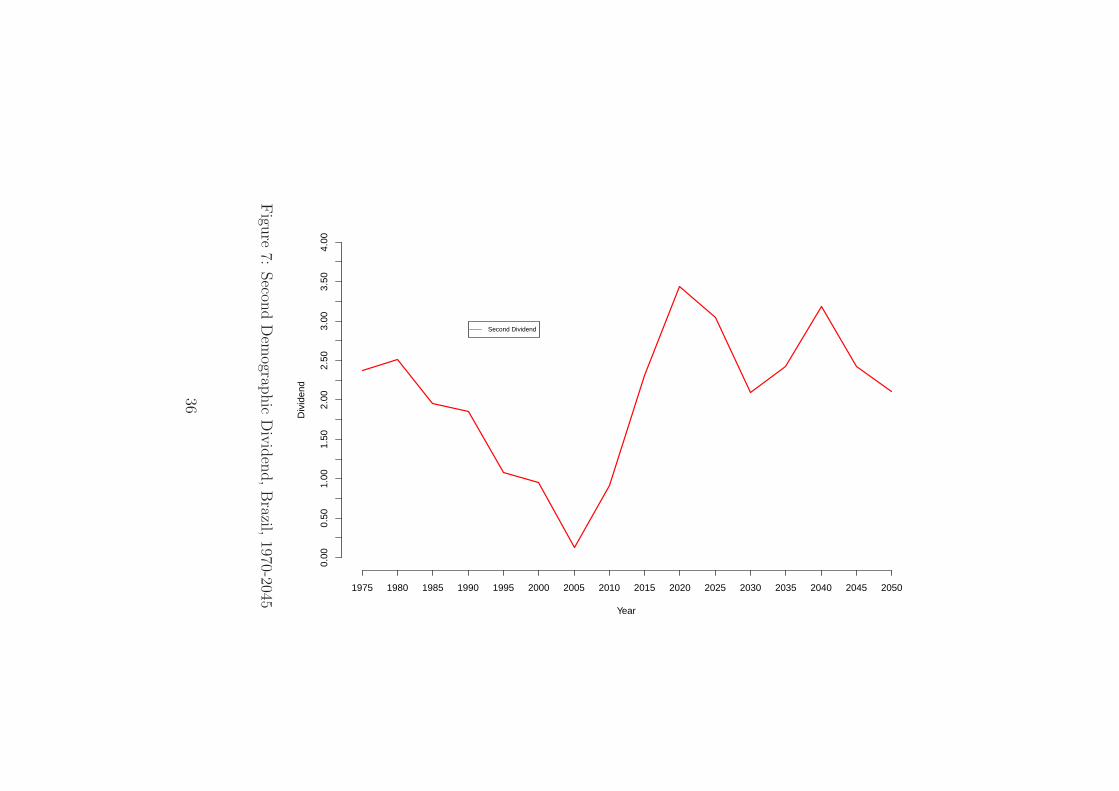
The estimates of lifecycle wealth and the second demographic dividendare presented in Figure 6, which shows the estimates of the ratio wealth tooutput, and Figure 7, which shows estimates of the second dividend from1970 to 2045.
Lifecycle wealth has been growing quite slowly until recently. Accordingto our estimates the ratio of lifecycle wealth to output will reach 0.45 in2050. Mason (2005) shows that the United States reached ratio equals to1 in 1905, Japan in 1940, and India in 1985. In recent years we estimatemore rapid grow to this ratio in Brazil because age structure is changing fastwith the population getting older. We estimate wealth-output ratio growthrate in 2.65% per year from 2015 to 2050. Despite raising growth rates, thewealth-income ratio in Brazil is much lower than what it observed in othercountries developed and developing (Mason 2005). The low levels of capitalaccumulation might have negative effects on future economic growth.
The increasing wealth translates in economic and productivity growth.Wealth accumulation and consequent capital deepening has direct effect onproductivity and economic growth. Figure 7 depicts productivity growthrate from 1970 to 2045. Before 2010, capital deepening caused by populationaging would have raised productivity level by 1.79% per year on average. Theeffects of population aging are clearly observed after 2015, when one-forthof the population is over 50 years old. From 2015 to 2045, the productivityeffect would increase by 150%, jumping to 2.68% per year on average.
2This estimates are very preliminary and needs further revision.
19
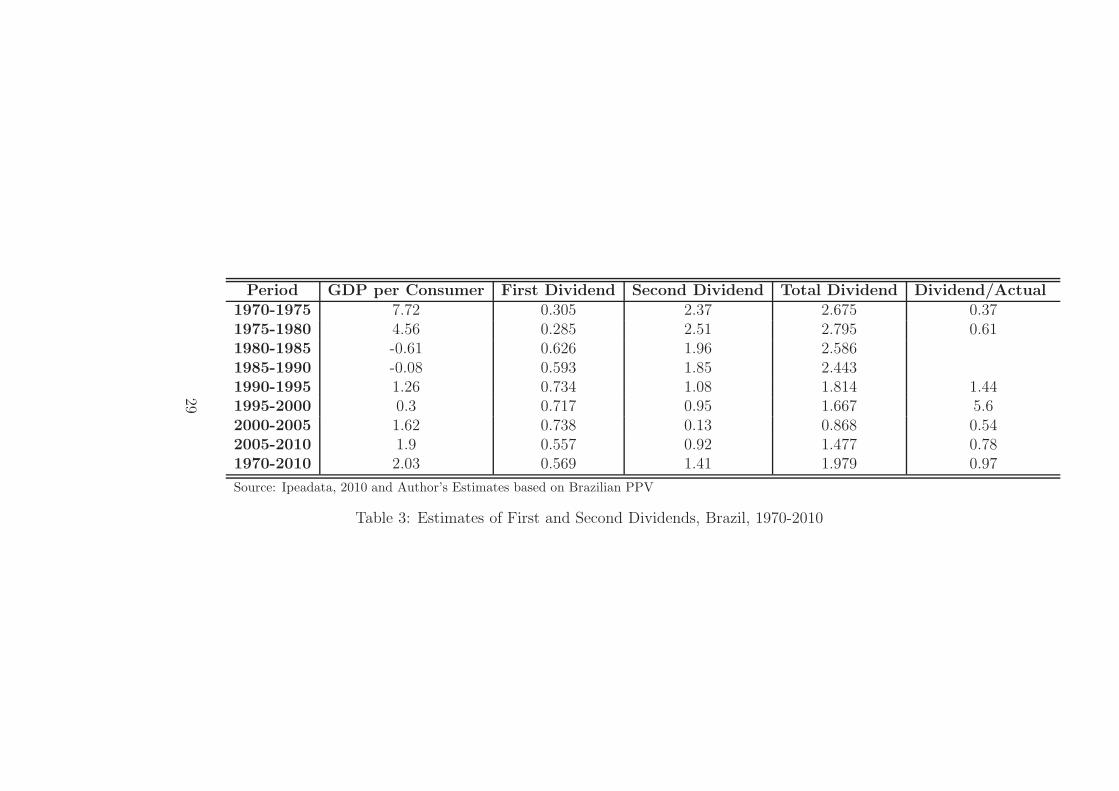
7.5 Combining the Dividends
Table 3 presents the contribution of the first and second demographic div-idends to growth in GDP per effective consumer. The second dividend isgreater than the first dividend for all periods but 2005-2010. This is alsofound by Mason (2005) observes for the USA, Japan and India, in thesethree countries the second dividend is greater than the first and the mag-nitudes are large. The combined effect of the first and second dividendscontributed to 97% of the observed growth rate in GDP per effective con-sumer from 1970 to 2010. As with the first dividend, the Brazilian economyfailed to take advantage of the second dividend. We show that for the twomost recent decades the growth rate in GDP per effective consumer was lowerthan what the demographic dividends would predict. For example, from 2000to 2005 GDP per effective consumer growth rate was one-half of what thedemographic dividends would predict.
Population change seems to be favorable to economic growth in Brazilin the near future. From 2010 to 2045, the demographic dividends (first +second) could raise GDP growth per effective consumer by 2.48% per year onaverage (Figure 7). On the contrary, developed countries studied by Mason(2005) will have a small or even negative contribution from the demographicdividends to economic growth. Population change provides an window ofopportunity that can either be used or not by countries.
There is evidence to support the view that the demographic transitionleads to an income boost, the gains from this association depend on severalconditions, including the ratio between producers and consumers, the de-gree of capital deepening, and the existence of appropriate institutions andeconomic policies. In Brazil, policy makers have been neglecting the oppor-tunities that changes in population dynamics can bring to the economy bymaintaining domestic policies that are less efficient than desired. The Brazil-ian case is remarkable because of the historical low levels of educationalattainment and the increasingly large pay-as-you-go pension systems.
8 Conclusion
This paper has shown that demographic changes might favor economic growthwhen appropriate policies and institutions are in place. We also have con-tributed to extend and deepen the knowledge of how much demographic
20
changes in Brazil can impact on economic growth. More specifically, we nowhave some understanding that the country is failing to take advantage ofthe positive impacts of the demographic dividends. In the last few decades,the Brazilian economy grew at much slower rates than what the demographicdividends alone would predict, contrary to the experience of other developingcountries (e.g. Asian countries).
One of the main findings of our work is that the demographic dividendsexplain 97% of GDP per effective consumer from 1970 to 2010. However, ourresults also indicate that the economy growth rate could have been greater ifthe country had taken advantage of the changes in population age structure.In addition to that, we find that most of the dividendsO contribution hap-pened in the 1970s, the last two decades have observed economic growth ratesmuch smaller than what demographic changes would predict. These findingsreveal that Brazilian policy makers have not made decisions to transformchanges in population age structure into economic growth. Moreover, if poli-cies are not adopted future benefits of the dividends will also be lost.
The second important finding is that we show that the first demographicdividend can be dividend into the familial (private) and fiscal (public) div-idends. The private dividend implies an improvement in living conditionsbecause there are more effective producers that effective consumers in thehousehold for a certain period of time. The fiscal dividend is related to thelarger number of potential contributors in relation to beneficiaries of publictransfers. As we show before, Brazil is characterized by large public transfersto the elderly resulting in a smaller dividend that lasts for a short period oftime. In other words, giving the current structure of public transfer sys-tem in Brazil, the government will observe a faster growth in the number ofbeneficiaries than contributors, and it will enjoy for a very short period thebenefits brought by the demographic transition.
In attempting to explore further benefits of demographic changes we alsosimulate future trends in the demographic dividends. Our results indicatethat the Brazilian economy can still benefit from population dynamics andboost economic growth. On one hand, the possible advantages from thefirst dividend will last until 2025, thus, there is still some time to elaboratepolicies to benefit from this opportunity. On the other hand, the benefitsfrom the second dividend are permanent but they will be realized only ifcapital deepening prevails. The experience of Asian economies should providesome insights on how to benefit from the demographic bonus. Investments inhuman capital and policies to incentive wealth accumulation should be top
21
priority for current and future governments.The second demographic dividend provides the country with a chance to
sustain reasonable economic growth. However, the realization of the seconddividend depends more heavily on proper policies than the first one. It isimportant that public policies in Brazil creates incentives to private savingsand that institutions are reliable for investors. Making public pension sys-tems large and generous might reduce the propensity to save, reducing thecapacity to invest, affecting economic growth.
The rapid process of population aging will have huge impacts on thesustainability of the Brazilian public transfer system (and familial supportnetwork). The increase in the old age dependency ratio means a larger num-ber of beneficiaries will depend on a smaller number of workers. The de-mographic problem is not the sole issue in this matter. Other research hasshown that large public transfer systems provide incentives for individuals toleave the labor force earlier, thus increasing dependency ratio, and crowding-out of private investing, affecting even further the fiscal dividend. The rapidpopulation aging, size and fiscal problems of public transfer systems in thedeveloped world led researchers to devote considerable attention to this prob-lem. However, developing countries are aging more rapidly than developedcountries, and social welfare programs will be asked to provide more supportthan they might be able to give.
22
References
Almeida, Ivan. 2001. “Gastos com Educacao no Periodo de 1994 a 1999.”Revista Brasileira de Estudos Pedagogicos 82.
Araujo, Tatiana, Cassio Turra, and Bernardo Queiroz. 2010. “Intergener-ational equity in Brazil: social security and public education transfersbetween generations born 1923 to 2000.” Working Paper.
Becker, Gary and Kevin Murphy. 1988. “The Family and the State.” Jour-
nal of Law and Economics 21.
Bixby, Luis Rosero and Arodys Robles. 2008. “Los dividendos demograficosy la economıa del ciclo vital en Costa Rica.” Papeles de Poblacion 55:9–34.
Bloom, David and David Canning. 2001. “Cumulative Causality, EconomicGrowth and Demographic Transition.” In Population Matters: Demo-
graphic Change, Economic Growth and Poverty in Developing Coun-
tries, edited by Nancy Birdsall, Allen Kelley, and Steve Sinding, pp.165–197. Oxford University Pres.
Bloom, David and David Canning. 2004. “Global Demographic Change:dimensions and economic significance.” Technical Report 10817,NBER. Available at: www.nber.org/papers/w10817.
Bloom, David, David Canning, and Jaypee Sevilla. 2003. Demographic
Divided: New Perspective on Economic Consequences Population
Change. RAND.
Bloom, David and Jeffrey Williamson. 1997. “Demographic Transition andEconomic Miracles in Emerging Asia.” Technical Report 6268, NBER.Available at: www.nber.org/papers/w6268.
Bonelli, Regis and Renato Fonseca. 1998. “Ganhos de Produtividade ede Eficiencia: novos resultados para a economia brasileira.” TechnicalReport 557, IPEA.
Bongaarts, John. 2004. “Population Aging and the Rising Costs of PublicPensions.” Population and Development Review 30:1–23.
Brazil. 2002. “Livro Branco da Previdencia Social.” Technical report, Min-isterio da Previdencia Social.
Brazil. 2003. “Gasto Social do Governo Central: 2001 e 2002.” Technicalreport, Ministerio da Fazenda - Secretaria de Politica Economica.
23
Camargo, Jose Marcio. 2004. “Polıtica Social no Brasil: prioridades er-radas, incentivos perversos.” Sao Paulo em Perspectiva 18:68–77.
Cutler, David, James Poterba, Louise Sheiner, Larry Summers, and GeorgeAkerlof. 1990. “An Aging Society: Opportunity or Challenge.” Brook-
ings Papers on Economic Activity 1990:1–73.
de Carvalho, Jose Alberto Magno. 1997/1998. “Demographic Dynamics inBrazil: Recent Trends and Perspectives.” Brazilian Journal of Popula-
tion Studies 1.
de Carvalho, Jose Alberto Magno and Laura Wong. 1999. “Demographicand Socioeconomic Implications of Rapid Fertility Decline in Brazil: awindow of opportunity.” In Reproductive Change in India and Brazil ,edited by George Martine, M. Gupta, and L. Chen. Oxford UniversityPress.
Deaton, Angus. 1997. The Analysis of Household Surveys: a microeco-
nomic approach to development policy . The Johns Hopkins UniversityPress.
e Francisco Ferreira, Jose Marcio Camargo. 2002. “Missing the Target:assessing social expenditures in Brazil.” The Brown Journal of World
Affairs VIII.
Fair, Ray and Kathryn Dominguez. 1991. “Effects of the Changing U.S.Age Distribution on Macroeconomic Equations.” The American Eco-
nomic Review 81:1276–1294.
Ferreira, Francisco and Ricardo Paes de Barros. 1999. “The Slippery Slope:explaining the increase in extreme poverty in urban Brazil, 1976-1996.”The Brazilian Review of Econometrics 19.
Ferreira, Francisco, Peter Lanjouw, and Marcelo Neri. 2003. “A Ro-bust Poverty Profile for Brazil Using Multiple Data Sources.” Revista
Brasileira de Economia 57:59–92.
Lee, Ronald. 1994. “The Formal Demography of Population Aging, Trans-fers, and the Economic Life Cycle.” In The Demography of Aging ,edited by Linda Martin and Samuel Preston, pp. 8–49. NationalAcademy Press.
Lee, Ronald. 2003a. “Demographic Change, Wellfare, and Intergenera-tional Transfers: a global overview.” Genus LIX:43–70.
24
Lee, Ronald. 2003b. “The Demographic Transition: Three Centuries ofFundamental Change.” Journal of Economic Perspectives 17.
Lee, Ronald and Andrew Mason. 2004. “Macroeconomic Demography ofIntergenerational Transfers.” Grant Proposal, National Institute onAging.
Lee, Ronald, Andrew Mason, and Tim Miller. 2003. “Saving, Wealth andthe Transition from Transfers to Individual Responsibility: the casesof Taiwan and the United States.” The Scandinavian Journal of Eco-
nomics 105:339–357.
Mankiw, Gregory and David Weil. 1989. “The Baby Boom, the BabyBust, and the Housing Market.” Regional Science and Urban Eco-
nomics 19:235–258.
Mason, Andrew. 2005. “Demographic Transition and Demographic Divi-dends in Developed and Developing Countries.” United Nations ExpertGroup Meeting on Social and Economic Implications of Changing Pop-ulation Age Structures.
Mason, Andrew and Ronald Lee. Forthcoming. “Reform and support sys-tems for the elderly in developing countries: capturing the second de-mographic dividend.” Genus .
Mason, Andrew and Feng Wang. 2005. “Demographic Dividends in China’spost-reform Economy.” XXV IUSSP General Population Conference.
Preston, Samuel, Patrick Heuveline, and Michel Guillot. 2001. Demogra-
phy: Measuring and Modelling Population Processes. Blackwell Pub-lishers.
Pritchett, Lant. 1997. “Divergence, Big Time.” Journal of Economic Per-
spectives 11:3–17.
Queiroz, Bernardo. 2005. Labor Force Participation and Retirement Be-
havior in Brazil . Ph.D. thesis, University of California at Berkeley.
Queiroz, Bernardo, Cassio Turra, and Elisenda Perez. 2006. “The Opportu-nities we cannot forgo: economic consequences of populations changesin Brazil.” In XV Encontro Nacional de Estudos Populacionais . ABEP.
Rios-Neto, Eduardo L. 2004. “Diagnostico Demografico e Socioeconomicodo Brasil.” In Projeto Brasil 3 Tempos: 2007, 2015, 2022 . Centro dePesquisa Economica e Social da Universidade de Brasilia.
25
Saad, Paulo, Tim Miller, and Ciro Martinez. 2009. “Impacto de los cambiosdemograficos en las demandas sectoriales de America Latina.” Revista
Brasileira de Estudos Populacionais 26:237–261.
Schwartzman, Simon. 2003. “The challenges of education in Brazil.”Workin Paper, Center for Brazilian Studies, Oxford University.
Soares, Fabio Veras. 2004. “Some Stylized Facts of the Informal Sector inBrazil in the 1980’s and 1990’s.” Texto para Discussao do IPEA no.1020.
Turra, Cassio. 2000. Contabilidade das Geracoes: riqueza, sistema de
transferencias e consequencias de mudancas do padrao demografico.Master’s thesis, CEDEPLAR-UFMG.
Turra, Cassio and Bernardo Queiroz. 2005. “Intergenerational Transfersand Socioeconomic Inequality in Brazil: a first look.” Notas de Pobla-
cion pp. 1–25.
Turra, Cassio and Bernardo Queiroz. 2009. “Before it’s too late: Demo-graphic Transition, Labor Supply, and Social Security Problems inBrazil.” Notas de Poblacion 86:141–165.
Turra, Cassio, Bernardo Queiroz, and Eduardo Rios-Neto. 2010. “Idyosyn-crasies of Intergeneratational Transfers in Brazil.” chapter prepared tothe NTA Book.
Turra, Cassio and Eduardo Rios-Neto. 2001. “Intergenerational Account-ing and Economic Consequences of Aging in Brazil.” Paper presentedat the XXIV IUSSP General Population Conference.
Wong, Laura Rodriguez and Jose Alberto M. de Carvalho. 2005. “AgeStructural Transition in Brazil - Demographic Bonuses and EmergingChallenges.” Paper Presented at the IUSSP XXV International Popu-lation Conference.
26
Variable 1976 1981 1985 1996 2003 2006GDP per Capita (U$ 2009) 5719 6252 6349 6792 6974 7616Annual Inflation Rate (%) 46.2 95.20 235.13 9.33 7.66 3.79Unemployment Rate(%) 1.82 4.26 3.38 9.95 5.24 9.2Average Years Schooling 3.23 3.9 4.3 5.4 6.3 6.6
Formal Employment Rate (%) 57 41 39 55 58 52Gini Index 0.62 0.58 0.59 0.60 0.58 0.56
Economic Growth (a.a.%) 10.26 -4.25 7.85 2.66 0.54 2.7
Source: Ferreira and de Barros (1999) and Ipeadata, 2010
Table 1: General Economic Indicators, Brazil, 1976-2006 (selected years)
27
Period Support Ratio GDP per Capita Effective Consumer GDP per Consumer Ratio1970-1975 0.305 7.13 2.32 7.27 4.281975-1980 0.285 4.6 2.39 4.56 6.201980-1985 0.626 -1.03 1.87 -0.61 60.611985-1990 0.593 -0.09 1.94 -0.08 680.321990-1995 0.734 1.32 1.67 1.26 55.621995-2000 0.717 0.49 1.69 0.3 147.272000-2005 0.738 1.38 1.13 1.62 53.432005-2010 0.557 2.06 1.03 1.9 27.051970-2010 0.569 1.98 1.76 2.03 28.72
Source: Ipeadata, 2010 and Author’s Estimates based on Brazilian PPV
Table 2: Growth Rates of the support ratio and GDP per effective consumer, Brazil, 1970-2010
28
Period GDP per Consumer First Dividend Second Dividend Total Dividend Dividend/Actual1970-1975 7.72 0.305 2.37 2.675 0.371975-1980 4.56 0.285 2.51 2.795 0.611980-1985 -0.61 0.626 1.96 2.5861985-1990 -0.08 0.593 1.85 2.4431990-1995 1.26 0.734 1.08 1.814 1.441995-2000 0.3 0.717 0.95 1.667 5.62000-2005 1.62 0.738 0.13 0.868 0.542005-2010 1.9 0.557 0.92 1.477 0.781970-2010 2.03 0.569 1.41 1.979 0.97
Source: Ipeadata, 2010 and Author’s Estimates based on Brazilian PPV
Table 3: Estimates of First and Second Dividends, Brazil, 1970-2010
29

Year
e0
Life Expectancy at Birth
1950 1970 1990 2010 2030 2050
4555
6575
85
Year
TF
R
Total Fertility Rate
1950 1970 1990 2010 2030 2050
12
34
56
7
Age
Per
cent
age
Population Age Structure
0 10 20 30 40 50 60 70 80 90+
01
23
199020102050
SOURCE: Authors’ Calculations, based on IBGE Population ProjectionsYear
Rat
io
Dependency Ratios
1970 1980 1990 2000 2010 2020 2030 2040 2050
020
4060
8010
0
TotalYouthOld Age
Figu
re1:
Dem
ographic
Tran
sitionin
Brazil,
1950-2050
30
Age
Rea
is
0 10 20 30 40 50 60 70 80 90
010
0020
0030
0040
0050
0060
0070
00
IncomeConsumption
Figu
re2:
Incom
ean
dC
onsu
mption
Age
Profi
les,B
razil,1996
31
Year
Div
iden
d
1975 1980 1985 1990 1995 2000 2005 2010 2015 2020 2025 2030 2035 2040 2045 2050
−1.
0−
0.8
−0.
6−
0.4
−0.
20.
00.
20.
40.
60.
81.
0First Dividend
Figu
re3:
First
Dem
ographic
Div
iden
d,B
razil,1970-2045
32
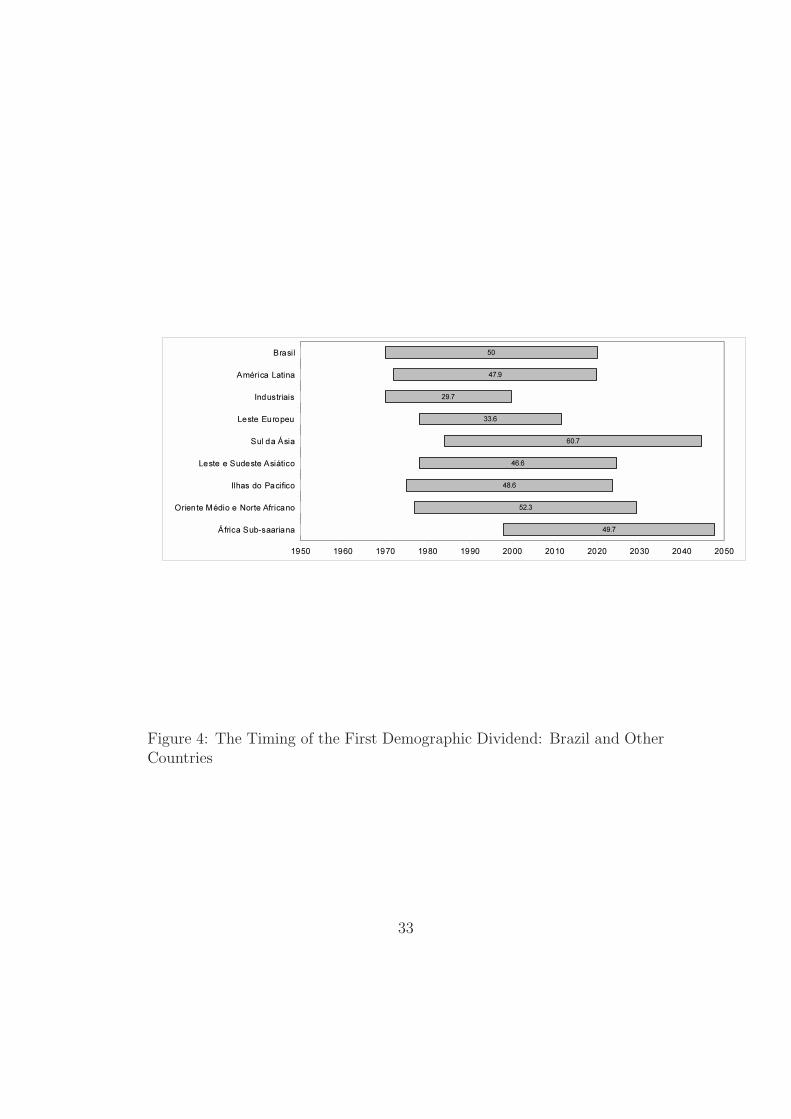
Figure 4: The Timing of the First Demographic Dividend: Brazil and OtherCountries
33
Year
Div
iden
ds
1970 1975 1980 1985 1990 1995 2000 2005 2010 2015 2020 2025 2030 2035 2040 2045 2050
−1.
50−
1.00
−0.
500.
000.
501.
001.
50
PublicPrivate
Figu
re5:
Public
and
Private
First
Dem
ographic
Div
iden
d,B
razil,1970-2045
34
Year
Wea
lth/O
utpu
t
1970 1975 1980 1985 1990 1995 2000 2005 2010 2015 2020 2025 2030 2035 2040 2045 2050
0.00
0.06
0.12
0.18
0.24
0.30
0.36
0.42
0.48
Ratio
Figu
re6:
Estim
atesof
Wealth
(50+)
toTotal
Outp
ut,
Brazil,
1970-2045
35
Year
Div
iden
d
1975 1980 1985 1990 1995 2000 2005 2010 2015 2020 2025 2030 2035 2040 2045 2050
0.00
0.50
1.00
1.50
2.00
2.50
3.00
3.50
4.00
Second Dividend
Figu
re7:
Secon
dD
emograp
hic
Div
iden
d,B
razil,1970-2045
36
Year
% o
f GD
P
1933 1937 1941 1945 1949 1953 1957 1961 1965 1969 1973 1977 1981 1985 1989 1993 1997 2001
02
46
810
12
EducationPension
Figu
re8:
Public
Expen
ditu
reon
Pen
sionan
dE
ducation
,as
%of
GD
P,
Brazil,
1933-2001
37
Age
Reais
010
2030
4050
6070
8090
−6000 −4500 −3000 −1500 0 1000 2500 4000 5500
Private
Public
Figure 9: Public and Private Net Transfers by age, Brazil
38
Related Documents