Valuation of Energy Storage with Wind Generation Clay D. Davis Douglas J. Gotham Paul V. Preckel State Utility Forecasting Group August 2013

Welcome message from author
This document is posted to help you gain knowledge. Please leave a comment to let me know what you think about it! Share it to your friends and learn new things together.
Transcript
Valuation of Energy Storage with Wind Generation Clay D. Davis Douglas J. Gotham Paul V. Preckel State Utility Forecasting Group August 2013

State Utility Forecasting Group Page 1
EXECUTIVE SUMMARY
The recent increase in intermittent forms of electricity generation (wind and solar) elevates the importance of development and adoption of fast responding energy storage resources, such as battery storage, flywheels, and compressed air storage, which are capable of quickly responding to fluctuations in output. Simultaneously considering multiple sources of value for energy storage not only more accurately determines the value of this resource, but also shows the tradeoffs between multiple revenue streams competing for the device’s limited resources (i.e. capacity, charging rate, etc.). This report provides a methodology to value battery storage considering multiple sources of value, by co-locating storage with an intermittent form of generation. Comparison across functions is necessary in order to determine the best use for energy storage and the tradeoffs among the various uses.
The report explains the development of a model to determine the value of energy storage co-located with wind. Sources of value modeled are participation in the day-ahead, real-time, and regulation markets, as well as optimal sizing of the transmission line connecting the wind/storage site to the rest of the transmission network. Actual wind generation and market data from the PJM Western Hub were used.
The results of this report conclude that battery storage is too expensive to be competitive, given the current state of battery technology, both in terms of cost and technology, and wholesale electricity market conditions. In order to make the battery economic, a reduction in battery cost of 55 percent is required. In the future a breakthrough in battery technology may lead to large reductions in cost or market conditions may change to benefit energy storage. In the model developed in this study, improvements in battery charging and discharging efficiency and increased variability in market prices resulted in the largest impact on profit.
Sensitivity analysis on certain key parameters showed the impacts these parameters have on modeling results and is an important part of any modeling where variation in parameter values is concerned. Given the current state of battery storage technology no level of battery capacity is optimal in the setting considered in this report, but wind site characteristics (wind variability) and market conditions (price variability) had non-trivial impacts on profitability and the optimal level of installed battery storage. Sensitivity analysis highlights the importance of project specific characteristics when determining the optimal level and profitability of large scale battery storage.
State Utility Forecasting Group Page 2
INTRODUCTION
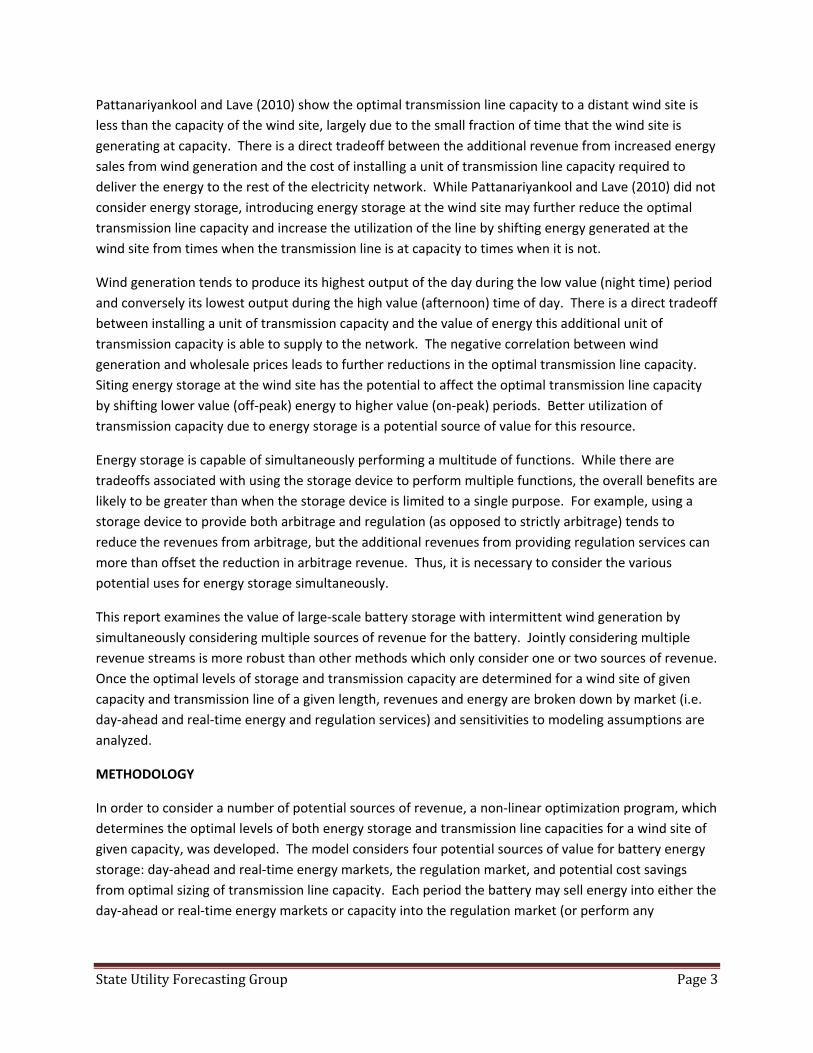
The recent increase in intermittent forms of electricity generation (wind and solar) elevates the importance of development and adoption of fast responding energy storage resources, such as battery storage, flywheels, and compressed air storage, which are capable of quickly responding to fluctuations in output. In a report titled “20% Wind Energy by 2030” the United States Department of Energy assembled a group to assess the likely effects of wind generation providing 20 percent of electricity consumption by 2030 (DOE, 2008). In a later study, Denholm et al. (2010) concluded that wind penetrations at these levels would increase the flexibility requirements of the system: likely creating market opportunities for fast responding energy storage technologies. A primary benefit of energy storage is its ability to serve the electricity system in multiple roles (arbitrage, ancillary services, congestion relief) simultaneously. In order to determine the likely adoption of various energy storage technologies, methods to accurately determine their benefits are required. Energy arbitrage (storing energy during low priced periods and selling during periods of high electricity prices) was one of the original uses for energy storage. Due to the strong diurnal pattern exhibited by load, electricity prices tend to exhibit a similar daily cycle with high loads generally corresponding to high prices. Temporal arbitrage via energy storage capitalizes on this daily cycle by storing low priced energy during the late night and early morning hours for sale during the higher priced afternoon periods. It may also be possible for energy storage to profit from arbitrage on less than a daily time frame.
Participation in markets for ancillary services also shows promise for energy storage. Ancillary services are resources used to keep real-time supply and demand in balance and can be characterized by three types: regulation, spinning reserves, and non-spinning reserves. These three types of services are differentiated by the amount of time required to respond, with regulation requiring participants to respond in a matter of seconds, spinning reserves within ten minutes, and non-spinning reserves responding within the hour. Regulation is generally the most valuable of the three types due to the short response time required for resources providing this service. Energy storage is particularly well suited to providing regulation due to fast response times and generally low levels of energy delivered. A low level of actual energy being supplied is particularly beneficial to energy storage because it allows the device to use the majority of the energy stored for arbitrage purposes.
Providing congestion relief to existing transmission lines and backup power for line outages are potential additional sources of value for energy storage. Storage can relieve congestion on transmission lines and possibly postpone the need for transmission capacity additions. Using energy storage as a source of backup power also has the ability to reduce system damage due to outages.
In order to meet a 20 percent wind share of generation by 2030 goal, significant increases in transmission capacity will be required to deliver wind generation to load centers (DOE, 2008). While multiple studies (Denholm et al., 2010; Sioshansi et al., 2009) claim locating storage near the load (as opposed to at the wind site) results in higher system value, this may not be true when considering the potential reduction to new transmission capacity requirements due to locating storage at the wind site.
State Utility Forecasting Group Page 3
Pattanariyankool and Lave (2010) show the optimal transmission line capacity to a distant wind site is less than the capacity of the wind site, largely due to the small fraction of time that the wind site is generating at capacity. There is a direct tradeoff between the additional revenue from increased energy sales from wind generation and the cost of installing a unit of transmission line capacity required to deliver the energy to the rest of the electricity network. While Pattanariyankool and Lave (2010) did not consider energy storage, introducing energy storage at the wind site may further reduce the optimal transmission line capacity and increase the utilization of the line by shifting energy generated at the wind site from times when the transmission line is at capacity to times when it is not.
Wind generation tends to produce its highest output of the day during the low value (night time) period and conversely its lowest output during the high value (afternoon) time of day. There is a direct tradeoff between installing a unit of transmission capacity and the value of energy this additional unit of transmission capacity is able to supply to the network. The negative correlation between wind generation and wholesale prices leads to further reductions in the optimal transmission line capacity. Siting energy storage at the wind site has the potential to affect the optimal transmission line capacity by shifting lower value (off-peak) energy to higher value (on-peak) periods. Better utilization of transmission capacity due to energy storage is a potential source of value for this resource.
Energy storage is capable of simultaneously performing a multitude of functions. While there are tradeoffs associated with using the storage device to perform multiple functions, the overall benefits are likely to be greater than when the storage device is limited to a single purpose. For example, using a storage device to provide both arbitrage and regulation (as opposed to strictly arbitrage) tends to reduce the revenues from arbitrage, but the additional revenues from providing regulation services can more than offset the reduction in arbitrage revenue. Thus, it is necessary to consider the various potential uses for energy storage simultaneously.
This report examines the value of large-scale battery storage with intermittent wind generation by simultaneously considering multiple sources of revenue for the battery. Jointly considering multiple revenue streams is more robust than other methods which only consider one or two sources of revenue. Once the optimal levels of storage and transmission capacity are determined for a wind site of given capacity and transmission line of a given length, revenues and energy are broken down by market (i.e. day-ahead and real-time energy and regulation services) and sensitivities to modeling assumptions are analyzed.
METHODOLOGY
In order to consider a number of potential sources of revenue, a non-linear optimization program, which determines the optimal levels of both energy storage and transmission line capacities for a wind site of given capacity, was developed. The model considers four potential sources of value for battery energy storage: day-ahead and real-time energy markets, the regulation market, and potential cost savings from optimal sizing of transmission line capacity. Each period the battery may sell energy into either the day-ahead or real-time energy markets or capacity into the regulation market (or perform any

State Utility Forecasting Group Page 4
combination of these three functions). While the battery may sell its resources into multiple markets, it is restricted to charging from energy generated by the wind site.
This section explains the basic model structure used for the analysis. For a more rigorous and detailed treatment of the model structure, the reader is referred to Clay Davis’s doctoral dissertation (Davis, 2013). The objective of the model is to maximize the profit of operating a wind site in combination with a battery energy storage system, while determining the optimal capacities of the battery system and connecting transmission line.
Battery parameters captured in the model include the battery charging and discharging efficiency, where the charging efficiency is the amount of energy stored in the battery per unit of charging and discharging efficiency is the amount of power supplied per unit of discharging. Round trip efficiency is the product of charging and discharging efficiencies. Additional battery parameters are maximum charging and discharging rates and maximum battery storage capacity. These three parameters are expressed on a per MW of installed battery capacity basis and are increased by increasing the level of battery capacity installed at the wind site. The remaining battery parameters are the annualized cost of batteries per MW and the total number of charge/discharge cycles in the lifetime of a battery.
Market parameters include the locational marginal price (LMP) in the day-ahead and real-time markets and the market clearing price for regulation. These three parameters are specified for each hour of the analysis. A related parameter is the “dispatch to contract” ratio for regulation, which is the amount of energy supplied for regulation divided by the amount of regulation services capacity supplied to the market during a given period of time.
The transmission cost function is non-linear due to certain components of transmission line cost, such as right-of-way and tower costs, that do not vary with the capacity of the transmission line. Transmission cost is an exponential function of line capacity and linear in line length. The wind parameter is the quantity of wind generated at the wind site for each hour of the analysis.
Time granulation is set at one hour – i.e. a time period is an hour. This does not account for charge/discharge cycles within the hour, which are assumed to be relevant only for regulation purposes. In each period decisions are made as to the level of battery charging and discharging and the level of capacity sold into the regulation market. The decision variable is the amount of energy stored in the battery from the wind site in each hour. While one variable determines the level of energy stored in the battery, discharging of the battery may occur through three methods: selling energy into the day-ahead market, selling energy into the real-time market, or energy supplied by selling capacity into the regulation market. Model decision variables are shown in Table 1.
State Utility Forecasting Group Page 5
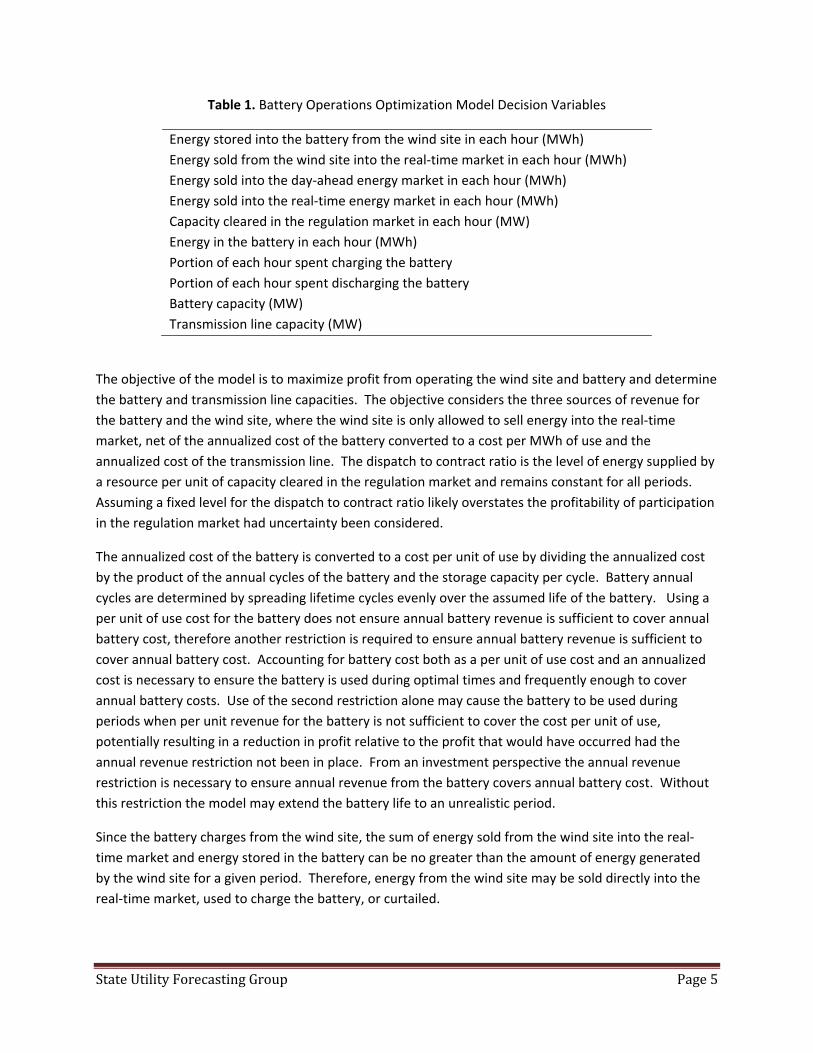
Table 1. Battery Operations Optimization Model Decision Variables
Energy stored into the battery from the wind site in each hour (MWh) Energy sold from the wind site into the real-time market in each hour (MWh) Energy sold into the day-ahead energy market in each hour (MWh) Energy sold into the real-time energy market in each hour (MWh) Capacity cleared in the regulation market in each hour (MW) Energy in the battery in each hour (MWh) Portion of each hour spent charging the battery Portion of each hour spent discharging the battery Battery capacity (MW) Transmission line capacity (MW)
The objective of the model is to maximize profit from operating the wind site and battery and determine the battery and transmission line capacities. The objective considers the three sources of revenue for the battery and the wind site, where the wind site is only allowed to sell energy into the real-time market, net of the annualized cost of the battery converted to a cost per MWh of use and the annualized cost of the transmission line. The dispatch to contract ratio is the level of energy supplied by a resource per unit of capacity cleared in the regulation market and remains constant for all periods. Assuming a fixed level for the dispatch to contract ratio likely overstates the profitability of participation in the regulation market had uncertainty been considered.
The annualized cost of the battery is converted to a cost per unit of use by dividing the annualized cost by the product of the annual cycles of the battery and the storage capacity per cycle. Battery annual cycles are determined by spreading lifetime cycles evenly over the assumed life of the battery. Using a per unit of use cost for the battery does not ensure annual battery revenue is sufficient to cover annual battery cost, therefore another restriction is required to ensure annual battery revenue is sufficient to cover annual battery cost. Accounting for battery cost both as a per unit of use cost and an annualized cost is necessary to ensure the battery is used during optimal times and frequently enough to cover annual battery costs. Use of the second restriction alone may cause the battery to be used during periods when per unit revenue for the battery is not sufficient to cover the cost per unit of use, potentially resulting in a reduction in profit relative to the profit that would have occurred had the annual revenue restriction not been in place. From an investment perspective the annual revenue restriction is necessary to ensure annual revenue from the battery covers annual battery cost. Without this restriction the model may extend the battery life to an unrealistic period.
Since the battery charges from the wind site, the sum of energy sold from the wind site into the real-time market and energy stored in the battery can be no greater than the amount of energy generated by the wind site for a given period. Therefore, energy from the wind site may be sold directly into the real-time market, used to charge the battery, or curtailed.

State Utility Forecasting Group Page 6
Since the battery may charge and discharge within a given hour, but not complete both tasks simultaneously, the portion of the hour spent charging and discharging are separately accounted for in the model. The sum of the portion of the hour spent charging and the portion spent discharging cannot exceed one.
The energy stored from the wind site into the battery during a given period is restricted by the lesser of the maximum charging rate times the proportion of the hour spent charging and the wind generated by the wind site. Similarly, the restriction on total energy supplied by the battery to each of the three markets during a given hour may be no greater than the product of the maximum discharge rate and proportion of the hour spent discharging.
The transmission line limits the total flow of energy from the combination battery and wind site.
SOLUTION METHOD
The optimization program is solved for a variety of transmission line and battery capacities, ranging from zero to the capacity of the wind site. This solution method involves solving the program multiple times and choosing the combination of transmission line and battery capacities which results in the largest profit.
DATA AND PARAMETER ESTIMATES
Modeling results are largely driven by electricity price data over time, parameter estimates for the battery and transmission line, and wind generation data. Prices for the day-ahead and real-time markets are from PJM Western Hub over the period September 2011 through August 2012 (PJM, 2012a,b). PJM Western Hub prices are chosen due to the relatively large amounts of existing wind capacity located in close proximity to this pricing point. Regulation market clearing prices are also from PJM during the same period September 2011 through August 2012 (PJM, 2012c). Summary statistics of prices in the three markets are shown below in Table 2. Mean prices in the day-ahead and real-time markets are nearly equal, although the standard deviation of real-time prices is dramatically larger, indicating that real-time prices are more volatile. Using prices and/or wind generation from different locations may impact the profitability of energy storage. The results section includes sensitivities on parameters likely to have a large impact on the profitability of battery storage.
State Utility Forecasting Group Page 7
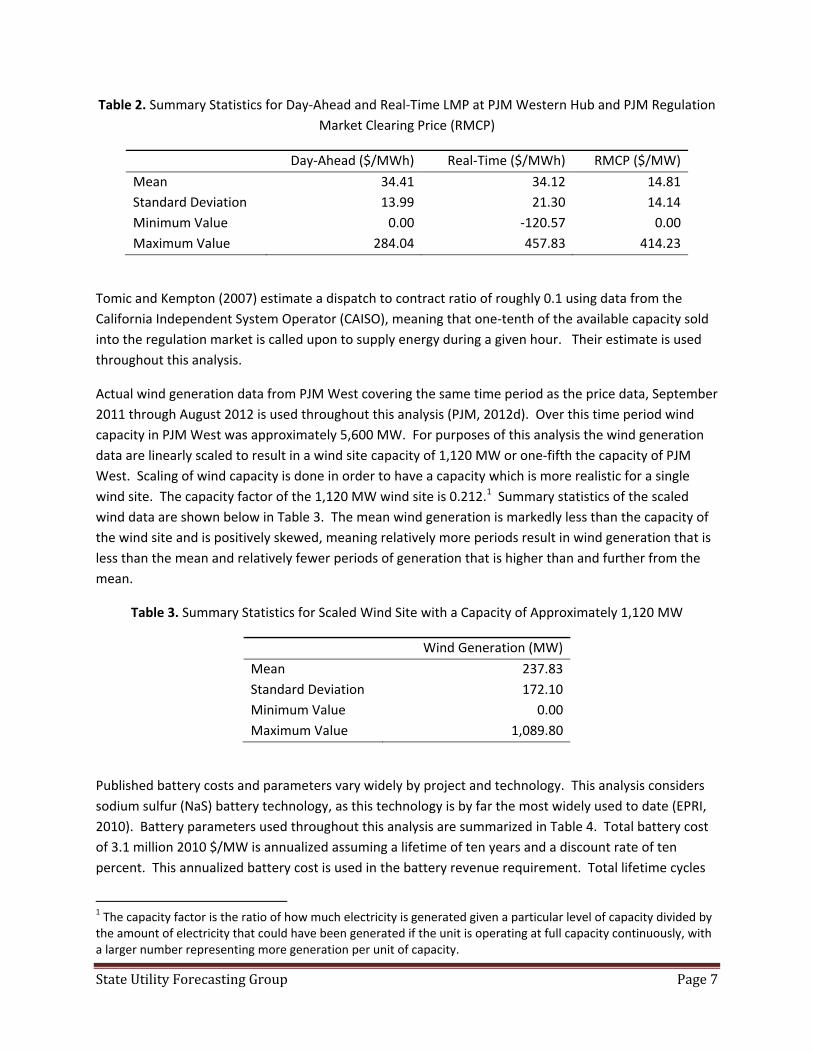
Table 2. Summary Statistics for Day-Ahead and Real-Time LMP at PJM Western Hub and PJM Regulation Market Clearing Price (RMCP)
Day-Ahead ($/MWh) Real-Time ($/MWh) RMCP ($/MW)
Mean 34.41 34.12 14.81Standard Deviation 13.99 21.30 14.14Minimum Value 0.00 -120.57 0.00Maximum Value 284.04 457.83 414.23
Tomic and Kempton (2007) estimate a dispatch to contract ratio of roughly 0.1 using data from the California Independent System Operator (CAISO), meaning that one-tenth of the available capacity sold into the regulation market is called upon to supply energy during a given hour. Their estimate is used throughout this analysis.
Actual wind generation data from PJM West covering the same time period as the price data, September 2011 through August 2012 is used throughout this analysis (PJM, 2012d). Over this time period wind capacity in PJM West was approximately 5,600 MW. For purposes of this analysis the wind generation data are linearly scaled to result in a wind site capacity of 1,120 MW or one-fifth the capacity of PJM West. Scaling of wind capacity is done in order to have a capacity which is more realistic for a single wind site. The capacity factor of the 1,120 MW wind site is 0.212.1 Summary statistics of the scaled wind data are shown below in Table 3. The mean wind generation is markedly less than the capacity of the wind site and is positively skewed, meaning relatively more periods result in wind generation that is less than the mean and relatively fewer periods of generation that is higher than and further from the mean.
Table 3. Summary Statistics for Scaled Wind Site with a Capacity of Approximately 1,120 MW
Wind Generation (MW)
Mean 237.83Standard Deviation 172.10Minimum Value 0.00Maximum Value 1,089.80
Published battery costs and parameters vary widely by project and technology. This analysis considers sodium sulfur (NaS) battery technology, as this technology is by far the most widely used to date (EPRI, 2010). Battery parameters used throughout this analysis are summarized in Table 4. Total battery cost of 3.1 million 2010 $/MW is annualized assuming a lifetime of ten years and a discount rate of ten percent. This annualized battery cost is used in the battery revenue requirement. Total lifetime cycles
1 The capacity factor is the ratio of how much electricity is generated given a particular level of capacity divided by the amount of electricity that could have been generated if the unit is operating at full capacity continuously, with a larger number representing more generation per unit of capacity.

State Utility Forecasting Group Page 8
are assumed to be spread evenly over the ten year lifetime of the battery to convert the $/MW-yr cost to $/MWh. Battery cost is converted from $/MW-yr to $/MWh by dividing the annualized cost by annual cycles times MWhs stored per unit of battery capacity times battery capacity.
Table 4. Summary of Sodium-sulfur Battery Cost and Parametersg
Cost (million 2010 $/MW) 3.1 Annualized Cost (2010 $/MW-yr) 504,511h Variable Cost (2010 $/MWh) 186.86 Capacity (MWh/MW) 6 Charge/Discharge Rate (MWh/hr/MW) 1 Round trip efficiency 0.88 Total lifetime cycles 4,500
g Battery cost and technology parameters p.4-22 (EPRI 2010). h Battery cost is annualized assuming a battery lifetime of 10 years and discount rate of 10 percent.
Pattanariyankool and Lave (2010) estimate transmission line cost per kilometer as a function of capacity (MW) using ordinary least squares regression. The function and parameter values estimated in their paper are used in this analysis and shown below. 10.0841 0.5759
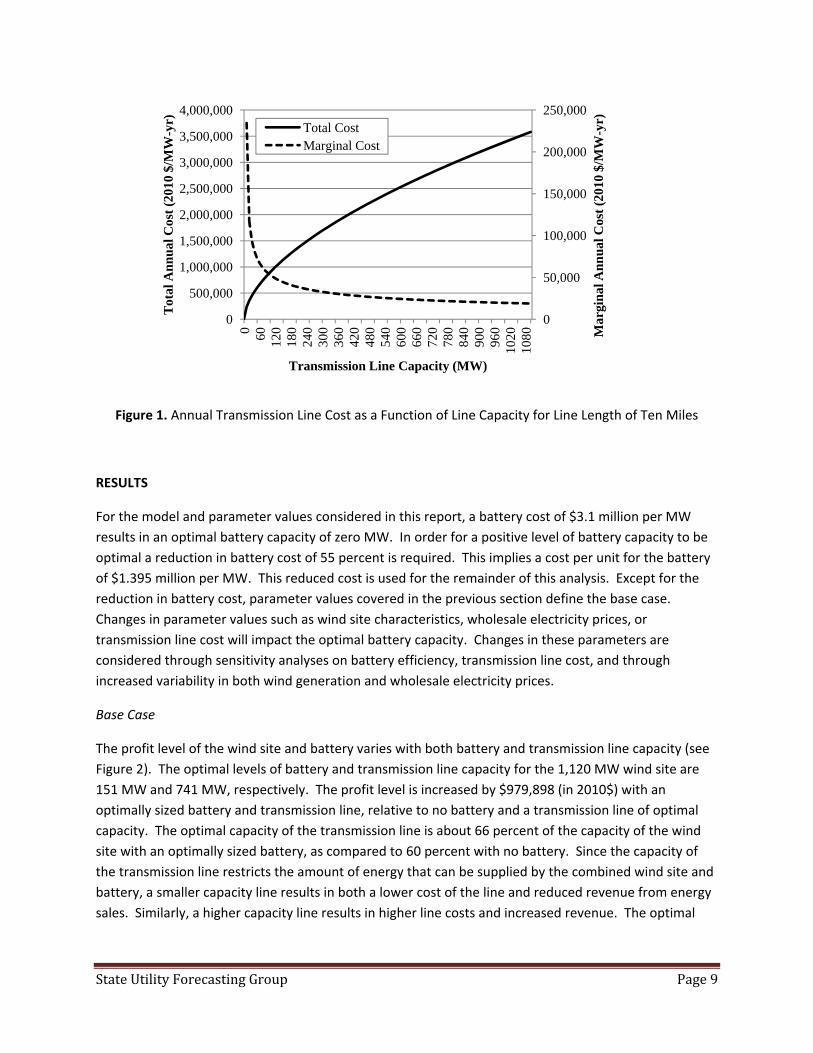
This analysis assumes a transmission line of ten-mile length is required to connect the wind site to the transmission network. Therefore the cost function estimated by Pattanariyankool and Lave (2010) is converted from cost per kilometer to cost per mile. For purposes of this analysis, the total cost function is annualized using a lifetime of 40 years and discount rate of ten percent. The non-linear shape of the cost function exhibits transmission line costs increasing with capacity, but at a decreasing rate (shown below in Figure 1). Therefore, each successive unit of transmission line capacity costs less than the unit before it.
State Utility Forecasting Group Page 9
Figure 1. Annual Transmission Line Cost as a Function of Line Capacity for Line Length of Ten Miles
RESULTS
For the model and parameter values considered in this report, a battery cost of $3.1 million per MW results in an optimal battery capacity of zero MW. In order for a positive level of battery capacity to be optimal a reduction in battery cost of 55 percent is required. This implies a cost per unit for the battery of $1.395 million per MW. This reduced cost is used for the remainder of this analysis. Except for the reduction in battery cost, parameter values covered in the previous section define the base case. Changes in parameter values such as wind site characteristics, wholesale electricity prices, or transmission line cost will impact the optimal battery capacity. Changes in these parameters are considered through sensitivity analyses on battery efficiency, transmission line cost, and through increased variability in both wind generation and wholesale electricity prices.
Base Case
The profit level of the wind site and battery varies with both battery and transmission line capacity (see Figure 2). The optimal levels of battery and transmission line capacity for the 1,120 MW wind site are 151 MW and 741 MW, respectively. The profit level is increased by $979,898 (in 2010$) with an optimally sized battery and transmission line, relative to no battery and a transmission line of optimal capacity. The optimal capacity of the transmission line is about 66 percent of the capacity of the wind site with an optimally sized battery, as compared to 60 percent with no battery. Since the capacity of the transmission line restricts the amount of energy that can be supplied by the combined wind site and battery, a smaller capacity line results in both a lower cost of the line and reduced revenue from energy sales. Similarly, a higher capacity line results in higher line costs and increased revenue. The optimal
0
50,000
100,000
150,000
200,000
250,000
0
500,000
1,000,000
1,500,000
2,000,000
2,500,000
3,000,000
3,500,000
4,000,000
0 60 120
180
240
300
360
420
480
540
600
660
720
780
840
900
960
1020
1080 M
argi
nal
An
nu
al C
ost
(201
0 $/
MW
-yr)
Tot
al A
nn
ual
Cos
t (2
010
$/M
W-y
r)
Transmission Line Capacity (MW)
Total CostMarginal Cost

State Utility Forecasting Group Page 10
transmission capacity for a given battery size occurs when either a reduction or an increase in transmission capacity results in lower profits.
Figure 2. Profit as a Function of Battery and Transmission Line Capacity
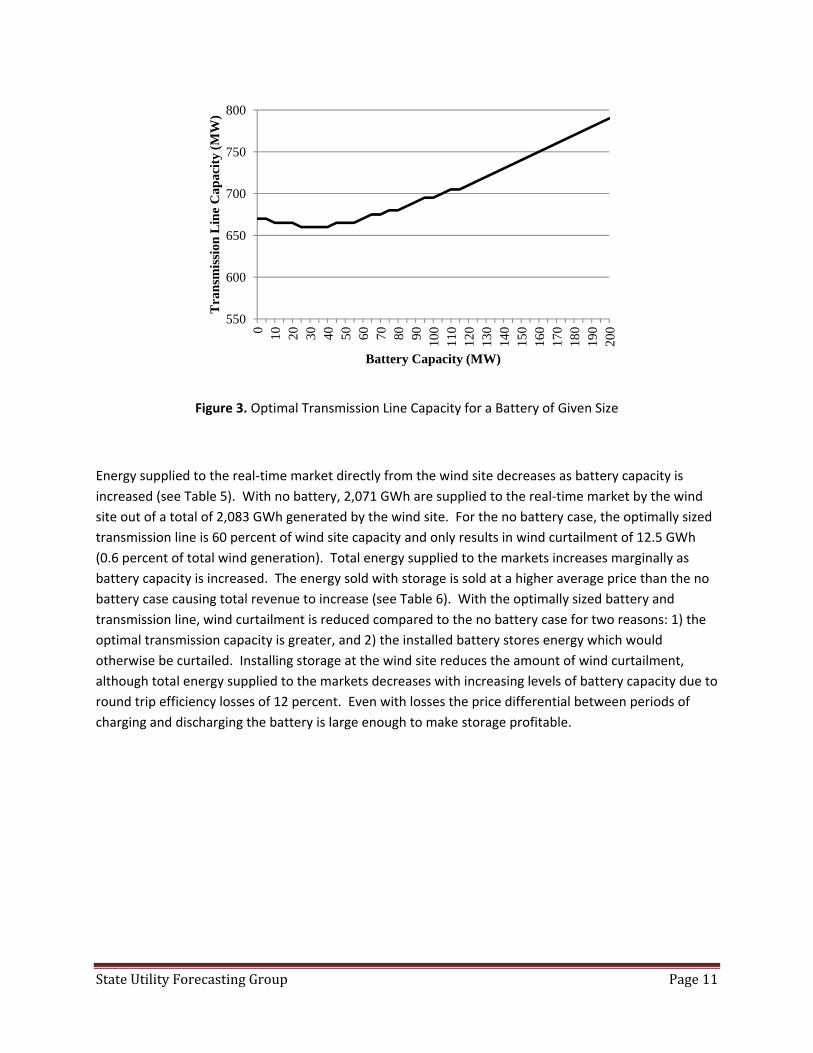
Figure 3 shows the optimal transmission line capacity for a given level of battery capacity initially decreasing with increasing battery capacity, but increasing for battery capacity levels beyond 45 MW. At lower levels of battery capacity optimal transmission capacity initially decreases due to the relatively smaller battery not being able to shift enough energy to higher value periods to account for the additional cost required to make an increase in transmission capacity optimal. Conversely, at higher levels of battery capacity the cost of an additional unit of transmission capacity is less than the increase in revenue provided by the larger battery. The marginal cost of transmission capacity increases at a decreasing rate, meaning each additional unit of transmission capacity is less costly than the previous unit (see Figure 1). As the optimal transmission capacity increases, the increase in revenue required from the battery to make an additional unit of capacity profitable is reduced. The combined effects of transmission cost increasing at a decreasing rate and the capability of a larger battery to shift more energy to relatively higher value periods results in the optimal transmission capacity increasing with battery capacity beyond 45 MW.
600635
670705
740775810845
66,500,000
67,000,000
67,500,000
68,000,000
68,500,000
69,000,0000
15 30 45 60 75 9010
512
013
5
150
165
180
195
Pro
fit
($ p
er y
r)
State Utility Forecasting Group Page 11
Figure 3. Optimal Transmission Line Capacity for a Battery of Given Size
Energy supplied to the real-time market directly from the wind site decreases as battery capacity is increased (see Table 5). With no battery, 2,071 GWh are supplied to the real-time market by the wind site out of a total of 2,083 GWh generated by the wind site. For the no battery case, the optimally sized transmission line is 60 percent of wind site capacity and only results in wind curtailment of 12.5 GWh (0.6 percent of total wind generation). Total energy supplied to the markets increases marginally as battery capacity is increased. The energy sold with storage is sold at a higher average price than the no battery case causing total revenue to increase (see Table 6). With the optimally sized battery and transmission line, wind curtailment is reduced compared to the no battery case for two reasons: 1) the optimal transmission capacity is greater, and 2) the installed battery stores energy which would otherwise be curtailed. Installing storage at the wind site reduces the amount of wind curtailment, although total energy supplied to the markets decreases with increasing levels of battery capacity due to round trip efficiency losses of 12 percent. Even with losses the price differential between periods of charging and discharging the battery is large enough to make storage profitable.
550
600
650
700
750
800
0 10 20 30 40 50 60 70 80 90 100
110
120
130
140
150
160
170
180
190
200
Tra
nsm
issi
on L
ine
Cap
acit
y (M
W)
Battery Capacity (MW)
State Utility Forecasting Group Page 12
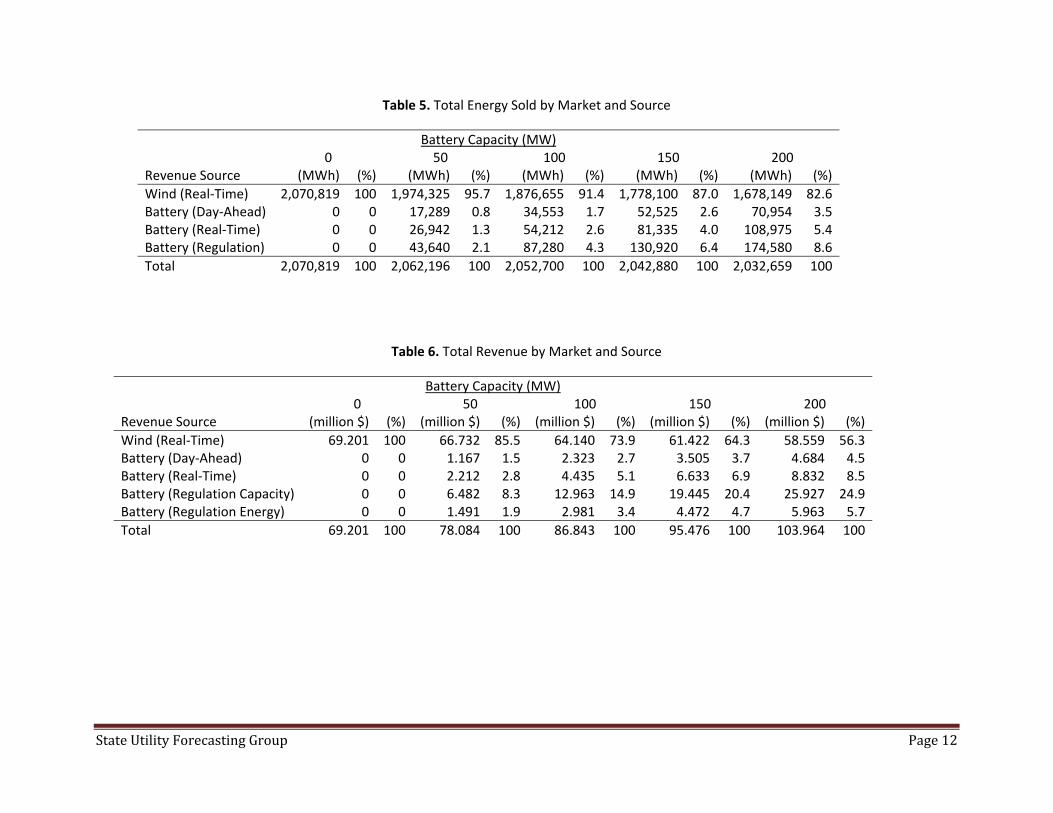
Table 5. Total Energy Sold by Market and Source
Battery Capacity (MW) 0 50 100 150 200 Revenue Source (MWh) (%) (MWh) (%) (MWh) (%) (MWh) (%) (MWh) (%)Wind (Real-Time) 2,070,819 100 1,974,325 95.7 1,876,655 91.4 1,778,100 87.0 1,678,149 82.6Battery (Day-Ahead) 0 0 17,289 0.8 34,553 1.7 52,525 2.6 70,954 3.5Battery (Real-Time) 0 0 26,942 1.3 54,212 2.6 81,335 4.0 108,975 5.4Battery (Regulation) 0 0 43,640 2.1 87,280 4.3 130,920 6.4 174,580 8.6Total 2,070,819 100 2,062,196 100 2,052,700 100 2,042,880 100 2,032,659 100
Table 6. Total Revenue by Market and Source
Battery Capacity (MW) 0 50 100 150 200 Revenue Source (million $) (%) (million $) (%) (million $) (%) (million $) (%) (million $) (%)Wind (Real-Time) 69.201 100 66.732 85.5 64.140 73.9 61.422 64.3 58.559 56.3Battery (Day-Ahead) 0 0 1.167 1.5 2.323 2.7 3.505 3.7 4.684 4.5Battery (Real-Time) 0 0 2.212 2.8 4.435 5.1 6.633 6.9 8.832 8.5Battery (Regulation Capacity) 0 0 6.482 8.3 12.963 14.9 19.445 20.4 25.927 24.9Battery (Regulation Energy) 0 0 1.491 1.9 2.981 3.4 4.472 4.7 5.963 5.7Total 69.201 100 78.084 100 86.843 100 95.476 100 103.964 100

State Utility Forecasting Group Page 13
The regulation market accounts for about 50 percent of the energy supplied by the battery (see Table 7) and approximately 70 percent of the revenue generated by the battery (see Table 8). This is in agreement with the belief that energy storage is well suited to providing regulation services as this market generally requires a small level of actual energy to be provided. Revenue from participating in the regulation market accounts for the largest share of battery revenue due to receiving the regulation market clearing price for clearing capacity in this market and the real-time energy price for any energy supplied for regulation purposes. This report assumes a dispatch-to-contract ratio that remains constant at 0.1 MWh of energy is supplied to the real-time energy market for one MW of capacity cleared in the regulation market. Participation of the battery in the real-time market accounts for roughly 30 percent of the energy supplied by the battery and approximately 20 percent of revenue generated by the battery, while participation by the battery in the day-ahead market accounts for the smallest levels of energy and revenue at roughly 20 percent and 10 percent, respectively. The average prices in the day-ahead and real-time markets are nearly equal at approximately 34 $/MWh, although prices in the real-time market show a markedly larger level of volatility. The increased volatility of prices in the real-time market, as compared to the day-ahead market, results in more profitable opportunities to use the battery for arbitrage in this market. As Tables 7 and 8 show, participation by the battery in each of the three markets remains relatively constant irrespective of the battery capacity, which is due to the model assuming the wind site and battery are price-takers and that their behavior does not affect market prices.
Table 7. Percent of Battery Energy Sold by Market
Battery Capacity (MW) Revenue Source 0 50 100 150 200
Battery (Day-Ahead) 0.0% 19.7% 19.6% 19.8% 20.0% Battery (Real-Time) 0.0% 30.7% 30.8% 30.7% 30.7% Battery (Regulation) 0.0% 49.7% 49.6% 49.4% 49.2%
Total 0.0% 100.0% 100.0% 100.0% 100.0%
Table 8. Percent of Battery Revenue by Market
Battery Capacity (MW) Revenue Source 0 50 100 150 200
Battery (Day-Ahead) 0.0% 10.3% 10.2% 10.3% 10.3%Battery (Real-Time) 0.0% 19.5% 19.5% 19.5% 19.5%Battery (Regulation) 0.0% 70.2% 70.2% 70.2% 70.2%
Total 0.0% 100.0% 100.0% 100.0% 100.0%
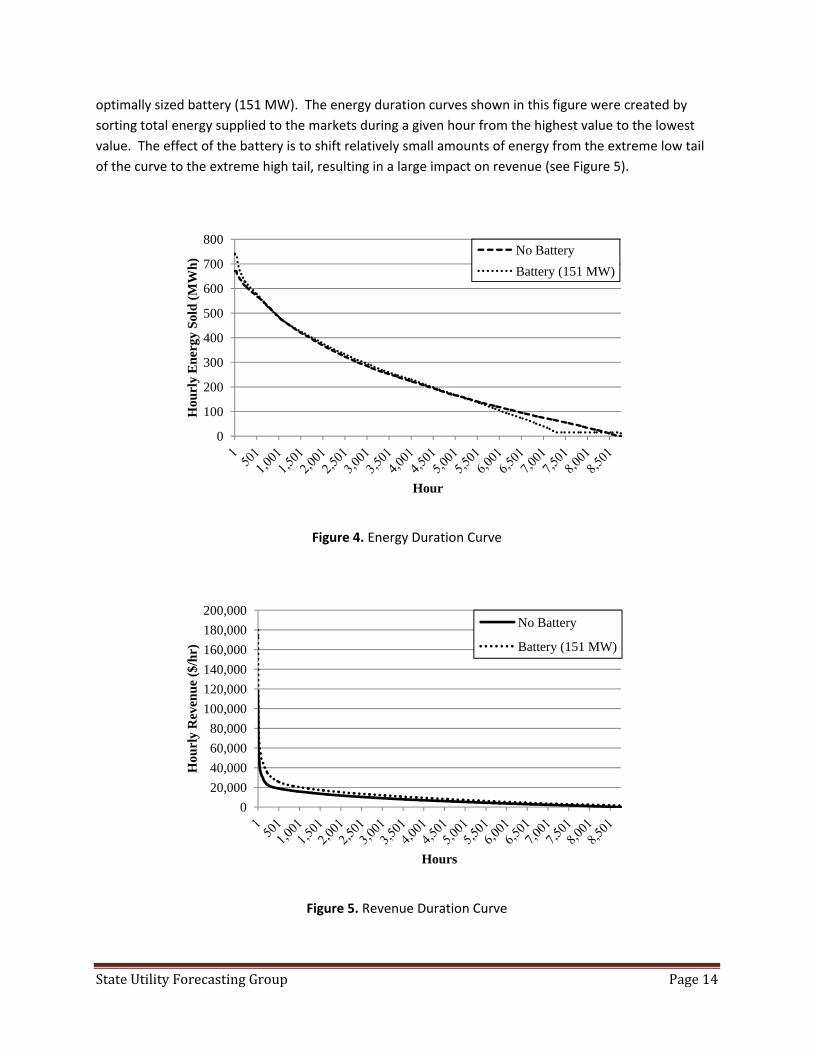
The effect of the battery is to shift energy generated by the wind site from lower value periods to periods of relatively higher value. Figure 4 shows energy duration curves for the no battery case and the
State Utility Forecasting Group Page 14
optimally sized battery (151 MW). The energy duration curves shown in this figure were created by sorting total energy supplied to the markets during a given hour from the highest value to the lowest value. The effect of the battery is to shift relatively small amounts of energy from the extreme low tail of the curve to the extreme high tail, resulting in a large impact on revenue (see Figure 5).
Figure 4. Energy Duration Curve
Figure 5. Revenue Duration Curve
0
100
200
300
400
500
600
700
800
Hou
rly
En
ergy
Sol
d (
MW
h)
Hour
No Battery
Battery (151 MW)
0
20,000
40,000
60,000
80,000
100,000
120,000
140,000
160,000
180,000
200,000
Hou
rly
Rev
enu
e ($
/hr)
Hours
No Battery
Battery (151 MW)
State Utility Forecasting Group Page 15
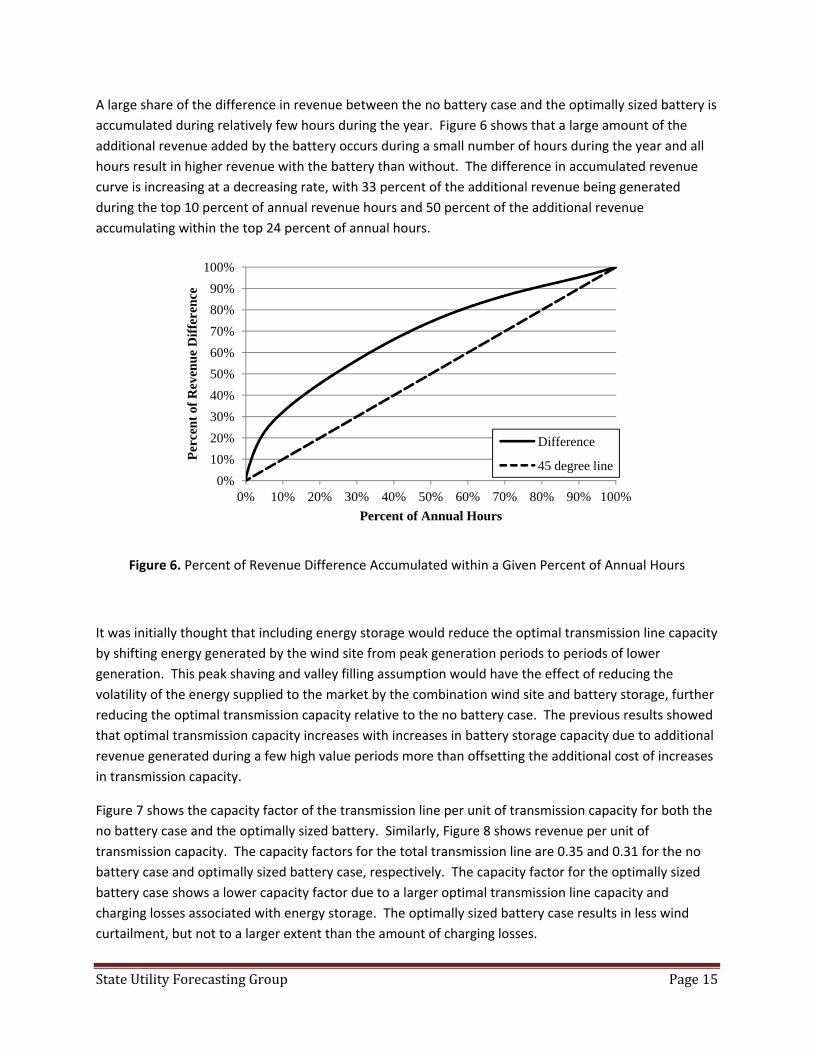
A large share of the difference in revenue between the no battery case and the optimally sized battery is accumulated during relatively few hours during the year. Figure 6 shows that a large amount of the additional revenue added by the battery occurs during a small number of hours during the year and all hours result in higher revenue with the battery than without. The difference in accumulated revenue curve is increasing at a decreasing rate, with 33 percent of the additional revenue being generated during the top 10 percent of annual revenue hours and 50 percent of the additional revenue accumulating within the top 24 percent of annual hours.
Figure 6. Percent of Revenue Difference Accumulated within a Given Percent of Annual Hours
It was initially thought that including energy storage would reduce the optimal transmission line capacity by shifting energy generated by the wind site from peak generation periods to periods of lower generation. This peak shaving and valley filling assumption would have the effect of reducing the volatility of the energy supplied to the market by the combination wind site and battery storage, further reducing the optimal transmission capacity relative to the no battery case. The previous results showed that optimal transmission capacity increases with increases in battery storage capacity due to additional revenue generated during a few high value periods more than offsetting the additional cost of increases in transmission capacity.
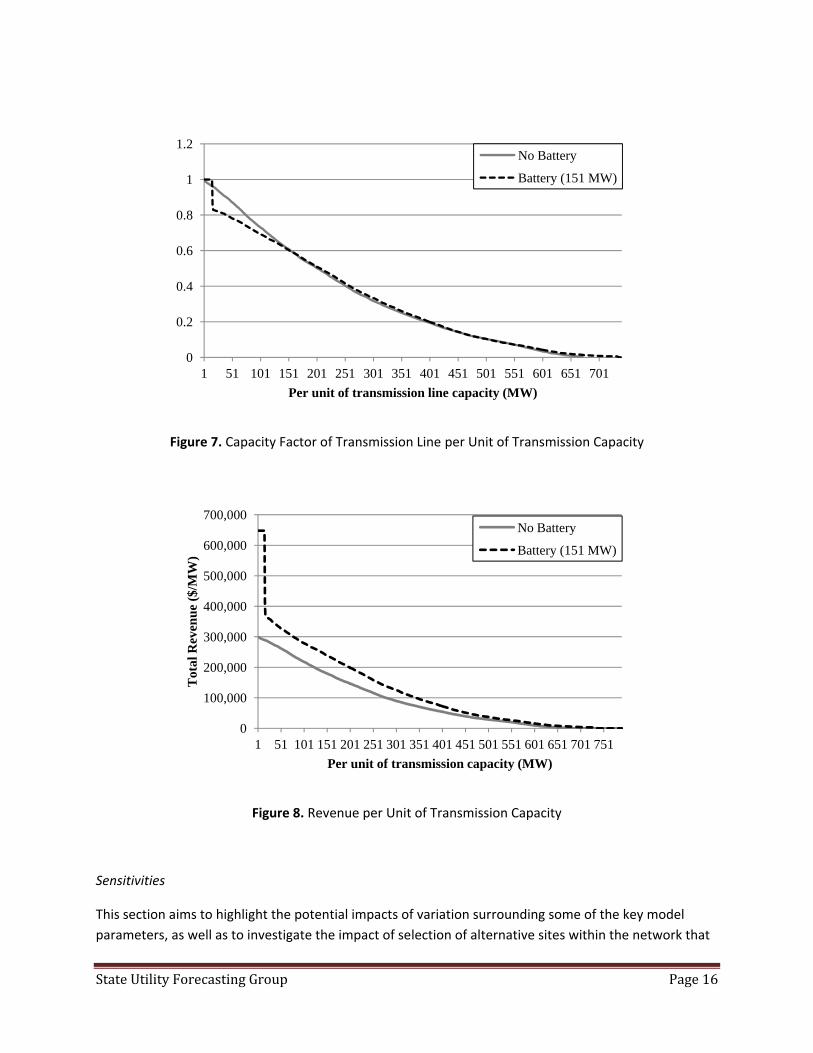
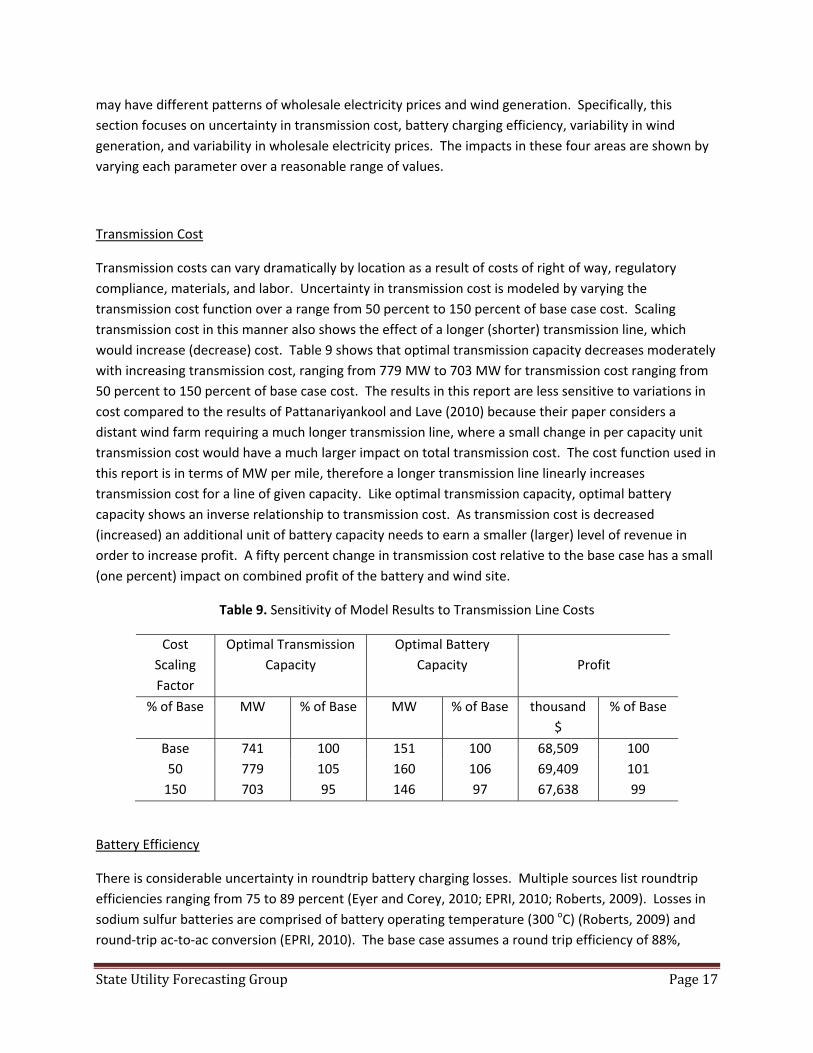
Figure 7 shows the capacity factor of the transmission line per unit of transmission capacity for both the no battery case and the optimally sized battery. Similarly, Figure 8 shows revenue per unit of transmission capacity. The capacity factors for the total transmission line are 0.35 and 0.31 for the no battery case and optimally sized battery case, respectively. The capacity factor for the optimally sized battery case shows a lower capacity factor due to a larger optimal transmission line capacity and charging losses associated with energy storage. The optimally sized battery case results in less wind curtailment, but not to a larger extent than the amount of charging losses.
0%
10%
20%
30%
40%
50%
60%
70%
80%
90%
100%
0% 10% 20% 30% 40% 50% 60% 70% 80% 90% 100%
Per
cen
t of
Rev
enu
e D
iffe
ren
ce
Percent of Annual Hours
Difference
45 degree line
State Utility Forecasting Group Page 16
Figure 7. Capacity Factor of Transmission Line per Unit of Transmission Capacity
Figure 8. Revenue per Unit of Transmission Capacity
Sensitivities
This section aims to highlight the potential impacts of variation surrounding some of the key model parameters, as well as to investigate the impact of selection of alternative sites within the network that
0
0.2
0.4
0.6
0.8
1
1.2
1 51 101 151 201 251 301 351 401 451 501 551 601 651 701
Per unit of transmission line capacity (MW)
No Battery
Battery (151 MW)
0
100,000
200,000
300,000
400,000
500,000
600,000
700,000
1 51 101 151 201 251 301 351 401 451 501 551 601 651 701 751
Tot
al R
even
ue
($/M
W)
Per unit of transmission capacity (MW)
No Battery
Battery (151 MW)
State Utility Forecasting Group Page 17
may have different patterns of wholesale electricity prices and wind generation. Specifically, this section focuses on uncertainty in transmission cost, battery charging efficiency, variability in wind generation, and variability in wholesale electricity prices. The impacts in these four areas are shown by varying each parameter over a reasonable range of values.
Transmission Cost
Transmission costs can vary dramatically by location as a result of costs of right of way, regulatory compliance, materials, and labor. Uncertainty in transmission cost is modeled by varying the transmission cost function over a range from 50 percent to 150 percent of base case cost. Scaling transmission cost in this manner also shows the effect of a longer (shorter) transmission line, which would increase (decrease) cost. Table 9 shows that optimal transmission capacity decreases moderately with increasing transmission cost, ranging from 779 MW to 703 MW for transmission cost ranging from 50 percent to 150 percent of base case cost. The results in this report are less sensitive to variations in cost compared to the results of Pattanariyankool and Lave (2010) because their paper considers a distant wind farm requiring a much longer transmission line, where a small change in per capacity unit transmission cost would have a much larger impact on total transmission cost. The cost function used in this report is in terms of MW per mile, therefore a longer transmission line linearly increases transmission cost for a line of given capacity. Like optimal transmission capacity, optimal battery capacity shows an inverse relationship to transmission cost. As transmission cost is decreased (increased) an additional unit of battery capacity needs to earn a smaller (larger) level of revenue in order to increase profit. A fifty percent change in transmission cost relative to the base case has a small (one percent) impact on combined profit of the battery and wind site.
Table 9. Sensitivity of Model Results to Transmission Line Costs
Cost Scaling Factor
Optimal Transmission Capacity
Optimal Battery Capacity
Profit
% of Base MW % of Base MW % of Base thousand $
% of Base
Base 741 100 151 100 68,509 100 50 779 105 160 106 69,409 101
150 703 95 146 97 67,638 99
Battery Efficiency
There is considerable uncertainty in roundtrip battery charging losses. Multiple sources list roundtrip efficiencies ranging from 75 to 89 percent (Eyer and Corey, 2010; EPRI, 2010; Roberts, 2009). Losses in sodium sulfur batteries are comprised of battery operating temperature (300 oC) (Roberts, 2009) and round-trip ac-to-ac conversion (EPRI, 2010). The base case assumes a round trip efficiency of 88%,

State Utility Forecasting Group Page 18
which is towards the upper end of the efficiency range. Sensitivity analysis shows that a relatively small change in efficiency has a dramatic impact on profits. Figure 9 shows how the profit maximizing level changes with charging efficiency. The profit maximizing level of battery capacity is zero for efficiency levels below 85%. At the other extreme efficiency of 100% is unrealistic, but shows the dramatic benefit of increased efficiency.
Figure 9. Profit of Wind Site and Battery in Relation to Battery Efficiency
Optimal battery and transmission line capacities change markedly with efficiency level (see Table 10). Both optimal transmission and battery capacities decrease with efficiency reductions, with battery capacity decreasing more in percentage terms. Optimal transmission capacity is much more affected by changes in efficiency, than even changes in transmission cost. A two percent reduction in efficiency relative to the base case reduces optimal transmission capacity by nine percent, while a 50 percent reduction in transmission cost relative to the base case leads to an increase in optimal transmission capacity of only five percent. Efficiency has such a profound impact on profitability because losses affect every MWh stored in the battery, which, similar to curtailed wind generation, are wasted MWh. In the future technological advances in battery efficiency could have a dramatic effect on the competitiveness of this technology.
Table 10. Sensitivity of Model Results to Battery Efficiency
Battery Efficiency
Optimal Transmission Capacity
Optimal Battery Capacity
Profit
Roundtrip MW % of Base MW % of Base thousand $
% of Base
Base (0.88) 741 100 151 100 68,509 100 0.86 674 91 65 43 67,707 99 1.00 1039 140 436 289 78,112 114
62
64
66
68
70
72
74
76
78
80
0.86 0.88 0.9 0.92 0.94 0.96 0.98 1
Pro
fit
(mil
lion
$ p
er y
ear)
Battery Efficiency

State Utility Forecasting Group Page 19
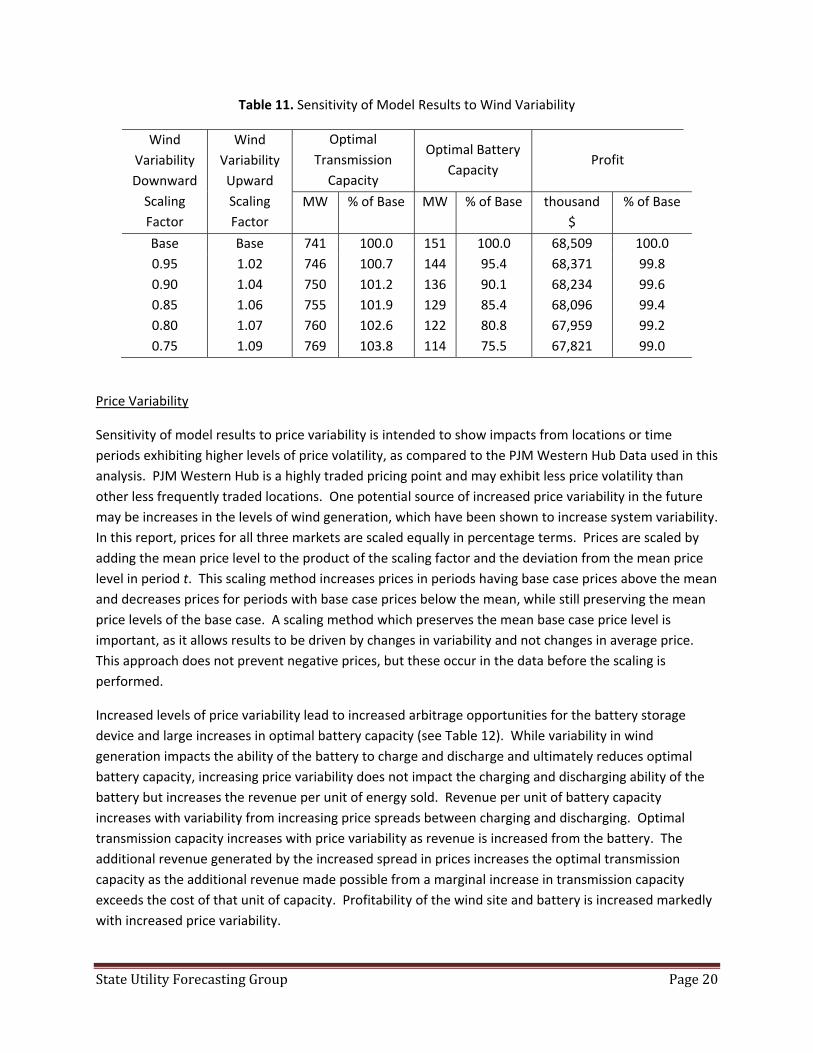
Wind Variability
Wind generation variability can differ dramatically by location. The data used in this report are from the PJM Western Region, which is comprised of multiple wind sites. Aggregate wind generation data tends to exhibit reduced variability as compared to a specific wind site, due to wind sites not exhibiting a perfect positive correlation. A decrease at one wind site is not usually accompanied by an equal decrease at all other wind sites comprising the aggregate data. Using ERCOT wind data from 2004 through 2009, Wan (2011) showed variability in wind generation is reduced with increases in installed wind capacity. This section highlights the effects of increased wind site variability on both optimal transmission and battery capacities, and ultimately profitability.
A piecewise linear scaling of wind variability is done in a manner to preserve the mean wind generation and have all periods of wind generation remain non-negative. Two scaling factors were used – one for wind generation below the base case mean wind generation, which is used to further scale down wind generation for these periods, and another for wind generation above the base case mean wind generation, which is used to scale up wind generation during these periods. The downward scaling factor was chosen to scale down periods below the base case mean wind generation in increments of 0.05. Given the downward scaling factor the upward scaling factor was chosen to preserve the mean wind generation. As Table 11 shows, downward scaling factors are larger in percentage terms than upward scaling factors, leading to equal total energy reductions for wind generation below the mean and total increases for wind generation above the mean.
Increasing wind generation variability leads to a marginal increase in optimal transmission capacity and a more dramatic decrease in optimal battery capacity (see Table 11). Profit is reduced with increasing wind variability due to optimal transmission capacity and cost increases, while the capacity factor of the transmission line is decreasing. The decreasing transmission capacity factor is due to increasing optimal transmission capacity and increasing levels of wind curtailment. Optimal transmission capacity increases with increasing wind variability in order to capture higher levels of wind generation, which occur with increased frequency. The level of wind curtailment increases with wind variability as a result of the marginal unit of transmission capacity being less utilized. As mentioned earlier, there is a tradeoff between the cost of installing an additional unit of transmission capacity and the revenue that unit of capacity makes possible. Optimal battery capacity is reduced with increasing variability, as charging and discharging opportunities are reduced for the battery. Charging opportunities are reduced as increased variability results in more frequent periods of lower levels of wind generation.
State Utility Forecasting Group Page 20
Table 11. Sensitivity of Model Results to Wind Variability
Wind Variability Downward
Scaling Factor
Wind Variability Upward Scaling Factor
Optimal Transmission
Capacity
Optimal Battery Capacity
Profit
MW % of Base MW % of Base thousand $
% of Base
Base Base 741 100.0 151 100.0 68,509 100.0 0.95 1.02 746 100.7 144 95.4 68,371 99.8 0.90 0.85 0.80 0.75
1.04 1.06 1.07 1.09
750 755 760 769
101.2 101.9 102.6 103.8
136 129 122 114
90.1 85.4 80.8 75.5
68,234 68,096 67,959 67,821
99.6 99.4 99.2 99.0
Price Variability
Sensitivity of model results to price variability is intended to show impacts from locations or time periods exhibiting higher levels of price volatility, as compared to the PJM Western Hub Data used in this analysis. PJM Western Hub is a highly traded pricing point and may exhibit less price volatility than other less frequently traded locations. One potential source of increased price variability in the future may be increases in the levels of wind generation, which have been shown to increase system variability. In this report, prices for all three markets are scaled equally in percentage terms. Prices are scaled by adding the mean price level to the product of the scaling factor and the deviation from the mean price level in period t. This scaling method increases prices in periods having base case prices above the mean and decreases prices for periods with base case prices below the mean, while still preserving the mean price levels of the base case. A scaling method which preserves the mean base case price level is important, as it allows results to be driven by changes in variability and not changes in average price. This approach does not prevent negative prices, but these occur in the data before the scaling is performed.
Increased levels of price variability lead to increased arbitrage opportunities for the battery storage device and large increases in optimal battery capacity (see Table 12). While variability in wind generation impacts the ability of the battery to charge and discharge and ultimately reduces optimal battery capacity, increasing price variability does not impact the charging and discharging ability of the battery but increases the revenue per unit of energy sold. Revenue per unit of battery capacity increases with variability from increasing price spreads between charging and discharging. Optimal transmission capacity increases with price variability as revenue is increased from the battery. The additional revenue generated by the increased spread in prices increases the optimal transmission capacity as the additional revenue made possible from a marginal increase in transmission capacity exceeds the cost of that unit of capacity. Profitability of the wind site and battery is increased markedly with increased price variability.

State Utility Forecasting Group Page 21
Table 12. Sensitivity of Model Results to Price Variability
Price Variability
Scaling Factor
Optimal Transmission
Capacity
Optimal Battery
Capacity
Profit
MW % of Base MW % of Base thousand $
% of Base
Base 741 100.0 151 100.0 68,509 100.0 1.05 789 106.5 197 130.5 69,492 101.4 1.10 1.15 1.20 1.25
840 874 919 958
113.4 117.9 124.0 129.3
240 274 316 355
158.9 181.5 209.3 235.1
70,661 72,005 73,515 75,211
103.1 105.1 107.3 109.8
Summary
The results of the sensitivity section show some model parameters resulting in markedly larger impacts in percentage terms, while others do not. Sensitivity on model parameters is important as it shows which parameters result in relatively larger impacts on optimal transmission and battery capacity levels and ultimately project profitability. Conducting sensitivity analysis on technological parameters, such as battery efficiency, can show which areas of research into battery technology may make batteries more competitive with other forms of energy storage or generation. Market parameters, such as price variability, show it is not only important to consider average wholesale price when locating wind sites, but also price variability and the potential benefits of including some form of energy storage when a wind site is located at a relatively more volatile pricing point. Ultimately, it is important to understand both technological and economic drivers of project analysis when considering investment decisions.
CONCLUSIONS
Simultaneously considering multiple sources of value for energy storage not only more accurately determines the value of this resource, but also shows the tradeoffs between multiple revenue streams competing for the device’s limited resources (i.e. capacity, charging rate, etc.). This report provides a methodology to value battery storage considering multiple sources of value, by co-locating storage with an intermittent form of generation. Comparison across functions is necessary in order to determine the best use for energy storage and the tradeoffs among the various uses.
The results of this report show that allowing battery storage to simultaneously participate in multiple markets is optimal relative to participating in any one market alone. This report is in agreement with others that using battery storage in regulation markets is a valuable use of this resource. Participation

State Utility Forecasting Group Page 22
of the energy storage device in the regulation market was modeled using PJM Interconnection’s previous regulation market pricing framework. In response to Federal Energy Regulatory Commission (FERC) Order 755, as of October 1, 2012 PJM Interconnection implemented a new framework to compensate market participants for providing frequency regulation. Participants providing this resource are now compensated through a two part payment system, one part compensates for providing capacity and another for providing movement within a time period known as a “mileage” component (PJM, 2012e). This two part compensation system was implemented because it was determined that the old framework discriminated against resources which offered small capacities, but were capable of providing a large amount of ramping or “mileage” (FERC, 2011). Due to a lack of available data the new framework was not modeled in this report, but it would be of value to compare the economics under the new framework to the old.
An additional source of value for storage could be participation in PJM Interconnection’s capacity market. This source of revenue was not considered in this report, but may improve the economics of storage and offer some interesting tradeoffs with the other markets if a certain minimum level of energy is required to remain in the battery in order to receive capacity credit. While not believed to be allowed under PJM’s current market rules, allowing the combination wind generation and storage device to participate as a single unit may markedly improve the economics of battery storage.
Sensitivity on certain key parameters showed the impacts these parameters have on modeling results and is an important part of any modeling where variation in parameter values is concerned. While given the current state of battery storage technology no level of battery capacity is optimal in the setting considered in this report, wind site characteristics (wind variability) and market conditions (price variability) had non-trivial impacts on profitability and the optimal level of installed battery storage. Sensitivity analysis highlights the importance of project specific characteristics when determining the optimal level and profitability of large scale battery storage.
In this study a few assumptions abstract from reality. In particular, perfect foresight is assumed for prices, wind generation, and the dispatch to contract ratio. In reality these model parameters are random variables and are not known before supply and storage decisions are made. Assuming perfect foresight for these parameters provides an upper-bound on profitability and is a baseline for future comparisons with models that do not assume perfect foresight. Assuming perfect foresight for wind generation, prices, and the dispatch to contract ratio likely overstates the value of energy storage. In particular, the assumption of perfect foresight for the dispatch to contract ratio overstates the profitability of storage by allowing the battery to reserve the exact amount of energy that will be called for each unit of capacity sold into this market. If the dispatch to contract ratio were uncertain the battery would likely store some level in excess of the 0.1 used in this analysis and would reduce storage capacity and energy for use in the other markets. Additionally, the assumption of perfect foresight likely leads to a larger optimal transmission capacity than would be optimal without this assumption because the revenues achieved assuming perfect foresight would not be achievable.
The results of this report conclude that given the current state of battery technology, both in terms of cost and technology, and wholesale electricity market conditions battery storage is too expensive to be
State Utility Forecasting Group Page 23
competitive. In the future a breakthrough in battery technology may lead to large reductions in cost or market conditions may change to benefit energy storage. In the model developed in this study, improvements in battery charging and discharging efficiency and increased variability in market prices resulted in the largest impact on profit.
REFERENCES
Davis, C, 2013. Three Essays on the Effect of Wind Generation on Power Systems Planning and Operation. Doctoral Dissertation, Purdue University, West Lafayette, Indiana. May 2013.
Denholm, P., Ela, E., Kirby, B., Milligan, M., 2010. The Role of Energy Storage with Renewable Electricity Generation. Golden, CO, National Renewable Energy Laboratory.
Department of Energy (DOE), 2008. 20% Wind Energy by 2030 Increasing Wind Energy’s Contribution to U.S. Electricity Supply. Washinton, D.C., U.S. Department of Energy, DOE/GO-102008-2567.
Pattanariyankool, S., Lave, L. B., 2010. Optimizing transmission from distant wind farms. Energy Policy 38(6), 2806-2815.
Electric Power Research Institute (EPRI), 2010. Electricity Energy Storage Options: A Whitepaper Primer on Applications, Costs, and Benefits. Electric Power Research Institute, December 2010.
Eyer, J., Corey, G., 2010. Energy Storage for the Electric Grid: Benefits and Market Potential Assessment Guide. Sandia Report: SAND2010-0815.
Federal Energy Regulatory Commission (FERC), 2011. Frequency Regulation Compensation in the Organized Wholesale Power Markets. Docket Nos. RM11-7-000 and AD10-11-000.
PJM Interconnection (PJM), 2012a. PJM Day-Ahead Locational Marginal Price Data,
http://www.pjm.com/markets-and-operations/energy/real-time/monthlylmp.aspx, accessed on October 18, 2012.
PJM Interconnection (PJM), 2012b. PJM Real-Time Locational Marginal Price Data,
http://www.pjm.com/markets-and-operations/energy/real-time/monthlylmp.aspx, accessed on October 18, 2012.
PJM Interconnection (PJM), 2012c. PJM Regulation Market Clearing Price Data, http://www.pjm.com/markets-and-operations/market-settlements/preliminary-billing-reports/pjm-reg-data.aspx, accessed on October 18, 2012.
PJM Interconnection (PJM), 2012d. PJM Wind Generation Data, http://www.pjm.com/markets-and-operations/ops-analysis.asp, accessed on October 18, 2012.
State Utility Forecasting Group Page 24
PJM Interconnection (PJM), 2012e. PJM Manual 11: Energy and Ancillary Services Market Operations.
Roberts, B., 2009. Capturing Grid Power: Performance, Purpose, and Promise of Different Storage Technologies. IEEE Power and Energy Magazine July/August 2009.
Sioshansi, R., Denholm, P., Thomas, J., Weiss, J., 2009. Estimating the value of electricity storage in PJM: Arbitrage and some welfare effects. Energy Economics 31(2), 269-277.
Tomic, J., Kempton, W., 2007. Using fleets of electric-drive vehicles for grid support. Journal of Power Sources 168(2), 459-468.
Wan, Y., 2011. Analysis of Wind Power Ramping Behavior in ERCOT. National Renewable Energy Lab Technical Report. March 2011.
Related Documents