Jannik Schottler ForWind, University of Oldenburg Wind Tunnel Tests and Wake Effects of Pitch and Load Controlled Model Wind Turbines ForWind, Center for Wind Energy Research, University of Oldenburg Jannik Schottler , A. Hölling, J. Peinke, M. Hölling [email protected]

Welcome message from author
This document is posted to help you gain knowledge. Please leave a comment to let me know what you think about it! Share it to your friends and learn new things together.
Transcript
Jannik SchottlerForWind, University of Oldenburg
Wind Tunnel Tests and Wake Effects of Pitch and Load Controlled Model Wind Turbines
ForWind, Center for Wind Energy Research, University of Oldenburg
Jannik Schottler, A. Hölling, J. Peinke, M. Hölling
Jannik Schottler / ForWind, University of Oldenburg 2
Motivationwind farms: interaction of turbines inevitable !
‣ power losses due to wake effects‣ increased loads
understanding of interactions necessary
[Barthelmie et.al. 2010]
[Crespo et.al. 1999]

Jannik Schottler / ForWind, University of Oldenburg 2
Motivationwind farms: interaction of turbines inevitable !
‣ power losses due to wake effects‣ increased loads
understanding of interactions necessary
[Barthelmie et.al. 2010]
inflow/turbine
[Crespo et.al. 1999]
Jannik Schottler / ForWind, University of Oldenburg 2
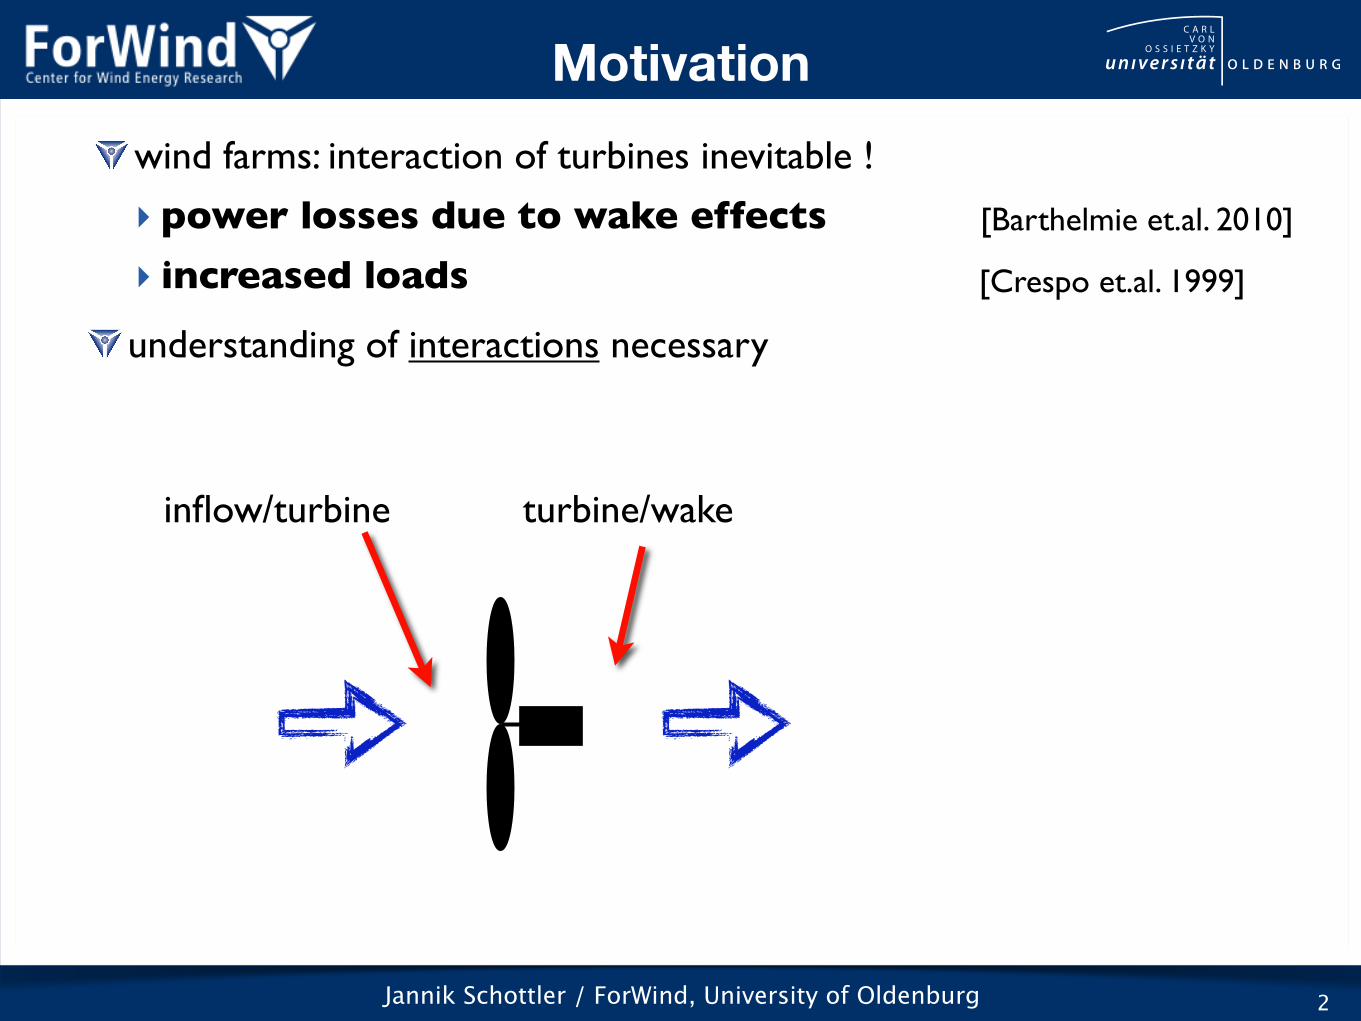
Motivationwind farms: interaction of turbines inevitable !
‣ power losses due to wake effects‣ increased loads
understanding of interactions necessary
[Barthelmie et.al. 2010]
inflow/turbine turbine/wake
[Crespo et.al. 1999]
Jannik Schottler / ForWind, University of Oldenburg 2
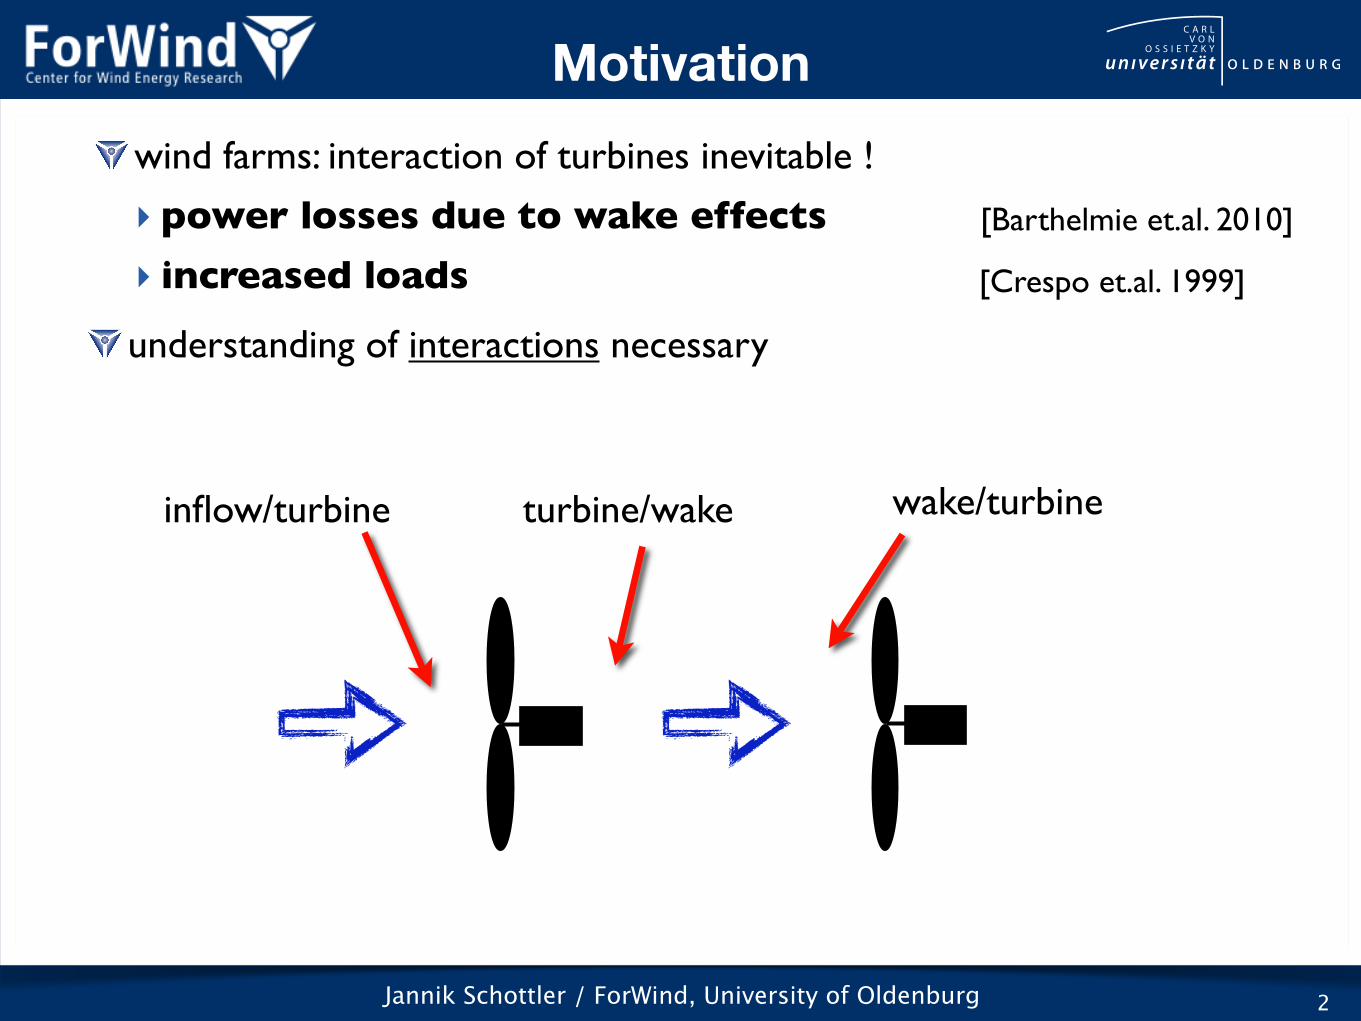
Motivationwind farms: interaction of turbines inevitable !
‣ power losses due to wake effects‣ increased loads
understanding of interactions necessary
[Barthelmie et.al. 2010]
inflow/turbine turbine/wake wake/turbine
[Crespo et.al. 1999]
Jannik Schottler / ForWind, University of Oldenburg 3
Methods
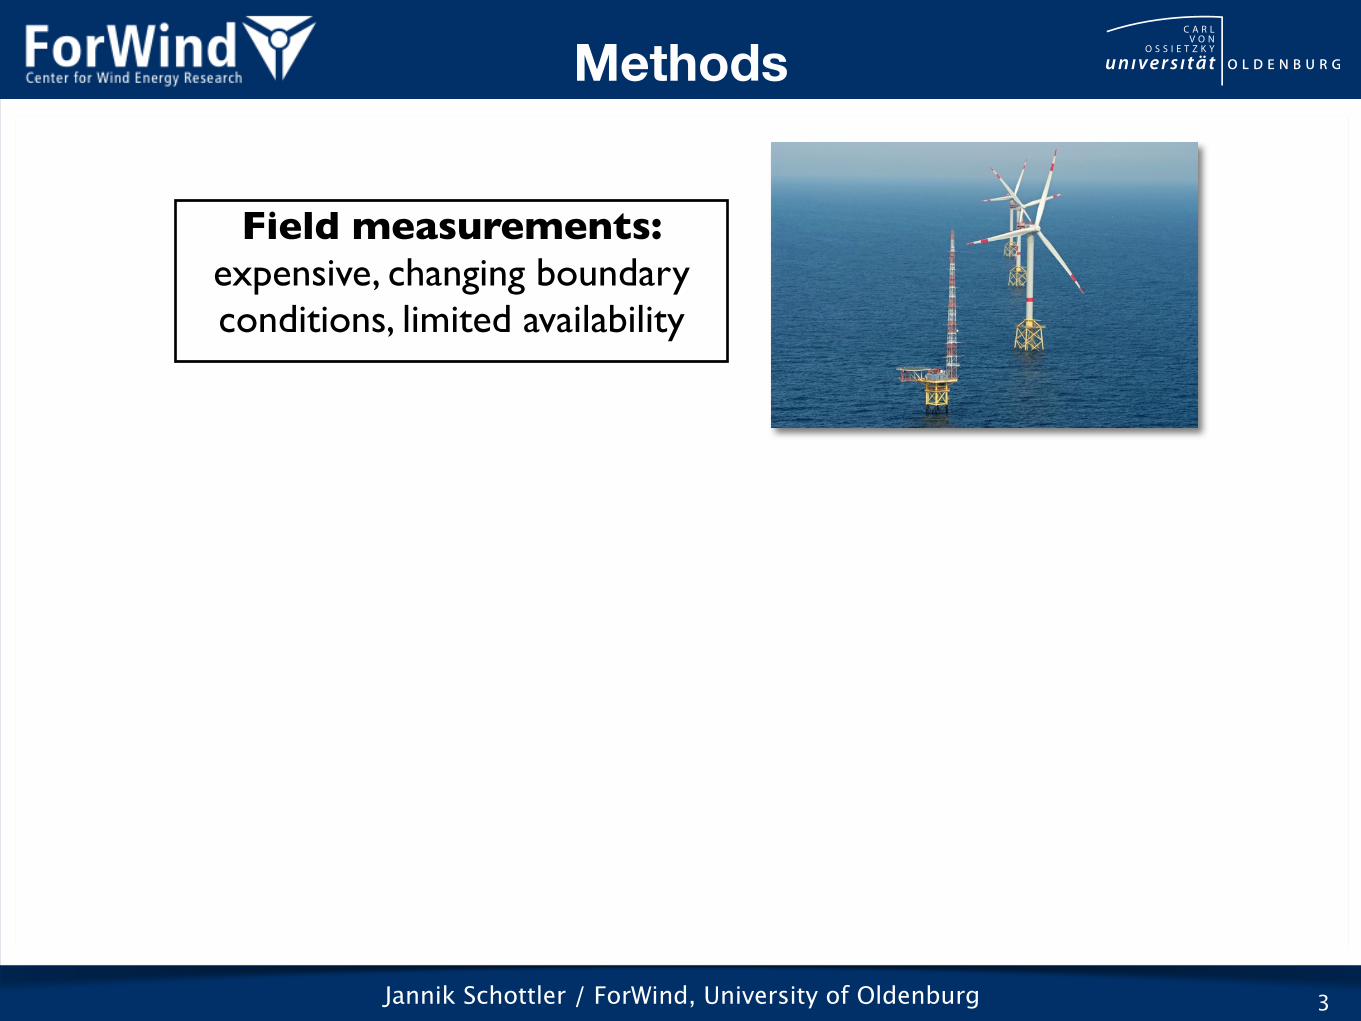
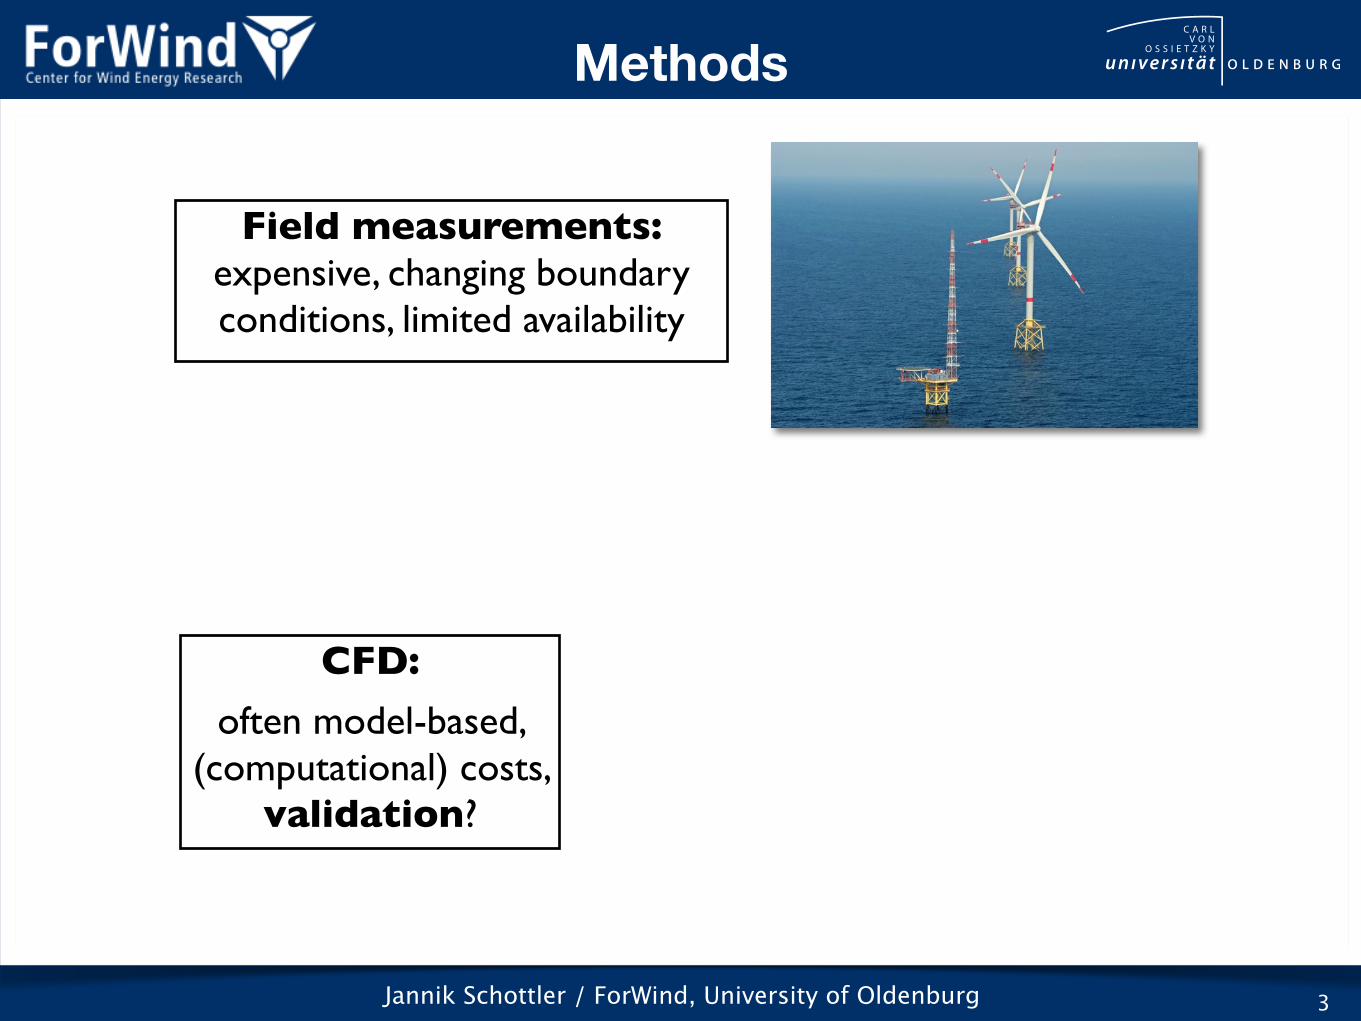
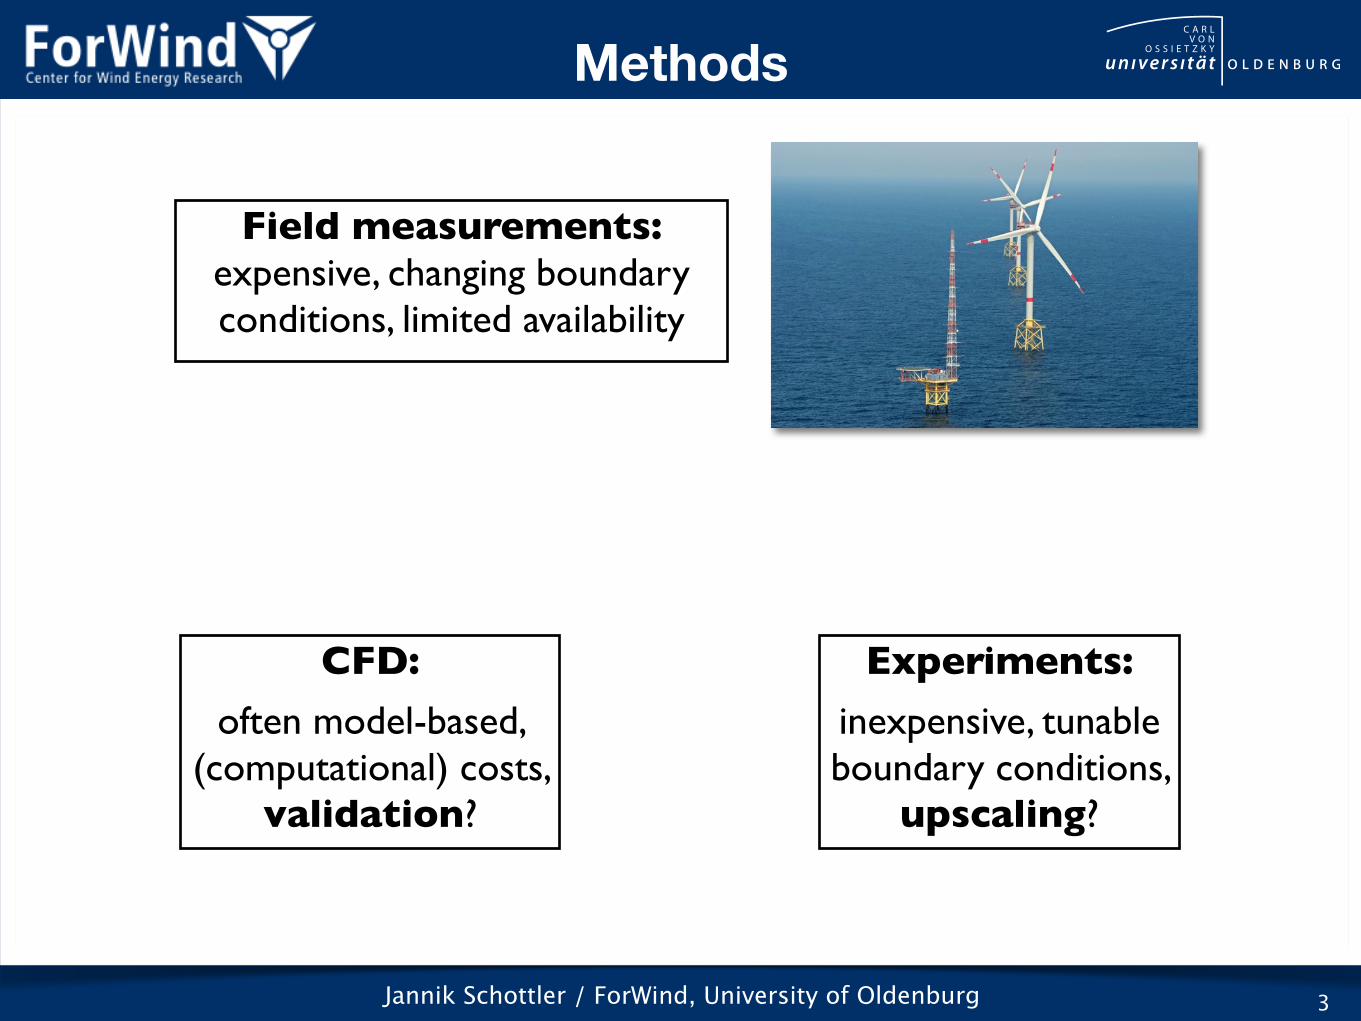
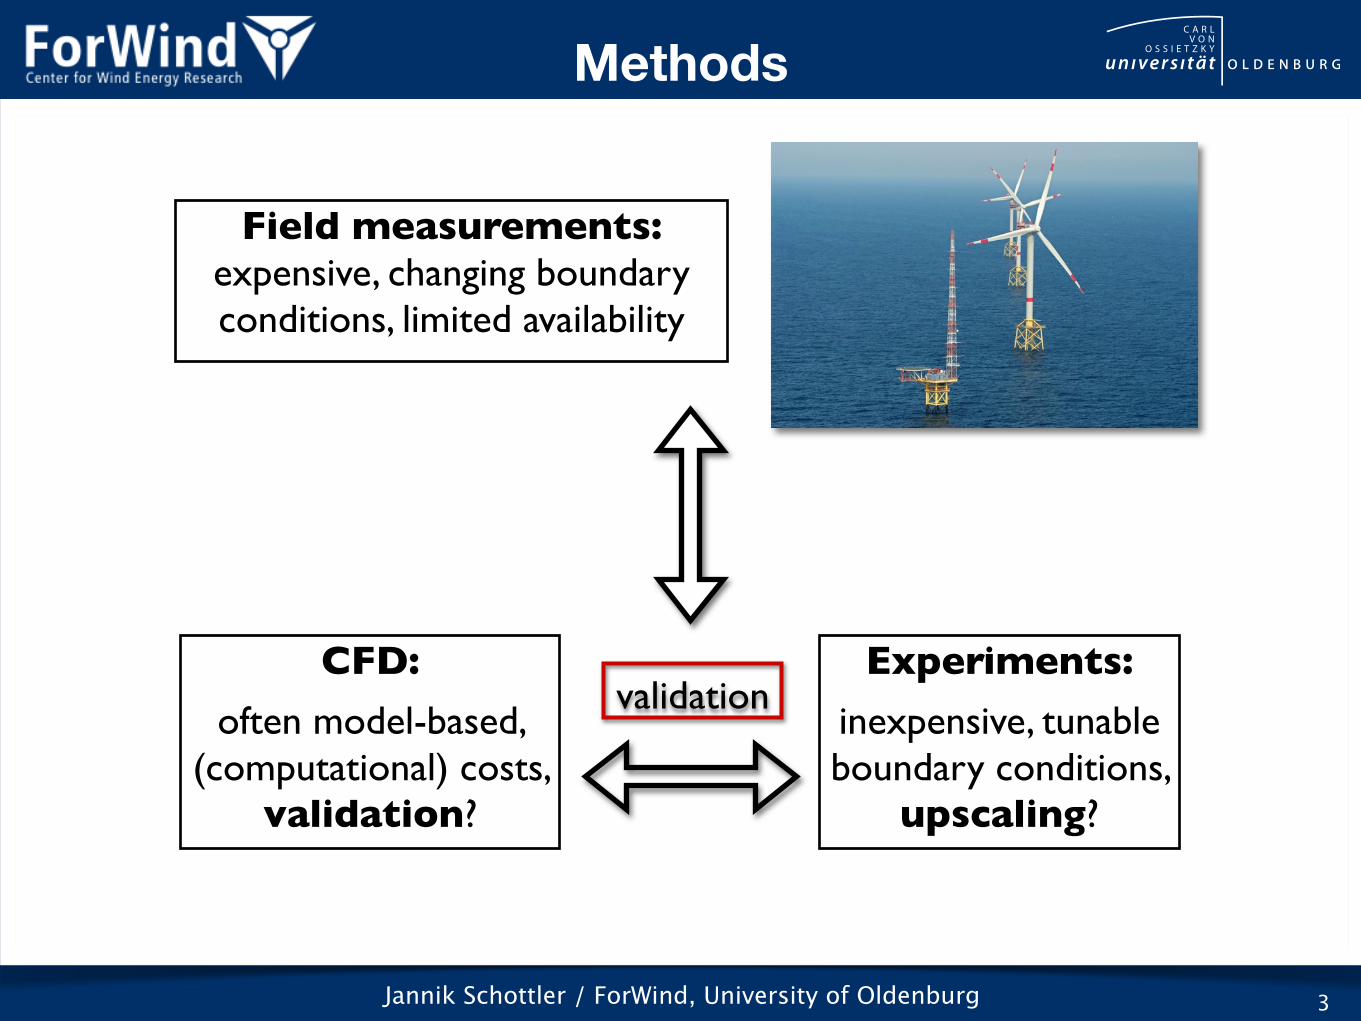
Field measurements:expensive, changing boundary conditions, limited availability
Jannik Schottler / ForWind, University of Oldenburg 3
Methods
Field measurements:expensive, changing boundary conditions, limited availability
CFD:often model-based,
(computational) costs, validation?
Jannik Schottler / ForWind, University of Oldenburg 3
Methods
Field measurements:expensive, changing boundary conditions, limited availability
Experiments:inexpensive, tunable boundary conditions,
upscaling?
CFD:often model-based,
(computational) costs, validation?
Jannik Schottler / ForWind, University of Oldenburg 3
Methods
Field measurements:expensive, changing boundary conditions, limited availability
Experiments:inexpensive, tunable boundary conditions,
upscaling?
CFD:often model-based,
(computational) costs, validation?
validation
Jannik Schottler / ForWind, University of Oldenburg 4
Wakes of Wind Turbines
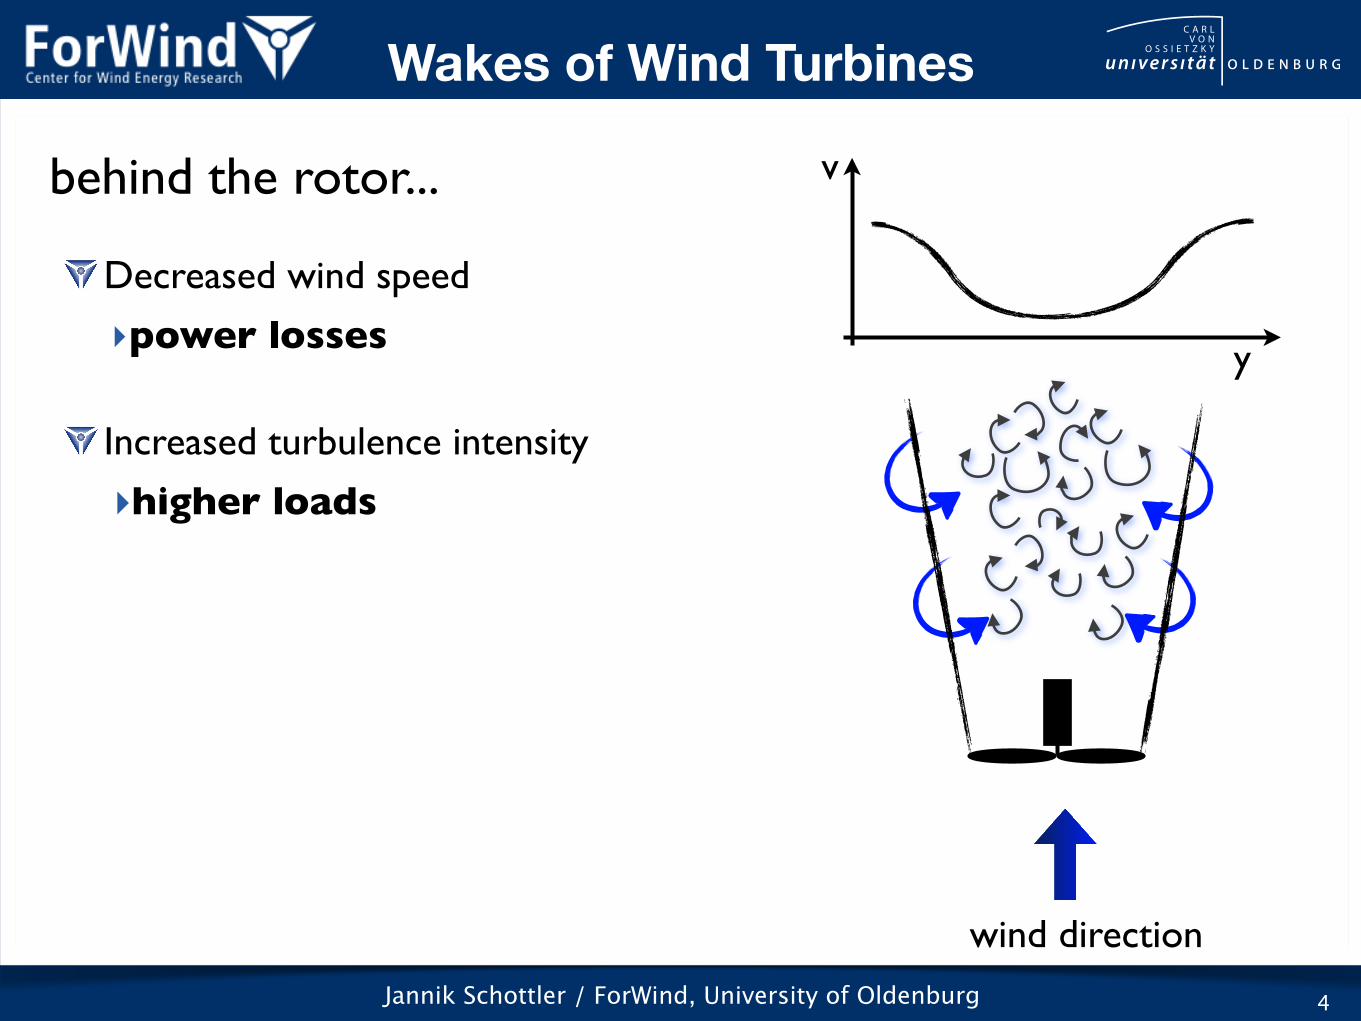
behind the rotor...
Jannik Schottler / ForWind, University of Oldenburg 4
Wakes of Wind Turbines
behind the rotor...
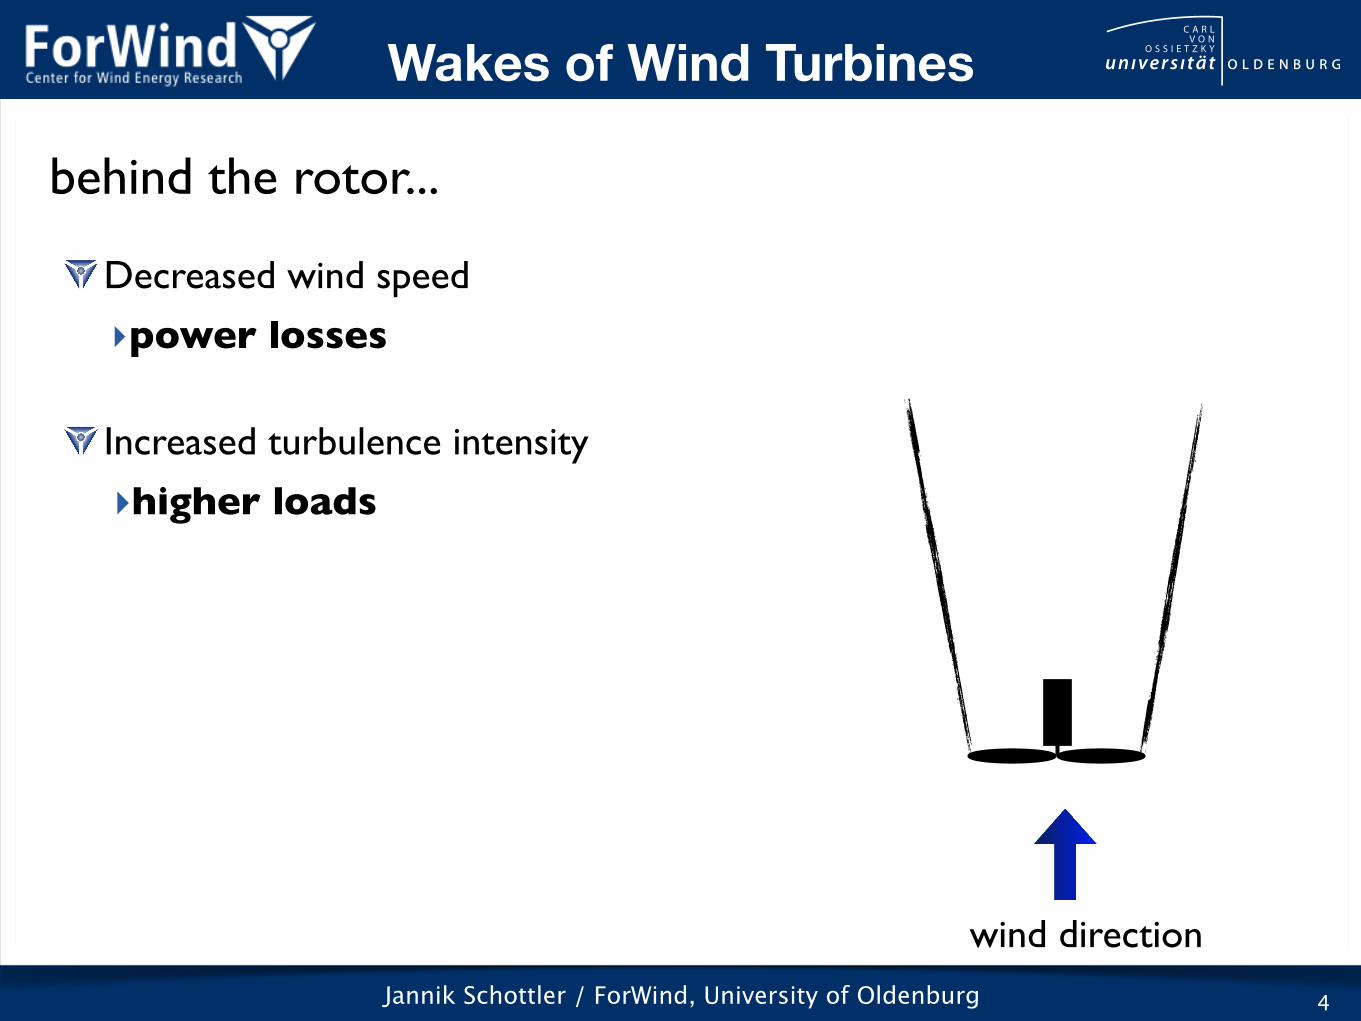
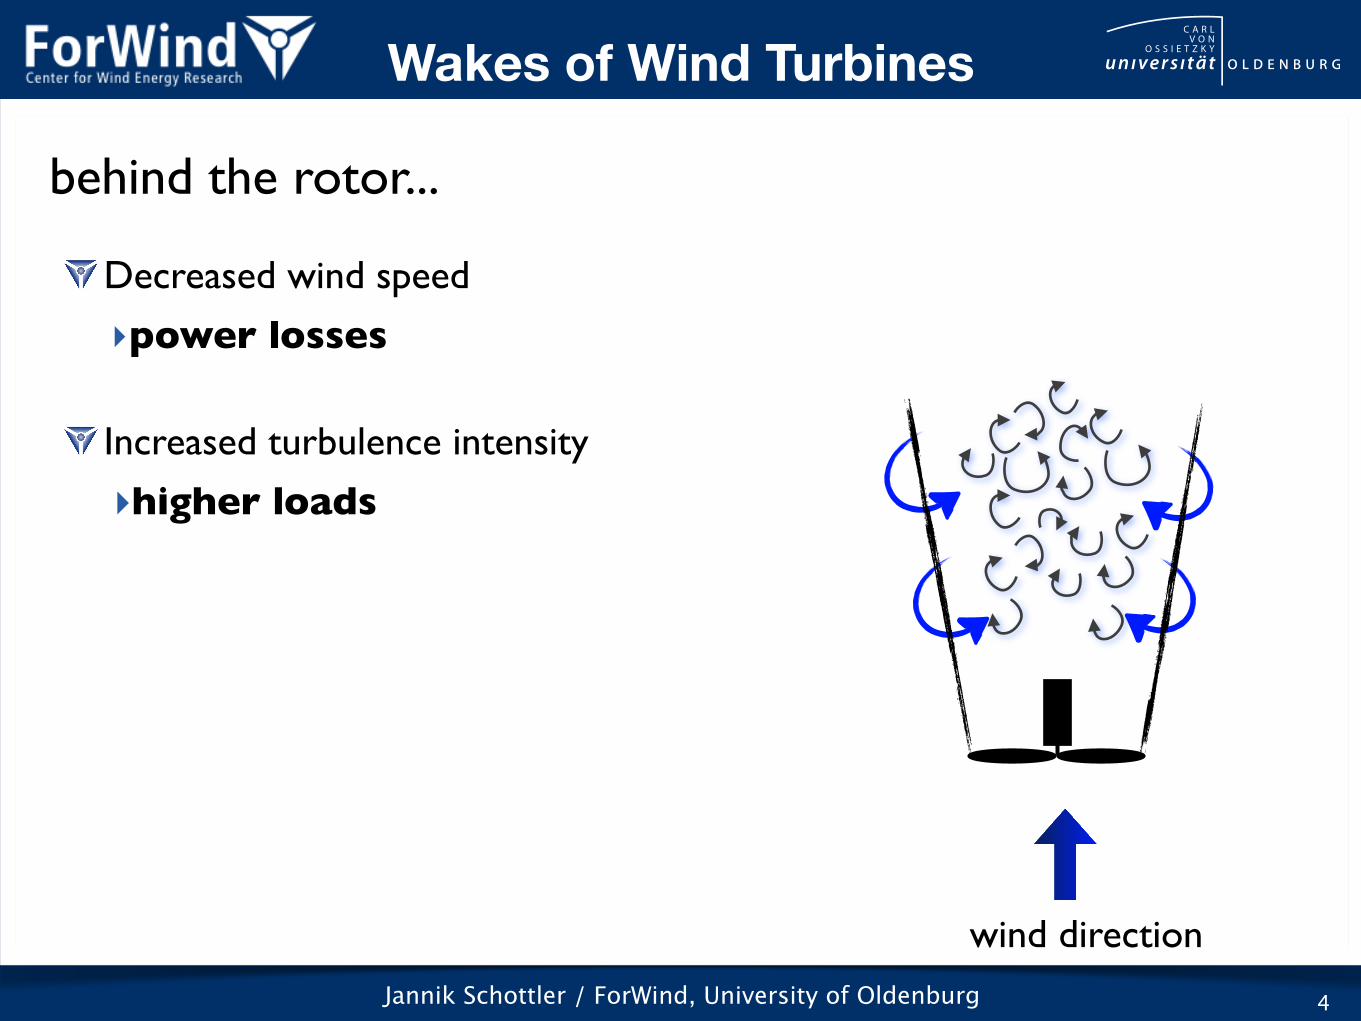
Decreased wind speed
‣power losses
Increased turbulence intensity
‣higher loads
Jannik Schottler / ForWind, University of Oldenburg 4
wind direction
Wakes of Wind Turbines
behind the rotor...
Decreased wind speed
‣power losses
Increased turbulence intensity
‣higher loads
Jannik Schottler / ForWind, University of Oldenburg 4
wind direction
Wakes of Wind Turbines
behind the rotor...
Decreased wind speed
‣power losses
Increased turbulence intensity
‣higher loads
Jannik Schottler / ForWind, University of Oldenburg 4
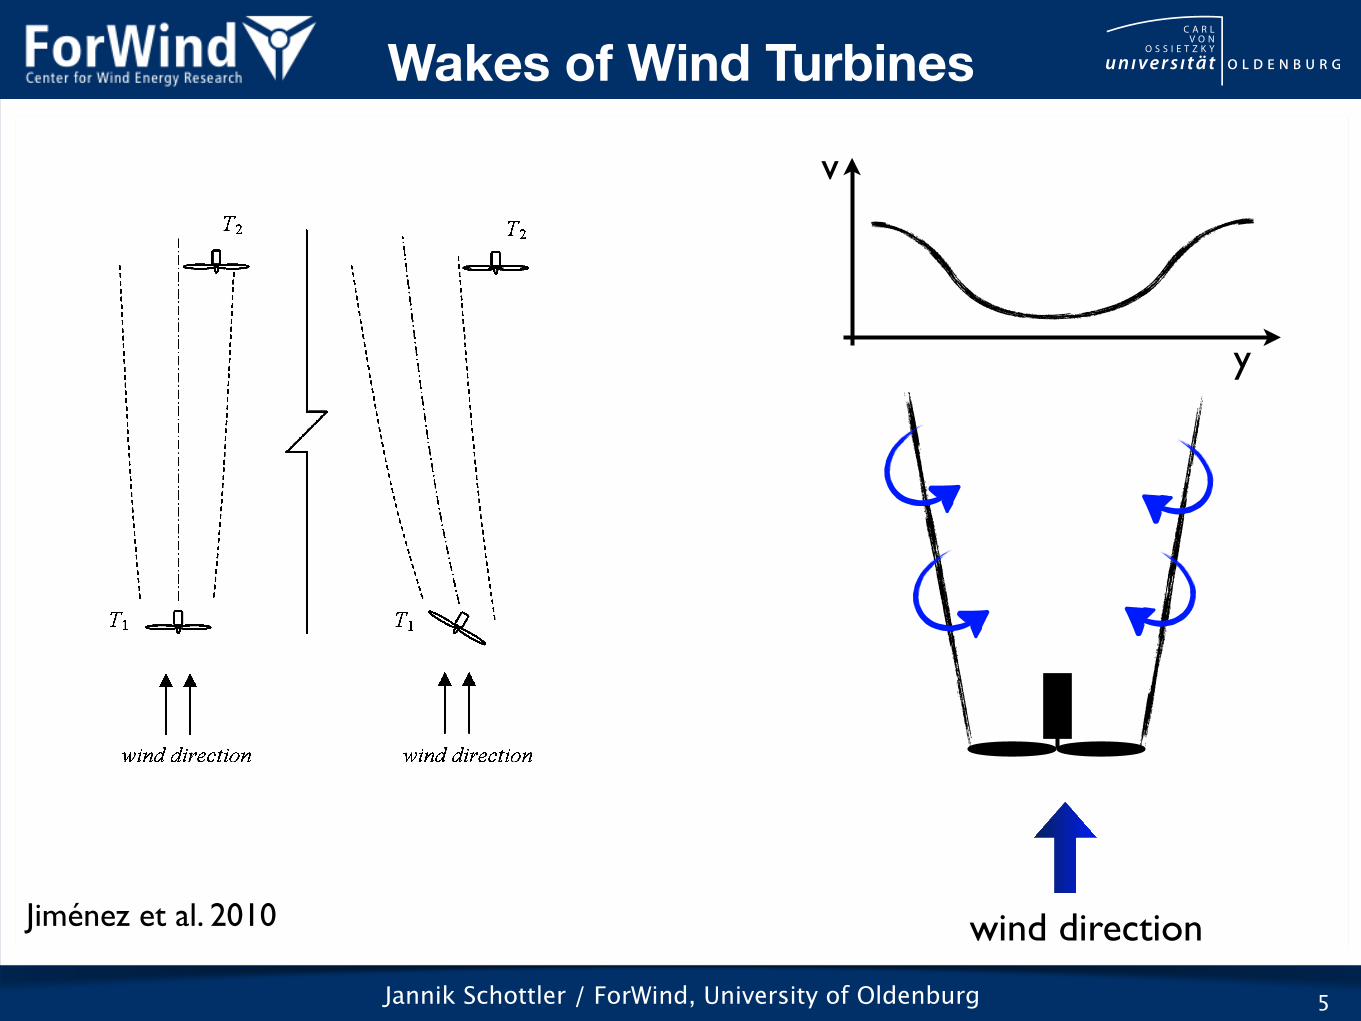
v
y
wind direction
Wakes of Wind Turbines
behind the rotor...
Decreased wind speed
‣power losses
Increased turbulence intensity
‣higher loads
Jannik Schottler / ForWind, University of Oldenburg 5
v
y
wind direction
Wind Energ. 2010; 13:559–572 © 2009 John Wiley & Sons, Ltd.DOI: 10.1002/we
560
Wake defl ection of a wind turbine in yaw Á. Jiménez, A. Crespo and E. Migoya
tensor proposed by Gómez-Elvira et al.7 In all these previ-ous methods, the Reynolds average over all turbulence scales is imposed. Instead, LES will reproduce the unsteady oscillations of the fl ow characteristics over all scales larger than the grid size; consequently, a greater detail of the turbulence characteristics is expected to be obtained. In Jiménez et al.,4 a LES computation of the wake was per-formed immersing an actuator disk-modelled turbine in an environment with turbulence properties similar to the ones of the atmosphere. A similar technique is used by other authors like Masson,8 Kasmi and Mason,9 etc. Together with the actuator disk approach, it must be highlighted the actuator line representation given by Sørensen and Shen,10 recently used by Troldborg et al.11 to carry out a detailed LES analysis of a wind turbine wake under uniform infl ow conditions.
Jiménez et al.4 gave a comparison of LES results with experimental data obtained by Cleijne12 from the Sex-bierum wind farm and with analytical correlations pre-viously proposed by Crespo and Hernández13 and Gomez-Elvira et al.7 In the present work, application of the same technique to study the steady wake defl ection of a wind turbine in yaw is made.
Control of turbine parameters in wind farms has been suggested as a method to increase the power production of the whole wind farm and to reduce fatigue loads due to the high level of turbulence in wakes. Corten and Shaak14 proposed a strategy based on decreasing the axial induc-tion factor (through pitch angle control) at the upwind side of the wind farm in order to get a higher wind speed in the wake and, consequently, a larger amount of available kinetic energy for the turbines under the lee side. The research presented in this paper can give an illustration of future possibilities to plan an active control to minimize the interference effects in wind farms, now based on the yaw of wind turbines.
When a wind turbine works in yaw, the wake intensity and the power production of the turbine become slightly smaller and a defl ection of the wake is induced. A suffi -ciently good understanding of this effect would allow an active control of the yaw angle of upstream turbines to steer the wake away from downstream machines, as illus-trated in Figure 1, reducing its effect on them and giving as consequence an optimization of the power output from the wind farm as a whole. Also a reduction of fatigue loads on downstream turbines due to a lower increase of turbu-lence intensity in wakes is achieved. However, possibly this also increases the fatigue in the fi rst turbine, since yawing itself may cause fatigue; accordingly, it should be quantifi ed if the net result is favourable.
The gross wake defl ection in yaw was shown by Clayton and Filby15 who performed hot-wired measurements in the wake of a wind turbine at a number of downstream posi-tions. Particle image velocimetry (PIV) technique was used by Grant et al.16 and Grant and Parkin17 enabling a detailed understanding of vortex formation and expansion phenomena in the near wake, both in yawed and non-yawed conditions, and giving information about the initial
skew angle of the wake of a yawed turbine. Concerning the interaction between machines, it is more relevant the experimental study done by Parkin et al.18 They obtained PIV images in the wake of a two bladed HAWT at dis-tances from one to fi ve diameters downstream, for differ-ent values of the yaw angle. Their PIV experiments were carried out with a two-bladed model wind turbine in a low turbulence wind tunnel at Kungliga Tekniska Högskolan (KTH), Sweden. Model turbines may not behave as full-sized ones and, consequently, it would be of interest to rely also on experimental measurements obtained on fi eld. Unfortunately, data about full-sized turbines operating in yaw conditions are scarce.
In this work, a preliminary analysis of wakes of wind turbines in yaw is presented. The wake defl ection and trajectories are studied and compared to a simple analytical model and with experimental results.
2. LES MODEL WITH SIMPLIFIED BOUNDARY CONDITIONS
Only a direct simulation of turbulence would be able to give us the full knowledge of the turbulence characteristics in the wake. In industrial or environmental applications, where Reynolds numbers are usually very high, direct-numerical simulations (DNS) of turbulence are generally impossible because the very wide range that exists between the largest and the smallest turbulent scales cannot be explicitly simulated, even in the most powerful computers. Furthermore, DNS is not feasible near rough boundaries
Figure 1. Recreation of the wake defl ection due to a wind turbine in yaw.
Jiménez et al. 2010
Wakes of Wind Turbines
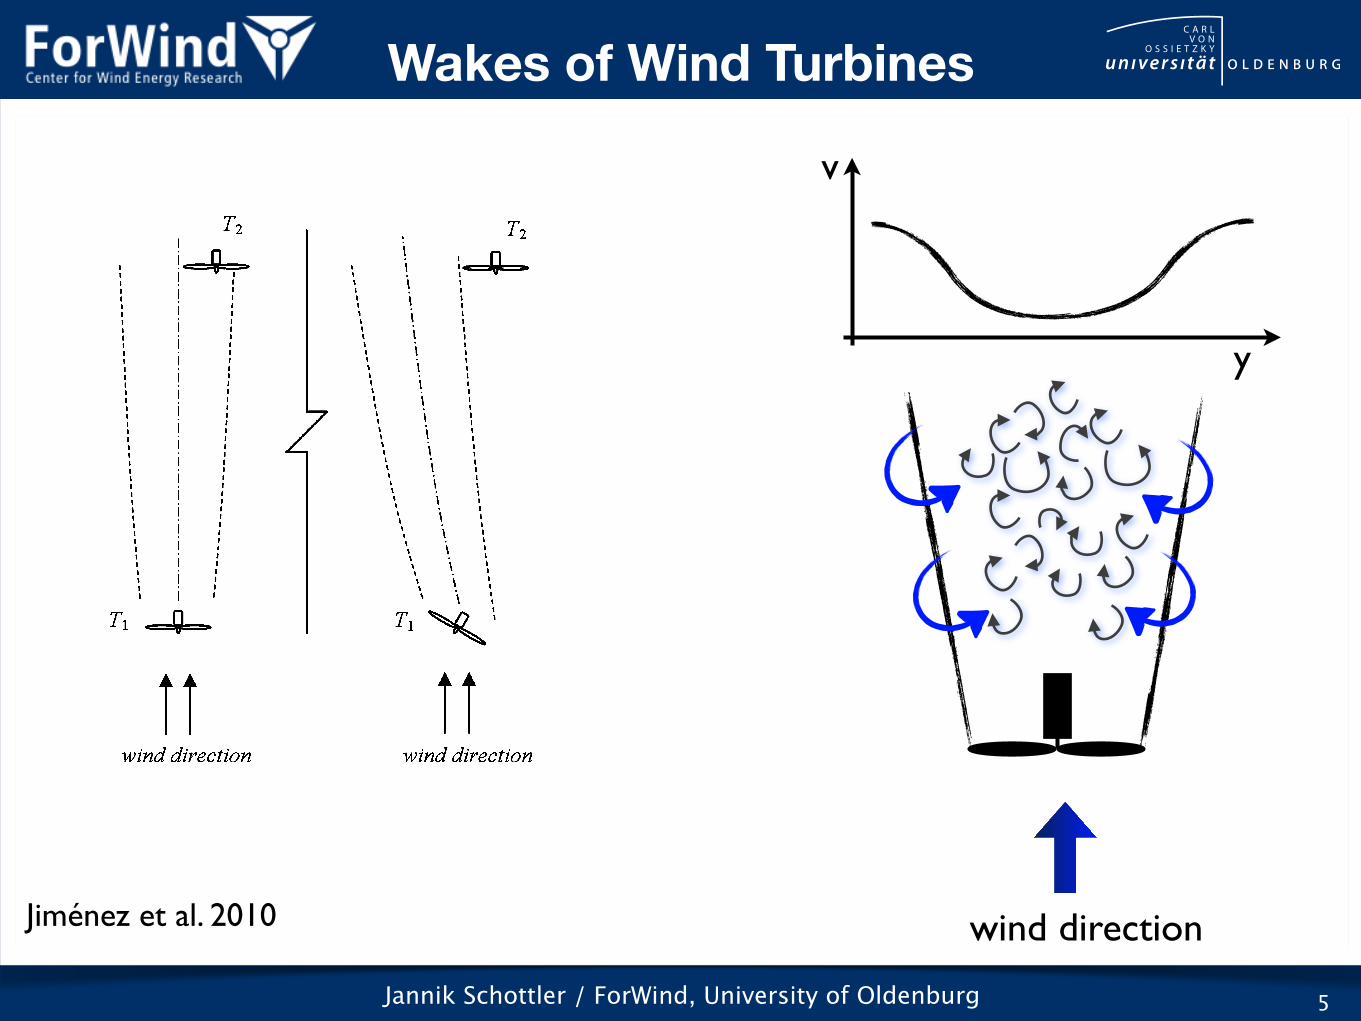
Jannik Schottler / ForWind, University of Oldenburg
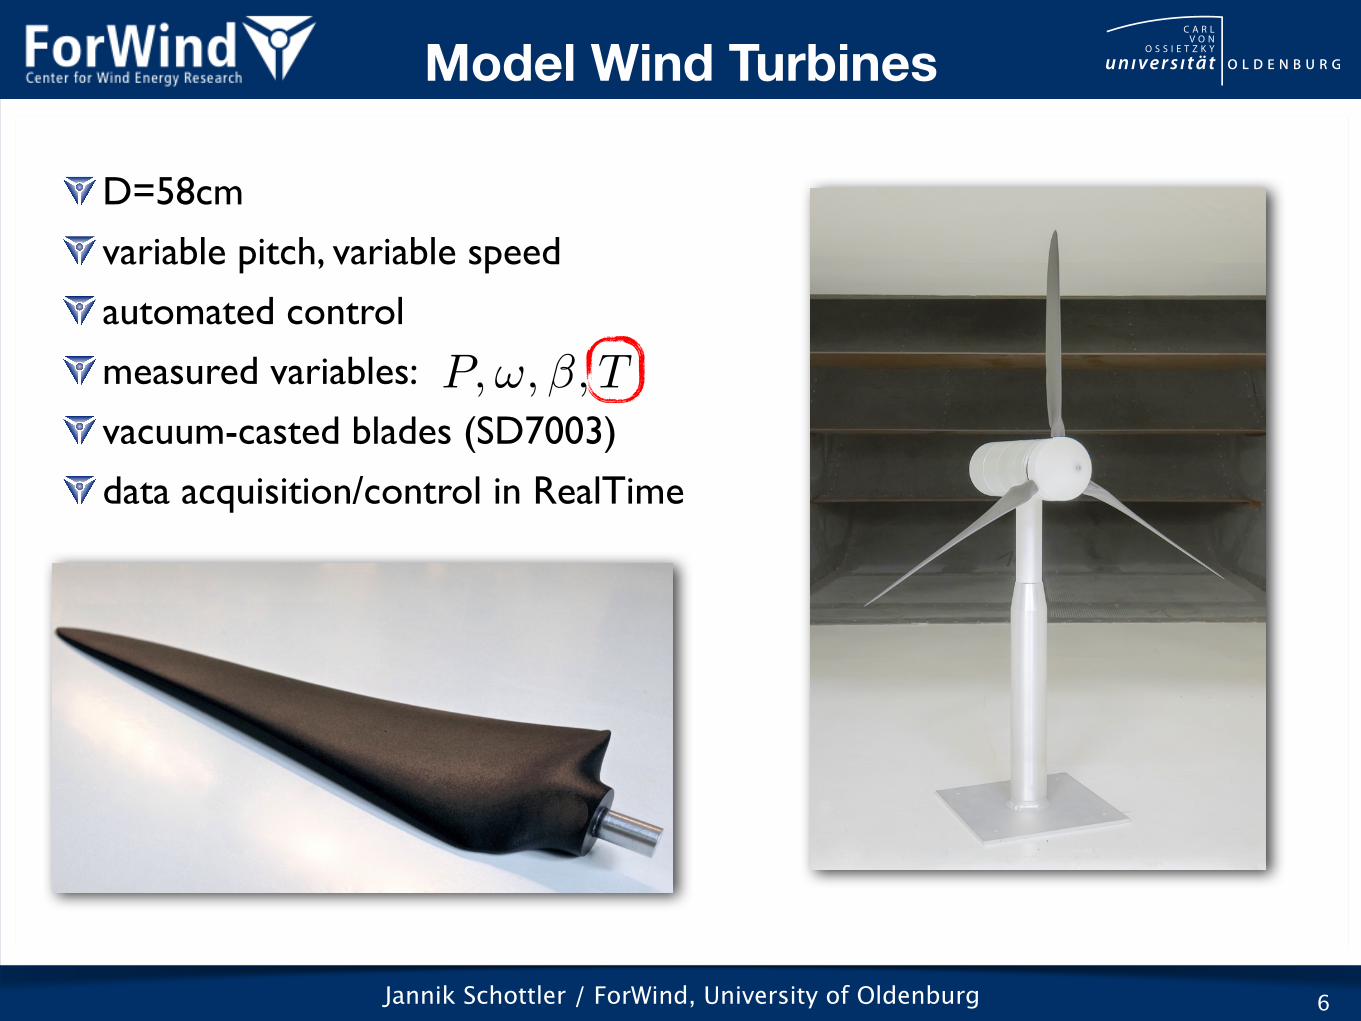
D=58cm
variable pitch, variable speed
automated control
measured variables:
vacuum-casted blades (SD7003)
data acquisition/control in RealTime
6
P,!,�, T
Model Wind Turbines
Jannik Schottler / ForWind, University of Oldenburg
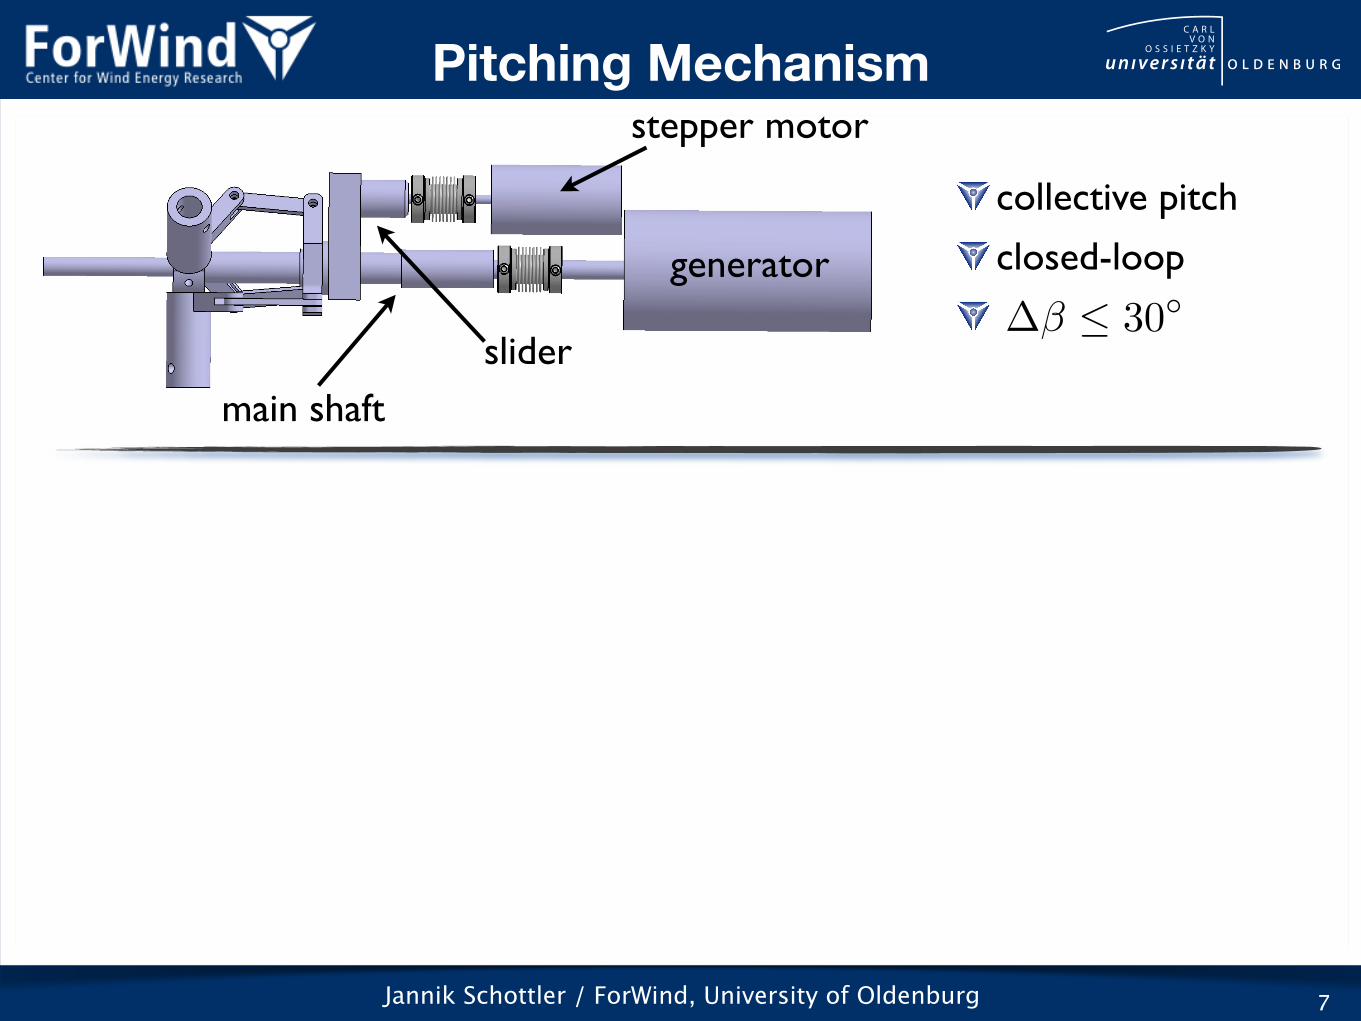
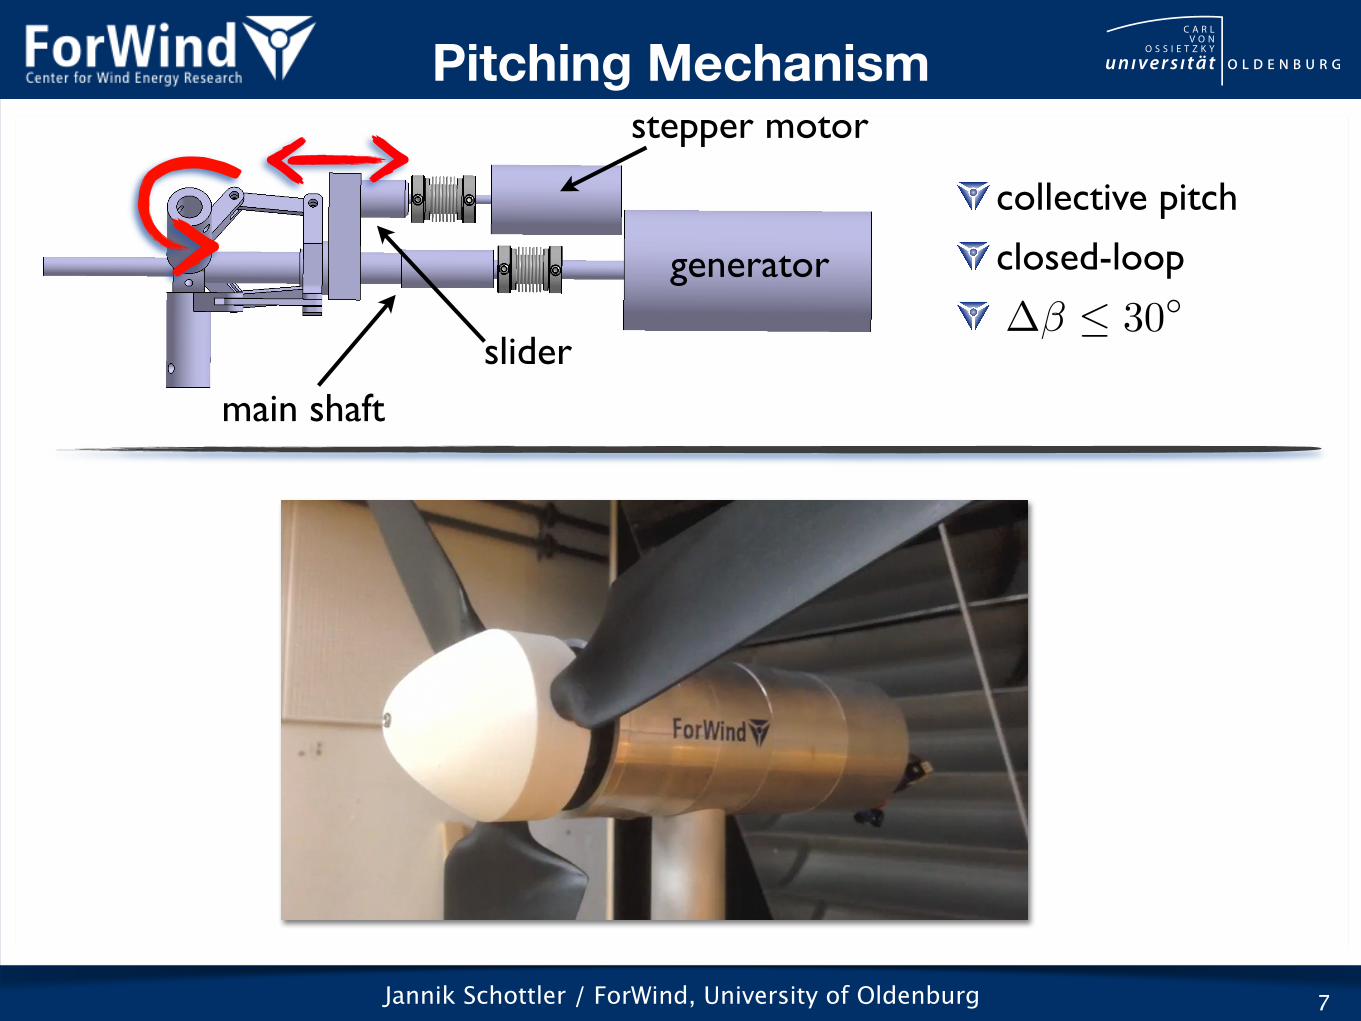
collective pitch
closed-loop
7
generator
stepper motor
main shaftslider
�� 30�
Pitching Mechanism
Jannik Schottler / ForWind, University of Oldenburg
collective pitch
closed-loop
7
generator
stepper motor
main shaftslider
�� 30�
Pitching Mechanism
Jannik Schottler / ForWind, University of Oldenburg 8
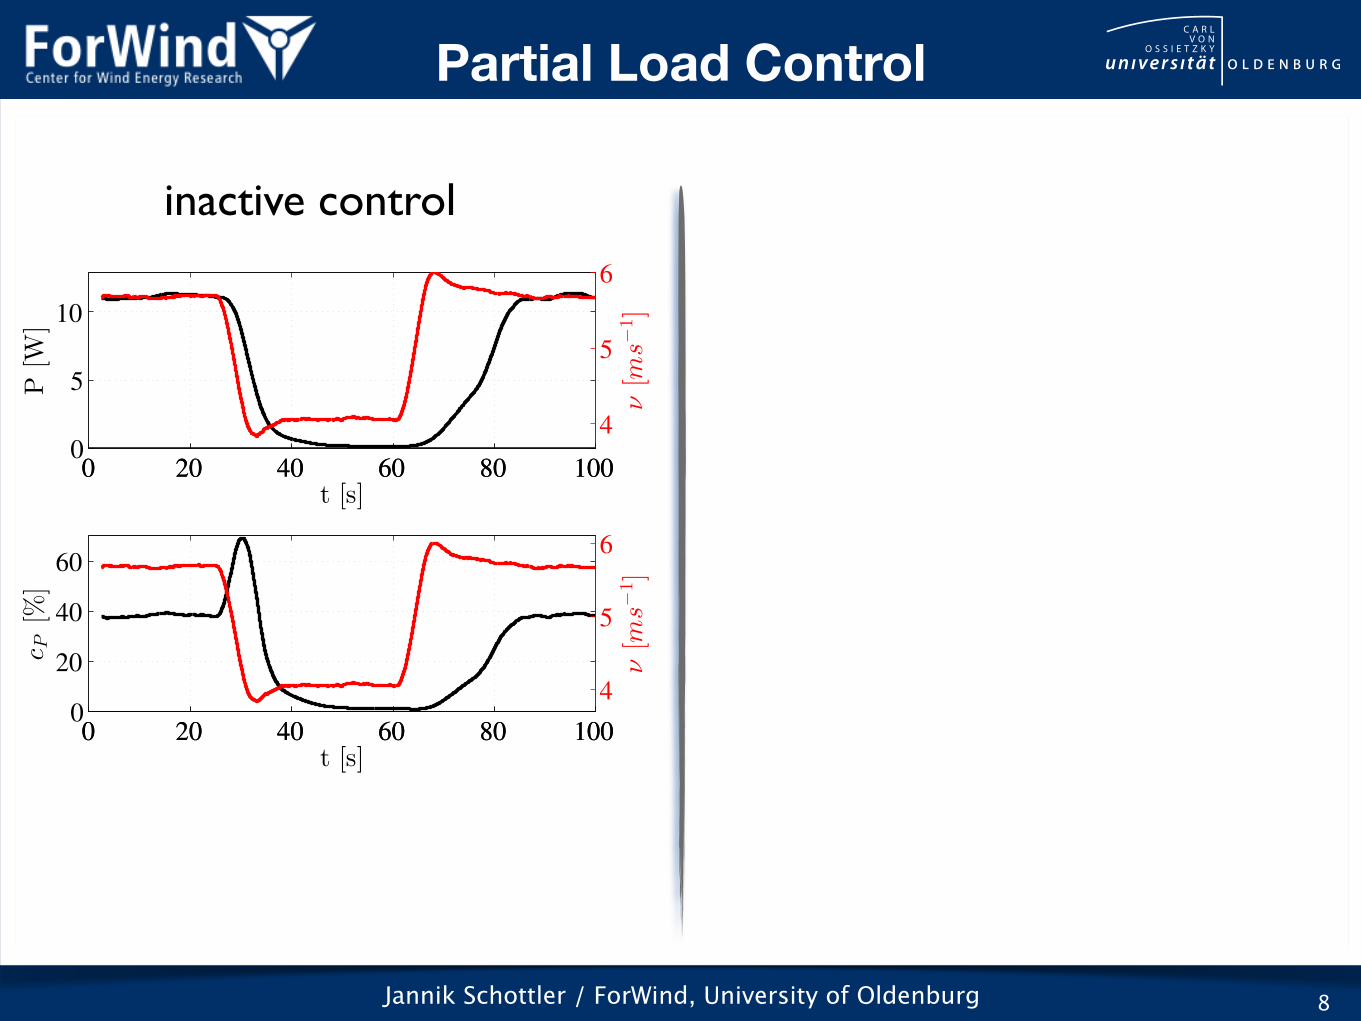
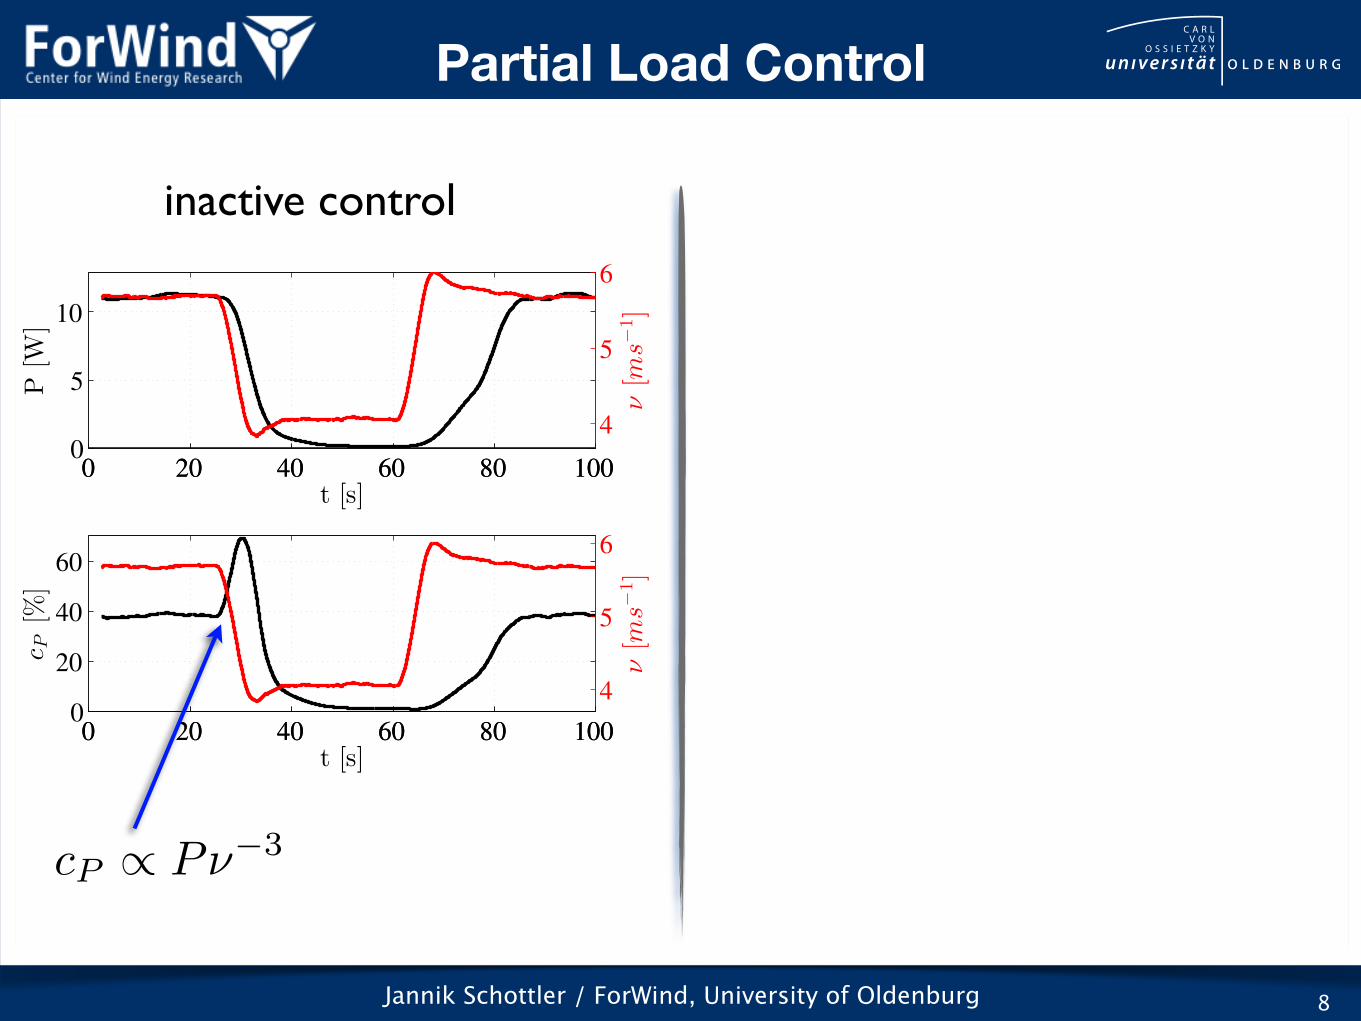
inactive control
0 20 40 60 80 1000
5
10
P[W
]
t [s]0 20 40 60 80 100
4
5
6
ν[m
s−1]
0 20 40 60 80 1000
20
40
60
cP[%
]
t [s]0 20 40 60 80 100
4
5
6
ν[m
s−1]
Partial Load Control
Jannik Schottler / ForWind, University of Oldenburg 8
inactive control
0 20 40 60 80 1000
5
10
P[W
]
t [s]0 20 40 60 80 100
4
5
6
ν[m
s−1]
0 20 40 60 80 1000
20
40
60
cP[%
]
t [s]0 20 40 60 80 100
4
5
6
ν[m
s−1]
cP / P⌫�3
Partial Load Control
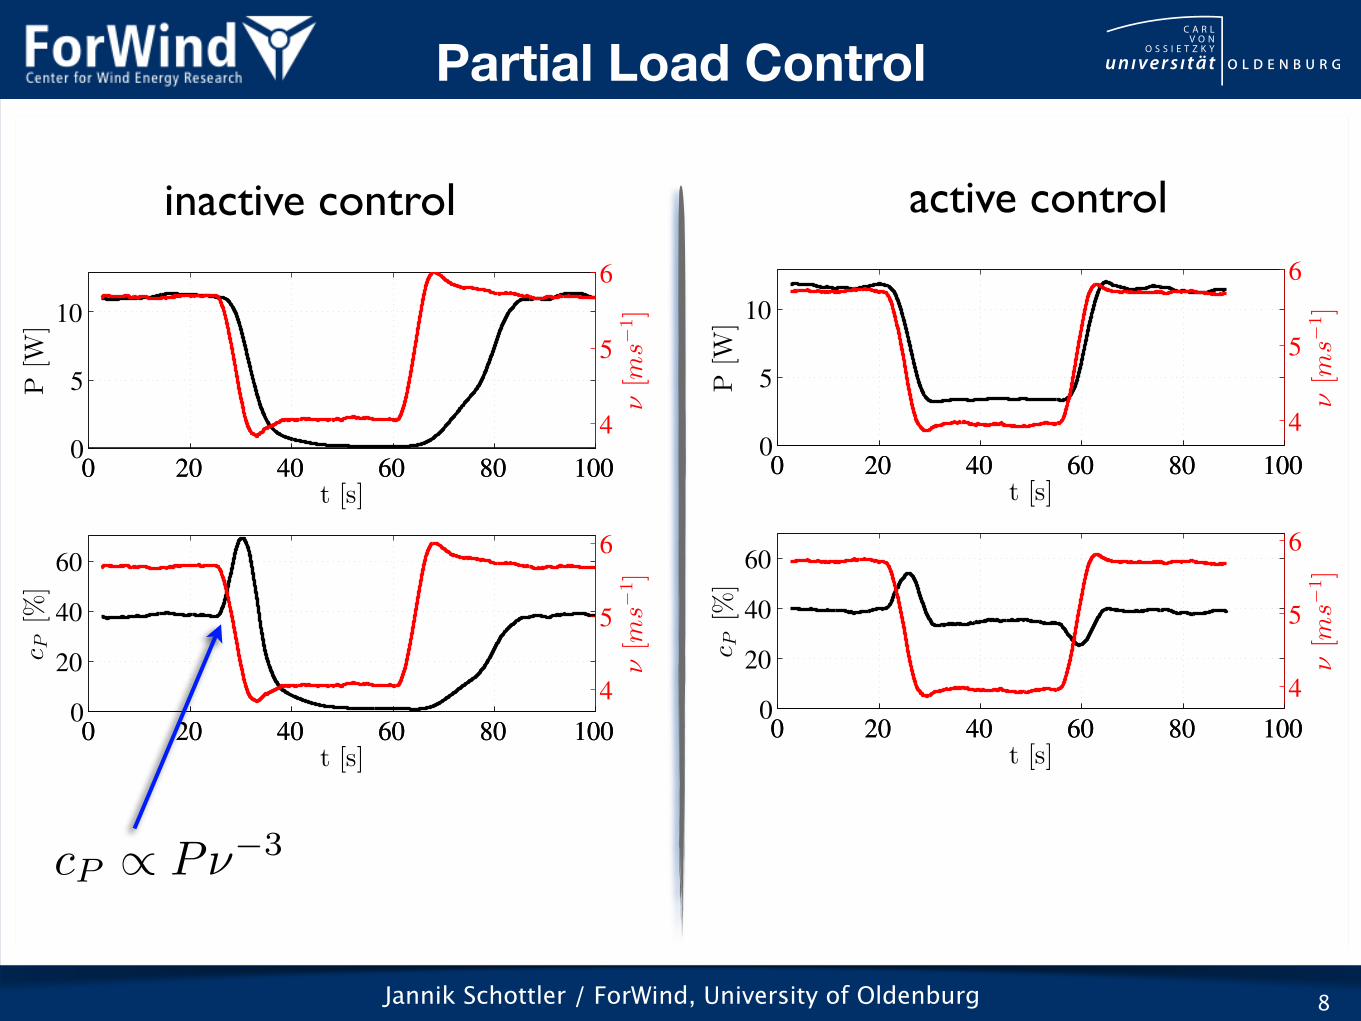
Jannik Schottler / ForWind, University of Oldenburg 8
inactive control
0 20 40 60 80 1000
5
10
P[W
]
t [s]0 20 40 60 80 100
4
5
6
ν[m
s−1]
0 20 40 60 80 1000
20
40
60
cP[%
]
t [s]0 20 40 60 80 100
4
5
6
ν[m
s−1]
active control
0 20 40 60 80 1000
5
10
P[W
]
t [s]0 20 40 60 80 100
4
5
6
ν[m
s−1]
0 20 40 60 80 1000
20
40
60
cP[%
]t [s]
0 20 40 60 80 100
4
5
6
ν[m
s−1]
cP / P⌫�3
Partial Load Control
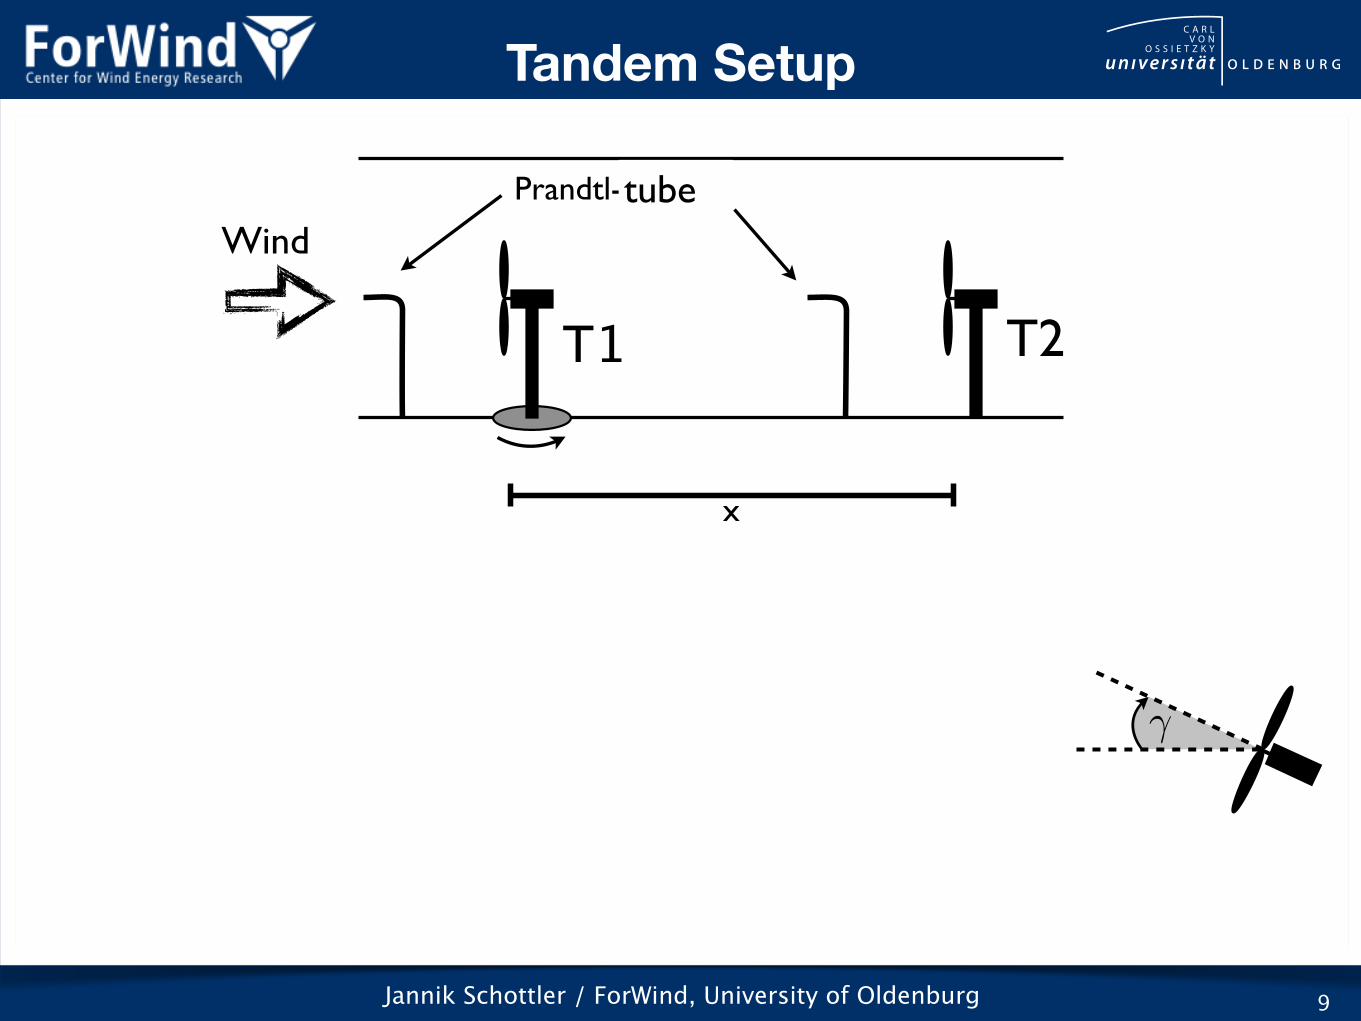
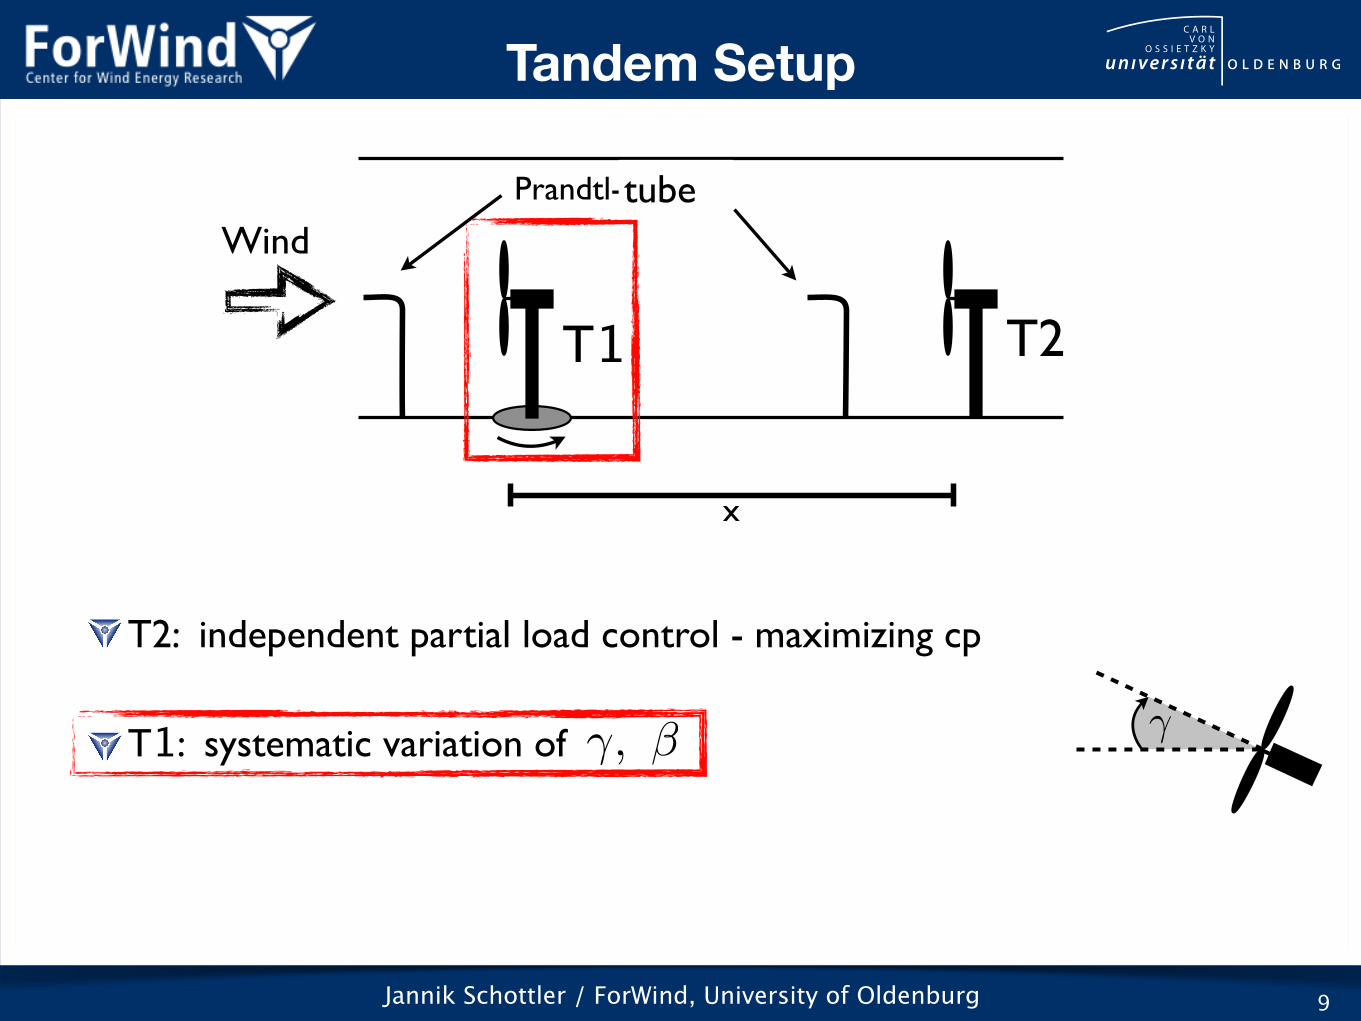
Jannik Schottler / ForWind, University of Oldenburg 9
x
Prandtl-Sonden
Wind
A1 A2
tube
T1 T2
�
Tandem Setup
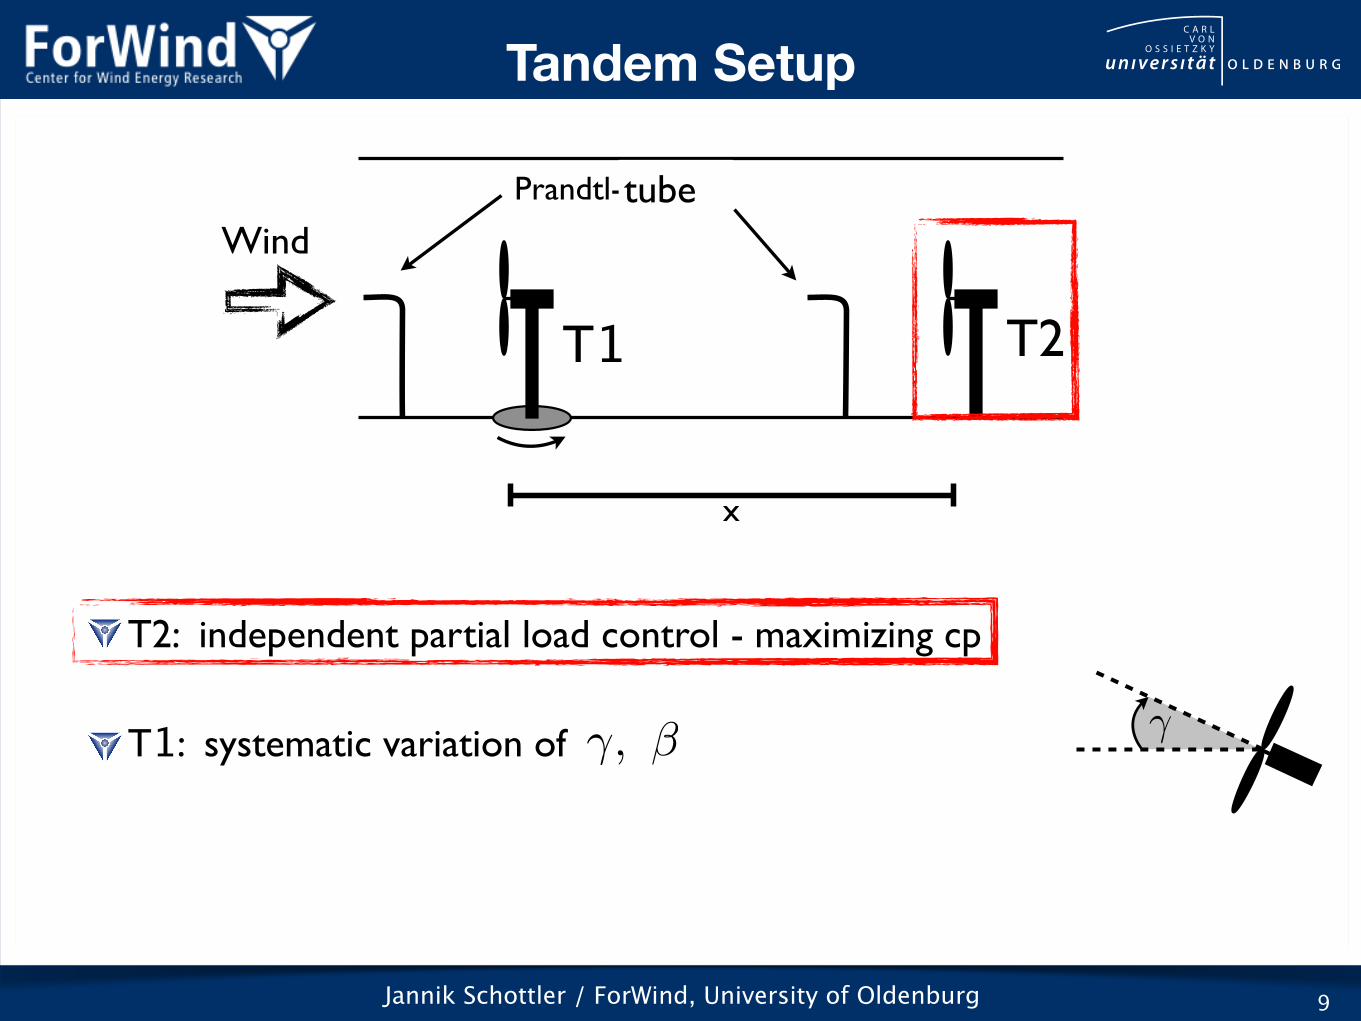
Jannik Schottler / ForWind, University of Oldenburg
T2: independent partial load control - maximizing cp
T1: systematic variation of
9
x
Prandtl-Sonden
Wind
A1 A2
tube
T1 T2
�, � �
Tandem Setup
Jannik Schottler / ForWind, University of Oldenburg
T2: independent partial load control - maximizing cp
T1: systematic variation of
9
x
Prandtl-Sonden
Wind
A1 A2
tube
T1 T2
�, � �
Tandem Setup
Jannik Schottler / ForWind, University of Oldenburg 10
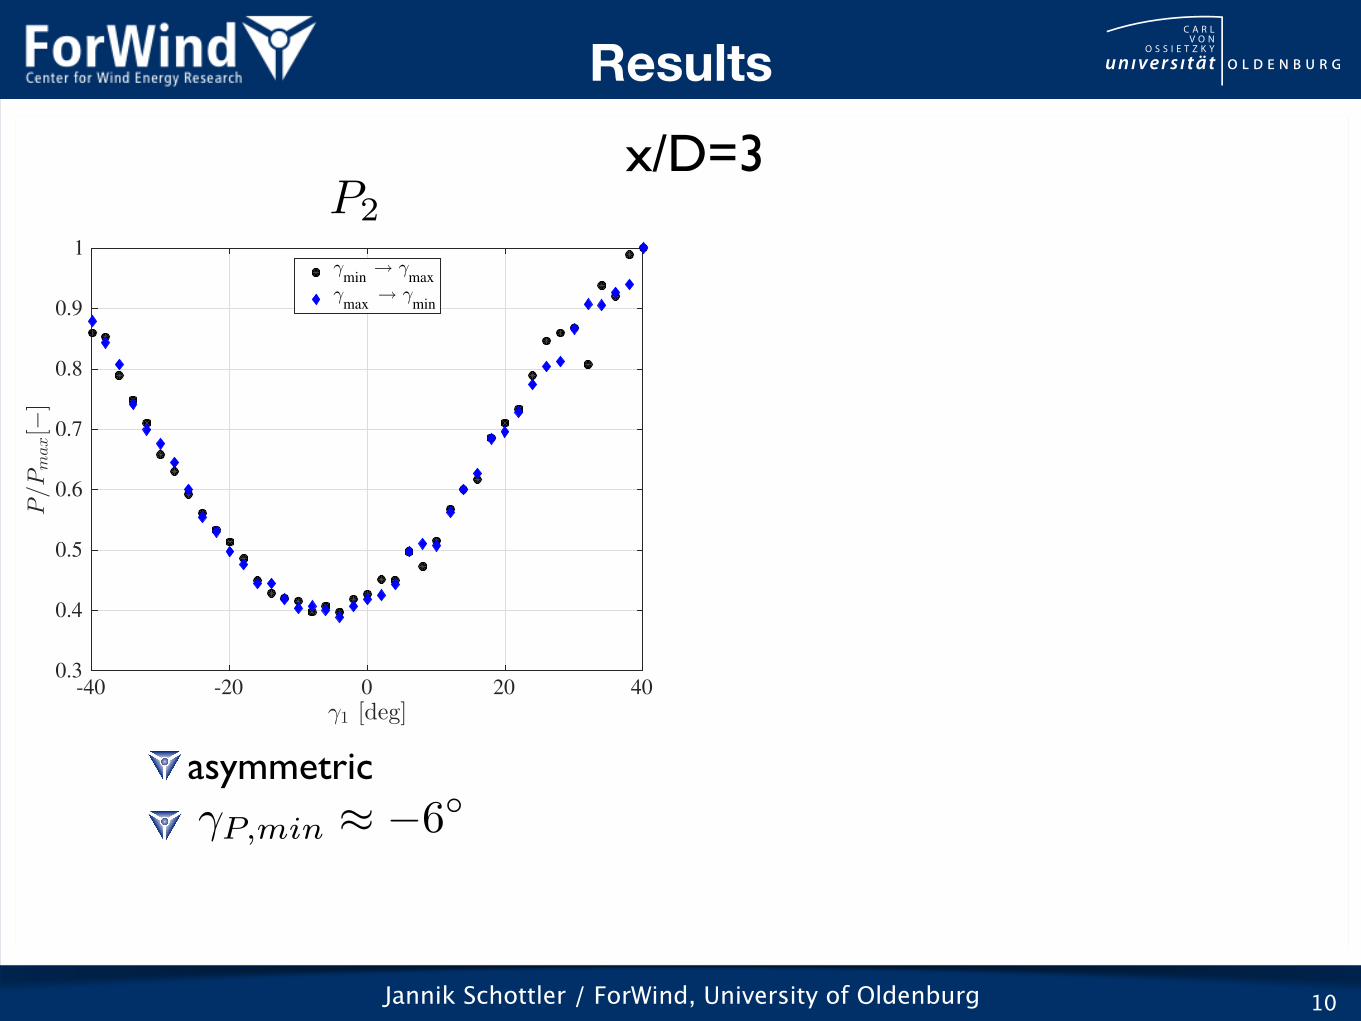
x/D=3
asymmetric�P,min ⇡ �6�
P2
γ1 [deg]-40 -20 0 20 40
P/Pmax[−
]
0.3
0.4
0.5
0.6
0.7
0.8
0.9
1γ
min → γ
max
γmax
→ γmin
Results

Jannik Schottler / ForWind, University of Oldenburg 10
x/D=3
asymmetric�P,min ⇡ �6�
P2
γ1 [deg]-40 -20 0 20 40
P/Pmax[−
]
0.3
0.4
0.5
0.6
0.7
0.8
0.9
1γ
min → γ
max
γmax
→ γmin
Ptot
asymmetric
+6%!
�P,max
⇡ 18�
γ1 [deg]-40 -20 0 20 40
P/Pmax[−
]
0.75
0.8
0.85
0.9
0.95
1
γmin
→ γmax
γmax
→ γmin
Results
Jannik Schottler / ForWind, University of Oldenburg 11
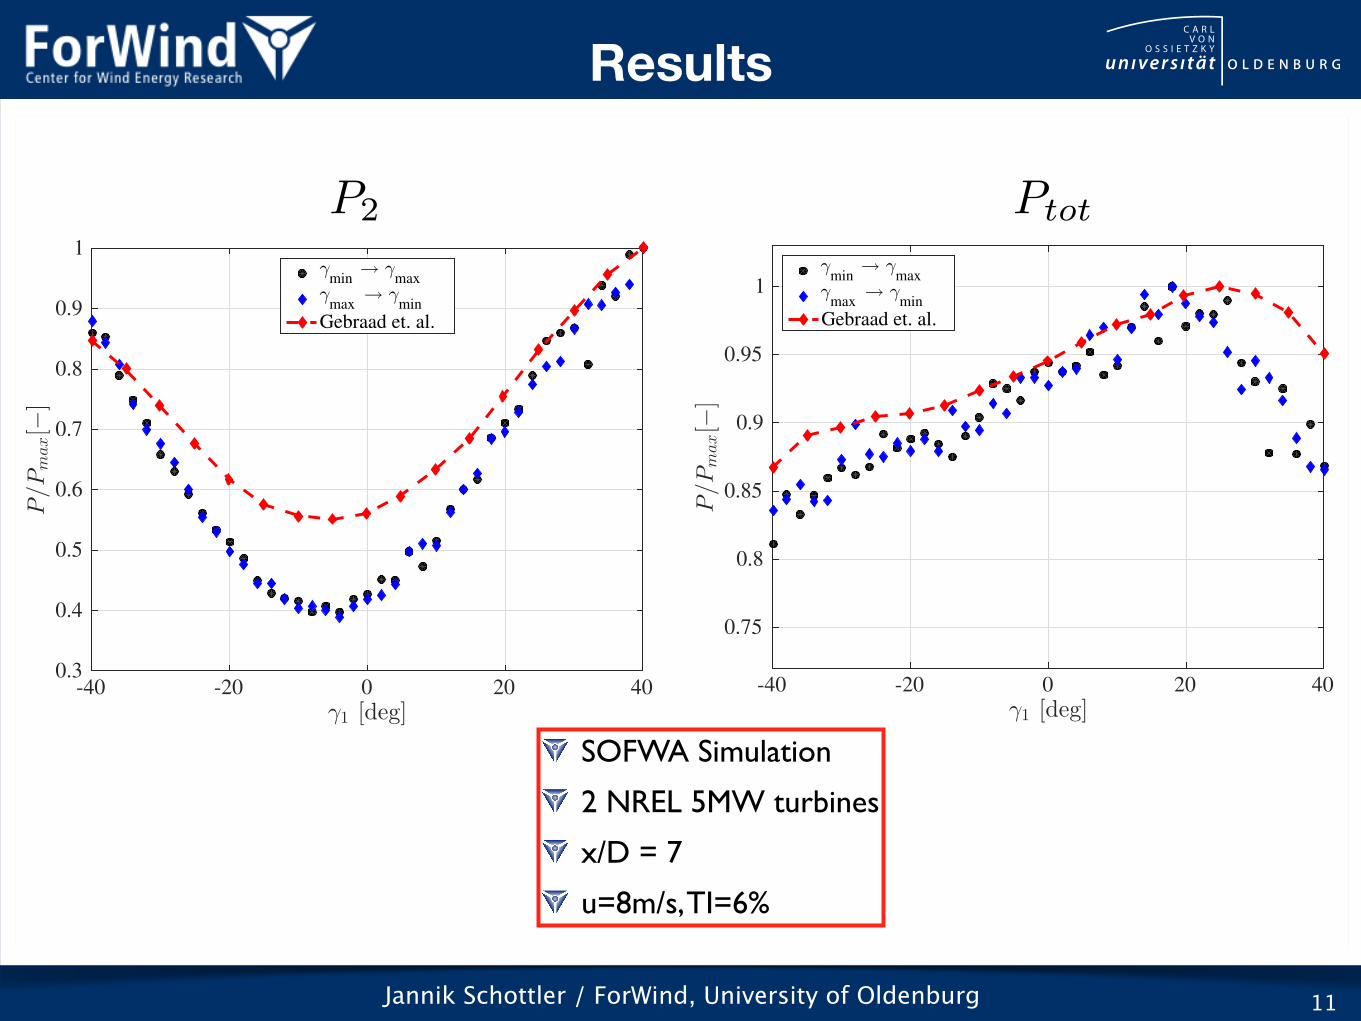
Ptot
P2
SOFWA Simulation
2 NREL 5MW turbines
x/D = 7
u=8m/s, TI=6%
γ1 [deg]-40 -20 0 20 40
P/Pmax[−
]
0.75
0.8
0.85
0.9
0.95
1
γmin
→ γmax
γmax
→ γmin
Gebraad et. al.
γ1 [deg]-40 -20 0 20 40
P/Pmax[−
]
0.3
0.4
0.5
0.6
0.7
0.8
0.9
1γ
min → γ
max
γmax
→ γmin
Gebraad et. al.
Results

Jannik Schottler / ForWind, University of Oldenburg
two ‘variable speed, variable pitch’ model wind turbines
tested partial load control
12
Tandem Setup
Summary
Jannik Schottler / ForWind, University of Oldenburg
two ‘variable speed, variable pitch’ model wind turbines
tested partial load control
12
improved power output for yaw misalignment in tandem-configuration
‣ +6% for x/D=3 at 18° yaw misalignment of T1
in good agreement with simulations!
Tandem Setup
Summary
Jannik Schottler / ForWind, University of Oldenburg 13
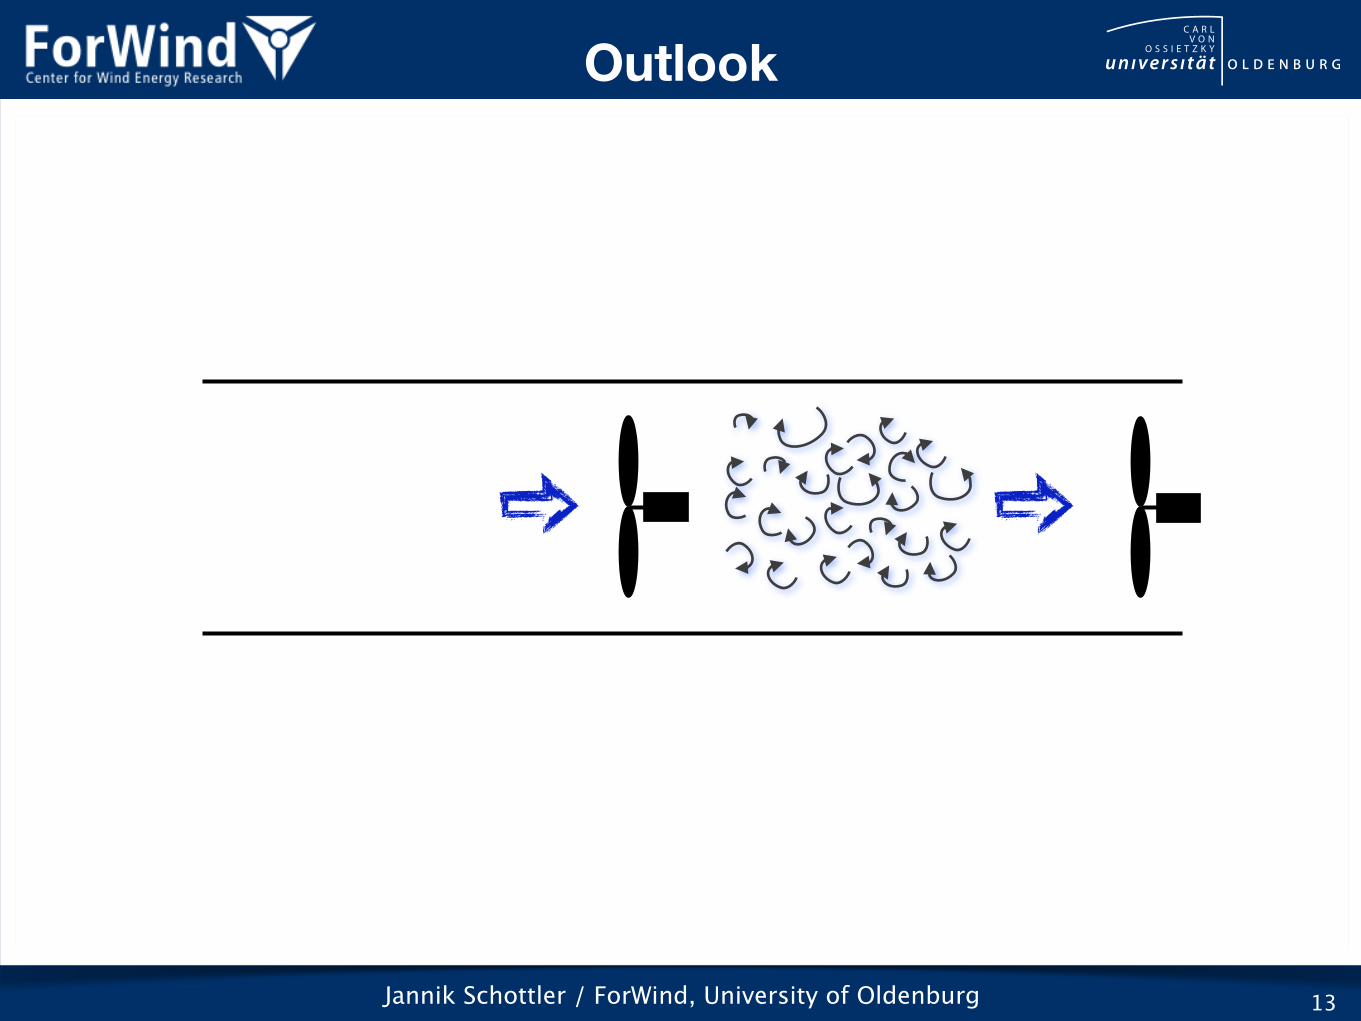
Outlook
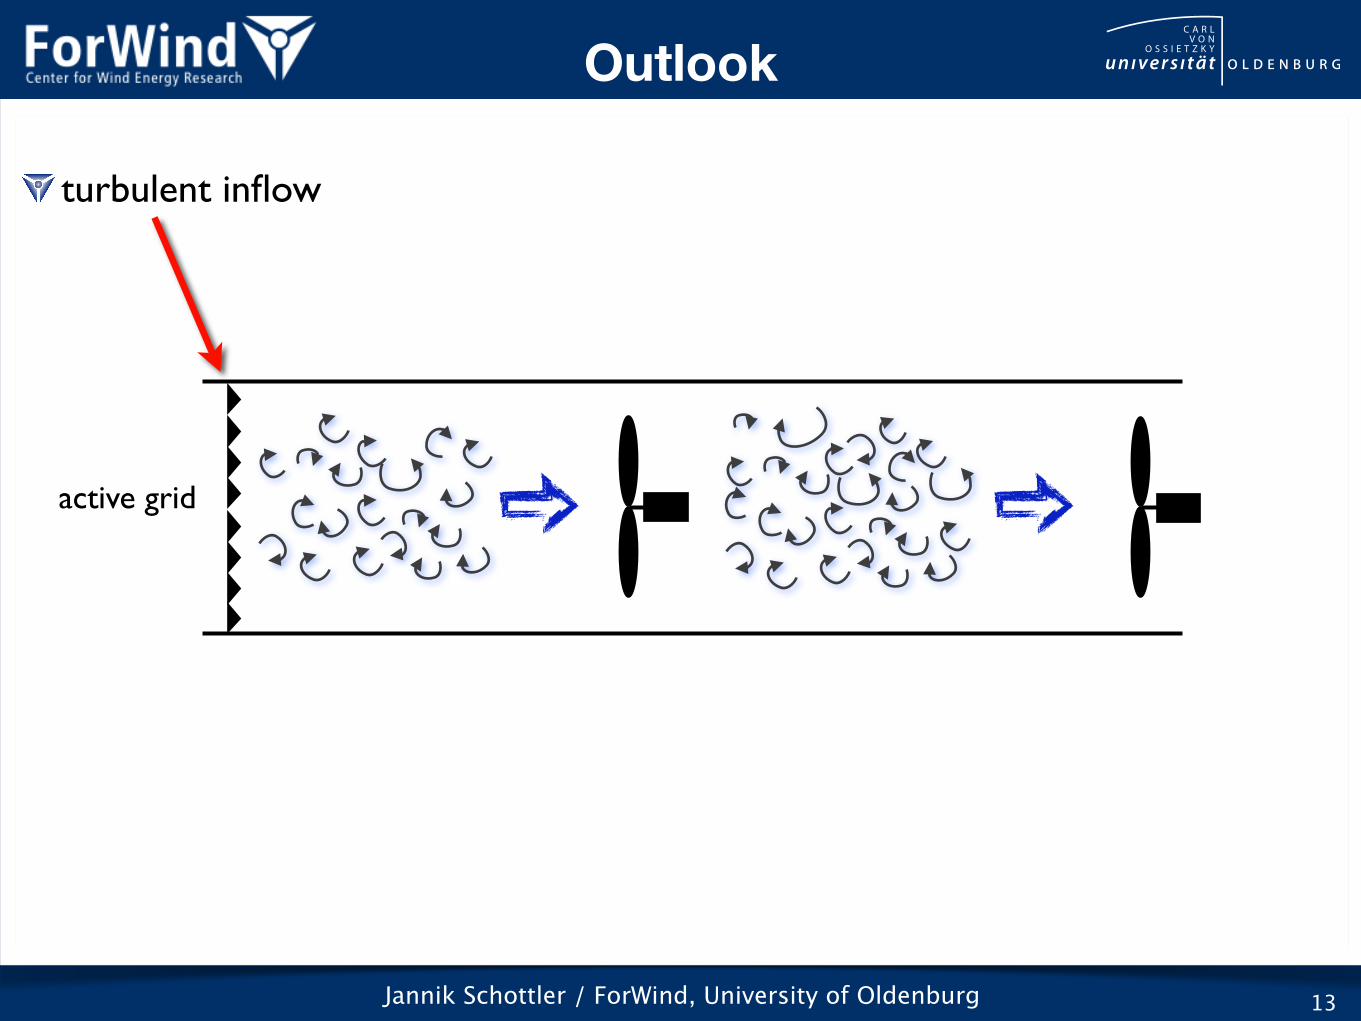
Jannik Schottler / ForWind, University of Oldenburg 13
turbulent inflow
active grid
Outlook
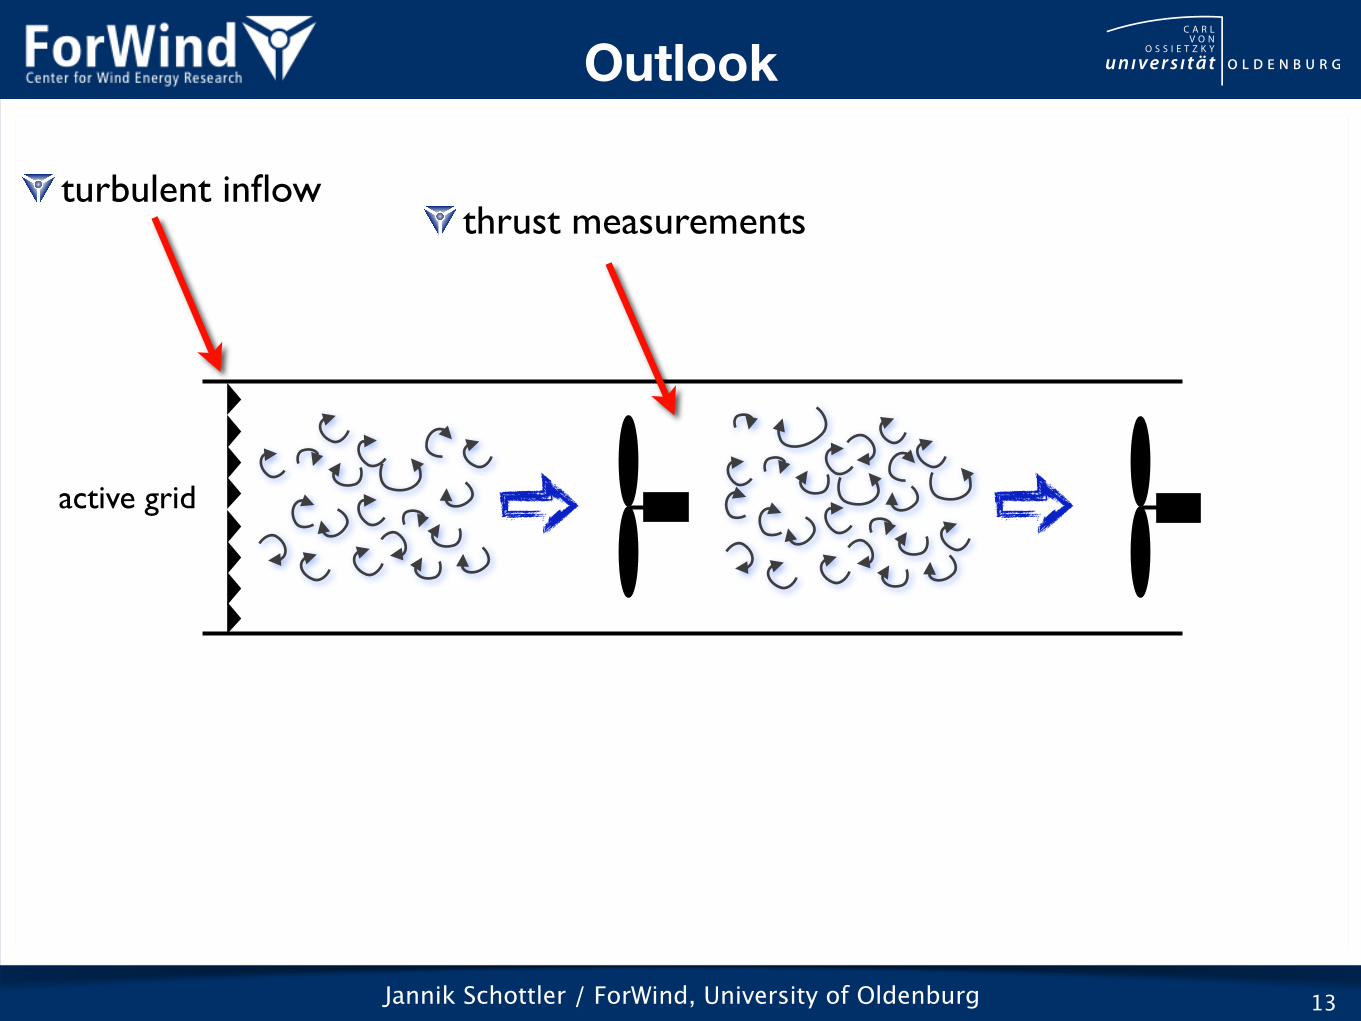
Jannik Schottler / ForWind, University of Oldenburg 13
thrust measurementsturbulent inflow
active grid
Outlook
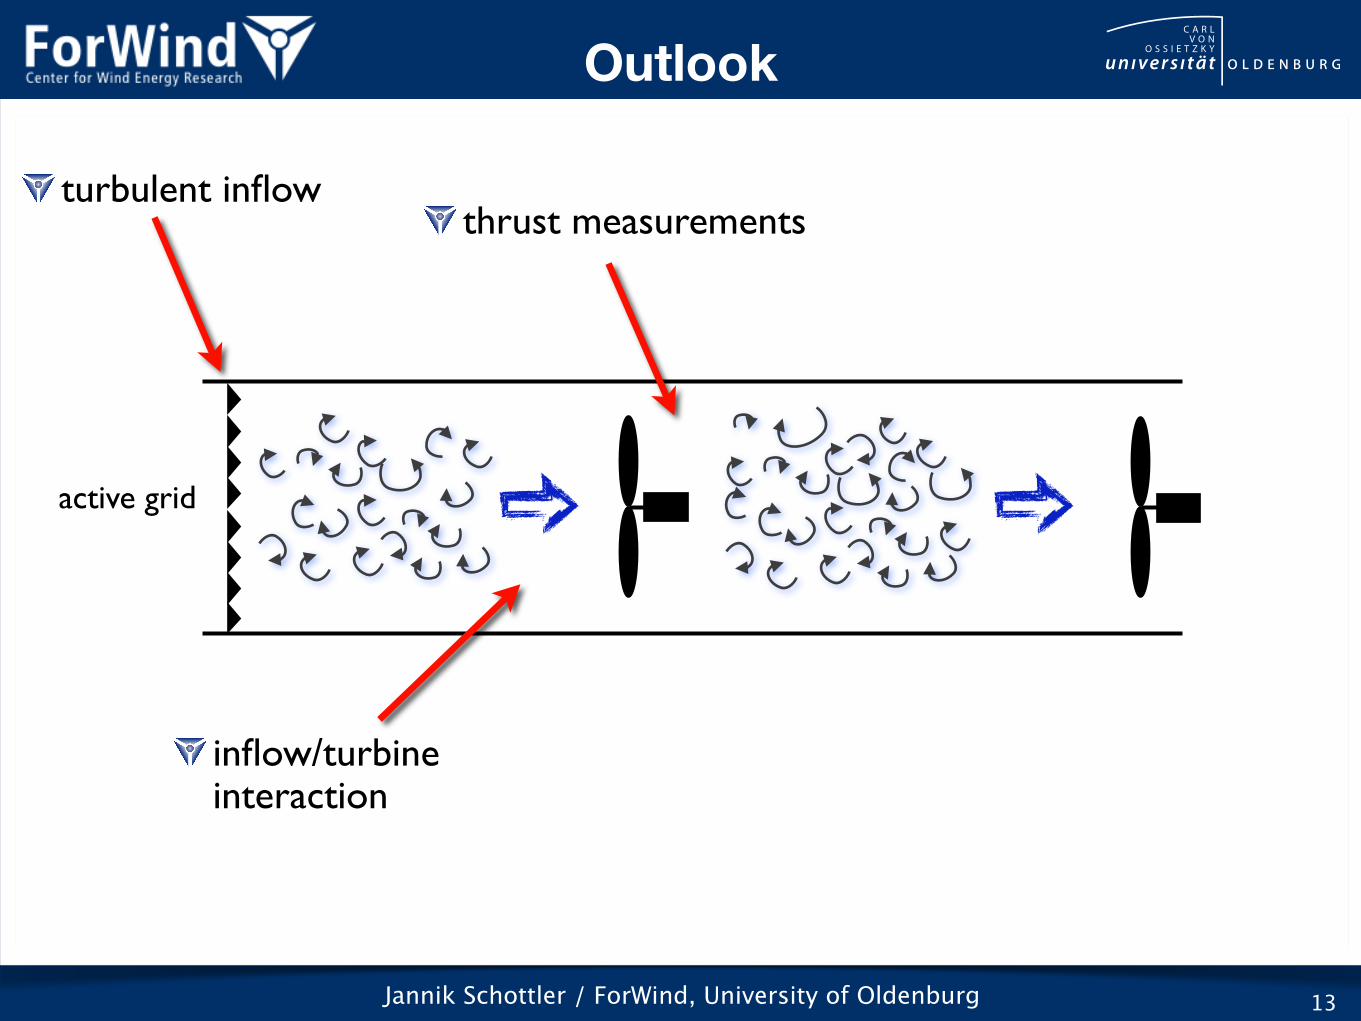
Jannik Schottler / ForWind, University of Oldenburg 13
inflow/turbine interaction
thrust measurementsturbulent inflow
active grid
Outlook
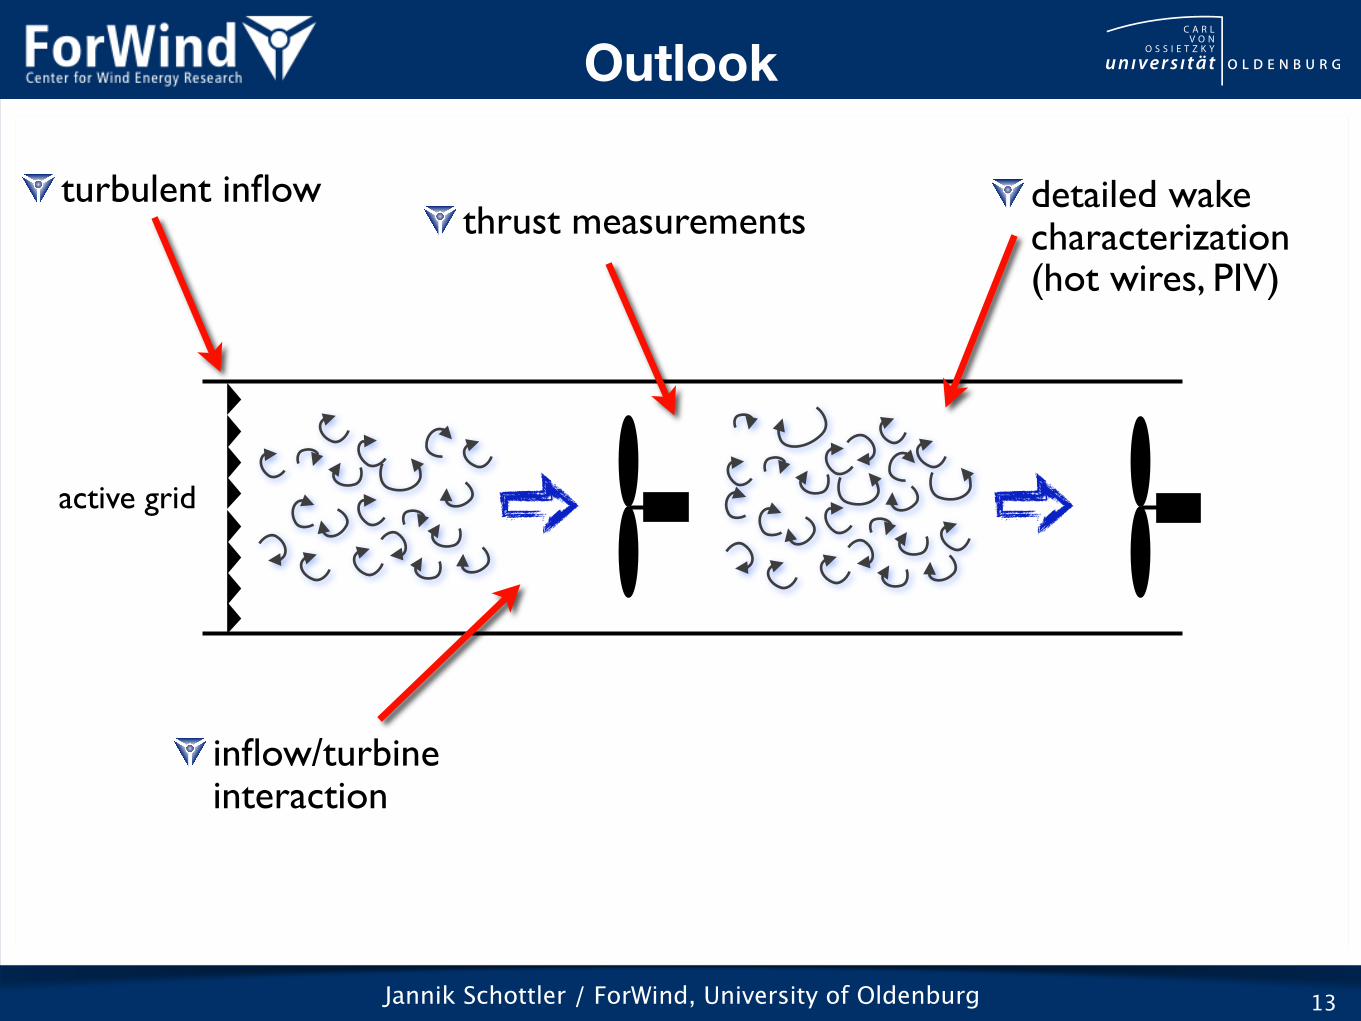
detailed wake characterization(hot wires, PIV)
Jannik Schottler / ForWind, University of Oldenburg 13
inflow/turbine interaction
thrust measurementsturbulent inflow
active grid
Outlook
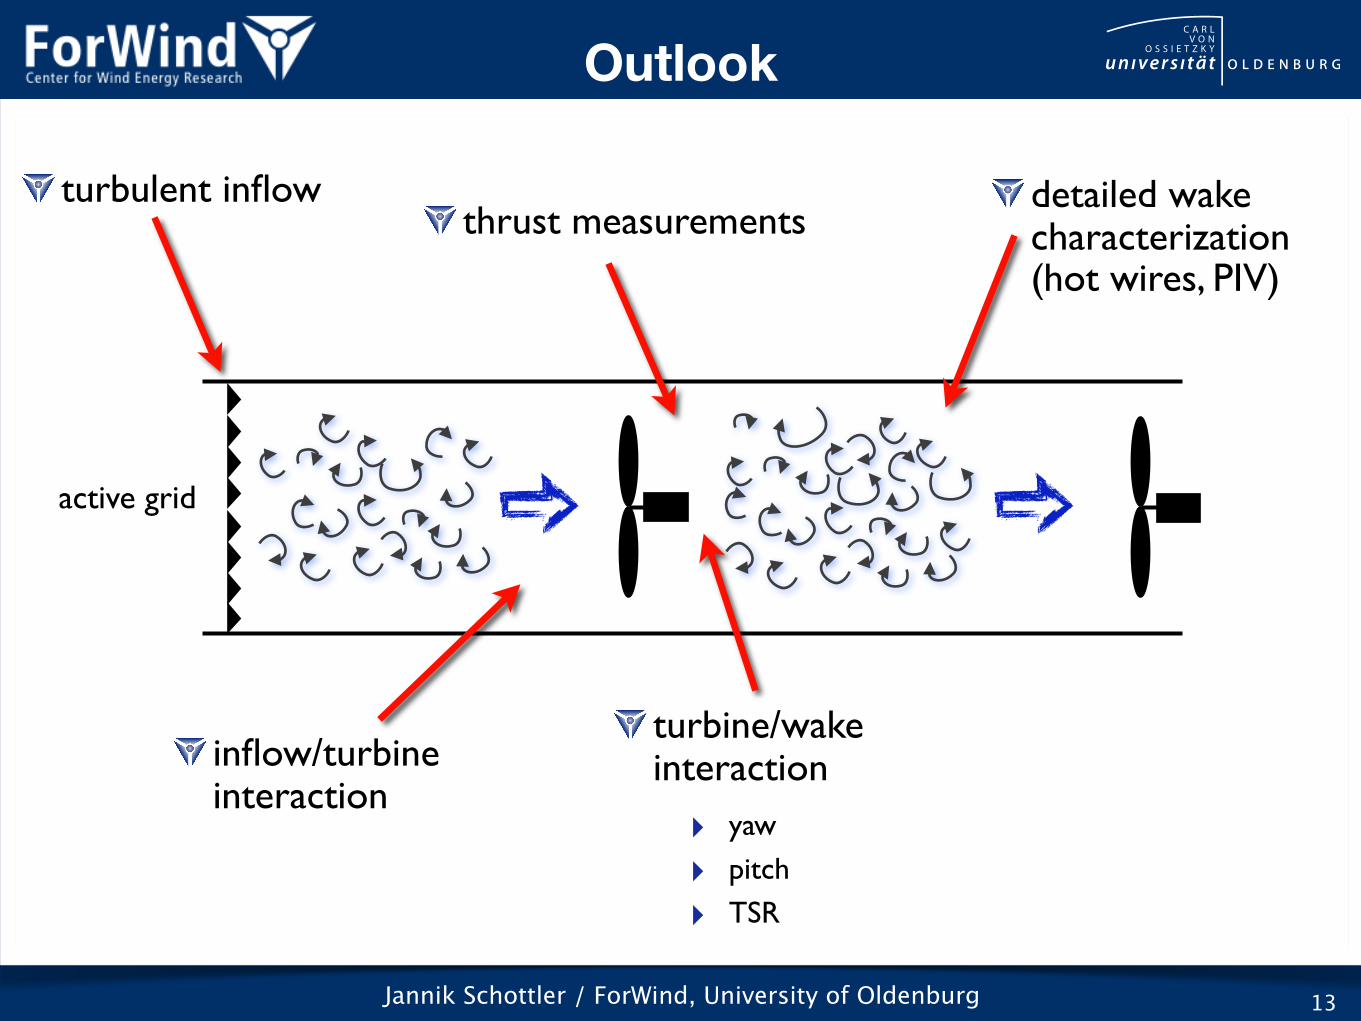
detailed wake characterization(hot wires, PIV)
Jannik Schottler / ForWind, University of Oldenburg 13
inflow/turbine interaction
turbine/wake interaction
thrust measurementsturbulent inflow
active grid
‣ yaw
‣ pitch
‣ TSR
Outlook
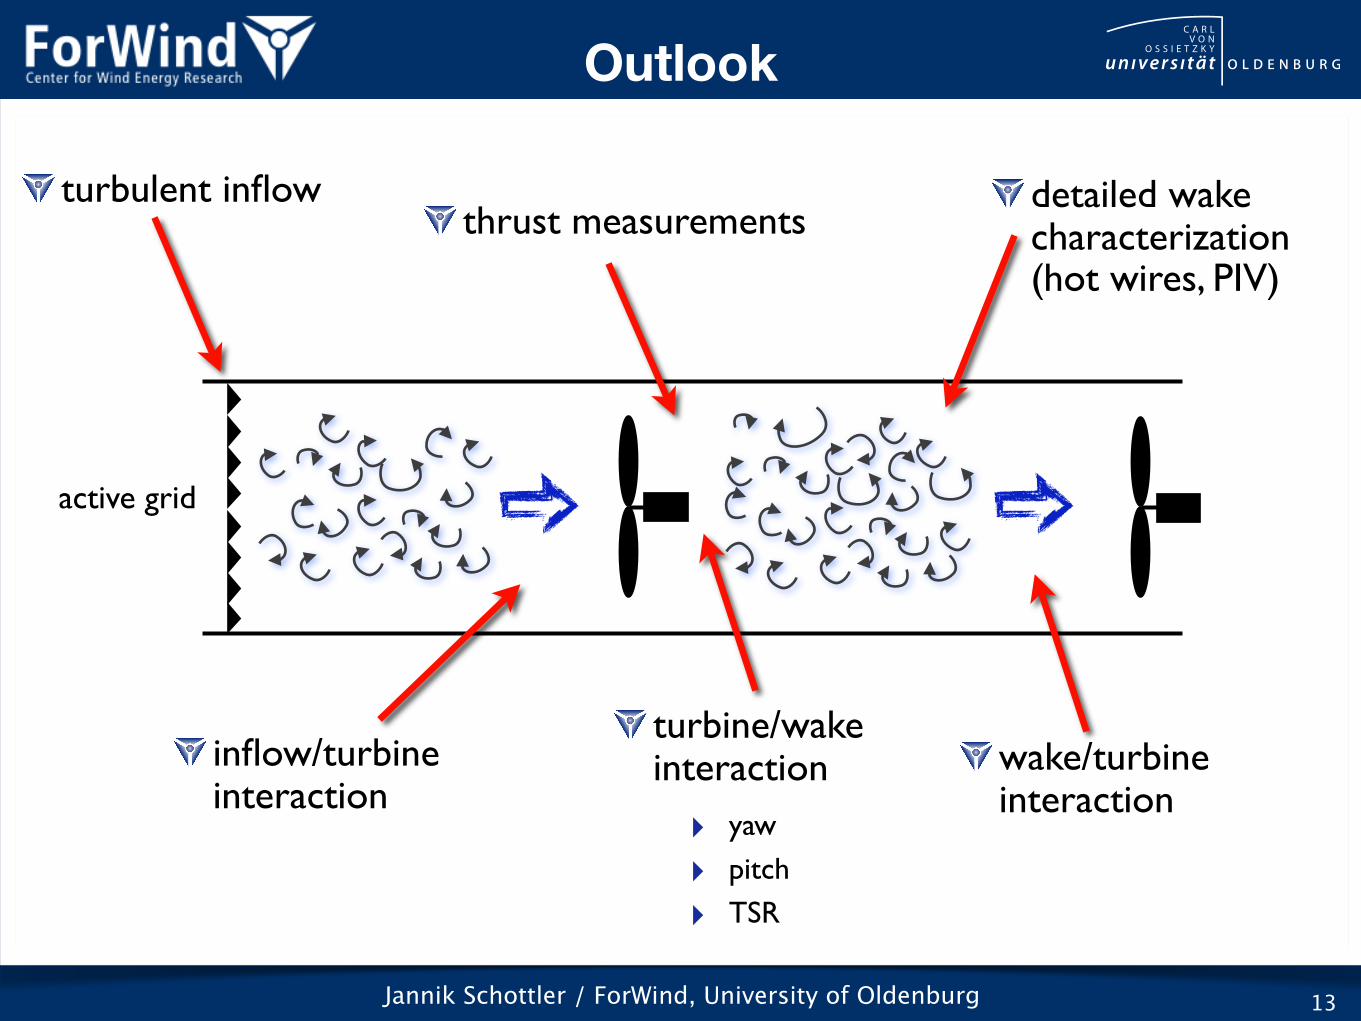
detailed wake characterization(hot wires, PIV)
Jannik Schottler / ForWind, University of Oldenburg 13
inflow/turbine interaction
turbine/wake interaction wake/turbine
interaction
thrust measurementsturbulent inflow
active grid
‣ yaw
‣ pitch
‣ TSR
Outlook
Jannik Schottler / ForWind, University of Oldenburg 14
,custom‘ turbulence
Active Grid
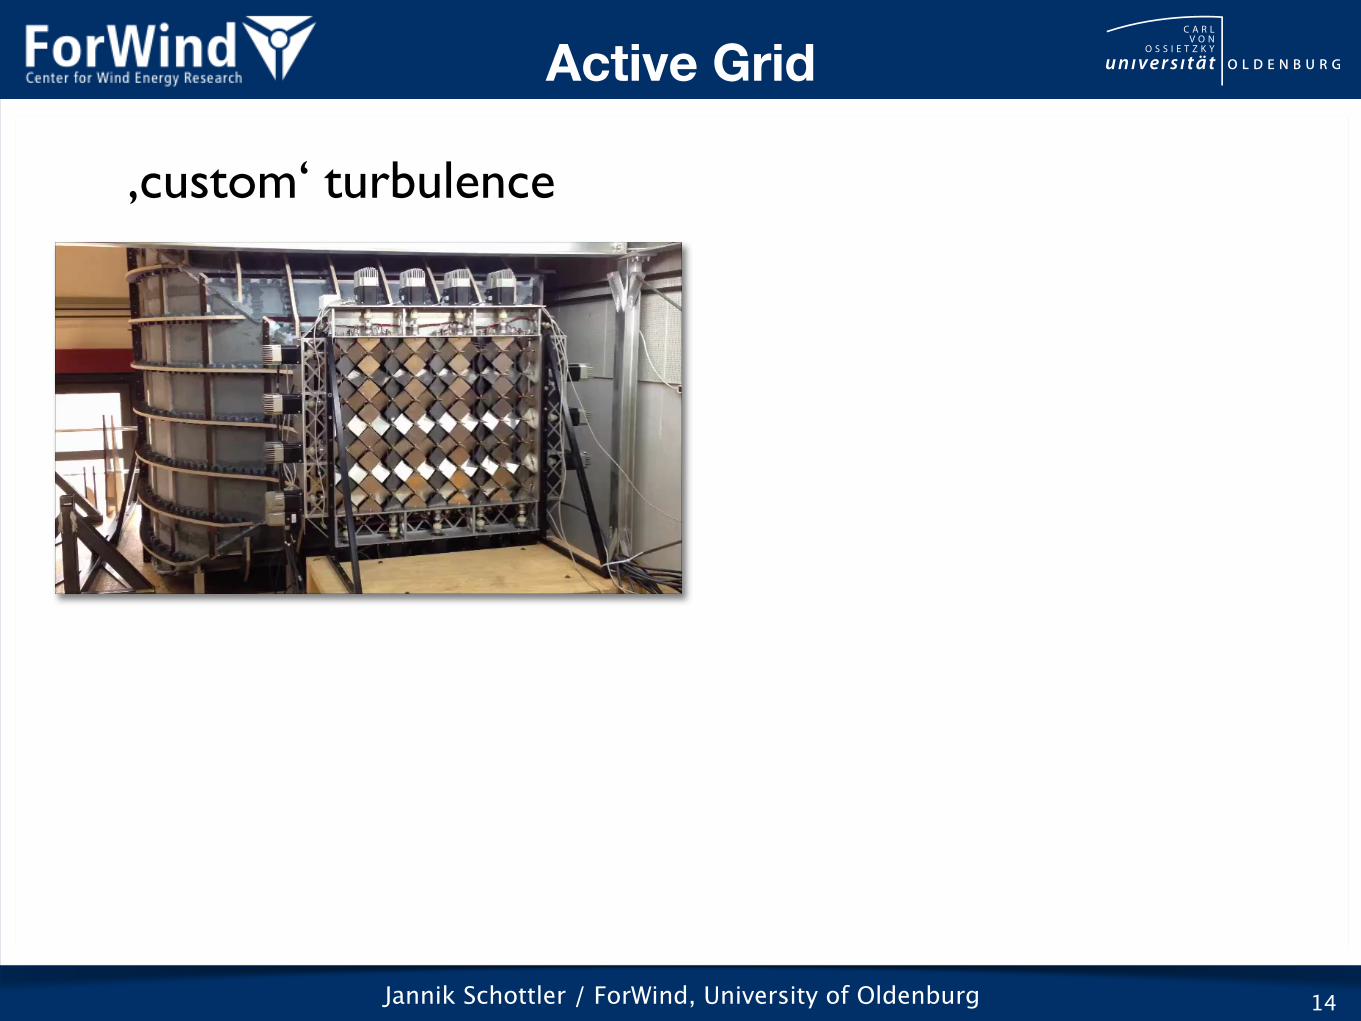
Jannik Schottler / ForWind, University of Oldenburg 14
,custom‘ turbulence
Active Grid

Jannik Schottler / ForWind, University of Oldenburg 14
,custom‘ turbulence
LiDAR measurements by Risø, DTU
Experiments: ,Smart Blades‘ Project, Nico Reinke, André Fuchs, Tim Homeyer. ForWind, University of Oldenburg
t / s
0 10 20 30 40 50 60U
/ m
/s5
6
7
8
9
10
11
12
13
14
15
Hot wire
LiDAR
Active Grid
Jannik Schottler / ForWind, University of Oldenburg 15
Acknowledgement
Parts of this work was funded by the
Thank you for your attention!
Jannik Schottler / ForWind, University of Oldenburg 15
Acknowledgement
Parts of this work was funded by the
Thank you for your attention!
Jannik Schottler / ForWind, University of Oldenburg 16
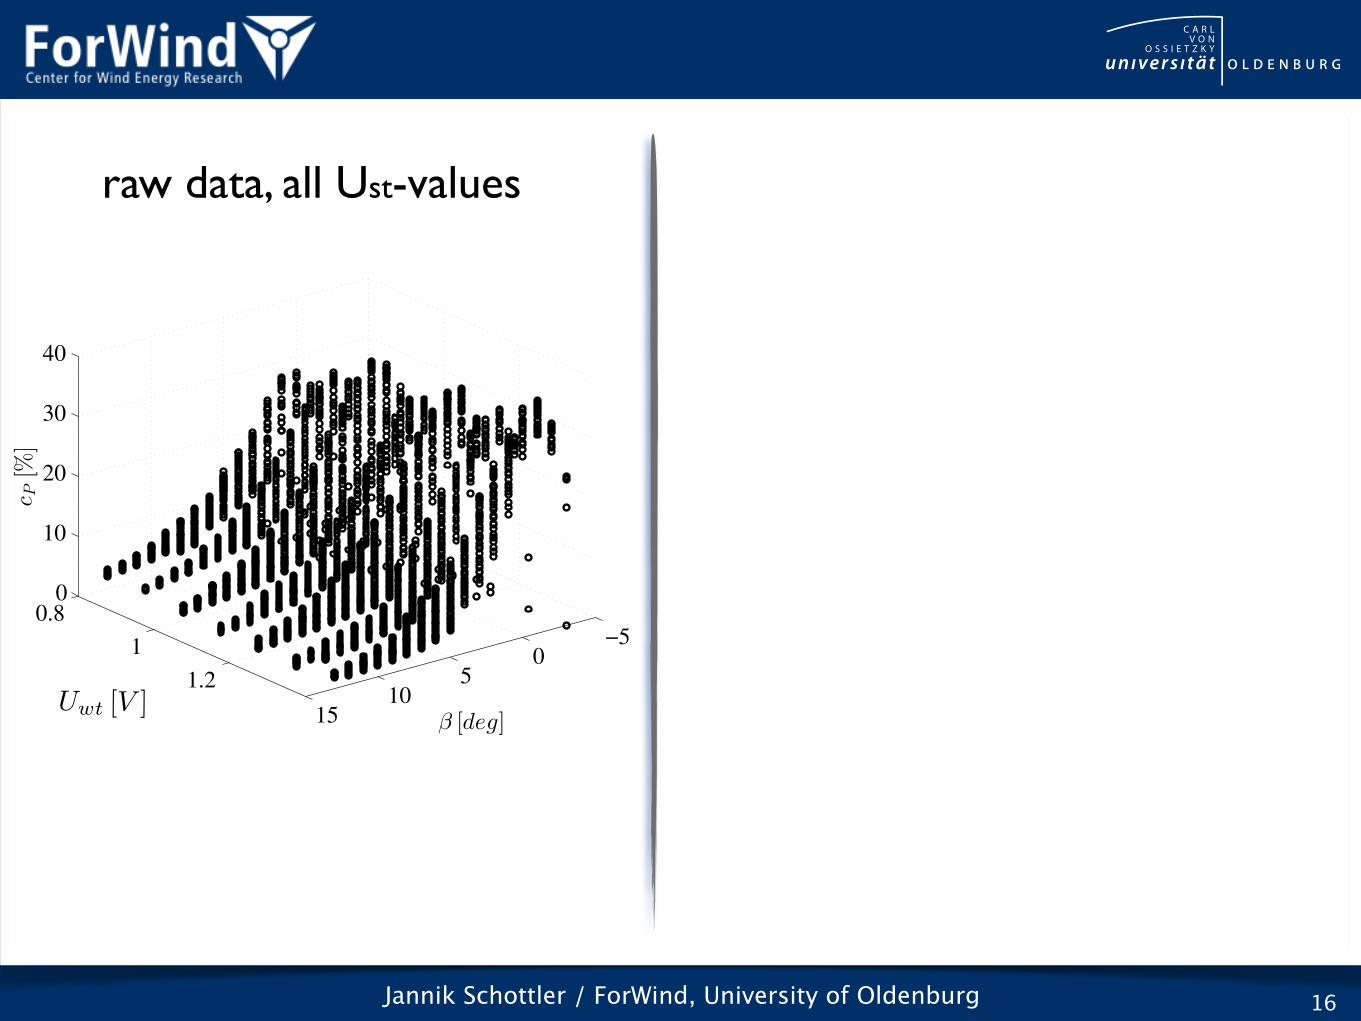
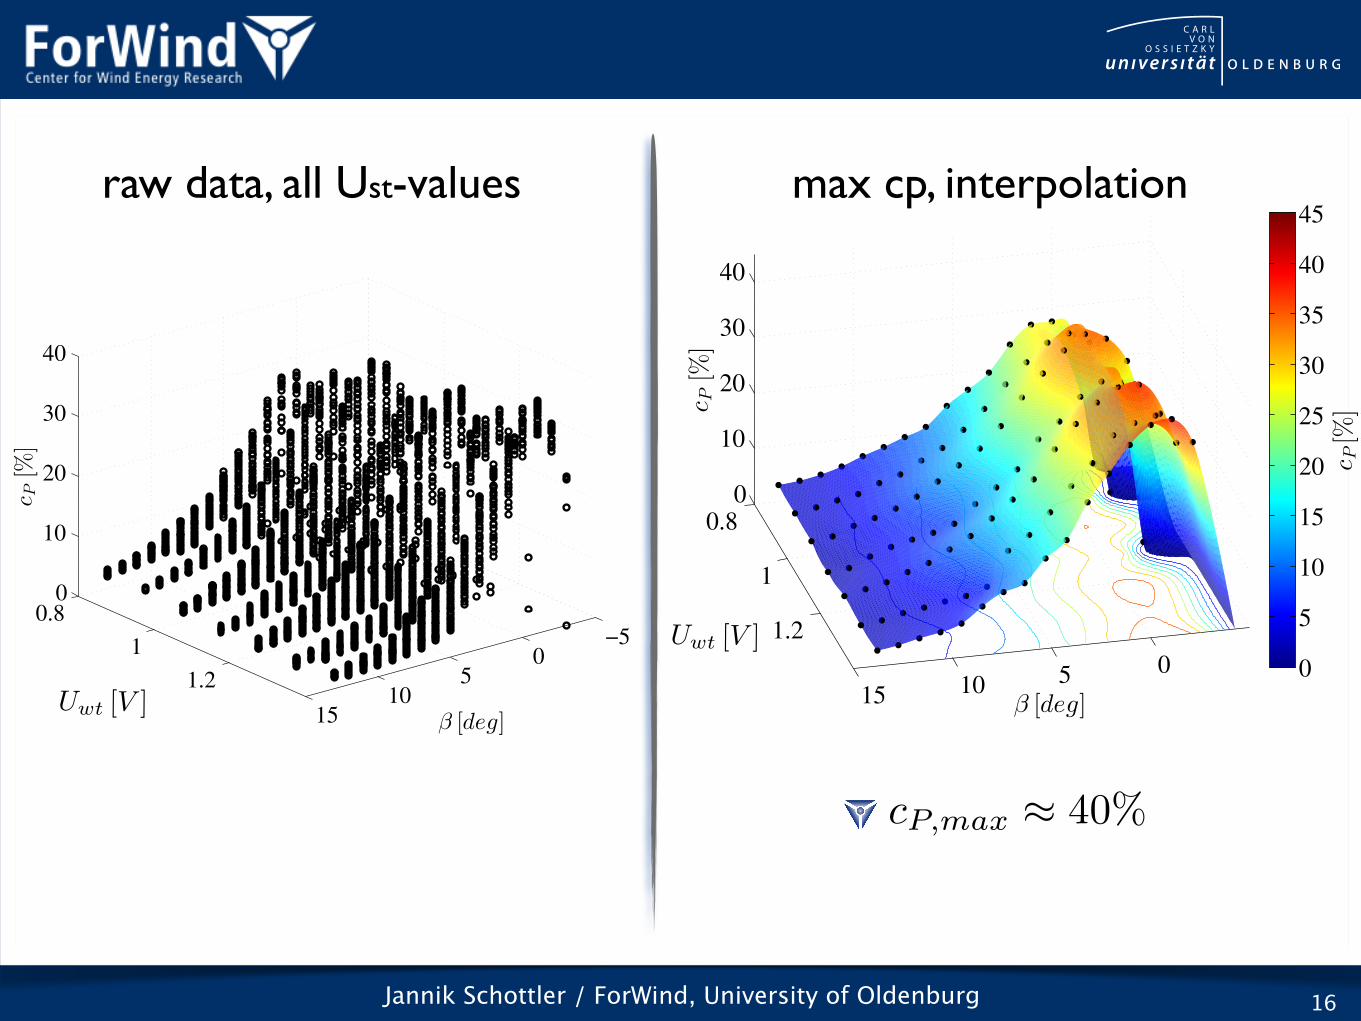
raw data, all Ust-values
−50
510
15
0.8
1
1.2
0
10
20
30
40
β [deg]Uwk [V ]
cP[%
]
Uwt [V ]
Jannik Schottler / ForWind, University of Oldenburg 16
cP,max
⇡ 40%
raw data, all Ust-values max cp, interpolation
−50
510
15
0.8
1
1.2
0
10
20
30
40
β [deg]Uwk [V ]
cP[%
]
Uwt [V ]
05
1015
0.8
1
1.2
0
10
20
30
40
β [deg]Uwk [V ]
cP[%
]
cP[%
]
0
5
10
15
20
25
30
35
40
45
Uwt [V ]
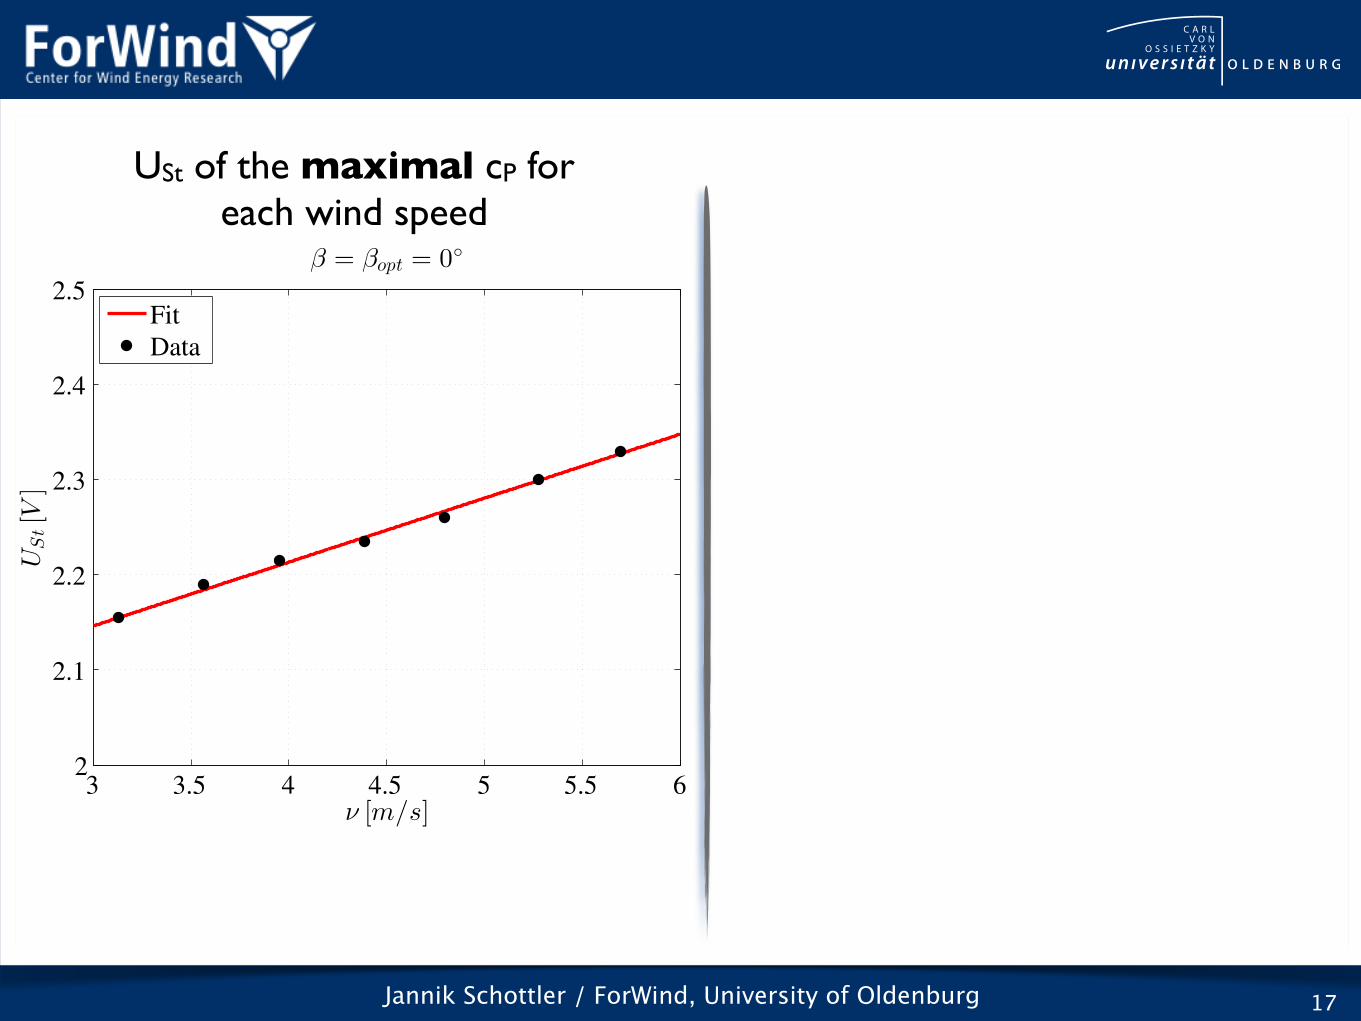
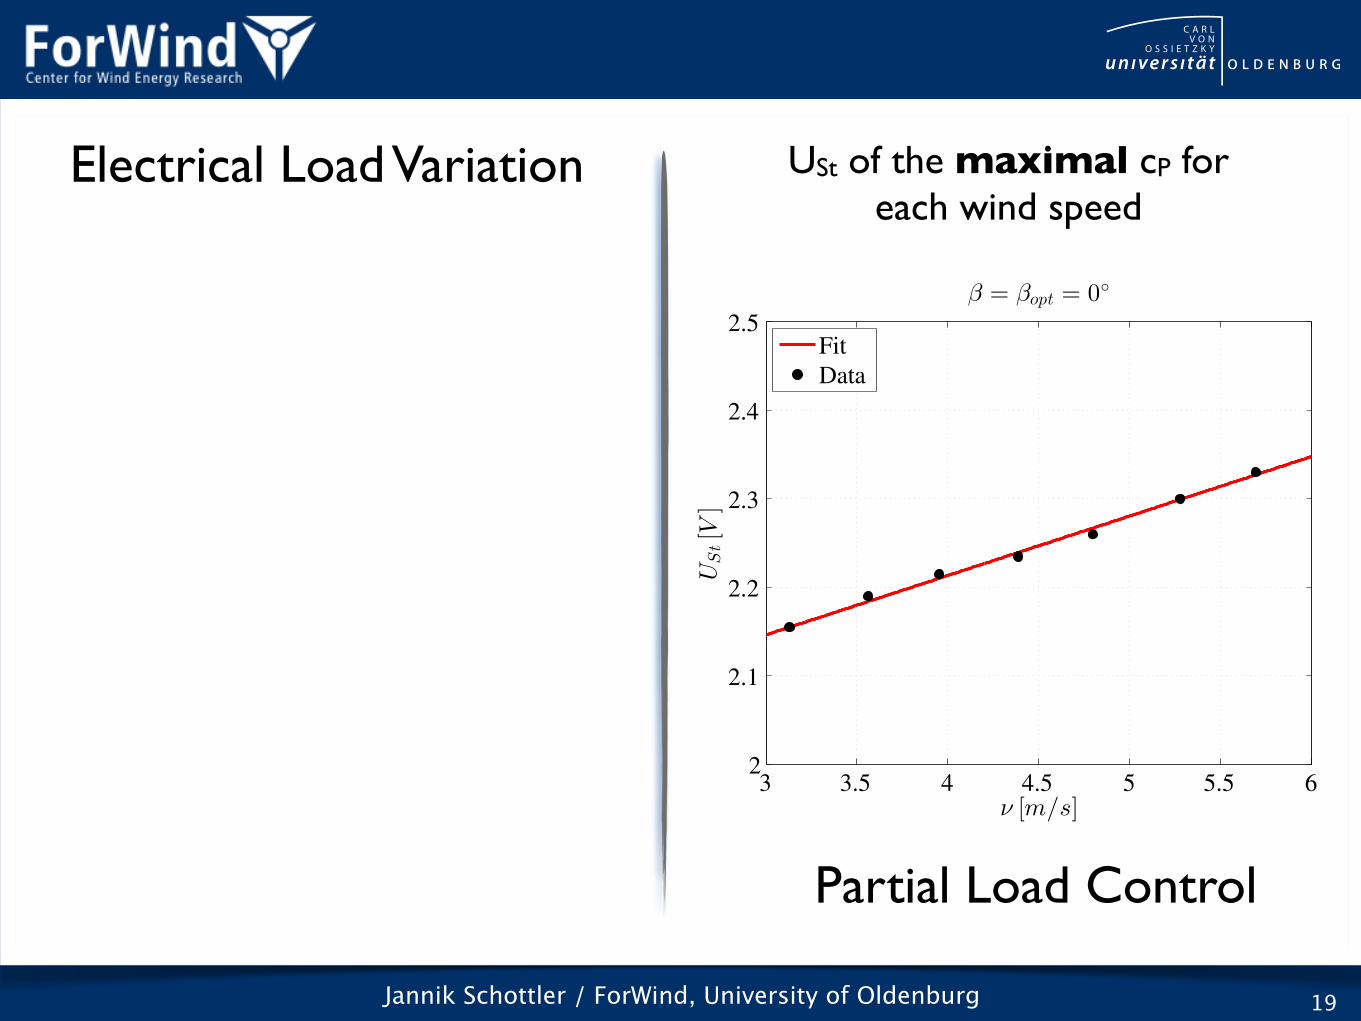
Jannik Schottler / ForWind, University of Oldenburg 17
USt of the maximal cP foreach wind speed
3 3.5 4 4.5 5 5.5 62
2.1
2.2
2.3
2.4
2.5
ν [m/s]
USt[V
]
β = βopt = 0◦
Fit
Data
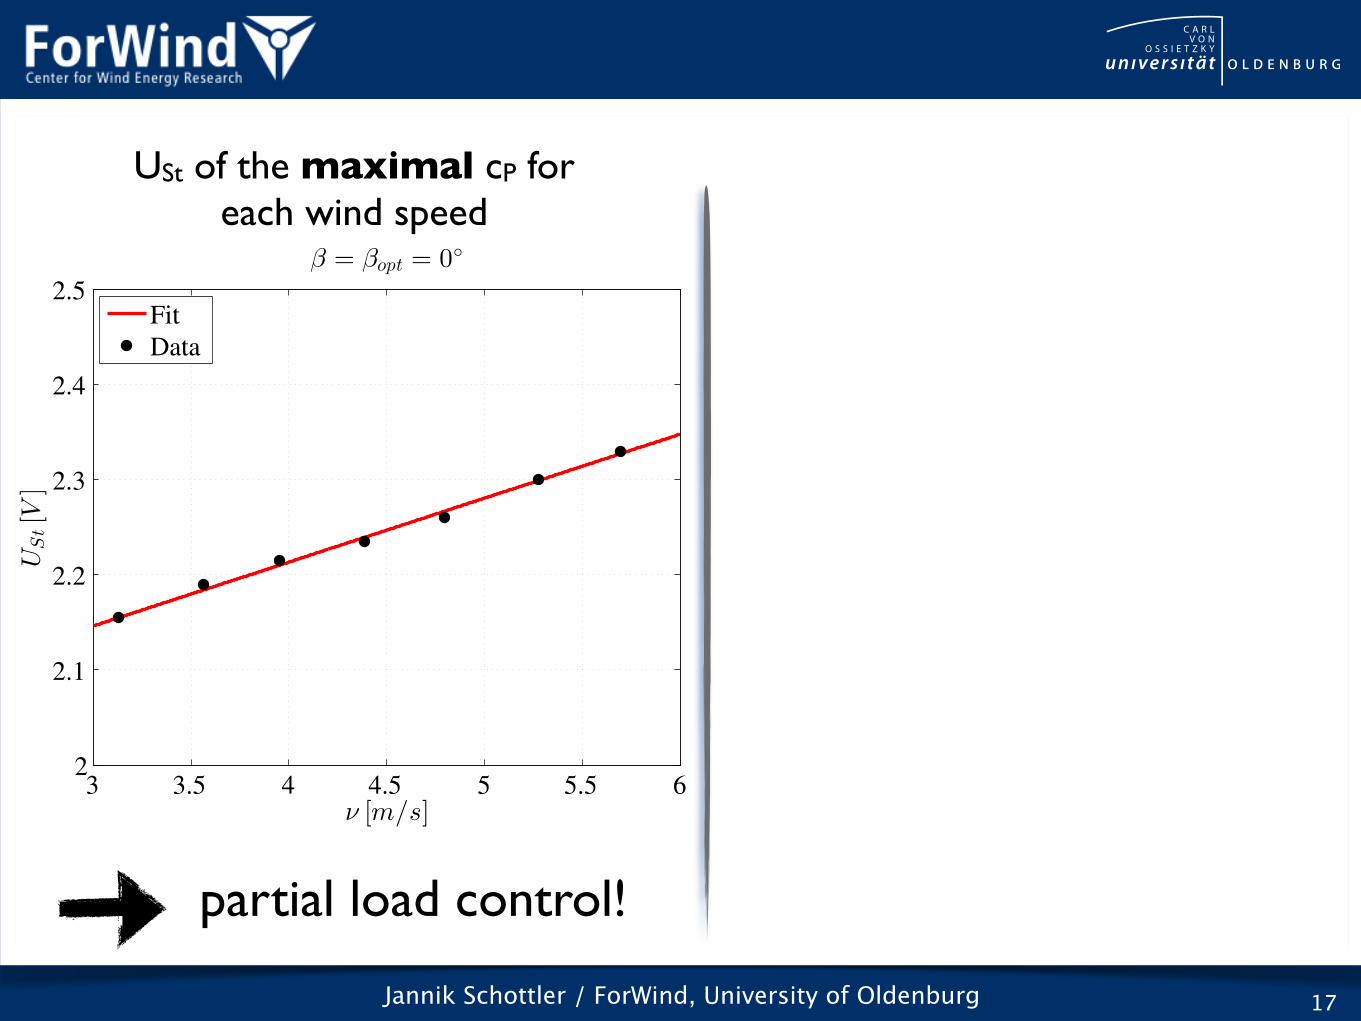
Jannik Schottler / ForWind, University of Oldenburg 17
USt of the maximal cP foreach wind speed
partial load control!
3 3.5 4 4.5 5 5.5 62
2.1
2.2
2.3
2.4
2.5
ν [m/s]
USt[V
]
β = βopt = 0◦
Fit
Data
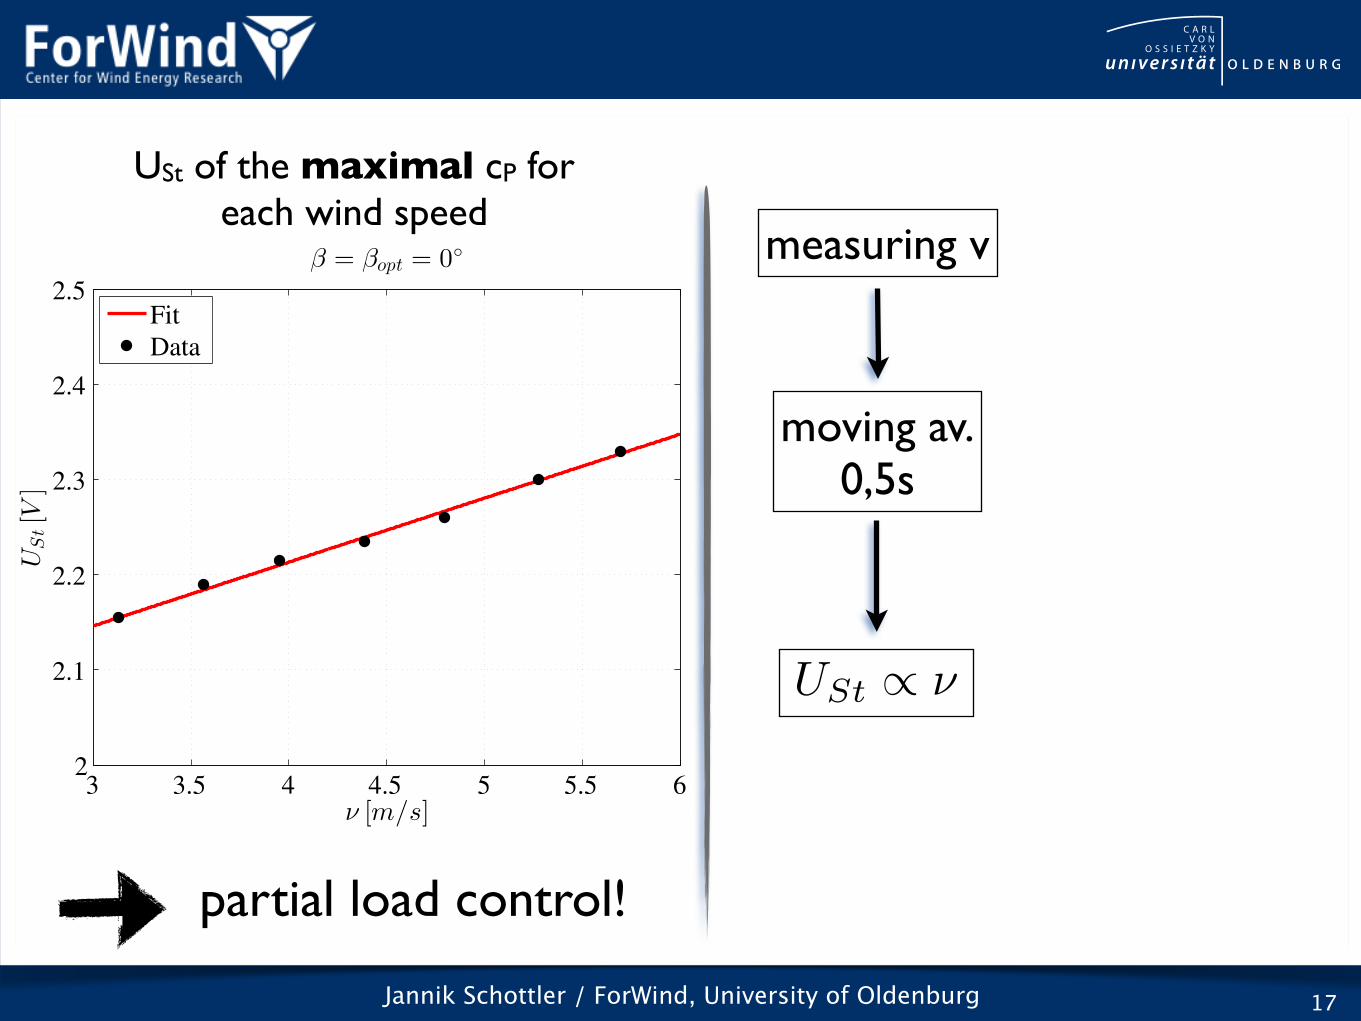
Jannik Schottler / ForWind, University of Oldenburg 17
USt of the maximal cP foreach wind speed
partial load control!
measuring v
moving av.0,5s
USt / ⌫
3 3.5 4 4.5 5 5.5 62
2.1
2.2
2.3
2.4
2.5
ν [m/s]
USt[V
]
β = βopt = 0◦
Fit
Data
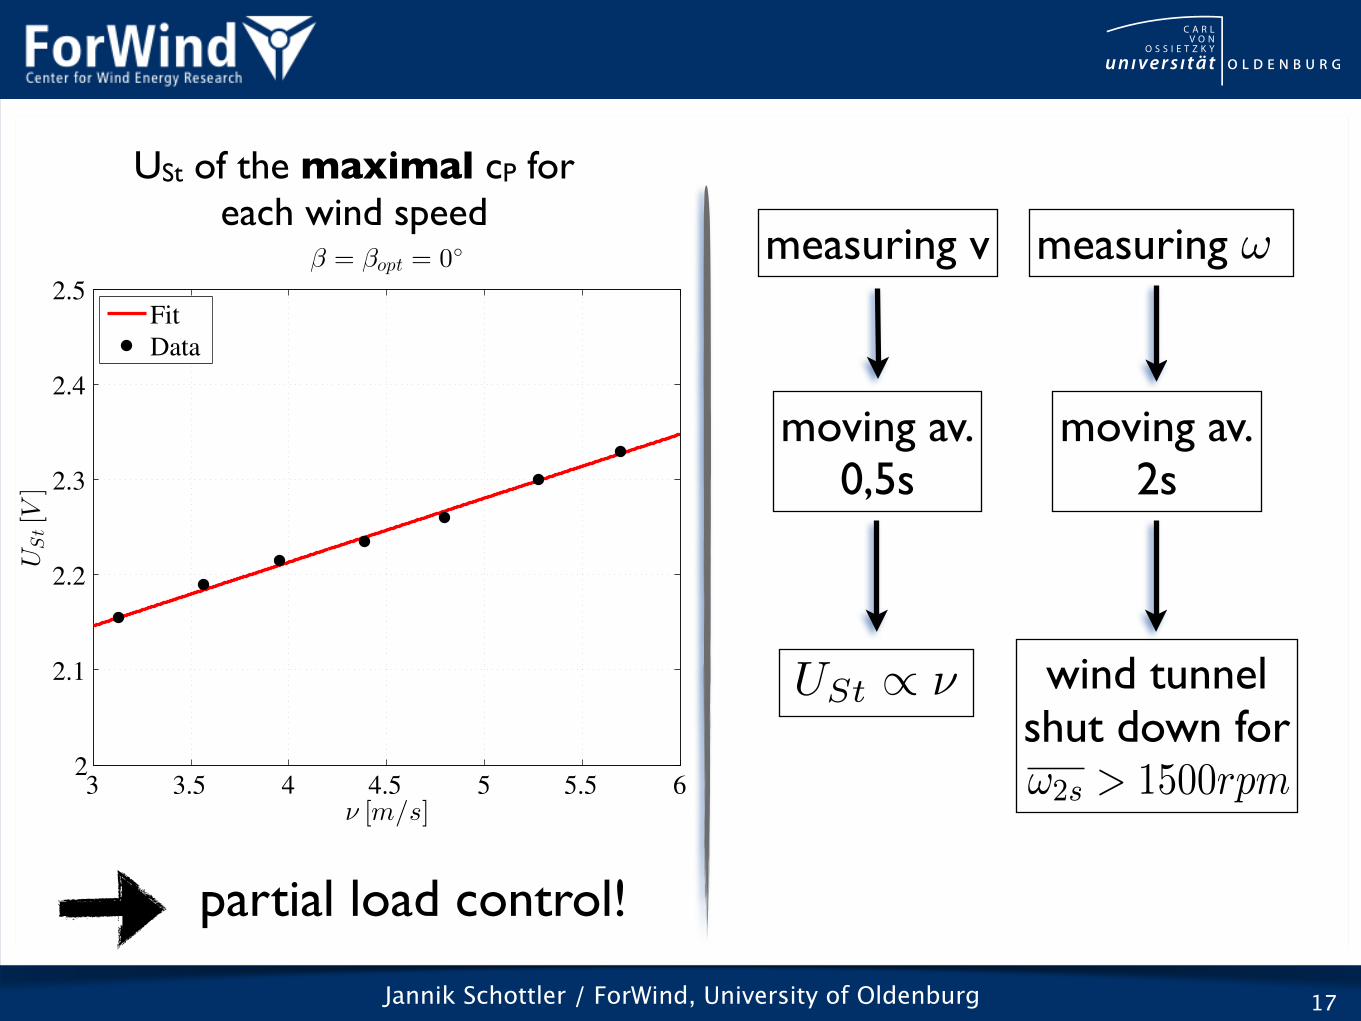
Jannik Schottler / ForWind, University of Oldenburg 17
USt of the maximal cP foreach wind speed
partial load control!
measuring v
moving av.0,5s
USt / ⌫
3 3.5 4 4.5 5 5.5 62
2.1
2.2
2.3
2.4
2.5
ν [m/s]
USt[V
]
β = βopt = 0◦
Fit
Data
moving av.2s
wind tunnelshut down for!2s > 1500rpm
measuring !
Jannik Schottler / ForWind, University of Oldenburg 18
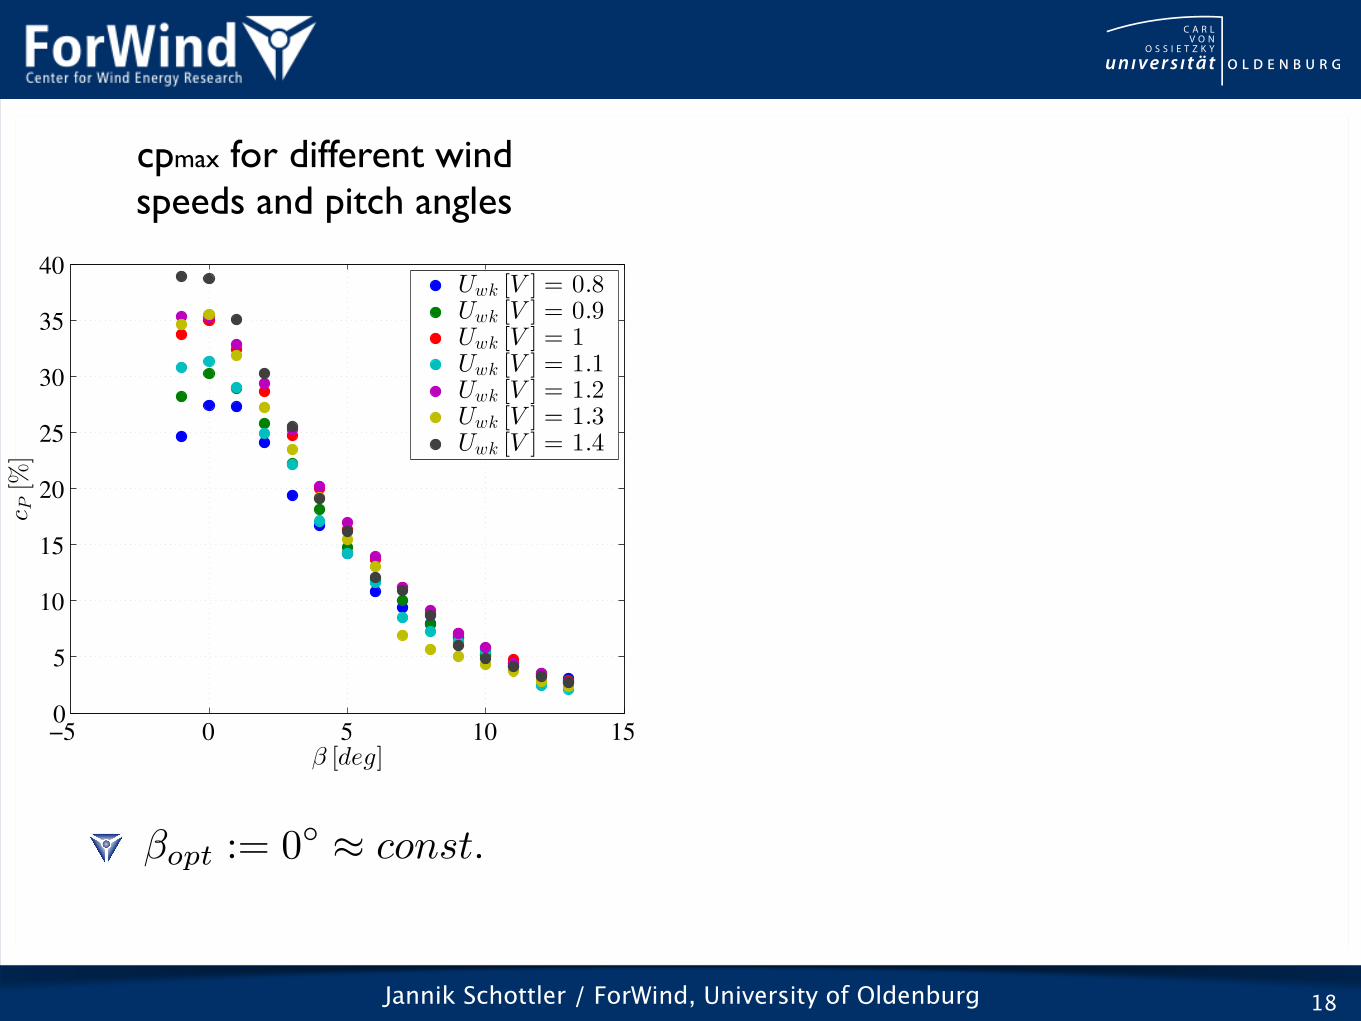
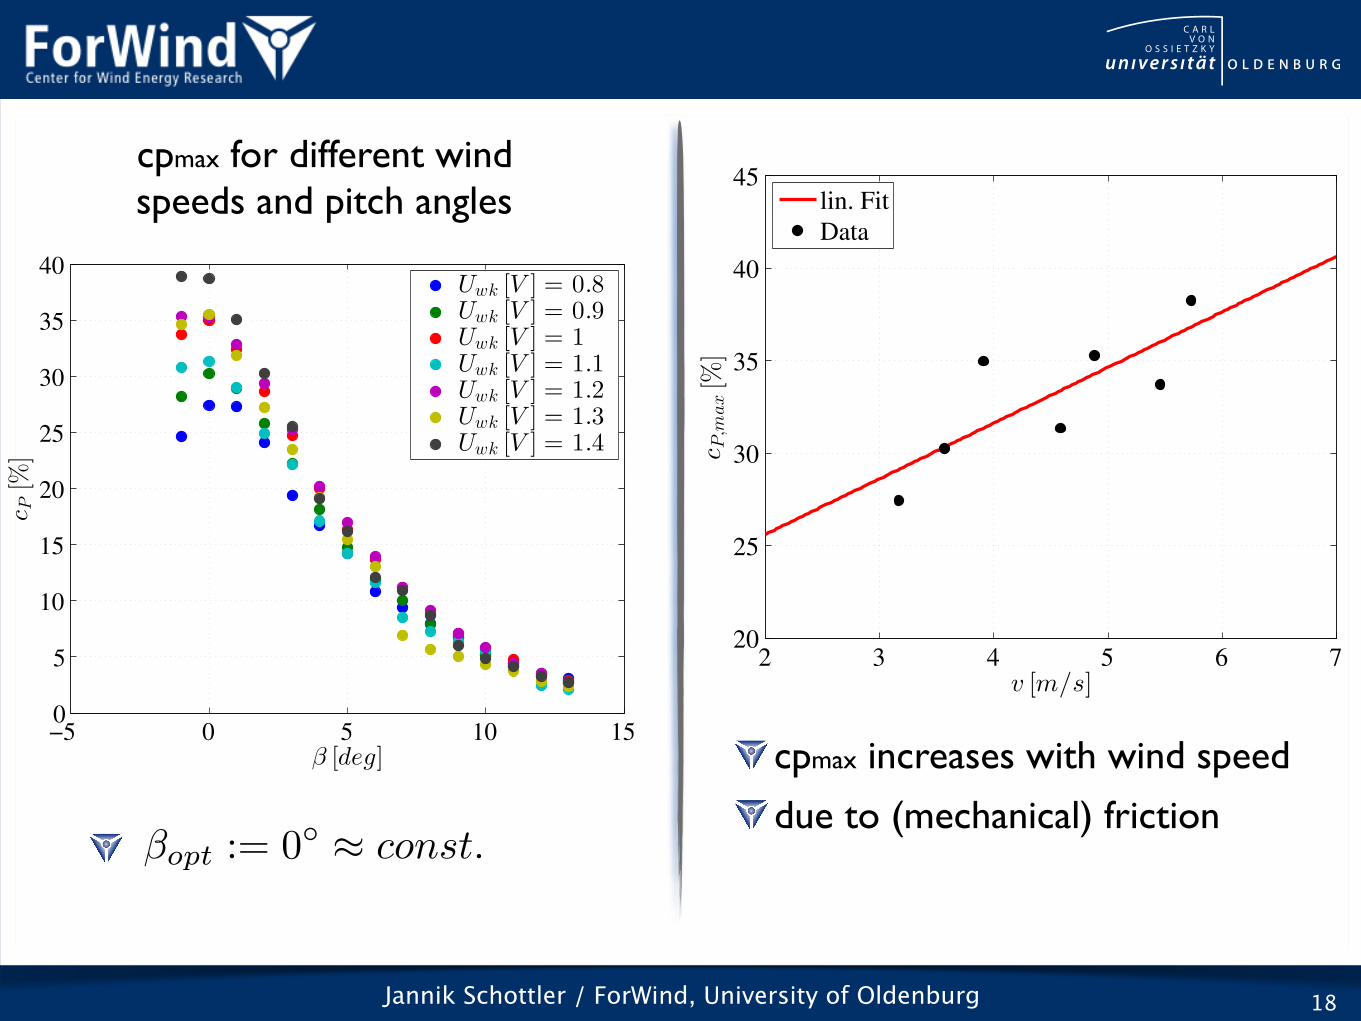
�
opt
:= 0� ⇡ const.
cpmax for different wind speeds and pitch angles
−5 0 5 10 150
5
10
15
20
25
30
35
40
β [deg]
cP[%
]
Uwk [V ] = 0.8Uwk [V ] = 0.9Uwk [V ] = 1Uwk [V ] = 1.1Uwk [V ] = 1.2Uwk [V ] = 1.3Uwk [V ] = 1.4
Jannik Schottler / ForWind, University of Oldenburg 18
�
opt
:= 0� ⇡ const.
cpmax for different wind speeds and pitch angles
−5 0 5 10 150
5
10
15
20
25
30
35
40
β [deg]
cP[%
]
Uwk [V ] = 0.8Uwk [V ] = 0.9Uwk [V ] = 1Uwk [V ] = 1.1Uwk [V ] = 1.2Uwk [V ] = 1.3Uwk [V ] = 1.4
cpmax increases with wind speed
due to (mechanical) friction
2 3 4 5 6 720
25
30
35
40
45
cP,m
ax[%
]v [m/s]
lin. Fit
Data
Jannik Schottler / ForWind, University of Oldenburg 19
Electrical Load Variation
Partial Load Control
3 3.5 4 4.5 5 5.5 62
2.1
2.2
2.3
2.4
2.5
ν [m/s]
USt[V
]
β = βopt = 0◦
Fit
Data
USt of the maximal cP foreach wind speed
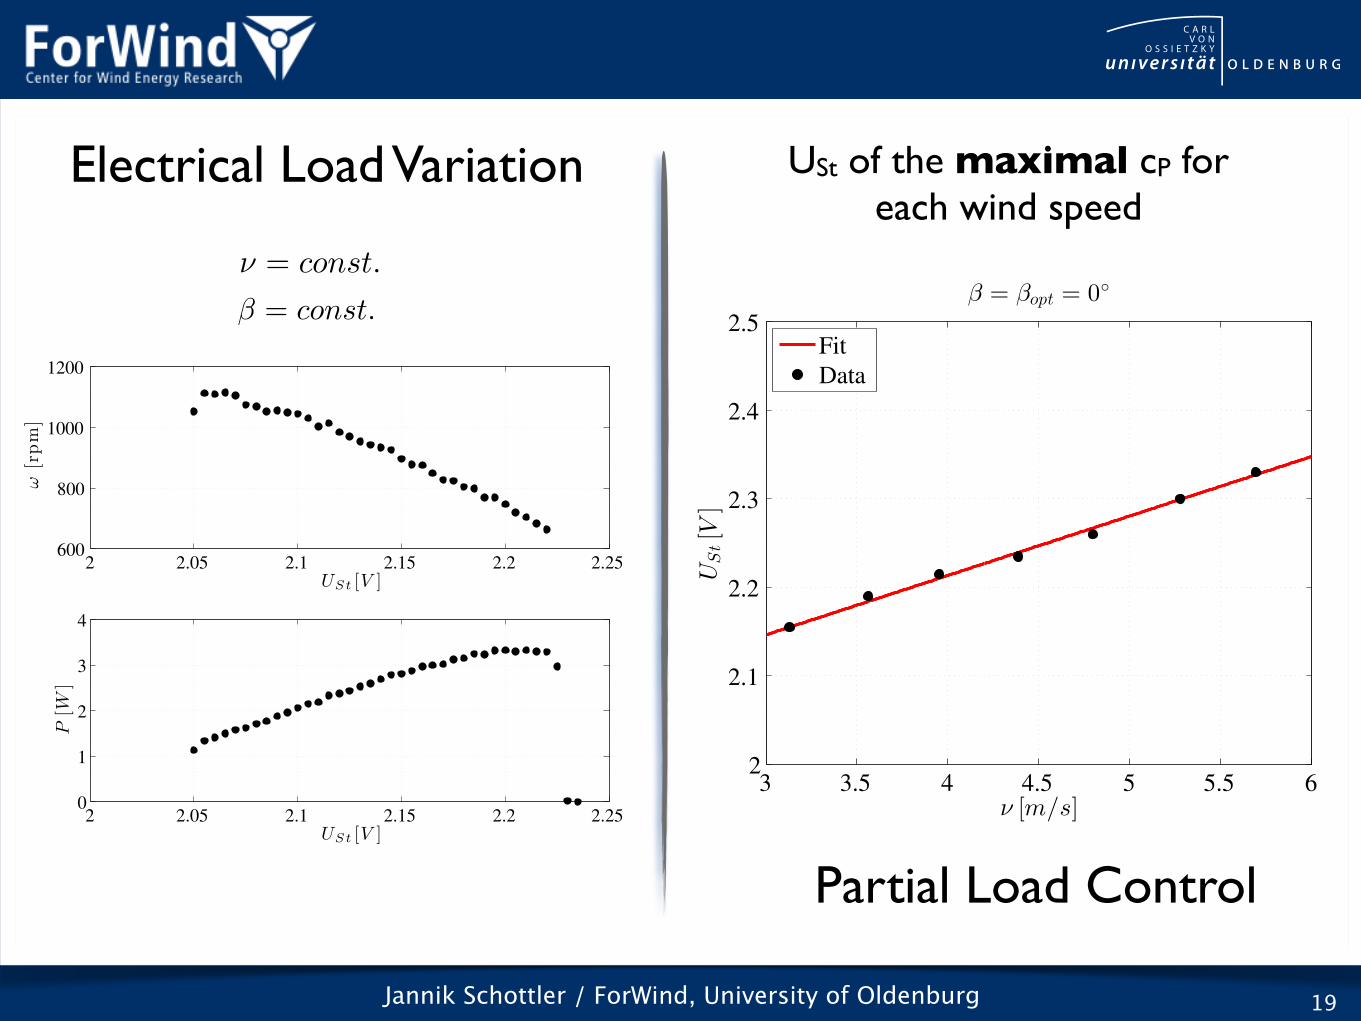
Jannik Schottler / ForWind, University of Oldenburg 19
⌫ = const.
� = const.
2 2.05 2.1 2.15 2.2 2.25600
800
1000
1200
USt [V ]
ω[r
pm
]
2 2.05 2.1 2.15 2.2 2.250
1
2
3
4
USt [V ]
P[W
]
Electrical Load Variation
Partial Load Control
3 3.5 4 4.5 5 5.5 62
2.1
2.2
2.3
2.4
2.5
ν [m/s]
USt[V
]
β = βopt = 0◦
Fit
Data
USt of the maximal cP foreach wind speed
Jannik Schottler / ForWind, University of Oldenburg 20
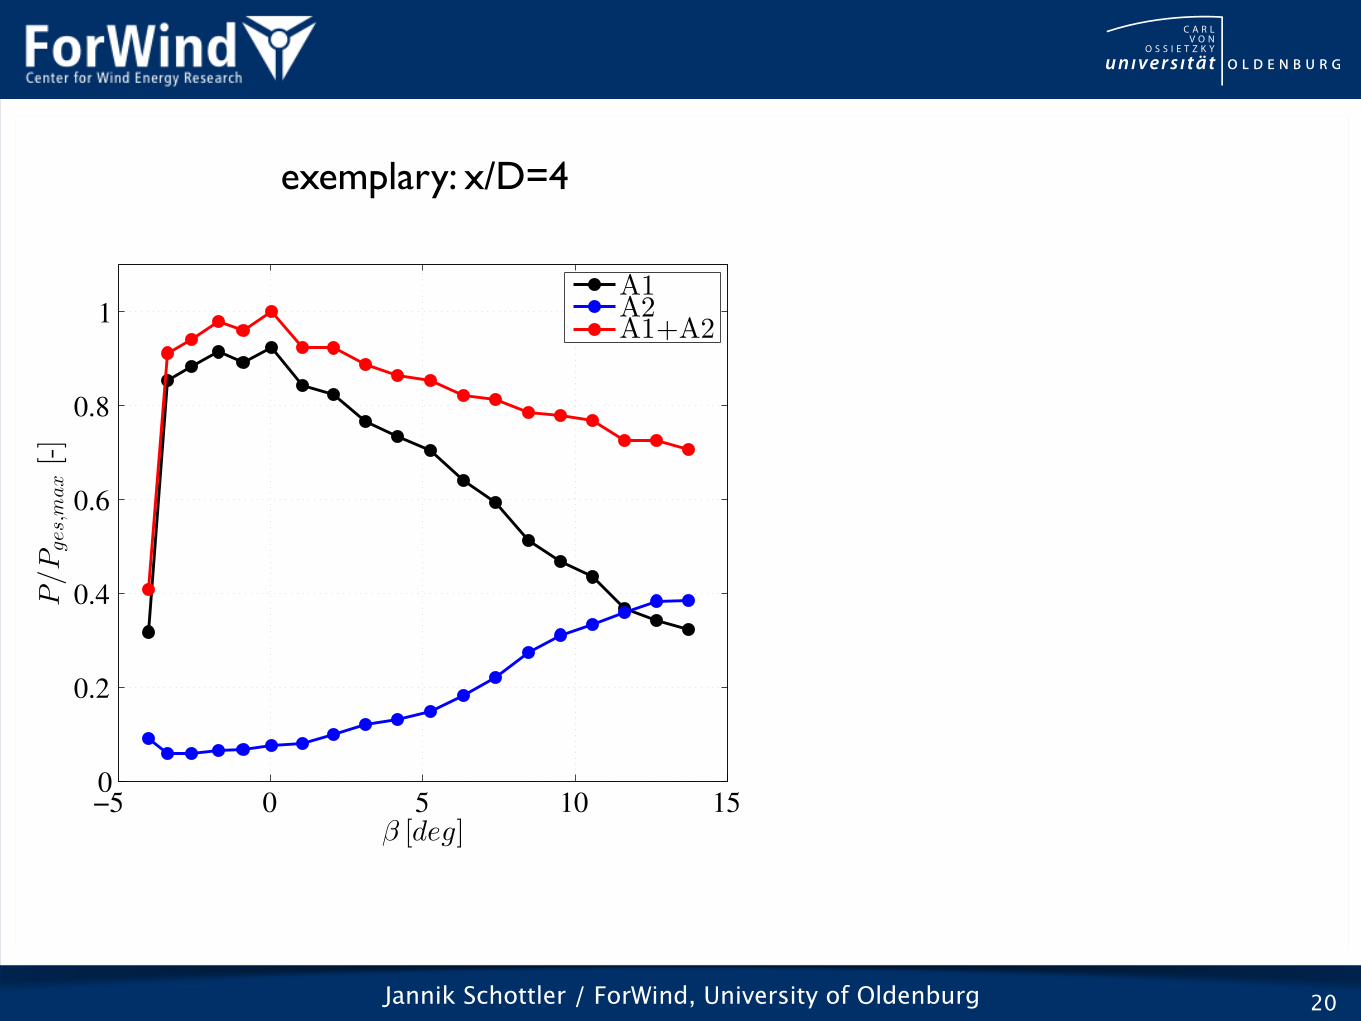
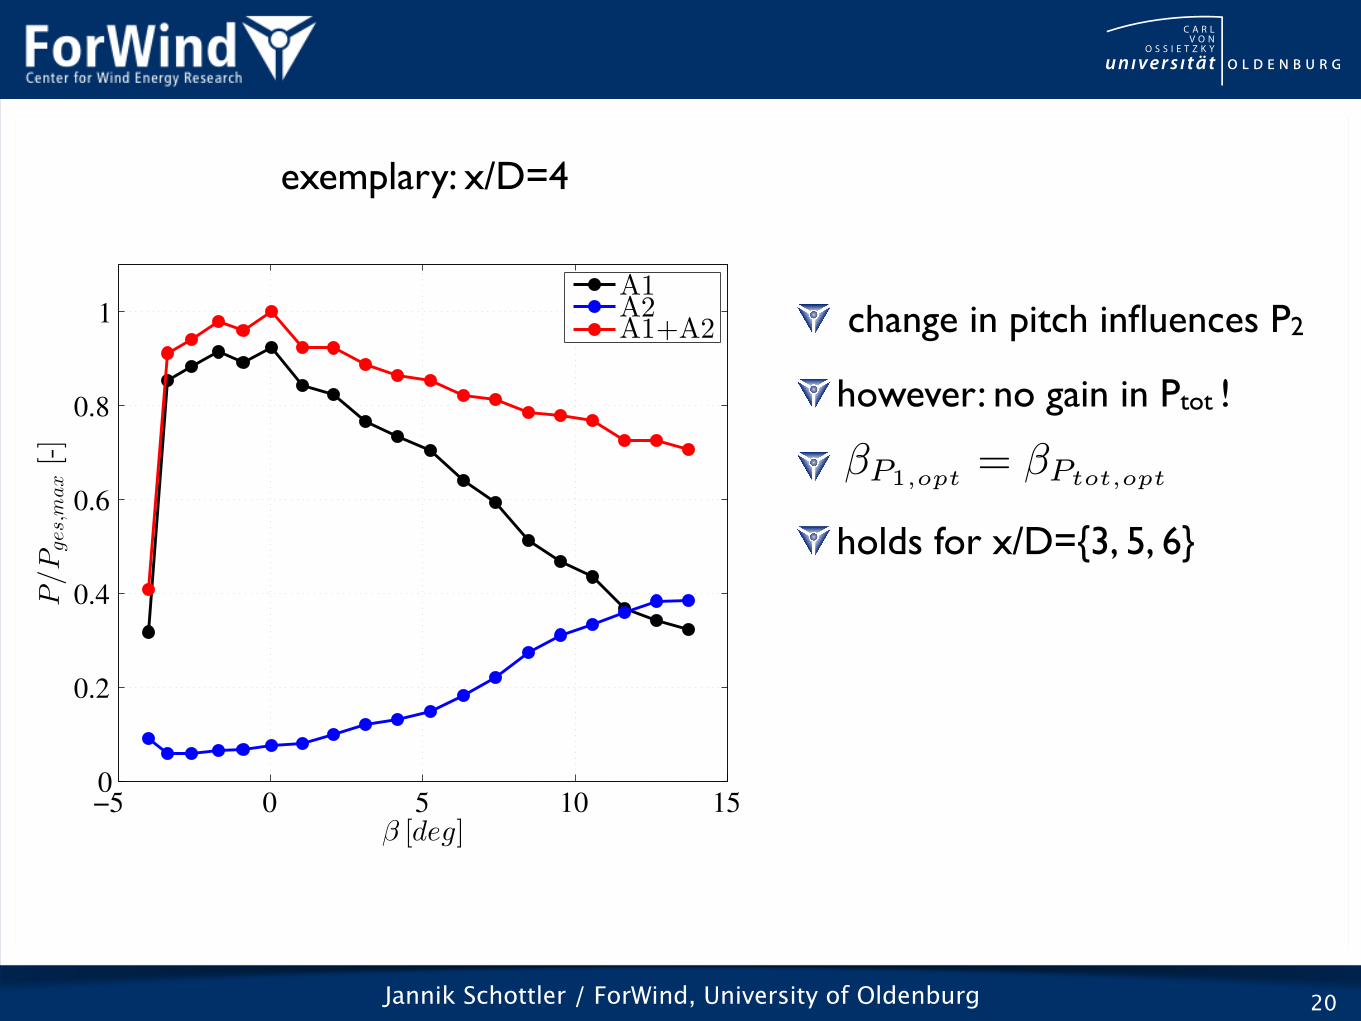
exemplary: x/D=4
−5 0 5 10 150
0.2
0.4
0.6
0.8
1
β [deg]
P/Pges,m
ax[-]
A1A2A1+A2
Jannik Schottler / ForWind, University of Oldenburg 20
change in pitch influences P2
however: no gain in Ptot !
holds for x/D={3, 5, 6}
exemplary: x/D=4
�P1,opt = �Ptot,opt
−5 0 5 10 150
0.2
0.4
0.6
0.8
1
β [deg]
P/Pges,m
ax[-]
A1A2A1+A2
Jannik Schottler / ForWind, University of Oldenburg 21
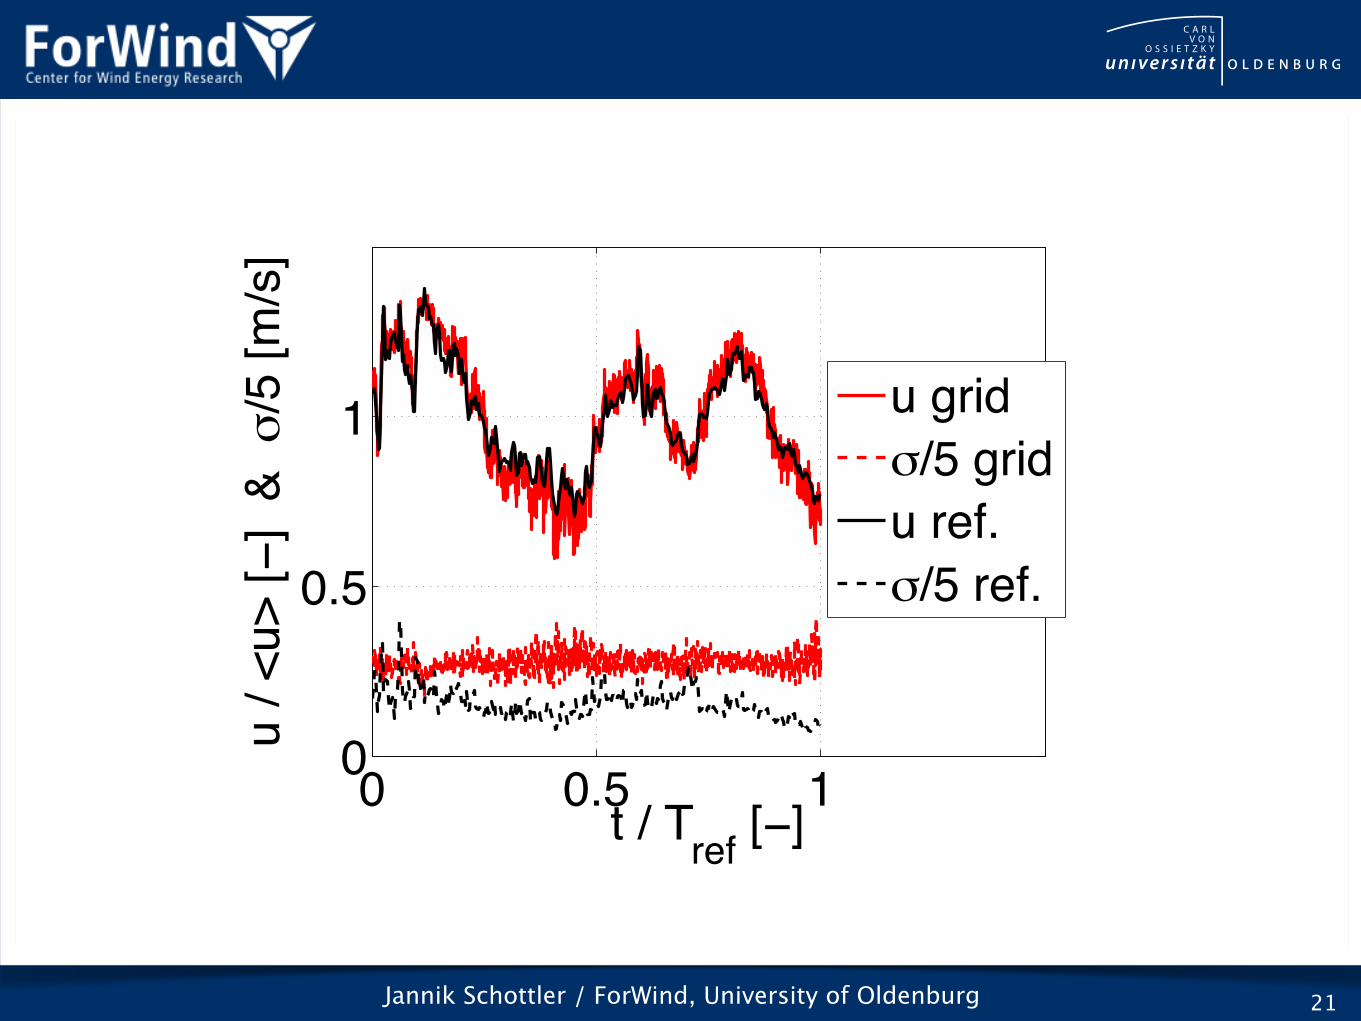
0 0.5 10
0.5
1
t / Tref [−]
u / <
u> [−
] &
σ/5
[m/s
]
u gridσ/5 gridu ref.σ/5 ref.
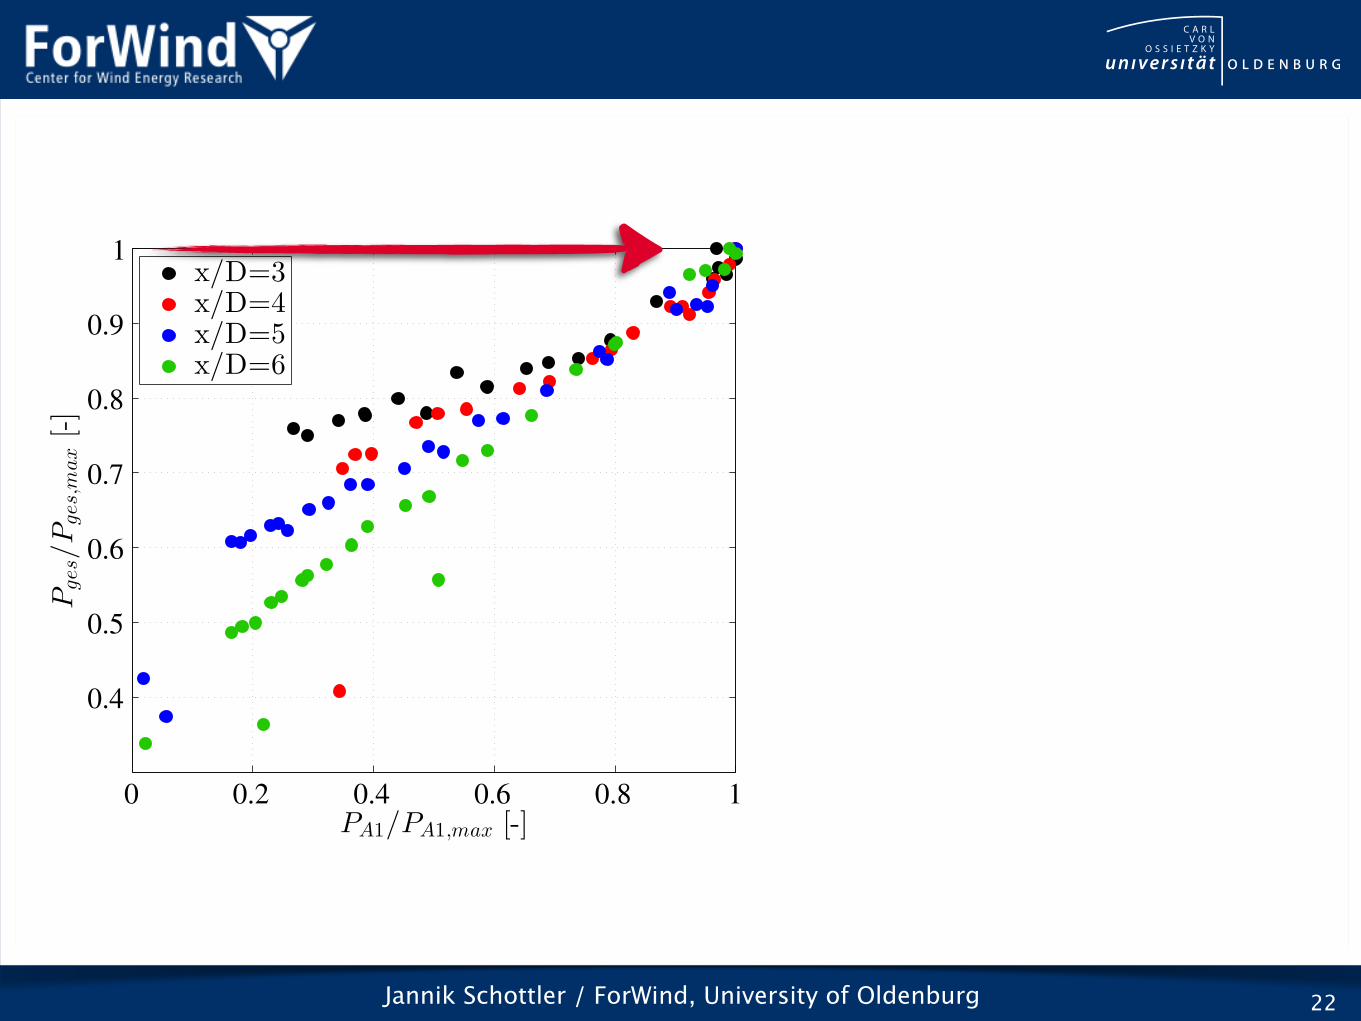
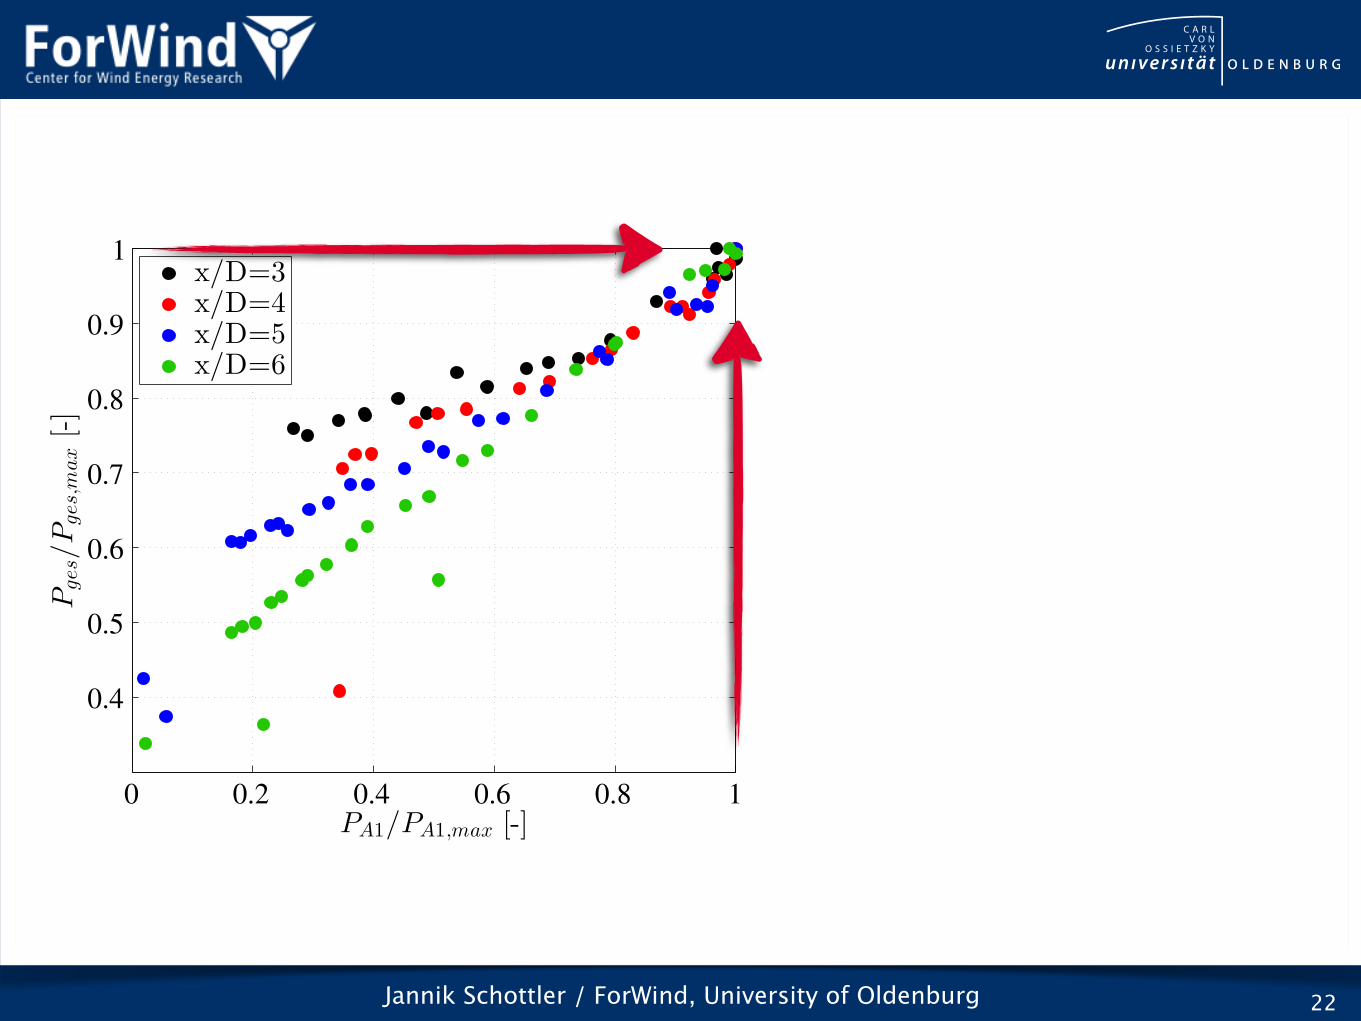
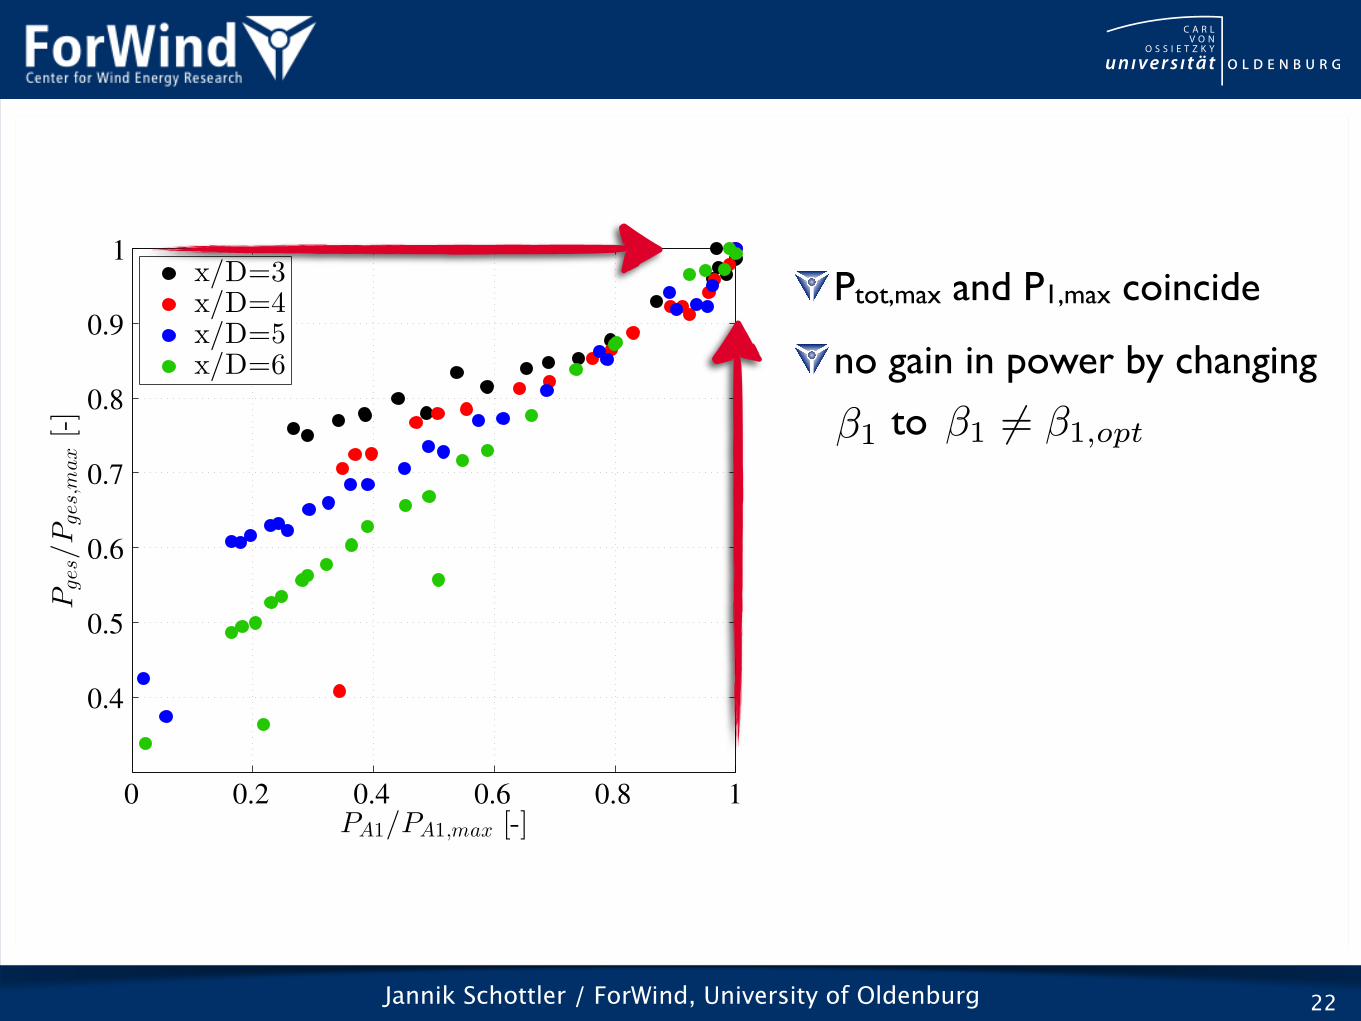
Jannik Schottler / ForWind, University of Oldenburg 22
0 0.2 0.4 0.6 0.8 1
0.4
0.5
0.6
0.7
0.8
0.9
1
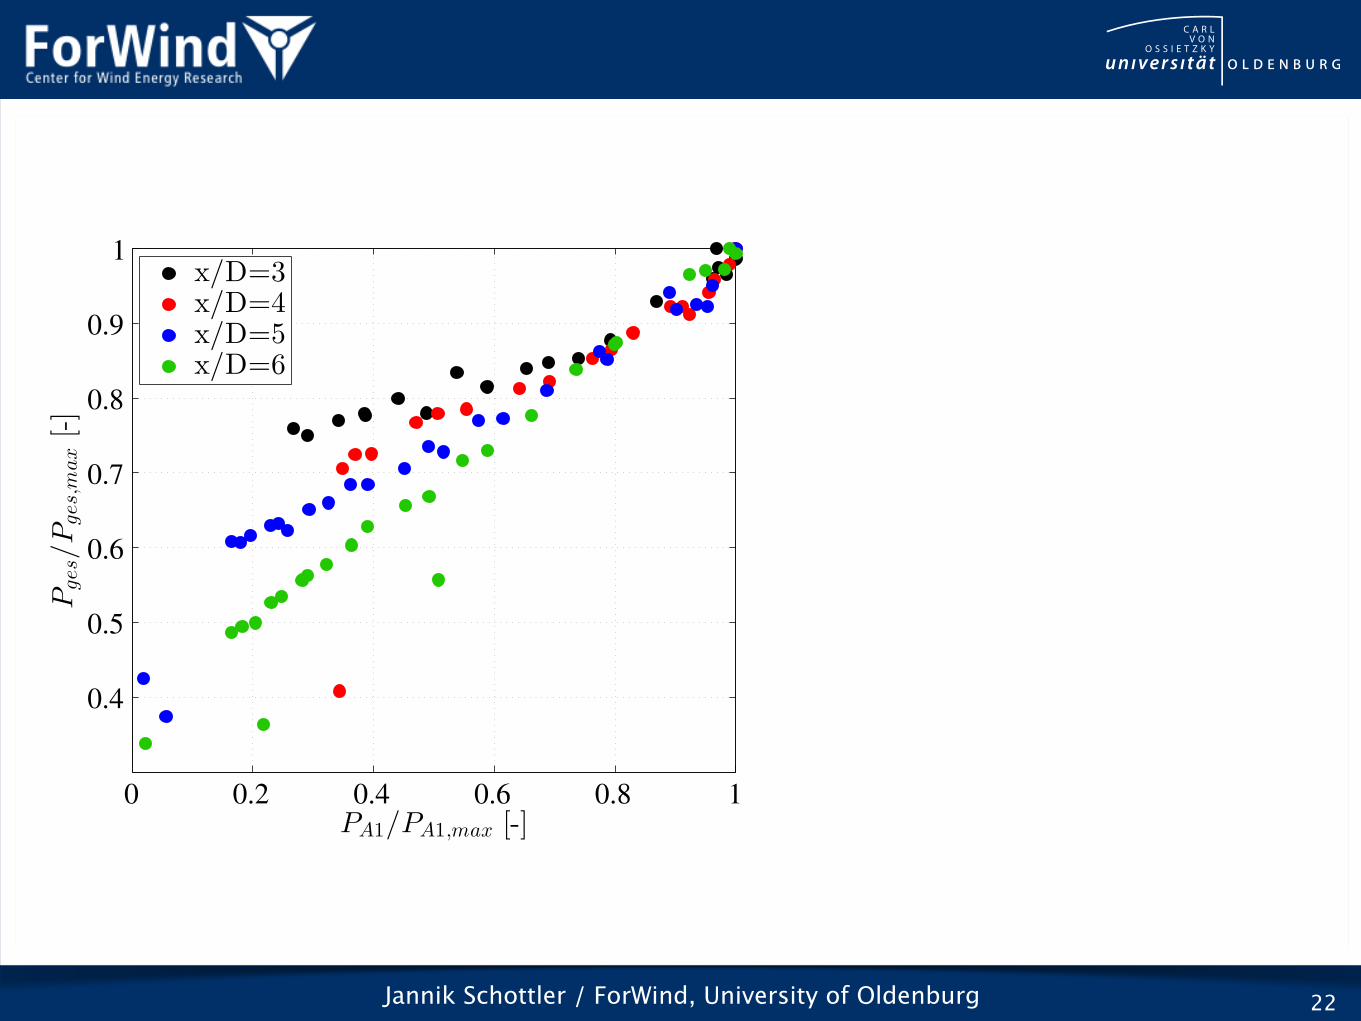
PA1/PA1,max [-]
Pges/Pges,m
ax[-]
x/D=3x/D=4x/D=5x/D=6
Jannik Schottler / ForWind, University of Oldenburg 22
0 0.2 0.4 0.6 0.8 1
0.4
0.5
0.6
0.7
0.8
0.9
1
PA1/PA1,max [-]
Pges/Pges,m
ax[-]
x/D=3x/D=4x/D=5x/D=6
Jannik Schottler / ForWind, University of Oldenburg 22
0 0.2 0.4 0.6 0.8 1
0.4
0.5
0.6
0.7
0.8
0.9
1
PA1/PA1,max [-]
Pges/Pges,m
ax[-]
x/D=3x/D=4x/D=5x/D=6
Jannik Schottler / ForWind, University of Oldenburg 22
0 0.2 0.4 0.6 0.8 1
0.4
0.5
0.6
0.7
0.8
0.9
1
PA1/PA1,max [-]
Pges/Pges,m
ax[-]
x/D=3x/D=4x/D=5x/D=6
Ptot,max and P1,max coincide
no gain in power by changing
to �1 �1 6= �1,opt
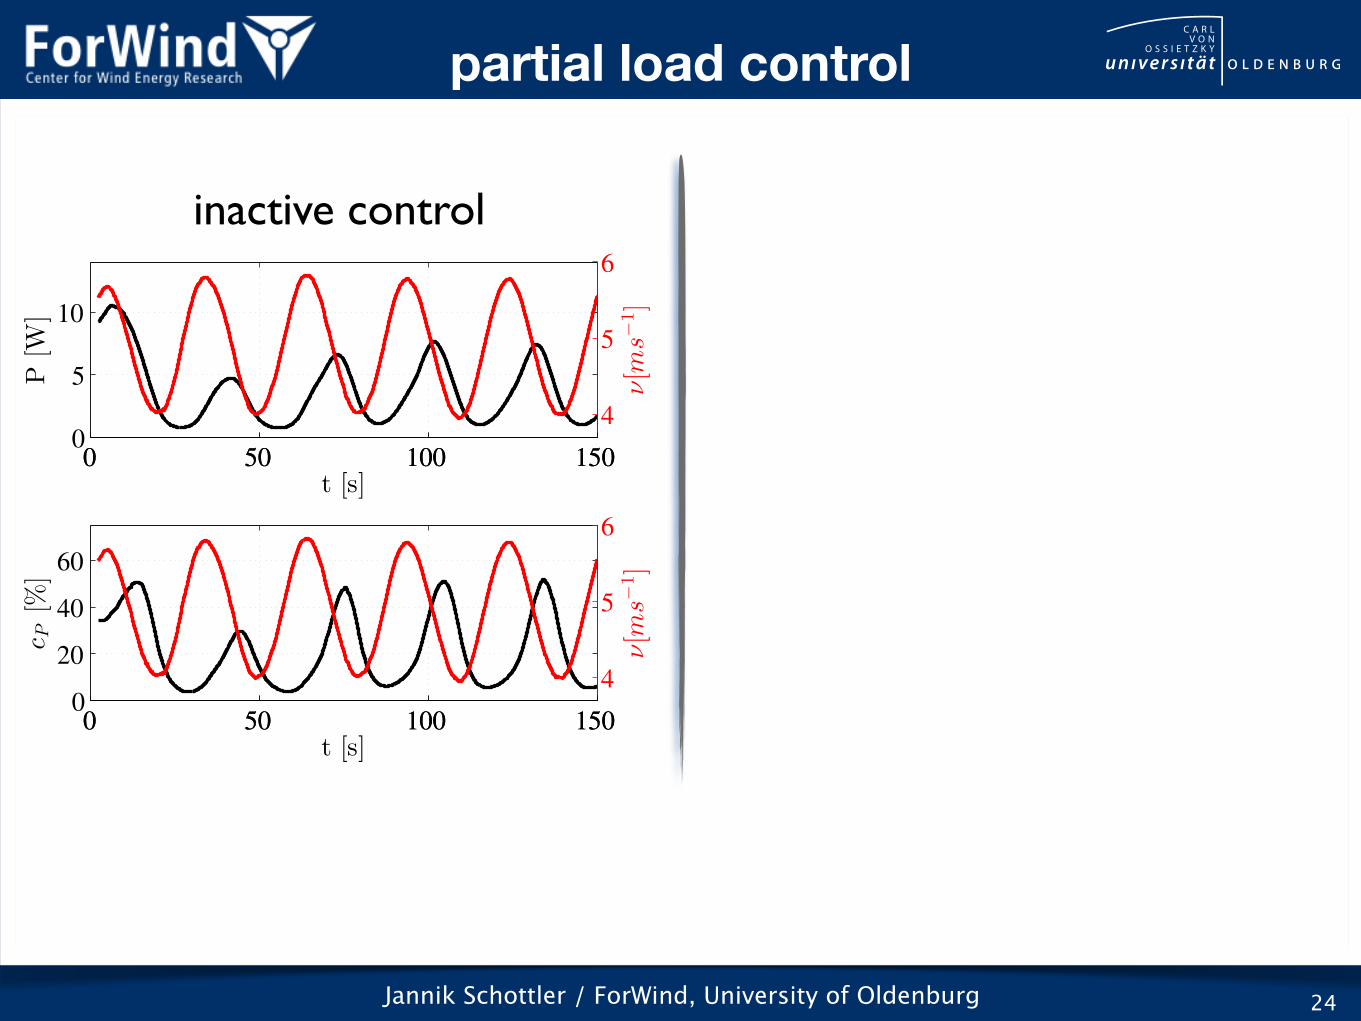
Jannik Schottler / ForWind, University of Oldenburg 23
partial load control
0 50 100 1500
5
10
P[W
]
t [s]0 50 100 150
4
5
6
ν[m
s−1]
0 50 100 1500
20
40
60
cP[%
]
t [s]0 50 100 150
4
5
6
ν[m
s−1]
inactive control
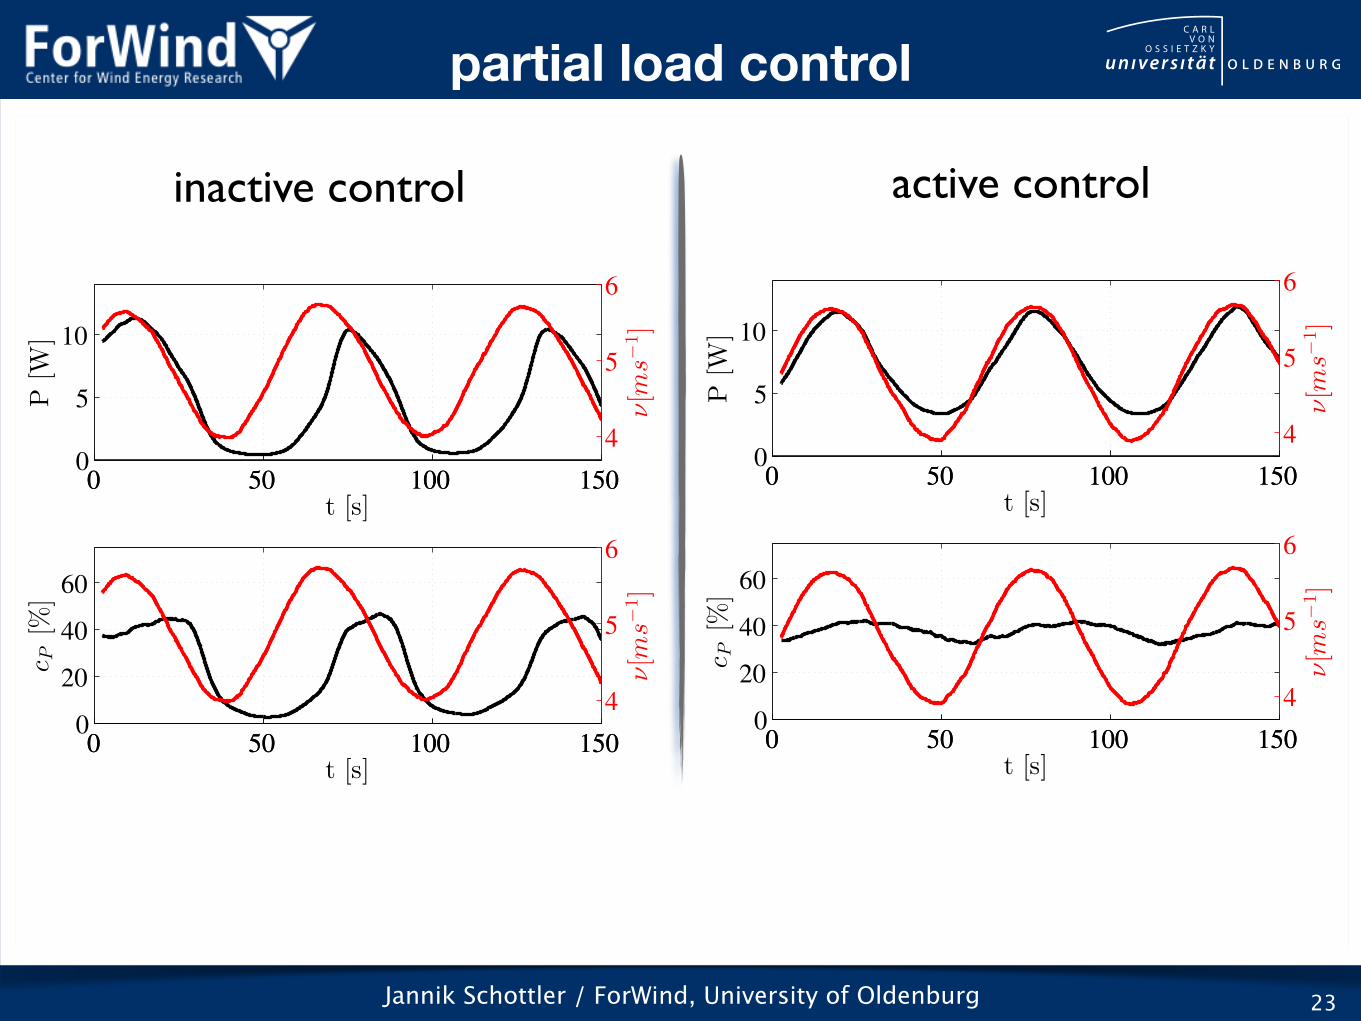
Jannik Schottler / ForWind, University of Oldenburg 23
partial load control
0 50 100 1500
5
10
P[W
]
t [s]0 50 100 150
4
5
6
ν[m
s−1]
0 50 100 1500
20
40
60
cP[%
]
t [s]0 50 100 150
4
5
6
ν[m
s−1]
inactive control
0 50 100 1500
5
10
P[W
]
t [s]0 50 100 150
4
5
6
ν[m
s−1]
0 50 100 1500
20
40
60
cP[%
]
t [s]0 50 100 150
4
5
6
ν[m
s−1]
active control
Jannik Schottler / ForWind, University of Oldenburg 24
partial load control
inactive control
0 50 100 1500
5
10
P[W
]
t [s]0 50 100 150
4
5
6
ν[m
s−1]
0 50 100 1500
20
40
60
cP[%
]
t [s]0 50 100 150
4
5
6
ν[m
s−1]
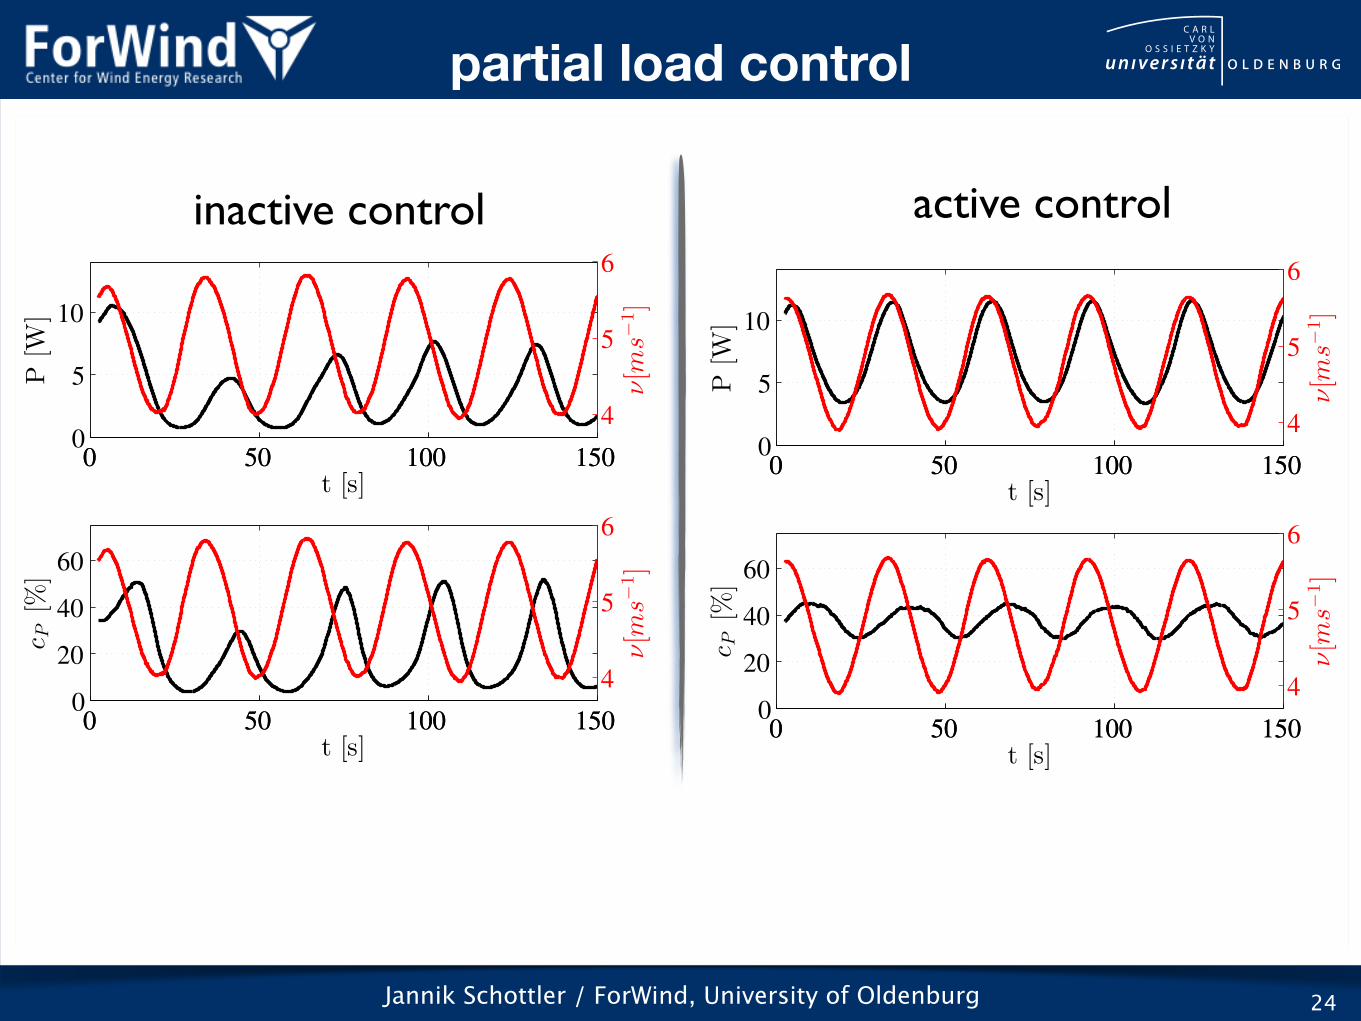
Jannik Schottler / ForWind, University of Oldenburg 24
partial load control
inactive control
0 50 100 1500
5
10
P[W
]
t [s]0 50 100 150
4
5
6
ν[m
s−1]
0 50 100 1500
20
40
60
cP[%
]
t [s]0 50 100 150
4
5
6
ν[m
s−1]
active control
0 50 100 1500
5
10
P[W
]
t [s]0 50 100 150
4
5
6
ν[m
s−1]
0 50 100 1500
20
40
60
cP[%
]t [s]
0 50 100 150
4
5
6
ν[m
s−1]
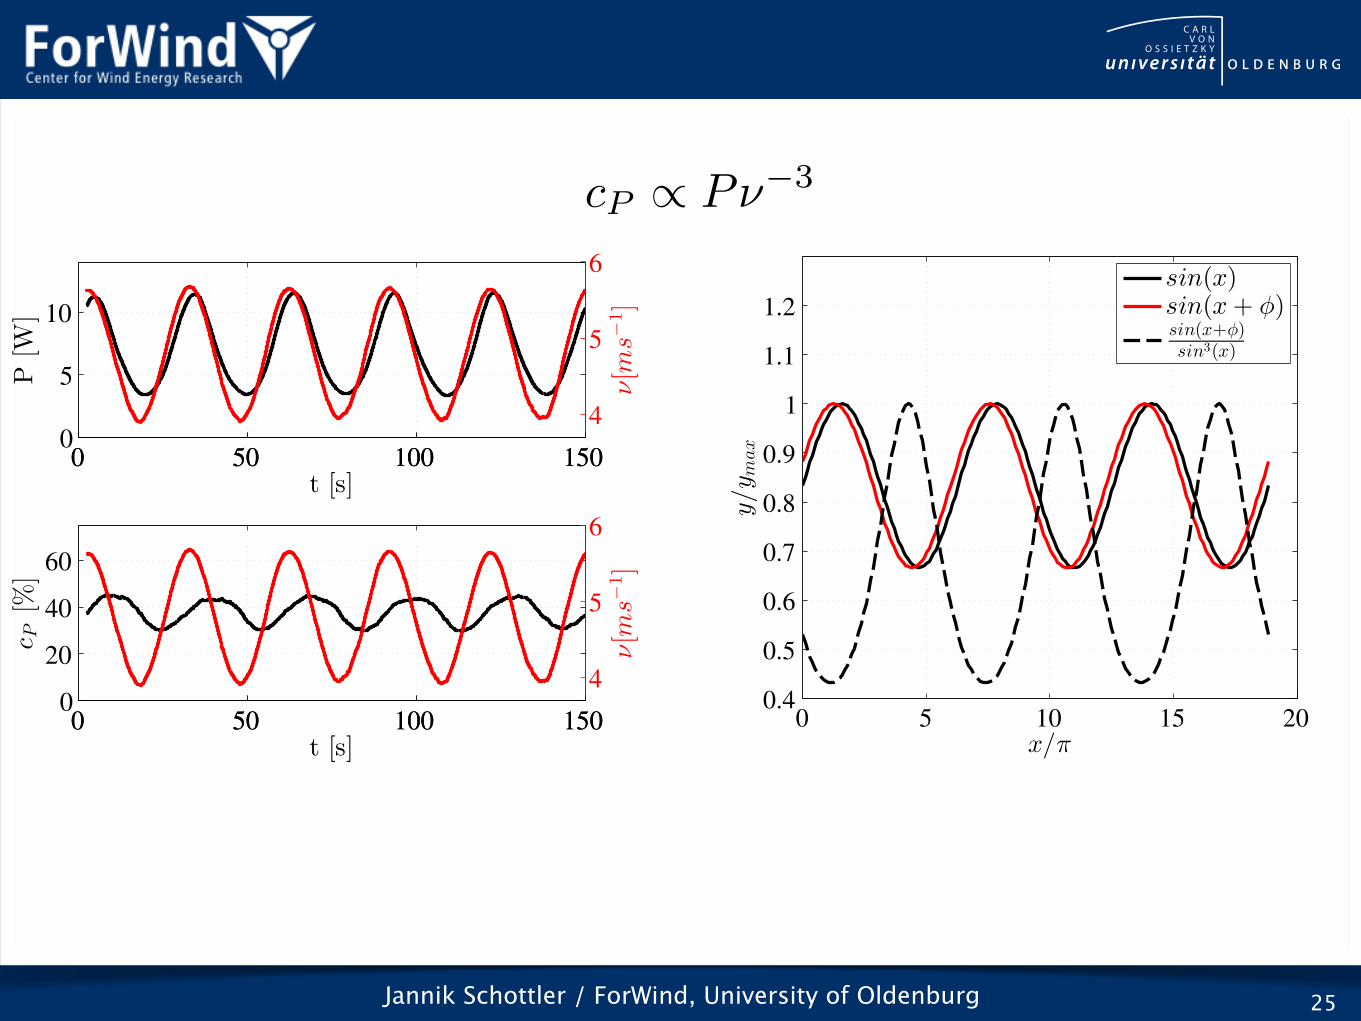
phase shift
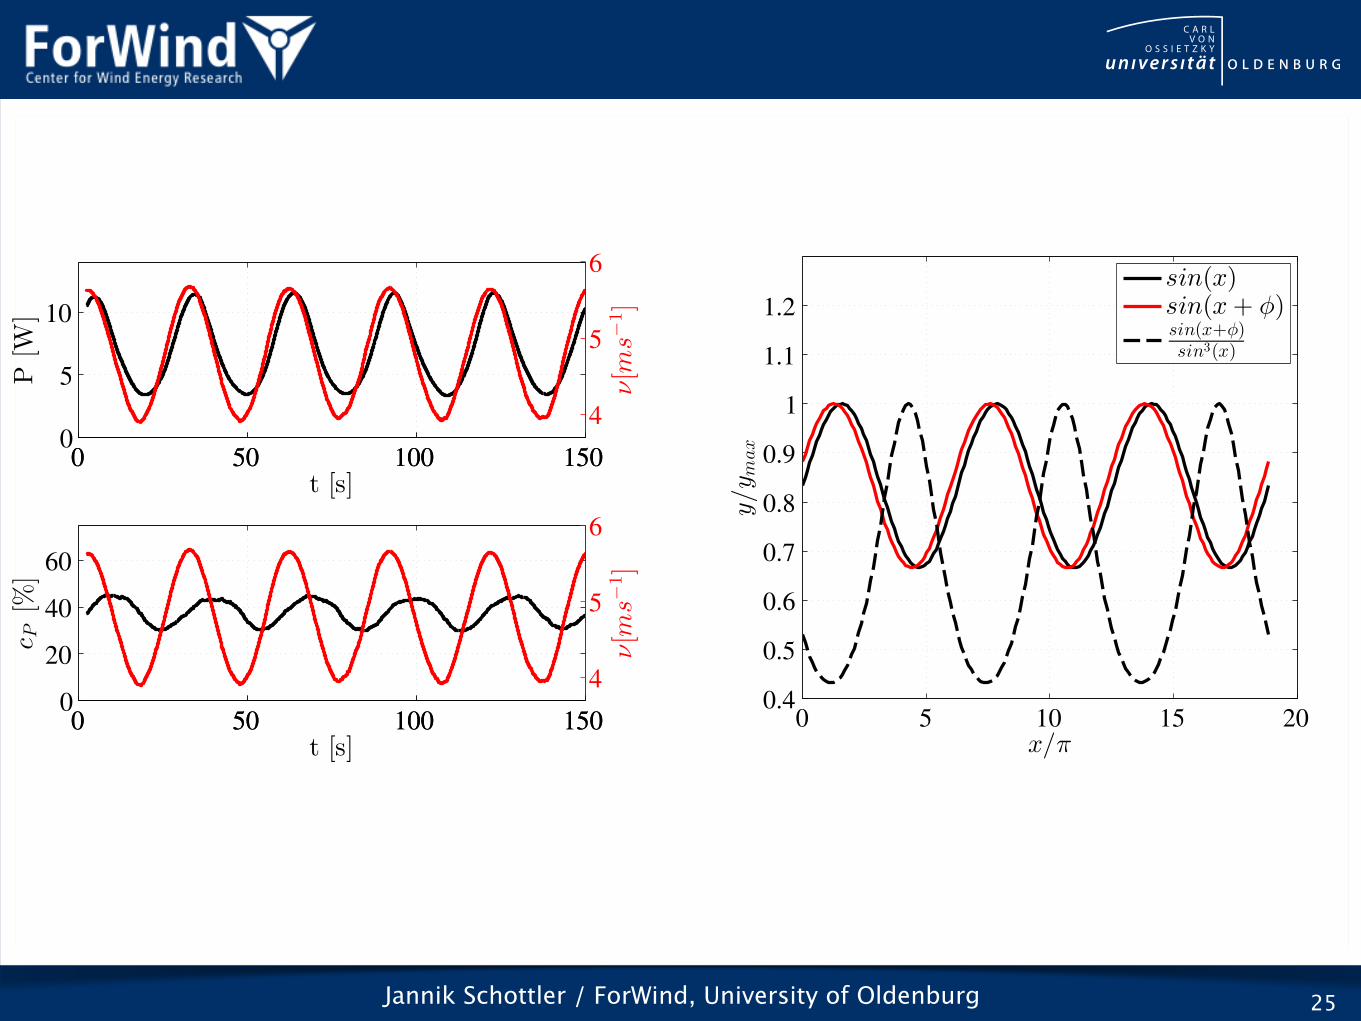
Jannik Schottler / ForWind, University of Oldenburg 25
0 5 10 15 200.4
0.5
0.6
0.7
0.8
0.9
1
1.1
1.2
y/ymax
x/π
sin(x)sin(x+ φ)sin(x+φ)sin3(x)
0 50 100 1500
5
10
P[W
]
t [s]0 50 100 150
4
5
6
ν[m
s−1]
0 50 100 1500
20
40
60
cP[%
]
t [s]0 50 100 150
4
5
6
ν[m
s−1]
Jannik Schottler / ForWind, University of Oldenburg 25
0 5 10 15 200.4
0.5
0.6
0.7
0.8
0.9
1
1.1
1.2
y/ymax
x/π
sin(x)sin(x+ φ)sin(x+φ)sin3(x)
0 50 100 1500
5
10
P[W
]
t [s]0 50 100 150
4
5
6
ν[m
s−1]
0 50 100 1500
20
40
60
cP[%
]
t [s]0 50 100 150
4
5
6
ν[m
s−1]
cP / P⌫�3
Jannik Schottler / ForWind, University of Oldenburg 26
generator
stepper motor
main shaft slider
Jannik Schottler / ForWind, University of Oldenburg 26
generator
stepper motor
main shaft slider
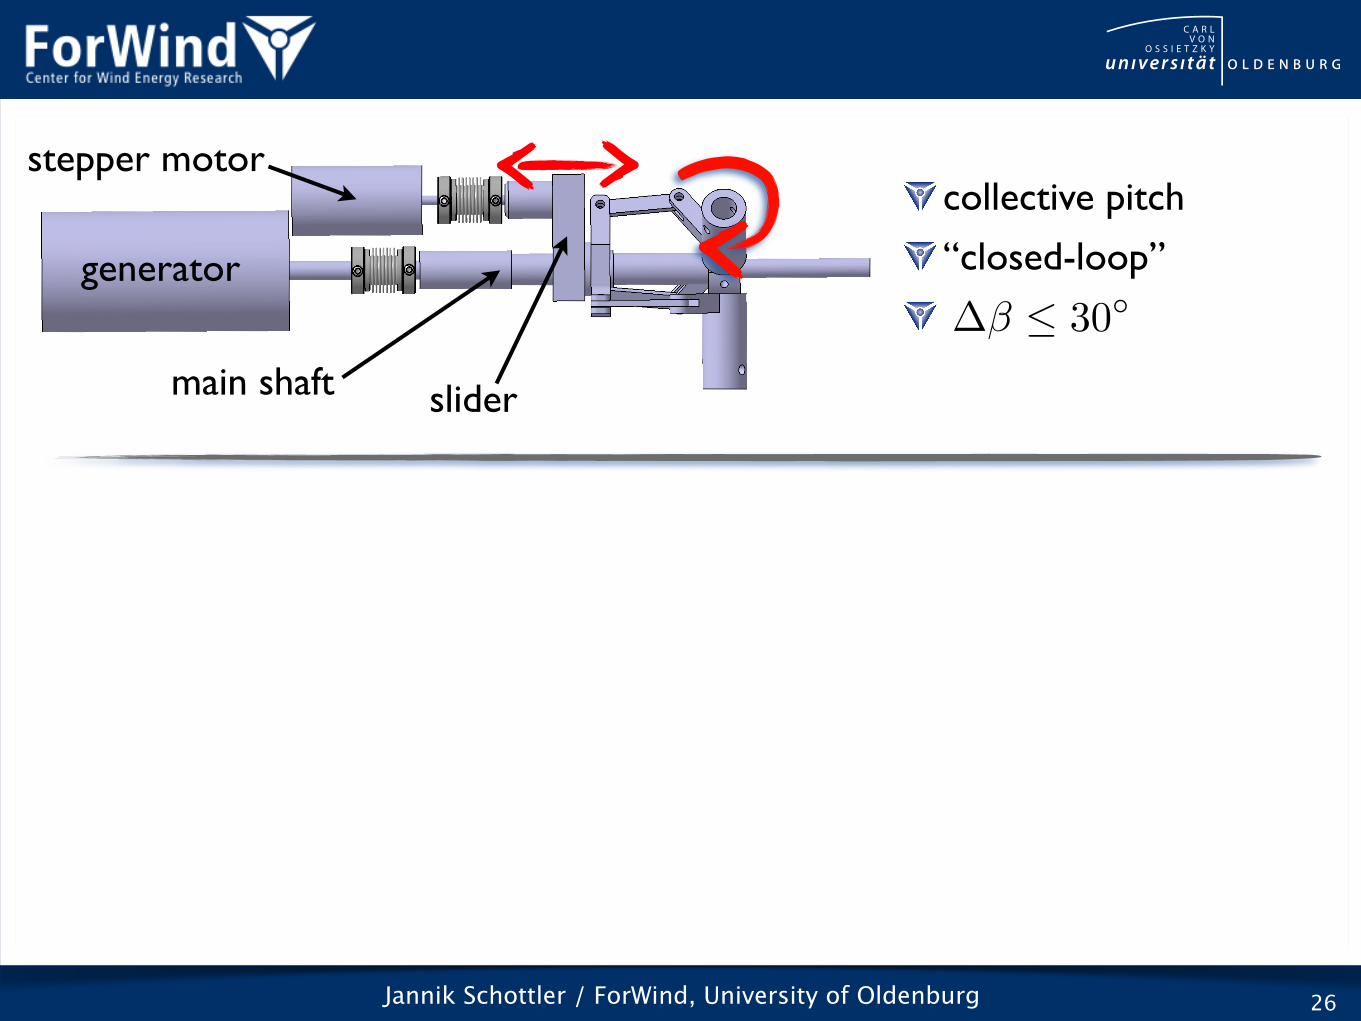
Jannik Schottler / ForWind, University of Oldenburg
collective pitch
“closed-loop”
26
generator
stepper motor
main shaft slider
�� 30�
Jannik Schottler / ForWind, University of Oldenburg
collective pitch
“closed-loop”
26
generator
stepper motor
main shaft slider
�� 30�
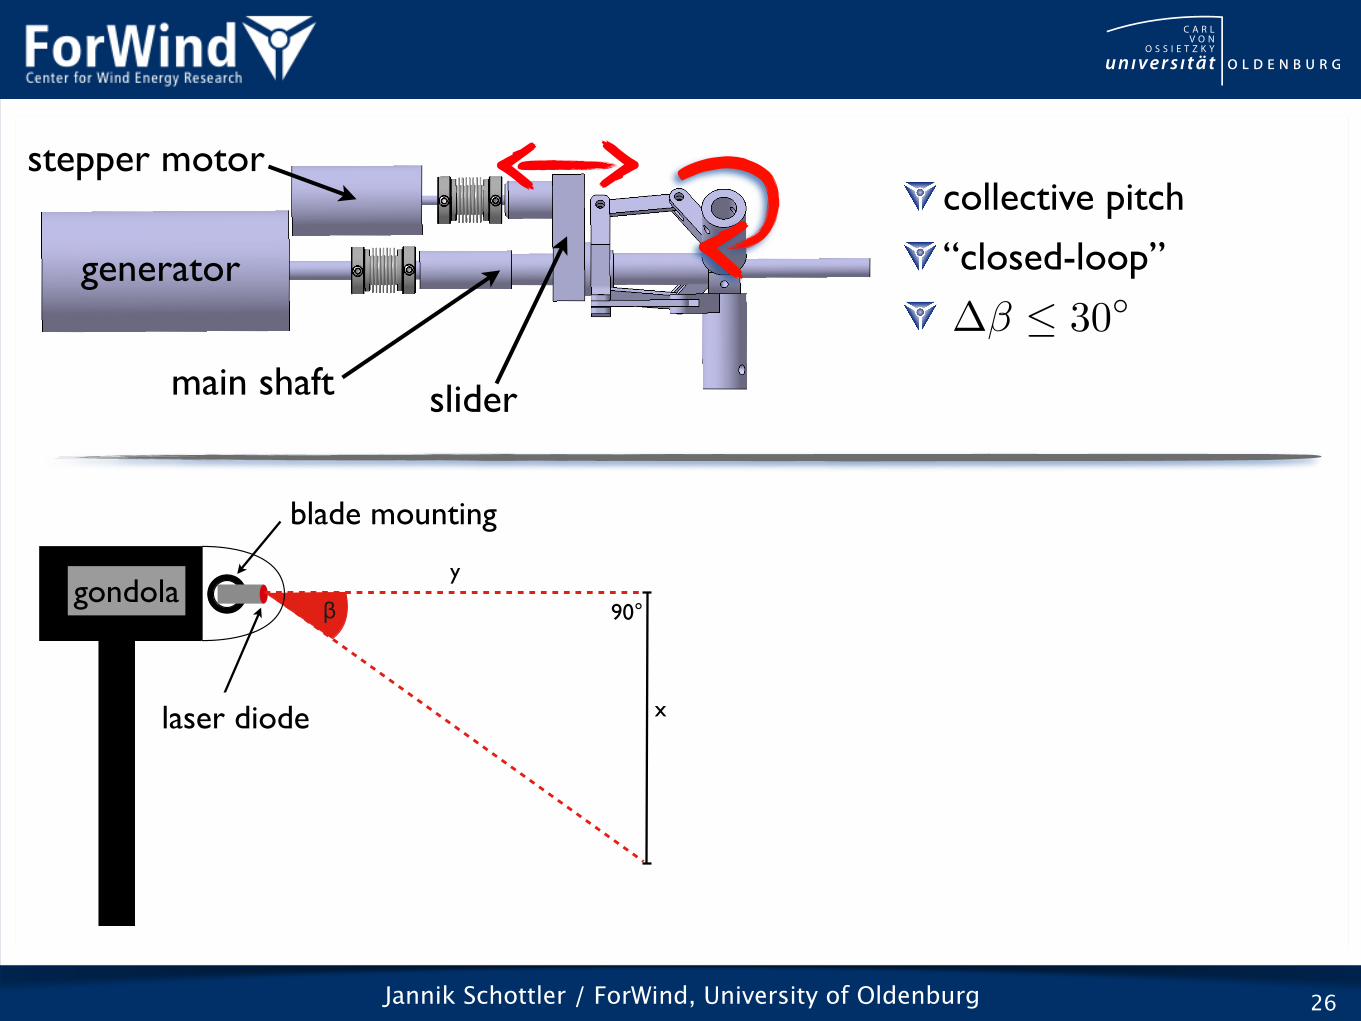
90°βy
xLaserdiode
Flügelhalterung
Gondel
blade mounting
laser diode
gondola
Jannik Schottler / ForWind, University of Oldenburg
collective pitch
“closed-loop”
26
generator
stepper motor
main shaft slider
�� 30�
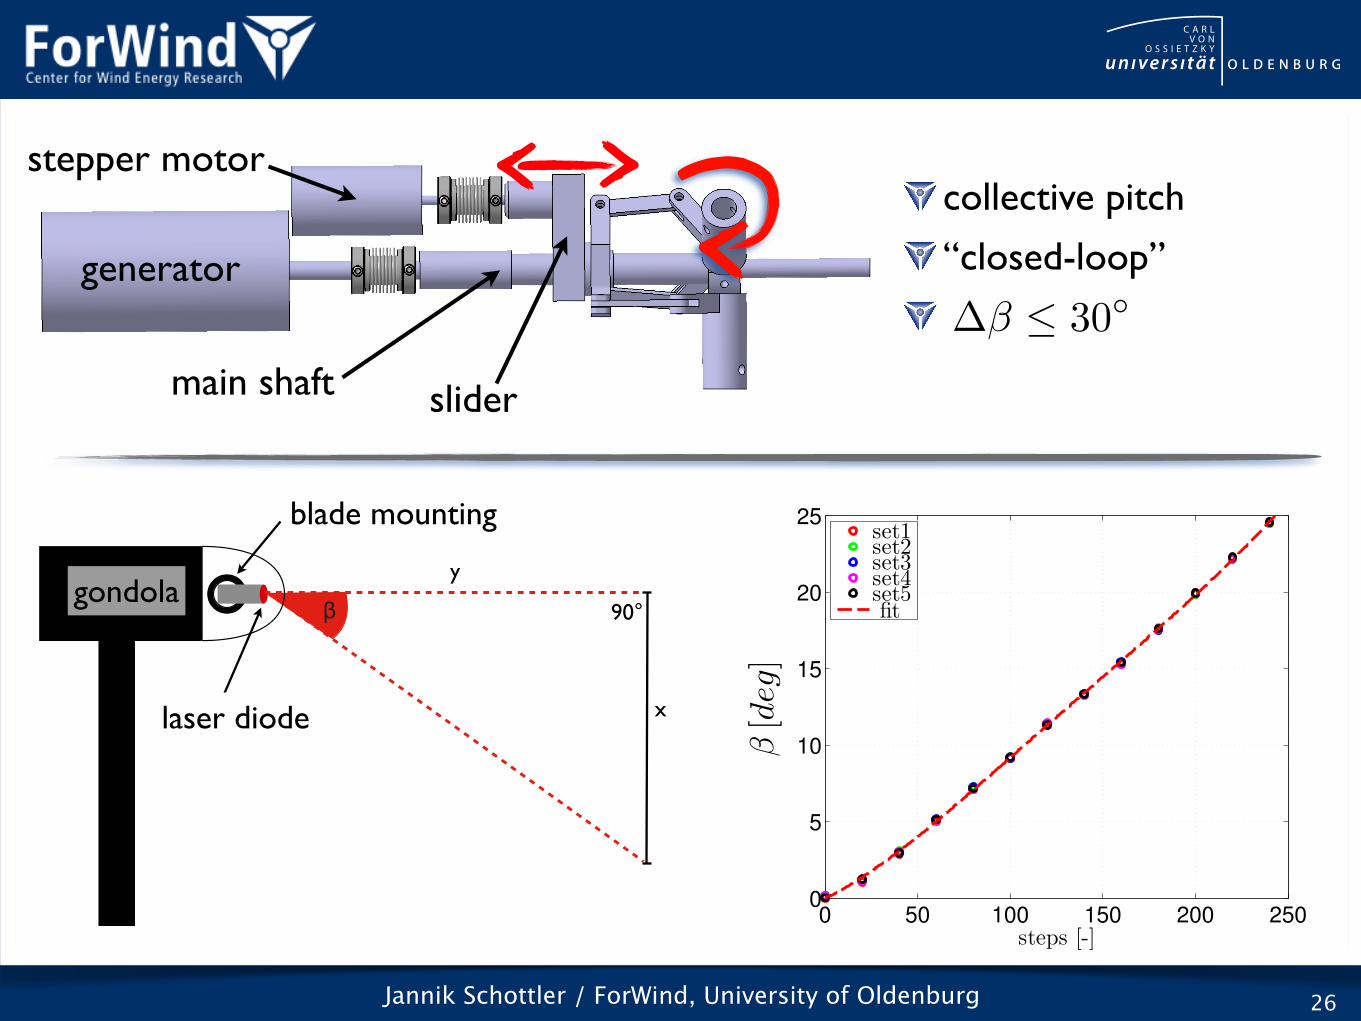
0 50 100 150 200 2500
5
10
15
20
25
steps [-]
Pitchwinkel[deg]
set1set2set3set4set5fit
�[deg]
90°βy
xLaserdiode
Flügelhalterung
Gondel
blade mounting
laser diode
gondola
Jannik Schottler / ForWind, University of Oldenburg 27
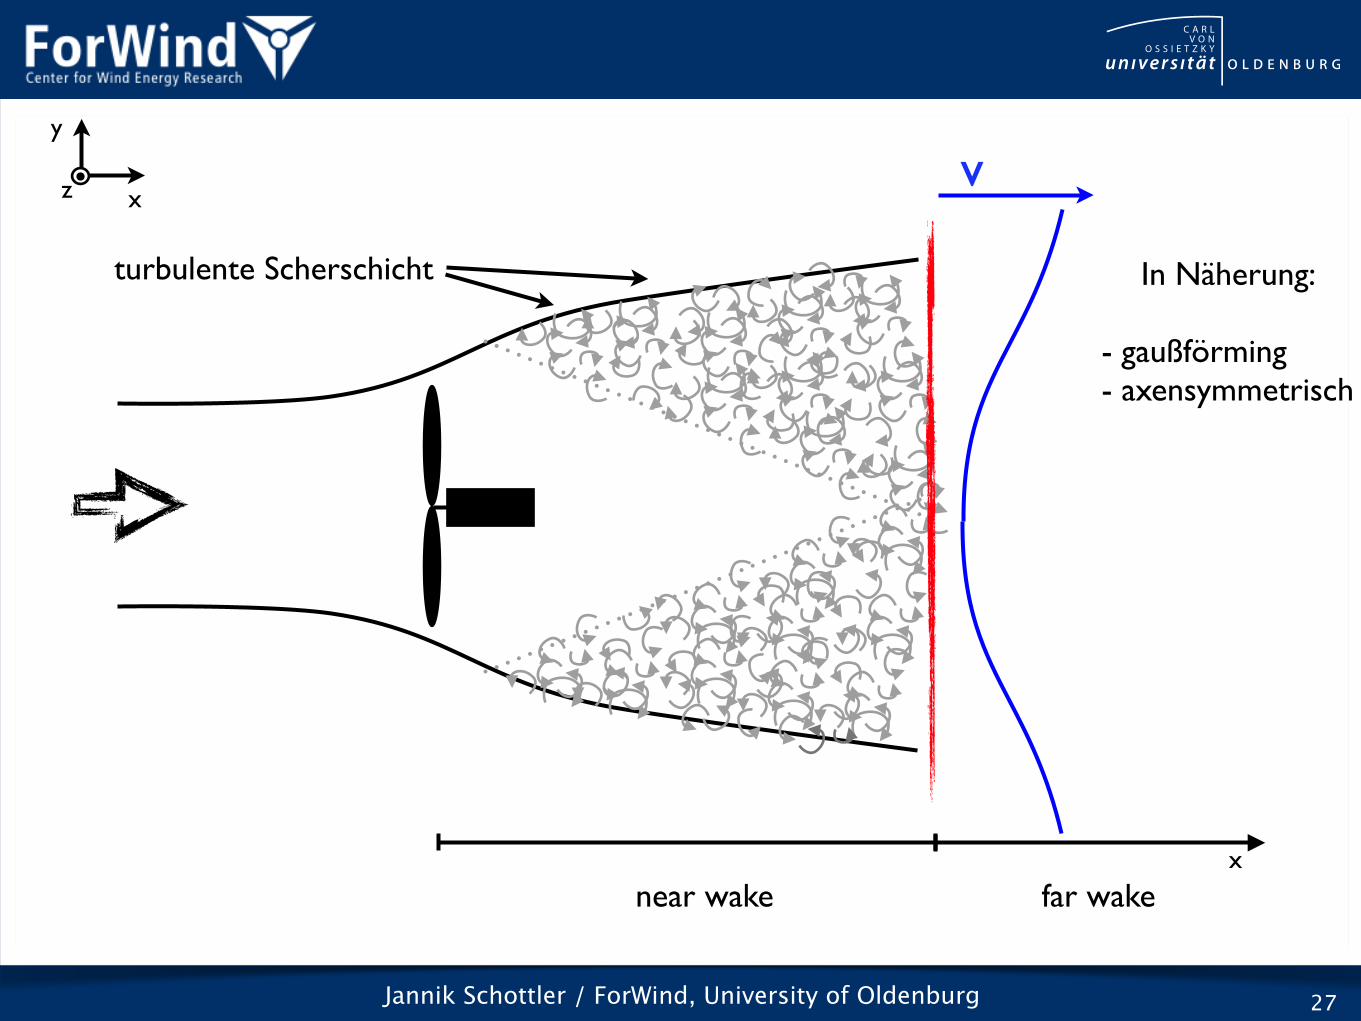
x
y
z
near wake far wakex
turbulente Scherschicht In Näherung:
- gaußförming- axensymmetrisch
v
Jannik Schottler / ForWind, University of Oldenburg 28
Dw
Wind
x
⇤
0, 8m
Düse⌫lab = 0ms�1
⌫1
⌫wake < ⌫1
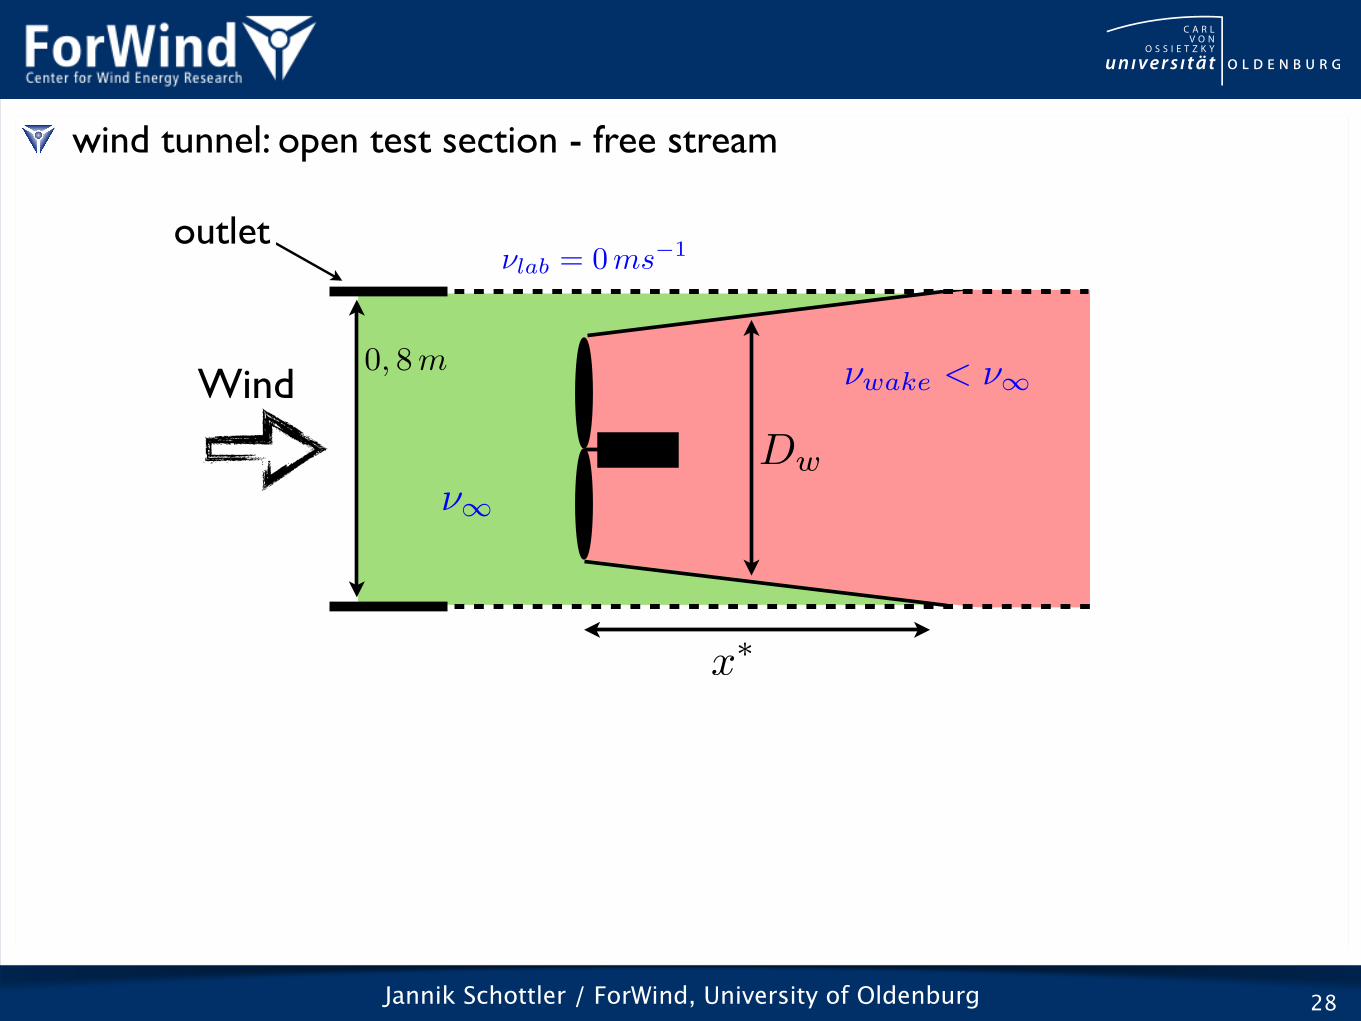
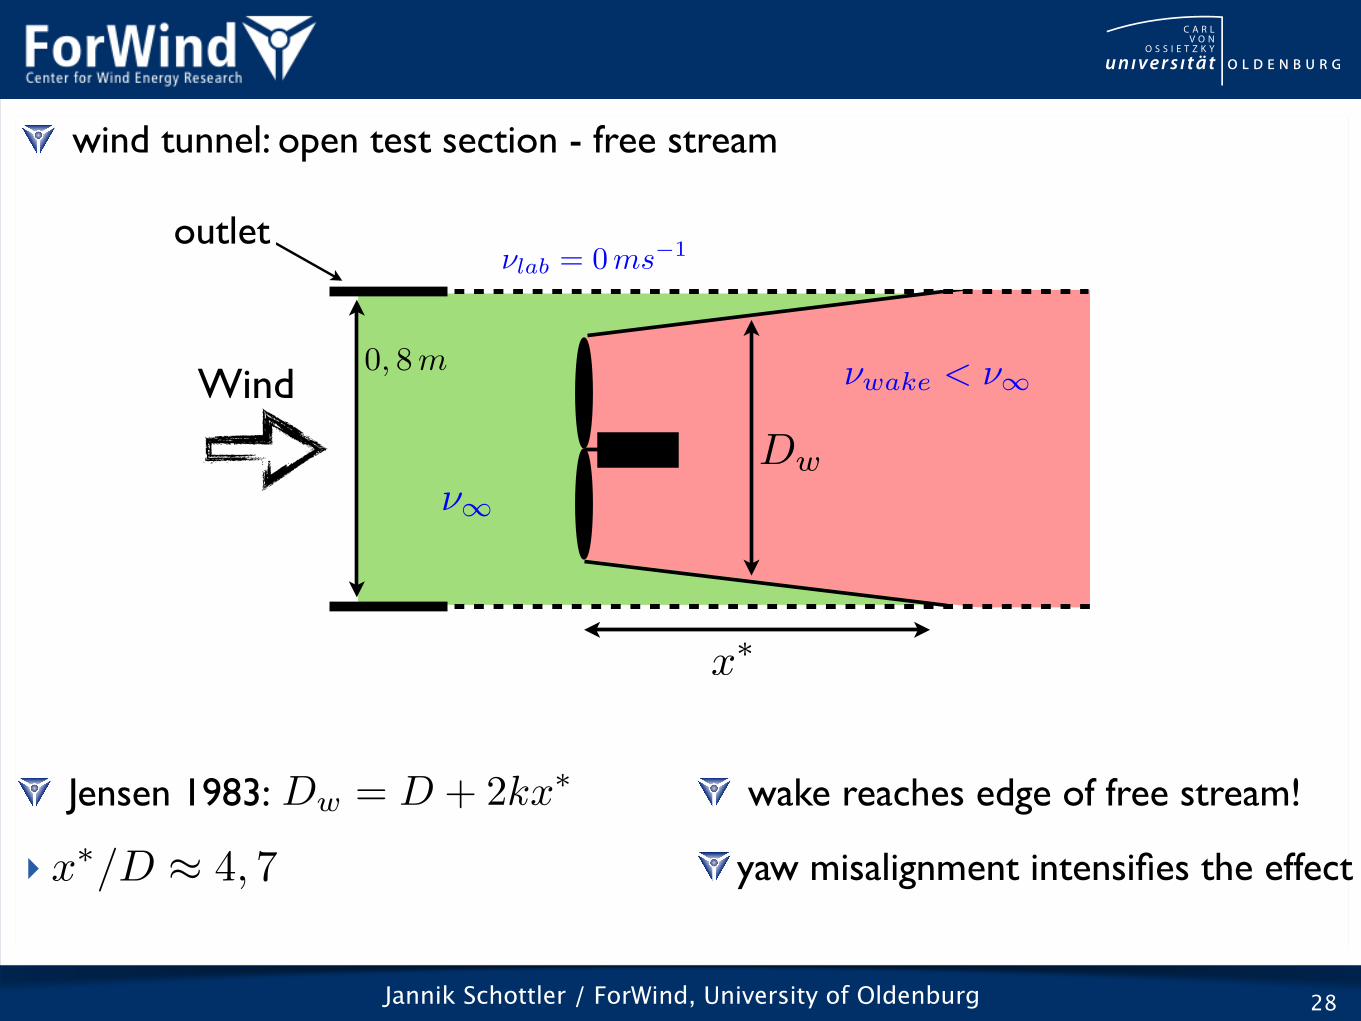
wind tunnel: open test section - free stream
outlet
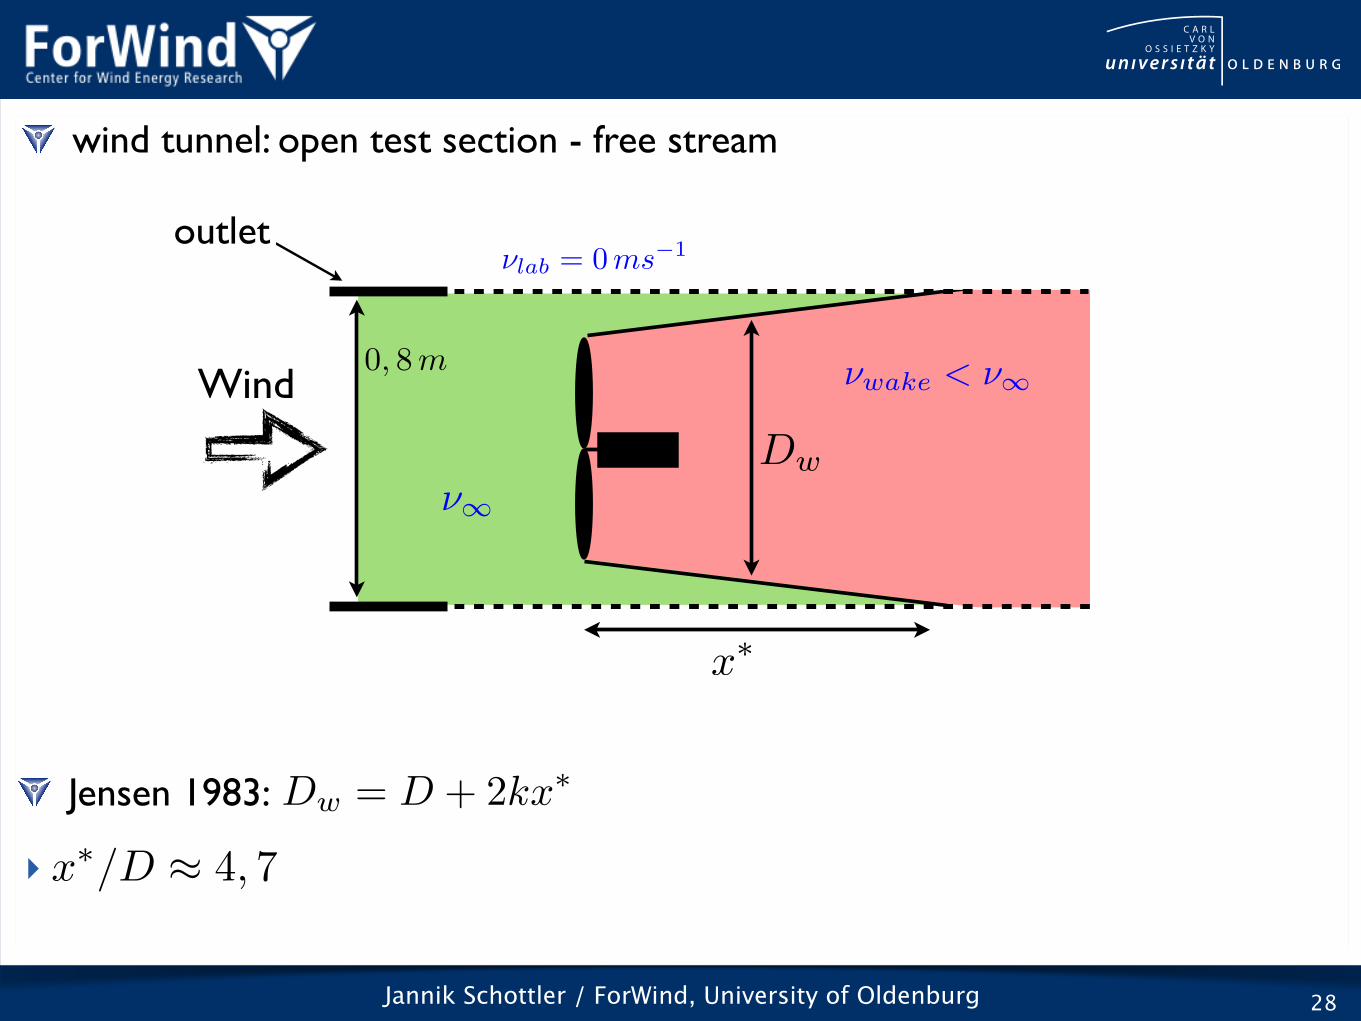
Jannik Schottler / ForWind, University of Oldenburg 28
Dw
Wind
x
⇤
0, 8m
Düse⌫lab = 0ms�1
⌫1
⌫wake < ⌫1
wind tunnel: open test section - free stream
Dw = D + 2kx⇤ Jensen 1983:
‣ x⇤/D ⇡ 4, 7
outlet
Jannik Schottler / ForWind, University of Oldenburg 28
Dw
Wind
x
⇤
0, 8m
Düse⌫lab = 0ms�1
⌫1
⌫wake < ⌫1
wind tunnel: open test section - free stream
Dw = D + 2kx⇤ Jensen 1983:
‣ x⇤/D ⇡ 4, 7
wake reaches edge of free stream!
yaw misalignment intensifies the effect
outlet
Jannik Schottler / ForWind, University of Oldenburg 29
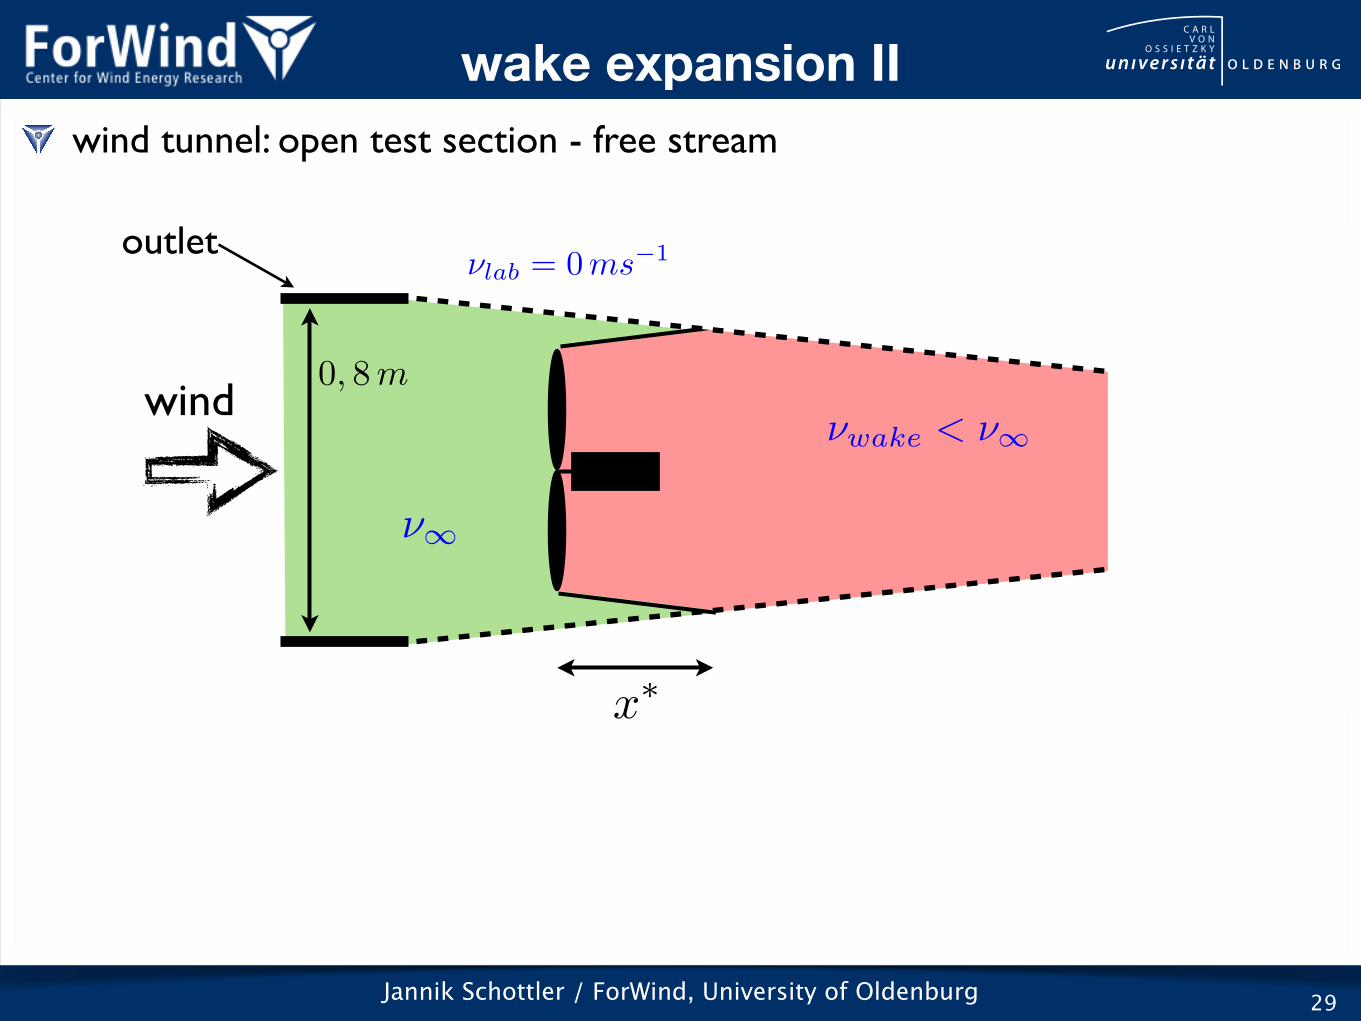
wake expansion II wind tunnel: open test section - free stream
Dw
wind0, 8m
outlet⌫lab = 0ms�1
⌫1
⌫wake < ⌫1
x
⇤

Jannik Schottler / ForWind, University of Oldenburg 29
wake expansion II wind tunnel: open test section - free stream
Dw
wind0, 8m
outlet⌫lab = 0ms�1
⌫1
⌫wake < ⌫1
x
⇤
turbulent conditions at T2 for large x
Jannik Schottler / ForWind, University of Oldenburg 30
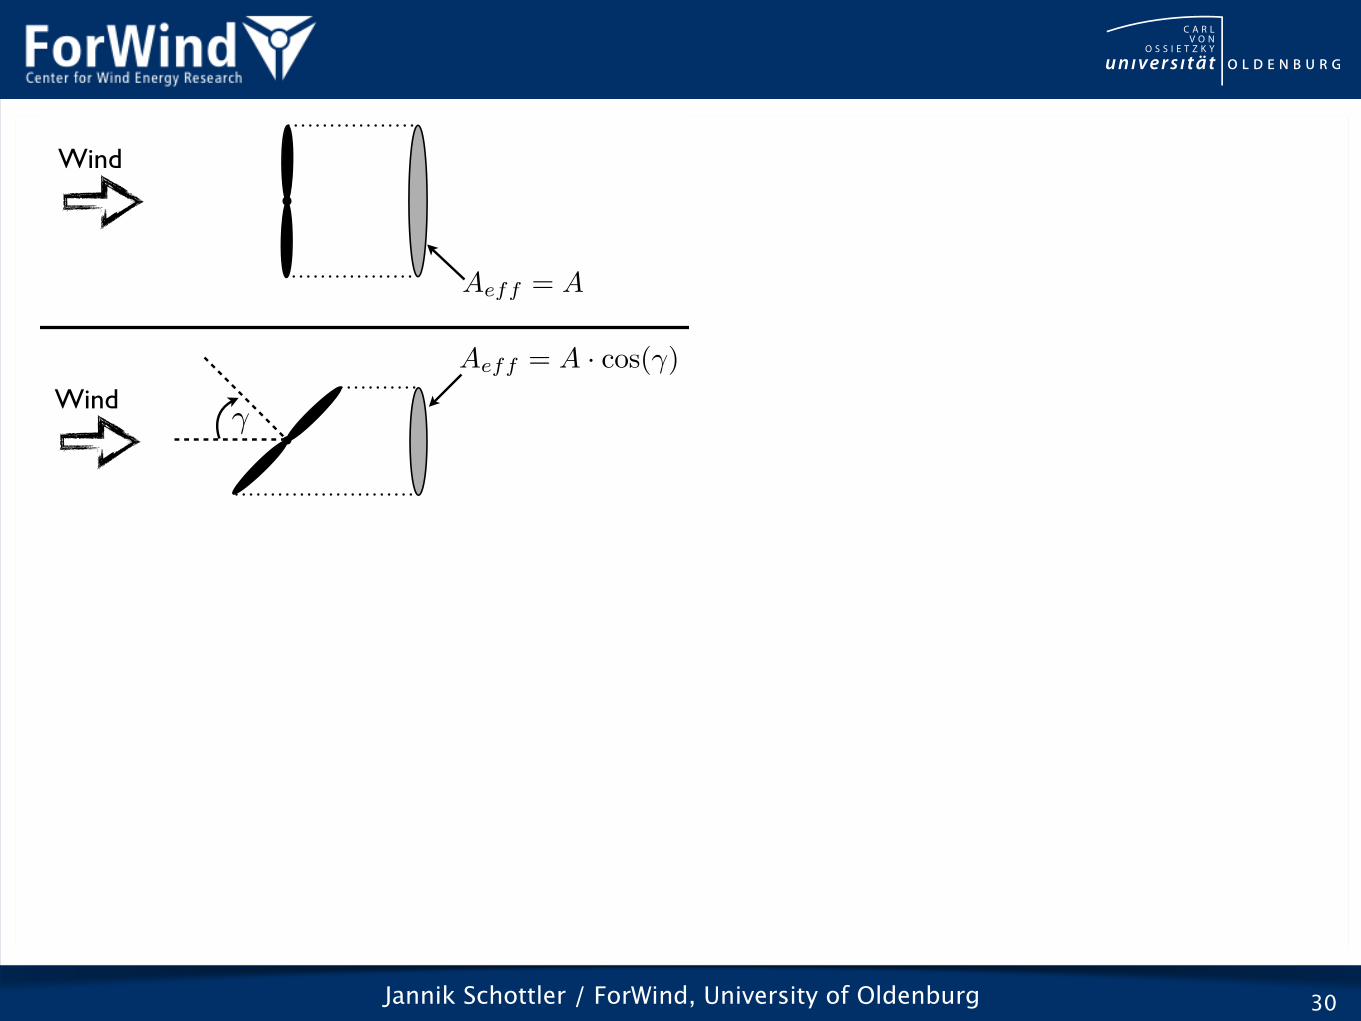
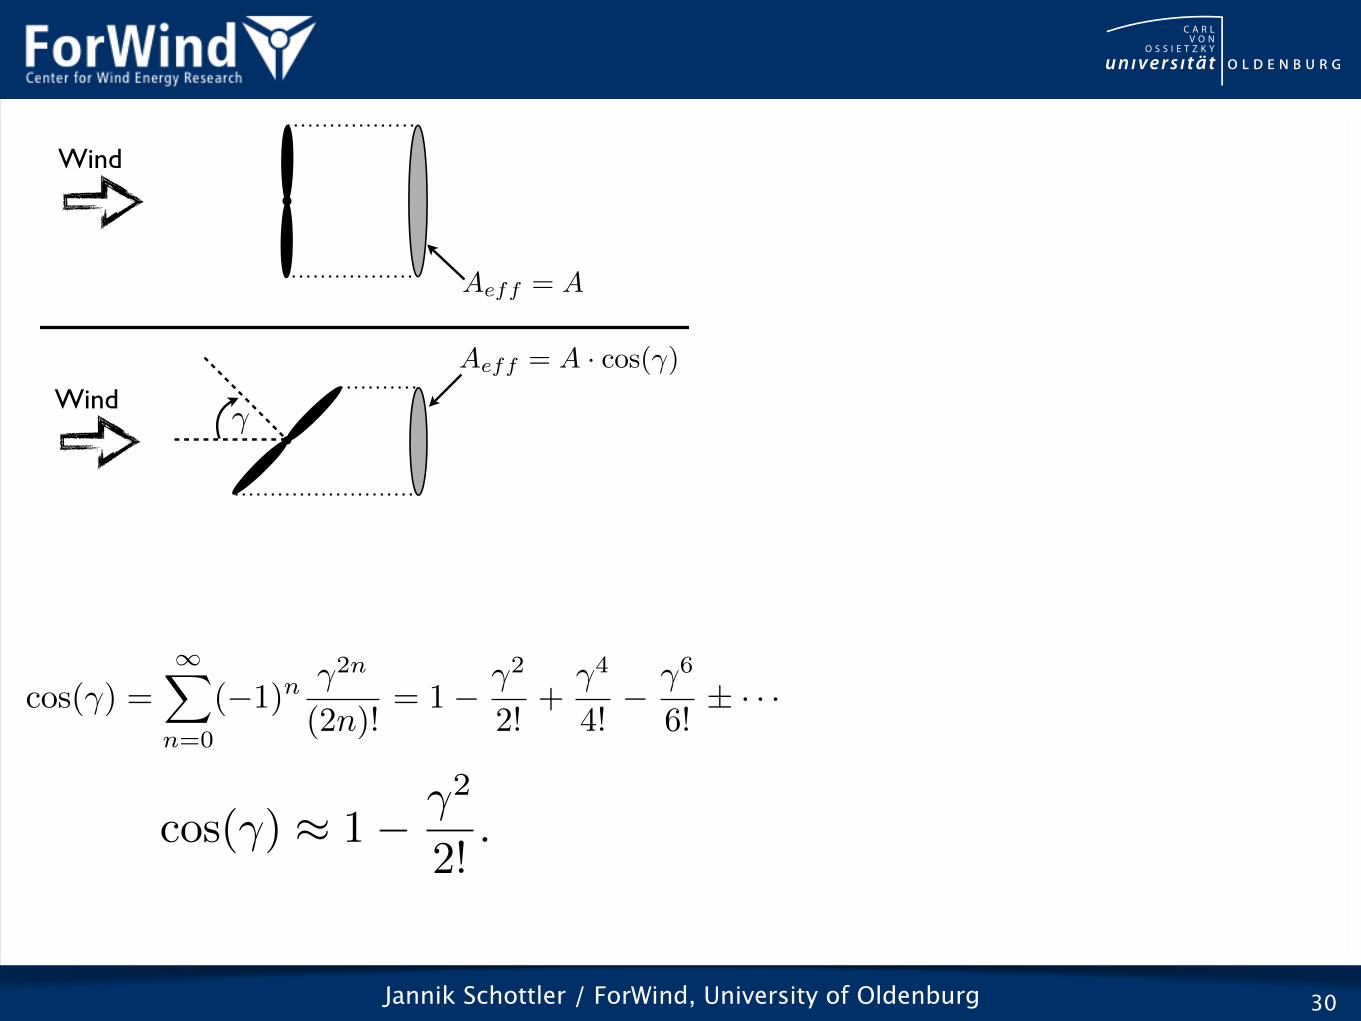
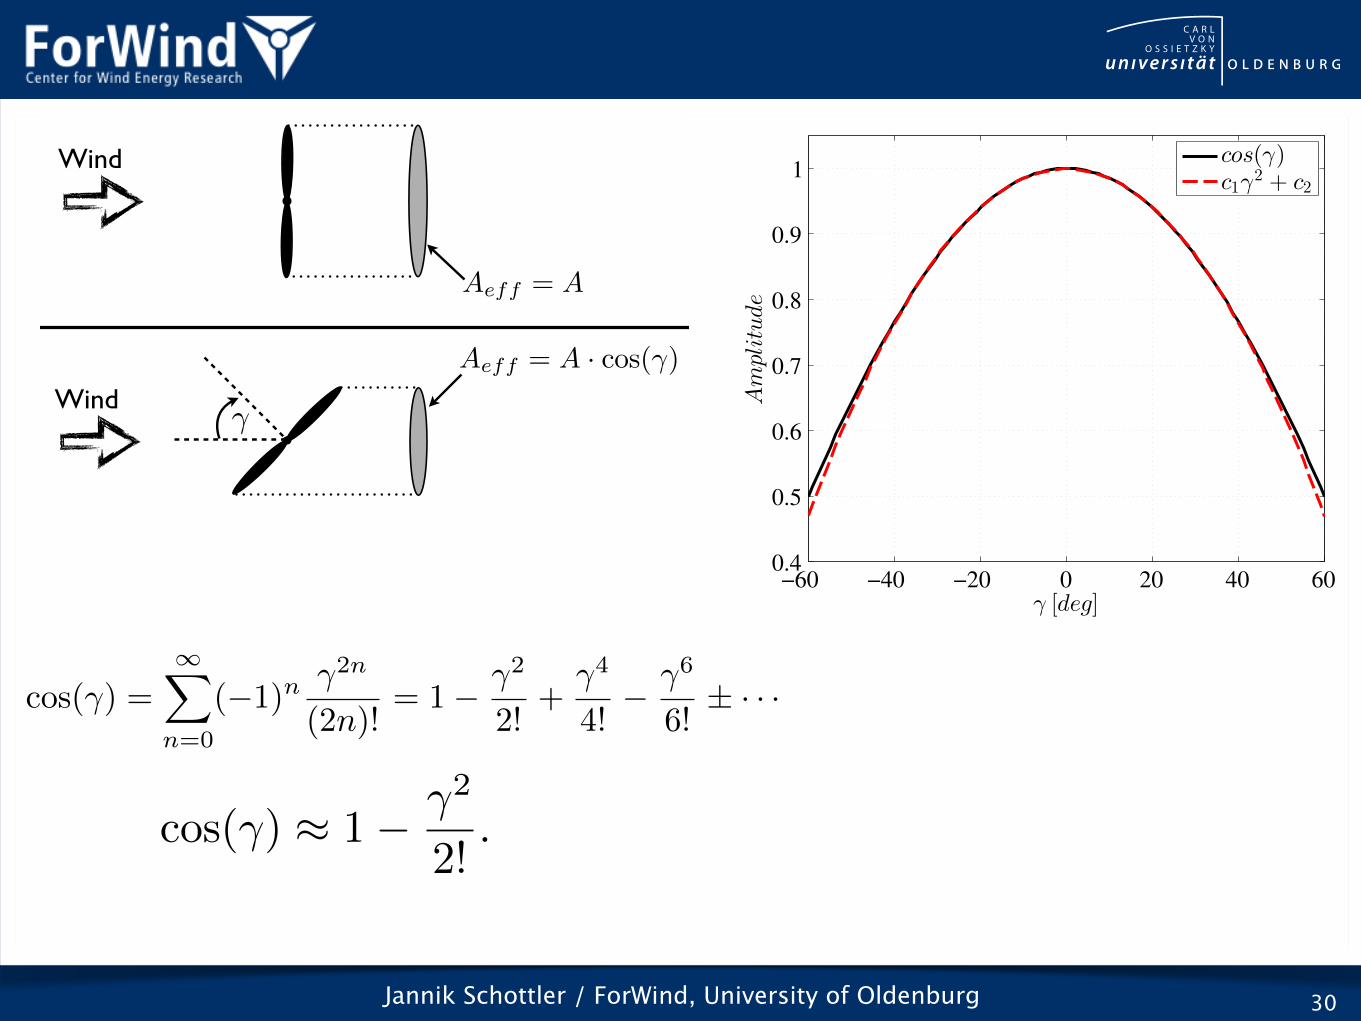
�
Aeff = A · cos(�)
Aeff = A
Wind
Wind
Jannik Schottler / ForWind, University of Oldenburg 30
�
Aeff = A · cos(�)
Aeff = A
Wind
Wind
cos(�) =1X
n=0
(�1)
n �2n
(2n)!= 1� �2
2!
+
�4
4!
� �6
6!
± · · ·
cos(�) ⇡ 1� �2
2!
.
Jannik Schottler / ForWind, University of Oldenburg 30
�
Aeff = A · cos(�)
Aeff = A
Wind
Wind
cos(�) =1X
n=0
(�1)
n �2n
(2n)!= 1� �2
2!
+
�4
4!
� �6
6!
± · · ·
cos(�) ⇡ 1� �2
2!
.
−60 −40 −20 0 20 40 600.4
0.5
0.6
0.7
0.8
0.9
1
γ [deg]
Amplitude
cos(γ)c1γ
2 + c2
Jannik Schottler / ForWind, University of Oldenburg 31
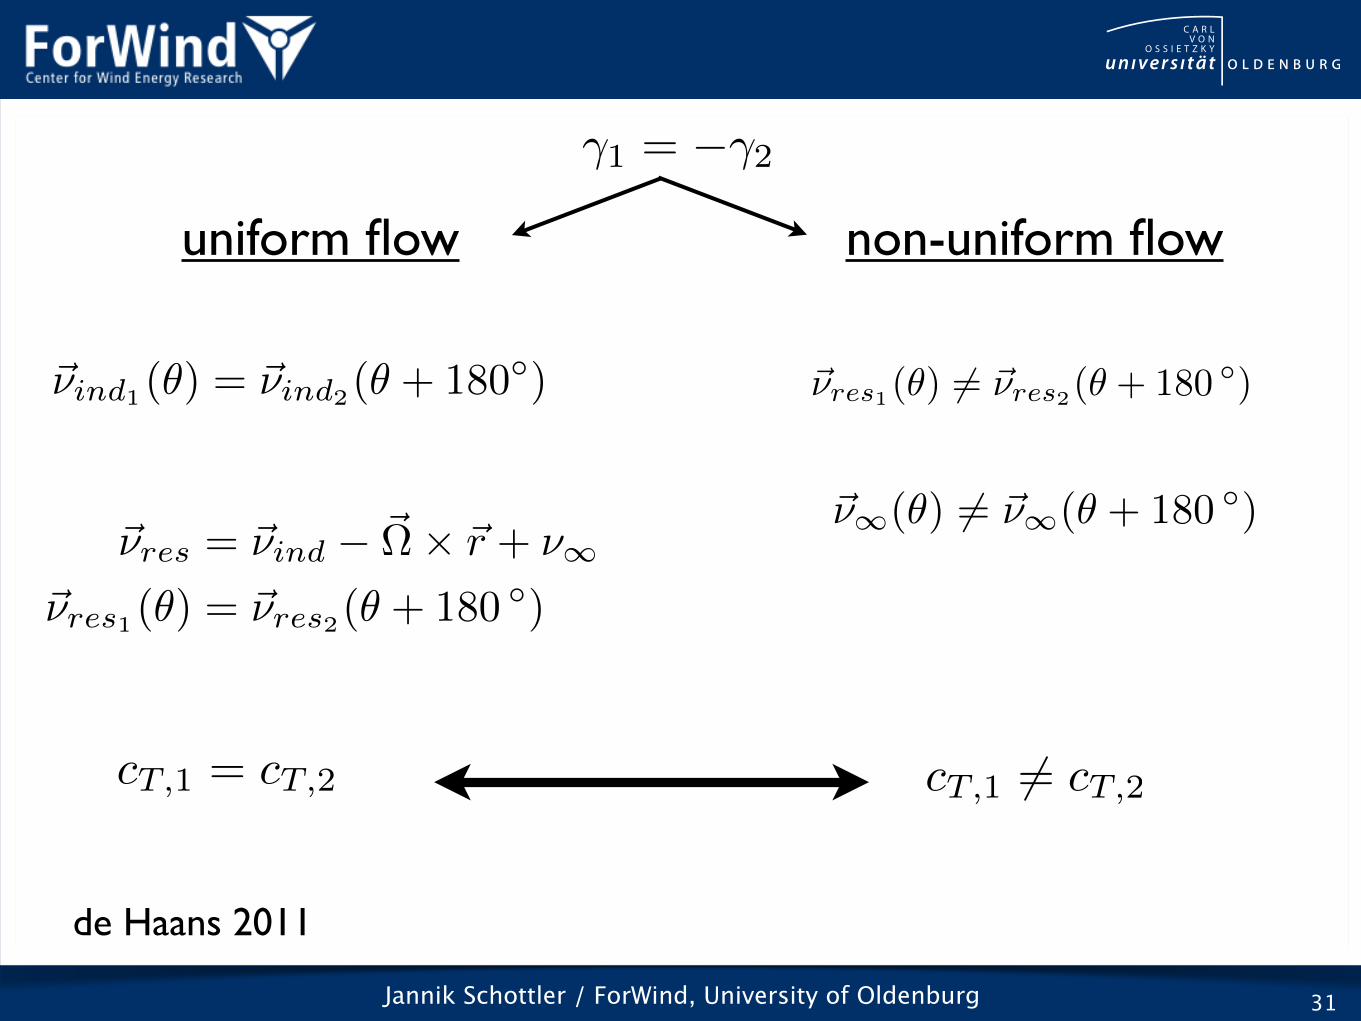
�1 = ��2
~⌫ind1(✓) = ~⌫ind2(✓ + 180�)
uniform flow non-uniform flow
~⌫res = ~⌫ind � ~⌦⇥ ~r + ⌫1
~⌫res1(✓) = ~⌫res2(✓ + 180 �)
de Haans 2011
~⌫res1(✓) 6= ~⌫res2(✓ + 180 �)
~⌫1(✓) 6= ~⌫1(✓ + 180 �)
cT,1 6= cT,2cT,1 = cT,2
Jannik Schottler / ForWind, University of Oldenburg 32
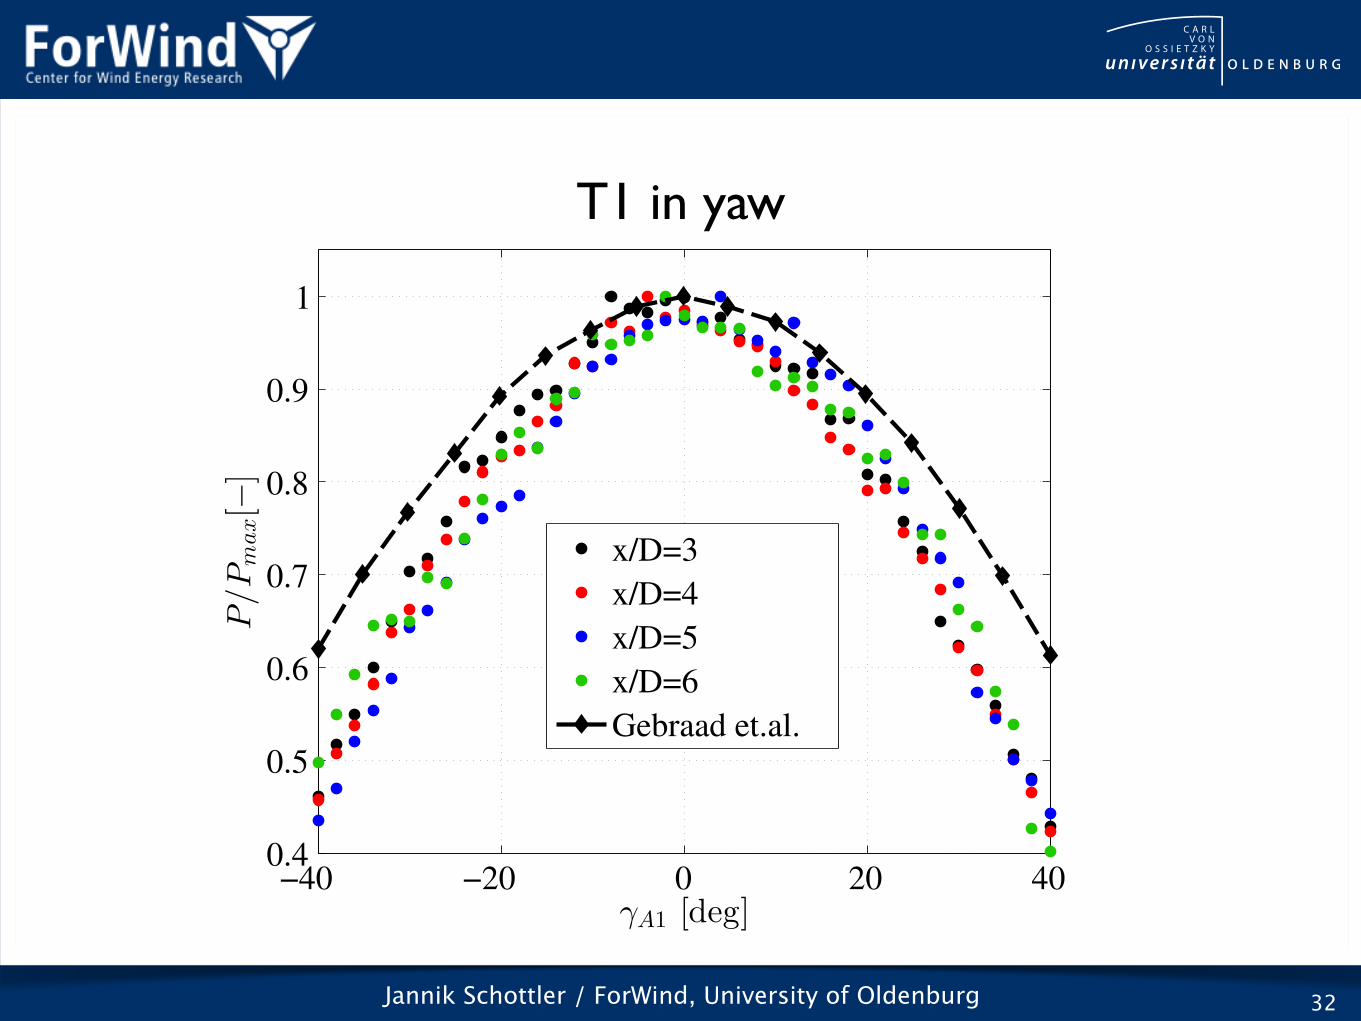
T1 in yaw
−40 −20 0 20 400.4
0.5
0.6
0.7
0.8
0.9
1
γA1 [deg]
P/Pmax[−
]
x/D=3
x/D=4
x/D=5
x/D=6
Gebraad et.al.
Related Documents