The Astronomical Journal, 142:191 (20pp), 2011 December doi:10.1088/0004-6256/142/6/191 C 2011. The American Astronomical Society. All rights reserved. Printed in the U.S.A. WIND STRUCTURE AND LUMINOSITY VARIATIONS IN THE WOLF–RAYET/LUMINOUS BLUE VARIABLE HD 5980 ∗ Leonid Georgiev 1 ,8 , Gloria Koenigsberger 2 , D. John Hillier 3 , Nidia Morrell 4 , Rodolfo Barb ´ a 5 ,6 , and Roberto Gamen 7 1 Instituto de Astronom´ ıa, Universidad Nacional Aut´ onoma de M´ exico, Apdo. Postal 70-264, M´ exico D.F., 04510, Mexico; [email protected] 2 Instituto de Ciencias F´ ısicas, Universidad Nacional Aut´ onoma de M´ exico, Apdo. Postal 48-3, Cuernavaca, Mor. 62210, Mexico; [email protected] 3 Department of Astronomy, 3941 O’Hara Street, University of Pittsburgh, Pittsburgh, PA 15260, USA 4 Las Campanas Observatory, The Carnegie Observatories, Colina El Pino s/n, Casillas 601, La Serena, Chile 5 Departamento de F´ ısica, Universidad de la Serena, Benavente 980, La Serena, Chile 6 ICATE-CONICET, San Juan, Argentina 7 Facultad de Ciencias Astron´ omicas y Geof´ ısicas, Universidad Nacional de La Plata, and Instituto de Astrof´ ısica de La Plata (CCT La Plata-CONICET), Paseo del Bosque S/N, B1900FWA, La Plata, Argentina Received 2011 July 4; accepted 2011 September 16; published 2011 November 7 ABSTRACT Over the past 40 years, the massive luminous blue variable/Wolf–Rayet system HD 5980 in the Small Magellanic Cloud (SMC) has undergone a long-term S Doradus-type variability cycle and two brief and violent eruptions in 1993 and 1994. In this paper we analyze a collection of UV and optical spectra obtained between 1979 and 2009 and perform CMFGEN model fits to spectra of 1994, 2000, 2002, and 2009. The results are as follows: (1) the long-term S Dor-type variability is associated with changes of the hydrostatic radius; (2) the 1994 eruption involved changes in its bolometric luminosity and wind structure; (3) the emission-line strength, the wind velocity, and the continuum luminosity underwent correlated variations in the sense that a decreasing V ∞ is associated with increasing emission line and continuum levels; and (4) the spectrum of the third star in the system (Star C) is well fit by a T eff = 32 K model atmosphere with SMC chemical abundances. For all epochs, the wind of the erupting star is optically thick at the sonic point and is thus driven mainly by the continuum opacity. We speculate that the wind switches between two stable regimes driven by the “hot” (during the eruption) and the “cool” (post-eruption) iron opacity bumps as defined by Lamers & Nugis and Gr¨ afener & Hamann, and thus the wind may undergo a bi-stability jump of a different nature from that which occurs in OB stars. Key words: binaries: eclipsing – stars: individual (HD 5980) – stars: variables: S Doradus – stars: Wolf–Rayet Online-only material: color figures 1. INTRODUCTION Eruptive mass-loss phenomenon in massive stars is emerging as an area of interest for many reasons, one of the most important of which is that the characteristics of certain supernova (SN) explosions depend critically on the progenitor’s mass. The stars classified as luminous blue variables (LBVs) appear to have the ability to remove a large fraction of their outer stellar layers through violent ejection processes long before the SN phase is reached. It is believed that these ejections, combined with the effects of the stationary stellar winds, may determine to a large extent the mass of the SN progenitor (van Marle et al. 2007; Smith 2008; Dwarkadas 2011). The LBV eruptions have been observed since the 1600s, but the mechanisms driving the instability have not been identified. Although some scenarios have been suggested (Guzik et al. 2005; Owocki & van Marle 2008; Kashi & Soker 2010), their confirmation is difficult due to the large distances at which most of these objects lie and the fact that they are intensely observed only after they have undergone an eruptive event. Thus, their pre- eruption characteristics are poorly constrained. Furthermore, observational constraints on their fundamental parameters are often lacking. ∗ Based on data obtained with HST, IUE, FUSE, and the 6.5 m Magellan telescopes at Las Campanas Observatory in Chile. 8 Visiting Astronomer, Department of Astronomy, 3941 O’Hara Street, University of Pittsburgh, Pittsburgh, PA 15260, USA. HD 5980 is a multiple system in the Small Magellanic Cloud (SMC) that has been observed spectroscopically since the 1960s. It contains an eclipsing binary system plus a third object. Four well-defined variability timescales are present: (1) a long-term (∼40 years) variation (Koenigsberger et al. 2010); (2) sudden eruptive events which were observed in 1993 and 1994, each lasting less than 1 year (Barb´ a & Niemela 1994; Barb´ a et al. 1995; Koenigsberger et al. 1995; Jones & Sterken 1997); (3) orbital-phase locked variations with the 19.3 day eclipsing binary period (Breysacher et al. 1982; Foellmi et al. 2008, and references therein); and (4) “microvariability” on ∼30 minute timescale that was observed shortly after the 1993/1994 eruptions (Breysacher 1997; Sterken & Breysacher 1997). These timescales disclose the presence of a variety of physical phenomena in the system. In particular, Koenigsberger et al. (2010) have argued that the 1993–1994 eruptions may have been caused by tidal interactions that became stronger due to a gradual increase in the stellar radius, on the ∼40 year timescale. Although the process responsible for the ∼40 year timescale is unknown, it is believed to be the same as that which occurs in S Doradus-type variables. The three luminous objects comprising the HD 5980 system are: two emission-line stars in a close 19.3 day binary orbit (Breysacher & Perrier 1980) and a third O-type object (here- after Star C) whose photospheric absorptions remain relatively stationary on the orbital timescale of the binary (Niemela 1988; Koenigsberger et al. 2002). Following the convention introduced by Barb´ a et al. (1996), we label as Star A the star “in front” at 1

Welcome message from author
This document is posted to help you gain knowledge. Please leave a comment to let me know what you think about it! Share it to your friends and learn new things together.
Transcript
The Astronomical Journal, 142:191 (20pp), 2011 December doi:10.1088/0004-6256/142/6/191C© 2011. The American Astronomical Society. All rights reserved. Printed in the U.S.A.
WIND STRUCTURE AND LUMINOSITY VARIATIONS IN THEWOLF–RAYET/LUMINOUS BLUE VARIABLE HD 5980∗
Leonid Georgiev1,8, Gloria Koenigsberger2, D. John Hillier3, Nidia Morrell4,Rodolfo Barba5,6, and Roberto Gamen7
1 Instituto de Astronomıa, Universidad Nacional Autonoma de Mexico, Apdo. Postal 70-264, Mexico D.F., 04510, Mexico; [email protected] Instituto de Ciencias Fısicas, Universidad Nacional Autonoma de Mexico, Apdo. Postal 48-3, Cuernavaca, Mor. 62210, Mexico; [email protected]
3 Department of Astronomy, 3941 O’Hara Street, University of Pittsburgh, Pittsburgh, PA 15260, USA4 Las Campanas Observatory, The Carnegie Observatories, Colina El Pino s/n, Casillas 601, La Serena, Chile
5 Departamento de Fısica, Universidad de la Serena, Benavente 980, La Serena, Chile6 ICATE-CONICET, San Juan, Argentina
7 Facultad de Ciencias Astronomicas y Geofısicas, Universidad Nacional de La Plata, and Instituto de Astrofısica de La Plata (CCT La Plata-CONICET),Paseo del Bosque S/N, B1900FWA, La Plata, Argentina
Received 2011 July 4; accepted 2011 September 16; published 2011 November 7
ABSTRACT
Over the past 40 years, the massive luminous blue variable/Wolf–Rayet system HD 5980 in the Small MagellanicCloud (SMC) has undergone a long-term S Doradus-type variability cycle and two brief and violent eruptionsin 1993 and 1994. In this paper we analyze a collection of UV and optical spectra obtained between 1979 and2009 and perform CMFGEN model fits to spectra of 1994, 2000, 2002, and 2009. The results are as follows:(1) the long-term S Dor-type variability is associated with changes of the hydrostatic radius; (2) the 1994 eruptioninvolved changes in its bolometric luminosity and wind structure; (3) the emission-line strength, the wind velocity,and the continuum luminosity underwent correlated variations in the sense that a decreasing V∞ is associated withincreasing emission line and continuum levels; and (4) the spectrum of the third star in the system (Star C) is wellfit by a Teff = 32 K model atmosphere with SMC chemical abundances. For all epochs, the wind of the eruptingstar is optically thick at the sonic point and is thus driven mainly by the continuum opacity. We speculate that thewind switches between two stable regimes driven by the “hot” (during the eruption) and the “cool” (post-eruption)iron opacity bumps as defined by Lamers & Nugis and Grafener & Hamann, and thus the wind may undergo abi-stability jump of a different nature from that which occurs in OB stars.
Key words: binaries: eclipsing – stars: individual (HD 5980) – stars: variables: S Doradus – stars: Wolf–Rayet
Online-only material: color figures
1. INTRODUCTION
Eruptive mass-loss phenomenon in massive stars is emergingas an area of interest for many reasons, one of the most importantof which is that the characteristics of certain supernova (SN)explosions depend critically on the progenitor’s mass. The starsclassified as luminous blue variables (LBVs) appear to have theability to remove a large fraction of their outer stellar layersthrough violent ejection processes long before the SN phase isreached. It is believed that these ejections, combined with theeffects of the stationary stellar winds, may determine to a largeextent the mass of the SN progenitor (van Marle et al. 2007;Smith 2008; Dwarkadas 2011).
The LBV eruptions have been observed since the 1600s, butthe mechanisms driving the instability have not been identified.Although some scenarios have been suggested (Guzik et al.2005; Owocki & van Marle 2008; Kashi & Soker 2010), theirconfirmation is difficult due to the large distances at which mostof these objects lie and the fact that they are intensely observedonly after they have undergone an eruptive event. Thus, their pre-eruption characteristics are poorly constrained. Furthermore,observational constraints on their fundamental parameters areoften lacking.
∗ Based on data obtained with HST, IUE, FUSE, and the 6.5 m Magellantelescopes at Las Campanas Observatory in Chile.8 Visiting Astronomer, Department of Astronomy, 3941 O’Hara Street,University of Pittsburgh, Pittsburgh, PA 15260, USA.
HD 5980 is a multiple system in the Small MagellanicCloud (SMC) that has been observed spectroscopically sincethe 1960s. It contains an eclipsing binary system plus a thirdobject. Four well-defined variability timescales are present:(1) a long-term (∼40 years) variation (Koenigsberger et al.2010); (2) sudden eruptive events which were observed in 1993and 1994, each lasting less than 1 year (Barba & Niemela1994; Barba et al. 1995; Koenigsberger et al. 1995; Jones &Sterken 1997); (3) orbital-phase locked variations with the 19.3day eclipsing binary period (Breysacher et al. 1982; Foellmiet al. 2008, and references therein); and (4) “microvariability”on ∼30 minute timescale that was observed shortly after the1993/1994 eruptions (Breysacher 1997; Sterken & Breysacher1997). These timescales disclose the presence of a variety ofphysical phenomena in the system. In particular, Koenigsbergeret al. (2010) have argued that the 1993–1994 eruptions may havebeen caused by tidal interactions that became stronger due to agradual increase in the stellar radius, on the ∼40 year timescale.Although the process responsible for the ∼40 year timescale isunknown, it is believed to be the same as that which occurs in SDoradus-type variables.
The three luminous objects comprising the HD 5980 systemare: two emission-line stars in a close 19.3 day binary orbit(Breysacher & Perrier 1980) and a third O-type object (here-after Star C) whose photospheric absorptions remain relativelystationary on the orbital timescale of the binary (Niemela 1988;Koenigsberger et al. 2002). Following the convention introducedby Barba et al. (1996), we label as Star A the star “in front” at
1
The Astronomical Journal, 142:191 (20pp), 2011 December Georgiev et al.
orbital phase φ = 0.00 and Star B the one “in front” at theopposite eclipse, which occurs at φ = 0.36. Star A is the unsta-ble star of the system (Barba et al. 1996), and whose spectraltype has changed from the Wolf–Rayet (WR) subtype WN3 (in1978–1981; Niemela 1988) to WN6 (in 1990; Koenigsbergeret al. 1994) culminating in WN11/B1.5Ia+ during the 1994 erup-tive phase (Drissen et al. 2001; Heydari-Malayeri et al. 1997;Koenigsberger et al. 1998a). Star B is believed to be a WN4 star(Breysacher et al. 1982; Niemela 1988). Further background onHD 5980’s observational characteristics may be found in Barbaet al. (1996, 1997), Moffat et al. (1998), Koenigsberger (2004),and Foellmi et al. (2008).
Although its triple nature implies having to deal with the prob-lem of disentangling the spectra of three stars and the possiblecontribution from a wind–wind interaction region to arrive atthe eruptor’s properties, HD 5980 provides considerable advan-tages for studying the underlying instability: (1) its distance andmasses can be relatively well constrained; (2) it is un-obscuredby dust; (3) it has been widely studied spectroscopically at X-ray,UV, and optical wavelengths; and (4) it was well observed dur-ing the stages prior to the 1993–1994 eruptions and intenselyobserved thereafter. In this paper we focus on determining theepoch-dependent properties of Star A. Section 2 is devoted toa description of the observational data; in Section 3 we em-pirically disentangle the wind velocities of the three stars inthe system; the existence of correlations between visual magni-tude, UV brightness, emission-line strength, and wind speed areshown to exist in Section 4. Section 5 contains the description ofthe model atmosphere fits to the spectra; the results are discussedin Section 6 and the conclusions presented in Section 7.
2. OBSERVATIONAL MATERIAL
Ultraviolet spectroscopy (λλ1190–2000) of HD 5980 isavailable from the International Ultraviolet Explorer (IUE)at low and high resolutions in 1979, 1981, 1989, 1991, and1994–1995, and at low resolution in 1978 and 1986. The prop-erties of these spectra were analyzed by Moffat et al. (1998) andKoenigsberger et al. (1994, 1995, 1996, 1998a, 1998b), and anoverview of the derived results may be found by Koenigsberger(2004). Further UV observations at high resolution were ob-tained using the HST/Space Telescope Imaging Spectrograph(STIS) in 1999, 2000, 2002, and 2009. The properties of thesespectra are described by Koenigsberger et al. (2000, 2001, 2010).Tables 1 and 2 list in the first three columns the identifyingnumber for each spectrum, the date of acquisition and the corre-sponding orbital phase computed with the Sterken & Breysacher(1997) initial epoch and orbital period. For many of the IUEspectra of HD 5980 a visual magnitude mv could be derived(Koenigsberger et al. 1994) from the Fine Error Sensor (FES)counts through the FES-mv calibrations (Perez 1992). These arelisted in Column 4 of Tables 1 and 2. The FES magnitudes havea formal error of 0.07 mag.
The IUE spectra analyzed in this paper were retrievedfrom the Multimission Archive at STScI (MAST) database,which contains spectra that have been reprocessed with theFinal Calibration. We find that the difference between the fluxmeasurements made on these spectra and on the original dataproducts are <5% for spectra obtained prior to 1992, but thisdifference increases significantly thereafter, in some cases beingas high as 15%.9
9 As described by Nichols & Linsky (1996), there were systematicwavelength-dependent discrepancies of up to 20% of the absolute fluxcalibration in some of the IUE spectra processed with previous software.
Velocities of spectral features were measured using consistentcriteria for all data sets. Columns 5 and 6 of Table 1 list thevelocities of selected features that will be described in the nextsection. We find that the uncertainty in the speeds measured forthe P Cygni absorption components is generally ∼100 km s−1,which we adopt throughout this paper unless otherwise noted.The sources of uncertainty include the small signal-to-noise ratio(S/N) of IUE spectra, the contamination by lines arising fromother atomic transitions, and the definition of the continuumlevel. In general, the new velocity measurements coincide well,within the uncertainties, with those published previously.
The continuum flux at λ1850 Å was measured on allUV spectra and is listed in Columns 9 and 7 of Tables 1and 2, respectively. The λ1850 Å spectral region was chosento characterize the UV continuum level because it is relativelyline-free in most of the HD 5980 spectra. The integrated fluxof the N iv] 1486 Å and N iii 1750 Å blend was measured andthe values are listed in Columns 7 and 8 of Table 1 and 5and 6 of Table 2. Both lines are clearly associated with the ac-tive state of Star A. N iv] 1486 Å was first seen in 1986, beingabsent or very weak previously. The N iii 1750 Å emission wasfirst seen during the declining phase of the 1994 eruption.10 Itappeared as a single emission line in low-resolution spectra butwas composed of N iii 2s22p–2s2p2 and N iii 2s2p2–2p3 mul-tiplets. The flux contained in the N iv] 1486 Å and N iii emissionlines was measured on the low dispersion spectra by fitting oneor more Gaussian functions. On high dispersion spectra, the fluxwas obtained through direct integration over the emission fea-ture. The largest source of uncertainty resides in the choice ofthe continuum level which is frequently difficult to define due tolarge number of variable emission lines and, on high-resolutionIUE spectra, the low S/N.
The formal uncertainties in the flux calibrations of IUE andSTIS data are, respectively, ∼6% (Colina et al. 1996) and 1%(Maız-Apellaniz & Bohlin 2005). In general, the flux levelsmeasured in high- and low-resolution IUE spectra differ by nomore than the quoted uncertainty. However, in the subset ofobservations obtained in 1994, the high-resolution data displaysignificantly weaker flux levels than the contemporaneous low-resolution spectra. This situation might be due to trackingproblems during the long exposures. Also, the FES counts arenot available during this time period.11 Hence, for the analysisdescribed in the following sections, we measured the continuumflux only on low-resolution IUE data for the 1994 epoch.
An optical spectrum was obtained on 2009 November 7,at phase 0.038 using the Magellan Echellette (MagE) on theClay 6.5 m (Magellan-II) telescope on Las Campanas. Weused the 1′′ slit providing a spectral resolution of 1 Å. Thir-teen echelle orders were extracted covering the wavelength re-gion from 3130 A to 9400 Å. The S/N ranges from 100 to200 for a single 150 s exposure. The usual ThAr comparisonlamp was used for wavelength calibration. The data were re-duced using the special set of IRAF routines available for thereduction of Magellan Inamori Kyosera Echelle (MIKE) spec-tra (mtools package; http://www.lco.cl/telescopes-information/magellan/instruments/mike/iraf-tools). Spectra of the standardsFeige 110 and NGC 7293 central star observed during the samenight were used to derive a sensitivity function. The individual
10 There are unfortunately no UV spectra obtained earlier during this event.11 No report of FES malfunction was found in the IUE Operations Summary,although a change in the Gyro 5 drift rate is reported to have occurred in 1994October as well as the appearance of the Data Multiplexer Unit (DMU)anomaly; see http://wise-iue.tau.ac.il/ines/docs/p05.pdf.
2

The Astronomical Journal, 142:191 (20pp), 2011 December Georgiev et al.
Table 1High Dispersion Spectra
Spectrum HJDa Phase FES Mag He iiedgeb N vsat
c F(N iv])d F(N iii)d F(1850 Å)e
4277 43921.1 0.57 11.68 −2770 −2800 <1. 1.0 1.474345 43928.6 0.91 11.69 −2620 −2760 <1. <1 1.534958 43981.0 0.68 11.72 −2800 −2050 <1. <1 1.43
. . . . . . . . . . . . −2790 . . . . . . . . .
11175 44632.3 0.48 11.61 −2920 −2610 2.8 2.7 1.5811190 44634.6 0.60 11.63 −2920 −2540 <1.3 <1 1.6415072 44869.5 0.80 11.62 −2740 −2450 1.9: <1 1.6115080 44870.5 0.85 11.57 −2730 −2130 0.7: 1.5 1.28
. . . . . . . . . . . . −2650 . . . . . . . . .
37759 47867.2 0.39 11.36 −2520 −2210 11.2 1. 1.59. . . . . . . . . −2080f . . . . . . . . . . . .
37768 47868.2 0.44 11.27 −2550 −2050 10.7 <1 1.62. . . . . . . . . −1890f . . . . . . . . . . . .
37781 47870.2 0.55 11.27 −2040 −1750 11.7 <1 1.8637788 47871.4 0.61 11.25 −2000 −1950 14.3 0.2 1.8542446 48511.5 0.83 11.41 −1900 −1980 12.5 <1 1.8642470 48515.6 0.05 11.35 −1700 −1800 16.9 <1 1.8242694 48541.4 0.39 11.55 −2650 −2450 13.2 1. 1.7342702 48542.4 0.44 11.50 −2480 −2340 11.1 2. 1.8642711 48543.4 0.49 11.27 −2480 −2210 14.5 1.4 1.9342721 48544.4 0.54 11.33 −2450 −2180g 17.8 <1 1.9552888 49680.5 0.51 11.37 −420 . . . 7.4 18.8 3.3253036h 49697.5 0.39 . . . −370 . . . 14.0: 39.1: 1.96::53129h 49706.5 0.86 . . . −470 . . . 6.9: 34.6: 1.75::53216h 49716.5 0.38 . . . −370 −1680 23.9 57.0 2.55:53226h 49717.5 0.43 11.12i −370 −1730 21.9 58.1 2.55:54064 49784.1 0.89 . . . −1100 −2010 38.8 39.3 2.5054490 49831.0 0.32 11.96 −800f . . . 43.6 35.9 2.65
. . . . . . . . . −1900 −1660 . . . . . . . . .
54671 49851.0 0.36 11.98 −810f −950: 49.0 35.7 2.49. . . . . . . . . −2000 −1900 . . . . . . . . .
54727 49859.9 0.82 11.96 −1100f −900 37.0 31.6 2.81. . . . . . . . . −2400 −2300 . . . . . . . . .
55315 49916.8 0.78 11.27 −1100f −800: 35.9 20.1 2.55. . . . . . . . . −2530 −2150 . . . . . . . . .
55380 49928.8 0.40 11.34 −900f −1130 38.2 19.2 2.36. . . . . . . . . −2230 −2400 . . . . . . . . .
55394 49930.8 0.507 11.22 −900f −900: 38.6 18.6 2.38. . . . . . . . . −2380 −2180 . . . . . . . . .
55932 49975.6 0.83 11.22 −1200f −1000 31.9 14.7 2.43. . . . . . . . . −2620 −2400: . . . . . . . . .
55955 49978.7 0.99 11.37 −1200f −880: 31.9 14.4 1.98. . . . . . . . . −2530 −2330 . . . . . . . . .
56017 49986.6 0.40 11.31 −2670 −2560 37.4 14.4 2.1556188 50033.5 0.83 . . . −1400 −1850 29.0 10.6 2.2956205 50036.4 0.99 . . . −1500 −1000: 31.9 8.2 1.76
. . . . . . . . . . . . −2160 . . . . . . . . .
56223 50045.2 0.43 . . . −2530 −2500 30.7 7.1 2.151070 51304.8 0.83 . . . −1770: −1600 24.9 0.8 2.08
. . . . . . . . . . . . −2050 . . . . . . . . .
3070 51308.9 0.05 . . . −1380 −1570 25.0 0.4 1.684070 51310.8 0.15 . . . −1350 −1670f 25.0 0.6 2.155070 51314.9 0.36 . . . −2500 −1630 23.6 0.5 1.67
. . . . . . . . . . . . −2130j . . . . . . . . .
6070 51315.8 0.40 . . . −2140 −1650 26.4 0.2 1.85. . . . . . . . . . . . −2140 . . . . . . . . .
2070 51655.1 0.00 . . . −1500 −1830f 17.9 0.9 1.687070 52386.6 0.99 k −1860 −2100 12.2 . . . . . .
8070 55083.9 0.99 11.6l −2260 −2460 7.0 <0.2 1.50. . . . . . . . . −2610 . . . . . . . . . . . .
Notes.a Heliocentric Julian Date −2400000.b Location where P Cyg absorption intersects the continuum level in km s−1. Corrected for an adopted SMC systemic velocity of +150 km s−1.c Maximum extent of the plateau (“flat” region) of P Cyg absorption in km s−1; two values in this column indicate the presence of a second plateau at adifferent intensity level. Corrected for an adopted SMC systemic velocity of +150 km s−1.d Integrated un-dereddened absolute flux in units of 10−12 erg cm−2 s−1.e Un-dereddened absolute flux in units of 10−12 erg cm−2 s−1 Å−1.f Maximum extent of “plateau.”g The absorption is not flat, but contains considerable structure.h Flux calibration problem.i Visual magnitude from Koenigsberger et al. 1998b.j Speed of what may be interpreted as a short plateau; absorption continues to rise gradually out −3100 km s−1.k Visual magnitude of 11.3 for this same epoch but out of eclipse was provided by S. Dufau & M. T. Ruiz (2002, private communication).l All Sky Automated Survey (ASAS; Pojmanski 2002) value obtained ∼3 hr earlier.
3

The Astronomical Journal, 142:191 (20pp), 2011 December Georgiev et al.
Table 2Low-resolution IUE Spectra
SWP HJDa Phase FES Mag F(N iv])b F(N iii)b F(1850 Å)c
1598 43650.5 0.53 11.72 1.8 6.52 1.6114112 44754.4 0.82 11.61 1.8 2.8 1.7314135 44756.2 0.92 11.63 5.1 0.7 1.6714166 44758.8 0.05 11.56 4.6 1.6 1.6829633 46743.7 0.07 11.42 5.3 0 1.6929673 46748.9 0.34 11.59 8.9 2 1.3529674 46748.9 0.35 11.57 7.9 2 1.3929681 46749.7 0.39 11.49 6.1 2 1.5229690 46750.8 0.45 11.44 14.7 2 1.6829693 46750.9 0.45 11.45 8.2 2 1.7529699 46751.8 0.51 11.41 8.2 0 1.7629702 46751.9 0.51 11.39 5.0 1 1.7529705 46752.7 0.54 11.41 7.7 2 1.7729708 46752.8 0.55 11.39 5.3 1.5 1.7629736 46757.9 0.81 11.37 5.9 2 1.6729743 46758.7 0.85 11.40 7.3 2 1.6937760 47867.5 0.39 11.30 11.7 2.0 1.8137769 47868.5 0.44 11.25 12.8 1 1.8937782 47870.5 0.56 11.22 14.0 1 1.9337789 47871.5 0.61 11.20 14.3 1 1.9637790 47871.5 0.61 11.37 18.6 3 1.9142445 48511.5 0.83 11.26 18.7 0.9 1.9942469 48515.5 0.04 11.43 16.9 0.5 1.8242693 48541.4 0.38 12.00 12.9 1 1.7342701 48542.4 0.44 11.39 13.7 2 1.9842703 48542.7 0.45 11.49 17.2 0.4 2.0142710 48543.4 0.49 11.27 18.3 2.8 2.0642720 48544.4 0.54 11.26 14.0 1. 2.0442722 48544.7 0.55 11.33 16.1 1.7 2.0952824 49674.9 0.22 10.11 4.0 26.5 3.5052889 49680.6 0.52 10.19 1. 27.2 3.5052922 49684.8 0.73 10.10 4 33.6 3.1052956 49688.6 0.93 10.22 0.8 29.3 3.0552967 49689.7 0.99 . . . 10.8 37.4 3.1752975 49690.7 0.04 . . . 12.1 38.3 3.0852992 49692.7 0.14 10.54 12.0 41.8 2.7453035 49697.2 0.38 . . . 23.1 42.6 2.6553037 49697.6 0.40 . . . 15.4 44.1 2.6053061 49702.6 0.66 . . . 17.1 52.3 2.6553128 49706.3 0.85 . . . 18.6 45.0 2.7253164 49709.9 0.03 . . . 18.1 45.8 2.6553186 49712.6 0.18 . . . 30.7 51.5 2.8053187 49712.7 0.18 . . . 31.1 53.3 2.8453218 49716.6 0.39 . . . 34.6 56.2 2.9053230 49717.8 0.44 . . . 36.5 59.8 3.1254485 49830.3 0.28 . . . 45.8 37.1 2.8954486 49830.5 0.29 . . . 40.2 37.7 2.9454491 49831.2 0.33 . . . 43.9 38.2 2.6554533 49836.3 0.59 . . . 39.8 38.3 3.2454534 49836.3 0.59 . . . 43.3 42.7 3.3054535 49836.3 0.59 . . . 43.4 41.9 3.2354664 49850.3 0.32 . . . 41.9 38.6 2.6254665 49850.4 0.33 . . . 42.1 38.1 2.6854666 49850.4 0.33 . . . 46.4 36.1 2.7054670 49850.8 0.35 . . . 47.4 39.5 2.6154708 49857.4 0.69 . . . 44.0 37.8 2.8554709 49857.4 0.69 . . . 40.4 37.2 2.9354728 49860.1 0.83 . . . 45.5 30.1 2.9354758 49864.1 0.04 . . . 37.7 34.0 2.5354759 49864.2 0.04 . . . 35.1 34.4 2.3754760 49864.2 0.04 . . . 32.6 37.8 2.2655111 49894.1 0.59 10.94 41.6 27.0 2.6055112 49894.1 0.60 10.21 45.3 29.5 2.6555314 49916.7 0.77 11.27 39.3 20.4 2.6955340 49921.0 0.99 . . . 41.2 23.8 2.3355381 49928.9 0.40 11.30 42.0 20.9 2.38
Table 2(Continued)
SWP HJDa Phase FES Mag F(N iv])b F(N iii)b F(1850 Å)c
55382 49928.9 0.51 . . . 40.2 21.6 2.4855382 49928.9 0.51 . . . 40.2 21.6 2.4855395 49930.9 0.51 11.19 42.5 24.1 2.6055396 49930.9 0.51 11.25 40.3 22.1 2.5555461 49939.9 0.97 11.33 43.7 24.2 2.1755462 49939.9 0.98 . . . 39.0 18.3 2.1355931 49975.5 0.82 . . . 45.5 13.0 2.4855933 49975.8 0.84 . . . 40.4 15.3 2.4055954 49978.8 0.99 . . . 41.9 19.0 1.9655956 49978.8 0.99 . . . 36.8 14.9 2.1455957 49978.8 0.00 . . . 37.1 14.6 2.0755958 49978.9 0.00 . . . 35.5 18.6 2.0855976 49981.8 0.15 . . . 33.0 15.8 2.4055977 49981.9 0.15 . . . 39.2 18.1 2.4856005 49985.0 0.32 . . . 42.7 17.3 2.0356006 49985.1 0.33 . . . 40.0 13.9 2.2056013 49985.9 0.36 . . . 37.2 16.3 2.1756014 49985.9 0.36 . . . 36.7 13.0 2.0856015 49985.9 0.36 . . . 32.0 13.2 2.1356018 49986.7 0.40 . . . 42.2 15.3 2.3456033 49990.8 0.62 . . . 38.7 15.3 2.4856034 49990.9 0.62 . . . 31.7 14.3 2.47
Notes.a Heliocentric Julian Date −2400000.b Integrated un-dereddened absolute flux in units of 10−12 erg cm−2 s−1.c Un-dereddened absolute flux in units of 10−12 erg cm−2 s−1 Å−1.
flux calibrated echelle orders were then normalized and mergedin the final spectrum.
For the modeling discussed below, four representative spectracorresponding to different observation epochs were constructedas follows.
Spectrum 1994. The low-resolution IUE spectra SWP 53218and LWP 29794 were combined with the optical spectrumobtained on the same date, 1994 December 30, at CTIO anddescribed in Koenigsberger et al. (1998b). This combinedspectrum covers the wavelength region from 1190 Å to 6900 Å.The orbital phase is 0.39, and this is the only spectrum notobtained at primary eclipse (φ = 0) that we analyze. Duringthis epoch, the spectrum of Star A was dominant and, as inKoenigsberger et al. (1998b), the contribution from Star B isneglected.
Spectrum 2000. The HST/STIS spectrum obtained on 2000April 20 at phase 0.00. This spectrum covers the spectral range1150–10800 Å.
Spectrum 2002. The HST/STIS observation of 2002 April 4,obtained at phase 0.99 was combined with the Far-UltravioletSpectroscopic Explorer (FUSE) spectrum P2230101 taken on2002 July 27 at phase 0.00. The systematic long-term varia-tions in HD 5980 were relatively small between 2002 and 2009,justifying that we combine these two spectra obtained∼3 months apart.
Spectrum 2009. The HST/STIS spectrum secured on 2009September 9 at φ = 0.99 was combined with the Magellan-IIoptical spectrum obtained on 2009 November 7 at phase 0.04.As in the previous case, the long-term variability is not expectedto be significant. Of greater concern is the fact that the opticalspectrum was obtained 0.05 in phase later than the UV spectrum.At φ = 0.04 the eclipse of Star B’s continuum-emitting regionis partial (see light curve in Foellmi et al. 2008).
4
The Astronomical Journal, 142:191 (20pp), 2011 December Georgiev et al.
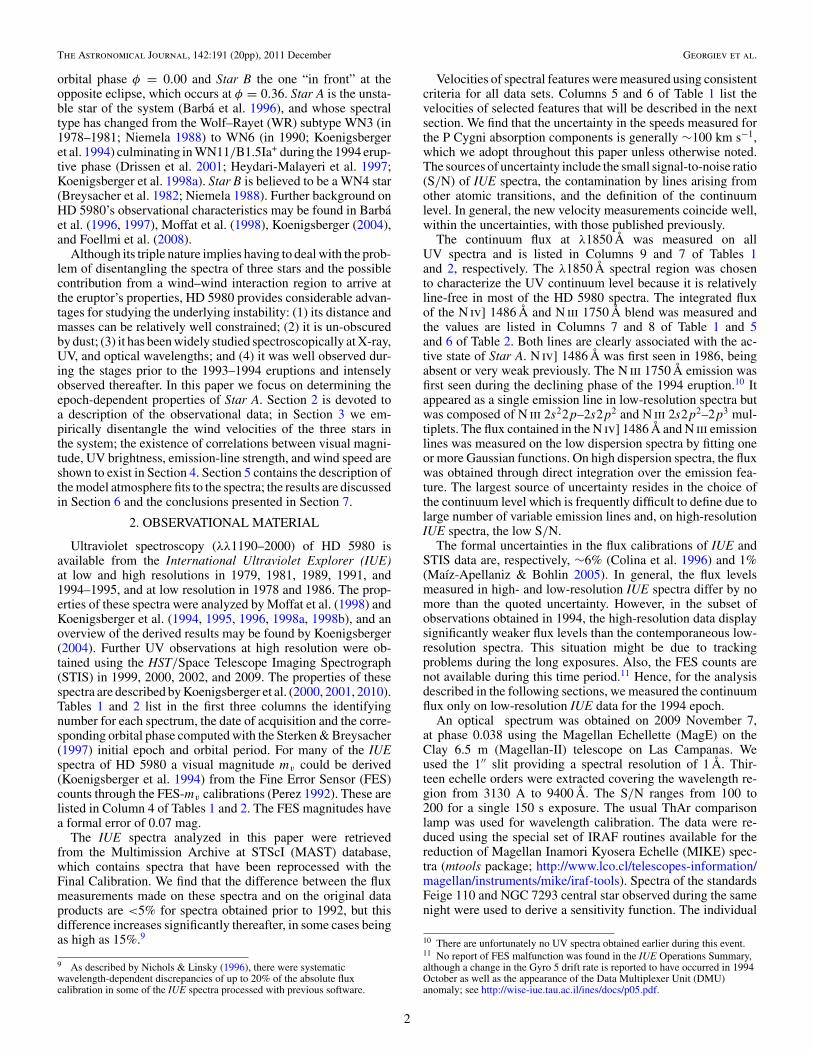
Figure 1. C iv 1548–1550 P Cygni doublet observed in 2009 (left) and 2002 (right) on a velocity scale centered on the 1548 Å laboratory wavelength corrected for theSMC motion (+150 km s−1).
(A color version of this figure is available in the online journal.)
3. DISENTANGLING THE WIND VELOCITIES
The terminal wind speed V∞ is generally derived from thesaturated portion of the P Cygni absorption component, i.e.,where the intensity reaches zero level, generally referred toas Vblack (Prinja et al. 1990). In the case of a binary system,the maximum extent of the saturated profile corresponds to thespeed of the slower wind in the system. The faster wind also has aVblack, but the minimum intensity level lies at the continuum levelof the star whose wind is slower. Thus, as shown in Georgiev& Koenigsberger (2004), the absorption profile presents a step-like appearance. We will refer to the second Vblack as Vplateau.For single WR stars, it is generally found that for saturatedlines Vblack ∼ 0.70 Vedge (Prinja et al. 1990; Eenens & Williams1994), where Vedge is the location where the P Cygni absorptionmeets the continuum level. The observation that Vedge > Vblackis generally attributed to an unspecified type of “turbulence” orto non-monotonicity in the wind. In the case of optically thinlines, the P Cygni absorptions do not reach the zero flux level.In this case, Vedge provides information on the maximum windspeed attained within the particular line-forming region.
Interpreting the P Cygni absorption components in HD 5980is difficult because 3 massive and hot stars contribute to itsspectrum. Koenigsberger et al. (1998a) adopted the purelyempirical approach of measuring Vblack and Vedge in the IUEspectra obtained over the years 1979–1995. They found apersistent component at Vblack ∼ −1740 km s−1 indicating thepresence of a stable wind with this speed and showed that thewind speed of Star A had undergone changes from <500 km s−1
to ∼1600 km s−1 during and after the 1994 eruption. However,although they suspected that Star A’s wind speed had been ashigh as ∼3000 km s−1 in 1979, disentangling its contribution tothe P Cygni absorptions from that of the other two stars provedvery challenging.
The more recent data have now clarified the picture, partlybecause of its greatly improved quality and partly because it hasbeen possible to obtain UV observations during the orbital phaseφ = 0.0, when Star A occults Star B. The size of the eclipsingdisk of Star A is a factor of 1.5 larger than Star B at minimumbrightness (Perrier et al. 2009) and significantly larger during itsmore active state. It is therefore valid to assume that at orbitalphases φ ∼ 0.0 Star A eclipses Star B’s continuum-forming
disk as well as the P Cyg absorption-forming region of Star B’swind. Thus, the P Cygni absorptions at φ ∼ 0.0 provide thewind speeds of Star A and Star C, without contamination fromStar B.
3.1. Star C: the “Third” Object
Figure 1 is a plot of the C iv 1548/1550 Å doublet observedin the HST/STIS spectra of 2009 (left panel) and 2002 (rightpanel) at orbital phase 0.99. A clear “step” is observed inthe 2009 spectrum, providing two velocity values: Vblack =−1760 km s−1 and Vplateau = −2440 km s−1.12 The “step”is not as pronounced in the spectrum of 2002 (Figure 1, right),but still two velocity values may be measured:Vblack = −1780and Vplateau = −2210 km s−1. Vblack = −1770 ± 10 km s−1
is consistent with the persistent wind velocity measured byKoenigsberger et al. (1998a) for all epochs prior to 1996. Sinceonly two stars are visible at φ = 0.99, it is now clear that thisstable component is formed in Star C. These spectra also giveus the wind speed of Star A in 2002 and 2009, a topic to whichwe shall return in Section 3.3.
3.2. Star B: the Elusive Companion
Of the three distinguishable objects in HD 5980, Star B is themost elusive. From the 19.3 d radial velocity variations and theeclipse light curve, there is no question that Star B is a hot andmassive object. However, given that Star A is such a prominentsource of emission-lines, it is difficult to determine the fractionof the emission-line spectrum that may be attributed to the windof Star B. On the other hand, during the eclipse when Star B is“in front,” the wind region of Star A where the fast portions ofits P Cygni absorption components are formed is occulted. Thiseclipse occurs at φ = 0.36 and can be used to estimate Star B’swind speed.
In 1999, five HST/STIS spectra of HD 5980 were obtainedover a single orbital cycle (Koenigsberger et al. 2000), includinga spectrum at φ = 0.36. The line-profile of C iv 1548–50 Åat this phase is shown in Figure 2 (right) where we observeVblack = −1720 km s−1, associated with Star C as discussed in
12 Note that the separation between these two V∞ values is ∼700 km s−1,significantly greater than the separation between the two C iv doublets(500 km s−1).
5
The Astronomical Journal, 142:191 (20pp), 2011 December Georgiev et al.
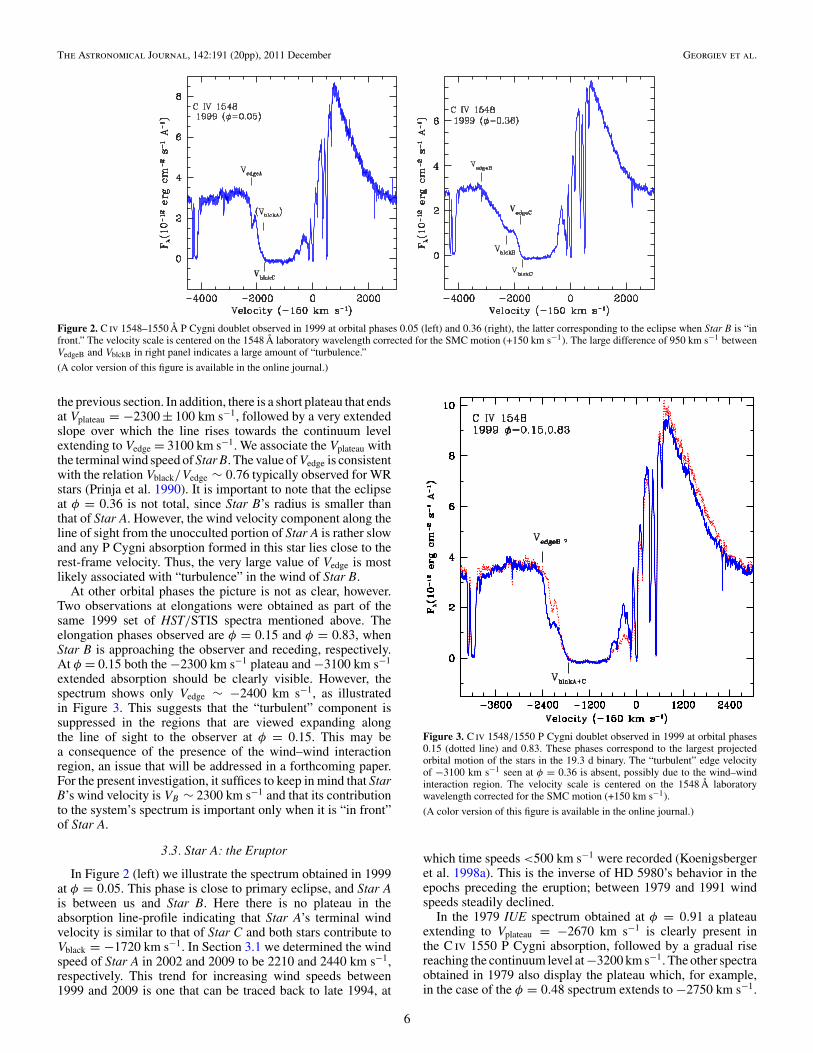
Figure 2. C iv 1548–1550 Å P Cygni doublet observed in 1999 at orbital phases 0.05 (left) and 0.36 (right), the latter corresponding to the eclipse when Star B is “infront.” The velocity scale is centered on the 1548 Å laboratory wavelength corrected for the SMC motion (+150 km s−1). The large difference of 950 km s−1 betweenVedgeB and VblckB in right panel indicates a large amount of “turbulence.”
(A color version of this figure is available in the online journal.)
the previous section. In addition, there is a short plateau that endsat Vplateau = −2300 ± 100 km s−1, followed by a very extendedslope over which the line rises towards the continuum levelextending to Vedge = 3100 km s−1. We associate the Vplateau withthe terminal wind speed of Star B. The value of Vedge is consistentwith the relation Vblack/Vedge ∼ 0.76 typically observed for WRstars (Prinja et al. 1990). It is important to note that the eclipseat φ = 0.36 is not total, since Star B’s radius is smaller thanthat of Star A. However, the wind velocity component along theline of sight from the unocculted portion of Star A is rather slowand any P Cygni absorption formed in this star lies close to therest-frame velocity. Thus, the very large value of Vedge is mostlikely associated with “turbulence” in the wind of Star B.
At other orbital phases the picture is not as clear, however.Two observations at elongations were obtained as part of thesame 1999 set of HST/STIS spectra mentioned above. Theelongation phases observed are φ = 0.15 and φ = 0.83, whenStar B is approaching the observer and receding, respectively.At φ = 0.15 both the −2300 km s−1 plateau and −3100 km s−1
extended absorption should be clearly visible. However, thespectrum shows only Vedge ∼ −2400 km s−1, as illustratedin Figure 3. This suggests that the “turbulent” component issuppressed in the regions that are viewed expanding alongthe line of sight to the observer at φ = 0.15. This may bea consequence of the presence of the wind–wind interactionregion, an issue that will be addressed in a forthcoming paper.For the present investigation, it suffices to keep in mind that StarB’s wind velocity is VB ∼ 2300 km s−1 and that its contributionto the system’s spectrum is important only when it is “in front”of Star A.
3.3. Star A: the Eruptor
In Figure 2 (left) we illustrate the spectrum obtained in 1999at φ = 0.05. This phase is close to primary eclipse, and Star Ais between us and Star B. Here there is no plateau in theabsorption line-profile indicating that Star A’s terminal windvelocity is similar to that of Star C and both stars contribute toVblack = −1720 km s−1. In Section 3.1 we determined the windspeed of Star A in 2002 and 2009 to be 2210 and 2440 km s−1,respectively. This trend for increasing wind speeds between1999 and 2009 is one that can be traced back to late 1994, at
Figure 3. C iv 1548/1550 P Cygni doublet observed in 1999 at orbital phases0.15 (dotted line) and 0.83. These phases correspond to the largest projectedorbital motion of the stars in the 19.3 d binary. The “turbulent” edge velocityof −3100 km s−1 seen at φ = 0.36 is absent, possibly due to the wind–windinteraction region. The velocity scale is centered on the 1548 Å laboratorywavelength corrected for the SMC motion (+150 km s−1).
(A color version of this figure is available in the online journal.)
which time speeds <500 km s−1 were recorded (Koenigsbergeret al. 1998a). This is the inverse of HD 5980’s behavior in theepochs preceding the eruption; between 1979 and 1991 windspeeds steadily declined.
In the 1979 IUE spectrum obtained at φ = 0.91 a plateauextending to Vplateau = −2670 km s−1 is clearly present inthe C iv 1550 P Cygni absorption, followed by a gradual risereaching the continuum level at −3200 km s−1. The other spectraobtained in 1979 also display the plateau which, for example,in the case of the φ = 0.48 spectrum extends to −2750 km s−1.
6

The Astronomical Journal, 142:191 (20pp), 2011 December Georgiev et al.
Table 3Estimated Wind Speeds
Year Vedge (He ii)Star A Star B Star C Star A
1979 −2670a . . . −1760 −25601991 −2000a −2320 −1740 −18701993.7 −1610b . . . . . . . . .
1994.90 −690c . . . . . . . . .
1994.94 −810c . . . . . . . . .
1994.97 −860c . . . . . . . . .
1994.98 −1100c . . . . . . . . .
1995.00 −1300c . . . . . . . . .
1999 −1720a −2300 −1740 −15002000 −2000a . . . −1780 −16802002 −2210a . . . −1780 −21002009 −2440a . . . −1760 −2260
Notes.a From Vblack C iv.b From P v, FUSE, Koenigsberger et al. 2006.c From Al iii, Koenigsberger et al. 1998a.
This is similar to the φ = 0.36 spectrum discussed in Section 3.2.But because none of the 1979–1980 spectra were obtainedduring eclipse, it is not possible a priori to determine whichof the two stars is responsible for the different fast components.However, since the speed determined from spectra obtained inother epochs when Star B eclipses Star A are ∼−2300 km s−1,we are led to conclude that the ∼−2700 km s−1 component in1979 corresponds to the wind of Star A. A similar analysis leadsto the conclusion that by 1991 Star A’s wind velocity decreasedto ∼−2200 km s−1.
The individual contribution from Star A and Star B may alsobe identified in other P Cygni lines such as He ii 1640 andN v 1240, lines to which the contribution from Star C isnegligible. The N v line displays a flat portion, analogous toVblack, but which does not reach the zero intensity level. Itsextent provides the velocity of the slower wind, either that ofStar A or Star B, depending on the epoch. A second plateauprovides the velocity of the faster wind. The measurements ofthese two plateaus are listed in Column 6 of Table 1.
The He ii 1640 line arises from a transition between twoexcited states, and thus, the strength of its P Cygni absorption isweaker than that of the C iv and N v resonance transitions. Here,the simplest measurement to perform is that of Vedge. Becausethere is no “black” portion in the absorption, it is not clear towhat extent “turbulence” contributes to the edge velocity. Inaddition, some of the spectra show a break in the absorptionprofile, similar to the plateau seen in the resonance lines, andwhich may be associated with the second star in the system.The measured values of Vedge and of the plateau (when visible)are listed in Column 5 of Table 1. We find that these values areconsistent with the velocity for Star A derived from C iv andN v. Because the contribution from Star C may be neglected inN v 1240 and He ii 1640, we use these lines for the analysis thatwill be presented in the next section.
The behavior of the three lines is illustrated in Figure 4 for theepochs 2002 and 2009, showing that they all display the windvelocity increase that took place between 2002 and 2009.
A summary of our estimated wind speeds for the three starsat different epochs is given in Table 3. These speeds, as thoseof Table 1, are corrected for the systematic velocity of the SMC(+150 km s−1) but do not include a correction for orbital motion.
Figure 4. Montage of the N v, C iv, and He ii P Cygni profiles in the HST/STISspectra obtained in 2002 (dots) and 2009. Both spectra correspond to the sameorbital phase φ = 0.99. The most striking differences are the strength of theemission line and the extent of the absorption component. Note the “step”-likeshape of the C iv absorption component in 2009 due to the contribution fromStar C (−1760 km s−1) and Star A (−2440 km s−1). Velocity scale is centered onthe laboratory wavelengths of NV1238.821, C iv 1548.187, and He ii 1640.47,with a correction of −150 km s−1 to account for the relative SMC motion.
(A color version of this figure is available in the online journal.)
It is important to note that, except for the 1979–1980 epochs,the He ii 1640 values of Vedge are systematically smaller than thevalues derived from C iv which are listed in Table 3. It is not clearwhether this is caused by the presence of additional emissionlines that “fill in” the absorption near its edge13 or whether thisis a consequence of the excitation structure in the wind.
4. EMPIRICAL CORRELATIONS
We have previously shown (Koenigsberger et al. 2010)that the emitted flux in the UV and optical lines increasedduring the pre-eruption epochs and decreased after ∼1999.Changes in the continuum flux levels have also occurred. Herewe show the existence of two correlations and their corollaries.
Line strength versus wind velocity. A decrease in the windvelocity is accompanied by an increase in the strength of theemission lines, i.e., Flines ∼ V −1
wind. Figure 5 shows the fluxcontained in the N iv] 1468 emission line plotted against theP Cygni absorption-line velocity of He ii 1640 Å and N v1240 Å. Only data from spectra obtained around φ = 0.00 areplotted, so the velocity clearly corresponds to that of Star A.
Continuum intensity versus wind velocity. A decrease in thewind velocity is accompanied by an increase in the strength ofthe continuum in the UV (λ1850 Å) and in the visual range,i.e., Fcontin ∼ V −1
wind. This is illustrated in Figure 6, where theUV continuum flux is plotted against the wind velocity measuredfrom Vedge of He ii 1640 Å.
These two correlations indicate that changes in the windvelocity are accompanied by changes in the continuum forming
13 The numerous absorptions associated with Star A’s active state are absent in1979–1980
7

The Astronomical Journal, 142:191 (20pp), 2011 December Georgiev et al.
Figure 5. Line strength vs. wind velocity correlation. The N iv] 1486 Åemission-line flux plotted against the wind velocity derived from P Cygniabsorption profiles. Only data from spectra obtained around φ = 0.00 areplotted. Squares correspond to Vedge of He ii 1640 Å and triangles correspond tothe saturation portion of N v 1238. Error bars in velocity correspond to estimateduncertainties in each individual measurement while the flux uncertainty isestimated at 10%.
(A color version of this figure is available in the online journal.)
Figure 6. Continuum intensity vs. wind velocity correlation. TheUV continuum flux level, F1850, plotted against the wind velocity derivedfrom Vedge of He ii 1640. Symbols indicate: filled triangles—1979–1981;open squares—1986; open triangles—1989–1991; stars—1994; filledsquares—1995; and pentagons—1999–2009. For 1994, we use values of F1850measured on the low dispersion spectra.
(A color version of this figure is available in the online journal.)
Figure 7. Visual magnitudes derived from the IUE FES counts andthe continuum absolute flux values at 1850 Å. Symbols indicate: filledtriangles—1979–1981; open triangles—1989–1991; stars—1994; filled—1995;Large/small symbols indicate low/high-resolution spectra. The increasing trendin both wavelength regions suggests an increase in bolometric brightness.
(A color version of this figure is available in the online journal.)
region as well as in the more extended line-forming regions. Thatis, the entire wind structure is affected. It is also important to notethat the UV and the visual continuum levels increase or decreasetogether, as illustrated in Figure 7. Hence, the phenomenon is notsimply due to a redistribution in wavelength of the continuumenergy.
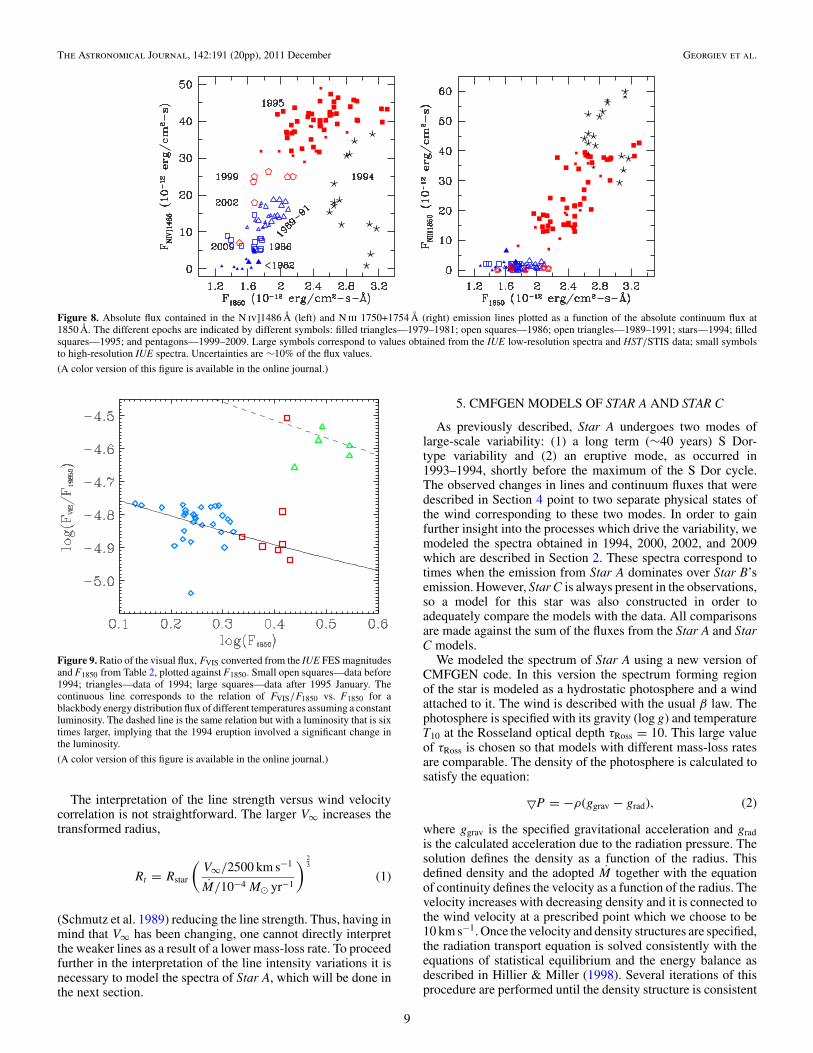
A corollary of the above relations is that the continuumbrightness and emission line strengths increase or decreasetogether; Fcont ∼ Flines. This is illustrated in Figure 8, where thestrengths of N iv] 1486 and N iii 1750 are plotted against the fluxin the continuum at 1850 Å. The different epochs of observationlie in different locations within this diagram. These resultssuggest that the physical phenomenon causing the changes inStar A involves an overall increase or decrease in the energy thatis emitted, i.e., bolometric luminosity variations.
Let us momentarily assume that Star A’s continuum emitsas a blackbody. The ratio Fvis/F1850 = 10−0.4∗m(FES)/F1850at constant luminosity is an almost linear function of theflux at 1850 Å with Fvis/F1850 decreasing with the increasingtemperature (continuous line in Figure 9). The observed pointsin Figure 9 are clearly separated in two groups. The pointsbefore the eruption and after 1995 lie along a curve similar tothe one described by the blackbody, while the points obtainedduring the eruption are displaced from this correlation. Thetemperature decreased during the eruption but contrary to whatmight be expected, the absolute flux at 1850 Å increased, as seenin the observed Fvis/F1850 correlation. To account for this, theluminosity must have increased by a factor of ∼6 (dashed linein Figure 9). This leads to the conclusion that the 1994 eruptioninvolved a luminosity increase, a conclusion that is strengthenedby the results of the CMFGEN modeling described in the nextsections. The dispersion of the points around the blackbodycurve during the other epochs points to some further changes inthe luminosity although at a much smaller scale.
8
The Astronomical Journal, 142:191 (20pp), 2011 December Georgiev et al.
Figure 8. Absolute flux contained in the N iv]1486 Å (left) and N iii 1750+1754 Å (right) emission lines plotted as a function of the absolute continuum flux at1850 Å. The different epochs are indicated by different symbols: filled triangles—1979–1981; open squares—1986; open triangles—1989–1991; stars—1994; filledsquares—1995; and pentagons—1999–2009. Large symbols correspond to values obtained from the IUE low-resolution spectra and HST/STIS data; small symbolsto high-resolution IUE spectra. Uncertainties are ∼10% of the flux values.
(A color version of this figure is available in the online journal.)
Figure 9. Ratio of the visual flux, FVIS converted from the IUE FES magnitudesand F1850 from Table 2, plotted against F1850. Small open squares—data before1994; triangles—data of 1994; large squares—data after 1995 January. Thecontinuous line corresponds to the relation of FVIS/F1850 vs. F1850 for ablackbody energy distribution flux of different temperatures assuming a constantluminosity. The dashed line is the same relation but with a luminosity that is sixtimes larger, implying that the 1994 eruption involved a significant change inthe luminosity.
(A color version of this figure is available in the online journal.)
The interpretation of the line strength versus wind velocitycorrelation is not straightforward. The larger V∞ increases thetransformed radius,
Rt = Rstar
(V∞/2500 km s−1
M/10−4 M� yr−1
) 23
(1)
(Schmutz et al. 1989) reducing the line strength. Thus, having inmind that V∞ has been changing, one cannot directly interpretthe weaker lines as a result of a lower mass-loss rate. To proceedfurther in the interpretation of the line intensity variations it isnecessary to model the spectra of Star A, which will be done inthe next section.
5. CMFGEN MODELS OF STAR A AND STAR C
As previously described, Star A undergoes two modes oflarge-scale variability: (1) a long term (∼40 years) S Dor-type variability and (2) an eruptive mode, as occurred in1993–1994, shortly before the maximum of the S Dor cycle.The observed changes in lines and continuum fluxes that weredescribed in Section 4 point to two separate physical states ofthe wind corresponding to these two modes. In order to gainfurther insight into the processes which drive the variability, wemodeled the spectra obtained in 1994, 2000, 2002, and 2009which are described in Section 2. These spectra correspond totimes when the emission from Star A dominates over Star B’semission. However, Star C is always present in the observations,so a model for this star was also constructed in order toadequately compare the models with the data. All comparisonsare made against the sum of the fluxes from the Star A and StarC models.
We modeled the spectrum of Star A using a new version ofCMFGEN code. In this version the spectrum forming regionof the star is modeled as a hydrostatic photosphere and a windattached to it. The wind is described with the usual β law. Thephotosphere is specified with its gravity (log g) and temperatureT10 at the Rosseland optical depth τRoss = 10. This large valueof τRoss is chosen so that models with different mass-loss ratesare comparable. The density of the photosphere is calculated tosatisfy the equation:
�P = −ρ(ggrav − grad), (2)
where ggrav is the specified gravitational acceleration and gradis the calculated acceleration due to the radiation pressure. Thesolution defines the density as a function of the radius. Thisdefined density and the adopted M together with the equationof continuity defines the velocity as a function of the radius. Thevelocity increases with decreasing density and it is connected tothe wind velocity at a prescribed point which we choose to be10 km s−1. Once the velocity and density structures are specified,the radiation transport equation is solved consistently with theequations of statistical equilibrium and the energy balance asdescribed in Hillier & Miller (1998). Several iterations of thisprocedure are performed until the density structure is consistent
9
The Astronomical Journal, 142:191 (20pp), 2011 December Georgiev et al.
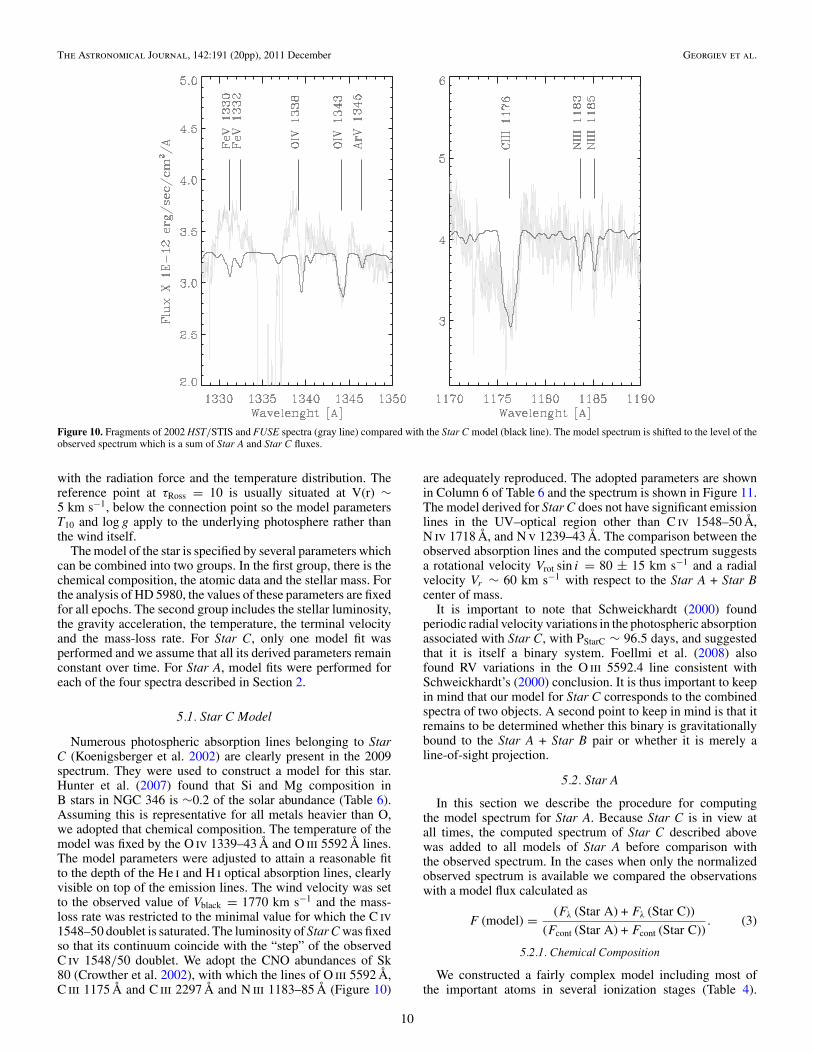
Figure 10. Fragments of 2002 HST/STIS and FUSE spectra (gray line) compared with the Star C model (black line). The model spectrum is shifted to the level of theobserved spectrum which is a sum of Star A and Star C fluxes.
with the radiation force and the temperature distribution. Thereference point at τRoss = 10 is usually situated at V(r) ∼5 km s−1, below the connection point so the model parametersT10 and log g apply to the underlying photosphere rather thanthe wind itself.
The model of the star is specified by several parameters whichcan be combined into two groups. In the first group, there is thechemical composition, the atomic data and the stellar mass. Forthe analysis of HD 5980, the values of these parameters are fixedfor all epochs. The second group includes the stellar luminosity,the gravity acceleration, the temperature, the terminal velocityand the mass-loss rate. For Star C, only one model fit wasperformed and we assume that all its derived parameters remainconstant over time. For Star A, model fits were performed foreach of the four spectra described in Section 2.
5.1. Star C Model
Numerous photospheric absorption lines belonging to StarC (Koenigsberger et al. 2002) are clearly present in the 2009spectrum. They were used to construct a model for this star.Hunter et al. (2007) found that Si and Mg composition inB stars in NGC 346 is ∼0.2 of the solar abundance (Table 6).Assuming this is representative for all metals heavier than O,we adopted that chemical composition. The temperature of themodel was fixed by the O iv 1339–43 Å and O iii 5592 Å lines.The model parameters were adjusted to attain a reasonable fitto the depth of the He i and H i optical absorption lines, clearlyvisible on top of the emission lines. The wind velocity was setto the observed value of Vblack = 1770 km s−1 and the mass-loss rate was restricted to the minimal value for which the C iv1548–50 doublet is saturated. The luminosity of Star C was fixedso that its continuum coincide with the “step” of the observedC iv 1548/50 doublet. We adopt the CNO abundances of Sk80 (Crowther et al. 2002), with which the lines of O iii 5592 Å,C iii 1175 Å and C iii 2297 Å and N iii 1183–85 Å (Figure 10)
are adequately reproduced. The adopted parameters are shownin Column 6 of Table 6 and the spectrum is shown in Figure 11.The model derived for Star C does not have significant emissionlines in the UV–optical region other than C iv 1548–50 Å,N iv 1718 Å, and N v 1239–43 Å. The comparison between theobserved absorption lines and the computed spectrum suggestsa rotational velocity Vrot sin i = 80 ± 15 km s−1 and a radialvelocity Vr ∼ 60 km s−1 with respect to the Star A + Star Bcenter of mass.
It is important to note that Schweickhardt (2000) foundperiodic radial velocity variations in the photospheric absorptionassociated with Star C, with PStarC ∼ 96.5 days, and suggestedthat it is itself a binary system. Foellmi et al. (2008) alsofound RV variations in the O iii 5592.4 line consistent withSchweickhardt’s (2000) conclusion. It is thus important to keepin mind that our model for Star C corresponds to the combinedspectra of two objects. A second point to keep in mind is that itremains to be determined whether this binary is gravitationallybound to the Star A + Star B pair or whether it is merely aline-of-sight projection.
5.2. Star A
In this section we describe the procedure for computingthe model spectrum for Star A. Because Star C is in view atall times, the computed spectrum of Star C described abovewas added to all models of Star A before comparison withthe observed spectrum. In the cases when only the normalizedobserved spectrum is available we compared the observationswith a model flux calculated as
F (model) = (Fλ (Star A) + Fλ (Star C))
(Fcont (Star A) + Fcont (Star C)). (3)
5.2.1. Chemical Composition
We constructed a fairly complex model including most ofthe important atoms in several ionization stages (Table 4).
10

The Astronomical Journal, 142:191 (20pp), 2011 December Georgiev et al.
Figure 11. Comparison between the HST/STIS spectrum obtained in 2009 September (black) and the sum of the current best model for Star A at this epoch andStar C model. The red line represents the computed spectrum of Star C alone. Note the coincidence of the Star C’s continuum and the step in the blue wind of theC iv 1548/50 Å P Cyg absorption.
Table 4Ions and Number of Levels Treated in the Model
Elements I II III IV V VI VII VIII IX
H 20/30He 27/39 13/30C 40/92 51/84 59/64N 45/85 41/82 44/76 41/49O 54/123 88/170 38/78 32/56 25/31Ne 42/242 40/182 53/355 37/166 36/202Al 21/65Si 20/34 22/33P 36/178 12/62S 13/28 51/142 31/98 28/58Cl 40/129 26/80 18/44 17/28Ar 10/36 31/105 38/99Ca 43/378 73/613 47/108 48/288 45/296 39/162Cr 30/145 29/234 30/223 30/215Mn 39/464 16/80 23/181 20/203Fe 104/1433 100/1000 139/1000 44/433 29/153Ni 115/1000 152/1000 62/1000 37/308 34/325 34/363
11

The Astronomical Journal, 142:191 (20pp), 2011 December Georgiev et al.
The main properties of the wind were obtained for each epoch.If the observed spectrum at one epoch required an adjustmentof the chemical composition, the change was made in all fourepochs and the models were recalculated and the consistencychecked.
The He composition was determined by the decrement of theH i and H i+He ii optical lines. We fitted the lines in the spectrumobtained in 1994 and found that N(He)/N(H) = 1.0 ± 0.2 bynumber. This value was fixed for all four spectra. Due to thesignificant abundance of He, the mean atomic mass of the gasis larger than the Solar. In order to be able compare Star Awith other objects having different He/H ratios we present thecomposition of all other elements by their mass fractions.
The carbon abundance was constrained mainly by C iv5804/12 Å and C iii 1178 Å as observed in the 2002 FUSEspectrum. The strong C iv 1548–50 doublet is not sensitive tothe abundance. The N iv 7123 Å line was used as a nitrogenabundance indicator, and consistency was checked using theUV N iii, N iv, and N v lines. Several iterations on all models atall epochs were made until a consistent abundance of nitrogenwas obtained.
We do not observe any strong oxygen lines in the spectrum.The O iv 1338–41 Å observed in STIS spectra are formed inStar C’s wind. The weakness of these lines in Star A’s spectrumsets an upper limit to the O composition to 0.1 of the SMC value(1/50 of the solar composition). The phosphorus abundance wasset to 0.05 solar. The predicted P v 1118–28 Å lines based onthis value agree with the 2002 observations. S v 1502 Å linewas fit with a sulfur abundance equal to 0.05 solar. The sameabundance fits reasonably well S vi 933 Å as well. Aluminumabundance of 0.1 solar fits Al iii 1855/63 Å doublet observed inthe 1994 spectrum.
Finally, we adopted Fe/H = 0.1 (Fe/H)� by mass since thisabundance reproduces well the Fe v and Fe iv lines in the spectraof the 2000, 2002, and 2009 epochs. This iron abundance islower than the one adopted for Star C (Fe/H = 0.2 (Fe/H)�) butwe did not perform a rigorous analysis of the abundances of StarC and we cannot exclude that it has the same Fe/H abundance∼0.1(Fe/H)� as of Star A. Nevertheless we kept the Fe/Habundance of Star C to the commonly accepted value. The loweriron abundance of Star A is consistent with the result derivedfrom a comparison of the wind-eclipse effects in HD 5980and the Galactic WR system HD 90657 (Koenigsberger et al.1987).14 For the elements Ne, Ar, Cl, Ca, Cr, Mg, and Ni,we adopted a 0.1 times Solar composition similar to the ironabundance. The spectrum does not show any observable spectralfeatures arising from these species but they are important for theline blanketing and the radiation force and were included in themodel.
The composition of all other elements included in the modelwas also set to 0.10 of the solar value. The final chemicalcomposition adopted for the four epochs is shown in Table 5.Note that the overall abundance for Star A is 0.1 Solar whilethat which was used for the Star C model is 0.2 Solar. Theuncertainties in the model fits lead to uncertainties in thechemical compositions of ±0.1 dex, so that these two metallicityvalues are consistent, within the uncertainties.
5.2.2. Wind Velocity
The calculated spectrum of a model is sensitive to severalparameters. The first two parameters are the wind velocity law
14 This result refers to the Fe abundance in Star B’s wind, derived from acomparison between the Fe v pseudocontinuum and the N iv 1718 Å line.
Table 5Chemical Composition of Star A Compared to Other Objects
Element Star Aa Star Ca SMCb NGC346c AG Card Sune
H 11.304 11.853 . . . . . . 11.868 11.868He 11.902 11.455 . . . 11.381 12.097 11.397C 7.484 8.233 . . . . . . 8.694 9.334N 9.000 7.999 7.526 7.521 10.161 8.791O 6.176 9.057 9.224 9.219 8.679 9.729Ne 8.241 8.542 8.474 8.470 . . . 9.010Na 6.538 6.839 . . . . . . . . . 7.396Mg 7.811 8.111 . . . . . . . . . 8.780Al 6.747 7.049 . . . . . . 8.056 7.666Si 7.844 8.146 . . . . . . 9.123 8.823P 5.787 6.086 . . . . . . . . . 6.716S 7.562 7.863 7.966 7.961 . . . 8.511Cl 5.896 6.196 . . . . . . . . . 6.914Ar 6.009 7.310 7.291 7.286 . . . 7.646Ca 6.809 5.865 . . . . . . . . . 7.778Ti 5.516 7.090 . . . . . . . . . 6.445Cr 6.230 6.531 . . . . . . . . . 7.221Mn 5.975 6.274 . . . . . . . . . 6.995Fe 8.134 8.436 . . . . . . 9.442 9.062Ni 6.865 7.164 . . . . . . . . . 7.863
Notes.a This paper.b Hunter et al. 2007.c Peimbert et al. 2000.d Groh et al. 2009.e Grevesse et al. 2007.
and the terminal speed, V∞. The Fe v and Fe vi lines in the1270–1450 Å region are optically thinner than the stronger linespresent in the spectrum, and thus they are more sensitive toproperties of the inner wind regions, particularly the velocitylaw. We find that a β � 2 velocity law adequately reproducestheir line-profiles. Values of β < 2 produce profiles with amore “box-like” shape than observed. Thus, we set β = 2. Thevalue of V∞ was initially chosen for each epoch from Table 3.However, we found it challenging to achieve a good fit to the PCygni absorption components of all lines with the same valueof V∞. In general, the value of V∞ deduced from the C iv lineleads to a model in which the extent of the He ii 1640 Å andP v 1118–28 Å P Cygni absorption is greater than observed(Figure 12). The difference is ∼500 km s−1. As mentioned inSection 2, the wind velocity determined from the He ii 1640P Cygni edge is systematically smaller than that derived fromC iv (listed in Table 3). A slower wind velocity law (i.e., β > 2)reduces this discrepancy. However, in the case of N v 1240 Å ourmodels require a faster V∞ than that derived from C iv, althoughthe measurements of Table 2 give values that are consistent,within the uncertainties, with C iv. Increasing the value of βdoes not eliminate this inconsistency in the model. Similardiscrepancies are observed in some central stars of planetarynebulae (Morisset & Georgiev 2009; Herald & Bianchi 2011;A. Arrieta et al. 2011, in preparation). This phenomenon needsfurther investigation. For the purposes of this paper we used theV∞ as derived from the C iv 1548–50 Å line and β = 2.
5.2.3. Stellar Mass and Luminosity
No feature in the spectrum is clearly dependent on the gravityacceleration. This is not surprising given that the continuumforming region extends beyond the photosphere. But the massof the star, M sin i, i being the orbital inclination, has been
12

The Astronomical Journal, 142:191 (20pp), 2011 December Georgiev et al.
Figure 12. As in Figure 13 but for the 2002 April epoch.
estimated from the analysis of the light curve and radial velocitycurve to be between 60 and 80 M�. Our modeling shows thatat the observed luminosities and mass-loss rates, a star with amass smaller than 90 M� is above the Eddington limit. To keepthe star stable, we assume a mass of 90 M� which, within theerrors, is consistent with the orbital solution and keeps the stellarphotosphere below the Eddington limit. The log g was adjustedso the mass of the star is maintained the same for all epochs.
The luminosity at different epochs was determined from thecontinuum level of the flux calibrated UV spectra. We assumea distance to the SMC of 64 kpc which is an average of thevalues obtained by Hilditch et al. (2005) and North et al. (2010).The reddening was determined by comparing the model andobserved spectral energy distribution in the 920 Å–11500 Årange and using the Cardelli et al. (1989) reddening law. Weobtained a good fit with E(B − V ) = 0.065 ± 0.005 andR = AV /E(B − V ) = 3.1 which was used for all epochs.
5.2.4. Temperature, Mass-loss Rate, and Clumping
The temperature and the mass-loss rate are the most difficultparameters to determine. The change in the spectrum over thedifferent epochs was so great that one cannot use the samediagnostic feature for the analysis for all epochs. The ever
present helium lines are affected by Star B in a yet unclearway so we avoided using them. We concentrated on lines whichsignificantly change from epoch to epoch and therefore cansafely be assumed to arise in Star A. Nitrogen is present as N iii,N iv, and N v in different epochs and due to this variabilitywe deduce that Nitrogen lines are formed mostly in Star A’swind. We used the N iv 1486] line as a mass-loss diagnostic andthe N iii 1750 Å and 4640 Å lines (when present) were used toconstrain the temperature. Although we did not use the heliumlines for this analysis, the fits to the He ii lines are reasonablygood in most of the epochs. He i lines are reasonably fit in 1994and 2000 epochs but the models underestimate them in 2009.The profile of He i lines is also narrower for the observed V∞.This suggests that at least part of the observed He i 5876 Åemission originates in wind–wind interaction region.
It is now well established that the winds of the massive starsare not homogeneous but rather made of clumps, although thetrue nature of the clumping is not known. The main effectof the clumping in the WR winds is the absence of electronscattering wings of the strong emission lines. Following thesame procedure as in Hillier et al. (2003) we used the volumefilling factor f prescription. We adjusted f until we fit the red wingof He ii 4686 Å line and then check the consistency with the
13
The Astronomical Journal, 142:191 (20pp), 2011 December Georgiev et al.
Table 6Model Fit Results
Parameter 1994 Septa 1994 Decb 1994 Decc 2000c 2002c 2009c Star Cc
JD - 240000.0 . . . 49716.6 49716.6 51655.1 52386.6 55083.9 . . .
V (mag) (system) . . . 11.12 11.12b 11.3 11.6 . . . . . .
R10 (R�) . . . 48d 28 20.4 21 19.3 23.5Rs (R�) . . . . . . 21.5 24.3 21.2 19.6 25.0R2/3 (R�) 280 . . . 124 34 32 28 24.2τs . . . . . . 25.8 4.7 3.7 1.8 0.005Teff (kK) . . . . . . 23 37.3 40 43 32T∗ (kK) 23 35.5d 47 48 50 47 33Ts (kK) . . . . . . 100 57 58 60 27M/
√f (10−5 M� yr−1) 80 100 111 35 25 23 0.06
log(L/L�) 7.05 6.48 6.57 6.30 6.39 6.39 5.77V∞ (km s−1) 500 600 750 2000 2200 2440 1800Vesc (km s−1) 464 . . . 642 832 895 932 . . .
Γ 0.75e . . . 0.75 0.53 0.53 0.53 . . .
Notes.a Drissen et al. 2001.b Koenigsberger et al. 1998b.c This paper.d “Core” radius, R∗, and corresponding temperature; in Koenigsberger et al. (1998b), R∗ is the inner boundary of the model atmosphere,where the expansion velocity is negligible.e Adopted value same as in 1994 model.
other strong H i + He ii lines. The observed electron scatteringwings are very weak which restrict the volume filling factor tof � 0.025. This is an upper limit to f. In some spectra the wingsof the lines are even weaker, but smaller values for f might bebeyond the validity of the approximations used in the formalism.We used f = 0.025 for all models for all epochs.
5.2.5. The Individual Spectral Fits
Spectrum 1994. Of the four spectra, this one corresponds tothe coolest temperature. N iii 1750 Å blend is clearly seen and weuse the ratio N iii 1750/N iv 1718 Å as a temperature diagnostic.The optical part of the spectrum shows N iii 4640 Å line whichis also well reproduced. In the low-resolution IUE spectrum, theobserved Fe iv lines in the 1600–1700 Å are much weaker thanpredicted. The mass-loss rate was fixed mainly by N iv] 1486but is consistent with the other UV emission lines. Taking intoaccount the clumping, our derived M is in reasonable agreementwith that derived in Koenigsberger et al. (1998b) for the sameobserved spectrum. A likely explanation for this discrepancyis that the model used in that study considered only hydrogenand helium, thus missing the important influence of the lineblanketing.
Spectrum 2000. The temperature of the star is low enough toshow a measurable N iii 4640 Å. We used that line to restrictthe upper limit of the temperature. The mass-loss rate wasconstrained by N iv] 1486 Å and further check with the Fe vUV complex. The model also reproduces well the optical He iand He ii lines.
Spectrum 2002. The spectrum of this epoch does not includethe optical wavelengths. We set the temperature based on theFe vi/Fe v features observed between 1250 Å and 1400 Å and1420 Å and 1480 Å, respectively. The mass-loss rate is derivedfrom N iv] 1486 and the P v 1118–28 Å doublet.
Spectrum 2009. The temperature was limited from below bythe absence of N iii 4640 Å. This line is present in the previousepochs but is weak in this last spectrum. In addition we used theFe v/Fe iv UV complex.
The uncertainties in the results obtained from the modelfits are difficult to estimate due to the large number of freeparameters which are not completely independent. However, themodels show that changing T(τRoss = 10) by more than ∼2000 Kcauses changes in the computed spectrum that make it noticeablydifferent from the observations. In an analogous manner, theuncertainty in the mass-loss rate can be estimated to be 30%. Theuncertainty in the luminosity due to the uncertainties in the fluxcalibration and in the S/N of the spectra is �20%. The absoluteuncertainty in the parameters is much larger due to unclearcorrelations between them which are difficult to quantify. Weminimize these errors by making our models for the differentepochs consistent so the differences in the parameter values areexpected to reflect real changes in the stellar physics.
5.3. Results
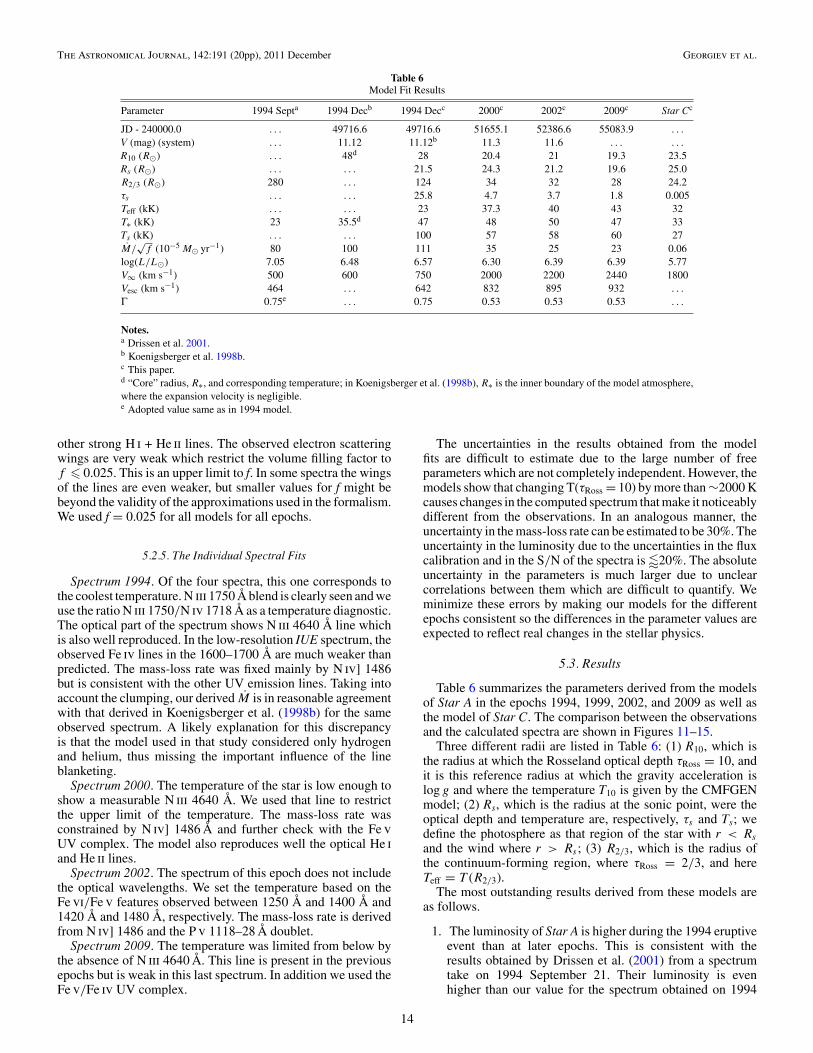
Table 6 summarizes the parameters derived from the modelsof Star A in the epochs 1994, 1999, 2002, and 2009 as well asthe model of Star C. The comparison between the observationsand the calculated spectra are shown in Figures 11–15.
Three different radii are listed in Table 6: (1) R10, which isthe radius at which the Rosseland optical depth τRoss = 10, andit is this reference radius at which the gravity acceleration islog g and where the temperature T10 is given by the CMFGENmodel; (2) Rs, which is the radius at the sonic point, were theoptical depth and temperature are, respectively, τs and Ts; wedefine the photosphere as that region of the star with r < Rs
and the wind where r > Rs ; (3) R2/3, which is the radius ofthe continuum-forming region, where τRoss = 2/3, and hereTeff = T (R2/3).
The most outstanding results derived from these models areas follows.
1. The luminosity of Star A is higher during the 1994 eruptiveevent than at later epochs. This is consistent with theresults obtained by Drissen et al. (2001) from a spectrumtake on 1994 September 21. Their luminosity is evenhigher than our value for the spectrum obtained on 1994
14

The Astronomical Journal, 142:191 (20pp), 2011 December Georgiev et al.
Figure 13. Comparison between the spectrum obtained on 1994 December 30 (black) and the sum of the current best model for Star A at this epoch and Star C model(blue). The singlet He i lines are underestimated while the triplet lines are well reproduced.
December 31. The luminosity is lowest in 2000 April, andthen rises slightly in 2002 remaining at the same leveluntil 2009. Thus, we are now able to confirm that the1994 eruption is an event which did not occur at constantluminosity.
2. Star A’s mass-loss rate is a factor of ∼4 larger in 1994 thanat later epochs. The larger luminosity most likely plays animportant role in driving the larger mass-loss rate.
3. The radius at τRoss = 2/3, R2/3 = 124 R�, is larger in1994 than at any other epoch, and it is very much largerthan Rs = 21.5 R�, the radius at the sonic point in 1994.The continuum-forming region is very extended. Figure 16shows the temperature structure of the 1994 model whereone can also see that due to the larger wind density, thetemperature is significantly higher throughout the wind. Itis also quite remarkable that the temperature at the sonicpoint is T = 105 K. This high temperature is due to the factthat radiation is trapped within the extended continuumemitting region.
4. R2/3 declines after 1994 reaching 28 R� in 2009. This valueis larger than the size of the observed continuum-emittingregion of Star A in 1979 (22–25 R�; Perrier et al. 2009),
consistent with the notion that Star A has still not recoveredits minimum state of activity. The decrease in R2/3 reflectsthe shrinking size of the continuum forming region as thedensity drops. Note, however, that Rs = 19.5 R� in 2009epoch, indicating that the continuum formation region isstill rather extended.
5. The most significant change in Rs occurred in the 2000epoch, at which time it was larger than during the otherepochs. This is consistent with the long-term behavior ofthe optical light curve which peaked at around the 2000epoch and with the notion that the long-term activity cycleand the brief eruptions of 1993–1994 seem to be separatephenomena (Koenigsberger et al. 2010).
6. There is a 30% variation in M between 2000 and 2002and it remains relatively constant thereafter. Although itis tempting to suggest a declining trend, the variation lieswithin the uncertainties of the model results. Hence, wetentatively conclude that M is approximately constant overthe timescale 2000–2009. This leads to the conclusionthat the observed spectral changes during this timescaleresult primarily from the declining wind density, causedby the increasing wind velocity. Hence, we are now in the
15

The Astronomical Journal, 142:191 (20pp), 2011 December Georgiev et al.
Figure 14. As in Figure 13 but for the 2000 April epoch.
possibility of understanding the relation between the fluxin N iv] 1486 Å and the terminal wind speed (Figure 5).Based on the models we can conclude that the reductionof the post-eruption line intensities is caused mainly bythe increase of V∞. Assuming that V∞/Vesc is constant(Figure 17) one can conclude that the changes in V∞ arecaused by a decreasing radius of the star (Table 6). Therelation between N iv] 1486 Å and the terminal velocity ismaintained during the pre-eruption epochs and it followsthe same general trend (Koenigsberger et al. 2010) but inthe opposite direction. V∞ decreases while N iv] 1486 Åincreases which points to an increase in the stellar radius.This leads us to conclude that the S Dor-type ∼40 yearvariability timescale of Star A is due to variations in itsradius.
The S Dor-type variability of Star A is similar to that ofAG Car (Groh et al. 2009) and S Dor (Lamers 1995). Excludingthe 1994 eruption event, the maximum of the optical brightnessin HD 5980 was attained between 1996 and 2000. At thattime, the terminal wind velocity and the temperature were lowerthan in 2009, when the visual brightness was approaching itsminimum. In this sense, during its long term variability, Star Abehaves similarly to AG Car and S Dor. Lamers (1995) explained
this variability as a pulsation of 10−3 to 10−2 of the stellar massin S Dor, and Groh et al. (2009) reached the same conclusionfor AG Car. Lamers (1995) suggested that the larger radiusdecreases the gravity acceleration and increases the scale heightwhich leads to larger mass loss. He also suggested that theluminosity of the star should be lower during the maximum ofthe optical brightness due to the work the star must performto lift the upper layers. In agreement with this prediction wedetected a small difference in the luminosity in 2000 (close tomaximum) and 2009 (close to minimum) epochs which addweight to the suggestion that S Dor variability of Star A iscaused by a pulsation. The exact physical mechanism causingthe pulsation is unclear but now that we have three objectsshowing similar effects, the question arises as to whether thismay be a common phenomenon in this class of objects.
6. THE 1994 ERUPTION AND THE BI-STABILITYJUMP OF A SECOND KIND
The results presented in Table 6 indicate that the windstructure of Star A in 1994 was significantly different fromits wind structure during the other three epochs. This differenceis best illustrated in Figure 16 where we plot the temperaturestructure derived from the spectra of 1994 and 2009. The
16
The Astronomical Journal, 142:191 (20pp), 2011 December Georgiev et al.
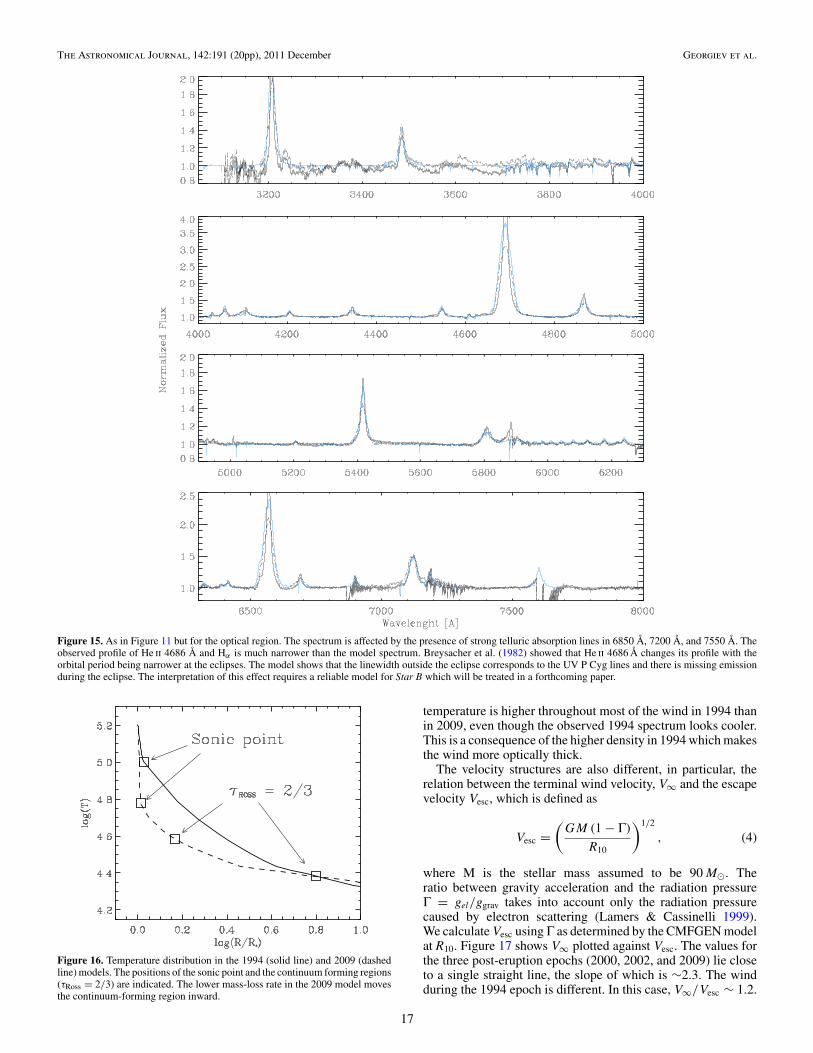
Figure 15. As in Figure 11 but for the optical region. The spectrum is affected by the presence of strong telluric absorption lines in 6850 Å, 7200 Å, and 7550 Å. Theobserved profile of He ii 4686 Å and Hα is much narrower than the model spectrum. Breysacher et al. (1982) showed that He ii 4686 Å changes its profile with theorbital period being narrower at the eclipses. The model shows that the linewidth outside the eclipse corresponds to the UV P Cyg lines and there is missing emissionduring the eclipse. The interpretation of this effect requires a reliable model for Star B which will be treated in a forthcoming paper.
Figure 16. Temperature distribution in the 1994 (solid line) and 2009 (dashedline) models. The positions of the sonic point and the continuum forming regions(τRoss = 2/3) are indicated. The lower mass-loss rate in the 2009 model movesthe continuum-forming region inward.
temperature is higher throughout most of the wind in 1994 thanin 2009, even though the observed 1994 spectrum looks cooler.This is a consequence of the higher density in 1994 which makesthe wind more optically thick.
The velocity structures are also different, in particular, therelation between the terminal wind velocity, V∞ and the escapevelocity Vesc, which is defined as
Vesc =(
GM (1 − Γ)
R10
)1/2
, (4)
where M is the stellar mass assumed to be 90 M�. Theratio between gravity acceleration and the radiation pressureΓ = gel/ggrav takes into account only the radiation pressurecaused by electron scattering (Lamers & Cassinelli 1999).We calculate Vesc using Γ as determined by the CMFGEN modelat R10. Figure 17 shows V∞ plotted against Vesc. The values forthe three post-eruption epochs (2000, 2002, and 2009) lie closeto a single straight line, the slope of which is ∼2.3. The windduring the 1994 epoch is different. In this case, V∞/Vesc ∼ 1.2.
17

The Astronomical Journal, 142:191 (20pp), 2011 December Georgiev et al.
Figure 17. Relation between V∞ and Vesc at different epochs.
The velocities obtained by the Drissen et al. (2001) for 1994September lie along the same relation.
The change in the V∞/Vesc relation together with the coolereffective temperature of the 1994 spectrum are strongly sug-gestive of a phenomenon associated with the bi-stability jump(Lamers et al. 1995). The bi-stability jump occurs when thetemperature in the inner wind decreases to a value at whichthe ionization fraction of Fe2+ increases leading to changesin the line opacities and a changes of the driving force, highermass-loss rate and reduce in V∞/Vesc from ∼2.6 to 1.3 (Vinket al. 1999). This occurs at Teff ∼ 21000 K.
This is remarkably similar to what we find for HD 5980.There is, however, a major difference between the cause of thebi-stability jump observed in O and B stars and the phenomenonthat our models indicate is occurring in HD 5980. As was shownby Lamers & Cassinelli (1999) and Vink et al. (1999), the mass-loss rate is defined by the force below the sonic point. In theoptically thin O and B star’s winds the sonic point is abovethe photosphere, thus the condition in it can be described bythe effective temperature. On the other hand, the sonic pointof the optically thick wind of HD 5980 is located below thepseudo photosphere (Figure 16). In the 1994 model, the pointat which the temperature T ∼ Teff ∼ 21000 K lies at ∼6 Rs farabove the sonic point. Thus, changes in the ionization structureat a distance of ∼6 Rs have little effect on the overall windstructure.
In search of an alternative cause of the jump we followed thereasoning of Lamers & Nugis (2002) and Grafener & Hamann(2008). These authors showed that the WR winds below thesonic point are driven not by the line force but rather by the
radiation pressure due to continuum opacities. We applied thatidea to Star A’s wind. In Table 6 we see that the optical depthof the sonic point τs > 1 for all four epochs, indicating thatthe wind is driven primarily by the continuum force. Nugis &Lamers (2002), and Grafener & Hamann (2008) showed thatin order to drive a WR-type wind, the continuum opacity (sumof the true continuum opacities and the pseudo continuum ofoverlapping lines) has to be dominated by one of the bumps inthe iron opacity. Grafener & Hamann (2008) showed that therequired high mass-loss rate is obtained only if the temperatureat the sonic point is either in the 30–70 kK range (“cool” bump)or around 160 kK (“hot” bump). Table 6 shows that all of thepost eruption models have Ts ∼ 48–50 kK, well within thefirst of these temperature intervals. One can thus expect thatat almost constant luminosity the mass-loss rate will be almostconstant, which is indeed the result from our models (Table 6).During the eruption the luminosity of the star increased. Thehigher luminosity heated the inner part of the wind changingthe opacity contributors from those of the “cool” bump to thoseof the “hot” bump, thus changing the driving force and thereforethe mass-loss rate. Our model for 1994 December gives Ts =100 kK (Table 6). This temperature is too high for the “cool”iron opacity bump but too cool for the “hot” bump at 160 kK.Grafener & Hamann (2008) suggested that winds with Ts in theintermediate temperature range are unstable. We speculate thatat the onset of the eruption Ts was high enough and the verydense wind was driven by the high temperature iron bump. Asthe luminosity decreased, the cooler wind became unstable andit rapidly switched back to the “cool” iron bump driving with Tsaround 50 kK.
We suggest that a bi-stability jump of a second kind operatesin Star A. The sudden change in the wind properties is dueto a transition from the “hot” to the “cool” Fe-bump opacityregimes mechanism that was shown by Lamers & Nugis (2002)and Grafener & Hamann (2008) to be needed to drive the windsof WR stars.
Our models show that the increased luminosity can indeedchange Ts, changing the entire wind structure during the erup-tion. Figure 16 shows the change in the temperature structureof the wind in the 1994 and 2009 models. In the less densewind of 2009, the continuum forming region has moved furtherin and Teff increased. The sonic point is at a similar radius butdue to the overall smaller temperature gradient it is significantlycooler. In addition to the changes in the temperature, the value ofΓ changes from ∼ 0.75 during the eruption to ∼ 0.53 afterward.A similar result was found by Smith et al. (2004). These authorsshowed that when the star approaches the Eddington limit, theoptical depth of the sonic point increases and it moves belowthe photosphere. The increased luminosity of Star A moved itcloser to the Eddington limit and the wind reacted in a similarmanner. Furthermore Grafener & Hamann (2008) found that theWN stars with SMC chemical composition require Γ > 0.75 tomaintain a high mass-loss rate. In addition the Vink et al. (2011)models show a transition from O star wind to WR wind when Γincreases above 0.7. Based on these considerations we can con-clude that the wind during the eruption is governed by differentforces than the wind in the post-eruption epochs. We speculatethat during the eruption, the high luminosity heats the inner partof the wind, driving much higher mass loss trough the “hot” ironopacity bump. After the eruption the temperature at the sonicpoint drops making the wind unstable. The mass-loss rate drops,which causes further cooling of the sonic point until it reachesthe “cool” iron bump where the wind stabilizes again and the
18
The Astronomical Journal, 142:191 (20pp), 2011 December Georgiev et al.
star continues its long-term variability but with a restructuredwind.
Hence, we suggest that for the dense winds such as those inHD 5980, there exists a second type of bi-stability jump thanthat proposed by Lamers et al. (1995). It is caused by transitionbetween the “hot” and “cold” iron opacity bump and is correlatedmainly with the stellar luminosity rather than with the effectivetemperature. Smith et al. (2004) discussed the position of thesonic point in the typical LBVs. They showed that for the derivedparameters of most of the LBVs, the sonic point is located abovethe photosphere and thus their winds change according to the“classical” bi-stability jump. Here we speculate that the mostluminous LBVs, such as Star A, have optically thick winds withpseudo photospheres above their sonic points even on the hotterside of the S Dor instability strip. Thus their excursion to thecool branch of the strip is caused by a second kind of bi-stabilityjump related to the changes in their continuum opacities.
7. CONCLUSIONS
HD 5980 is a relatively nearby system in which processesinvolving eruptive phenomena and massive star evolution inbinary systems in a low metallicity environment can be studied.In this respect, is important to gain an understanding of thephenomena that it has presented over the past few decades.
In this paper we present the results of the analysis of acollection of UV and optical spectra obtained between 1979and 2009 and performed CMFGEN model fits to spectra of1994, 2000, 2002, and 2009. The primary results are as follows.(1) The long term S Dor-type variability is associated withchanges of the hydrostatic radius. We find that the radius ofthe eruptor at the sonic point was largest in the year 2000(Rs = 24.3 R�), coinciding with the long-term maximum inthe visual light curve. The minimum value in our data set is in2009 (Rs = 19.6 R�). (2) The 1994 eruption involved changesin the eruptor’s bolometric luminosity and wind structure.The luminosity was larger by at least 50% with respect tothe subsequent epochs and the temperature throughout mostof the wind was significantly higher. The latter is a consequenceof the very large optical depth which causes photons to betrapped within this wind region. At the same time, the velocitystructure was one in which the relationship between the terminalwind velocity and the escape velocity V∞/Vesc ∼ 1.2, contraryto other epochs in which this ratio was ∼2.3. (3) The emission-line strength, the wind velocity and the continuum luminosityunderwent correlated variations in the sense that a decreasingV∞ was associated with increasing emission line and continuumlevels. These correlations can be understood in the context of theincreasing size of the hydrostatic stellar radius. (4) The spectrumof the third star in the system (Star C) is well fit by a Teff =32 K model atmosphere with SMC chemical abundances. Theabundances of the eruptor, Star A, show He and N enhancements,roughly consistent with the CNO cycle equilibrium values. Asimilar composition was obtained by Groh et al. (2009) forAG Car and Hillier et al. (2001) for η Car.
For all epochs, the wind of the erupting star is optically thickat the sonic point and is thus driven mainly by the continuumopacity. We speculate that the wind switches between two stableregimes driven by the “hot” (during the eruption) and the “cool”(post-eruption) iron opacity bumps as defined by Lamers &Nugis (2002) and Grafener & Hamann (2008), and thus thewind may undergo a bi-stability jump of a different nature fromthat which occurs in OB stars.
We thank Alfredo Dıaz and Ulises Amaya for com-puting assistance. This research was supported underUNAM/DGAPA/PAPIIT grants IN106798 and IN123309 andCONACYT grants 48929 and 83016. L.N.G. acknowledges thesupport from CONACyT grant 141530. R.H.B. acknowledgespartial support from ULS DIULS grant, and D.J.H. acknowl-edges support from grant HST-GO-11623.01-A and HST-GO-11756.01. The HST is operated by the STScI, under contractwith AURA.
REFERENCES
Barba, R. H., Morrell, N. I., Niemela, V. S., et al. 1996, Rev. Mex. Astron.Astrofis. Ser. Conf., 5, 85
Barba, R. H., & Niemela, V. S. 1994, IAU Circ., 6099, 1Barba, R. H., Niemela, V. S., Baume, G., & Vazquez, R. A. 1995, ApJ, 446, L23Barba, R. H., Niemela, V. S., & Morrell, N. I. 1997, in ASP Conf. Ser. 120,
Luminous Blue Variables: Massive stars in Trnsition, ed. A. Nota & H.Larmers (San Francisco, CA: ASP), 238
Breysacher, J. 1997, in ASP Conf. Ser. 120, Luminous Blue Variables: MassiveStars in Transition, ed. A. Nota & H. Lamers (San Francisco, CA: ASP), 227
Breysacher, J., Moffat, A. F. J., & Niemela, V. 1982, ApJ, 257, 116Breysacher, J., & Perrier, C. 1980, A&A, 90, 207Cardelli, J. A., Clayton, G. C., & Mathis, J. S. 1989, ApJ, 345, 245Colina, L., Bohlin, F., & Castelli, F. 1996, Instrument Science Report CAL/
SCS-008Crowther, P. A., Hillier, D. J., Evans, C. J., et al. 2002, ApJ, 579, 774Drissen, L., Crowther, P. A., Smith, L. J., et al. 2001, ApJ, 545, 484Dwarkadas, V. V. 2011, MNRAS, 412, 1639Eenens, P. R. J., & Williams, P. M. 1994, MNRAS, 269, 1082Foellmi, C., Koenigsberger, G., & Georgiev, L. 2008, RevMexAA, 44, 3Georgiev, L. N., & Koenigsberger, G. 2004, A&A, 423, 267Grafener, G., & Hamann, W.-R. 2008, A&A, 482, 945Grevesse, N., Asplund, M., & Sauval, A. J. 2007, Space Sci. Rev., 130, 105Groh, J. H., Hillier, D. J., Damineli, A., et al. 2009, ApJ, 698, 1698Guzik, J. A., Cox, A. N., & Despain, K. M. 2005, in ASP Conf. Ser. 332,
The Fate of the Most Massive Stars, ed. R. Humphreys & K. Stanek (SanFrancisco, CA: ASP), 263
Herald, J., & Bianchi, L. 2011, MNRAS, in pressHeydari-Malayeri, M., Rauw, G., Esslinger, O., & Beuzit, J.-L. 1997, A&A,
322, 554Hilditch, R. W., Howarth, I. D., & Harries, T. J. 2005, MNRAS, 357, 304Hillier, D. J., Davidson, K., Ishibashi, K., & Gull, T. 2001, ApJ, 553, 837Hillier, D. J., Lanz, T., Heap, S. R., et al. 2003, ApJ, 588, 1039Hillier, D. J., & Miller, D. 1998, ApJ, 496, 407Hunter, I., Dufton, P. L., Smartt, S. J., et al. 2007, A&A, 466, 277Jones, A., & Sterken, C. 1997, J. Astron. Data, 3, 3Kashi, A., & Soker, N. 2010, ApJ, 723, 602Koenigsberger, G. 2004, RevMexAA, 40, 107Koenigsberger, G., Auer, L. H., Georgiev, L., & Guinan, E. 1998a, ApJ, 496,
934Koenigsberger, G., Fullerton, A., Massa, D., & Auer, L. H. 2006, AJ, 132, 1527Koenigsberger, G., Georgiev, L., Barba, R., et al. 2000, ApJ, 542, 428Koenigsberger, G., Georgiev, L., Hillier, D. J., et al. 2010, AJ, 139, 2600Koenigsberger, G., Georgiev, L., Peimbert, M., et al. 2001, AJ, 121, 267Koenigsberger, G., Guinan, E., Auer, L., & Georgiev, L. 1995, ApJ, 452, L107Koenigsberger, G., Kurucz, R., & Georgiev, L. 2002, ApJ, 581, 598Koenigsberger, G., Moffat, A. F. J., & Auer, L. H. 1987, ApJ, 322, L41Koenigsberger, G., Moffat, A. F. J., St-Louis, N., et al. 1994, ApJ, 436, 301Koenigsberger, G., Pena, M., Schmutz, W., & Ayala, S. 1998b, ApJ, 499, 889Koenigsberger, G., Shore, S., Guinan, E., & Auer, L. 1996, Rev. Mex. Astron.
Astrofis. Ser. Conf., 5, 92Lamers, H. J. G. L. M. 1995, in ASP Conf. Ser. 83, IAU Colloq. 155:
Astrophysical Applications of Stellar Pulsation, ed. R. S. Stobie & P. A.Whitelock (San Francisco, CA: ASP), 176
Lamers, H. J. G. L. M., & Cassinelli, J. P. 1999, Introduction to Stellar Winds(Cambridge: Cambridge Univ. Press)
Lamers, H. J. G. L. M., & Nugis, T. 2002, A&A, 395, L1Lamers, H. J. G. L. M., Snow, T. P., & Lindholm, D. M. 1995, ApJ, 455, 269Maız-Apellaniz, J., & Bohlin, R. C. 2005, Space Telescope Science Institute,
Instrument Science Report STIS 2005-01Moffat, A. F. J., Marchenko, S. V., Bartzakos, P., et al. 1998, ApJ, 497, 896Morisset, C., & Georgiev, L. 2009, A&A, 507, 1517Nichols, J. S., & Linsky, J. L. 1996, AJ, 111, 517
19
The Astronomical Journal, 142:191 (20pp), 2011 December Georgiev et al.
Niemela, V. S. 1988, in ASP Conf. Ser. 1, Progress and Opportunities in SouthernHemisphere Optical Astronomy, ed. V. M. Blanco & M. M. Phillips (SanFrancisco, CA: ASP), 381
North, P., Gauderon, R., Barblan, F., & Royer, F. 2010, A&A, 520, A74Nugis, T., & Lamers, H. J. G. L. M. 2002, A&A, 389, 162Owocki, S., & van Marle, A. J. 2008, in IAU Symp. 250, Massive Stars as
Cosmic Engines, ed. A. Maeder, G. Meynet, S. Ekstrom, R. Hirschi, & C.Gregory (Cambridge: Cambridge Univ. Press), 71
Peimbert, M., Peimbert, A., & Ruiz, M. T. 2000, ApJ, 541, 688Perez, M. 1992, NASA IUE Newsletter, 48, 76Perrier, C., Breysacher, J., & Rauw, G. 2009, A&A, 503, 963Pojmanski, G. 2002, Acta Astron., 52, 397
Prinja, R. K., Barlow, M. J., & Howarth, I. D. 1990, ApJ, 361, 607Schmutz, W., Hamann, W.-R., & Wessolowski, U. 1989, A&A, 210,
236Schweickhardt, J. 2000, PhD thesis, Ruprecht-Karls-Universitat, HeidelbergSmith, N. 2008, in IAU Symp. 250, Massive Stars as Cosmic Engines, ed. A.
Maeder, G. Meynet, S. Ekstrom, R. Hirschi, & C. Gregory (Cambridge:Cambridge Univ. Press), 193
Smith, N., Vink, J. S., & de Koter, A. 2004, ApJ, 615, 475Sterken, C., & Breysacher, J. 1997, A&A, 328, 269van Marle, A. J., Langer, N., & Garcıa-Segura, G. 2007, A&A, 469, 941Vink, J. S., de Koter, A., & Lamers, H. J. G. L. M. 1999, A&A, 350, 181Vink, J. S., Muijres, L. E., Anthonisse, B., et al. 2011, A&A, 531, 132
20
Related Documents


![Telford & Wrekin Local Plan Examination in Public Matter 7 ... · 1 Rayet, Harjot From: Mark North [mark.north@mineralproducts.org] Sent: 06 March 2017 10:40 To: Rayet, Harjot Subject:](https://static.cupdf.com/doc/110x72/5fb847286abceb18f24a7816/telford-wrekin-local-plan-examination-in-public-matter-7-1-rayet-harjot.jpg)