F Desalination and Water Purification Research and Development Program Report No. 128 Wind-Powered Reverse Osmosis Water Desalination for Pacific Islands and Remote Coastal Communities U.S. Department of the Interior Bureau of Reclamation April 2009

Welcome message from author
This document is posted to help you gain knowledge. Please leave a comment to let me know what you think about it! Share it to your friends and learn new things together.
Transcript
F
Desalination and Water Purification Research and Development Program Report No. 128
Wind-Powered Reverse Osmosis Water Desalination for Pacific Islands and Remote Coastal Communities
U.S. Department of the Interior Bureau of Reclamation April 2009
2
REPORT DOCUMENTATION PAGE Form Approved OMB No. 0704-0188
Public reporting burden for this collection of information is estimated to average 1 hour per response, including the time for reviewing instructions, searching existing data sources, gathering and maintaining the data needed, and completing and reviewing this collection of information. Send comments regarding this burden estimate or any other aspect of this collection of information, including suggestions for reducing this burden to Department of Defense, Washington Headquarters Services, Directorate for Information Operations and Reports (0704-0188), 1215 Jefferson Davis Highway, Suite 1204, Arlington, VA 22202-4302. Respondents should be aware that notwithstanding any other provision of law, no person shall be subject to any penalty for failing to comply with a collection of information if it does not display a currently valid OMB control number. PLEASE DO NOT RETURN YOUR FORM TO THE ABOVE ADDRESS.
T1. REPORT DATE (DD-MM-YYYY) T
April 3, 2009 T2. REPORT TYPE T
Final T3. DATES COVERED (From - To)T
January 10, 2004–April 3, 2009 5a. CONTRACT NUMBER
Agreement No. 04-FG-81-1062 5b. GRANT NUMBER
T4. TITLE AND SUBTITLE Systems Development for Environmental Impact Assessment of Concentrate Disposal – Development of Density Current Simulation Models, Rule Base, and Graphic User Interface
5c. PROGRAM ELEMENT NUMBER
5d. PROJECT NUMBER
5e. TASK NUMBER
6. AUTHOR(S) Clark C.K. Liu
5f. WORK UNIT NUMBER
7. PERFORMING ORGANIZATION NAME(S) AND ADDRESS(ES) Water Resources Research Center University of Hawaii at Manoa 2540 Dole Street, Holmes Hall 283 Honolulu HI 96822
8. PERFORMING ORGANIZATION REPORT NUMBER
10. SPONSOR/MONITOR’S ACRONYM(S)
9. SPONSORING / MONITORING AGENCY NAME(S) AND ADDRESS(ES) U.S. Department of the Interior, Bureau of Reclamation, Technical Service Center, Environmental Services Division, Water Treatment Engineering and Research Group, 86-68230, PO Box 25007, Denver CO 80225-0007
11. SPONSOR/MONITOR’S REPORT NUMBER(S)
DWPR Report No. 128 12. DISTRIBUTION / AVAILABILITY STATEMENT
Available from the National Technical Information Service (NTIS), Operations Division, 5285 Port Royal Road, Springfield VA 22161 13. SUPPLEMENTARY NOTES T
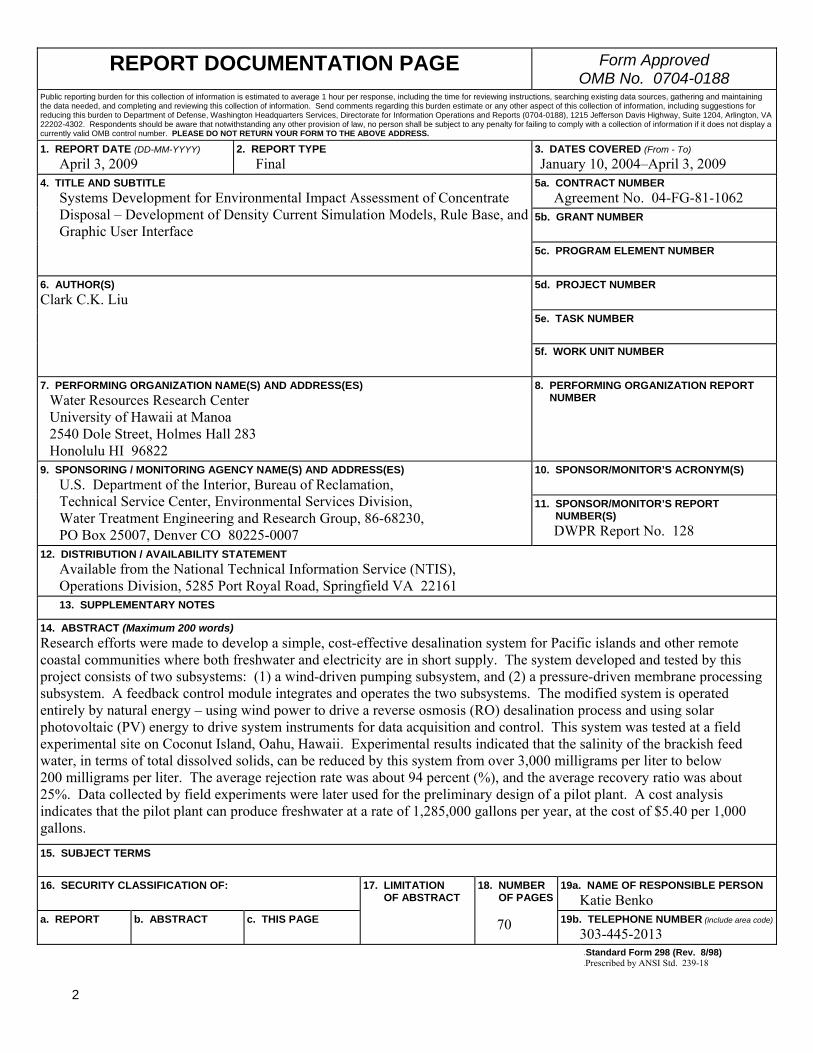
14. ABSTRACT (Maximum 200 words) Research efforts were made to develop a simple, cost-effective desalination system for Pacific islands and other remote coastal communities where both freshwater and electricity are in short supply. The system developed and tested by this project consists of two subsystems: (1) a wind-driven pumping subsystem, and (2) a pressure-driven membrane processing subsystem. A feedback control module integrates and operates the two subsystems. The modified system is operated entirely by natural energy – using wind power to drive a reverse osmosis (RO) desalination process and using solar photovoltaic (PV) energy to drive system instruments for data acquisition and control. This system was tested at a field experimental site on Coconut Island, Oahu, Hawaii. Experimental results indicated that the salinity of the brackish feed water, in terms of total dissolved solids, can be reduced by this system from over 3,000 milligrams per liter to below 200 milligrams per liter. The average rejection rate was about 94 percent (%), and the average recovery ratio was about 25%. Data collected by field experiments were later used for the preliminary design of a pilot plant. A cost analysis indicates that the pilot plant can produce freshwater at a rate of 1,285,000 gallons per year, at the cost of $5.40 per 1,000 gallons.
15. SUBJECT TERMS 16. SECURITY CLASSIFICATION OF:
19a. NAME OF RESPONSIBLE PERSONT
Katie Benko a. REPORT b. ABSTRACT
c. THIS PAGE
17. LIMITATION OF ABSTRACT
18. NUMBER OF PAGES
70 19b. TELEPHONE NUMBER (include area code)
303-445-2013 SS Standard Form 298 (Rev. 8/98)
P Prescribed by ANSI Std. 239-18

Desalination and Water Purification Research and Development Program Report No. 128
Wind-Powered Reverse Osmosis Water Desalination for Pacific Islands and Remote Coastal Communities
Prepared for Reclamation Under Agreement No. 04-FC-81-1062
by
Clark C.K. Liu
Water Resources Research Center University of Hawaii at Manoa Honolulu, Hawaii
U.S. Department of the Interior Bureau of Reclamation Technical Service Center Environmental Services Division Water Treatment Engineering and Research Group Denver, Colorado April 2009

Disclaimer The views, analysis, recommendations, and conclusions in this report are those of the authors and do not represent official or unofficial policies or opinions of the United States Government, and the United States takes no position with regard to any findings, conclusions, or recommendations made. As such, mention of trade names or commercial products does not constitute their endorsement by the United States Government.
MISSION STATEMENTS
The mission of the Department of the Interior is to protect and provide access to our Nation's natural and cultural heritage and honor our trust responsibilities to Indian tribes and our commitments to island communities.
The mission of the Bureau of Reclamation is to manage, develop, and protect water and related resources in an environmentally and economically sound manner in the interest of the American public.

iii
Acknowledgements This report is based upon works supported, in part, by the Desalination and Water Purification Research and Development Program, Bureau of Reclamation, U.S. Department of the Interior under award 04-FC-81-1062. The University of Hawaii project team consists of the following technical members: Professor Clark C.K. Liu, Project Manager and Principal Investigator; Andrew H. Oshita, Technician; Krispin Fernandes, Graduate Research Assistant; and Xiangang Li, Graduate Research Assistant.

v
Table of Contents Page
1. Executive Summary ............................................................................ 1
2. Background and Introduction to Potential Solution............................ 3
2.1. Existing Water Supplies in Pacific Islands and Remote Coastal Communities .......................................................................... 3
2.2. Brackish Water Desalination by RO Process............................. 4 2.3. Renewable Energy and Desalination ......................................... 6
2.3.1. Desalination Driven by Photovoltaic Solar Panel and Ocean Thermal Energy ....................................... 6
2.3.2. Desalination Driven by Wind Energy............................. 7
3. Conclusions and Recommendations ................................................... 9
4. Work Performed.................................................................................. 11
5. Research Scope and Tasks .................................................................. 13
6. Design of the Field Testing System.................................................... 15
6.1. Wind-Energy Conversion Subsystem......................................... 16 6.1.2. Efficiency of Wind-Energy Conversion ........................ 18
6.2 Brackish Water Desalination Subsystem.................................... 18 6.3. Feedback Control and System Operation Under Varying
Environmental Conditions ..................................................... 20 6.3.1 Selection of a Photovoltaic Solar Module ...................... 21
7. Construction of the Field Testing System........................................... 25
7.1 Construction of Wind-powered Two-stage Pumping Devices ... 25 7.2 Construction of System Components for the RO Module .......... 28 7.3 Installation of Feedback Control Module ................................... 28 7.4 Installation of Solar PV Panel..................................................... 29 7.5 Installation of a Carbon-Adsorption Pre-treatment Unit ............ 30
8. Field Experiments and Data Analysis................................................. 31
8.1. Efficiency of Windmill/Pump.................................................... 31 8.2. Experiments of Wind-Powered Two-stage Pumping ................ 32 8.3. Experiments on the Operation of System Data
Acquisition and Control......................................................... 37 8.4. System Operation Under Varying Wind Speed .......................... 38 8.5. System Operation under Varying Feed Water Salinity............... 39
9. Pilot Plant Site Selection..................................................................... 43
9.1. Potential Pilot Plant Sites........................................................... 43
vi
Contents (continued) Page
10. Pilot Plant Design and Cost Analysis ............................................... 49
10.1 Conceptual Design .................................................................... 49 10.1.1 Large Windmills ........................................................... 49 10.1.2 Arranging Multi-Units of Windmill and RO Module in
Parallel and in Series.................................................. 49
Reference List .......................................................................................... 55
SI Metric Conversion Table..................................................................... 59
Appendices
Page
1 Result of Field Experiment on August 16, 2005 for Two-Stage Pumping ............................................................................................. 61
2 Result of Field Experiment on August 19, 2005 (Second-Stage Operation) .......................................................................................... 65
3 Results of Field Experiment on September 7, 2005 .......................... 67
List of Figures
Figure Page
1 Brackish Water in the Transition Zone of a Hawaii Basal Water Lens................................................................................................. 3 2 Salinity Variations Measured at Waipahu Deep Monitoring
Well on Oahu .................................................................................. 4 3 An Open-Cycle OTEC Desalination System..................................... 7 4 Research Scope and Task................................................................... 14 5 Wind-Driven Reverse Osmosis Desalination .................................... 15 6 Schematic of the Field Testing System of Wind-Driven
Desalination .................................................................................... 16 7 Schematic of the Design of a Wind-Energy Conversion
Subsystem ....................................................................................... 17 8 Schematic of the Brackish Water Desalination Subsystem ............... 19
vii
List of Figures (continued) Page
9 Schematic of Feedback Control Module............................................ 21 10 Feedback Control for System Operation Under Varying
Wind Speed..................................................................................... 22 11 Feedback Control for System Operation Under Varying
Feed Water Salinity......................................................................... 23 12 Coconut Island, Oahu, Hawaii ........................................................... 25 13 Construction of Dempster Multivaned Windmill on Coconut
Island Experimental Site ................................................................. 26 14 Stabilizer with Control Sensors and Data Logger.............................. 27 15 Construction of Wind-Powered Two-Stage Pumping ....................... 27 16 Installation of Pre-treatment and RO Units ....................................... 28 17 Control Devices for System Operation Under Varying Wind
Speed and Feed Water Salinity ....................................................... 29 18 Photovoltaic Solar Installed at the Experimental Site........................ 29 19 Modified Research Scope and Tasks ................................................. 30 20 Carbon Filter of Feed Water Pre-treatment ....................................... 30 21 Field Experiments of Summer 2005 at the Field Testing Site ........... 31 22 Overall Power Coefficient of Windmill/Pump Module with
Respect to Wind Speed ................................................................... 32 23 Wind Speed During the Field Testing of the System on
August 16, 2005.............................................................................. 33 24 Two-Stage Pumping and Different Levels of Pressure
Generated – Field Experiment of August 16, 2005 ........................ 35 25 The Rate of Pumped Flow During the First-Stage
Pumping – Field Experiment of August 16, 2005 .......................... 35 26 The Rate of Flow Before and After RO Units - Field
Experiment of August 16, 2005 ...................................................... 37 27 The Salinity of Feed Water, Brine, and Permeate - Field
Experiment on August 16, 2005 ..................................................... 36 26 Relationship of Power Consumption and Operating Pressure........... 37 29 Experimental Results of System Operation Under Varying
Wind Speed, August 9, 2005 .......................................................... 39 30 Experimental Results of System Operation Under Varying
Salinity, September 7, 2005 ............................................................ 41 31 Potential Sites for Proposed Development of a Wind/Solar-
Powered RO Brackish Water Desalination Pilot ............................ 43 32 Coconut Island Site on Oahu, Hawaii................................................ 44 33 Ewa Beach Site on Oahu, Hawaii ...................................................... 45 34 Kahoolawe Island, Hawaii Site.......................................................... 46 35 Existing State of Hawaii Demonstration Desalting Facility .............. 47
viii
List of Figures (continued) Page
36 Average Wind Speed on Oahu, Hawaii ............................................. 47 37 Solar Map of Oahu, Hawaii ............................................................... 48 38 Schematic of the Conceptual Design of a Renewable-
Energy-Driven RO Desalination Pilot Plant ................................... 50
ix
Glossary Basal Water Body – Coastal and island ground water aquifers in which freshwater floats on top of seawater. Under natural conditions, a transition zone of brackish water exists in between freshwater and seawater zones. Brackish Water – Water that is intermediate in saly content between freshwater and saline water; contains between 1,000 and 10,000 milligrams per liter of total dissolved solids (TDS). Desalination – The removal of dissolved minerals (including salts) from seawater or brackish water. Photovoltaic Panels – Several individual metallic cells connected in series or parallel to transform the sun's rays into useable electrical energy. Pressure Stabilizer – A hydropneumatic pressure tank, which is used to maintain a steady feed water flow by reducing excessive fluctuation of the pressure and the flow rate. Renewable Energy – Energy sources which are available virtually forever through natural processes. Reverse Osmosis – The process that causes water in a salt solution to move through a semipermeable membrane to the freshwater side; it is accomplished by applying pressure in excess of the natural osmotic pressure to the salt solution. Salinity – The salt content in a water, often measured in terms of the milligram of TDS in a liter of water. Wind Energy – A renewable energy driven by the temperature differences in the atmosphere caused by uneven heating by the sun; wind power is proportional to the cube of the wind speed.


1
1. Executive Summary The principal objective of this 1-year project was to develop a simple, cost-effective desalination system for Pacific islands and other remote coastal communities where both freshwater and electricity are in short supply.
Brackish water desalination driven by renewable energy seems a viable water supply alternative and was selected by this project for further investigation. The following factors prompted this selection. First, brackish water desalination is much easier than seawater desalination and many Pacific islands have plenty of brackish water supply. Secondly, Pacific islands are rich in renewable energy, due to constant trade winds and strong solar radiation. Thirdly, recent advances in membrane technology, especially in the field of ultra-low-pressure reverse-osmosis (RO) membranes, make this alternative more attractive.
A preliminary testing system of wind-driven RO desalination was originally developed several years ago by the University of Hawaii. The system was constructed on an experimental site on Coconut Island, Oahu, Hawaii. However, this preliminary testing system was not ready for real-world application because the system could not provide dual working pressure required for feed water pre-treatment and for RO desalination. Also, the system was not entirely driven by renewable energy because the measuring instruments of the system were operated by electricity.
With funding support by the Bureau of Reclamation (Reclamation), this preliminary testing system was modified. The modified system consists of: (1) a wind-driven pumping subsystem and (2) a pressure-driven membrane processing subsystem. A feedback control module integrates and operates these two subsystems. The wind-driven pumping subsystem of the modified system can raise the feed water pressure to two different levels for pre-treatment and for RO desalination. The modified system is operated entirely by renewable energy, using wind power to drive an RO desalination process and using solar photovoltaic energy to drive system instruments for data acquisition and control.
Results of field experiments with this modified system indicated that the salinity of the brackish feed water, in terms of total dissolved solids, was reduced from over 3,000 milligrams per liter (mg/L) to below 200 mg/L. The overall average rejection rate was about 94 percent (%), and the average recovery ratio was about 25%.
Three potential sites for a pilot plant of natural energy powered brackish desalination were evaluated by this Reclamation project. The site at an existing

2
State of Hawaii Demonstration Desalting Facility in Ewa Beach region on Oahu was selected for pilot plant development.
Data collected by field experiments were then used for a preliminary design and cost analysis of the pilot plant. A cost analysis indicates that the pilot plant be located in Ewa Beach area on Oahu can produce freshwater at a rate of 1,285,000 gallons per year at the cost of $5.40 per 1,000 gallons.
3
2. Background and Introduction to Potential Solution 2.1. Existing Water Supplies in Pacific Islands and Remote Coastal Communities
Pacific islands fall into two general categories: large volcanic islands and low atoll islands. Perennial streams exist only in large volcanic islands where storage facilities are required to regulate highly variable rainfall distributions. Due to the high porosity of the ground, a surface water supply is almost nonexistent in low atoll islands.
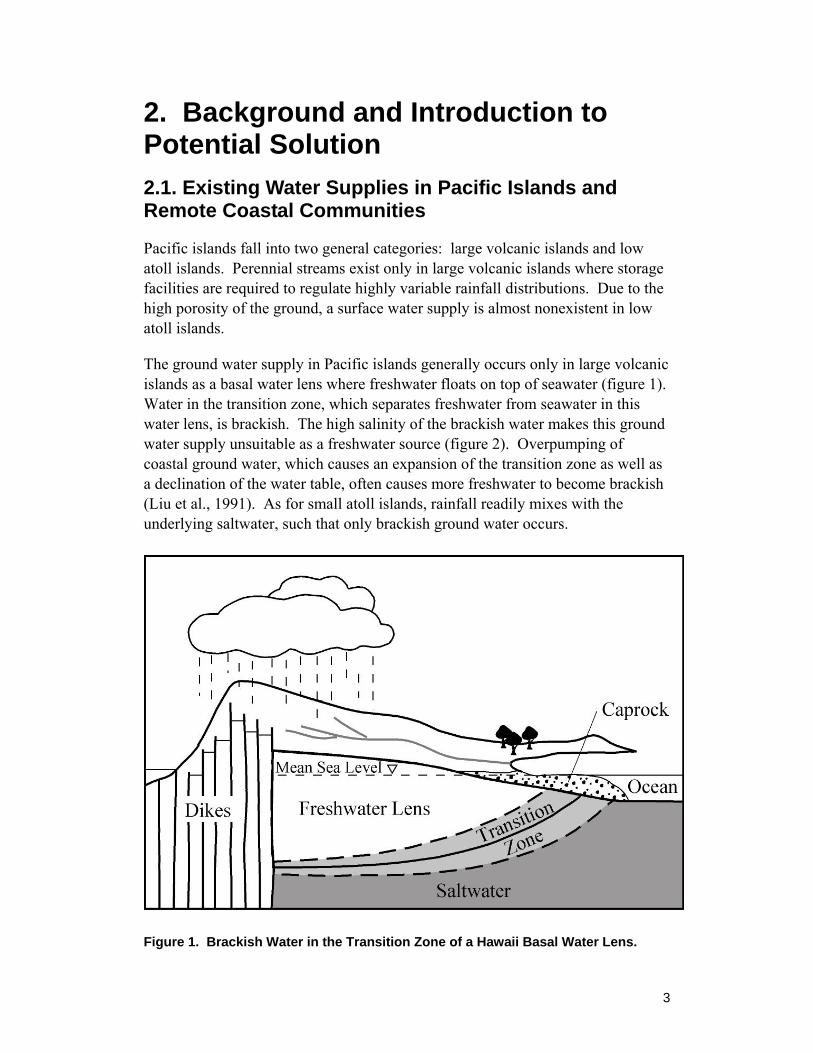
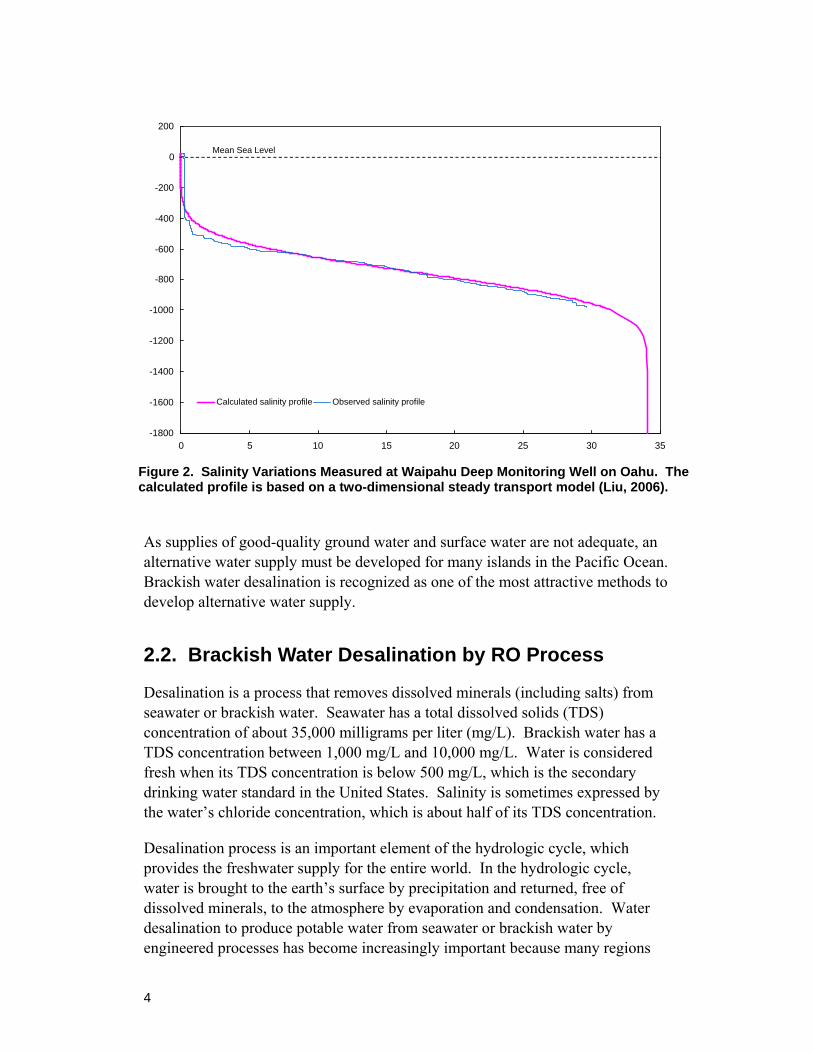
The ground water supply in Pacific islands generally occurs only in large volcanic islands as a basal water lens where freshwater floats on top of seawater (figure 1). Water in the transition zone, which separates freshwater from seawater in this water lens, is brackish. The high salinity of the brackish water makes this ground water supply unsuitable as a freshwater source (figure 2). Overpumping of coastal ground water, which causes an expansion of the transition zone as well as a declination of the water table, often causes more freshwater to become brackish (Liu et al., 1991). As for small atoll islands, rainfall readily mixes with the underlying saltwater, such that only brackish ground water occurs.
Figure 1. Brackish Water in the Transition Zone of a Hawaii Basal Water Lens.
4
-1800
-1600
-1400
-1200
-1000
-800
-600
-400
-200
0
200
0 5 10 15 20 25 30 35
Calculated salinity profile Observed salinity profile cal add
Mean Sea Level
Figure 2. Salinity Variations Measured at Waipahu Deep Monitoring Well on Oahu. The calculated profile is based on a two-dimensional steady transport model (Liu, 2006). As supplies of good-quality ground water and surface water are not adequate, an alternative water supply must be developed for many islands in the Pacific Ocean. Brackish water desalination is recognized as one of the most attractive methods to develop alternative water supply.
2.2. Brackish Water Desalination by RO Process
Desalination is a process that removes dissolved minerals (including salts) from seawater or brackish water. Seawater has a total dissolved solids (TDS) concentration of about 35,000 milligrams per liter (mg/L). Brackish water has a TDS concentration between 1,000 mg/L and 10,000 mg/L. Water is considered fresh when its TDS concentration is below 500 mg/L, which is the secondary drinking water standard in the United States. Salinity is sometimes expressed by the water’s chloride concentration, which is about half of its TDS concentration.
Desalination process is an important element of the hydrologic cycle, which provides the freshwater supply for the entire world. In the hydrologic cycle, water is brought to the earth’s surface by precipitation and returned, free of dissolved minerals, to the atmosphere by evaporation and condensation. Water desalination to produce potable water from seawater or brackish water by engineered processes has become increasingly important because many regions

5
throughout the world suffer from water shortages. The capacity of installed desalination plants around the world at the end of 1966 was 200,000 cubic meters per day (53 million gallons per day). By 1998, it had increased to 22,700,000 cubic meters per day (6 billion gallons per day).
Existing water desalination processes are based on either thermal or membrane technology (Liu and Park, 2002). Multistage effect distillation (MED) and multistage flash distillation (MFD) are the two most popular water desalination processes using thermal technology. Thirty years ago, MED and MSF comprised about 70% of the world’s water desalination capacity (Wangnick, 1996). Because of major advancements in membrane technology, most water desalination plants built in the last 30 years used membrane technology such as reverse osmosis (RO), electrodialysis, and nanofiltration (NF) (Gutman, 1987). In addition to their use in water desalination systems, RO and NF are commonly used as advanced treatment processes of water and wastewater. The RO process is also used frequently by the pharmaceutical industry, the electronics industry, and research laboratories to produce ultra high-purity water (Parekh, 1988).
One major problem with both the MFD and MED processes is scale formation. Because substances such as calcium sulfate in feed water have low solubility in warmer water, they leave solution as the temperature rises. Scales then form on the equipment surface. Using a lower operating temperature can reduce the scale problem but not without decreasing the thermal efficiency. More research and development on scale control are needed.
A major problem in the membrane processes is fouling, which is the plugging of membrane surfaces over time by organic and inorganic substances present in the feed water. Fouling prevention requires the pre-treatment of feed water or the addition of antiscalants. The three most common membrane-cleaning methods are hydraulic, mechanical, and chemical. In hydraulic cleaning, the flow direction (back-flushing) is changed to remove fouling at the membrane surface. Mechanical cleaning is accomplished with sponge balls. In chemical cleaning, the membrane is washed with chemical agents, such as acid for mineral scale or alkali for organic matter (Mulder, 1996). New fouling resistant membrane materials are being developed by studying the physicochemical and biological interactions between membrane surface and foulants and anti-fouling agents.
The RO process is energy intensive. Energy consumption per unit of product water would be even higher as the scale of production decreases because energy-saving devices, such as pressure-recovery turbines, could not be applied in a small-scale operation. Thus, the conventional RO desalination process using seawater as the feed water was determined to be less competitive for small Pacific islands and other remote communities. To address this problem, studies were conducted for the development of cost-effective desalination systems, which use
6
brackish water instead of seawater as feed water (Liu et al., 2002) and use renewable energy instead of electricity to power the system operation (Hicks et al., 1989; Abdul-Fattah, 1986; Feron, 1985; Kelogg et al., 1998; Robinson et al., 1992; Weiner et al., 2001; and Liu et al., 2002).
The osmotic pressure difference between feed water and product water (or permeate) can be calculated by the following equation (Reynolds and Richards, 1996):
(1)
where ∆π = osmotic pressure
Based on equation (1), the osmotic pressure of seawater at a TDS concentration of 35,000 mg/L is about 2,700 kilopascals (kPa) (395 pounds per square inch [psi]). Use of brackish water as feed water for the RO desalination process would give a smaller ∆π. Thus, brackish water desalination would require smaller applied pressure than seawater desalination. The osmotic pressure of brackish water at a TDS concentration of 3,000 mg/L is only about 230 kPa (30 psi).
2.3. Renewable Energy and Desalination
2.3.1. Desalination Driven by Photovoltaic Solar Panel and Ocean Thermal Energy United States receives a daily average solar radiation of about 1,500 British thermal units per square foot (406 calories per square centimeter) on the ground. Photovoltaic (PV) solar panels convert light energy of solar radiation (photons) into electricity (voltage) at the atomic level (Glueckstern, 1995) and are the most popular method of solar energy utilization.
Small-scale PV desalination systems with either an electrodialysis or RO process have been designed and tested (Abdul-Fattah, 1986). In a PV/RO system, the PV array provides electric power to the RO plant to raise feed water pressure. Voltage regulation and the use of storage batteries permit delivery of electrical energy at a constant rate despite the daily sunlight variation. A PV/RO desalination plant built in Saudi Arabia in 1981 produces a freshwater flow of 850 gpd, with feed water TDS concentration of 42,800 parts per million (ppm).
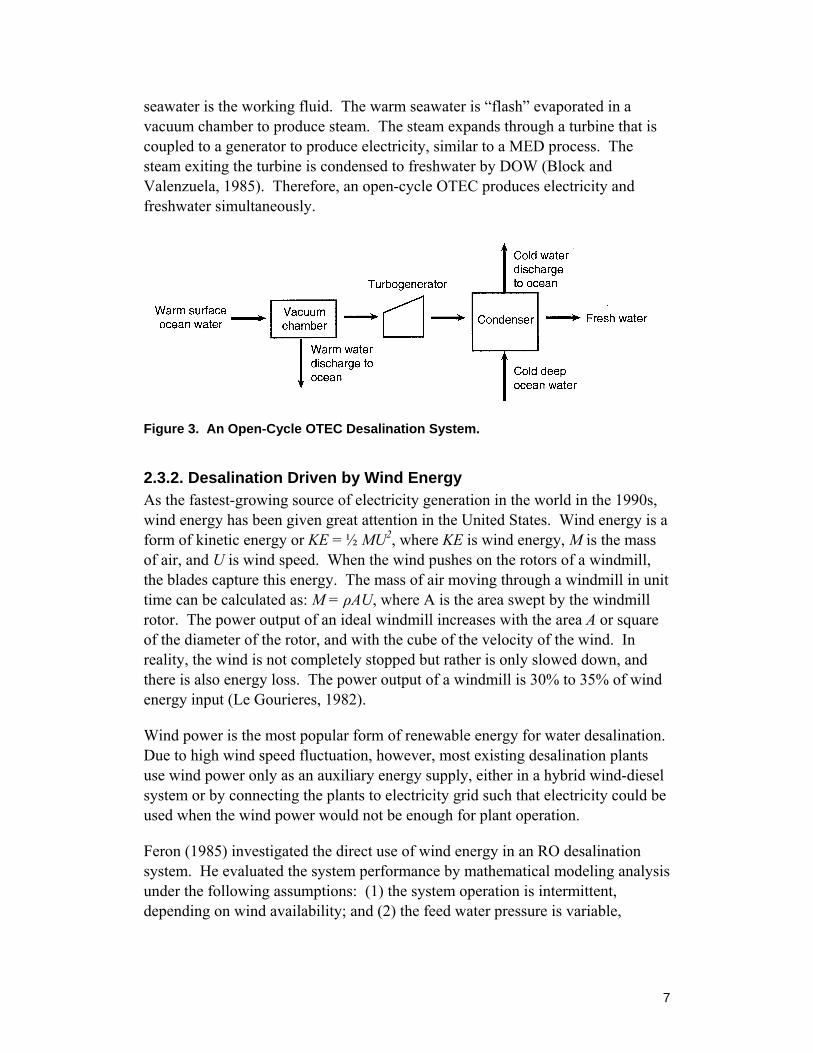
Deep ocean water (DOW) at a depth of 1,000 m or lower is cold, nutrient rich, and free of pathogenic bacteria; it is considered an important natural resource (Liu, 1999). Ocean thermal energy conversion (OTEC) is a process that uses the ocean’s natural thermal gradient between surface water and DOW to drive a power-producing cycle (figure 3). In an open-cycle OTEC system, warm
( )productfeed TDSTDS078.0 −=πΔ
7
seawater is the working fluid. The warm seawater is “flash” evaporated in a vacuum chamber to produce steam. The steam expands through a turbine that is coupled to a generator to produce electricity, similar to a MED process. The steam exiting the turbine is condensed to freshwater by DOW (Block and Valenzuela, 1985). Therefore, an open-cycle OTEC produces electricity and freshwater simultaneously.
Figure 3. An Open-Cycle OTEC Desalination System.
2.3.2. Desalination Driven by Wind Energy As the fastest-growing source of electricity generation in the world in the 1990s, wind energy has been given great attention in the United States. Wind energy is a form of kinetic energy or KE = ½ MU2, where KE is wind energy, M is the mass of air, and U is wind speed. When the wind pushes on the rotors of a windmill, the blades capture this energy. The mass of air moving through a windmill in unit time can be calculated as: M = ρAU, where A is the area swept by the windmill rotor. The power output of an ideal windmill increases with the area A or square of the diameter of the rotor, and with the cube of the velocity of the wind. In reality, the wind is not completely stopped but rather is only slowed down, and there is also energy loss. The power output of a windmill is 30% to 35% of wind energy input (Le Gourieres, 1982).
Wind power is the most popular form of renewable energy for water desalination. Due to high wind speed fluctuation, however, most existing desalination plants use wind power only as an auxiliary energy supply, either in a hybrid wind-diesel system or by connecting the plants to electricity grid such that electricity could be used when the wind power would not be enough for plant operation.
Feron (1985) investigated the direct use of wind energy in an RO desalination system. He evaluated the system performance by mathematical modeling analysis under the following assumptions: (1) the system operation is intermittent, depending on wind availability; and (2) the feed water pressure is variable,
8
depending on the prevailing wind speed. Results derived by Feron (1985) were largely theoretical and were not verified with experimental data.
A small-scale wind-powered RO system was later constructed and tested by Robinson et al. (1992). Freshwater production by their system was only 0.5 to 1.0 cubic meters per day, which is the estimated volume needed by a typical remote community in Australia. A pressure vessel to store the feed water under pressure was included in their system. There was no feedback control mechanism for the system operation, and when the wind speed was low, a small diesel or portable gasoline pump must be used.
Cost analysis of a wind-assisted RO system for desalinating brackish ground water in Jordan was conducted by Habali and Saleh (1994). The high-pressure pump of the system was powered by either a diesel engine or a wind-energy converter. There was no actual field testing of the system. Instead, the analysis was based on measured wind-speed distribution and power curves of the wind-energy converter in Jordan. Their study found that it would cost less to desalinate brackish water with a wind-assisted RO system than with a conventional, diesel-powered RO system.
An analytical study of utilizing wind power for RO desalination was conducted by Kiranousdis et al. (1997). Generalized design curves for processing structural and operation variables were derived. The study indicated that the unit cost of freshwater production by a conventional RO plant could be reduced up to 20% for regions with an average wind speed of 5 meters per second (m/s) or higher.
9
3. Conclusions and Recommendations 1. A prototype brackish water desalination system, which is ready for real world
application, was developed and tested. This system is entirely driven by renewable energy—it uses wind energy to drive RO desalination process and uses solar energy to drive the instruments of the system.
2. With a two-stage, wind-driven pumping mechanism, the system developed by this project can provide two different levels of operating water pressure—one for the pre-treatment process and the other one for the RO process.
3. A system feedback control module was developed by this project, which consists of a data logger, a PC computer, and a number of flow, wind speed, pressure, and salinity sensors. The control module operates the system and allows continuous operation under varying wind speeds and feed water salinity.
4. The water can produce freshwater at a TDS of less than 200 mg/L from brackish feed water with a TDS of over 3,000 mg/L. The average rejection rate was about 94%, and the average recovery ratio was about 25%.
5. A pilot plant of renewable energy driven desalination was designed. It is recommended that this pilot plant will be constructed on Ewa Beach on Oahu, Hawaii. A cost analysis indicates that the pilot plant can produce freshwater at a rate of 1,285,000 gallons per year (gal/yr) at the cost of $5.40 per 1,000 gal.


11
4. Work Performed This project extended the previous research on a wind-powered brackish water desalination system at the University of Hawaii and made this system ready for real world application.
Work performed by this project includes: (1) designing a modified system, (2) constructing the modified system on Coconut Island test site, (3) conducting field experiments with the modified system, (4) analyzing experimental results, and (5) preparing a pilot plant design.


13
5. Research Scope and Tasks This proposed project aims to develop a simple, cost-effective water desalination system for small Pacific islands and other remote coastal communities where both freshwater and conventional electricity are in short supply. The proposed system is driven entirely by renewable energy. It uses wind energy directly as kinetic energy to drive brackish water through pre-treatment units and a RO desalination unit. Solar PV energy is used to power the system’s data acquisition and control instruments.
Pre-treatment of feed water such as chemical conditioning and multimedia filtration must be provided if the system is used to desalinate brackish ground water. Under these conditions, different water pressures would be required for pre-treatment and for RO processing. Therefore, the first major task of this research project was to modify the existing system in order to provide two different levels of operating water pressures; one is used by pre-treatment, and the other one is used for RO processing.
Although the working pressure for RO membrane processes of the system is provided by wind energy, conventional electricity was used to run the system instruments for data acquisition and control in the initial work. The second task of this research project was to incorporate to the system a solar PV energy unit to power the data acquisition and control instruments.
The rate of flow entering the pressure stabilizer depends on wind speed, which is highly variable. System operation is interrupted when the speed of prevailing wind diminishes. Also, in real application of brackish water desalination, the feed water is derived from the transition zone of a coastal ground water or from other brackish water sources. Continuous pumping would cause the salinity of feed water to vary. The third task of this research project was to develop and install a feedback control module such that the system could be operated satisfactorily under varying environmental conditions of wind speed and feed water salinity.
The fourth task of this research project was to examine three potential sites for the construction and operation of a pilot plant of RO brackish water desalination, driven by renewable energy. The fifth task of this research project was to conduct a cost analysis for the pilot plant at the selected site.
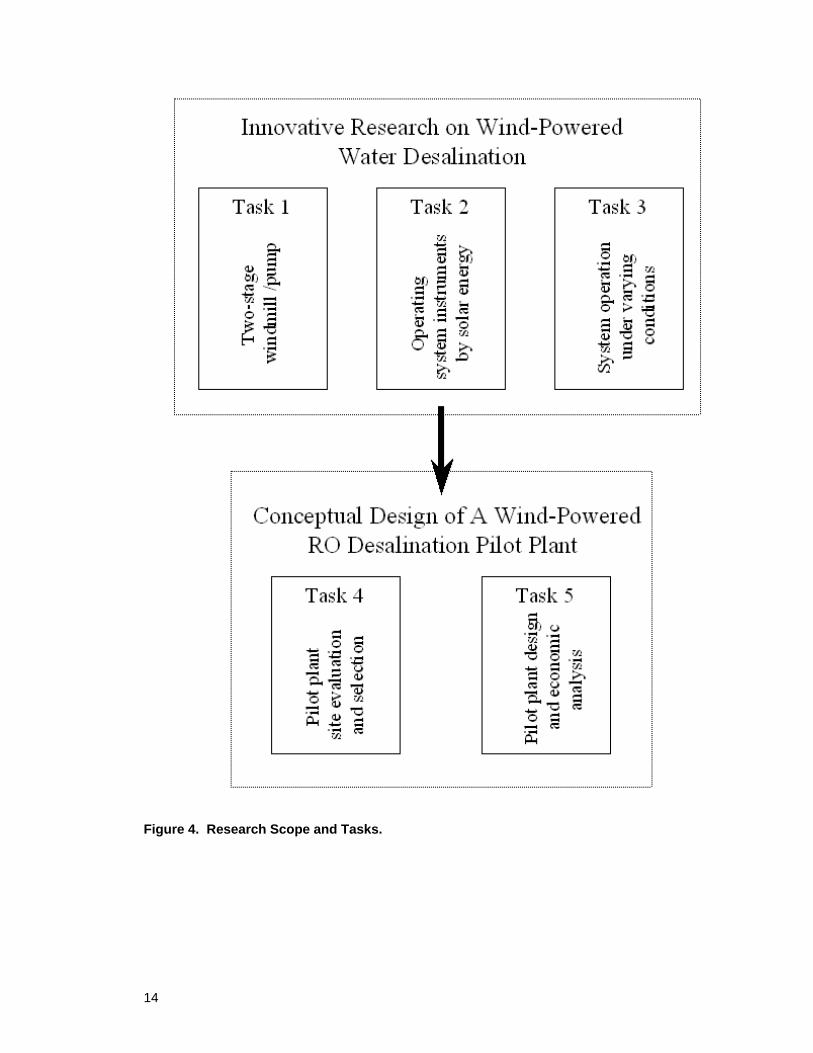
The scope of the project is shown in figure 4, which also shows the research tasks and their relationships.
14
Figure 4. Research Scope and Tasks.
15
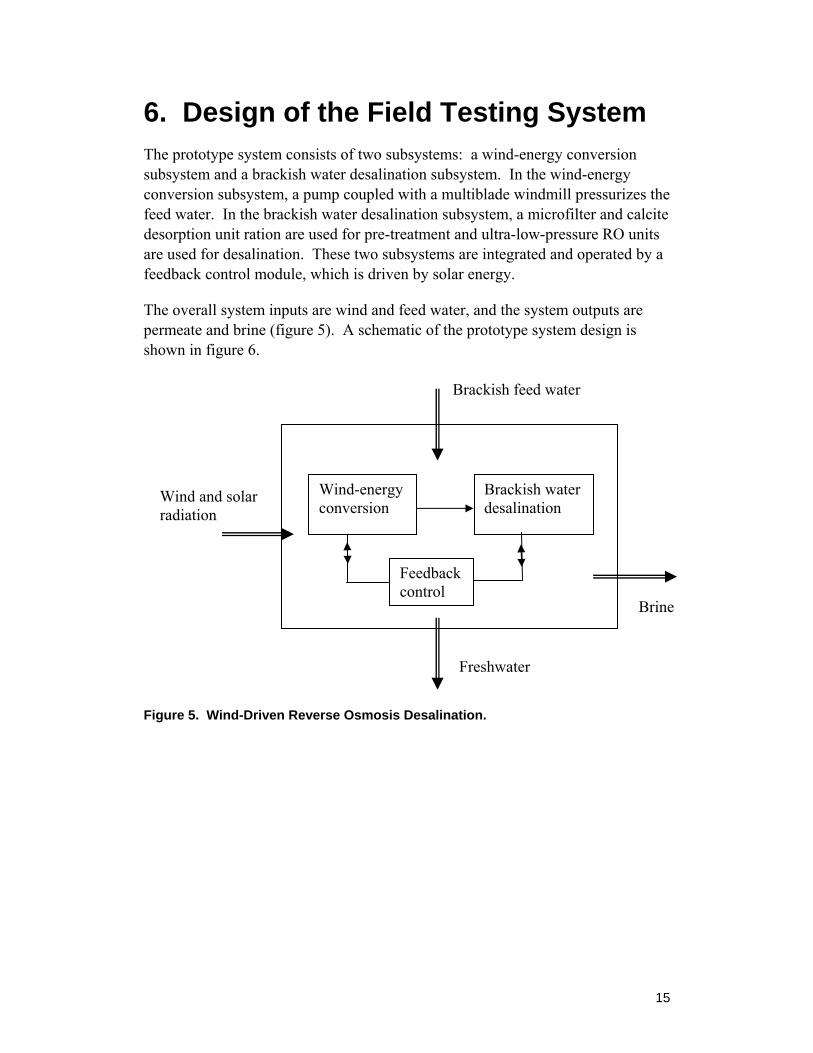
6. Design of the Field Testing System The prototype system consists of two subsystems: a wind-energy conversion subsystem and a brackish water desalination subsystem. In the wind-energy conversion subsystem, a pump coupled with a multiblade windmill pressurizes the feed water. In the brackish water desalination subsystem, a microfilter and calcite desorption unit ration are used for pre-treatment and ultra-low-pressure RO units are used for desalination. These two subsystems are integrated and operated by a feedback control module, which is driven by solar energy.
The overall system inputs are wind and feed water, and the system outputs are permeate and brine (figure 5). A schematic of the prototype system design is shown in figure 6.
Figure 5. Wind-Driven Reverse Osmosis Desalination.
Brackish water desalination
Feedback control
Brackish feed water
Freshwater
Wind and solar radiation
Brine
Wind-energy conversion

16
Column
Pump
Electric Power Supply Line/Data Transportation Line
Ground Surface
Solenoid Valve Conductivity Sensor
3-Way ValveNote: Flow/Pressure Sensor
Feedback Control Module
Brackish Water Desalination Subsystem
Wind-Energy Conversion Subsystem
Feedwater
Pretreated Water
PressureTank
Brackish Water
Computer Center
Data Loger CR10X
Photovoltaic System
Solar Energy
Windmill
Fresh
Brine
RO ModulesPretreatment
Figure 6. Schematic of the Field Testing System of Wind-Driven Desalination.
6.1. Wind-Energy Conversion Subsystem
The wind-energy conversion subsystem, consisting of a windmill/pump and a stabilizer, convert wind energy to the hydraulic head (or energy) of feed water (figure 7).
The wind-energy conversion subsystem developed by this project can provide two-stage pumping. During the stage 1 operation, the windmill drives a piston pump, which raises the pressure of feed water to a range of 20-50 psi for pre-treatment. During stage 2 operation, the windmill drives a piston pump which raises the pressure of pre-treated water to a range of 70-105 psi for desalination.
Highly variable wind speed and the pulsating discharge characteristics of the piston pump could cause an unstable feed water flow rate and pressure that could result in operational failure. A stabilizer was used to maintain a steady feed water flow by reducing excessive fluctuation of the pressure and the flow rate.

17
First Stage Flow Path
Pressure Sensor
Q1
First Stage Flow Path
Second Stage Flow Path Feedback Control Module
Brackish Water Desalination Subsystem
FlowSensor Q2
FlowSensor
Windspeed Sensor
Pump
Feedwater
Pretreated Water
PressureTank
Brackish Water
Windmill
Figure 7. Schematic of the Design of a Wind-Energy Conversion Subsystem.
6.1.1. Pressure Stabilizer A pressure stabilizer is a special design of a pressure vessel in which the pressure is accumulated to a specific (operating) pressure and held relatively constant by adjusting the outflow rate. For the special case where the average inflow rate to the stabilizer is constant, the outflow rate and pressure will also be constant. The primary purpose of the pressure stabilizer is to act as a hydraulic shock absorber to stabilize the inflow to produce a continuous constant outflow of constant pressure.
The proper design of a pressure vessel should follow the code presented by the American Society of Mechanical Engineers Code Section VIII, Division 1 (Moss, 1987). The construction of a pressure vessel depends on many factors, which include the material selection, internal pressure, external conditions, design, and fabrication process.
The stabilizer used by this project is a hydropneumatic pressure tank with an inside diameter of 0.562 m (22-1/8 inches), an outside diameter of 0.572 m (22-1/2 inches), and a height of 1.143 m (45 inches) (see figure 14, which appears later in this chapter). Its total volume is 0.3 m3 (75 gal), an amount sufficient to
18
store the estimated maximum hourly flow. It was constructed with a conventional vertical pressure vessel with a cylindrical welded shell, flat circular ends, and a ring pedestal base. The shell is 0.005 m (3/16 inch) thick, and the heads, made of American Society for Testing and Materials A 36 steel, are 0.006 m (1/4 inch) thick. The stabilizer is pre-charged with air by injecting air under pressure into the empty tank before it is operated together with the wind pump. As water is delivered to the tank, the air in the tank is compressed, exerting pressure on the water. To eliminate “water-logging” problems, a diaphragm or a bladder separates the air and water in the tank.
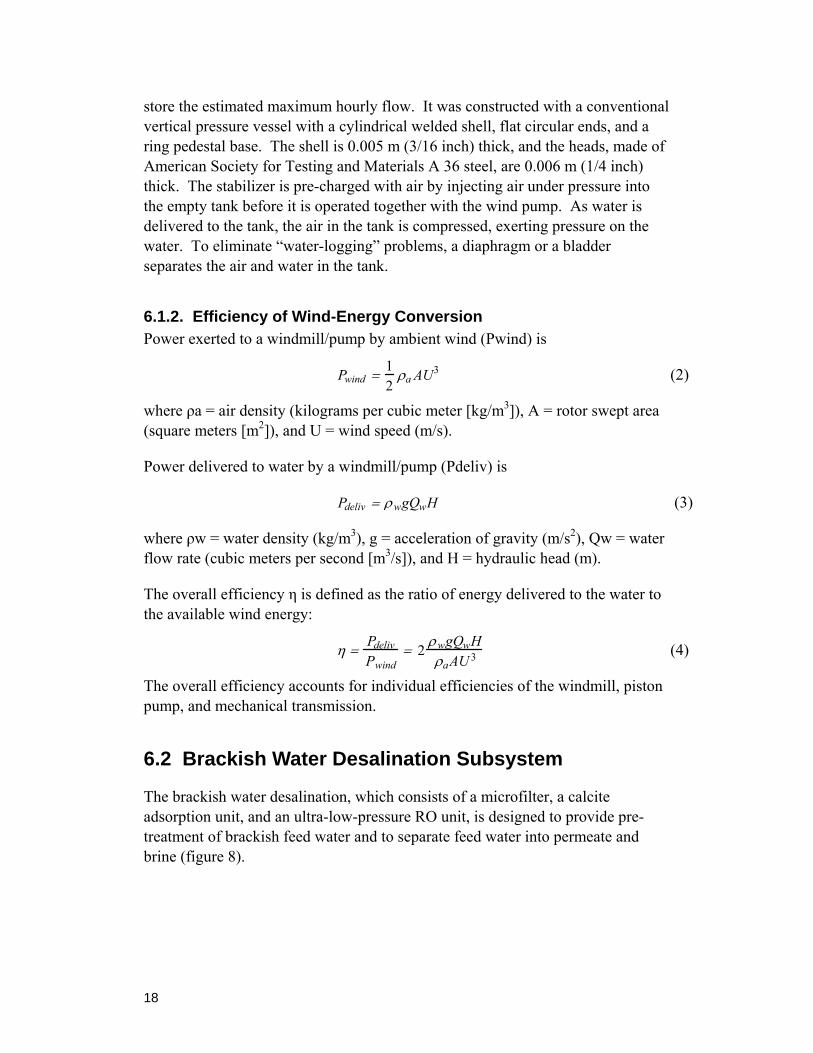
6.1.2. Efficiency of Wind-Energy Conversion Power exerted to a windmill/pump by ambient wind (Pwind) is
Pwind = 12ρa AU3 (2)
where ρa = air density (kilograms per cubic meter [kg/m3]), A = rotor swept area (square meters [m2]), and U = wind speed (m/s).
Power delivered to water by a windmill/pump (Pdeliv) is
Pdeliv = ρwgQwH (3)
where ρw = water density (kg/m3), g = acceleration of gravity (m/s2), Qw = water flow rate (cubic meters per second [m3/s]), and H = hydraulic head (m).
The overall efficiency η is defined as the ratio of energy delivered to the water to the available wind energy:
η = PdelivPwind
= 2 ρwgQwHρaAU 3 (4)
The overall efficiency accounts for individual efficiencies of the windmill, piston pump, and mechanical transmission.
6.2 Brackish Water Desalination Subsystem
The brackish water desalination, which consists of a microfilter, a calcite adsorption unit, and an ultra-low-pressure RO unit, is designed to provide pre-treatment of brackish feed water and to separate feed water into permeate and brine (figure 8).

19
Salinity Sensor
Feedback Control Module
Q3
Q4 Q5
Adsorption Column
Wind-Energy Conversion Subsystem
Fresh
Brine
RO ModulesMicrofilter
Figure 8. Schematic of the Brackish Water Desalination Subsystem. Feed water pre-treatment is applied to maximize the RO system efficiency and membrane life by minimizing fouling, scaling, and membrane degradation. The degree of pre-treatment depends on the quality of the feed water, which to a large extent depends on the feed water source. In general, well water requires simple pre-treatment, such as adsorption, and microfiltration (Redondo and Lomax, 1997). On the other hand, pre-treatment of surface water usually requires additional steps such as polymer addition, clarification, and microfiltration or ultrafiltration.
Desorption is used as a pre-treatment process by using calcites as sorbents for the removal of silica and humic acid in feed water. Microfiltration is used as a pre-treatment process by using a 5-micrometer (µm) microfilter. Both desorption and microfiltration processes can be operated under operating pressure of at least 172-374 kPa (20-50 psi). One major research task of this project is to provide dual water pressures for pre-treatment at 172-374 kPa (20-50 psi) and for RO processing at 517-724 kPa (75-105 psi).
The amount of water produced by RO is a function of its membrane type including its surface area and mass-transfer coefficient (water permeation coefficient), the applied pressure, and the concentration of the feed water. The pressure is applied to overcome the osmotic pressure. Osmotic pressure across a semipermeable membrane, which separates seawater (TDS of 35,000 mg/L) and freshwater (TDS of 50 mg/L), is about 2,700 kPa. On the other hand, the osmotic
20
pressure across a semipermeable membrane, separating a brackish water with TDS of 2,500 mg/L and freshwater, is only about 190 kPa. Therefore, brackish water desalination by the RO process would consume much less energy than seawater desalination.
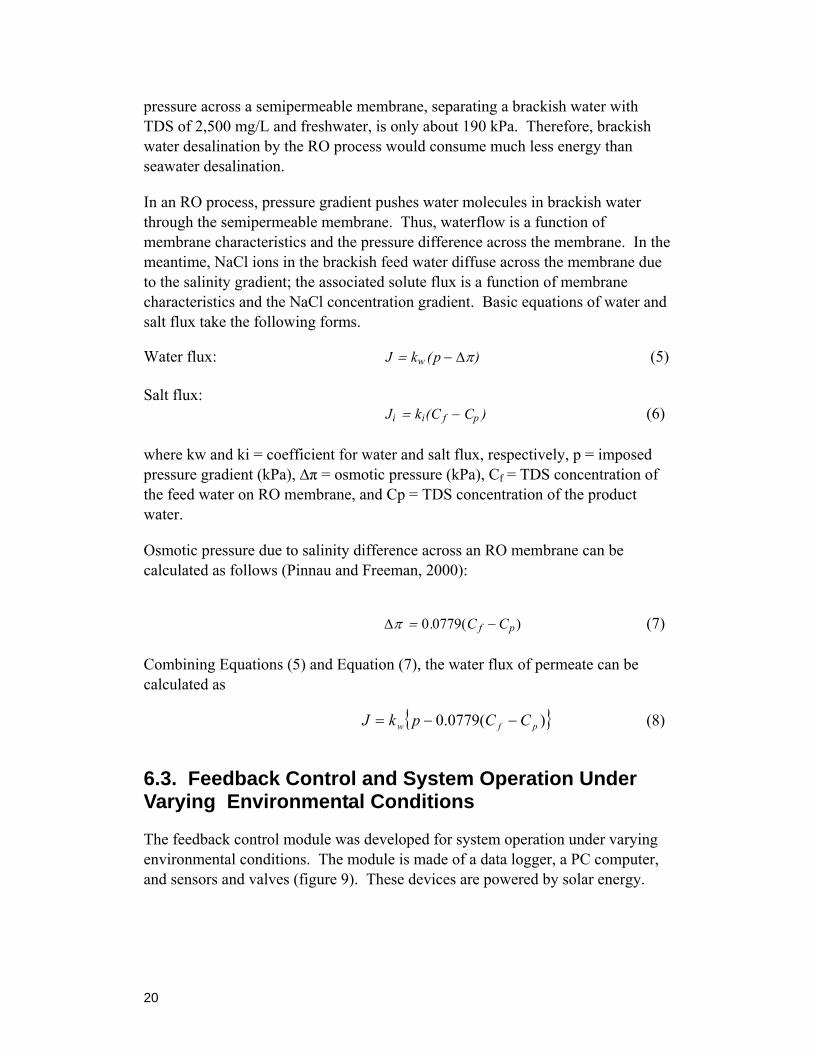
In an RO process, pressure gradient pushes water molecules in brackish water through the semipermeable membrane. Thus, waterflow is a function of membrane characteristics and the pressure difference across the membrane. In the meantime, NaCl ions in the brackish feed water diffuse across the membrane due to the salinity gradient; the associated solute flux is a function of membrane characteristics and the NaCl concentration gradient. Basic equations of water and salt flux take the following forms.
Water flux: J = kw (p− Δπ) (5) Salt flux: Ji = ki(C f − Cp ) (6) where kw and ki = coefficient for water and salt flux, respectively, p = imposed pressure gradient (kPa), ∆π = osmotic pressure (kPa), Cf = TDS concentration of the feed water on RO membrane, and Cp = TDS concentration of the product water.
Osmotic pressure due to salinity difference across an RO membrane can be calculated as follows (Pinnau and Freeman, 2000):
Δπ = 0.0779(C f − Cp) (7) Combining Equations (5) and Equation (7), the water flux of permeate can be calculated as
{ })(0779.0 pfw CCpkJ −−= (8)
6.3. Feedback Control and System Operation Under Varying Environmental Conditions
The feedback control module was developed for system operation under varying environmental conditions. The module is made of a data logger, a PC computer, and sensors and valves (figure 9). These devices are powered by solar energy.

21
Brackish Water Desalination Subsystem (with Control Sensors)
Wind-Energy Conversion Subsystem (with Control Sensors)
Computer Center
Data Loger CR10X
Photovoltaic Panel
Solar Energy
Figure 9. Schematic of Feedback Control Module.
6.3.1 Selection of a Photovoltaic Solar Module A PV panel was used to provide energy to operate control instruments including valves, a data logger, sensors, relays, and a PC computer. Table 1 gives an inventory of energy requirement.
Table 1. Total Energy Consumption when Control System is in Full Operation
Component Quantity Watt/Item Watt
Valves 5 17 85.0
Data logger 1 1.2 1.2
Sensors 8 0.04 0.3
Relays 6 0.12 0.7
Computer 1 19 19.0
Total maximum needed 106.2 Energy consumption of 106.2 watts, as shown in table 1, is the maximum value. The actual energy needed would usually be less. Only part of the control instruments are in operation as system operating pressure varies.
A Shell SQ75 PV solar panel was installed and connected to the system (figure 9). This module contains 36 series connected 125- by 125-millimeter (mm) PowerPax monocrystalline silicon solar cells. The shell SQ75 can generate a peak power of 75 watts at 17 volts. According to the Inter Island Solar Manual (http://www.state.hi.us/dbedt/ert/solar-maps.html), an average sun hour around Coconut Island is about 4.5. Therefore, the total power that can be produced by the panel is about 338 watt-hours.
22
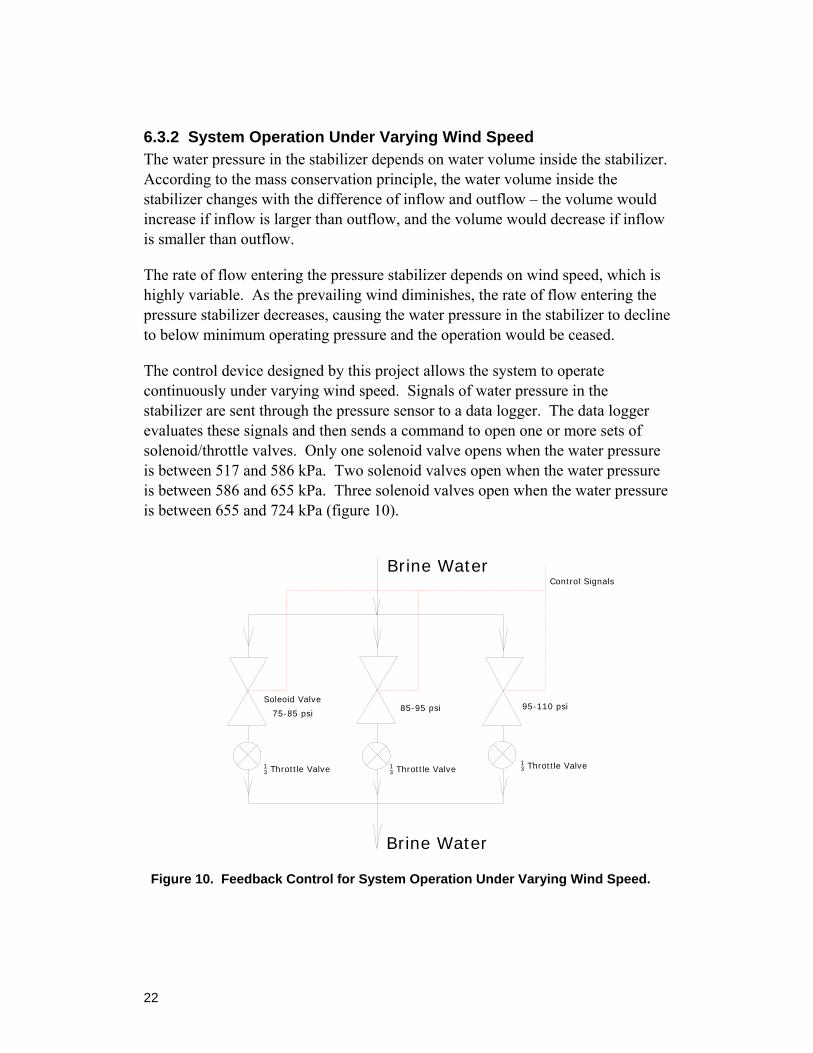
6.3.2 System Operation Under Varying Wind Speed The water pressure in the stabilizer depends on water volume inside the stabilizer. According to the mass conservation principle, the water volume inside the stabilizer changes with the difference of inflow and outflow – the volume would increase if inflow is larger than outflow, and the volume would decrease if inflow is smaller than outflow.
The rate of flow entering the pressure stabilizer depends on wind speed, which is highly variable. As the prevailing wind diminishes, the rate of flow entering the pressure stabilizer decreases, causing the water pressure in the stabilizer to decline to below minimum operating pressure and the operation would be ceased.
The control device designed by this project allows the system to operate continuously under varying wind speed. Signals of water pressure in the stabilizer are sent through the pressure sensor to a data logger. The data logger evaluates these signals and then sends a command to open one or more sets of solenoid/throttle valves. Only one solenoid valve opens when the water pressure is between 517 and 586 kPa. Two solenoid valves open when the water pressure is between 586 and 655 kPa. Three solenoid valves open when the water pressure is between 655 and 724 kPa (figure 10).
13 Throttle Valve 13 Throttle Valve
95-110 psi85-95 psi75-85 psi
Control Signals
13 Throttle Valve
Brine Water
Soleoid Valve
Brine Water
Figure 10. Feedback Control for System Operation Under Varying Wind Speed.
23
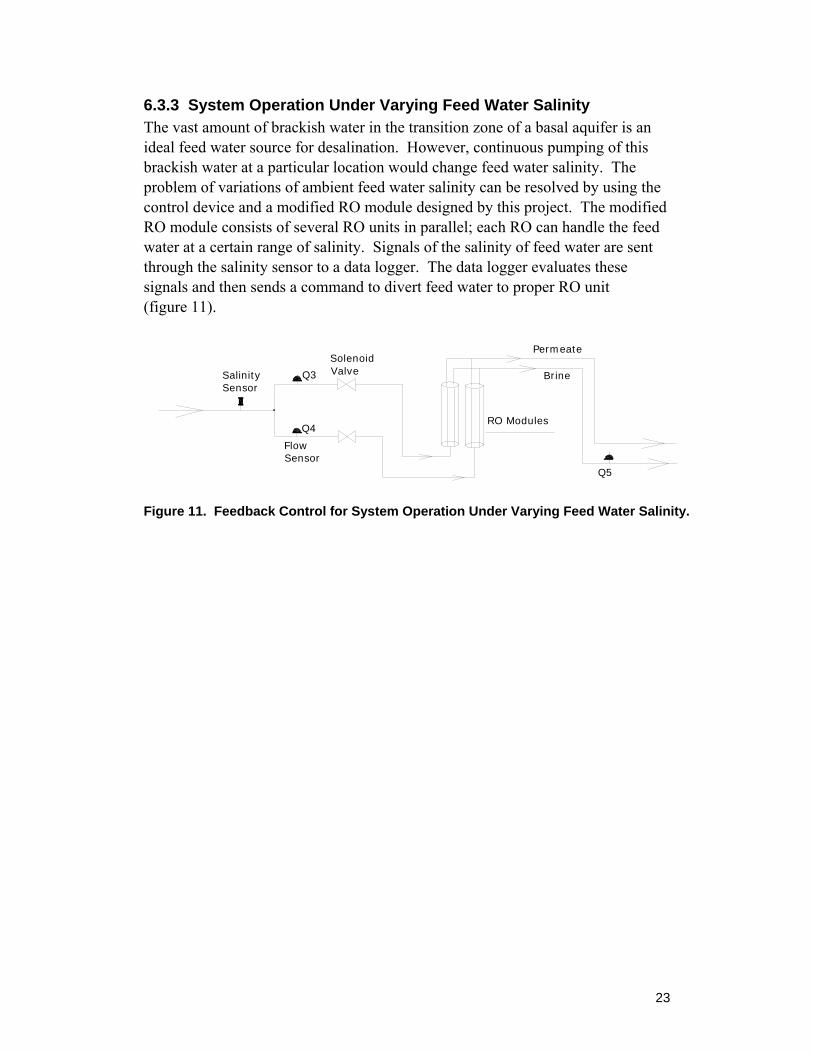
6.3.3 System Operation Under Varying Feed Water Salinity The vast amount of brackish water in the transition zone of a basal aquifer is an ideal feed water source for desalination. However, continuous pumping of this brackish water at a particular location would change feed water salinity. The problem of variations of ambient feed water salinity can be resolved by using the control device and a modified RO module designed by this project. The modified RO module consists of several RO units in parallel; each RO can handle the feed water at a certain range of salinity. Signals of the salinity of feed water are sent through the salinity sensor to a data logger. The data logger evaluates these signals and then sends a command to divert feed water to proper RO unit (figure 11).
Flow Sensor
Solenoid ValveSalinity
Sensor
Q4
Q3
Q5
Permeate
Brine
RO Modules
Figure 11. Feedback Control for System Operation Under Varying Feed Water Salinity.

25
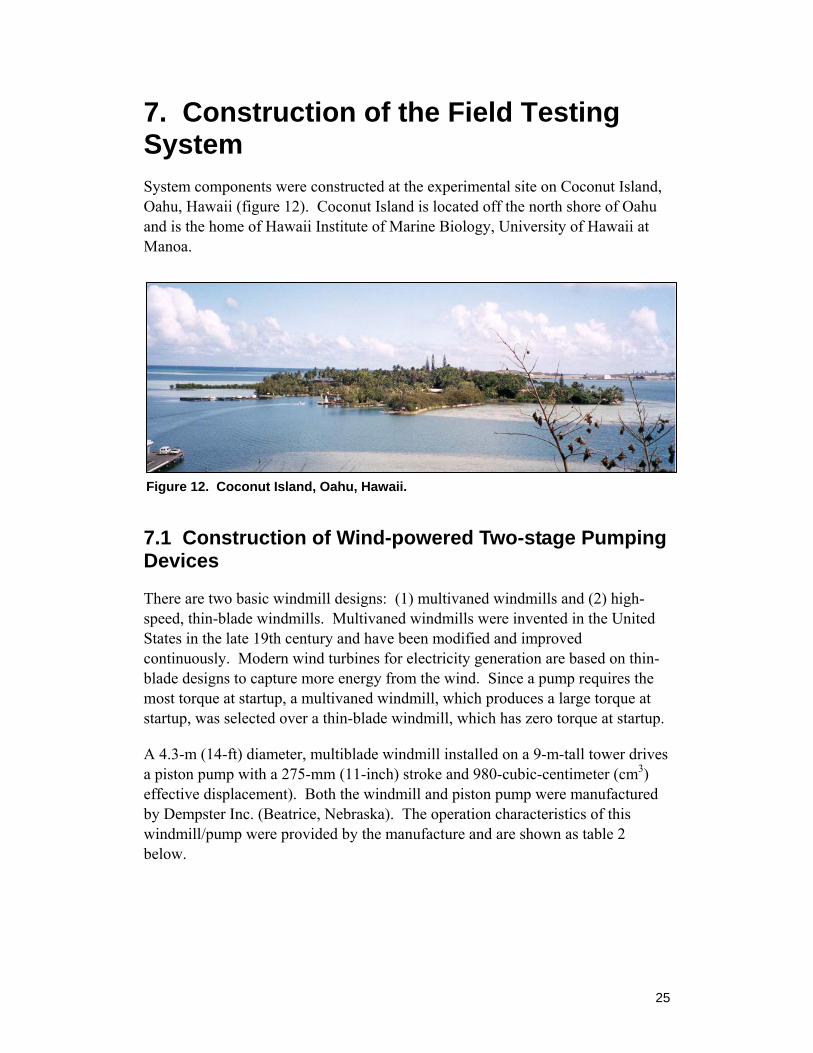
7. Construction of the Field Testing System System components were constructed at the experimental site on Coconut Island, Oahu, Hawaii (figure 12). Coconut Island is located off the north shore of Oahu and is the home of Hawaii Institute of Marine Biology, University of Hawaii at Manoa.
7.1 Construction of Wind-powered Two-stage Pumping Devices
There are two basic windmill designs: (1) multivaned windmills and (2) high-speed, thin-blade windmills. Multivaned windmills were invented in the United States in the late 19th century and have been modified and improved continuously. Modern wind turbines for electricity generation are based on thin-blade designs to capture more energy from the wind. Since a pump requires the most torque at startup, a multivaned windmill, which produces a large torque at startup, was selected over a thin-blade windmill, which has zero torque at startup.
A 4.3-m (14-ft) diameter, multiblade windmill installed on a 9-m-tall tower drives a piston pump with a 275-mm (11-inch) stroke and 980-cubic-centimeter (cm3) effective displacement). Both the windmill and piston pump were manufactured by Dempster Inc. (Beatrice, Nebraska). The operation characteristics of this windmill/pump were provided by the manufacture and are shown as table 2 below.
Figure 12. Coconut Island, Oahu, Hawaii.

26
Table 2. Operation Characteristics Table for 14-ft Dempster Windmill
Cylinder Size (diameter, inches) 1-7/8 2 2-1/4 2-1/2 2-3/4 3
G.P.H 132 147 185 230 278 330
Elevation (ft) 696 546 432 360 312 264 10-inch stroke
Maximum pressure (psi) 302 237 187 156 135 114
G.P.H 159 176 222 276 334 396
Elevation (ft) 580 455 360 300 260 220 12-inch stroke
Maximum pressure (psi) 251 197 156 130 113 95 Construction of windmill/pump at the experimental site on Coconut Island is shown in figure 13.
Figure 13. Construction of Dempster Multivaned Windmill on Coconut Island Experimental Site. A stabilizer was used to maintain a steady feed water flow by reducing excessive fluctuation of the pressure and the flow rate. Otherwise, the highly variable wind speed and the pulsating discharge characteristics of the piston pump could cause an unstable feed water flow rate and pressure that could result in operational failure.
The stabilizer developed by the University of Hawaii is a kind of hydropneumatic pressure tank with a 0.3-m3 inner volume (figure 14). It yields a mean hydraulic detention time of about 30 minutes under design conditions.
(a) Under construction (b) Completed

27
The wind-energy conversion subsystem developed by this project can provide two-stage pumping (figure 15). During the stage 1 operation, the windmill drives a piston pump, which raises the pressure of feed water to a range of 172-374 kPa (20-50 psi). The actual feed water pressure, depending on types and levels of pre-treatment, is controlled by a pressure/flow stabilizer. After pre-treatment, the water is stored in a tank of pre-treated water as shown in figure 16. The volume or water level in the pre-treated tank is controlled by a pressure transducer. When the water level reaches a pre-set value, the control mechanism will shut off the first-stage pumping and start the second-stage pumping. During stage 2 operation, the windmill drives a piston pump, which raises the pressure of pre-treated water to a range of 517-724 kPa (70-105 psi). At this pressure, the pre-treatment water will flow through the RO module.
Figure 15. Construction of Wind-Powered Two-Stage Pumping.
Figure 14. Stabilizer with Control Sensors and Data Logger.
(a) Under construction (b) Completed
28
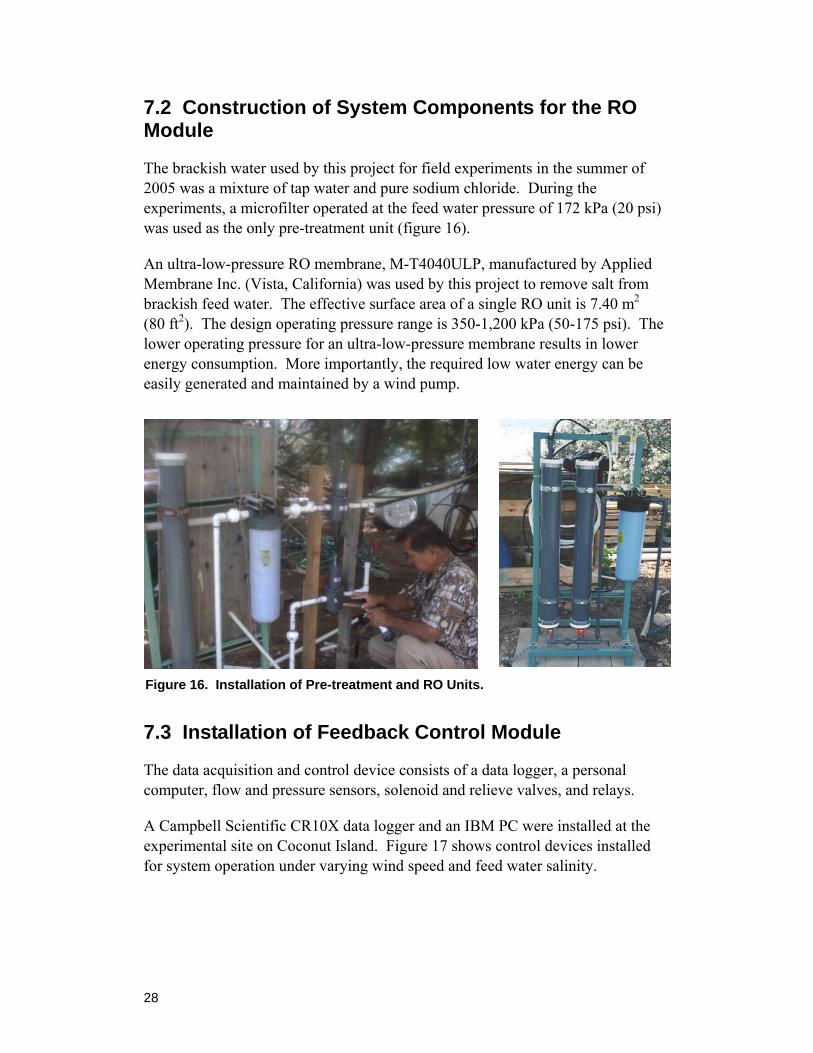
7.2 Construction of System Components for the RO Module
The brackish water used by this project for field experiments in the summer of 2005 was a mixture of tap water and pure sodium chloride. During the experiments, a microfilter operated at the feed water pressure of 172 kPa (20 psi) was used as the only pre-treatment unit (figure 16).
An ultra-low-pressure RO membrane, M-T4040ULP, manufactured by Applied Membrane Inc. (Vista, California) was used by this project to remove salt from brackish feed water. The effective surface area of a single RO unit is 7.40 m2 (80 ft2). The design operating pressure range is 350-1,200 kPa (50-175 psi). The lower operating pressure for an ultra-low-pressure membrane results in lower energy consumption. More importantly, the required low water energy can be easily generated and maintained by a wind pump.
7.3 Installation of Feedback Control Module
The data acquisition and control device consists of a data logger, a personal computer, flow and pressure sensors, solenoid and relieve valves, and relays.
A Campbell Scientific CR10X data logger and an IBM PC were installed at the experimental site on Coconut Island. Figure 17 shows control devices installed for system operation under varying wind speed and feed water salinity.
Figure 16. Installation of Pre-treatment and RO Units.

29
7.4 Installation of Solar PV Panel
A solar PV panel was installed to power the data acquisition and feedback control mechanisms. Acquisition and control devices were originally designed for operation by alternating current (AC), but the power produced by the PV panels is direct current (DC). Therefore, the DC power produced must be converted to AC via a voltage inverter. A photograph of a solar energy driven data acquisition and control module is shown in figure 18.
(a) Data logger and PC (c) Salinity control (b) Wind speed control
Figure 17. Control Devices for System Operation Under Varying Wind Speed and Feed Water Salinity.
Solar panel
Battery, Inverter, Controller
Figure 18. Photovoltaic Solar Installed at the Experimental Site.

30
7.5 Installation of a Carbon-Adsorption Pre-treatment Unit
A research task 6—system operation with feed water containing silica and humic acids—was added to the project as part of the second no-cost extension. This research task investigates fouling prevention by pre-treatment to remove silica and humic acids from feed water. A diagram of expanded research work scope, including this added task, is shown as below:
Figure 19. Modified Research Scope and Tasks.
The carbon filter has a diameter of 30.48 cm (12 inches) and a packing depth of 35 cm (13.8 inches).
Task 6 System operation with feed water containing silica and
humic acids
Figure 20. Carbon Filter of Feed Water Pretreatment.
31
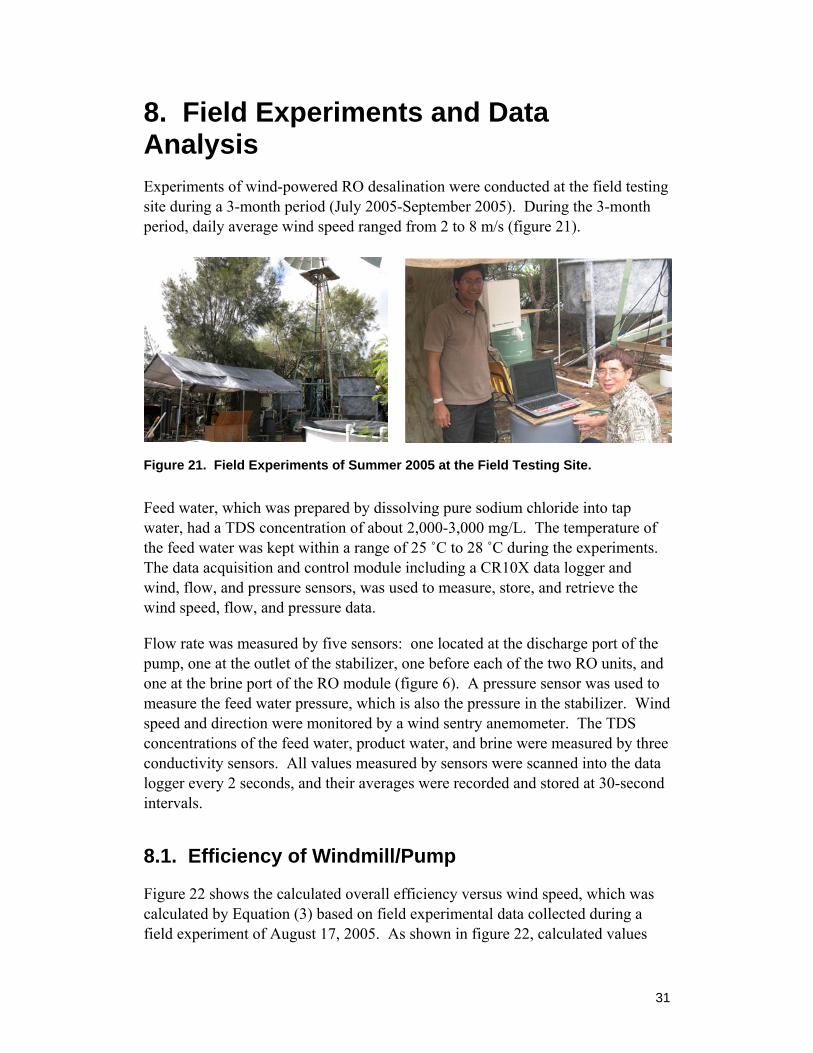
8. Field Experiments and Data Analysis Experiments of wind-powered RO desalination were conducted at the field testing site during a 3-month period (July 2005-September 2005). During the 3-month period, daily average wind speed ranged from 2 to 8 m/s (figure 21).
Figure 21. Field Experiments of Summer 2005 at the Field Testing Site.
Feed water, which was prepared by dissolving pure sodium chloride into tap water, had a TDS concentration of about 2,000-3,000 mg/L. The temperature of the feed water was kept within a range of 25 ˚C to 28 ˚C during the experiments. The data acquisition and control module including a CR10X data logger and wind, flow, and pressure sensors, was used to measure, store, and retrieve the wind speed, flow, and pressure data.
Flow rate was measured by five sensors: one located at the discharge port of the pump, one at the outlet of the stabilizer, one before each of the two RO units, and one at the brine port of the RO module (figure 6). A pressure sensor was used to measure the feed water pressure, which is also the pressure in the stabilizer. Wind speed and direction were monitored by a wind sentry anemometer. The TDS concentrations of the feed water, product water, and brine were measured by three conductivity sensors. All values measured by sensors were scanned into the data logger every 2 seconds, and their averages were recorded and stored at 30-second intervals.
8.1. Efficiency of Windmill/Pump
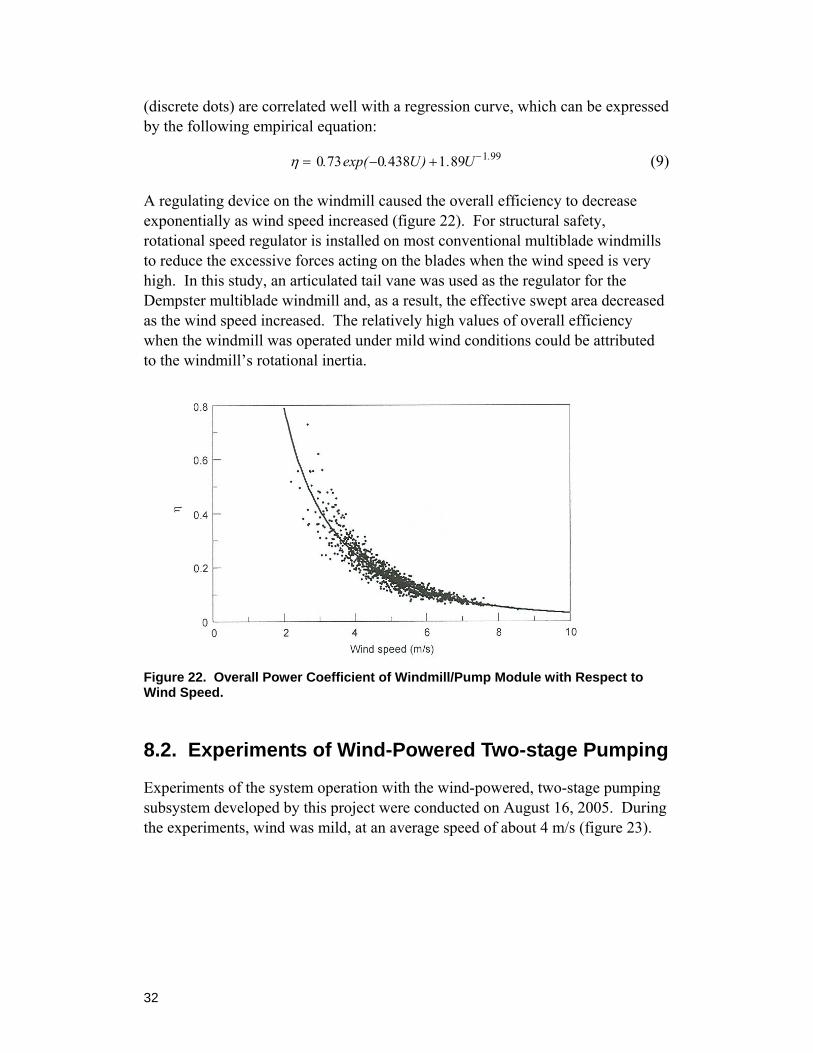
Figure 22 shows the calculated overall efficiency versus wind speed, which was calculated by Equation (3) based on field experimental data collected during a field experiment of August 17, 2005. As shown in figure 22, calculated values
32
(discrete dots) are correlated well with a regression curve, which can be expressed by the following empirical equation:
η = 0.73exp(−0.438U) +1.89U−1.99 (9) A regulating device on the windmill caused the overall efficiency to decrease exponentially as wind speed increased (figure 22). For structural safety, rotational speed regulator is installed on most conventional multiblade windmills to reduce the excessive forces acting on the blades when the wind speed is very high. In this study, an articulated tail vane was used as the regulator for the Dempster multiblade windmill and, as a result, the effective swept area decreased as the wind speed increased. The relatively high values of overall efficiency when the windmill was operated under mild wind conditions could be attributed to the windmill’s rotational inertia.
Figure 22. Overall Power Coefficient of Windmill/Pump Module with Respect to Wind Speed.
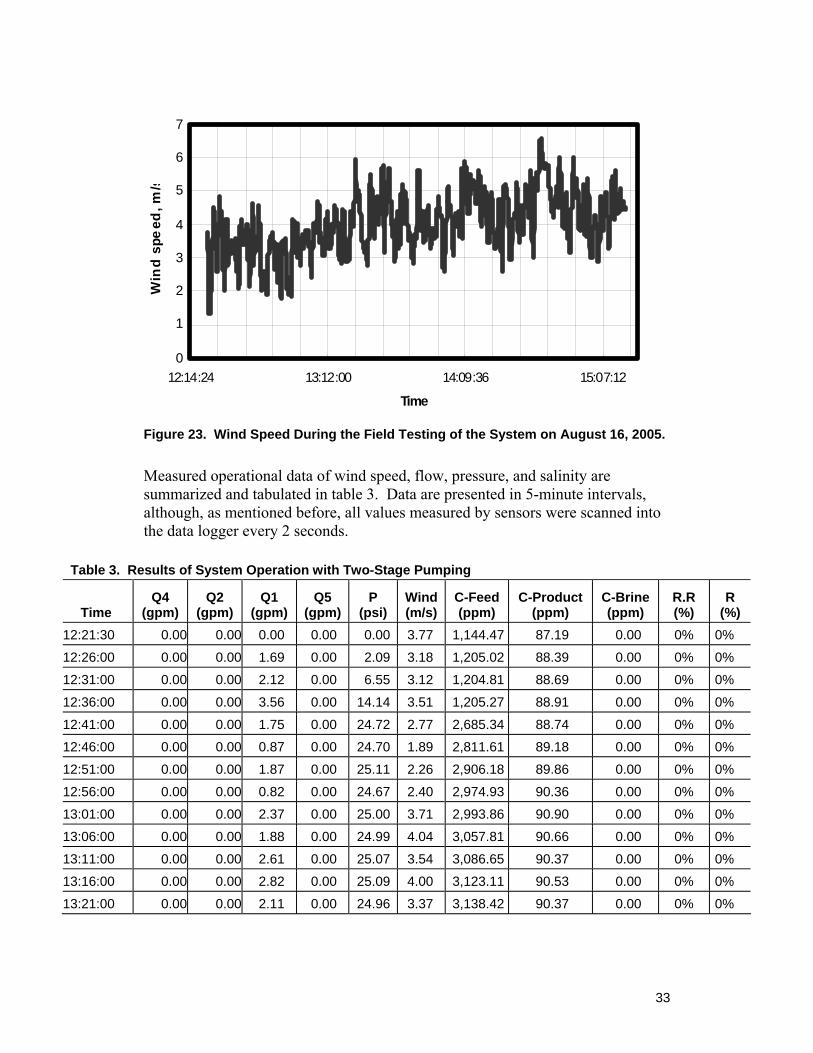
8.2. Experiments of Wind-Powered Two-stage Pumping
Experiments of the system operation with the wind-powered, two-stage pumping subsystem developed by this project were conducted on August 16, 2005. During the experiments, wind was mild, at an average speed of about 4 m/s (figure 23).
33
0
1
2
3
4
5
6
7
12:14:24 13:12:00 14:09:36 15:07:12
Time
Win
d sp
eed
, m/s
Figure 23. Wind Speed During the Field Testing of the System on August 16, 2005.
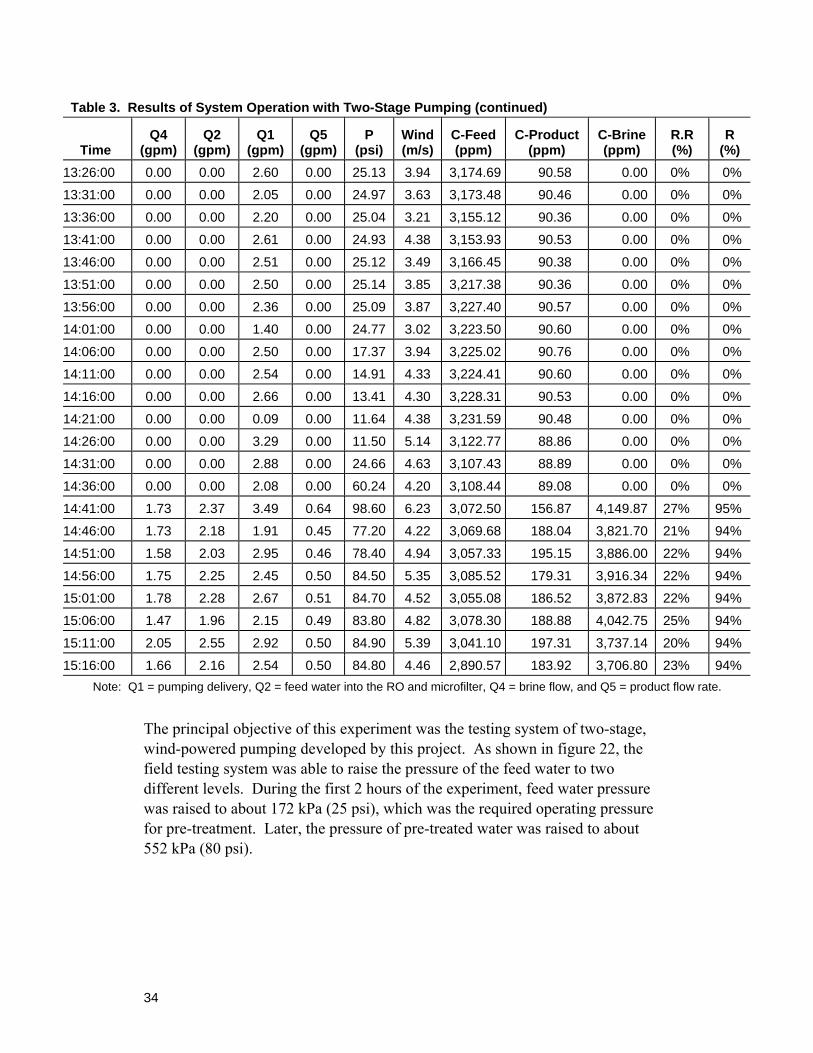
Measured operational data of wind speed, flow, pressure, and salinity are summarized and tabulated in table 3. Data are presented in 5-minute intervals, although, as mentioned before, all values measured by sensors were scanned into the data logger every 2 seconds.
Table 3. Results of System Operation with Two-Stage Pumping
Time Q4
(gpm) Q2
(gpm) Q1
(gpm) Q5
(gpm)P
(psi) Wind(m/s)
C-Feed (ppm)
C-Product (ppm)
C-Brine (ppm)
R.R (%)
R (%)
12:21:30 0.00 0.00 0.00 0.00 0.00 3.77 1,144.47 87.19 0.00 0% 0%
12:26:00 0.00 0.00 1.69 0.00 2.09 3.18 1,205.02 88.39 0.00 0% 0%
12:31:00 0.00 0.00 2.12 0.00 6.55 3.12 1,204.81 88.69 0.00 0% 0%
12:36:00 0.00 0.00 3.56 0.00 14.14 3.51 1,205.27 88.91 0.00 0% 0%
12:41:00 0.00 0.00 1.75 0.00 24.72 2.77 2,685.34 88.74 0.00 0% 0%
12:46:00 0.00 0.00 0.87 0.00 24.70 1.89 2,811.61 89.18 0.00 0% 0%
12:51:00 0.00 0.00 1.87 0.00 25.11 2.26 2,906.18 89.86 0.00 0% 0%
12:56:00 0.00 0.00 0.82 0.00 24.67 2.40 2,974.93 90.36 0.00 0% 0%
13:01:00 0.00 0.00 2.37 0.00 25.00 3.71 2,993.86 90.90 0.00 0% 0%
13:06:00 0.00 0.00 1.88 0.00 24.99 4.04 3,057.81 90.66 0.00 0% 0%
13:11:00 0.00 0.00 2.61 0.00 25.07 3.54 3,086.65 90.37 0.00 0% 0%
13:16:00 0.00 0.00 2.82 0.00 25.09 4.00 3,123.11 90.53 0.00 0% 0%
13:21:00 0.00 0.00 2.11 0.00 24.96 3.37 3,138.42 90.37 0.00 0% 0%
34
Table 3. Results of System Operation with Two-Stage Pumping (continued)
Time Q4
(gpm) Q2
(gpm) Q1
(gpm) Q5
(gpm)P
(psi) Wind(m/s)
C-Feed (ppm)
C-Product (ppm)
C-Brine (ppm)
R.R (%)
R (%)
13:26:00 0.00 0.00 2.60 0.00 25.13 3.94 3,174.69 90.58 0.00 0% 0%
13:31:00 0.00 0.00 2.05 0.00 24.97 3.63 3,173.48 90.46 0.00 0% 0%
13:36:00 0.00 0.00 2.20 0.00 25.04 3.21 3,155.12 90.36 0.00 0% 0%
13:41:00 0.00 0.00 2.61 0.00 24.93 4.38 3,153.93 90.53 0.00 0% 0%
13:46:00 0.00 0.00 2.51 0.00 25.12 3.49 3,166.45 90.38 0.00 0% 0%
13:51:00 0.00 0.00 2.50 0.00 25.14 3.85 3,217.38 90.36 0.00 0% 0%
13:56:00 0.00 0.00 2.36 0.00 25.09 3.87 3,227.40 90.57 0.00 0% 0%
14:01:00 0.00 0.00 1.40 0.00 24.77 3.02 3,223.50 90.60 0.00 0% 0%
14:06:00 0.00 0.00 2.50 0.00 17.37 3.94 3,225.02 90.76 0.00 0% 0%
14:11:00 0.00 0.00 2.54 0.00 14.91 4.33 3,224.41 90.60 0.00 0% 0%
14:16:00 0.00 0.00 2.66 0.00 13.41 4.30 3,228.31 90.53 0.00 0% 0%
14:21:00 0.00 0.00 0.09 0.00 11.64 4.38 3,231.59 90.48 0.00 0% 0%
14:26:00 0.00 0.00 3.29 0.00 11.50 5.14 3,122.77 88.86 0.00 0% 0%
14:31:00 0.00 0.00 2.88 0.00 24.66 4.63 3,107.43 88.89 0.00 0% 0%
14:36:00 0.00 0.00 2.08 0.00 60.24 4.20 3,108.44 89.08 0.00 0% 0%
14:41:00 1.73 2.37 3.49 0.64 98.60 6.23 3,072.50 156.87 4,149.87 27% 95%
14:46:00 1.73 2.18 1.91 0.45 77.20 4.22 3,069.68 188.04 3,821.70 21% 94%
14:51:00 1.58 2.03 2.95 0.46 78.40 4.94 3,057.33 195.15 3,886.00 22% 94%
14:56:00 1.75 2.25 2.45 0.50 84.50 5.35 3,085.52 179.31 3,916.34 22% 94%
15:01:00 1.78 2.28 2.67 0.51 84.70 4.52 3,055.08 186.52 3,872.83 22% 94%
15:06:00 1.47 1.96 2.15 0.49 83.80 4.82 3,078.30 188.88 4,042.75 25% 94%
15:11:00 2.05 2.55 2.92 0.50 84.90 5.39 3,041.10 197.31 3,737.14 20% 94%
15:16:00 1.66 2.16 2.54 0.50 84.80 4.46 2,890.57 183.92 3,706.80 23% 94% Note: Q1 = pumping delivery, Q2 = feed water into the RO and microfilter, Q4 = brine flow, and Q5 = product flow rate.
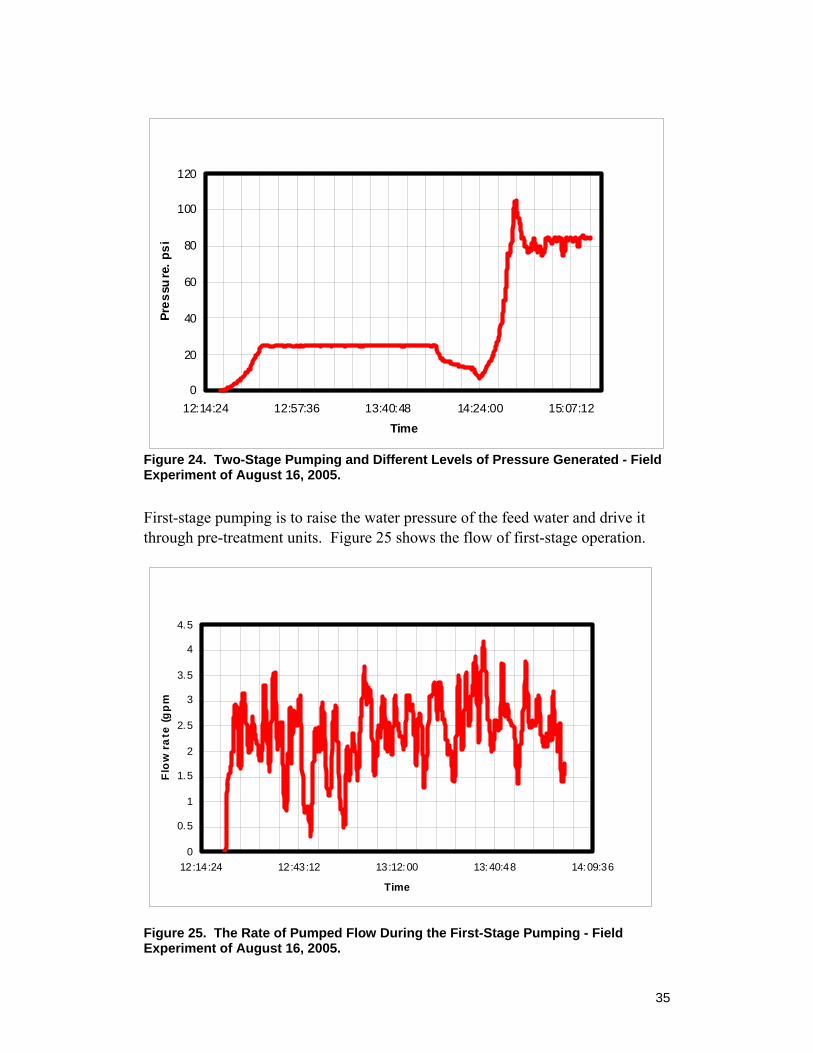
The principal objective of this experiment was the testing system of two-stage, wind-powered pumping developed by this project. As shown in figure 22, the field testing system was able to raise the pressure of the feed water to two different levels. During the first 2 hours of the experiment, feed water pressure was raised to about 172 kPa (25 psi), which was the required operating pressure for pre-treatment. Later, the pressure of pre-treated water was raised to about 552 kPa (80 psi).
35
0
20
40
60
80
100
120
12:14:24 12:57:36 13:40:48 14:24:00 15:07:12Time
Pres
sure
. psi
Figure 24. Two-Stage Pumping and Different Levels of Pressure Generated - Field Experiment of August 16, 2005.
First-stage pumping is to raise the water pressure of the feed water and drive it through pre-treatment units. Figure 25 shows the flow of first-stage operation.
0
0.5
1
1.5
2
2.5
3
3.5
4
4.5
12:14:24 12:43:12 13:12:00 13:40:48 14:09:36
Time
Flo
w r
ate
(g
pm
Figure 25. The Rate of Pumped Flow During the First-Stage Pumping - Field Experiment of August 16, 2005.
36
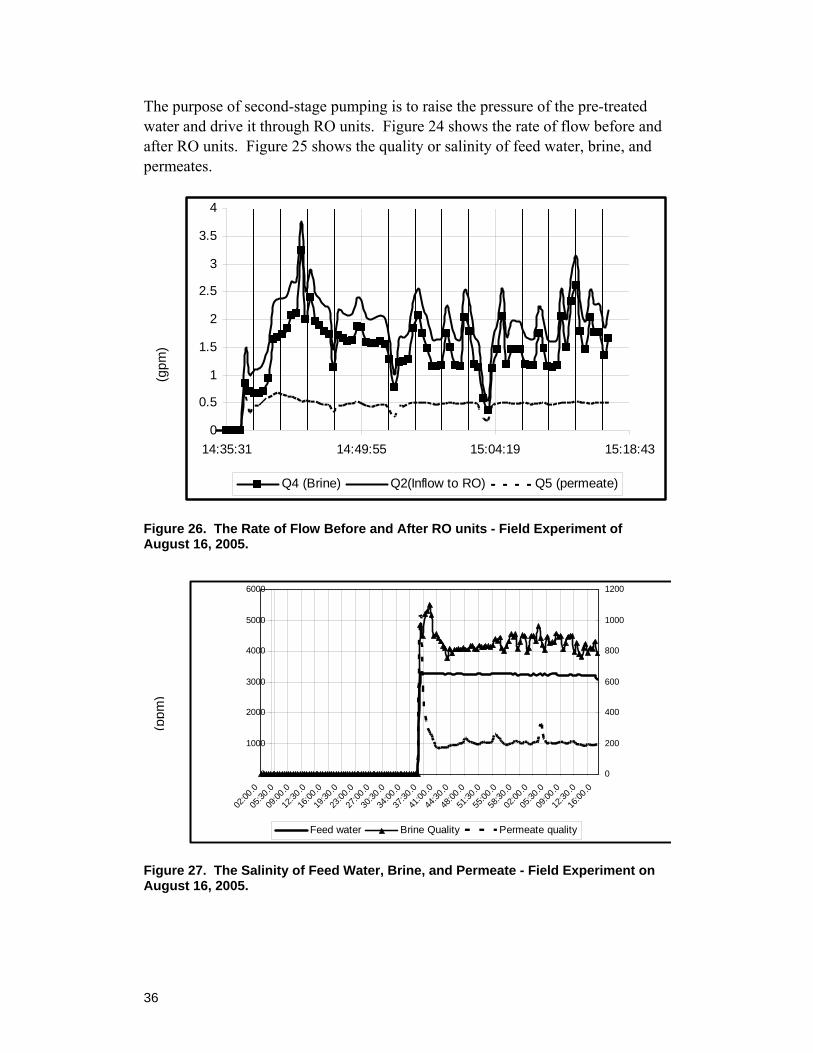
The purpose of second-stage pumping is to raise the pressure of the pre-treated water and drive it through RO units. Figure 24 shows the rate of flow before and after RO units. Figure 25 shows the quality or salinity of feed water, brine, and permeates.
Figure 26. The Rate of Flow Before and After RO units - Field Experiment of August 16, 2005.
0
1000
2000
3000
4000
5000
6000
02:00
.0
05:30
.0
09:00
.0
12:30
.0
16:00
.0
19:30
.0
23:00
.0
27:00
.0
30:30
.0
34:00
.0
37:30
.0
41:00
.0
44:30
.0
48:00
.0
51:30
.0
55:00
.0
58:30
.0
02:00
.0
05:30
.0
09:00
.0
12:30
.0
16:00
.00
200
400
600
800
1000
1200
Feed water Brine Quality Permeate quality
Figure 27. The Salinity of Feed Water, Brine, and Permeate - Field Experiment on August 16, 2005.
0
0.5
1
1.5
2
2.5
3
3.5
4
14:35:31 14:49:55 15:04:19 15:18:43
Q4 (Brine) Q2(Inflow to RO) Q5 (permeate)
(gpm
) (p
pm)

37
8.3. Experiments on the Operation of System Data Acquisition and Control
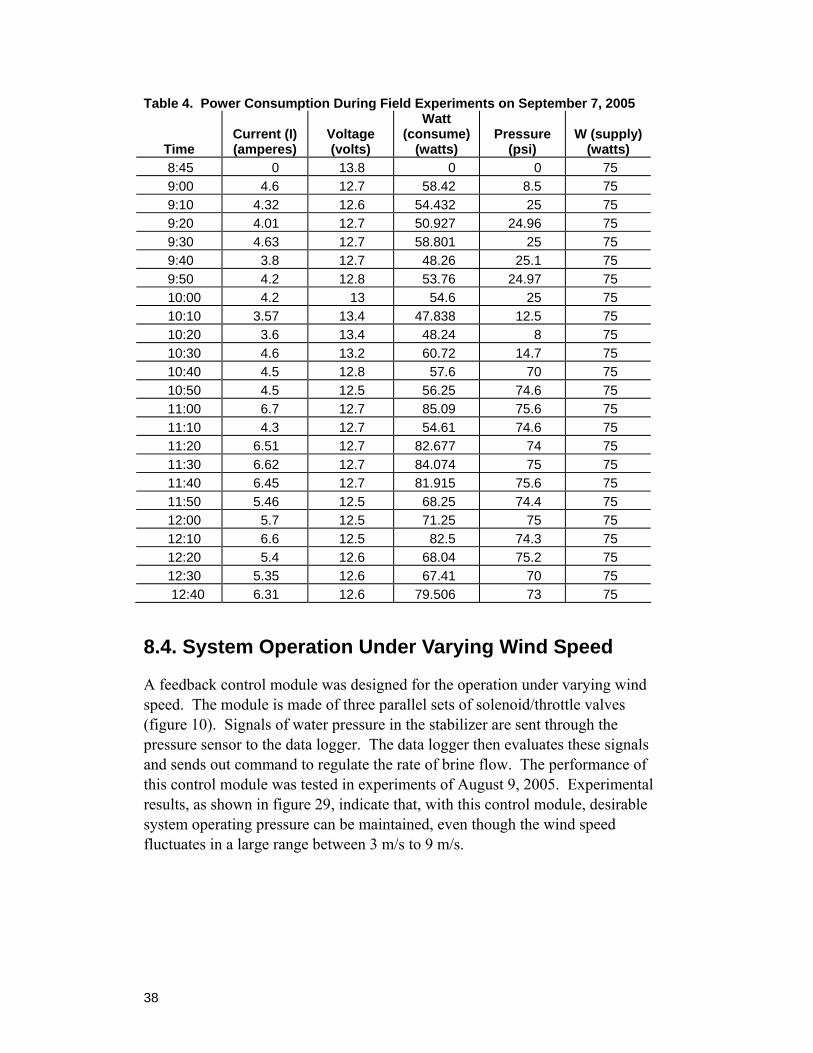
During the experiment on September 9, 2005, current and voltage used by the system were measured, and they are shown in figure 28 and table 4. The actual power consumption can be readily determined. A 12-volt battery is used as part of the solar module. With the battery, the power generated by solar PV panel is adequate for the operation of system instruments.
System instruments are designed to be operated by either AC or DC power supplies, at different voltages and currents. Power generated by SQ75 is transformed to desirable operating voltages and currents by inverters.
Pressure and power consumption
0
10
20
30
40
50
60
70
80
8:24 9:50 11:16 12:43 time
Pres
sure
Psi
0
10
20
30
40
50
60
70
80
90
Operating Pressure Pow er Consumption Pow er Generation
Figure 28. Relationship of Power Consumption and Operating Pressure. Power input and power consumption.
38
Table 4. Power Consumption During Field Experiments on September 7, 2005
Time Current (I) (amperes)
Voltage (volts)
Watt (consume)
(watts) Pressure
(psi) W (supply)
(watts) 8:45 0 13.8 0 0 75 9:00 4.6 12.7 58.42 8.5 75 9:10 4.32 12.6 54.432 25 75 9:20 4.01 12.7 50.927 24.96 75 9:30 4.63 12.7 58.801 25 75 9:40 3.8 12.7 48.26 25.1 75 9:50 4.2 12.8 53.76 24.97 75 10:00 4.2 13 54.6 25 75 10:10 3.57 13.4 47.838 12.5 75 10:20 3.6 13.4 48.24 8 75 10:30 4.6 13.2 60.72 14.7 75 10:40 4.5 12.8 57.6 70 75 10:50 4.5 12.5 56.25 74.6 75 11:00 6.7 12.7 85.09 75.6 75 11:10 4.3 12.7 54.61 74.6 75 11:20 6.51 12.7 82.677 74 75 11:30 6.62 12.7 84.074 75 75 11:40 6.45 12.7 81.915 75.6 75 11:50 5.46 12.5 68.25 74.4 75 12:00 5.7 12.5 71.25 75 75 12:10 6.6 12.5 82.5 74.3 75 12:20 5.4 12.6 68.04 75.2 75 12:30 5.35 12.6 67.41 70 75 12:40 6.31 12.6 79.506 73 75
8.4. System Operation Under Varying Wind Speed
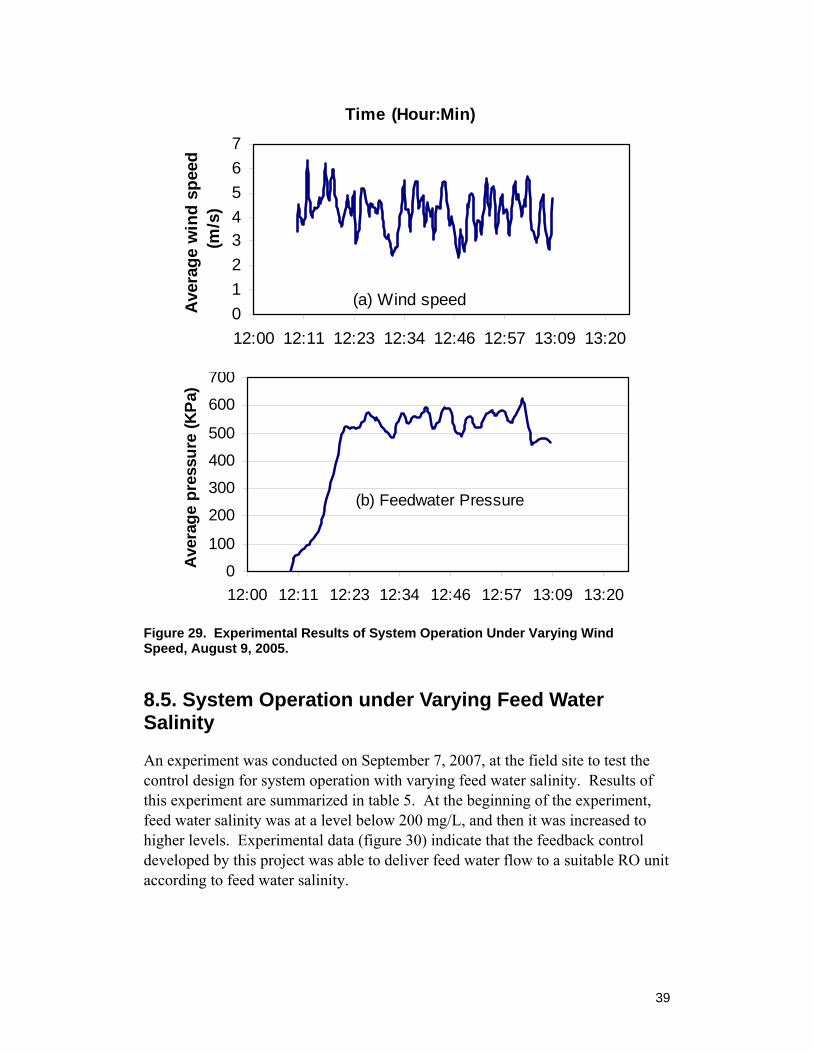
A feedback control module was designed for the operation under varying wind speed. The module is made of three parallel sets of solenoid/throttle valves (figure 10). Signals of water pressure in the stabilizer are sent through the pressure sensor to the data logger. The data logger then evaluates these signals and sends out command to regulate the rate of brine flow. The performance of this control module was tested in experiments of August 9, 2005. Experimental results, as shown in figure 29, indicate that, with this control module, desirable system operating pressure can be maintained, even though the wind speed fluctuates in a large range between 3 m/s to 9 m/s.
39
Figure 29. Experimental Results of System Operation Under Varying Wind Speed, August 9, 2005.
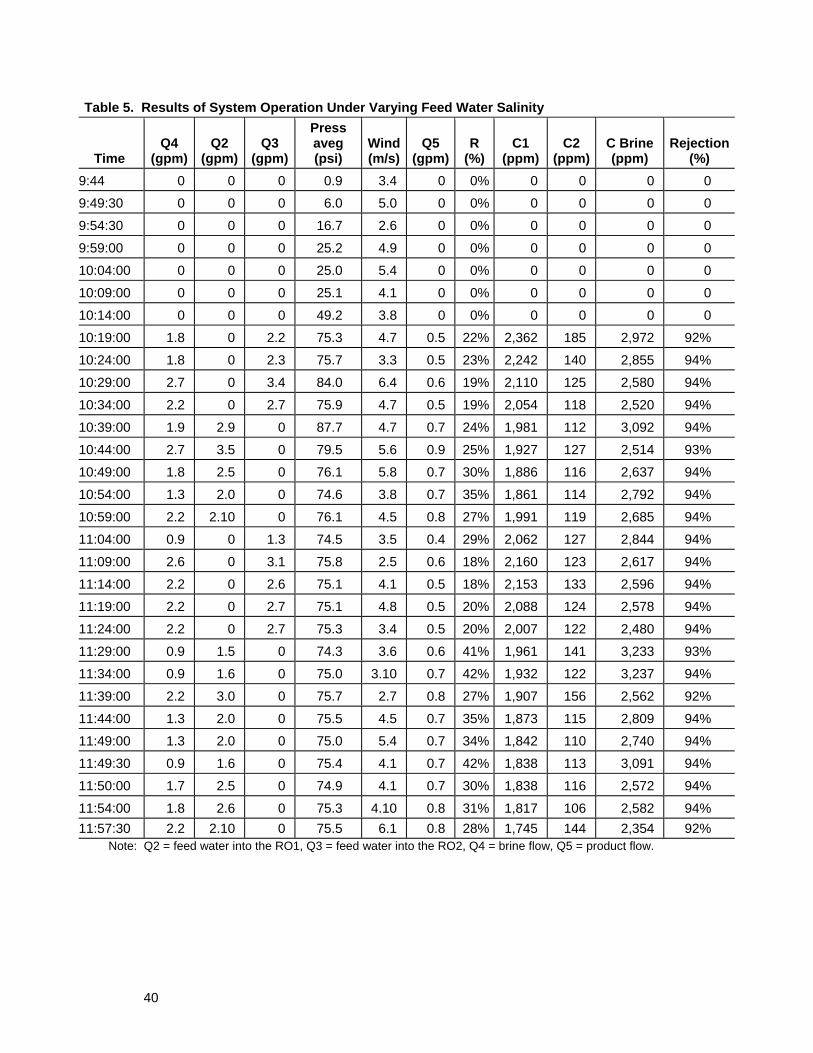
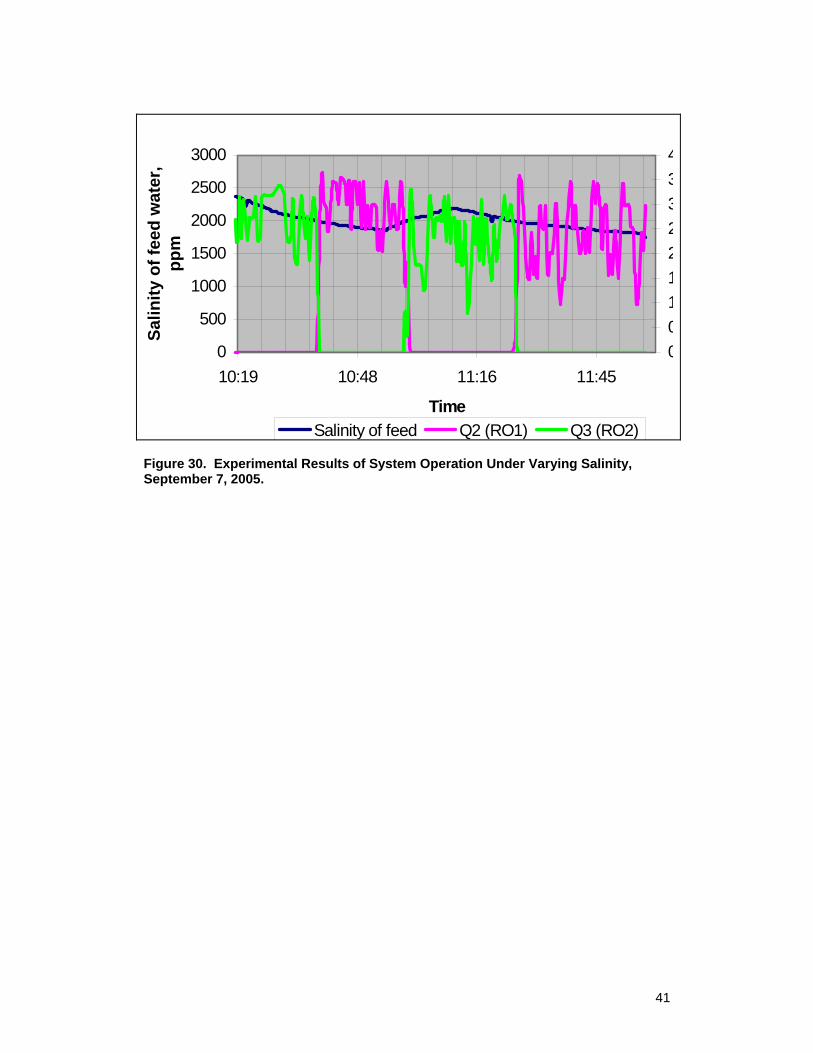
8.5. System Operation under Varying Feed Water Salinity
An experiment was conducted on September 7, 2007, at the field site to test the control design for system operation with varying feed water salinity. Results of this experiment are summarized in table 5. At the beginning of the experiment, feed water salinity was at a level below 200 mg/L, and then it was increased to higher levels. Experimental data (figure 30) indicate that the feedback control developed by this project was able to deliver feed water flow to a suitable RO unit according to feed water salinity.
(a) Wind speed01234567
12:00 12:11 12:23 12:34 12:46 12:57 13:09 13:20
Time (Hour:Min)
Ave
rage
win
d sp
eed
(m/s
)
(b) Feedwater Pressure
0
100
200
300
400
500
600
700
12:00 12:11 12:23 12:34 12:46 12:57 13:09 13:20
Aver
age
pres
sure
(KPa
)
40
Table 5. Results of System Operation Under Varying Feed Water Salinity
Time Q4
(gpm) Q2
(gpm) Q3
(gpm)
Press aveg (psi)
Wind(m/s)
Q5 (gpm)
R (%)
C1 (ppm)
C2 (ppm)
C Brine (ppm)
Rejection(%)
9:44 0 0 0 0.9 3.4 0 0% 0 0 0 0
9:49:30 0 0 0 6.0 5.0 0 0% 0 0 0 0
9:54:30 0 0 0 16.7 2.6 0 0% 0 0 0 0
9:59:00 0 0 0 25.2 4.9 0 0% 0 0 0 0
10:04:00 0 0 0 25.0 5.4 0 0% 0 0 0 0
10:09:00 0 0 0 25.1 4.1 0 0% 0 0 0 0
10:14:00 0 0 0 49.2 3.8 0 0% 0 0 0 0
10:19:00 1.8 0 2.2 75.3 4.7 0.5 22% 2,362 185 2,972 92%
10:24:00 1.8 0 2.3 75.7 3.3 0.5 23% 2,242 140 2,855 94%
10:29:00 2.7 0 3.4 84.0 6.4 0.6 19% 2,110 125 2,580 94%
10:34:00 2.2 0 2.7 75.9 4.7 0.5 19% 2,054 118 2,520 94%
10:39:00 1.9 2.9 0 87.7 4.7 0.7 24% 1,981 112 3,092 94%
10:44:00 2.7 3.5 0 79.5 5.6 0.9 25% 1,927 127 2,514 93%
10:49:00 1.8 2.5 0 76.1 5.8 0.7 30% 1,886 116 2,637 94%
10:54:00 1.3 2.0 0 74.6 3.8 0.7 35% 1,861 114 2,792 94%
10:59:00 2.2 2.10 0 76.1 4.5 0.8 27% 1,991 119 2,685 94%
11:04:00 0.9 0 1.3 74.5 3.5 0.4 29% 2,062 127 2,844 94%
11:09:00 2.6 0 3.1 75.8 2.5 0.6 18% 2,160 123 2,617 94%
11:14:00 2.2 0 2.6 75.1 4.1 0.5 18% 2,153 133 2,596 94%
11:19:00 2.2 0 2.7 75.1 4.8 0.5 20% 2,088 124 2,578 94%
11:24:00 2.2 0 2.7 75.3 3.4 0.5 20% 2,007 122 2,480 94%
11:29:00 0.9 1.5 0 74.3 3.6 0.6 41% 1,961 141 3,233 93%
11:34:00 0.9 1.6 0 75.0 3.10 0.7 42% 1,932 122 3,237 94%
11:39:00 2.2 3.0 0 75.7 2.7 0.8 27% 1,907 156 2,562 92%
11:44:00 1.3 2.0 0 75.5 4.5 0.7 35% 1,873 115 2,809 94%
11:49:00 1.3 2.0 0 75.0 5.4 0.7 34% 1,842 110 2,740 94%
11:49:30 0.9 1.6 0 75.4 4.1 0.7 42% 1,838 113 3,091 94%
11:50:00 1.7 2.5 0 74.9 4.1 0.7 30% 1,838 116 2,572 94%
11:54:00 1.8 2.6 0 75.3 4.10 0.8 31% 1,817 106 2,582 94% 11:57:30 2.2 2.10 0 75.5 6.1 0.8 28% 1,745 144 2,354 92%
Note: Q2 = feed water into the RO1, Q3 = feed water into the RO2, Q4 = brine flow, Q5 = product flow.
41
0
500
1000
1500
2000
2500
3000
10:19 10:48 11:16 11:45
Time
Salin
ity o
f fee
d w
ater
, pp
m
001122334
Salinity of feed Q2 (RO1) Q3 (RO2) Figure 30. Experimental Results of System Operation Under Varying Salinity, September 7, 2005.

43
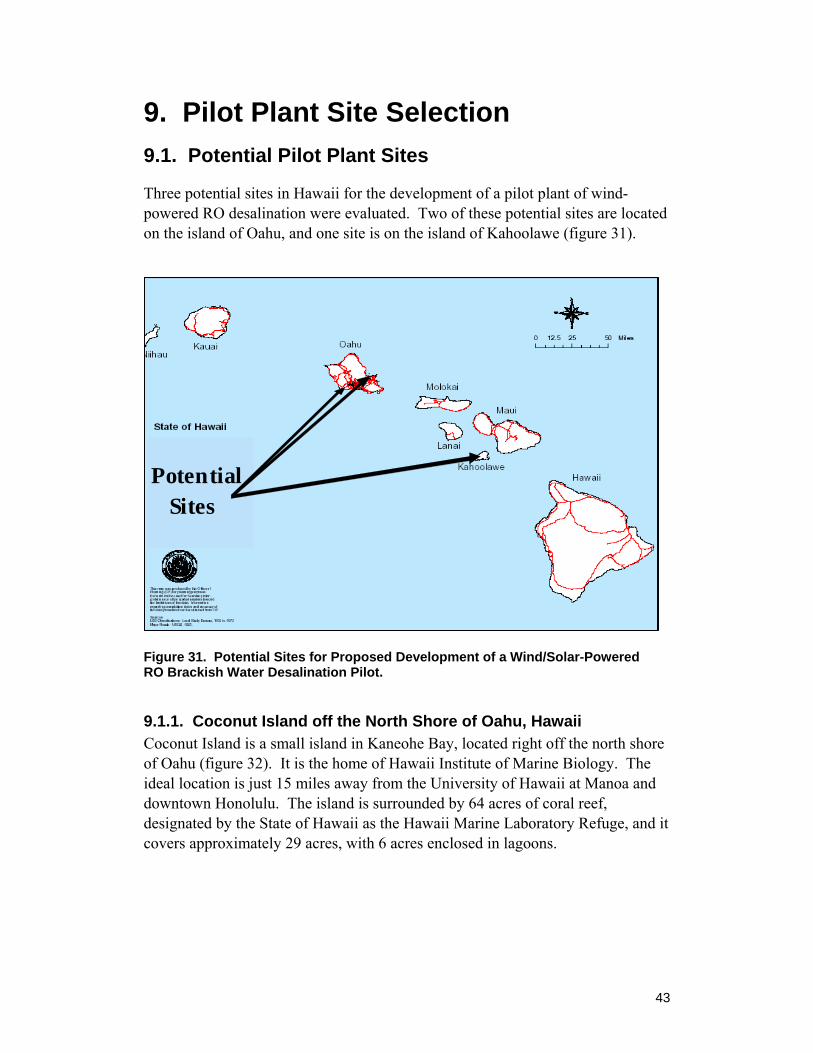
9. Pilot Plant Site Selection 9.1. Potential Pilot Plant Sites
Three potential sites in Hawaii for the development of a pilot plant of wind-powered RO desalination were evaluated. Two of these potential sites are located on the island of Oahu, and one site is on the island of Kahoolawe (figure 31).
Figure 31. Potential Sites for Proposed Development of a Wind/Solar-Powered RO Brackish Water Desalination Pilot.
9.1.1. Coconut Island off the North Shore of Oahu, Hawaii Coconut Island is a small island in Kaneohe Bay, located right off the north shore of Oahu (figure 32). It is the home of Hawaii Institute of Marine Biology. The ideal location is just 15 miles away from the University of Hawaii at Manoa and downtown Honolulu. The island is surrounded by 64 acres of coral reef, designated by the State of Hawaii as the Hawaii Marine Laboratory Refuge, and it covers approximately 29 acres, with 6 acres enclosed in lagoons.
PotentialSites
44
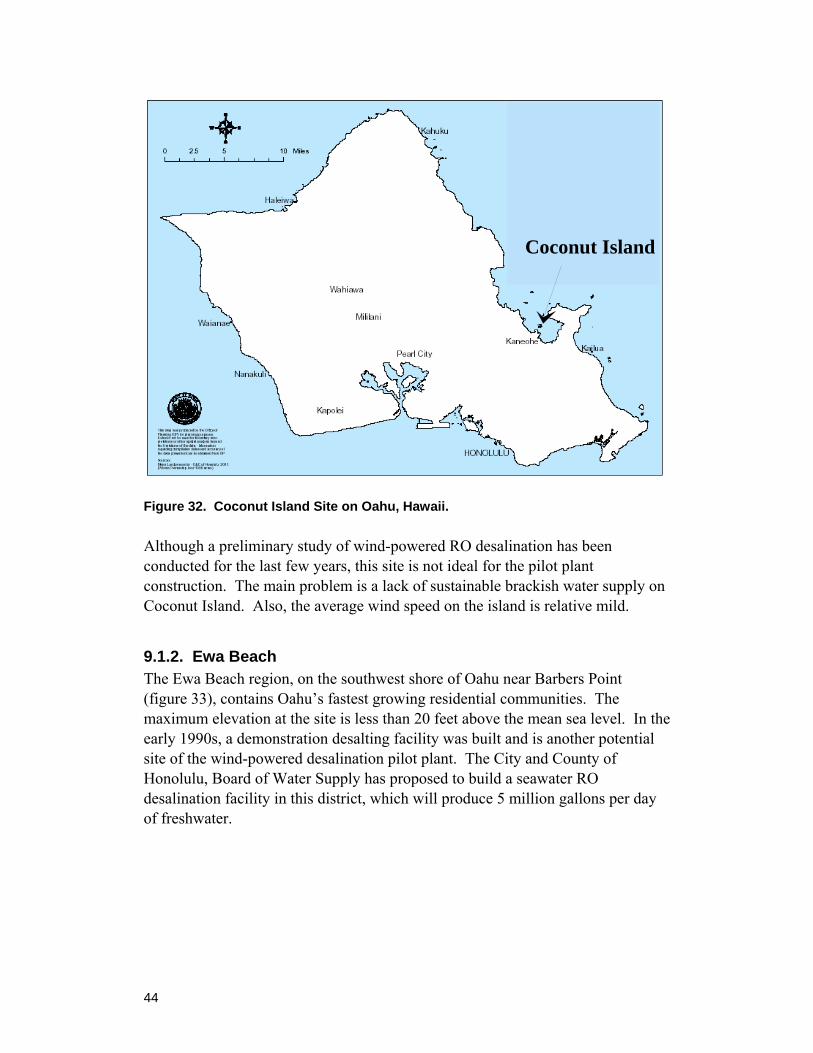
Figure 32. Coconut Island Site on Oahu, Hawaii.
Although a preliminary study of wind-powered RO desalination has been conducted for the last few years, this site is not ideal for the pilot plant construction. The main problem is a lack of sustainable brackish water supply on Coconut Island. Also, the average wind speed on the island is relative mild.
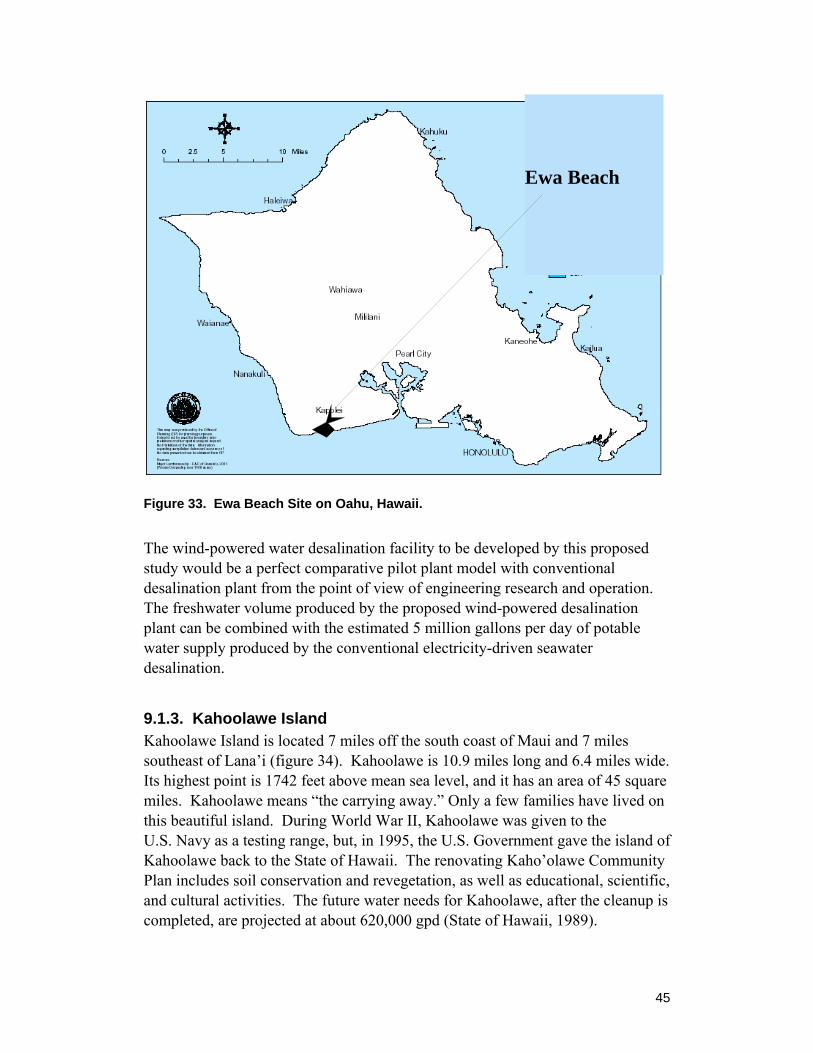
9.1.2. Ewa Beach The Ewa Beach region, on the southwest shore of Oahu near Barbers Point (figure 33), contains Oahu’s fastest growing residential communities. The maximum elevation at the site is less than 20 feet above the mean sea level. In the early 1990s, a demonstration desalting facility was built and is another potential site of the wind-powered desalination pilot plant. The City and County of Honolulu, Board of Water Supply has proposed to build a seawater RO desalination facility in this district, which will produce 5 million gallons per day of freshwater.
Coconut Island
45
Figure 33. Ewa Beach Site on Oahu, Hawaii.
The wind-powered water desalination facility to be developed by this proposed study would be a perfect comparative pilot plant model with conventional desalination plant from the point of view of engineering research and operation. The freshwater volume produced by the proposed wind-powered desalination plant can be combined with the estimated 5 million gallons per day of potable water supply produced by the conventional electricity-driven seawater desalination.
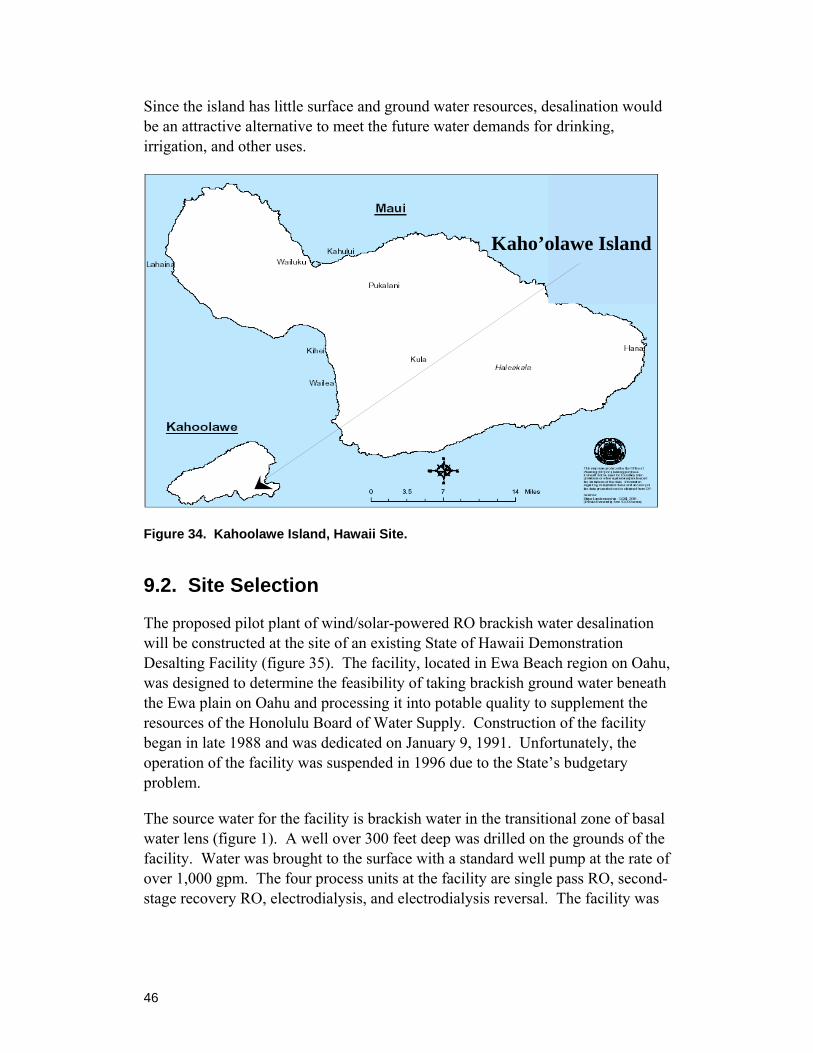
9.1.3. Kahoolawe Island Kahoolawe Island is located 7 miles off the south coast of Maui and 7 miles southeast of Lana’i (figure 34). Kahoolawe is 10.9 miles long and 6.4 miles wide. Its highest point is 1742 feet above mean sea level, and it has an area of 45 square miles. Kahoolawe means “the carrying away.” Only a few families have lived on this beautiful island. During World War II, Kahoolawe was given to the U.S. Navy as a testing range, but, in 1995, the U.S. Government gave the island of Kahoolawe back to the State of Hawaii. The renovating Kaho’olawe Community Plan includes soil conservation and revegetation, as well as educational, scientific, and cultural activities. The future water needs for Kahoolawe, after the cleanup is completed, are projected at about 620,000 gpd (State of Hawaii, 1989).
Ewa Beach
46
Since the island has little surface and ground water resources, desalination would be an attractive alternative to meet the future water demands for drinking, irrigation, and other uses.
Figure 34. Kahoolawe Island, Hawaii Site.
9.2. Site Selection
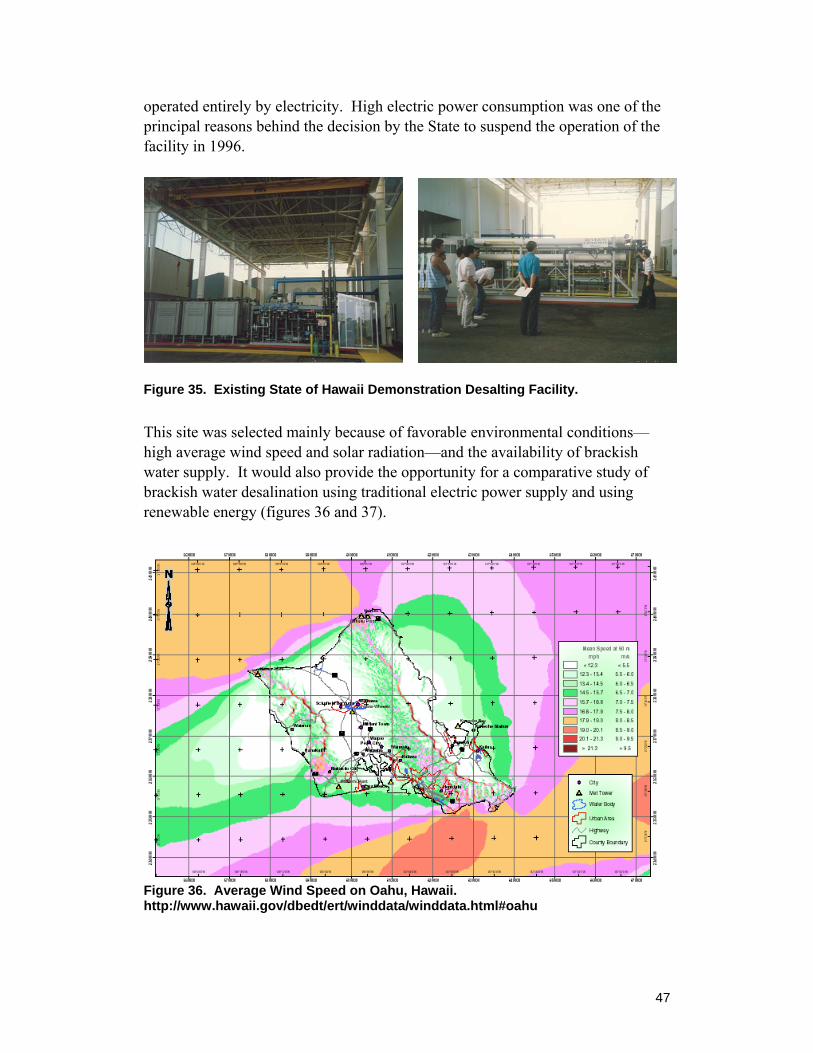
The proposed pilot plant of wind/solar-powered RO brackish water desalination will be constructed at the site of an existing State of Hawaii Demonstration Desalting Facility (figure 35). The facility, located in Ewa Beach region on Oahu, was designed to determine the feasibility of taking brackish ground water beneath the Ewa plain on Oahu and processing it into potable quality to supplement the resources of the Honolulu Board of Water Supply. Construction of the facility began in late 1988 and was dedicated on January 9, 1991. Unfortunately, the operation of the facility was suspended in 1996 due to the State’s budgetary problem.
The source water for the facility is brackish water in the transitional zone of basal water lens (figure 1). A well over 300 feet deep was drilled on the grounds of the facility. Water was brought to the surface with a standard well pump at the rate of over 1,000 gpm. The four process units at the facility are single pass RO, second-stage recovery RO, electrodialysis, and electrodialysis reversal. The facility was
Kaho’olawe Island
47
operated entirely by electricity. High electric power consumption was one of the principal reasons behind the decision by the State to suspend the operation of the facility in 1996.
Figure 35. Existing State of Hawaii Demonstration Desalting Facility.
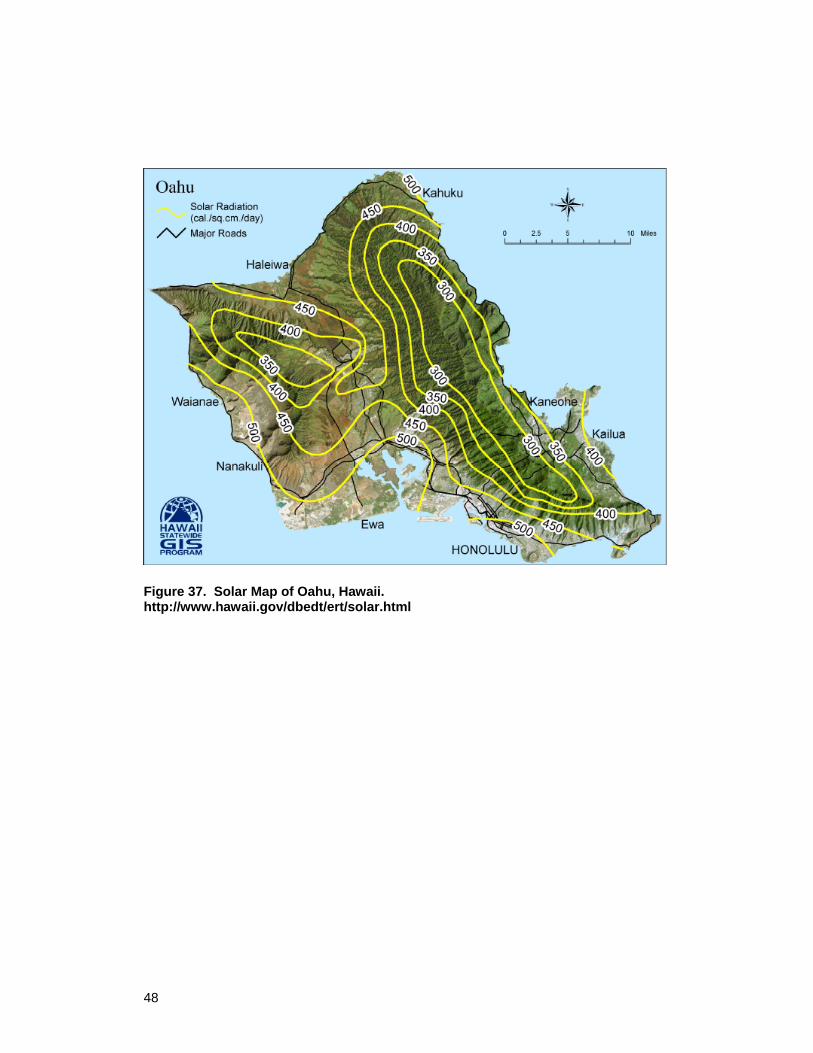
This site was selected mainly because of favorable environmental conditions—high average wind speed and solar radiation—and the availability of brackish water supply. It would also provide the opportunity for a comparative study of brackish water desalination using traditional electric power supply and using renewable energy (figures 36 and 37).
Figure 36. Average Wind Speed on Oahu, Hawaii. http://www.hawaii.gov/dbedt/ert/winddata/winddata.html#oahu
48
Figure 37. Solar Map of Oahu, Hawaii. http://www.hawaii.gov/dbedt/ert/solar.html
49
10. Pilot Plant Design and Cost Analysis 10.1 Conceptual Design
A pilot plant of renewable energy-driven RO desalination will be designed by scaling up the existing system, which can be achieved by using 20-ft windmills and (2) arranging multi-units of windmill/pump and membrane processing in parallel and in series.
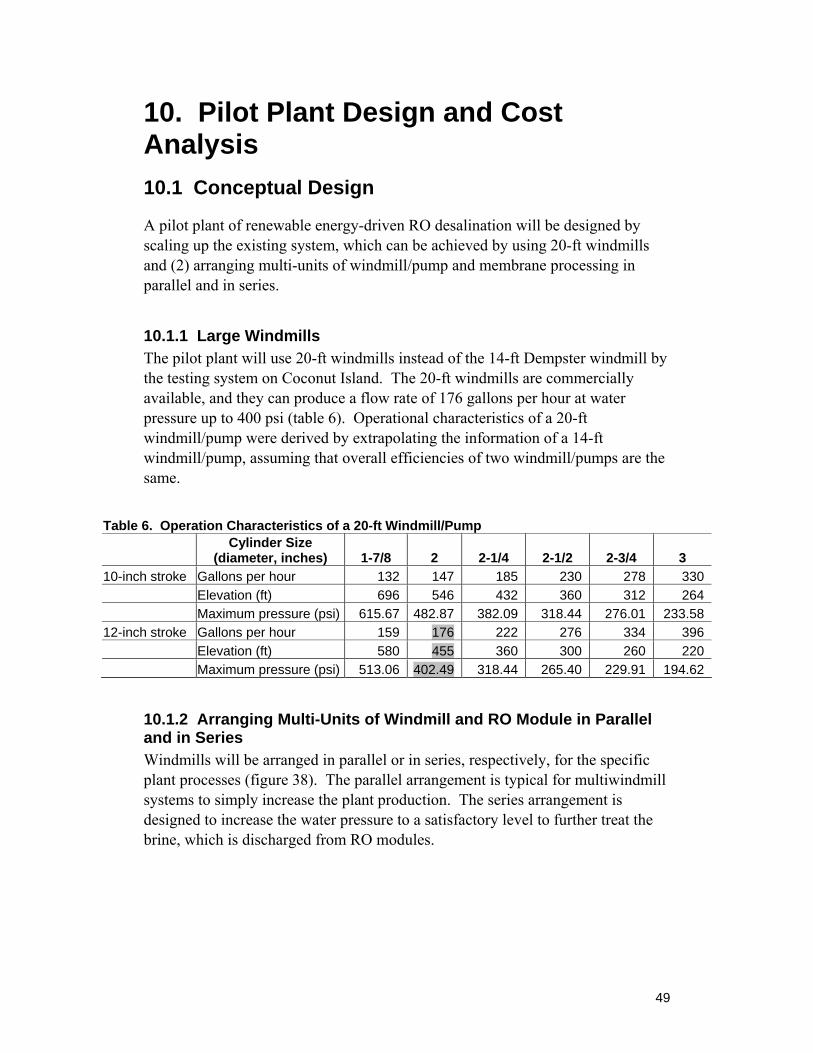
10.1.1 Large Windmills The pilot plant will use 20-ft windmills instead of the 14-ft Dempster windmill by the testing system on Coconut Island. The 20-ft windmills are commercially available, and they can produce a flow rate of 176 gallons per hour at water pressure up to 400 psi (table 6). Operational characteristics of a 20-ft windmill/pump were derived by extrapolating the information of a 14-ft windmill/pump, assuming that overall efficiencies of two windmill/pumps are the same.
Table 6. Operation Characteristics of a 20-ft Windmill/Pump
Cylinder Size
(diameter, inches) 1-7/8 2 2-1/4 2-1/2 2-3/4 3 10-inch stroke Gallons per hour 132 147 185 230 278 330 Elevation (ft) 696 546 432 360 312 264 Maximum pressure (psi) 615.67 482.87 382.09 318.44 276.01 233.58 12-inch stroke Gallons per hour 159 176 222 276 334 396 Elevation (ft) 580 455 360 300 260 220 Maximum pressure (psi) 513.06 402.49 318.44 265.40 229.91 194.62
10.1.2 Arranging Multi-Units of Windmill and RO Module in Parallel and in Series Windmills will be arranged in parallel or in series, respectively, for the specific plant processes (figure 38). The parallel arrangement is typical for multiwindmill systems to simply increase the plant production. The series arrangement is designed to increase the water pressure to a satisfactory level to further treat the brine, which is discharged from RO modules.

50
Figure 38. Schematic of the Conceptual Design of a Renewable-Energy-Driven RO Desalination Pilot Plant.
10.2 Cost Analysis
Cost analysis was conducted in terms of system cost, income, and system salvage value. Two types of investment scenarios were assumed in cost analysis. The first investment scenario used a single windmill/pump unit, and the second investment scenario used a scaling-up system, which consists of 50 windmill/ pump units. Results of the cost analysis for a single system and for a scaling-up system are shown in tables 7 and 8, respectively.
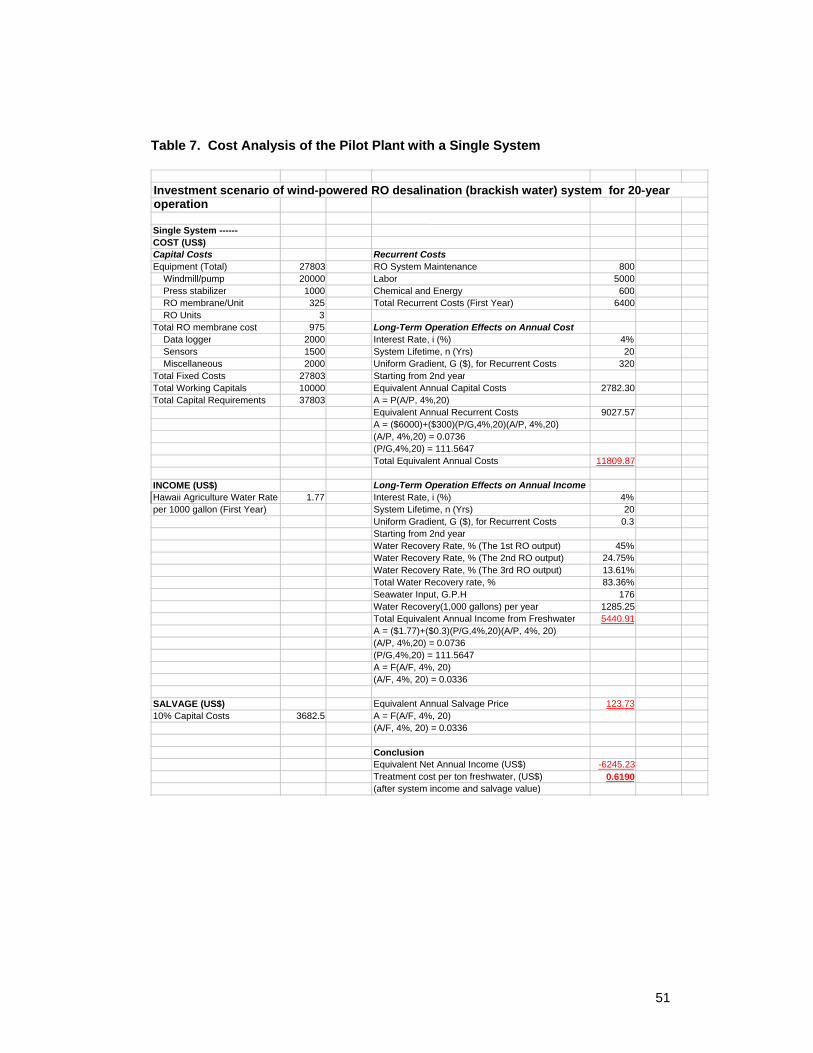
51
Table 7. Cost Analysis of the Pilot Plant with a Single System
Single System ------COST (US$)Capital Costs Recurrent CostsEquipment (Total) 27803 RO System Maintenance 800 Windmill/pump 20000 Labor 5000 Press stabilizer 1000 Chemical and Energy 600 RO membrane/Unit 325 Total Recurrent Costs (First Year) 6400 RO Units 3Total RO membrane cost 975 Long-Term Operation Effects on Annual Cost Data logger 2000 Interest Rate, i (%) 4% Sensors 1500 System Lifetime, n (Yrs) 20 Miscellaneous 2000 Uniform Gradient, G ($), for Recurrent Costs 320 Total Fixed Costs 27803 Starting from 2nd yearTotal Working Capitals 10000 Equivalent Annual Capital Costs 2782.30Total Capital Requirements 37803 A = P(A/P, 4%,20)
Equivalent Annual Recurrent Costs 9027.57A = ($6000)+($300)(P/G,4%,20)(A/P, 4%,20)(A/P, 4%,20) = 0.0736(P/G,4%,20) = 111.5647Total Equivalent Annual Costs 11809.87
INCOME (US$) Long-Term Operation Effects on Annual Income Hawaii Agriculture Water Rate 1.77 Interest Rate, i (%) 4%per 1000 gallon (First Year) System Lifetime, n (Yrs) 20
Uniform Gradient, G ($), for Recurrent Costs 0.3Starting from 2nd yearWater Recovery Rate, % (The 1st RO output) 45%Water Recovery Rate, % (The 2nd RO output) 24.75%Water Recovery Rate, % (The 3rd RO output) 13.61%Total Water Recovery rate, % 83.36%Seawater Input, G.P.H 176 Water Recovery(1,000 gallons) per year 1285.25Total Equivalent Annual Income from Freshwater 5440.91A = ($1.77)+($0.3)(P/G,4%,20)(A/P, 4%, 20)(A/P, 4%,20) = 0.0736(P/G,4%,20) = 111.5647A = F(A/F, 4%, 20)(A/F, 4%, 20) = 0.0336
SALVAGE (US$) Equivalent Annual Salvage Price 123.7310% Capital Costs 3682.5 A = F(A/F, 4%, 20)
(A/F, 4%, 20) = 0.0336
ConclusionEquivalent Net Annual Income (US$) -6245.23Treatment cost per ton freshwater, (US$) 0.6190(after system income and salvage value)
Investment scenario of wind-powered RO desalination (brackish water) system for 20-year operation
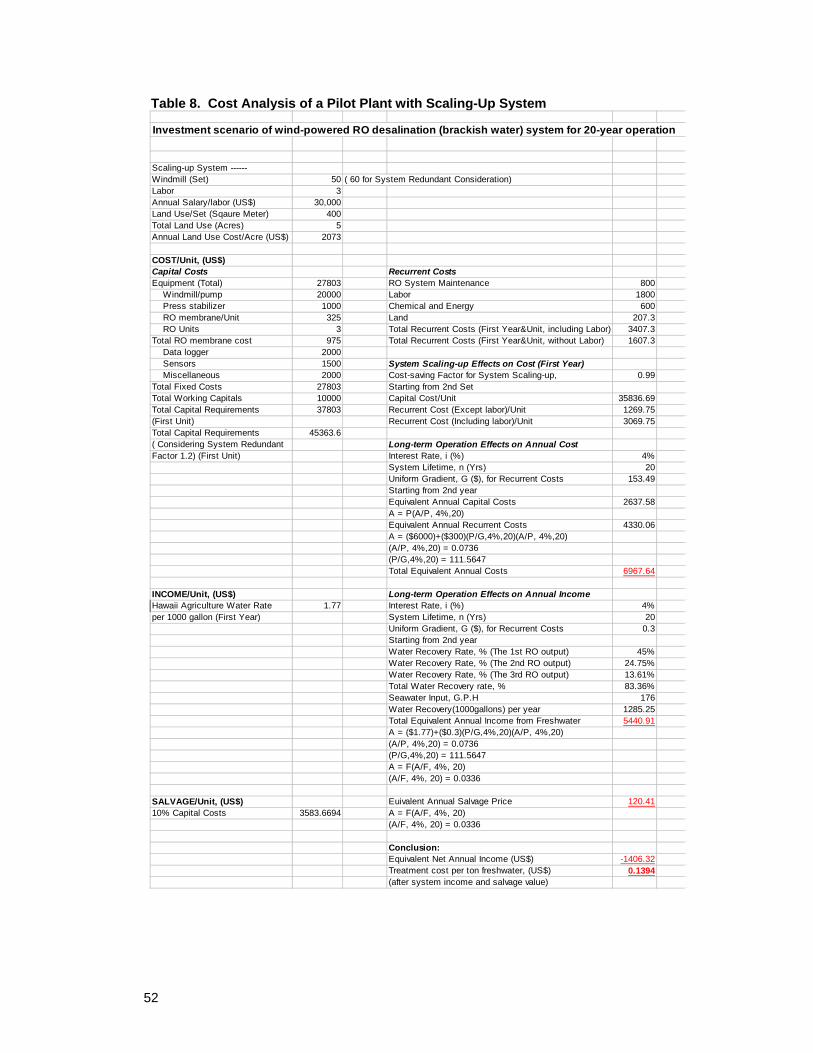
52
Table 8. Cost Analysis of a Pilot Plant with Scaling-Up System
Scaling-up System ------Windmill (Set) 50 ( 60 for System Redundant Consideration)Labor 3Annual Salary/labor (US$) 30,000Land Use/Set (Sqaure Meter) 400Total Land Use (Acres) 5Annual Land Use Cost/Acre (US$) 2073
COST/Unit, (US$)Capital Costs Recurrent CostsEquipment (Total) 27803 RO System Maintenance 800 Windmill/pump 20000 Labor 1800 Press stabilizer 1000 Chemical and Energy 600 RO membrane/Unit 325 Land 207.3 RO Units 3 Total Recurrent Costs (First Year&Unit, including Labor) 3407.3Total RO membrane cost 975 Total Recurrent Costs (First Year&Unit, without Labor) 1607.3 Data logger 2000 Sensors 1500 System Scaling-up Effects on Cost (First Year) Miscellaneous 2000 Cost-saving Factor for System Scaling-up, 0.99Total Fixed Costs 27803 Starting from 2nd SetTotal Working Capitals 10000 Capital Cost/Unit 35836.69Total Capital Requirements 37803 Recurrent Cost (Except labor)/Unit 1269.75(First Unit) Recurrent Cost (Including labor)/Unit 3069.75Total Capital Requirements 45363.6( Considering System Redundant Long-term Operation Effects on Annual CostFactor 1.2) (First Unit) Interest Rate, i (%) 4%
System Lifetime, n (Yrs) 20Uniform Gradient, G ($), for Recurrent Costs 153.49Starting from 2nd yearEquivalent Annual Capital Costs 2637.58A = P(A/P, 4%,20)Equivalent Annual Recurrent Costs 4330.06A = ($6000)+($300)(P/G,4%,20)(A/P, 4%,20)(A/P, 4%,20) = 0.0736(P/G,4%,20) = 111.5647Total Equivalent Annual Costs 6967.64
INCOME/Unit, (US$) Long-term Operation Effects on Annual IncomeHawaii Agriculture Water Rate 1.77 Interest Rate, i (%) 4%per 1000 gallon (First Year) System Lifetime, n (Yrs) 20
Uniform Gradient, G ($), for Recurrent Costs 0.3Starting from 2nd yearWater Recovery Rate, % (The 1st RO output) 45%Water Recovery Rate, % (The 2nd RO output) 24.75%Water Recovery Rate, % (The 3rd RO output) 13.61%Total Water Recovery rate, % 83.36%Seawater Input, G.P.H 176Water Recovery(1000gallons) per year 1285.25Total Equivalent Annual Income from Freshwater 5440.91A = ($1.77)+($0.3)(P/G,4%,20)(A/P, 4%,20)(A/P, 4%,20) = 0.0736(P/G,4%,20) = 111.5647A = F(A/F, 4%, 20)(A/F, 4%, 20) = 0.0336
SALVAGE/Unit, (US$) Euivalent Annual Salvage Price 120.4110% Capital Costs 3583.6694 A = F(A/F, 4%, 20)
(A/F, 4%, 20) = 0.0336
Conclusion:Equivalent Net Annual Income (US$) -1406.32Treatment cost per ton freshwater, (US$) 0.1394(after system income and salvage value)
Investment scenario of wind-powered RO desalination (brackish water) system for 20-year operation
53
Capital costs or working capitals involve the costs for equipment, land, and system construction. Equipment costs include windmill/pump, pressure stabilizer, RO membrane module, data logger, sensors, and miscellaneous. The earthwork cost is categorized into the following working capitals. Construction of the entire system can be done by an experienced technician in 3 months. The working capital is for a 3-month salary of the technician.
Operational costs or recurrent costs cover several items that occurred during the 20-year operation of the system. Note that for long-term operation period, a uniform gradient of raise is considered in evaluation of recurrent costs.
Income is derived by selling the product water. Hawaii agriculture water rate of $1.77 per 1,000 gal was the rate charged by the Honolulu Board of Water Supply in 2002 to 2005. It was assumed that after the system operation starts, water rates would increase $0.3 for the first 13,000 gallons and increase $0.02 for over 13,000 gallons.
After 20 years of operation, the fixed cost part of the RO system is expected to have a 10% salvage value.
Scaling-up and long-term system operation effects on the system cost were considered in the cost analysis. Scaling-up effect was evaluated by adopting a simple geometric progression relationship between scaling-up and cost saving. A scaling-up factor of 0.8 was adopted. If the cost of a single system was 1, according to the geometric progression relationship, the adding of a second system would increase the cost by a factor of 0.8. The third system would increase the cost by a factor of 0.64, and the fourth system would increase the cost by a factor of 0.51. Scaling-up factor for adding more systems can be determined accordingly.
Table 7 shows that the unit cost of freshwater production by the pilot plant with a single system cost is $2.39 per 1,000 gal or $0.62 per 1,000 gal more than the current water rate charged by the Honolulu Board of Water Supply. Table 8 indicates that, even with system scaling-up, the cost of product water would be $1.89 per 1,000 gal or $0.12 per 1,000 gal more than the current water rate charged by the Honolulu Board of Water Supply.
Renewable-energy-driven brackish desalination would not be a competitive water supply alternative for Oahu or for other large volcanic islands in the Pacific, where the cheap ground water supply is available. However, brackish water desalination will become an attractive water supply alternative when an imbalance of demand and supply develops in these islands. For small Pacific islands without adequate freshwater supply, brackish water desalination is an immediate solution to the problem.

55
Reference List Bureau of Reclamation, Progress Report No. 3, Canal Erosion and Tractive Force Study (Correlation of Laboratory Test Data) - Lower Cost Canal Lining Program, Report No. HYD-464, Denver, Colorado, October 1960.
Carlson, E.J., and P.F. Enger, Studies of Tractive Forces of Cohesive Soils in Earth Canals, Report No. HYD-504, Bureau of Reclamation, Denver, Colorado, October 1962.
Gibbs, H.J., A Study of Erosion and Tractive Force Characteristics in Relation to Soil Mechanics Properties - Earth Research Program, Report No. EM-643, Bureau of Reclamation, Denver, Colorado, 1962.
Holtz, W.G., Construction of Compacted Soil Linings for Canals, Report No. EM-383, Bureau of Reclamation, Denver, Colorado, 1962.
Merriman, J., and P.F. Enger, Progress Report of Canal Erosion and Tractive Force Study - Low Cost Canal Lining Program, General Report No. 21, Bureau of Reclamation, Denver, Colorado, March 1, 1957.
Merriman, J., and P.F. Enger, Progress Report No. 2 of Canal Erosion and Tractive Force Study, Report No. HYD-443.
Abdul-Fattah, A.F., “Selection of Solar Desalination System for Supply of Water in Remote arid Zones,” Desalination, Vol. 60, pp. 165-189, 1986.
Block, D., and J. Valenzuela, Thermoeconomic Optimization of OC-OTEC Electricity and Water Production Plants, Solar Energy Research Institute, Golden, Colorado, SERI/STR-251-2603, 1985.
Feron, P., “The Use of Wind-Power in Autonomous Reverse Osmosis Seawater Desalination,” Wind Engineering, Vol. 9, pp. 180-199, 1985.
Glueckstern, P., “Potential Uses of Solar Energy for Seawater Desalination,” Desalination, Vol. 101, pp. 11-20, 1995.
Gutman, R.G., Membrane Filtration, Adam Hilger, Bristol, England, 1987.
Habali S.M., and I.A. Saleh, “Design of Stand-Alone Brackish Water Desalination Wind Energy system for Jordan,” Solar Energy, Vol. 52, No. 6, pp. 525–532, 1994.
56
Hicks, D., C. Pleass, G.R. Mitcheson, and J. Salevan, “Delbouy: Ocean Wave-Powered Seawater Reverse Osmosis Desalination Systems,” Desalination, Vol. 73, pp. 81-94, 1989.
Kellogg, W.D., M.H. Nehrir, G. Venkataramanan, and V. Gerez, “General Unit Sizing and Cost Analysis for Stand-Alone Wind, Photovoltaic, and Hybrid Wind/PV Systems,” IEEE Transaction on Energy Conversion, Vol. 13, No. 1, pp. 70-75, 1998.
Kershman, S.A., J. Rheinlander, and H. Gabler, “Seawater Reverse Osmosis Powered from Renewable Energy Sources – Hybrid Wind/Photovoltaic/Grid Power Supply for Small-Scale Desalination in Libya,” Desalination, Vol. 153, pp. 17-23, 2002.
Kiranoudis, C.T., N.G. Voros, and Z.B. Maroulis, “Wind Energy Exploitation for Reverse Osmosis Desalination Plants,” Desalination, Vol. 109, pp. 195-209, 1997.
Le Gourieres, D., Wind Power Plant: Theory and Design, Pergamon Press, Oxford, 1982.
Liu, C.C.K., “Research on Artificial Upwelling and Mixing at the University of Hawaii at Manoa,” IOA Newsletter, International OTEC/DOWA Association, Vol. 10, No. 4, pp. 1-8, 1999.
Liu, C.C.K., C. Ewart, and Q. Huang, “Response of a Basal Water-Body to Forced Draft,” Ground Water in the Pacific Rim Countries, J. Peters (ed.), American Society of Civil Engineers, New York, New York, pp. 36-42, 1991.
Liu, C.C.K. and J.W. Park, “Water Desalination,” McGraw-Hill Encyclopedia of Science & Technology, Ninth Edition, Vol. 19, pp. 404-406, Published by the McGraw-Hill Book Co, 2002.
Liu, C.C.K., J.W. Park, J. Migita, and G. Qing, “Experiments of a Prototype Wind-Driven Reverse Osmosis Desalination System with Feedback Control,” Desalination, Vol. 150, pp. 277-287, 2002.
Liu, C.C.K., Analytical Groundwater Flow and Transport Modeling for the Estimation of the Sustainable Yield of Pearl Harbor Aquifer, Project Report PR-2006-06, Water Resources Research Center, University of Hawaii at Manoa, Honolulu, Hawaii, 2006.
Moss, D.R., Pressure Vessel Design Manual, Gulf Publishing Company, 1987.
57
Mulder, M., Basic Principles of Membrane Technology, second edition, Kluwer Academic, Dordrecht, 1996.
Parekh, B.S., Reverse Osmosis Technology – Application for High-Purity-Water Production, Marcel Dekker, Inc., New York, 1988.
Pinnau, I., and B.D. Freeman, “Formation and Modification of Polymetric Membrane: Overview,” in Membrane Formation and Modification, I. Pinnau and B.D. Freeman (eds.), ACS Symposium Series 744, American Chemical Society, Washington, DC, 2000.
Redondo J.A., and I. Lomax, “Experiences with the Pretreatment of Raw Water with High Fouling Potential for Reverse Osmosis Plant Using FILMTEC** Membranes,” Desalination, Vol. 110, pp. 167-182, 1997.
Reynolds, T.D., and P.A. Richards, Unit Operations and Processing in Environmental Engineering, Houghton Mifflin, Boston, 1996.
Robinson, R., G. Ho, and K. Mathew, “Development of a Reliable Low-Cost Reverse Osmosis Desalination Unit for Remote Communities,” Desalination, Vol. 86, pp. 9-26, 1992.
Rosenfeld, J., and S. Loeb, I & EC Process Design and Development, Vol. 6, pp. 123-127, 1967.
State of Hawaii, Kahoolawe Water Resources Study, Hawaii Department of Land and Natural Resources, Division of Water and Land Management, 1989.
Weiner, D., D. Fisher, E.J. Moses, B. Katz, and G. Meron, “Operation Experience of a Solar- and Wind-Powered Desalination Demonstration Plant,” Desalination, Vol. 137, pp. 7-13, 2001.
Wangnick, K., IDA Worldwide Desalting Plants Inventory Report No. 14, International Desalination Association, 1996

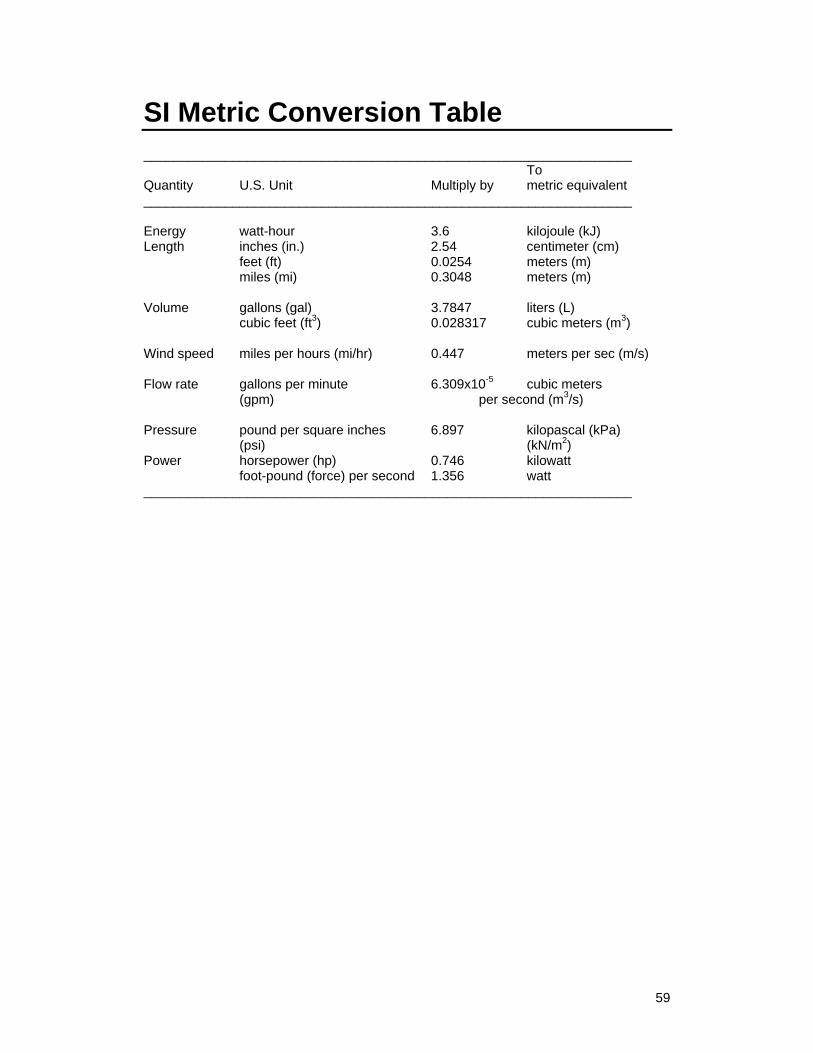
59
SI Metric Conversion Table __________________________________________________________________ To Quantity U.S. Unit Multiply by metric equivalent __________________________________________________________________ Energy watt-hour 3.6 kilojoule (kJ) Length inches (in.) 2.54 centimeter (cm) feet (ft) 0.0254 meters (m) miles (mi) 0.3048 meters (m) Volume gallons (gal) 3.7847 liters (L) cubic feet (ft3) 0.028317 cubic meters (m3) Wind speed miles per hours (mi/hr) 0.447 meters per sec (m/s) Flow rate gallons per minute 6.309x10⁻⁵ cubic meters
(gpm) per second (m3/s) Pressure pound per square inches 6.897 kilopascal (kPa) (psi) (kN/m2) Power horsepower (hp) 0.746 kilowatt foot-pound (force) per second 1.356 watt __________________________________________________________________


61
Appendix 1
Result of Field Experiment on August 16, 2005 for Two-Stage Pumping
Time Q4
(gpm) Q2
(gpm) Q1
(gpm) Q5
(gpm) P
(psi) C1
(ppm) C2
(ppm) C3
(ppm) R.R (%)
S. R. R (%)
14:02:00 0 0 2.849 0 25.09 3,233.55 0 0 14:03:00 0 0 3.047 0 25.05 3,222.34 0 0 14:04:00 0 0 2.139 0 22 3,232.3 0 0 14:05:00 0 0 1.929 0 19.08 3,235.85 0 0 14:06:00 0 0 2.503 0 17.37 3,225.02 0 0 14:07:00 0 0 3.212 0 16.67 3,225.02 0 0 14:08:00 0 0 3.706 0 15.9 3,212.81 0 0 14:09:00 0 0 3.717 0 15.87 3,226.44 0 0 14:10:00 0 0 3.535 0 15.69 3,236.23 0 0 14:11:00 0 0 2.537 0 14.91 3,224.41 0 0 14:12:00 0 0 3.711 0 14.68 3,226.84 0 0 14:13:00 0 0 3.161 0 14.34 3,231.98 0 0 14:14:00 0 0 2.883 0 13.95 3,231.24 0 0 14:15:00 0 0 3.195 0 13.72 3,229.17 0 0 14:16:00 0 0 2.656 0 13.41 3,228.31 0 0 14:17:00 0 0 2.888 0 12.59 3,231.59 0 0 14:18:00 0 0 3.513 0 12.56 3,222.86 0 0 14:19:00 0 0 2.843 0 12.61 3,238.8 0 0 14:20:00 0 0 3.416 0 12.17 3,247.94 0 0 14:21:00 0 0 0.091 0 11.64 3,231.59 0 0 14:22:00 0 0 0 0 9.51 3,239.16 0 0 14:23:00 0 0 0 0 8.03 3,228.82 0 0 14:24:00 0 0 2.724 0 7.18 3,079.34 0 0 14:25:00 0 0 1.968 0 8.54 3,157.57 0 0 14:26:00 0 0 3.859 0 10.45 3,127.35 0 0 14:27:00 0 0 3.371 0 12.61 3,119.24 0 0 14:28:00 0 0 2.599 0 14.73 3,122.77 0 0 14:29:00 0 0 2.049 0 16.71 3,115.11 0 0 14:30:00 0 0 2.508 0 19.06 3,117.94 0 0 14:31:00 0 0 3.308 0 22.58 3,107.92 0 0
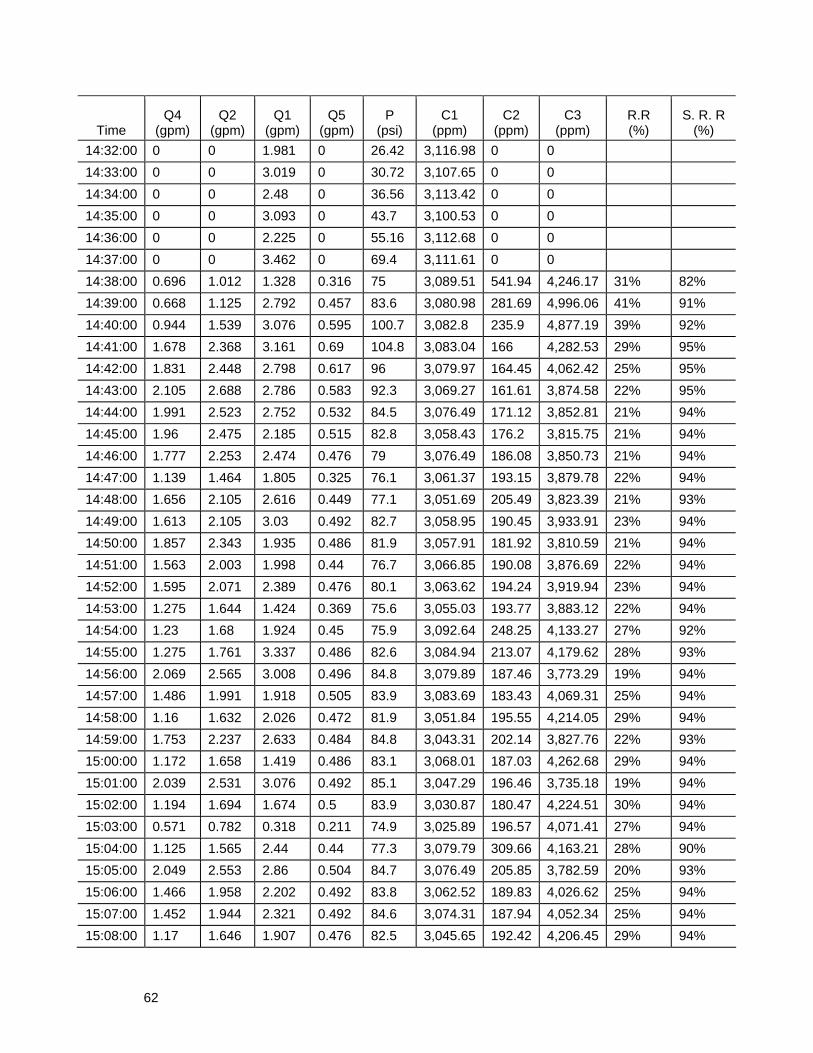
62
Time Q4
(gpm) Q2
(gpm) Q1
(gpm) Q5
(gpm) P
(psi) C1
(ppm) C2
(ppm) C3
(ppm) R.R (%)
S. R. R (%)
14:32:00 0 0 1.981 0 26.42 3,116.98 0 0 14:33:00 0 0 3.019 0 30.72 3,107.65 0 0 14:34:00 0 0 2.48 0 36.56 3,113.42 0 0 14:35:00 0 0 3.093 0 43.7 3,100.53 0 0 14:36:00 0 0 2.225 0 55.16 3,112.68 0 0 14:37:00 0 0 3.462 0 69.4 3,111.61 0 0 14:38:00 0.696 1.012 1.328 0.316 75 3,089.51 541.94 4,246.17 31% 82% 14:39:00 0.668 1.125 2.792 0.457 83.6 3,080.98 281.69 4,996.06 41% 91% 14:40:00 0.944 1.539 3.076 0.595 100.7 3,082.8 235.9 4,877.19 39% 92% 14:41:00 1.678 2.368 3.161 0.69 104.8 3,083.04 166 4,282.53 29% 95% 14:42:00 1.831 2.448 2.798 0.617 96 3,079.97 164.45 4,062.42 25% 95% 14:43:00 2.105 2.688 2.786 0.583 92.3 3,069.27 161.61 3,874.58 22% 95% 14:44:00 1.991 2.523 2.752 0.532 84.5 3,076.49 171.12 3,852.81 21% 94% 14:45:00 1.96 2.475 2.185 0.515 82.8 3,058.43 176.2 3,815.75 21% 94% 14:46:00 1.777 2.253 2.474 0.476 79 3,076.49 186.08 3,850.73 21% 94% 14:47:00 1.139 1.464 1.805 0.325 76.1 3,061.37 193.15 3,879.78 22% 94% 14:48:00 1.656 2.105 2.616 0.449 77.1 3,051.69 205.49 3,823.39 21% 93% 14:49:00 1.613 2.105 3.03 0.492 82.7 3,058.95 190.45 3,933.91 23% 94% 14:50:00 1.857 2.343 1.935 0.486 81.9 3,057.91 181.92 3,810.59 21% 94% 14:51:00 1.563 2.003 1.998 0.44 76.7 3,066.85 190.08 3,876.69 22% 94% 14:52:00 1.595 2.071 2.389 0.476 80.1 3,063.62 194.24 3,919.94 23% 94% 14:53:00 1.275 1.644 1.424 0.369 75.6 3,055.03 193.77 3,883.12 22% 94% 14:54:00 1.23 1.68 1.924 0.45 75.9 3,092.64 248.25 4,133.27 27% 92% 14:55:00 1.275 1.761 3.337 0.486 82.6 3,084.94 213.07 4,179.62 28% 93% 14:56:00 2.069 2.565 3.008 0.496 84.8 3,079.89 187.46 3,773.29 19% 94% 14:57:00 1.486 1.991 1.918 0.505 83.9 3,083.69 183.43 4,069.31 25% 94% 14:58:00 1.16 1.632 2.026 0.472 81.9 3,051.84 195.55 4,214.05 29% 94% 14:59:00 1.753 2.237 2.633 0.484 84.8 3,043.31 202.14 3,827.76 22% 93% 15:00:00 1.172 1.658 1.419 0.486 83.1 3,068.01 187.03 4,262.68 29% 94% 15:01:00 2.039 2.531 3.076 0.492 85.1 3,047.29 196.46 3,735.18 19% 94% 15:02:00 1.194 1.694 1.674 0.5 83.9 3,030.87 180.47 4,224.51 30% 94% 15:03:00 0.571 0.782 0.318 0.211 74.9 3,025.89 196.57 4,071.41 27% 94% 15:04:00 1.125 1.565 2.44 0.44 77.3 3,079.79 309.66 4,163.21 28% 90% 15:05:00 2.049 2.553 2.86 0.504 84.7 3,076.49 205.85 3,782.59 20% 93% 15:06:00 1.466 1.958 2.202 0.492 83.8 3,062.52 189.83 4,026.62 25% 94% 15:07:00 1.452 1.944 2.321 0.492 84.6 3,074.31 187.94 4,052.34 25% 94% 15:08:00 1.17 1.646 1.907 0.476 82.5 3,045.65 192.42 4,206.45 29% 94%
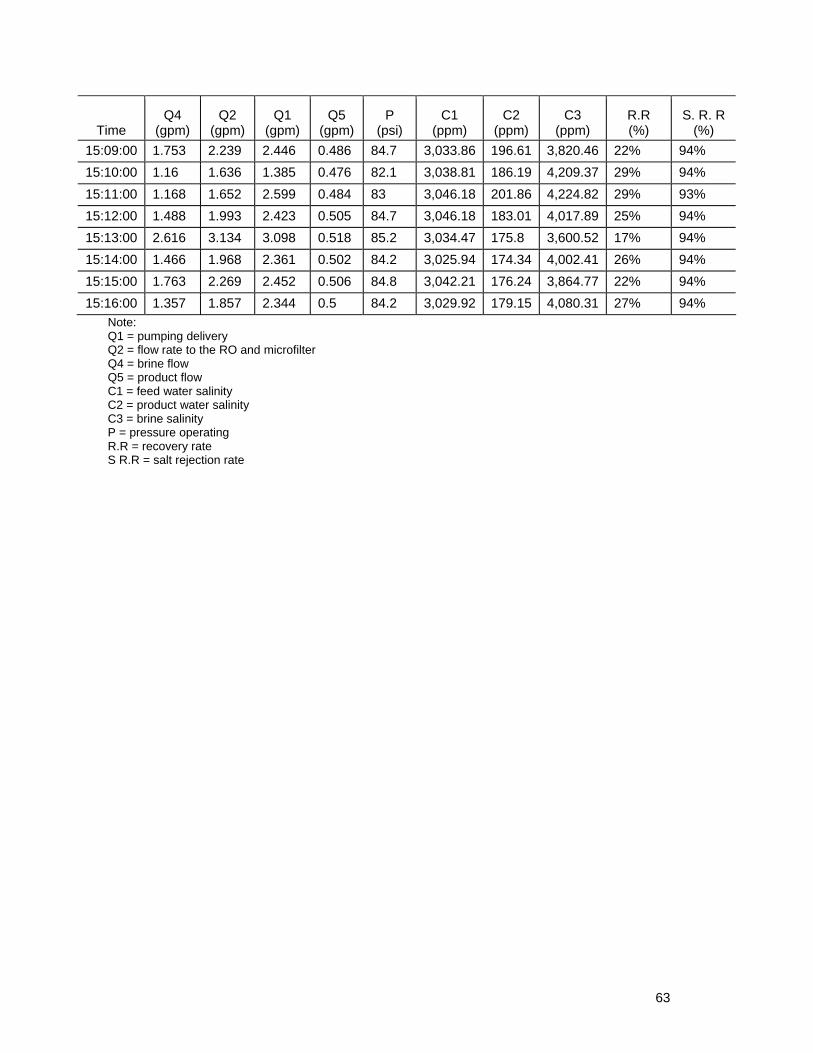
63
Time Q4
(gpm) Q2
(gpm) Q1
(gpm) Q5
(gpm) P
(psi) C1
(ppm) C2
(ppm) C3
(ppm) R.R (%)
S. R. R (%)
15:09:00 1.753 2.239 2.446 0.486 84.7 3,033.86 196.61 3,820.46 22% 94% 15:10:00 1.16 1.636 1.385 0.476 82.1 3,038.81 186.19 4,209.37 29% 94% 15:11:00 1.168 1.652 2.599 0.484 83 3,046.18 201.86 4,224.82 29% 93% 15:12:00 1.488 1.993 2.423 0.505 84.7 3,046.18 183.01 4,017.89 25% 94% 15:13:00 2.616 3.134 3.098 0.518 85.2 3,034.47 175.8 3,600.52 17% 94% 15:14:00 1.466 1.968 2.361 0.502 84.2 3,025.94 174.34 4,002.41 26% 94% 15:15:00 1.763 2.269 2.452 0.506 84.8 3,042.21 176.24 3,864.77 22% 94% 15:16:00 1.357 1.857 2.344 0.5 84.2 3,029.92 179.15 4,080.31 27% 94%
Note: Q1 = pumping delivery Q2 = flow rate to the RO and microfilter Q4 = brine flow Q5 = product flow C1 = feed water salinity C2 = product water salinity C3 = brine salinity P = pressure operating R.R = recovery rate S R.R = salt rejection rate

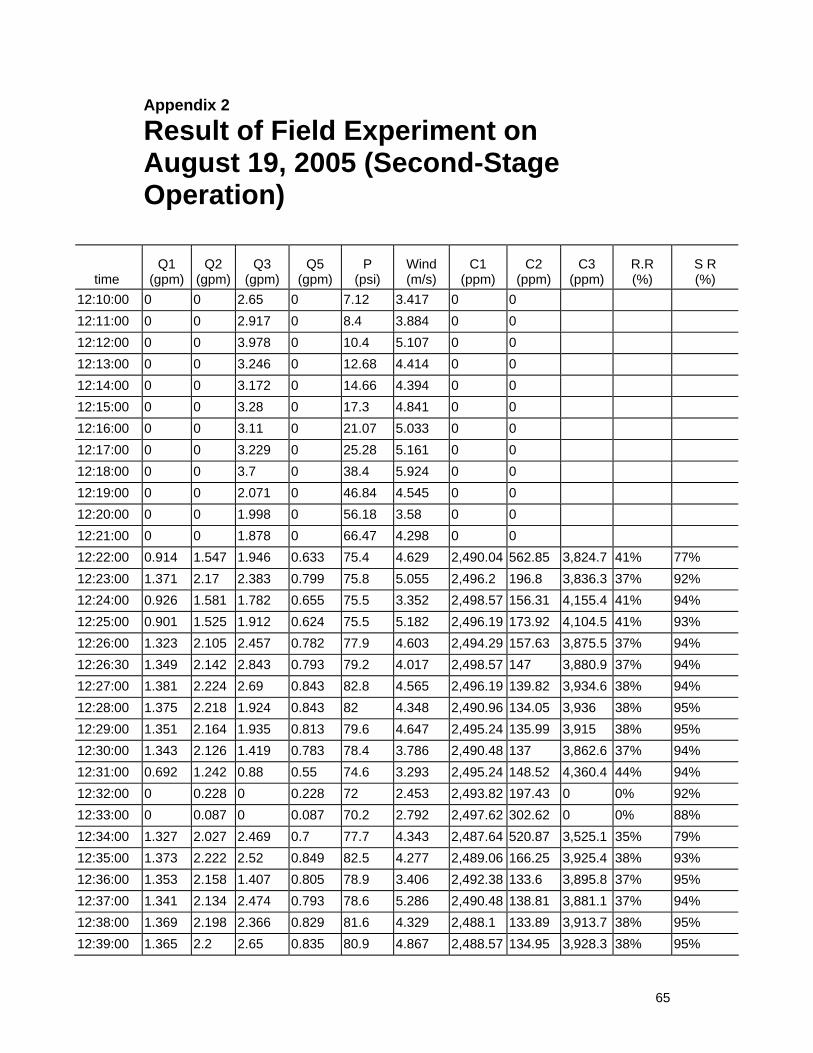
65
Appendix 2
Result of Field Experiment on August 19, 2005 (Second-Stage Operation)
time Q1
(gpm) Q2
(gpm) Q3
(gpm) Q5
(gpm) P
(psi) Wind (m/s)
C1 (ppm)
C2 (ppm)
C3 (ppm)
R.R (%)
S R (%)
12:10:00 0 0 2.65 0 7.12 3.417 0 0 12:11:00 0 0 2.917 0 8.4 3.884 0 0 12:12:00 0 0 3.978 0 10.4 5.107 0 0 12:13:00 0 0 3.246 0 12.68 4.414 0 0 12:14:00 0 0 3.172 0 14.66 4.394 0 0 12:15:00 0 0 3.28 0 17.3 4.841 0 0 12:16:00 0 0 3.11 0 21.07 5.033 0 0 12:17:00 0 0 3.229 0 25.28 5.161 0 0 12:18:00 0 0 3.7 0 38.4 5.924 0 0 12:19:00 0 0 2.071 0 46.84 4.545 0 0 12:20:00 0 0 1.998 0 56.18 3.58 0 0 12:21:00 0 0 1.878 0 66.47 4.298 0 0 12:22:00 0.914 1.547 1.946 0.633 75.4 4.629 2,490.04 562.85 3,824.7 41% 77% 12:23:00 1.371 2.17 2.383 0.799 75.8 5.055 2,496.2 196.8 3,836.3 37% 92% 12:24:00 0.926 1.581 1.782 0.655 75.5 3.352 2,498.57 156.31 4,155.4 41% 94% 12:25:00 0.901 1.525 1.912 0.624 75.5 5.182 2,496.19 173.92 4,104.5 41% 93% 12:26:00 1.323 2.105 2.457 0.782 77.9 4.603 2,494.29 157.63 3,875.5 37% 94% 12:26:30 1.349 2.142 2.843 0.793 79.2 4.017 2,498.57 147 3,880.9 37% 94% 12:27:00 1.381 2.224 2.69 0.843 82.8 4.565 2,496.19 139.82 3,934.6 38% 94% 12:28:00 1.375 2.218 1.924 0.843 82 4.348 2,490.96 134.05 3,936 38% 95% 12:29:00 1.351 2.164 1.935 0.813 79.6 4.647 2,495.24 135.99 3,915 38% 95% 12:30:00 1.343 2.126 1.419 0.783 78.4 3.786 2,490.48 137 3,862.6 37% 94% 12:31:00 0.692 1.242 0.88 0.55 74.6 3.293 2,495.24 148.52 4,360.4 44% 94% 12:32:00 0 0.228 0 0.228 72 2.453 2,493.82 197.43 0 0% 92% 12:33:00 0 0.087 0 0.087 70.2 2.792 2,497.62 302.62 0 0% 88% 12:34:00 1.327 2.027 2.469 0.7 77.7 4.343 2,487.64 520.87 3,525.1 35% 79% 12:35:00 1.373 2.222 2.52 0.849 82.5 4.277 2,489.06 166.25 3,925.4 38% 93% 12:36:00 1.353 2.158 1.407 0.805 78.9 3.406 2,492.38 133.6 3,895.8 37% 95% 12:37:00 1.341 2.134 2.474 0.793 78.6 5.286 2,490.48 138.81 3,881.1 37% 94% 12:38:00 1.369 2.198 2.366 0.829 81.6 4.329 2,488.1 133.89 3,913.7 38% 95% 12:39:00 1.365 2.2 2.65 0.835 80.9 4.867 2,488.57 134.95 3,928.3 38% 95%
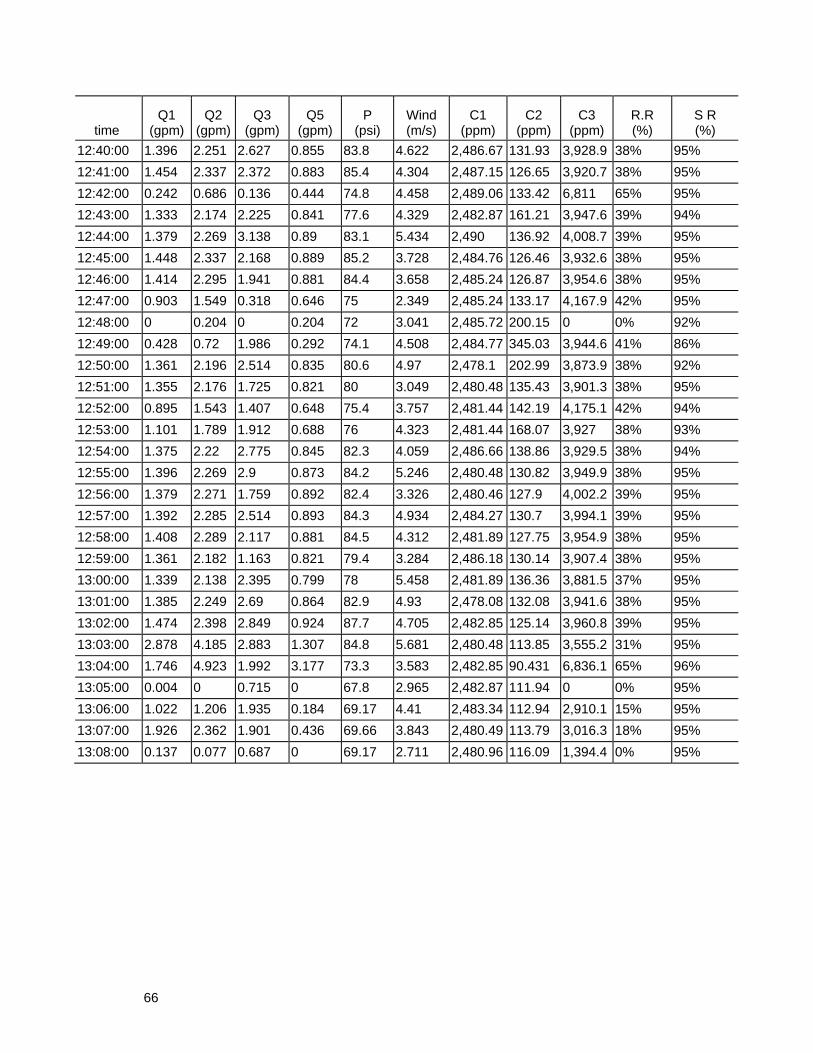
66
time Q1
(gpm) Q2
(gpm) Q3
(gpm) Q5
(gpm) P
(psi) Wind (m/s)
C1 (ppm)
C2 (ppm)
C3 (ppm)
R.R (%)
S R (%)
12:40:00 1.396 2.251 2.627 0.855 83.8 4.622 2,486.67 131.93 3,928.9 38% 95% 12:41:00 1.454 2.337 2.372 0.883 85.4 4.304 2,487.15 126.65 3,920.7 38% 95% 12:42:00 0.242 0.686 0.136 0.444 74.8 4.458 2,489.06 133.42 6,811 65% 95% 12:43:00 1.333 2.174 2.225 0.841 77.6 4.329 2,482.87 161.21 3,947.6 39% 94% 12:44:00 1.379 2.269 3.138 0.89 83.1 5.434 2,490 136.92 4,008.7 39% 95% 12:45:00 1.448 2.337 2.168 0.889 85.2 3.728 2,484.76 126.46 3,932.6 38% 95% 12:46:00 1.414 2.295 1.941 0.881 84.4 3.658 2,485.24 126.87 3,954.6 38% 95% 12:47:00 0.903 1.549 0.318 0.646 75 2.349 2,485.24 133.17 4,167.9 42% 95% 12:48:00 0 0.204 0 0.204 72 3.041 2,485.72 200.15 0 0% 92% 12:49:00 0.428 0.72 1.986 0.292 74.1 4.508 2,484.77 345.03 3,944.6 41% 86% 12:50:00 1.361 2.196 2.514 0.835 80.6 4.97 2,478.1 202.99 3,873.9 38% 92% 12:51:00 1.355 2.176 1.725 0.821 80 3.049 2,480.48 135.43 3,901.3 38% 95% 12:52:00 0.895 1.543 1.407 0.648 75.4 3.757 2,481.44 142.19 4,175.1 42% 94% 12:53:00 1.101 1.789 1.912 0.688 76 4.323 2,481.44 168.07 3,927 38% 93% 12:54:00 1.375 2.22 2.775 0.845 82.3 4.059 2,486.66 138.86 3,929.5 38% 94% 12:55:00 1.396 2.269 2.9 0.873 84.2 5.246 2,480.48 130.82 3,949.9 38% 95% 12:56:00 1.379 2.271 1.759 0.892 82.4 3.326 2,480.46 127.9 4,002.2 39% 95% 12:57:00 1.392 2.285 2.514 0.893 84.3 4.934 2,484.27 130.7 3,994.1 39% 95% 12:58:00 1.408 2.289 2.117 0.881 84.5 4.312 2,481.89 127.75 3,954.9 38% 95% 12:59:00 1.361 2.182 1.163 0.821 79.4 3.284 2,486.18 130.14 3,907.4 38% 95% 13:00:00 1.339 2.138 2.395 0.799 78 5.458 2,481.89 136.36 3,881.5 37% 95% 13:01:00 1.385 2.249 2.69 0.864 82.9 4.93 2,478.08 132.08 3,941.6 38% 95% 13:02:00 1.474 2.398 2.849 0.924 87.7 4.705 2,482.85 125.14 3,960.8 39% 95% 13:03:00 2.878 4.185 2.883 1.307 84.8 5.681 2,480.48 113.85 3,555.2 31% 95% 13:04:00 1.746 4.923 1.992 3.177 73.3 3.583 2,482.85 90.431 6,836.1 65% 96% 13:05:00 0.004 0 0.715 0 67.8 2.965 2,482.87 111.94 0 0% 95% 13:06:00 1.022 1.206 1.935 0.184 69.17 4.41 2,483.34 112.94 2,910.1 15% 95% 13:07:00 1.926 2.362 1.901 0.436 69.66 3.843 2,480.49 113.79 3,016.3 18% 95% 13:08:00 0.137 0.077 0.687 0 69.17 2.711 2,480.96 116.09 1,394.4 0% 95%
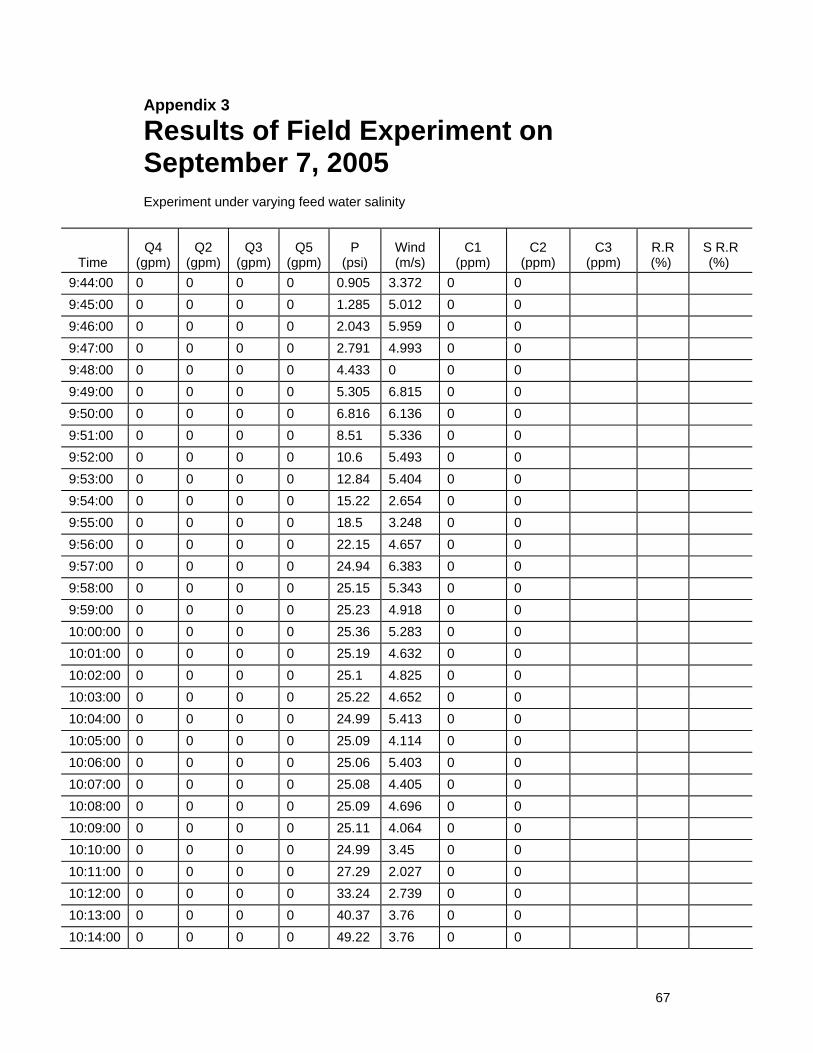
67
Appendix 3
Results of Field Experiment on September 7, 2005 Experiment under varying feed water salinity
Time Q4
(gpm) Q2
(gpm) Q3
(gpm) Q5
(gpm) P
(psi) Wind (m/s)
C1 (ppm)
C2 (ppm)
C3 (ppm)
R.R (%)
S R.R (%)
9:44:00 0 0 0 0 0.905 3.372 0 0 9:45:00 0 0 0 0 1.285 5.012 0 0 9:46:00 0 0 0 0 2.043 5.959 0 0 9:47:00 0 0 0 0 2.791 4.993 0 0 9:48:00 0 0 0 0 4.433 0 0 0 9:49:00 0 0 0 0 5.305 6.815 0 0 9:50:00 0 0 0 0 6.816 6.136 0 0 9:51:00 0 0 0 0 8.51 5.336 0 0 9:52:00 0 0 0 0 10.6 5.493 0 0 9:53:00 0 0 0 0 12.84 5.404 0 0 9:54:00 0 0 0 0 15.22 2.654 0 0 9:55:00 0 0 0 0 18.5 3.248 0 0 9:56:00 0 0 0 0 22.15 4.657 0 0 9:57:00 0 0 0 0 24.94 6.383 0 0 9:58:00 0 0 0 0 25.15 5.343 0 0 9:59:00 0 0 0 0 25.23 4.918 0 0 10:00:00 0 0 0 0 25.36 5.283 0 0 10:01:00 0 0 0 0 25.19 4.632 0 0 10:02:00 0 0 0 0 25.1 4.825 0 0 10:03:00 0 0 0 0 25.22 4.652 0 0 10:04:00 0 0 0 0 24.99 5.413 0 0 10:05:00 0 0 0 0 25.09 4.114 0 0 10:06:00 0 0 0 0 25.06 5.403 0 0 10:07:00 0 0 0 0 25.08 4.405 0 0 10:08:00 0 0 0 0 25.09 4.696 0 0 10:09:00 0 0 0 0 25.11 4.064 0 0 10:10:00 0 0 0 0 24.99 3.45 0 0 10:11:00 0 0 0 0 27.29 2.027 0 0 10:12:00 0 0 0 0 33.24 2.739 0 0 10:13:00 0 0 0 0 40.37 3.76 0 0 10:14:00 0 0 0 0 49.22 3.76 0 0
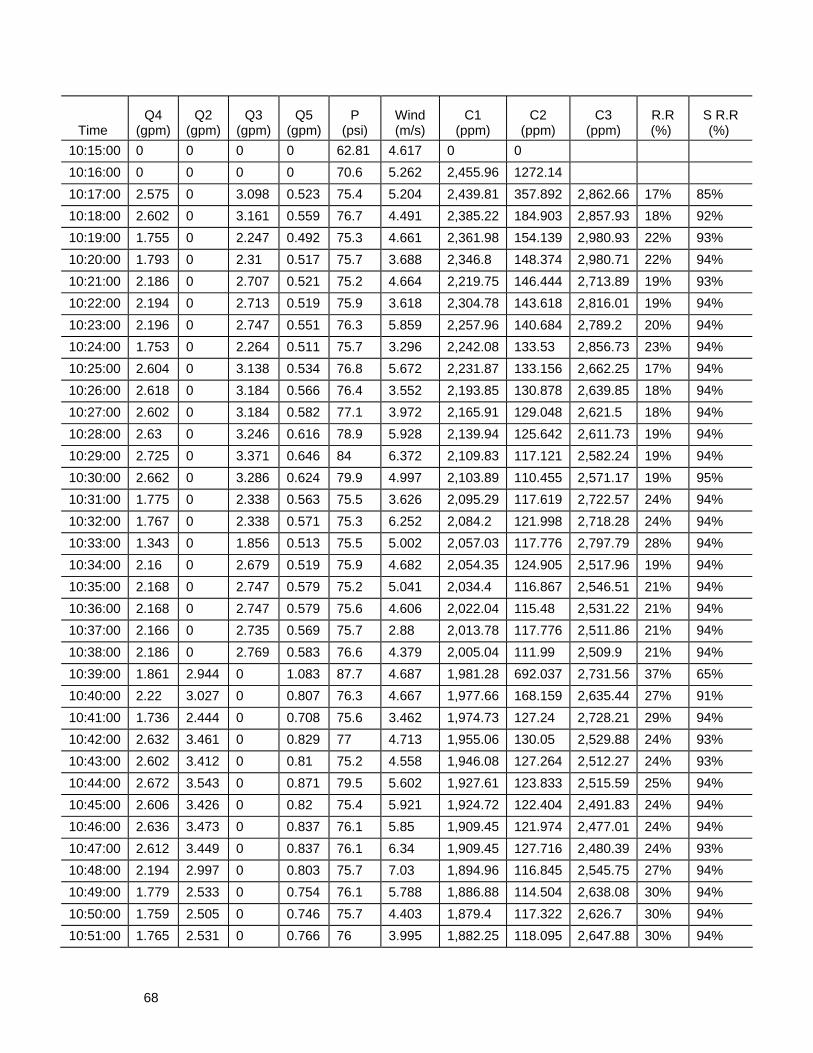
68
Time Q4
(gpm) Q2
(gpm) Q3
(gpm) Q5
(gpm) P
(psi) Wind (m/s)
C1 (ppm)
C2 (ppm)
C3 (ppm)
R.R (%)
S R.R (%)
10:15:00 0 0 0 0 62.81 4.617 0 0 10:16:00 0 0 0 0 70.6 5.262 2,455.96 1272.14 10:17:00 2.575 0 3.098 0.523 75.4 5.204 2,439.81 357.892 2,862.66 17% 85% 10:18:00 2.602 0 3.161 0.559 76.7 4.491 2,385.22 184.903 2,857.93 18% 92% 10:19:00 1.755 0 2.247 0.492 75.3 4.661 2,361.98 154.139 2,980.93 22% 93% 10:20:00 1.793 0 2.31 0.517 75.7 3.688 2,346.8 148.374 2,980.71 22% 94% 10:21:00 2.186 0 2.707 0.521 75.2 4.664 2,219.75 146.444 2,713.89 19% 93% 10:22:00 2.194 0 2.713 0.519 75.9 3.618 2,304.78 143.618 2,816.01 19% 94% 10:23:00 2.196 0 2.747 0.551 76.3 5.859 2,257.96 140.684 2,789.2 20% 94% 10:24:00 1.753 0 2.264 0.511 75.7 3.296 2,242.08 133.53 2,856.73 23% 94% 10:25:00 2.604 0 3.138 0.534 76.8 5.672 2,231.87 133.156 2,662.25 17% 94% 10:26:00 2.618 0 3.184 0.566 76.4 3.552 2,193.85 130.878 2,639.85 18% 94% 10:27:00 2.602 0 3.184 0.582 77.1 3.972 2,165.91 129.048 2,621.5 18% 94% 10:28:00 2.63 0 3.246 0.616 78.9 5.928 2,139.94 125.642 2,611.73 19% 94% 10:29:00 2.725 0 3.371 0.646 84 6.372 2,109.83 117.121 2,582.24 19% 94% 10:30:00 2.662 0 3.286 0.624 79.9 4.997 2,103.89 110.455 2,571.17 19% 95% 10:31:00 1.775 0 2.338 0.563 75.5 3.626 2,095.29 117.619 2,722.57 24% 94% 10:32:00 1.767 0 2.338 0.571 75.3 6.252 2,084.2 121.998 2,718.28 24% 94% 10:33:00 1.343 0 1.856 0.513 75.5 5.002 2,057.03 117.776 2,797.79 28% 94% 10:34:00 2.16 0 2.679 0.519 75.9 4.682 2,054.35 124.905 2,517.96 19% 94% 10:35:00 2.168 0 2.747 0.579 75.2 5.041 2,034.4 116.867 2,546.51 21% 94% 10:36:00 2.168 0 2.747 0.579 75.6 4.606 2,022.04 115.48 2,531.22 21% 94% 10:37:00 2.166 0 2.735 0.569 75.7 2.88 2,013.78 117.776 2,511.86 21% 94% 10:38:00 2.186 0 2.769 0.583 76.6 4.379 2,005.04 111.99 2,509.9 21% 94% 10:39:00 1.861 2.944 0 1.083 87.7 4.687 1,981.28 692.037 2,731.56 37% 65% 10:40:00 2.22 3.027 0 0.807 76.3 4.667 1,977.66 168.159 2,635.44 27% 91% 10:41:00 1.736 2.444 0 0.708 75.6 3.462 1,974.73 127.24 2,728.21 29% 94% 10:42:00 2.632 3.461 0 0.829 77 4.713 1,955.06 130.05 2,529.88 24% 93% 10:43:00 2.602 3.412 0 0.81 75.2 4.558 1,946.08 127.264 2,512.27 24% 93% 10:44:00 2.672 3.543 0 0.871 79.5 5.602 1,927.61 123.833 2,515.59 25% 94% 10:45:00 2.606 3.426 0 0.82 75.4 5.921 1,924.72 122.404 2,491.83 24% 94% 10:46:00 2.636 3.473 0 0.837 76.1 5.85 1,909.45 121.974 2,477.01 24% 94% 10:47:00 2.612 3.449 0 0.837 76.1 6.34 1,909.45 127.716 2,480.39 24% 93% 10:48:00 2.194 2.997 0 0.803 75.7 7.03 1,894.96 116.845 2,545.75 27% 94% 10:49:00 1.779 2.533 0 0.754 76.1 5.788 1,886.88 114.504 2,638.08 30% 94% 10:50:00 1.759 2.505 0 0.746 75.7 4.403 1,879.4 117.322 2,626.7 30% 94% 10:51:00 1.765 2.531 0 0.766 76 3.995 1,882.25 118.095 2,647.88 30% 94%
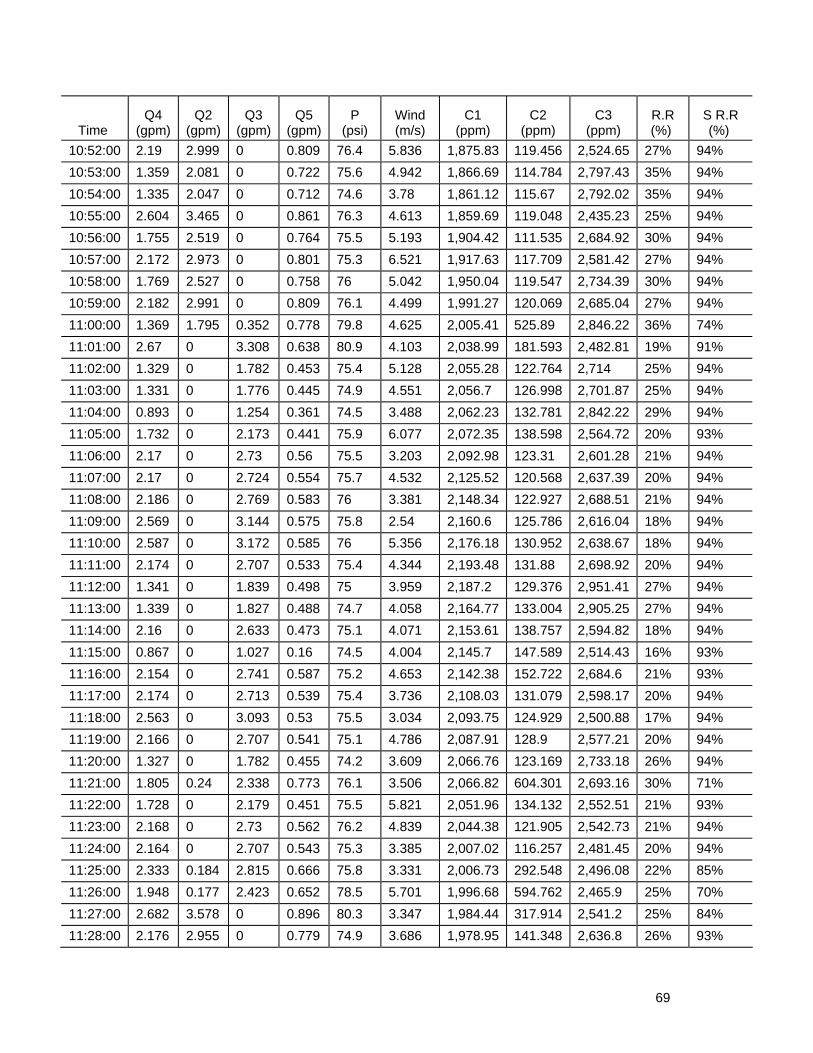
69
Time Q4
(gpm) Q2
(gpm) Q3
(gpm) Q5
(gpm) P
(psi) Wind (m/s)
C1 (ppm)
C2 (ppm)
C3 (ppm)
R.R (%)
S R.R (%)
10:52:00 2.19 2.999 0 0.809 76.4 5.836 1,875.83 119.456 2,524.65 27% 94% 10:53:00 1.359 2.081 0 0.722 75.6 4.942 1,866.69 114.784 2,797.43 35% 94% 10:54:00 1.335 2.047 0 0.712 74.6 3.78 1,861.12 115.67 2,792.02 35% 94% 10:55:00 2.604 3.465 0 0.861 76.3 4.613 1,859.69 119.048 2,435.23 25% 94% 10:56:00 1.755 2.519 0 0.764 75.5 5.193 1,904.42 111.535 2,684.92 30% 94% 10:57:00 2.172 2.973 0 0.801 75.3 6.521 1,917.63 117.709 2,581.42 27% 94% 10:58:00 1.769 2.527 0 0.758 76 5.042 1,950.04 119.547 2,734.39 30% 94% 10:59:00 2.182 2.991 0 0.809 76.1 4.499 1,991.27 120.069 2,685.04 27% 94% 11:00:00 1.369 1.795 0.352 0.778 79.8 4.625 2,005.41 525.89 2,846.22 36% 74% 11:01:00 2.67 0 3.308 0.638 80.9 4.103 2,038.99 181.593 2,482.81 19% 91% 11:02:00 1.329 0 1.782 0.453 75.4 5.128 2,055.28 122.764 2,714 25% 94% 11:03:00 1.331 0 1.776 0.445 74.9 4.551 2,056.7 126.998 2,701.87 25% 94% 11:04:00 0.893 0 1.254 0.361 74.5 3.488 2,062.23 132.781 2,842.22 29% 94% 11:05:00 1.732 0 2.173 0.441 75.9 6.077 2,072.35 138.598 2,564.72 20% 93% 11:06:00 2.17 0 2.73 0.56 75.5 3.203 2,092.98 123.31 2,601.28 21% 94% 11:07:00 2.17 0 2.724 0.554 75.7 4.532 2,125.52 120.568 2,637.39 20% 94% 11:08:00 2.186 0 2.769 0.583 76 3.381 2,148.34 122.927 2,688.51 21% 94% 11:09:00 2.569 0 3.144 0.575 75.8 2.54 2,160.6 125.786 2,616.04 18% 94% 11:10:00 2.587 0 3.172 0.585 76 5.356 2,176.18 130.952 2,638.67 18% 94% 11:11:00 2.174 0 2.707 0.533 75.4 4.344 2,193.48 131.88 2,698.92 20% 94% 11:12:00 1.341 0 1.839 0.498 75 3.959 2,187.2 129.376 2,951.41 27% 94% 11:13:00 1.339 0 1.827 0.488 74.7 4.058 2,164.77 133.004 2,905.25 27% 94% 11:14:00 2.16 0 2.633 0.473 75.1 4.071 2,153.61 138.757 2,594.82 18% 94% 11:15:00 0.867 0 1.027 0.16 74.5 4.004 2,145.7 147.589 2,514.43 16% 93% 11:16:00 2.154 0 2.741 0.587 75.2 4.653 2,142.38 152.722 2,684.6 21% 93% 11:17:00 2.174 0 2.713 0.539 75.4 3.736 2,108.03 131.079 2,598.17 20% 94% 11:18:00 2.563 0 3.093 0.53 75.5 3.034 2,093.75 124.929 2,500.88 17% 94% 11:19:00 2.166 0 2.707 0.541 75.1 4.786 2,087.91 128.9 2,577.21 20% 94% 11:20:00 1.327 0 1.782 0.455 74.2 3.609 2,066.76 123.169 2,733.18 26% 94% 11:21:00 1.805 0.24 2.338 0.773 76.1 3.506 2,066.82 604.301 2,693.16 30% 71% 11:22:00 1.728 0 2.179 0.451 75.5 5.821 2,051.96 134.132 2,552.51 21% 93% 11:23:00 2.168 0 2.73 0.562 76.2 4.839 2,044.38 121.905 2,542.73 21% 94% 11:24:00 2.164 0 2.707 0.543 75.3 3.385 2,007.02 116.257 2,481.45 20% 94% 11:25:00 2.333 0.184 2.815 0.666 75.8 3.331 2,006.73 292.548 2,496.08 22% 85% 11:26:00 1.948 0.177 2.423 0.652 78.5 5.701 1,996.68 594.762 2,465.9 25% 70% 11:27:00 2.682 3.578 0 0.896 80.3 3.347 1,984.44 317.914 2,541.2 25% 84% 11:28:00 2.176 2.955 0 0.779 74.9 3.686 1,978.95 141.348 2,636.8 26% 93%
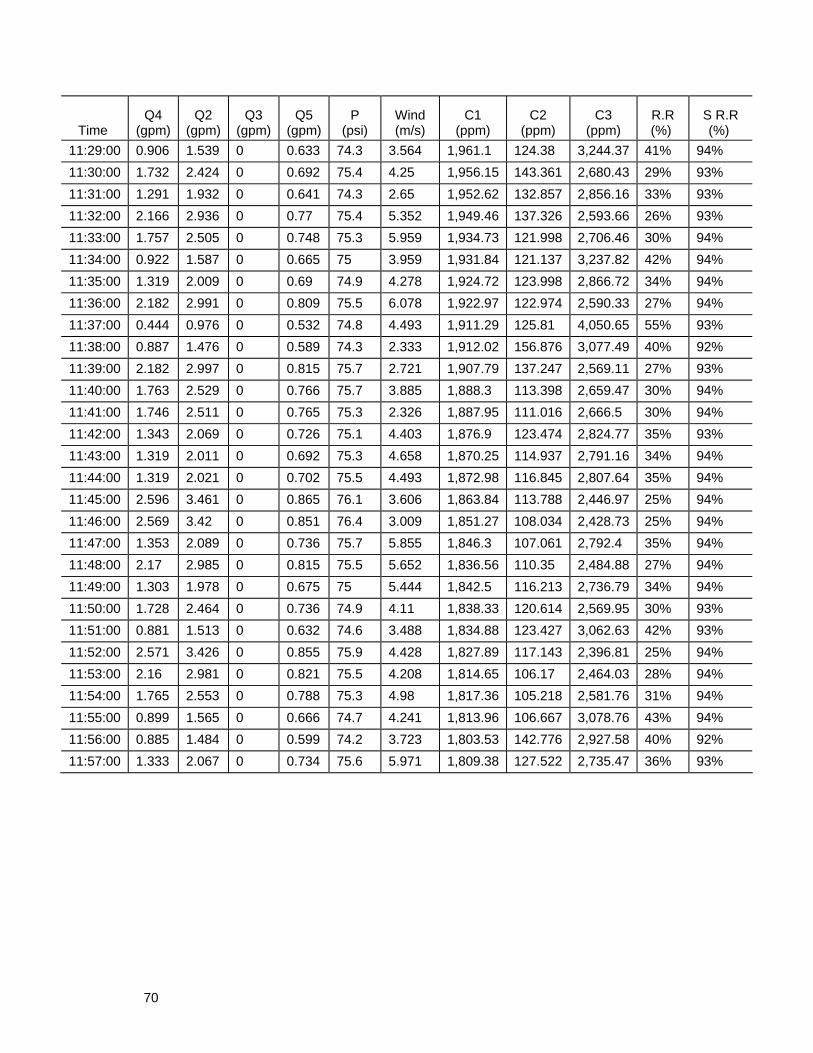
70
Time Q4
(gpm) Q2
(gpm) Q3
(gpm) Q5
(gpm) P
(psi) Wind (m/s)
C1 (ppm)
C2 (ppm)
C3 (ppm)
R.R (%)
S R.R (%)
11:29:00 0.906 1.539 0 0.633 74.3 3.564 1,961.1 124.38 3,244.37 41% 94% 11:30:00 1.732 2.424 0 0.692 75.4 4.25 1,956.15 143.361 2,680.43 29% 93% 11:31:00 1.291 1.932 0 0.641 74.3 2.65 1,952.62 132.857 2,856.16 33% 93% 11:32:00 2.166 2.936 0 0.77 75.4 5.352 1,949.46 137.326 2,593.66 26% 93% 11:33:00 1.757 2.505 0 0.748 75.3 5.959 1,934.73 121.998 2,706.46 30% 94% 11:34:00 0.922 1.587 0 0.665 75 3.959 1,931.84 121.137 3,237.82 42% 94% 11:35:00 1.319 2.009 0 0.69 74.9 4.278 1,924.72 123.998 2,866.72 34% 94% 11:36:00 2.182 2.991 0 0.809 75.5 6.078 1,922.97 122.974 2,590.33 27% 94% 11:37:00 0.444 0.976 0 0.532 74.8 4.493 1,911.29 125.81 4,050.65 55% 93% 11:38:00 0.887 1.476 0 0.589 74.3 2.333 1,912.02 156.876 3,077.49 40% 92% 11:39:00 2.182 2.997 0 0.815 75.7 2.721 1,907.79 137.247 2,569.11 27% 93% 11:40:00 1.763 2.529 0 0.766 75.7 3.885 1,888.3 113.398 2,659.47 30% 94% 11:41:00 1.746 2.511 0 0.765 75.3 2.326 1,887.95 111.016 2,666.5 30% 94% 11:42:00 1.343 2.069 0 0.726 75.1 4.403 1,876.9 123.474 2,824.77 35% 93% 11:43:00 1.319 2.011 0 0.692 75.3 4.658 1,870.25 114.937 2,791.16 34% 94% 11:44:00 1.319 2.021 0 0.702 75.5 4.493 1,872.98 116.845 2,807.64 35% 94% 11:45:00 2.596 3.461 0 0.865 76.1 3.606 1,863.84 113.788 2,446.97 25% 94% 11:46:00 2.569 3.42 0 0.851 76.4 3.009 1,851.27 108.034 2,428.73 25% 94% 11:47:00 1.353 2.089 0 0.736 75.7 5.855 1,846.3 107.061 2,792.4 35% 94% 11:48:00 2.17 2.985 0 0.815 75.5 5.652 1,836.56 110.35 2,484.88 27% 94% 11:49:00 1.303 1.978 0 0.675 75 5.444 1,842.5 116.213 2,736.79 34% 94% 11:50:00 1.728 2.464 0 0.736 74.9 4.11 1,838.33 120.614 2,569.95 30% 93% 11:51:00 0.881 1.513 0 0.632 74.6 3.488 1,834.88 123.427 3,062.63 42% 93% 11:52:00 2.571 3.426 0 0.855 75.9 4.428 1,827.89 117.143 2,396.81 25% 94% 11:53:00 2.16 2.981 0 0.821 75.5 4.208 1,814.65 106.17 2,464.03 28% 94% 11:54:00 1.765 2.553 0 0.788 75.3 4.98 1,817.36 105.218 2,581.76 31% 94% 11:55:00 0.899 1.565 0 0.666 74.7 4.241 1,813.96 106.667 3,078.76 43% 94% 11:56:00 0.885 1.484 0 0.599 74.2 3.723 1,803.53 142.776 2,927.58 40% 92% 11:57:00 1.333 2.067 0 0.734 75.6 5.971 1,809.38 127.522 2,735.47 36% 93%
Related Documents