Wind Energy Data Analysis and Resource Mapping of Geba Catchment, North Ethiopia by Mulu Bayray, Anwar Mustefa, Ftwi Yohannes, Hailay Kiros, Asfafaw Haileslasie, Petros Gebray, Mesele Hayelom and Addisu Dagne R EPRINTED FROM WIND ENGINEERING VOLUME 37, N O . 4, 2013 M U LT I -S CIENCE P UBLISHING C O M PA N Y 5 W AT E S WAY • B RENTWOOD • E SSEX CM15 9TB • UK TEL : +44(0)1277 224632 • F AX: +44(0)1277 223453 E-MAIL: [email protected] • WEB SITE: www.multi-science.co.uk

Welcome message from author
This document is posted to help you gain knowledge. Please leave a comment to let me know what you think about it! Share it to your friends and learn new things together.
Transcript
Wind Energy Data Analysis and Resource Mapping of Geba Catchment, North Ethiopia
by
Mulu Bayray, Anwar Mustefa, Ftwi Yohannes, Hailay Kiros, AsfafawHaileslasie, Petros Gebray, Mesele Hayelom and Addisu Dagne
REPRINTED FROM
WIND ENGINEERINGVOLUME 37, NO. 4, 2013
MULTI-SCIENCE PUBLISHING COMPANY5 WATES WAY • BRENTWOOD • ESSEX CM15 9TB • UKTEL: +44(0)1277 224632 • FAX: +44(0)1277 223453E-MAIL: [email protected] • WEB SITE: www.multi-science.co.uk
Wind Energy Data Analysis and Resource Mappingof Geba Catchment, North Ethiopia
Mulu Bayray, Anwar Mustefa, Ftwi Yohannes, Hailay Kiros, Asfafaw Haileslasie,Petros Gebray, Mesele Hayelom and Addisu DagneDepartment of Mechanical Engineering, EiT – M, Mekelle University, Ethiopia
Received March 28, 2013;Accepted May 3, 2013
WIND ENGINEERING VOLUME 37, NO. 4, 2013 PP 333–346 333
ABSTRACTWind energy potential in Ethiopia is estimated to be enormous due to local peculiar
landscape situations. However, the country started to utilize the potential only very recently.
One of the reasons for low utilization of wind energy in Ethiopia is the absence of reliable and
accurate wind energy resource data. Development of reliable and accurate wind atlas helps
to identify candidate sites for wind energy applications and facilitates the planning and
implementation of wind energy projects. This paper presents wind energy data analysis and
wind atlas of Geba catchment in North Ethiopia.
The work reported in this paper is based on wind data collected over a period of one year
from measuring masts in six different sites in Tigray, Ethiopia. The data was analyzed using
various statistical software to evaluate the wind energy potential of the area. Average wind
speed and power density, distribution of the wind prevailing direction, turbulence intensity
and wind shear profile of each site were determined. Wind Atlas Analysis and Application
Programme (WAsP) was used to generate the wind atlas of the area and to develop the wind
speed and power density maps.
The data analysis indicates that the average wind speed at 10 m above ground level
(a.g.l.) varies from 3.7 m/s to 6.64 m/s. The mean power density at 10 m a.g.l varies from
64 W/m2 to 301 W/m2. The prevailing wind directions are East and South East directions.
The wind resource map developed by WAsP at 50 m indicated that the catchment has good
wind power potential having mean wind speed and power density of 6.5 m/s and 288 W/m2,
respectively.
1. INTRODUCTIONEthiopia’s current electrical energy supply is mainly from hydropower. Wind energy is an
alternative energy resource which can complement hydropower especially during the dry
season. Due to the fast economic development in the recent years, the country is looking for
more power plants to satisfy the high demand for electricity. Wind energy resource potential
in the country is estimated to be high. The objective of the study reported in this paper was to
conduct wind energy resource assessment of a specific catchment area of the river named
Geba located in Northern part of Ethiopia.
2. METHODOLOGY2.1. Description of the study areaGeba catchment is found in Tigray Region, North Ethiopia. The entire Geba catchment is
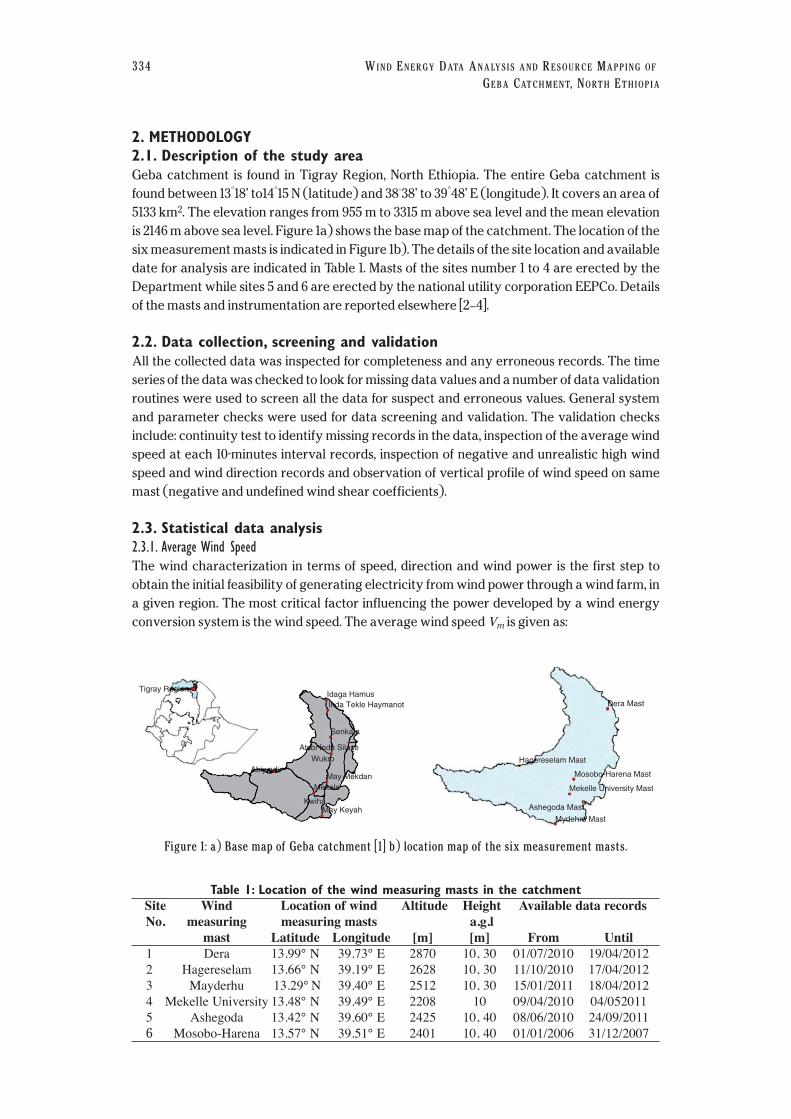
found between 13°18’ to14°15 N (latitude) and 38°38’ to 39°48’ E (longitude). It covers an area of
5133 km2. The elevation ranges from 955 m to 3315 m above sea level and the mean elevation
is 2146 m above sea level. Figure 1a) shows the base map of the catchment. The location of the
six measurement masts is indicated in Figure 1b). The details of the site location and available
date for analysis are indicated in Table 1. Masts of the sites number 1 to 4 are erected by the
Department while sites 5 and 6 are erected by the national utility corporation EEPCo. Details
of the masts and instrumentation are reported elsewhere [2−4].
2.2. Data collection, screening and validationAll the collected data was inspected for completeness and any erroneous records. The time
series of the data was checked to look for missing data values and a number of data validation
routines were used to screen all the data for suspect and erroneous values. General system
and parameter checks were used for data screening and validation. The validation checks
include: continuity test to identify missing records in the data, inspection of the average wind
speed at each 10-minutes interval records, inspection of negative and unrealistic high wind
speed and wind direction records and observation of vertical profile of wind speed on same
mast (negative and undefined wind shear coefficients).
2.3. Statistical data analysis2.3.1. Average Wind SpeedThe wind characterization in terms of speed, direction and wind power is the first step to
obtain the initial feasibility of generating electricity from wind power through a wind farm, in
a given region. The most critical factor influencing the power developed by a wind energy
conversion system is the wind speed. The average wind speed Vm is given as:
334 WIND ENERGY DATA ANALYSIS AND RESOURCE MAPPING OF
GEBA CATCHMENT, NORTH ETHIOPIA
Idaga HamusInda Tekle Haymanot
Senkata
Atsbi Inda SilaseWukro
May MekdanMekele
KwihaMay Keyah
Tigray Region
Dera Mast
Hagereselam Mast
Mosobo-Harena Mast
Mekelle University Mast
Ashegoda Mast
Mydehru Mast
Abiy adi
Figure 1: a) Base map of Geba catchment [1] b) location map of the six measurement masts.
Table 1: Location of the wind measuring masts in the catchmentSite Wind Location of wind Altitude Height Available data recordsNo. measuring measuring masts a.g.l
mast Latitude Longitude [m] [m] From Until1 Dera 13.99° N 39.73° E 2870 10, 30 01/07/2010 19/04/20122 Hagereselam 13.66° N 39.19° E 2628 10, 30 11/10/2010 17/04/20123 Mayderhu 13.29° N 39.40° E 2512 10, 30 15/01/2011 18/04/20124 Mekelle University 13.48° N 39.49° E 2208 10 09/04/2010 04/0520115 Ashegoda 13.42° N 39.60° E 2425 10, 40 08/06/2010 24/09/20116 Mosobo-Harena 13.57° N 39.51° E 2401 10, 40 01/01/2006 31/12/2007
(1)
Where Vi is the wind speed at interval i and n is the number of records. The average wind
speed is calculated at hourly, daily, monthly and annual interval.
2.3.2. Wind Power DensityThe wind power per unit area, P/A or wind power density at interval i is given by:
(2)
Where Vi is the wind speed at interval i, ρ is air density. Average power density is
calculated in similar way to the average speed shown previously.
The wind speed and power density at a certain height determines the wind power class of the
site. The wind power class of a site is determined as per the standard classification reported in [5].
2.3.3. Wind Shear CoefficientThe wind shear coefficient is calculated assuming power law relationship at the two heights.
The coefficient α is found from:
(3)
Where V1 is the wind speed at height z1 and V2 is the wind speed at height z2.
2.3.4. TurbulenceThe average turbulence intensity of the sites was calculated by taking the average of the
individual turbulence intensity values of 10 minutes records which were calculated by
dividing the standards deviation with the average speed of each record. The turbulence
intensity TI at interval i is given from [6]:
(4)
Where σi is the standard deviation of wind speed at interval i. The overall average
turbulence is found in similar way to that shown for wind speed. TI is a relative indicator of
turbulence with low levels indicated by values less than or equal to 0.10, moderate levels to
0.25, and high levels greater than 0.25.
2.4. Modeling with WAsP2.4.1. Observed Wind Climate (OWC)WAsP (Wind Atlas Analysis and Application Program) [7] was used to generate the Wind
Atlas and to develop the wind resource map of the Catchment. The flow modeling of WAsP is
discussed in [8] and application of the software for resource assessment may be found in
literature such as [9−11]. The various inputs needed in WAsP are Observed Wind Climate
(OWC) of sites, Vector Map of the catchment and Obstacle Groups to the measuring masts.
OWC is a tabular summary of the frequency of occurrence of wind speed and wind direction.
The OWC is produced from raw wind speed and direction measurements.
TIV
ii
i
=σ
α =−
−
In In
In In
( ) ( )
( ) ( )
V V
Z Z2 1
2 1
P
A nV
ii
=1 3ρ
Vn
Vm i
i
n
==
∑1
0
WIND ENGINEERING VOLUME 37, NO. 4, 2013 PP 333–346 335
The OWC represents the data converted into Weibull probability density function. The
Weibull function is defined using two factors namely the scale parameter A and the shape
parameter k. The OWC also shows the wind direction distribution as wind rose. Wind rose
diagram shows the distribution of wind in different directions. The wind rose diagram is
generated by dividing into twelve equally spaced sectors. The frequency distribution for each
sector is calculated and plotted in the wind rose diagram.
2.4.2 Wind AtlasWind Atlas is a generalized wind climate of the observed wind climate. The data measured
from the wind measuring mast is a site specific data. The Wind Atlas data sets are site-
independent and the wind distributions have been reduced to certain standard conditions.
The Wind Atlas contains data for 5 reference roughness lengths (0.000 m, 0.030 m, 0.100 m,
0.200 m, 0.400 m) and 5 reference heights (10 m, 30 m, 50 m, 70 m, 100 m) a.g.l.
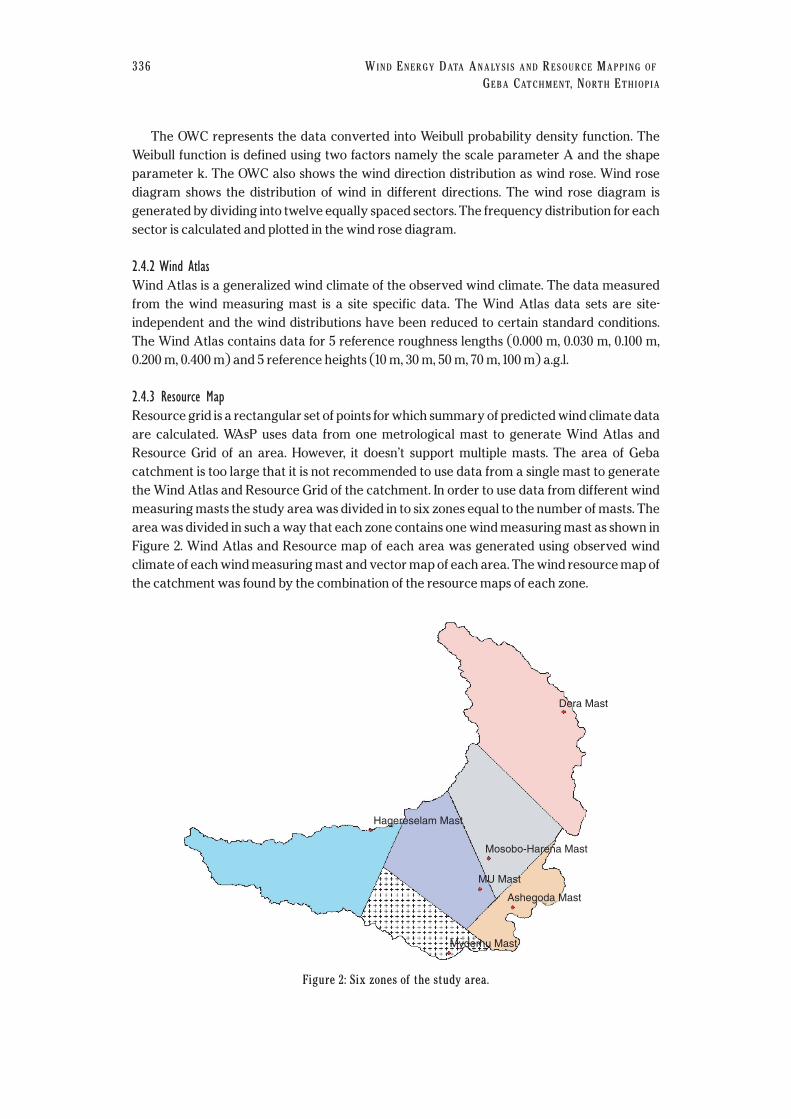
2.4.3 Resource MapResource grid is a rectangular set of points for which summary of predicted wind climate data
are calculated. WAsP uses data from one metrological mast to generate Wind Atlas and
Resource Grid of an area. However, it doesn’t support multiple masts. The area of Geba
catchment is too large that it is not recommended to use data from a single mast to generate
the Wind Atlas and Resource Grid of the catchment. In order to use data from different wind
measuring masts the study area was divided in to six zones equal to the number of masts. The
area was divided in such a way that each zone contains one wind measuring mast as shown in
Figure 2. Wind Atlas and Resource map of each area was generated using observed wind
climate of each wind measuring mast and vector map of each area. The wind resource map of
the catchment was found by the combination of the resource maps of each zone.
336 WIND ENERGY DATA ANALYSIS AND RESOURCE MAPPING OF
GEBA CATCHMENT, NORTH ETHIOPIA
Dera Mast
Hagereselam Mast
Mosobo-Harena Mast
MU Mast
Ashegoda Mast
Myderhu Mast
Figure 2: Six zones of the study area.
3. RESULTS AND DISCUSSION3.1. Data recovery and validationData recovery and validation was conducted as per the procedure discussed in section 2.2.
The summary of results of the data screening and validation is shown in Table 2. The data
recovery rate was greater than 96% in all the measuring stations except in Hagereselam
which was 94%. The reason for low data recovery rate in Hagereselam mast was that the mast
was taken down for 20 days from 21-05-2011 to 11-06-2011 to replace a broken anemometer
accounting for 4% of the missing data. The data recovery rate in the other masts was good
except for the loss of some data during transfer from data loggers to laptops because the
memory card had to be removed.
Measures were taken to replace the missing and erroneous data records when
necessary. Data lost during transfer of data due to removal of memory card was filled with
average data record of the same hour where the data was missing. The missing data
records at 30 m in Hagereselam mast due to break down of the anemometer were filled by
interpolating from the 10 m records using the power low and the wind shear coefficient
calculated based on overall average wind speeds at 10 and 30 m. Data lost at both heights
for extended period of time was found in Hagereselam, Ashegoda and Mosobo-Harena
masts. Since the overall data recovery rate was above 94% in these sites this will not affect
the overall data quality of the sites. No measure was taken to fill the loss of data for
extended period of time. Negative and undefined wind shear coefficients occurred when
the wind speed at 30 or 40 m height is less than the 10 m record. This was corrected by
replacing the 30 or 40 m wind speed records by interpolating from the 10 m records using
the power law and the wind shear coefficient calculated based on overall average wind
speeds at 10 and 30 or 40 m.
3.2. Results of statistical data analysis3.2.1. Average Wind Speed and Power DensityThe overall average wind speed and average power density of the data during the period
were calculated based on the equations discussed in section 2.3. The results obtained for each
site are shown in Table 3. Included in this table is the maximum wind speed recorded averaged
in the ten minutes measurement interval for each site. The wind power density class at each
height for the respective sites is also shown in the table. The class ranges from class 6 in
Hagereselam site to class 1 at Dera and Mekelle University sites.
WIND ENGINEERING VOLUME 37, NO. 4, 2013 PP 333–346 337
Table 2: Data screening and validationSite Data Available Total number of Gross Number of negative No. measuring data records missing data data and undefined wind
mast (10 minute records recovery shear coefficientsaverage) rate (%)
1 Dera 94,800 13 99.99 11,2522 Hagereselam 70,823 4,470 94.06 23,1813 Mayderhu 66,082 7 99.99 5,0244 Mekelle University 56,125 23 99.96 NA5 Ashegoda 65,592 2,544 96.26 9376 Mosobo-Harena 103,001 2,119 97.98 3,657
NA: not applicable, only one anemometer at 10 m.
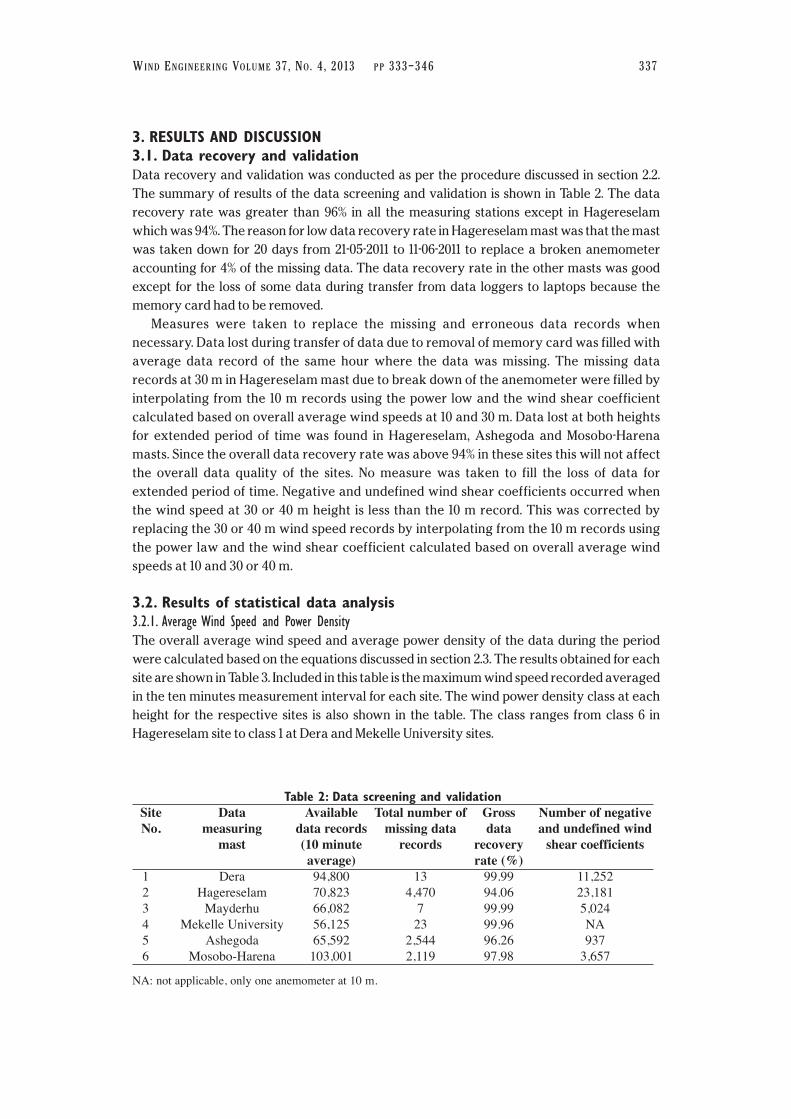
3.2.2. Wind ShearThe wind shear coefficients are calculated based on the overall average wind speeds at 10 and
30 or 40 m using power law as per the equation shown in section 2.3. The wind shear
coefficient for each site is shown in Table 4. The coefficient varies from the lowest value of
0.042 at Hagereselam to the highest value of 0.168 in Dera. The wind shear profile is plotted
based on the calculated coefficient as shown in Figure 3. The profile of Dera site shows
significant difference from the others with low wind speed and high wind shear coefficient.
3.2.3. Turbulence IntensityThe average turbulence intensity for each site was calculated based on the formula discussed
in the methodology section 2.3. The results for each site at the two measurement heights are
shown in Table 5. Moderate turbulence (0.1−0.25) intensities are found at Hagereselam,
338 WIND ENERGY DATA ANALYSIS AND RESOURCE MAPPING OF
GEBA CATCHMENT, NORTH ETHIOPIA
Table 3: Average wind speed and power density at the different wind measuring mastsWind measuring Average wind Maximum wind Average wind Wind power
mast speed (m/s) speed (m/s) power density (m/s) density class10 m 30/40 m 10 m 30/40 m 10 m 30/40 m 10 m 30/40 m
Dera 3.70 4.45 13.59 15.4 64.11 95.16 1 1Hagereselam 6.64 6.96 18.07 18.92 301.32 336.96 6 4
Mayderhu 5.68 6.19 15.78 16.78 180.58 228.86 3 2
MekelleUniversity 3.95 NA 12.12 NA 84.45 NA 1 NA
Ashegoda 6.19 7.21 18 20.3 211.10 318.44 4 3
Mosobo-Harena 5.12 6.41 14.5 18.2 138.55 276.52 2 3
Dera site
Hagereselam site
Myderhu site
Ashegoda site
MosoboH arena site
200
180
160
140
120
Hei
ght a
bove
the
grou
nd le
vel (
m)
100
80
60
40
20
00 1 2 3 4 5
Wind speed in m/s6 7 8 9
Table 4: Wind shear coefficientSite name Wind shear coefficientDera 0.168Hagereselam 0.042Mayderhu 0.077Mekelle University NAAshegoda 0.110Mosobo-Harena 0.163
Figure 3: Wind shear profile for the sites.
WIND ENGINEERING VOLUME 37, NO. 4, 2013 PP 333–346 339
Mayderhu, Ashegoda and Mesebo-Harena sites. High turbulence (> 0.25) intensities are found
at Mekelle University and Dera sites.
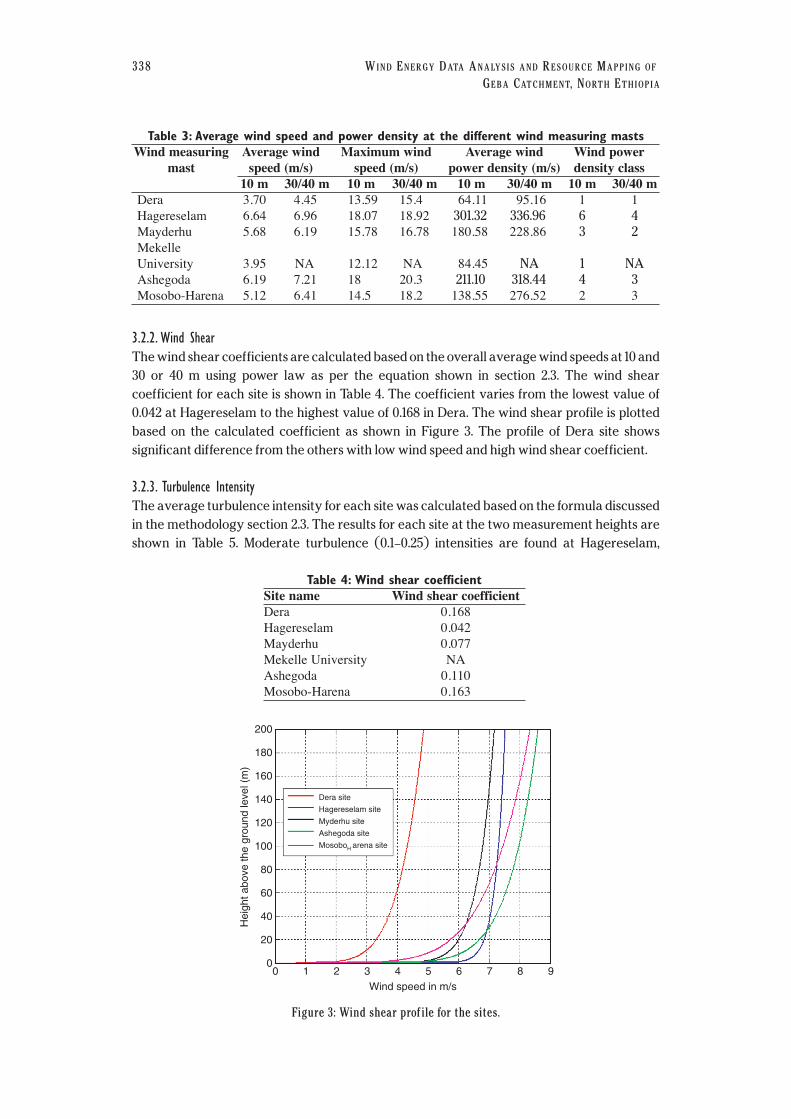
3.3. Results of WAsP modeling and analysis3.3.1. Observed Wind ClimateObserved wind climate is a tabular summary of the frequency of occurrence of wind speed
versus wind direction. The time-series of wind speed and direction data were transformed into
a table which describes a time-independent summary of the conditions found at the measuring
site using the WAsP software. Figure 4 shows the results for each site based on the 10 m raw data.
Table 5: Average Turbulence intensityWind measuring Average turbulence
mast intensity10 m 30 /40 m
Dera 0.466 0.267Hagereselam 0.175 0.137Mayderhu 0.230 0.165Mekelle University 0.54 NAAshegoda 0.128 0.099Mosobo-Harena 0.176 0.136
Dera site Hagereselam site
Mayderhu site Mekelle University site
Ashegoda site Mosobo-Harena site
35.0 25.0
25.0% 0.00 u (m/s) 20.00
f(%/(m/s))
Sector: AllA: 4.4 m/sk: 2.18U: 3.92 m/sP: 64 W/m2
–– Emergent–– Fitted
Sector: AllA: 7.6 m/sk: 2.46U: 6.71 m/sP: 304 W/m2
–– Emergent–– Fitted
f(%/(m/s))
0.020.0%0 u (m/s) 14.00
30.0Sector: AllA: 6.5 m/sk: 2.65U: 5.79 m/sP: 182 W/m2
–– Emergent–– Fitted
f(%/(m/s))
0.040.0%0 u (m/s) 20.00
Sector: AllA: 7.0 m/sk: 2.92U: 6.17 m/sP: 212 W/m2
–– Emergent–– Fitted
f(%/(m/s))
35.0
0.035.0%0 u (m/s) 20.00
Sector: AllA: 5.8 m/sk: 2.35U: 5.13 m/sP: 139 W/m2
–– Emergent–– Fitted
f(%/(m/s))
35.0
0.030.0% 0 u (m/s) 16.00
60.0
Sector: AllA: 4.8 m/sk: 2.10U: 4.13 m/sP: 85 W/m2
–– Emergent–– Fitted
f(%/(m/s))
0.035.0% 0 u (m/s) 14.00
Figure 4: OWC at measuring masts at 10 m a.g.l.
340 WIND ENERGY DATA ANALYSIS AND RESOURCE MAPPING OF
GEBA CATCHMENT, NORTH ETHIOPIA
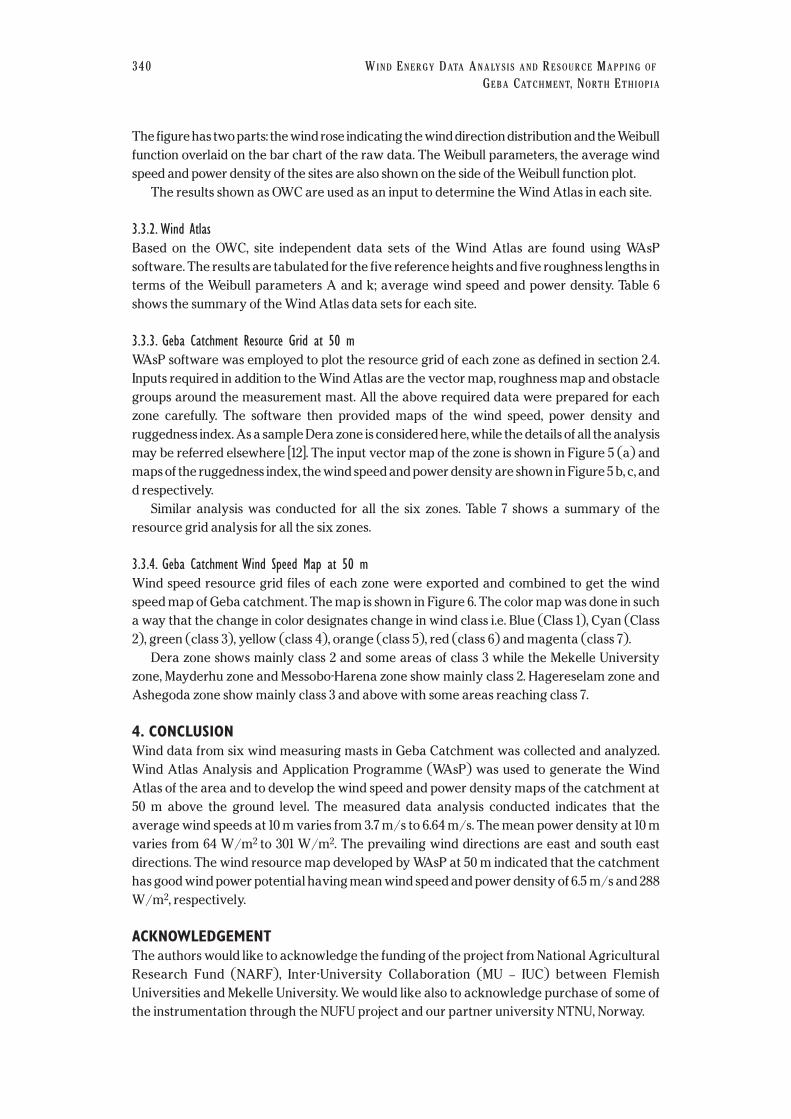
The figure has two parts: the wind rose indicating the wind direction distribution and the Weibull
function overlaid on the bar chart of the raw data. The Weibull parameters, the average wind
speed and power density of the sites are also shown on the side of the Weibull function plot.
The results shown as OWC are used as an input to determine the Wind Atlas in each site.
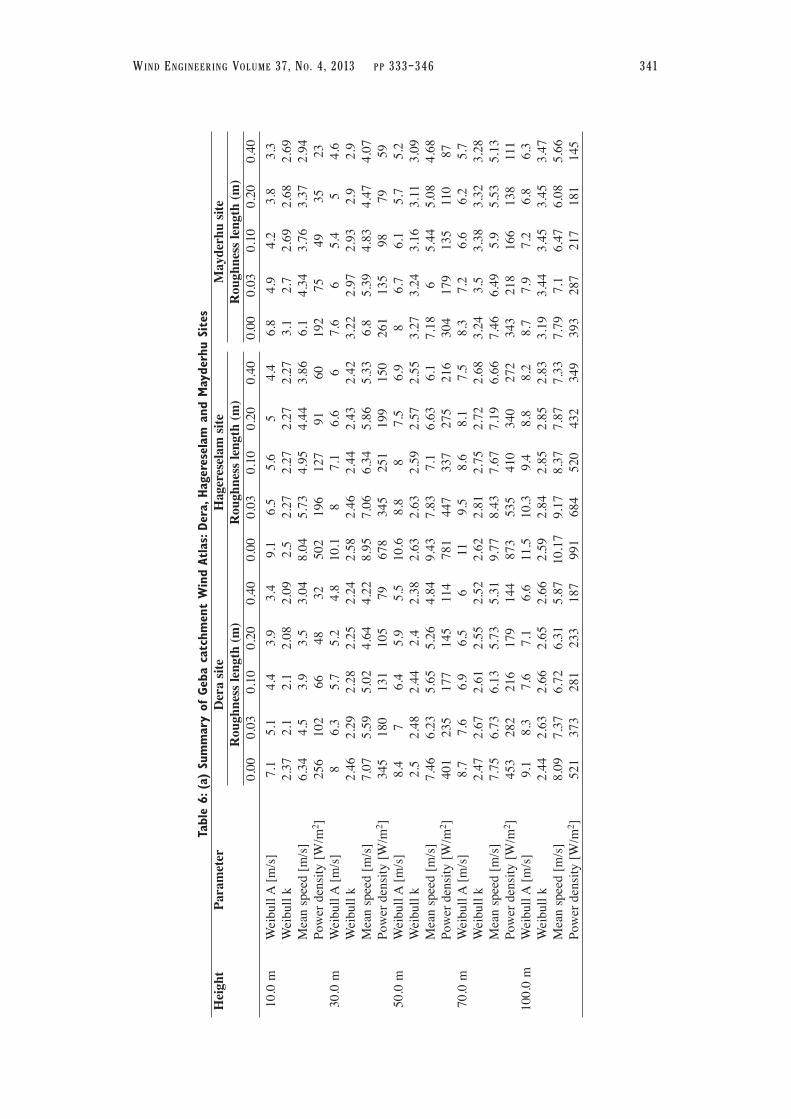
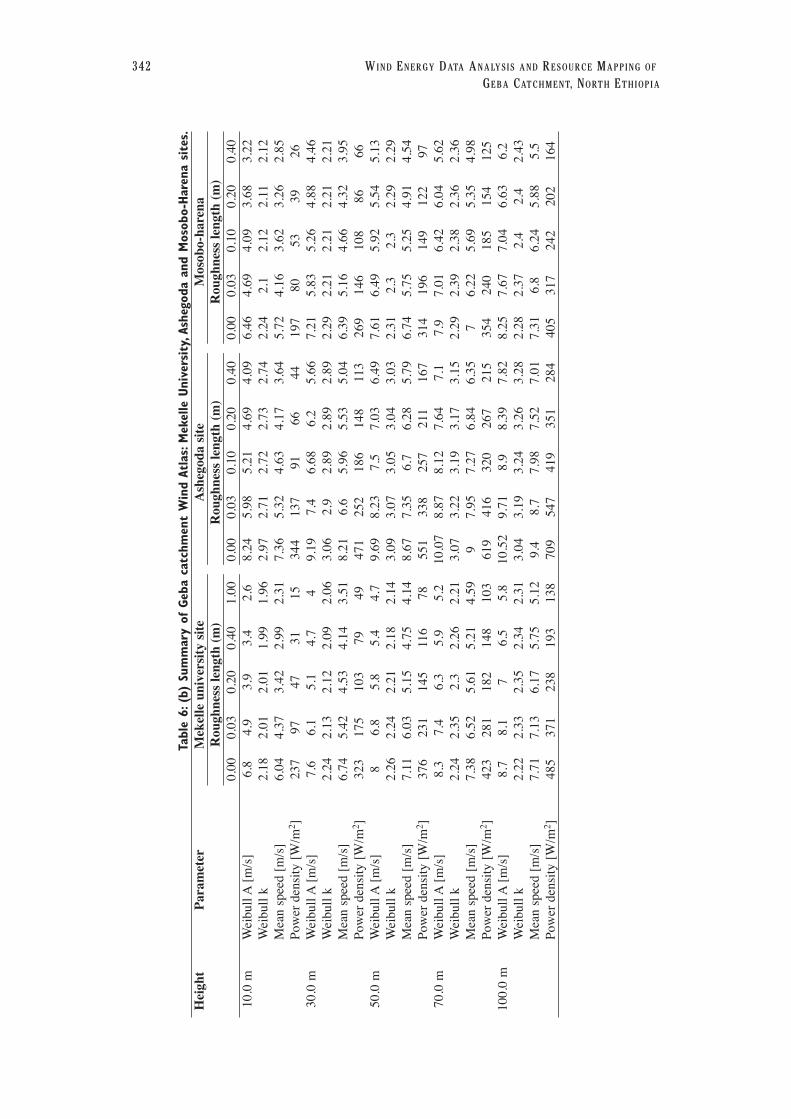
3.3.2. Wind AtlasBased on the OWC, site independent data sets of the Wind Atlas are found using WAsP
software. The results are tabulated for the five reference heights and five roughness lengths in
terms of the Weibull parameters A and k; average wind speed and power density. Table 6
shows the summary of the Wind Atlas data sets for each site.
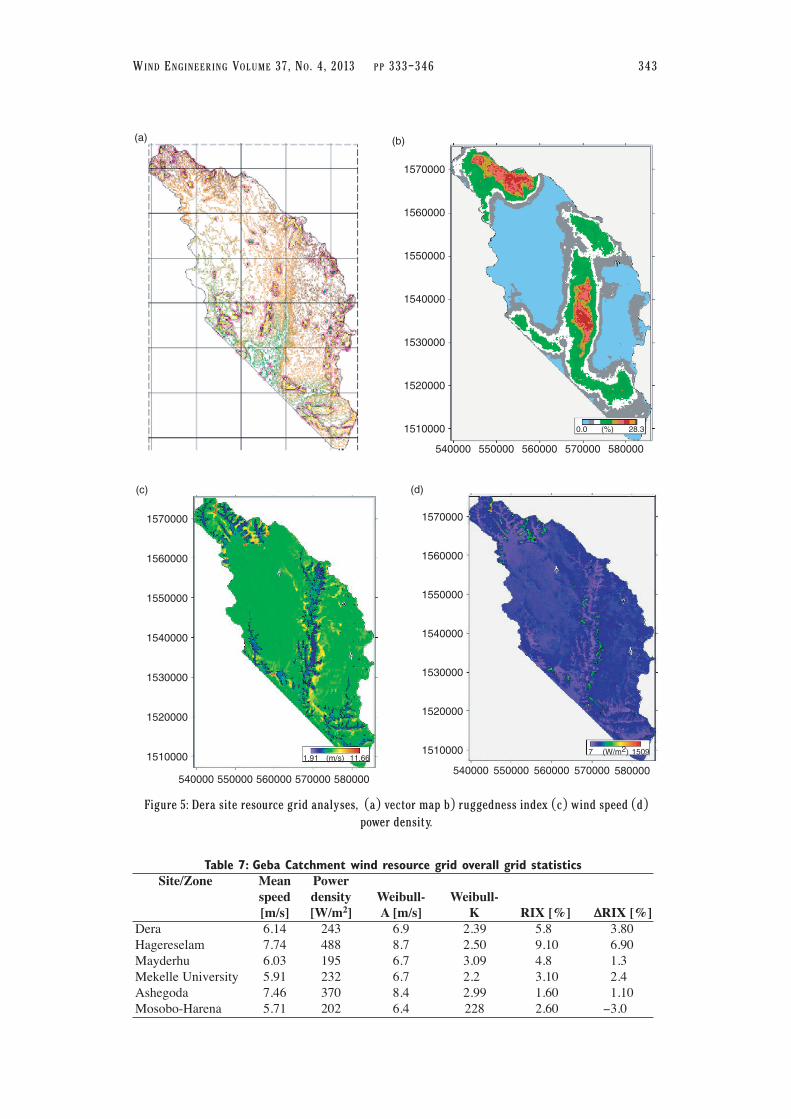
3.3.3. Geba Catchment Resource Grid at 50 mWAsP software was employed to plot the resource grid of each zone as defined in section 2.4.
Inputs required in addition to the Wind Atlas are the vector map, roughness map and obstacle
groups around the measurement mast. All the above required data were prepared for each
zone carefully. The software then provided maps of the wind speed, power density and
ruggedness index. As a sample Dera zone is considered here, while the details of all the analysis
may be referred elsewhere [12]. The input vector map of the zone is shown in Figure 5 (a) and
maps of the ruggedness index, the wind speed and power density are shown in Figure 5 b, c, and
d respectively.
Similar analysis was conducted for all the six zones. Table 7 shows a summary of the
resource grid analysis for all the six zones.
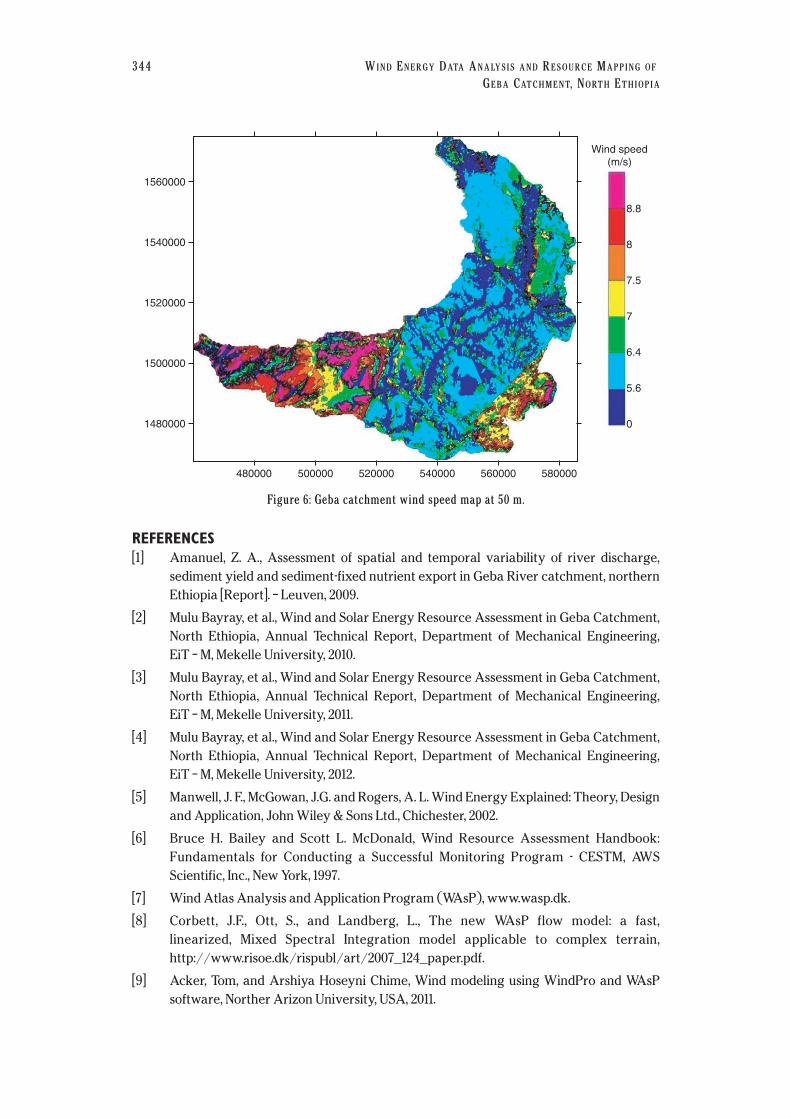
3.3.4. Geba Catchment Wind Speed Map at 50 mWind speed resource grid files of each zone were exported and combined to get the wind
speed map of Geba catchment. The map is shown in Figure 6. The color map was done in such
a way that the change in color designates change in wind class i.e. Blue (Class 1), Cyan (Class
2), green (class 3), yellow (class 4), orange (class 5), red (class 6) and magenta (class 7).
Dera zone shows mainly class 2 and some areas of class 3 while the Mekelle University
zone, Mayderhu zone and Messobo-Harena zone show mainly class 2. Hagereselam zone and
Ashegoda zone show mainly class 3 and above with some areas reaching class 7.
4. CONCLUSIONWind data from six wind measuring masts in Geba Catchment was collected and analyzed.
Wind Atlas Analysis and Application Programme (WAsP) was used to generate the Wind
Atlas of the area and to develop the wind speed and power density maps of the catchment at
50 m above the ground level. The measured data analysis conducted indicates that the
average wind speeds at 10 m varies from 3.7 m/s to 6.64 m/s. The mean power density at 10 m
varies from 64 W/m2 to 301 W/m2. The prevailing wind directions are east and south east
directions. The wind resource map developed by WAsP at 50 m indicated that the catchment
has good wind power potential having mean wind speed and power density of 6.5 m/s and 288
W/m2, respectively.
ACKNOWLEDGEMENTThe authors would like to acknowledge the funding of the project from National Agricultural
Research Fund (NARF), Inter-University Collaboration (MU − IUC) between Flemish
Universities and Mekelle University. We would like also to acknowledge purchase of some of
the instrumentation through the NUFU project and our partner university NTNU, Norway.
WIND ENGINEERING VOLUME 37, NO. 4, 2013 PP 333–346 341
Tabl
e 6:
(a)
Sum
mar
y of
Geb
a ca
tchm
ent
Win
d At
las:
Der
a,Hag
eres
elam
and
May
derh
u Si
tes
Hei
ght
Par
amet
erD
era
site
Hag
eres
elam
sit
eM
ayde
rhu
site
Rou
ghne
ss le
ngth
(m
)R
ough
ness
leng
th (
m)
Rou
ghne
ss le
ngth
(m
)0.
000.
030.
100.
200.
400.
000.
030.
100.
200.
400.
000.
030.
100.
200.
40
10.0
mW
eibu
ll A
[m/s
]7.
15.
14.
43.
93.
49.
16.
55.
65
4.4
6.8
4.9
4.2
3.8
3.3
Wei
bull
k2.
372.
12.
12.
082.
092.
52.
272.
272.
272.
273.
12.
72.
692.
682.
69M
ean
spee
d [m
/s]
6.34
4.5
3.9
3.5
3.04
8.04
5.73
4.95
4.44
3.86
6.1
4.34
3.76
3.37
2.94
Pow
er d
ensi
ty [
W/m
2 ]25
610
266
4832
502
196
127
9160
192
7549
3523
30.0
mW
eibu
ll A
[m/s
]8
6.3
5.7
5.2
4.8
10.1
87.
16.
66
7.6
65.
45
4.6
Wei
bull
k2.
462.
292.
282.
252.
242.
582.
462.
442.
432.
423.
222.
972.
932.
92.
9M
ean
spee
d [m
/s]
7.07
5.59
5.02
4.64
4.22
8.95
7.06
6.34
5.86
5.33
6.8
5.39
4.83
4.47
4.07
Pow
er d
ensi
ty [
W/m
2 ]34
518
013
110
579
678
345
251
199
150
261
135
9879
5950
.0 m
Wei
bull
A[m
/s]
8.4
76.
45.
95.
510
.68.
88
7.5
6.9
86.
76.
15.
75.
2W
eibu
ll k
2.5
2.48
2.44
2.4
2.38
2.63
2.63
2.59
2.57
2.55
3.27
3.24
3.16
3.11
3.09
Mea
n sp
eed
[m/s
]7.
466.
235.
655.
264.
849.
437.
837.
16.
636.
17.
186
5.44
5.08
4.68
Pow
er d
ensi
ty [
W/m
2 ]40
123
517
714
511
478
144
733
727
521
630
417
913
511
087
70.0
mW
eibu
ll A
[m/s
]8.
77.
66.
96.
56
119.
58.
68.
17.
58.
37.
26.
66.
25.
7W
eibu
ll k
2.47
2.67
2.61
2.55
2.52
2.62
2.81
2.75
2.72
2.68
3.24
3.5
3.38
3.32
3.28
Mea
n sp
eed
[m/s
]7.
756.
736.
135.
735.
319.
778.
437.
677.
196.
667.
466.
495.
95.
535.
13Po
wer
den
sity
[W
/m2 ]
453
282
216
179
144
873
535
410
340
272
343
218
166
138
111
100.
0 m
Wei
bull
A[m
/s]
9.1
8.3
7.6
7.1
6.6
11.5
10.3
9.4
8.8
8.2
8.7
7.9
7.2
6.8
6.3
Wei
bull
k2.
442.
632.
662.
652.
662.
592.
842.
852.
852.
833.
193.
443.
453.
453.
47M
ean
spee
d [m
/s]
8.09
7.37
6.72
6.31
5.87
10.1
79.
178.
377.
877.
337.
797.
16.
476.
085.
66Po
wer
den
sity
[W
/m2 ]
521
373
281
233
187
991
684
520
432
349
393
287
217
181
145
342 WIND ENERGY DATA ANALYSIS AND RESOURCE MAPPING OF
GEBA CATCHMENT, NORTH ETHIOPIA
Tabl
e 6:
(b)
Sum
mar
y of
Geb
a ca
tchm
ent
Win
d At
las:
Mek
elle
Uni
vers
ity,
Ashe
goda
and
Mos
obo-
Har
ena
site
s.H
eigh
tP
aram
eter
Mek
elle
uni
vers
ity
site
Ash
egod
a si
teM
osob
o-ha
rena
Rou
ghne
ss le
ngth
(m
)R
ough
ness
leng
th (
m)
Rou
ghne
ss le
ngth
(m
)0.
000.
030.
200.
401.
000.
000.
030.
100.
200.
400.
000.
030.
100.
200.
4010
.0 m
Wei
bull
A[m
/s]
6.8
4.9
3.9
3.4
2.6
8.24
5.98
5.21
4.69
4.09
6.46
4.69
4.09
3.68
3.22
Wei
bull
k2.
182.
012.
011.
991.
962.
972.
712.
722.
732.
742.
242.
12.
122.
112.
12M
ean
spee
d [m
/s]
6.04
4.37
3.42
2.99
2.31
7.36
5.32
4.63
4.17
3.64
5.72
4.16
3.62
3.26
2.85
Pow
er d
ensi
ty [
W/m
2 ]23
797
4731
1534
413
791
6644
197
8053
3926
30.0
mW
eibu
ll A
[m/s
]7.
66.
15.
14.
74
9.19
7.4
6.68
6.2
5.66
7.21
5.83
5.26
4.88
4.46
Wei
bull
k2.
242.
132.
122.
092.
063.
062.
92.
892.
892.
892.
292.
212.
212.
212.
21M
ean
spee
d [m
/s]
6.74
5.42
4.53
4.14
3.51
8.21
6.6
5.96
5.53
5.04
6.39
5.16
4.66
4.32
3.95
Pow
er d
ensi
ty [
W/m
2 ]32
317
510
379
4947
125
218
614
811
326
914
610
886
6650
.0 m
Wei
bull
A[m
/s]
86.
85.
85.
44.
79.
698.
237.
57.
036.
497.
616.
495.
925.
545.
13W
eibu
ll k
2.26
2.24
2.21
2.18
2.14
3.09
3.07
3.05
3.04
3.03
2.31
2.3
2.3
2.29
2.29
Mea
n sp
eed
[m/s
]7.
116.
035.
154.
754.
148.
677.
356.
76.
285.
796.
745.
755.
254.
914.
54Po
wer
den
sity
[W
/m2 ]
376
231
145
116
7855
133
825
721
116
731
419
614
912
297
70.0
mW
eibu
ll A
[m/s
]8.
37.
46.
35.
95.
210
.07
8.87
8.12
7.64
7.1
7.9
7.01
6.42
6.04
5.62
Wei
bull
k2.
242.
352.
32.
262.
213.
073.
223.
193.
173.
152.
292.
392.
382.
362.
36M
ean
spee
d [m
/s]
7.38
6.52
5.61
5.21
4.59
97.
957.
276.
846.
357
6.22
5.69
5.35
4.98
Pow
er d
ensi
ty [
W/m
2 ]42
328
118
214
810
361
941
632
026
721
535
424
018
515
412
510
0.0
mW
eibu
ll A
[m/s
]8.
78.
17
6.5
5.8
10.5
29.
718.
98.
397.
828.
257.
677.
046.
636.
2W
eibu
ll k
2.22
2.33
2.35
2.34
2.31
3.04
3.19
3.24
3.26
3.28
2.28
2.37
2.4
2.4
2.43
Mea
n sp
eed
[m/s
]7.
717.
136.
175.
755.
129.
48.
77.
987.
527.
017.
316.
86.
245.
885.
5Po
wer
den
sity
[W
/m2 ]
485
371
238
193
138
709
547
419
351
284
405
317
242
202
164
WIND ENGINEERING VOLUME 37, NO. 4, 2013 PP 333–346 343
(a) (b)
(c) (d)
1570000
1560000
1550000
1540000
1530000
1520000
1510000
540000
1570000
1560000
1550000
1540000
1530000
1520000
1510000
540000 550000 560000 570000 580000540000
1570000
1560000
1550000
1540000
1530000
1520000
1510000
550000 560000 570000 580000
7 (W/m2) 15091.91 (m/s) 11.66
550000 560000 570000 580000
0.0 (%) 28.3
Figure 5: Dera site resource grid analyses, (a) vector map b) ruggedness index (c) wind speed (d)
power density.
Table 7: Geba Catchment wind resource grid overall grid statistics Site/Zone Mean Power
speed density Weibull- Weibull-[m/s] [W/m2] A [m/s] K RIX [%] ∆RIX [%]
Dera 6.14 243 6.9 2.39 5.8 3.80Hagereselam 7.74 488 8.7 2.50 9.10 6.90Mayderhu 6.03 195 6.7 3.09 4.8 1.3Mekelle University 5.91 232 6.7 2.2 3.10 2.4Ashegoda 7.46 370 8.4 2.99 1.60 1.10Mosobo-Harena 5.71 202 6.4 228 2.60 −3.0
REFERENCES[1] Amanuel, Z. A., Assessment of spatial and temporal variability of river discharge,
sediment yield and sediment-fixed nutrient export in Geba River catchment, northern
Ethiopia [Report]. – Leuven, 2009.
[2] Mulu Bayray, et al., Wind and Solar Energy Resource Assessment in Geba Catchment,
North Ethiopia, Annual Technical Report, Department of Mechanical Engineering,
EiT – M, Mekelle University, 2010.
[3] Mulu Bayray, et al., Wind and Solar Energy Resource Assessment in Geba Catchment,
North Ethiopia, Annual Technical Report, Department of Mechanical Engineering,
EiT – M, Mekelle University, 2011.
[4] Mulu Bayray, et al., Wind and Solar Energy Resource Assessment in Geba Catchment,
North Ethiopia, Annual Technical Report, Department of Mechanical Engineering,
EiT – M, Mekelle University, 2012.
[5] Manwell, J. F., McGowan, J.G. and Rogers, A. L. Wind Energy Explained: Theory, Design
and Application, John Wiley & Sons Ltd., Chichester, 2002.
[6] Bruce H. Bailey and Scott L. McDonald, Wind Resource Assessment Handbook:
Fundamentals for Conducting a Successful Monitoring Program - CESTM, AWS
Scientific, Inc., New York, 1997.
[7] Wind Atlas Analysis and Application Program (WAsP), www.wasp.dk.
[8] Corbett, J.F., Ott, S., and Landberg, L., The new WAsP flow model: a fast,
linearized, Mixed Spectral Integration model applicable to complex terrain,
http://www.risoe.dk/rispubl/art/2007_124_paper.pdf.
[9] Acker, Tom, and Arshiya Hoseyni Chime, Wind modeling using WindPro and WAsP
software, Norther Arizon University, USA, 2011.
344 WIND ENERGY DATA ANALYSIS AND RESOURCE MAPPING OF
GEBA CATCHMENT, NORTH ETHIOPIA
1560000
1540000
1520000
1500000
1480000
480000 500000 520000 540000 560000 580000
8.8
Wind speed(m/s)
8
7.5
7
6.4
5.6
0
Figure 6: Geba catchment wind speed map at 50 m.
[10] Ahmed Shata, A.S., and Hanitsch, R., Electricity generation and wind potential
assessment at Hurghada, Egypt, Renewable Energy, Volume 33, Issue 1, Jan. 2008,
p. 141–148.
[11] Shafiuzzaman Khan Khadem and Muhtasham Hussain, A pre-feasibility study of wind
resources in Kutubdia Island, Bangladesh, Renewable Energy, Volume 31, Issue 14,
November 2006, Pages 2329–2341.
[12] Addisu Dagne, Wind Data Analysis and Resource Mapping of Geba Catchment, M.Sc.
Thesis, Energy Technology Program, Department of Mechanical Engineering, EiT – M,
Mekelle University, 2011.
WIND ENGINEERING VOLUME 37, NO. 4, 2013 PP 333–346 345

Related Documents