Wind and the Electrical Grid Mitigating the Rise in Electricity Rates and Greenhouse Gas Emissions March 14, 2012 THE VOICE OF ONTARIO’S ENGINEERS

Welcome message from author
This document is posted to help you gain knowledge. Please leave a comment to let me know what you think about it! Share it to your friends and learn new things together.
Transcript
Wind and the Electrical GridMitigating the Rise in Electricity Rates and Greenhouse Gas Emissions
March 14, 2012
THE VOICE OF ONTARIO’S ENGINEERS

Wind and the Electrical Grid: Mitigating the Rise in Electricity Rates and Greenhouse Gas Emissions
Page 1 of 43
Executive Summary The Ontario Society of Professional Engineers (OSPE) has undertaken an independent
engineering review of wind generation and its impact on Ontario’s electrical grid because of
growing amounts of hydraulic spill, nuclear shutdowns and periods of negative wholesale
electricity prices during severe surplus base load generation periods. This situation is expected to
get much worse over the next several years as significant amounts of wind, hydraulic and nuclear
generation will be coming into service while expected electrical demand will continue to be
stagnant even with the introduction of electric plug-in vehicles.
This document presents the results of the OSPE review. It also makes a number of
recommendations that OSPE believes will mitigate the rise in electricity rates and the rise in
greenhouse gas emissions due to more frequent shutdowns of nuclear units if no action is taken.
Ontario’s electrical grid is currently suffering from a lack of effective integration of its generation
resources and its electrical demand profile. The electrical grid is a very complex engineered
system and requires the application of power engineering expertise to optimize its technical,
economic and environmental performance.
OSPE believes the Minister of Energy should implement the following recommendations as soon
as practicable:
1. Modify market rules so that all significant generation resources including wind, solar and
nuclear generation will be subject to IESO1 dispatching.
2. Renegotiate existing OPA, OPG and OEFC generation contracts to ensure the capacity
and energy charges combined with electricity market design will align with the economic
and environmental needs of the public.
3. Authorize OPG to contract with entities outside of Ontario for the sale of long-term
dependable (firm) GHG-free electricity.
4. Authorize OPA to adjust the FIT rates and annual maximum capacity additions in each
category to an affordable level that will sustain the new green energy sectors.
5. Authorize OPA to develop a program designed to better align demand to periods when
Ontario supply is available.
6. Assign OPA the overall responsibility of meeting the public’s expectations for electrical
grid reliability, cost and environmental performance without the need for Ministerial
Directives.
In the longer term, the OPA should undertake detailed studies to:
1. Determine if the dispatching capability of existing nuclear plants can be improved
economically.
2. Determine if additional daily and seasonal storage capacity can be added or alternatively
purchased from adjoining grids (eg: Quebec) economically.
3. Determine if surplus electrical energy can be used economically for new applications
such as hydrogen production.
4. Determine if alternate TOU rate structures or other incentives with smart grid capability
can be used economically to encourage demand shifting from peak to off-peak periods.
The complete list of 19 recommendations is included in Section 8 – Recommendations.
1 The abbreviations used in this document are: IESO – Independent Electricity System Operator, OPA – Ontario Power
Authority, OPG – Ontario Power Generation, OEFC – Ontario Electricity Financial Corporation, GHG – Greenhouse
gases, TOU – Time of Use

Wind and the Electrical Grid: Mitigating the Rise in Electricity Rates and Greenhouse Gas Emissions
Page 2 of 43
Table of Contents
Title Page
Executive Summary ........................................................................................................... 1
1. Introduction .................................................................................................................. 3
2. Ontario’s Electrical Grid and Its Load Profile ........................................................... 5
3. Wind Generation Performance Characteristics and Concerns ............................... 11
4. Potential Solutions to Wind Generation Variability ................................................. 15
5 Life Cycle Costing ...................................................................................................... 27
6. Greenhouse Gas Emissions ....................................................................................... 30
7. Conclusions ................................................................................................................ 32
8. Recommendations ...................................................................................................... 36
9. Abbreviations .............................................................................................................. 37
10. References .................................................................................................................. 38
11. Acknowledgements ..................................................................................................... 42
Wind and the Electrical Grid: Mitigating the Rise in Electricity Rates and Greenhouse Gas Emissions
Page 3 of 43
1. Introduction
The Ontario Society for Professional Engineers (OSPE) was founded in 2000 through the
collaborative efforts of Professional Engineers Ontario and the Canadian Society of Professional
Engineers (CSPE). OSPE’s mandate is to advance the professional and economic interests of its
members by advocating with governments, offering member services, and providing
opportunities for ongoing professional development.
OSPE’s interest in advocating for an affordable and balanced energy policy stems from the fact
that some of our members are employed in the energy sector and many of our other members
work for industries that are impacted by the cost of electricity. Electrical energy is fundamentally
tied to our high standard of living in Ontario and the health of our industrial sector.
Consequently OSPE advocates for a reliable, safe, abundant, affordable and environmentally
sustainable electricity supply.
The grid has recently been experiencing increasing amounts and frequency of surplus base load
generation (SBG). Surplus base load generation means that the minimum must-run base load
generation is producing more power than the customer demand. Surplus base load generation
results in one or more of the following: hydraulic spill, nuclear unit shutdowns and negative
wholesale market prices for electricity when we try to export large surpluses on the spot market.
This is a symptom of sub-optimal integration of generating resources with the Ontario electrical
demand profile. If the situation is not corrected soon, the additional generation that is coming
into service over the next 6 years will put additional upward pressure on electricity rates and will
raise greenhouse gas emissions due to nuclear shutdowns.
OSPE recognizes that long term planning for the electrical grid is not an exact science because of
the many uncertainties that must be reconciled to produce a planning scenario that hopefully will
be close to actual conditions in the future. However, the addition of large amounts of intermittent
wind generation into Ontario’s grid posses some severe engineering challenges. Ontario’s grid is
heavily dependent on hydraulic plants that have relatively little daily and seasonal storage and
nuclear plants with relatively little maneuvering capability.
The problem of surplus base load generation and negative wholesale electricity prices has been
growing for about 3 years. After reviewing the Ministry of Energy’s Supply Mix Directive and
2010 Long Term Energy Plan, OSPE felt that an independent engineering review of the wind
generation plans might shed some insight into the root causes of these problems and potential
solutions.
To determine the extent of the problem, OSPE’s Energy Task Force undertook a series of
analyses that resulted in the following submissions:
On March 8, 2011, a report was submitted to the Minister of Energy that identified a
number of requirements unique to Ontario’s electrical grid that should be included in
the specifications for new and refurbished nuclear plants in Ontario (R28).
On March 9, 2011, a submission was forwarded to the Ontario Energy Board that
identified an alternative time-of-use (TOU) rate structure that would more fairly
allocate costs for peak power to those customers that create a peak demand. The
proposed new rate structure would provide a greater incentive for customers who
produce a peak demand to invest in demand leveling technologies. (R29).

Wind and the Electrical Grid: Mitigating the Rise in Electricity Rates and Greenhouse Gas Emissions
Page 4 of 43
On June 13, 2011, a submission was forwarded to the Ontario Power Authority which
outlined a number of concerns that were not adequately addressed in the 2011
Integrated Power System Plan consultation documents (R30).
On December 13, 2011, a submission was forwarded to the Deputy Minister – FIT
Program Review, outlining OSPE’s suggestion to help make the program more
affordable and sustainable (R43).
OSPE also undertook a review of wind generation in the autumn of 2011 and that resulted in a
draft version of this document that was issued for comment to OSPE members and industry
stakeholders on December 19, 2011 (R44). The draft document generated considerable comment.
This final document has been revised based on those comments. OSPE has eliminated the
appendix that was included in the draft version of this document and plans to issue it later in 2012
as an information guide describing how the Ontario electrical grid works.
OSPE’s understanding of the government objectives in restructuring the electrical energy supply
system include:
The reduction of air and water pollution and other negative health impacts,
The reduction of greenhouse gas emissions,
The reduction of energy intensity (conservation and improved energy efficiency),
The reduction of peak electrical demand (flatten the demand profile),
The improvement of sustainability (less dependence on declining resources), and
The increase of green (clean and sustainable) energy jobs in the Ontario economy.
OSPE supports the government’s objectives listed above. However, in pursuing those objectives
it is important that the government does not lose sight of the engineering principles that must be
followed to ensure the electrical grid continues to be reliable, safe and affordable in addition to
being environmentally sustainable. The electrical grid is a very complex engineered system and
requires the application of power engineering expertise to optimize its technical, economic and
environmental performance.
To facilitate the development of green energy supply in Ontario, the government undertook to
remove barriers to the introduction of green energy generation. The government passed the Green
Energy and Green Economy Act in 2009 (R45). The Green Energy Act, Renewable Energy Offer
programs, the Feed-In-Tariff (FIT) Program and Ministerial Directives have established a
significant wind and solar industry in Ontario in a relatively short period of time. The
government is therefore achieving its goal of increasing the green energy jobs in the Ontario
economy.
Unfortunately, the global recession in 2008/09 followed by weak economic growth has
eliminated any room to accommodate the new wind, hydraulic and nuclear base load generation
that is being added by 2018. To make matters more difficult, the present electricity market rules
do not permit wind generation to be dispatched and the new high efficiency, combined cycle gas
turbine (CCGT) plants that were recently built are not as flexible as expected. The CCGT plants
have higher must run power levels, longer must run periods and lower power ramp rates than
expected. This means there is a large amount of surplus base load generation during low demand
periods when wind is blowing.
When severe surplus base load generation occurs it is often impossible to export all of the surplus
energy at positive electricity prices. The electricity market auction process will drive electricity
prices lower until the export takes place or a base load plant is forced to shut down.
Wind and the Electrical Grid: Mitigating the Rise in Electricity Rates and Greenhouse Gas Emissions
Page 5 of 43
The IESO is undertaking actions to permit it to dispatch wind, solar and nuclear by the end of
2013 and to set minimum floor prices on energy bids to ensure the market produces efficient
outcomes. Wind dispatching has also become necessary elsewhere in North American where
wind is a significant portion of total generation and the storage facilities are limited (e.g.: New
York, Texas and California).
A further complication is that when a CANDU nuclear unit is shutdown during one evening’s
surplus, it cannot return to service for 2 to 3 days. That means natural gas-fired generation will
need to replace the missing production for the subsequent 2 or 3 days at about 5 times the fuel
cost and about 398 kg of carbon dioxide emissions per MWh of production (R27). Consequently
both costs and emissions will go up significantly when surplus base load generation occurs and
forces one or more nuclear units to shut down.
In 2011 with only about 1,400 MW of wind generation, about 15 million dollars (R3) were spent
exporting surplus power at negative prices because of a lack of both technical and contractual
capability to manage surplus base load generation. The frequency of nuclear shutdowns will
increase dramatically as an additional 400% of wind generation and two refurbished Bruce A
nuclear units are added by 2018. The IESO’s preliminary estimate of the impact of forced
nuclear shutdowns in 2014 alone will be over 180 M$ in extra natural gas fuel costs to consumers
and over 1.6 million tons of carbon dioxide emissions (R40) if wind and solar generation are not
dispatched down. In the September 2011 IESO “18 Month Outlook” for the electrical grid (R23),
the IESO indicated it continues to be concerned about the state of integration of renewable energy
into the grid.
The data presented and used in the analysis for this document has been obtained from publicly
available sources such as the Independent Electricity System Operator (IESO), Ontario Power
Authority (OPA), the Ontario Ministry of Energy (MOE) and energy industry associations. The
specific references we used are listed at the end of this document in Section 10. The IESO data
for public use is provided in hourly interval format.
This document does not expand on the findings on the state of the electrical grid and its related
governance that was reported by the Ontario Auditor General (R35) and the Commission on the
Reform of Ontario's Public Services (R47).
2. Ontario’s Electrical Grid and Its Load Profile
Before we get into details about wind generation and its impact on the grid we need to define a
few terms and get a basic understanding of how the electrical grid works.
In this document we will use the term “grid” to mean the Ontario electrical generation,
transmission, inter-grid connections, distribution, customer connections and related control
facilities. The term “power” will be used to represent the instantaneous amount of electricity
flowing in the wires and is typically expressed as thousands (kilo) of watts or simply kilowatts
(kW). The term “energy” will be used to represent a measure of the ability of electricity to do
useful work and the units are typically expressed as thousands of watts multiplied by time in
hours or simply as kilowatt hours (kWh). When the quantities are very large we typically will
replace thousands or kilo (k) with larger units of million or mega (M), billions or giga (G) and

Wind and the Electrical Grid: Mitigating the Rise in Electricity Rates and Greenhouse Gas Emissions
Page 6 of 43
trillions or tera (T). Therefore, the symbols used in this document for power will be kW, MW,
GW and TW and for energy will be kWh, MWh, GWh and TWh.
The terms load ramping, load following, load cycling, load control and load maneuvering have
slightly different meanings in the industry depending on how and why the load change is
occurring. For the purposes of this document we will simply refer to a change of power output as
a load maneuver and we will not get into the specific details of each type of load change. The
term “dispatch” is used in the context of the IESO sending out commands for generators to move
their output to a specified MW level at a specified time or at a specified ramp rate.
Generating station and unit sizes vary according to the technology used. The Sir Adam Beck I
and II stations at Niagara Falls have 26 units and can produce a maximum power output of about
2,000 MW but only if there is sufficient water flow. The Darlington nuclear station near Oshawa
has 4 units that can produce about 3,500 MW continuously. The Nanticoke coal-fired station near
Port Dover has 6 units that can produce about 3,000 MW continuously. The Sithe Goreway gas-
fired combined cycle station near Brampton has 4 units that can produce about 900 MW
continuously. Large wind turbines are typically 1 to 3 MW each and are often clustered into large
wind farms of 50 to 200 MW each in order to reduce the installed capital cost per MW. Their
actual output varies with the wind speed so it is considered intermittent power.
If a facility could produce power at its maximum nameplate rating 24 hours a day for 365 days a
year it would have an annual capacity factor of 100%. However, maintenance, dispatching, and
lack of water or wind can reduce a facility’s capacity factor. In the case of hydraulic, wind and
solar generation, their capacity factors are relatively low because their energy source is affected
by weather.
Ontario has interconnections to neighbouring electrical grids in Manitoba, Minnesota, Michigan,
New York and Quebec. The practical limit of our export/import capability to those neighbouring
grids is about 4,800 MW (R9)(R22) provided those neighbouring grids are all willing to import or
export at the same time. Since this does not always happen, the actual export or import capability
is situation dependent and varies day-to-day.
Ontario’s grid is administered by the Independent Electricity System Operator (IESO). The IESO
operates a wholesale market that determines which generating plants run and at what power level
through an auction process. The generators offer prices for their output and the IESO selects
sufficient sources to meet the demand at the lowest price. The price where supply and demand
are in balance is the market clearing price. That price is paid to all generators that are providing
power. The price is set every 5 minutes. A more detailed description of how the electricity
market works is available at http://ieso.ca/imoweb/siteShared/wholesale_price.asp?sid=md
Facilities to store electricity in large quantities are very expensive. Ontario has a relatively small
amount of storage capacity compared to the size of its generating fleet. As a result the electrical
grid is operated in a manner that balances the supply and demand of electricity on a moment-to-
moment basis. When customer demand is lower than the minimum output of our base load
generators (typically nuclear, hydraulic, wind and some must-run gas-fired generation), the
system experiences what is called surplus base load generation or SBG.
Since supply and demand must be balanced at all times, the auction process forces those
generators who want to remain on-line and not be dispatched off to bid lower prices into the
electricity market. If neighbouring grids do not take the surplus base load generation then the
price continues to fall and can go negative as generators compete to stay on-line to avoid the high
Wind and the Electrical Grid: Mitigating the Rise in Electricity Rates and Greenhouse Gas Emissions
Page 7 of 43
cost of a shutdown. Eventually the low or negative prices in Ontario attract demand from our
neighbouring grids. Even so, our neighbours have a limited ability to absorb our surplus energy.
If the surplus base load generation is very large then a generating unit or perhaps several will
need to be shut down to avoid creating an unstable supply/demand situation.
North American utilities all subscribe to the philosophy that consumer demand should not be
interrupted unless there is a crisis on the electrical grid. Consequently, most day-to-day control
efforts are directed at managing supply to match the demands of consumers at all times.
Another important consideration in grid operation is the current policy in Ontario to allow wind
turbines to generate all their output without dispatching restrictions. They have priority access to
the grid for the purposes of generating power (R36). This has been done for two reasons. Firstly,
if you don’t capture the energy when nature provides it, then you lose it. Secondly, wind turbines
have a high installed capital cost of typically $2,000 to $2,800 per kW and they have low capacity
factors of about 29% average for large wind farms across Ontario in 2010/11 (R3). If you
dispatch wind turbines their capacity factor would fall and the cost of electricity on a kWh basis
would rise.
Customer Demand
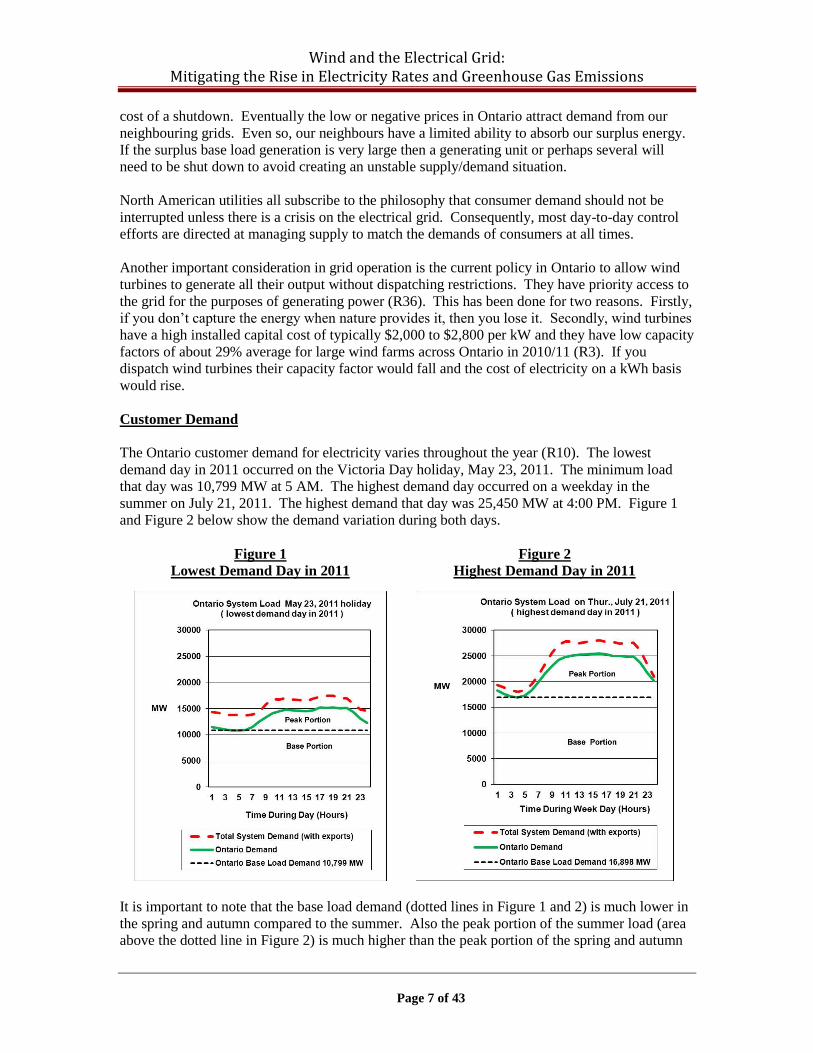
The Ontario customer demand for electricity varies throughout the year (R10). The lowest
demand day in 2011 occurred on the Victoria Day holiday, May 23, 2011. The minimum load
that day was 10,799 MW at 5 AM. The highest demand day occurred on a weekday in the
summer on July 21, 2011. The highest demand that day was 25,450 MW at 4:00 PM. Figure 1
and Figure 2 below show the demand variation during both days.
Figure 1
Lowest Demand Day in 2011
Figure 2
Highest Demand Day in 2011
It is important to note that the base load demand (dotted lines in Figure 1 and 2) is much lower in
the spring and autumn compared to the summer. Also the peak portion of the summer load (area
above the dotted line in Figure 2) is much higher than the peak portion of the spring and autumn
Wind and the Electrical Grid: Mitigating the Rise in Electricity Rates and Greenhouse Gas Emissions
Page 8 of 43
load. The winter demand is between the two cases in Figure 1 and 2. Ontario has been a summer
peaking grid since 2000 mainly due to the growth in air conditioning.
To optimize overall energy costs, a combination of base load and peak load generating plants are
installed on most electrical grids. Seasonal variations in demand can to some extent be managed
by careful planning of generating station annual maintenance outages. This means it is economic
to install more base load generating plants than the yearly minimum daily base load demand
(10,799 MW in 2011). However, if too much base load generation is installed, there will be
frequent periods of surplus base load generation. The surplus base load generation can be
exported or eliminated by spilling water at the hydraulic units. It can also be eliminated if we
dispatch wind generation or if we shut down some of the nuclear units.
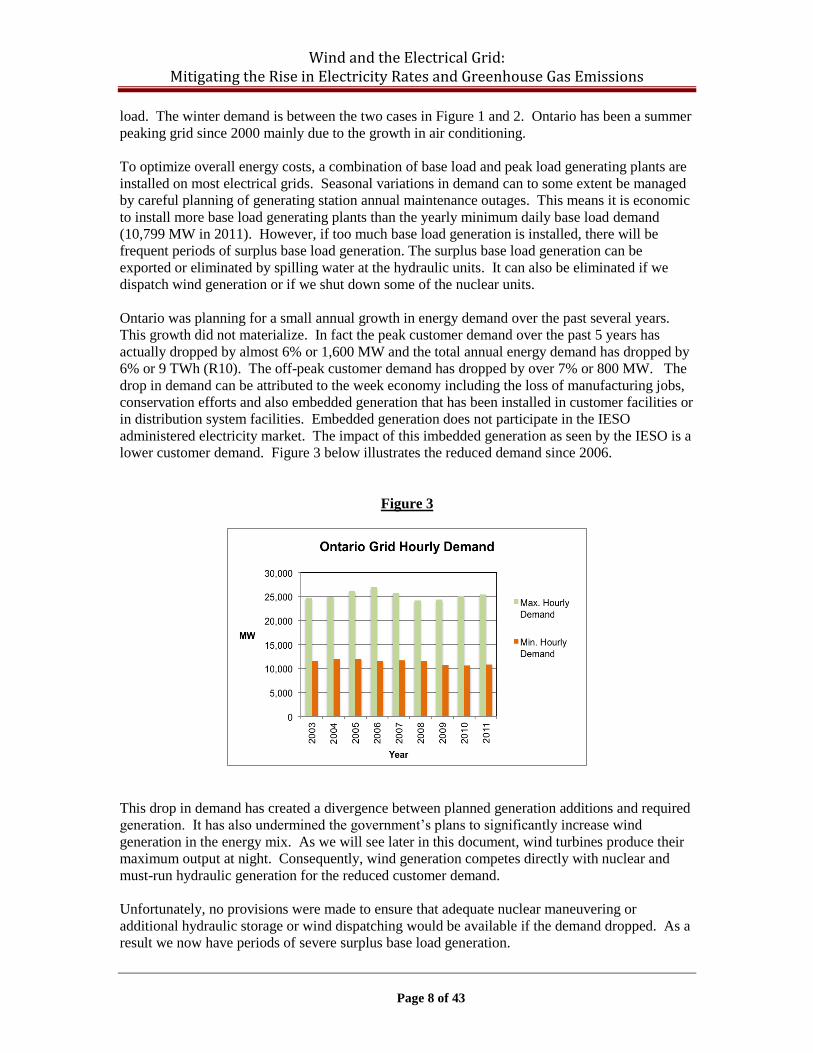
Ontario was planning for a small annual growth in energy demand over the past several years.
This growth did not materialize. In fact the peak customer demand over the past 5 years has
actually dropped by almost 6% or 1,600 MW and the total annual energy demand has dropped by
6% or 9 TWh (R10). The off-peak customer demand has dropped by over 7% or 800 MW. The
drop in demand can be attributed to the week economy including the loss of manufacturing jobs,
conservation efforts and also embedded generation that has been installed in customer facilities or
in distribution system facilities. Embedded generation does not participate in the IESO
administered electricity market. The impact of this imbedded generation as seen by the IESO is a
lower customer demand. Figure 3 below illustrates the reduced demand since 2006.
Figure 3
This drop in demand has created a divergence between planned generation additions and required
generation. It has also undermined the government’s plans to significantly increase wind
generation in the energy mix. As we will see later in this document, wind turbines produce their
maximum output at night. Consequently, wind generation competes directly with nuclear and
must-run hydraulic generation for the reduced customer demand.
Unfortunately, no provisions were made to ensure that adequate nuclear maneuvering or
additional hydraulic storage or wind dispatching would be available if the demand dropped. As a
result we now have periods of severe surplus base load generation.
Wind and the Electrical Grid: Mitigating the Rise in Electricity Rates and Greenhouse Gas Emissions
Page 9 of 43
Available Supply
Ontario’s generating resources fall into two categories: base load and peak load generators. Base
load generators are best suited to continuous and steady power output. These typically have
higher capital cost, lower fuelling cost and limited maneuvering capability. Some examples are
run-of-the-river hydraulic and nuclear generating plants. Wind generation is also considered a
base load generation resource because a significant amount of its energy is produced at night
during the base load period.
Peak load generators are best suited to variable power output. These typically have lower capital
costs, higher fuelling costs and good maneuvering capability. Some examples are coal-fired and
gas-fired generating plants. Solar generation is considered a peak load generation resource
because all of its energy is produced during the peak demand period.
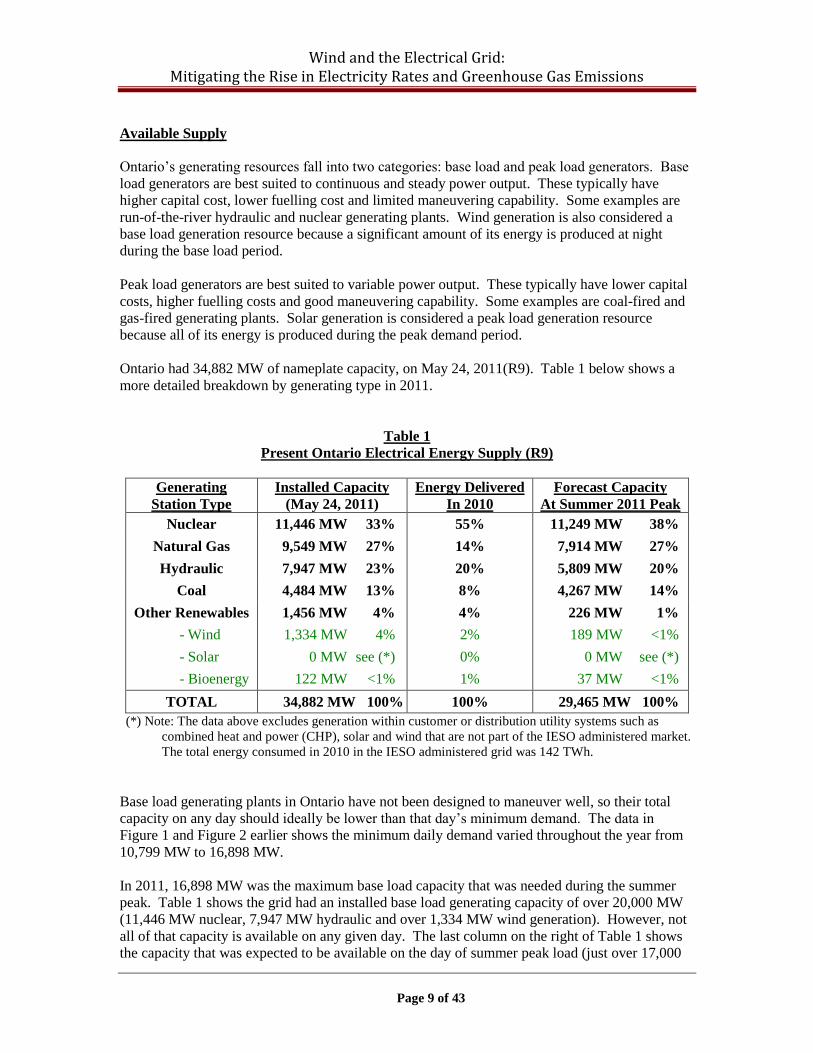
Ontario had 34,882 MW of nameplate capacity, on May 24, 2011(R9). Table 1 below shows a
more detailed breakdown by generating type in 2011.
Table 1
Present Ontario Electrical Energy Supply (R9)
Generating
Station Type
Installed Capacity
(May 24, 2011)
Energy Delivered
In 2010
Forecast Capacity
At Summer 2011 Peak
Nuclear 11,446 MW 33% 55% 11,249 MW 38%
Natural Gas 9,549 MW 27% 14% 7,914 MW 27%
Hydraulic 7,947 MW 23% 20% 5,809 MW 20%
Coal 4,484 MW 13% 8% 4,267 MW 14%
Other Renewables
- Wind
- Solar
- Bioenergy
1,456 MW 4%
1,334 MW 4%
0 MW see (*)
122 MW <1%
4%
2%
0%
1%
226 MW 1%
189 MW <1%
0 MW see (*)
37 MW <1%
TOTAL 34,882 MW 100% 100% 29,465 MW 100%
(*) Note: The data above excludes generation within customer or distribution utility systems such as
combined heat and power (CHP), solar and wind that are not part of the IESO administered market.
The total energy consumed in 2010 in the IESO administered grid was 142 TWh.
Base load generating plants in Ontario have not been designed to maneuver well, so their total
capacity on any day should ideally be lower than that day’s minimum demand. The data in
Figure 1 and Figure 2 earlier shows the minimum daily demand varied throughout the year from
10,799 MW to 16,898 MW.
In 2011, 16,898 MW was the maximum base load capacity that was needed during the summer
peak. Table 1 shows the grid had an installed base load generating capacity of over 20,000 MW
(11,446 MW nuclear, 7,947 MW hydraulic and over 1,334 MW wind generation). However, not
all of that capacity is available on any given day. The last column on the right of Table 1 shows
the capacity that was expected to be available on the day of summer peak load (just over 17,000

Wind and the Electrical Grid: Mitigating the Rise in Electricity Rates and Greenhouse Gas Emissions
Page 10 of 43
MW of hydraulic, nuclear and wind base load capacity). Surplus energy can be exported to
neighbouring grids if they have a need.
The Ontario Long Term Energy Plan (R5) indicates the planned capacity of the electrical grid by
2018 and 2030 will be 38,580 MW and 41,900 MW respectively. However, a significant
percentage of that capacity (28% and 27% respectively) will be intermittent renewable generation
that cannot be depended on to be available on the annual peak demand day in the summer. The
2018 and 2030 capacities are shown in Table 2 below.
Table 2
Future Ontario Electrical Energy Supply
Energy Source Installed Capacity
Medium Growth Plan
(Dec 31, 2018)
Installed Capacity
Medium Growth Plan
(Dec 31, 2030)
Nuclear 8,507 MW 22% 12,000 MW 29%
Natural Gas 10,373 MW 27% 10,100 MW 24%
Hydraulic 9,000 MW 23% 9,000 MW 20%
Coal 0 MW 0% 0 MW 0%
Other Renewables
- Wind
- Solar
- Bioenergy
10,700 MW 28%
7,500 MW (see note 2)
2,400 MW (see note 2)
800 MW (see note 2)
10,700 MW 27%
7,500 MW (see note 2)
2,400 MW (see note 2)
800 MW (see note 2)
TOTAL 38,580 MW 100% 41,900 MW 100%
Note 1: The data above excludes generation within customer or distribution utility
systems such as CHP, solar and wind that are not part of the IESO administered
market.
Note 2: The final breakdown of the 10,700 MW of renewables was not specified in the
Long Term Energy Plan. The data above has been estimated based on using the
same ratio of renewables for the 10,700 MW as that identified in the list of the
existing, committed and directed projects in the IPSP Planning and Consultation
Overview, Table 4, page 3-14 (R4).
Note 3: The drop in nuclear capacity in 2018 is due to Pickering retirement and
refurbishment programs at the other nuclear plants.
Note 4: Actual demand will depend on projected growth. The 2010/2018/2030 energy
demand is 142/140/147 TWh for the low growth scenario, 142/148/165 TWh for
the medium growth OPA planning scenario and 142/155/198 for the high
growth scenario.
As more wind and hydraulic generation are added and more nuclear plants are refurbished or built
the potential surplus base load generation will get worse unless there is a significant growth in our
Ontario demand or we export the surplus.
System Utilization
Another growing concern is the rising ratio of the annual peak load to the annual minimum load.
A flatter customer demand profile across each day (daily) and across the whole year (seasonal) is

Wind and the Electrical Grid: Mitigating the Rise in Electricity Rates and Greenhouse Gas Emissions
Page 11 of 43
preferred. As the ratio of peak demand to base demand increases, the system becomes less
efficient at utilizing generating plants and the average cost of electricity per unit energy (kWh)
rises. Figure 1 and Figure 2 earlier show that Ontario has had some success in flattening the daily
load profile from about 11 am to about 9 pm. Unfortunately, the increased use of air conditioning
in the summer has resulted in a significant difference between day and night demand and between
summer and spring demand. A flatter demand profile also reduces the need for peak load
generating plants and transmission and distribution capacity that would operate with a low
capacity factor and as a result, high unit energy cost.
This document does not examine solar generation, however, our analysis of wind generation has
brought to light another potential problem. The Ontario Long Term Energy Plan projects about
2,400 MW of solar generation on the grid by 2018. According to the OPA website, there were
about 8,300 MW of Solar PV applications submitted by November 14, 2011 (R54). There are
over 4,000 MW of solar FIT applications in the queue that have not been rejected. Another 1,300
MW have already been awarded contacts. The past rejection rate for applications was less than
50% so if that rejection rate continues we could potentially see close to 3,300 MW or more of
solar installations. That is sufficient capacity to create periods of surplus peak load generation
(SPG) during low demand sunny days. Surplus peak load generation would occur when the total
capacity of operating base load generation including must-run gas-fired generation plus solar
generation exceeds the peak demand. Although surplus peak load generation can be exported
more easily than surplus base load generation, it is unlikely we will be able to obtain 44 to 80
cents/kWh - the price that Ontario must pay for that solar power.
3. Wind Generation Performance Characteristics and Concerns
Wind generation is easy to construct and distribute geographically and has very low operating
costs. Wind generation is considered environmentally friendly but recent opposition from
residents close to wind farms regarding health and safety concerns suggests additional study may
be required. Wind turbines increase the noise level above background when they are rotating even
at low power (R52). There is considerable controversy in Ontario on whether such noise levels,
frequency distribution and tonal characteristics are sufficiently disturbing to disrupt nearby
residents’ lives and cause adverse health effects. The controversy may linger for years if a more
direct study is not conducted. Beginning in early 2014, wind generation will be dispatched by the
IESO. IESO can dispatch all wind turbines equally or shutdown specific wind farms completely
for a period of time. This may provide opportunities to do some controlled studies on the effect
of turbine noise in the more populated areas.
Apart from the health and safety concerns of nearby residents, wind generation is intermittent, it
has a low capacity factor and it delivers its energy when nature provides it rather than when
consumers want it. These weaknesses make wind generation one of the most technically
challenging and costly energy sources to integrate into the electrical grid.
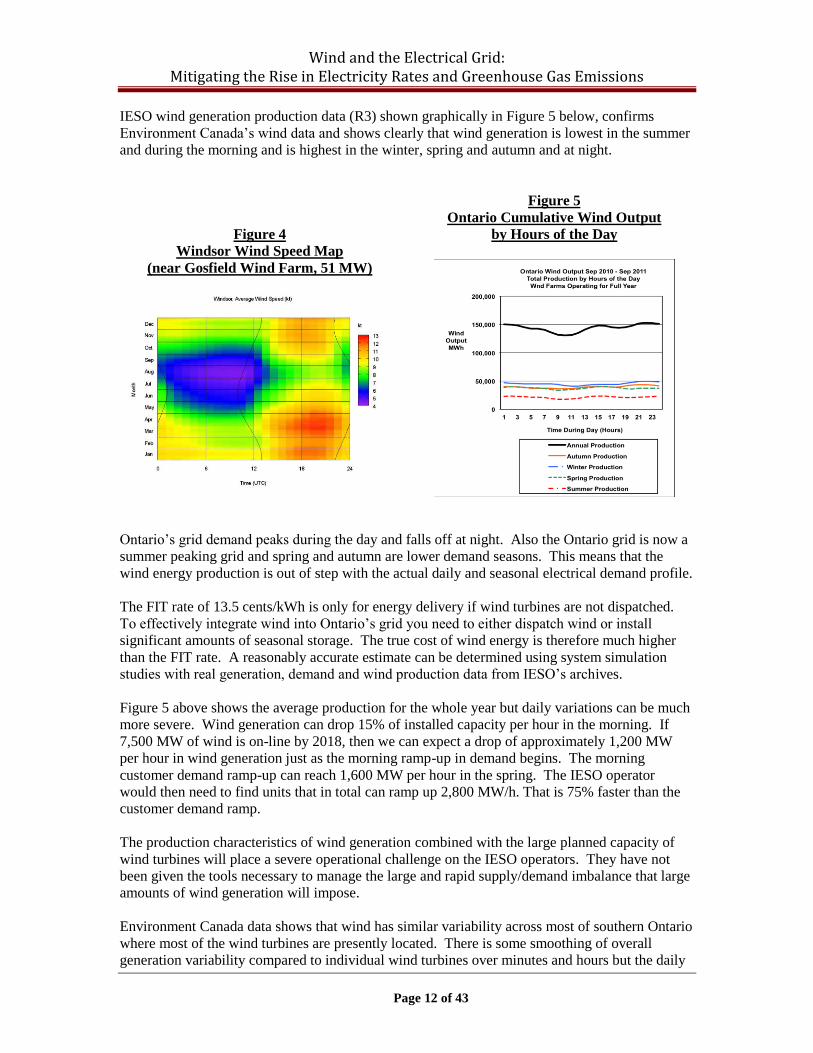
Environment Canada data (R12) shows that in Southwestern Ontario, summer is the lowest wind
production season and spring, autumn and winter the highest. Also wind blows more strongly at
night and less during the morning hours. Figure 4 on the next page shows this data graphically.
The purple colour represents the lowest wind speed and the red colour represents the highest wind
speeds.
Wind and the Electrical Grid: Mitigating the Rise in Electricity Rates and Greenhouse Gas Emissions
Page 12 of 43
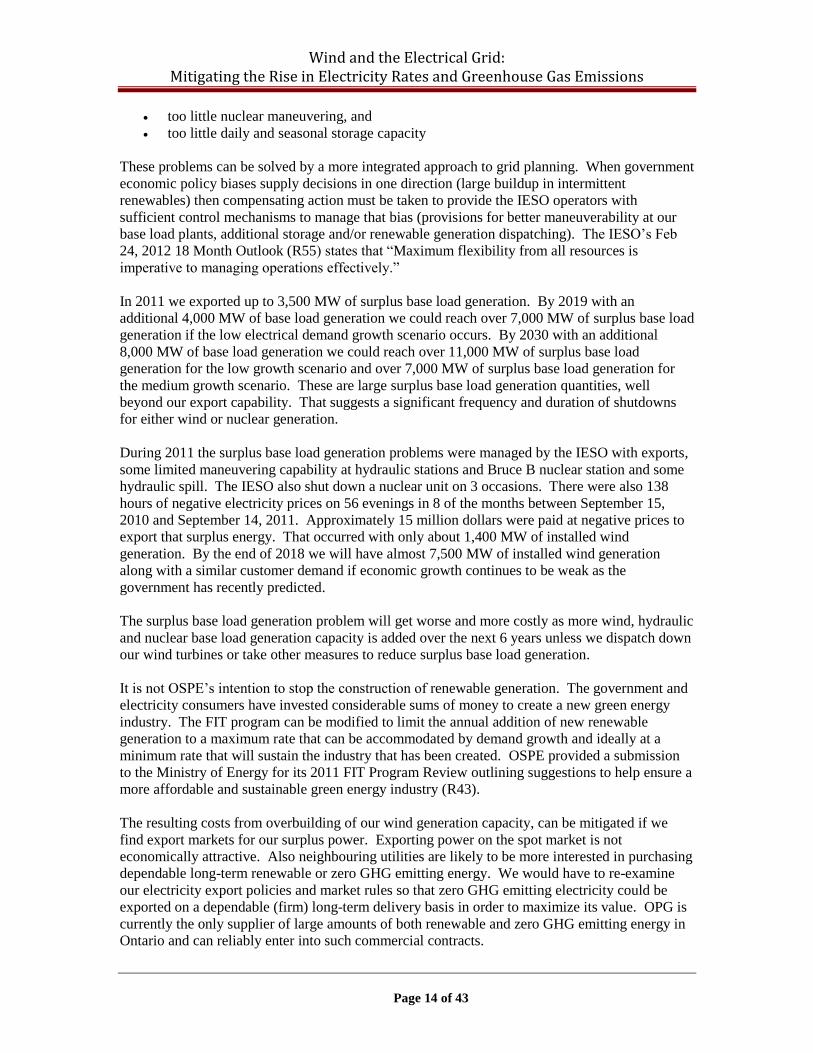
IESO wind generation production data (R3) shown graphically in Figure 5 below, confirms
Environment Canada’s wind data and shows clearly that wind generation is lowest in the summer
and during the morning and is highest in the winter, spring and autumn and at night.
Figure 4
Windsor Wind Speed Map
(near Gosfield Wind Farm, 51 MW)
Figure 5
Ontario Cumulative Wind Output
by Hours of the Day
Ontario’s grid demand peaks during the day and falls off at night. Also the Ontario grid is now a
summer peaking grid and spring and autumn are lower demand seasons. This means that the
wind energy production is out of step with the actual daily and seasonal electrical demand profile.
The FIT rate of 13.5 cents/kWh is only for energy delivery if wind turbines are not dispatched.
To effectively integrate wind into Ontario’s grid you need to either dispatch wind or install
significant amounts of seasonal storage. The true cost of wind energy is therefore much higher
than the FIT rate. A reasonably accurate estimate can be determined using system simulation
studies with real generation, demand and wind production data from IESO’s archives.
Figure 5 above shows the average production for the whole year but daily variations can be much
more severe. Wind generation can drop 15% of installed capacity per hour in the morning. If
7,500 MW of wind is on-line by 2018, then we can expect a drop of approximately 1,200 MW
per hour in wind generation just as the morning ramp-up in demand begins. The morning
customer demand ramp-up can reach 1,600 MW per hour in the spring. The IESO operator
would then need to find units that in total can ramp up 2,800 MW/h. That is 75% faster than the
customer demand ramp.
The production characteristics of wind generation combined with the large planned capacity of
wind turbines will place a severe operational challenge on the IESO operators. They have not
been given the tools necessary to manage the large and rapid supply/demand imbalance that large
amounts of wind generation will impose.
Environment Canada data shows that wind has similar variability across most of southern Ontario
where most of the wind turbines are presently located. There is some smoothing of overall
generation variability compared to individual wind turbines over minutes and hours but the daily

Wind and the Electrical Grid: Mitigating the Rise in Electricity Rates and Greenhouse Gas Emissions
Page 13 of 43
and seasonal variation must be managed by a backup source of energy. Presently, Ontario is
using gas-fired generation to provide that backup with a lesser contribution from some hydraulic
and nuclear generation that have some limited maneuvering capability. Hydraulic spill is also
being used. Unfortunately, spilling water means the energy is wasted. Spilling water is the
equivalent to turning off (dispatching) the wind turbines.
Because of wind’s variability, the remaining generating stations see a residual demand that is
much more variable. Figure 6 below shows the wind generation capacity in 2011 and the planned
wind generation capacity in 2019. The grid demand is also shown assuming no overall growth in
electrical demand. The difference between the red wind generation and green demand lines is the
residual demand that needs to be supplied by other generation. That residual demand in 2019 is
plotted in Figure 7. Figure 7 shows that the residual demand available for hydraulic and nuclear
plants has dropped from 10,799 MW to 5,137 MW. We can export some but not all of the
surplus generation. We will likely have to shutdown several nuclear units on a frequent basis in
the future if we don’t dispatch wind generation.
Figure 6
Demand and Wind Generation in 2019
Lowest Demand Day
Figure 7
Residual Demand After Wind Gets Priority
on the Lowest Demand Day
The following day the lost nuclear capacity would need to be replaced by gas-fired generation at
considerable extra fuel cost and GHG emissions. In addition, the peak portion of the residual
load demand will have risen from about 5,900 MW to over 6,500 MW. That extra peak demand
will need to be supplied by peak generation resources. Therefore, not requiring wind generation
to be dispatched means electricity will be produced with more natural gas generation at higher
fuel costs and higher GHG emissions.
This unexpected result occurs because Ontario’s electrical grid suffers from supply/demand
imbalances created by:
too little customer demand at night and on weekends in combination with
too much intermittent wind generation out of step with demand,
Wind and the Electrical Grid: Mitigating the Rise in Electricity Rates and Greenhouse Gas Emissions
Page 14 of 43
too little nuclear maneuvering, and
too little daily and seasonal storage capacity
These problems can be solved by a more integrated approach to grid planning. When government
economic policy biases supply decisions in one direction (large buildup in intermittent
renewables) then compensating action must be taken to provide the IESO operators with
sufficient control mechanisms to manage that bias (provisions for better maneuverability at our
base load plants, additional storage and/or renewable generation dispatching). The IESO’s Feb
24, 2012 18 Month Outlook (R55) states that “Maximum flexibility from all resources is
imperative to managing operations effectively.”
In 2011 we exported up to 3,500 MW of surplus base load generation. By 2019 with an
additional 4,000 MW of base load generation we could reach over 7,000 MW of surplus base load
generation if the low electrical demand growth scenario occurs. By 2030 with an additional
8,000 MW of base load generation we could reach over 11,000 MW of surplus base load
generation for the low growth scenario and over 7,000 MW of surplus base load generation for
the medium growth scenario. These are large surplus base load generation quantities, well
beyond our export capability. That suggests a significant frequency and duration of shutdowns
for either wind or nuclear generation.
During 2011 the surplus base load generation problems were managed by the IESO with exports,
some limited maneuvering capability at hydraulic stations and Bruce B nuclear station and some
hydraulic spill. The IESO also shut down a nuclear unit on 3 occasions. There were also 138
hours of negative electricity prices on 56 evenings in 8 of the months between September 15,
2010 and September 14, 2011. Approximately 15 million dollars were paid at negative prices to
export that surplus energy. That occurred with only about 1,400 MW of installed wind
generation. By the end of 2018 we will have almost 7,500 MW of installed wind generation
along with a similar customer demand if economic growth continues to be weak as the
government has recently predicted.
The surplus base load generation problem will get worse and more costly as more wind, hydraulic
and nuclear base load generation capacity is added over the next 6 years unless we dispatch down
our wind turbines or take other measures to reduce surplus base load generation.
It is not OSPE’s intention to stop the construction of renewable generation. The government and
electricity consumers have invested considerable sums of money to create a new green energy
industry. The FIT program can be modified to limit the annual addition of new renewable
generation to a maximum rate that can be accommodated by demand growth and ideally at a
minimum rate that will sustain the industry that has been created. OSPE provided a submission
to the Ministry of Energy for its 2011 FIT Program Review outlining suggestions to help ensure a
more affordable and sustainable green energy industry (R43).
The resulting costs from overbuilding of our wind generation capacity, can be mitigated if we
find export markets for our surplus power. Exporting power on the spot market is not
economically attractive. Also neighbouring utilities are likely to be more interested in purchasing
dependable long-term renewable or zero GHG emitting energy. We would have to re-examine
our electricity export policies and market rules so that zero GHG emitting electricity could be
exported on a dependable (firm) long-term delivery basis in order to maximize its value. OPG is
currently the only supplier of large amounts of both renewable and zero GHG emitting energy in
Ontario and can reliably enter into such commercial contracts.

Wind and the Electrical Grid: Mitigating the Rise in Electricity Rates and Greenhouse Gas Emissions
Page 15 of 43
4. Potential Solutions to Wind Generation Variability
Wind variability and the more problematic surplus base load generation problem caused by strong
winds when customer demand is low can be managed in a number of ways.
Supply side solutions provide grid flexibility so that wind generation can be integrated
effectively. The following methods can be used to manage wind variability:
Improved wind forecasting,
Improved maneuvering at hydraulic units,
Improved maneuvering at nuclear units,
Improved maneuvering at gas-fired units,
Improved maneuvering at bio-mass units,
Improved storage capacity,
Improved import/export capability,
Dispatching (constraining) wind turbine output.
Demand side solutions provide a more flexible demand that can be adjusted to match the
prevailing supply. When wind energy is available customers draw more power and when wind
energy is not available customers defer their power consumption until wind energy is available or
until off-peak hours. During off-peak hours the peak load plants can be operated for additional
hours to accommodate the demand that has been shifted.
These potential solutions are discussed in more detail below.
Improved Wind Forecasting to Manage Wind Variability
The objective of improved wind forecasting is to more efficiently deploy other types of
generation to accommodate only the expected variation in wind generation and not the entire
nameplate capacity. Wind forecasting can help manage both the expected magnitude and rate of
change in wind generation.
The larger number of monitoring stations around the province and improved software tools can
allow the forecaster to monitor a weather front and plot its course as it travels across the wind
farms. The result is a more accurate forecast that can help grid operators better manage
generation resources. Most grids that have a high percentage of wind generation now employ
wind forecasting as part of their generation management strategy. Wind forecasting is therefore
an important new tool to help manage intermittent wind generation. Improved wind forecasting
capability is included in the IESO plans.
It is important to remember that wind forecasting only eliminates unnecessary over reaction to
wind variability. Wind forecasting cannot eliminate surplus base load generation caused by
customer demand falling below the running capacity of the base load plants. Consequently other
solutions are required for that situation.
Improved Maneuvering at Hydraulic Units to Manage Wind Variability
The operating flexibility (storage and spill) provided by existing hydraulic stations is currently
being fully utilized. In order to obtain additional maneuvering flexibility we would need to make
significant civil engineering modifications to the hydraulic stations. This would be very
Wind and the Electrical Grid: Mitigating the Rise in Electricity Rates and Greenhouse Gas Emissions
Page 16 of 43
expensive. Therefore, modifying existing hydraulic stations to get more maneuvering capability
may not be economically viable. Detailed studies can confirm this.
Hydraulic storage is discussed in more detail later in this document.
Improved Maneuvering at Nuclear Units to Manage Wind Variability
Nuclear generation is a zero GHG emission source of energy. It would be attractive
environmentally to use nuclear generation to back up wind generation rather than gas-fired
generation. However, the current CANDU reactors we use in Ontario have not been designed to
continuously maneuver their power output. There are reactor physics and other plant technical
constraints that limit the frequency, magnitude and speed at which reactor power changes can
take place. An alternative is to maneuver the generator output and leave the reactor operating at
constant high power levels. The energy imbalance would be directed to a steam bypass system.
The Bruce B and Darlington reactors have a turbine condenser steam dump system that can be
used to redirect steam to the condenser and bypass the turbine generator. This steam bypass
system allows the units to survive a grid load rejection or blackout by allowing the reactor to
continue operating at 60-70% power with the turbine-generator operating at 6% to supply the
unit’s electrical loads. At this reactor power level the reactor core will continue to burn off
neutron absorbing fission products that would otherwise build up and poison (shutdown) the
reactor for about 2 days.
These systems were used during the August 2003 blackout to keep 3 units at Bruce B and 1 unit
at Darlington operating throughout the blackout. These units re-connected to the grid a few hours
after the initial grid collapse. Unfortunately, the turbine condenser steam dump system was
design for infrequent use during load rejections and grid blackouts. They are not designed for
continuous maneuvering duty. Bruce B staff have modified their turbine condenser steam dump
system so it can operate more frequently but it is not rated for continuous duty, 24 hours a day.
The present nuclear plants already discharge the maximum amount of heat into the lake that is
permitted by the Ministry of the Environment. If we wanted to reject more steam energy
conveniently, we would likely need to reject that steam to the air using air-cooled condensers on
the roof. The type of condensers required would resemble those installed at gas-fired plants such
as the Sithe Goreway or Halton Hills plants. The air-cooled condensers at a nuclear plant would
sit high enough above the roof to avoid costly roof redesign. They would be designed to a higher
pressure and temperature because the condensate would be returned to the de-aerator storage tank
rather than the turbine condenser storage tank (hot-well). Because of their higher design
temperature they would be smaller per MWt of capacity compared to the gas-fired plants.
Suppose these nuclear plants were fitted with a 30-40% roof mounted air-cooled condenser. The
roof mounted air-cooled condensers would not produce any wear and tear on the turbine
condensers so they should be able to operate continuously at the same maneuvering rate as the
nuclear steam turbines. Nuclear steam turbines have a faster maneuvering rate than the higher
temperature coal and gas-fired plant steam turbines. That means we could get 30-40% or about
250-300 MW of continuous maneuvering capability from each unit at Bruce A, Bruce B and
Darlington or about 3,000 MW of maneuvering capability if all 12 units were fitted with air-
cooled condensers. This could be done without a major licensing effort because the reactor
would continue to operate at 100% power level and would not see any change in power during
turbine-generator power maneuvers.

Wind and the Electrical Grid: Mitigating the Rise in Electricity Rates and Greenhouse Gas Emissions
Page 17 of 43
If the design was standardized into modules to get manufacturing economies even with its higher
design pressure and temperature, the smaller size needed per MW thermal should result in a
reasonable cost per MW of maneuvering capacity. The cost and environmental impact should be
significantly less than the cost of a new 3,000 MW pumped hydraulic generating station,
transmission line and large seasonal storage reservoir.
Another advantage of using nuclear maneuvering to manage wind variability is that we achieve
zero GHG emissions from both the wind energy production and its nuclear backup.
Unfortunately, we would still consume nuclear fuel because the reactor is still at full power. If
the electrical power reduction was expected for an extended period of time (e.g.: a full day of
strong winds or a weekend of lower demand) we could reduce nuclear fuel consumption by
lowering reactor power. The reactor power reductions would have to be done very slowly to
prevent poisoning out the reactor. Power maneuvers would involve considerably more workload
for the nuclear operator and additional wear and tear on nuclear systems. Consequently,
engineering and safety studies would need to be done to make sure a reactor power maneuver
could be done on a regular basis (eg: nightly or weekends).
Since the nuclear plant would not poison out, the plant owner could offer a much higher marginal
cost of power into the electricity market auction process. If enough nuclear maneuvering
capacity is available this would eliminate the very large negative prices that have occurred in
2011. Nuclear and run-of-the-river plants had to bid very low prices to stay on-line in 2011. In
2010/11 we saw negative wholesale prices as low as negative 139 $/MWh when the normal
market price should be around +30 to 40 $/MWh based on the marginal fueling cost of gas-fired
plants.
It is important to remember that the Ontario grid experiences some surplus base load generation
periods even when there is no wind generation. This has occurred recently because the customer
demand has dropped the past few years while 2 units at the Bruce A plant were returned to
service. This means we have too many nuclear, run-of-the-river hydraulic and must-run gas-fired
units operating during the night in the spring and autumn.
To fully appreciate the implications of this we need to view the grid operation as 3 separate
regions. We are assuming that solar PV installations are not approved beyond a capacity level
that would create surplus peak load generation (SPG) otherwise we would need to look at a 4th
operating region.
SBG Region A – where there is not enough load for nuclear units irrespective of wind.
SBG Region B – where there is not enough demand for both nuclear and wind combined.
Non-SBG Region – where there is sufficient demand for all the nuclear and wind units.
In SBG Region A: A steam bypass system eliminates the need for costly nuclear plant
shutdowns. Dispatching wind turbines off does not guarantee a solution to the negative
electricity price problem when the grid is operating in SBG Region A. In this regime, wind
generation is not setting the price, nuclear generation is. Therefore, it is important that nuclear is
able to dispatch down to avoid a large negative electricity price. A robust steam bypass system
would enable nuclear generators to offer a more reasonable price into the market and power down
without a poison outage. It is important to note that the current IESO proposal to use floor prices
to prevent large negative electricity prices will not prevent a nuclear poison outage because
dispatching will still take place and force a nuclear plant to shutdown when there is no more wind
generation to dispatch down.
Wind and the Electrical Grid: Mitigating the Rise in Electricity Rates and Greenhouse Gas Emissions
Page 18 of 43
In SBG Region B: A steam bypass system would permit a choice of either dispatching wind
turbines or dispatching nuclear electrical output down. Dispatching wind turbines is easier. But
that means the investment in wind generation is wasted. The other option from a broader
provincial viewpoint is to give wind generation priority and force nuclear plants to innovate and
provide additional environmental benefits for the province as a whole. If we choose to dispatch
nuclear generation instead of wind turbines, then two other environmental opportunities arise:
Zero GHG steam becomes available at the nuclear plants when their steam bypass
systems are operating. This steam can offset gas-fired industrial and residential steam
within a district heating steam system. Some nuclear plants in Europe supply steam to
their local towns for hot water, space heating and industrial process steam (eg: Hungary’s
PAKS nuclear plant). The Bruce A station also supplied a large district heating steam
system during the 1970s and 1980s before the plant was laid up.
There would be an incentive for the owners to do the required R&D and safety analysis
work to enable reactor power maneuvering in order for the plant to reduce the amount of
wasted steam and nuclear fuel used during dispatches.
The end result of dispatching nuclear instead of wind is that you can potentially achieve lower
nuclear fuel consumption and lower GHG emissions for the province as a whole for the same
electrical energy production.
In the Non-SBG Region: There is no surplus generation. However, if it became a policy goal to
further reduce GHG emissions from the electrical grid, you could optimize the combination of
additional hydraulic storage and nuclear capacity to provide a zero GHG backup for wind and
solar. Nuclear steam bypass would be used to keep the storage capacity needed to a more
affordable and environmentally acceptable size.
The cumulative costs and environmental benefits provided by nuclear steam bypass are dependent
on the number of operating hours in each of the 3 regions above. These can be studied with
reasonable accuracy using system simulation studies using supply, demand and wind generation
data from IESO’s production data archives and OPA’s financial data. Parametric studies can be
done to optimize steam bypass capacity and storage capacity.
Steam bypass capability at the nuclear plants provides considerable grid operating flexibility in
case planning assumptions do not materialize as expected. It also provides the IESO additional
operating advantages during normal and abnormal operating conditions including grid blackout
restoration (R28).
You cannot energize a long 500 kV transmission corridor after a blackout with wind turbines.
The Bruce transmission lines to the GTA area require about 180 MX of charging power. System
restoration must be done with larger hydraulic, gas-fired or nuclear units. Wind and solar
generation cannot be added to the restoration process until the system is large enough to
withstand the variability of wind and solar generation. Grid restoration studies in the mid 1980s
at Ontario Hydro by Power System Operations Division and the Generation Design and
Development Division indicated that nuclear units operating on steam bypass could help restore a
blacked out grid in about 4 hours. Without nuclear units the process was predicted to take from
24 to 72 hours depending on weather conditions. Following the August 2003 blackout the
restoration process took about 24 hours followed by power conservation appeals for another
week.

Wind and the Electrical Grid: Mitigating the Rise in Electricity Rates and Greenhouse Gas Emissions
Page 19 of 43
The IESO target for system restoration (R31, R32) after a blackout is 8 hours. That target relies
on all major units to be ready to assist with system restoration soon after the load rejection. All
large units on the grid can currently meet this requirement except Bruce A. The 8-hour period is
a reasonable maximum during the winter. The IESO was not able to achieve this target in August
2003 in part because the grid lost too many operating nuclear units. Only 3 units at Bruce B and
1 unit at Darlington survived the grid collapse and associated load rejection. Brue A units were
not operating at that time. The deficiencies at Darlington that resulted in 3 units being lost,
instead of the design target of 1 unit loss out of 4, have been corrected.
However, due to design changes at Bruce A (removal of its reactor booster rods) Bruce A would
not be able to survive a load rejection from 100% power in any case. It can only survive load
rejections from about 60-70% power or lower. The boosters cannot be re-installed for safety
reasons. It would be uneconomic to operate the Bruce A reactors at 60-70% power so they will
survive a grid blackout. Consequently, the 8 hour restoration target cannot be met unless the
Bruce A steam bypass system is upgraded to about 100% steam bypass capacity.
Upgrading the turbine steam condenser to 100% steam dump capacity is not practical because of
the regulatory limits on the heat load to the lake. But a 30-40% air-cooled condenser on the roof
would restore Bruce A’s load rejection capability at full power and provide about 250 MW of
continuous power maneuvering capability per unit.
A Bruce A unit is the best candidate for installing an air-cooled condenser on the roof to gain
operational experience with nuclear maneuvering using steam bypass before it is added to other
nuclear units.
Improved Maneuvering at Gas Fired Units to Manage Wind Variability
Gas fired generation is the current preferred backup to wind generation to manage its variability.
Gas fired backup does not work at all in SBG Region A and has limits to what it can do in SBG
Region B. Most of our gas-fired capacity is the more efficient CCGT type. These gas-fired
plants are not sufficiently flexible to fully manage the full 7,500 MW of wind generation
variability on their own. These plants have large must-run loads when they are operating, long
must-run periods and slower maneuvering rates than required. Consequently, wind turbine
dispatching would be required in both SBG Region A and B if nuclear cannot maneuver its
electrical output.
To improve maneuvering rates at CCGT gas-fired plants would require significant process
engineering changes. The engineering features needed to improve maneuvering rates are the
opposite of what are needed to maintain high thermal efficiency. Also as efficiency drops, GHG
emissions rise. Modifying CCGT plants to provide a faster maneuvering rate is not
recommended.
The simple cycle gas-fired plants are more maneuverable that CCGT plants but their efficiencies
are much lower – typically 35% instead of 55%. Ontario does not have enough simple cycle gas-
fired plant capacity to manage a large fleet of wind turbines. Also it would cost too much in fuel
consumption and GHG emissions to use these plants for that purpose around-the-clock. Adding
additional simple cycle gas-fired plant capacity to manage wind variability is therefore not
recommended.

Wind and the Electrical Grid: Mitigating the Rise in Electricity Rates and Greenhouse Gas Emissions
Page 20 of 43
Improved Maneuvering at Biomass Units to Manage Wind Variability
Ontario Power Generation is currently repowering its Atikokan station to use biomass and is
making provisions to use biomass at its Thunder Bay station, that is being converted from coal
firing to gas firing (R33). These plants already have transmission line connections so that is one
expense that will be avoided if biomass is used as fuel at those facilities. Biomass generating
plants can maneuver their electrical output. They are also carbon neutral and the environmental
impact of their combustion products can be managed by installing the latest post-combustion
filtration systems.
Biomass is only considered sustainable if it comes from waste streams and not from biomass that
can be used for food production (including soil nutrients) or building materials. Biomass
generation is more economical when it is developed close to its fuel source. The maneuvering
rates of these plants are very application dependent and as in the case of gas-fired plants the more
maneuverable we want to make them the less efficient they become.
Some forms of biomass generation are actually very beneficial to the environment. For example
landfill methane gas plants convert methane to carbon dioxide when they produce energy.
Methane (natural gas) by weight is about 21 times more potent than carbon dioxide with respect
to GHG effects over a 100 year period (R56). Consequently burning landfill gas reduces the
GHG impact on the environment by a factor of 7.6 compared to allowing the methane to escape
from the landfill site.
To the extent that waste biomass is available in Ontario it can be used to provide a zero GHG
backup to wind and solar generation. Modifying these plants to provide a faster maneuvering rate
is not recommended.
Improved Storage Capacity to Manage Wind Variability
Storage is an effective option to manage wind generation variability. Its strengths include:
No GHG emissions and no nuclear fuel consumption,
It has fast maneuvering rates,
Daily storage can be distributed close to the wind or solar farm where it can provide a
number of other advantages such as:
o Improved voltage control on the distribution system,
o Reduced transmission line and transformer ratings, and
o Improved distribution and transmission capacity factors.
However storage has several disadvantages:
It is expensive compared to gas-fired or nuclear steam bypass maneuvering. Costs vary
from $1,000 to $9,000 per kW (R2)(R46)(R53) depending on technology, geography and
energy storage capacity.
Large seasonal storage capable of managing a large wind fleet requires:
o A very large hydraulic storage reservoir
o A large new transmission corridor
There are several commercial storage technologies available. Some storage solutions can deliver
small to moderate amounts of power transfer (kW to MW) over a short time frame (seconds to

Wind and the Electrical Grid: Mitigating the Rise in Electricity Rates and Greenhouse Gas Emissions
Page 21 of 43
days) such as batteries, fuel cells, flywheels, compressed gas, hot fluids, etc. These are typically
best deployed in a distributed manner near their associated wind or solar farm.
Hydraulic storage technologies are capable of large amounts of power transfer (MW to GW) over
very long time frames (days to months) such as dam storage or pumped hydraulic storage.
A number of US utilities are now deploying MW scale short-term distributed storage (less than 1
hour) to smooth out the rapid fluctuations that are created by wind and solar energy variability
inside their distribution systems. Because storage is expensive, it is deployed sparingly where
absolutely necessary for electrical voltage control and to limit the peak power flow in the
distribution lines.
Daily storage (a few hours to a few days) can provide considerable benefit to the overall grid
because it can eliminate much of the overnight supply/demand imbalances that a strong wind
during low demand can create. Daily storage can be provided locally within the distribution
system or at the transmission system level in a more central location. For example OPG has a
modest pumped storage station at Niagara Falls. There is also daily storage at a number of the
existing hydraulic dams.
Seasonal storage (a few months or more) is the most valuable because Ontario’s electrical
demand has a large seasonal variation that does not coincide with the wind generation seasonal
variation. Seasonal storage would allow much higher penetration of wind generation if that
energy can be shifted to when it is needed.
Pumped hydraulic storage wastes energy in the conversion to and from the pumped storage
reservoir, typically at least 10 to 15% in each conversion if the reservoir pumps and turbines are
operated near their maximum operating efficiency point.
Dam storage (holding back water) has no conversion losses but you need enough river flow to
effect the power reduction you want. For example a 1,000 MW dam cannot be powered down
more than 1,000 MW. For environmental reasons most river flows cannot be stopped completely.
Typically only about 60% of Ontario’s operating hydraulic capacity is maneuverable. Ontario
typically has about 6,000 MW of running hydraulic capacity on most days with another 1,000
MW coming into service by 2018. Consequently dam storage alone will not manage the entire
7,500 MW wind turbine fleet planned for 2018.
OPA is undertaking studies to determine if some hydraulic storage can be added economically
such as expanding the Niagara Pumped Storage Station reservoir capacity. For readers who want
more information about hydraulic storage, the Ontario Waterpower Association produced a report
in 2005 that identifies a number of Ontario sites where hydraulic generation and hydraulic
pumped storage can be located (R46). The cost of hydraulic generation facilities was estimated at
that time at $2,000 to $4,000 depending on the dam size but not including the transmission lines.
Improved Import/Export Capability to Manage Wind Variability
Ontario recently upgraded the tie lines to Quebec to get additional capacity that can be used to
transmit surplus energy for storage in Quebec’s James Bay and to obtain energy when we are
short. The total transfer capability is about 6,000 MW to the 5 adjoining grids. Only about 4,800
MW is usable simultaneously because of technical constraints. However, all 5 adjoining grids
would have to simultaneously import our surplus energy to achieve the 4,800 MW export limit.
This rarely happens because our adjoining grids in New York or Michigan also have surplus
Wind and the Electrical Grid: Mitigating the Rise in Electricity Rates and Greenhouse Gas Emissions
Page 22 of 43
energy often when we do. From Sep 2010 to Sep 2011 when wholesale electricity prices in
Ontario dipped to negative values we never exported more than 3,500 MW and that only occurred
once.
To export large amounts of power (MW) and energy (MWh) we would have to change the way
we sell our power. Currently it is sold on the spot market which effectively is the incremental
fuel cost for that energy unless we have a surplus. During surpluses the price drops and if surplus
base load generation is severe, the price can go negative. From Sep 2010 to Sep 2011 the worst
case price was negative 139 $/MWh.
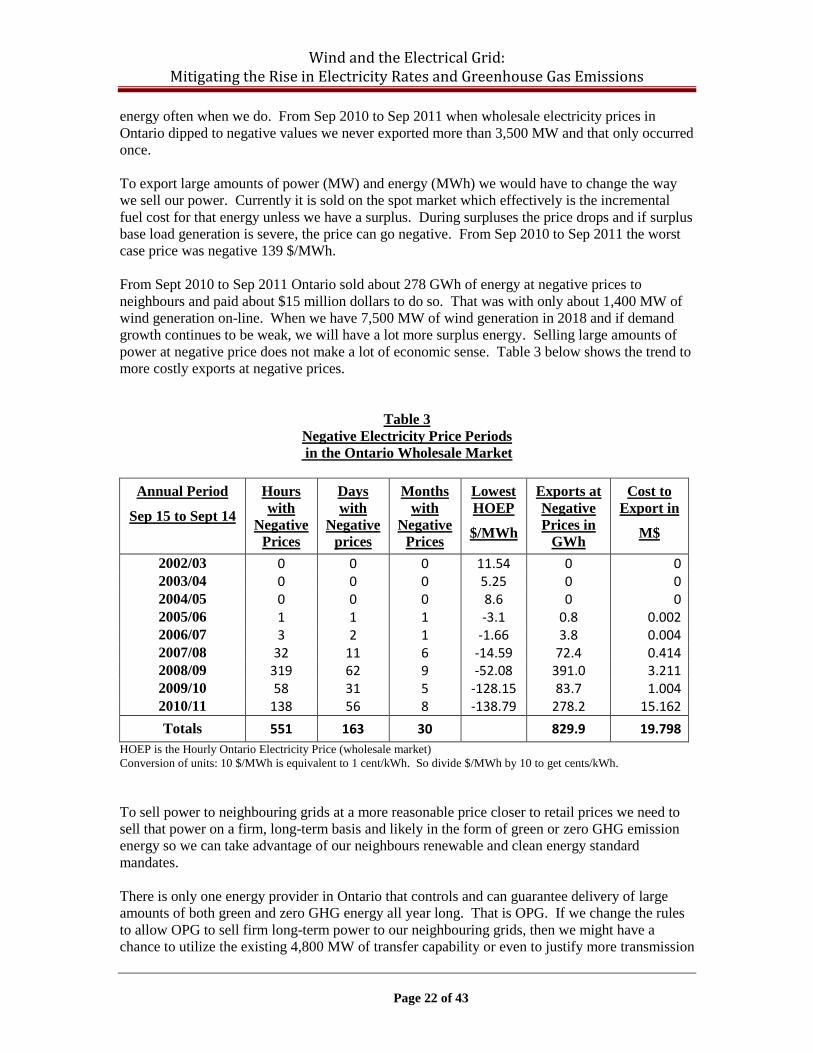
From Sept 2010 to Sep 2011 Ontario sold about 278 GWh of energy at negative prices to
neighbours and paid about $15 million dollars to do so. That was with only about 1,400 MW of
wind generation on-line. When we have 7,500 MW of wind generation in 2018 and if demand
growth continues to be weak, we will have a lot more surplus energy. Selling large amounts of
power at negative price does not make a lot of economic sense. Table 3 below shows the trend to
more costly exports at negative prices.
Table 3
Negative Electricity Price Periods
in the Ontario Wholesale Market
Annual Period
Sep 15 to Sept 14
Hours
with
Negative
Prices
Days
with
Negative
prices
Months
with
Negative
Prices
Lowest
HOEP
$/MWh
Exports at
Negative
Prices in
GWh
Cost to
Export in
M$
2002/03 0 0 0 11.54 0 0 2003/04 0 0 0 5.25 0 0 2004/05 0 0 0 8.6 0 0 2005/06 1 1 1 -3.1 0.8 0.002 2006/07 3 2 1 -1.66 3.8 0.004 2007/08 32 11 6 -14.59 72.4 0.414 2008/09 319 62 9 -52.08 391.0 3.211 2009/10 58 31 5 -128.15 83.7 1.004 2010/11 138 56 8 -138.79 278.2 15.162
Totals 551 163 30 829.9 19.798
HOEP is the Hourly Ontario Electricity Price (wholesale market)
Conversion of units: 10 $/MWh is equivalent to 1 cent/kWh. So divide $/MWh by 10 to get cents/kWh.
To sell power to neighbouring grids at a more reasonable price closer to retail prices we need to
sell that power on a firm, long-term basis and likely in the form of green or zero GHG emission
energy so we can take advantage of our neighbours renewable and clean energy standard
mandates.
There is only one energy provider in Ontario that controls and can guarantee delivery of large
amounts of both green and zero GHG energy all year long. That is OPG. If we change the rules
to allow OPG to sell firm long-term power to our neighbouring grids, then we might have a
chance to utilize the existing 4,800 MW of transfer capability or even to justify more transmission

Wind and the Electrical Grid: Mitigating the Rise in Electricity Rates and Greenhouse Gas Emissions
Page 23 of 43
capacity. What that means is that OPG will not provide energy exclusively to Ontario but also to
our neighbours.
If that power can be exported at a higher price than the Ontario wholesale price and that extra
revenue is retained by OPG to improve its stations, or by the grid as a whole to reduce the global
adjustment, or by OEFC to reduce the stranded debt or by the Ontario government to reduce
taxes, then consumers will benefit in the long run.
Because of the large surplus energy we will likely have for an extended period of time (10 to 20
years) it is probably worth the trouble to test the electricity export market and see what green and
zero GHG firm long-term power is worth to our neighbouring grids.
One definite environmental benefit is that if the US Ohio valley can offset coal generation with
our zero GHG energy then our own air quality will improve because the prevailing winds carry
that pollution into Ontario.
Dispatching (Constraining) Wind Turbine Output to Manage Wind Variability
Wind generation can easily be dispatched down. Adjusting the rotor pitch angle will reduce the
amount of wind energy delivered to the grid. However, wind generation cannot be dispatched up
beyond the maximum power available in the wind at any moment in time. This means that
dispatching wind generation down is not a complete solution to manage wind variability. For
example if you dispatch wind down from 1000 MW to 500 MW but shortly thereafter the wind
power drops off to 200 MW then you still need to find 300 MW to make up the shortfall. A
dependable backup supply is therefore required because wind energy may fall off below the
required dispatch value.
When we dispatch wind down we don’t want to just set the rotor angle to a new fixed value. We
prefer to set the MW output to a fixed dispatch value and have the rotor pitch angle varied by the
control system to keep the MW fixed. In this way wind speed variations do not affect the wind
turbine MW output to the grid.
For those wind turbines that are dispatched, their contribution to the surplus base load generation
problem can be eliminated. There are of course economic and environmental consequences. The
IESO still needs to honour existing contracts and compensate wind generators not to produce.
New contacts will need to be structured with dispatching in mind. This can be done either by
separating the capacity and energy charge or by anticipating the capacity factor reduction caused
by dispatching and adjusting the energy price to reflect the reduced operating time. Also, the
environmental benefits from our investments in wind generation do not materialize if wind
generation is turned off too frequently.
It is necessary to dispatch wind turbines as soon as practicable to manage our surplus base load
generation. It will take many years to implement other engineering solutions such as improved
storage or improved nuclear maneuvering. If we don’t dispatch wind turbines then the IESO will
be forced to shut down nuclear units and retail electricity rates and GHG emissions will rise more
than planned as more wind turbines are added to the grid.
Shifting the Demand to Manage Wind Variability
Theoretically, a mismatch between supply and demand can be eliminated if we shift the demand
to a period when the supply is available. This can be done in two ways. We can provide
Wind and the Electrical Grid: Mitigating the Rise in Electricity Rates and Greenhouse Gas Emissions
Page 24 of 43
incentives to get customers to shift their peak demand into the night hours or weekends. The
other method is to provide the IESO with the means to lower and raise customer demand any
time it is necessary.
Shifting customer peak demand into the off-peak hours will usually involve some capital
equipment such as smart controllers and process equipment. Unfortunately the current difference
between peak and off-peak electricity rates do not provide a sufficient economic incentive to
make the capital investment. The ratio of peak to off-peak rates needs to be much higher to
provide that incentive.
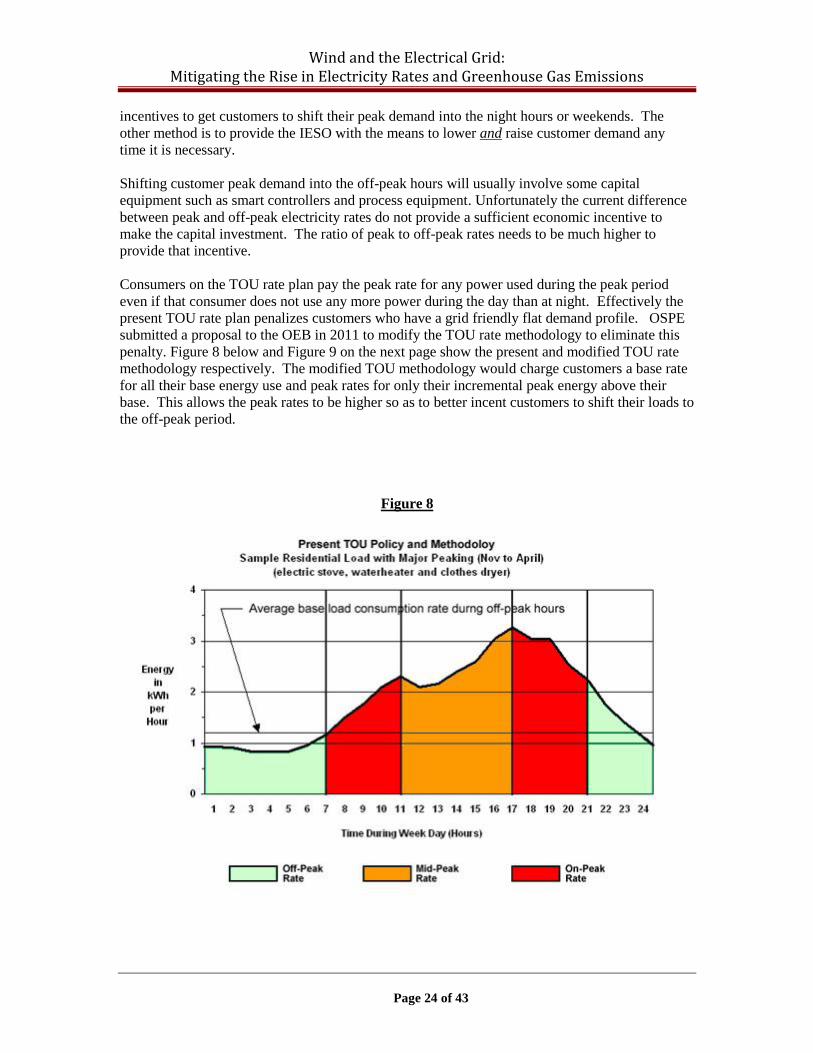
Consumers on the TOU rate plan pay the peak rate for any power used during the peak period
even if that consumer does not use any more power during the day than at night. Effectively the
present TOU rate plan penalizes customers who have a grid friendly flat demand profile. OSPE
submitted a proposal to the OEB in 2011 to modify the TOU rate methodology to eliminate this
penalty. Figure 8 below and Figure 9 on the next page show the present and modified TOU rate
methodology respectively. The modified TOU methodology would charge customers a base rate
for all their base energy use and peak rates for only their incremental peak energy above their
base. This allows the peak rates to be higher so as to better incent customers to shift their loads to
the off-peak period.
Figure 8

Wind and the Electrical Grid: Mitigating the Rise in Electricity Rates and Greenhouse Gas Emissions
Page 25 of 43
Figure 9
Providing the IESO with the means to adjust customer demand up or down would require us to
find customers with the right types of loads that can be managed by the IESO. In order to
effectively manage wind generation variability the customer loads must be sufficiently flexible
that they can use or store the energy when the wind is blowing. Those loads need to have some
form of storage built in or the ability to displace other fuels such as natural gas.
Some utilities in the US have been experimenting with using existing demand reduction schemes
in new ways that result in an increase demand when the grid operator wants to drive demand
higher. For example if electric water heaters are on a demand management scheme, the grid
operator can remotely turn off or reduce their temperature setting during periods when wind
generation is low and then turn them on or raise their temperature setting when wind generation is
high. This effectively creates additional demand when required even though the demand
management scheme was originally designed for a different purpose - to reduce total grid demand
when supply is insufficient to meet peak demand.
Water heaters are an ideal storage medium because they operate 12 months of the year 24 hours a
day so the scheme is always available. The problem is that in Ontario, there are a limited number
of electrical water heaters. Many of these heaters were converted to gas firing over the past
couple of decades due to electrical conservation programs and rising electricity prices.
Air conditioning, heat pumps and geothermal storage systems for space heating and cooling could
also be used in the winter and summer but they are not effective at shifting the demand during the
spring and autumn.

Wind and the Electrical Grid: Mitigating the Rise in Electricity Rates and Greenhouse Gas Emissions
Page 26 of 43
To make IESO controlled demand effective at counteracting wind related surplus base load
generation, more willing customers are needed than the minimum required dispatching amount.
The reason is that some customers may not be able to provide a demand on some days because
their storage is full or their production is shutdown. A smarter information and control interface
is also required between the IESO and the customer facilities. Smart grid products will come to
market in the next few years that will make demand flexibility easier to implement. Also, to
attract sufficient interest and pay for the capital investment needed for this type of demand
flexibility, it may be necessary to offer customers price incentives. If the modified TOU
methodology described above is not used it may be necessary to create a new class of customers
with special metering functionality. Consequently IESO controlled demand is not a simple or
quick solution to the large amounts of wind variability we need to manage.
Analyzing various load shifting and storage schemes is not the main purpose of this document so
we will not go into details for each application. Below is a list of a few industrial and commercial
applications that would help flatten the load profile either by shifting peak load to the off-peak
periods or by adding new load to the off-peak periods. The result would be the same, namely, to
flatten the load profile and increase demand at night when much of the wind energy is produced
and to improve overall grid utilization by lowering the ratio of peak load to base load.
A few typical applications include:
Creating ice at night for space air conditioning and refrigeration,
Filling thermal storage for space heating at night,
Pumping industrial domestic water into storage towers at night,
Charging electric plug-in vehicle batteries at night,
Producing industrial commodities such as hydrogen gas at night.
We should make a few comments about two of items above – electric plug-in vehicles and
hydrogen production.
Electric Plug-in Vehicles: Judging by some of the popular stories in the press, electric plug in
vehicles are going to solve all our electrical grid storage problems. This is simply not possible in
the near term. There are two reasons. Firstly, electric plug-in vehicle production is not expected
to reach significant production volumes in the USA until 2025 (R42). The most optimistic
estimate is 25% of new car production by 2025. It takes about 10 to 15 years to replace the
existing fleet of vehicles so electric vehicles will take many years to reach double digit
percentage of vehicles on the road. Nearly half of the energy in a plug-in electric vehicle will be
needed for passenger compartment space heating and cooling in Ontario’s summer and winter
climate. That will reduce the driving range by about half. Consequently, the adoption rate is
likely to be lower than the maximum rate mentioned above unless there is a large increase in oil
prices or a major breakthrough in battery technology.
Secondly, there is not much energy required to charge an electric car. Most of these cars will
have a 20 to 50 kWh storage battery. Lets say 30 kWh on average for discussion purposes. If
500,000 cars or about 8% of Ontario’s passenger car fleet (R48) were electric plug-in vehicles we
could completely charge every vehicle every night with about 18 GWh of electricity per day
assuming a 20% charging efficiency loss. Between 10 PM and 6 AM we have 8 hours of
charging time so we would need 2,250 MW of generating capacity at night to charge these
vehicles. We typically have 4,000 MW of off-peak capacity available at night in the spring and
autumn and 8,000 MW in the summer. So yes, electric vehicles will help flatten our demand
profile, if they are charged at night, but they won’t be a complete solution and not for many years.

Wind and the Electrical Grid: Mitigating the Rise in Electricity Rates and Greenhouse Gas Emissions
Page 27 of 43
If electric vehicles are not charged at night they could make the grid peak load worse or they
could create electrical problems on your local residential street. A 230 Volt, 7 kW fast charging
station (4 hour charging time) consumes about double the power of a typical high efficiency air
conditioner. Therefore some time-based charging controls may be needed to prevent local
transformer overloads or a worsening grid peak load.
Hydrogen Production: Articles about the “hydrogen economy” has received some attention
recently as GHG emissions have become a greater concern. Hydrogen that is produced when
wind energy is available can be used to power an internal combustion engine or fuel cell when
wind is not available. This concept is being evaluated (R49). A small amount of hydrogen by
volume can also be injected into the natural gas supply with suitable safeguards.
Another concept is to produce hydrogen as a byproduct of other industrial processes at night.
Unfortunately due to the capital cost of many industrial processes, there is a strong economic
incentive to keep them running continuously at high capacity factor. To operate these facilities at
lower capacity factor during the off-peak hours will likely require a substantial incentive.
The barrier to adopting hydrogen as a major fuel in our economy is the current low cost of natural
gas. A considerable amount of R&D and time will be needed before hydrogen gas becomes a
major component of our energy mix.
5 Life Cycle Costing
Most utilities now are using life cycle costing (LCC) as the basis for deciding what technology
will be used to increase generation capacity. LCC has different names in different places.
Examples include levelized unit energy cost (LUEC) and levelized cost of electricity (LCOE) in
the international literature. We will use the term LCOE in this document. LCOE includes the
impact of capacity factor, capital cost, financing costs, fuel costs, operating costs and
maintenance costs into the total anticipated costs of the facility recovered via an average cost per
unit of energy produced. LCOE is expressed as cents/kWh in North America. LCOE can also
include future costs such as carbon taxes, decommissioning costs or long term waste disposal
costs.
While LCOE is fairly well understood and established, it is affected significantly by the
underlying assumptions used in the calculation. For example, the expected capacity factor of the
facility has a significant impact on the LCOE for all facilities. For fuel burning facilities the
assumptions for future fuel costs have a significant impact on LCOE. For higher capital cost
plants with long construction schedules such as nuclear and hydraulic plants, the financing
discount factor will significantly affect the LCOE. Also projected future costs are important for
strategic decisions about new energy sources. For example, renewable generation costs
especially solar PV are dropping faster than expected, so what may seem expensive today may be
economic tomorrow. Consequently, care must be taken when comparing LCOE numbers to
ensure the underlying assumptions are clearly understood and accepted.
Comparisons of LCOE data for several technologies from three recognized sources are provided
in Table 4 below. In Ontario, the data varies from about 5 cents/kWh for conservation and
nuclear refurbishment up to about 80 cents/kWh for solar PV roof top units. Because LCOE data
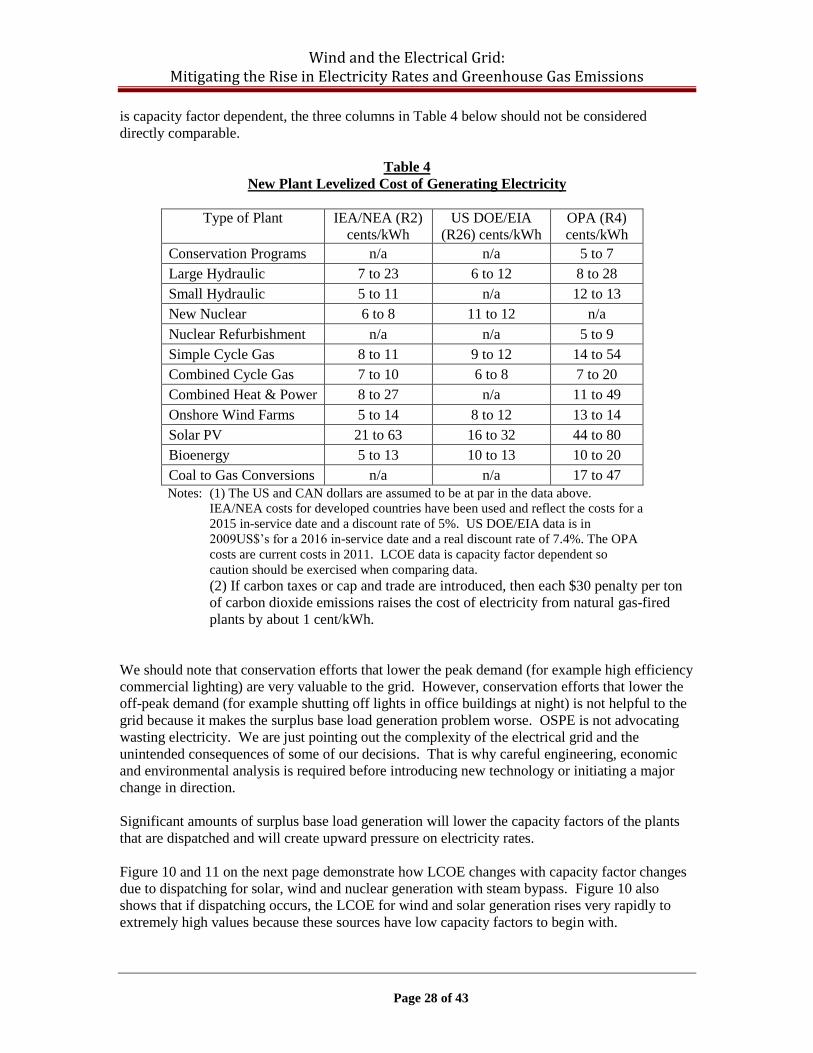
Wind and the Electrical Grid: Mitigating the Rise in Electricity Rates and Greenhouse Gas Emissions
Page 28 of 43
is capacity factor dependent, the three columns in Table 4 below should not be considered
directly comparable.
Table 4
New Plant Levelized Cost of Generating Electricity
Type of Plant IEA/NEA (R2)
cents/kWh
US DOE/EIA
(R26) cents/kWh
OPA (R4)
cents/kWh
Conservation Programs n/a n/a 5 to 7
Large Hydraulic 7 to 23 6 to 12 8 to 28
Small Hydraulic 5 to 11 n/a 12 to 13
New Nuclear 6 to 8 11 to 12 n/a
Nuclear Refurbishment n/a n/a 5 to 9
Simple Cycle Gas 8 to 11 9 to 12 14 to 54
Combined Cycle Gas 7 to 10 6 to 8 7 to 20
Combined Heat & Power 8 to 27 n/a 11 to 49
Onshore Wind Farms 5 to 14 8 to 12 13 to 14
Solar PV 21 to 63 16 to 32 44 to 80
Bioenergy 5 to 13 10 to 13 10 to 20
Coal to Gas Conversions n/a n/a 17 to 47
Notes: (1) The US and CAN dollars are assumed to be at par in the data above.
IEA/NEA costs for developed countries have been used and reflect the costs for a
2015 in-service date and a discount rate of 5%. US DOE/EIA data is in
2009US$’s for a 2016 in-service date and a real discount rate of 7.4%. The OPA
costs are current costs in 2011. LCOE data is capacity factor dependent so
caution should be exercised when comparing data.
(2) If carbon taxes or cap and trade are introduced, then each $30 penalty per ton
of carbon dioxide emissions raises the cost of electricity from natural gas-fired
plants by about 1 cent/kWh.
We should note that conservation efforts that lower the peak demand (for example high efficiency
commercial lighting) are very valuable to the grid. However, conservation efforts that lower the
off-peak demand (for example shutting off lights in office buildings at night) is not helpful to the
grid because it makes the surplus base load generation problem worse. OSPE is not advocating
wasting electricity. We are just pointing out the complexity of the electrical grid and the
unintended consequences of some of our decisions. That is why careful engineering, economic
and environmental analysis is required before introducing new technology or initiating a major
change in direction.
Significant amounts of surplus base load generation will lower the capacity factors of the plants
that are dispatched and will create upward pressure on electricity rates.
Figure 10 and 11 on the next page demonstrate how LCOE changes with capacity factor changes
due to dispatching for solar, wind and nuclear generation with steam bypass. Figure 10 also
shows that if dispatching occurs, the LCOE for wind and solar generation rises very rapidly to
extremely high values because these sources have low capacity factors to begin with.

Wind and the Electrical Grid: Mitigating the Rise in Electricity Rates and Greenhouse Gas Emissions
Page 29 of 43
Figure 10
Comparison of Solar, Wind
and Nuclear (R2)
Figure 11
Comparison of Base Load Gas
and Nuclear (R2)
Even if wind and solar generation are a small fraction of capacity, these very large LCOE values
will impact electricity rates significantly. For illustration purposes, lets say energy demand rises
1% and we want to increase wind capacity by 1% of total grid energy demand to meet that
demand increase. Let us also assume that the current average energy price is 7 cents/kWh (close
to the average Ontario price in 2011). At an LCOE of 10 cents/kWh for wind energy that is fully
utilized at its 29% capacity factor, the rates would rise to 7.03 cents/kWh or about 0.4% for a rise
of 1% in wind capacity.
If we need to dispatch wind frequently because it does not produce the energy at the time it is
needed the rates would be affected more severely. At an LCOE of 20 cents/kWh (ie: if we use
only 50% of the wind energy), the rates would rise to about 7.13 cents/kWh or about 2% for a 1%
rise in wind capacity. The more we dispatch wind the greater the impact on rates. At an LCOE
of 60 cents/kWh (i.e.: if we use only about 15% of the wind energy) rates would rise to about
7.52 cents/kWh or about 7% for a 1% addition in wind capacity.
Gas fired plants have relatively low capital cots and high fuel costs. These plants do not consume
fuel for the foregone portion of production that is dispatched down. Consequently their LCOE
curves are less steep than for nuclear plants that have very low fueling costs but relatively high
capital costs. This can make gas-fired generation more economic than nuclear generation at low
capacity factors. This can be seen on the right side of Figure 11 on the previous page. This is
why we use nuclear plants for base load demand and gas-fired plants for peak load demand.
The case of back up service for wind generation is an interesting special situation. Lets look at the
Ontario grid in 2018 with 8,500 MW of nuclear generation operating at 85% capacity factor and
7,500 MW wind generation operating at 29% capacity factor. If say 50% of that wind generation
was surplus and needed nuclear generation to maneuver down to accommodate wind generation,
then the reduction in nuclear capacity factor to allow wind turbines to run would be about
(7500*0.5)/8500*29% = 13%. This means that accommodating 50% of surplus wind generation
would lower the nuclear generation capacity factor by about 13% from 85% to 72%.

Wind and the Electrical Grid: Mitigating the Rise in Electricity Rates and Greenhouse Gas Emissions
Page 30 of 43
Figure 11 above shows the comparison of LCOE for base load gas and nuclear generation when
they are dispatched. For a reduction of 13% in capacity factor nuclear plants are competitive with
base load gas-fired plants if fuel costs are above $8 per million BTU. Currently the spot price for
natural gas in Canada is below $3 per million BTU ($4 per million BTU delivered to the burner
face). In Europe it is about $12 excluding delivery charges and in Japan it is about $16 excluding
delivery charges. Long-term contracts for natural gas will be at a higher price. The authors of
this document did not have access to the actual prices paid by Ontario plants for their natural gas
so this document uses spot prices.
As additional liquefied natural gas transportation capability is developed, the North American
natural gas price is expected to rise because gas will be diverted to European and Asian markets.
Also if carbon taxes or cap and trade are introduced to limit GHG emissions, nuclear generation
will become even more cost effective.
The extent to which the government wants to reduce GHG emissions is a matter of public policy
and economics. Decisions on the supply mix related to how much natural gas, renewable or
nuclear energy should be installed to achieve GHG emission reductions has significant cost
implications for electricity rates in Ontario. There has not been a transparent planning process to
determine if the current supply mix is in fact optimal from a cost point of view for both the
present and future projections of fuel prices. This is important because electricity prices have a
major impact on the ability of our industrial companies to compete in world markets. The
projected trends in electricity rates also impact investment decisions on which jurisdiction a
company will choose to expand production.
6. Greenhouse Gas Emissions
One of Ontario’s objectives to use renewable energy is to reduce greenhouse gas emissions. Coal
fired generation emits about 973 g/kWh of carbon dioxide and gas-fired generation emits about
398 g/kWh (R27). Biomass, hydraulic, wind, solar and nuclear generating plants are all zero
GHG sources of energy. The overall mix of generation technologies in Ontario resulted in a
weighted average of about 134 g/kWh of carbon dioxide emissions for electricity production in
2010 (see Table 5 on the next page).
One way to reduce GHG emissions is to use a zero GHG emitting biomass energy source to back
up wind and solar generation. However, the sustainable quantity of biomass in Ontario is limited.
Sustainable biomass is the non-usable waste product from various biomass sectors. Therefore
only a small portion of the 7,500 MW of wind generation and 2,400 MW of solar generation can
be backed up by biomass generation. It would be helpful if the Ontario Ministry of Energy would
quantify the recoverable annual amount of renewable biomass and in which locations that
biomass would be available.
Another way to reduce GHG emissions is to use nuclear generation to back up wind and solar
generation. However, nuclear plants would need a robust steam bypass system to allow the
generator to maneuver its electrical output at the speed required by wind generation variability.
We are not recommending that reactor power maneuvering be considered at this time. There
would be a number of potential technical and licensing issues that would need to be studied and
resolved prior to maneuvering the reactor itself on a continuous basis. However, we believe that
once steam bypass operations begin, opportunity to sell surplus steam energy and/or reduce
wasted nuclear fuel consumption will drive innovation. Industrial steam loads will be found to

Wind and the Electrical Grid: Mitigating the Rise in Electricity Rates and Greenhouse Gas Emissions
Page 31 of 43
make use of the surplus steam, as Ontario Hydro did at the Bruce A site in the 1970s and 1980’s
when some electrical capacity was boxed in at the site due to transmission limitations. We can
also expect R&D efforts to find ways to safely maneuver the reactor power to reduce nuclear fuel
consumption if all the surplus steam is not required.
Table 5
CO2 Emissions from Generating Stations
Generating
Station Type
CO2
Emissions
(g/kWh)
(R27)
Ontario
Energy
Prod’n in
2010 (R9)
CO2
Emissions
(g/kWh)
(R27)
Ontario
Energy
Prod’n in
2030 (R5)
Nuclear 0 55% 0 53%
Natural Gas 398 14% 398 8%
Hydraulic 0 20% 0 23%
Coal 973 8% 973 0%
Wind 0 2% 0 12%
Solar 0 0% 0 2%
Bio-energy 0 1% 0 2%
Weighted Aver. 134 100% 32 100%
Note: The data for natural gas is for an average 45% cycle efficiency. The data
for coal is for an average 35% cycle efficiency. Bioenergy is considered neutral
with respect to CO2 emissions.
Nuclear energy is currently the only large scale, zero GHG emitting source of electricity in
Ontario that is not limited by geography or weather. Nuclear energy has helped Ontario reduce
its GHG emissions safely and competitively for over 4 decades. CANDU reactors have a unique
Canadian design with an excellent safety record. They can fuel with Uranium or Thorium.
Nuclear energy can provide us decades if not centuries of time to find ways to generate more of
our energy needs from affordable renewable sources or perhaps nuclear fusion at some point in
the future.
Spent nuclear fuel continues to be a major concern to the public. The Nuclear Waste
Management Organization has developed a technical solution for long-term secure storage called
Adaptive Phased Management (R51). Public acceptance of that solution will go a long way to
removing a major barrier to the wider use of nuclear energy.
For discussion purposes, lets suppose we decided to abandon our nuclear program. We could
increase our wind and solar generation capacities. However, in order to avoid building very
expensive seasonal storage the proportions of wind and solar relative to gas need to be kept
within the gas-fired plants’ capacity to load maneuver and provide the required backup. A
detailed study would need to be performed to arrive at accurate values. For our purposes lets
assume we could manage wind and solar intermittency if the ratio of gas-fired to wind plus solar
generating capacity was at least 2:1. Also we will keep the ratio of wind turbines to solar PV at
6:1 because solar energy is much more costly than wind energy.
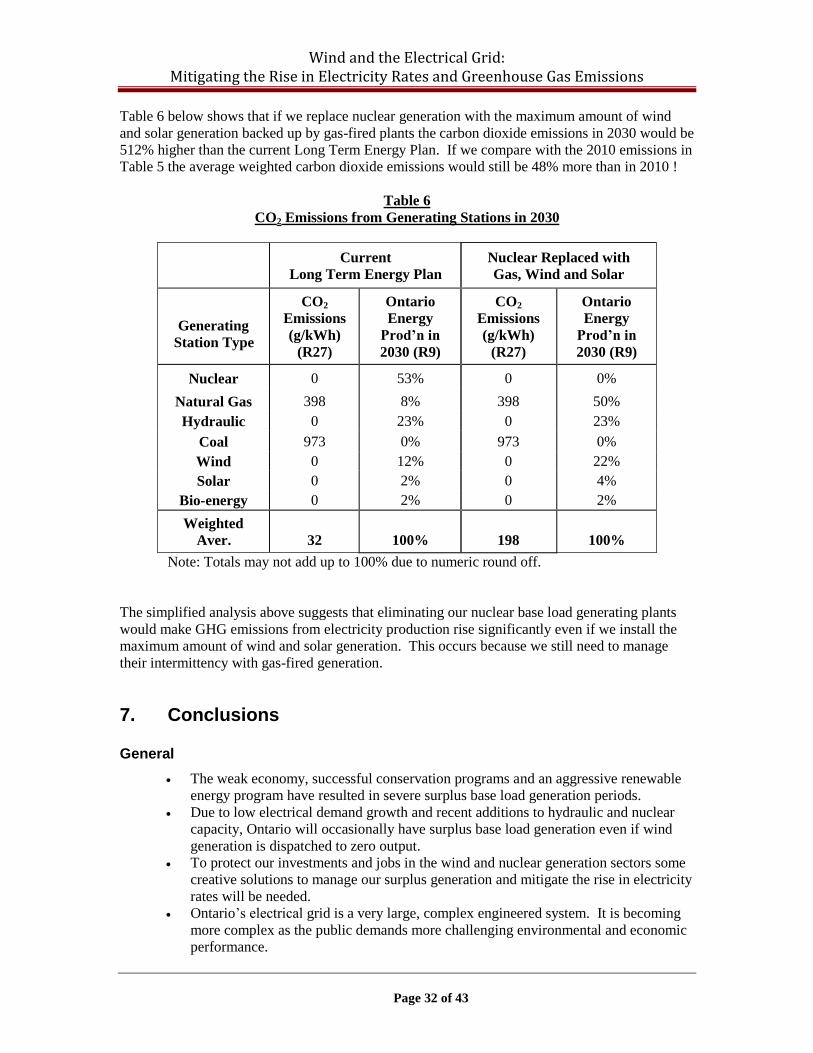
Wind and the Electrical Grid: Mitigating the Rise in Electricity Rates and Greenhouse Gas Emissions
Page 32 of 43
Table 6 below shows that if we replace nuclear generation with the maximum amount of wind
and solar generation backed up by gas-fired plants the carbon dioxide emissions in 2030 would be
512% higher than the current Long Term Energy Plan. If we compare with the 2010 emissions in
Table 5 the average weighted carbon dioxide emissions would still be 48% more than in 2010 !
Table 6
CO2 Emissions from Generating Stations in 2030
Current
Long Term Energy Plan
Nuclear Replaced with
Gas, Wind and Solar
Generating
Station Type
CO2
Emissions
(g/kWh)
(R27)
Ontario
Energy
Prod’n in
2030 (R9)
CO2
Emissions
(g/kWh)
(R27)
Ontario
Energy
Prod’n in
2030 (R9)
Nuclear 0 53% 0 0%
Natural Gas 398 8% 398 50%
Hydraulic 0 23% 0 23%
Coal 973 0% 973 0%
Wind 0 12% 0 22%
Solar 0 2% 0 4%
Bio-energy 0 2% 0 2%
Weighted
Aver. 32 100% 198 100%
Note: Totals may not add up to 100% due to numeric round off.
The simplified analysis above suggests that eliminating our nuclear base load generating plants
would make GHG emissions from electricity production rise significantly even if we install the
maximum amount of wind and solar generation. This occurs because we still need to manage
their intermittency with gas-fired generation.
7. Conclusions
General
The weak economy, successful conservation programs and an aggressive renewable
energy program have resulted in severe surplus base load generation periods.
Due to low electrical demand growth and recent additions to hydraulic and nuclear
capacity, Ontario will occasionally have surplus base load generation even if wind
generation is dispatched to zero output.
To protect our investments and jobs in the wind and nuclear generation sectors some
creative solutions to manage our surplus generation and mitigate the rise in electricity
rates will be needed.
Ontario’s electrical grid is a very large, complex engineered system. It is becoming
more complex as the public demands more challenging environmental and economic
performance.

Wind and the Electrical Grid: Mitigating the Rise in Electricity Rates and Greenhouse Gas Emissions
Page 33 of 43
Effective design and operation of the grid requires specialized power engineering
knowledge and experience with Ontario’s grid and its market design.
Every energy source has its advantages and disadvantages and each can have a
legitimate role to play provided they are properly integrated.
Wind generation is not properly integrated into the grid resources given the reduced
demand for electricity.
Wind generation can be environmentally benign if deployed in a manner that
addresses local residents’ health and safety concerns. It can easily be distributed
geographically and it has very low operating costs.
Ontario’s existing CANDU reactors have limited maneuvering capability so they are
not able to accommodate the variability of wind generation.
Wind generation has a low capacity factor and its production characteristics do not
match well with consumers’ electrical demand. This makes it one of the more
technically difficult and economically costly energy sources to integrate into
Ontario’s grid.
Adding base load generation like wind, hydraulic and nuclear generation when the
grid has large amounts of surplus base load generation will drive up electricity rates.
Electricity rates are being driven to large negative values during periods of severe
surplus base load generation because of the market design in combination with the
present prohibition on dispatching wind generation and the limited amount of nuclear
maneuvering capability.
The severe surplus base load generation is getting worse.
We need to manage the severe surplus base load generation before we start to have a
significant number of costly nuclear unit shutdowns.
The IESO is in the process of implementing wind, solar and nuclear dispatching that
will eliminate severe surplus base load generation.
The IESO is in the process of implementing floor prices on energy supply bids so that
the market auction will result in acceptable economic and environmental outcomes.
Floor process will ensure nuclear shutdowns are minimized but not necessarily
eliminated.
Without a robust steam bypass system, nuclear dispatching will result in nuclear
shutdowns.
Nuclear shutdowns will drive up electricity costs and will raise GHG emissions.
A sudden halt in construction of wind turbines will likely cause a collapse of this new
industrial sector.
Phasing out nuclear energy by cancelling the Darlington New Build and reactor
refurbishment programs will raise GHG emissions significantly because of the need
to use gas-fired generation to manage wind and solar energy intermittency and to
replace the nuclear capacity.
Root Causes of the Growing Surplus Base Load Generation
The economic recession in 2008-09 and the slow economic recovery have resulted in a
much lower demand that originally planned. Consequently the planned generation
additions that are coming into service are making the surplus base load generation
problem worse.
When the Green Energy Act was enacted it incorporated policy initiatives used in other
jurisdictions that appeared to be working well (ie: adding wind and solar generation
without self-contained storage).
The Green Energy Act made wind generation without self-contained storage highly
attractive to investors by paying a premium price and making access to the grid easy.

Wind and the Electrical Grid: Mitigating the Rise in Electricity Rates and Greenhouse Gas Emissions
Page 34 of 43
Hydraulic and nuclear plants provide 75% of Ontario’s electrical energy. Existing
CANDU nuclear plants have limited maneuvering capability. Hydraulic plants have
limited storage.
Ontario’s grid has insufficient daily and seasonal storage capability to manage wind
generation’s intermittency and seasonality.
During surplus base load generation periods, wind generation without storage displaces
energy from existing zero GHG emitting hydraulic and nuclear generating plants.
Opportunities to Improve Grid Performance
Adding a 30-40% air-cooled steam bypass system on the roof of the Bruce A units would
restore these reactors’ full power load rejection and grid blackout recovery capability.
Improving the existing turbine condenser steam bypass systems or adding an air-cooled
steam bypass system on the roof of the existing reactors would eliminate surplus base
load generation and forced nuclear unit shutdowns.
Using nuclear generation to backup the variability of wind generation is uniquely
available to Ontario because it will soon have large amounts of both nuclear and wind
generation on its grid. Ontario’s nuclear generation capacity is sufficient to manage
all of the nearly 7,500 MW of intermittent wind generation planned for 2018.
The benefits of using nuclear units to provide backup for wind generation would be:
A near zero GHG emission IESO managed grid,
No additional transmission lines would be required,
No global warming penalties for our industrial production in the future for
electricity that comes from zero GHG emitting energy sources,
Industrial process steam would be available near our nuclear plants with a
zero GHG footprint,
Reduced natural gas demand competition between electricity production and
other sectors (e.g.: cooking, space and industrial heating, plastics, chemicals,
fertilizers and the transportation sectors),
As the economics improve with R&D or changing carbon tax policy, the
surplus electrical power could be used directly to produce hydrogen for the
industrial or transportation sector, and
Once built a nuclear plant has approximately 1/5 to 1/10 the fueling cost of a
gas-fired plant so future electrical energy prices will be less sensitive to fuel
price increases.
Electrical Grid Planning
The intermittent nature of wind generation requires that it be explicitly and effectively
integrated into the existing grid.
While social, economic, environmental and political goals can be included as
requirements, the actual design and operation of the electrical grid must be based on
established power engineering principles so that mandatory technical performance
requirements will be met.
The present grid operating problems related to wind integration demonstrates that
additional engineering studies and Ontario specific power engineering expertise are
required for implementation planning for wind generation.
Ontario’s electrical grid suffers from:
too little customer demand at night and on weekends in combination with,
too much intermittent wind generation, or
too little nuclear maneuvering, or
too little storage capacity.
Wind and the Electrical Grid: Mitigating the Rise in Electricity Rates and Greenhouse Gas Emissions
Page 35 of 43
The present electricity market price instability during surplus base load generation
periods will get worse if wind generation is not effectively integrated.
The large increase of wind generation capacity (7,500 MW by the end of 2018), while
well intentioned, ignores the performance challenges wind generation places on
existing base load hydraulic and nuclear generation facilities. The existing facilities
have not been designed to cope with the new maneuvering demands imposed by wind
generation. The existing base load facilities need to be modified to better integrate
with wind generation or substantial seasonal storage capacity needs to be added to the
grid or wind generation needs to be dispatched down.
A reduction in the capacity targets for installed wind generation would help but most of
the planned capacity has already been approved.
Current IESO plans to dispatch wind will help to alleviate the technical performance
problems. However, dispatching wind generation frequently, in the absence of other
planning and control actions, will drive up the levelized cost of wind generation.
There is a growing backlog of FIT applications for solar generation. If even half of these
applications get approved, we could see surplus peak load generation (SPG) periods in
Ontario for the first time during the spring and autumn. Dispatching solar will resolve
the SPG problem but it will also drive up the levelized cost of solar and retail
electricity rates.
Some Surprises
Ontario’s grid energy supply was already about 75% free of GHG emissions using
hydraulic and nuclear plants, before the Green Energy Act was enacted.
As wind production increases, GHG emissions will increase for the base load component
of electrical power production in Ontario. This will occur because the gas-fired
backup generation required to support wind generation will begin to occupy a larger
share of base load generation. Also, if the load demand does not grow, the wind and
gas-fired backup generation will force nuclear generation off the grid unless wind
generation is dispatched down.
The shutdown of nuclear generation during severe surplus base load generation periods
can result in energy shortfalls the following 2 or 3 days. This will necessitate running
higher fuel cost gas-fired plants to make up the shortfall or importing relatively
expensive power from neighbouring grids. This will drive up electricity rates and
GHG emissions.
Strong winds during low customer demand periods create severe surplus base load
generation conditions.
Ontario consumers subsidize surplus energy sales at negative electricity prices to
consumers in Quebec, New York and Michigan via the global adjustment mechanism.
The public believes that wind generation is replacing coal-fired generation in Ontario.
Because coal is a peak load supply and wind is a base load supply, most of the coal
generation is actually being replaced by gas-fired generation that has 50% of the GHG
emissions of coal.
OPG has a different contractual arrangement with OPG for regulated nuclear and
hydraulic generation compared to private generators. OPG is not compensated if it
bypasses steam at its nuclear plants when it gets dispatched down, but Bruce Power
that leases the Bruce B plant from OPG does get paid. Because OPG gets paid more
for nuclear power than for hydraulic power it is more economic for OPG to spill
hydraulic energy, for example at Niagara Falls, rather than modify its Darlington
reactors to be able to reduce their electrical output. Bruce Power, on the other hand,
has improved its Bruce B steam bypass system and can offer some limited

Wind and the Electrical Grid: Mitigating the Rise in Electricity Rates and Greenhouse Gas Emissions
Page 36 of 43
maneuvering to the IESO when severe surplus base load generation conditions are
present.
Present OPA and OEFC contracts for electricity production do not incent producers to
reduce power output when the grid is in a surplus base load generation condition.
There does not appear to be any entity other than the Ministry itself that has overall
planning ownership of the electrical grid. Ministerial Directives are being used
instead of a more rigorous and transparent planning process to establish the supply
mix and long-term energy plans.
Wholesale market prices are significantly lower than the total cost of power production in
Ontario. Therefore our exported energy should attract a higher price if it was sold as
firm long-term power instead of through the real time (spot) wholesale market.
8. Recommendations
The recommendations have been divided into two groupings, those that can be implemented
immediately and those that require more time to carry out detailed studies, analysis and
engineering changes to the facilities.
OSPE believes the Minister of Energy should implement the following recommendations as soon
as practicable:
1) Modify market rules so that all significant generation resources including wind, solar
and nuclear generation will be subject to IESO dispatching.
2) Renegotiate existing OPA, OPG and OEFC generation contracts to ensure the capacity
and energy charges combined with electricity market design will align with the
economic and environmental needs of the public.
3) Authorize OPG to contract with entities outside of Ontario for the sale of its
dependable (firm) GHG-free electricity that is surplus to Ontario’s needs.
4) Authorize OPA to adjust the FIT rates and establish annual maximum capacity
additions in each category to an affordable level that will sustain the new green energy
sectors.
5) Authorize OPA to develop a program designed to better align demand to periods when
Ontario supply is available.
6) Assign OPA the overall responsibility of meeting the public’s expectations for
electrical grid reliability, cost and environmental performance without the need for
Ministerial Directives.
7) Establish guidelines for the Ministry of Energy and its related agencies that will ensure
appropriate engineering expertise is included during the development of policies,
directives and implementation plans of technically complex programs and projects.
8) Maintain the planned nuclear refurbishment program because it promises to deliver the
lowest and most stable electrical rates of any energy source with zero GHG emissions.
9) Maintain the planned nuclear new build at Darlington so that GHG emissions can be
kept low in the longer term. Include improved reactor maneuvering or a more robust
steam bypass system in the technical specifications so that the new reactors do not
contribute to surplus base load generation.
In the longer term, the OPA should undertake detailed studies to:
1) Determine if the dispatching capability of existing nuclear plants can be improved
economically either through reactor maneuvering or by using a steam bypass system.

Wind and the Electrical Grid: Mitigating the Rise in Electricity Rates and Greenhouse Gas Emissions
Page 37 of 43
2) Determine if additional daily and seasonal storage capacity can be economically added
or purchased from adjoining grids (eg: Quebec).
3) Determine if surplus electrical energy can be used economically for new applications
such as hydrogen production.
4) Determine if alternate TOU rate structures or other incentives with smart grid
capability can be used economically to encourage demand shifting from peak to off-
peak periods.
5) Determine whether a common transparent process can be used for OPG, OEFC and
OPA contracts for energy supply.
6) Determine the extent of the surplus base load generation problem over the same
planning horizon as the Long Term Energy Plan (LTEP) and make those findings
public as part of the Integrated Power System Plan (IPSP).
7) Determine the long-term sustainable volume of biomass available (bio-mass from
waste) in Ontario that can provide zero GHG backup generation for our intermittent
renewables fleet.
8) Determine if it is economically feasible to restore the Bruce A full power load rejection
and grid restoration capability and to provide some nuclear dispatching capability to
help eliminate surplus base load generation.
9) Determine if it is economically feasible to use nuclear plants to backup wind generation
and further reduce GHG emissions.
10) Determine if there is direct linkage between wind turbine noise and public reports of
adverse health effects. The dispatching of wind turbines beginning in 2014 may
provide an opportunity to shutdown an entire wind farm and conduct a study.
9. Abbreviations
The following abbreviations have been used in this document:
AGC – Automatic Generation Control
ASME – American Society of Mechanical Engineers
CCGT – Combined Cycle Gas Turbine
CHP – Combined Heat and Power
CSPE – Canadian Society of Professional Engineers
DOE – US Department of Energy
EIA – Energy Information Administration, USA
ETF – OSPE’s Energy Task Force
FIT – Feed in Tariff
GHG – Greenhouse Gases
HOEP – Hourly Ontario Energy Price (wholesale market)
IEA – International Energy Agency
IESO – Independent Electricity System Operator
IPSP – Integrated Power System Plan
LCC – Life Cycle Costing
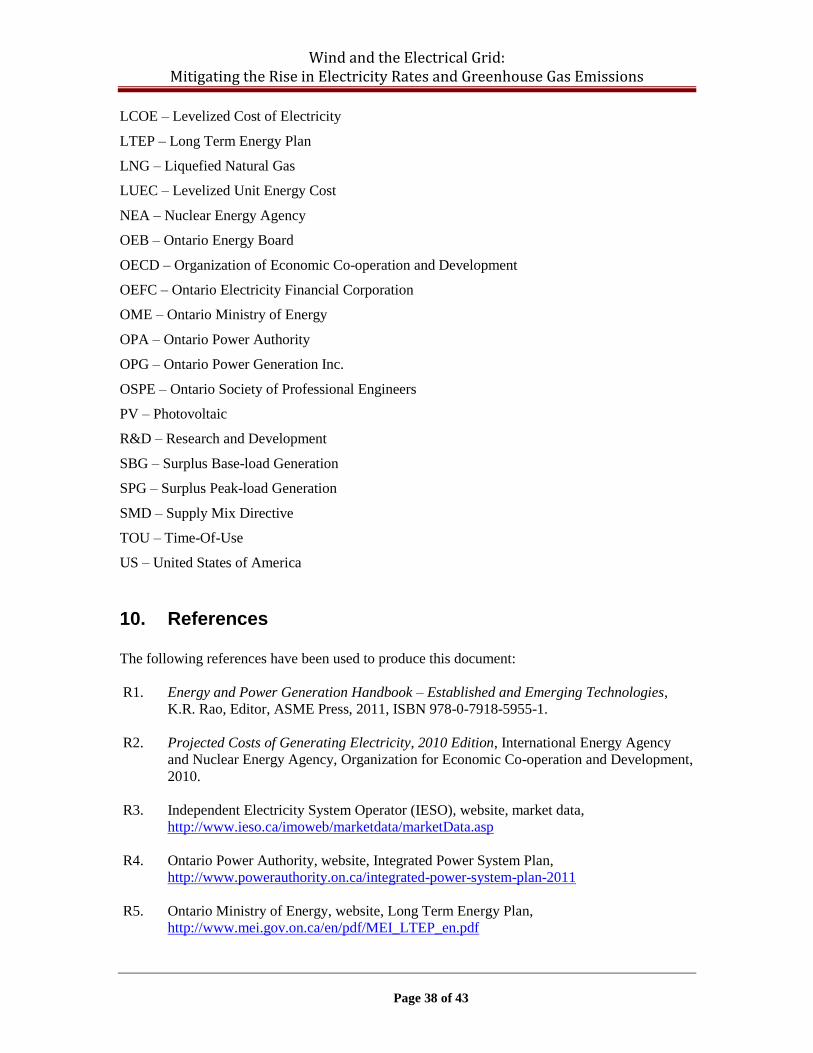
Wind and the Electrical Grid: Mitigating the Rise in Electricity Rates and Greenhouse Gas Emissions
Page 38 of 43
LCOE – Levelized Cost of Electricity
LTEP – Long Term Energy Plan
LNG – Liquefied Natural Gas
LUEC – Levelized Unit Energy Cost
NEA – Nuclear Energy Agency
OEB – Ontario Energy Board
OECD – Organization of Economic Co-operation and Development
OEFC – Ontario Electricity Financial Corporation
OME – Ontario Ministry of Energy
OPA – Ontario Power Authority
OPG – Ontario Power Generation Inc.
OSPE – Ontario Society of Professional Engineers
PV – Photovoltaic
R&D – Research and Development
SBG – Surplus Base-load Generation
SPG – Surplus Peak-load Generation
SMD – Supply Mix Directive
TOU – Time-Of-Use
US – United States of America
10. References
The following references have been used to produce this document:
R1. Energy and Power Generation Handbook – Established and Emerging Technologies,
K.R. Rao, Editor, ASME Press, 2011, ISBN 978-0-7918-5955-1.
R2. Projected Costs of Generating Electricity, 2010 Edition, International Energy Agency
and Nuclear Energy Agency, Organization for Economic Co-operation and Development,
2010.
R3. Independent Electricity System Operator (IESO), website, market data,
http://www.ieso.ca/imoweb/marketdata/marketData.asp
R4. Ontario Power Authority, website, Integrated Power System Plan,
http://www.powerauthority.on.ca/integrated-power-system-plan-2011
R5. Ontario Ministry of Energy, website, Long Term Energy Plan,
http://www.mei.gov.on.ca/en/pdf/MEI_LTEP_en.pdf
Wind and the Electrical Grid: Mitigating the Rise in Electricity Rates and Greenhouse Gas Emissions
Page 39 of 43
R6. Ontario Ministry of Energy/Ontario Power Authority, website, Supply Mix Directive,
http://www.powerauthority.on.ca/sites/default/files/new_files/IPSP%20directive%20201
10217.pdf
R7. Ontario Ministry of Energy, website, Coal Phase Out Plan,
http://news.ontario.ca/mei/en/2009/09/ontarios-coal-phase-out-plan.html
R8. Independent Electricity System Operator (IESO), website, map of wind facilities,
http://www.ieso.ca/imoweb/siteshared/images/wind_generation_in_Ontario.pdf
R9. Independent Electricity System Operator (IESO), website, supply overview,
http://www.ieso.ca/imoweb/media/md_supply.asp
R10. Independent Electricity System Operator (IESO), website, demand overview,
http://www.ieso.ca/imoweb/media/md_demand.asp
R11. Independent Electricity System Operator (IESO), website, control center photo used on
the cover of this report, http://www.ieso.ca/imoweb/media/images/controlRoom2_xl.jpg
R12. Environment Canada, website, average wind speed maps,
http://collaboration.cmc.ec.gc.ca/science/arma/climatology/speed_avg/
R13. Canadian Wind Energy Association, website, media reports and photos,
http://www.canwea.ca/media/index_e.php
R14. ClearSky Advisors Inc., website, Economic Impacts of the Solar PV Sector in Ontario
2008-2018, July, 2011,
http://www.cansia.ca/sites/default/files/economic_impacts_of_solar.pdf
R15. ClearSky Advisors Inc., website, The Economic Impacts of the Wind Sector in Ontario
2011 – 2018, May 27, 2011, http://www.awawindprojects.com/wp-
content/uploads/2011/06/economic_impacts_wind_energy_ontario2011-2018.pdf
R16. Independent Electricity System Operator (IESO), website, 18 Month Outlook, May 24,
2011, http://www.ieso.ca/imoweb/pubs/marketReports/18MonthOutlook_2011may.pdf
R17. Toronto Board of Trade presentation entitled “CANDU Energy Inc: The Closing and the
Future”, by Patrick Lamarre, CANDU Energy Inc., October 27, 2011.
R18. Independent Electricity System Operator (IESO), website, SE-91 Renewable Integration,
http://www.ieso.ca/imoweb/consult/consult_se91-DTWG.asp
R19. Independent Electricity System Operator (IESO), website, 2009 State of the Market
Report, ISO/RTO Council, http://ieso.ca/imoweb/pubs/irc/IRC-
State_of_Markets_Report-2009.pdf
R20. Independent Electricity System Operator (IESO), website, how the market wholesale
price is determined, http://ieso.ca/imoweb/siteShared/wholesale_price.asp?sid=md
R21. Independent Electricity System Operator (IESO), website, average price of electricity,
http://ieso.ca/imoweb/siteShared/electricity_bill.asp?sid=md

Wind and the Electrical Grid: Mitigating the Rise in Electricity Rates and Greenhouse Gas Emissions
Page 40 of 43
R22. Independent Electricity System Operator (IESO), website, Ontario Transmission System,
May 24, 2011, import/export capability,
http://www.ieso.ca/imoweb/pubs/marketReports/OntTxSystem_2011may.pdf
R23. Independent Electricity System Operator (IESO), website, 18 Month Outlook, Aug 24,
2011, http://www.ieso.ca/imoweb/pubs/marketReports/18MonthOutlook_2011aug.pdf
R24. Ontario Power Authority, website, A Progress Report on Electricity Supply, Q2 2011,
http://www.powerauthority.on.ca/sites/default/files/Q2-
2011%20Quarterly%20Report.pdf
R25. Independent Electricity System Operator (IESO), website, SE-91 Renewable Integration
Final Design Principles, http://www.ieso.ca/imoweb/pubs/consult/se91/se91-20110309-
Final_Design_Principles.pdf
R26. US Energy Information Administration, website, Annual Energy Outlook 2011, levelized
cost of new generation in 2016, http://www.eia.gov/oiaf/aeo/electricity_generation.html
R27. Natural Resources Canada, website, RETScreen Clean Energy Project Analysis Software,
http://canmetenergy-canmetenergie.nrcan-rncan.gc.ca/eng/software_tools/retscreen.html
R28. “Ontario Electrical Grid and Project Requirements for Nuclear Plants”, March 8, 2011,
OSPE submission to The Honourable Brad Duguid, Minister of Energy,
http://www.ospe.on.ca/resource/resmgr/doc_advocacy/2011_sub_8mar_nuclear.pdf
R29. “Time of Use Rates: Let’s Use Smart Meters in a Smart Way!”, March 9, 2011, OSPE
submission to the Ontario Energy Board, EB-2010-0364,
http://www.ospe.on.ca/resource/resmgr/doc_advocacy/2011_sub_9mar_tou.pdf
R30. “2011 IPSP Consultation Submission”, June 13, 2011, submission to the OPA,
http://www.ospe.on.ca/resource/resmgr/doc_advocacy/2011_sub_13jun_opa.pdf
R31. Independent Electricity System Operator (IESO), website, Ontario Blackout Restoration
Plan, http://www.ieso.ca/imoweb/pubs/systemOps/so_OntPowerSysRestorePlan.pdf
R32. Independent Electricity System Operator (IESO), website, Resource and Transmission
Assessment Criteria,
http://www.ieso.ca/imoweb/pubs/marketadmin/imo_req_0041_transmissionassessmentcri
teria.pdf
R33. Ontario Power Generation, website, converting existing coal-fired plants to biomass,
http://www.opg.com/power/thermal/repowering/
R34. Ontario Energy Board, website, Market Surveillance Panel Report – Nov 2010/Apr 2011,
http://www.ontarioenergyboard.ca/OEB/_Documents/MSP/MSP_Report_20111116.pdf
R35. Auditor General of Ontario website, 2011 Annual Report,
http://www.auditor.on.ca/en/reports_en/en11/303en11.pdf
Wind and the Electrical Grid: Mitigating the Rise in Electricity Rates and Greenhouse Gas Emissions
Page 41 of 43
R36. Independent Electricity System Operator (IESO), website, wind power generation,
http://www.ieso.ca/imoweb/siteShared/windtracker.asp?sid=md
R37. Natural Resources Canada (NRCan), website, renewable energy demonstration projects,
http://www.nrcan.gc.ca/energy/science/programs-funding/1514
R38. Energy Density in Fuels, Wikipedia website, http://en.wikipedia.org/wiki/Energy_density
R39. Ontario's CANDUs can be more flexible than gas-fired generation and hydro generation,
Don Jones, P. Eng., Dec 2011, http://atomicinsights.com/2011/12/ontarios-candus-can-
be-more-flexible-than-natural-gas-and-hydro.html
R40. Independent Electricity System Operator (IESO), website, Stakeholder Engagement-91
Renewables Integration, FPFG presentation, January 24, 2012,
http://ieso.ca/imoweb/pubs/consult/se91/se91-20120124-
FPFG_FeedbackResponsesAnalysis.pdf
R41. Natural Resources Canada, CANMET Energy Technology Centre, Integration of Storage
in Electrical Distribution Systems and its Impact on the Depth of Penetration of DG, M.
Graovac, et.al., University of Toronto, May 23, 2008,
http://198.103.48.154/fichier.php/codectec/En/2009-174/2009-174_RP-TEC_411-
IMPACT_Graovac_Wang_Iravani_e.pdf
R42. US Dept of Energy, Annual Energy Outlook 2011 with Projections to 2035, DOE/EIA-
0383(2011), April 2011, http://www.eia.gov/forecasts/archive/aeo11/
R43. Ontario Society of Professional Engineers, website, 2011 FIT Program Review
submission to the Ministry of Energy,
http://www.ospe.on.ca/resource/resmgr/doc_advocacy/2011_sub_14dec_fit.pdf
R44. Ontario Society of Professional Engineers, website, Wind and the Electrical Grid report
issued for public comment, December 13, 2011,
http://www.ospe.on.ca/resource/resmgr/doc_advocacy/2011_draft_13dec_windelectri.pdf
R45. Ontario Government, website, Green Energy and Green Economy Act 2009,
http://www.e-laws.gov.on.ca/html/source/statutes/english/2009/elaws_src_s09012_e.htm
R46. Ontario Waterpower Association, website, Ontario’s Water Potential October 2005,
http://www.owa.ca/assets/files/links/Waterpower_Potential_Nov2005.pdf
R47. Ontario Government, website, Public Services for Ontarians: A Path to Sustainability
and Excellence, http://www.fin.gov.on.ca/en/reformcommission/index.html
R48. Government of Ontario, website, Number of Passenger Vehicles in Ontario,
http://www.mto.gov.on.ca/english/safety/orsar/orsar03/chp5_03.shtml
R49. National Renewable Energy Laboratory, website, Demonstration project – wind energy to
hydrogen storage, http://www.nrel.gov/hydrogen/proj_wind_hydrogen.html
R50. Hydrogen production using the steam reforming process, Wikipedia website,
http://en.wikipedia.org/wiki/Hydrogen_production
Wind and the Electrical Grid: Mitigating the Rise in Electricity Rates and Greenhouse Gas Emissions
Page 42 of 43
R51. Nuclear Waste Management Organization, website, Adaptive Phased Management of
nuclear spent fuel, http://www.nwmo.ca/implementationplan
R52. W.K.G. Palmer, Wind Turbine Noise - Clues to the Mystery of Why People are Hurting,
May 23, 2011, http://www.acoustics.org/press/161st/Palmer.html
R53. Electric Storage Association, website, Costs of various storage technologies,
http://www.electricitystorage.org/technology/storage_technologies/technology_comparis
on
R54. Ontario Power Authority, website, FIT and micro-FIT program reports,
http://fit.powerauthority.on.ca/bi-weekly-fit-and-microfit-program-reports
R55. Independent Electricity System Operator (IESO), website, 18 Month Outlook, Feb 24,
2012, http://ieso.ca/imoweb/pubs/marketReports/18MonthOutlook_2012feb.pdf
R56. US Environmental Protection Agency, Greenhouse gas potency of methane (natural gas),
http://www.epa.gov/outreach/scientific.html
11. Acknowledgements
OSPE is grateful to the following individuals who provided comments on the draft version of this
document:
Stakeholders
Rick Jennings, Assistant Deputy Minister, Energy Supply, Transmission and Distribution
Division, Ministry of Energy and Infrastructure
Serge Dupont, Deputy Minister, Ministry of Natural Resources, Canada
Bruce Campbell, Vice-President, Resource Integration, et. al., Independent Electricity
System Operator
Amir Shalaby, Vice-President, Power System Planning, et. al., Ontario Power Authority
Bruce Boland, Senior Vice President, Corporate Affairs, Ontario Power Generation
Laura Cooke, Vice President, Corporate Affairs, Hydro One Inc.
Tom Levy, Manager of Technical and Utility Affairs, Canadian Wind Energy
Association
John Stewart, Director of Policy and Research, Canadian Nuclear Association
Dr. Michael Binder, President and CEO, Canadian Nuclear Safety Commission
OSPE Members and Other Individuals
Norman Askew Eugene Hlynka Christopher Reddick
Tony Bonney Don Jones James Richardson
Hendrik Borgdorff Roger Jones Joe Rosen
Ryan Boudreau Fredrik Kallin Larry Rousse

Wind and the Electrical Grid: Mitigating the Rise in Electricity Rates and Greenhouse Gas Emissions
Page 43 of 43
Jan Carr Mike Keshyk Allan Runstedtler
Jordan Chou Brent Kimberley Michael Sudbury
Renato DeTina Thomas Lavender George Stanford
Denver Dickie Bryan Lomenda Don Statham
Larry Drebert Bob Morrison Gary Thomas
Robert Dyck Livio Nichilo Wayne Todd
Ross Eddie Andre d’Olembert Gregory Williams
Wilfred Ferwerda William Palmer Mark Zimny
Malcolm Hamilton Steve Pepper
Carl Hennum Dino Poretta
OSPE would also like to acknowledge the contributions made to this document by members of its
Energy Task Force. They include:
Paul Acchione, P. Eng., Chair
Michael Bilaniuk, P. Eng.
Peter DeVita, P. Eng.
Chris Cragg, P. Eng.
Michael Monette, P. Eng.
Marius Vartolomei, P. Eng.
Laszlo Zsidai, P. Eng.
Kristian A. Kennedy, OSPE Staff
Edwina McGroddy, OSPE Staff
Related Documents