Port and Logistics | Maritime Annual Report 2010 / Wilson Sons Limited

Wilson Sons Annual Report 2010
Jan 24, 2015
Wilson, Sons, Brazil, oil, gas, Institutional, Presentation, ports, tugboats, offshore, shipyard, shipping, agency, logistics
Welcome message from author
This document is posted to help you gain knowledge. Please leave a comment to let me know what you think about it! Share it to your friends and learn new things together.
Transcript

Port and Logistics | Maritime
Annual Report 2010 / Wilson Sons Limited
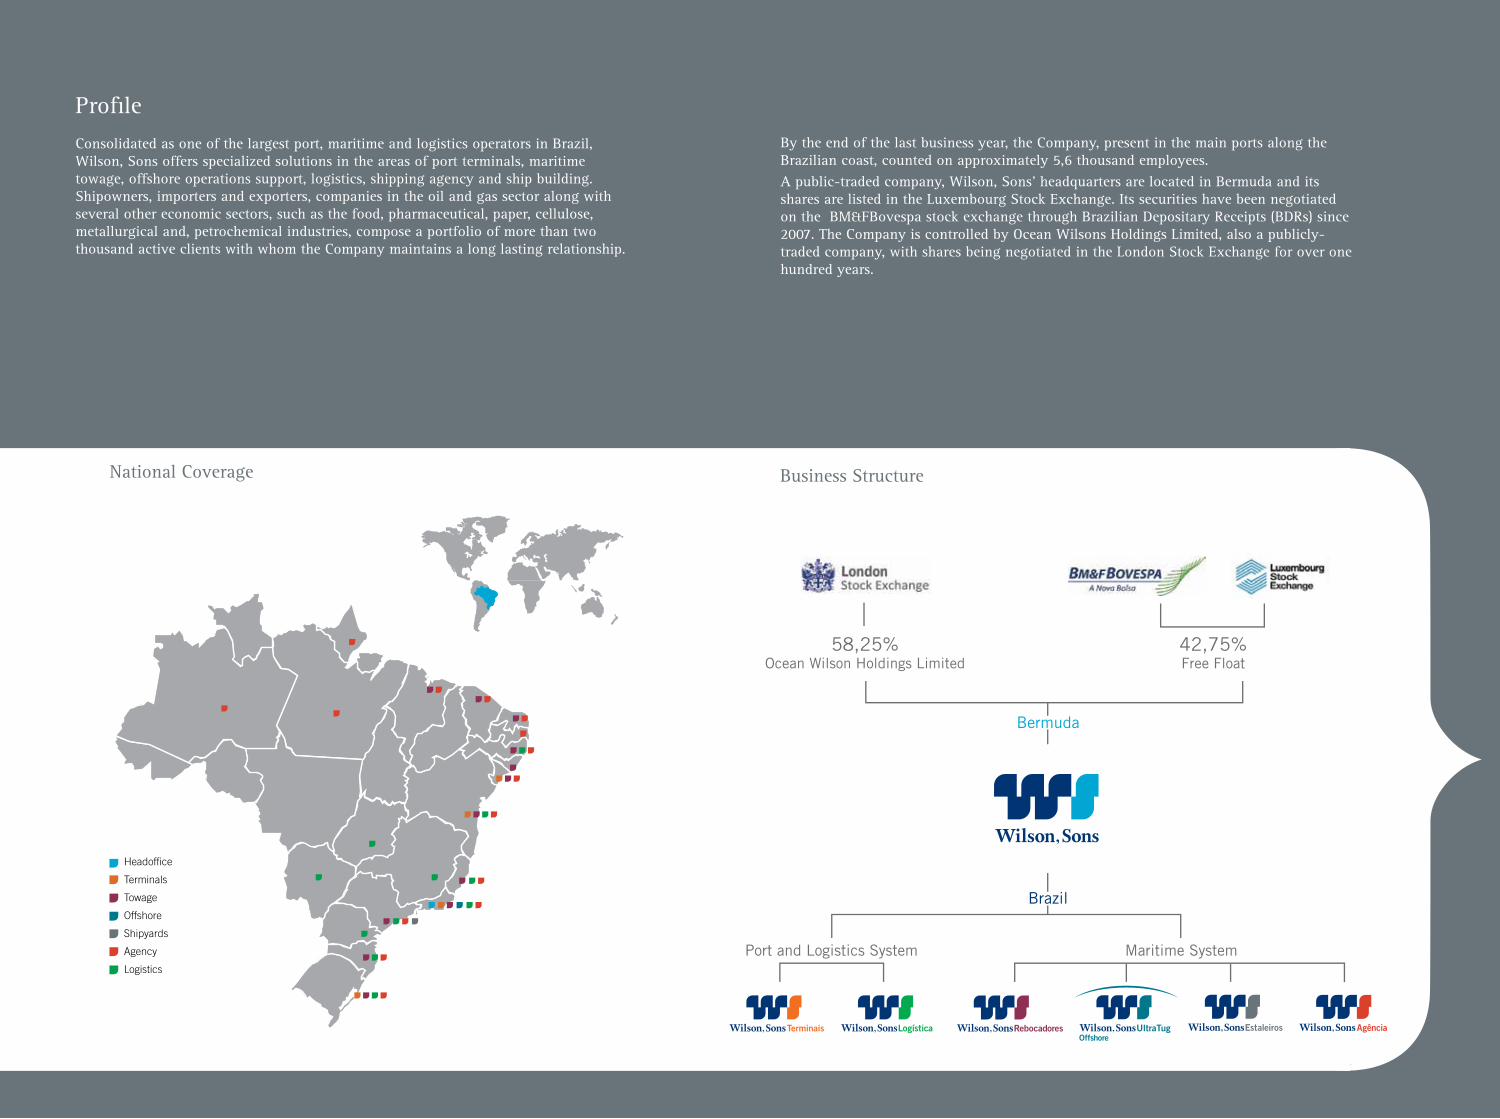
ProfileConsolidated as one of the largest port, maritime and logistics operators in Brazil, Wilson, Sons offers specialized solutions in the areas of port terminals, maritime towage, offshore operations support, logistics, shipping agency and ship building. Shipowners, importers and exporters, companies in the oil and gas sector along with several other economic sectors, such as the food, pharmaceutical, paper, cellulose, metallurgical and, petrochemical industries, compose a portfolio of more than two thousand active clients with whom the Company maintains a long lasting relationship.
National Coverage
Headoffice
Terminals
Towage
Offshore
Shipyards
Agency
Logistics
By the end of the last business year, the Company, present in the main ports along the Brazilian coast, counted on approximately 5,6 thousand employees.A public-traded company, Wilson, Sons’ headquarters are located in Bermuda and its shares are listed in the Luxembourg Stock Exchange. Its securities have been negotiated on the BM&FBovespa stock exchange through Brazilian Depositary Receipts (BDRs) since 2007. The Company is controlled by Ocean Wilsons Holdings Limited, also a publicly-traded company, with shares being negotiated in the London Stock Exchange for over one hundred years.
Business Structure
Brazil
Bermuda
Port and Logistics System Maritime System
Company Philosophy
Mission
Develop and provide high value-added solutions
for our clients in port, maritime and logistic activities,
in a sustainable and innovative way, while,
at the same time, valuing the career development
of our employees.
Vision
To be the first choice of our employees, clients,
and investors in port, maritime, and logistic
segments, growing in a bold, synergetic, and
sustainable way.
Principles
› fo tnempoleved reerac eht etalumits oT our employees by creating advancement opportunities, while recognizing their contribution, enthusiasm, and commitment to Wilson, Sons.
› yb noitcafsitas remotsuc eetnaraug oT delivering services with quality, reliability, efficiency, availability, and safety.
› snruter etauqeda sredloherahs ruo erussa oT on their invested capital, while stimulating continuous reinvestment in the Company’s businesses, for long-term growth.
› fo modeerf egaruocne ylsuounitnoc oT expression and provide incentives for creativity and the development of technology.
› sdradnats lacihte detpecca ot gnidrocca tca oT of behaviour, with respect to human life, the environment, culture, and the rule of law.
yhposolihP ynapmoC • Mission• Vision• Principles
Main indicatorsTimeline
PresentationMessage from the Chairman of the Board of DirectorsMessage from the CEO of Operations in Brazil
Business StructureCorporate GovernanceBusiness ManagementCorporate SustainabilityOperational Markets
Performance in 2010Management Discussion & Analysis – MD&AEquity MarketsValue-Added Statement
Years to comeInvestmentsPerspective
AttachmentFinancial StatementsGlossaryCorporate InformationCredits
0607
10162633
505758
6263
65
110111112
Table of Contents
Annual Report 2010 www.wilsonsons.com
3
Timeline
1837
19361869 1911 1966 20001997 2010
1870 1973 20071964 20031928 1999
Wilson, Sons & Company establishment in the city of Salvador (BA), with operations directed to rendering shipping agency services and the international coal trade.
Acquisition of Guarujá shipyard, marking the beginning of shipbuilding activities.
Participation in the most ambitious construction projects of the period such as the Brazilian Great Western Railroad (currently part of the Federal Railroad Network).
Activities in privatised port terminals begin by winning the bid for the container terminal of the port of Rio Grande – Tecon Rio Grande.
Constitution of Brasco, an offshore logistics company
Start of activities in the logistics segment with Wilson, Sons
Logistica. Acquisition of container terminal concession
in Salvador through a public auction.
Operation marked by the business strength. As well as trading in coal, the Company was involved in the most profitable businesses of that time, such as trading in cotton, wool, linen and silk manufacture.
Start of towage business activities, with the Rio de Janeiro Lighterage Company.
Purchase of Camuyrano Serviços Marítimos which doubles the size
and importance of the fleet. Saveiros and Camuyrano begin to operate as
associated companies.
Signature of the merger agreement between the Rio de
Janeiro Lighterage Company Limited - (John Mackenzie
- Trustee) and Wilson, Sons &Company Limited.
Inauguration of the largest covered storage in Latin America, in São Cristóvão (RJ).
Change of trading name from Rio de Janeiro Lighterage Company
(subsidiary of WS Co. Ltd.), to Companhia de Saveiros
do Rio de Janeiro.Start of activities in the offshore segment, with the entry into operation of the first PSV (platform supply vessel) – `Saveiros Albatroz` – built at the Wilson, Sons shipyard.
Acquisition of the remaining 25% of Brasco’s share capital to control 100% of the company. License to expand Tecon Salvador won. Wilson, Sons closes the year with a net profit of US$ 70.4 million.
Wilson, Sons becomes a publicly-traded company, with shares listed on the BM&FBovespa, in the form of BDRs.
www.wilsonsons.com
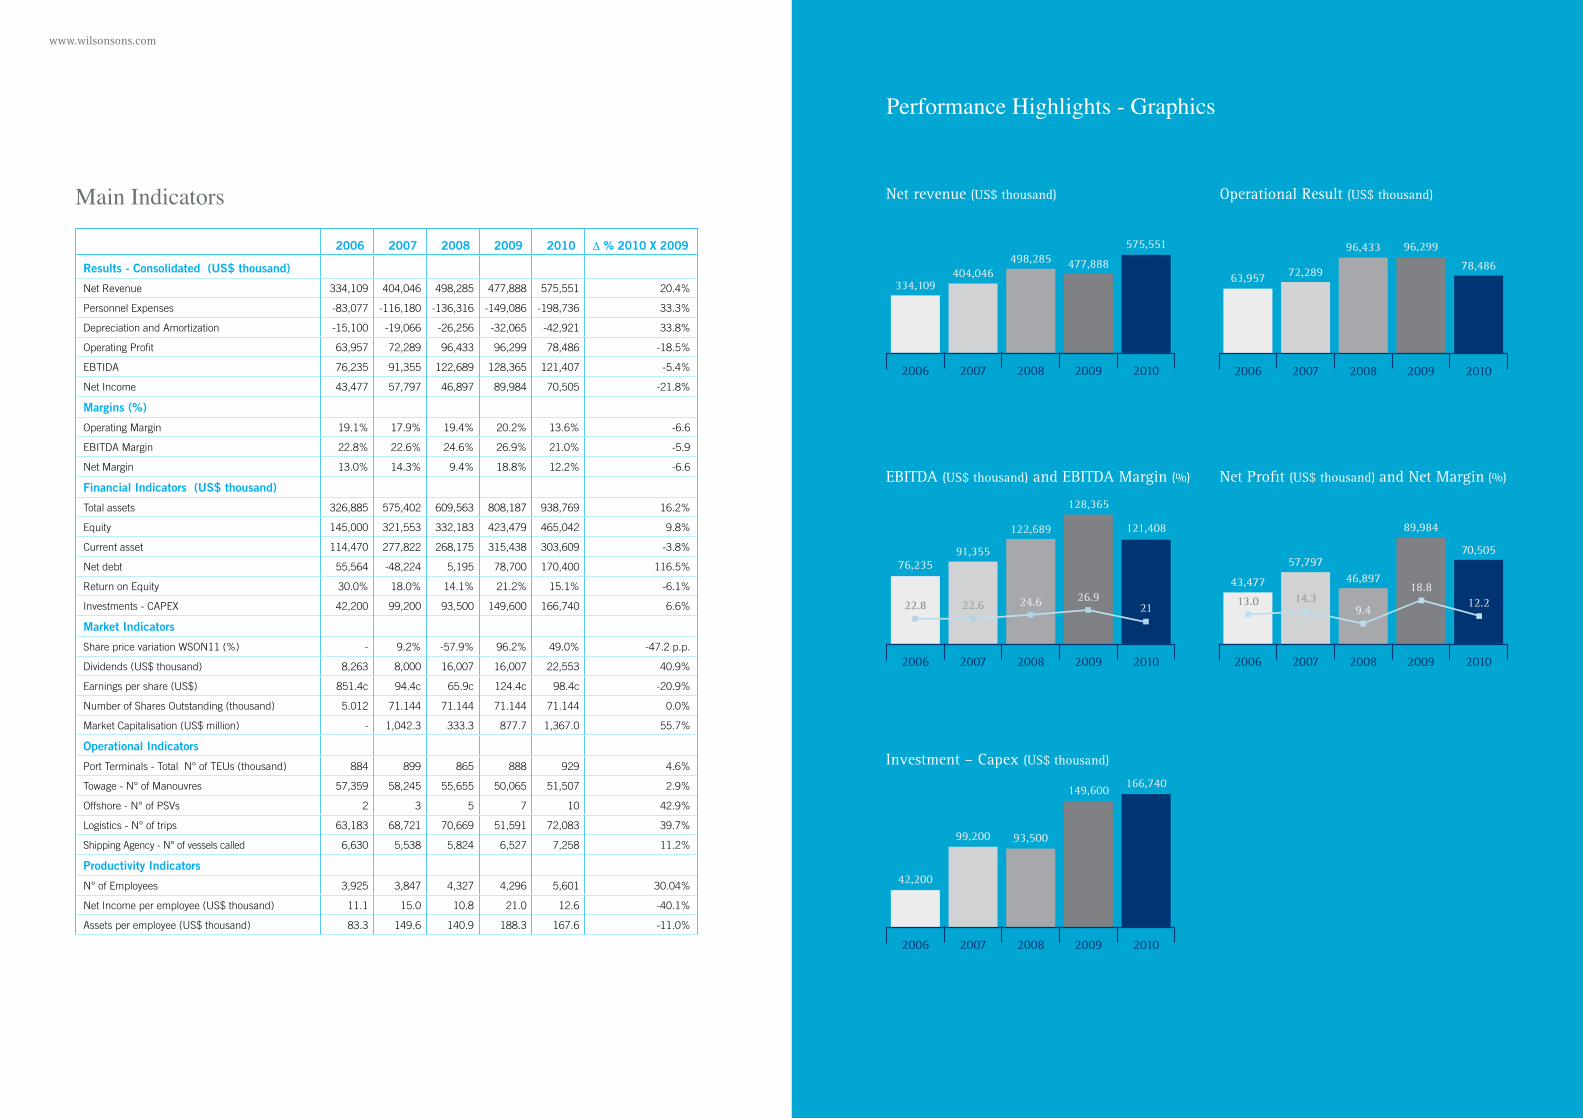
2006 2007 2008 2009 2010 ∆ % 2010 X 2009
Results - Consolidated (US$ thousand)
Net Revenue 334,109 404,046 498,285 477,888 575,551 20.4%
Personnel Expenses -83,077 -116,180 -136,316 -149,086 -198,736 33.3%
Depreciation and Amortization -15,100 -19,066 -26,256 -32,065 -42,921 33.8%
Operating Profit 63,957 72,289 96,433 96,299 78,486 -18.5%
EBTIDA 76,235 91,355 122,689 128,365 121,407 -5.4%
Net Income 43,477 57,797 46,897 89,984 70,505 -21.8%
Margins (%)
Operating Margin 19.1% 17.9% 19.4% 20.2% 13.6% -6.6
EBITDA Margin 22.8% 22.6% 24.6% 26.9% 21.0% -5.9
Net Margin 13.0% 14.3% 9.4% 18.8% 12.2% -6.6
Financial Indicators (US$ thousand)
Total assets 326,885 575,402 609,563 808,187 938,769 16.2%
Equity 145,000 321,553 332,183 423,479 465,042 9.8%
Current asset 114,470 277,822 268,175 315,438 303,609 -3.8%
Net debt 55,564 -48,224 5,195 78,700 170,400 116.5%
Return on Equity 30.0% 18.0% 14.1% 21.2% 15.1% -6.1%
Investments - CAPEX 42,200 99,200 93,500 149,600 166,740 6.6%
Market Indicators
Share price variation WSON11 (%) - 9.2% -57.9% 96.2% 49.0% -47.2 p.p.
Dividends (US$ thousand) 8,263 8,000 16,007 16,007 22,553 40.9%
Earnings per share (US$) 851.4c 94.4c 65.9c 124.4c 98.4c -20.9%
Number of Shares Outstanding (thousand) 5.012 71.144 71.144 71.144 71.144 0.0%
Market Capitalisation (US$ million) - 1,042.3 333.3 877.7 1,367.0 55.7%
Operational Indicators
Port Terminals - Total N° of TEUs (thousand) 884 899 865 888 929 4.6%
Towage - N° of Manouvres 57,359 58,245 55,655 50,065 51,507 2.9%
Offshore - N° of PSVs 2 3 5 7 10 42.9%
Logistics - N° of trips 63,183 68,721 70,669 51,591 72,083 39.7%
Shipping Agency - N° of vessels called 6,630 5,538 5,824 6,527 7,258 11.2%
Productivity Indicators
N° of Employees 3,925 3,847 4,327 4,296 5,601 30.04%
Net Income per employee (US$ thousand) 11.1 15.0 10.8 21.0 12.6 -40.1%
Assets per employee (US$ thousand) 83.3 149.6 140.9 188.3 167.6 -11.0%
Main Indicators
Performance Highlights - Graphics
Net revenue (US$ thousand)
EBITDA (US$ thousand) and EBITDA Margin (%)
Investment – Capex (US$ thousand)
Operational Result (US$ thousand)
Net Profit (US$ thousand) and Net Margin (%)
Annual Report 2010 www.wilsonsons.com
7
ABIlITy TO EvOlvE
With the passing of another year of activities we have shown our ability to evolve and continually capture new opportunities. The experience we have acquired in the last 173 years enables us to build an excellent platform for the future.
We live in a period in which the Brazilian economy is in strong growth. Our optimism is derived not only from our strong performance in 2010 but our long history of performance excellence.
Each stakeholder plays a decisive role in our success. The effort of each of our employees has been indispensible for the performance of our port, logistic and maritime operations. Our clients not only realize the value of our services, but place their trust in our company. Most of them have been Wilson, Sons’ partners for decades in long-lasting relationships and this continues to differentiate our company.
Our shareholders have also shown trust in our Company, and this has been reflected in the performance of our BDRs that in 2010 significantly outperformed the Ibovespa (Index of the BM&FBovespa).
In brief, the positive result of the Company in 2010 can be attributed to Wilson, Sons’ culture, which is to believe that the future is built in the present by means of consistent work, operational excellence and the tireless pursuit of results.
In the last business year, I became chairman of the Wilson, Sons Board. Endorsed by the priceless collaboration of the other members of this Board, I now have the mission to continue the work of Mr. Francisco Gros (deceased in the first semester of 2010), who presided over this Board with pride, wisdom and intelligence since the Company’s Initial Public Offer in 2007.
We thank our clients, shareholders and lenders for their support and confidence, we also thank the Executive Officers and especially each of our employees located throughout Brazil. Because of them we have been able to implement our strategy and consolidate our values and principles.
We remain confident in our long term growth and that 2011 will be another year of great achievements for Wilson, Sons.
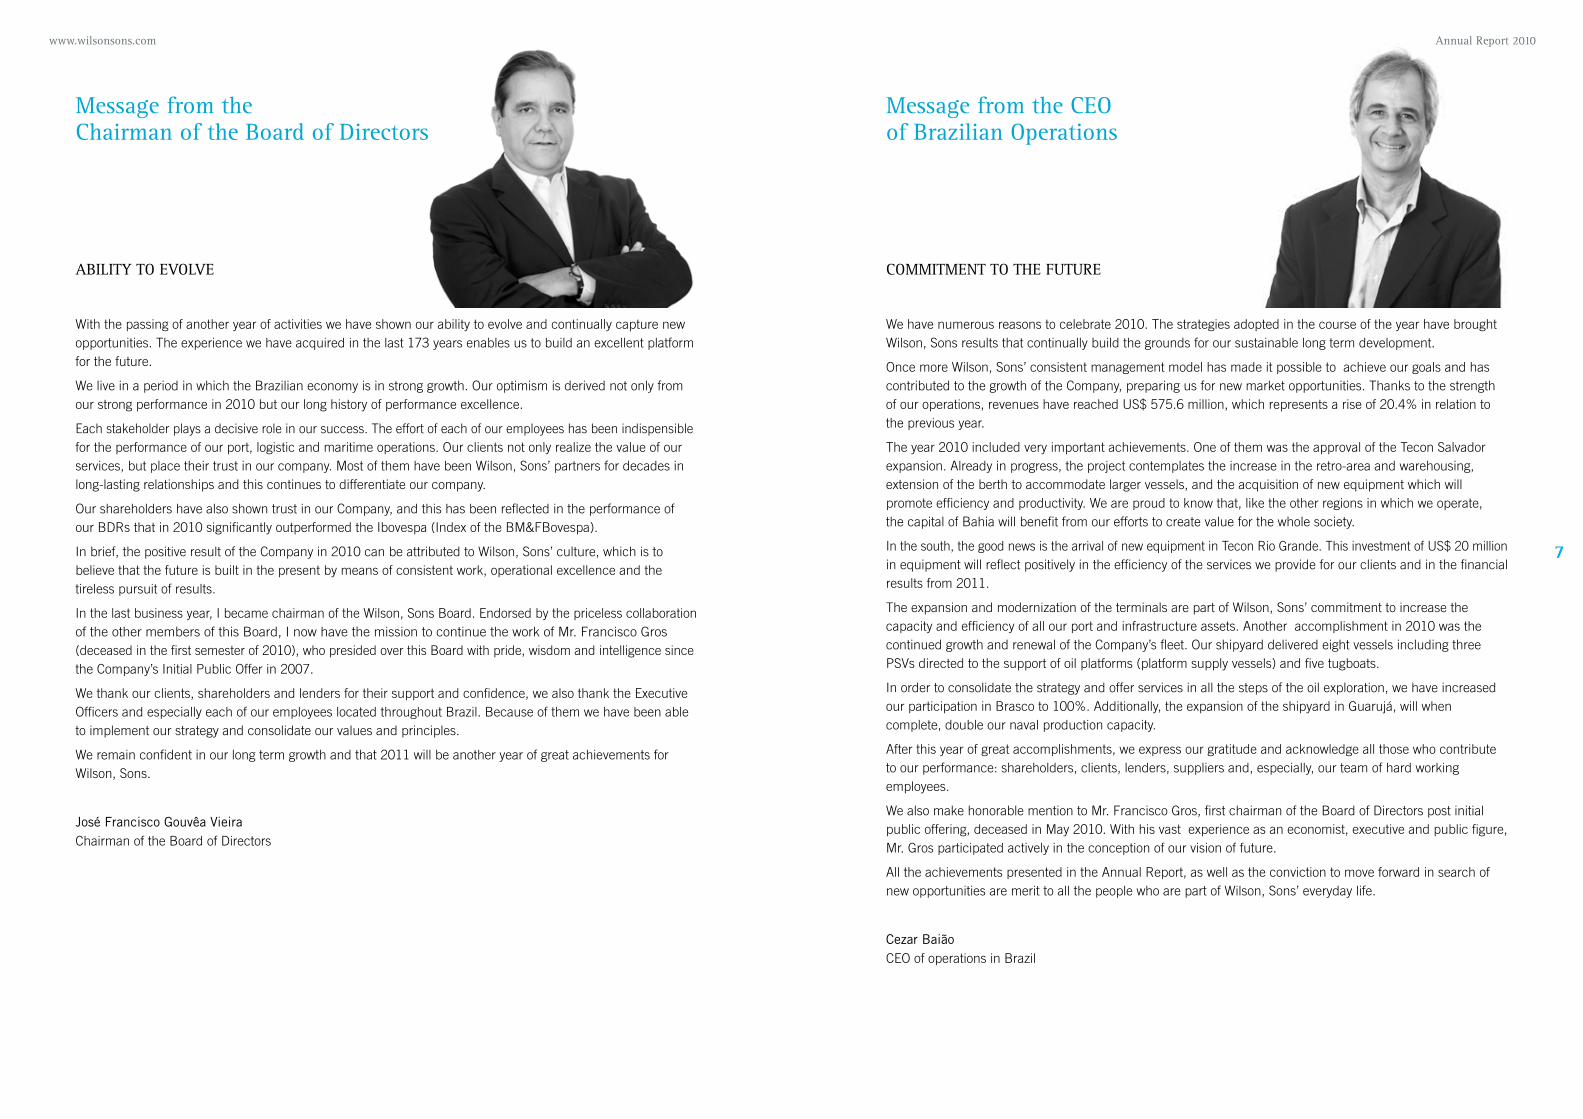
José Francisco Gouvêa Vieira Chairman of the Board of Directors
COMMITMENT TO ThE FUTURE
We have numerous reasons to celebrate 2010. The strategies adopted in the course of the year have brought Wilson, Sons results that continually build the grounds for our sustainable long term development.
Once more Wilson, Sons’ consistent management model has made it possible to achieve our goals and has contributed to the growth of the Company, preparing us for new market opportunities. Thanks to the strength of our operations, revenues have reached US$ 575.6 million, which represents a rise of 20.4% in relation to the previous year.
The year 2010 included very important achievements. One of them was the approval of the Tecon Salvador expansion. Already in progress, the project contemplates the increase in the retro-area and warehousing, extension of the berth to accommodate larger vessels, and the acquisition of new equipment which will promote efficiency and productivity. We are proud to know that, like the other regions in which we operate, the capital of Bahia will benefit from our efforts to create value for the whole society.
In the south, the good news is the arrival of new equipment in Tecon Rio Grande. This investment of US$ 20 million in equipment will reflect positively in the efficiency of the services we provide for our clients and in the financial results from 2011.
The expansion and modernization of the terminals are part of Wilson, Sons’ commitment to increase the capacity and efficiency of all our port and infrastructure assets. Another accomplishment in 2010 was the continued growth and renewal of the Company’s fleet. Our shipyard delivered eight vessels including three PSVs directed to the support of oil platforms (platform supply vessels) and five tugboats.
In order to consolidate the strategy and offer services in all the steps of the oil exploration, we have increased our participation in Brasco to 100%. Additionally, the expansion of the shipyard in Guarujá, will when complete, double our naval production capacity.
After this year of great accomplishments, we express our gratitude and acknowledge all those who contribute to our performance: shareholders, clients, lenders, suppliers and, especially, our team of hard working employees.
We also make honorable mention to Mr. Francisco Gros, first chairman of the Board of Directors post initial public offering, deceased in May 2010. With his vast experience as an economist, executive and public figure, Mr. Gros participated actively in the conception of our vision of future.
All the achievements presented in the Annual Report, as well as the conviction to move forward in search of new opportunities are merit to all the people who are part of Wilson, Sons’ everyday life.
Cezar BaiãoCEO of operations in Brazil
Message from the CEO of Brazilian Operations
Message from the Chairman of the Board of Directors
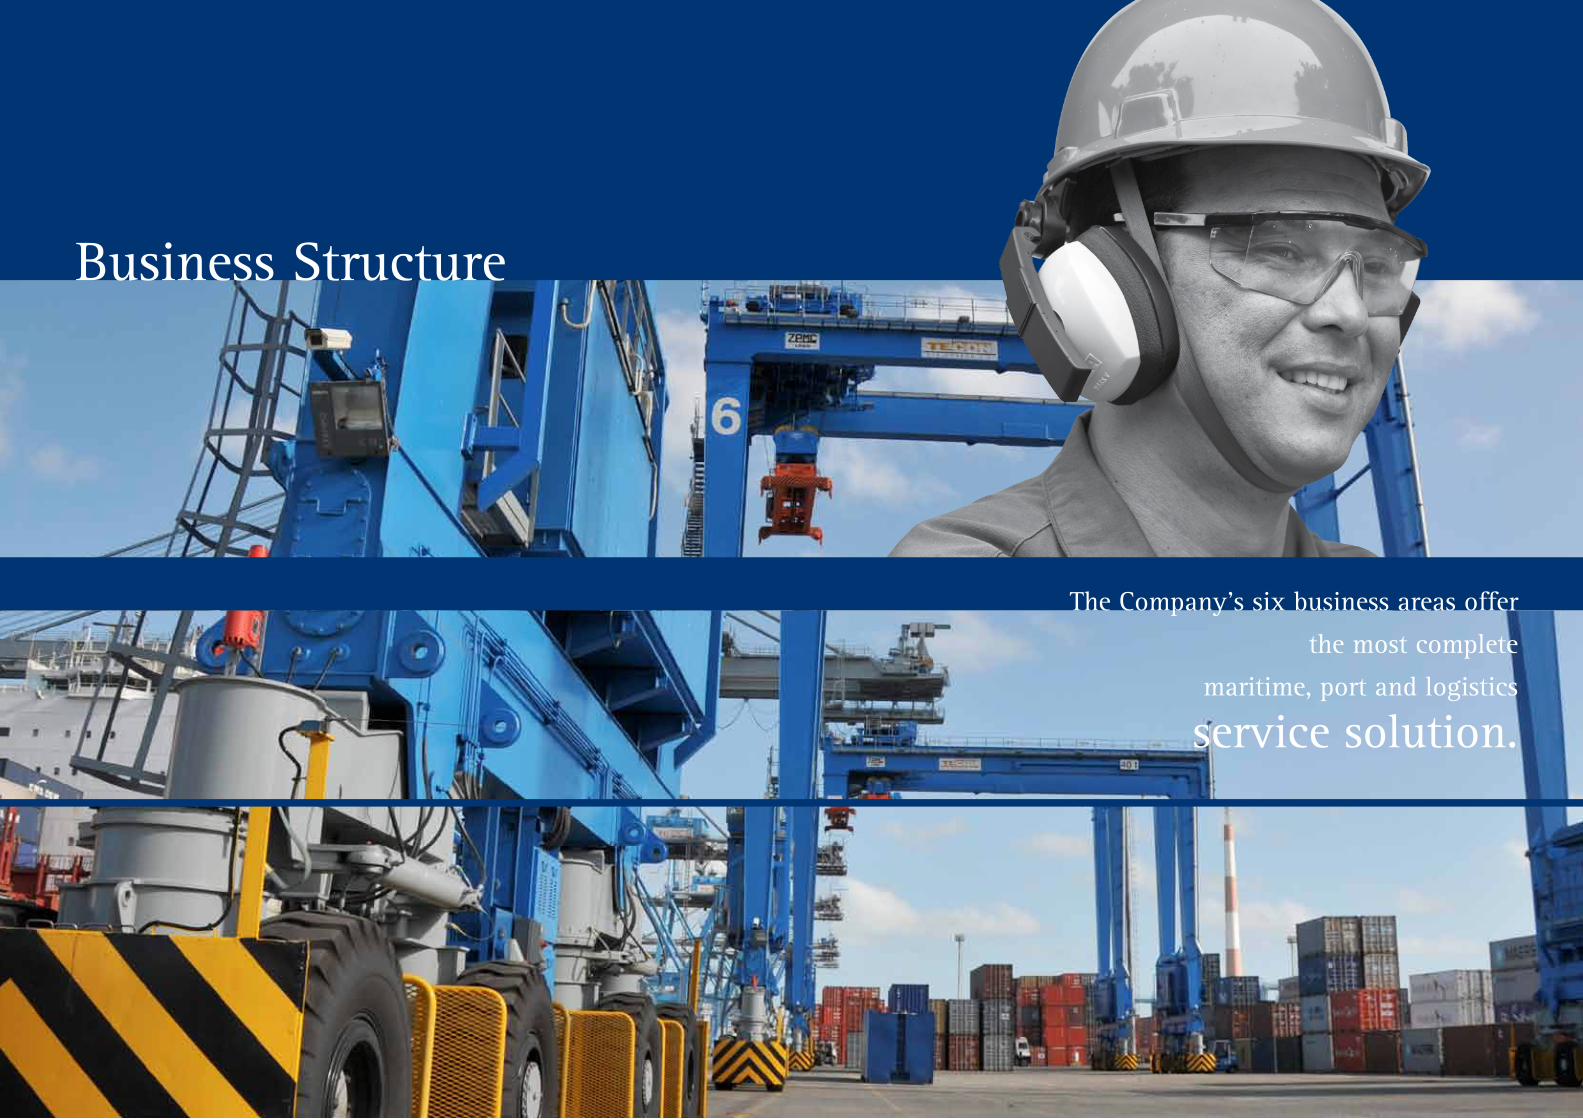
Business Structure
The Company’s six business areas offer
the most complete
maritime, port and logistics
service solution.

Annual Report 2010 www.wilsonsons.com
11
Corporate Governance
Wilson, Sons sees the adoption of governance
best practice as a continuous and long term
process directed to the Company’s sustainable
growth. Therefore, in order to enable the longevity
of value creation for all stakeholders, role clarity,
transparency and ethics are of great importance.
Such principles are completely linked to the
Company origins, as its controller, Ocean Wilsons
Holdings Limited, has been listed in the London
Stock Exchange for over a century.
In line with the best international models, the
Company’s consistent governance structure
ensures safe and transparent decision taking.
Wilson, Sons seeks to adopt practices which
are legally only demanded by companies
that participate in the BM&FBovespa Novo
Mercado, even though Wilson, Sons’ can´t be
designated Novo Mercado as its shares are traded
in BM&FBovespa through BDRs - Brazilian
Depositary Receipts. The Company’s governance
actions contribute to value creation for the various
stakeholders with whom it interacts.
BOARD OF DIRECTORS
Wilson, Sons’ Board of Directors is composed
of professionals with exceptional experience in
different fields of operation and aims to promote
the long term prosperity of the business. They
define the Company’s strategic objectives and
supervise the Board of Executive Officers and
management actions by means of project validation
and results evaluation.
Stated in the By-laws, the Boards of Directors must
have at least five members with mandates of up
to three years, each being eligible for re-election.
Currently there are seven board members of which
one is independent. All the board members have
a mandate up to the Annual General Meeting of
2011 where they are nominated for re-election.
The Board meetings are held ordinarily, once every
three months, and extraordinarily when summoned
by any member of the Board.
At the executive level, Wilson, Sons relies on areas
of Human and Organisational Development, New
Businesses and Corporate Affairs. The areas of
Information Technology, Internal Auditing and
Health, Safety and Environment (HSE) are run by
managers who report directly to the CEO due to the
key role they perform in the operations.
Role clarity, transparency and ethics guide every Wilson, Sons’ action.
Annual Report 2010 www.wilsonsons.com
13
José Francisco Gouvêa vieira | Chairman
Mr. Gouvêa Vieira received a Law degree from the Catholic University of Rio de Janeiro in 1972, and completed
his Master’s degree at the same institution, in 1973. He holds a Master’s degree in Law from Columbia
University, New York, awarded in 1978. He has been a partner at the law firm Gouvêa Vieira Advogados since
1971 and has been with the Company since 1991. He has served as chairman of the board of directors (1997)
at Wilson, Sons de Administração e Comércio (1992), at Ocean Wilsons Holdings Limited (1997) and at Ocean
Wilsons (Investments) Limited (1997). He also serves as member of the board of directors to a number of
companies, namely Banco PSA Finance Brasil S.A., PSA Finance S.A., Arrendamento Mercantil, Concremat
– Engenharia e Tecnologia S.A., International Meal Company; and member of the advisory councils at Violy
& Co., New York, Peugeot Citroen do Brasil Automóveis Ltda, Columbia Latin American Business and Law
Association (CLABLA) and Lafarge Brasil S.A., and still, member of the Association of Friends of the Paço
Imperial Museum in Rio de Janeiro, and of the Committee of Corporate Governance of the AMCHAM - American
Chamber of Commerce - as well as being Honorary Consul of the Kingdom of Morocco in Rio de Janeiro.
William henry Salomon | vice-Chairman
Mr. Salomon received an undergraduate and postgraduate degree in Law at Magdalene College, Cambridge.
Mr. Salomon joined Finsbury Asset Management, which was merged in 1995 into Rea Brothers Group, of
which Mr. Salomon became Vice-Chairman. Subsequently, Close Brothers Group acquired Rea Brothers
Group, where Mr Salomon became Deputy Chairman of the investment division. In 1999 Mr. Salomon
established Hansa Capital Partners LLP, of which he is the Senior Partner. He has been a Director of a variety
of UK and international listed companies and is currently Chairman of the New India Investment Trust, as
well as a Director of Hansa Trust. In addition, Mr. Salomon is Deputy Chairman of Ocean Wilsons Holdings
(OWH), the company which holds the controlling stake in Wilson, Sons; and is a Director of Hanseatic Asset
Management LBG.
Augusto Cezar Tavares Baião | Board Member
Mr. Cezar Baião graduated in Economics from the Catholic University of Rio de Janeiro (PUC/RJ). Having
joined Wilson, Sons in 1994 as CFO, he currently acts as the CEO of operations in Brazil. From 1982 to 1989,
he served as Money Market Desk Manager at JP Morgan and also as Finance Director of Grupo Lachmann
Agência Marítima, between 1989 and 1994. He holds one of the vice presidency positions at the National
Union of Shipping Companies (Syndarma) and acts as adviser to the board of directors at the Brazilian
Association of Public-Use Container Terminals (Abratec).
Felipe Gutterres | Board Member
Mr. Gutterres holds a Harvard Business School diploma in General Management and an MBA from COPPEAD,
having graduated in Economics from the Federal University of Rio de Janeiro. He joined the Company in
1998 and currently serves as the CFO of operations in Brazil and Investor Relations. From 1994 to1998, Mr.
Gutterres held executive positions at Shell Brasil S.A.
Claudio Marote | Board Member
Mr. Marote received a law degree from Faculdade de Direito de Curitiba. He also holds diplomas from the
following institutions: International Maritime Law from Lloyds of London, England; Executive Development
Programme of the Kellogg Institute from Northwestern University, Evanston, Illinois, U.S.A.; Structures
and Economic Systems - FDC, Paraná; and in Brazilian Policies and Strategies from the Association of
Graduates of the Higher War College, in Santos, São Paulo. He joined the Company in 1964 and has held
various executive positions, from branch manager to regional director, to superintendent-director. He began
his professional career in 1956 at Agência Marítima Intermares Ltda., a subsidiary of the Bunge Born
Group. At present, he is a partner at CMMR - Intermediação Comercial Ltda.
Andrés Rozental | Board Member
Mr. Rozental is the founding partner of Rozental & Asociados, an international consulting firm specialised
in providing political and economic advisory services to both Mexican and foreign companies.Mr. Rozental
previously was a career diplomat for more than 35 years with the Mexican foreign ministry holding a number
of senior ambassadorial diplomatic posts. He is Chairman of the Board of Directors of Arcelor Mittal Mexico
and is an independent Director of ArcelorMittal Brazil, Ocean Wilson Holdings and Wilson, Sons. He serves
on the advisory board sof Kansas City Southern de México, EADS de México, Toyota de México and is an
Operating Partner of Advent International Private Equity.
Mr. Rozental obtained his professional degree in international relations from the Universidad de las Américas
in Mexico and his Master’s in International Economics from the University of Pennsylvania. He is the author of
four books on Mexican foreign policy and of numerous articles on international affairs. He has been a foreign
policy advisor to President Vicente Fox and Felipe Calderón.
Paulo Fernando Fleury | Independent Board Member
Dr. Fleury is a full professor at Coppead Business School, Federal University of Rio de Janeiro and CEO
of Logistics and Supply Chain Institute – ILOS. He has been teaching and conducting research and
consulting for the last 30 years. He holds a B.Sc. degree in mechanical engineering (1969) a MSc. degree
in Industrial engineering, and a PhD degree in Industrial Management.
He was a visiting scholar at the Harvard Business School, during 1983, and an invited speaker at
the Sloan School of Management, MIT in 1986. He has published more than 100 papers in Brazilian
and international journals and was responsible for the organization of two logistics and supply chain
management books. During all his professional life he has been engaged in consultancy work in the areas
of logistics management, and operations strategy.
He was Director General (CEO) of AD-RIO, the Development Agency of the State of Rio de Janeiro, being
responsible for its creation and implementation (1987 - 1989).

Annual Report 2010 www.wilsonsons.com
15
BOARD OF EXECUTIvE OFFICERS OF OPERATIONS IN BRAZIl
The board of Executive officers is responsible for; establishing the policies of management, corporate operations and conduct of businesses in Brazil. As well as responsibility for achieving the goals established by the Board of Directors, the Board of Executive Officers assembles qualified professionals who act in the Company’s operational day-to-day. It is composed by a CEO (Chief Executive Officer), a CFO (Chief Financial Officer) and two COO’s (Chief Operating Officers): one for the Port Terminal and Logistics, and another one for Tugboats, Offshore, Shipping Agency and Shipyards.
At the executive level, Wilson, Sons relies on areas of Human and Organisational Development and Corporate Affairs. The areas of Information Technology, Internal Auditing and Health, Safety and Environment (HSE) are run by managers who report directly to the CEO due to the key role they perform in the operations.
CODE OF EThICS
The aim of the Code of Ethics is to foster and actualise values expressed in the Company’s Mission, Vision and Principles which guide the Company’s business operations. Seeking consistency the document translates into Wilson, Sons’ daily practice of commitment to maintaining healthy relationships with all of its stakeholders, based on honesty and integrity.
Available to everyone who is interested on the Company’s website (www.wilsonsons.com), the document is a valuable instrument to preserve the image and longevity of the organisation.
EXTERNAl AUDIT
Wilson, Sons’ Financial Statements are prepared according to the principles of International Financial Reporting Standards (IFRS), which became compulsory for Brazilian companies in 2010. The company is audited by Delloite Touche Tohmatsu.
INvESTOR RElATIONS
Wilson, Sons holds transparency as a main guideline for the relations with investors, shareholders and market analysts. For this reason, besides fulfilling the usual compulsory routine for the companies listed on the Brazilian stock exchange, the Company pays special attention to communication, investing continuously in the improvement of the communication channels.
Communication tools include an area targeted at investors on its website (www.wilsonsons.com/ir), which is regularly updated with performance and result information. This communication channel also allows registration, in order to receive news alerts, and market announcements, among other important information. In 2010, the area commenced the use of online social network tools as twitter, Linkedin and YouTube, aiming to communicate with the public in a faster
and more efficient way. Besides the traditional communication and online social networks the Company participates actively in bank events and conferences related to the industry.
Quarterly, the Investors Relations area (IR) organises the results disclosure, coordinating the teleconference which is open to the market and fosters the direct access of interested investors with the executives of the Company.
In 2010, the team of investor relations promoted 75 individual or small group meetings of analysts and investors, ten conferences, six non-deal road shows, besides the continuous services by phone and e-mail, which has resulted in a total of 819 direct interactions.
The Code of Ethics translates into Wilson, Sons’ daily practice of commitment to maintaining a healthy relationship
with all of its stakeholders based on honesty and integrity.
Annual Report 2010 www.wilsonsons.com
17
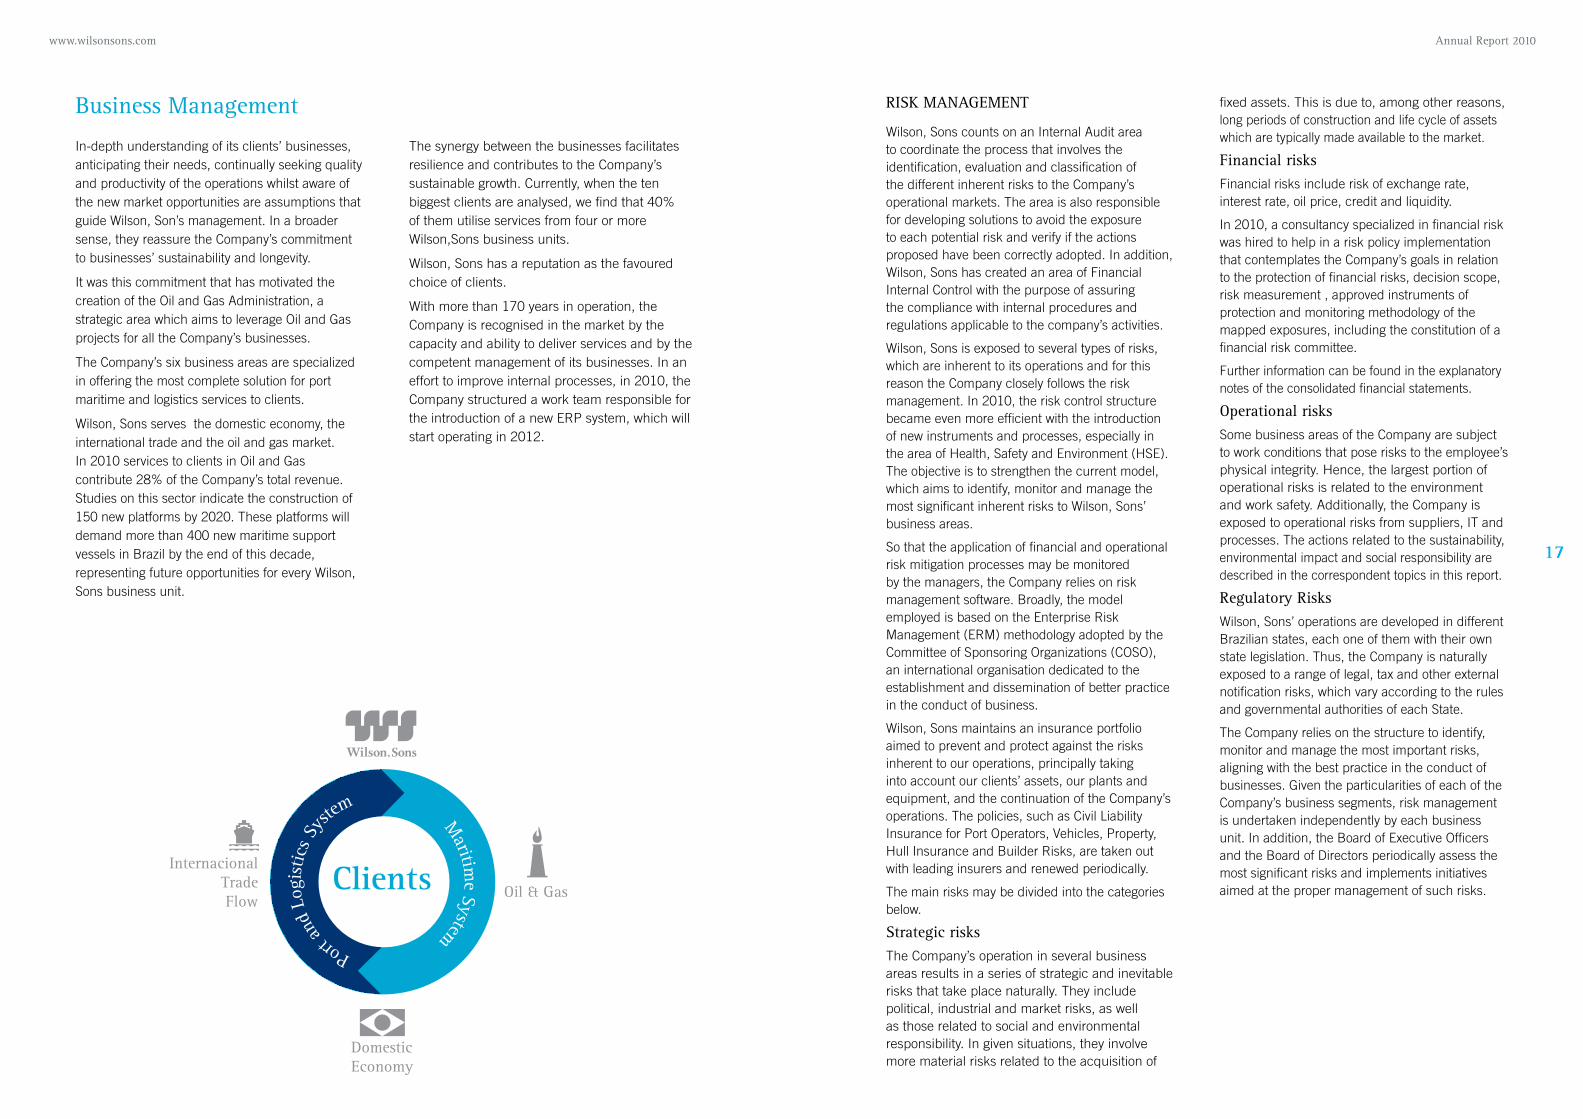
InternacionalTradeFlow
DomesticEconomy
Oil & Gas
Port
and
logi
stic
s Sys
tem Maritim
e System
Business Management
In-depth understanding of its clients’ businesses, anticipating their needs, continually seeking quality and productivity of the operations whilst aware of the new market opportunities are assumptions that guide Wilson, Son’s management. In a broader sense, they reassure the Company’s commitment to businesses’ sustainability and longevity.
It was this commitment that has motivated the creation of the Oil and Gas Administration, a strategic area which aims to leverage Oil and Gas projects for all the Company’s businesses.
The Company’s six business areas are specialized in offering the most complete solution for port maritime and logistics services to clients.
Wilson, Sons serves the domestic economy, the international trade and the oil and gas market. In 2010 services to clients in Oil and Gas contribute 28% of the Company’s total revenue. Studies on this sector indicate the construction of 150 new platforms by 2020. These platforms will demand more than 400 new maritime support vessels in Brazil by the end of this decade, representing future opportunities for every Wilson, Sons business unit.
The synergy between the businesses facilitates resilience and contributes to the Company’s sustainable growth. Currently, when the ten biggest clients are analysed, we find that 40% of them utilise services from four or more Wilson,Sons business units.
Wilson, Sons has a reputation as the favoured choice of clients.
With more than 170 years in operation, the Company is recognised in the market by the capacity and ability to deliver services and by the competent management of its businesses. In an effort to improve internal processes, in 2010, the Company structured a work team responsible for the introduction of a new ERP system, which will start operating in 2012.
RISK MANAGEMENT
Wilson, Sons counts on an Internal Audit area to coordinate the process that involves the identification, evaluation and classification of the different inherent risks to the Company’s operational markets. The area is also responsible for developing solutions to avoid the exposure to each potential risk and verify if the actions proposed have been correctly adopted. In addition, Wilson, Sons has created an area of Financial Internal Control with the purpose of assuring the compliance with internal procedures and regulations applicable to the company’s activities.
Wilson, Sons is exposed to several types of risks, which are inherent to its operations and for this reason the Company closely follows the risk management. In 2010, the risk control structure became even more efficient with the introduction of new instruments and processes, especially in the area of Health, Safety and Environment (HSE). The objective is to strengthen the current model, which aims to identify, monitor and manage the most significant inherent risks to Wilson, Sons’ business areas.
So that the application of financial and operational risk mitigation processes may be monitored by the managers, the Company relies on risk management software. Broadly, the model employed is based on the Enterprise Risk Management (ERM) methodology adopted by the Committee of Sponsoring Organizations (COSO), an international organisation dedicated to the establishment and dissemination of better practice in the conduct of business.
Wilson, Sons maintains an insurance portfolio aimed to prevent and protect against the risks inherent to our operations, principally taking into account our clients’ assets, our plants and equipment, and the continuation of the Company’s operations. The policies, such as Civil Liability Insurance for Port Operators, Vehicles, Property, Hull Insurance and Builder Risks, are taken out with leading insurers and renewed periodically.
The main risks may be divided into the categories below.
Strategic risksThe Company’s operation in several business areas results in a series of strategic and inevitable risks that take place naturally. They include political, industrial and market risks, as well as those related to social and environmental responsibility. In given situations, they involve more material risks related to the acquisition of
fixed assets. This is due to, among other reasons, long periods of construction and life cycle of assets which are typically made available to the market.
Financial risksFinancial risks include risk of exchange rate, interest rate, oil price, credit and liquidity.
In 2010, a consultancy specialized in financial risk was hired to help in a risk policy implementation that contemplates the Company’s goals in relation to the protection of financial risks, decision scope, risk measurement , approved instruments of protection and monitoring methodology of the mapped exposures, including the constitution of a financial risk committee.
Further information can be found in the explanatory notes of the consolidated financial statements.
Operational risksSome business areas of the Company are subject to work conditions that pose risks to the employee’s physical integrity. Hence, the largest portion of operational risks is related to the environment and work safety. Additionally, the Company is exposed to operational risks from suppliers, IT and processes. The actions related to the sustainability, environmental impact and social responsibility are described in the correspondent topics in this report.
Regulatory RisksWilson, Sons’ operations are developed in different Brazilian states, each one of them with their own state legislation. Thus, the Company is naturally exposed to a range of legal, tax and other external notification risks, which vary according to the rules and governmental authorities of each State.
The Company relies on the structure to identify, monitor and manage the most important risks, aligning with the best practice in the conduct of businesses. Given the particularities of each of the Company’s business segments, risk management is undertaken independently by each business unit. In addition, the Board of Executive Officers and the Board of Directors periodically assess the most significant risks and implements initiatives aimed at the proper management of such risks.
Annual Report 2010 www.wilsonsons.com
19
hEAlTh, SAFETy AND ENvIRONMENT (hSE)
HSE Corporate Management reports directly to the CEO. Its strategic operation contributes to the maintenance of a healthy and safe work environment, by preventing; accidents, deceases in, or damage to the employee’s health or the environment. Seventy HSE professionals work directly in the business units integrating with the work of HSE area.
The year of 2010 was dedicated to the intensification of compliance with the Company’s corporate standards by means of a validation of procedures that support the HSE Corporate Policy for each one of Wilson, Sons’ businesses. The set of rules show the concern with the preservation of the environment, health and safety. The rules apply to all employees.
In Tecon Rio Grande, the advances in the area have involved the constitution of a Emergency Response Unit, an equipped mobile base which has been installed in a container, and the acquisition of a fire fighting vehicle - Wilson, Sons’ first of the kind. The actions improve the Company’s response to possible emergency incidents in the terminal. In addition, within the continuous programme of fire prevention and response training, 130 brigade members from Tecon Rio Grande have undergone training.
In Brasco, the Company reached the index of 1,000 days with no work accidents in October 2010 and conducted, in December, an emergency simulation which involved all the employees as well as the participation of the local Fire Department.
In the Logistics area, subjects related to the work safety are themes for the Daily Safety Talks. The action consists of a structured talk with the employees before each shift, dedicated to a theme related to day-to-day operational safety. This action has been very important for accident prevention. Logistics has also released the Prevention 10, Accident 0 campaign (Prevenção 10, Acidente 0), rewarding the employees for their performance in work safety.
Throughout last year, the management agenda was also focused on monitoring the fulfilment of the legal requirements to which the Company’s businesses areas are subject and on the development of programmes that aim to promote the employees’ health and welfare. One of the advances in this sense was the standardization of the medical and occupational health activities. From 2010, all the pre-employment and periodic health examinations as well as risk assessment in work environment are carried out by one single partner company, which covers all the Wilson, Sons locations. This action is part of a project seeking to consolidate, by the end of 2011, all the Group health and safety information.
New technologies also form part of the agenda of the environmental management. This includes the purchase of new equipment, such as the container cranes that arrived in Tecon Rio Grande (RS) in October 2010. The cranes have technology for the reuse of the electricity generated by the equipment. In Tecon Salvador, electrical cranes have been ordered, with improved performance in energy consumption and much lower emission of pollutants than the conventional diesel systems. The equipment should start operating in 2011.
In the Rio de Janeiro headquarters, a selective collection programme has been introduced. The recyclable material is donated to an NGO which invests in qualification of low-income population.
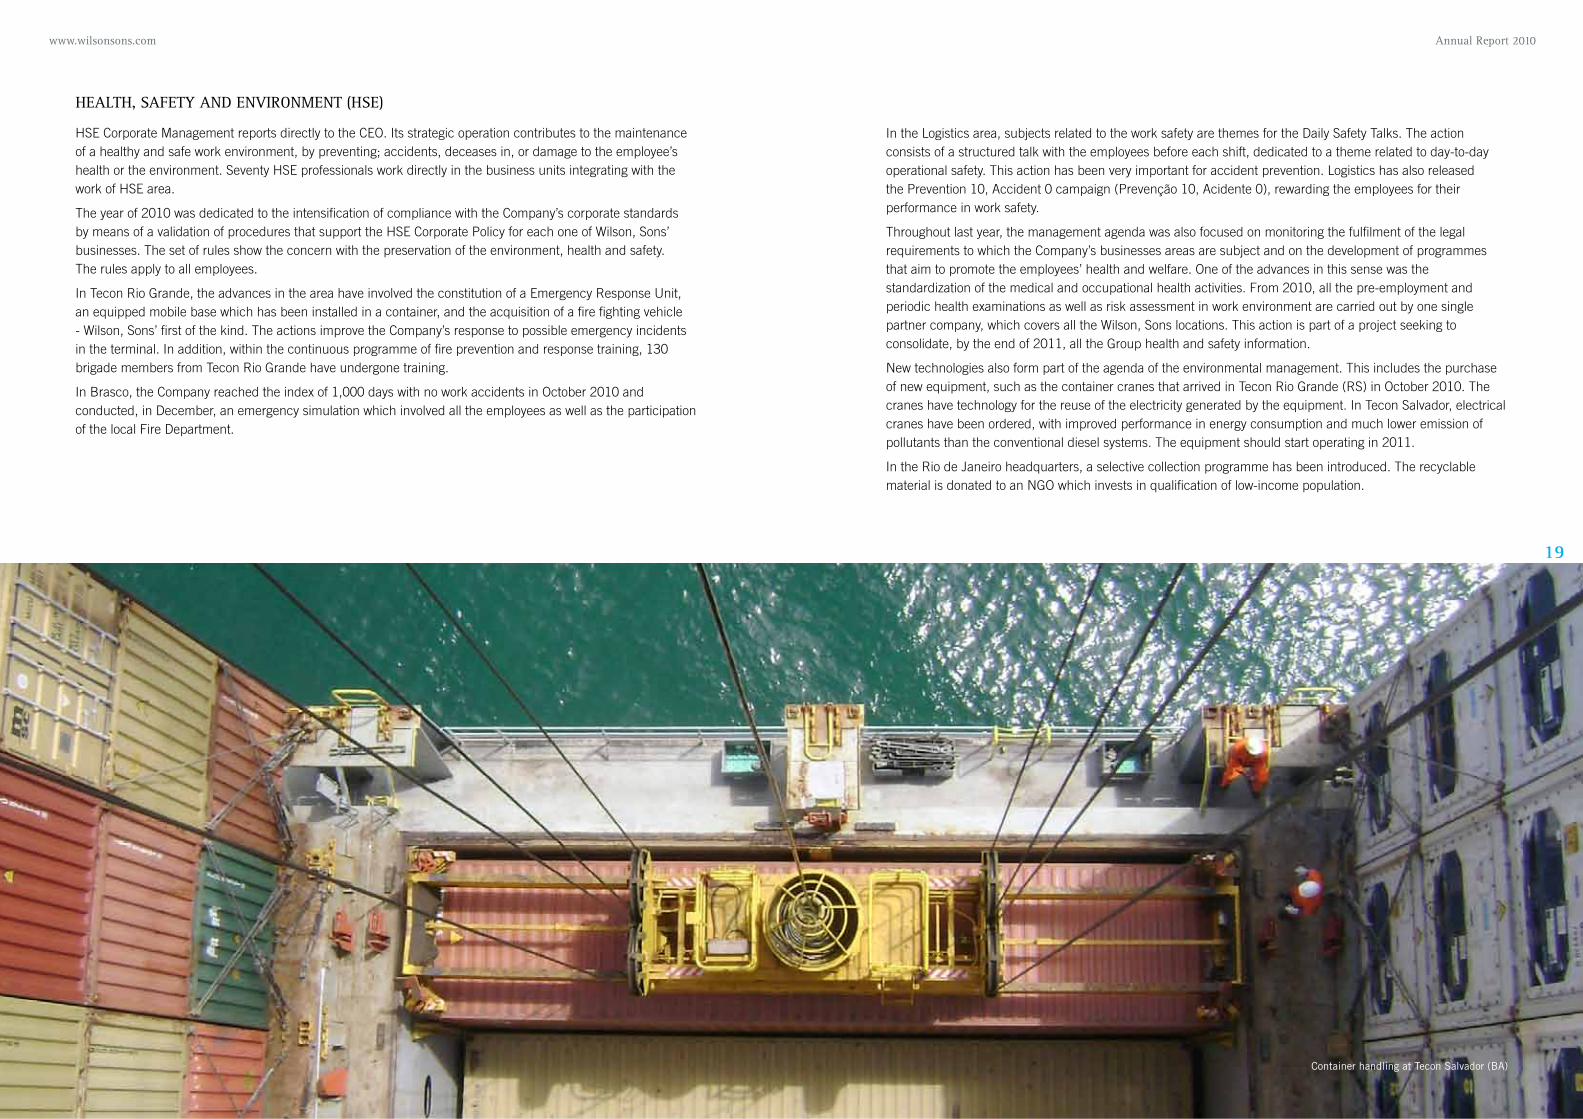
Container handling at Tecon Salvador (BA)
www.wilsonsons.com
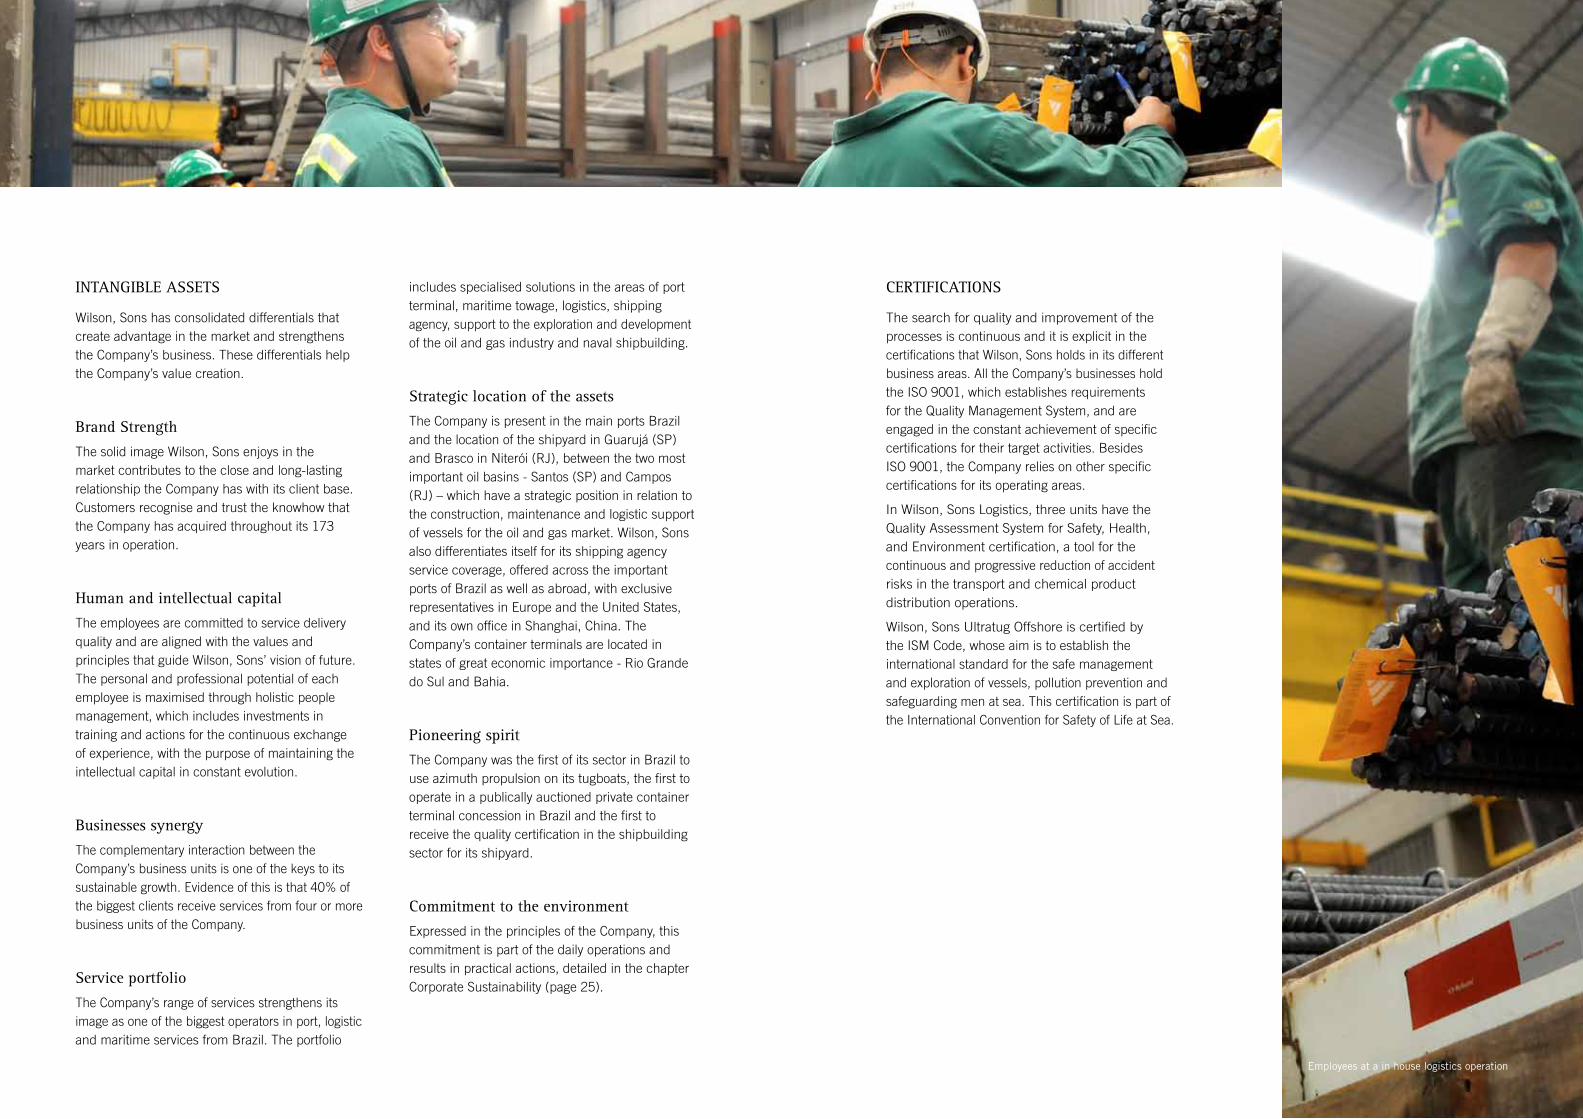
Employees at a in house logistics operation
INTANGIBlE ASSETS
Wilson, Sons has consolidated differentials that create advantage in the market and strengthens the Company’s business. These differentials help the Company’s value creation.
Brand Strength
The solid image Wilson, Sons enjoys in the market contributes to the close and long-lasting relationship the Company has with its client base. Customers recognise and trust the knowhow that the Company has acquired throughout its 173 years in operation.
human and intellectual capital
The employees are committed to service delivery quality and are aligned with the values and principles that guide Wilson, Sons’ vision of future. The personal and professional potential of each employee is maximised through holistic people management, which includes investments in training and actions for the continuous exchange of experience, with the purpose of maintaining the intellectual capital in constant evolution.
Businesses synergy
The complementary interaction between the Company’s business units is one of the keys to its sustainable growth. Evidence of this is that 40% of the biggest clients receive services from four or more business units of the Company.
Service portfolio
The Company’s range of services strengthens its image as one of the biggest operators in port, logistic and maritime services from Brazil. The portfolio
includes specialised solutions in the areas of port terminal, maritime towage, logistics, shipping agency, support to the exploration and development of the oil and gas industry and naval shipbuilding.
Strategic location of the assets
The Company is present in the main ports Brazil and the location of the shipyard in Guarujá (SP) and Brasco in Niterói (RJ), between the two most important oil basins - Santos (SP) and Campos (RJ) – which have a strategic position in relation to the construction, maintenance and logistic support of vessels for the oil and gas market. Wilson, Sons also differentiates itself for its shipping agency service coverage, offered across the important ports of Brazil as well as abroad, with exclusive representatives in Europe and the United States, and its own office in Shanghai, China. The Company’s container terminals are located in states of great economic importance - Rio Grande do Sul and Bahia.
Pioneering spirit
The Company was the first of its sector in Brazil to use azimuth propulsion on its tugboats, the first to operate in a publically auctioned private container terminal concession in Brazil and the first to receive the quality certification in the shipbuilding sector for its shipyard.
Commitment to the environment
Expressed in the principles of the Company, this commitment is part of the daily operations and results in practical actions, detailed in the chapter Corporate Sustainability (page 25).
CERTIFICATIONS
The search for quality and improvement of the processes is continuous and it is explicit in the certifications that Wilson, Sons holds in its different business areas. All the Company’s businesses hold the ISO 9001, which establishes requirements for the Quality Management System, and are engaged in the constant achievement of specific certifications for their target activities. Besides ISO 9001, the Company relies on other specific certifications for its operating areas.
In Wilson, Sons Logistics, three units have the Quality Assessment System for Safety, Health, and Environment certification, a tool for the continuous and progressive reduction of accident risks in the transport and chemical product distribution operations.
Wilson, Sons Ultratug Offshore is certified by the ISM Code, whose aim is to establish the international standard for the safe management and exploration of vessels, pollution prevention and safeguarding men at sea. This certification is part of the International Convention for Safety of Life at Sea.
www.wilsonsons.com
Male
Female
12%
88%
RElATIONS WITh ThE STAFF
The Company’s human capital plays a key-role in every business and goes beyond the service delivery on time and quality. In the day-to-day of the operations, each one of the employees is responsible for the fulfilment and trust that lasts in the clients’ memory and motivates them to continually choose Wilson, Sons. This belief allows the Company’s strategy to include the employee’s investment in the technical training and welfare.
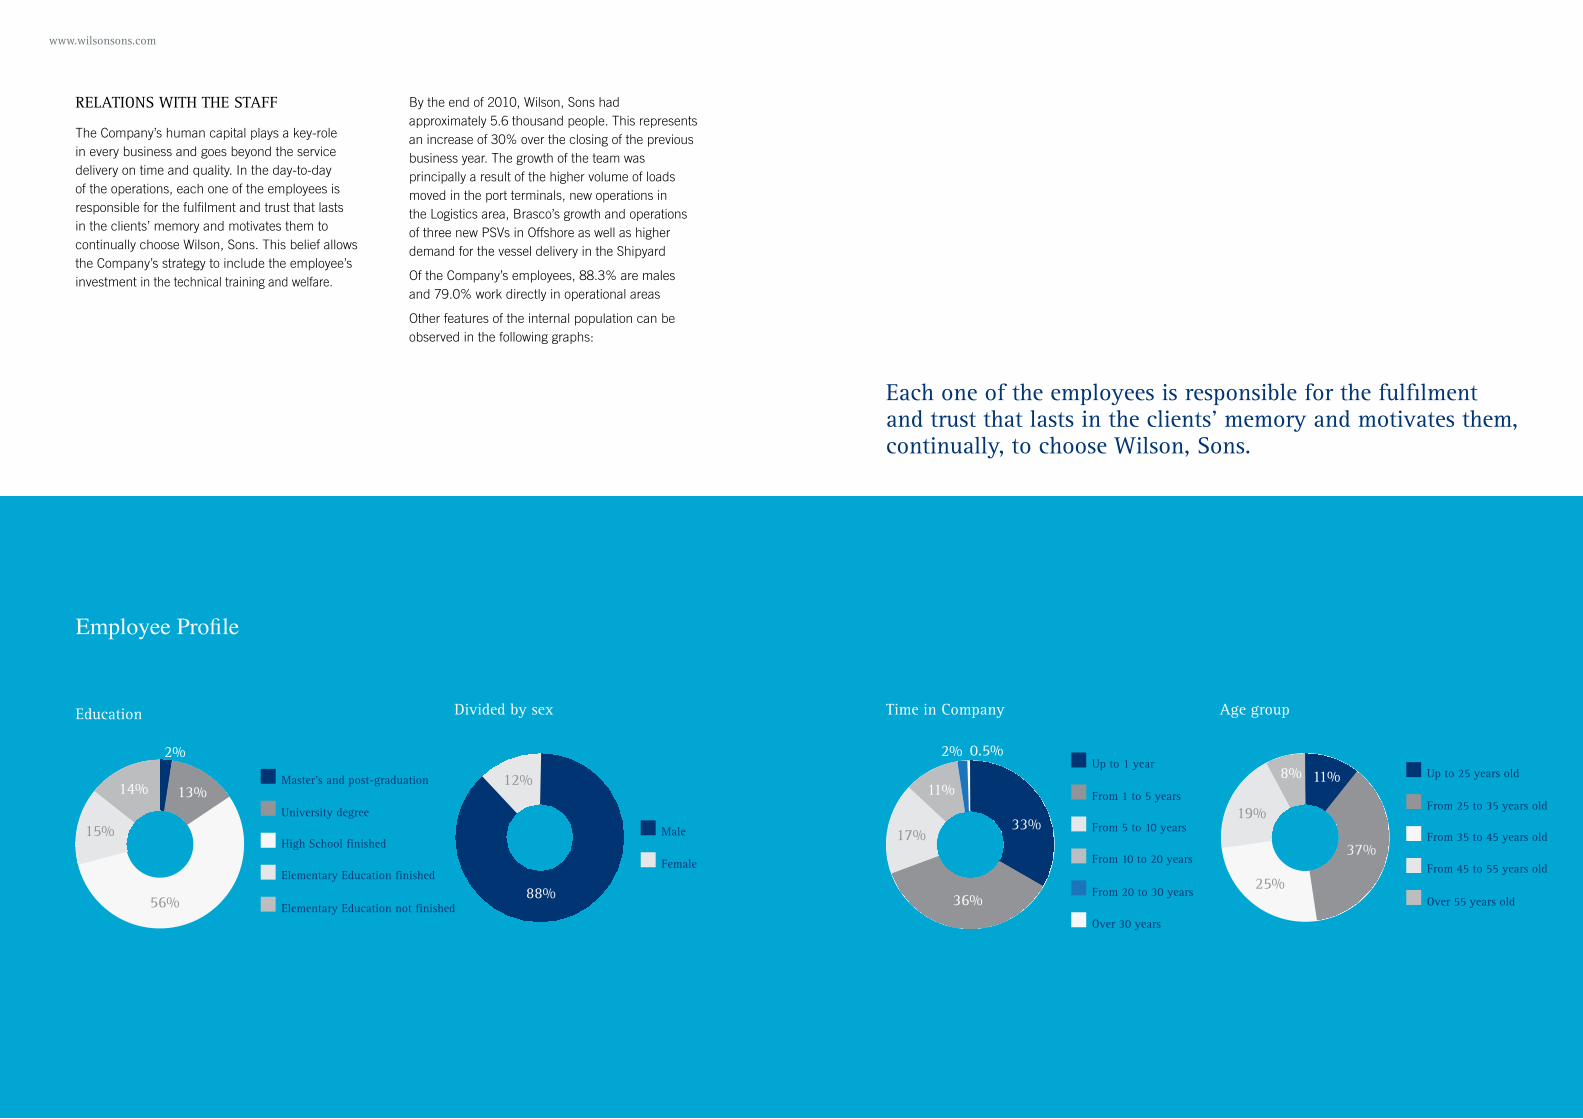
By the end of 2010, Wilson, Sons had approximately 5.6 thousand people. This represents an increase of 30% over the closing of the previous business year. The growth of the team was principally a result of the higher volume of loads moved in the port terminals, new operations in the Logistics area, Brasco’s growth and operations of three new PSVs in Offshore as well as higher demand for the vessel delivery in the Shipyard
Of the Company’s employees, 88.3% are males and 79.0% work directly in operational areas
Other features of the internal population can be observed in the following graphs:
Education Time in Company Age groupDivided by sex
Employee Profile
Each one of the employees is responsible for the fulfilment and trust that lasts in the clients’ memory and motivates them, continually, to choose Wilson, Sons.
www.wilsonsons.com
Wilson, Sons staff management is carried out by the Human and Organisational Development area, which is structured into corporate management (Rewards and Planning, Development and Management) and business management. The first aims to measure and institute the strategies of the Company as a whole and operates in partnership with Human and Organisational Development areas in each business that concentrate on their business specifities.
The year of 2010 was also significant in the use of the Strategic Human Resources Management platform, which integrates the pillars of Performance Evaluation, Succession & Retention, Personnel Development and Reward. The tool demanded time and technological investment for its implementation. It is used in relation to the managerial level and going forward it will be applied to a wider number of positions in the company.
Besides offering an integrated vision of the Company’s human capital, the Strategic Human Resources Management platform enables the employee, with the assistance of their manager, to plan the development of their career based on individual performance and area of interest. This possibility enhances ownership and buy-in of career planning and is aligned with Wilson, Sons Vision to be its employees’ first choice.
Knowledge management
Improving the employee’s individual competence contributes for the Company’s value creation in its entirety. It is up to the Business Human and Organisational Development to conceive and coordinate the human development that serves the demands of different Wilson, Sons businesses. In 2010, 127,149 hours of training were delivered, which involved the participation of employees in 8,706 training actions. Worthy of mention was the resumption of the Managerial Development Program, which involved all the Company’s coordinators and managers; the technical course for Tecon Salvador’s employees, provided thanks to a partnership with the National Service for Industrial Learning (SENAI- Serviço Nacional de Aprendizagem Industrial); and, in June, the start of activities in the William Salomon Training Centre, where, during the first six months of activities 166 employees were trained for the Tugboat business.
Again at Tecon Salvador, a training programme “Interlinked with the Tecon,” was adopted using the e-learning platform. The use of this tool, which had been applied to the Shipping Agency business in the previous year, consolidates this training concept within the Group.
In line with the Company’s growth related to the oil and gas sector, training has been given by specialists in the area to 35 employees, including participants from the top management and employees who work directly in the business. The training had a purpose to provide a global view on the segment and increase employee knowledge, with themes related to the oil geology fundamentals and geoengineering of reservoirs.
The human development programme also included contributions to higher education courses, post-graduation and language courses. In 2010, 56 scholarships were granted.
Rewarding and Benefits Practice
Wilson, Sons has adopted, since 2004, as a platform of positions and salaries, the Hay Group point methodology, which makes use of annual research to update the salary scale. The benefit package practised by the group contemplates, in addition to the benefits in the collective agreement, the full costing of life insurance and funeral assistance, Private Pension plans, in the form of income benefits and individual benefits, as well as the Program of Profit-Sharing and Bonuses, which has a taylor-made design for the managers group and another for the non-managers group.

www.wilsonsons.com
Corporate Sustainability
With the support of the Brazilian Foundation for Sustainable Development, Wilson, Sons has adopted the methodology based on the triple bottom line and on the ISE (BM&FBovespa’s Business Sustainability Index) dimension analysis.
In 2010, Offshore and Logistics went through the diagnostic phase as well as the constitution of a sustainability committee which will be responsible for coordinating and rendering accounts on the actions that will be adopted in their respective businesses.
Throughout the year, investments were made in the dissemination of sustainability concepts through internal communication channels, which include notice boards, electronic newsletters, a column in New’s magazine and a specific intranet area.
The agenda also contemplated programs for the dissemination of concepts to onboard staff, with the first lecture in a Platform Supply Vessel (PSV) being carried out aboard Talha-Mar. For the year of 2011, a series of training is expected for all vessels.
Governance
In 2010, Wilson, Sons’ Code of Ethics was revised in a process that involved the formation of a committee composed of employees from all businesses and different hierarchical levels. The committee analysed the guidelines provided by IBGC – Brazilian Institute of Corporate Governance – along with documents from other companies. The objective is to implement best market practice, and resulted in a comprehensive document of guidelines for the Company and it’s employees.
The adherence of each one of our employees to the Code of Ethics is formalised during the corporate integration process. Upon being hired, each professional at Wilson, Sons accepts the commitment to guide their professional attitudes with the principles of appreciation and respect for life, the environment, culture, and the legislation which are defended by the Wilson, Sons. The document also entails that queries concerning real situations should be forwarded to a hierarchical superior, who will consult the Ethics Committee.
Another initiative was the formalisation of the Corporate Social Policy, a comprehensive document which guides Wilson, Sons’ actions in the social and environmental scopes. The methodology applied in the construction of the Code of Ethics was used on the elaboration of this document.
Creating Ties Christmas activity at Rio Grande (RS)
Economic
Social
Dimension
DimensionAmbientalDimension
Corporate Governance
Inovation

www.wilsonsons.com
Economic Dimension
Since 2009, Wilson, Sons has been publishing the Added Value Statement, which can be found at the end of the Report.
In addition to the businesses’ emergency procedures the Company relies on a crisis management plan from the corporate sustainability area with focus on reputation and image. Another point to be highlighted in this dimension was the formation of a work team and with the assistance of a consultancy to implement Economic Value Added (EVA) methodologies throughout the business in 2011.
Environmental Dimension
The commitment to environmental preservation, the conscious use of natural resources, and the reduction of environmental impact caused by operational activities are evident in several initiatives. One of them concerns the certifications described on page 21. Another one is in the adoption of cleaner technologies, which is the case of new tugboats, whose engines include an electronic management system that reduces polluting gas emissions. All new tugboats built in Wilson, Sons’ shipyard use this technology. The energy efficiency achieved by the projects on new vessels guarantees the reduction of 11.1% CO2 emissions when compared to vessels built in the 1970s.
Also worthy of mention is the case of Brasco, where the comprehensive waste disposal process includes the receipt, processing, separation and correct final destination logistics for clients and third party residues from oil and gas platforms.
Another initiative in the scope of environmental sustainability was, in support of the area of HSE (Health, Safety, and Environment), the promotion and adoption of a selective collection in the Rio de Janeiro. headquarters.
Social Dimension
Transparency and commitment to social advances permeate Wilson, Sons’ management model and are manifested in several examples. The Company, a co-founding member of the Brazilian Council for Corporate Volunteering, it is also part of the Social Responsibility Commission at Brazilian Institute of Petroleum, and was the first in its segment to adhere to the United Nations Organization Global Compact. This initiative, that mobilizes the corporate community for the adoption of fundamental and internationally accepted values in their business practice, has been translated into ten principles in the areas of human rights, labour rights, environment protection and combat against corruption, which can be found in the document named Global Compact – 10 Decisions to Change the World.
Wilson, Sons believes that business sustainability also depends on the way the Company relates to their internal public and to the community. In 2010, it carried out its first functional census which included all the business units. The main goal of this research was to analyze the way the Company is seen by its employees.
Around 50% of employees (79.6% male and 20.3% female) voluntarily contributed. 84% of respondents largely agree that the Company is concerned with the environment and 71.4% think it is a supportive company.
This census was also valuable for Wilson, Sons to be familiarized with the racial diversity of employees: 55.8% declared themselves white, while 10% afro descendent and 30.9% mixed descendent, Asian, indigenous and others account for the other 3.3%. These and other results help to beacon many future actions of the Company.
The relationship with the community aims to contribute to the construction of a better world for the generations of today and the future. Thus, the company participates, through financial support and volunteering actions, in projects which involve respect, the appreciation for life and the preservation of historic and cultural assets.
PRESERvATION OF MEMORy AND hISTORICAl ASSETS
› Wilson, Sons Business History Centre
The history of Wilson, Sons, established in Brazil for over 170 years, is considered to be a valuable intangible asset with approximately 4,000 documents representing the trajectory of the Company. Such documents are a source of information for employees of the Group and researchers in general. In 2010, the Company launched a research portal, with its entire collection digitised. Documents and images, catalogued by themes, are now available to users of all locations, while the physical collection will be preserved.
› Maintenance of historical assets
Making use of resources that comply with the Rouanet Law, Wilson, Sons is committed to the financing of two restoration works. In 2010 the restoration of Rio Grande’s (RS) City Hall was concluded. In Salvador, the Company has initiated the restoration of the Bahia Association of Commerce building, which housed Wilson, Sons’ first headquarters.
Creating Ties, Rio de Janeiro
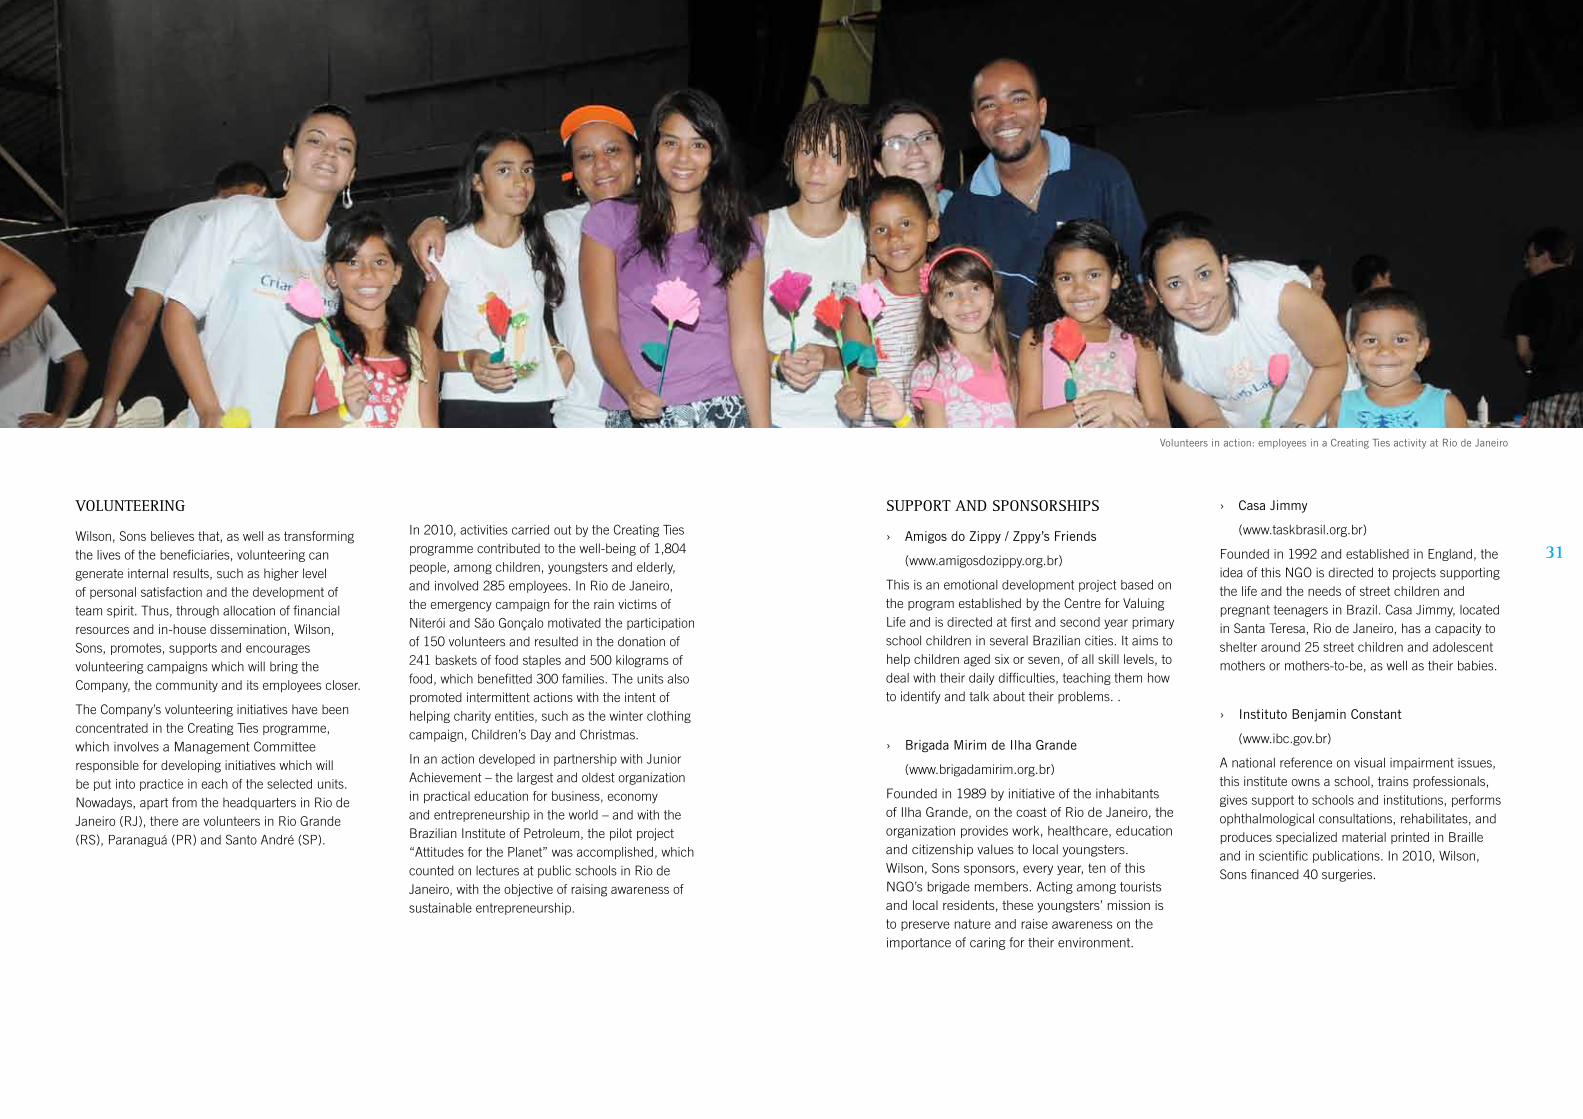
Annual Report 2010 www.wilsonsons.com
31
vOlUNTEERING
Wilson, Sons believes that, as well as transforming the lives of the beneficiaries, volunteering can generate internal results, such as higher level of personal satisfaction and the development of team spirit. Thus, through allocation of financial resources and in-house dissemination, Wilson, Sons, promotes, supports and encourages volunteering campaigns which will bring the Company, the community and its employees closer.
The Company’s volunteering initiatives have been concentrated in the Creating Ties programme, which involves a Management Committee responsible for developing initiatives which will be put into practice in each of the selected units. Nowadays, apart from the headquarters in Rio de Janeiro (RJ), there are volunteers in Rio Grande (RS), Paranaguá (PR) and Santo André (SP).
In 2010, activities carried out by the Creating Ties programme contributed to the well-being of 1,804 people, among children, youngsters and elderly, and involved 285 employees. In Rio de Janeiro, the emergency campaign for the rain victims of Niterói and São Gonçalo motivated the participation of 150 volunteers and resulted in the donation of 241 baskets of food staples and 500 kilograms of food, which benefitted 300 families. The units also promoted intermittent actions with the intent of helping charity entities, such as the winter clothing campaign, Children’s Day and Christmas.
In an action developed in partnership with Junior Achievement – the largest and oldest organization in practical education for business, economy and entrepreneurship in the world – and with the Brazilian Institute of Petroleum, the pilot project “Attitudes for the Planet” was accomplished, which counted on lectures at public schools in Rio de Janeiro, with the objective of raising awareness of sustainable entrepreneurship.
SUPPORT AND SPONSORShIPS
› Amigos do Zippy / Zppy’s Friends
(www.amigosdozippy.org.br)
This is an emotional development project based on the program established by the Centre for Valuing Life and is directed at first and second year primary school children in several Brazilian cities. It aims to help children aged six or seven, of all skill levels, to deal with their daily difficulties, teaching them how to identify and talk about their problems. .
› Brigada Mirim de Ilha Grande
(www.brigadamirim.org.br)
Founded in 1989 by initiative of the inhabitants of Ilha Grande, on the coast of Rio de Janeiro, the organization provides work, healthcare, education and citizenship values to local youngsters. Wilson, Sons sponsors, every year, ten of this NGO’s brigade members. Acting among tourists and local residents, these youngsters’ mission is to preserve nature and raise awareness on the importance of caring for their environment.
› Casa Jimmy
(www.taskbrasil.org.br)
Founded in 1992 and established in England, the idea of this NGO is directed to projects supporting the life and the needs of street children and pregnant teenagers in Brazil. Casa Jimmy, located in Santa Teresa, Rio de Janeiro, has a capacity to shelter around 25 street children and adolescent mothers or mothers-to-be, as well as their babies.
› Instituto Benjamin Constant
(www.ibc.gov.br)
A national reference on visual impairment issues, this institute owns a school, trains professionals, gives support to schools and institutions, performs ophthalmological consultations, rehabilitates, and produces specialized material printed in Braille and in scientific publications. In 2010, Wilson, Sons financed 40 surgeries.
Volunteers in action: employees in a Creating Ties activity at Rio de Janeiro
Annual Report 2010
33
Operational Market Environments
Through its operations, Wilson, Sons focuses on three drivers of growth: international trade flow, the oil and gas sector, and the Brazilian economy.
PORT AND lOGISTICS
Wilson, Sons Terminals operates two of the most important Brazilian container terminals, as well as Brasco, a company specialised in logistics support to the oil and gas industry.
Wilson, Sons Logistics is involved in all stages of the commercial logistics supply chain. Its services involve warehousing, in-house operations, distribution and multimodal transportation by means of flexible and taylor made solutions.
Employee operating a Tecon Rio Grande equipment
Annual Report 2010 www.wilsonsons.com
35
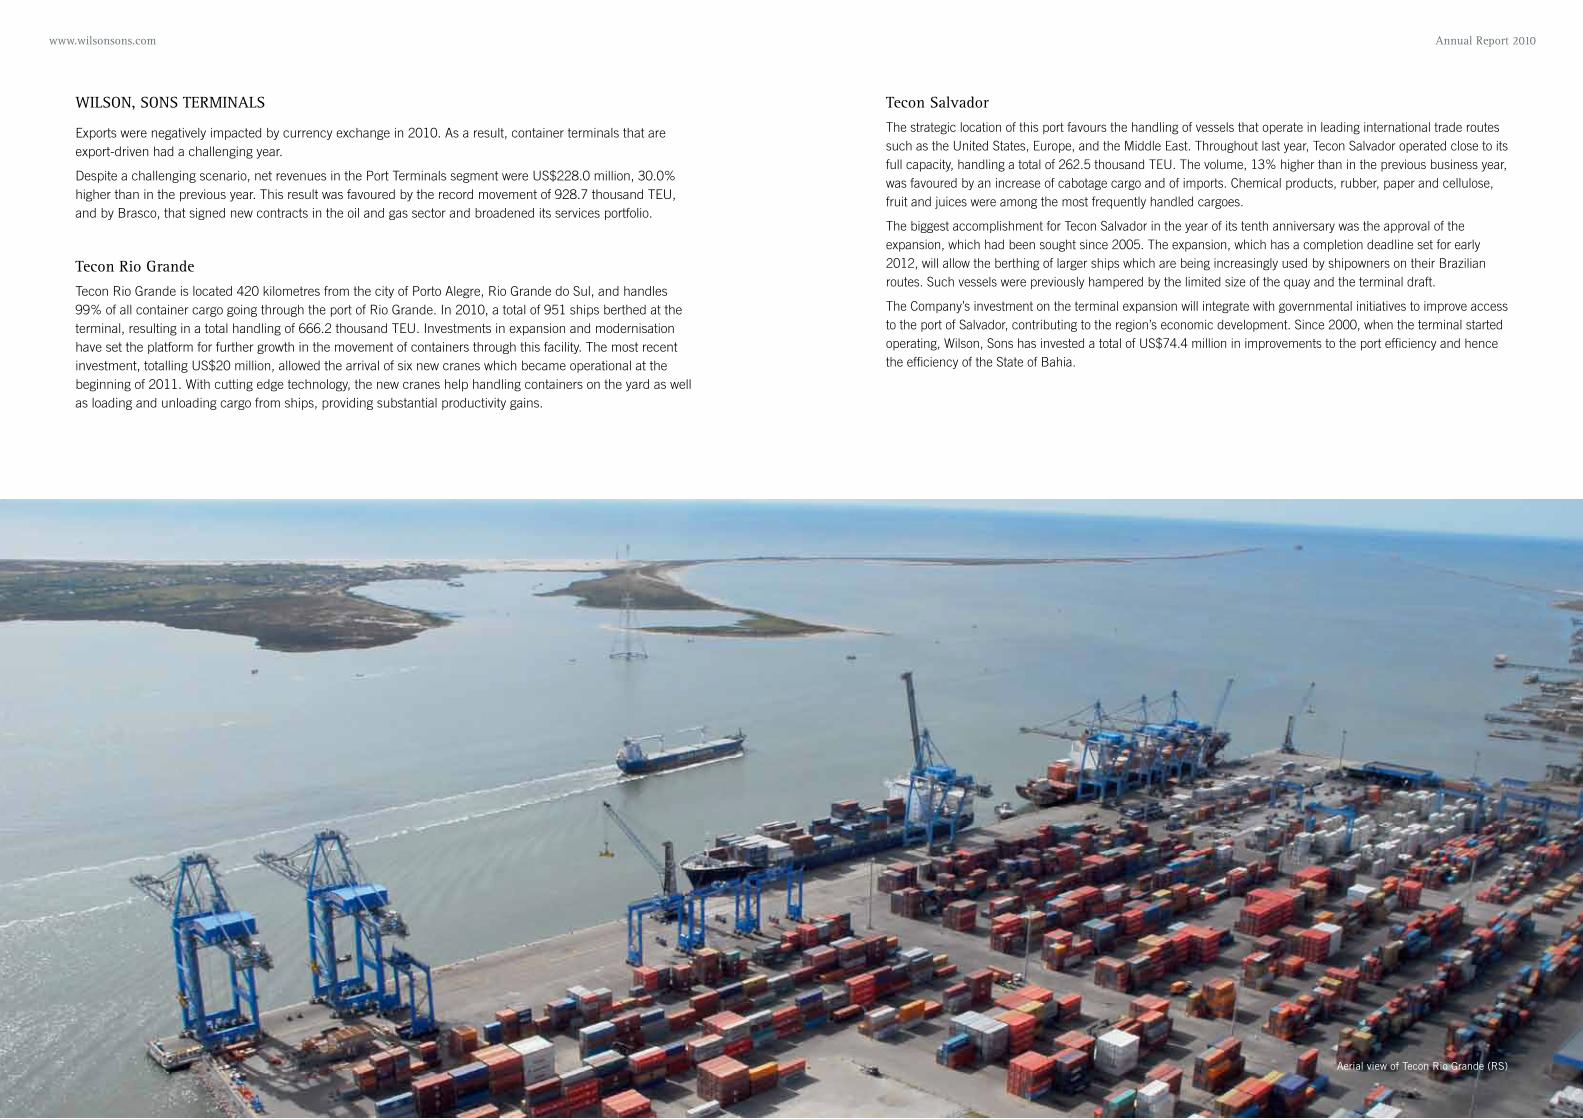
WIlSON, SONS TERMINAlS
Exports were negatively impacted by currency exchange in 2010. As a result, container terminals that are export-driven had a challenging year.
Despite a challenging scenario, net revenues in the Port Terminals segment were US$228.0 million, 30.0% higher than in the previous year. This result was favoured by the record movement of 928.7 thousand TEU, and by Brasco, that signed new contracts in the oil and gas sector and broadened its services portfolio.
Tecon Rio Grande
Tecon Rio Grande is located 420 kilometres from the city of Porto Alegre, Rio Grande do Sul, and handles 99% of all container cargo going through the port of Rio Grande. In 2010, a total of 951 ships berthed at the terminal, resulting in a total handling of 666.2 thousand TEU. Investments in expansion and modernisation have set the platform for further growth in the movement of containers through this facility. The most recent investment, totalling US$20 million, allowed the arrival of six new cranes which became operational at the beginning of 2011. With cutting edge technology, the new cranes help handling containers on the yard as well as loading and unloading cargo from ships, providing substantial productivity gains.
Tecon Salvador
The strategic location of this port favours the handling of vessels that operate in leading international trade routes such as the United States, Europe, and the Middle East. Throughout last year, Tecon Salvador operated close to its full capacity, handling a total of 262.5 thousand TEU. The volume, 13% higher than in the previous business year, was favoured by an increase of cabotage cargo and of imports. Chemical products, rubber, paper and cellulose, fruit and juices were among the most frequently handled cargoes.
The biggest accomplishment for Tecon Salvador in the year of its tenth anniversary was the approval of the expansion, which had been sought since 2005. The expansion, which has a completion deadline set for early 2012, will allow the berthing of larger ships which are being increasingly used by shipowners on their Brazilian routes. Such vessels were previously hampered by the limited size of the quay and the terminal draft.
The Company’s investment on the terminal expansion will integrate with governmental initiatives to improve access to the port of Salvador, contributing to the region’s economic development. Since 2000, when the terminal started operating, Wilson, Sons has invested a total of US$74.4 million in improvements to the port efficiency and hence the efficiency of the State of Bahia.
Aerial view of Tecon Rio Grande (RS)
Annual Report 2010
37
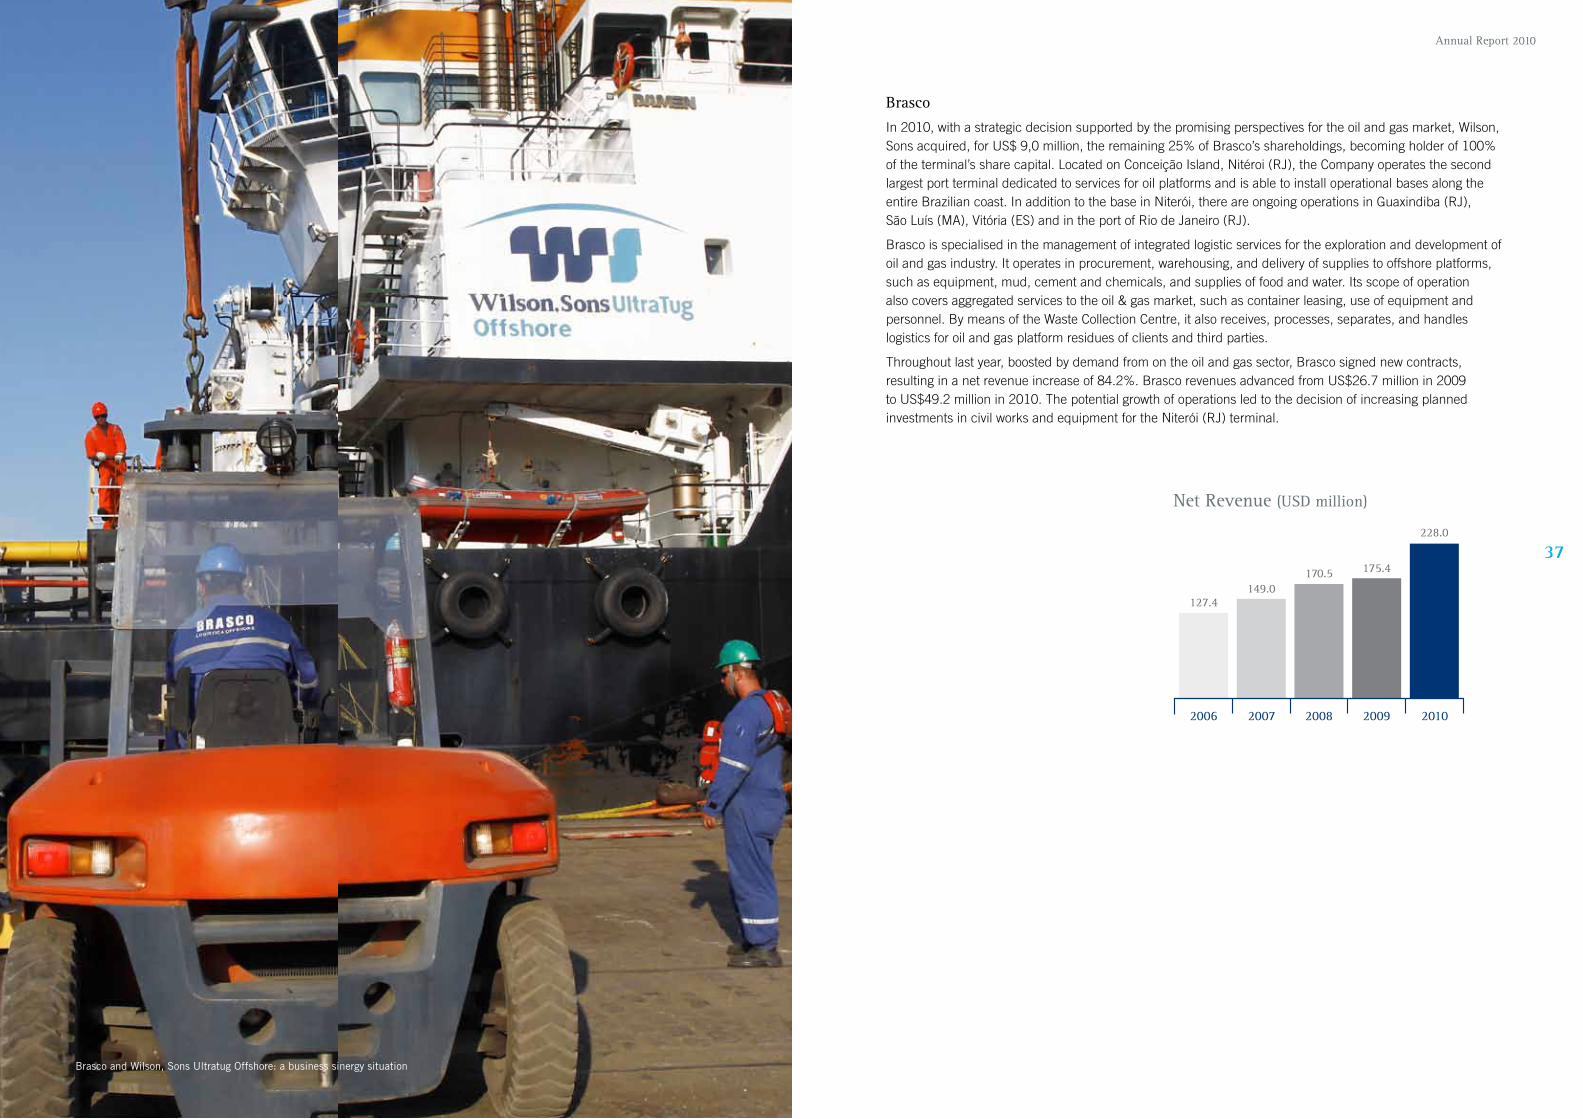
Brasco
In 2010, with a strategic decision supported by the promising perspectives for the oil and gas market, Wilson, Sons acquired, for US$ 9,0 million, the remaining 25% of Brasco’s shareholdings, becoming holder of 100% of the terminal’s share capital. Located on Conceição Island, Nitéroi (RJ), the Company operates the second largest port terminal dedicated to services for oil platforms and is able to install operational bases along the entire Brazilian coast. In addition to the base in Niterói, there are ongoing operations in Guaxindiba (RJ), São Luís (MA), Vitória (ES) and in the port of Rio de Janeiro (RJ).
Brasco is specialised in the management of integrated logistic services for the exploration and development of oil and gas industry. It operates in procurement, warehousing, and delivery of supplies to offshore platforms, such as equipment, mud, cement and chemicals, and supplies of food and water. Its scope of operation also covers aggregated services to the oil & gas market, such as container leasing, use of equipment and personnel. By means of the Waste Collection Centre, it also receives, processes, separates, and handles logistics for oil and gas platform residues of clients and third parties.
Throughout last year, boosted by demand from on the oil and gas sector, Brasco signed new contracts, resulting in a net revenue increase of 84.2%. Brasco revenues advanced from US$26.7 million in 2009 to US$49.2 million in 2010. The potential growth of operations led to the decision of increasing planned investments in civil works and equipment for the Niterói (RJ) terminal.
Net Revenue (USD million)
Brasco and Wilson, Sons Ultratug Offshore: a business sinergy situation
127.4149.0
170.5 175.4
228.0
2006 2007 2008 2009 2010
www.wilsonsons.com
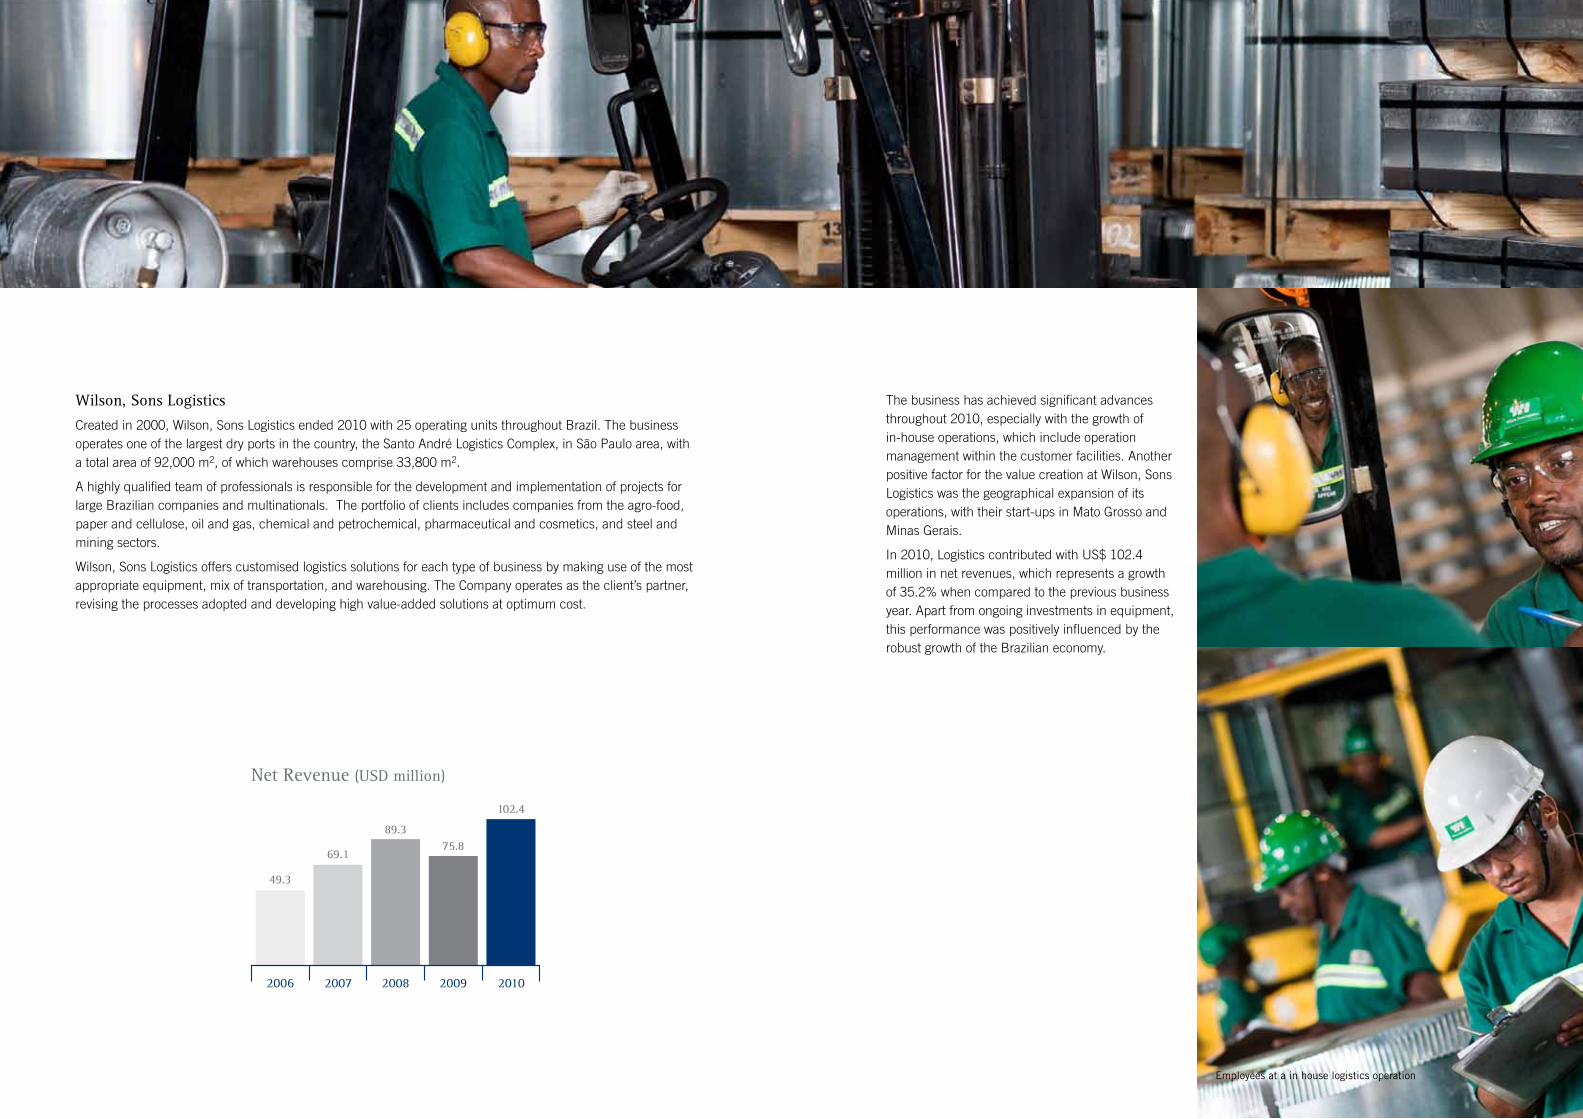
Wilson, Sons logistics
Created in 2000, Wilson, Sons Logistics ended 2010 with 25 operating units throughout Brazil. The business operates one of the largest dry ports in the country, the Santo André Logistics Complex, in São Paulo area, with a total area of 92,000 m2, of which warehouses comprise 33,800 m2.
A highly qualified team of professionals is responsible for the development and implementation of projects for large Brazilian companies and multinationals. The portfolio of clients includes companies from the agro-food, paper and cellulose, oil and gas, chemical and petrochemical, pharmaceutical and cosmetics, and steel and mining sectors.
Wilson, Sons Logistics offers customised logistics solutions for each type of business by making use of the most appropriate equipment, mix of transportation, and warehousing. The Company operates as the client’s partner, revising the processes adopted and developing high value-added solutions at optimum cost.
The business has achieved significant advances throughout 2010, especially with the growth of in-house operations, which include operation management within the customer facilities. Another positive factor for the value creation at Wilson, Sons Logistics was the geographical expansion of its operations, with their start-ups in Mato Grosso and Minas Gerais.
In 2010, Logistics contributed with US$ 102.4 million in net revenues, which represents a growth of 35.2% when compared to the previous business year. Apart from ongoing investments in equipment, this performance was positively influenced by the robust growth of the Brazilian economy.
Net Revenue (USD million)
Employees at a in house logistics operation
49.3
69.1
89.375.8
102.4
2006 2007 2008 2009 2010
www.wilsonsons.com
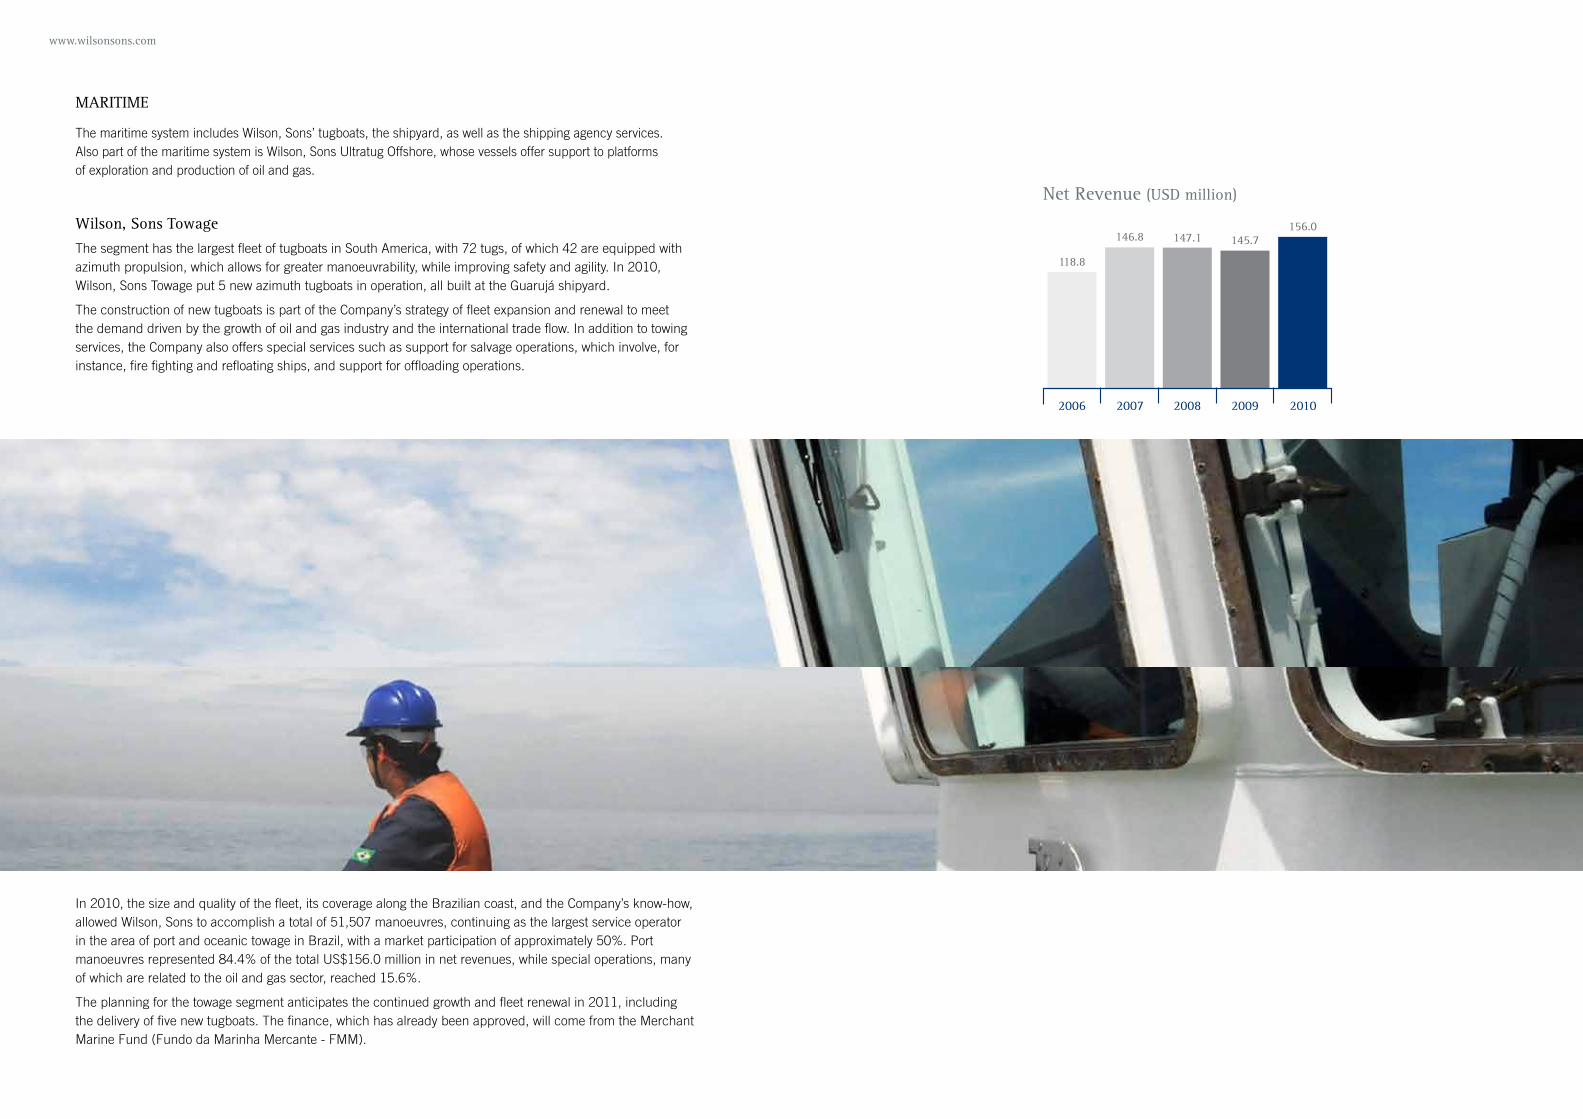
MARITIME
The maritime system includes Wilson, Sons’ tugboats, the shipyard, as well as the shipping agency services. Also part of the maritime system is Wilson, Sons Ultratug Offshore, whose vessels offer support to platforms of exploration and production of oil and gas.
Wilson, Sons Towage
The segment has the largest fleet of tugboats in South America, with 72 tugs, of which 42 are equipped with azimuth propulsion, which allows for greater manoeuvrability, while improving safety and agility. In 2010, Wilson, Sons Towage put 5 new azimuth tugboats in operation, all built at the Guarujá shipyard.
The construction of new tugboats is part of the Company’s strategy of fleet expansion and renewal to meet the demand driven by the growth of oil and gas industry and the international trade flow. In addition to towing services, the Company also offers special services such as support for salvage operations, which involve, for instance, fire fighting and refloating ships, and support for offloading operations.
In 2010, the size and quality of the fleet, its coverage along the Brazilian coast, and the Company’s know-how, allowed Wilson, Sons to accomplish a total of 51,507 manoeuvres, continuing as the largest service operator in the area of port and oceanic towage in Brazil, with a market participation of approximately 50%. Port manoeuvres represented 84.4% of the total US$156.0 million in net revenues, while special operations, many of which are related to the oil and gas sector, reached 15.6%.
The planning for the towage segment anticipates the continued growth and fleet renewal in 2011, including the delivery of five new tugboats. The finance, which has already been approved, will come from the Merchant Marine Fund (Fundo da Marinha Mercante - FMM).
Net Revenue (USD million)
118.8
146.8 147.1 145.7156.0
2006 2007 2008 2009 2010

Annual Report 2010 www.wilsonsons.com
43
12.58.0
52.2
27.4
43.3
2006 2007 2008 2009 2010
Wilson, Sons Shipyards
Located in Guarujá (SP), the Company’s shipyard occupies a 20,000 m2 area and has the capacity for simultaneous building and maintaining small and medium vessels.
In 2010, eight vessels were delivered, being five tugboats equipped with azimuth propulsion, and another three PSVs (Platform Supply Vessels) used to support oil platforms. The construction of all vessels was concluded ahead of plan ensuring customer satisfaction and anticipating of cash flows for the Company.
The efficiency of Wilson, Sons’ shipyard is derived from the constant search for improvement with the use of cutting edge technologies and the development of local suppliers to ensure the delivery and the quality of the materials used.
The Shipyard’s growth is reflected in the addition of 57.8% in net revenues, US$ 43.3 million in 2010 compared to US$ 27.4 million in 2009.
Taking into consideration the growth and given the strategic importance, the shipyard expansion project known as Guarujá II began in 2010. It will double capacity and will add a new dry-dock. The capacity expansion will allow for the construction of medium-sized vessels in the facility. US$ 47 million will be invested in the project. Scheduled for completion in late 2011, this expansion is of great importance for the increased participation of the Company in the oil and gas market. The shipyard´s geographical location, close to two major oil basins in Brazil – Santos (SP) and Campos (RJ), means the shipyard in Guarujá is ideally suited for both construction and maintenance of OSVs (Offshore Support Vessels).
Also aligned with the Company’s vision of future, the project for the creation of a new shipyard in the port of Rio Grande (RS) has progressed after being granted a preliminary permit by the authorities. Approximately US$ 155 million will be invested in this construction. In addition to infrastructure and equipment, the facility will include a naval construction technical centre for the construction of vessels to support offshore platforms, such as AHTS - Anchor Handling Tug Supply, as well as port and oceanic tugboats. The technical centre will train welders, assemblers, and painters, following the models of the existing shipyard’s model on the coast of São Paulo.
The Shipyard expansion projects in Guarujá and in Rio Grande will be financed with funds from the Merchant Marine Fund (Fundo da Marinha Mercante).
Net Revenue (USD million)
Welder in action at Guarujá (SP)
Annual Report 2010 www.wilsonsons.com
45
8.410.7
21.6
38.1
28.0
2006 2007 2008 2009 2010
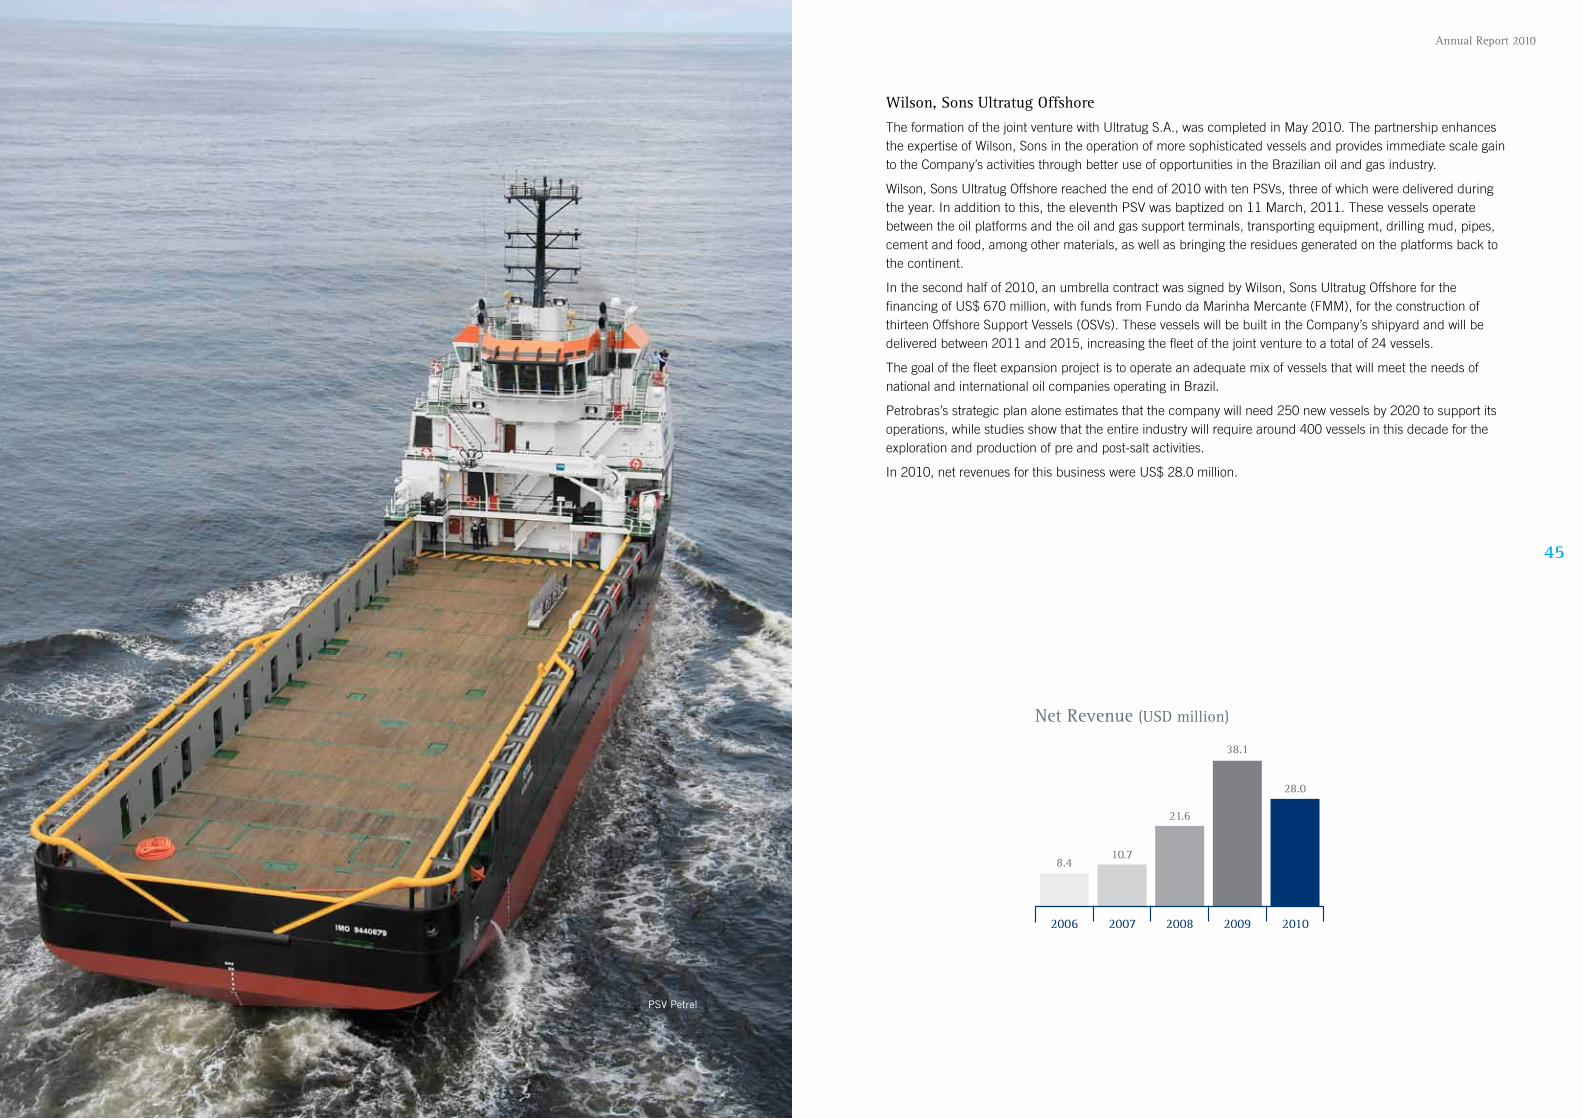
Wilson, Sons Ultratug Offshore
The formation of the joint venture with Ultratug S.A., was completed in May 2010. The partnership enhances the expertise of Wilson, Sons in the operation of more sophisticated vessels and provides immediate scale gain to the Company’s activities through better use of opportunities in the Brazilian oil and gas industry.
Wilson, Sons Ultratug Offshore reached the end of 2010 with ten PSVs, three of which were delivered during the year. In addition to this, the eleventh PSV was baptized on 11 March, 2011. These vessels operate between the oil platforms and the oil and gas support terminals, transporting equipment, drilling mud, pipes, cement and food, among other materials, as well as bringing the residues generated on the platforms back to the continent.
In the second half of 2010, an umbrella contract was signed by Wilson, Sons Ultratug Offshore for the financing of US$ 670 million, with funds from Fundo da Marinha Mercante (FMM), for the construction of thirteen Offshore Support Vessels (OSVs). These vessels will be built in the Company’s shipyard and will be delivered between 2011 and 2015, increasing the fleet of the joint venture to a total of 24 vessels.
The goal of the fleet expansion project is to operate an adequate mix of vessels that will meet the needs of national and international oil companies operating in Brazil.
Petrobras’s strategic plan alone estimates that the company will need 250 new vessels by 2020 to support its operations, while studies show that the entire industry will require around 400 vessels in this decade for the exploration and production of pre and post-salt activities.
In 2010, net revenues for this business were US$ 28.0 million.
Net Revenue (USD million)
PSV Petrel
Annual Report 2010 www.wilsonsons.com
4717.820.4
17.615.2
17.6
2006 2007 2008 2009 2010
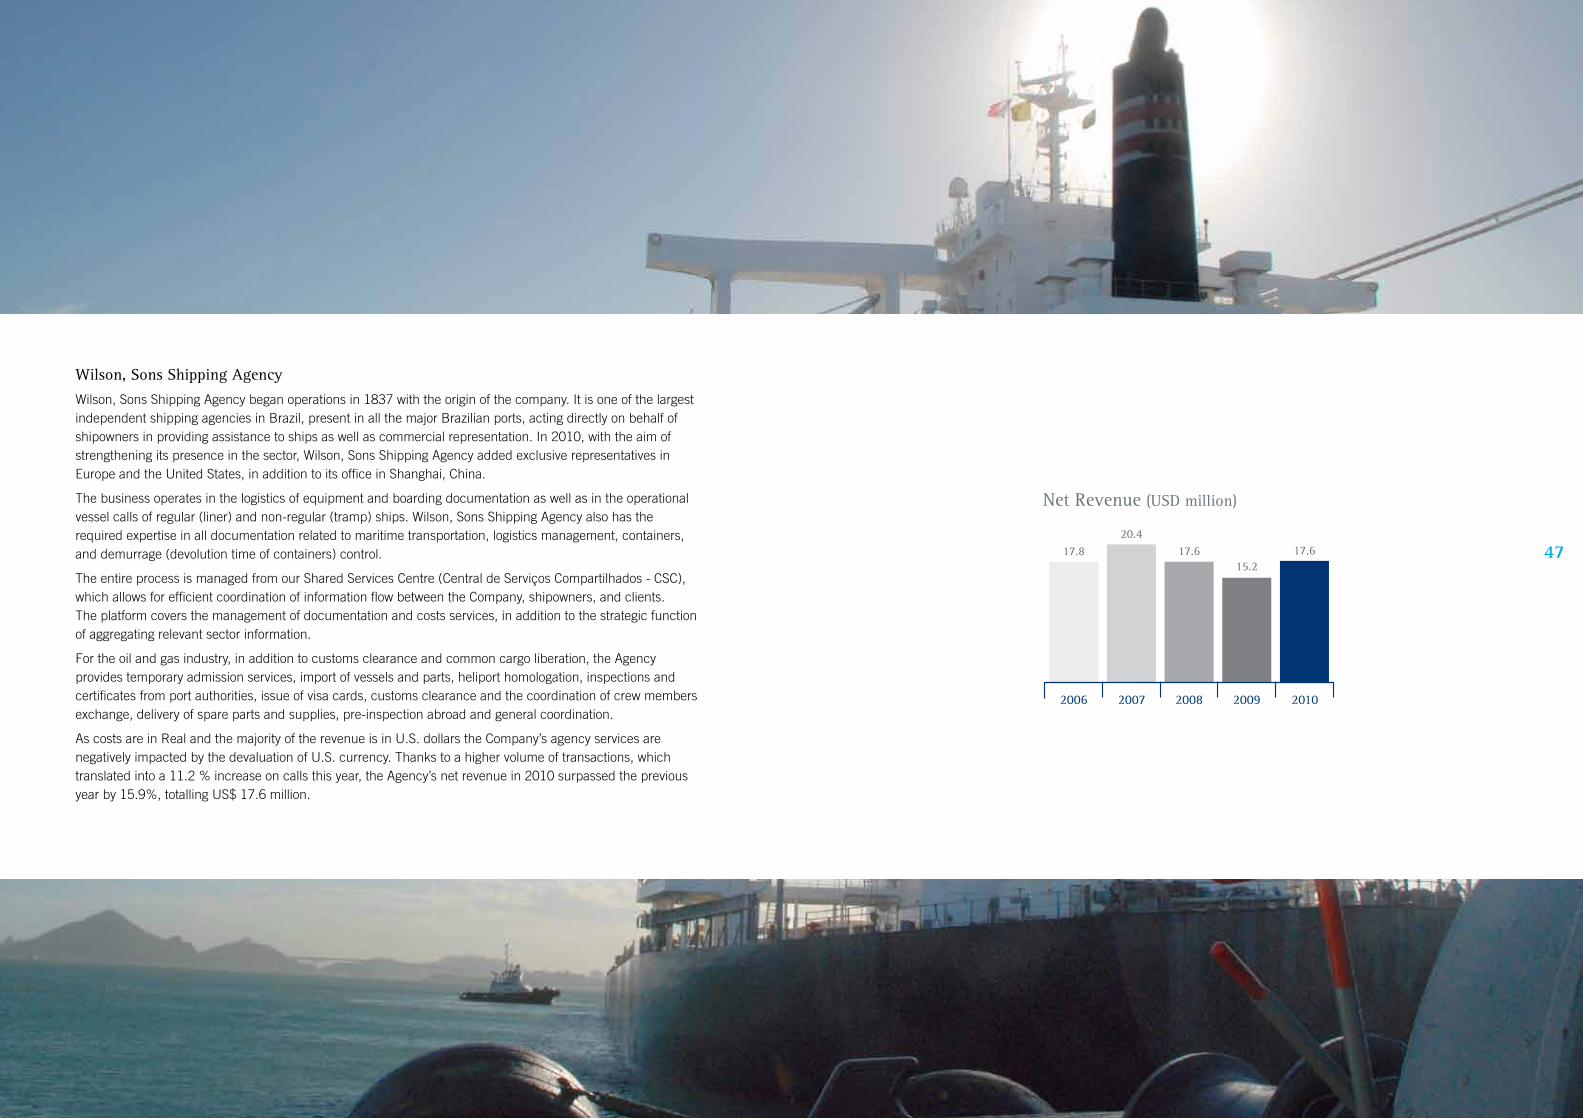
Wilson, Sons Shipping Agency
Wilson, Sons Shipping Agency began operations in 1837 with the origin of the company. It is one of the largest independent shipping agencies in Brazil, present in all the major Brazilian ports, acting directly on behalf of shipowners in providing assistance to ships as well as commercial representation. In 2010, with the aim of strengthening its presence in the sector, Wilson, Sons Shipping Agency added exclusive representatives in Europe and the United States, in addition to its office in Shanghai, China.
The business operates in the logistics of equipment and boarding documentation as well as in the operational vessel calls of regular (liner) and non-regular (tramp) ships. Wilson, Sons Shipping Agency also has the required expertise in all documentation related to maritime transportation, logistics management, containers, and demurrage (devolution time of containers) control.
The entire process is managed from our Shared Services Centre (Central de Serviços Compartilhados - CSC), which allows for efficient coordination of information flow between the Company, shipowners, and clients. The platform covers the management of documentation and costs services, in addition to the strategic function of aggregating relevant sector information.
For the oil and gas industry, in addition to customs clearance and common cargo liberation, the Agency provides temporary admission services, import of vessels and parts, heliport homologation, inspections and certificates from port authorities, issue of visa cards, customs clearance and the coordination of crew members exchange, delivery of spare parts and supplies, pre-inspection abroad and general coordination.
As costs are in Real and the majority of the revenue is in U.S. dollars the Company’s agency services are negatively impacted by the devaluation of U.S. currency. Thanks to a higher volume of transactions, which translated into a 11.2 % increase on calls this year, the Agency’s net revenue in 2010 surpassed the previous year by 15.9%, totalling US$ 17.6 million.
Net Revenue (USD million)
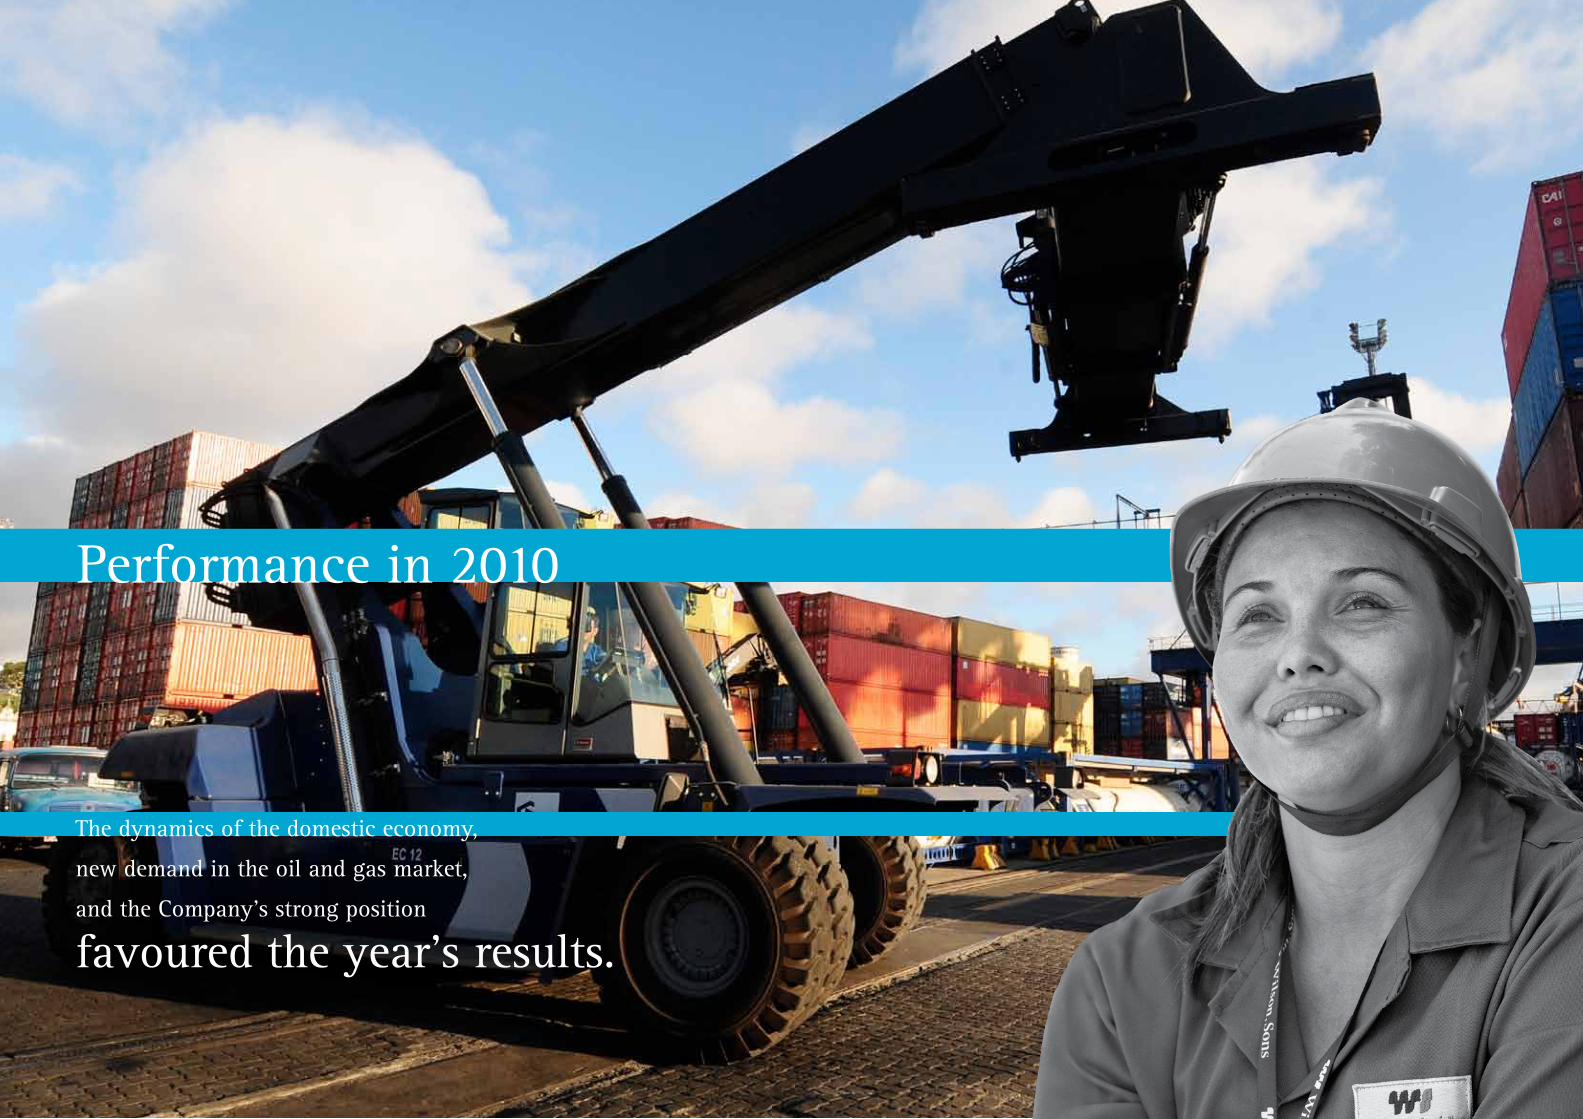
Performance in 2010
The dynamics of the domestic economy,
new demand in the oil and gas market,
and the Company’s strong position
favoured the year’s results.
Annual Report 2010 www.wilsonsons.com
51
Management Discussion & Analysis – MD&A
ECONOMIC BACKGROUND
The Brazilian economy showed great expansion in the level of activity during the first semester of the year. GDP increased 8.8% in the first half of 2010 when compared with the same period of 2009. Although growth started decelerating in the third quarter, the domestic economy continued to experience high levels of activity. GDP reached, in current values, US$ 2.1 trillion in the year, a rise of 7.5% versus 2009 according to data published by the Brazilian Institute of Geography and Statistics (IBGE).
Even though the advance in GDP was favoured by a weak comparison, the evolution was the biggest since 1986 and reflected the positive performance of agriculture (+6.5%), industry (+10.5%), and services (+5.4%).GDP per capita also saw an increase of 6.5%. Domestic consumption provided support to the Brazilian economy, a trend that continued from the previous year. Within the components of demand, household expenditures should be highlighted as they increased 7.0% in 2010, the 7th consecutive year of growth, with increases in both payroll and personal credit.
Following the economic expansion trend, the investment rate was of 18.4% of the GDP, 1.5 p.p. higher than 2009 (16.9%). Despite this, the savings rate reached 16.5% of the GDP against 14.7% of the previous year, an increase of 1.8p.p.
The Brazilian balance of payments registered a surplus of US$ 49.1 billion in 2010. Despite this surplus, the country experienced a current account deficit of US$ 47.5 billion caused by rising import volumes, an increase in profit remittances and dividends, and higher expenditure on services, especially transportation, equipment rental, and tourism abroad. Unlike previous periods, the current account deficit was accompanied by an increase in foreign investments. Net inflows from foreign direct investments (FDI) reached a record US$ 48.5 billion in 2010, corresponding to an increase of 86.8% compared to 2009. The participation in the capital of Brazilian businesses, including conversions into investments, totalled new inflows of US$ 40.1 billion, while inter-company loans totalled US$ 8.3 billion in the year.
The Brazilian balance of trade reflected the effects of the Real appreciation and heavy internal consumption. In 2010, the current trade totalled US$ 383.6 billion, with exports of US$ 201.9 billion and imports of US$ 181.6 billion, increases of 36.6%, 32.0% and 42.2% over 2009, respectively. The significant growth rates indicate the resumption of the Brazilian international trade and a robust domestic economy.
Compared to 2009, sales of commodities advanced 45.3% while those of semi- manufactured and manufactured goods presented expansion of 37.6% and 18.1%, respectively. Manufactured goods correspond for 39.4% of the total exports of Brazil in 2010. The trade surplus fell to US$ 20.3 billion in the year, the lowest since 2002, representing a decrease of 19.8% in relation to the US$ 25.3 billion of 2009. The reduction in trade surplus is a result of a larger increase in imports than that of exports; the appreciation of the Brazilian Real; and the aggressive performance of Brazil’s main trading partners, stimulated by the depreciation of their currencies.
While some of the indicators are not favourable, such as the current account deficit and the reduction in trade surplus, some are positive, such as international reserves and the foreign debt position that improved and remained at comfortable levels. International reserves reached US$ 288.6 billion by the end of December, an increase of US$ 49.5 billion or 20.7% when compared to 2009. Estimated total foreign debt at year-end was US$ 255.7 billion, being US$ 198.7 billion long-term and US$ 56.9 billion short-term, a decline of 9.3% from US$ 282.0 billion of the previous year.
After having finished 2009 at 4.3%, inflation stood at 5.9% in 2010, measured by the National Index of Broad Consumer Prices (IPCA). It is the highest level since 2004, when the index was 7.6%. 2010 inflation was above the 4.5% target established by National Monetary Council, although below the upper limit of 6.5%. The interest rate target set by the Monetary Policy Committee (the Selic rate) for the year averaged 10.1%.
The strengthening of the Brazilian Real, which started in 2009, continued in 2010. Among the measures adopted by Brazilian Central Bank to restrain this trend were open market interventions of US$ 41 billion, with limited success. This volume was higher than the foreign currency flow that entered Brazil, which is estimated to be around US$ 26 billion. The average exchange rate ended 2010 at R$1.76 and the PTAX exchange rate was R$1.67, a 3.2% and 4.4% decline for the year, respectively.
2006 2007 2008 2009 2010
Selic rate – annualised (% p.a.)1 13.25% 11.25% 13.75% 8.75% 10.75%
PTAX Exchange Rate (R$ x US$)1 2.14 1.77 2.34 1.74 1.67
USD appreciation vs Real2 -8.52% -17.00% 31.87% -25.42% -4.37%
IPCA2 3.14% 4.46% 5.43% 4.31% 5.91%
1. End of the period.
2. Accumulated in the period.
The Company’s financial statements are reported based on the International Financial Report Standards (IFRS). The adoption of IFRS by Wilson, Sons date back to 2004, due to the fact that Wilson, Sons is controlled by Ocean Wilson Holdings Limited, a publicly-traded company with its shares negotiated in the London Stock Exchange. Thus, the Brazilian legislation system that required publicly-traded companies in Brazil to report based on IFRS starting in 2010 has already been Wilson, Sons’ standard for seven years. The purpose of this legislation is to align local accounting standards with the international practice.
The comments on the Company’s economic-financial performance in 2010 are presented, detailing the operational and financial information on Wilson, Sons’ different businesses. Except when indicated otherwise, all data presented here are in US dollars. Wilson, Sons’ operational and financial performance is directly influenced by three main factors: (i) Brazilian international trade; (ii) the Brazilian oil and gas industry; and (iii) the growth in the Brazilian domestic economy.
Annual Report 2010 www.wilsonsons.com
53
OPERATIONAl PERFORMANCE
Port and logistics System Container Terminals and BrascoNet revenues from Port Terminals in the year reached US$ 228.0 million, while operational profit was US$ 62.7 million, amounts 30.0% and 34.8% higher when compared to 2009. Total volumes for our container terminals reached 928.7 thousand TEU (20-foot container equivalent units), an increase of 4.6% year-over-year. Volume growth was constrained by the export profile of the Company’s terminals, which suffered from the effects of the decrease in exports as a whole, which was reflected in the reduction of deep-sea cargo movements. The revenue expansion resulted principally from a significant rise in Brasco’s activities, higher volumes of cabotage and transhipment movements in Tecon Rio Grande and Tecon Salvador, up 8.8% and 17.3% respectively. Both Tecon Rio Grande and Tecon Salvador also benefited from a better pricing mix.
Brasco, our logistics terminal for the oil and gas industry, benefited from the sector’s strength which translated into new contracts and demand for auxiliary services. Net revenues and EBITDA presented increases of 84.2% and 63.8% in the year and ended 2010 at US$ 49.2 million and US$ 14.9 million, respectively.
The appreciation of the Real in relation to the US dollar during the course of 2010 boosted imports and at the same time weakened national exports. In contrast, cabotage volumes were favoured by this scenario and the strength in the domestic economy. Cabotage volumes increased 14.3% while other operations grew 37.8% in the period.
EBITDA of the Port Terminals business for the year was US$ 76.3 million, 30.9% above 2009. EBITDA margin was nearly stable, ending the year at 33.5% against a comparative 33.2% for the previous year.
PORT TERMINALSTotal Volume (TEU ‘000))
2006 2007 2008 2009 2010 2010 x 2009 (%)
Deep-sea 623.2 650.6 627.5 639.0 611.7 -4.3%
Cabotage 102.0 113.1 120.4 112.7 128.8 14.3%
Others* 158.6 135.8 117.2 136.6 188.2 37.8%
Total 883.8 899.5 865.1 888.3 928.7 4.5%
Logistics
The expanding level of activity in the Brazilian domestic economy benefited the signing of new contracts, the renewal of existing ones, and the growth of in-house operations. Net revenues reached US$102.4 million, EBITDA came to US$13.1 million and EBITDA margin reached 12.8%, corresponding to increases of 35.2%, 86.2%, and 3.5% p.p. when compared to 2009, respectively.
Maritime System TowageNet revenues for the Towage business increased to US$156.2 million, up 7.2% in 2010 in comparison with 2009. The number of harbour manoeuvres increased +2.9% and demand for special operations (which included salvage operations, support to the construction of platforms and LNG terminals) continued strong. The participation of special operations in the total towage revenue doubled in the past three years, going from 7.6% in 2007 to 15.6% in 2010.
EBITDA came to US$53.4 million while EBITDA margin was 34.3%, which corresponds to respective decreases of 12.8% and 7.8 p.p. when compared to 2009. This decline is due to the positive impact of US$6.5 million in fiscal credits in the 2009 result that did not repeat in 2010. Actually, 2010 results included the negative effect of fiscal debts totalling US$1.0 million. The appreciation of the Real also affected the margin of this business since a large proportion of costs are Real-based, while most of the revenues are in US dollars.
OffshoreAnnual results in this business were impacted by the aforementioned formation of the Wilson, Sons Ultratug Offshore joint venture. After the partnership was formalised in May, 2010, this business no longer pays charter costs to the partner for two PSVs, but the results were reported proportionally, with Wilson, Sons’ 50% participation. Additionally, four vessels migrated from the spot
market to long-term contracts, negatively impacting the results. Net revenues, EBITDA, and EBITDA margin were of US$28.0 million, US$13.1 million and 46.8%, which represent declines of 26.5%, 31.6% and 3.5 p.p. in relation to 2009, when the results had been consolidated as a 100%-owned subsidiary.
ShipyardAnnual net revenues reached US$43.3 million, 57.8% higher than that of 2009, thanks to the delivery of three PSVs. EBITDA totaled US$6.1 million, which represents a decrease of 38.3% when compared to the previous year. The EBITDA margin registered a decline of 21.9 p.p., going from 36.0% in 2009 to 14.1% in 2010. The decreases show the effects of the formation of the Wilson, Sons Ultratug Offshore joint venture: 50% of activities under construction in the Shipyard are recorded as third parties’ revenue, while the remaining 50% are considered an inter-company activity, reflected only in the Fixed Asset account and, therefore, not incorporated in the margin of the business.
Shipping AgencyThe recovery observed in the flow of international trade in 2010 led to a growth of volumes and increases in all operating indicators: larger numbers of vessel calls (+11.2%), BLs (bills of lading) issued (+13.1%) and containers controlled (+5.6%). Net revenues totalled US$17.6 million, 15.9% higher than that of 2009. The EBITDA margin had a decline of 10.7 p.p. reducing from 15.3% in 2009 to 4.6% in 2010. The margin decline was due to higher personnel expenses, along with higher provisions for stock options. The appreciation of the Real also affected the margin of the business since a large proportion of the costs are Real-based, while revenues are in US dollars.

Annual Report 2010 www.wilsonsons.com
55-41.5 0.86.1
13.1 13.1
53.4
76.3 Port Terminals
Towage
Offshore
logistics
Shipping Agency
Shipyards
Corporate
Port Terminals
Towage
logistics
Offshore
Shipping Agency
Shipyards
3.1%7.5%
4.9%
17.8%
39.6%
27.1%
Consolidated Performance
The Company’s net revenues reached US$575.6 million, representing an increase of 20.4% in the year when compared to 2009 (US$477.9 million). Higher revenues were a reflect of bigger demand for Wilson, Sons port, maritime, and logistics services assisted by an expansion of 36.6% in international trade (exports plus imports) and the outstanding growth in the oil and gas sector.
More than 65% of Wilson, Sons’ revenues comes from Port Terminals and Towage, with respective annual revenue increases of 30.0% and 7.1%, contributing to the Company’s strong performance. The expansion of Brasco’s activities, the growth of cabotage and transhipment at both Tecon Rio Grande and Salvador, and the increase of special operations offset the negative impact caused by the appreciation of the Real and the adverse effect on the volumes of exports.
A strong domestic market created favourable conditions for the development of the Company’s Logistics business that accounts for 17.8% of total revenues, and the services provided by Wilson, Sons Shipping Agency, also contributing to the Company’s revenue growth.
The Company’s total annual costs and expenses amounted to US$474.6 million in 2010, 32.7% higher than 2009 (US$357 million). It is worth mentioning that this amount reflects the ongoing effects of the strengthening of the Real against the US Dollar, which is Wilson, Sons’ functional currency. At the same time, costs and expenses were affected by increases of 35.6% in inputs and raw materials, and 33.3% in personnel expenses. Both items together correspond to 56.0% of total costs and expenses. Inputs and raw materials were impacted by construction activities in the Company’s shipyard. Personnel expense increases were due to increases in the number of employees to meet the growth demands for Wilson, Sons’ business operations. Depreciation and amortisation expenses totalled US$42.9 million in 2010, 33.6% higher than that of 2009. Other Operating Expenses also impacted the result in 2010, being of US$188.3 million, US$37.0 million higher (+24.4%) than the US$151.3 million in 2009. The main impacts came from the increased costs of services (+US$10.1 million), and other rentals (+US$6.6 million).
Consolidated EBITDA was US$121.4 million in 2010, falling 5.4% from US$128.4 million in the previous year. The EBITDA margin in 2010 also declined to 21,1% from 26.9% in 2009. The main reasons for the margin decline were: (i) fiscal credits in the amount of US$6.5 million in the 2009 results, while 2010 results included the negative effects of a debit amount totalling US$1.7 million in the same line; (ii) reduction of Offshore revenues as a consequence of having more vessels operating in long-term contracts with lower daily rates; (iii) the formalisation of Wilson, Sons Ultratug joint venture with Wilson, Sons’ 50% participation proportionally consolidated.
The Company registered net financial income of US$2.1 million in 2010 compared to US$24.8 million in 2009. The reduction is mostly due to financial revenues of US$13.9 million in 2010 against US$34.3 million in 2009, a decline that resulted principally from the impact of the lesser depreciation of the US Dollar in face of the Real in 2010. At the same time, financial expenses increased by 23.7%, from US$9.6 million in 2009 to US$11.8 million in 2010, as a result of the Company’s higher debt level.
The consolidated net income in 2010 reached US$70.4 million, with a net margin of 12.2%, representing a fall of 21.8% over the previous year’s profit (US$90.0 million) and a decrease of 6.6 p.p. in the net margin over the same period. The decrease of net profit is mostly due to the decline in the Company’s operating profit as previously mentioned.
Net Revenue 2010US$ 575.6 million
EBITDA 2010US$ 121.4 million
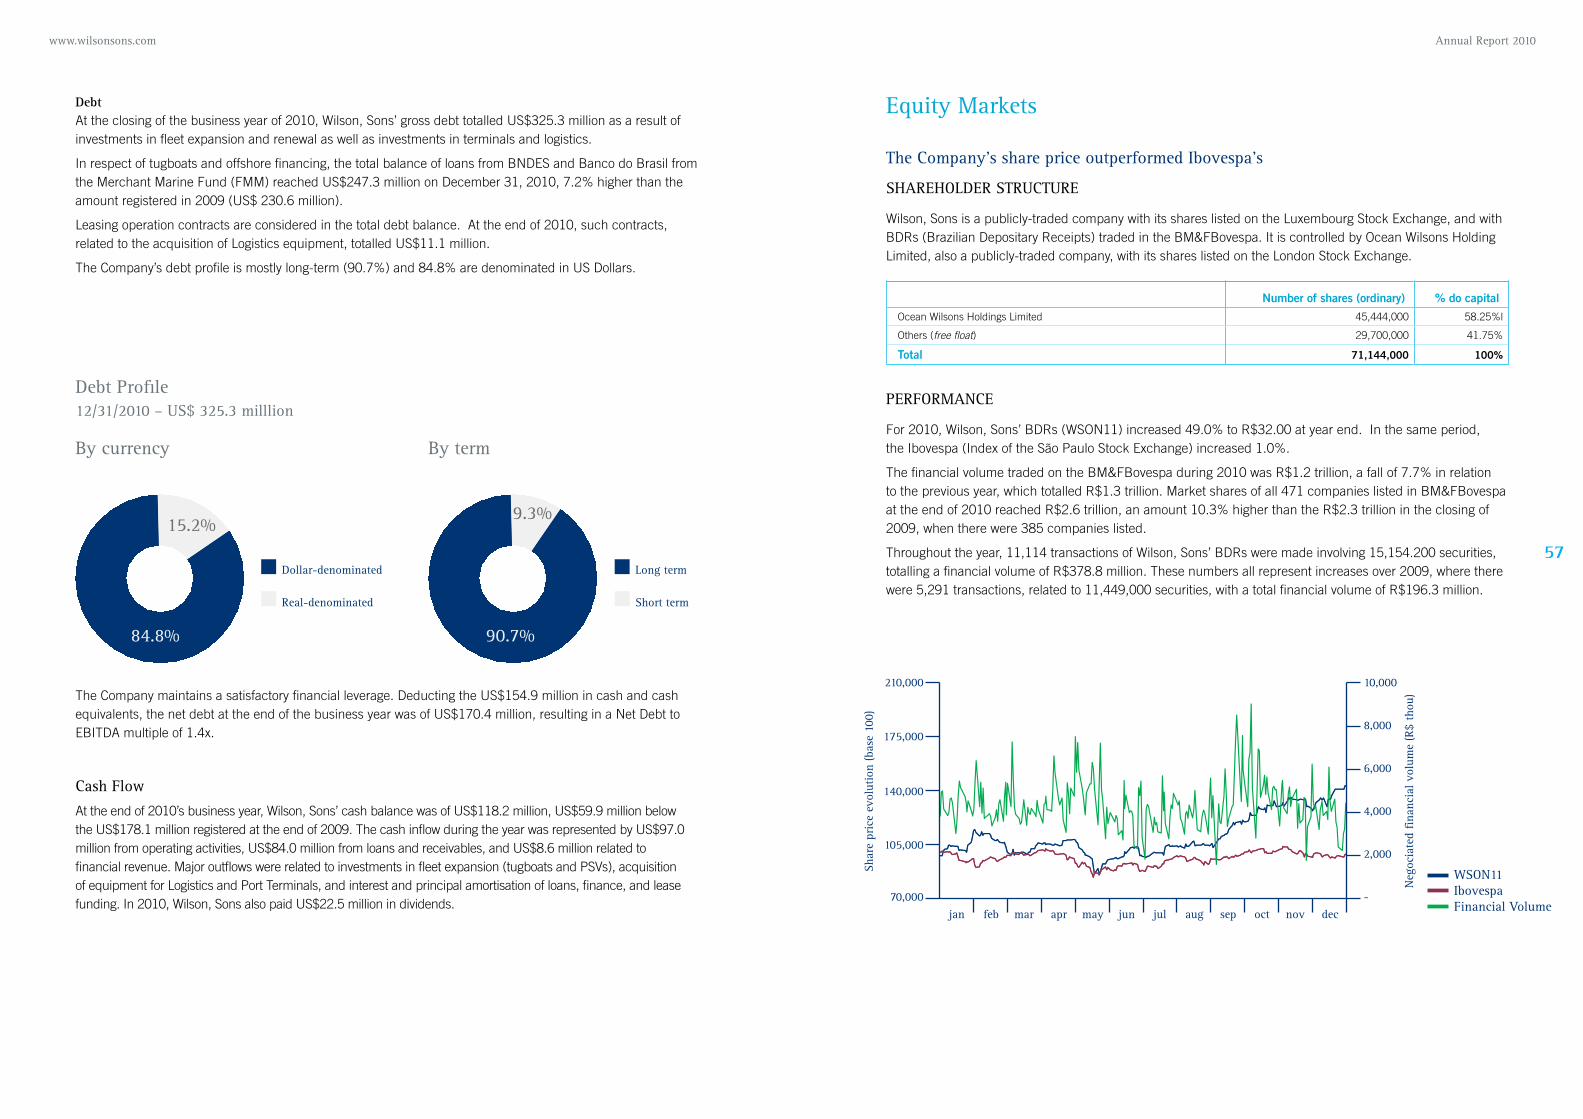
Annual Report 2010 www.wilsonsons.com
57Dollar-denominated
Real-denominated
long term
Short term
15.2%
84.8%
9.3%
90.7%
DebtAt the closing of the business year of 2010, Wilson, Sons’ gross debt totalled US$325.3 million as a result of investments in fleet expansion and renewal as well as investments in terminals and logistics.
In respect of tugboats and offshore financing, the total balance of loans from BNDES and Banco do Brasil from the Merchant Marine Fund (FMM) reached US$247.3 million on December 31, 2010, 7.2% higher than the amount registered in 2009 (US$ 230.6 million).
Leasing operation contracts are considered in the total debt balance. At the end of 2010, such contracts, related to the acquisition of Logistics equipment, totalled US$11.1 million.
The Company’s debt profile is mostly long-term (90.7%) and 84.8% are denominated in US Dollars.
The Company maintains a satisfactory financial leverage. Deducting the US$154.9 million in cash and cash equivalents, the net debt at the end of the business year was of US$170.4 million, resulting in a Net Debt to EBITDA multiple of 1.4x.
Cash Flow
At the end of 2010’s business year, Wilson, Sons’ cash balance was of US$118.2 million, US$59.9 million below the US$178.1 million registered at the end of 2009. The cash inflow during the year was represented by US$97.0 million from operating activities, US$84.0 million from loans and receivables, and US$8.6 million related to financial revenue. Major outflows were related to investments in fleet expansion (tugboats and PSVs), acquisition of equipment for Logistics and Port Terminals, and interest and principal amortisation of loans, finance, and lease funding. In 2010, Wilson, Sons also paid US$22.5 million in dividends.
Equity Markets
The Company’s share price outperformed Ibovespa’s
ShAREhOlDER STRUCTURE
Wilson, Sons is a publicly-traded company with its shares listed on the Luxembourg Stock Exchange, and with BDRs (Brazilian Depositary Receipts) traded in the BM&FBovespa. It is controlled by Ocean Wilsons Holding Limited, also a publicly-traded company, with its shares listed on the London Stock Exchange.
Number of shares (ordinary) % do capital
Ocean Wilsons Holdings Limited 45,444,000 58.25%l
Others (free float) 29,700,000 41.75%
Total 71,144,000 100%
PERFORMANCE
For 2010, Wilson, Sons’ BDRs (WSON11) increased 49.0% to R$32.00 at year end. In the same period, the Ibovespa (Index of the São Paulo Stock Exchange) increased 1.0%.
The financial volume traded on the BM&FBovespa during 2010 was R$1.2 trillion, a fall of 7.7% in relation to the previous year, which totalled R$1.3 trillion. Market shares of all 471 companies listed in BM&FBovespa at the end of 2010 reached R$2.6 trillion, an amount 10.3% higher than the R$2.3 trillion in the closing of 2009, when there were 385 companies listed.
Throughout the year, 11,114 transactions of Wilson, Sons’ BDRs were made involving 15,154.200 securities, totalling a financial volume of R$378.8 million. These numbers all represent increases over 2009, where there were 5,291 transactions, related to 11,449,000 securities, with a total financial volume of R$196.3 million.
Debt Profile12/31/2010 – US$ 325.3 milllion
By currency By term

Annual Report 2010 www.wilsonsons.com
59
8,263 8,000
16,007 16,007
22,553
2006 2007 2008 2009 2010
RETURN TO ShAREhOlDERS
The Annual Shareholders’ Meeting of the 26th April, 2010 approved the reduction of the Company’s share premium account capital from US$119,619,348.42 to US$69,619,348.42 as well as the transfer of the resulting amount of US$50 million credit to the contributed surplus account. This movement was made in accordance to the Bermuda corporate law, as stated in sections 40 (1) and 46 of the law (lei) “the Companies Act 1981 of Bermuda”.
The amount of US$22,552,648.00 was distributed to shareholders from the contributed surplus and such amount corresponds to the statutory provision of 25% over the net income of 2009. The actual value of dividends paid on May 17th, 2010 to Wilson, Sons’ BDRs shareholders was of R$0.5626750 per BDR, equivalent to US$0.317 per BDR converted using the PTAX exchange rate published on 11th May.
Dividends (US$ thou)
value-Added Statement
The Value Added Statement shows the Company’s value creation capacity and the distribuition of such value among stakeholders.
In 2010, Wilson, Sons’ economic activities generated US$ 406.4 million in terms of wealth added to society, a value 13.4% higher than the one of 2009. This position shows an added value of 70.3% over the net operating revenue of 2010. In other words: US$ 0.70 out of every US$ 1.00 of the income from operations was distributed among the Government (federal, state and city taxes), third parties (interest, rents, and others) and Equity (retained earnings and non-controlling participation).
value Added Statement on 31 December 2010 and 2009(IN AMERICAN DOllARS)
The main variations between the distributions occurred in the percentage correspondent to employees, government and equity. The value distributed to the employees grew 28.9% advancing from US$ 134.0 million in 2009 to US$ 172.7 million in 2010.
Similarly growth in operations and the services rendered by Wilson, Sons increased the values collected in the form of taxes.
2 0 1 0 2 0 0 9
VALUE ADDED CREATIONRevenues 657,718 532,416
Goods and services sales 633,565 524,020
Other revenues 24,064 7,232
Allowance for doubtful debts 89 1,164
Acquired inputs -225,500 -181,879
Cost of products and services sold -167,595 -138,545
Maintenance -31,635 -22,909
Energy, fuel and services hired -22,017 -15,350
Other costs -4,253 -5,075
Gross value added 432,218 350,537
Depreciation and amortisation -42,920 -32,065
Net value added 389,298 318,472
Earnings from third-parties 17,126 40,024
Financial revenues 17,126 40,024
Total value added for distribution 406,424 358,496
VALUE ADDED DISTRIBUTIONPersonnel 172,684 133,968
Direct remuneration 138,576 109,462
Benefits 26,170 18,557
FGTS 7,938 5,949
Taxes and social contributions 98,920 76,855
Federal 77,604 59,814
State 1,613 1,269
City 19,703 15,772
Third-party remuneration 64,315 57,689
Rent 50,531 43,380
Interest 13,312 13,638
Other 472 671
Equity 70,505 89,984
Earnings retained 69,996 88,530
Non controlling participation 509 1,454
Total value added distributed 406,424 358,496
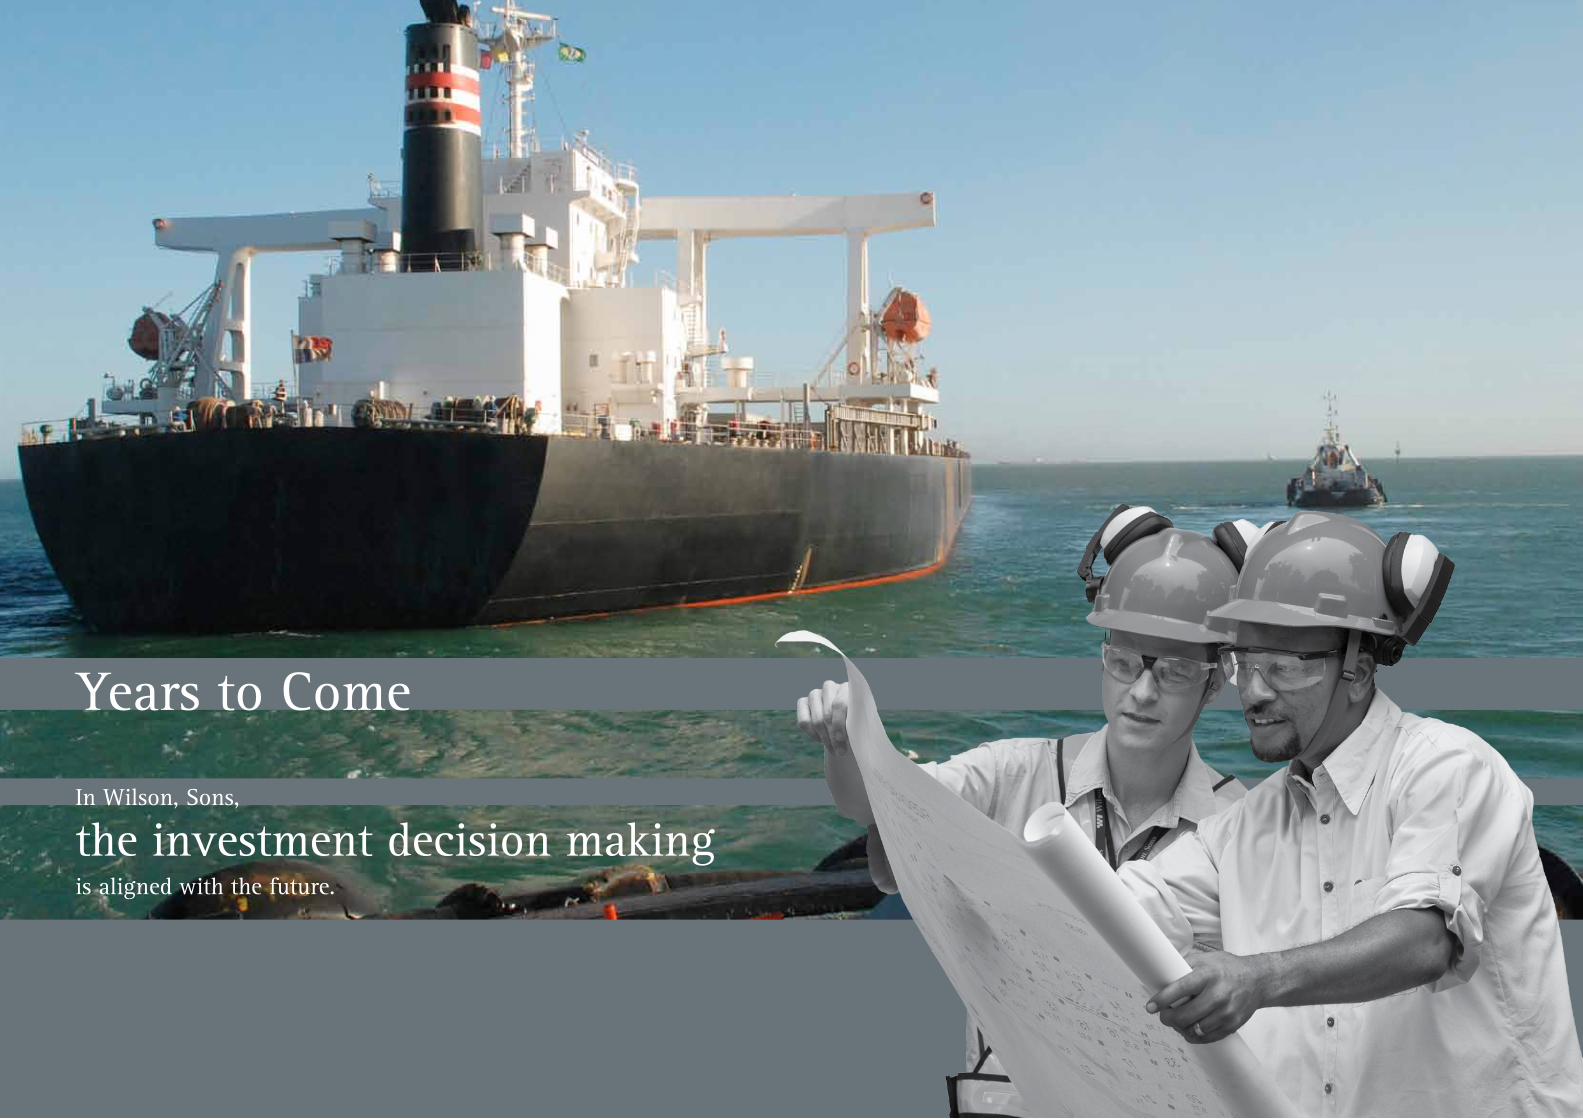
years to Come
In Wilson, Sons,
the investment decision making is aligned with the future.
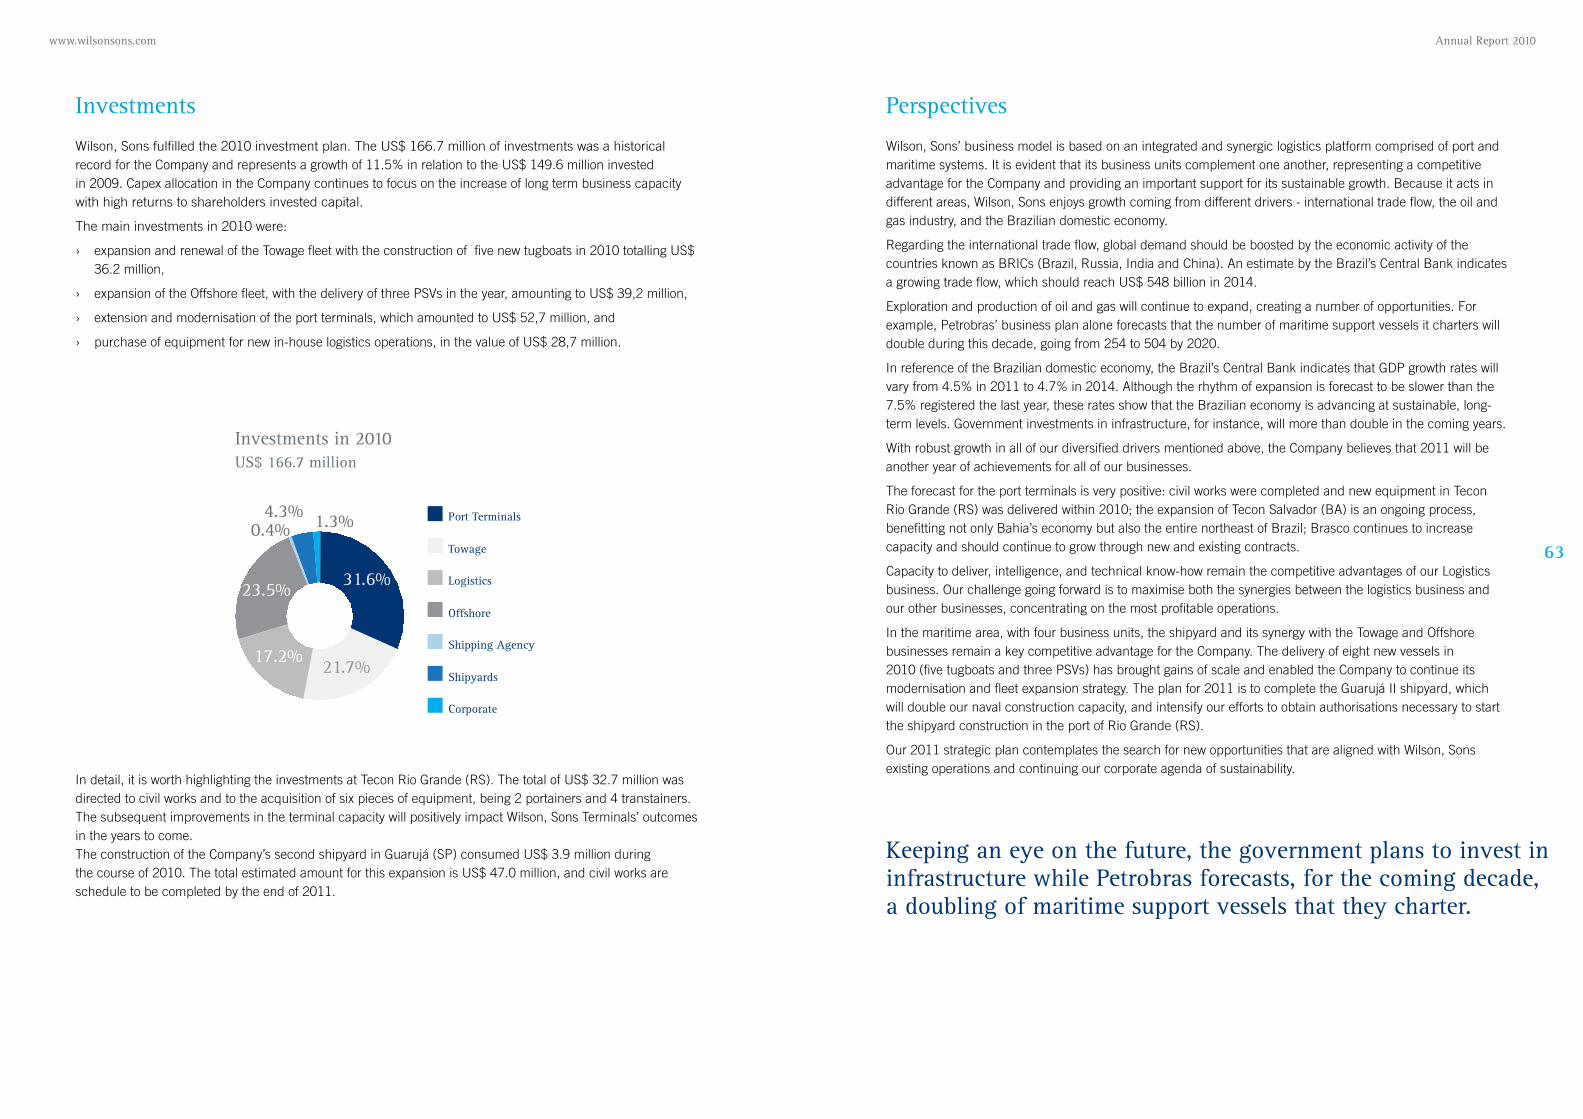
Annual Report 2010 www.wilsonsons.com
63
Port Terminals
Towage
Offshore
logistics
Shipping Agency
Shipyards
Corporate
1.3%4.3%0.4%
17.2%
23.5% 31.6%
21.7%
Investments
Wilson, Sons fulfilled the 2010 investment plan. The US$ 166.7 million of investments was a historical record for the Company and represents a growth of 11.5% in relation to the US$ 149.6 million invested in 2009. Capex allocation in the Company continues to focus on the increase of long term business capacity with high returns to shareholders invested capital.
The main investments in 2010 were:
› expansion and renewal of the Towage fleet with the construction of five new tugboats in 2010 totalling US$ 36.2 million,
› expansion of the Offshore fleet, with the delivery of three PSVs in the year, amounting to US$ 39,2 million,
› extension and modernisation of the port terminals, which amounted to US$ 52,7 million, and
› purchase of equipment for new in-house logistics operations, in the value of US$ 28,7 million.
In detail, it is worth highlighting the investments at Tecon Rio Grande (RS). The total of US$ 32.7 million was directed to civil works and to the acquisition of six pieces of equipment, being 2 portainers and 4 transtainers. The subsequent improvements in the terminal capacity will positively impact Wilson, Sons Terminals’ outcomes in the years to come. The construction of the Company’s second shipyard in Guarujá (SP) consumed US$ 3.9 million during the course of 2010. The total estimated amount for this expansion is US$ 47.0 million, and civil works are schedule to be completed by the end of 2011.
Perspectives
Wilson, Sons’ business model is based on an integrated and synergic logistics platform comprised of port and maritime systems. It is evident that its business units complement one another, representing a competitive advantage for the Company and providing an important support for its sustainable growth. Because it acts in different areas, Wilson, Sons enjoys growth coming from different drivers - international trade flow, the oil and gas industry, and the Brazilian domestic economy.
Regarding the international trade flow, global demand should be boosted by the economic activity of the countries known as BRICs (Brazil, Russia, India and China). An estimate by the Brazil’s Central Bank indicates a growing trade flow, which should reach US$ 548 billion in 2014.
Exploration and production of oil and gas will continue to expand, creating a number of opportunities. For example, Petrobras’ business plan alone forecasts that the number of maritime support vessels it charters will double during this decade, going from 254 to 504 by 2020.
In reference of the Brazilian domestic economy, the Brazil’s Central Bank indicates that GDP growth rates will vary from 4.5% in 2011 to 4.7% in 2014. Although the rhythm of expansion is forecast to be slower than the 7.5% registered the last year, these rates show that the Brazilian economy is advancing at sustainable, long-term levels. Government investments in infrastructure, for instance, will more than double in the coming years.
With robust growth in all of our diversified drivers mentioned above, the Company believes that 2011 will be another year of achievements for all of our businesses.
The forecast for the port terminals is very positive: civil works were completed and new equipment in Tecon Rio Grande (RS) was delivered within 2010; the expansion of Tecon Salvador (BA) is an ongoing process, benefitting not only Bahia’s economy but also the entire northeast of Brazil; Brasco continues to increase capacity and should continue to grow through new and existing contracts.
Capacity to deliver, intelligence, and technical know-how remain the competitive advantages of our Logistics business. Our challenge going forward is to maximise both the synergies between the logistics business and our other businesses, concentrating on the most profitable operations.
In the maritime area, with four business units, the shipyard and its synergy with the Towage and Offshore businesses remain a key competitive advantage for the Company. The delivery of eight new vessels in 2010 (five tugboats and three PSVs) has brought gains of scale and enabled the Company to continue its modernisation and fleet expansion strategy. The plan for 2011 is to complete the Guarujá II shipyard, which will double our naval construction capacity, and intensify our efforts to obtain authorisations necessary to start the shipyard construction in the port of Rio Grande (RS).
Our 2011 strategic plan contemplates the search for new opportunities that are aligned with Wilson, Sons existing operations and continuing our corporate agenda of sustainability.
Keeping an eye on the future, the government plans to invest in infrastructure while Petrobras forecasts, for the coming decade, a doubling of maritime support vessels that they charter.
Investments in 2010US$ 166.7 million
Consolidated Financial Statementsfor the Year Ended December 31, 2010 and Independent Auditors’ Report
Deloitte Touche Tohmatsu Independent Auditors
www.wilsonsons.com

67
Annual Report 2010 www.wilsonsons.com
Consolidated Statement of Comprehensive Income for the Year Ended December 31, 2010(AmountS ExpRESSED In thouSAnDS, unlESS othERwISE notED – BRAzIlIAn REAl AmountS ARE thE RESult of A ConvEnIEnCE tRAnSlAtIon)
Convenience translation*
Notes 2010 US$ 2009 US$ 2010 R$ 2009 R$
Revenue 4 575,551 477,888 958,982 832,098
Raw materials and consumables used (67,222) (49,570) (112,005) (86,311)
Employee benefits expense 5 (198,736) (149,086) (331,134) (259,588)
Depreciation and amortization expenses (42,921) (32,065) (71,515) (55,832)
Other operating expenses 6 (188,276) (151,337) (313,705) (263,508)
Profit on disposal of property, plant and equipment 90 470 150 818
Investment income 7 13,940 34,343 23,227 59,798
Finance costs 7 (11,814) (9,555) (19,684) (16,637)
Capital gain in joint venture transaction 23 20,407 - 34,002 -
Profit Before Tax 101,019 121,088 168,318 210,838
Income tax expense 8 (30,514) (31,104) (50,843) (54,158)
Profit for the Year 70,505 89,984 117,475 156,680
Profit for the year attributable to:
Owners of the Company 69,996 88,531 116,627 154,149
Non-controlling interests 509 1,453 848 2,531
70,505 89,984 117,475 156,680
Other Comprehensive Income
Exchange differences on translating 4,607 15,538 7,676 27,053
Total Comprehensive Income for the Year 75,112 105,522 125,151 183,733
Total comprehensive income for the year attributable to: 74,855 102,823 124,723 179,034
Owners of the Company 257 2,699 428 4,699
Non-controlling interests 75,112 105,522 125,151 183,733
Earnings per share from continuing operations
Basic and diluted (cents per share) 21 98.39c 124.44c 163.93c 216.67c
*Exchange rates for convenience translation: 31/12/10 – R$1.6662 / US$1.00 | 31/12/09 – R$1.7412 / US$1.00
The accompanying notes are an integral part of the consolidated financial statements.
Independent Auditors’ Report
to the Directors of wilson Sons limited
hamilton, BermudaWe have audited the accompanying consolidated financial statements of Wilson Sons Limited and its subsidiaries (“the Group”),
which comprise the consolidated balance sheets as at December 31, 2010, and the consolidated statement of comprehensive
income, consolidated statement of changes in equity and consolidated statement of cash flows for the year then ended, and a
summary of significant accounting policies and other explanatory information, all expressed in United States Dollars, the presentation
currency of the Group.
management’s Responsibility for the Consolidated financial StatementsManagement is responsible for the preparation and fair presentation of these consolidated financial statements in accordance
with International Financial Reporting Standards, and for such internal control as management determines is necessary to enable
the preparation of consolidated financial statements that are free from material misstatement, whether due to fraud or error.
Auditor’s ResponsibilityOur responsibility is to express an opinion on these consolidated financial statements based on our audit. We conducted our
audit in accordance with International Standards on Auditing. Those standards require that we comply with ethical requirements
and plan and perform the audit to obtain reasonable assurance about whether the consolidated financial statements are free
from material misstatement.
An audit involves performing procedures to obtain audit evidence about the amounts and disclosures in the consolidated financial
statements. The procedures selected depend on the auditor’s judgment, including the assessment of the risks of material
misstatement of the consolidated financial statements, whether due to fraud or error. In making those risk assessments, the auditor
considers internal control relevant to the entity’s preparation and fair presentation of the consolidated financial statements in order
to design audit procedures that are appropriate in the circumstances, but not for the purpose of expressing an opinion on the
effectiveness of the entity’s internal control. An audit also includes evaluating the appropriateness of accounting policies used and
the reasonableness of accounting estimates made by management, as well as evaluating the overall presentation of the consolidated
financial statements.
We believe that the audit evidence we have obtained is sufficient and appropriate to provide a basis for our audit opinion.
opinionIn our opinion, the consolidated financial statements give a true and fair view of the financial position of the Group as at December
31, 2010, and of their financial performance and cash flows for the year then ended in accordance with International Financial
Reporting Standards, expressed in United States dollars.
Our audit also comprehended the convenience translation of the presentation currency amounts (United States Dollar) into Brazilian
Real amounts and, in our opinion, such convenience translation has been made in conformity with the basis stated in Note 2.
The translation of the consolidated financial statements amounts into Brazilian Reais has been made solely for the convenience
of readers in Brazil and does not purport to represent amounts in accordance with International Financial Reporting Standards.
Rio de Janeiro, Brazil, March 24, 2011
DELOITTE TOUCHE TOHMATSU
Independent Auditors

69
Annual Report 2010 www.wilsonsons.com
Consolidated Balance Sheets as at December 31, 2010(AmountS ExpRESSED In thouSAnDS, unlESS othERwISE notED – BRAzIlIAn REAl AmountS ARE thE RESult of A ConvEnIEnCE tRAnSlAtIon)
ASSETS
Convenience translation*
Notes 2010 US$ 2009 US$ 2010 R$ 2009 R$
Non-Current Assets
Goodwill 9 15,612 15,612 26,013 27,184
Other intangible assets 10 16,841 2,239 28,060 3,899
Property, plant and equipment 11 560,832 438,878 934,458 764,174
Deferred tax assets 16 28,923 25,499 48,192 44,398
Trade and other receivables 13 6,400 - 10,665 -
Other non-current assets 6,552 10,521 10,918 18,319
Total non-current assets 635,160 492,749 1,058,306 857,974
Current Assets
Inventories 12 20,147 20,687 33,569 36,021
Trade and other receivables 13 128,561 105,499 214,206 183,695
Short term investments 14 36,729 11,116 61,198 19,355
Cash and cash equivalents 14 118,172 178,136 196,898 310,170
Total current assets 303,609 315,438 505,871 549,241
Total Assets 938,769 808,187 1,564,177 1,407,215
Equity and Liabilities
Capital and Reserves
Share capital 21 9,905 9,905 16,504 17,247
Capital reserves 91,484 146,334 152,431 254,797
Profit reserve 1,981 1,981 3,301 3,449
Contributed surplus 27,449 - 45,737 -
Retained earnings 313,299 243,303 522,017 423,640
Translation reserve 20,924 16,065 34,864 27,972
Equity attributable to owners of the Company 465,042 417,588 774,854 727,105
Non controlling interests - 5,891 - 10,257
Total equity 465,042 423,479 774,854 737,362
Non-Current Liabilities
Bank loans 15 288,596 237,271 480,859 413,136
Deferred tax liabilities 16 15,073 16,140 25,115 28,102
Provisions for contingencies 17 12,289 9,831 20,476 17,118
Obligations under finance leases 18 6,305 8,653 10,505 15,067
Total non-current liabilities 322,263 271,895 536,955 473,423
Current Liabilities
Trade and other payables 19 117,698 89,927 196,108 156,581
Current tax liabilities 3,354 838 5,588 1,460
Obligations under finance leases 18 4,847 3,902 8,076 6,793
Bank overdrafts and loans 15 25,565 18,146 42,596 31,596
Total current liabilities 151,464 112,813 252,368 196,430
Total liabilities 473,727 384,708 789,323 669,853
Total Equity and Liabilities 938,769 808,187 1,564,177 1,407,215
*Exchange rates for convenience translation: 31/12/10 – R$1.6662 / US$1.00 | 31/12/09 – R$1.7412 / US$1.00
The accompanying notes are an integral part of the consolidated financial statements.
Consolidated Statements of Changes in Equity for the Year Ended December 31, 2010(AmountS ExpRESSED In thouSAnDS, unlESS othERwISE notED – BRAzIlIAn REAl AmountS ARE thE RESult of A ConvEnIEnCE tRAnSlAtIon)
Notes
Share capital
Capital reservesAddi-tional
paid in capital
Profit reserve
Contrib-uted
surplusRetained earnings
Transla-tion
reserve
Attribut-able
to owners of the parent
Non- control-
ling interests Total
Share premium Others
US$ US$ US$ US$ US$ US$ US$ US$ US$ US$ US$
Balance at january 1, 2009 9,905 117,951 28,383 - 1,981 - 170,779 1,773 330,772 1,411 332,183
Profit for the year - - - - - - 88,531 - 88,531 1,453 89,984
Other comprehensive income for the year - - - - - - - 14,292 14,292 1,246 15,538
Total comprehensive income for the year - - - - - - 88,531 14,292 102,823 2,699 105,522
Capital increase - - - - - - - - - 1,781 1,781
Dividends - - - - - - (16,007) - (16,007) - (16,007)
Balance at december 31, 2009 21 9,905 117,951 28,383 - 1,981 - 243,303 16,065 417,588 5,891 423,479
Profit for the year - - - - - - 69,996 - 69,996 509 70,505
Other comprehensive income for the year - - - - - - - 4,859 4,859 (252) 4,607
Total comprehensive income for the year - - - - - - 69,996 4,859 74,855 257 75,112
Purchase of non-controlling interests 22 - - - (4,850) - - - - (4,850) (4,156) (9,006)
Transfer to retained earnings - (50,000) - - - 50,000 - - - - -
Dividends - - - - - (22,551) - - (22,551) (1,992) (24,543)
Balance at december 31, 2010 21 9,905 67,951 28,383 (4,850) 1,981 27,449 313,299 20,924 465,042 - 465,042
*Exchange rates for convenience translation: 31/12//10 – R$1.6662 / US$1.00 | 31/12/09 – R$1.7412 / US$1.00
The accompanying notes are an integral part of the consolidated financial statements.
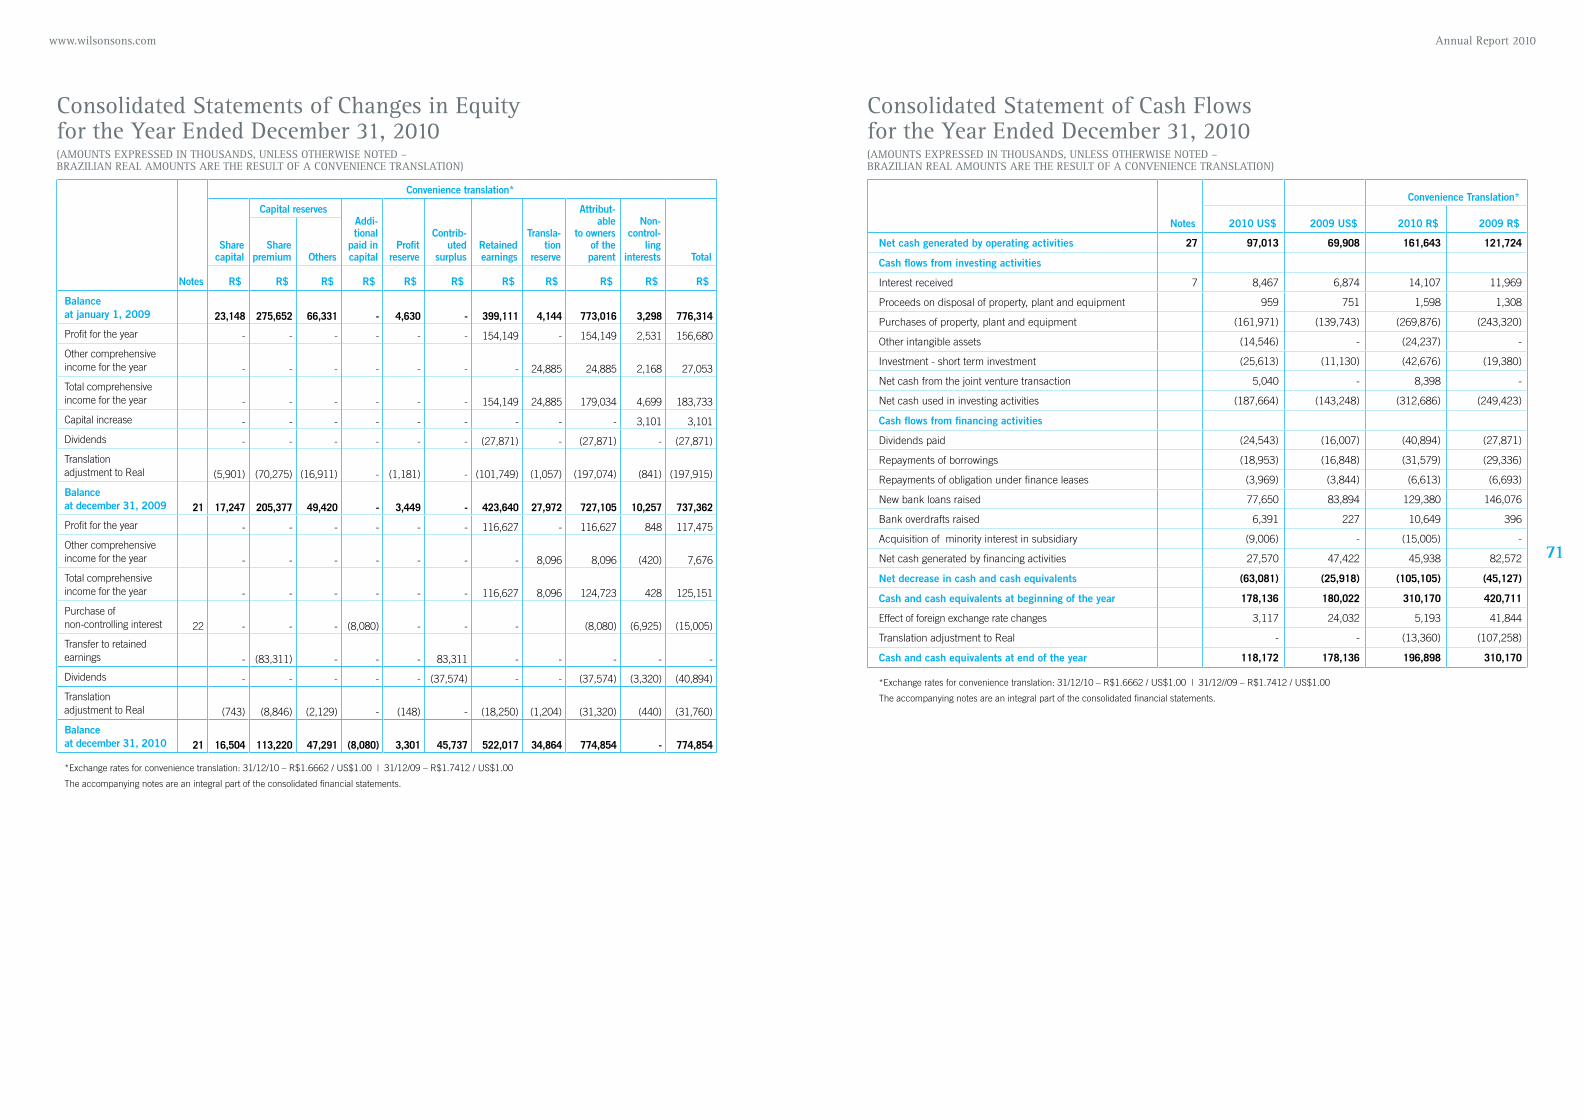
71
Annual Report 2010 www.wilsonsons.com
Consolidated Statement of Cash flows for the Year Ended December 31, 2010(AmountS ExpRESSED In thouSAnDS, unlESS othERwISE notED – BRAzIlIAn REAl AmountS ARE thE RESult of A ConvEnIEnCE tRAnSlAtIon)
Notes
Convenience Translation*
2010 US$ 2009 US$ 2010 R$ 2009 R$
Net cash generated by operating activities 27 97,013 69,908 161,643 121,724
Cash flows from investing activities
Interest received 7 8,467 6,874 14,107 11,969
Proceeds on disposal of property, plant and equipment 959 751 1,598 1,308
Purchases of property, plant and equipment (161,971) (139,743) (269,876) (243,320)
Other intangible assets (14,546) - (24,237) -
Investment - short term investment (25,613) (11,130) (42,676) (19,380)
Net cash from the joint venture transaction 5,040 - 8,398 -
Net cash used in investing activities (187,664) (143,248) (312,686) (249,423)
Cash flows from financing activities
Dividends paid (24,543) (16,007) (40,894) (27,871)
Repayments of borrowings (18,953) (16,848) (31,579) (29,336)
Repayments of obligation under finance leases (3,969) (3,844) (6,613) (6,693)
New bank loans raised 77,650 83,894 129,380 146,076
Bank overdrafts raised 6,391 227 10,649 396
Acquisition of minority interest in subsidiary (9,006) - (15,005) -
Net cash generated by financing activities 27,570 47,422 45,938 82,572
Net decrease in cash and cash equivalents (63,081) (25,918) (105,105) (45,127)
Cash and cash equivalents at beginning of the year 178,136 180,022 310,170 420,711
Effect of foreign exchange rate changes 3,117 24,032 5,193 41,844
Translation adjustment to Real - - (13,360) (107,258)
Cash and cash equivalents at end of the year 118,172 178,136 196,898 310,170
*Exchange rates for convenience translation: 31/12/10 – R$1.6662 / US$1.00 | 31/12//09 – R$1.7412 / US$1.00
The accompanying notes are an integral part of the consolidated financial statements.
Consolidated Statements of Changes in Equity for the Year Ended December 31, 2010(AmountS ExpRESSED In thouSAnDS, unlESS othERwISE notED – BRAzIlIAn REAl AmountS ARE thE RESult of A ConvEnIEnCE tRAnSlAtIon)
Notes
Convenience translation*
Share capital
Capital reservesAddi-tional
paid in capital
Profit reserve
Contrib-uted
surplusRetained earnings
Transla-tion
reserve
Attribut-able
to owners of the parent
Non- control-
ling interests Total
Share premium Others
R$ R$ R$ R$ R$ R$ R$ R$ R$ R$ R$
Balance at january 1, 2009 23,148 275,652 66,331 - 4,630 - 399,111 4,144 773,016 3,298 776,314
Profit for the year - - - - - - 154,149 - 154,149 2,531 156,680
Other comprehensive income for the year - - - - - - - 24,885 24,885 2,168 27,053
Total comprehensive income for the year - - - - - - 154,149 24,885 179,034 4,699 183,733
Capital increase - - - - - - - - - 3,101 3,101
Dividends - - - - - - (27,871) - (27,871) - (27,871)
Translation adjustment to Real (5,901) (70,275) (16,911) - (1,181) - (101,749) (1,057) (197,074) (841) (197,915)
Balance at december 31, 2009 21 17,247 205,377 49,420 - 3,449 - 423,640 27,972 727,105 10,257 737,362
Profit for the year - - - - - - 116,627 - 116,627 848 117,475
Other comprehensive income for the year - - - - - - - 8,096 8,096 (420) 7,676
Total comprehensive income for the year - - - - - - 116,627 8,096 124,723 428 125,151
Purchase of non-controlling interest 22 - - - (8,080) - - - (8,080) (6,925) (15,005)
Transfer to retained earnings - (83,311) - - - 83,311 - - - - -
Dividends - - - - - (37,574) - - (37,574) (3,320) (40,894)
Translation adjustment to Real (743) (8,846) (2,129) - (148) - (18,250) (1,204) (31,320) (440) (31,760)
Balance at december 31, 2010 21 16,504 113,220 47,291 (8,080) 3,301 45,737 522,017 34,864 774,854 - 774,854
*Exchange rates for convenience translation: 31/12/10 – R$1.6662 / US$1.00 | 31/12/09 – R$1.7412 / US$1.00
The accompanying notes are an integral part of the consolidated financial statements.
73
Annual Report 2010 www.wilsonsons.com
notes to the consolidated financial statements for the year ended december 31, 20101. GEnERAl InfoRmAtIon
Wilson Sons Limited (the “Group” or “Company”) is a limited company incorporated in Bermuda under the Companies Act 1981.
The address of the registered office is Clarendon House, 2 Church Street, Hamilton, HM11, Bermuda. The Group is one of the
largest providers of integrated port and maritime logistics and supply chain solutions in Brazil. Throughout over 173 years in
the Brazilian market, we have developed an extensive Brazilian network and provide a variety of services related to international
trade, particularly in the port and maritime sectors. Our principal activities are divided into the following segments: operation of port
terminals, towage services, logistics, shipping assistance, support to offshore oil and natural gas platforms and shipyard.
2. SIGnIfICAnt ACCountInG polICIES AnD CRItICAl ACCountInG JuDGEmEntS
Statement of complianceThe consolidated financial statements have been prepared in accordance with International Financial Reporting Standards (“IFRS”).
Basis of preparationThe consolidated financial statements are presented in US Dollars because that is the currency of the primary economic environment
in which the Group operates. Entities with a functional currency other than US Dollars are included in accordance with the accounting
policies described below.
The consolidated financial statements have been prepared on the historical cost basis except for financial instruments and share-
based payments liability that are measured at fair values, as explained in the accounting policies below. Historical cost is generally
based on the fair value of the consideration given in exchange for assets.
Convenience translationThe consolidated financial statements were originally prepared in US Dollars. A convenience translation to the Real, the Brazilian
currency, was carried out solely for the convenience of readers in Brazil and does not purport to represent amounts in accordance
with International Financial Reporting Standards, and should not be construed as implying that the amounts in US Dollars
represent, or could have been or could be converted into, Reais, at such rates or at any other rate. The exchange rates used
for the purposes of this convenience translation were the PTAX exchange rates ruling as at the closing dates of the consolidated
financial statements, as published by the Brazilian Central Bank. On December 31, 2010 and 2009 the applicable exchange
rates were R$1.6662 and R$1.7412, respectively. The difference between the applicable exchanges rates, on each of the closing
dates, generates impacts of translation on the beginning balances of the consolidated financial statements in Brazilian Real and on
the changes therein through the subsequent period. The effect of this difference was disclosed in the Brazilian Real Consolidated
Statement of Changes in Equity and respective notes as “Translation adjustment to Real”.
The principal accounting policies are set out below:
Consolidation The consolidated financial statements incorporate the financial statements of the Company and entities controlled by the Company.
Control is achieved where the Company has the power to govern the financial and operating policies of an entity so as to obtain
benefits from its activities.
The results of subsidiaries acquired or disposed of during the year are included in the consolidated statement of comprehensive
income from the effective date of acquisition and up to the effective date of disposal, as appropriate.
When necessary, adjustments are made to the financial statements of subsidiaries to bring their accounting policies into line
with those used by other members of the Group.
All intra-group transactions, balances, income and expenses are eliminated in full on consolidation.
Non-controlling interests in subsidiaries are identified separately from the Group’s equity therein. The interests of non-controlling
shareholders may be initially measured either at fair value or at the non-controlling interests’ proportionate share of the fair
value of the acquiree’s identifiable net assets. The choice of measurement basis is made on an acquisition-by-acquisition basis.
Subsequent to acquisition, the carrying amount of non-controlling interests is the amount of those interests at initial recognition
plus the non-controlling interests’ share of subsequent changes in equity. Total comprehensive income is attributed
to non-controlling interests even if this results in the non-controlling interests having a deficit balance.
The consolidated financial statements include the accounts of the direct and indirect subsidiaries which are listed in Note 22.
Interests in joint venturesA joint venture is a contractual arrangement whereby the Group and other parties undertake an economic activity that is subject
to joint control, which is when the strategic financial and operating policy decisions relating to the activities of the joint venture
require the unanimous consent of the parties sharing control.
When a Group entity undertakes its activities under joint venture arrangements directly, the Group’s share of jointly controlled
assets and any liabilities incurred jointly with other venturers are recognized in the financial statements of the relevant entity
and classified according to their nature. Liabilities and expenses incurred directly in respect of interests in jointly controlled
assets are accounted for on an accrual basis. Income from the sale or use of the Group’s share of the output of jointly controlled
assets, and its share of joint venture expenses, are recognized when it is probable that the economic benefits associated with
the transactions will flow to/from the Group and their amount can be measured reliably.
Joint venture arrangements that involve the establishment of a separate entity in which each venturer has an interest are referred
to as jointly controlled entities. The Group reports its interests in jointly controlled entities using proportionate consolidation.
The Group’s share of the assets, liabilities, income and expenses of jointly controlled entities are combined with the equivalent
items in the consolidated financial statements on a line-by-line basis.
When a group entity transacts with its jointly controlled entity, profits and losses resulting from the transactions with the jointly
controlled entity are recognised in the Group’ consolidated financial statements only to the extent of interests in the jointly
controlled entity that are not related to the Group.
foreign currencyThe functional currency for each Group entity is determined as the currency of the primary economic environment in which
it operates. Transactions in currencies other than the entity’s functional currency (foreign currencies) are recognized at the
rates of exchange prevailing at the dates of the transactions. At the end of each reporting period, monetary assets and liabilities
denominated in foreign currencies are retranslated at the rates prevailing at that date.
Non-monetary assets and liabilities that are measured in terms of historical cost in a foreign currency are not retranslated.
On consolidation, the income statement items of entities with a functional currency other than US Dollars are translated into
US Dollars, the Group’s presentational currency, at average rates of exchange. Balance sheet items are translated into
US Dollars at year end exchange rates. Exchange differences arising on consolidation of entities with functional currencies
other than US Dollars are classified as other comprehensive income.
Retirement benefit costsPayments to defined contribution retirement benefit plans are charged as an expense as they fall due. Payments made
to state-managed retirement benefit schemes are dealt with as payments to defined contribution plans where the Group’s
obligations under the plans are equivalent to those arising in a defined contribution retirement benefit plan.
75
Annual Report 2010 www.wilsonsons.com
taxationIncome tax expense represents the sum of the tax currently payable and deferred tax.
The tax currently payable is based on taxable profit for the year. Taxable profit differs from profit as reported in the consolidated
income statement because it excludes or includes items of income or expense that are taxable or deductible in other years and
it further excludes items that are never taxable or deductible. The Group’s liability for current tax is calculated using tax rates that
have been enacted or substantively enacted by the end of the reporting period.
Deferred tax is the tax expected to be payable or recoverable on temporary differences (i.e. differences between the carrying
amounts of assets and liabilities in the financial statements and the corresponding tax basis used in the computation of taxable
profit). Deferred tax liabilities are generally recognized for all taxable temporary differences. Deferred tax assets are generally
recognized for all deductible temporary differences to the extent that it is probable that taxable profits will be available against
which those deductible temporary differences can be utilised. Such deferred tax assets and liabilities are not recognized if the
temporary difference arises from goodwill or from the initial recognition (other than in a business combination) of other assets
and liabilities in a transaction that affects neither the taxable profit nor the accounting profit.
Deferred tax liabilities are recognized for taxable temporary differences associated with investments in subsidiaries and associates,
and interests in joint ventures, except where the Group is able to control the reversal of the temporary difference and it is probable that
the temporary difference will not reverse in the foreseeable future. Deferred tax assets arising from deductible temporary differences
associated with such investments and interests are only recognized to the extent that it is probable that there will be sufficient taxable
profits against which to utilise the benefits of the temporary differences and they are expected to reverse in the foreseeable future.
The carrying amount of deferred tax assets is reviewed at the end of each reporting period and reduced to the extent that it is no
longer probable that sufficient taxable profits will be available to allow all or part of the asset to be recovered.
Deferred tax assets and liabilities are measured at the tax rates that are expected to apply in the period in which the liability is settled or
the asset is realized, based on tax rates and tax laws that have been enacted or substantively enacted by the end of the reporting period.
The Company will normally have a legally enforceable right to set off a deferred tax asset against a deferred tax liability when these
items are in the same entity and relate to income taxes levied by the same taxation authority and the taxation authority permits
the company to make or receive a single net payment. In the consolidated financial statements, a deferred tax asset of one entity
in the Group cannot be offset against a deferred tax liability of another entity in the Group as there is no legally enforceable right
to offset tax assets and liabilities between Group companies.
Current and deferred tax are recognized as an expense or income in profit or loss, except when they relate to items charged
or credited directly to equity, in which case the tax is also taken directly to equity.
property, plant and equipmentProperty, plant and equipment are stated at cost less accumulated depreciation and any accumulated impairment losses.
Depreciation is charged so as to write off the cost or valuation of assets, other than land and assets under construction, over their
estimated useful lives, using the straight-line method as follows.
Docking costs are capitalized and depreciated over the period in which the economic benefits are received.
The gain or loss arising on the disposal or retirement of an item of property, plant and equipment is determined as the difference
between the sales proceeds, if applicable, and the carrying amount of the asset and is recognized in the income statement.
Borrowing costsBorrowing costs directly attributable to the acquisition, construction or production of qualifying assets, which are assets that necessarily
take a substantial period of time to get ready for their intended use or sale, are added to the cost of those assets, until such time
as the assets are substantially ready for their intended use or sale.
Investment income earned on the temporary investment of specific borrowings pending their expenditure on qualifying assets
is deducted from the borrowing costs eligible for capitalisation.
All other borrowing costs are recognized in profit or loss in the period in which they are incurred.
GoodwillGoodwill arising on the acquisition of a subsidiary or a jointly controlled entity represents the excess of the cost of acquisition
over the Group’s interest in the net fair value of the identifiable assets, liabilities and contingent liabilities of the subsidiary or jointly
controlled entity recognized at the date of acquisition. Goodwill is initially recognized as an asset at cost and is subsequently
measured at cost less any accumulated impairment losses.
On disposal of a subsidiary or a jointly controlled entity, the attributable amount of goodwill is included in the determination of the
profit or loss on disposal.
The Group tests goodwill annually for impairment or more frequently if there are indications that goodwill might be impaired.
The recoverable amounts are determined from value in use calculations. The key assumptions for the value in use calculations
are those regarding the discount rate, growth rates and expected changes to selling prices and costs during the period.
Management estimates discount rates using pre-tax rates that reflect current market assessments of the time value of money
and the risks specific to the cash generating unit. Growth rates are based on management’s forecasts and historical trends.
Changes in selling prices and direct costs are based on past practices and expectations of future changes in the market.
Intangible assetsIntangible assets acquired separately are carried at cost less accumulated amortization and accumulated impairment losses.
Amortization is recognized on a straight-line basis over their estimated useful lives. The estimated useful life and amortization
method are reviewed at the end of each annual reporting period, with the effect of any changes in estimate being accounted
for on a prospective basis.
Impairment of tangible and intangible assets other than goodwillAssets that are subject to amortization or depreciation are reviewed for impairment whenever events or changes in circumstances
indicate that their carrying amounts may not be recoverable.
Intangible assets with indefinite useful lives and intangible assets not yet available for use are tested for impairment at least annually,
and whenever there is an indication that the asset may be impaired.
An impairment loss is recognized for the amount by which the asset’s carrying amount exceeds its recoverable amount. The recoverable
amount is the higher of fair value less costs to sell and value in use. For the purposes of assessing impairment, assets are grouped at the
lowest levels for which there are separately identifiable cash inflows.
InventoriesInventories are stated at the lower of cost and net realizable value. Costs comprise direct materials and, where applicable, directly
attributable labor costs and those overheads that have been incurred in bringing the inventories to their present location and
condition. Net realizable value represents the estimated selling price for inventories less all estimated costs of completion and
costs to be incurred in marketing, selling and distribution.
Freehold Buildings 25 years
Improvements in Rented Buildings (*)
Floating Craft 20 years
Vehicles 5 years
Plant and Equipment 5 to 20 years
(*) lower of period of the rental or useful life.
Assets in the course of construction are carried at cost, less any recognized impairment loss. Costs include professional fees for
qualifying assets. Depreciation of these assets, on the same basis as other property assets, commences when the assets are ready
for intended use.
Assets held under finance leases are depreciated over their expected useful lives on the same basis as owned assets, except when
there is no reasonable certainty that the lessee will obtain ownership by the end of the lease term in which the asset shall be fully
depreciated over the shorter of the lease term and its useful life.
77
Annual Report 2010 www.wilsonsons.com
The carrying amount of the financial asset is reduced by the impairment loss directly for all financial assets with the exception
of trade receivables, where the carrying amount is reduced through the use of an allowance account.
When a trade receivable is considered uncollectible, it is written off against the allowance account. Subsequent recoveries
of amounts previously written off are credited against the allowance account. Changes in the carrying amount of the allowance
account are recognized in profit or loss.
Derecognition of financial assets
The Group derecognizes a financial asset only when the contractual rights to the cash flows from the asset expire, or when it
transfers the financial asset and substantially all the risks and rewards of ownership of the asset to another entity. If the Group
neither transfers nor retains substantially all the risks and rewards of ownership and continues to control the transferred asset,
the Group recognizes its retained interest in the asset and an associated liability for amounts it may have to pay. If the Group
retains substantially all the risks and rewards of ownership of a transferred financial asset, the Group continues to recognize
the financial asset and also recognizes a collateralized borrowing for the proceeds received.
2. Financial Liabilities
Financial liabilities are classified as either financial liabilities “as FVTPL” or “other financial liabilities”.
Financial liabilities are classified as at FVTPL when the financial liability is either held for trading or it is designated as at FVTPL.
Other financial liabilities are initially measured at fair value, net of transaction cost.
Other financial liabilities are subsequently measured at amortization cost, using the effective interest method, with interest expense
recognized on an effective yield basis.
The effective interest method is a method of calculating the amortised cost of a financial liability and of allocating interest expense
over the relevant period. The effective interest rate is the rate that exactly discounts estimated future cash payments through the
expected life of the financial liability, or (where appropriate) a shorter period, to the net carrying amount on initial recognition.
There are no financial liabilities classified at FVTPL.
other financial liabilities
› Bank overdrafts and loans: Interest-bearing bank loans, overdrafts and obligations under finance leases are recorded at the
proceeds received, net of direct issue costs. Finance charges, including premiums payable on settlement or redemption and
direct issue costs, are accounted for on the accruals basis to the income statement using the effective interest method and are
added to the carrying amount of the instrument to the extent that they are not settled in the period in which they arise.
› Trade Payables: Trade payables and other amounts payables are measured at fair value, net of transaction cost.
Derecognition of financial liabilities
The Group derecognizes financial liabilities when, and only when, the Group’s obligations are discharged, cancelled or they expire.
DerivativesDerivatives: The Group may use derivative financial instruments to reduce exposure to foreign exchange movements. Derivatives
are measured at each balance sheet date at fair value. The Group does not have “hedge accounting” and the gains and losses
arising from changes in fair value are included in the income statement for the period within investment revenue or finance costs.
The Group does not have any derivatives for the periods presented.
Derivatives embedded in other financial instruments or other host contracts are treated as separate derivatives when their risks
and characteristics are not closely related to those of host contracts and the host contracts are not carried at fair value, with gains
or losses reported in the income statement. The Group does not have embedded derivatives for the periods presented.
financial instrumentsFinancial assets and liabilities are recognized in the Group’s balance sheet when the Group becomes a party to the contractual
provisions of the instrument.
1. Financial Assets
Financial assets are classified into the following specified categories: financial assets at fair value through profit or loss (FVTPL),
held to maturity investments, available for sale (AFS) financial assets and loans and receivables. The classification depends on the
nature and purpose of the financial assets and is determined at the time of initial recognition.
Investments are recognized and derecognized on trade date when the purchase or sale of a financial asset is under a contract whose
terms require delivery of the financial asset within the timeframe established by the market concerned, and are initially measured
at fair value, plus transaction costs, except for those financial assets classified as at fair value trough profit or loss (FVTPL), which
are initially measured at fair value.
All recognized financial assets are subsequently measured in their entirety at either amortised cost or fair value.
Income is recognized on an effective interest basis for debt instruments other than those financial assets designated as at FVTPL.
The effective interest method is a method of calculating the amortised cost of a debt instrument and of allocating interest income over
the relevant period. The effective interest rate is the rate that exactly discounts estimated future cash receipts (including all fees on points
paid or received that form an integral part of the effective interest rate, transaction costs and other premiums or discounts) through
the expected life of the debt instrument, or, where appropriate, a shorter period, to the net carrying amount on initial recognition.
the financial assets of the Company have been classified as loan and receivables.
loans and receivables
The following instruments have been classified as loans and receivables and are measured at amortised cost using the effective
interest method, less any impairment loss. Interest income is recognized by applying the effective interest rate, except for short-
term receivables when the recognition of interest would be immaterial.
› Cash and Cash Equivalents / Short Term Investments: Cash and cash equivalents comprise cash in hand and other short-term
highly liquid before 90 days and which are subject to an insignificant risk of changes in value; and Short Term Investments
comprise cash in hand and other short-term investments with more than 90 days of maturity but less than 365 days.
› Trade Receivables: Trade receivables and other amounts receivable are stated at the present value of the amounts due, reduced
by the impairment loss.
Impairment of financial assets
Financial assets that are measured at amortized cost are assessed for indicators of impairment at the end of each reporting period.
Financial assets are considered to be impaired when there is objective evidence that, as a result of one or more events that occurred
after the initial recognition of the financial asset, the estimated future cash flows of the investment have been affected.
Objective evidence of impairment could include:
› Significant financial difficulty of the issuer or counterparty; or
› Default or delinquency in interest or principal payments; or
› It becoming probable that the borrower will enter bankruptcy or financial re-organisation; or
› The disappearance of an active market for that financial asset of financial difficulties.
For certain categories of financial asset, such as trade receivables, assets that are assessed not to be impaired individually are,
in addition, assessed for impairment on a collective basis. Objective evidence of impairment for a portfolio of receivables could
include the Group’s past experience of collecting payments, an increase in the number of delayed payments in the portfolio past
the average credit period of 60 days, as well as observable changes in national or local economic conditions that correlate with
default on receivables.
For financial assets carried at amortized cost, the amount of the impairment loss recognized is the difference between the
asset’s carrying amount and the present value of estimated future cash flows, reflecting the impact of collateral and guarantees,
discounted at the financial asset’s original effective interest rate.
79
Annual Report 2010 www.wilsonsons.com
provisionsProvisions are recognized when the Group has a present obligation (legal or constructive) as a result of a past event, it is probable
that the Group will be required to settle that obligation and a reliable estimate can be made of the amount of the obligation.
The amount recognized as a provision is the best estimate of the expenditure required to settle the present obligation at the end
of the reporting period, taking into account the risks and uncertainties surrounding the obligation.
When some or all of the economic benefits required to settle a provision are expected to be recovered from a third party, a receivable is
recognized as an asset if it is virtually certain that reimbursement will be received and the amount of the receivable can be measured reliably.
Construction contractsWhere the outcome of a construction contract can be estimated reliably, revenue and costs are recognized by reference to the stage
of completion of the contract activity at the end of the reporting period, measured based on the proportion of contract costs incurred
for work performed to date relative to the estimated total contract costs, except where this would not be representative of the stage of
completion. Variations in contract work, claims and incentive payments are included to the extent that the amount can be measured
reliably, have been agreed with the customer and consequently is considered probable.
Where the outcome of a construction contract cannot be estimated reliably, contract revenue is recognized to the extent of contract costs
incurred that it is probable will be recoverable. Contract costs are recognized as expenses in the period in which they are incurred.
When it is probable that total contract costs will exceed total contract revenue, the expected loss is recognized as an expense immediately.
Share-based paymentsIn accordance with IFRS 2 Share-based Payment, for cash settled share-based payments, a liability is recognized for the goods
or services acquired, measured initially at the fair value of the liability.
At the end of each reporting period until the liability is settled, and at the date of settlement, the fair value of the liability is remeasured,
with any changes in fair value recognized in profit or loss for the year.
Fair value is measured by use of a binomial model. The fair value calculated by the model has been adjusted, based on management’s
best estimate, for the effects of behavioural considerations.
RevenueRevenue is measured at fair value of the consideration received or receivable for goods and services provided in the normal course
of business net of trade discounts and other sales related taxes. If the Group is acting solely as an agent, amounts billed to customers
are offset against relevant costs.
Sales of services are recognized when the work contracted has been performed in accordance with contracted terms.
Revenue from construction contracts is recognized by reference to the stage of completion of the contract, in accordance with the
Group’s accounting policy on construction contracts aforementioned.
Interest income is recognized when it is probable that the economic benefits will flow to the Group and the amount of revenue can be
measured reliably. Interest income is accrued on a time basis, by reference to the principal outstanding and at the effective interest
rate applicable, which is the rate that exactly discounts estimated future cash receipts through the expected life of the financial asset
to that asset’s net carrying amount on initial recognition.
Dividend income from investments is recognized when the shareholders rights to receive payment have been established.
operating profitOperating profit is stated before investment income, finance costs and income tax.
leasingLeases are classified as finance leases whenever the terms of the lease transfer substantially all the risks and rewards of ownership
to the lessee. All other leases are classified as operating leases.
The Group as lessee:
Assets held under finance leases are recognized as assets of the Group at their fair value at the inception of the lease or, if lower,
at the present value of the minimum lease payments. The corresponding liability to the lessor is included in the balance sheet
as a finance lease obligation.
Lease payments are apportioned between finance expenses and reduction of the lease obligation so as to achieve a constant rate
of interest on the remaining balance of the liability. Finance expenses are recognized immediately in profit or loss, unless they are
directly attributable to qualifying assets, in which case they are capitalised.
Operating leases payments are recognized as an expense on a straight-line basis over the lease term.
Critical Accounting Judgments and Key Sources of Estimation uncertaintyIn the process of applying the Group’s accounting policies, which are described above, management has made the following
judgments, estimates and assumptions that have the most significant effect on the amounts recognized in the financial statements
as mentioned below.
The estimates and underlying assumptions are reviewed on an ongoing basis. Revisions to accounting estimates are recognized in
the period in which the estimate is revised if the revision affects only that period or in the period of the revision and future periods
if the revision affects both current and future periods.
1. provision for legal contingencies
In the normal course of business in Brazil, the Group is exposed to local legal cases. Provisions for legal cases are made when
the Group’s management, together with their legal advisors, considers the probable outcome is a financial settlement against
the Group. Provisions are measured at the Management’s best estimate of the expenditure required to settle the obligation based
upon legal advice received. For labor claims the provision is based on prior experience and managements’ best knowledge of the
relevant facts and circumstances.
2. Impairment of goodwill
Determining whether goodwill is impaired requires an estimation of the value in use of the cash-generating units to which goodwill
has been allocated. The value in use calculation requires the entity’s management to estimate the future cash flows expected to
arise from the cash-generating unit and a suitable discount rate in order to calculate present value.
The carrying amount of goodwill at the end of the reporting period was US$15.6 million (R$26.0 million) (2009: US$15.6 million
(R$27.2 million)). Details of the impairment loss calculation are provided in note 9. There is not any impairment loss recognized
for the periods presented.
3. fair value of derivatives and other financial instruments
As described in Note 25, the Company may use derivatives contracts to manage foreign currency risk. For derivative financial
instruments, assumptions are made based on quoted market rates adjusted for specific features of the instruments. Other financial
instruments are valued using a discounted cash flow analysis based on assumptions supported, where possible, by observable market
prices or rates. The Group does not have any derivatives for the periods presented.
4. Cash settled share-based payment schemes
The fair value of cash settled share-based payments is determined using a binomial model. The assumptions used in determining
this fair value include the life of the options, share price volatility, dividend yield and risk free rate. Expected volatility is determined
by calculating the volatility of the Group’s share price over a historical period. The expected life used in the model has been
adjusted, based on management’s best estimate, for the effects of behavioural considerations. Expected dividend yield are based
on the Groups dividend policy. In determining the risk free rate the Group utilizes the yield on a zero coupon government bond
in the currency in which the exercise price is expressed. Forfeiture rates are applied and historical distributions to fair valuations
in computing the share based payment charge. The Group uses forfeiture rates in line with management’s best estimate of the
percentage of awards which will be forfeited, based on the proportion of award holders expected to leave the Group.
Any changes in these assumptions will impact the carrying amount of cash settled share-based payments liabilities.
81
Annual Report 2010 www.wilsonsons.com
5. useful lives of property, plant and equipment
Depreciation is charged so as to write off the cost or valuation of assets, other than land and assets under construction, over their
estimated useful lives, using the straight-line method. Estimated useful lives are determined based on prior experience and management’s
best knowledge, and are reviewed annually.
Adoption of new and revised International financial Reporting Standards (IfRS)
1. Standards and Interpretations affecting amounts reported in the current period and/or prior periods
The following new and revised IFRSs have been applied in the current period and have affected the amounts reported in these
financial statements. Details of other new and revised IFRSs applied in these financial statements that have had no material effect
on the financial statements are set below.
New and revised Standards and Interpretations that effect the financial statementsAmendments to IAS 1 presentation of financial Statements (as part of Improvements to IfRSs issued in 2010)
The amendments to IAS 1 clarify that an entity may choose to present the required analysis of items of other comprehensive
income either in the statement of changes in equity or in the notes to the financial statements. The Group has applied the
amendments in advance of their effective date (annual periods beginning on or after 1 January 2011). The amendments have
been applied retrospectively.
Amendments to IAS 1 presentation of financial Statements (as part of Improvements to IfRSs issued in 2009)
The amendments to IAS 1 clarify that the potential settlement of a liability by the issue of equity is not relevant to its classification
as current or noncurrent.
Amendments to IfRS 7 financial Instruments: Disclosures (as part of Improvements to IfRSs issued in 2010)
The amendments to IFRS 7 clarify the required level of disclosures about credit risk and collateral held and provide relief from
disclosures previously required regarding renegotiated loans.
IAS 27 (revised in 2008) Consolidated and Separate financial Statements
The revised Standard affects accounting policies regarding changes in ownership interests in subsidiaries that do not result in loss
of control. In prior years, in the absence of specific requirements in IFRSs, increases in interests in existing subsidiaries were treated
in the same manner as the acquisition of subsidiaries, with goodwill or a bargain purchase gain being recognised, when appropriate;
for decreases in interests in existing subsidiaries that did not involve a loss of control, the difference between the consideration
received and the adjustment to the non-controlling interests was recognised in profit or loss. Under IAS 27(2008), all such increases
or decreases are dealt with in equity, with no impact on goodwill or profit or loss.
When control of a subsidiary is lost as a result of a transaction, event or other circumstance, the revised Standard requires to derecognise
all assets, liabilities and non-controlling interests at their carrying amount and to recognise the fair value of the consideration received.
Any retained interest in the former subsidiary is recognised at its fair value at the date control is lost. The resulting difference is recognised
as a gain or loss in profit or loss.
These changes in accounting policies have been applied prospectively from 1 January 2010 in accordance with the relevant
transitional provisions.
Amendments to IfRS 2 Share-based payment – Group Cash-settled Share-based payment transactions
The amendments clarify the scope of IFRS 2, as well as the accounting for group cash-settled share-based payment transactions
in the separate (or individual) financial statements of an entity receiving the goods or services when another group entity or shareholder
has the obligation to settle the award.
New and revised Standards and Interpretations adopted with no effect on the financial statements
Amendments to IfRS 1 first-time Adoption of International financial Reporting Standards – Additional Exemptions for first-time Adopters
The amendments provide two exemptions when adopting IFRSs for the first time relating to oil and gas assets, and the determination
as to whether an arrangement contains a lease.
IfRS 3 (revised in 2008) Business Combinations
IFRS 3(2008) has been applied in the current year prospectively to business combinations for which the acquisition date is on or
after 1 January 2010 in accordance with the relevant transitional provisions. Its adoption has affected the accounting for business
combinations in the current year.
The impact of the application of IFRS 3(2008) is as follows:
› IFRS 3(2008) allows a choice on a transaction-by-transaction basis for the measurement of non-controlling interests at the
date of acquisition (previously referred to as ‘minority’ interests) either at fair value or at the non-controlling interests’ share
of recognised identifiable net assets of the acquire.
› IFRS 3(2008) changes the recognition and subsequent accounting requirements for contingent consideration. Previously, contingent
consideration was recognised at the acquisition date only if payment of the contingent consideration was probable and it could be
measured reliably; any subsequent adjustments to the contingent consideration were always made against the cost of the acquisition.
Under the revised Standard, contingent consideration is measured at fair value at the acquisition date; subsequent adjustments to
the consideration are recognised against the cost of the acquisition only to the extent that they arise from new information obtained
within the measurement period (a maximum of 12 months from the acquisition date) about the fair value at the date of acquisition.
All other subsequent adjustments to contingent consideration classified as an asset or a liability are recognised in profit or loss.
› IFRS 3(2008) requires the recognition of a settlement gain or loss when the business combination in effect settles a
pre-existing relationship between the Group and the acquiree.
› IFRS 3(2008) requires acquisition-related costs to be accounted for separately from the business combination, generally
leading to those costs being recognised as an expense in profit or loss as incurred, whereas previously they were accounted
for as part of the cost of the acquisition.
As part of Improvements to IFRSs issued in 2010, IFRS 3 (2008) was amended to clarify that the measurement choice regarding
non-controlling interests at the date of acquisition (see above) is only available in respect of non-controlling interests that are
present ownership interests and that entitle their holders to a proportionate share of the entity’s net assets in the event of liquidation.
All other types of non-controlling interests are measured at their acquisition-date fair value, unless another measurement basis is
required by other Standards.
In addition, as part of Improvements to IFRSs issued in 2010, IFRS 3(2008) was amended to give more guidance regarding the
accounting for share-based payment awards held by the acquirer’s employees. Specifically, the amendments specify that share-
based payment transactions of the acquiree that are not replaced should be measured in accordance with IFRS 2 Share-based
Payment at the acquisition date (‘market-based measure’).
83
Annual Report 2010 www.wilsonsons.com
Amendments to IfRS 5 non-current Assets held for Sale and Discontinued operations (as part of Improvements to IfRSs issued in 2009)
The amendments to IFRS 5 clarify that the disclosure requirements in IFRSs other than IFRS 5 do not apply to non-current assets
(or disposal groups) classified as held for sale or discontinued operations unless those IFRSs require (i) specific disclosures in
respect of non-current assets (or disposal groups) classified as held for sale or discontinued operations, or (ii) disclosures about
measurement of assets and liabilities within a disposal group that are not within the scope of the measurement requirement of
IFRS 5 and the disclosures are not already provided in the consolidated financial statements.
Amendments to IfRS 5 non-current Assets held for Sale and Discontinued operations (as part of Improvements to IfRSs issued in 2008)
The amendments clarify that all the assets and liabilities of a subsidiary should be classified as held for sale when the Group is
committed to a sale plan involving loss of control of that subsidiary, regardless of whether the Group will retain a non-controlling
interest in the subsidiary after the sale.
Amendments to IAS 39 financial Instruments: Recognition and measurement – Eligible hedged Items
The amendments provide clarification on two aspects of hedge accounting: identifying inflation as a hedged risk or portion, and
hedging with options.
Amendments to IAS 7 Statement of Cash flows (as part of Improvements to IfRSs issued in 2009)
The amendments to IAS 7 specify that only expenditures that result in a recognised asset in the statement of financial position can
be classified as investing activities in the statement of cash flows.
IAS 28 (revised in 2008) Investments in Associates
The principle adopted under IAS 27(2008) (see above) that a loss of control is recognised as a disposal and re-acquisition of any
retained interest at fair value is extended by consequential amendments to IAS 28. Therefore, when significant influence over an
associate is lost, the investor measures any investment retained in the former associate at fair value, with any consequential gain
or loss recognised in profit or loss.
As part of Improvements to IFRSs issued in 2010, IAS 28 (2008) has been amended to clarify that the amendments to IAS 28 regarding
transactions where the investor loses significant influence over an associate should be applied prospectively. The Group has applied
the amendments to IAS 28(2008) as part of Improvements to IFRSs issued in 2010 in advance of their effective dates (annual periods
beginning on or after 1 July 2010).
IfRIC 17 Distributions of non-cash Assets to owners
The Interpretation provides guidance on the appropriate accounting treatment when an entity distributes assets other than cash
as dividends to its shareholders.
IfRIC 18 transfers of Assets from Customers
The Interpretation addresses the accounting by recipients for transfers of property, plant and equipment from ‘customers’ and
concludes that when the item of property, plant and equipment transferred meets the definition of an asset from the perspective
of the recipient, the recipient should recognise the asset at its fair value on the date of the transfer, with the credit being recognised
as revenue in accordance with IAS 18 Revenue.
Improvements to IfRSs issued in 2009
Except for the amendments to IAS 1, IAS 27, IFRS 2 and IFRS 7, the application of Improvements to IFRSs issued in 2009 has not
had any material effect on amounts reported in the consolidated financial statements.
2. New and revised Standards and Interpretations in issue not yet adopted
The Group has not applied the following new and revised IFRSs that have been issued but are not yet effective:
Amendments to IFRS 1 Limited Exemption from Comparative IFRS 7 Disclosures for First-time Adopters1
Amendments to IFRS 1 Replacement of “fixed dates” for certain exceptions with “the date of transition to IFRS2
Amendments to IFRS 1 Additional Exemption for Entities Ceasing to Suffer from Severe Hyperinflation2
Amendments to IFRS 7 Disclosures – Transfers of Financial Assets2
IFRS 9 (as amended in 2010) Financial Instruments3
IAS 24 (revised in 2009) Related Party Disclosures4
Amendments to IAS 32 Classification of Right Issues5
Amendments to IAS 12 Income taxes – Limited scope amendment (Recovery of Underlying Assets)6
Amendments to IFRIC 14 Prepayments of a Minimum Funding Requirement4
IFRIC 19 Extinguishment Financial Liabilities with Equity Instruments1
Improvements to IFRSs issued in 2010 (except for the amendments to IFRS 3 (2008), IFRS 7, IAS 1and IAS 28 described earlier in section 2.1)7
1 Effective for annual periods beginning on or after 1 July 2010
2 Effective for annual periods beginning on or after 1 July 2011
3 Effective for annual periods beginning on or after 1 January 2013
4 Effective for annual periods beginning on or after 1 January 2011
5 Effective for annual periods beginning on or after 1 February 2010
6 Effective for annual periods beginning on or after 1 January 2012
7 Effective for annual periods beginning on or after 1 July 2010 and 1 January 2011, as appropriate
IfRS 9 financial Instruments
IFRS 9 Financial Instruments issued in November 2009 and amended in October 2010 introduces new requirements for the
classification and measurement of financial assets and financial liabilities and for derecognition.
› IFRS 9 requires all recognised financial assets that are within the scope of IAS 39 Financial Instruments: Recognition and Measurement
to be subsequently measured at amortised cost or fair value. Specifically, debt investments that are held within a business model
whose objective is to collect the contractual cash flows, and that have contractual cash flows that are solely payments of principal
and interest on the principal outstanding are generally measured at amortised cost at the end of subsequent accounting periods.
All other debt investments and equity investments are measured at their fair values at the end of subsequent accounting periods.
› The most significant effect of IFRS 9 regarding the classification and measurement of financial liabilities relates to the accounting
for changes in fair value of a financial liability (designated as at fair value through profit or loss) attributable to changes in the
credit risk of that liability. Specifically, under IFRS 9, for financial liabilities that are designated as at fair value through profit or
loss, the amount of change in the fair value of the financial liability that is attributable to changes in the credit risk of that liability
is recognised in other comprehensive income, unless the recognition of the effects of changes in the liability’s credit risk in other
comprehensive income would create or enlarge an accounting mismatch in profit or loss. Changes in fair value attributable to a
financial liability’s credit risk are not subsequently reclassified to profit or loss. Previously, under IAS 39, the entire amount of the
change in the fair value of the financial liability designated as at fair value through profit or loss was recognised in profit or loss.
IFRS 9 is effective for annual periods beginning on or after 1 January 2013, with earlier application permitted.
IAS 24 Related party Disclosures (as revised in 2009) modifies the definition of a related party and simplifies disclosures for government-related entities.
The disclosure exemptions introduced in IAS 24 (as revised in 2009) do not affect the Group because the Group is not a government-
related entity. However, disclosures regarding related party transactions and balances in these consolidated financial statements
may be affected when the revised version of the Standard is applied in future accounting periods because some counterparties
that did not previously meet the definition of a related party may come within the scope of the Standard.
Amendments to IAS 32 financial Instruments: presentation regarding Classification of Rights Issues
The amendments to IAS 32 titled Classification of Rights Issues address the classification of certain rights issues denominated in a
foreign currency as either an equity instrument or as a financial liability. To date, the Group has not entered into any arrangements
that would fall within the scope of the amendments. However, if the Group does enter into any rights issues within the scope of the
amendments in future accounting periods, the amendments to IAS 32 will have an impact on the classification of those rights issues.
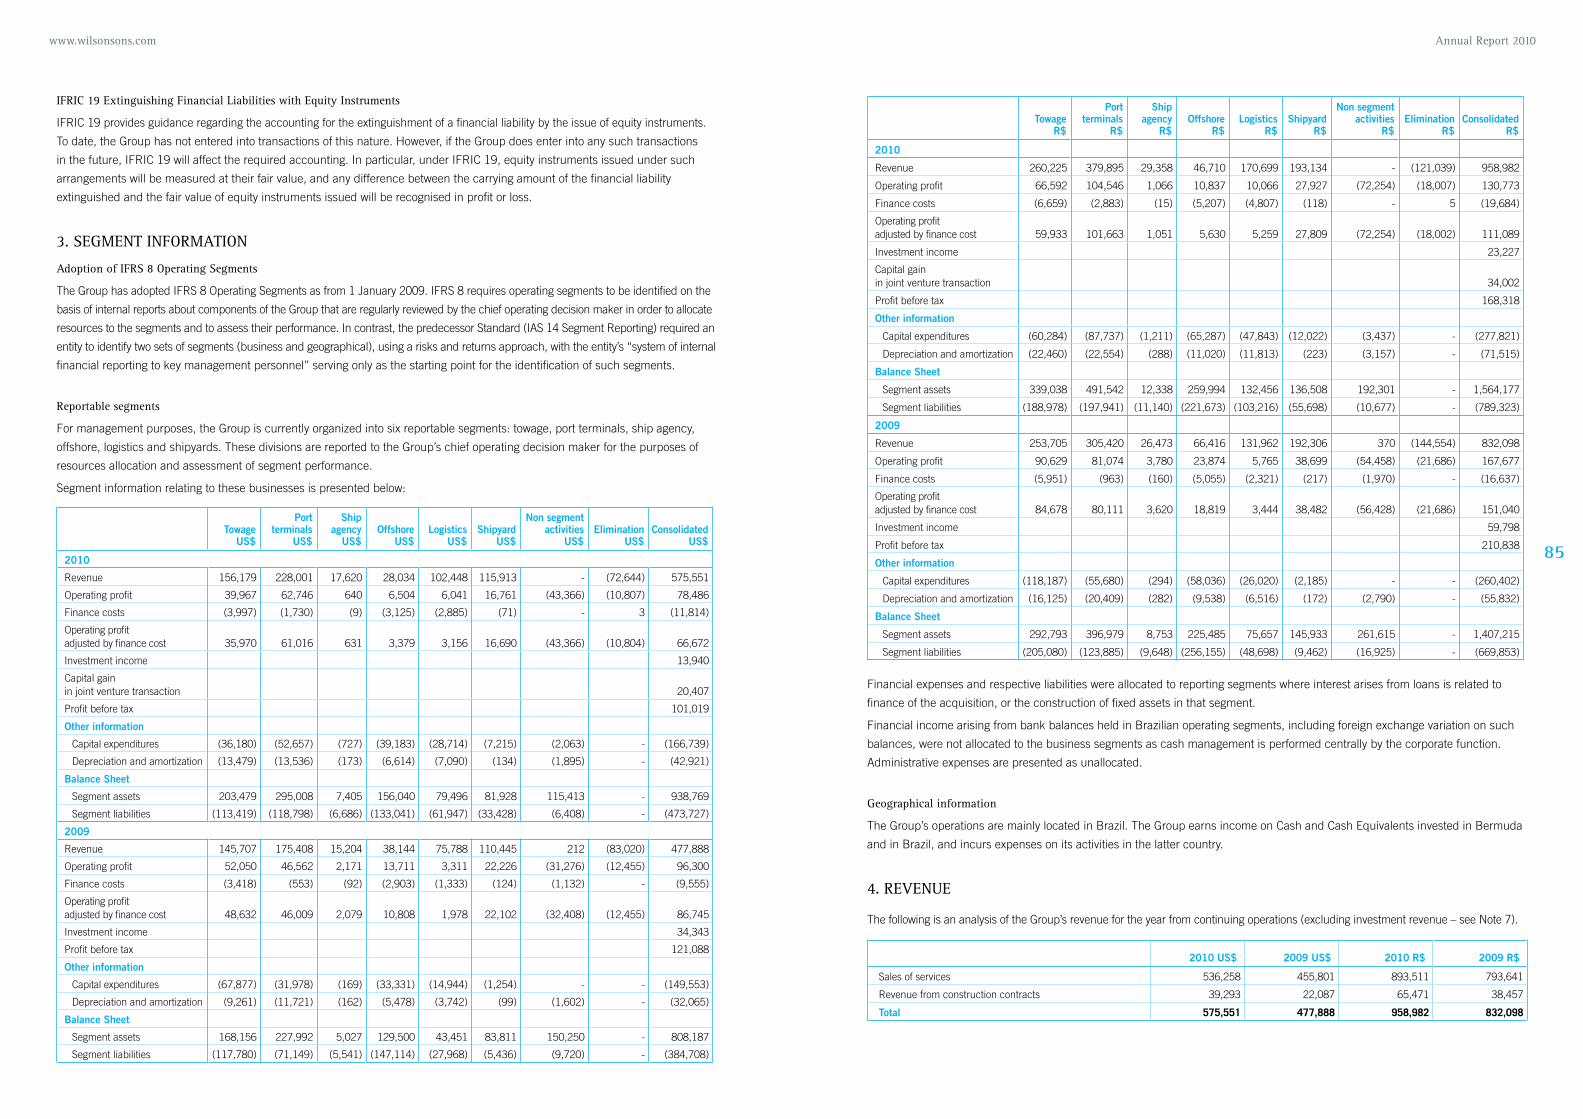
85
Annual Report 2010 www.wilsonsons.com
IfRIC 19 Extinguishing financial liabilities with Equity Instruments
IFRIC 19 provides guidance regarding the accounting for the extinguishment of a financial liability by the issue of equity instruments.
To date, the Group has not entered into transactions of this nature. However, if the Group does enter into any such transactions
in the future, IFRIC 19 will affect the required accounting. In particular, under IFRIC 19, equity instruments issued under such
arrangements will be measured at their fair value, and any difference between the carrying amount of the financial liability
extinguished and the fair value of equity instruments issued will be recognised in profit or loss.
3. SEGmEnt InfoRmAtIon
Adoption of IfRS 8 operating Segments
The Group has adopted IFRS 8 Operating Segments as from 1 January 2009. IFRS 8 requires operating segments to be identified on the
basis of internal reports about components of the Group that are regularly reviewed by the chief operating decision maker in order to allocate
resources to the segments and to assess their performance. In contrast, the predecessor Standard (IAS 14 Segment Reporting) required an
entity to identify two sets of segments (business and geographical), using a risks and returns approach, with the entity’s “system of internal
financial reporting to key management personnel” serving only as the starting point for the identification of such segments.
Reportable segments
For management purposes, the Group is currently organized into six reportable segments: towage, port terminals, ship agency,
offshore, logistics and shipyards. These divisions are reported to the Group’s chief operating decision maker for the purposes of
resources allocation and assessment of segment performance.
Segment information relating to these businesses is presented below:
TowageUS$
Port terminals
US$
Ship agency
US$Offshore
US$Logistics
US$Shipyard
US$
Non segment activities
US$Elimination
US$Consolidated
US$
2010
Revenue 156,179 228,001 17,620 28,034 102,448 115,913 - (72,644) 575,551
Operating profit 39,967 62,746 640 6,504 6,041 16,761 (43,366) (10,807) 78,486
Finance costs (3,997) (1,730) (9) (3,125) (2,885) (71) - 3 (11,814)
Operating profit adjusted by finance cost 35,970 61,016 631 3,379 3,156 16,690 (43,366) (10,804) 66,672
Investment income 13,940
Capital gain in joint venture transaction 20,407
Profit before tax 101,019
Other information
Capital expenditures (36,180) (52,657) (727) (39,183) (28,714) (7,215) (2,063) - (166,739)
Depreciation and amortization (13,479) (13,536) (173) (6,614) (7,090) (134) (1,895) - (42,921)
Balance Sheet
Segment assets 203,479 295,008 7,405 156,040 79,496 81,928 115,413 - 938,769
Segment liabilities (113,419) (118,798) (6,686) (133,041) (61,947) (33,428) (6,408) - (473,727)
2009
Revenue 145,707 175,408 15,204 38,144 75,788 110,445 212 (83,020) 477,888
Operating profit 52,050 46,562 2,171 13,711 3,311 22,226 (31,276) (12,455) 96,300
Finance costs (3,418) (553) (92) (2,903) (1,333) (124) (1,132) - (9,555)
Operating profit adjusted by finance cost 48,632 46,009 2,079 10,808 1,978 22,102 (32,408) (12,455) 86,745
Investment income 34,343
Profit before tax 121,088
Other information
Capital expenditures (67,877) (31,978) (169) (33,331) (14,944) (1,254) - - (149,553)
Depreciation and amortization (9,261) (11,721) (162) (5,478) (3,742) (99) (1,602) - (32,065)
Balance Sheet
Segment assets 168,156 227,992 5,027 129,500 43,451 83,811 150,250 - 808,187
Segment liabilities (117,780) (71,149) (5,541) (147,114) (27,968) (5,436) (9,720) - (384,708)
TowageR$
Port terminals
R$
Ship agency
R$Offshore
R$Logistics
R$Shipyard
R$
Non segment activities
R$Elimination
R$Consolidated
R$
2010
Revenue 260,225 379,895 29,358 46,710 170,699 193,134 - (121,039) 958,982
Operating profit 66,592 104,546 1,066 10,837 10,066 27,927 (72,254) (18,007) 130,773
Finance costs (6,659) (2,883) (15) (5,207) (4,807) (118) - 5 (19,684)
Operating profit adjusted by finance cost 59,933 101,663 1,051 5,630 5,259 27,809 (72,254) (18,002) 111,089
Investment income 23,227
Capital gain in joint venture transaction 34,002
Profit before tax 168,318
Other information
Capital expenditures (60,284) (87,737) (1,211) (65,287) (47,843) (12,022) (3,437) - (277,821)
Depreciation and amortization (22,460) (22,554) (288) (11,020) (11,813) (223) (3,157) - (71,515)
Balance Sheet
Segment assets 339,038 491,542 12,338 259,994 132,456 136,508 192,301 - 1,564,177
Segment liabilities (188,978) (197,941) (11,140) (221,673) (103,216) (55,698) (10,677) - (789,323)
2009
Revenue 253,705 305,420 26,473 66,416 131,962 192,306 370 (144,554) 832,098
Operating profit 90,629 81,074 3,780 23,874 5,765 38,699 (54,458) (21,686) 167,677
Finance costs (5,951) (963) (160) (5,055) (2,321) (217) (1,970) - (16,637)
Operating profit adjusted by finance cost 84,678 80,111 3,620 18,819 3,444 38,482 (56,428) (21,686) 151,040
Investment income 59,798
Profit before tax 210,838
Other information
Capital expenditures (118,187) (55,680) (294) (58,036) (26,020) (2,185) - - (260,402)
Depreciation and amortization (16,125) (20,409) (282) (9,538) (6,516) (172) (2,790) - (55,832)
Balance Sheet
Segment assets 292,793 396,979 8,753 225,485 75,657 145,933 261,615 - 1,407,215
Segment liabilities (205,080) (123,885) (9,648) (256,155) (48,698) (9,462) (16,925) - (669,853)
Financial expenses and respective liabilities were allocated to reporting segments where interest arises from loans is related to
finance of the acquisition, or the construction of fixed assets in that segment.
Financial income arising from bank balances held in Brazilian operating segments, including foreign exchange variation on such
balances, were not allocated to the business segments as cash management is performed centrally by the corporate function.
Administrative expenses are presented as unallocated.
Geographical information
The Group’s operations are mainly located in Brazil. The Group earns income on Cash and Cash Equivalents invested in Bermuda
and in Brazil, and incurs expenses on its activities in the latter country.
4. REvEnuE
The following is an analysis of the Group’s revenue for the year from continuing operations (excluding investment revenue – see Note 7).
2010 US$ 2009 US$ 2010 R$ 2009 R$
Sales of services 536,258 455,801 893,511 793,641
Revenue from construction contracts 39,293 22,087 65,471 38,457
Total 575,551 477,888 958,982 832,098
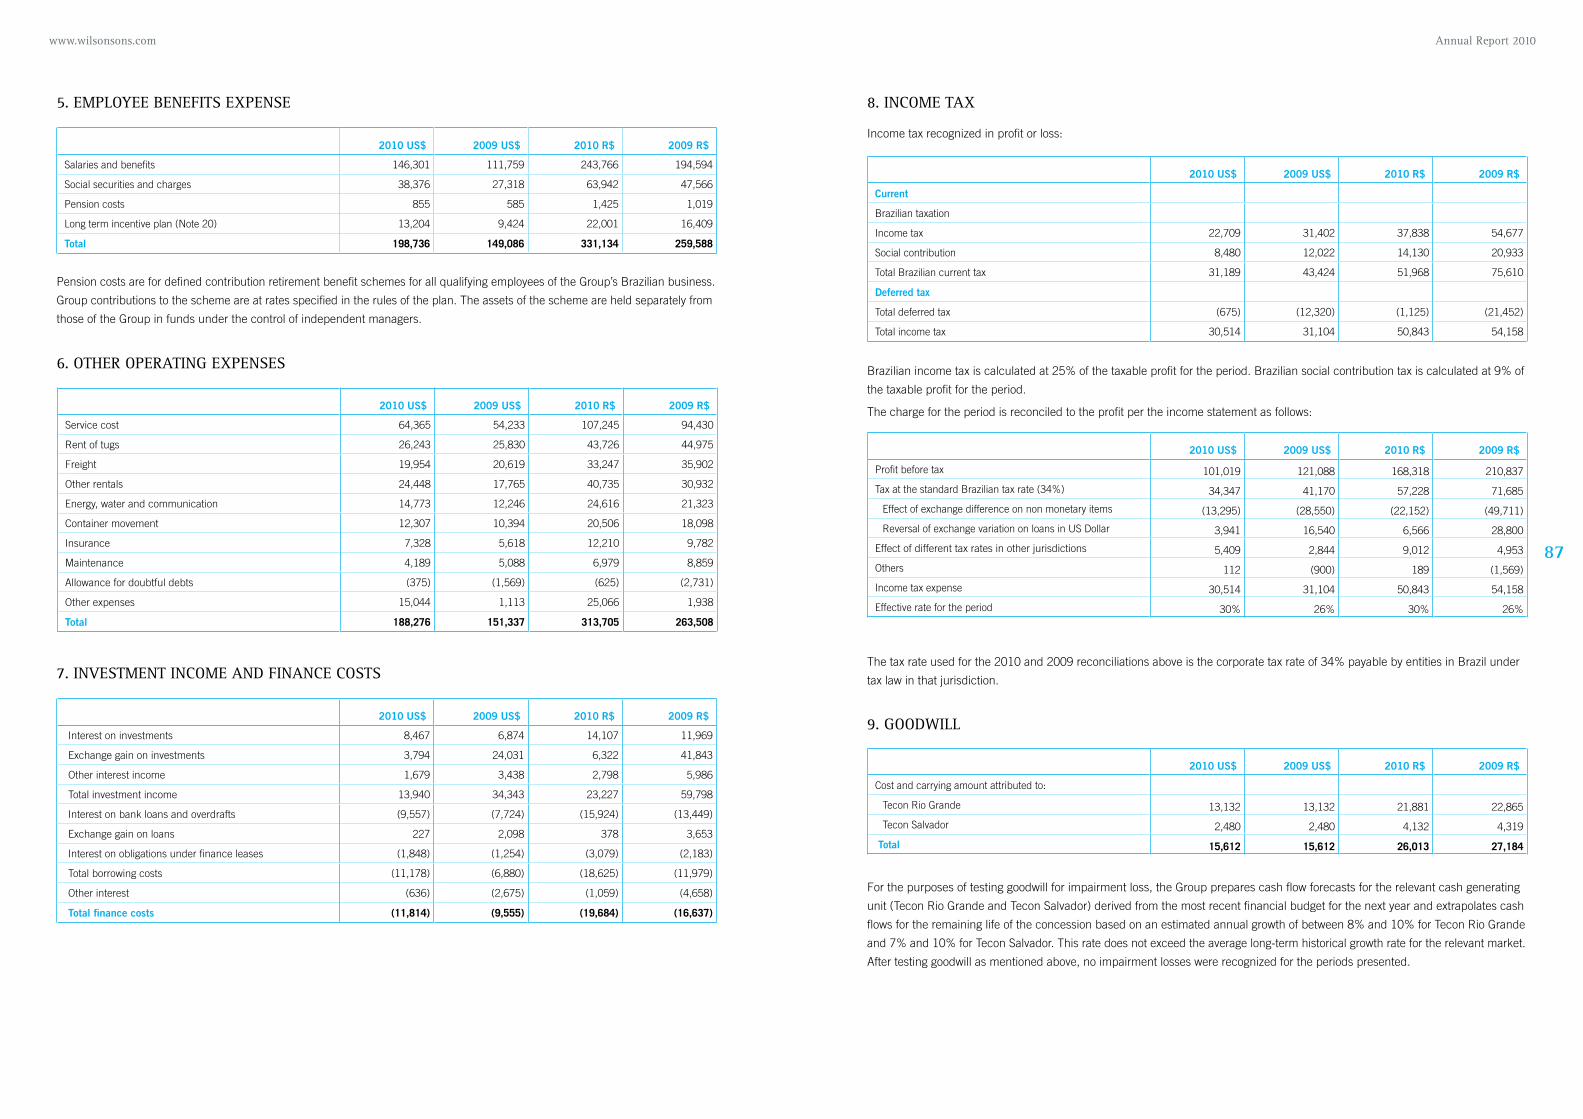
87
Annual Report 2010 www.wilsonsons.com
5. EmploYEE BEnEfItS ExpEnSE
2010 US$ 2009 US$ 2010 R$ 2009 R$
Salaries and benefits 146,301 111,759 243,766 194,594
Social securities and charges 38,376 27,318 63,942 47,566
Pension costs 855 585 1,425 1,019
Long term incentive plan (Note 20) 13,204 9,424 22,001 16,409
Total 198,736 149,086 331,134 259,588
Pension costs are for defined contribution retirement benefit schemes for all qualifying employees of the Group’s Brazilian business.
Group contributions to the scheme are at rates specified in the rules of the plan. The assets of the scheme are held separately from
those of the Group in funds under the control of independent managers.
6. othER opERAtInG ExpEnSES
2010 US$ 2009 US$ 2010 R$ 2009 R$
Service cost 64,365 54,233 107,245 94,430
Rent of tugs 26,243 25,830 43,726 44,975
Freight 19,954 20,619 33,247 35,902
Other rentals 24,448 17,765 40,735 30,932
Energy, water and communication 14,773 12,246 24,616 21,323
Container movement 12,307 10,394 20,506 18,098
Insurance 7,328 5,618 12,210 9,782
Maintenance 4,189 5,088 6,979 8,859
Allowance for doubtful debts (375) (1,569) (625) (2,731)
Other expenses 15,044 1,113 25,066 1,938
Total 188,276 151,337 313,705 263,508
2010 US$ 2009 US$ 2010 R$ 2009 R$
Current
Brazilian taxation
Income tax 22,709 31,402 37,838 54,677
Social contribution 8,480 12,022 14,130 20,933
Total Brazilian current tax 31,189 43,424 51,968 75,610
Deferred tax
Total deferred tax (675) (12,320) (1,125) (21,452)
Total income tax 30,514 31,104 50,843 54,158
2010 US$ 2009 US$ 2010 R$ 2009 R$
Profit before tax 101,019 121,088 168,318 210,837
Tax at the standard Brazilian tax rate (34%) 34,347 41,170 57,228 71,685
Effect of exchange difference on non monetary items (13,295) (28,550) (22,152) (49,711)
Reversal of exchange variation on loans in US Dollar 3,941 16,540 6,566 28,800
Effect of different tax rates in other jurisdictions 5,409 2,844 9,012 4,953
Others 112 (900) 189 (1,569)
Income tax expense 30,514 31,104 50,843 54,158
Effective rate for the period 30% 26% 30% 26%
7. InvEStmEnt InComE AnD fInAnCE CoStS
2010 US$ 2009 US$ 2010 R$ 2009 R$
Interest on investments 8,467 6,874 14,107 11,969
Exchange gain on investments 3,794 24,031 6,322 41,843
Other interest income 1,679 3,438 2,798 5,986
Total investment income 13,940 34,343 23,227 59,798
Interest on bank loans and overdrafts (9,557) (7,724) (15,924) (13,449)
Exchange gain on loans 227 2,098 378 3,653
Interest on obligations under finance leases (1,848) (1,254) (3,079) (2,183)
Total borrowing costs (11,178) (6,880) (18,625) (11,979)
Other interest (636) (2,675) (1,059) (4,658)
Total finance costs (11,814) (9,555) (19,684) (16,637)
8. InComE tAx
Income tax recognized in profit or loss:
Brazilian income tax is calculated at 25% of the taxable profit for the period. Brazilian social contribution tax is calculated at 9% of
the taxable profit for the period.
The charge for the period is reconciled to the profit per the income statement as follows:
The tax rate used for the 2010 and 2009 reconciliations above is the corporate tax rate of 34% payable by entities in Brazil under
tax law in that jurisdiction.
9. GooDwIll
2010 US$ 2009 US$ 2010 R$ 2009 R$
Cost and carrying amount attributed to:
Tecon Rio Grande 13,132 13,132 21,881 22,865
Tecon Salvador 2,480 2,480 4,132 4,319
Total 15,612 15,612 26,013 27,184
For the purposes of testing goodwill for impairment loss, the Group prepares cash flow forecasts for the relevant cash generating
unit (Tecon Rio Grande and Tecon Salvador) derived from the most recent financial budget for the next year and extrapolates cash
flows for the remaining life of the concession based on an estimated annual growth of between 8% and 10% for Tecon Rio Grande
and 7% and 10% for Tecon Salvador. This rate does not exceed the average long-term historical growth rate for the relevant market.
After testing goodwill as mentioned above, no impairment losses were recognized for the periods presented.
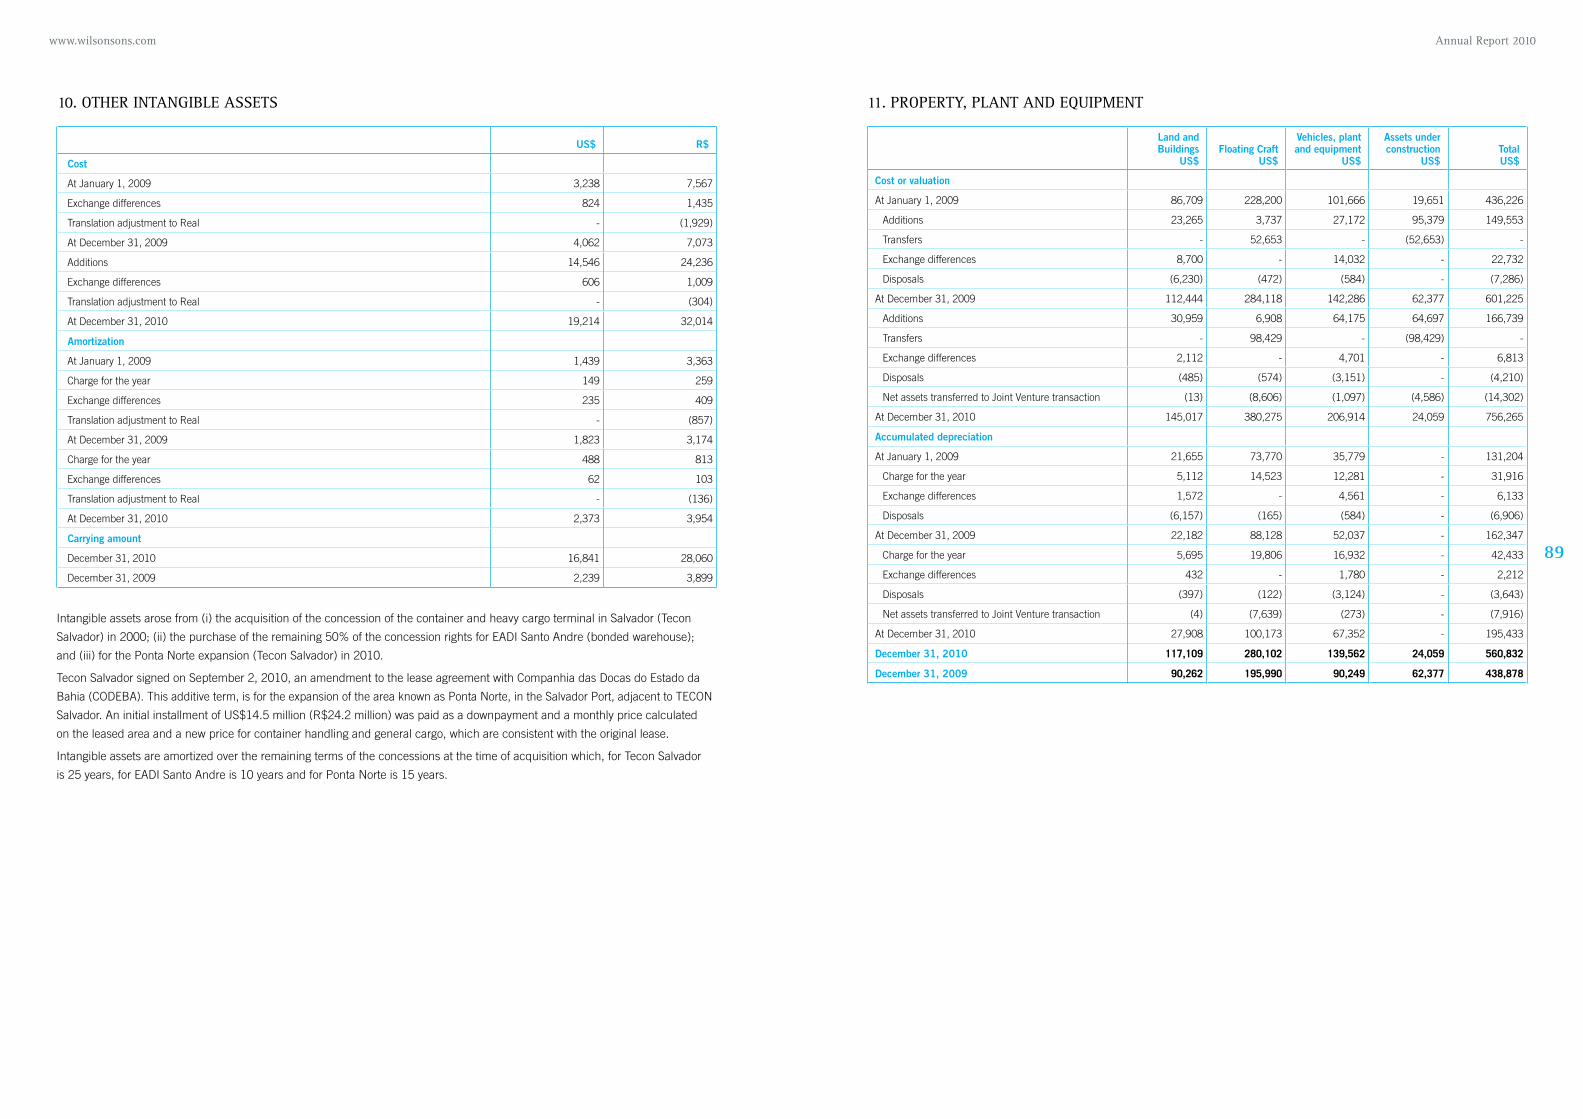
89
Annual Report 2010 www.wilsonsons.com
US$ R$
Cost
At January 1, 2009 3,238 7,567
Exchange differences 824 1,435
Translation adjustment to Real - (1,929)
At December 31, 2009 4,062 7,073
Additions 14,546 24,236
Exchange differences 606 1,009
Translation adjustment to Real - (304)
At December 31, 2010 19,214 32,014
Amortization
At January 1, 2009 1,439 3,363
Charge for the year 149 259
Exchange differences 235 409
Translation adjustment to Real - (857)
At December 31, 2009 1,823 3,174
Charge for the year 488 813
Exchange differences 62 103
Translation adjustment to Real - (136)
At December 31, 2010 2,373 3,954
Carrying amount
December 31, 2010 16,841 28,060
December 31, 2009 2,239 3,899
Land and Buildings
US$Floating Craft
US$
Vehicles, plant and equipment
US$
Assets under construction
US$TotalUS$
Cost or valuation
At January 1, 2009 86,709 228,200 101,666 19,651 436,226
Additions 23,265 3,737 27,172 95,379 149,553
Transfers - 52,653 - (52,653) -
Exchange differences 8,700 - 14,032 - 22,732
Disposals (6,230) (472) (584) - (7,286)
At December 31, 2009 112,444 284,118 142,286 62,377 601,225
Additions 30,959 6,908 64,175 64,697 166,739
Transfers - 98,429 - (98,429) -
Exchange differences 2,112 - 4,701 - 6,813
Disposals (485) (574) (3,151) - (4,210)
Net assets transferred to Joint Venture transaction (13) (8,606) (1,097) (4,586) (14,302)
At December 31, 2010 145,017 380,275 206,914 24,059 756,265
Accumulated depreciation
At January 1, 2009 21,655 73,770 35,779 - 131,204
Charge for the year 5,112 14,523 12,281 - 31,916
Exchange differences 1,572 - 4,561 - 6,133
Disposals (6,157) (165) (584) - (6,906)
At December 31, 2009 22,182 88,128 52,037 - 162,347
Charge for the year 5,695 19,806 16,932 - 42,433
Exchange differences 432 - 1,780 - 2,212
Disposals (397) (122) (3,124) - (3,643)
Net assets transferred to Joint Venture transaction (4) (7,639) (273) - (7,916)
At December 31, 2010 27,908 100,173 67,352 - 195,433
December 31, 2010 117,109 280,102 139,562 24,059 560,832
December 31, 2009 90,262 195,990 90,249 62,377 438,878
11. PROPERTY, PLANT AND EQUIPMENT10. OTHER INTANGIBLE ASSETS
Intangible assets arose from (i) the acquisition of the concession of the container and heavy cargo terminal in Salvador (Tecon
Salvador) in 2000; (ii) the purchase of the remaining 50% of the concession rights for EADI Santo Andre (bonded warehouse);
and (iii) for the Ponta Norte expansion (Tecon Salvador) in 2010.
Tecon Salvador signed on September 2, 2010, an amendment to the lease agreement with Companhia das Docas do Estado da
Bahia (CODEBA). This additive term, is for the expansion of the area known as Ponta Norte, in the Salvador Port, adjacent to TECON
Salvador. An initial installment of US$14.5 million (R$24.2 million) was paid as a downpayment and a monthly price calculated
on the leased area and a new price for container handling and general cargo, which are consistent with the original lease.
Intangible assets are amortized over the remaining terms of the concessions at the time of acquisition which, for Tecon Salvador
is 25 years, for EADI Santo Andre is 10 years and for Ponta Norte is 15 years.

91
Annual Report 2010 www.wilsonsons.com
Land and Buildings
R$ Floating
R$
Vehicles, plant and equipment
R$
assets under construction
R$Total
R$
Cost or valuation
At January 1, 2009 202,639 533,303 237,593 45,924 1,019,459
Additions 40,509 6,507 47,312 166,074 260,402
Transfers - 91,679 - (91,679) -
Exchange differences 15,149 - 24,433 - 39,582
Disposals (10,848) (822) (1,017) - (12,687)
Translation adjustment to Real (51,662) (135,961) (60,573) (11,707) (259,903)
At December 31, 2009 195,787 494,706 247,748 108,612 1,046,853
Additions 51,584 11,510 106,928 107,799 277,821
Transfers - 164,003 - (164,003) -
Exchange differences 3,520 - 7,833 - 11,353
Disposals (808) (956) (5,251) - (7,015)
Net assets transferred to Joint Venture transaction (22) (14,340) (1,829) (7,641) (23,832)
Translation adjustment to Real (8,434) (21,308) (10,669) (4,681) (45,092)
At December 31, 2010 241,627 633,615 344,760 40,086 1,260,088
Accumulated depreciation
At January 1, 2009 50,607 172,400 83,616 - 306,623
Charge for the year 8,901 25,287 21,384 - 55,572
Exchange differences 2,737 - 7,942 - 10,679
Disposals (10,721) (287) (1,017) - (12,025)
Translation adjustment to Real (12,901) (43,951) (21,318) - (78,170)
At December 31, 2009 38,623 153,449 90,607 - 282,679
Charge for the year 9,488 33,002 28,212 - 70,702
Exchange differences 720 - 2,967 - 3,687
Disposals (661) (203) (5,206) - (6,070)
Net assets transferred to Joint Venture transaction (6) (12,728) (455) - (13,189)
Translation adjustment to Real (1,664) (6,612) (3,903) - (12,179)
At December 31, 2010 46,500 166,908 112,222 - 325,630
December 31, 2010 195,127 466,707 232,538 40,086 934,458
December 31, 2009 157,164 341,257 157,141 108,612 764,174
The cost amount of the Group’s vehicles, plant and equipment includes an amount of US$24.9 million (R$41.5 million)
(2009: US$23.0 million (R$40.0 million)) in respect of assets held under finance leases.
Land and buildings with a net book value of US$370 (R$616) (2009: US$385 (R$670)) and tugs with a net book value
of US$2,587 (R$4,310) (2009: US$2,794 (R$4,865)) have been given in guarantee of various lawsuits.
The Group has pledged assets having a carrying amount of approximately US$317.1 million (R$528.4 million)
(2009: US$235.4 million (R$409.9 million)) to secure loans granted to the Group.
The amount of capitalized interest in 2010 is US$1,889 (R$3,147) (2009: US$728 (R$1,268)), at an average interest rate
of 3.83% (2009: 3.42%).
On December 31 2010, the Group had contractual commitments to suppliers for the acquisition and construction of property,
plant and equipment amounting to US$116.4 million (R$194.0 million) (2009: US$23.7 million (R$41.2 million)). The amount
mainly refers to the expansion of Tecon Salvador and Tecon Rio Grande and to the construction of the Guarujá II shipyard.
When the Company entered the Joint Venture with Magallanes Navegação Brasileira the property, plant and equipment was
reduced by US$16.8 million (R$28.1 million), equivalent to the portion of the net assets transferred to the partner on setting up
the joint venture.
2010 US$ 2009 US$ 2010 R$ 2009 R$
Operating materials 11,024 9,758 18,368 16,991
Raw materials for construction contracts (external customers) 9,123 10,929 15,201 19,030
Total 20,147 20,687 33,569 36,021
2010 US$ 2009 US$ 2010 R$ 2009 R$
Accounts receivable for services rendered 65,240 49,948 108,703 86,971
Allowance for doubtful debts (1,320) (1,637) (2,200) (2,850)
Income tax recoverable 8,203 5,484 13,667 9,547
Prepayments and recoverable taxes and levies 62,838 51,704 104,701 90,027
Total 134,961 105,499 224,871 183,695
Total current 128,561 105,499 214,206 183,695
Total non-current 6,400 - 10,665 -
2010 US$ 2009 US$ 2010 R$ 2009 R$
Current 52,518 41,377 87,506 72,046
Overdue by:
01 to 30 days 7,351 5,051 12,248 8,796
31 to 90 days 3,442 1,440 5,735 2,508
91 to 180 days 609 443 1,014 771
More than 180 days 1,320 1,637 2,200 2,850
Total 65,240 49,948 108,703 86,971
13. tRADE AnD othER RECEIvABlES
Trade receivables disclosed are classified as financial assets measured at amortised cost.
Long term trade receivables refers to recoverable taxes with maturity dates of more than 365 days and mainly refers to PIS,
COFINS, ISS and INSS. There is any impairment evidence for this asset.
The aging list of accounts receivable for services rendered is shown below as follows:
12. InvEntoRIES
Allowances for doubtful debts are recognized decreasing the amount of accounts receivable and is established whenever a loss
is detected, based on estimated irrecoverable amounts determined by reference to past default experience of the counterparty
and on an analysis of the counterparty’s current financial position. The Group has recognized an allowance for doubtful debts
of 100% against all receivables over 180 days because historical experience has been that receivables that are past due beyond
180 days are not recoverable. Interest of 1 percent plus an average penalty of 2 percent is charged to customers on overdue
accounts receivables balances.
Changes in allowance for doubtful debts are as follows:
US$ R$
At January 1, 2009 2,761 6,452
Amounts written off during the period (4,177) (7,272)
Increase in allowance 2,423 4,220
Exchange difference 630 1,096
Translation adjustment to Real - (1,646)
At December 31, 2009 1,637 2,850
Amounts written off during the period (2,288) (3,812)
Increase in allowance 1,910 3,182
Exchange difference 61 103
Translation adjustment to Real - (123)
At December 31, 2010 1,320 2,200
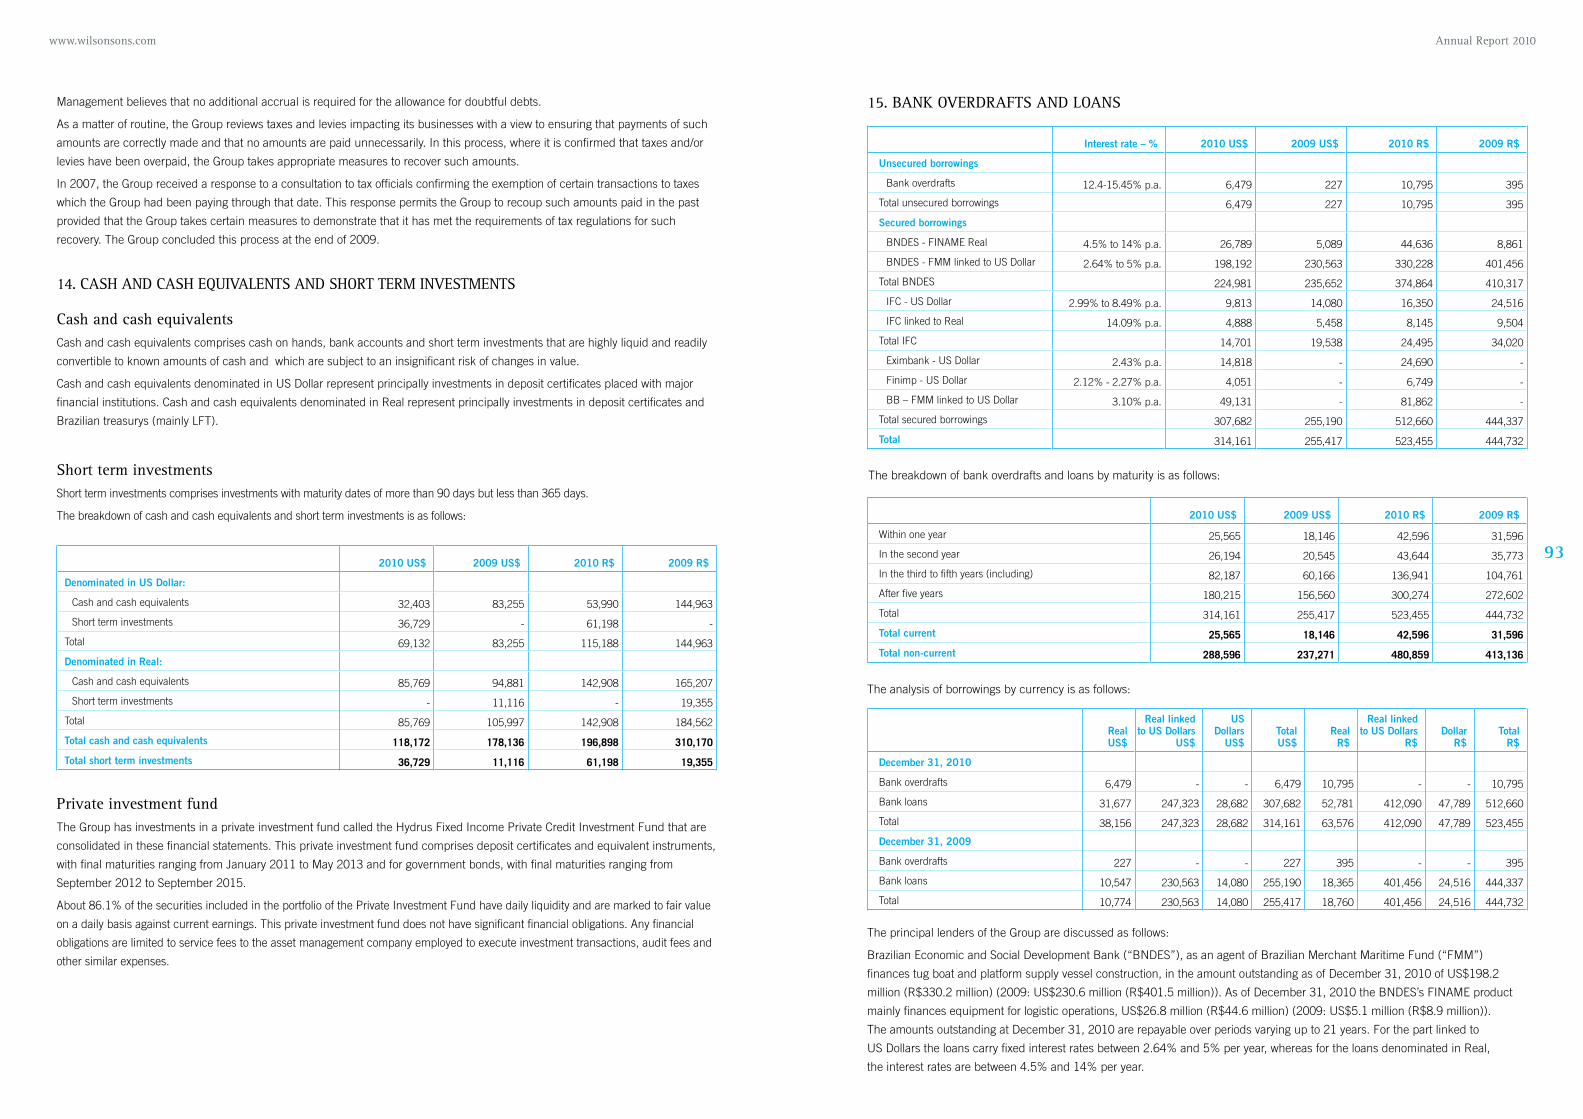
93
Annual Report 2010 www.wilsonsons.com
Management believes that no additional accrual is required for the allowance for doubtful debts.
As a matter of routine, the Group reviews taxes and levies impacting its businesses with a view to ensuring that payments of such
amounts are correctly made and that no amounts are paid unnecessarily. In this process, where it is confirmed that taxes and/or
levies have been overpaid, the Group takes appropriate measures to recover such amounts.
In 2007, the Group received a response to a consultation to tax officials confirming the exemption of certain transactions to taxes
which the Group had been paying through that date. This response permits the Group to recoup such amounts paid in the past
provided that the Group takes certain measures to demonstrate that it has met the requirements of tax regulations for such
recovery. The Group concluded this process at the end of 2009.
14. CASh AnD CASh EQuIvAlEntS AnD ShoRt tERm InvEStmEntS
Cash and cash equivalentsCash and cash equivalents comprises cash on hands, bank accounts and short term investments that are highly liquid and readily
convertible to known amounts of cash and which are subject to an insignificant risk of changes in value.
Cash and cash equivalents denominated in US Dollar represent principally investments in deposit certificates placed with major
financial institutions. Cash and cash equivalents denominated in Real represent principally investments in deposit certificates and
Brazilian treasurys (mainly LFT).
Short term investmentsShort term investments comprises investments with maturity dates of more than 90 days but less than 365 days.
The breakdown of cash and cash equivalents and short term investments is as follows:
2010 US$ 2009 US$ 2010 R$ 2009 R$
Denominated in US Dollar:
Cash and cash equivalents 32,403 83,255 53,990 144,963
Short term investments 36,729 - 61,198 -
Total 69,132 83,255 115,188 144,963
Denominated in Real:
Cash and cash equivalents 85,769 94,881 142,908 165,207
Short term investments - 11,116 - 19,355
Total 85,769 105,997 142,908 184,562
Total cash and cash equivalents 118,172 178,136 196,898 310,170
Total short term investments 36,729 11,116 61,198 19,355
Interest rate – % 2010 US$ 2009 US$ 2010 R$ 2009 R$
Unsecured borrowings
Bank overdrafts 12.4-15.45% p.a. 6,479 227 10,795 395
Total unsecured borrowings 6,479 227 10,795 395
Secured borrowings
BNDES - FINAME Real 4.5% to 14% p.a. 26,789 5,089 44,636 8,861
BNDES - FMM linked to US Dollar 2.64% to 5% p.a. 198,192 230,563 330,228 401,456
Total BNDES 224,981 235,652 374,864 410,317
IFC - US Dollar 2.99% to 8.49% p.a. 9,813 14,080 16,350 24,516
IFC linked to Real 14.09% p.a. 4,888 5,458 8,145 9,504
Total IFC 14,701 19,538 24,495 34,020
Eximbank - US Dollar 2.43% p.a. 14,818 - 24,690 -
Finimp - US Dollar 2.12% - 2.27% p.a. 4,051 - 6,749 -
BB – FMM linked to US Dollar 3.10% p.a. 49,131 - 81,862 -
Total secured borrowings 307,682 255,190 512,660 444,337
Total 314,161 255,417 523,455 444,732
private investment fundThe Group has investments in a private investment fund called the Hydrus Fixed Income Private Credit Investment Fund that are
consolidated in these financial statements. This private investment fund comprises deposit certificates and equivalent instruments,
with final maturities ranging from January 2011 to May 2013 and for government bonds, with final maturities ranging from
September 2012 to September 2015.
About 86.1% of the securities included in the portfolio of the Private Investment Fund have daily liquidity and are marked to fair value
on a daily basis against current earnings. This private investment fund does not have significant financial obligations. Any financial
obligations are limited to service fees to the asset management company employed to execute investment transactions, audit fees and
other similar expenses.
15. BAnK ovERDRAftS AnD loAnS
The breakdown of bank overdrafts and loans by maturity is as follows:
2010 US$ 2009 US$ 2010 R$ 2009 R$
Within one year 25,565 18,146 42,596 31,596
In the second year 26,194 20,545 43,644 35,773
In the third to fifth years (including) 82,187 60,166 136,941 104,761
After five years 180,215 156,560 300,274 272,602
Total 314,161 255,417 523,455 444,732
Total current 25,565 18,146 42,596 31,596
Total non-current 288,596 237,271 480,859 413,136
The analysis of borrowings by currency is as follows:
RealUS$
Real linked to US Dollars
US$
US Dollars
US$TotalUS$
RealR$
Real linked to US Dollars
R$Dollar
R$Total
R$
December 31, 2010
Bank overdrafts 6,479 - - 6,479 10,795 - - 10,795
Bank loans 31,677 247,323 28,682 307,682 52,781 412,090 47,789 512,660
Total 38,156 247,323 28,682 314,161 63,576 412,090 47,789 523,455
December 31, 2009
Bank overdrafts 227 - - 227 395 - - 395
Bank loans 10,547 230,563 14,080 255,190 18,365 401,456 24,516 444,337
Total 10,774 230,563 14,080 255,417 18,760 401,456 24,516 444,732
The principal lenders of the Group are discussed as follows:
Brazilian Economic and Social Development Bank (“BNDES”), as an agent of Brazilian Merchant Maritime Fund (“FMM”)
finances tug boat and platform supply vessel construction, in the amount outstanding as of December 31, 2010 of US$198.2
million (R$330.2 million) (2009: US$230.6 million (R$401.5 million)). As of December 31, 2010 the BNDES’s FINAME product
mainly finances equipment for logistic operations, US$26.8 million (R$44.6 million) (2009: US$5.1 million (R$8.9 million)).
The amounts outstanding at December 31, 2010 are repayable over periods varying up to 21 years. For the part linked to
US Dollars the loans carry fixed interest rates between 2.64% and 5% per year, whereas for the loans denominated in Real,
the interest rates are between 4.5% and 14% per year.

95
Annual Report 2010 www.wilsonsons.com
The Banco do Brasil (“BB”), as an agent of Brazilian Merchant Maritime Fund (“FMM”) finances platform supply vessel’s construction,
in the amount outstanding as of December 31, 2010 of US$49.1 million (R$81.9 million). This liability was assumed when the
Company entered the Joint Venture with Magallanes Navegação Brasileira. All contracts are in a grace period and will be amortized
from January 2012 and are repayable over periods varying up to 18 years. These loans are denominated in the U.S. dollar and
bear fixed interest rates of 3.1% per year.
The International Finance Corporation (“IFC”) finances both port terminals – Tecon Rio Grande and Tecon Salvador. There are two
loan agreements with this bank: one for Tecon Salvador and one for Tecon Rio Grande. The amounts outstanding at December 31,
2010 are repayable over periods varying up to 6 years. These loans are denominated partly in the US Dollar and partly in the Real.
For the part linked to the US Dollar, one of the loans has an interest rate fixed at 8.49% per year, while the others bear interest at
a variable rate of Libor (6 monthly) plus spread of between 2.5% to 3.5% per year, whereas for the part denominated in Real, the
interest rate is fixed at 14.09% per year.
The Export-Import Bank of China (“Eximbank”), finances Tecon Rio Grande’s equipment. The amount is US$16.66 million, with
initial outlay of US$6.9 million in January 2010 and a second outlay of US$7.8 million in October 2010. The outstanding amount
is repayable over 10 years, including a grace period of 2 years. The amortization and interest payment are 6 monthly. The loan is
denominated in US Dollars with a variable rate Libor (6 monthly). The spread is 1.7% per year and there is a payment for Bank
Itaú BBA’s guarantee of 2% per year.
The Banco Itaú BBA S.A. credit line, Finimp, finances Tecon Rio Grande’s equipment. The amount is US$4.0 million and is repayable
up to 5 years, including a grace period of one year. The amortization and interest payment are 6 monthly. The loan is denominated
in US Dollars with a variable rate (Libor – 6 month) and carries fixed interest rates of 1.63% per year. The local commission for
Banco Itaú BBA S.A. is 1.75% per year.
Bank loans was reduced by US$12 million (R$20 million) due to the net assets transferred to the partner on setting up the joint venture.
GuaranteesThe loans from BNDES are secured by a pledge over the tug boats and supply vessels financed. Financing of three of the seven
platform supply vessels is guarantee by receivables from the client Petrobras.
The loans from BB are secured by a pledge over the supply vessels that are financed, by a “Standby Letter of Credit” and by
fiduciary assignment of long-term contracts with Petrobras.
The loans from the IFC are secured by the Group’s shares in Tecon Salvador and Tecon Rio Grande, the projects cash flows, and,
in the case of Tecon Rio Grande, equipment and building.
The loan with “The Export-Import Bank of China” is secured by a “Standby Letter of Credit” issued for Tecon Rio Grande, with a
financing bank as beneficiary.
As counter-guarantee for the operation, Tecon Rio Grande obtained a formal authorization of the IFC trustee to dispose the
equipment funded by “The Export-Import Bank of China” to the bank Itau BBA.
undrawn borrowing facilitiesAt December 31, 2010, the Group had available US$389.4 million of undrawn borrowing facilities. This value includes fifty percent
of the loan agreements on September 28, 2010, as described below. For every disbursement there is a set of conditions precedent
that should be fulfilled.
loan agreements signedOn September 28, 2010, the Group signed a US$ 670 million Financing Agreement. The Financing Agreement is between the joint
venture Wilson, Sons Ultratug Offshore and BNDES as agent for the Fundo da Marinha Mercante (FMM). The 18 year financing
includes a three year repayment grace period and is intended for the construction of 13 Offshore Support Vessels (OSV’s), to be
constructed in the Wilson, Sons’ Shipyards.
The 13 vessels are expected to be delivered between early 2011 and 2015 increasing the joint venture fleet to 24 vessels.
Construction has already commenced on three of the vessels.
fair valueManagement estimates the fair value of the Group’s borrowings as follows:
2010 US$ 2009 US$ 2010 R$ 2009 R$
Bank overdrafts 6,479 227 10,794 395
Bank loans
BNDES 224,981 235,652 374,864 410,317
IFC 15,096 20,160 25,152 35,103
Eximbank 14,818 - 24,690 -
Finimp 4,051 - 6,749 -
BB 49,131 - 81,862 -
Total bank loans 308,077 255,812 513,317 445,420
Total 314,556 256,039 524,111 445,815
Accelerated depreciation
US$
Exchange variance on loans
US$
Timing differences
US$
Non-monetary itemsUS$
TotalUS$
At January 1, 2009 (13,243) 1,906 10,618 (4,024) (4,743)
(Charge)/Credit to income (8,351) (15,156) 741 35,086 12,320
Exchange differences - 3 1,779 - 1,782
At December 31, 2009 (21,594) (13,247) 13,138 31,062 9,359
(Charge)/Credit to income (5,869) (1,484) 1,415 6,613 675
Deferred tax booked in disposed investment 5,058 2,885 216 (4,686) 3,473
Exchange differences - 35 308 - 343
At December 31, 2010 (22,405) (11,811) 15,077 32,989 13,850
Accelerated depreciation
R$
Exchange variance on loans
R$
Timing differences
R$
Non-monetary items
R$Total
R$
At January 1, 2009 (30,949) 4,454 24,815 (9,404) (11,084)
(Charge)/Credit to income (14,541) (26,390) 1,290 61,092 21,452
Exchange differences - 5 3,098 - 3,102
Translation adjustment to Real 7,891 (1,135) (6,327) 2,397 2,826
At December 31, 2009 (37,599) (23,066) 22,876 54,085 16,296
(Charge)/Credit to income (9,779) (2,473) 2,358 11,019 1,125
Deferred tax booked in disposed investment 8,427 4,806 359 (7,808) 5,784
Exchange differences - 58 513 - 571
Translation adjustment to Real 1,619 995 (983) (2,330) (699)
At December 31, 2010 (37,332) (19,680) 25,123 54,966 23,077
CovenantsThe subsidiaries Tecon Rio Grande and Tecon Salvador have specific restrictive clauses in their financing contracts with financial
institutions related, basically, to the maintenance of liquidity ratios. At December 31, 2010, the Group is in compliance with all
clauses of these contracts.
16. DEfERRED tAx
The following are the major deferred tax assets and liabilities recognized by the Group during the current and prior reporting periods:

97
Annual Report 2010 www.wilsonsons.com
Certain tax assets and liabilities have been offset on an entity by entity basis. In the consolidated financial statements, a deferred tax
asset of one entity in the Group cannot be offset against a deferred tax liability of another entity in the Group as there is no legally
enforceable right to offset tax assets and liabilities between Group companies. After offset, deferred tax balances are presented in the
balance sheet as follows:
2010 US$ 2009 US$ 2010 R$ 2009 R$
Deferred tax liabilities (15,073) (16,140) (25,115) (28,102)
Deferred tax assets 28,923 25,499 48,192 44,398
Total 13,850 9,359 23,077 16,296
At the balance sheet date, the Group has unused tax losses of US$30,487 (R$50,797) (2009: US$23,664 (R$41,203))
available for offset against future fiscal profits. No deferred tax asset has been recognized in the amount of US$10,366 (R$17,272)
(2009: US$ 8,046 (R$14,009)) due to the unpredictability of future streams of related taxable income.
Deferred tax assets and liabilities arise on Brazilian property, plant and equipment, inventories and prepaid expense held in
US Dollar functional currency businesses. Deferred tax is calculated on the difference between the historical US Dollar balances
recorded in the Group’s accounts and the Real balances used in the Group’s Brazilian tax calculations.
Deferred tax liabilities arise from exchange gains on the Group’s US Dollar and Real denominated loans linked to the US Dollar
that are taxable on settlement and not in the period in which the gains arise.
17. pRovISIonS foR ContInGEnCIES
US$ R$
At January 1, 2009 8,455 19,759
Addition provision in the year 2,192 3,818
Reversal of provision in the year (3,846) (6,697)
Exchange difference 3,030 5,275
Translation adjustment to Real - (5,037)
At December 31, 2009 9,831 17,118
Addition provision in the year 4,464 7,437
Reversal of provision in the year (2,575) (4,290)
Exchange difference 569 947
Translation adjustment to Real - (736)
At December 31, 2010 12,289 20,476
The breakdown of classes of provision is described below as follows:
2010 US$ 2009 US$ 2010 R$ 2009 R$
Civil cases 1,128 781 1,879 1,360
Tax cases 261 921 435 1,604
Labor claims 10,900 8,129 18,162 14,154
Total 12,289 9,831 20,476 17,118
In the normal course of business in Brazil, the Group continues to be exposed to numerous local legal claims. It is the Group’s
policy to vigorously contest such claims, many of which appear to have little substance in merit, and to manage such claims
through its legal advisors. There are no material claims outstanding at December 31, 2010 which have not been provided
for and which the Group’s legal advisers consider are more likely than not to result in a financial settlement against the Group.
In addition to the cases for which the Group booked the provision for contingencies there are other tax, civil and labor disputes
amounting to US$53,404 (R$88,981) (2009: US$60,355 (R$105,089)), whose probability of loss was estimated by the legal
advisors as possible.
The breakdown of possible claims is described below as follows:
2010 US$ 2009 US$ 2010 R$ 2009 R$
Civil cases 7,259 6,001 12,094 10,449
Tax cases 15,829 12,220 26,375 21,277
Labor claims 30,316 42,134 50,512 73,363
Total 53,404 60,355 88,981 105,089
The main probable and possible claims against the Group are described below:
› Civil and Environmental cases: Discussions on contractual matters related to a punctual disagreement in transport supply
contract and casuals demands based on service contracts, regarding some of its obligations.
› Labor claims: These lawsuits litigate about salary differences, overtime worked without payments, and other additional.
› Tax cases: The Group itself litigates against the respective governments in respect of Group considers inappropriate.
18. oBlIGAtIonS unDER fInAnCE lEASES
Minimum lease payments Present value of minimum lease payments
2010 US$ 2009 US$ 2010 US$ 2009 US$
Amounts payable under finance leases:
Within one year 5,921 5,263 4,847 3,902
In the second to fifth years, inclusive 7,098 9,950 6,305 8,653
13,019 15,213 11,152 12,555
Less future finance charges (1,867) (2,658)
Present value of lease obligations 11,152 12,555
Total current 4,847 3,902 4,847 3,902
Total non-current 6,305 8,653 6,305 8,653
Minimum lease payments Present value of minimum lease payments
2010 R$ 2009 R$ 2010 R$ 2009 R$
Amounts payable under finance leases:
Within one year 9,866 9,164 8,076 6,793
In the second to fifth years inclusive 11,826 17,324 10,505 15,067
21,692 26,488 18,581 21,860
Less future finance charges (3,111) (4,628)
Present value of lease obligations 18,581 21,860
Total current 8,076 6,793 8,076 6,793
Total non-current 10,505 15,067 10,505 15,067
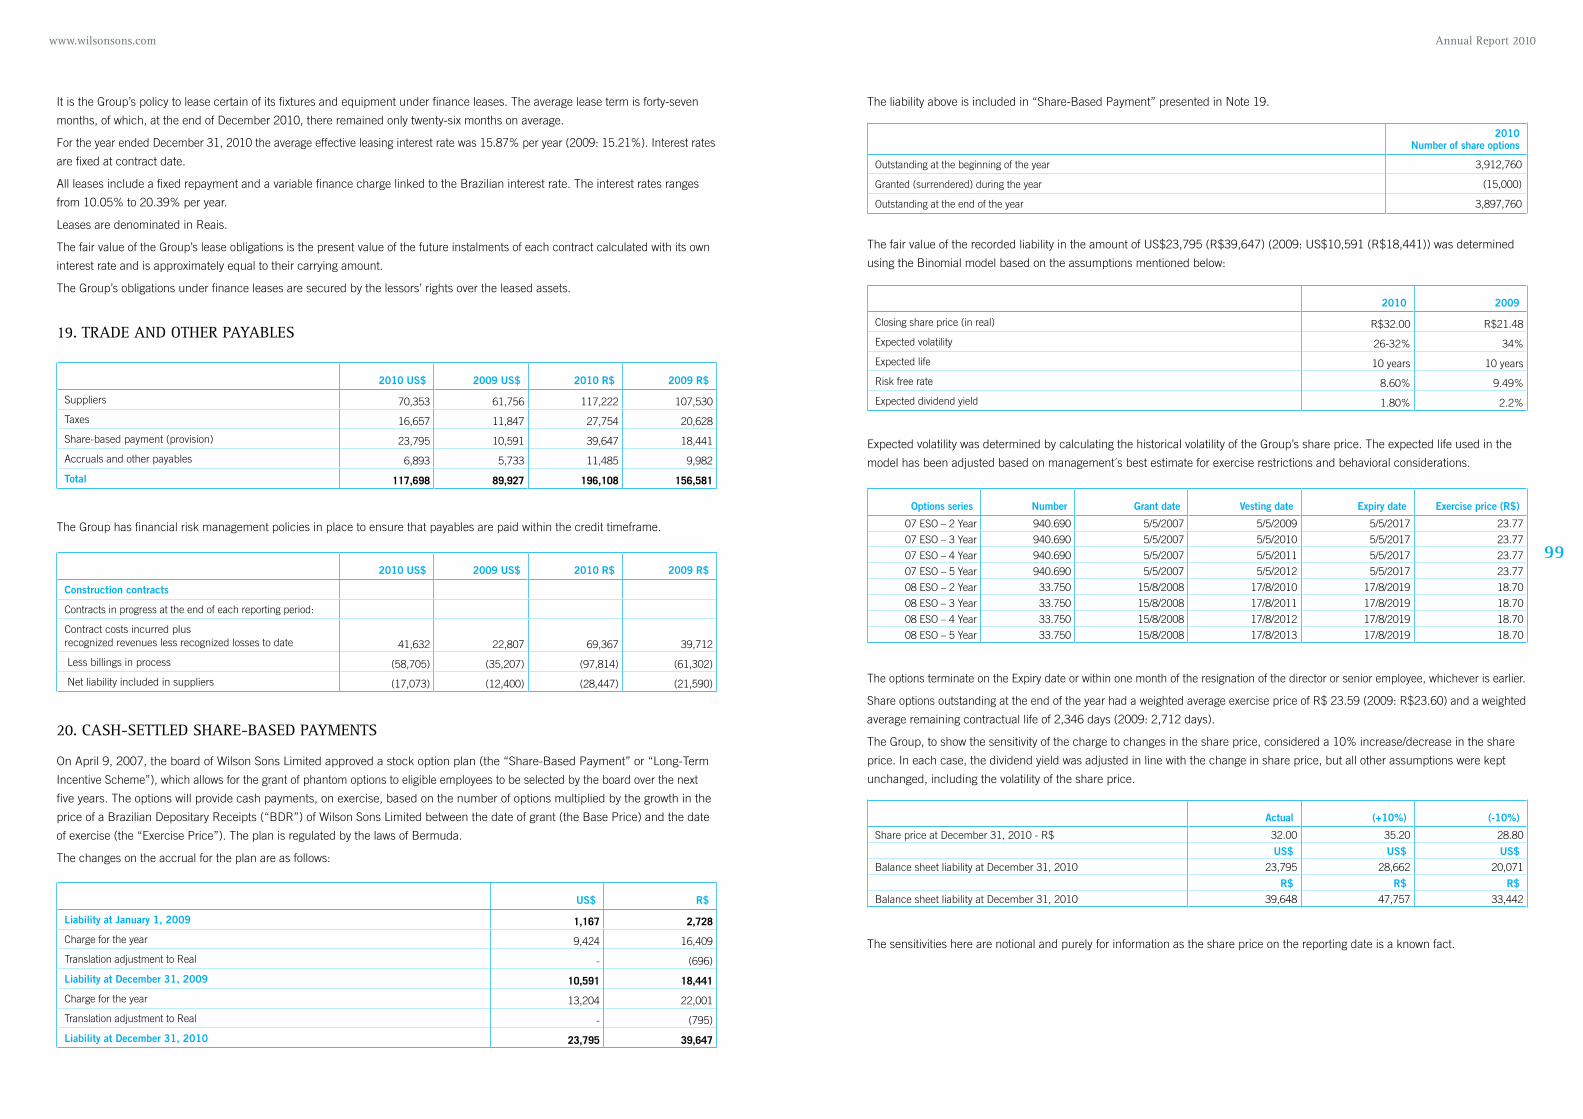
99
Annual Report 2010 www.wilsonsons.com
It is the Group’s policy to lease certain of its fixtures and equipment under finance leases. The average lease term is forty-seven
months, of which, at the end of December 2010, there remained only twenty-six months on average.
For the year ended December 31, 2010 the average effective leasing interest rate was 15.87% per year (2009: 15.21%). Interest rates
are fixed at contract date.
All leases include a fixed repayment and a variable finance charge linked to the Brazilian interest rate. The interest rates ranges
from 10.05% to 20.39% per year.
Leases are denominated in Reais.
The fair value of the Group’s lease obligations is the present value of the future instalments of each contract calculated with its own
interest rate and is approximately equal to their carrying amount.
The Group’s obligations under finance leases are secured by the lessors’ rights over the leased assets.
19. tRADE AnD othER pAYABlES
2010 US$ 2009 US$ 2010 R$ 2009 R$
Suppliers 70,353 61,756 117,222 107,530
Taxes 16,657 11,847 27,754 20,628
Share-based payment (provision) 23,795 10,591 39,647 18,441
Accruals and other payables 6,893 5,733 11,485 9,982
Total 117,698 89,927 196,108 156,581
2010 US$ 2009 US$ 2010 R$ 2009 R$
Construction contracts
Contracts in progress at the end of each reporting period:
Contract costs incurred plus recognized revenues less recognized losses to date 41,632 22,807 69,367 39,712
Less billings in process (58,705) (35,207) (97,814) (61,302)
Net liability included in suppliers (17,073) (12,400) (28,447) (21,590)
The Group has financial risk management policies in place to ensure that payables are paid within the credit timeframe.
US$ R$
Liability at January 1, 2009 1,167 2,728
Charge for the year 9,424 16,409
Translation adjustment to Real - (696)
Liability at December 31, 2009 10,591 18,441
Charge for the year 13,204 22,001
Translation adjustment to Real - (795)
Liability at December 31, 2010 23,795 39,647
20. CASh-SEttlED ShARE-BASED pAYmEntS
On April 9, 2007, the board of Wilson Sons Limited approved a stock option plan (the “Share-Based Payment” or “Long-Term
Incentive Scheme”), which allows for the grant of phantom options to eligible employees to be selected by the board over the next
five years. The options will provide cash payments, on exercise, based on the number of options multiplied by the growth in the
price of a Brazilian Depositary Receipts (“BDR”) of Wilson Sons Limited between the date of grant (the Base Price) and the date
of exercise (the “Exercise Price”). The plan is regulated by the laws of Bermuda.
The changes on the accrual for the plan are as follows:
2010Number of share options
Outstanding at the beginning of the year 3,912,760
Granted (surrendered) during the year (15,000)
Outstanding at the end of the year 3,897,760
The liability above is included in “Share-Based Payment” presented in Note 19.
2010 2009
Closing share price (in real) R$32.00 R$21.48
Expected volatility 26-32% 34%
Expected life 10 years 10 years
Risk free rate 8.60% 9.49%
Expected dividend yield 1.80% 2.2%
Options series Number Grant date Vesting date Expiry date Exercise price (R$)
07 ESO – 2 Year 940.690 5/5/2007 5/5/2009 5/5/2017 23.77
07 ESO – 3 Year 940.690 5/5/2007 5/5/2010 5/5/2017 23.77
07 ESO – 4 Year 940.690 5/5/2007 5/5/2011 5/5/2017 23.77
07 ESO – 5 Year 940.690 5/5/2007 5/5/2012 5/5/2017 23.77
08 ESO – 2 Year 33.750 15/8/2008 17/8/2010 17/8/2019 18.70
08 ESO – 3 Year 33.750 15/8/2008 17/8/2011 17/8/2019 18.70
08 ESO – 4 Year 33.750 15/8/2008 17/8/2012 17/8/2019 18.70
08 ESO – 5 Year 33.750 15/8/2008 17/8/2013 17/8/2019 18.70
The fair value of the recorded liability in the amount of US$23,795 (R$39,647) (2009: US$10,591 (R$18,441)) was determined
using the Binomial model based on the assumptions mentioned below:
Expected volatility was determined by calculating the historical volatility of the Group’s share price. The expected life used in the
model has been adjusted based on management´s best estimate for exercise restrictions and behavioral considerations.
Actual (+10%) (-10%)
Share price at December 31, 2010 - R$ 32.00 35.20 28.80
US$ US$ US$Balance sheet liability at December 31, 2010 23,795 28,662 20,071
R$ R$ R$Balance sheet liability at December 31, 2010 39,648 47,757 33,442
The options terminate on the Expiry date or within one month of the resignation of the director or senior employee, whichever is earlier.
Share options outstanding at the end of the year had a weighted average exercise price of R$ 23.59 (2009: R$23.60) and a weighted
average remaining contractual life of 2,346 days (2009: 2,712 days).
The Group, to show the sensitivity of the charge to changes in the share price, considered a 10% increase/decrease in the share
price. In each case, the dividend yield was adjusted in line with the change in share price, but all other assumptions were kept
unchanged, including the volatility of the share price.
The sensitivities here are notional and purely for information as the share price on the reporting date is a known fact.

101
Annual Report 2010 www.wilsonsons.com
2010 US$ 2009 US$ 2010 R$ 2009 R$
71,144,000 ordinary shares issued and fully paid 9,905 9,905 16,504 17,247
21. EQuItY
Share Capital
2010 US$ 2009 US$ 2010 R$ 2009 R$
Dividends 22,551 16,007 37,574 27,871
Total 22,551 16,007 37,574 27,871
2010 US$ 2009 US$ 2010 R$ 2009 R$
Profit for the year attributable to owners of the Company 69,996 88,531 116,627 154,149
Weighted average number of ordinary shares 71,144,000 71,144,000 71,144,000 71,144,000
Basic and diluted earnings per share (cents per share) 98.4 124.4 163.9 216.7
DividendsAccording to the Company’s by-laws, an amount of no less than 25% of the Adjusted Net Profit for the current year shall be declared
by the Board as a dividend to be paid to the Members before the next Annual General Meeting. The by-laws provided that the dividend
will be mandatory unless the Board considers that the payment of such dividends will not be in the interests of the Company. The final
dividend is subject to approval by shareholders at the Annual General Meeting.
Amounts recognized as distributions to owners of the Company:
In the Board Meeting held on May 11, 2010 the Board of Directors declared the payment of a dividend in the amount of
US$0.317 cents per share (R$0.528 cents per share) in the total amount of US$22,551 (R$37,574) to Shareholders of record
as at May 11, 2010 and the payment of such dividend on May 17, 2010.
Earnings per shareThe calculation of the basic and diluted earnings per share is based on the following data:
profit reserveAn amount equal to 5% of the Company’s net profit for the current year is to be credited to a retained earnings account to be called
“Profit Reserve” until such account equals 20% of the Company’s paid up share capital. The Company does not recognize any further
profit reserve, because it has already reached the limit of 20% of share capital.
translation reserveThe translation reserve arises from exchange differences on the translation of operations with a functional currency other than the US Dollar.
22. SuBSIDIARIES
The Group acquired the minority 25% share participation in Brasco Logística Offshore Ltda. As a result of this transaction, the Group
became the sole owner of 100% of Brasco’s total share capital.
The transaction was completed on June 16, 2010, with a consideration of US$9.0 million (R$15.0 million) measured by reference to
the fair value, for the acquisition of shares equivalent to 25% of the total Brasco share capital. This transaction resulted in additional
paid in capital of US$4.9 million (R$8.1 million) reported in the consolidated statement of changes in equity.
Place of incorporation and
operationProportion of
ownership interest
Method used to account
for investment
Holding company
Wilson Sons de Administração e Comércio Ltda. Brasil 100% Consolidação
Vis Limited Guernsey 100% Consolidação
Towage
Saveiros Camuyrano Serviços Marítimos S.A. Brasil 100% Consolidação
Sobrare-Servemar Ltda. Brasil 100% Consolidação
Wilson Sons Apoio Marítimo Ltda. Brasil 100% Consolidação
Wilson Sons Operações Marítimas Especiais Ltda. Brasil 100% Consolidação
Shipyard
Wilson, Sons S.A. Comércio, Indústria, e Agência de Navegação Ltda. Brasil 100% Consolidação
Wilson Sons Estaleiro Ltda. Brasil 100% Consolidação
Ship Agency
Wilson Sons Agência Marítima Ltda. Brasil 100% Consolidação
Wilson Sons Navegação Ltda. Brasil 100% Consolidação
Transamérica Visas Serviços de Despachos Ltda. Brasil 100% Consolidação
Logistics
EADI Santo André Terminal de Carga Ltda. Brasil 100% Consolidação
Wilson, Sons Logística Ltda. Brasil 100% Consolidação
Port terminal
Brasco Logística Offshore Ltda Brasil 100% Consolidação
Tecon Rio Grande S.A. Brasil 100% Consolidação
Tecon Salvador S.A. Brasil 100% Consolidação
Wilport Operadores Portuários Ltda. Brasil 100% Consolidação
Wilson, Sons Operadores Portuários Ltda. Brasil 100% Consolidação
Wilson, Sons Terminais de Cargas Ltda. Brasil 100% Consolidação
Created in 1999, Brasco is an integrated port and logistics service provider to the Oil & Gas industry in Brazil. The company has support
bases in the cities of Niterói, Rio de Janeiro, and Guaxindiba (Rio de Janeiro); São Luis (Maranhão); and Vitória (Espírito Santo).
Details of the Company’s subsidiaries at December 31, 2010 are as follows:
The Group also has 100% of ownership interest in a Brazilian Private Investment Fund called the Hydrus Fixed Income Private Credit
Investment Fund. This fund is managed by Itaú bank and its policies and objectives are determined by the Group’s treasury (Note 14).
In 2010, Wilson, Sons Offshore S.A. and Wilson, Sons Ultratug S.A. became Joint Ventures, ceasing to be subsidiaries.
23. JoInt vEntuRES
On 28 May 2010 the Group finalised the offshore joint venture “Wilson, Sons Ultratug Participacoes S.A” with Remolcadores
Ultratug Ltda, a subsidiary of Ultratug Ltda, a Chilean Group.
The Group contributed its 50% participation of the joint venture with the issued shares of Wilson, Sons Offshore S.A., the company
that owns and operates the Group’s offshore supply vessels. The Ultratug Group contributed its 50% participation of the joint
venture with the issued shares of Magallanes Navegacao Brasileira S.A., the owner of the Ultratug Group’s offshore operations in
Brazil and US$14.3 million in cash.

103
Annual Report 2010 www.wilsonsons.com
Fair value Book value
2010 US$ 2009 US$ 2010 US$ 2009 US$
Financial assets: Loans and receivables (includes: cash and cash equivalents, short term investments and trade and other receivables) 289,862 294,751 289,862 294,751
Financial liabilities: Other financial liabilities (includes: bank loans and overdrafts, obligations under finance leases and trade and other payables) 443,406 358,521 443,411 357,899
2010 R$ 2009 R$ 2010 R$ 2009 R$
Financial assets: Loans and receivables (includes: cash and cash equivalents, short term investments and trade and other receivables) 482,967 513,220 482,967 513,220
Financial liabilities: Other financial liabilities (includes: bank loans and overdrafts, obligations under finance leases and trade and other payables) 738,799 624,256 738,144 623,173
2010 US$ 2009 US$ 2010 R$ 2009 R$
Current assets 17,991 3,639 29,977 6,336
Non-current assets 127,213 2,297 211,963 4,000
Current liabilities (31,976) (4,744) (53,278) (8,260)
Non-current liabilities (109,242) (21) (182,020) (37)
Income 35,817 15,963 59,678 27,795
Expenses (30,860) (14,748) (51,419) (25,679)
2010 US$ 2009 US$ 2010 R$ 2009 R$
Within one year 2,211 1,453 3,684 2,530
In the second to fifth year inclusive 18,425 13,557 30,700 23,605
Total 20,636 15,010 34,384 26,135
A gain of US$20.4 million calculated based on SIC13 was realized on formation of the joint venture as set out below.
US$ R$
Wilsons Sons share of fair value of the assets contributed by Magallanes 16,165 26,935
Less Carrying value of Wilsons Sons Offshore S.A. (6,208) (10,344)
Consolidation elimination of intercompany profit 10,450 17,411
Wilsons Sons contribution at net book value 4,242 7,068
Total gain on joint venture formation* 20,407 34,002
* See note 27 for more details for net assets.
2010 US$ 2009 US$ 2010 R$ 2009 R$
Minimum lease payments under operating leases recognized in income for the year 14,528 12,440 24,207 21,661
Consolidation elimination of intercompany profit represents profits on the construction of PSVs in the Groups shipyards previously
eliminated on consolidation.
The Group has the following significant interests in joint ventures at December 31, 2010:
Place of incorporation and
operationProportion of
ownership interes t
Method used to account
for investment
Towage
Consórcio de Rebocadores Barra de Coqueiros Brazil 50%Proportional
Consolidation
Consórcio de Rebocadores Baia de São Marcos Brazil 50%Proportional
Consolidation
Non-vessel operating common carrier
Allink Transportes Internacionais Limitada Brazil 50%Proportional
Consolidation
Offshore
Wilson, Sons Ultratug Participações S.A.* Brazil 50%Proportional
Consolidation
* Wilson, Sons Ultratug Participações S.A. controls Wilson, Sons Offshore S.A. and Magallanes Navegação Brasileira S.A.. These latter two companies are indirect joint ventures of the Company.
The following amounts are included in the Group’s financial statements as a result of proportionate consolidation of joint ventures.
In 2010, Wilson, Sons Offshore S.A. and Wilson, Sons Ultratug S.A. became joint ventures and their proportional contributions are
equivalents to eight months results.
24. opERAtInG lEASE ARRAnGEmEntS
The Group as lessee
At December 31, 2010, the minimum amount due by the Group for future minimum lease payments under cancellable operating
leases was US$13,668 (R$22,774) (2009: US$8,390 (R$14,608)).
Lease commitments for land and buildings with a term of over 5 years are recognized as an expense on a straight-line basis
over the lease term. These operating lease arrangements are between Tecon Rio Grande and the Rio Grande port authority,
and between Tecon Salvador and the Salvador port authority. The Tecon Rio Grande concession expires in 2022 and the Tecon
Salvador concession in 2025.
The Tecon Rio Grande guaranteed payments consist of two elements; a fixed rental, and fee per 1,000 containers moved based
on forecast volumes made by the consortium. The amount shown in the accounts is based on the minimum volume forecast.
Volumes are forecast to rise in future years. If container volumes moved through the terminal exceed forecast volumes in any given
year additional payments will be required.
Tecon Salvador guaranteed payments consists of three elements; a fixed rental, a fee per container moved based on minimum
forecast volumes and a fee per ton of non-containerized cargo moved based on minimum forecast volumes.
At the balance sheet date, the Group had outstanding commitments for future minimum lease payments under non-cancellable
operating leases, which fall due as follows:
Non-cancellable lease payments represent rental payments by the Group for the bonded warehouse used by EADI Santo Andre.
In November, 2008 the Group’s renewed the concession to operate the EADI Santo Andre (a bonded warehouse) for a further ten
years. With this, the Group’s management renewed the rental agreement contract of the bonded warehouse used by EADI Santo
Andre for the same period. The unexpired lease period at December 31, 2010 is 9 years and 4 months. These rental payments
are updated by a Brazilian general inflation index (IGPM - General Market Price Index).
25. fInAnCIAl InStRumEntS AnD RISK ASSESSmEnt
a) Capital risk managementThe Group manages its capital to ensure that entities in the Group will be able to continue as a going concern while maximizing the
return to stakeholders through the optimization of the debt and equity balance. The capital structure of the Group consists of debt,
which includes the borrowing disclosed in Note 15, cash and cash equivalents. And short term investments disclosed in note 14
and equity attributable to owners of the parent comprising issued capital, reserves and retained earnings as disclosed in Note 21.
b) Categories of financial instruments:
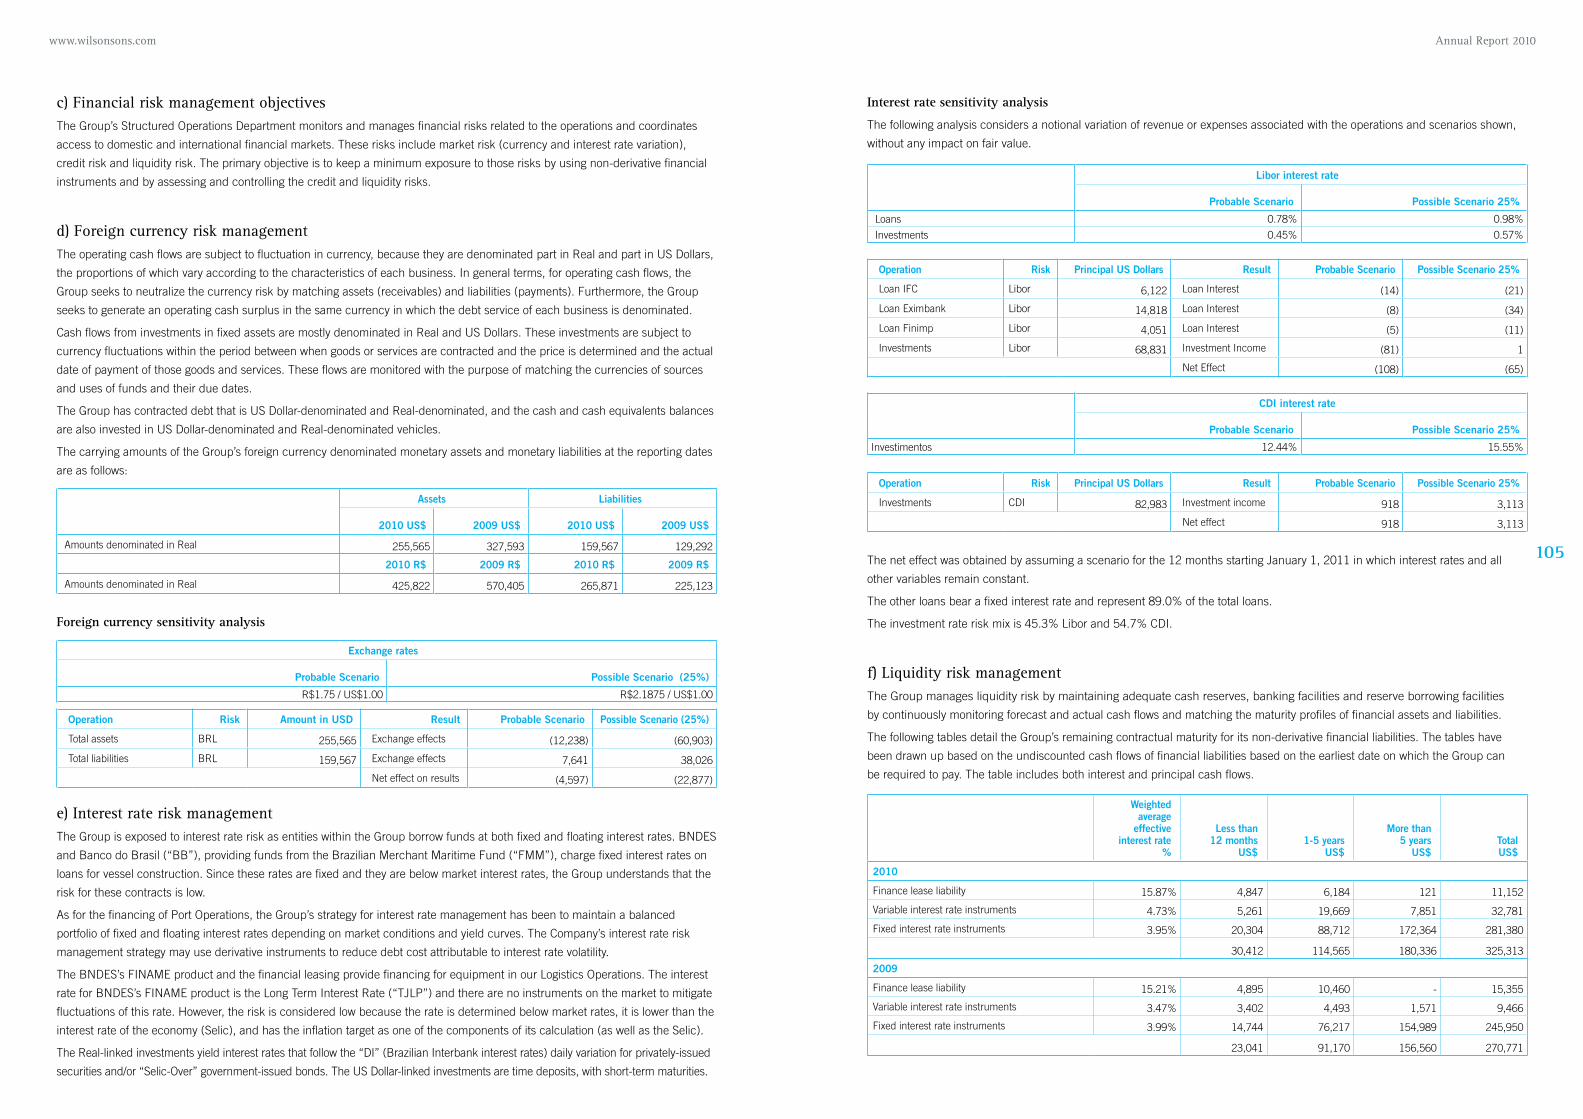
105
Annual Report 2010 www.wilsonsons.com
Exchange rates
Probable Scenario Possible Scenario (25%)
R$1.75 / US$1.00 R$2.1875 / US$1.00
Libor interest rate
Probable Scenario Possible Scenario 25%
Loans 0.78% 0.98%
Investments 0.45% 0.57%
CDI interest rate
Probable Scenario Possible Scenario 25%
Investimentos 12.44% 15.55%
Operation Risk Amount in USD Result Probable Scenario Possible Scenario (25%)
Total assets BRL 255,565 Exchange effects (12,238) (60,903)
Total liabilities BRL 159,567 Exchange effects 7,641 38,026
Net effect on results (4,597) (22,877)
Operation Risk Principal US Dollars Result Probable Scenario Possible Scenario 25%
Loan IFC Libor 6,122 Loan Interest (14) (21)
Loan Eximbank Libor 14,818 Loan Interest (8) (34)
Loan Finimp Libor 4,051 Loan Interest (5) (11)
Investments Libor 68,831 Investment Income (81) 1
Net Effect (108) (65)
Operation Risk Principal US Dollars Result Probable Scenario Possible Scenario 25%
Investments CDI 82,983 Investment income 918 3,113
Net effect 918 3,113
c) financial risk management objectivesThe Group’s Structured Operations Department monitors and manages financial risks related to the operations and coordinates
access to domestic and international financial markets. These risks include market risk (currency and interest rate variation),
credit risk and liquidity risk. The primary objective is to keep a minimum exposure to those risks by using non-derivative financial
instruments and by assessing and controlling the credit and liquidity risks.
d) foreign currency risk managementThe operating cash flows are subject to fluctuation in currency, because they are denominated part in Real and part in US Dollars,
the proportions of which vary according to the characteristics of each business. In general terms, for operating cash flows, the
Group seeks to neutralize the currency risk by matching assets (receivables) and liabilities (payments). Furthermore, the Group
seeks to generate an operating cash surplus in the same currency in which the debt service of each business is denominated.
Cash flows from investments in fixed assets are mostly denominated in Real and US Dollars. These investments are subject to
currency fluctuations within the period between when goods or services are contracted and the price is determined and the actual
date of payment of those goods and services. These flows are monitored with the purpose of matching the currencies of sources
and uses of funds and their due dates.
The Group has contracted debt that is US Dollar-denominated and Real-denominated, and the cash and cash equivalents balances
are also invested in US Dollar-denominated and Real-denominated vehicles.
The carrying amounts of the Group’s foreign currency denominated monetary assets and monetary liabilities at the reporting dates
are as follows:
Assets Liabilities
2010 US$ 2009 US$ 2010 US$ 2009 US$
Amounts denominated in Real 255,565 327,593 159,567 129,292
2010 R$ 2009 R$ 2010 R$ 2009 R$
Amounts denominated in Real 425,822 570,405 265,871 225,123
Foreign currency sensitivity analysis
e) Interest rate risk management The Group is exposed to interest rate risk as entities within the Group borrow funds at both fixed and floating interest rates. BNDES
and Banco do Brasil (“BB”), providing funds from the Brazilian Merchant Maritime Fund (“FMM”), charge fixed interest rates on
loans for vessel construction. Since these rates are fixed and they are below market interest rates, the Group understands that the
risk for these contracts is low.
As for the financing of Port Operations, the Group’s strategy for interest rate management has been to maintain a balanced
portfolio of fixed and floating interest rates depending on market conditions and yield curves. The Company’s interest rate risk
management strategy may use derivative instruments to reduce debt cost attributable to interest rate volatility.
The BNDES’s FINAME product and the financial leasing provide financing for equipment in our Logistics Operations. The interest
rate for BNDES’s FINAME product is the Long Term Interest Rate (“TJLP”) and there are no instruments on the market to mitigate
fluctuations of this rate. However, the risk is considered low because the rate is determined below market rates, it is lower than the
interest rate of the economy (Selic), and has the inflation target as one of the components of its calculation (as well as the Selic).
The Real-linked investments yield interest rates that follow the “DI” (Brazilian Interbank interest rates) daily variation for privately-issued
securities and/or “Selic-Over” government-issued bonds. The US Dollar-linked investments are time deposits, with short-term maturities.
Interest rate sensitivity analysis
The following analysis considers a notional variation of revenue or expenses associated with the operations and scenarios shown,
without any impact on fair value.
The net effect was obtained by assuming a scenario for the 12 months starting January 1, 2011 in which interest rates and all
other variables remain constant.
The other loans bear a fixed interest rate and represent 89.0% of the total loans.
The investment rate risk mix is 45.3% Libor and 54.7% CDI.
f) liquidity risk managementThe Group manages liquidity risk by maintaining adequate cash reserves, banking facilities and reserve borrowing facilities
by continuously monitoring forecast and actual cash flows and matching the maturity profiles of financial assets and liabilities.
The following tables detail the Group’s remaining contractual maturity for its non-derivative financial liabilities. The tables have
been drawn up based on the undiscounted cash flows of financial liabilities based on the earliest date on which the Group can
be required to pay. The table includes both interest and principal cash flows.
Weighted average
effective interest rate
%
Less than 12 months
US$1-5 years
US$
More than 5 years
US$TotalUS$
2010
Finance lease liability 15.87% 4,847 6,184 121 11,152
Variable interest rate instruments 4.73% 5,261 19,669 7,851 32,781
Fixed interest rate instruments 3.95% 20,304 88,712 172,364 281,380
30,412 114,565 180,336 325,313
2009
Finance lease liability 15.21% 4,895 10,460 - 15,355
Variable interest rate instruments 3.47% 3,402 4,493 1,571 9,466
Fixed interest rate instruments 3.99% 14,744 76,217 154,989 245,950
23,041 91,170 156,560 270,771
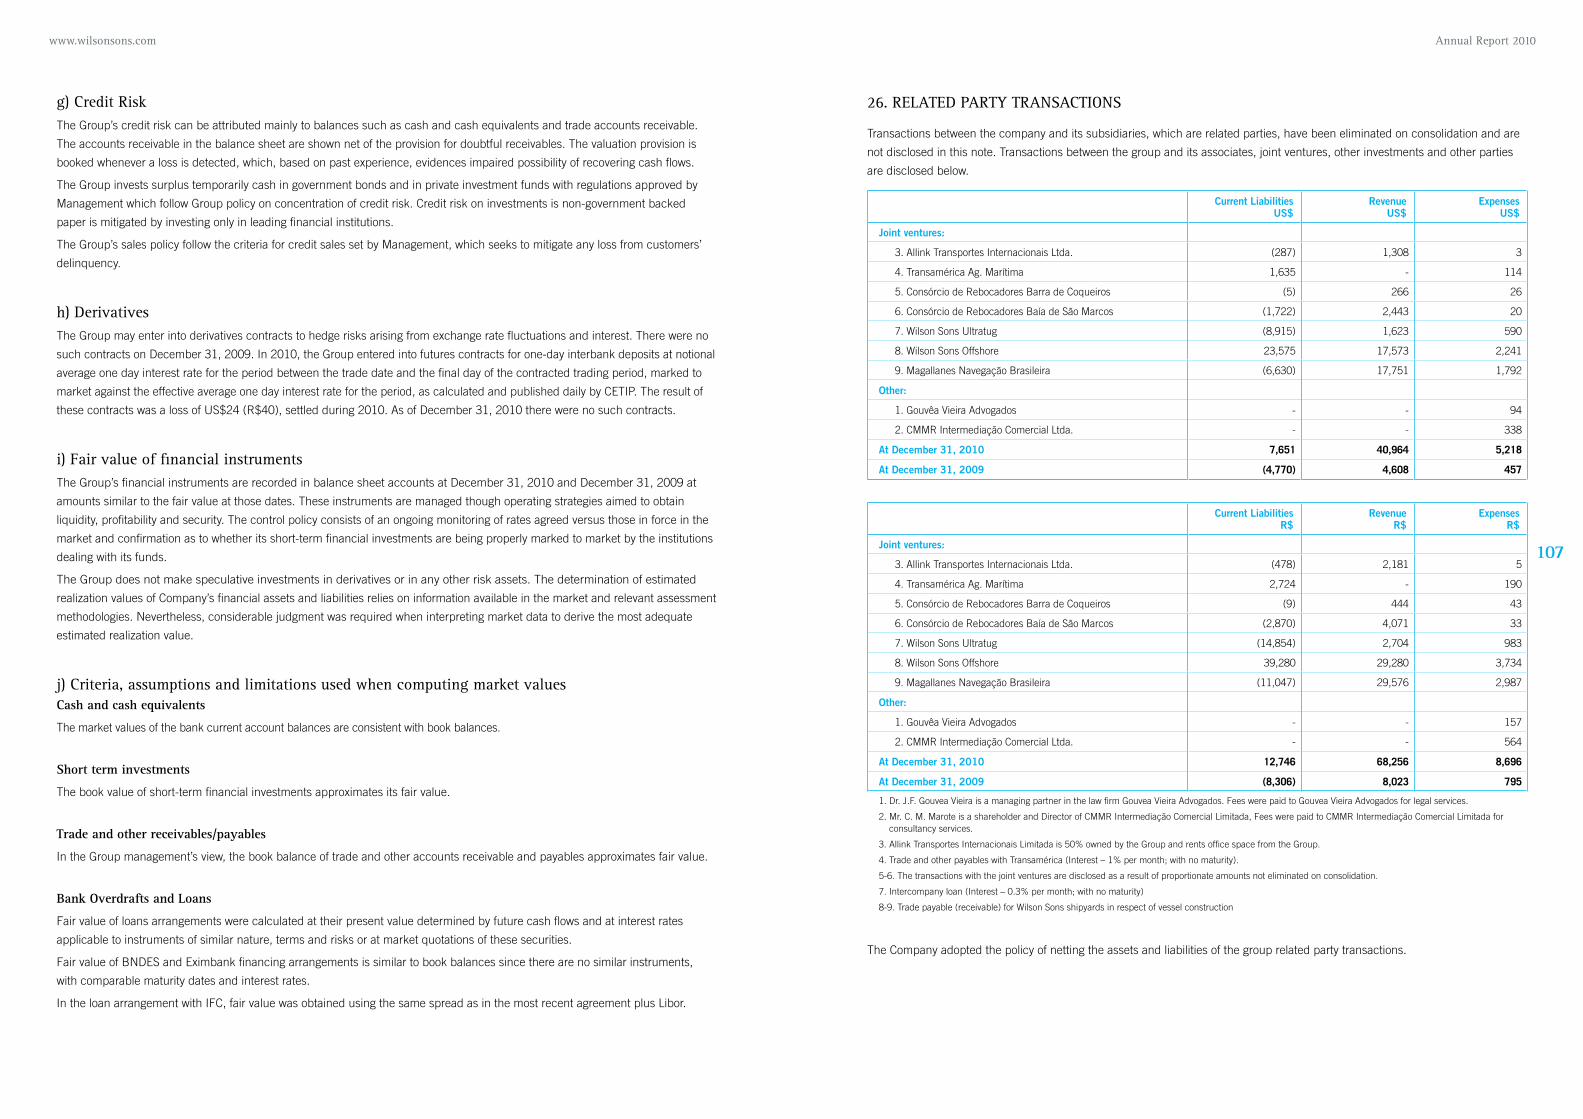
107
Annual Report 2010 www.wilsonsons.com
g) Credit RiskThe Group’s credit risk can be attributed mainly to balances such as cash and cash equivalents and trade accounts receivable.
The accounts receivable in the balance sheet are shown net of the provision for doubtful receivables. The valuation provision is
booked whenever a loss is detected, which, based on past experience, evidences impaired possibility of recovering cash flows.
The Group invests surplus temporarily cash in government bonds and in private investment funds with regulations approved by
Management which follow Group policy on concentration of credit risk. Credit risk on investments is non-government backed
paper is mitigated by investing only in leading financial institutions.
The Group’s sales policy follow the criteria for credit sales set by Management, which seeks to mitigate any loss from customers’
delinquency.
h) DerivativesThe Group may enter into derivatives contracts to hedge risks arising from exchange rate fluctuations and interest. There were no
such contracts on December 31, 2009. In 2010, the Group entered into futures contracts for one-day interbank deposits at notional
average one day interest rate for the period between the trade date and the final day of the contracted trading period, marked to
market against the effective average one day interest rate for the period, as calculated and published daily by CETIP. The result of
these contracts was a loss of US$24 (R$40), settled during 2010. As of December 31, 2010 there were no such contracts.
i) fair value of financial instrumentsThe Group’s financial instruments are recorded in balance sheet accounts at December 31, 2010 and December 31, 2009 at
amounts similar to the fair value at those dates. These instruments are managed though operating strategies aimed to obtain
liquidity, profitability and security. The control policy consists of an ongoing monitoring of rates agreed versus those in force in the
market and confirmation as to whether its short-term financial investments are being properly marked to market by the institutions
dealing with its funds.
The Group does not make speculative investments in derivatives or in any other risk assets. The determination of estimated
realization values of Company’s financial assets and liabilities relies on information available in the market and relevant assessment
methodologies. Nevertheless, considerable judgment was required when interpreting market data to derive the most adequate
estimated realization value.
j) Criteria, assumptions and limitations used when computing market valuesCash and cash equivalents
The market values of the bank current account balances are consistent with book balances.
Short term investments
The book value of short-term financial investments approximates its fair value.
Trade and other receivables/payables
In the Group management’s view, the book balance of trade and other accounts receivable and payables approximates fair value.
Bank Overdrafts and Loans
Fair value of loans arrangements were calculated at their present value determined by future cash flows and at interest rates
applicable to instruments of similar nature, terms and risks or at market quotations of these securities.
Fair value of BNDES and Eximbank financing arrangements is similar to book balances since there are no similar instruments,
with comparable maturity dates and interest rates.
In the loan arrangement with IFC, fair value was obtained using the same spread as in the most recent agreement plus Libor.
26. RElAtED pARtY tRAnSACtIonS
Transactions between the company and its subsidiaries, which are related parties, have been eliminated on consolidation and are
not disclosed in this note. Transactions between the group and its associates, joint ventures, other investments and other parties
are disclosed below.
Current LiabilitiesUS$
RevenueUS$
ExpensesUS$
Joint ventures:
3. Allink Transportes Internacionais Ltda. (287) 1,308 3
4. Transamérica Ag. Marítima 1,635 - 114
5. Consórcio de Rebocadores Barra de Coqueiros (5) 266 26
6. Consórcio de Rebocadores Baía de São Marcos (1,722) 2,443 20
7. Wilson Sons Ultratug (8,915) 1,623 590
8. Wilson Sons Offshore 23,575 17,573 2,241
9. Magallanes Navegação Brasileira (6,630) 17,751 1,792
Other:
1. Gouvêa Vieira Advogados - - 94
2. CMMR Intermediação Comercial Ltda. - - 338
At December 31, 2010 7,651 40,964 5,218
At December 31, 2009 (4,770) 4,608 457
Current LiabilitiesR$
RevenueR$
ExpensesR$
Joint ventures:
3. Allink Transportes Internacionais Ltda. (478) 2,181 5
4. Transamérica Ag. Marítima 2,724 - 190
5. Consórcio de Rebocadores Barra de Coqueiros (9) 444 43
6. Consórcio de Rebocadores Baía de São Marcos (2,870) 4,071 33
7. Wilson Sons Ultratug (14,854) 2,704 983
8. Wilson Sons Offshore 39,280 29,280 3,734
9. Magallanes Navegação Brasileira (11,047) 29,576 2,987
Other:
1. Gouvêa Vieira Advogados - - 157
2. CMMR Intermediação Comercial Ltda. - - 564
At December 31, 2010 12,746 68,256 8,696
At December 31, 2009 (8,306) 8,023 795
1. Dr. J.F. Gouvea Vieira is a managing partner in the law firm Gouvea Vieira Advogados. Fees were paid to Gouvea Vieira Advogados for legal services.
2. Mr. C. M. Marote is a shareholder and Director of CMMR Intermediação Comercial Limitada, Fees were paid to CMMR Intermediação Comercial Limitada for consultancy services.
3. Allink Transportes Internacionais Limitada is 50% owned by the Group and rents office space from the Group.
4. Trade and other payables with Transamérica (Interest – 1% per month; with no maturity).
5-6. The transactions with the joint ventures are disclosed as a result of proportionate amounts not eliminated on consolidation.
7. Intercompany loan (Interest – 0.3% per month; with no maturity)
8-9. Trade payable (receivable) for Wilson Sons shipyards in respect of vessel construction
The Company adopted the policy of netting the assets and liabilities of the group related party transactions.
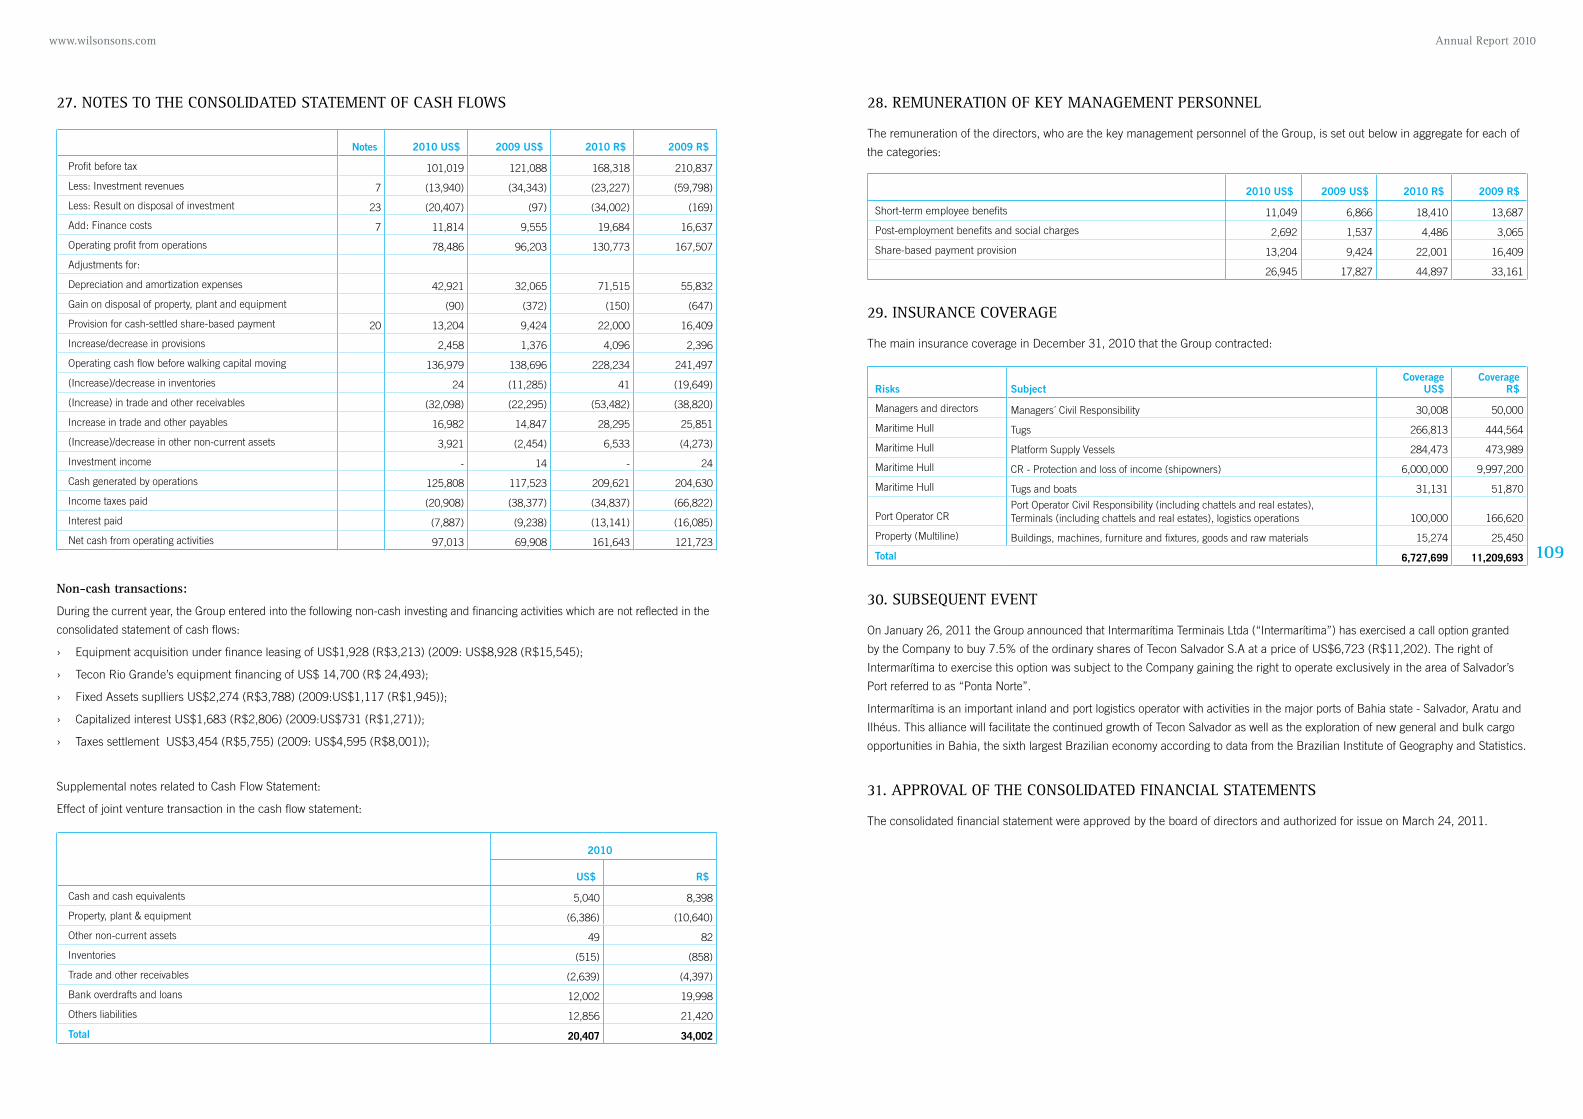
109
Annual Report 2010 www.wilsonsons.com
27. notES to thE ConSolIDAtED StAtEmEnt of CASh flowS
Notes 2010 US$ 2009 US$ 2010 R$ 2009 R$
Profit before tax 101,019 121,088 168,318 210,837
Less: Investment revenues 7 (13,940) (34,343) (23,227) (59,798)
Less: Result on disposal of investment 23 (20,407) (97) (34,002) (169)
Add: Finance costs 7 11,814 9,555 19,684 16,637
Operating profit from operations 78,486 96,203 130,773 167,507
Adjustments for:
Depreciation and amortization expenses 42,921 32,065 71,515 55,832
Gain on disposal of property, plant and equipment (90) (372) (150) (647)
Provision for cash-settled share-based payment 20 13,204 9,424 22,000 16,409
Increase/decrease in provisions 2,458 1,376 4,096 2,396
Operating cash flow before walking capital moving 136,979 138,696 228,234 241,497
(Increase)/decrease in inventories 24 (11,285) 41 (19,649)
(Increase) in trade and other receivables (32,098) (22,295) (53,482) (38,820)
Increase in trade and other payables 16,982 14,847 28,295 25,851
(Increase)/decrease in other non-current assets 3,921 (2,454) 6,533 (4,273)
Investment income - 14 - 24
Cash generated by operations 125,808 117,523 209,621 204,630
Income taxes paid (20,908) (38,377) (34,837) (66,822)
Interest paid (7,887) (9,238) (13,141) (16,085)
Net cash from operating activities 97,013 69,908 161,643 121,723
2010 US$ 2009 US$ 2010 R$ 2009 R$
Short-term employee benefits 11,049 6,866 18,410 13,687
Post-employment benefits and social charges 2,692 1,537 4,486 3,065
Share-based payment provision 13,204 9,424 22,001 16,409
26,945 17,827 44,897 33,161
Risks SubjectCoverage
US$Coverage
R$
Managers and directors Managers´ Civil Responsibility 30,008 50,000
Maritime Hull Tugs 266,813 444,564
Maritime Hull Platform Supply Vessels 284,473 473,989
Maritime Hull CR - Protection and loss of income (shipowners) 6,000,000 9,997,200
Maritime Hull Tugs and boats 31,131 51,870
Port Operator CRPort Operator Civil Responsibility (including chattels and real estates), Terminals (including chattels and real estates), logistics operations 100,000 166,620
Property (Multiline) Buildings, machines, furniture and fixtures, goods and raw materials 15,274 25,450
Total 6,727,699 11,209,693
2010
US$ R$
Cash and cash equivalents 5,040 8,398
Property, plant & equipment (6,386) (10,640)
Other non-current assets 49 82
Inventories (515) (858)
Trade and other receivables (2,639) (4,397)
Bank overdrafts and loans 12,002 19,998
Others liabilities 12,856 21,420
Total 20,407 34,002
Non-cash transactions:
During the current year, the Group entered into the following non-cash investing and financing activities which are not reflected in the
consolidated statement of cash flows:
› Equipment acquisition under finance leasing of US$1,928 (R$3,213) (2009: US$8,928 (R$15,545);
› Tecon Rio Grande’s equipment financing of US$ 14,700 (R$ 24,493);
› Fixed Assets suplliers US$2,274 (R$3,788) (2009:US$1,117 (R$1,945));
› Capitalized interest US$1,683 (R$2,806) (2009:US$731 (R$1,271));
› Taxes settlement US$3,454 (R$5,755) (2009: US$4,595 (R$8,001));
Supplemental notes related to Cash Flow Statement:
Effect of joint venture transaction in the cash flow statement:
28. REmunERAtIon of KEY mAnAGEmEnt pERSonnEl
The remuneration of the directors, who are the key management personnel of the Group, is set out below in aggregate for each of
the categories:
29. InSuRAnCE CovERAGE
The main insurance coverage in December 31, 2010 that the Group contracted:
30. SuBSEQuEnt EvEnt
On January 26, 2011 the Group announced that Intermarítima Terminais Ltda (“Intermarítima”) has exercised a call option granted
by the Company to buy 7.5% of the ordinary shares of Tecon Salvador S.A at a price of US$6,723 (R$11,202). The right of
Intermarítima to exercise this option was subject to the Company gaining the right to operate exclusively in the area of Salvador’s
Port referred to as “Ponta Norte”.
Intermarítima is an important inland and port logistics operator with activities in the major ports of Bahia state - Salvador, Aratu and
Ilhéus. This alliance will facilitate the continued growth of Tecon Salvador as well as the exploration of new general and bulk cargo
opportunities in Bahia, the sixth largest Brazilian economy according to data from the Brazilian Institute of Geography and Statistics.
31. AppRovAl of thE ConSolIDAtED fInAnCIAl StAtEmEntS
The consolidated financial statement were approved by the board of directors and authorized for issue on March 24, 2011.
111
Annual Report 2010 www.wilsonsons.com
Glossary
BDR ou BDRs – Brazilian Depositary Receipts, each one representing an ordinary share.
Bill of Ladings (BLs) – shipowner’s document, filled by the shipper and signed by the captain or ship agent, in order to confirm
the receipt of a certain cargo aboard (or for boarding) and to specify, among other details, the freight payed or to be payed at the
destination. It is at the the same time a receipt of boarding, title of possession, and evidence of transport the contract, in which
the terms are integrated.
EBITDA – Earnings before interest tax depreciation and amortisation.
Rubber tyred gantry (RTG) crane – crane used to move containers in the yard allowing the formation of higher and larger stacks.
In-house Logistics – services for movement and storage of material inside the clients’ productive units. Wilson, Sons Logistics
offers the following services in this segment: storage either in a dedicated distribution centre (or in the client’s facilities, network
analysis and tax analysis for the stock positioning, ancillary services such as tagging, kit assembling, special packaging, picking &
packing, planning and despatch control, handling and screening of returns, and seasonal operations of storage and despatch.
Novo mercado – special designation BM&FBovespa (Brazilian stock market) that differentiates companies which are committed to
adopting elevated practices of corporate governance.
PSV – Platform Supply Vessel; a vessel that provides marine support services to platforms for the exploration and production of oil
and gas.
TEU – Twenty-foot Equivalent Unit: the international unit of measurement for containers, equivalent to twenty feet.
Tecon – Container Terminal – port terminal with quay equipped to service container ships. It is specialised in container
movement and storage.
Corporate Information
Headquartes
Wilson Sons Limited
Clarendon House, 2 Church Street
Hamilton, HM11, Bermuda
Investor Relations
Rua Jardim Botânico, 518, 4º andar
Rio de Janeiro, RJ, Brasil
22461-000
Tel.: (0xx21) 2126-4107
Fax: (0xx21) 2126-4190
Email: [email protected]
www.wilsonsons.com/ir
Team
C FO of operations in Brazil and Investor Relations
Felipe Gutterres
I nvestor Relations
Michael Connell
Guilherme Nahuz
Eduardo Valença
Independent Auditors
Deloitte Touche Tohmatsu Independent Auditors
Stock Exchange
São Paulo Stock Exchange (Bovespa)
Share Code: WSON11 (BDRs)
Luxemburg Stock Exchange (Bourse de Luxembourg)
Share Code: BMG968101094

www.wilsonsons.com
Credits
Internal Coordination
Investor Relations
Felipe Gutterres
Michael Connell
Guilherme Nahuz
Eduardo Valença
Comunication and Sustainability
Angela Giacobbe
Luiz Gustavo Ramos
Maria Luiza Henriques
Planning, Content Coordination and Text
Global RI Consultoria
Translation
Michael Connell
Graphic Project
Mobileradar
Photography
Acervo Wilson, Sons
Carlos Nogueira
Felipe Dumont
João Hissao
Lunae Parracho
Roberto Rosa
Roberto Bellonia
Cover
Bernardo Escansette – Wilson, Sons employee
Genailton Moreno Batista – Wilson, Sons Logística employee
Jonathan Menezes – Wilson, Sons employee

Wilson Sons LimitedClarendon House, 2 Church StreetHamilton, HM11, Bermuda
Investor RelationsRua Jardim Botânico, 518 - 4º andarRio de Janeiro, RJ, Brasil - 22461-000www.wilsonsons.com/ir
Related Documents