Willingness to Pay Market Research EPN Main Report November 2012 Prepared by: Prepared for: Accent Chiswick Gate 598-608 Chiswick High Road London W4 5RT UK Power Networks UK Power Networks 237 Newington House London SE1 6NP Contact: Miranda Mayes Contact: Julian Rudd & Keith Hutton E-mail: [email protected] Tel: 0131 220 2550 Fax: 0131 315 3207 File name: 2440rep02_mainEPNwtp_final.doc

Welcome message from author
This document is posted to help you gain knowledge. Please leave a comment to let me know what you think about it! Share it to your friends and learn new things together.
Transcript

Willingness to Pay
Market Research
EPN
Main Report
November 2012
Prepared by: Prepared for:
Accent Chiswick Gate 598-608 Chiswick High Road London W4 5RT
UK Power Networks UK Power Networks 237 Newington House London SE1 6NP
Contact: Miranda Mayes Contact: Julian Rudd & Keith Hutton E-mail: [email protected] Tel: 0131 220 2550 Fax: 0131 315 3207
File name: 2440rep02_mainEPNwtp_final.doc
[Click here type Alt E for ETU, ALT L for London]

CONTENTS Executive Summary .................................................................................................................... i
1. INTRODUCTION ............................................................................................................. 1
1.1 Background........................................................................................................................ 1
1.2 Objectives .......................................................................................................................... 2
2. METHODOLOGY ............................................................................................................ 3
2.1 Introduction ....................................................................................................................... 3
2.2 Target Audience ................................................................................................................ 3
2.3 Survey Method .................................................................................................................. 3
2.4 Survey Numbers & Structure ............................................................................................ 3
2.5 Questionnaire Length and Content .................................................................................... 4
2.6 Pilot Survey ....................................................................................................................... 5
2.7 Mainstage Fieldwork Dates ............................................................................................... 5
2.8 Quality System Details - ISO 20252 ................................................................................. 5
3. FINDINGS ........................................................................................................................ 6
3.1 Introduction ....................................................................................................................... 6
3.2 Electricity Bills .................................................................................................................. 7
4. STATED PREFERENCE ANALYSIS ........................................................................... 10
4.1 Background Theory ......................................................................................................... 10
4.2 Methodology.................................................................................................................... 10
4.3 Stated Preference Values ................................................................................................. 12
4.4 Combined & Ranked Customer Priorities for EPN ......................................................... 21
4.5 Ranked Customers Priorities for All DNOs .................................................................... 24
4.6 EPN Customers WTP ...................................................................................................... 29
4.7 Summary of Key Findings by Socio-Economic Group (SEG) and Business Size.......... 30
5. CONCLUSIONS AND RECOMMENDATIONS .......................................................... 35
5.1 Domestic Customers ........................................................................................................ 35
5.2 Socio-Economic Group ................................................................................................... 35
5.3 Business Customers ......................................................................................................... 36
5.4 Business Size ................................................................................................................... 37
Appendix A: Profile Data
Appendix B: Domestic Questionnaire
Appendix C: Domestic Showcards
Appendix D: Business Questionnaire
Appendix E: Business Showcards

Accent 2440rep02_mainEPNwtp_ final MM/KOB 13.12.12 Page i of i
Executive Summary
UK Power Networks is in the early stages of developing a business plan, for the period
from April 2015 to March 2023. This will ultimately be submitted to Ofgem in July
2013 as part of its next regulatory price control (known as RIIO-ED1). To support this
plan UK Power Networks required research to:
test customer preferences in respect of the options that might be included in the final
business plan, and the value that they placed on these options
determine the overall acceptability and affordability of the package as a whole.
For EPN this research was addressed through 100 business and 397 domestic
interviews. Sophisticated stated preference and contingent valuation techniques were
use to prioritise service aspects and determine customer willingness to pay for them.
The results revealed that EPN domestic customer willingness to pay for service changes
ranges from 0.76% to 2.89%, with overall willingness to pay for the full package being
20.3% of the distribution element of the bill by 2023. The three highest priorities for
changes in services for domestic customers were:
investment in infrastructure to enable UKPN to detect loss of supply from individual
or small groups of premises
investment in infrastructure to allow cheaper and quicker connection of new low
carbon generators of electricity
timing of any new connections work: work undertaken in normal business hours
(08.00-17.00), in the evenings and at weekends.
Willingness to pay for these services by 2023 ranged from a 1.81% increase in
distribution bills for timing of new connections work, increasing substantially to 2.84%
for infrastructure to allow cheaper and quicker connection of new low carbon
generators, and to 2.89% for investment in infrastructure to detect loss of supply.
EPN business customer willingness to pay for different levels of services ranged from
0.65% to 2.94% with overall willingness to pay for the full package being 21.8% of the
distribution element of the bill by 2023. Their priorities for changes in services were:
investment in network technologies to allow cheaper and quicker connection of new
low carbon generators of electricity
investment in infrastructure required to enable UKPN to detect loss of supply from
individual or small groups of premises
investment to enable uptake of micro-generation e.g. solar panels etc.
Willingness to pay for these services by 2023 ranged from a 2.65% increase in
distribution bills for investment to enable uptake of micro-generation, to 2.84% for
investment in infrastructure to detect loss of supply, to 2.94% for investment in
technologies to allow cheaper and quicker connection of low carbon generators.

Accent 2440rep02_mainEPNwtp_ final MM/KOB 13/1212 Page 1 of 37
1. INTRODUCTION
1.1 Background
The electricity industry was privatised over 20 years ago. In that time, regulation has
primarily focused on encouraging greater efficiency and thus value for money for its
customers. However, political and economic priorities have shifted with the
acknowledgement of the impact of climate change and the desire for greater security of
supply.
The most notable consequence of this change is the recognition that billions of pounds
of capital investment is required to transform the energy networks and make them fit for
purpose in a low-carbon economy.
As a response, Ofgem has revised the regulatory framework which applies to networks
companies. RIIO has been introduced, meaning that revenue will be generated from
Incentives, Innovation and the delivery of Outputs.
Although some elements of the framework are familiar, there are also important
changes to the way in which Networks companies are expected to behave. Most
notable, is the recognition that all of the required investment will be financed by end-
customers and therefore it is only fair that they are given an opportunity to influence
investment decisions and that the networks are delivery the product and service levels
that the customers require.
As a consequence, UK Power Networks needs to involve customers and other
stakeholders in shaping their business plans, at all stages of the process – from high
level prioritisation through to the ultimate spending decisions.
Research is therefore required to ensure that UK Power Networks‟ business plan is a
reflection of customer priorities and the value that they place upon the elements that
make up the plan.
Accent has been commissioned by UK Power Networks to undertake this
comprehensive programme of research designed to inform their future investment
strategy. The research will derive willingness to pay values, along with determining
customer priorities for investment. It will also test customer preferences in respect of
the options that might be included in the business plan, and the value that is placed on
each of these options.

Accent 2440rep02_mainEPNwtp_ final MM/KOB 13/1212 Page 2 of 37
1.2 Objectives
UK Power Networks is in the early stages of developing a business plan, for the period
from April 2015 to March 2023. This will ultimately be submitted to Ofgem in July
2013 as part of its next regulatory price control (known as RIIO-ED1).
UK Power Networks requires research to:
test customer preferences in respect of the options that might be included in the final
business plan, and the value that they place on these options
determine the overall acceptability and affordability of the package as a whole.
This research will need to reflect the potentially different views of domestic consumers
and businesses (ie industrial/commercial) customers.

Accent 2440rep02_mainEPNwtp_ final MM/KOB 13/1212 Page 3 of 37
2. METHODOLOGY
2.1 Introduction
The research has been undertaken across all three UKPN ie EPN, SPN and LPN.
There were four main elements to the research:
• Stage 1 – Setup and design of qualitative research:
– 2 pilot groups and 3 tele-depths
• Stage 2 – Qualitative fieldwork:
– 12 extended (2-hour) focus groups: 4 in each of UKPN‟s licence areas:
– 18 45-minute tele-depths with business customers: 6 in each of UKPN‟s
licence areas:
• Stage 3 – Design of quantitative research:
– 160 domestic pilot interviews and 160 business pilot interviews:
• Stage 4 – Quantitative fieldwork :
– 1200 domestic Phone post Phone interviews: 400 per licence area
– 300 business Phone post Phone interviews: 100 per licence area.
This report relates to the main quantitative stage of the surveys for the EPN licence
area.
2.2 Target Audience
The research focused on those consumers who were “responsible for paying their
household‟s electricity bills” (domestic) or were “responsible for paying their
organisation‟s electricity bills or for liaising with their electricity distributor [for
example, in the event of a power cut, to arrange a new connection etc]” (businesses).
2.3 Survey Method
The interviews were undertaken from Accent‟s telephone units using a phone-
post/email/fax-phone approach, whereby target respondents are contacted, asked some
questions to determine whether they are in scope for the survey, invited to take part and
– where the agree to do so – are sent show material to refer to during the interview. This
show material includes context for the attributes to be discussed as well as hard copies
of the choice experiments to ensure they fully understand the choices that we are asking
them to make. It is sent to them as an email attachment, a fax or in the post, as they
prefer.
2.4 Survey Numbers & Structure
For the mainstage of the survey a total of 301 business and 1200 domestic interviews
were achieved against targets of 300 and 1200 respectively. The number of interviews
achieved for EPN specifically was 100 business and 397 domestic. Both of these cell
sizes can be considered to provide robust data for the markets they represent.

Accent 2440rep02_mainEPNwtp_ final MM/KOB 13/1212 Page 4 of 37
Minimum quotas were set by age band and SEG to get a representative spread of
respondents within the sample. Table 2 shows the breakdown of achieved interviews by
the different quota groups for EPN.
Table 1: Domestic Interviews Achieved By Segment –EPN
Age Band EPN
18-44 136
45-64 171
65+ 90
SEG
ABC1 226
C2DE 165
Not stated 6
Total achieved 397
Table 2: Business interviews achieved – EPN
Size EPN
Small 60
Medium 31
Large 9
Total target 100
Further profiling data can be found in Appendix A.
2.5 Questionnaire Length and Content
The questionnaire took an average of 38 minutes for domestic respondents to complete
and 22 for business respondents. It included a mix of background, stated preference,
contingent valuation and revealed behaviour questions.
A stated preference approach was used to provide a robust assessment of the relative
importance consumers place on different elements during the decision making process.
Both the stated preference and contingent valuation questions were used to determine
customers willingness to pay for improvements or their willingness to accept a
deterioration in service levels. This is explained in greater detail in Section 4.
The questionnaire was structured as follows:
Background, contextual questions1
Stated preference (SP) exercises: 3 lower level & 1 packaged exercise
Contingent Valuation (CV) & follow up questions
Key demographics.
Respondents were sent (by email, fax or post) show material to refer to during the
interview. This comprised explanatory information about the services being tested and
copies of the SP choice experiments for their reference. The questionnaires and
showcards used are shown in Appendix B, C, D and E.
1 The findings from the background questions are available in a separate report.
Accent 2440rep02_mainEPNwtp_ final MM/KOB 13/1212 Page 5 of 37
2.6 Pilot Survey
A pilot of 135 business and 151 domestic interviews was undertaken between 9 August
and 21 August 2012. The pilot was conducted in order to test:
the recruitment process
the clarity and flow of the questionnaire
the appropriateness of the language used
the accuracy of all routings
ease of use of the show material
the stated preference design and understanding of the stated preference exercises
the interview duration
the survey hit rate.
The results of the pilot were reported separately and reviewed with the UKPN team. No
substantial changes were made to the questionnaire or stated preference exercises
following the pilot.
2.7 Mainstage Fieldwork Dates
The mainstage fieldwork was undertaken between the 6th of September 2012 and 23
October 2012.
2.8 Quality System Details - ISO 20252
All research and analysis was undertaken in line with the requirements of International
market & social research standard ISO 20252:2006.

Accent 2440rep02_mainEPNwtp_ final MM/KOB 13/1212 Page 6 of 37
3. FINDINGS
3.1 Introduction
Before discussing the stated preference data, this section of the report gives details of
some key background data findings. Charts indicating annual bill sizes for business and
domestic respondents are shown, followed by customers‟ perceptions of the amount
currently paid to UK Power Networks.
The charts show the results for EPN‟s domestic and business customers and also
compares them to the total business and total domestic data. The question text is shown
before the findings for each question. Where the question wording differed for business
respondents, the alternative wordings are shown in the text, for example:
“Do you/does your organisation …?”

Accent 2440rep02_mainEPNwtp_ final MM/KOB 13/1212 Page 7 of 37
3.2 Electricity Bills
All business respondents were asked:
“How much is your site’s annual electricity bill?”
Figure 1: Site‟s Annual Electricity Bill
36
27
38
31
27
42
0
10
20
30
40
50
Up to £2,500 £2,501 to £10,000 £10,001+
% R
espo
ndents
Total Business
EPN Business
Base: all respondents – business: 301, EPN (100)
Three in ten (31%) EPN business customers surveyed had an annual electricity bill of
£2,500 or less, with two fifths (42%) having bills in excess of £10,001.
Domestic customers were asked a similar question:
“How much is your annual electricity bill?”

Accent 2440rep02_mainEPNwtp_ final MM/KOB 13/1212 Page 8 of 37
Figure 2: Annual Electricity Bill
4138
21
52
30
18
0
10
20
30
40
50
60
Up to £450 £451 to £800 £801 +
% R
espo
ndents
Total Domestic
EPN Domestic
Base: all respondents – domestic: 1,200, EPN (397)
Half (52%) of EPN‟s domestic customers had an annual electricity bill of up to £450,
with bills for one fifth (18%) of respondents being in excess of £801 per annum
In order to understand respondents‟ perception of the proportion of their electricity bill
allocated to their distributor, they were all asked:
“Previously you told me that you annual electricity bill is xx. Roughly
18% of this, ie (18% OF xx) goes to your electricity distributor; the rest
is distributed as shown in Showcard 2, ie the company that you pay your
bills to. Given what we have told you about the role of the distributor,
how do you feel about the amount that goes towards your distributor? Is
it …
Too little
About right
Slightly too much
Far too much”
Accent 2440rep02_mainEPNwtp_ final MM/KOB 13/1212 Page 9 of 37
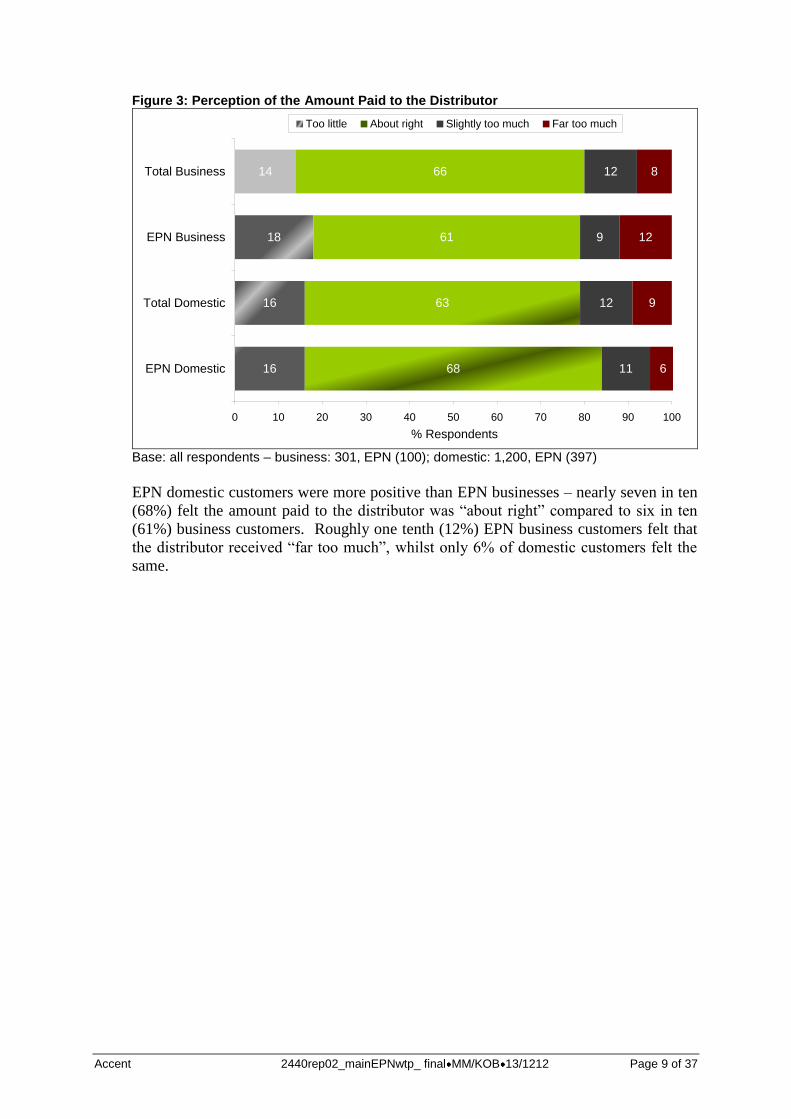
Figure 3: Perception of the Amount Paid to the Distributor
16
16
18
14
68
63
61
66
11
12
9
12
6
9
12
8
0 10 20 30 40 50 60 70 80 90 100
EPN Domestic
Total Domestic
EPN Business
Total Business
% Respondents
Too little About right Slightly too much Far too much
Base: all respondents – business: 301, EPN (100); domestic: 1,200, EPN (397)
EPN domestic customers were more positive than EPN businesses – nearly seven in ten
(68%) felt the amount paid to the distributor was “about right” compared to six in ten
(61%) business customers. Roughly one tenth (12%) EPN business customers felt that
the distributor received “far too much”, whilst only 6% of domestic customers felt the
same.

Accent 2440rep02_mainEPNwtp_ final MM/KOB 13/1212 Page 10 of 37
4. STATED PREFERENCE ANALYSIS
4.1 Background Theory
In principle there are two preference elicitation techniques, namely Revealed Preference
and Stated Preference. The revealed preference (RP) technique is where customers
reveal what they have actually chosen among the available products/services in the
market, whilst stated preference (SP) refers to the observation of preferences stated
against real and/or hypothetical products/services. SP enables one to test hypothetical
attributes, or services levels which are not yet available, so it is particularly valuable in
circumstances such as these where UKPN wants to test customer priorities for potential
service improvements and their willingness to pay for them.
There are, of course, potential issues/weaknesses with SP (as reported in literature). It is
possible that „what people state‟ in a hypothetical scenario may not actually be the case
in reality, which could inflate willingness to pay values. However, this can be mitigated
through a carefully designed and executed SP exercise.
Ranking, rating and discrete choice experiments (DCE) are the three variants of SP. The
most commonly used SP technique is the DCE as it is the simplest of the choice
techniques and thus has the lowest cognitive complexity – ie the lowest degree of task
complexity and difficulty arising from the experiment. The DCE experiments provide a
framework for estimating the relative marginal disutility of variations in attributes, and
their potential correlations. In DCE, respondents have to choose one alternative out of
two or more alternatives. Examples of how they have been presented in this study,
along with other methodological details, are discussed in Section 4.2.
4.2 Methodology
All survey respondents were asked to undertake a series of trade off (Stated Preference)
exercises which sought to assess the relative importance and associated willingness to
pay for a range of potential service improvements.
In this study respondents were shown a series of four exercises where they were asked
to make choices between different service levels relating to electricity distribution.
Fourteen different attributes (or service types) were tested across the three initial lower
level exercises. Their associated levels are shown in the table below:
Table 3: Attributes and Levels in the Stated Preference Design
EXERCISE 1 TIMESCALE FOR PROVISION OF QUOTATIONS FOR SIMPLE, LOW VOLTAGE NEW CONNECTIONS WORK:
Within 15 working days
Within 10 working days
Within 7 working days
By date agreed with customers
TIMING OF ANY NEW CONNECTIONS WORK:
As now, ie work undertaken in normal business hours (08.00-17.00)
Work undertaken in normal business hours (08.00-17.00) and in the evenings
Work undertaken in normal business hours (08.00-17.00), in the evenings and at weekends
Work is undertaken within a banded time ie morning, afternoon or evening in normal

Accent 2440rep02_mainEPNwtp_ final MM/KOB 13/1212 Page 11 of 37
business hours, evenings or at weekends
CONTACT FOR ANY NEW CONNECTIONS WORK: :
As now, telephone or e-mail to general call centre
Phone or email contact via dedicated new connections call centre
Phone or email contact via a named co-ordinator
All contact through an on-line web portal
TIME TO COMPLETE SIMPLE, LOW VOLTAGE NEW CONNECTIONS WORK:
Standard service, with UKPN defining what they will do and what activities remain the responsibility of a customer's builder or electrician
A menu of services available from UKPN allowing the customer to choose who completes which elements of the work
All elements of the work completed by UK Power Networks
EXERCISE 2 INVESTMENT IN INFRASTRUCTURE TO ENABLE UKPN TO DETECT LOSS OF SUPPLY:
No investment
Investment in infrastructure required to enable UKPN to detect loss of supply from individual or small groups of premises
INVESTMENT TO ENABLE GREATER UPTAKE OF ELECTRIC VEHICLES:
No investment
Investment in infrastructure required to support take up of electric vehicles
INVESTMENT IN INFRASTRUCTURE TO ENABLE GREATER UPTAKE OF LOW CARBON ELECTRIC HEATING TECHNOLOGIES:
No investment
Investment in infrastructure required to support take up of low carbon electric heating technologies
INVESTMENT TO ENABLE LARGESCALE RENEWABLE GENERATION (E.G ONSHORE WIND FARMS, BIOMASS PLANTS ETC):
No specific infrastructure investment; each new connection charged at cost
Investment in network technologies to allow cheaper and quicker connection of new low carbon generators of electricity
INVESTMENT TO ENABLE UPTAKE OF MICRO-GENERATION E.G, SOLAR PANELS ETC:
No specific infrastructure investment; each new connection charged at cost
Investment in network technologies to allow cheaper and quicker connection of new low carbon generators of electricity
EXERCISE 3 FREQUENCY OF POWER CUTS OVER 3 MINS - AVERAGE NUMBER:
1 every 13 months
1 every 18 months
1 every 24 months
RURAL CUSTOMERS: FOR POWER CUTS LONGER THAN 3 MINUTES, TIME TO RESTORE 80% OF AFFECTED CUSTOMERS
Within 180 minutes
Within 120 minutes
Within 60 minutes
URBAN CUSTOMERS: FOR POWER CUTS LONGER THAN 3 MINUTES, TIME TO RESTORE 80% OF AFFECTED CUSTOMERS:
Within 180 minutes
Within 60 minutes
Within 20 minutes
Within 10 minutes
INFORMATION DURING A POWER CUT:
Information available on contacting call centre
Information available on contacting call centre plus provision of automatic text messages to registered customers with details of power cut and updates
Information available on contacting call centre plus provision of automatic update calls to

Accent 2440rep02_mainEPNwtp_ final MM/KOB 13/1212 Page 12 of 37
customer from call centre and follow-up call when power cut over
Information available on contacting call centre plus provision of additional information services such as real-time information on internet, use of social media, customer service staff ‘knocking on doors’ etc
CONTINGENCY SERVICES:
Customer responsibility for any back-up services
Provision of generator hire e.g. for an event
Provision of back-up services to customers e.g. regular testing of customer-owned generators and systems
An example of how these were presented as a choice set is shown below:
A final, fourth exercise brought together all of the different aspects covered in the
previous exercises along with cost. In this final exercise respondents were asked to trade
off the “best” or “worst” levels of each of the attributes in order to scale (or factor) the
values calculated from the individual exercises and determine overall willingness to pay
for them. Contingent valuation questions were also used to double check respondents‟
maximum willingness to pay and these findings were used to scale the final SP data.
4.3 Stated Preference Values
The following tables show the factored coefficient scores – or values – given by all EPN
respondents to each attribute level tested.
It also shows the robust t-stat for each level. A robust „t test‟ value of 1.96 or greater
either means that respondents were significantly supportive of the proposition (ie where
a positive coefficient or value was achieved) or significantly opposed to it (ie where a
negative coefficient or value was achieved). For ease of comprehension, those results
that are insignificant are highlighted in yellow throughout this section.
It should be noted that the “base” or “lowest” level of each attribute has a coefficient of
zero against which all other levels are measured. Note that the coefficients indicate the
relative importance of each level compared to another. For example, a service level with

Accent 2440rep02_mainEPNwtp_ final MM/KOB 13/1212 Page 13 of 37
a coefficient of 0.4000 can be said to be twice a highly valued as a service level with a
coefficient of 0.2000.
The results shown in the tables are very positive. The large majority of the levels were
significant for both business and domestic customers (ie had a t-stat of 1.96 or above),
show the correct signs (ie positive where a service level is improving relative to the base
and negative where it is declining relative to the base) and moving in the expected
direction (ie a higher value is typically attributed to a „better‟ service level).
However, it will also be seen that a number of levels were not significant, indicating
that they were not valued by respondents. Game 2 and, to a lesser extent Game 3, have
more significant results than in Game 1.
Domestic Game 1
The following results were achieved for domestic customers (as shown in Table 4):
“Timescale for provision of quotations for simple, low voltage new connections
work”: moving from the base of 15 working days to 10 working days was not
valued by respondents, showing an unexpected negative sign; neither was 7 working
days which, whilst showing the correct sign, was not significant; it is hard to
understand why moving to 10 days would be valued negatively, but may simply
reflect a rejection of a relatively small timescale difference compared to getting the
quote on a date agreed, as offering quotations to a date agreed with the customer
was valued and significant
“Timing of any new connections work”: Adding evening to the baseline for this
attribute is not perceived as a significant improvement, while appointments during
weekends and within a banded time are both considered important and significant.
Interestingly being given a banded time was less highly valued than having work
done at weekends.
All except two levels for the attributes “Contact for any new connections work” and
“Time to complete simple, low voltage new connections work” were not significant.
The exceptions were “All contact through an on-line web portal” which was less
preferred than having contact through a call centre, and having a much quicker
timescale to complete simple, low voltage new connections work, 75 days quicker
than the baseline level of 90 days being valued.
Finally, having all elements of the works required for a new connection completed
by UKPN was considered valuable and significant. A menu of services was not.

Accent 2440rep02_mainEPNwtp_ final MM/KOB 13/1212 Page 14 of 37
Table 4: Game 1 Domestic – EPN
Attributes Levels Factored
coefficient Robust t stat
Timescale for provision of quotations for simple, low voltage new connections work:
Within 15 working days 0.0000 0
Within 10 working days -0.0151 -2.81
Within 7 working days 0.0063 1.17
By date agreed with customer 0.0169 5.29
Timing of any new connections work:
As now, ie work undertaken in normal business hours (08.00-17.00)
0.0000 0
Work undertaken in normal business hours (08.00-17.00) and in the evenings
0.0055 0.69
Work undertaken in normal business hours (08.00-17.00), in the evenings and at weekends
0.0211 2.74
Work is undertaken within a banded time ie morning, afternoon or evening in normal business hours, evenings or at weekends
0.0177 5.72
Contact for any new connections work:
As now, telephone or e-mail to general call centre
0.0000 0
Phone or email contact via dedicated new connections call centre
0.0019 0.31
Phone or email contact via a named co-ordinator
0.0110 1.81
All contact through an on-line web portal -0.0119 -3.54
Time to complete simple, low voltage new connections work As now, ie within 90 days
0.0000 0
30 days quicker than now, ie within 60 days
0.0093 1.25
60 days quicker than now, ie within 30 days
0.0107 1.43
75 days quicker than now, ie within 15 days
0.0139 4.28
Type of new connections service offered:
Standard service, with UKPN defining what they will do and what activities remain the responsibility of a customer's builder or electrician
0.0000 0
A menu of services available from UKPN allowing the customer to choose who completes which elements of the work
0.0092 1.43
All elements of the work completed by UK Power Networks
0.0138 4.91
Business Game 1
Fairly similar results were achieved for business customers for the majority of the
attributes except the second and third attribute:
“Timescale for provision of quotations for simple, low voltage new connections
work”: moving from the base of 15 working days to 10 working days was
significant but again negative; again, it is hard to understand why this should be
viewed negatively but may simply reflect a rejection of a relatively small timescale
difference compared to getting the quote on a date agreed, as offering quotations to
a date agreed with the customer was valued in a positive way and was significant.

Accent 2440rep02_mainEPNwtp_ final MM/KOB 13/1212 Page 15 of 37
“Timing of any new connections work”: Offering appointments within a banded
time was the only attribute considered important and significant by business
customer.
As for domestic, all except two levels for the attributes “Contact for any new
connections work” and “Time to complete simple, low voltage new connections
work” were not significant. However for the first of these two attributes the
exception was this time “Phone or email contact via dedicated new connections call
centre” which was not considered as an improvement from the base level by
business customers. For the second improving the time to complete to 15 days was
valued.
Finally, as with domestic customers, having a menu of services available from
UKPN allowing the customer to choose who completes which elements of the work
was not considered valuable, whilst having all elements of work completed by
UKPN was.

Accent 2440rep02_mainEPNwtp_ final MM/KOB 13/1212 Page 16 of 37
Table 5: Game 1 Business – EPN
Attributes Levels Factored
coefficient Robust t stat
Timescale for provision of quotations for simple, low voltage new connections work:
Within 15 working days 0.0000 0
Within 10 working days -0.0167 -2.35
Within 7 working days 0.0064 0.96
By date agreed with customer 0.0099 2.14 Timing of any new connections work:
As now, ie work undertaken in normal business hours (08.00-17.00)
0.0000 0
Work undertaken in normal business hours (08.00-17.00) and in the evenings
0.0164 1.29
Work undertaken in normal business hours (08.00-17.00), in the evenings and at weekends
0.0231 1.89
Work is undertaken within a banded time ie morning, afternoon or evening in normal business hours, evenings or at weekends
0.0165 3.9
Contact for any new connections work:
As now, telephone or e-mail to general call centre
0.0000 0
Phone or email contact via dedicated new connections call centre
-0.0158 -2.03
Phone or email contact via a named co-ordinator
0.0015 0.2
All contact through an on-line web portal
0.0009 0.18
Time to complete simple, low voltage new connections work As now, ie within 90 days
0.0000 0
30 days quicker than now, ie within 60 days
0.0087 0.83
60 days quicker than now, ie within 30 days
0.0118 1.13
75 days quicker than now, ie within 15 days
0.0168 4.2
Type of new connections service offered:
Standard service, with UKPN defining what they will do and what activities remain the responsibility of a customer's builder or electrician
0.0000 0
A menu of services available from UKPN allowing the customer to choose who completes which elements of the work
0.0111 1.35
All elements of the work completed by UK Power Networks
0.0139 3.42
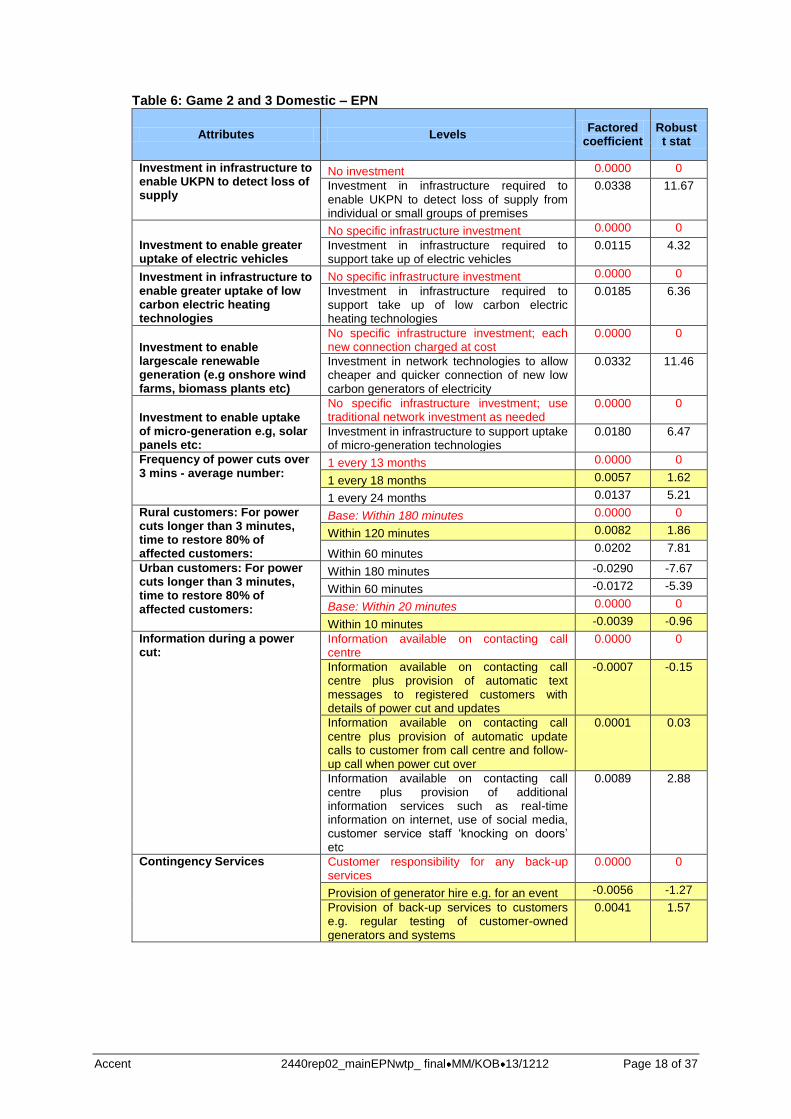
Domestic Game 2 and 3
The following results were achieved for domestic customers in Game 2 and 3:
All the investment attributes were significant and highly valued, particularly:
investing in infrastructure to enable UKPN to detect loss of supply from
individual or small groups of premises (seen as the most valued)
investing in infrastructure to allow cheaper and quicker connection of new low
carbon generators of electricity

Accent 2440rep02_mainEPNwtp_ final MM/KOB 13/1212 Page 17 of 37
“frequency of power cuts over 3 mins - average number”: moving from having a
power cut every 13 months to having one every 18 was not perceived as valuable
and was not significant, while moving to 1 every 24 months was significant and
valued
decreasing the time to restore power to 80% of rural customers affected by a cut in
excess of 3 minutes from within 180 minutes to 60 minutes was perceived positively
worsening the time to restore power to 80% of urban customers affected by a cut in
excess of 3 minutes from within 20 minutes to 60 minutes or 180 minutes was
perceived negatively, as expected, while an improvement to 10 minutes – whilst
showing the correct sign –was not significant
“information during a power cut”: the only significant level was having information
available on contacting call centre plus provision of additional information services
such as real-time information on internet, use of social media, customer service staff
„knocking on doors‟
neither of the contingency service levels tested – ie moving from customer
responsibility for any back-up services to “provision of generator hire e.g. for an
event” and to “provision of back-up services to customers e.g. regular testing of
customer-owned generators and systems” – were valued or significant.
Accent 2440rep02_mainEPNwtp_ final MM/KOB 13/1212 Page 18 of 37
Table 6: Game 2 and 3 Domestic – EPN
Attributes Levels Factored
coefficient Robust t stat
Investment in infrastructure to enable UKPN to detect loss of supply
No investment 0.0000 0
Investment in infrastructure required to enable UKPN to detect loss of supply from individual or small groups of premises
0.0338 11.67
Investment to enable greater uptake of electric vehicles
No specific infrastructure investment 0.0000 0
Investment in infrastructure required to support take up of electric vehicles
0.0115 4.32
Investment in infrastructure to enable greater uptake of low carbon electric heating technologies
No specific infrastructure investment 0.0000 0
Investment in infrastructure required to support take up of low carbon electric heating technologies
0.0185 6.36
Investment to enable largescale renewable generation (e.g onshore wind farms, biomass plants etc)
No specific infrastructure investment; each new connection charged at cost
0.0000 0
Investment in network technologies to allow cheaper and quicker connection of new low carbon generators of electricity
0.0332 11.46
Investment to enable uptake of micro-generation e.g, solar panels etc:
No specific infrastructure investment; use traditional network investment as needed
0.0000 0
Investment in infrastructure to support uptake of micro-generation technologies
0.0180 6.47
Frequency of power cuts over 3 mins - average number:
1 every 13 months 0.0000 0
1 every 18 months 0.0057 1.62
1 every 24 months 0.0137 5.21
Rural customers: For power cuts longer than 3 minutes, time to restore 80% of affected customers:
Base: Within 180 minutes 0.0000 0
Within 120 minutes 0.0082 1.86
Within 60 minutes 0.0202 7.81
Urban customers: For power cuts longer than 3 minutes, time to restore 80% of affected customers:
Within 180 minutes -0.0290 -7.67
Within 60 minutes -0.0172 -5.39
Base: Within 20 minutes 0.0000 0
Within 10 minutes -0.0039 -0.96
Information during a power cut:
Information available on contacting call centre
0.0000 0
Information available on contacting call centre plus provision of automatic text messages to registered customers with details of power cut and updates
-0.0007 -0.15
Information available on contacting call centre plus provision of automatic update calls to customer from call centre and follow-up call when power cut over
0.0001 0.03
Information available on contacting call centre plus provision of additional information services such as real-time information on internet, use of social media, customer service staff ‘knocking on doors’ etc
0.0089 2.88
Contingency Services Customer responsibility for any back-up services
0.0000 0
Provision of generator hire e.g. for an event -0.0056 -1.27
Provision of back-up services to customers e.g. regular testing of customer-owned generators and systems
0.0041 1.57

Accent 2440rep02_mainEPNwtp_ final MM/KOB 13/1212 Page 19 of 37
Business Game 2 and 3
The Game 2 and 3 results for business customers were very much in line with the
domestic results, with the exception of the findings for contingency services:
investment in network technologies to allow cheaper and quicker connection of new
low carbon generators of electricity was shown to be the most valuable level tested
investing in infrastructure to enable UKPN to detect loss of supply was the second
most valuable level tested
similarly, investment in infrastructure to support uptake of micro-generation
technologies was also highly valued and significant
“frequency of power cuts over 3 mins - average number”: as in the domestic results,
moving from having a power cut every 13 months to having one every 18 did not
make any difference to EPN business respondents and was not significant, while
moving to 1 every 24 months was significant and valued
decreasing the time to restore power to 80% of rural customers affected by a cut in
excess of 3 minutes from within 180 minutes to 120 minutes was not valued;
however, improving it to 60 minutes was perceived positively
worsening the time to restore power to 80% of urban customers affected by a cut in
excess of 3 minutes from within 20 minutes to within 60 minutes or 180 minutes
was perceived negatively (ie business EPN customers would expect to be
compensated for this). As with domestic customers an improvement to 10 minutes
was not valued or significant
“information during a power cut”: as with domestic customers the only level valued
was having information available on contacting call centre plus provision of
additional information services such as real-time information on internet, use of
social media, customer service staff „knocking on doors‟ etc
finally, only one level of the contingency service levels tested – ie moving from
customer responsibility for any back-up services to “provision of back-up services
to customers e.g. regular testing of customer-owned generators and systems” – was
valued and significant.

Accent 2440rep02_mainEPNwtp_ final MM/KOB 13/1212 Page 20 of 37
Table 7: Game 2 and 3 Business - EPN
Attributes Levels Factored
coefficient Robust t
stat
Investment in infrastructure to enable UKPN to detect loss of supply
No investment 0.0000 0
Investment in infrastructure required to enable UKPN to detect loss of supply from individual or small groups of premises
0.0432 5.66
Investment to enable greater uptake of electric vehicles
No specific infrastructure investment 0.0000 0
Investment in infrastructure required to support take up of electric vehicles
0.0261 3.56
Investment in infrastructure to enable greater uptake of low carbon electric heating technologies
No specific infrastructure investment 0.0000 0
Investment in infrastructure required to support take up of low carbon electric heating technologies
0.0218 2.83
Investment to enable largescale renewable generation (e.g onshore wind farms, biomass plants etc)
No specific infrastructure investment; each new connection charged at cost
0.0000 0
Investment in network technologies to allow cheaper and quicker connection of new low carbon generators of electricity
0.0447 5.44
Investment to enable uptake of micro-generation e.g, solar panels etc:
No specific infrastructure investment; use traditional network investment as needed
0.0000 0
Investment in infrastructure to support uptake of micro-generation technologies
0.0403 5.11
Frequency of power cuts over 3 mins - average number:
1 every 13 months 0.0000 0
1 every 18 months 0.0005 0.06
1 every 24 months 0.0139 2.31
Rural customers: For power cuts longer than 3 minutes, time to restore 80% of affected customers:
Base: Within 180 minutes 0.0000 0
Within 120 minutes 0.0011 0.1
Within 60 minutes 0.0169 2.74
Urban customers: For power cuts longer than 3 minutes, time to restore 80% of affected customers:
Within 180 minutes -0.0302 -3.32
Within 60 minutes -0.0375 -4.92
Base: Within 20 minutes 0.0000 0
Within 10 minutes -0.0080 -0.86
Information during a power cut:
Information available on contacting call centre
0.0000 0
Information available on contacting call centre plus provision of automatic text messages to registered customers with details of power cut and updates
0.0016 0.13
Information available on contacting call centre plus provision of automatic update calls to customer from call centre and follow-up call when power cut over
0.0148 1.15
Information available on contacting call centre plus provision of additional information services such as real-time information on internet, use of social media, customer service staff ‘knocking on doors’ etc
0.0154 2
Contingency Services Customer responsibility for any back-up services
0.0000 0
Provision of generator hire e.g. for an event
-0.0075 -0.63
Provision of back-up services to customers e.g. regular testing of customer-owned generators and systems
0.0213 3.4

Accent 2440rep02_mainEPNwtp_ final MM/KOB 13/1212 Page 21 of 37
4.4 Combined & Ranked Customer Priorities for EPN
The following two tables combine all levels tested that were valued and significant and
rank them in order of priority. Table 8, which shows the ranking for EPN domestic
customers, demonstrates that the following are most important to them:
Investment in infrastructure required to enable UKPN to detect loss of supply from
individual or small groups of premises (the index shows that this is valued almost
four times as highly as the lowest valued service)
Investment in network technologies to allow cheaper and quicker connection of new
low carbon generators of electricity
Timing of any new connections work: Work undertaken in normal business hours
(08.00-17.00), in the evenings and at weekends.
Fairly high values were also associated with:
Rural customers: For power cuts longer than 3 minutes, time to restore 80% of
affected customers within 60 minutes (the index shows that this is roughly a third of
the value of investment to detect loss of supply)
Investment in infrastructure required to support take up of low carbon electric
heating technologies
Investment to enable uptake of microgeneration, eg solar panels etc
Timing of any new connections work: Work is undertaken within a banded time ie
morning, afternoon or evening in normal business hours, evenings or at weekends
Timescale for provision of quotations for simple, low voltage new connections
work: By date agreed with customer.
Of least importance are:
Information during a power cut: available on contacting call centre plus provision of
additional information services such as real-time information on internet, use of
social media, customer service staff „knocking on doors‟ during a power cut
Investment in infrastructure required to support take up of electric vehicles.
And ranked negatively are:
For urban customers: for power cuts longer than 3 minutes, time to restore 80% of
affected customers within 180 or 60 minutes
Timescale for provision of quotations for simple, low voltage new connections
work: within 10 working days
Contact for any new connections work: all contact through an on-line web portal.

Accent 2440rep02_mainEPNwtp_ final MM/KOB 13/1212 Page 22 of 37
Table 8: Domestic EPN Priorities Combined and Ranked
Levels Factored coefficient
Index
Investment in infrastructure required to enable UKPN to detect loss of supply from individual or small groups of premises
0.0338 3.79
Investment in network technologies to allow cheaper and quicker connection of new low carbon generators of electricity
0.0332 3.72
Timing of any new connections work: Work undertaken in normal business hours (08.00-17.00), in the evenings and at weekends
0.0211 2.37
Rural customers: For power cuts longer than 3 minutes, time to restore 80% of affected customers within 60 minutes
0.0202 2.27
Investment in infrastructure required to support take up of low carbon electric heating technologies
0.0185 2.07
Investment to enable uptake of micro-generation e.g, solar panels etc
0.0180 2.02
Timing of any new connections work: Work is undertaken within a banded time ie morning, afternoon or evening in normal business hours, evenings or at weekends
0.0177 1.99
Timescale for provision of quotations for simple, low voltage new connections work: By date agreed with customer
0.0169 1.90
Time to complete simple, low voltage new connections work: 75 days quicker than now, ie within 15 days
0.0139 1.56
Type of new connections service offered: All elements of the work completed by UK Power Networks
0.0138 1.55
Frequency of power cuts over 3 mins - average number: 1 every 24 months
0.0137 1.54
Investment in infrastructure required to support take up of electric vehicles
0.0115 1.29
Information during a power cut: available on contacting call centre plus provision of additional information services such as real-time information on internet, use of social media, customer service staff ‘knocking on doors’ etc
0.0089 1.00
Contact for any new connections work: All contact through an on-line web portal
-0.0119
Timescale for provision of quotations for simple, low voltage new connections work: Within 10 working days
-0.0151
Urban customers: For power cuts longer than 3 minutes, time to restore 80% of affected customers: Within 60 minutes
-0.0172
Urban customers: For power cuts longer than 3 minutes, time to restore 80% of affected customers: Within 180 minutes
-0.0290
Table 9 shows the ranking for EPN business customers and shows that the following are
most important to them:
Investment in network technologies to allow cheaper and quicker connection of new
low carbon generators of electricity (the index shows that this was valued more than
four times as highly as the least valued service)
Investment in infrastructure required to enable UKPN to detect loss of supply from
individual or small groups of premises
Investment to enable uptake of micro-generation e.g, solar panels etc.

Accent 2440rep02_mainEPNwtp_ final MM/KOB 13/1212 Page 23 of 37
Fairly high values were also associated with:
Investment in infrastructure required to support take up of electric vehicles (the
index shows that this was valued just over two and a half times as highly as the least
valued service)
Investment in infrastructure required to support take up of low carbon electric
heating technologies
Provision of back-up services to customers e.g. regular testing of customer-owned
generators and systems.
Of least importance are:
Timescale for provision of quotations for simple, low voltage new connections
work: by date agreed with customer
Frequency of power cuts over 3 mins - average number: 1 every 24 months (from 1
every 13 months).
And ranked negatively are:
For urban customers: for power cuts longer than 3 minutes, time to restore 80% of
affected customers worsening to within 180 or 60 minutes
Timescale for provision of quotations for simple, low voltage new connections
work: within 10 working days
Contact for any new connections work: Phone or email contact via dedicated new
connections call centre.

Accent 2440rep02_mainEPNwtp_ final MM/KOB 13/1212 Page 24 of 37
Table 9: Business EPN Priorities Combined and Ranked
Levels Factored coefficient
Indexed coefficient
Investment in network technologies to allow cheaper and quicker connection of new low carbon generators of electricity
0.0447 4.54
Investment in infrastructure required to enable UKPN to detect loss of supply from individual or small groups of premises
0.0432 4.38
Investment to enable uptake of micro-generation e.g, solar panels etc
0.0403 4.09
Investment in infrastructure required to support take up of electric vehicles
0.0261 2.65
Investment in infrastructure required to support take up of low carbon electric heating technologies
0.0218 2.22
Provision of back-up services to customers e.g. regular testing of customer-owned generators and systems
0.0213 2.16
Rural customers: For power cuts longer than 3 minutes, time to restore 80% of affected customers within 60minutes
0.0169 1.71
Time to complete simple, low voltage new connections work: 75 days quicker than now, ie within 15 days
0.0168 1.71
Timing of any new connections work: Work is undertaken within a banded time ie morning, afternoon or evening in normal business hours, evenings or at weekends
0.0165 1.68
Information during a power cut: available on contacting call centre plus provision of additional information services such as real-time information on internet, use of social media, customer service staff ‘knocking on doors’ etc
0.0154 1.57
Type of new connections service offered: All elements of the work completed by UK Power Networks
0.0139 1.41
Frequency of power cuts over 3 mins - average number: 1 every 24 months
0.0139 1.41
Timescale for provision of quotations for simple, low voltage new connections work: By date agreed with customer
0.0099 1.00
Contact for any new connections work: Phone or email contact via dedicated new connections call centre
-0.0158
Timescale for provision of quotations for simple, low voltage new connections work: Within 10 working days
-0.0167
Urban customers: For power cuts longer than 3 minutes, time to restore 80% of affected customers: Within 60 minutes
-0.0302
Urban customers: For power cuts longer than 3 minutes, time to restore 80% of affected customers: Within 180 minutes
-0.0375
4.5 Ranked Customers Priorities for All DNOs
Sections 4.3 and 4.4 have shown the findings for EPN customers only. This section
compares the ranking of all three DNOs customer priorities against each other.
The domestic comparison table demonstrates that domestic customers of all three DNOs
had similar highest priorities, with the following seen as the most important or second
most important levels in all cases:
investment in network technologies to allow cheaper and quicker connection of new
low carbon generators of electricity
investment to enable UKPN to detect loss of supply from individual or small groups
of premises.

Accent 2440rep02_mainEPNwtp_ final MM/KOB 13/1212 Page 25 of 37
Other investment related attributes were also highly considered by all three with the
exception of investment to support the take up electric vehicles. Although this was the
fifth highest ranked level by SPN customers, it was ranked 12th
by both LPN and EPN.
Other key differences were:
All elements of the work completed by UK Power Networks for a new connection
work was much less valued by SPN customers
LPN customers valued having new connection work undertaken within a banded
time ie morning, afternoon or evening in normal business hours, evenings or at
weekends more highly than EPN and SPN customers
On the other hand new connection work undertaken in normal business hours
(08.00-17.00), in the evenings and at weekends was seen as a valuable improvement
by EPN customers, while it was considered less important by LPN customers and
was not significant for SPN customers
Investment to enable uptake of micro-generation e.g, solar panels etc was seen as
less important by EPN customers
EPN customers valued a reduction of time to restore 80% of affected rural
customers to within 60 minutes more highly than SPN customers.

Accent 2440rep02_mainEPNwtp_ final MM/KOB 13/1212 Page 26 of 37
Table 10: Domestic all DNOs Priorities Combined and Ranked
Levels LPN ranking
EPN ranking
SPN ranking
Investment in network technologies to allow cheaper and quicker connection of new low carbon generators of electricity
1 2 1
Investment in infrastructure required to enable UKPN to detect loss of supply from individual or small groups of premises
2 1 2
Investment to enable uptake of micro-generation e.g, solar panels etc 3 6 3
Investment in infrastructure required to support take up of low carbon electric heating technologies
4 5 4
Timing of any new connections work: Work is undertaken within a banded time ie morning, afternoon or evening in normal business hours, evenings or at weekends
5 7 10
Frequency of power cuts over 3 mins - average number: 1 every 48 months
6 N/S N/S
Timing of any new connections work: Work undertaken in normal business hours (08.00-17.00), in the evenings and at weekends
7 3 N/S
Provision of back-up services to customers e.g. regular testing of customer-owned generators and systems
8 N/S 16
Time to complete simple, low voltage new connections work: 75 days quicker than now, ie within 15 days
9 9 6
Type of new connections service offered: All elements of the work completed by UK Power Networks
10 10 18
Contingency Services: Provision of generator hire e.g. for an event 11 N/S N/S
Investment in infrastructure required to support take up of electric vehicles
12 12 5
Timescale for provision of quotations for simple, low voltage new connections work: By date agreed with customer
13 8 N/S
Information during a power cut: Information available on contacting call centre plus provision of additional information services such as real-time information on internet, use of social media, customer service staff ‘knocking on doors’ etc
14 13 15
Timescale for provision of quotations for simple, low voltage new connections work: Within 10 working days
15 15 N/S
Urban customers: For power cuts longer than 3 minutes, time to restore 80% of affected customers: Within 60 minutes
16 16 20
Urban customers: For power cuts longer than 3 minutes, time to restore 80% of affected customers: Within 180 minutes
17 17 21
Contact for any new connections work: All contact through an on-line web portal
N/S 14 N/S
Rural customers: For power cuts longer than 3 minutes, time to restore 80% of affected customers within 60minutes
NA 4 9
Frequency of power cuts over 3 mins - average number: 1 every 24 months
N/S 11 14
Timescale for provision of quotations for simple, low voltage new connections work: By date agreed with customer
N/S N/S 7
Time to complete simple, low voltage new connections work: 30 days quicker than now, ie within 60 days
N/S N/S 8
Time to complete simple, low voltage new connections work:30 days quicker than now, ie within 60 days
N/S N/S 11
Timescale for provision of quotations for simple, low voltage new connections work: Within 7 working days
N/S N/S 13
Information during a power cut: Information available on contacting call centre plus provision of automatic update calls to customer from call centre and follow-up call when power cut over
N/S N/S 12
Information during a power cut: Information available on contacting call centre plus provision of automatic text messages to registered customers with details of power cut and updates
N/S N/S 17
Contact for any new connections work: All contact through an on-line web portal
N/S N/S 19

Accent 2440rep02_mainEPNwtp_ final MM/KOB 13/1212 Page 27 of 37
The business comparison table demonstrates that business customers of all three DNOs
also had similar highest priorities, with the following seen as the most important or
second most important levels in most cases:
investment to enable UKPN to detect loss of supply from individual or small groups
of premises
investment in network technologies to allow cheaper and quicker connection of new
low carbon generators of electricity
Investment to enable uptake of micro-generation e.g, solar panels etc was also highly
valued, but SPN customers considered this less important than LPN and EPN
customers.
Other key differences were:
Improvements in the timescale for provision of quotations for simple, low voltage
new connections work were considered more important by LPN customers
Having new connection work undertaken within a banded time ie morning,
afternoon or evening in normal business hours, evenings or at weekends was
considered less important by SPN customers; however, SPN customers were the
only business customers where having work undertaken in normal business hours, in
the evenings and weekends was valued, it being the third most important service to
these customers
Being provided with a back-up service e.g. regular testing of customer-owned
generators and systems was considered more valuable by EPN customers
EPN customers also placed more value on investing in the infrastructure required to
support take up of electric vehicles.

Accent 2440rep02_mainEPNwtp_ final MM/KOB 13/1212 Page 28 of 37
Table 11: Business All DNOs Priorities Combined and Ranked
Levels LPN ranking
EPN ranking
SPN ranking
Investment in infrastructure required to enable UKPN to detect loss of supply from individual or small groups of premises
1 2 1
Investment to enable uptake of micro-generation e.g, solar panels etc
2 3 5
Investment in network technologies to allow cheaper and quicker connection of new low carbon generators of electricity
3 1 2
Timescale for provision of quotations for simple, low voltage new connections work: By date agreed with customer
4 13 14
Timescale for provision of quotations for simple, low voltage new connections work: Within 7 working days
5 N/S 10
Investment in infrastructure required to support take up of low carbon electric heating technologies
6 5 4
Timing of any new connections work: Work is undertaken within a banded time ie morning, afternoon or evening in normal business hours, evenings or at weekends
7 9 16
Time to complete simple, low voltage new connections work: 75 days quicker than now, ie within 15 days
8 8 7
Investment in infrastructure required to support take up of electric vehicles
9 4 12
Frequency of power cuts over 3 mins - average number: 1 every 48 months
10 N/S N/S
Provision of back-up services to customers e.g. regular testing of customer-owned generators and systems
11 6 11
Urban customers: For power cuts longer than 3 minutes, time to restore 80% of affected customers: Within 60 minutes
12 16 17
Urban customers: For power cuts longer than 3 minutes, time to restore 80% of affected customers: Within 180 minutes
13 17 18
Information during a power cut: Information available on contacting call centre plus provision of additional information services such as real-time information on internet, use of social media, customer service staff ‘knocking on doors’ etc
N/S 10 13
Timescale for provision of quotations for simple, low voltage new connections work: Within 10 working days
N/S 15 N/S
Rural customers: For power cuts longer than 3 minutes, time to restore 80% of affected customers within 60minutes
NA 7 8
Frequency of power cuts over 3 mins - average number: 1 every 24 months
N/S 12 9
Type of new connections service offered: All elements of the work completed by UK Power Networks
N/S 11 15
Timing of any new connections work: Work undertaken in normal business hours (08.00-17.00), in the evenings and at weekends
N/S N/S 3
Contact for any new connection work: Phone or email contact via a named co-ordinator
N/S N/S 6
Contact for any new connections work: Phone or email contact via dedicated new connections call centre
N/S 14 N/S

Accent 2440rep02_mainEPNwtp_ final MM/KOB 13/1212 Page 29 of 37
4.6 EPN Customers WTP
As mentioned in the methodology section, the willingness to pay estimates shown in the
table have been derived from the package SP exercise, scaled to the Contingent
Valuation (CV) questions. Having done that, the results suggest that the average
willingness to pay amongst domestic EPN customers is 20.3% of the distribution
element of the bill by 2023.
This domestic willingness to pay (WTP) ranged from a 0.76% increase in their
distribution bill by 2023 for the lowest valued service level to a 2.89% increase for the
service level valued most highly as shown in Table 12. This also shows the level to
which customers would need to be compensated for a decline in (or what they see as a
decline or failure to improve) service.
Table 12: Domestic Willingness to Pay – EPN
Levels WTP in % in 2023
Investment in infrastructure required to enable UKPN to detect loss of supply from individual or small groups of premises
2.89
Investment in network technologies to allow cheaper and quicker connection of new low carbon generators of electricity
2.84
Timing of any new connections work: Work undertaken in normal business hours (08.00-17.00), in the evenings and at weekends
1.81
Rural customers: For power cuts longer than 3 minutes, time to restore 80% of affected customers within 60minutes
1.73
Investment in infrastructure required to support take up of low carbon electric heating technologies
1.58
Investment to enable uptake of micro-generation e.g, solar panels etc 1.54
Timing of any new connections work: Work is undertaken within a banded time ie morning, afternoon or evening in normal business hours, evenings or at weekends
1.52
Timescale for provision of quotations for simple, low voltage new connections work: By date agreed with customer
1.45
Time to complete simple, low voltage new connections work: 75 days quicker than now, ie within 15 days
1.19
Type of new connections service offered: All elements of the work completed by UK Power Networks
1.18
Frequency of power cuts over 3 mins - average number: 1 every 24 months 1.17
Investment in infrastructure required to support take up of electric vehicles 0.99
Information during a power cut: available on contacting call centre plus provision of additional information services such as real-time information on internet, use of social media, customer service staff ‘knocking on doors’ etc
0.76
Contact for any new connections work: All contact through an on-line web portal
-1.02
Timescale for provision of quotations for simple, low voltage new connections work: Within 10 working days
-1.29
Urban customers: For power cuts longer than 3 minutes, time to restore 80% of affected customers: Within 60 minutes
-1.47
Urban customers: For power cuts longer than 3 minutes, time to restore 80% of affected customers: Within 180 minutes
-2.48

Accent 2440rep02_mainEPNwtp_ final MM/KOB 13/1212 Page 30 of 37
Overall business willingness to pay for business customers was 21.8%, ranging from
0.65% to 2.94% as shown in Table 13.
Table 13: Business Willingness to Pay – EPN
Levels WTP in % in 2023
Investment in network technologies to allow cheaper and quicker connection of new low carbon generators of electricity
2.94
Investment in infrastructure required to enable UKPN to detect loss of supply from individual or small groups of premises
2.84
Investment to enable uptake of micro-generation e.g, solar panels etc 2.65
Investment in infrastructure required to support take up of electric vehicles 1.72
Investment in infrastructure required to support take up of low carbon electric heating technologies
1.44
Provision of back-up services to customers e.g. regular testing of customer-owned generators and systems
1.40
Rural customers: For power cuts longer than 3 minutes, time to restore 80% of affected customers within 60minutes
1.11
Time to complete simple, low voltage new connections work: 75 days quicker than now, ie within 15 days
1.11
Timing of any new connections work: Work is undertaken within a banded time ie morning, afternoon or evening in normal business hours, evenings or at weekends
1.09
Information during a power cut: available on contacting call centre plus provision of additional information services such as real-time information on internet, use of social media, customer service staff ‘knocking on doors’ etc
1.02
Type of new connections service offered: All elements of the work completed by UK Power Networks
0.92
Frequency of power cuts over 3 mins - average number: 1 every 24 months 0.92
Timescale for provision of quotations for simple, low voltage new connections work: By date agreed with customer
0.65
Contact for any new connections work: Phone or email contact via dedicated new connections call centre
-1.04
Timescale for provision of quotations for simple, low voltage new connections work: Within 10 working days
-1.10
Urban customers: For power cuts longer than 3 minutes, time to restore 80% of affected customers: Within 60 minutes
-1.98
Urban customers: For power cuts longer than 3 minutes, time to restore 80% of affected customers: Within 180 minutes
-2.47
4.7 Summary of Key Findings by Socio-Economic Group (SEG) and
Business Size
The next comparison tables show the results for different SEGs for domestic customers
and by business size for business customers.
As shown in Table 14 there were many differences in the findings between ABC1s (the
higher socio economic group) and C2DEs (the lower socio economic group). For
instance, ABC1s placed a higher value on:
Investment in infrastructure required to enable UKPN to detect loss of supply from
individual or small groups of premises

Accent 2440rep02_mainEPNwtp_ final MM/KOB 13/1212 Page 31 of 37
Investment in network technologies to allow cheaper and quicker connection of new
low carbon generators of electricity
Timing of any new connections work: valuing both work undertaken in normal
business hours (08.00-17.00), in the evenings and at weekends and work being
undertaken within a banded time ie morning, afternoon or evening in normal
business hours, evenings or at weekends.
Conversely C2DEs placed higher values on:
Rural customers: for power cuts longer than 3 minutes, time to restore 80% of
affected customers improving to within 60 minutes. This value was much higher for
C2DEs who demonstrated a willingness to pay 2.66% on top of their current
distribution bill by 2023 for this compared to 1.54% for ABC1s
Investment in infrastructure required to support take up of low carbon electric
heating technologies.

Accent 2440rep02_mainEPNwtp_ final MM/KOB 13/1212 Page 32 of 37
Table 14: Domestic EPN Willingness to Pay by SEG
Levels WTP in % in 2023 ABC1
WTP in % in 2023 C2DE
Investment in infrastructure required to enable UKPN to detect loss of supply from individual or small groups of premises
3.36 2.36
Investment in network technologies to allow cheaper and quicker connection of new low carbon generators of electricity
2.94 2.64
Timing of any new connections work: Work undertaken in normal business hours (08.00-17.00), in the evenings and at weekends
1.98 N/S
Timing of any new connections work: Work is undertaken within a banded time ie morning, afternoon or evening in normal business hours, evenings or at weekends
1.67 1.37
Investment to enable uptake of micro-generation e.g, solar panels etc
1.62 1.41
Frequency of power cuts over 3 mins - average number: 1 every 24 months
1.60 N/S
Rural customers: For power cuts longer than 3 minutes, time to restore 80% of affected customers within 60minutes
1.54 2.66
Timescale for provision of quotations for simple, low voltage new connections work: By date agreed with customer
1.35 1.54
Time to complete simple, low voltage new connections work: 75 days quicker than now, ie within 15 days
1.29 0.99
Investment in infrastructure required to support take up of low carbon electric heating technologies
1.29 1.94
Frequency of power cuts over 3 mins - average number: 1 every 18 months
0.98 N/S
Type of new connections service offered: All elements of the work completed by UK Power Networks
0.91 1.54
Investment in infrastructure required to support take up of electric vehicles
0.91 1.16
Information available on contacting call centre plus provision of additional information services such as real-time information on internet, use of social media, customer service staff ‘knocking on doors’ etc
0.84 N/S
Contact for any new connections work: All contact through an on-line web portal
-0.83 -1.19
Urban customers: For power cuts longer than 3 minutes, time to restore 80% of affected customers: Within 60 minutes
-1.46 -1.99
Timescale for provision of quotations for simple, low voltage new connections work: Within 10 working days
-1.63 -3.87
Urban customers: For power cuts longer than 3 minutes, time to restore 80% of affected customers: Within 180 minutes
-2.02
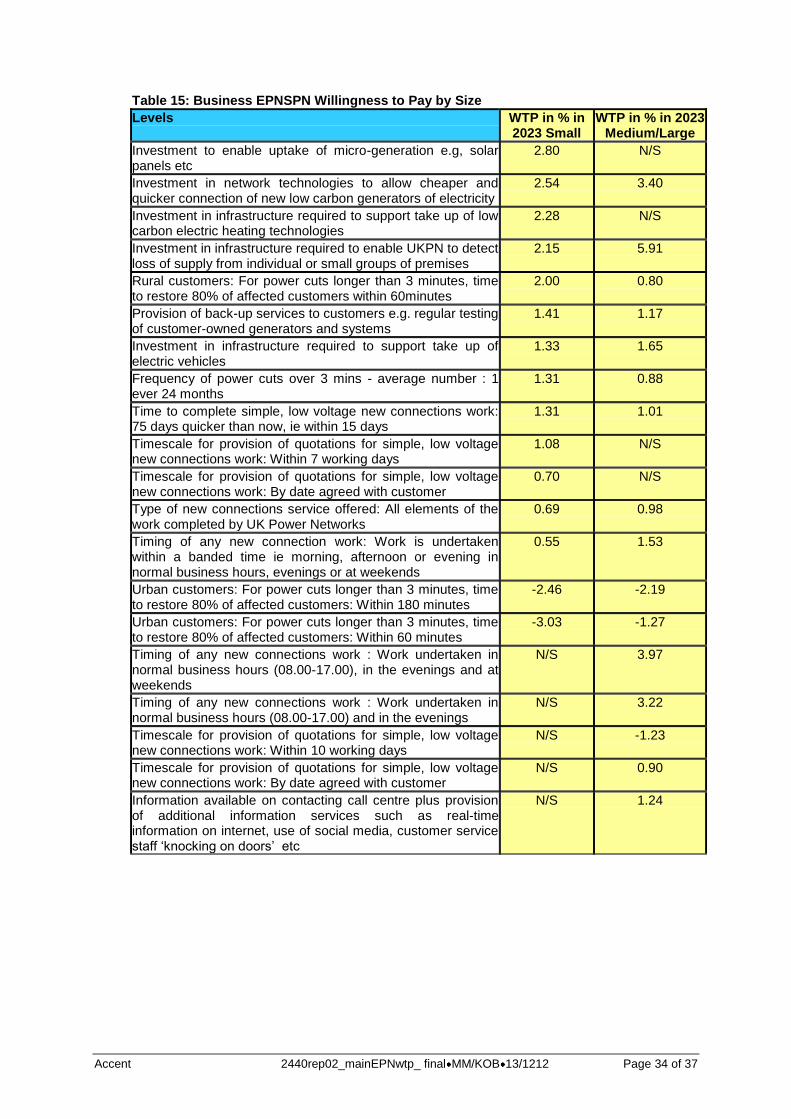
Segmented results for business customers are shown in Table 15. However, it should be
noted that these are the combined results for EPN and SPN, as the segmented data had
to be combined in order to have the bigger sample sizes required to achieve more robust
results.
As shown in Table 15, several service levels were valued very differently by small
compared to medium and large businesses. Small businesses placed a higher value on:
investment to enable uptake of micro-generation e.g, solar panels etc and investment
in infrastructure required to support take up of low carbon electric heating
technologies (neither valued significantly by medium and large businesses)

Accent 2440rep02_mainEPNwtp_ final MM/KOB 13/1212 Page 33 of 37
rural customers: for power cuts longer than 3 minutes, time to restore 80% of
affected customers improved to within 60 minutes.
Conversely medium and large businesses placed higher values on:
Investment in network technologies to allow cheaper and quicker connection of new
low carbon generators of electricity
Investment in infrastructure required to enable UKPN to detect loss of supply from
individual or small groups of premises.
Also they placed a higher value on “Timing of any new connection work: work is
undertaken within a banded time ie morning, afternoon or evening in normal business
hours, evenings or at weekends” and also valued both other improvements to timing of
new connections work, neither of which were valued by small businesses.
Accent 2440rep02_mainEPNwtp_ final MM/KOB 13/1212 Page 34 of 37
Table 15: Business EPNSPN Willingness to Pay by Size
Levels WTP in % in 2023 Small
WTP in % in 2023 Medium/Large
Investment to enable uptake of micro-generation e.g, solar panels etc
2.80 N/S
Investment in network technologies to allow cheaper and quicker connection of new low carbon generators of electricity
2.54 3.40
Investment in infrastructure required to support take up of low carbon electric heating technologies
2.28 N/S
Investment in infrastructure required to enable UKPN to detect loss of supply from individual or small groups of premises
2.15 5.91
Rural customers: For power cuts longer than 3 minutes, time to restore 80% of affected customers within 60minutes
2.00 0.80
Provision of back-up services to customers e.g. regular testing of customer-owned generators and systems
1.41 1.17
Investment in infrastructure required to support take up of electric vehicles
1.33 1.65
Frequency of power cuts over 3 mins - average number : 1 ever 24 months
1.31 0.88
Time to complete simple, low voltage new connections work: 75 days quicker than now, ie within 15 days
1.31 1.01
Timescale for provision of quotations for simple, low voltage new connections work: Within 7 working days
1.08 N/S
Timescale for provision of quotations for simple, low voltage new connections work: By date agreed with customer
0.70 N/S
Type of new connections service offered: All elements of the work completed by UK Power Networks
0.69 0.98
Timing of any new connection work: Work is undertaken within a banded time ie morning, afternoon or evening in normal business hours, evenings or at weekends
0.55 1.53
Urban customers: For power cuts longer than 3 minutes, time to restore 80% of affected customers: Within 180 minutes
-2.46 -2.19
Urban customers: For power cuts longer than 3 minutes, time to restore 80% of affected customers: Within 60 minutes
-3.03 -1.27
Timing of any new connections work : Work undertaken in normal business hours (08.00-17.00), in the evenings and at weekends
N/S 3.97
Timing of any new connections work : Work undertaken in normal business hours (08.00-17.00) and in the evenings
N/S 3.22
Timescale for provision of quotations for simple, low voltage new connections work: Within 10 working days
N/S -1.23
Timescale for provision of quotations for simple, low voltage new connections work: By date agreed with customer
N/S 0.90
Information available on contacting call centre plus provision of additional information services such as real-time information on internet, use of social media, customer service staff ‘knocking on doors’ etc
N/S 1.24
Accent 2440rep02_mainEPNwtp_ final MM/KOB 13/1212 Page 35 of 37
5. CONCLUSIONS AND RECOMMENDATIONS
5.1 Domestic Customers
Domestic willingness to pay for service changes ranges from 0.76% to 2.89% with
overall willingness to pay for the full package being 20.3% of the distribution element
of the bill by 2023.
For EPN domestic customers, the three highest priorities for changes in services were:
investment in infrastructure to enable UKPN to detect loss of supply from individual
or small groups of premises
investment in infrastructure to allow cheaper and quicker connection of new low
carbon generators of electricity
timing of any new connections work: work undertaken in normal business hours
(08.00-17.00), in the evenings and at weekends.
Willingness to pay for these services by 2023 ranged from a 1.81% increase in
distribution bills for timing of new connections work, increasing substantially to 2.84%
for infrastructure to allow cheaper and quicker connection of new low carbon
generators, and to 2.89% for investment in infrastructure to detect loss of supply.
The results highlight the importance that EPN domestic customers place on security of
supply, energy saving and environment and sustainable source of energy.
Separate research questions indicate that 38% of EPN domestic customers have
experienced a power cut longer than 3 minutes in the past year and this is reflected in
support for improvements to the time to restore 80% of affected rural customers to
within 60 minutes, but not for improving the time to restore 80% of urban customers
affected by a cut to within 10 minutes. This is also reflected in support for improving
the frequency of cuts from an average of to 1 every 13 months to 1 every 24 months.
EPN customers would be willing to pay a 1.73% increase in their distribution bill by
2023 for the rural improvement and 1.17% for the frequency improvement.
Whilst separate, non stated preference research, has indicated a desire for more
information during a cut, the results presented in this report demonstrate that – when
compared with other potential service improvements – in the stated preference analysis,
provision of information during a power cut was of lowest priority for EPN domestic
customers.There was no willingness to pay for any information service options during a
cut.
5.2 Socio-Economic Group
UKPN may wish to use the results by socio economic group to endeavour to ensure that
they do not overstate the willingness to pay of lower socio economic groups who will
typically be the lower income groups. In this respect their priorities and willingness to
pay should be noted. For C2DE customers, the highest priorities are:

Accent 2440rep02_mainEPNwtp_ final MM/KOB 13/1212 Page 36 of 37
rural customers: for power cuts longer than 3 minutes, time to restore 80% of
affected customers improving to within 60 minutes (WTP 2.64%)
investment in infrastructure required to support take up of low carbon generators of
electricity (WTP 2.64%)
investment in infrastructure to enable UKPN to detect loss of supply from individual
or small groups of premises (2.36%).
5.3 Business Customers
Business customer willingness to pay for different levels of services ranged from 0.65%
to 2.94% with overall willingness to pay for the full package being 21.8% of the
distribution element of the bill by 2023.
For EPN business customers, the highest priorities for changes in services were:
investment in network technologies to allow cheaper and quicker connection of new
low carbon generators of electricity
investment in infrastructure required to enable UKPN to detect loss of supply from
individual or small groups of premises
investment to enable uptake of micro-generation e.g. solar panels etc.
Willingness to pay for these services by 2023 ranged from a 2.65% increase in
distribution bills for investment to enable uptake of micro-generation, to 2.84% for
investment in infrastructure to detect loss of supply, to 2.94% for investment in
technologies to allow cheaper and quicker connection of low carbon generators.
Therefore it appears that security of supply and supplying electricity with the least
environmental impact is of high priority for business customers and suggests they are
conscious of climate change. This ties in with separate research questions which support
the suggestion that „being green‟ is important to EPN business customers.
Of least importance to EPN business customers were:
timescale for provision of quotations for simple, low voltage new connections work:
by date agreed with customer
frequency of power cuts over 3 mins - average number: 1 every 24 months (from 1
every 13 months).
New connections work was not a priority for business customers and was regarded of
least importance. With respect to the timescale for provision of quotations for new
connections work (date agreed with customer) and the type of new connections service
offered (all elements completed by UKPN), willingness to pay was particularly low:
0.65% and 0.92%, respectively. Separate research questions indicate that only a small
proportion of EPN business customers have ever contacted their distributor for a new
connection and had the work completed.

Accent 2440rep02_mainEPNwtp_ final MM/KOB 13/1212 Page 37 of 37
As with the domestic findings, separate non-stated preference research questions
implied that the provision of information to business customers during a power cut was
important. However the stated preference analysis indicates that EPN business
customers place no value on receiving information during a cut, suggesting that it is
desirable but not something that businesses would pay for.
5.4 Business Size
It is important to note that the conclusions for business size are based on the combined
results for EPN and SPN. The segmented data for these two DNO‟s were combined to
ensure a sample size large enough to achieve more robust results.
Values placed on service levels differed greatly between small business and medium to
large businesses. Small businesses placed the highest value on investment to enable
uptake of micro-generation e.g, solar panels (not valued by medium to large businesses)
and medium to large businesses on investment in infrastructure to detect loss of supply
from individual/small premises.
Both small and medium to large businesses placed a high value on investment in
technologies to allow cheaper and quicker connection of new low carbon generators of
electricity. Willingness to pay for this service was higher amongst medium and large
businesses than small businesses: 3.4% and 2.54% respectively.

APPENDIX A
Profile Data

The charts below show the profile of business and domestic respondents. The question
text is shown before each chart.
Business
“How many people are employed by your company at this site?”
Figure 4: Number of people employed at site
9
5
26
24
36
11
4
22
22
41
0 10 20 30 40 50
250 or more
150 to 249
50 to 149
10 to 49
Less than 10
% Respondents
Total Business
EPN Business
Base: all respondents – business: 301, EPN (100)
“And what business sector best defines the core activity of your
company?”

Figure 5: Business sector
1
1
7
27
3
21
4
8
18
6
4
4
2
2
4
24
2
23
6
11
15
5
3
0 10 20 30 40 50
Retail & Wholesale
Housing/Estate agents
Not for profit organisations
Construction/Engineering
Other Services
Government & Defence
Education & Health
Hotel, catering & Camp sites
Banking, Finance, Transport & Distribution
Other Manufacturing
Food, Drink & Tobacco
Agriculture
% Respondents
Total Business
EPN Business
Base: all respondents – business: 301, EPN (100)
Domestic
“What is the job title of the chief wage earner of your household or, if
you are the chief wage earner, your own job title?”
Figure 6: Socio-economic group
2
25
16
32
20
5
2
25
18
30
21
5
0 10 20 30 40 50
Not stated
DE
C2
C1
B
A
% Respondents
Total Domestic
EPN Domestic
Base: all respondents – domestic: 1,200, EPN (397)
“Which of the following age groups do you fall into?”

Figure 7: Age
7
16
43
27
7
6
17
39
30
9
0 10 20 30 40 50
75 or older
65 to 74
45-64
30-44
18-29
% Respondents
Total Domestic
EPN Domestic
Base: all respondents – domestic: 1,200, EPN (397)

APPENDIX B
Domestic Questionnaire
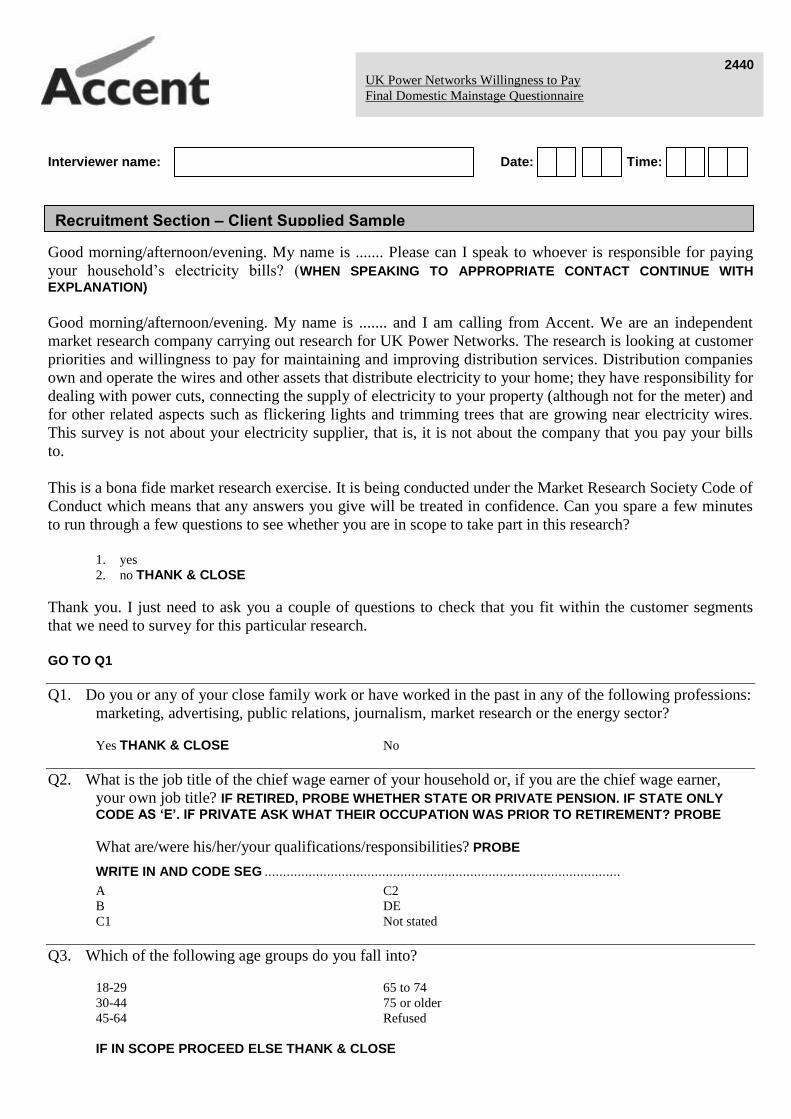
Interviewer name: Date: Time:
Good morning/afternoon/evening. My name is ....... Please can I speak to whoever is responsible for paying
your household‟s electricity bills? (WHEN SPEAKING TO APPROPRIATE CONTACT CONTINUE WITH
EXPLANATION)
Good morning/afternoon/evening. My name is ....... and I am calling from Accent. We are an independent
market research company carrying out research for UK Power Networks. The research is looking at customer
priorities and willingness to pay for maintaining and improving distribution services. Distribution companies
own and operate the wires and other assets that distribute electricity to your home; they have responsibility for
dealing with power cuts, connecting the supply of electricity to your property (although not for the meter) and
for other related aspects such as flickering lights and trimming trees that are growing near electricity wires.
This survey is not about your electricity supplier, that is, it is not about the company that you pay your bills
to.
This is a bona fide market research exercise. It is being conducted under the Market Research Society Code of
Conduct which means that any answers you give will be treated in confidence. Can you spare a few minutes
to run through a few questions to see whether you are in scope to take part in this research?
1. yes
2. no THANK & CLOSE
Thank you. I just need to ask you a couple of questions to check that you fit within the customer segments
that we need to survey for this particular research.
GO TO Q1
Q1. Do you or any of your close family work or have worked in the past in any of the following professions:
marketing, advertising, public relations, journalism, market research or the energy sector?
Yes THANK & CLOSE No
Q2. What is the job title of the chief wage earner of your household or, if you are the chief wage earner,
your own job title? IF RETIRED, PROBE WHETHER STATE OR PRIVATE PENSION. IF STATE ONLY
CODE AS „E‟. IF PRIVATE ASK WHAT THEIR OCCUPATION WAS PRIOR TO RETIREMENT? PROBE
What are/were his/her/your qualifications/responsibilities? PROBE
WRITE IN AND CODE SEG .................................................................................................
A C2
B DE
C1 Not stated
Q3. Which of the following age groups do you fall into?
18-29 65 to 74 30-44 75 or older 45-64 Refused
IF IN SCOPE PROCEED ELSE THANK & CLOSE
2440 UK Power Networks Willingness to Pay
Final Domestic Mainstage Questionnaire
Recruitment Section – Client Supplied Sample
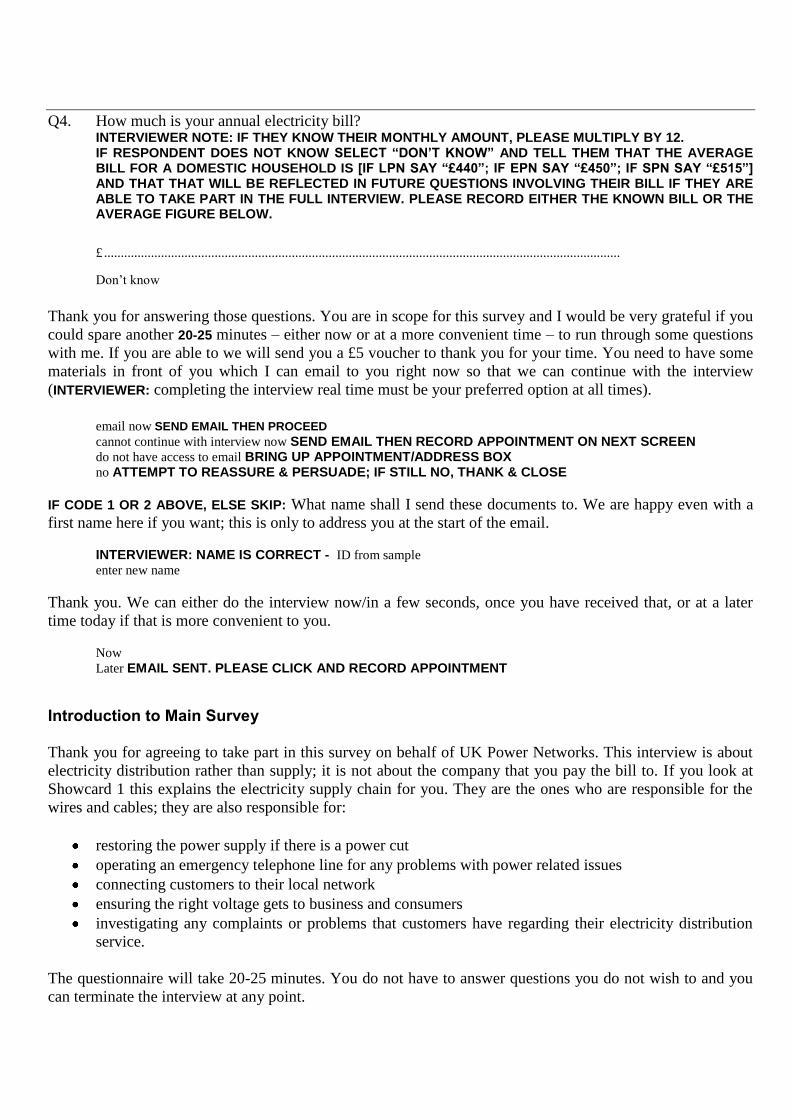
Q4. How much is your annual electricity bill? INTERVIEWER NOTE: IF THEY KNOW THEIR MONTHLY AMOUNT, PLEASE MULTIPLY BY 12. IF RESPONDENT DOES NOT KNOW SELECT “DON‟T KNOW” AND TELL THEM THAT THE AVERAGE BILL FOR A DOMESTIC HOUSEHOLD IS [IF LPN SAY “£440”; IF EPN SAY “£450”; IF SPN SAY “£515”] AND THAT THAT WILL BE REFLECTED IN FUTURE QUESTIONS INVOLVING THEIR BILL IF THEY ARE ABLE TO TAKE PART IN THE FULL INTERVIEW. PLEASE RECORD EITHER THE KNOWN BILL OR THE AVERAGE FIGURE BELOW.
£ ..........................................................................................................................................................
Don‟t know
Thank you for answering those questions. You are in scope for this survey and I would be very grateful if you
could spare another 20-25 minutes – either now or at a more convenient time – to run through some questions
with me. If you are able to we will send you a £5 voucher to thank you for your time. You need to have some
materials in front of you which I can email to you right now so that we can continue with the interview
(INTERVIEWER: completing the interview real time must be your preferred option at all times).
email now SEND EMAIL THEN PROCEED
cannot continue with interview now SEND EMAIL THEN RECORD APPOINTMENT ON NEXT SCREEN
do not have access to email BRING UP APPOINTMENT/ADDRESS BOX
no ATTEMPT TO REASSURE & PERSUADE; IF STILL NO, THANK & CLOSE
IF CODE 1 OR 2 ABOVE, ELSE SKIP: What name shall I send these documents to. We are happy even with a
first name here if you want; this is only to address you at the start of the email.
INTERVIEWER: NAME IS CORRECT - ID from sample
enter new name
Thank you. We can either do the interview now/in a few seconds, once you have received that, or at a later
time today if that is more convenient to you.
Now
Later EMAIL SENT. PLEASE CLICK AND RECORD APPOINTMENT
Introduction to Main Survey
Thank you for agreeing to take part in this survey on behalf of UK Power Networks. This interview is about
electricity distribution rather than supply; it is not about the company that you pay the bill to. If you look at
Showcard 1 this explains the electricity supply chain for you. They are the ones who are responsible for the
wires and cables; they are also responsible for:
restoring the power supply if there is a power cut
operating an emergency telephone line for any problems with power related issues
connecting customers to their local network
ensuring the right voltage gets to business and consumers
investigating any complaints or problems that customers have regarding their electricity distribution
service.
The questionnaire will take 20-25 minutes. You do not have to answer questions you do not wish to and you
can terminate the interview at any point.

Can I check you have your materials ready to refer to? These will have either been sent in the post, sent by
email or faxed to you. And what is the reference number on the materials? INTERVIEWER: CHECK THE
NUMBER IS CORRECT AND PROCEED OR RE-SCHEDULE AS APPROPRIATE.
Correct – PROCEED
Incorrect – GOT TO APPOINTMENTS SCREEN AND RE-SCHEDULE, RE-SENDING MATERIALS
Background Questions Q5. DP - DO NOT ASK: INPUT FROM SCREENER Q2:
A C2
B DE
C1 Not stated
Q6. DP - DO NOT ASK: INPUT FROM SCREENER Q3
18-29 65 to 74
30-44 75 or older
45-64 Refused
Q7. DP - DO NOT ASK: INPUT FROM SCREENER Q3:
£ ..........................................................................................................................................................
Don‟t know
Q8. DUMMY2: DP CALCULATE 18% OF Q8 VALUE
Q9. IF Q8 = DON‟T KNOW, SAY: The average annual household electricity bill in your area is [INSERT
RESPONSE FROM VALUE CODE AT Q8].
IF Q8 NE DON‟T KNOW SAY: Previously you told me that your annual electricity bill is [INSERT
RESPONSE FROM VALUE CODE AT Q8].
ASK ALL: Roughly 18% of this, ie [DP INSERT FROM Q9] goes to your electricity distributor; the rest is
distributed as shown in Showcard 2. Given what we have told you about the role of the distributor,
how do you feel about the amount that goes towards your distributor? Is it …
Too little
About right
Slightly too much
Far too much
Customer Experiences
Q10. Have you experienced any unplanned power cuts lasting more than 3 minutes (that is, any that you
were not warned about) in the last year?
Yes
No
Can‟t remember

Q11. IF NO AT Q12 ASK, ELSE GO TO Q15: Have you experienced any unplanned power cuts lasting more
than 3 minutes (that is, any that you were not warned about) in the last 5 years?
Yes
No
Can‟t remember
Q12. IF NO AT Q13 ASK, ELSE GO TO Q15: Have you experienced any unplanned power cuts lasting more
than 3 minutes (that is, any that you were not warned about) in the last 10 years?
Yes
No
Can‟t remember
Q13. IF „YES‟ IN Q12 OR Q13 OR Q14 ASK; ELSE GO TO Q22. How many of these unplanned cuts have you
had in the last [INSERT “year” IF Q12 = 1; INSERT “5 years” IF Q13 = 1 OR INSERT “10 years” IF Q14 =
1]?
Q14. On the last occasion that you had an unplanned power cut in excess of 3 minutes, how long did it last? INTERVIEWER: RECORD IN MINUTES (EG 1 HOUR = 60, 2 HOURS = 120 ETC); ENTER NUMBER OF 999 FOR DON‟T KNOW
Q15. Who, if anybody, did you contact on the last occasion you experienced a power cut?
Supplier
Distributor
Both supplier and distributor
No one
Don‟t know/can‟t remember
Q16. IF 2 OR 3 IN Q17; OTHERS GO TO Q22. Did you manage to get through to either an operator or a
recorded message at your distributor?
Yes , operator
Yes, recorded message
Yes, both
No
Don‟t know/can‟t remember
Q17. IF LE 3 IN Q18 ASK; OTHERS GO TO Q21. Did you get all the information you wanted when you made
the call to your distributor?
Yes
No
Don‟t know/can‟t remember
Q18. Using a scale of 1 to 5, where 5 is very accurate and 1 is very inaccurate, how accurate would you say
the information you were given was?
5: Very accurate
4: Quite accurate
3: Neither accurate nor inaccurate
2: Quite inaccurate
1: Very inaccurate

Q19. ASK ALL Has your distributor ever contacted you or called you back during an unplanned power cut?
Yes
No
Don‟t know
Q20. Where your distributor is aware of a power cut affecting an area, would you like to receive
information about the cut via an automatic contact via text or phone call, or are you content simply to
call the call centre if you need information?
Yes, would like call
Yes, would like text
Yes would like both
No, neither
Maybe SPECIFY, IE WHY DO THEY SAY THAT? Don‟t know
Q21. Where your distributor has information about a power cut they will usually prepare a recorded
message for callers to listen to when they make contact about the cut. Is your preference to stay on the
line to speak with an advisor after hearing the recorded message, or would you hang up after hearing
it?
Stay online
Hang up
Depends SPECIFY, IE WHY DO THEY SAY THAT?
Don‟t know
Q22. IF THEY SAY “STAY ONLINE” OR “DEPENDS” AT Q21 ASK, ELSE GO TO Q23: What is an acceptable
time to wait to speak to an advisor after hearing a recorded message? RECORD IN SECONDS AND/OR
MINUTES
CAN WE HAVE TWO BOXES, ONE FOR MINUTES, ONE FOR SECONDS?
Q23. In the event of a power cut, how likely would you be to visit a UK Power Networks (ie your
distributor‟s) webpage?... mobile app? Please use a scale of 1 to 5, where 1 is very unlikely, 2 is quite
unlikely, 3 is neither likely nor unlikely, 4 is quite likely and 5 is very likely?
Very Quite Neither likely Quite Very Don‟t
unlikely unlikely nor unlikely likely likely know
webpage .................................................1................. 2 .............. 3 ............... 4 ............... 5 ............... 6
mobile app .............................................1................. 2 .............. 3 ............... 4 ............... 5 ............... 6
Q24. Would you be interested in receiving reports on, and updates about, power cuts via social media such
as Twitter or Facebook?
Yes
No
Maybe
Don‟t know
Q25. Again, thinking about the event of a power cut, when a cut occurred would you like staff, or an
engineer, from UK Power Networks to knock on your door and explain the reason for the fault?
Yes
No
Don‟t know

Q26. Would you value them doing so once the power was restored?
Yes
No
Don‟t know
Q27. Have you – or have any of your family or friends that live in your area – ever experienced a power cut
due to severe weather (eg a major storm or flooding) or due to any other emergency or unforeseen
event (for example, an unforeseen attack on the network or theft of cables)? MULTICODE
Yes, severe weather
Yes, attack
Yes, cable theft
Yes, reason unknown
No
Don‟t know
Q28. ASK IF Q27=1, ELSE GO TO Q31: Specifically, have you – or have any of your family or friends that
live in your area – ever experienced a power cut due to flooding affecting an electricity substation?
Yes
No
Don‟t know
Q29. ASK IF Q27=1 OR 2 OR 3 OR 4, ELSE GO TO Q30: And did you contact your distributor when this
occurred?
Yes
No
Can‟t remember
Q30. IF YES AT Q31 ASK, ELSE GO TO Q33: Using a scale of 1 to 5, where 5 equals very well and 1 equals
very poorly how well do you feel that your distributor dealt with the fault that resulted from this
severe event?
5: very well
4: quite well
3: neither well nor poorly
2: quite poorly
1: very poorly
Q31. Have you ever suffered inconvenience as a result of roadworks caused by UK Power Networks or
another utility (ie your water company)?
Yes, UKPN
Yes, other utility
Yes, organisation unknown
No
Don‟t know
Q32. ASK IF Q31=1 OR 2 OR 3Q35: How inconvenient was the work to you? Please use a scale of 1 to 3,
where 3 is extremely inconvenient and 1 is quite, or moderately, inconvenient.
3: Extremely inconvenient
2: Very inconvenient
1: Quite or moderately inconvenient

Q33. And have you ever had to contact your distributor to get a quote for a new electricity connection?
Yes
No
Don‟t know
Q34. IF YES TO Q35 ASK, ELSE GO TO Q37: And did they undertake the new connection for you? ie was the
work completed?
Yes
No
Don‟t know/can‟t remember
Q35. Prior to this interview had you heard of UK Power Networks?
Yes
No
Q36. Would you welcome their brand being more visible?
Yes
No
Don‟t know
Don‟t care
Q37. Would it enhance the service they provide if you knew more about them, how to find them etc?
Yes
No
Maybe
Don‟t know
Q38. Before moving on to the next section of questions, I would like to understand your attitude towards the
environment. Which of the following best describes your attitude towards the environment, or how
“green” you consider yourself to be?
I think I am very green; I care about the environment: I use energy efficiently and recycle whatever I can
I think I am quite green; I care about the environment, but I could recycle more and do more to reduce my energy usage
I‟m not very green; I take some, but not much, interest in the environment
I am not at all green; I don‟t care about the environment, other things are more important

Choice Experiment Intro
We are now going to go through a set of choices between service levels you could experience from your
distributor. START OF 1ST ROTATION
Choice Experiments: Set A – NEW CONNECTIONS WORK
Please look at Showcard A. [INTERVIEWER CHECK THAT RESPONDENT HAS SHOWCARD A IN FRONT OF
THEM]
Showcard A describes 5 aspects of a distributor‟s new connections service, including:
The timescale for provision of quotations for simple, low voltage new connections work
The timing of any new connections work
Contact for any new connections work
Time to complete simple, low voltage new connections work
The type of new connections service offered.
The first service aspect on Showcard A is “The timescale for provision of quotations for simple new
connections work”. Currently UK Power Networks is required to provide a quotation for simple new
connections work within 15 working days. This could be improved to within 10 working days, within 7
working days or to being provided on a date agreed by the customer.
Do you have any questions about this? [INTERVIEWER CHECK THAT RESPONDENT UNDERSTANDS. IF LESS
THAN 100% CLEAR, READ AGAIN. WHEN 100% CLEAR, CONTINUE]
[*] Please now read the rest of Showcard A yourself, and feel free to ask me any questions you may have
about any of the material on it.
[INTERVIEWER WAIT A FEW MOMENTS, THEN ASK:]
Would you like more time? [IF YES, ALLOW MORE TIME. IF NO, CONTINUE]
The next four questions will each ask you to choose between two packages of service levels. Some service
levels will be better in one option, and some will be better in the other. The aim of this exercise is to
encourage you to consider your preferences carefully and decide which is the best option in each situation.
You may not like all the parts of a package but you must decide overall which one you would prefer.
First look at Choice Card A1. [INTERVIEWER CHECK THAT RESPONDENT HAS CHOICE CARD A1 IN FRONT
OF THEM]
The 5 service areas from Showcard A are presented alongside two options for the level of service in each
case. Please take a moment to review these options. Please note that if a level is shaded it means that it is
worse than the alternative option shown; where neither the option A nor the option B level is shaded, this
means that both options are the same for that service.
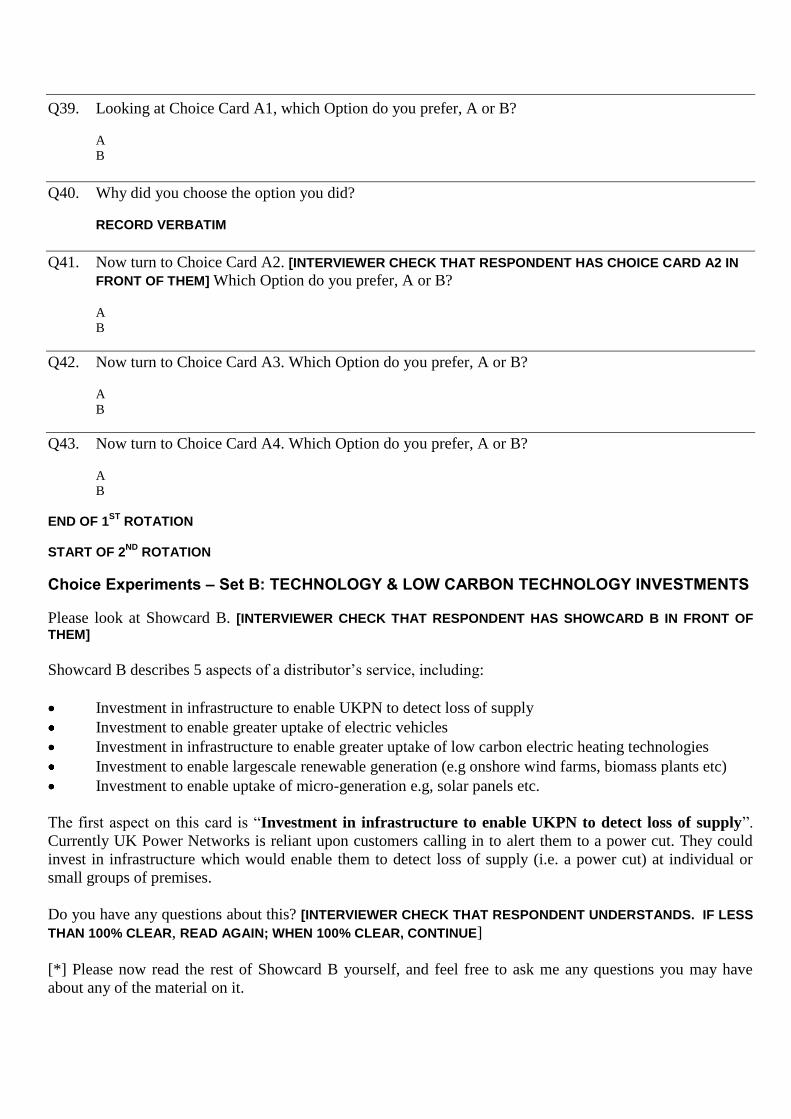
Q39. Looking at Choice Card A1, which Option do you prefer, A or B?
A
B
Q40. Why did you choose the option you did?
RECORD VERBATIM
Q41. Now turn to Choice Card A2. [INTERVIEWER CHECK THAT RESPONDENT HAS CHOICE CARD A2 IN
FRONT OF THEM] Which Option do you prefer, A or B?
A
B
Q42. Now turn to Choice Card A3. Which Option do you prefer, A or B?
A
B
Q43. Now turn to Choice Card A4. Which Option do you prefer, A or B?
A
B
END OF 1ST
ROTATION
START OF 2ND
ROTATION
Choice Experiments – Set B: TECHNOLOGY & LOW CARBON TECHNOLOGY INVESTMENTS
Please look at Showcard B. [INTERVIEWER CHECK THAT RESPONDENT HAS SHOWCARD B IN FRONT OF
THEM]
Showcard B describes 5 aspects of a distributor‟s service, including:
Investment in infrastructure to enable UKPN to detect loss of supply
Investment to enable greater uptake of electric vehicles
Investment in infrastructure to enable greater uptake of low carbon electric heating technologies
Investment to enable largescale renewable generation (e.g onshore wind farms, biomass plants etc)
Investment to enable uptake of micro-generation e.g, solar panels etc.
The first aspect on this card is “Investment in infrastructure to enable UKPN to detect loss of supply”.
Currently UK Power Networks is reliant upon customers calling in to alert them to a power cut. They could
invest in infrastructure which would enable them to detect loss of supply (i.e. a power cut) at individual or
small groups of premises.
Do you have any questions about this? [INTERVIEWER CHECK THAT RESPONDENT UNDERSTANDS. IF LESS
THAN 100% CLEAR, READ AGAIN; WHEN 100% CLEAR, CONTINUE]
[*] Please now read the rest of Showcard B yourself, and feel free to ask me any questions you may have
about any of the material on it.

[INTERVIEWER WAIT A FEW MOMENTS, THEN ASK:]
Would you like more time? [IF YES, ALLOW MORE TIME. IF NO, CONTINUE]
The next four questions will each ask you to choose between two packages of service levels. Some service
levels will be better in one option, and some will be better in the other. The aim of the exercise is to
encourage you to consider your preferences carefully and decide which is the best option in each situation.
You may not like all the parts of a package but you must decide overall which one you would prefer.
Please look at Choice Card B1. [INTERVIEWER CHECK THAT RESPONDENT HAS CHOICE CARD B1 IN FRONT
OF THEM]
The 5 service areas from Showcard B are presented alongside two options for the future level of service in
each case. Please take a moment to review these options. Please note that if a level is shaded it means that it
is worse than the alternative option shown; where neither the option A nor the option B level is shaded, this
means that both options are the same for that service.
Q44. Looking at Choice Card B1. Which Option do you prefer, A or B?
A
B
Q45. Why did you choose the option you did?
RECORD VERBATIM
Q46. Now turn to Choice Card B2. [INTERVIEWER CHECK THAT RESPONDENT HAS CHOICE CARD B2 IN
FRONT OF THEM] Which Option do you prefer, A or B? A
B
Q47. Now turn to Choice Card B3. Which Option do you prefer, A or B?
A
B
Q48. Now turn to Choice Card B4. Which Option do you prefer, A or B? A
B
END OF 2ND ROTATION
START OF 3
RD ROTATION
Choice Experiments – Set C: NETWORK RELIABILITY
Please look at Showcard C. [INTERVIEWER CHECK THAT RESPONDENT HAS SHOWCARD C IN FRONT OF
THEM]
Showcard C describes [FOR LPN SAY “4”; FOR EPN AND SPN SAY “5”] aspects of a distributor‟s service,
including:
frequency of power cuts over 3 mins
[DO NOT READ FOR LPN] time to restore 80% of affected rural customers for power cuts longer than
3 minutes
time to restore 80% of affected urban customers for power cuts longer than 3 minutes
information during a power cut
contingency services.
The first aspect on this Showcard is “frequency of power cuts over 3 mins”. Currently, the average number
of power cuts in your region is [FOR LPN INSERT “1 every 36 months”; FOR EPN INSERT “1 every 13
months”; FOR SPN INSERT “1 every 15 months”]. UK Power Networks could invest to reduce this to [FOR
LPN INSERT “1 every 42 months or 1 every 48 months”; FOR EPN INSERT “1 every 18 months or 1 every 24
months”; FOR SPN INSERT “1 every 18 months or 1 every 24 months”]..
Do you have any questions about this? [INTERVIEWER CHECK THAT RESPONDENT UNDERSTANDS. IF LESS
THAN 100% CLEAR, READ AGAIN. IF/WHEN 100% CLEAR, CONTINUE]
[*] Please now read the rest of Showcard C yourself, and feel free to ask me any questions you may have
about any of the material on it.
[INTERVIEWER WAIT A FEW MOMENTS, THEN ASK:]
Would you like more time? [IF YES, ALLOW MORE TIME. IF NO, CONTINUE]
The next four questions will each ask you to choose between two packages of service levels. Some service
levels will be better in one option, and some will be better in the other. The aim of the exercise is to
encourage you to consider your preferences carefully and decide which is the best option in each situation.
You may not like all the parts of a package but you must decide overall which one you would prefer.
Now look at Choice Card C1. [INTERVIEWER CHECK THAT RESPONDENT HAS CHOICE CARD C1 IN FRONT
OF THEM]
The [FOR LPN SAY “4”; FOR EPN AND SPN SAY “5”] service areas from Showcard C are presented alongside
two options for the future level of service in each case. Take a moment to review these options. Please note
that if a level is shaded it means that it is worse than the alternative option shown; where neither the option A
nor the option B level is shaded, this means that both options are the same for that service.
Q49. Looking at Choice Card C1. Which Option do you prefer, A or B?
A
B
Q50. Why did you choose the option you did?
RECORD VERBATIM

Q51. Now turn to Choice Card C2. [INTERVIEWER CHECK THAT RESPONDENT HAS CHOICE CARD C2 IN
FRONT OF THEM] Which Option do you prefer, A or B? A
B
Q52. Now turn to Choice Card C3. Which Option do you prefer, A or B?
A
B
Q53. Now turn to Choice Card C4. Which Option do you prefer, A or B?
A
B
END OF 3RD ROTATION
Choice Experiments – Package
In this fourth exercise I would like you to consider all of the factors that I have shown you in the first three
exercises. This will help us to understand how you value specific services across the entire package that could
be offered by your distributor.
In order to simplify the exercise, we have put the services into three groups, as presented in the previous
exercises, and the levels of services in each group will all move together. Each group is separated by a thick
black line.
We will also show you the associated change in your annual electricity bill year on year from 2015 to 2023.
Investment by UK Power Networks could maintain or improve service levels across all the areas shown.
Alternatively, by spending less in some areas, UK Power Networks will be able to spend more in others, or
reduce bills.
Please bear in mind when considering these choices that increased investment activity is required simply to
maintain services at their current level. This activity is undertaken to ensure that:
The distribution network continues to comply with relevant legislation
The distribution networks continues to operate safely
The overall condition and health of the distribution network does not deteriorate, which would otherwise
cause an increase in the number of power cuts experienced by customers.
When making your choices between the different service packages, please also bear in mind the following:
That your bill would also increase by the rate of inflation each year and by any increases imposed by
your electricity supplier
That any money you would pay for better service levels here will not be available for you to spend on
other things
That other household bills may go up or down affecting the amount of money you have to spend in
general; and
That the new bill level (from 2015) will also apply in all later years, from 2023 onwards, your bill will
not drop back to the level it was prior to the service improvement.

Please look at Choice Card P1. [INTERVIEWER CHECK THAT RESPONDENT HAS CHOICE CARD P1 IN FRONT
OF THEM]
There are [FOR LPN SAY “14”; FOR EPN & SPN SAY “15”] different service areas presented, plus the impact
on your electricity bill. As in the previous exercise, you are shown two different options. Please note that if a
level is shaded it means that it is worse than the alternative option shown; where neither the option A nor the
option B level is shaded, this means that both options are the same for that service group.
Take a moment to review these options.
Q54. Looking at Choice Card P1. Which Option do you prefer, A or B?
A
B
Q55. Why did you choose the option you did?
RECORD VERBATIM
Q56. Now turn to Choice Card P2. Which Option do you prefer, A or B?
A
B
Q57. Now turn to Choice Card P3. Which Option do you prefer, A or B?
A
B
Q58. Now turn to Choice Card P4. Which Option do you prefer, A or B?
A
B
Q59. Now turn to Choice Card P5. Which Option do you prefer, A or B?
A
B
Q60. Now turn to Choice Card P6. Which Option do you prefer, A or B?
A
B GO TO Q61
Q61. Keep looking at Choice Card P6. The cost of providing Option B on this card is not fully determined
at this stage. If the cost of Option B was £X(-) each year for 8 years, from £X in 2015 to £X in 2023,
would you still choose Option A or would you now choose Option B? [SKIP Q61]
A
B
Q62. Keep looking at Choice Card P6. The cost of providing Option B on this card is not fully determined
at this stage. If the cost of Option B was an increase of £X(+) each year for 8 years, from £X in 2015
to £X in 2023, would you still choose Option B or would you now choose Option A?
A
B
Follow-up Questions
I would now like to ask you a few questions about the choices you have just made.
Q63. Did you feel able to make comparisons between the choices I presented to you?
1. Yes GO TO Q64
2. No
Q64. Why weren‟t you able to make the comparisons in the choices?
Q65. In the choices, did you find each of the levels of service we described realistic & easy to understand?
1. Yes GO TO Q67 2. No
Q66. Which levels did you feel were not realistic or easy to understand?
Demographics
Q67. Which of these statements best describes your current employment status?
Self employed 1
Employed full-time (30+ hrs) 2
Employed part-time (up to 30 hrs) 3
Student 4
Unemployed – seeking work 5
Unemployed – other 6
Looking after the home/children full-time 7
Retired 8
Unable to work due to sickness or disability 9
Other (please specify)
Q68. Thinking about all the people in your household, including yourself, please indicate how many people
there in each age group
Up to 15 years ........................................0................. 1 .............. 2 ............... 3 ............... 4 .............. 5+
16 to 60 years ........................................0................. 1 .............. 2 ............... 3 ............... 4 .............. 5+
61+ .........................................................0................. 1 .............. 2 ............... 3 ............... 4 .............. 5+

Q69. Would you describe the area that you live in as… READ OUT
Remote rural
Rural
Semi rural
Urban
Q70. To help us analyse your responses can you tell me which band on SHOWCARD D best describes your
total annual household income, before tax and other deductions?
Per Week
Per Year Up to £100 Under £5,200
£101-£200 £5,201-£10,400
£201-£300 £10,401 – £15,600
£301-£400 £15,601 - £20,800
£401-£500 £20,801,-£26,000
£501-£600 £26,001-£31,200
£601-£800 £31,201-£41,600
£801-£1000 £41,601 - £52,000
£1001-£1200 £52,001 - £62,400
£1201-£1400 £62,401 - £72,800
£1401-£1600 £72,801 - £83,200
More than £1601 More than £83,201
Prefer not to say
Q71. We really appreciate the time that you have given us today. Would you be willing to be contacted
again for clarification purposes or be invited to take part in other research for UK Power Networks?
Yes, for both clarification and further research
Yes, for clarification only
Yes, for further research only
No
That was the last question. Thank you very much for your help in this research Please can I take a note of your name and telephone number for quality control purposes?
Respondent name: .................................................................................................................
Telephone: home: .............................................. work: ...............................................
Thank you I confirm that this interview was conducted under the terms of the MRS code of conduct and is completely
confidential
Interviewer‟s signature: ................................................................................................................

Debriefing Questions – to be completed by the interviewer when interview is over
Q72. In your judgement, did the respondent understand what he/she was being asked to do in the questions?
Did not understand at all
Did not understand very much
Understood a little
Understood a great deal
Understood completely
Q73. Which of the following best describes the amount of thought the respondent put into making their
choices?
Gave the questions very careful consideration
Gave the questions careful consideration
Gave the questions some consideration
Gave the questions little consideration
Gave the questions no consideration
Q74. Which of the following best describes the degree of fatigue shown by the respondent when doing the
choice experiments?
Easily maintained concentration throughout the survey
Maintained concentration with some effort throughout the survey
Maintained concentration with a deal of effort throughout the survey
Lessened concentration in the later stages
Lost concentration in the later stages

APPENDIX C
Domestic Showcards


SHOWCARD A: NEW CONNECTIONS WORK
Timescale for provision of quotations for simple, low voltage new connections work:
Currently UK Power Networks is required to provide a quotation for simple new
connections work within 15 working days. They could invest to improve this to within
10 working days, within 7 working days or to being provided on a date agreed by the
customer.
Simple new connections work refers to making up to 4 domestic (100amp) connections.
It will involve the provision of a service cable from the electricity main cable to the
property and the subsequent testing and energisation of this cable. Typically the
electricity main cable is a relatively short distance from the new property (up to 10s of
metres).
Timing of any new connections work:
New connections work is currently undertaken in normal business hours, i.e. between
8.00am and 5pm. They could invest to enable work to be undertaken in the evening or
at weekends if preferred, or within a banded time (i.e. morning, afternoon or evening) in
normal business hours, evenings or at weekends.
Contact for any new connections work:
Currently, contact for new connections work is made via telephone or e-mail to a
general call centre. UK Power Networks could invest to enable contact for new
connections to be made by phone or email to a dedicated new connections call centre, a
named co-ordinator or through an on-line web portal.
Time to complete simple, low voltage new connections work
Currently UK Power Networks is required to complete low voltage new connections
work within 90 days. They could invest to improve this to within 60 days, within 30
days or within 15 days.
Type of new connections service offered:
UK Power Networks currently offers a standard new connections service, where they
define what elements they will do and what activities must be done by the customer's
builder or electrician.
However, UK Power Networks could broaden the range of services it offers to include
those typically undertaken by the customer‟s builder or electrician and allow the
customer to decide what they wanted to commission from UK Power Networks.
Alternatively, UK Power Networks could undertake all elements of the work so that the
customer does not have to worry about commissioning any other supplier.

SHOWCARD B: TECHNOLOGY & LOW CARBON TECHNOLOGY INVESTMENTS
Investment in infrastructure to enable UKPN to detect loss of supply:
Currently UK Power Networks is reliant upon customers calling in to alert them to a
power cut. They could invest in infrastructure which would enable them to detect loss of
supply (i.e. a power cut) at individual or small groups of premises.
Investment to enable greater uptake of electric vehicles:
UK Power Networks is not currently making any specific investments in infrastructure
to support the uptake of electric vehicles. They could invest ahead of need to support
the take up of electric vehicles.
Investment in infrastructure to enable greater uptake of low carbon electric heating technologies:
Similarly, UK Power Networks is not currently making any specific investments in
infrastructure to support the take up of low carbon electric heating technologies. These
could include more efficient radiators, air source heat pumps or ground source heat
pumps for example:
- an air source heat pump is a low carbon technology that replaces an existing heating
system. Rather than burning fuel to produce heat, it uses electricity to absorb heat from
the outside air
- a ground source heat pump is a low carbon technology that replaces an existing
heating system. Rather than burning fuel to produce heat, it uses electricity to pump
liquid around plastic tubes in the ground, to extract the heat stored there.
They could invest ahead of need to support the take up of low carbon electric heating
technologies.
Investment to enable largescale renewable generation:
UK Power Networks is not currently making any specific investments in infrastructure
to support the growth of largescale renewable generation; each new connection is
currently charged at cost. They could invest in network technologies which would allow
cheaper and quicker connection of new low carbon generators of electricity such as
onshore wind farms or biomass plants.
Investment to enable uptake of micro-generation:
UK Power Networks is not currently making any specific investments in infrastructure
to support the take up of home-based micro-generation technologies; rather, they invest
as needed. They could invest in infrastructure ahead of need to support the uptake of
micro-generation technologies such as solar panels or wind turbines etc.

SHOWCARD C: NETWORK RELIABILITY Frequency of power cuts over 3 mins - average number:
Currently, the average number of power cuts in your region is 1 every 13 months. UK
Power Networks could invest to reduce this to 1 in every 18 months or 1 in every 24
months.
Time to restore 80% of affected rural customers for power cuts longer than 3 minutes:
Currently UK Power Networks restores 80% of customers in rural areas who have been
affected by a cut within an average of 180 minutes of being made aware of the cut.
They could invest to reduce this to within 120 minutes or within 60 minutes.
Time to restore 80% of affected urban customers for power cuts longer than 3 minutes:
Currently UK Power Networks restores 80% of customers in urban areas who have been
affected by a cut within an average of 20 minutes of being made aware of the cut. They
could invest to reduce this to within 10 minutes or, alternatively, the average time to
restore them could be worsened to within 60 minutes or within 180 minutes in return for
a lower bill.
Information during a power cut:
Currently customers can get information about a power cut by contacting UK Power
Network‟s call centre. They could invest to offer other means of getting information on
a cut, including:
provision of automatic text messages to registered customers (i.e. customers that
provided their mobile phone details when they contacted the call centre) with details
of power cut and updates
provision of automatic update calls to customer from the call centre and a follow-up
call when the power cut is over
provision of additional information services such as real-time information on the
internet, use of social media, customer service staff „knocking on doors‟ etc.
Contingency services
It is currently the responsibility of customers to provide themselves with any back-up
services, such as a generator, in the event of a power cut. UK Power Networks could
provide services in this area, including:
the provision of generator hire e.g. for an event
provision of back-up services to customers e.g. regular testing of customer-owned
generators and back-up systems.

SHOWCARD D
Per Week
Per Year
1 Up to £100 Under £5,200
2 £101-£200 £5,201-£10,400
3 £201-£300 £10,401 – £15,600
4 £301-£400 £15,601 - £20,800
5 £401-£500 £20,801,-£26,000
6 £501-£600 £26,001-£31,200
7 £601-£800 £31,201-£41,600
8 £801-£1000 £41,601 - £52,000
9 £1001-£1200 £52,001 - £62,400
10 £1201-£1400 £62,401 - £72,800
11 £1401-£1600 £72,801 - £83,200
12 More than £1601 More than £83,201

APPENDIX D
Business Questionnaire

Interviewer name: Date: Time:
Good morning/afternoon. My name is ....... Please could I speak to whoever is responsible for paying your
organisation‟s electricity bills or for liaising with your electricity distributor (for example, in the event of a
power cut, to arrange a new connection etc)? (WHEN SPEAKING TO APPROPRIATE CONTACT CONTINUE WITH
EXPLANATION)
My name is ....... from Accent, an independent research consultancy, and we are carrying out an important
research study for your electricity distribution company, UK Power Networks, to investigate what is most
important to business customers and what they would like the company to invest in the coming years. This is
a bona fide market research exercise. It is being conducted under the Market Research Society Code of
Conduct which means that any answers you give will be treated in confidence. Could you please spare a
couple of minutes to see if you are the type of customer we need to speak to for this research?
Q1. dummy: insert company name from sample
UKPN LPN
UKPN EPN
EKPN SPN
Q2. Do you or any of your close family work or have worked in the past in any of the following professions:
marketing, advertising, public relations, journalism, market research or the energy sector?
Yes THANK & CLOSE No
Q3. How much is your site‟s annual electricity bill? INTERVIEWER NOTE: IF THEY KNOW THEIR MONTHLY AMOUNT, PLEASE MULTIPLY BY 12.
£ ..........................................................................................................................................................
Don‟t know ASK IF THEY CAN GIVE A GOOD ESTIMATE; ELSE THANK & CLOSE
Q4. How many people are employed by your company at this site? READ OUT BANDS IF NECESSARY
Less than 10 SMALL BUSINESS
10-49 SMALL BUSINESS
50-149 MEDIUM BUSINESS
150-249 MEDIUM BUSINESS
250 or more LARGE BUSINESS
CHECK QUOTAS
2440 UK Power Networks Willingness to Pay
Final Business Mainstage Questionnaire
Recruitment Section – Client Supplied Sample

Q5. And what business sector best defines the core activity of your company?
Agriculture
Food, Drink & Tobacco
Other Manufacturing
Banking, Finance, Transport & Distribution
Hotel, catering & Camp sites
Education & Health
Government & Defence
Other Services
Other SPECIFY
IF IN SCOPE PROCEED ELSE THANK & CLOSE
Thank you for answering those questions. As I mentioned, we are carrying out an important research study for
UK Power Networks to investigate what is most important to their business customers and what their
priorities are for the company for the coming years.
Your organisation is in scope for this research and I would be very grateful if you could spare another 20-25
minutes – either now or at a more convenient time – to run through some questions with me. You need to
have some materials in front of you which I can email to you right now so that we can continue with the
interview (INTERVIEWER: completing the interview real time must be your preferred option at all times).
email now SEND EMAIL THEN PROCEED
cannot continue with interview now SEND EMAIL THEN RECORD APPOINTMENT ON NEXT SCREEN
do not have access to email BRING UP APPOINTMENT/ADDRESS BOX
no ATTEMPT TO REASSURE & PERSUADE; IF STILL NO, THANK & CLOSE
IF CODE 1 OR 2 ABOVE, ELSE SKIP: What name shall I send these documents to. We are happy even with a
first name here if you want; this is only to address you at the start of the email.
INTERVIEWER: NAME IS CORRECT - ID from sample
enter new name
Thank you. We can either do the interview now/in a few seconds, once you have received that, or at a later
time today if that is more convenient to you.
Now
Later EMAIL SENT. PLEASE CLICK AND RECORD APPOINTMENT
Introduction to Main Survey Thank you for agreeing to take part in this survey on behalf of UK Power Networks. This interview is about
electricity distribution rather than supply; it is not about the company that you pay the bill to. If you look at
Showcard 1 this explains the electricity supply chain for you. They are the ones who are responsible for the
wires and cables; they are also responsible for:
restoring the power supply if there is a power cut
operating an emergency telephone line for any problems with power related issues
connecting customers to their local network
ensuring the right voltage gets to business and consumers
investigating any complaints or problems that customers have regarding their electricity distribution
service.
The questionnaire will take 20-25 minutes. You do not have to answer questions you do not wish to and you
can terminate the interview at any point.

Can I check you have your materials ready to refer to? These will have either been sent in the post, sent by
email or faxed to you. And what is the reference number on the materials? INTERVIEWER: CHECK THE
NUMBER IS CORRECT AND PROCEED OR RE-SCHEDULE AS APPROPRIATE.
Correct – PROCEED
Incorrect – GOT TO APPOINTMENTS SCREEN AND RE-SCHEDULE, RE-SENDING MATERIALS
Background Questions Q6. DP - DO NOT ASK: INPUT FROM SCREENER Q1:
UKPN LPN
UKPN EPN
EKPN SPN
Q7. DP - DO NOT ASK: INPUT FROM SCREENER Q3
£ ..........................................................................................................................................................
Q8. DP - DO NOT ASK: INPUT FROM SCREENER Q4:
Less than 10 SMALL BUSINESS
10-49 SMALL BUSINESS
50-149 MEDIUM BUSINESS
150-249 MEDIUM BUSINESS
250 or more LARGE BUSINESS
Q9. DP - DO NOT ASK: INPUT FROM SCREENER Q5:
Agriculture
Food, Drink & Tobacco
Other Manufacturing
Banking, Finance, Transport & Distribution
Hotel, catering & Camp sites
Education & Health
Government & Defence
Other Services
Other
Q10. DUMMY2: DP CALCULATE 18% OF Q7 VALUE
Q11. Previously you told me that your annual electricity bill is [INSERT RESPONSE FROM VALUE CODE AT
Q7].
ASK ALL: Roughly 18% of this, ie [DP INSERT FROM Q10] goes to your electricity distributor; the rest
is distributed as shown in Showcard 2, ie the company that you pay your bills to. Given what we have
told you about the role of the distributor, how do you feel about the amount that goes towards your
distributor? Is it …
Too little
About right
Slightly too much
Far too much
Customer Experiences
Q12. Has your business experienced any unplanned power cuts lasting more than 3 minutes (that is, any that
you were not warned about) at this site in the last year?

Yes
No
Can‟t remember
Q13. IF NO AT Q12 ASK, ELSE GO TO Q15: Has your business experienced any unplanned power cuts
lasting more than 3 minutes (that is, any that you were not warned about) at this site in the last 5
years?
Yes
No
Can‟t remember
Q14. IF NO AT Q13 ASK, ELSE GO TO Q15: Has your business experienced any unplanned power cuts
lasting more than 3 minutes at this site in the last 10 years?
Yes
No
Can‟t remember
Q15. IF „YES‟ IN Q12 OR Q13 OR Q14 ASK; ELSE GO TO Q22. How many of these unplanned cuts have you
had in the last [INSERT “year” IF Q12 = 1; INSERT “5 years” IF Q13 = 1 OR INSERT “10 years” IF Q14 =
1] at this site?
Q16. On the last occasion that you had an unplanned power cut in excess of 3 minutes at this site, how long
did it last? INTERVIEWER: RECORD IN MINUTES (EG 1 HOUR = 60, 2 HOURS = 120 ETC); ENTER
NUMBER OF 999 FOR DON‟T KNOW
Q17. Who, if anybody, did you contact on the last occasion your business experienced a power cut?
Supplier
Distributor
Both supplier and distributor
No one
Don‟t know/can‟t remember
Q18. IF 2 OR 3 IN Q17; OTHERS GO TO Q22. Did you manage to get through to either an operator or a
recorded message at your distributor?
Yes , operator
Yes, recorded message
Yes, both
No
Don‟t know/can‟t remember
Q19. IF LE 3 IN Q18 ASK; OTHERS GO TO Q21. Did you get all the information you wanted when you made
the call to your distributor?
Yes
No
Don‟t know/can‟t remember
Q20. Using a scale of 1 to 5, where 5 is very accurate and 1 is very inaccurate, how accurate would you say
the information you were given was?
5: Very accurate
4: Quite accurate
3: Neither accurate nor inaccurate
2: Quite inaccurate

1: Very inaccurate
Q21. ASK ALL Has your distributor ever contacted you or called you back during an unplanned power cut?
Yes
No
Don‟t know
Q22. Where your distributor is aware of a power cut affecting an area, would you like to receive
information about the cut via an automatic contact via text or phone call, or are you content simply to
call the call centre if you need information?
Yes, would like call
Yes, would like text
Yes would like both
No, neither
Maybe SPECIFY, IE WHY DO THEY SAY THAT?
Don‟t know
Q23. Where your distributor has information about a power cut they will usually prepare a recorded
message for callers to listen to when they make contact about the cut. Is your preference to stay on the
line to speak with an advisor after hearing the recorded message, or would you hang up after hearing
it?
Stay online
Hang up
Depends SPECIFY, IE WHY DO THEY SAY THAT?
Don‟t know
Q24. IF THEY SAY “STAY ONLINE” OR “DEPENDS” AT Q23 ASK, ELSE GO TO Q25: What is an acceptable
time to wait to speak to an advisor after hearing a recorded message? RECORD IN SECONDS AND/OR
MINUTES
CAN WE HAVE TWO BOXES, ONE FOR MINUTES, ONE FOR SECONDS?
Q25. In the event of a power cut, how likely would you be, as a business, to visit a UK Power Networks (ie
your distributor‟s) webpage?... mobile app? Please use a scale of 1 to 5, where 1 is very unlikely, 2 is
quite unlikely, 3 is neither likely nor unlikely, 4 is quite likely and 5 is very likely?
Very Quite Neither likely Quite Very Don‟t
unlikely unlikely nor unlikely likely likely know
webpage .................................................1................. 2 .............. 3 ............... 4 ............... 5 ............... 6
mobile app .............................................1................. 2 .............. 3 ............... 4 ............... 5 ............... 6
Q26. Would you be interested, as a business, in receiving reports on, and updates about, power cuts via
social media such as Twitter or Facebook?
Yes
No
Maybe
Don‟t know
Q27. Again, thinking about the event of a power cut, when a cut occurred would you like staff, or an
engineer, from UK Power Networks to come to your premises and explain the reason for the fault?
Yes
No
Don‟t know

Q28. Would you value them doing so once the power was restored?
Yes
No
Don‟t know
Q29. Have you ever experienced a power cut due to severe weather (eg a major storm or flooding) or due to
any other emergency or unforeseen event (for example, an unforeseen attack on the network or theft of
cables) at this site? MULTICODE
Yes, severe weather
Yes, attack
Yes, cable theft
Yes, reason unknown
No
Don‟t know
Q30. ASK IF Q29=1, ELSE GO TO Q31: Specifically, have you ever experienced a power cut at this site due
to flooding affecting an electricity substation?
Yes
No
Don‟t know
Q31. ASK IF Q29=1 OR 2 OR 3 OR 4, ELSE GO TO Q32: And did you contact your distributor when this
occurred?
Yes
No
Can‟t remember
Q32. IF YES AT Q31 ASK, ELSE GO TO Q33: Using a scale of 1 to 5, where 5 equals very well and 1 equals
very poorly how well do you feel that your distributor dealt with the fault that resulted from this
severe event?
5: very well
4: quite well
3: neither well nor poorly
2: quite poorly
1: very poorly
Q33. Has your business ever suffered inconvenience as a result of roadworks caused by UK Power
Networks or another utility (ie your water company)?
Yes, UKPN
Yes, other utility
Yes, organisation unknown
No
Don‟t know
Q34. ASK IF Q33=1 OR 2 OR 3, ELSE GO TO Q35: How inconvenient was the work to your business? Please
use a scale of 1 to 3, where 3 is extremely inconvenient and 1 is quite, or moderately, inconvenient.
3: Extremely inconvenient
2: Very inconvenient
1: Quite or moderately inconvenient

Q35. And has your organisation ever had to contact your distributor to get a quote for a new electricity
connection?
Yes
No
Don‟t know
Q36. IF YES TO Q35 ASK, ELSE GO TO Q37: And did they undertake the new connection for you? ie was the
work completed?
Yes
No
Don‟t know/can‟t remember
Q37. Which of the following best describes your organisation‟s attitude towards the environment, or how
“green” you consider your organisation to be?
I think we are very green; we care about the environment: we use energy efficiently and recycle whatever we can
I think we are quite green; we care about the environment, but we could recycle more and do more to reduce our energy
usage
We are not very green; we take some, but not much, interest in the environment
We are not at all green; we don‟t care about the environment, other things are more important
Choice Experiment Intro
We are now going to go through a set of choices between service levels your organisation could experience
from your distributor. START OF 1ST ROTATION
Choice Experiments: Set A
Please look at ShowcardA. [INTERVIEWER CHECK THAT RESPONDENT HAS SHOWCARD A IN FRONT OF
THEM]
Showcard A describes 5 aspects of a distributor‟s service, including:
The timescale for provision of quotations for simple, low voltage new connections work
The timing of any new connections work
Contact for any new connections work
Time to complete simple, low voltage new connections work
The type of new connections service offered.
The first service aspect on Showcard A is “The timescale for provision of quotations for simple new
connections work”. Currently UK Power Networks is required to provide a quotation for simple new
connections work within 15 working days. This could be improved to within 10 working days, within 7
working days or to being provided on a date agreed by the customer.
Do you have any questions about this? [INTERVIEWER CHECK THAT RESPONDENT UNDERSTANDS. IF LESS
THAN 100% CLEAR, READ AGAIN. WHEN 100% CLEAR, CONTINUE]
[*] Please now read the rest of Showcard A yourself, and feel free to ask me any questions you may have
about any of the material on it.

[INTERVIEWER WAIT A FEW MOMENTS, THEN ASK:]
Would you like more time? [IF YES, ALLOW MORE TIME. IF NO, CONTINUE]
The next four questions will each ask you to choose between two packages of service levels. Some service
levels will be better in one option, and some will be better in the other. The aim of this exercise is to
encourage you to consider your preferences carefully and decide which is the best option in each situation.
You may not like all the parts of a package but you must decide overall which one you would prefer for your
business premises.
First look at Choice Card A1. [INTERVIEWER CHECK THAT RESPONDENT HAS CHOICE CARD A1 IN FRONT
OF THEM]
The 5 service areas from Showcard A are presented alongside two options for the level of service in each
case. Please take a moment to review these options. Please note that if a level is shaded it means that it is
worse than the alternative option shown; where neither the option A nor the option B level is shaded, this
means that both options are the same for that service.
Q38. Looking at Choice Card A1, which Option do you prefer for your business premises, A or B?
A
B
Q39. Why did you choose the option you did?
RECORD VERBATIM
Q40. Now turn to Choice Card A2. [INTERVIEWER CHECK THAT RESPONDENT HAS CHOICE CARD A2 IN
FRONT OF THEM] Which Option do you prefer for your business premises, A or B?
A
B
Q41. Now turn to Choice Card A3. Which Option do you prefer for your business premises, A or B?
A
B
Q42. Now turn to Choice Card A4. Which Option do you prefer for your business premises, A or B?
A
B
END OF 1ST
ROTATION
START OF 2ND
ROTATION
Choice Experiments – Set B
Please look at Showcard B. [INTERVIEWER CHECK THAT RESPONDENT HAS SHOWCARD B IN FRONT OF
THEM]
Showcard B describes 5 aspects of a distributor‟s service, including:
Investment in infrastructure to enable UKPN to detect loss of supply
Investment to enable greater uptake of electric vehicles
Investment in infrastructure to enable greater uptake of low carbon electric heating technologies
Investment to enable largescale renewable generation (e.g onshore wind farms, biomass plants etc)
Investment to enable uptake of micro-generation e.g, solar panels etc.
The first aspect on this card is “Investment in infrastructure to enable UKPN to detect loss of supply”.
Currently UK Power Networks is reliant upon customers calling in to alert them to a power cut. They could
invest in infrastructure which would enable them to detect loss of supply (i.e. a power cut) at individual or
small groups of premises.
Do you have any questions about this? [INTERVIEWER CHECK THAT RESPONDENT UNDERSTANDS. IF LESS
THAN 100% CLEAR, READ AGAIN; WHEN 100% CLEAR, CONTINUE]
[*] Please now read the rest of Showcard B yourself, and feel free to ask me any questions you may have
about any of the material on it.
[INTERVIEWER WAIT A FEW MOMENTS, THEN ASK:]
Would you like more time? [IF YES, ALLOW MORE TIME. IF NO, CONTINUE]
The next four questions will each ask you to choose between two packages of service levels. Some service
levels will be better in one option, and some will be better in the other. The aim of the exercise is to
encourage you to consider your preferences carefully and decide which is the best option in each situation for
your business premises. You may not like all the parts of a package but you must decide overall which one
you would prefer.
Please look at Choice Card B1. [INTERVIEWER CHECK THAT RESPONDENT HAS CHOICE CARD B1 IN FRONT
OF THEM]
The 5 service areas from Showcard B are presented alongside two options for the future level of service in
each case. Please take a moment to review these options. Please note that if a level is shaded it means that it
is worse than the alternative option shown; where neither the option A nor the option B level is shaded, this
means that both options are the same for that service.
Q43. Looking at Choice Card B1. Which Option do you prefer for your business premises, A or B?
A
B
Q44. Why did you choose the option you did?
RECORD VERBATIM
Q45. Now turn to Choice Card B2. [INTERVIEWER CHECK THAT RESPONDENT HAS CHOICE CARD B2 IN
FRONT OF THEM] Which Option do you prefer for your business premises, A or B? A
B
Q46. Now turn to Choice Card B3. Which Option do you prefer, A or B?
A
B

Q47. Now turn to Choice Card B4. Which Option do you prefer, A or B? A
B
END OF 2ND ROTATION
START OF 3
RD ROTATION
Choice Experiments – Set C
Please look at Showcard C. [INTERVIEWER CHECK THAT RESPONDENT HAS SHOWCARD C IN FRONT OF
THEM]
Showcard C describes [FOR LPN SAY “4”; FOR EPN AND SPN SAY “5”] aspects of a distributor‟s service,
including:
frequency of power cuts over 3 mins
[DO NOT READ FOR LPN] time to restore 80% of affected rural customers for power cuts longer than
3 minutes
time to restore 80% of affected urban customers for power cuts longer than 3 minutes
information during a power cut
contingency services.
The first aspect on this Showcard is “frequency of power cuts over 3 mins”. Currently, the average number
of power cuts in your region is [FOR LPN INSERT “1 every 36 months”; FOR EPN INSERT “1 every 13
months”; FOR SPN INSERT “1 every 15 months”]. UK Power Networks could invest to reduce this to [FOR
LPN INSERT “1 every 42 months or 1 every 48 months”; FOR EPN INSERT “1 every 18 months or 1 every 24
months”; FOR SPN INSERT “1 every 18 months or 1 every 24 months”].
Do you have any questions about this? [INTERVIEWER CHECK THAT RESPONDENT UNDERSTANDS. IF LESS
THAN 100% CLEAR, READ AGAIN. IF/WHEN 100% CLEAR, CONTINUE]
[*] Please now read the rest of Showcard C yourself, and feel free to ask me any questions you may have
about any of the material on it.
[INTERVIEWER WAIT A FEW MOMENTS, THEN ASK:]
Would you like more time? [IF YES, ALLOW MORE TIME. IF NO, CONTINUE]
The next four questions will each ask you to choose between two packages of service levels. Some service
levels will be better in one option, and some will be better in the other. The aim of the exercise is to
encourage you to consider your preferences carefully and decide which is the best option in each situation for
your business premises. You may not like all the parts of a package but you must decide overall which one
you would prefer.
Now look at Choice Card C1. [INTERVIEWER CHECK THAT RESPONDENT HAS CHOICE CARD C1 IN FRONT
OF THEM]
The [FOR LPN SAY “4”; FOR EPN AND SPN SAY “5”] service areas from Showcard C are presented alongside
two options for the future level of service in each case. Take a moment to review these options. Please note
that if a level is shaded it means that it is worse than the alternative option shown; where neither the option A
nor the option B level is shaded, this means that both options are the same for that service.

Q48. Looking at Choice Card C1. Which Option do you prefer for your business premises, A or B?
A
B
Q49. Why did you choose the option you did?
RECORD VERBATIM
Q50. Now turn to Choice Card C2. [INTERVIEWER CHECK THAT RESPONDENT HAS CHOICE CARD C2 IN
FRONT OF THEM] Which Option do you prefer for your business premises, A or B? A
B
Q51. Now turn to Choice Card C3. Which Option do you prefer, A or B?
A
B
Q52. Now turn to Choice Card C4. Which Option do you prefer, A or B?
A
B
END OF 3RD ROTATION
Choice Experiments – Package
In this fourth exercise I would like you to consider all of the factors that I have shown you in the first three
exercises. This will help us to understand how your business values specific services across the entire package
that could be offered by your distributor.
In order to simplify the exercise, we have put the services into three groups, as presented in the previous
exercises, and the levels of services in each group will all move together. Each group is separated by a thick
black line.
We will also show you the associated change in your site‟s annual electricity bill year on year from 2015 to
2023.
Investment by UK Power Networks could maintain or improve service levels across all the areas shown.
Alternatively, by spending less in some areas, UK Power Networks will be able to spend more in others, or
reduce bills.
Please bear in mind when considering these choices that increased investment activity is required simply to
maintain services at their current level. This activity is undertaken to ensure that:
The distribution network continues to comply with relevant legislation,
The distribution networks continues to operate safely
The overall condition and health of the distribution network does not deteriorate, which would otherwise
cause an increase in the number of power cuts experienced by customers.
When making your choices between the different service packages, please also bear in mind the following:

That your bill would also increase by the rate of inflation each year and by any increases imposed by
your electricity supplier
That any money you would pay for better service levels here will not be available for your business to
spend on other things
That other business bills may go up or down affecting the amount of money you have to spend in
general; and
That the new bill level (from 2015) will also apply in all later years, from 2023 onwards, your bill will
not drop back to the level it was prior to the service improvement.
Please look at Choice Card P1. [INTERVIEWER CHECK THAT RESPONDENT HAS CHOICE CARD P1 IN FRONT
OF THEM]
There are [FOR LPN SAY “14”; FOR EPN & SPN SAY “15”] different service areas presented, plus the impact
on your site‟s electricity bill. As in the previous exercise, you are shown two different options. Please note
that if a level is shaded it means that it is worse than the alternative option shown; where neither the option A
nor the option B level is shaded, this means that both options are the same for that service group.
Take a moment to review these options.
Q53. Looking at Choice Card P1. Which Option do you prefer for your business premises, A or B?
A
B
Q54. Why did you choose the option you did?
RECORD VERBATIM
Q55. Now turn to Choice Card P2. Which Option do you prefer for your business premises, A or B?
A
B
Q56. Now turn to Choice Card P3. Which Option do you prefer, A or B?
A
B
Q57. Now turn to Choice Card P4. Which Option do you prefer, A or B?
A
B
Q58. Now turn to Choice Card P5. Which Option do you prefer, A or B?
A
B
Q59. Now turn to Choice Card P6. Which Option do you prefer, A or B?
A
B GO TO Q61

Q60. Keep looking at Choice Card P6. The cost of providing Option B on this card is not fully determined
at this stage. If the cost of Option B was £X(-) each year for 8 years, from £X in 2015 to £X in 2023,
would you still choose Option A or would you now choose Option B? [SKIP Q61]
A
B
Q61. Keep looking at Choice Card P6. The cost of providing Option B on this card is not fully determined
at this stage. If the cost of Option B was an increase of £X(+) each year for 8 years, from £X in 2015
to £X in 2023, would you still choose Option B or would you now choose Option A?
A
B
Follow-up Questions
I would now like to ask you a few questions about the choices you have just made.
Q62. Did you feel able to make comparisons between the choices I presented to you?
1. Yes GO TO Q64
2. No
Q63. Why weren‟t you able to make the comparisons in the choices?
Q64. In the choices, did you find each of the levels of service we described realistic & easy to understand?
1. Yes GO TO Q66 2. No
Q65. Which levels did you feel were not realistic or easy to understand?

Demographics
Q66. Finally, to help us analyse your responses, can you please tell me how many employees there are at
your business premises?
1. 0 – 4
2. 5 – 9
3. 10 - 19
4. 20 - 49
5. 50 - 99
6. 100 - 249
7. 250 - 499
8. 500 - 999
9. 1,000 +
10. Don‟t know/not stated
Q67. We really appreciate the time that you have given us today. Would you be willing to be contacted
again for clarification purposes or be invited to take part in other research for UK Power Networks?
Yes, for both clarification and further research
Yes, for clarification only
Yes, for further research only
No
That was the last question. Thank you very much for your help in this research Please can I take a note of your name and telephone number for quality control purposes?
Respondent name: .................................................................................................................
Telephone: home: .............................................. work: ...............................................
Thank you I confirm that this interview was conducted under the terms of the MRS code of conduct and is completely
confidential
Interviewer‟s signature: ................................................................................................................

Debriefing Questions – to be completed by the interviewer when interview is over
Q68. In your judgement, did the respondent understand what he/she was being asked to do in the questions?
Did not understand at all
Did not understand very much
Understood a little
Understood a great deal
Understood completely
Q69. Which of the following best describes the amount of thought the respondent put into making their
choices?
Gave the questions very careful consideration
Gave the questions careful consideration
Gave the questions some consideration
Gave the questions little consideration
Gave the questions no consideration
Q70. Which of the following best describes the degree of fatigue shown by the respondent when doing the
choice experiments?
Easily maintained concentration throughout the survey
Maintained concentration with some effort throughout the survey
Maintained concentration with a deal of effort throughout the survey
Lessened concentration in the later stages
Lost concentration in the later stages

APPENDIX E
Business Showcards


SHOWCARD A: NEW CONNECTIONS WORK
Timescale for provision of quotations for simple, low voltage new connections work:
Currently UK Power Networks is required to provide a quotation for simple new connections
work within 15 working days. They could invest to improve this to within 10 working days,
within 7 working days or to being provided on a date agreed by the customer.
Simple new connections work refers to making up to 4 domestic (100amp) connections. It
will involve the provision of a service cable from the electricity main cable to the property
and the subsequent testing and energisation of this cable. Typically the electricity main cable
is a relatively short distance from the new property (up to 10s of metres).
Timing of any new connections work:
New connections work is currently undertaken in normal business hours, i.e. between 8.00am
and 5pm. They could invest to enable work to be undertaken in the evening or at weekends if
preferred, or within a banded time (i.e. morning, afternoon or evening) in normal business
hours, evenings or at weekends.
Contact for any new connections work:
Currently, contact for new connections work is made via telephone or e-mail to a general call
centre. UK Power Networks could invest to enable contact for new connections to be made
by phone or email to a dedicated new connections call centre, a named co-ordinator or
through an on-line web portal.
Time to complete simple, low voltage new connections work
Currently UK Power Networks is required to complete low voltage new connections work
within 90 days. They could invest to improve this to within 60 days, within 30 days or within
15 days.
Type of new connections service offered:
UK Power Networks currently offers a standard new connections service, where they define
what elements they will do and what activities must be done by the customer's builder or
electrician.
However, UK Power Networks could broaden the range of services it offers to include those
typically undertaken by the customer‟s builder or electrician and allow the customer to decide
what they wanted to commission from UK Power Networks.
Alternatively, UK Power Networks could undertake all elements of the work so that the
customer does not have to worry about commissioning any other supplier.

SHOWCARD B: TECHNOLOGY & LOW CARBON TECHNOLOGY INVESTMENTS
Investment in infrastructure to enable UKPN to detect loss of supply:
Currently UK Power Networks is reliant upon customers calling in to alert them to a power
cut. They could invest in infrastructure which would enable them to detect loss of supply (i.e.
a power cut) at individual or small groups of premises.
Investment to enable greater uptake of electric vehicles:
UK Power Networks is not currently making any specific investments in infrastructure to
support the uptake of electric vehicles. They could invest ahead of need to support the take up
of electric vehicles.
Investment in infrastructure to enable greater uptake of low carbon electric heating technologies:
Similarly, UK Power Networks is not currently making any specific investments in
infrastructure to support the take up of low carbon electric heating technologies. These could
include more efficient radiators, air source heat pumps or ground source heat pumps for
example:
- an air source heat pump is a low carbon technology that replaces an existing heating system.
Rather than burning fuel to produce heat, it uses electricity to absorb heat from the outside air
- a ground source heat pump is a low carbon technology that replaces an existing heating
system. Rather than burning fuel to produce heat, it uses electricity to pump liquid around
plastic tubes in the ground, to extract the heat stored there.
They could invest ahead of need to support the take up of low carbon electric heating
technologies.
Investment to enable largescale renewable generation:
UK Power Networks is not currently making any specific investments in infrastructure to
support the growth of largescale renewable generation; each new connection is currently
charged at cost. They could invest in network technologies which would allow cheaper and
quicker connection of new low carbon generators of electricity such as onshore wind farms or
biomass plants.
Investment to enable uptake of micro-generation:
UK Power Networks is not currently making any specific investments in infrastructure to
support the take up of home-based micro-generation technologies; rather, they invest as
needed. They could invest in infrastructure ahead of need to support the uptake of micro-
generation technologies such as solar panels or wind turbines etc.

SHOWCARD C: NETWORK RELIABILITY Frequency of power cuts over 3 mins - average number:
Currently, the average number of power cuts in your region is 1 every 13 months. UK Power
Networks could invest to reduce this to 1 in every 18 months or 1 in every 24 months.
Time to restore 80% of affected rural customers for power cuts longer than 3 minutes:
Currently UK Power Networks restores 80% of customers in rural areas who have been
affected by a cut within an average of 180 minutes of being made aware of the cut. They
could invest to reduce this to within 120 minutes or within 60 minutes.
Time to restore 80% of affected urban customers for power cuts longer than 3 minutes:
Currently UK Power Networks restores 80% of customers in urban areas who have been
affected by a cut within an average of 20 minutes of being made aware of the cut. They could
invest to reduce this to within 10 minutes or, alternatively, the average time to restore them
could be worsened to within 60 minutes or within 180 minutes in return for a lower bill.
Information during a power cut:
Currently customers can get information about a power cut by contacting UK Power
Network‟s call centre. They could invest to offer other means of getting information on a cut,
including:
provision of automatic text messages to registered customers (i.e. customers that provided
their mobile phone details when they contacted the call centre) with details of power cut
and updates
provision of automatic update calls to customer from the call centre and a follow-up call
when the power cut is over
provision of additional information services such as real-time information on the internet,
use of social media, customer service staff „knocking on doors‟ etc.
Contingency services
It is currently the responsibility of customers to provide themselves with any back-up
services, such as a generator, in the event of a power cut. UK Power Networks could provide
services in this area, including:
the provision of generator hire e.g. for an event
provision of back-up services to customers e.g. regular testing of customer-owned
generators and back-up systems.
Related Documents


![kesanggupan membayar [willingness to pay] oleh pengunjung ...](https://static.cupdf.com/doc/110x72/5866836f1a28abd2408b5db7/kesanggupan-membayar-willingness-to-pay-oleh-pengunjung-.jpg)


