Will There Be a Price War Between Russian Pipeline Gas and US LNG in Europe? Anne-Sophie Corbeau and Vitaly Yermakov July 2016 KS-1643-DP037A

Welcome message from author
This document is posted to help you gain knowledge. Please leave a comment to let me know what you think about it! Share it to your friends and learn new things together.
Transcript

1Will There Be a Price War Between Russian Pipeline Gas and US LNG in Europe?
Will There Be a Price War Between Russian Pipeline Gas and US LNG in Europe?Anne-Sophie Corbeau and Vitaly Yermakov July 2016 KS-1643-DP037A

2Will There Be a Price War Between Russian Pipeline Gas and US LNG in Europe?
About KAPSARC
Legal Notice
The King Abdullah Petroleum Studies and Research Center (KAPSARC) is a non-profit global institution dedicated to independent research into energy economics, policy, technology, and the environment across all types of energy. KAPSARC’s mandate is to advance the understanding of energy challenges and opportunities facing the world today and tomorrow, through unbiased, independent, and high-caliber research for the benefit of society. KAPSARC is located in Riyadh, Saudi Arabia.
© Copyright 2016 King Abdullah Petroleum Studies and Research Center (KAPSARC). No portion of this document may be reproduced or utilized without the proper attribution to KAPSARC.

3Will There Be a Price War Between Russian Pipeline Gas and US LNG in Europe?
Around 150 mtpa of LNG export capacity will come to global gas markets over 2015-20. While Asia seems unlikely now to be able to absorb it all, Europe emerges as a residual market for flexible volumes. The question is, therefore, which outcome(s) in the global LNG market could set the
stage for a battle for market share in the European gas market between LNG suppliers and the incumbent pipeline suppliers, most importantly Russia, and how that country could respond to the potential challenge of large quantities of LNG supplies flooding European gas markets?
Russia’s gas export strategy in Europe so far has been based on value maximization rather than on protecting its market share. But if increasing LNG supply to Europe becomes an extended threat to Russia’s market share, it may change its position from reactive to proactive and attempt to defend it.
Whether a confrontation between Russian gas and LNG takes place and how Russia could respond depends crucially on the build-up of total LNG trade and the appetite of China for LNG.
Russia has the advantage of being a low cost producer with ample spare productive capacity and underutilized pipeline capacity to Europe. A low price environment (up to $40/bbl) would actually benefit Russia more than a higher price environment, from a market share perspective, as it can reduce its prices below the variable costs of U.S. LNG and can push U.S. volumes out of the European market. In a higher price environment, U.S. LNG would continue to flow.
The competition between Russian gas and U.S. LNG in Europe is also about pricing models, driven on one hand by oil market fundamentals, with some influence from Europe spot markets, and on the other hand driven by the fundamentals of the U.S. gas market and the LNG trade.
The geopolitical aspect is also important. While relations between Russia and Europe have become frosty, cheap and abundant Russian gas could potentially help mend commercial ties. However, the tensions between the U.S. and Russia have been increased by the Ukraine situation, the war in Syria and sanctions. The competition between U.S. LNG and Russian pipeline gas in Europe is about more than the pure commercial aspects and will be influenced by the geopolitical standoff of the two powers.
Key Points

4Will There Be a Price War Between Russian Pipeline Gas and US LNG in Europe?
Summary
The key questions are how much LNG will be left targeting Europe? And whether this will threaten Europe’s main pipeline gas supplier, Russia? Russia has ample spare gas production capacity, still supplies around one-third of Europe’s gas needs and is a low cost supplier. In this context, Russia may put the resilience and tenacity of LNG suppliers to the test, just as Saudi Arabia has been testing the resilience of U.S. tight oil producers and other higher cost producers by increasing supply and exposing its competitors to a prolonged low oil price environment. Two key elements of Russia’s defensive strategy could be putting more of its gas on European hubs and restricting flexibility (by limiting buyers’ nominations rights) in its contracts with Europe. Should Gazprom turn to more hub indexation and become a price taker, this may not be enough to undercut competition, pushing Russia to trigger a price war by pricing its gas below the variable costs of U.S. LNG exporters.
The pricing environment for gas has fundamentally changed as the period of high prices – notably in Asia – has come to an end (KAPSARC 2016). Both at the U.K. NBP and in Asia, spot prices stood at around $4-6/MMBtu in July 2016. While lower gas prices may not be sufficient to trigger a significant switch from coal to gas-fired plants, since coal prices have also fallen, gas prices are at much lower levels now than was anticipated at the time of sanctioning of most LNG projects. If the oversupply situation continues, prices may fall to the price floor on the basis of the variable costs of supply.
Many LNG projects outside the U.S. would struggle to recover their full costs in a low price environment, but they have now reached the point of no return and will continue operating as long as they can justify their variable costs, in the hope of an eventual
Global gas markets are facing a fundamental change as a result of declining prices and an approaching wave of new LNG supply
over 2015-20. With the start of the first U.S. LNG cargoes out of the Gulf of Mexico in February 2016, the conclusion that a glut on the global gas markets is approaching appears inescapable. But this is just the start of the boom in LNG supply: most LNG capacity additions, which are from Australia and the U.S., will come over the period of 2016-18.
Low gas prices have not triggered a significant rebound in gas demand in Asia and Europe, the two largest importing regions (KAPSARC 2016). As a result, the combination of demand from existing Asian LNG importers and from new importers appearing in Africa, the Middle East and Asia may not be sufficient to absorb these large incremental volumes of LNG (Corbeau and Ledesma 2016). The main uncertainty in this area is future Chinese LNG demand. While Europe and China stand out as the two potential battlefields between pipeline gas and LNG, China may actually prefer pipeline gas to LNG.
This saturation of LNG markets elsewhere is making Europe the residual market for surplus LNG. Europe has tried to reduce its dependency on Russian pipeline gas for over a decade, with little success. It has plentiful and underutilized regasification capacities, liquid and well-developed gas trading hubs in Northwest Europe and relatively well-developed pipeline infrastructure that allows for a certain degree of flexibility in terms of diversifying sources of gas for intraregional flows. The European Commission (EC) has been vocal about the need to diversify away from Russian gas, and to consider LNG as one of the possible alternatives. The EC published a new LNG and storage strategy in February 2016.

5Will There Be a Price War Between Russian Pipeline Gas and US LNG in Europe?
price rebound. U.S. LNG projects have a business model, where the pricing and volume risks are borne by the offtaker of the tolling capacity of LNG terminals, which is often an aggregator. If European or Asian prices were to fall to very low levels, these offtakers could either continue to lift LNG as long as they can cover their variable costs, chose to lose the liquefaction fee and not lift LNG, or throw down the gauntlet and call for a renegotiation of their long-term contracts. There are risks of shut-in production among high-cost producers, and risks that new LNG projects may not be able to recover their costs, setting the stage for the next boom-bust cycle in LNG supply – and for wide fluctuations in gas prices.
The outcome of any confrontation between Russian pipeline gas and LNG in Europe will be different in a high ($15/MMBtu+) or medium ($8-10/MMBtu+)gas price environment. The price levels at which any price war between LNG and pipeline gas in Europe takes place will influence the perceptions of the seriousness and duration of the challenge for the incumbent low cost suppliers and are thus very important to the understanding of the logic behind their strategic responses. Depending on the future development of the oil price, the strategy of protecting its market share in Europe may play out well for Russia’s state company Gazprom, but may also result in an extended period of lower exports and lost revenues.
How serious is the threat of large volumes of LNG reaching Europe? To understand this it is essential to analyze the current and future gas market dynamics. The board of future LNG supply and demand fundamentals is set up, with ample LNG supply coming to the markets, while Russia holds a key position as Europe’s main supplier. This report analyzes successively the different moving pieces:
The evolution of global LNG supply.
LNG demand from different regions outside Europe and China.
Chinese LNG demand.
This analysis enables us to calculate the quantities of LNG that could come to Europe under different scenarios. The battle is not inevitable, depending on what the different outcomes prove to be.
The second stage of our analysis looks at Europe’s supply/demand dynamics, and how much Russian pipeline gas and LNG the region can absorb. Then we analyze the role of Russia as a key supplier to Europe as well as the issues it currently faces. If Russia’s market share is threatened, will it fight for market share or stick to its traditional value maximization approach and drift toward becoming a classical swing supplier and market balancer?
The board is set, the pieces are moving. We come to it at last ...The great battle of our time.
J. R. R. Tolkien, The Lord of the Rings: The Return of the King
Summary

6Will There Be a Price War Between Russian Pipeline Gas and US LNG in Europe?
How Much LNG is Heading for Europe?
Over 2012-14 the global gas market experienced a general tightness as a result of the strong pull on LNG to meet
incremental Asian demand. The spread between lower prices in North America and Europe and higher LNG prices in Asia made the latter the premium market for LNG. The situation is expected to dramatically change over the period 2016-20, building on what happened in 2015. (KAPSARC 2016). Significant volumes of LNG supply will come to the markets during this period. Should Asian, especially Chinese, LNG demand remain structurally low, this would push large volumes of LNG toward Europe. The next paragraphs aim at understanding how much LNG could potentially flow back to Europe by analyzing the global LNG supply picture as well as the LNG demand from outside Europe. To minimize the number of scenarios, we have considered one central case for LNG demand outside China and Europe. We give sensitivities around this number while recognizing that a low LNG demand in one region does not lead to a low LNG demand in the others. China and Europe are the only regions where a pipeline against LNG battle would take place.
The Inevitable Growth in LNG Supply
The large expansion of liquefaction capacity over the period 2015-20 is unprecedented in terms of scale and global LNG markets are expected to be totally transformed by it. Australia and the U.S. will be the two countries providing the largest additions – 63 and 64 million tons per annum (mtpa) respectively. As of July 2016, many LNG export plants have already come online (See Appendix 1, Table A-1). Many trains have been delayed, including U.S. Sabine Pass, Australia’s Gorgon and APLNG. These were initially expected to come online in late 2015, late 2014 and 2015, respectively. Consequently, the
increase in LNG supply during 2015 was lower than expected – at just 6 mtpa – based on the initially announced starting dates. These delays are now welcome, given the oversupplied state of the market. However, this pattern may go on to be repeated, with LNG plants currently under construction being delayed.
Since late 2014, Asian markets, which had been the major driver for LNG demand over 2010-14, have been showing signs of weakness. The emergence of new LNG importers in 2015 – Pakistan, Jordan and Egypt – has not been sufficient to compensate for and to absorb additional LNG supply in 2015. Consequently, Europe has become the residual market for surplus LNG (KAPSARC 2016). Because European gas demand was boosted by colder weather, and domestic production dropped markedly in the Netherlands, these additional LNG supplies did not clash with increasing Russian and Norwegian gas pipeline imports.
Looking forward, the evolution of global LNG supply will depend on the onstream dates of the LNG plants and the evolution of LNG supply from existing plants. Many countries are facing issues ranging from gas shortages, redirection of LNG supplies to the domestic markets and even civil war. LNG plants in Egypt, Libya and Yemen are no longer operating, as of mid-2016, and it is doubtful when and whether LNG exports from these three countries could restart.
Consequently, we consider two scenarios for future LNG supply:
The optimistic one assumes some decline in existing LNG supply and a relatively timely start for liquefaction plants under construction, based on the information available as this report is being written. This means that LNG supply will come faster to the global gas markets and

7Will There Be a Price War Between Russian Pipeline Gas and US LNG in Europe?
reach higher levels, potentially deepening the oversupply phenomenon and lowering LNG spot prices even further if LNG demand does not also rise.
The cautious scenario assumes declines in existing LNG supply and delays for the plants under construction. LNG supply will increase by over 100 mtpa over five years. As LNG sponsors defer the start of their LNG plants, or face technical issues like Gorgon LNG, LNG supply builds up more slowly than in our first case.
All the liquefaction plants under construction are completed by 2020 in both scenarios and Angola LNG restarts in 2016. None of these scenarios assumes any major issue – such as worsening gas shortages or political issues affecting LNG plants – in any LNG supplier, apart from the three mentioned above and Gorgon T1. LNG trade ranges between 353 and 380 mtpa by 2020.
LNG Demand Outside Europe and China
The group of historical LNG importers – Japan, Korea and Taiwan – is assumed to have relatively stable LNG demand till 2020. These countries imported 140 mtpa in 2014, but only around 133 mtpa in 2015. In Japan, four nuclear units have restarted since mid-2015 – though two went back offline in 2016 due to a court injunction – and coal remains more competitive than gas. There is little upside for gas demand in the medium term, especially if a few more nuclear power plants restart. In Korea, the Ministry of Trade, Industry and Energy forecasts LNG demand as 33.96 mtpa in 2022 and 34.65 mtpa in 2029, against 33.4 mtpa in 2015. This is a major shift from previous forecasts: in its energy strategy published in 2014, Korea was expecting gas demand to increase to 46 MTOE in 2011 to 70 MTOE in 2030 and 73 MTOE in 2035. Considering
050
100150200250300350400450
2014 2015 2016 2017 2018 2019 2020
Liquefaction capacityLNG supply availability (optimistic)LNG supply availability (cautious)
Figure 1. Scenarios for global LNG supply (2014-20).
Source: KAPSARC analysis. Note: Both LNG supply scenarios are the result of bottom-up analysis, looking individually at each LNG exporting country and at the LNG plants currently under construction and using the announced starting date as a reference.
How Much LNG is Heading for Europe?
8Will There Be a Price War Between Russian Pipeline Gas and US LNG in Europe?
the 4.2 GW of nuclear capacity under construction that is scheduled to come online over 2017-18, and the 8 GW of additional coal-fired capacity expected online before 2020, Korea’s LNG demand is likely to be constrained – possibly even fall – up to 2020 despite some growth in power demand. In Taiwan, the government is planning to expand renewable capacity as well as coal-fired capacity, but there will be some room for gas demand to grow as nuclear power plants are decommissioned.
In spite of the strong competition from coal, other Asian countries (excluding China) have strong LNG growth potential on the back of rising energy demand. Boosted by new facilities in the Philippines, Indonesia and potentially Bangladesh and Vietnam, demand will benefit from issues with domestic gas production in India, Indonesia and Thailand and from LNG replacing imported pipeline gas in Singapore.
LNG demand in North America – the U.S., Canada, and Mexico – is expected to continue to decline as more pipeline gas is exported to Mexico and Canada. It was already low – 7 mtpa in 2015 – due to developments in U.S. gas production.
LNG demand is bound to increase strongly in Latin America and the Middle East and North Africa (MENA). In the latter region, Egypt installed two floating storage and regasification units (FSRUs) in 2015. The gap between potential demand and production in Egypt is such that even with Zohr gas coming online later this decade, there is still ample room for increased LNG demand in the next few years and stability thereafter. Additional facilities are planned in the Middle East in the UAE, Bahrain and Kuwait. While Morocco’s new facility may be operational only by 2020, elsewhere in Africa, Ghana is building a FSRU that is expected to be in operation in 2016. While LNG demand in the MENA region rose to 10 mtpa in 2015 from 4 mtpa
in 2014, this calls for a potential further doubling of LNG imports by 2020 from 2015 levels. In Latin America, LNG demand growth depends upon the availability of hydro and the completion of additional LNG regasification terminals in Uruguay, Colombia, Brazil and Argentina. Demand is expected to further expand to around 22 mtpa by 2020.
Downside factors are slower economic growth, slow construction or postponement of LNG terminals, and LNG being seen as expensive against coal – even though its competitiveness has improved with current LNG prices – or even oil. Upside factors are countries trying to benefit from lower prices, or preferring natural gas to coal in the context of the U.N.’s 2015 climate change conference (COP21), or opting for LNG to meet rising gas demand. We estimate the upside LNG demand potential, compared with our base case of 240 mtpa, to be around 10 mtpa, while the downside stands at around 30 mtpa. Taking these uncertainties into account, volumes left for China and Europe could range between 105 and 170 mtpa.
China’s Uncertain Appetite for LNG
While there is some uncertainty regarding the final outcome for most regions analyzed above, the uncertainty is even greater when it comes to China and Europe. China had been regarded as the fastest growing market for many years before the economic slowdown of 2015. Chinese gas consumption by 2020 was regularly forecast as above 400 billion cubic meters (bcm), which would require substantial imports. This estimate has subsequently been modified as Chinese gas demand growth slowed from 8.4 percent in 2014 to an estimated 3.7 percent in 2015, reaching around 190 bcm. As of late 2015, CNPC’s demand estimates for 2020 range between 269 and 330 bcm, with 300 bcm as the mid case
How Much LNG is Heading for Europe?

9Will There Be a Price War Between Russian Pipeline Gas and US LNG in Europe?
(ETRI 2015). This mid case actually implies an incremental annual growth of around 22 bcm/year, which contrasts markedly with the 7 bcm increase in 2015. The power and industrial sectors represent the largest uncertainties. The impact of COP21 discussions on natural gas is still very difficult to assess at this stage. The China Energy Research Society puts the share of gas in the primary energy mix at 8 percent by 2020, a steep change from the previous government target of 10 percent, which is equivalent to 360 bcm. If total energy demand is the same as previously expected, that would put gas demand at 290 bcm. However, Chinese energy demand by 2020 could be lower than previously anticipated as a result of slower economic growth. Despite a price cut in November 2015, gas-fired plants remain uncompetitive against coal-fired plants.
The trajectory of future Chinese gas production is also uncertain, as it will include conventional gas, tight gas, CBM, shale gas and syngas. China has missed its previous targets for unconventional gas. In addition, lower oil prices can be expected to have an impact on future upstream investments. The Chinese government, together with the three national oil companies, needs to establish a balance between the benefits and the risks of lower oil and gas prices. Gas production is likely to respond to demand developments and the Chinese government would prioritize indigenous production over imports. A production level of 240 to 260 bcm by 2020 has
often been mentioned for Chinese gas production, but that is too optimistic now (similar to the high demand case), considering that gas production reached around 132 bcm in 2015 (Xinhua 2016); (LNG World News 2015). The 2020 targets of 30 bcm for shale gas, 30 bcm of coalbed methane and 50 bcm of syngas look even more challenging.
The last factor impacting China’s LNG imports is pipeline imports, which reached 33 bcm in 2015, as China preferred to reduce expensive contracted LNG supplies and import more pipeline gas (Hellenic Shipping News 2016). It is worth noting that the country signed many LNG contracts during 2008-11, which feature relatively high slopes. It has already completed three legs of the Central Asian Gas Pipeline (CAGP) (55 bcm/y), as well as the Myanmar-China Gas Pipeline (12 bcm/y). The fourth leg of the CAGP is under construction and planned for 2020, adding 30 bcm/y. Although the Power of Siberia gas pipeline (38 bcm/y) is officially under construction, there are serious doubts over the completion date. Given the oversupply in the Chinese gas market, there may be very little incentive to push forward its completion date to 2020. Even without the Russian pipeline, there will be at least around 100 bcm/y of pipeline capacity to supply the Chinese market and it is likely that there will be 60 bcm, possibly 70 bcm of pipeline supplies by 2020. This means that LNG imports would range broadly between 34 to 54 mtpa (Table 1).
Altogether we expect demand in the regions mentioned – Japan/Korea/Taiwan, other Asian countries (excluding China), Latin America and MENA – to reach around 240 mpta by 2020. Based on our scenarios for global LNG supply and LNG demand outside China and Europe, this would leave between about 115 and 140 mtpa for these two regions.
How Much LNG is Heading for Europe?

10Will There Be a Price War Between Russian Pipeline Gas and US LNG in Europe?
How Much LNG Is Left for Europe?
Using the two LNG supply scenarios and the two Chinese demand outlooks and the base case for the other regions, we can calculate how much LNG would be left for Europe in four cases. The different scenarios mean that European LNG imports could range between 61 mtpa and 108 mtpa, equal to 83 and 147 bcm, respectively (See Table 2). Taking into account the sensitivities around LNG demand in the other regions, European LNG imports could range between 51 mtpa and 138 mtpa.
Low LNG supply combined with high Chinese LNG demand would mean that total European LNG imports would be 20 mtpa higher than in 2015, something that would be bearable from a Russian perspective. The higher estimates would certainly trigger some reaction from Russia, depending on other elements in the European gas market. These numbers imply that large quantities of U.S. LNG would come to Europe. This being said, such a high scenario would result in spot cargoes being available at a potentially very low distress prices, which could then have a positive influence on demand in several markets.
bcm CNPC low case CNPC mid case CNPC high case IEA
Demand 269 300 330 315
Production 163 175 191 172
Import needs 106 125 139 143
Pipeline 60 70 70 70
LNG imports 46 55 69 73
LNG imports (mtpa) 34 40 51 54
Table 1. Chinese gas balance under different scenarios (2020).
Source: Demand numbers are based on CNPC scenarios and the IEA New Policies Scenario; production numbers are based on IEA (for the IEA case) and author’s assessments based on announced targets by Chinese authorities. Pipeline imports: author’s assumptions based on capacity build up.
LNG supply left for Europe + China
LNG Supply left for Europe
High Chinese LNG demand Low Chinese LNG demand
Low LNG supply 115 61 81
High LNG supply 142 88 108
How Much LNG is Heading for Europe?
Table 2. Chinese gas balance under different scenarios (2020).
Source: Author’s assumptions based on previous calculations (see Table 1 and Figure 1).

11Will There Be a Price War Between Russian Pipeline Gas and US LNG in Europe?
But How Much LNG Does Europe Need?
There are two factors determining Europe’s call on LNG. One is the amount of LNG that cannot be absorbed by other regions. The
other is the gap between indigenous gas production in Europe and its consumption and the role of alternative pipeline supplies. It is important to be precise as to the definition of Europe, as different institutions use different definitions of the region, ranging from EU28, OECD Europe, or our wider definition of Europe used above. This includes EU28, Turkey, Norway, Switzerland, Albania and countries from the Former Yugoslavia.
As late as 2010 a golden age of gas in Europe was expected, but the reality turned out to be very different; after reaching the high point of 594 bcm in 2010, Europe’s gas consumption declined to 476 bcm (down 120 bcm) by 2014. A demand level as low as this has not been seen since the late 1990s. Mild weather in 2014 exacerbated the demand reduction. The key reasons behind this slump were the overall economic decline on the continent following the Great Recession, expansion of renewables, energy efficiency measures and substitution of gas with coal in power generation due to low coal prices and the alleged failure of European carbon policies. Lower coal prices made gas-fired plants uncompetitive against coal plants, leading to the mothballing of gas-fired plants in Northwest Europe. The U.K., which put in place a carbon tax on top of the ETS carbon price, saw a switch from coal to gas in mid-2014 and then since late 2015 a more substantial change as gas prices dropped massively.
This low demand had dire implications for LNG imports: European imports reached a record low level of 32.5 mtpa in 2014 following the collapse of European gas demand, the diversion of LNG to Asia and a large price differential between Europe and Asia. In 2015, LNG imports recovered to 37.9 mtpa,
while European gas demand is estimated to have recovered by 5-6 percent. This puts European gas demand at around 500-505 bcm.
Will European Gas Demand Bounce Back?
Despite higher levels in 2015, European gas demand remains structurally low. The consensus view is that it will return to the growth trajectory very slowly. Even by 2035 demand is seen as only slightly higher than in 2010, but there is a wide variability in the range of the forecasts due to diverging views on Europe’s energy choices and the role of gas in its energy balance. Cedigaz has forecast that demand from OECD Europe will reach 585 bcm by 2035, and 532 bcm in 2020, while the IEA, in its World Energy Outlook (WEO) 2015, reduced its forecast for 2020 to 496 bcm from 531 bcm in WEO 2014. This was despite assuming much lower import prices, $7.8/MMBtu against $11.1/MMBtu. Only the EC, however, forecasts a drop in demand over time. Not all these forecasts have taken into account lower oil and gas prices, as some were made before or at the beginning of the oil and gas price drop. Meanwhile, it is worth noting that past forecasts for Europe have almost systematically overestimated gas demand (see Table 3). Looking forward, a key question is whether natural gas demand could recover at a time of lower gas prices.
The residential/commercial sector is now the largest consuming sector in Europe, but many energy efficiency measures are being taken to improve the energy efficiency of buildings. Even if wholesale gas prices fall, in fact they represent a limited share of the total gas price charged to end-users, as these prices include transport, distribution costs and various taxes. The effect of lower wholesale gas prices on demand is likely to be limited and residential/commercial gas demand is expected to

12Will There Be a Price War Between Russian Pipeline Gas and US LNG in Europe?
But How Much LNG Does Europe Need?
remain flat, adjusted for temperature variations, with a potential downward trend due to energy efficiency measures.
In the industry sector, lower gas prices could improve the competitiveness of the European industry against some competitors. But the industry has already been hard hit by the economic crisis and the recession that followed, triggering permanent demand destruction as industries closed down or transferred their operations. Some industries – mainly energy intensive industries – have moved offshore, while high gas prices have triggered efficiency measures (OIES 2014).
A promising new market has been the use of gas (LNG) in the maritime transport sector. While this is actively promoted by the EC following new regulations covering Emission Control Areas, the declining gap between oil and gas prices has reduced the incentive. In addition, a real push towards more LNG in the maritime sector is unlikely to take place before 2020, which is the earliest
date by which the level of sulfur emissions could be limited internationally.
The power generation sector seems the most likely to benefit from lower gas prices. However, several variables have to be considered. There is a limited upside in terms of power demand growth due to a relatively bleak outlook and continuing energy efficiency measures. In addition, renewable energy capacity is expected to continue to increase, even if at a slower pace. The EC’s 2030 Energy Strategy foresees a share in consumption of at least 27 percent for renewable energy. The IEA’s WEO 2015 expects renewable generation in OECD Europe to increase from 1094 TWh in 2013 to 1390 TWh by 2020, at the expense of thermal generation, which would drop by 74 TWh.
This will leave gas to compete against coal for a smaller share of power generation than observed in the past. Despite lower gas prices, gas-fired plants were struggling against coal-fired plants. Up to May 2016, European spot gas prices were around
2010 2013 2015 2020 2025 2030 2035
OCED Europe
Cedigaz 567 512 480 532 585
IEA 567 512 480 496 523 526 530
Europe ExxonMobil 594 505 564 594
OIES 594 528 550 564 595 618
ERI 594 560 579 602 596
EU28 EC 545 534 498 500 487 487
Table 3. Forecasts of OECD Europe and Europe gas demand compared.
Source: Cedigaz, IEA, ExxonMobil, OIES, ERI, European Commission. In red, institutions’ estimates for 2015. Figures 2015 and 2025 from OIES estimated based on graphic.

13Will There Be a Price War Between Russian Pipeline Gas and US LNG in Europe?
But How Much LNG Does Europe Need?
$4/MMBtu, and coal prices (API2 and CIF ARA) around $46/ton, making combined cycle gas turbine (CCGT) generation more competitive than the least efficient and average coal-fired plants. The U.K. is different, as it established a carbon price floor (£18/ton) which is added on top of the ETS. Additionally, there have been many closures of coal-fired plants in the U.K. due to the EC’s Large Combustion Plant Directive (LCPD), leaving gas as the main option. Switching to gas is already a reality in the U.K. (Timera Energy 2016).
Forward API2 coal prices for the period 2016-20, as of May 2016, range from $46-48/ton (CME Group 2016). Assuming coal prices at around $48/ton, and a carbon price at €10/ton, gas prices would need to be below $4.2/MMBtu to displace an average power plant and on or below $3.6/MMBtu to displace the most efficient coal-fired plant in Continental Europe. Coal prices increased to above $55/ton in July.
However, higher oil prices (> $40/bbl) are pushing oil-indexed gas prices to levels above $4/MMBtu, while spot prices are likely to stay depressed due to global LNG oversupply (see Figure 2).
Switching potential varies according to the individual conditions in each European power market. Some countries, such as Germany, have recently built efficient coal-fired plants that will continue to run as long as they are competitive. But there will be some additional closures due to the EC’s Industrial Emissions Directive (IED). Plants have either the option of upgrading their SOx and NOx emissions reduction measures to meet the IED, or taking the ‘limited life derogation’ (LDD) in the directive and running for a maximum of 17,500 hours from January 2016 till December 2023, before closing down. Consequently, closures of coal-fired plants may take place too late relative to the gas glut. Meanwhile, more nuclear capacity will be shut down due to political decisions.
Figure 2. Gas price to switch from coal to gas (Continental Europe).
Source: KAPSARC analysis. Note: assumes an efficiency of 55 percent for gas-fired plants and a 1.1 exchange rate between the euro and the U.S. dollar.
0
1
2
3
4
5
6
35 36 37 38 39 40 41 42 43 44 45 46 47 48 49 50
$/M
MBt
u
$/ton
36% 42& 30%

14Will There Be a Price War Between Russian Pipeline Gas and US LNG in Europe?
But How Much LNG Does Europe Need?
Indigenous Production Declines
Indigenous production in Europe stood at 267 bcm in 2014, down from 318 bcm in 2010. Domestic gas production is declining in almost every single European country except Norway, Poland and Ireland. The main countries to watch are Norway, the U.K. and the Netherlands, as they account for 87 percent of Europe’s gas output. Norway is now expected to plateau at current levels, followed by a decline after 2020 (Ministry of Petroleum and Energy 2015). The U.K.’s gas production decline will slow down over the coming years as new fields come online, but will resume post-2020 unless new investments are made, which appears unlikely in a low oil price environment. The Netherlands represents the largest uncertainty, but in this case future gas production (or caps on it) has mostly been determined by political decisions following the earthquakes in the Groningen province. While Groningen gas production peaked at 53 bcm in 2013, it was capped at 24 bcm in 2016. Meanwhile, the rest of the Dutch production coming from the ‘small fields’ will also decline. By 2020, in Europe there is little expectation of unconventional gas developments. Poland once seemed the most advanced in that respect, but results proved disappointing. The U.K. is unlikely to have any significant unconventional output by 2020. Looking forward, European gas production is expected to
continue to decline to around 239 bcm, based on a country-by-country analysis.
Implications for Imports Needs
European net import requirements are expected to fall within a range of 286-301 bcm by 2020 and those of OECD Europe in a range of 274-289 bcm. Assuming that around 55 bcm will come from other sources – Algeria, Libya, Iran and Azerbaijan – and taking into account Norwegian LNG exports, we can obtain a range of scenarios for Russian gas pipeline imports (see Table 4). It appears that the threat to Russian gas pipeline exports is real (Figure 3). These exports would be limited in all but one scenario, low LNG supply, high Chinese LNG demand, which is the most optimistic scenario. The scenarios with high LNG supply feature an important reduction in Russia’s pipeline exports to Europe. These would be testing the flexibility imbedded in Russian long-term gas contracts – estimated at 70 percent, which means that Russian volumes would be limited to 130 bcm on the downside, based on contacted quantities (see Figure 7). Over 2009-10, European buyers took below contracted quantities from some suppliers, leading them to ask for more flexibility during the following round of renegotiations. But it is unlikely that Russia would be willing to negotiate flexibility again if this is solely for the benefit of LNG suppliers.
Taking into account the limited upside from lower gas prices, the slow recovery of demand in 2015 and existing forecasts, Europe’s gas consumption can be expected to range around 525-540 bcm by 2020, from an estimated 500-505 bcm in 2015.

15Will There Be a Price War Between Russian Pipeline Gas and US LNG in Europe?
But How Much LNG Does Europe Need?
0 50 100 150 200
Low supply, China high
Low supply, China low
High supply, China high
High supply, China low
bcmLow High
Figure 3. Ranges of Russian gas pipeline exports to Europe by 2020.
Source: KAPSARC research. Ranges of imports: Gazprom export data converted to European standards.
Low High
Europe
Demand 525 540
Production 239
Net imports 286 301
LNG exports (Norway) 6
Imports Needs 292 307
Pipeline imports (North Africa, Azerbaijan, Iran)
55
Imports Needs (LNG + Russia) 237 252
Table 4. Europe supply/demand balance (bcm).
Source: Author’s assumptions based on previous calculations (see Table 1 and Figure 1).
16Will There Be a Price War Between Russian Pipeline Gas and US LNG in Europe?
But how much LNG does Europe need?
Getting LNG to the Right Place
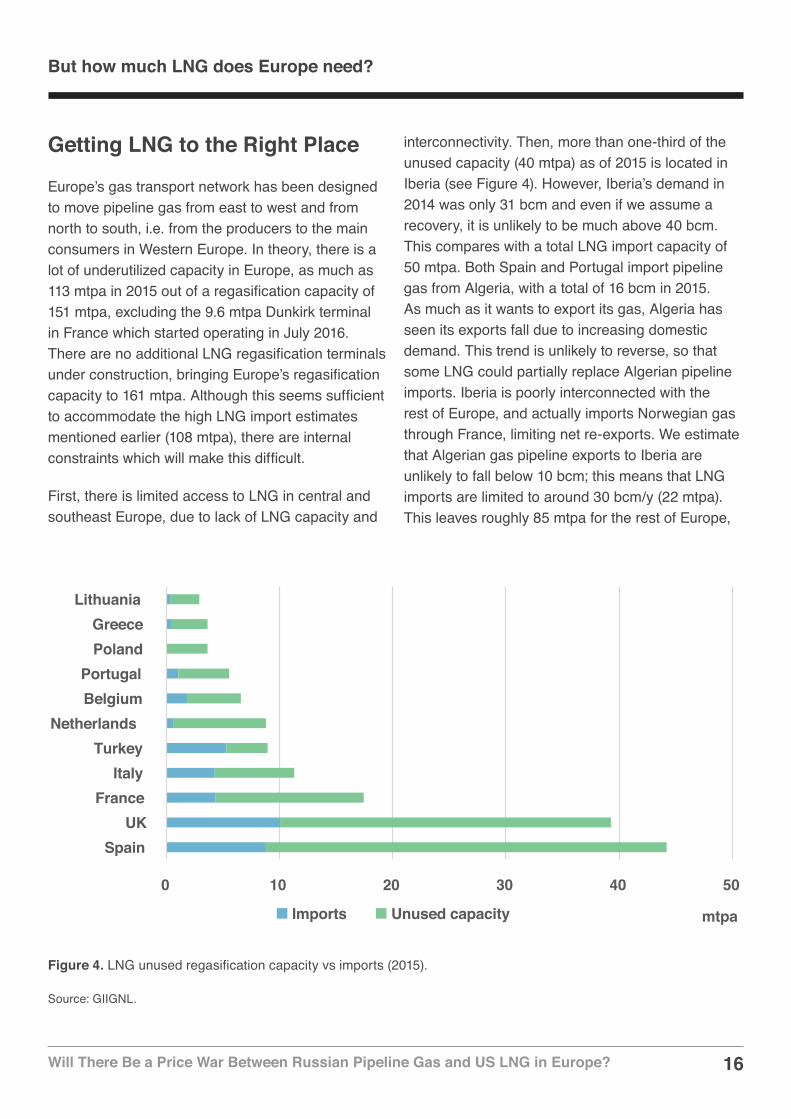
Europe’s gas transport network has been designed to move pipeline gas from east to west and from north to south, i.e. from the producers to the main consumers in Western Europe. In theory, there is a lot of underutilized capacity in Europe, as much as 113 mtpa in 2015 out of a regasification capacity of 151 mtpa, excluding the 9.6 mtpa Dunkirk terminal in France which started operating in July 2016. There are no additional LNG regasification terminals under construction, bringing Europe’s regasification capacity to 161 mtpa. Although this seems sufficient to accommodate the high LNG import estimates mentioned earlier (108 mtpa), there are internal constraints which will make this difficult.
First, there is limited access to LNG in central and southeast Europe, due to lack of LNG capacity and
interconnectivity. Then, more than one-third of the unused capacity (40 mtpa) as of 2015 is located in Iberia (see Figure 4). However, Iberia’s demand in 2014 was only 31 bcm and even if we assume a recovery, it is unlikely to be much above 40 bcm. This compares with a total LNG import capacity of 50 mtpa. Both Spain and Portugal import pipeline gas from Algeria, with a total of 16 bcm in 2015. As much as it wants to export its gas, Algeria has seen its exports fall due to increasing domestic demand. This trend is unlikely to reverse, so that some LNG could partially replace Algerian pipeline imports. Iberia is poorly interconnected with the rest of Europe, and actually imports Norwegian gas through France, limiting net re-exports. We estimate that Algerian gas pipeline exports to Iberia are unlikely to fall below 10 bcm; this means that LNG imports are limited to around 30 bcm/y (22 mtpa). This leaves roughly 85 mtpa for the rest of Europe,
0 10 20 30 40 50
SpainUK
FranceItaly
TurkeyNetherlands
BelgiumPortugal
PolandGreece
Lithuania
mtpaImports Unused capacity
Figure 4. LNG unused regasification capacity vs imports (2015).
Source: GIIGNL.

17Will There Be a Price War Between Russian Pipeline Gas and US LNG in Europe?
But how much LNG does Europe need?
which means quite a high utilization rate of around 75 percent. Markets such as Turkey, Poland and Greece could use their terminals at such high levels, albeit for different reasons.
This would leave around 70 mtpa to be absorbed by Continental Europe and the U.K. In the U.K., LNG would be facing pipeline imports from Norway and the Netherlands. Surplus gas could be sent to Continental Europe via the Interconnector pipeline (IUK). Such an influx of LNG into Northwest Europe could potentially create some congestion issues in Zeebrugge: Dunkirk, Zeebrugge and GATE LNG
import terminals would have to import around 19 mtpa over and above the IUK pipeline flows. France alone would import 28 bcm of LNG, more than half of its demand, which looks challenging. LNG imports of these proportions into Western Europe would produce an eastwards shift in intra-European gas flows. But there could also be internal constraints on how much LNG could go that way, even though the interconnections from west to east have been significantly improved since the 2009 disruption. Finally, different gas odorization standards between European countries also limit gas market integration.

18Will There Be a Price War Between Russian Pipeline Gas and US LNG in Europe?
The World’s Largest Gas Exporter
Russia is the largest natural gas exporter in the world. According to BP statistics, net exports amounted to 177 bcm in 2014.
Pipeline exports amounted to 187 bcm – about 80 percent of which were directed to Europe – while LNG exports were 14.5 bcm. Russia’s gas imports from other FSU countries account for the balance (BP 2015). As a comparison, Qatar and Norway exported 123 and 106 bcm, respectively.
Quantifying Russian export volumes is always complex due to the multiplicity of sources, sometimes contradicting themselves. The first issue comes from the difference between Russian and European cubic meters. European statistical practice is to report in standard gas volumes measured at 9,500 kilocalories (kcal) per cubic meter (gross calorific value), at 15 degrees centigrade (C) at a pressure of one atmosphere (760 millimeters (mm) of mercury) instead of the measure of 8,200 kcal per cubic meter (in net calorific value, or the equivalent of 9,040 kcal per cubic meter in gross calorific value) used in the countries of the FSU. In short, Russian gas volumes are measured
at 20 degrees C and 760 mm of mercury, and to convert Russian gas volumes to standard volumes, we multiply by 0.935.
Another set of issues comes from how export countries are categorized. Russian exports are sometimes reported by country, but also sometimes grouped under the Russian headings of ‘Far Abroad’ and ‘Commonwealth of Independent States’ (CIS) countries, though some CIS countries are actually in Europe. In its Gas Trade Flow map, the IEA reports flows at each entry border point, but does not make any adjustment in terms of calorific value (IEA - Gas Trade Flows in Europe 2016) (see Table 5).
Europe is Russia’s core export gas market and has become even more important to it as exports to other former CIS countries – notably Ukraine – have declined (see Figure 5). Russia has the ambition to pivot east via the start of pipeline gas deliveries to China by 2020 through the Power of Siberia gas pipeline and the expansion of its LNG exports. In May 2014 Russia and China signed a 30-year oil-indexed gas supply contract, starting between 2019 and 2021, providing for 38 bcm per annum peak deliveries from Russia’s new gas fields in
Russia’s Gas in Global Gas Markets and in Europe
2010 2011 2012 2013 2014 2015
Gazprom Export 138.6 150 138.6 161.6 146.6 158.6
Converted European std 129.7 140.3 129.9 151.1 137.2 148.4
IEA (net) 144.6 156.7 148.2 165.3 148.1 NA
BP NA NA NA 162.4 147.7 NA
Table 5. Russian gas exports to Europe.
Source: Gazprom Export, IEA, BP.

19Will There Be a Price War Between Russian Pipeline Gas and US LNG in Europe?
Eastern Siberia to northeast China via the Power of Siberia pipeline. Russia and China are continuing to negotiate an additional contract for 30 bcm per year of gas from the existing fields in west Siberia to Western China via the Altai pipeline, plus deliveries of pipeline gas to China via a short spur from the existing Sakhalin-Khabarovsk-Vladivostok pipeline in Russia’s Far East. However, there are worries that the pipeline could be delayed, while many Russian LNG projects have stalled due to the combination of low oil prices, LNG oversupply and international sanctions adversely affecting the projects’ financing. The sanctions against Russian banks and companies make it harder to raise finance. Russia has one LNG project currently under construction – Yamal LNG, sponsored by Novatek, expected online by 2018. When Europe is hit by the wave of LNG supplies by 2018, it will still be Russia’s main export market and main source of gas export revenues.
Russian pipeline gas exports to European countries in 2014 declined substantially from 2013’s high level (162 bcm – Russian standards), but recovered in 2015 (see Figure 6). Political issues, seasonality, and downward trends in oil prices that started to gain momentum in the last quarter of 2014 were playing unusually important roles in the first half of 2015. Russian oil-linked gas exports to Europe were also constrained by the time-lag effect. Russian contract gas prices reflect oil-linked price dynamics, with a time lag of six to nine months. Thus, during the winter of 2014/15 prices for contracted gas were still relatively high and started to reflect the new realities of low oil prices only by April-May 2015 when the new storage injection season commenced. The optimization strategies of European buyers for winter 2014/15 were to draw on existing gas in storage and maximize purchases from other suppliers. (Norwegian gas contracts have spot gas
012345678910
0
50
100
150
200
250
2000 2005 2010 2015Exports to CISExports to “Far Abroad”Total pipeline exports of Russian gasAverage export price (all pipeline exports)
!"##$%&'($()*$&)'+%#'),(-./#'%&0'%1).%+)'(.$2)'$&'%**'3%.4)/#Vo
lum
e, B
cm
Pric
e $M
MBt
u
Figure 5. Russian gas pipeline exports and average price, 2000-15.
Source: KAPSARC analysis, Russian Central Bank. Notes: Volumes in standard cubic metres. Data excludes Russian imports from Central Asia under transit arrangements.
Russia’s Gas in Global Gas Markets and in Europe

20Will There Be a Price War Between Russian Pipeline Gas and US LNG in Europe?
Russia’s Gas in Global Gas Markets and in Europe
market indexation.) Meanwhile, Gazprom reduced flows to Europe in an attempt to reduce reverse flows to Ukraine and possibly to support European spot prices by curtailing supply. But in Q3 2015 the price of Russian gas caught up with the oil market’s dynamics and European purchases of Russian gas hit the historical maximum. Going forward, 2016 prices are expected to fall further to about $4/MMBtu levels.
Germany, Turkey and Italy are the three largest importers of Russian pipeline gas. Exports to Gazprom’s European ‘big three’ consumers amounted to 90.5 bcm in 2015, up 10.3 percent year-on-year (Table A-2). On the other hand, deliveries to Slovakia and the Czech Republic declined substantially, by 13.2 percent and 11.7 percent, due to the reduced flow of Russian gas via the Ukrainian transit corridor and the emergence of a new trend of ‘reverse supplies’ from these countries (as well as Ukraine), based on Russian gas that originally arrived in Germany via the Nord Stream pipeline.
Russia’s Domestic DevelopmentsSince Russia’s gas export contracts are predominantly oil-indexed, the tumbling prices of crude oil (Brent) that declined from about $100/bbl in 2014 to about $52/bbl on average in 2015, and to just $30/bbl in early 2016, represent a threat to Russia’s gas export revenues and to the economics of its new upstream and pipeline gas projects aimed at new markets. Since then, oil prices have been progressively rising back toward $50/bbl by June 2016. Since 2012, Russia has begun development of a supergiant new gas province in the Yamal peninsula, where output is expected to reach more than 200 bcm by 2040. Moreover, since 2012, Russia has invested in the construction of new, large diameter, high pressure, internal pipelines that would optimize transportation distances for the newly developed fields and feed its new export pipelines to Europe, bypassing Ukraine. Revenues from pipeline gas exports going to Europe and the FSU countries, reported by the Russian Central Bank, amounted to $42 billion in 2015 compared
0
10
20
30
40
50
Q1 Q2 Q3 Q4
Range 2009 - 14 2014 2015
bcm
Figure 6. Russian pipeline gas exports to Far Abroad.
Source: KAPSARC analysis, Gazprom. Notes: Gazprom's reported exports to the so called 'Far Abroad' exclude Baltic states, which are reported under 'Near Abroad' category. Volumes converted to standard BCM (European calorific standard).

21Will There Be a Price War Between Russian Pipeline Gas and US LNG in Europe?
Russia’s Gas in Global Gas Markets and in Europe
with $55 in 2014 (down 24% year-on-year), while volumes were only marginally lower (Central Bank of Russia 2016). At the same time, Russia remains one of the lowest cost suppliers of natural gas to its existing export markets because of the very low production costs of its supergiant gas fields and the sunk costs of its gas pipeline legacy infrastructure. The low costs of Russia’s gas are further aided by a massive depreciation of the Russian ruble against the U.S. dollar in 2014-16, which has cut the U.S. dollar-denominated costs for Russia’s gas industry – upstream lifting costs and transportation costs within Russia – by more than 50 percent. (Only a relatively small percentage of total production costs in Russia’s gas sector – mostly electronics equipment – is priced in hard currency.)
In addition, Russia has about 200 bcm of spare productive capacity at its gas fields in Yamal and in Nadym-Pur-Taz that can supply Europe via several pre-existing pipelines which have significant underutilized capacity. According to a statement by Gazprom CEO Aleksey Miller on Sept. 17, 2014, the amount of spare capacity held by the company is over 185 bcm. He reported that Gazprom has the capacity to produce 617 bcm, against production of 432 bcm in 2014 (Gazprom 2014). The state company’s output fell in 2015. Meanwhile, the largest Russian independent gas producers also have spare production capacity. The established framework of Russia-Europe long-term contracts, which contain significant embedded seasonal and annual supply flexibility, allows Russia to increase deliveries quickly if there is additional demand for its gas. Russia has accepted the role of a balancer for the European gas market as part of its legacy long-term contracts that contain significant seasonal and structural flexibility. As a result, the country has all the prerequisites to assume the role of a swing supplier for the European natural gas market – should it so wish – in a striking parallel to Saudi Arabia’s position in the global oil market. Both countries are facing a supply-
side challenge from higher cost producers. The tight oil phenomenon in North America has contributed most to global crude oil incremental supply over the past few years. U.S. oil output alone has increased incrementally by about 5 mb/d during 2010-15. Saudi Arabia’s response to this dual challenge has been to stop balancing the market, letting oil prices drop, revitalizing demand for oil and expanding its own market share. But the cost of this strategy has been high due to a sharp decline in oil prices to date.
It is also crucial to differentiate slightly between the positions of Russia and of Gazprom, even though they tend to be viewed together when it comes to exports. (Or they will be until gas from the Yamal LNG project of independent producer Novatek starts to flow.) Russia’s position as an exporter may be challenged, but the implications for Gazprom are even greater. Gazprom has been increasingly losing domestic gas market share to independent producers like Novatek, and companies such as Rosneft, which are undercutting Gazprom’s regulated prices. In 2014, Gazprom’s market share was estimated at about 55 percent of Russia’s domestic gas market, against 80 percent 10 years before (Drebentsov 2015). As its competitors are planning to significantly increase their gas production, Gazprom will be increasingly challenged in a domestic market where demand is not growing much because of an already high share of gas in the primary energy mix. Consequently, Gazprom will become even more dependent on export volumes and revenues to preserve its share of Russia’s gas production and also to be able to support new and expensive investments.
Russian Gas Supply Contracts With Europe
Russia inherited from the Soviet Union a vast framework of long-term gas contracts with Europe that originated in the early 1970s when the first contracts were signed with Germany, Italy and

22Will There Be a Price War Between Russian Pipeline Gas and US LNG in Europe?
France. Over time these contracts were prolonged and extended, some of them as recently as a few years ago. After the collapse of the Soviet Union, a series of contracts with East European countries was signed. At present, the combined annual contract quantities (ACQ) of Russian gas supply contracts with Europe exceed 180 standard bcm (see Figure 7), compared with Russia’s gas exports to Europe (including Turkey) totaling 141 standard bcm in 2014 and 153 standard bcm in 2015, or 79 to 85 percent of ACQ levels.
During the past 40 years, the three key pillars of the Russia-Europe gas trade have been:
Long-term contracts.
Oil indexation of gas prices.
Take-or-pay (TOP) clauses.
These general principles have historically been designed to allow the seller and the buyer bilaterally to balance the various business risks involved, particularly as regards price and offtake volume. Historically, the seller takes the price risk and the buyer the volume risk. But these principles have come under increasing pressure recently, as European gas buyers have sought greater flexibility in offtake volumes and delinkage from oil since 2009 and the economic crisis, as traditional importers lost customer franchises in gas market liberalization and the spread widened between European oil-linked gas prices and traded prices. Gazprom has been forced to adapt to these new realities by adjusting its pricing policies (see later) as well as its take-or-pay provisions.
0
20
40
60
80
100
120
140
160
180
200
1973 1978 1983 1988 1993 1998 2003 2008 2013 2018 2023 2028 2033
bcm
Italy Germany France Turkey Slovenia
Slovakia Serbia Romania Poland Netherlands
Hungary Greece Finland Denmark Czech Republic
Croatia Austria Macedonia Lithuania ACQ
Figure 7. Gazprom gas export contracts with Europe.
Source: KAPSARC analysis, Gazprom and Gazprom Export various reports. Note: bcm are for standard bcm.
Russia’s Gas in Global Gas Markets and in Europe

23Will There Be a Price War Between Russian Pipeline Gas and US LNG in Europe?
Russia faces several issues when it comes to supplying gas to Europe:
The deterioration of its relationship with Europe, especially the EC.
Price levels, since Russia has a strong preference for the oil indexation model.
Competition from other suppliers.
The ever present issue of transit through Ukraine.
The perception by Gazprom of a growing asymmetry of rights and obligations between buyers and sellers of gas.
The European Commission Issue
Russia has been facing an overall deterioration of its gas relationship with Europe over the past few years as a result of security of supply issues – notably after the Russian supply cut in 2009, high gas prices, changes in European gas regulation that in Russia’s view threaten the established framework of its gas contracts and, finally, geopolitical tensions over Ukraine and Russia’s annexation of the Crimea, leading to the subsequent international sanctions. On the energy side, Russian gas has become ‘Undesirable Number 1’ for the EC. Gazprom is currently under an antitrust investigation in Europe into alleged overpricing and anti-competitive practices (The Financial Times 2016), while Russia’s South Stream pipeline project has been blocked by the EU regulators. Despite Europe’s being as much dependent on Russian coal and Russian oil as it is on Russian gas, tensions focus on gas. Finally, the EC published an LNG and storage strategy in February 2016. Announcing that, Miguel Arias Cañete, Commissioner for Climate Action and Energy, said that, “After the gas crises of 2006 and
2009 that left many millions out in the cold, we said: 'Never again.' But the stress tests of 2014 showed we are still far too vulnerable to major disruption of gas supplies. And the political tensions on our borders are a sharp reminder that this problem will not just go away.” (European Commission 2016) This statement highlights the frosty relations between the EU and Russia.
Another area of contention has been around the OPAL pipeline. The 55 bcm/y Nord Stream pipeline is linked to two downstream pipelines: the 20 bcm/y NEL pipeline and the 36 bcm/y OPAL pipeline. Gazprom has tried to access full capacity of both extensions, but faced issues with the OPAL pipeline. While the German regulator granted the exemption from third party access (TPA) to OPAL, this was denied by the EC and capped at 50 percent. Despite lengthy negotiations, the EC has delayed its approval against a background of deteriorating relations over Ukraine.
The whole concept of Russia-Europe gas cooperation has therefore been brought into question. Russia’s attempt to create vertically integrated supply chains in Europe, via what has been called an ‘upstream-downstream’ model – under which European companies would obtain interests in upstream gas development projects and Russian companies would take interests in European downstream assets – ran into conflict with the EC’s deregulation agenda for electricity and gas markets. The latter envisioned horizontal unbundling, while Russia’s concern, in its turn, has been centered on the risks that this new approach would create for its gas business.
After a number of unsuccessful attempts to reach a compromise, Russia finally accepted that the model of mutual cooperation and mutual interdependence was not going to fly and needed a major overhaul (Gazprom 2015). But even under regulatory
Challenges Faced by Russia in Europe

24Will There Be a Price War Between Russian Pipeline Gas and US LNG in Europe?
Challenges Faced by Russia in Europe
pressure, and in an environment of international sanctions, Gazprom and BASF/Wintershall agreed an asset swap deal in September 2015 through which Gazprom increased its interest (up to 100 percent) in joint ventures it had previously established in Germany, and Wintershall obtained 25.01 percent in the project to develop Blocks 4A and 5A in the Achimov layers of the Urengoyskoye gas and condensate field in Russia. Gazprom now has 100 percent interests in WINGAS, WIEH, WIEE and 50 percent interest in WINZ. WINGAS is a company engaged in natural gas wholesale trading and storage in Germany, where it has 20 percent market share, as well as in Austria, Belgium, the Czech Republic, the Netherlands, and the U.K. WIEH also purchases and sells natural gas in Germany, WIEE in southeastern Europe, and WINZ carries out geological exploration and hydrocarbon production offshore in the North Sea. At about the same time a consortium of companies including Gazprom, BASF, E.ON, ENGIE (formerly GDF Suez), OMV and Shell was formed to participate in the construction of the Nord Stream 2 pipeline project, which will have capacity of 55 bcm/y.
Finally, the EC is proposing to tighten up intergovernmental energy agreements – related to gas in particular – between EU and non-EU countries and to take action “if it assesses that such an agreement could affect the security of gas supplies in another EU country or hamper the functioning of the EU’s energy market” (European Commission 2016). The wording is interesting as long-term contracts are commercial contracts between companies. It can be argued that nothing can be done in Russia without the Kremlin’s assent, but this is not really true for the European side. By dumping gas on the spot markets, Gazprom could actually move around that issue, though potentially at a cost for the company and for Russia.
The Price Issue
In an environment of very high oil prices that existed during most of 2008-14 – the oil price fall in 2009 was dramatic but did not last long enough to make much difference for oil-linked gas contracts – Russia’s oil-indexed prices presented a challenge to European consumers. In most European countries gas prices have not reflected market fundamentals for the last 20 years, but this had not been a major concern because buyers worried about the price level, rather than the price formation principles. As long as importers could pass on the costs of purchased gas to their customers – and before 2008 they always could – oil indexation was generally accepted. But market liberalization, availability of LNG at lower spot prices, development of spot markets, and hub trading based on gas fundamentals all gradually created an alternative to oil indexation in Western European markets. Three key trends – a sharp increase in oil prices, economic recession in Europe, and the emergence of a consistently wide gap between spot and oil-indexed gas prices – thus emerged as a cumulative game changer. Against this background, European regulators clearly wanted to move to prices that are determined by gas market fundamentals and they were insisting on moving away from oil indexation.
As soon as gas importers could not pass their higher purchase costs on to customers (2009-10) they faced significant financial losses, leading to a growing number of renegotiation and arbitration (legal) cases, not only with Gazprom but also with many pipeline and LNG suppliers selling at oil-indexed prices. At the same time, because spot gas prices were lower than oil-indexed prices, utilities were facing the risks of either being undercut by competitors offering spot-indexed gas or having customers that demanded spot indexation.

25Will There Be a Price War Between Russian Pipeline Gas and US LNG in Europe?
Challenges Faced by Russia in Europe
The rise in oil-indexed gas prices in 2011-12 resulted in high bills for European buyers and prompted them to seek further price renegotiation.
The results that emerged from the period 2011-12 can be summarized as the emergence of a ‘bending, not breaking’ formula. Neither side could afford to terminate existing long-term contracts. In Gazprom’s view, completely severing the oil-gas link would undermine its current business model, as it would create problems for financing the next generation of upstream projects in Russia. These traditionally have been secured by oil-indexed, long-term, take-or-pay (TOP) contracts. Many international oil companies have the same approach, particularly when it comes to financing LNG projects. But Gazprom accepted that it had to adapt to the new realities of the gas market and adjusted its contract prices to bring them as close as possible to European spot gas prices. While retaining some elements of oil indexation, contract renegotiations also introduced spot market indexation and more flexibility in TOP obligations. These adjustments were also aimed at keeping buyers solvent, as European utilities faced heavy losses. For example, E.ON, like many European companies, launched arbitration processes against Gazprom as the company’s gas trading arm suffered a loss close to 1 billion euro from trading in 2011 (E.ON 2012). The average gas price at that time for Russian imports largely departed from an oil-linked one. While it is still slightly higher than the average German border price and the NBP, the prices for Russian long-term contracted gas and European spot gas have got closer. But this compromise is now being tested as never before, as the result of a new confrontation between the EC and Gazprom over the terms for sales of Russian gas to European consumers.
The Competition From Other Suppliers
During the period of weak demand in Europe in 2011-14 Gazprom faced competition from LNG and from pipeline suppliers (mostly Norway) that had adopted more flexible pricing strategies. The competitive pressures associated with the possibility of alternative gas supplies built up just as Russian gas was moving up on the cost curve, with the development of a higher-cost new generation of Yamal gas from the Bovanenkovskoye field.
But it is important to highlight that there never really was any competition in terms of volumes: Norway’s gas production increased marginally over the period 2009-14, while Algeria’s exports collapsed, Libya’s production was unreliable and supplies from Iran and Azerbaijan were constrained by pipeline capacity. In addition, a tightening LNG market in the period 2010-14 meant that LNG supplies moved away from Europe, while indigenous production dropped off, primarily in the North Sea. As a result, Russia increased its market share in Europe (the Europe 35 countries plus Turkey) to 30.5 percent in 2014 and more, to 31.7 percent in 2015, compared with just 22.8 percent in 2010 (Komlev 2015). During 2015 European gas demand recovered, while production declined further due to the introduction of a tighter production cap on Groningen’s gas production.
The Ukrainian Transit Corridor and the ‘Problem of 2020’
Since the collapse of the Soviet Union, when parts of the Soviet gas pipeline network became separated by the national borders of the newly independent states, Russia has been trying to address the problem of its almost complete

26Will There Be a Price War Between Russian Pipeline Gas and US LNG in Europe?
Challenges Faced by Russia in Europe
dependence on the Ukrainian transit corridor for deliveries of its gas to Europe. Russia had initial success through the construction of several gas pipelines avoiding Ukraine: the 33 bcm/y Europol system, that runs via Belarus and Poland into Germany; the 16 bcm/y Blue Stream, a direct subsea pipeline link to Turkey; and the 55 bcm/y Nord Stream, again via a direct subsea pipeline to Germany. Twenty years later, the problem has not been completely solved, but it has been greatly reduced as Ukraine’s share of Russian gas transit to Europe has declined steadily, from 90.4 percent in 1995 to only 39.3 percent in 2014 – and an estimated 40 percent in 2015, about 65 bcm (see Figure 8).
But the clock is ticking if Russia wants to remain a major supplier to Europe and to be in a position to repel the coming wave of LNG. The existing gas transit contract between Russia and Ukraine runs through the end of 2019. Both Russia and Ukraine have said repeatedly that they would not renew the existing contract: Russia wanted to avoid dependence on third country transit to the EU while Ukraine demanded doubling of the transit tariff for the Russian gas. Hence ‘problem-2020’ is how to ensure that Russian gas flows to its European customers without interruption. In particular, countries such as Hungary, Romania, Bulgaria and Turkey receive a large share of their total gas
0
20
40
60
80
100
120
140
160
180
1995
1996
1997
1998
1999
2000
2001
2002
2003
2004
2005
2006
2007
2008
2009
2010
2011
2012
2013
2014
2015
Transit via Ukraine Transit via Belarus Nord Stream Other Blue Stream
Figure 8. Key routes of Russian pipeline gas deliveries to Europe.
Source: KAPSARC analysis, Gazprom

27Will There Be a Price War Between Russian Pipeline Gas and US LNG in Europe?
Challenges Faced by Russia in Europe
supply through Ukraine. Simply stated, if no solution can be found and Ukraine cannot be used as a transit country, Russian exports would need to be dramatically reduced, to about 110 bcm. Several approaches, including a 63 bcm/y South Stream pipeline that would cross the Black Sea to Bulgaria and, more recently, Turkish Stream to Turkey, have been studied but failed to be developed for widely different reasons (Stern, Pirani and Yafimava 2015; Henderson and Mitrova, The Political and Commercial Dynamics of Russia's Gas Export Strategy 2015).
With less than four years left before the Russia-Ukraine gas transit contract expires, it has now become very urgent to find a solution. It is probably this realization that became the major driver behind the idea of Nord Stream 2 – a major expansion of the existing route for delivery of Russian gas to Germany from 55 bcm/y to 110 bcm/y by the addition of two new subsea trunk pipelines. But this project is facing strong opposition from the EC and East European countries concerned about security of gas supplies and the loss of transit fees. In the end, in addition to one or two more spurlines to Nord Stream, a new lease of life for the South Stream concept is also possible. This would address Italy’s concerns about contract obligations not being met via Nord Stream 2. Gazprom announced in February 2016 that it had agreed a new supply route to Southern Europe with Edison of Italy and Greece’s DEPA via a pipeline that would serve the companies’ markets – Italy and Greece – through other countries. One leg of the pipeline, with a destination in Bulgaria, appears possible. However, the clouds of uncertainty over the required midstream investments in Southern Europe probably mean that the problem of 2020' will not go away.
Flexibility and AsymmetryGazprom’s take on the situation in the European natural gas market has been set out by Gazprom Export representatives at international forums (Komlev 2015). It can be summarized as a view of a growing asymmetry of rights and obligations between buyers and sellers of gas in Europe that has followed the emergence of a new pricing model – hub-based pricing – alongside historically dominant oil-indexation in long-term contracts.
According to Gazprom Export, the interests of buyers and sellers are strictly balanced in long-term oil-indexed contracts. The company claims that the introduction of hub pricing to long-term contracts dramatically shifts the balance of interests in favor of the buyer. The take-or-pay obligations of the buyer lose their economic sense because the buyer can easily dispose of excess gas volumes by dumping them on the hub. To balance risks, shippers that have firm obligations to deliver must remove the nomination rights from buyers by introducing contracts with flat volumes and 100 percent take-or-pay. Otherwise, the balance of interests will be disrupted, because nomination rights in flexible contracts give advantages to buyers, including enhanced potential for price manipulation. The example of Norway’s Statoil demonstrates the pros and cons of a hub-based pricing system whereby, instead of spot prices, a buyer is obliged to fully receive contracted volumes under a 100 percent take-or-pay principle. Hub pricing leads to another type of long-term contract with loose obligations on both sides. The gas shipper in this case is given an option either to deliver gas at times of attractive prices or to divert gas to premium markets at times of low prices. Such an approach is already employed in the LNG trade on gas-indexed markets.

28Will There Be a Price War Between Russian Pipeline Gas and US LNG in Europe?
How a Price War in Europe Could Unfold
As analyzed in the first part of this report, Europe is likely to turn into a residual market for global LNG and potentially to be long on
gas for an extended period of time. It is important to highlight that Russia seeing its market share threatened is not unavoidable. If we consider 30 percent to be the market share that Gazprom would like to retain in the European gas market, this figure equates to volumes ranging from 158 to 162 bcm by 2020 – or 160 bcm on average – in standard bcm, which is actually higher than exports reached over 2010-14 (see Table 5).
One of the scenarios examined here (low LNG supply and high Chinese demand) allows Russia to reach such a volume. In other circumstances, Russian gas pipeline exports would be constrained.
In the case of low LNG supply and low Chinese demand, Russian pipeline gas exports would be slightly reduced compared with previous years’ levels, but this might not trigger a reaction from the Russian side because historically Russia has been ready to take the volume risk and accommodate wide fluctuations in Europe’s gas demand. However, the two scenarios with high LNG supply mean a significant reduction of Russia’s market share, but also volumes (see Figure 3 and Figure 9). Timing will be very important. While LNG supplies are rising in 2016, the buildup will be faster in 2017 and additional LNG volumes will be significant by 2018. In a similar environment, Saudi Arabia opted for not cutting production relative to increasing U.S. oil volumes and chose to let oil prices drop.
-20 0 20 40 60 80
Low supply, China high
Low supply, China low
High supply, China high
High supply, China low
bcmLow High
Figure 9. Volumes lost by Russia against an objective of 160 bcm by 2020.
Source: KAPSARC analysis.

29Will There Be a Price War Between Russian Pipeline Gas and US LNG in Europe?
But there are significant differences between the oil market and Saudi Arabia’s position there and the gas market and Russia’s role in it.
Saudi Arabian oil is not as dependent on one main market as Russian gas is. Until 2020, and maybe later, Russia’s main export market is, and remains, Europe.
Russia’s eastern strategy and attempts to pivot to Asia – notably to export pipeline gas to China and to develop LNG exports aimed at Asia-Pacific – is longer-term (post 2020) and its success is still uncertain.
There is no such thing as an OPEC for gas. The only attempt to follow OPEC’s example for the gas markets, the GECF, never succeeded in imposing itself as a credible imitation of OPEC.
Oil is a global commodity. Gas markets are regionalized. Only 9 percent of global gas demand is moved across oceans as LNG.
Regional spot prices and oil-linked long-term contract prices differ in terms of pricing mechanisms and levels. However, both oil-indexed gas prices and spot prices are falling, due to the drop in oil prices and to the increasing volumes of LNG arriving to the markets (KAPSARC 2016). At the same time, spot prices in Asia and Europe are converging.
While geopolitics are important in the oil markets, there has not been a similar push to diversify away from one specific oil supplier for security of supply reasons. (The issues around Iranian oil come mostly from sanctions). By contrast, Europe has been trying to diversify away from Russian gas for at least a decade.
The main question is how Russia – and specifically
Gazprom – will react to this threat? There is a body of evidence that Russia has preferred the ‘price over market share’ approach in Europe in the past and has taken a reactive approach, as explained below. But there are now many signs that Russia’s position is changing and that, this time, it is not ready to act as the swing supplier, especially if significant volumes of U.S. LNG are arriving in Europe. Nevertheless, switching to a market share strategy and potentially starting a price war would be a radical change in Russia’s behavior. Russia will also undoubtedly be wary of the possible reaction of the EC to any radical changes in Russian gas policies in Europe that might be considered as undermining fair market competition.
How Has Russia Met Similar Threats in the past?
The situation in 2009-10 has some parallels with the market conditions we sall see from 2017 onwards. The evidence from 2009-10, when oil prices declined sharply, is thus a possible indicator of how Russia and Gazprom might respond to the current crisis. When new challenges emerged earlier in this decade – the North American ‘shale gale’, growing competition for pipeline gas from LNG producers and structural changes in Europe’s gas market – Gazprom replied in a reactive rather than a proactive way. Back in 2009 Russia’s response to the buyer’s market in Europe was to view the problem of slack gas demand and shale gas as purely temporary phenomena. Russia’s short-term strategy, in expectation that the market would rebalance fairly quickly, was to make some concessions in order to retain long-term contracts and relationships with wholesale buyers in Europe. During the second half of 2009 and the first half of 2010, Gazprom went through a round of modifications to its export contracts with its key customers in Europe. The company reported in
How a Price War in Europe Could Unfold

30Will There Be a Price War Between Russian Pipeline Gas and US LNG in Europe?
How a Price War in Europe Could Unfold
2010 that many of its contracts had begun to include a spot component, varying from 7 percent to 16 percent for different customers. In addition, the minimum annual obligatory offtakes were reduced. As part of their subsequent compensation, Gazprom had to agree retroactive price discounts with many companies. It described these concessions as representing an average 10 percent base price discount but not introducing a higher proportion of spot-indexed sales. The concessions concluded lengthy negotiations that followed regular once-in-three-years contract reviews. Gazprom also said that European buyers wanted to introduce shorter contract review cycles. Despite all its concessions, Russia firmly rejected all suggestions of a complete move away from the indexation of gas prices to oil prices or changes in the traditional structure of long-term take-or-pay contracts.
The present situation, however, is significantly different from 2009:
In 2009, the drop in energy demand and commodity prices was strongly linked to that of economic growth, which recovered in 2010, along with some commodity prices and energy demand.
Oil prices dropped, but recovered quite quickly. As of early 2016, the words ‘lower for longer’ are in everyone’s minds. Oil prices are down to $40/bbl.
The volumes of LNG heading to Europe are potentially much larger.
Spot prices and especially spot cargoes were available at a large discount to oil-linked gas prices.
Gazprom has the firm belief that this time the situation has been reversed, with oil-indexed gas prices having a clear advantage over potential LNG
supplies, priced on a Henry Hub cost-plus basis. However, this could be a total misreading of the situation since aggregators are prepared to market their LNG purely on the basis of the variable costs, considering liquefaction and potentially shipping as sunk costs.
Meanwhile, Russia’s response to demand-side pressures in the European gas market has been to make tactical adjustments to its long-term contracts, especially where it is in competition with other sources of gas supply. These adjustments have included price discounts but key elements such as oil-indexed pricing and take-or-pay clauses have been retained. The advance of cheap coal into Europe’s power generation in 2012 became a litmus test for Russia’s strategy. Russia chose a ‘price over market share’ approach instead of opting for a ‘white knight’ role to protect traditional European gas users in the power sector by means of large price discounts, and all the indications are that this is Russia’s consistent long-term strategy. In effect, Russia has been a price taker, rather than a price setter, in Europe.
Figure 5, earlier in this report, and Figure 10 (below) demonstrate low correlation between the exported volumes and the export price for Russian gas, but high correlation between the value of total Russian pipeline gas exports and the average price of exported gas. These numbers, reported by Russia’s Central Bank, combine the revenues and average out prices for exports of Russian gas to both European and CIS countries. Unfortunately, there are no separate statistics in the public domain that would provide long-term Gazprom export price series for specific European countries. The figures tell the story of Russia’s meeting ups and downs in nominations by the buyers of its gas in Europe and CIS, but not embarking on a price war to protect its oil-linked gas export revenues from the negative effects of oil price collapses in both 2009 and 2014-15.

31Will There Be a Price War Between Russian Pipeline Gas and US LNG in Europe?
How a Price War in Europe Could Unfold
How Does Russia See Its Competitive Position in Europe?
In the absence of a challenge and a serious reduction in Russia’s gas market share in Europe, its previous strategy would likely continue to form the basis, in the short to medium term, for Russia’s ‘price over market share’ approach in Europe. As in previous cases, Russia’s line of thought may be a denial of the importance of the threat. After all, the country has for a long time dismissed U.S. shale gas as a temporary phenomenon.
Russia’s long-term strategy has so far been based on the assumption that Russian gas remains readily available to European buyers through their existing long-term contracts, while the prospects for unconventional gas in Europe remain clouded and
global LNG is likely to remain diverted toward the premium Asian markets. The decline in Europe’s indigenous production bodes well, in theory, for Russian gas, which is competitive in terms of costs of supply compared with other sources.
Another plank in Russia’s argument has been that LNG developers will be wary of potential overbuild of production capacities and the market risks this poses for high cost projects. Significant mismatch between supply and expected demand, according to this logic, was not seen as very likely because the high cost of supply for many marginal producers requires relatively high market prices before these projects can be profitable. As a result, high cost projects would find it difficult to obtain financing and reach financial investment decision (FID) if they fall in the ‘risk zone’. While this reasoning may be well founded in the long term, miscalculations are
0
2
4
6
8
10
12
0
10
20
30
40
50
60
70
80
2000 2005 2010 2015
Value of Russian gas exports Average export price (all pipeline exports)
Billi
on U
SD
Pric
e, $
/MM
Btu
Figure 10. Value of Russian pipeline gas exports.
Source: KAPSARC analysis, Russian Central Bank.

32Will There Be a Price War Between Russian Pipeline Gas and US LNG in Europe?
How a Price War in Europe Could Unfold
common. The current mismatch between supply and demand results from the decisions taken in a previous era of high energy prices: over the next few years we are going to witness ample LNG supply that was based on investment decisions taken in a period of high energy prices and seemingly insatiable demand for LNG in Asia. Based on our earlier analysis, Europe could become a ‘market of last resort’ for the volumes that could not be placed in Asia or elsewhere, especially in scenarios where LNG supply ramps up fast and there is limited LNG export reduction potential for existing suppliers. In this situation, LNG will challenge Russia’s market share in Europe.
Finally, Russia’s calculation is that U.S. LNG would be delivered based on full costs to Europe and Asia and thus would be largely uncompetitive against Russian gas. In that scenario, a consistent surplus of LNG that would have to find a market in Europe at any cost would be unlikely. Here again, Russia could be facing an unpleasant surprise as it is going to see many projects that it considers uneconomic still proceeding and delivering their supply to the European gas markets, based only on variable costs.
When that challenge comes, Russia could base a competitive response on pricing its gas not on its own marginal cost but on its average cost, to deter the threat. However, this would require a departure from its traditional policies.
How Low Can Russian Gas Prices Go?
The key new factor in 2015 was the reaction of the world in general and the FSU countries in particular to the strengthening of the U.S. dollar, the end of the commodities supercycle and tumbling oil prices. Russia, heavily dependent upon oil and gas revenues, managed to stabilize its economy via a
massive depreciation of its currency. As a result, the Russian ruble as of January 2016 was worth only 40 percent of its dollar value at the beginning of 2014 (See Figure 11). Consequently Russian costs, expressed in U.S. dollar terms, roughly halved. The ruble/U.S. dollar exchange rate returned to around 50 percent as of early June 2016. This reined in capital flight and stabilized Russia’s trade balance, thus restoring the international competitiveness of the economy.
We calculated the unit supply costs to Europe via Nord Stream for 2010-15 (See Figure 12). Gazprom reports its average production costs for seven key upstream production subsidiaries as well as its average Russian production tax (Mineral Resource Extraction Tax or MRET) on a unit basis. The company also reports its average transportation costs on a unit basis (Gazprom 2015). We estimated the indicative unit tariff for Nord Stream using the reported capital costs of the construction and taking into account the pipeline’s capacity utilization as $62/Mcm (Russian standard) which converts to $1.76/MMBtu. It is worth noting that if Nord Stream utilization was higher, the unit cost would fall significantly. The significant drop in the costs of supply in 2014, and especially in 2015 as the result of the ruble depreciation, resulted in a drastic reduction of the ruble costs in dollar terms. The oil price and the ruble/U.S. dollar exchange rate are perfectly correlated, which reflects Russia’s dependence on exports of hydrocarbons and the free float regime of the Russian currency. Thus, in a low oil price environment, the exchange rate acts as a shock absorber for Russian energy exporters. Conversely, when oil prices go up, the cost curve for Russian exporters shifts up.
At the average exchange rate in effect in the first quarter of 2016, the total cost of supply of Russian gas to Europe is now even lower than it averaged in 2015. The cost of supply of Russian gas to Europe

33Will There Be a Price War Between Russian Pipeline Gas and US LNG in Europe?
How a Price War in Europe Could Unfold
0.00
0.20
0.40
0.60
0.80
1.00
01.01
.2014
04.03
.2014
26.04
.2014
26.06
.2014
19.08
.2014
10.10
.2014
05.12
.2014
06.02
.2015
03.04
.2015
30.05
.2015
24.07
.2015
16.09
.2015
10.11
.2015
01.01
.2016
04.03
.2016
29.04
.2016
0
1
2
3
4
5
6
7
8
2010
2011
2012
2013
2014
2015
*201
6
Upstream Production tax (MRET) Transportation in Russia
Transportation Nord Stream 30% Export tax
$MM
Btu
Figure 11. Index of Russian ruble to US$ exchange rate, Exchange rate as of Jan. 1 2014 = 1.
Source: KAPSARC analysis, Russian Central Bank.
Figure 12. Cost of supply of Russian gas to Europe.
Source: KAPSARC analysis, Gazprom.

34Will There Be a Price War Between Russian Pipeline Gas and US LNG in Europe?
How a Price War in Europe Could Unfold
is just $3.5/MMBtu ($5.0/MMBtu including export tax) in 2015. In early 2016, when Russian currency reached its weakest point in the year so far, the cost of supply of Russian gas fell to $3.1/MMBtu ($4.4/MMBtu including export tax). As the ruble is gaining strength since its low point in early 2016, it is likely that the cost of delivering Russian gas will also increase. Oxford Institute for Energy Studies (OIES) estimated in early 2016 the delivered cost of gas at the German border to be $3.5/MMBtu (Henderson, Gazprom – Is 2016 the Year for a Change of Pricing Strategy in Europe? 2016). Very few other suppliers, apart from Qatar, can compete at such a low cost, giving Russia the option of lowering prices – because its intrinsic costs of delivering gas to Europe are much lower than current prices – to preserve its market share, if necessary.
A distinction should nevertheless be made between the cost of Russian gas and the price at which it will be sold. Internationally traded gas is usually priced either based on oil indexation or gas-on-gas competition (hub pricing). An analysis of Russia’s costs gives an idea on how low its gas prices could potentially go if the country decides to opt for a different pricing strategy.
How Competitive is US LNG Against Russian Gas?
The main competitor to Russian gas pipeline gas – in terms of volumes, prices and geopolitical implications – is U.S. LNG. The U.S. has become the world’s largest gas producer, ahead of Russia, and it is now the largest oil producer as well. Qatar has a bigger role now than the U.S. would have by 2020 on global LNG markets, but the geopolitical opposition to Russia is absent there: that country has never promoted the idea of ‘lessening Europe’s dependence on Russian gas for security of supply reasons’.
U.S. projects were sanctioned with the view that the resulting LNG would be more competitive than oil-indexed gas in Asia and would occasionally land in Europe depending on price differential and portfolio optimization between Asia and Europe. U.S. LNG prices are based on Henry Hub (HH) spot prices, rather than on oil indexation. The price formulae for Cheniere’s LNG is as follows:
Gas price = 115 percent * HH + liquefaction fee + transport/regas
The first two elements give the price at which an offtaker would buy the LNG from Cheniere. The liquefaction fee varies depending on contracts from $2.25/MMBtu to $3.5/MMBtu, though for most offtakers it is $3/MMBtu. Transport and regasification costs depend on where the market is located. With the gas prices prevailing as of 2016 in Europe, U.S. LNG exporters are losing money.
Based on a HH price of $2/MMBtu, and using Cheniere’s formula negotiated with BG ($2.25/MMBtu), LNG would reach Europe at about $5.55/MMBtu and Asia at about $6.55/MMBtu, assuming a transportation cost of $2/MMBtu to Asia. This compares with NBP prices at $4.6/MMBtu in July 2016 and Asian spot prices at around $5.5/MMBtu. Each $1 difference means that an offtaker of U.S. LNG will lose $49 million for each mtpa contracted on an annual basis (KAPSARC 2016). But for them this may be the lesser of two evils. In the future, U.S. LNG offtakers will face two choices: either to market LNG but with potential losses or to consider the liquefaction fee, and potentially also the cost of shipping, as a sunk cost. If Asian and European spot prices converge, most U.S. LNG aggregators would prefer to send LNG to Europe as it would mean lower losses due to shorter transportation distances. Asian buyers selling to their home market would face market forces such as liberalization in Japan which means that they would be unlikely to
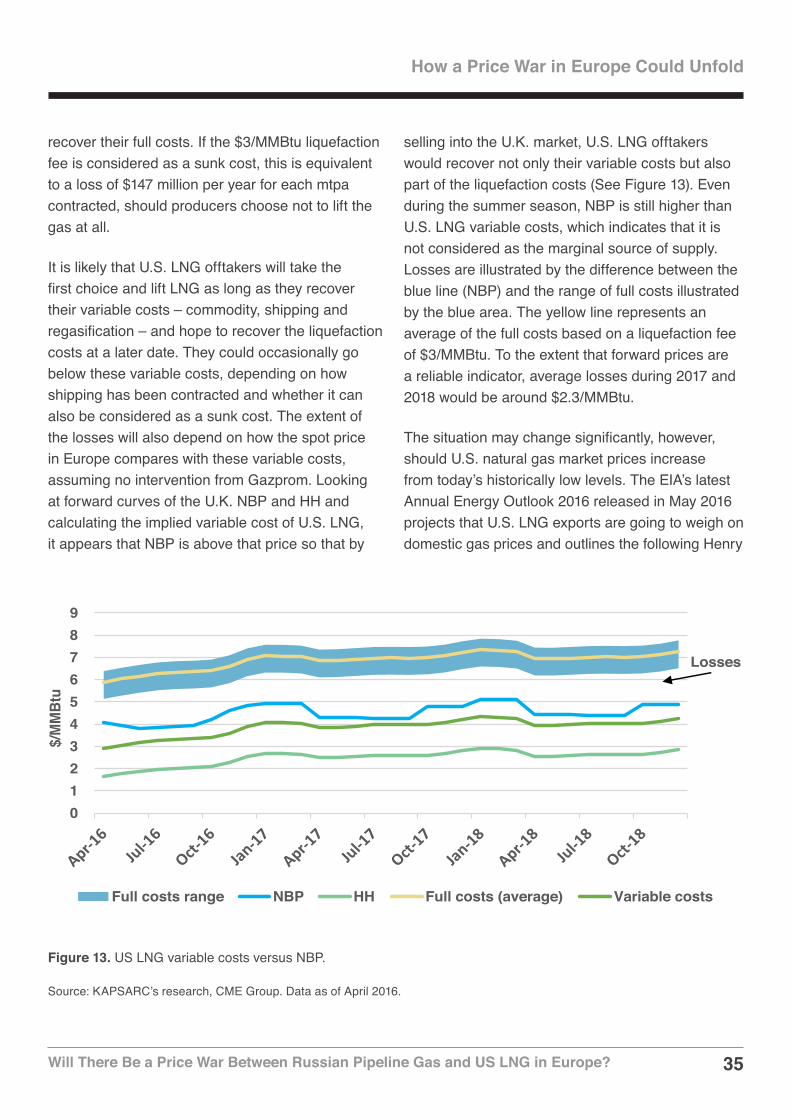
35Will There Be a Price War Between Russian Pipeline Gas and US LNG in Europe?
How a Price War in Europe Could Unfold
recover their full costs. If the $3/MMBtu liquefaction fee is considered as a sunk cost, this is equivalent to a loss of $147 million per year for each mtpa contracted, should producers choose not to lift the gas at all.
It is likely that U.S. LNG offtakers will take the first choice and lift LNG as long as they recover their variable costs – commodity, shipping and regasification – and hope to recover the liquefaction costs at a later date. They could occasionally go below these variable costs, depending on how shipping has been contracted and whether it can also be considered as a sunk cost. The extent of the losses will also depend on how the spot price in Europe compares with these variable costs, assuming no intervention from Gazprom. Looking at forward curves of the U.K. NBP and HH and calculating the implied variable cost of U.S. LNG, it appears that NBP is above that price so that by
selling into the U.K. market, U.S. LNG offtakers would recover not only their variable costs but also part of the liquefaction costs (See Figure 13). Even during the summer season, NBP is still higher than U.S. LNG variable costs, which indicates that it is not considered as the marginal source of supply. Losses are illustrated by the difference between the blue line (NBP) and the range of full costs illustrated by the blue area. The yellow line represents an average of the full costs based on a liquefaction fee of $3/MMBtu. To the extent that forward prices are a reliable indicator, average losses during 2017 and 2018 would be around $2.3/MMBtu.
The situation may change significantly, however, should U.S. natural gas market prices increase from today’s historically low levels. The EIA’s latest Annual Energy Outlook 2016 released in May 2016 projects that U.S. LNG exports are going to weigh on domestic gas prices and outlines the following Henry
0123456789
$/M
MBt
u
Full costs range NBP HH Full costs (average) Variable costs
Losses
Figure 13. US LNG variable costs versus NBP.
Source: KAPSARC’s research, CME Group. Data as of April 2016.

36Will There Be a Price War Between Russian Pipeline Gas and US LNG in Europe?
How a Price War in Europe Could Unfold
Hub gas price dynamics in nominal terms: $3.2/MMBtu in 2017, $3.8/MMBtu in 2018, $4.3/MMBtu in 2019, and $4.9/MMBtu in 2020. Brent oil price in the same forecast is seen as growing to $78.6/bbl (U.S. Energy Information Administration 2016).
What Could Be Russia’s Possible Defense Strategy?
While previous history suggests a more reactive than proactive response to changes, on this occasion the threat to Russia is multiple: pricing mechanisms, price levels, market share and finally geopolitics are all threatened. Two key elements of defensive strategy that Russia might adopt in the European gas markets could be restricting flexibility in its contracts with Europe, and putting more of its gas into European hubs to counterattack alternative suppliers. The latter being LNG, first and foremost.
Russia’s contract prices in Europe are largely based on oil indexation and are exposed to the risks of oil price dynamics, but Russia could offer discounts or sell more gas on spot market basis to protect its market share so long as its variable costs are covered.
Focusing on the pricing element, Gazprom could consider different strategies:
The reactive one, continuing to adapt contract pricing elements to bring its contract price into line with the spot gas price, though not significantly below it. This would be a continuation of Russia’s previous behavior and could see it remain as Europe’s flexible supplier.
A more proactive reaction would be moving to hub indexation – which has been done to some degree since 12.7 percent of Gazprom’s European exports are spot-indexed gas. This
is a radical departure from the company’s business model, as it prefers oil linkage. The move toward spot indexation in these contracts would imply that Gazprom would be willing to act as a price taker.
An aggressive defense of market share by dumping significant volumes on the spot markets (see box), letting prices drop and trying to undercut U.S. LNG, especially if spot prices drop just below the variable costs of U.S. LNG.
Both the second and third actions would require a radical rethink of Russian gas marketing strategy. But other producers with a similar stance have started to adapt, as demonstrated by Qatar, which is progressively adopting a ‘volume over value’ strategy by giving more flexibility to its customers and reducing some prices. This is demonstrated by the renegotiation of RasGas’ contract with Petronet.
In a gas oversupply scenario, spot prices are likely to remain low, potentially at even lower levels than the current $4-6/MMBtu in Europe and Asia. Higher oil prices may not lead to higher European spot prices. Meanwhile, contract prices are likely to act as a ceiling for spot prices. Such a configuration happened in 2009 as LNG supply started flooding gas markets while demand was down due to the recession. When oil prices rebounded, NBP spot prices remained low until mid-2010. In a low oil price environment (<$40/bbl), Russia’s oil indexed gas prices would be around $4-5/MMBtu, relatively in line with spot prices but, when oil prices recover durably to above $50/bbl, a gap is likely to emerge between Russia’s oil indexed gas prices – despite the partial spot indexation included in the post 2009 contract renegotiations – and spot prices. Even if the gap would not be as large as was observed in 2009 as Russia revised its prices closer to spot price levels, this could put Russia in the position

37Will There Be a Price War Between Russian Pipeline Gas and US LNG in Europe?
How a Price War in Europe Could Unfold
of marginal supplier and make it more difficult to compete against LNG supplies selling at spot-indexed prices.
The first option would likely fail to limit U.S. LNG exporters, so long as U.S. offtakers are able to recover their variable costs. As Gazprom would not attempt to act on the price levels, European buyers would opt to take their minimum contracted quantities of more expensive Russian gas and instead buy cheaper spot-indexed LNG, as they did in 2009. U.S. LNG offtakers would still incur losses but would be able to export. The loss of market share for Russia would depend on which scenario we are in (see Figure 9), but also on buyers’ procurement choices and how the price of Russian gas compares with European spot prices. If Gazprom applies this strategy to the cases where the threat from LNG volumes is the lowest (low LNG supply), the outcome could still be an increase in revenues. But in the scenarios with higher LNG volumes, the likely loss in Russian export volumes implies a reduction in revenues and letting alternative suppliers get a foot in Europe on a lasting basis. Gazprom would remain Europe’s main flexible supply provider without gaining benefits from this. In the present European context, the surge in U.S. LNG would meet the EC’s objectives of reducing its exposure to Russia’s ‘more expensive’ pipeline gas. Finally, it would not be likely to produce any positive effect on the demand side as prices would need to be below $3.5-4/MMBtu to have effective coal-to-gas switching.
The second option would be already a considerable departure from Gazprom’s strategy even if there were signs that Gazprom would sell increasing quantities of its gas at hubs. This could be coupled with the removal of flexibility in long-term contracts. Both Russian and U.S. gas would then be sold at hub prices and the outcome could vary
significantly depending on buyers’ portfolios and relationship with Russia and U.S. LNG offtakers. Again, depending on which scenario we are in, some U.S. LNG would be left unwanted and available at discount prices, thus reducing Russian pipeline gas exports. But should increasing volumes of U.S. LNG be stranded and offered at variable costs, below spot prices, these would likely undercut Russian export volumes. The more the oil price increased, the larger the gap between spot prices and Russia’s export prices would be, thus increasing the perceived price loss in the eyes of Gazprom.
The third option would be an effective price war, with Russia making sure that the contract price was set to levels that would deter U.S. LNG, or systematically dropping additional volumes of cheap spot gas on to European hubs through auctions (see Box 1 in Appendices). The gas arriving through the Nord Stream pipeline would neither be attached to a long-term contract nor expensive and therefore would be in accordance with the EC’s rules and targets. Considering this problem from Russia’s position, and the $4.4/MMBtu mentioned earlier as the minimum price at which Russia would be willing to sell its gas in Europe, this would mean a Henry Hub price close to $3/MMBtu if U.S. LNG was being sold on variable costs. Russia could potentially set its price even lower, to $3.1/MMBtu, by giving up on the 30 percent export tax, but we consider that this is probably a bridge too far. This is close to where HH gas prices are estimated to be by 2017-18, based on forward curves and at higher levels than today. There is no doubt that Marcellus Shale gas can be produced at such low costs and even below, but HH prices reflect a much wider supply/demand balance. Otherwise, if HH prices are higher, this means that U.S. LNG offtakers would choose to lose more than the liquefaction fee so as to compete, or they would opt not to lift their LNG. The only company that could potentially make money out of

38Will There Be a Price War Between Russian Pipeline Gas and US LNG in Europe?
the low oil price environment would be Cheniere, if it were to sell unlifted cargoes for which it has already obtained the liquefaction fee. In any case, U.S. LNG offtakers are likely to face substantial losses and it is questionable how long they would be able to sustain this situation. Should one company decide that it cannot afford to pay a liquefaction fee of $3/MMBtu and negotiate a lower fee, then U.S. LNG contracts would collapse like a house of cards. Interestingly, there are no renegotiation or price
review clauses in those U.S. LNG contracts currently in the public domain (KAPSARC 2016). In any case, such a scenario would see some, if not all, U.S. LNG suppliers in financial difficulty. However, as oil prices recover, so does the ruble, and the cost of delivering Russian pipeline gas to Europe may increase. Additionally, the more the oil price increases, the larger the gap will be between depressed spot prices and the original Russian gas price, which would make Russia more wary of starting such a move.
How a Price War in Europe Could Unfold

39Will There Be a Price War Between Russian Pipeline Gas and US LNG in Europe?
Conclusion
The outbreak of a price war between Russian pipeline gas and U.S. LNG is not inevitable. The dynamics of global supply/demand
offer some chance of avoiding that. However, according to our analysis, even in a scenario of low LNG supply and high Chinese demand, Russia’s market share in Europe would still be slightly below 30 percent. In the worst case scenario, Russia’s share would be pushed down to below 20 percent, below what the minimum take-or-pay in its existing contracts would allow. In practice, the outcome is likely to fall between these two extremes.
Our view is that Gazprom will start to react to the challenge of new LNG to Europe only when the competitive threat becomes apparent through a sustained reduction of its market share. This may not be immediate but could be progressive as LNG supply builds up, notably with the arrival of significant LNG supplies by 2017-18. The first signs of this threat will be European customers reverting to minimum TOP levels on their long-term Russian gas contracts, until doing so becomes insufficient to absorb excess LNG volumes. The Russian strategists may first consider that the competitive threat from the U.S. LNG suppliers, whom they know would struggle to recover their costs, is not serious. But in practice this LNG will come to the markets nonetheless, as aggregators are already selling LNG at a loss. This could force Gazprom management to reconsider the company’s previous policies. Russian gas, with its sunk upstream and transportation costs, continues to look attractive compared with U.S. Gulf Coast LNG on the basis of either full or variable cost of supply.
Should oil prices stay low, at around $40/bbl, the next few years will be painful for Gazprom and Russia as their revenues have to be substantially revised down. The impact of trying to keep U.S. LNG at bay would thus not be trivial for Russia’s
economy and for Gazprom, but ironically, a low price environment gives more chances to Gazprom to keep U.S. LNG at bay. This may be the lesser of two evils, if the loss of market share is not compensated for by higher sales prices. A price war would be cheaper to implement in a low oil price environment as gas prices are, or would be, already low and the gap between spot prices and Gazprom’s sales price is lower than in an high oil price environment.
In a scenario of oil prices recovering to above $50/bbl and Henry Hub levels not increasing from what they are today, the threat to Gazprom’s position could become very serious. The LNG demand side is unlikely to brighten either in Asia or in new markets, while LNG supplies could be incentivized to come quicker to the market (high LNG supply case). This would be a double blow to Gazprom as more LNG would potentially be forced back to Europe. Asia would nevertheless be more attractive than Europe in terms of sales price. In a $100/bbl price environment, Russian gas becomes priced at around $10/MMBtu and has to compete with U.S. LNG at $7-8/MMBtu, based on full costs. In that case, U.S. LNG offtakers would act as the cheap source of gas, while Russia would have to reduce its prices in order to compete and its flexible pipeline gas would be impacted. Many LNG projects would be able to cover their full costs and could thus compete with Russia in Europe consistently, not just over one investment cycle. In this situation, the optimum strategy for Gazprom would be, first, to reduce flexibility in its long-term contracts – thus removing from European consumers their current possibilities to optimize their seasonal and structural offtake – and, second, to put more of its gas for sale on to hubs. This would introduce the principle of gas-on-gas competition to compete against U.S. LNG, though Russia would still be challenged by the volumes coming to Europe.

40Will There Be a Price War Between Russian Pipeline Gas and US LNG in Europe?
Whether oil prices are high or low, another important element for Russia is the level of U.S. gas prices. Forward curves point to sustained low levels at or below $3/MMBtu for the years to come, but forward curves have been misleading in the past. Should U.S. gas prices recover, the position of Russia would improve. In the past two years the overall downward movements of oil prices and gas prices have been more or less synchronized, but these are different commodities driven by their own fundamentals. Should these fundamentals go out of sync, globally or regionally, the competitiveness of oil-indexed gas and cost-plus LNG might be altered from today’s calculations.
In addition, we have considered the duopoly Russia-U.S. at length, in light of market dynamics and geopolitical tensions between those two countries. Global gas markets are more complex. Significant changes in Europe in terms of prices and volumes would have worldwide implications. In Europe, it could force Norway to shut in some production as well as lead to a potential rebound in demand in the power sector, depending on coal price levels.
A significant drop in European gas prices would impact Asian spot prices, too – possibly triggering an increase in demand – and thus would also affect global supply/demand dynamics. But other new LNG suppliers would be hurt, too, notably Australian LNG projects that have recently come online. Finally the key player to watch will be Qatar, the low cost supplier for LNG: it is unlikely to enjoy seeing its revenues being impacted to that extent.
But these implications are mostly for the medium term, up to 2020. For the longer term, such a price war would discourage investments in LNG liquefaction in Russia and elsewhere in the world until prices recovered and would potentially create an even larger boom-and-bust cycle than the current low oil price environment could lead us to expect. Meanwhile if some U.S. LNG companies default and the LNG glut ends sooner than expected, this could trigger new LNG investment. On the bright side, though, lower gas prices are likely to have a positive effect on natural gas demand worldwide, as the gas industry tries to promote its product as an affordable, available and environmental acceptable (AAA) fuel.
Conclusion

41Will There Be a Price War Between Russian Pipeline Gas and US LNG in Europe?
References
BP. 2015. "BP Statistical Review of World Energy."
Central Bank of Russia. 2016. "External sector statistics." Central Bank of Russia. http://www.cbr.ru/statistics/?PrtId=svs
CME Group. 2016. "Coal (API2) CIF ARA (ARGUS-McCloskey) Futures Quotes." http://www.cmegroup.com/trading/energy/coal/coal-api-2-cif-ara-argus-mccloskey.html
CNPC ETRI. 2015. "Prospects of Gas Market in China." December 9. https://www.ief.org/_resources/files/events/iac-meeting---cnpc/cnpc-presentation.pdf
Corbeau, Anne-Sophie, and David Ledesma. 2016. LNG Markets in Transition: The Great Reconfiguration. KAPSARC publication, Riyadh: KAPSARC.
E.ON. 2012. "E.ON - Global Unit Gas." January 17. http://www.eon.com/content/dam/eon-com/en/downloads/ir/20120117_Global_Unit_Gas_.pdf
European Commission. 2016a. "Commission proposes new rules on gas and a heating and cooling strategy." February 16. https://ec.europa.eu/energy/en/news/commission-proposes-new-rules-gas-and-heating-and-cooling-strategy
European Commission. 2016b. "Decision of the European Parliament and of the Council on establishing an information exchange mechanism with regard to intergovernmental agreements and non-binding instruments between Member States and third countries in the field of energy and repealing." February 16. https://ec.europa.eu/energy/sites/ener/files/documents/1_EN_ACT_part1_v12.pdf
Gas Strategies. 2015. "The Gas Strategies Interview: Vladimir Drebentsov, head of Russia and CIS economics – BP." BP. March 20. http://www.bp.com/content/dam/bp-country/en_ru/documents/publications_PDF_eng/GSIS_%20Interview-Debrentsov-BP_Mar%202015%20V1.pdf
Gazprom Export. 2016. "Gazprom Export's Gas Auction for the Baltic States Completed." March 18. http://www.gazpromexport.ru/en/presscenter/press/1783/
Gazprom Export. 2015. "Pipeline LTCs in the "New World" of European Natural Gas." November 30. http://www.gazpromexport.ru/en/presscenter/speech/
Gazprom. 2014. Gazprom gas supplies to Europe in the framework of contractual obligations. September 17. http://www.gazprom.ru/press/news/2014/september/article201356/
Gazprom. 2015a. Speech by Alexey Miller at the conference "Europe and Eurasia: Towards a new energy model". April 13. http://www.gazprom.ru/press/miller-journal/029076/
Gazprom. 2015b. "ФИНАНСОВО – ЭКОНОМИЧЕСКАЯ ПОЛИТИКА ОАО «ГАЗПРОМ»." June 25. http://www.gazprom.ru/f/posts/38/513195/presentation-press-conference-2015-06-25-ru.pdf
Hellenic Shipping News. 2016. "http://www.hellenicshippingnews.com/ " http://www.hellenicshippingnews.com/. February 1 http://www.hellenicshippingnews.com/chinese-gas-imports-slowing-growth-but-high-targets/
Henderson, James. 2016. "Gazprom - Is 2016 the Year for a Change of Pricing Strategy in Europe?" Oxford Energy comment, Oxford. https://www.oxfordenergy.org/wpcms/wp-content/uploads/2016/02/Gazprom-Is-2016-the-Year-for-a-Change-of-Pricing-Strategy-in-Europe.pdf
Henderson, James, and Tatiana Mitrova. 2015. The Political and Commercial Dynamics of Russia's Gas Export Strategy. OIES paper, Oxford: OIES. https://www.oxfordenergy.org/wpcms/wp-content/uploads/2015/09/NG-102.pdf
IEA. 2016. Gas Trade Flows in Europe. Accessed June 2016. www.iea.org/gtf

42Will There Be a Price War Between Russian Pipeline Gas and US LNG in Europe?
KAPSARC. 2016. How Will Natural Gas Adapt to the New Price Environment. Riyadh: KAPSARC. https://www.kapsarc.org/?q=&all=publications
KAPSARC. 2016. The Impact of Low Oil and Gas Prices on Gas Markets: a Retrospective 2014-15. Riyadh: KAPSARC.
LNG World News. 2015. "LNG World News." http://www.lngworldnews.com/ June 4. http://www.lngworldnews.com/chinas-gas-demand-to-rise-significantly-by-2020/
Stern, Jonathan, Simon Pirani, and Katja Yafimava. 2015. Does the Cancellation of South Stream Signal a Fundamental Reorientation of Russian Gas Export Policy? Oxford Energy comment, Oxford: OIES. https://www.oxfordenergy.org/wpcms/wp-content/uploads/2015/01/Does-cancellation-of-South-Stream-signal-a-fundamental-reorientation-of-Russian-gas-export-policy-GPC-5.pdf
The Financial Times. 2016. "EU strengthens resilience to Russian gas supply threats." The Financial Times, February.
Timera Energy. 2016. "http://www.timera-energy.com/ " http://www.timera-energy.com/. February 8. http://www.timera-energy.com/dark-spreads-spell-the-death-of-uk-coal-plants/
U.S. Energy Information Administration. 2016. "Annual Energy Outlook 2016 Early Release."
Xinhua news. 2016. "China natural gas consumption growth slows." February 10. http://news.xinhuanet.com/english/2016-02/10/c_135088850.htm
References

43Will There Be a Price War Between Russian Pipeline Gas and US LNG in Europe?
Appendix
Project Country Capacity (mtpa) Online Date
Operating as of June 2016Queensland Curtis T1 Australia 4.25 Q1 2015
Queensland Curtis T2 Australia 4.25 Q3 2015
Donggi Senoro Indonesia 2 Q3 2015
Gladstone T1 Australia 3.9 Q4 2015
APLNG T1 Australia 4.5 Q1 2016
Sabine Pass T1 U.S. 4.5 Q1 2016
Gorgon T1 Australia 5.2 Q1 2016
Gladstone T2 Australia 3.9 Q2 2016
Under constructionAPLNG T2 Australia 4.5 Q3 2016
Malaysia LNG Malaysia 3.6 2016
Kanowit FLNG Malaysia 1.2 Q3 2016
Sabine Pass T2 U.S. 4.5 Q3 2016
Gorgon T2 Australia 5.2 Q4 2016
RestartAngola LNG Angola 5.2 Q2 2016
Table A1. LNG plants schedule – 2015-16.
Source: Companies’ reports, KAPSARC analysis.
2005 2006 2007 2008 2009 2010 2011 2012 2013 2014 20152015 over 2014, %
Germany 33.7 32.2 32.3 35.2 31.3 33.0 31.9 31.8 37.5 36.2 42.4 17.1%
Turkey 16.8 18.6 21.9 22.3 18.7 16.8 24.3 25.3 25.0 25.5 25.3 -1.0%
Italy 20.6 20.7 20.6 20.9 17.9 12.2 16.0 14.1 23.7 20.3 22.8 12.5%
United Kingdom 3.6 8.1 14.2 7.1 6.8 10.0 12.1 10.9 11.7 9.4 10.4 10.2%
France 12.3 9.4 9.4 9.7 9.4 8.3 7.9 7.7 7.6 6.6 9.1 36.8%
Poland 6.5 7.2 6.5 7.4 8.4 11.0 9.6 12.2 9.2 8.5 8.3 -2.0%
Hungary 8.4 8.2 7.0 8.3 7.1 6.5 5.9 4.9 5.6 5.0 5.5 10.1%
Austria 6.4 6.2 5.0 5.5 5.1 5.2 5.1 5.0 4.9 3.7 4.1 11.5%
Czech Republic 6.9 6.9 6.7 7.4 6.0 8.4 7.7 7.8 6.8 4.5 3.9 -11.7%
Slovakia 7.0 6.5 5.8 5.8 5.1 5.4 5.5 4.0 5.1 4.1 3.6 -13.2%
Table A2. Top 10 European importers of Russian gas.
Source: KAPSARC analysis, Gazprom export data. Note: Volumes converted to standard bcm (European calorific standard).
44Will there be a Price War Between Russian Pipeline Gas and US LNG in Europe?
Russian Gas and Spot MarketsHow could Russia drop volumes of gas on the spot markets? it may be asked. Gazprom is no stranger to spot markets through its subsidiary Gazprom Marketing and Trading (GM&T), which optimizes Gazprom’s own gas portfolio. In a sign that Russia was willing to test the mechanisms of putting its gas into direct gas-on-gas competition in Europe, in September 2015 Gazprom offered for sale, through an auction, the quantity of 3.2 bcm of gas at the St. Petersburg International Mercantile Exchange (SPIMEX) for delivery to the European market in the winter half year between Oct. 1 and March 31.
The key offerings in the auction included:
1.2 bcm divided into 48 lots of 60 MWh/h (0.13 mcm/d), each with the delivery point of Greifswald NEL, with an option for the buyers to take delivery at Gaspool.
1.4 bcm divided into 57 lots of 60 MWh/h (0.13 mcm/d), each with the delivery point of Olbernhau II, with the option for buyers to purchase entry capacity to the CZ gas transport network from Gazprom Export.
0.6 bcm divided into 22 lots of 60 MWh/h (0.13 mcm/d), each with the delivery point of Greifswald, OPAL exempted. Adjacent OPAL capacity with the exit point of Brandov could be purchased from the Network Operator.
This was the first time in the history of Gazprom’s marketing gas to Europe that it offered to sell spot gas effectively into the European hubs – apart from any volumes from GM&T. The results of the auction failed to live up to expectations, however, as Gazprom only managed to attract buyers for about 1 bcm out of the 3.2 bcm offered, despite a large number of initially interested participants. This can be explained by the pre-set confidential minimum price for the auction that Gazprom said was higher than the level set in Gazprom's long-term contracts, and higher than the spot and forward prices on the European gas hubs at the moment of the auction. As a result, the buyers only had an opportunity to take a view on the increase in winter hub gas prices, but not to arbitrage the prevailing winter forward prices, which limited buying interest. In the short term, Gazprom’s motivation for the auction was probably its desire to achieve higher utilization of the OPAL pipeline, and, correspondingly, greater gas throughput via Nord Stream. The title to the auctioned gas would be relinquished at the entry point to the EU, thus addressing EU market third-party access requirements. But the auction was an important signal that Gazprom has the means and instruments in place to put volumes into a hub to defend its market share in the future. Gazprom Export head Elena Burmistrova has indicated that the company plans to sell 10 percent of its exports, equivalent to around 15 bcm annually, by means of similar auctions.
Gazprom Export conducted another gas auction of natural gas for the Baltic States on March 15–17, 2016. As a result of that auction, deals for 80 lots with six clients were concluded, with a total volume of over 420 million cubic meters of gas sold.
“We have managed to sell more than three-fourths of the whole volume offered for the Baltics, to earn additional revenues, and to gain valuable experience,” said Alexander Medvedev, Deputy Chairman of the Gazprom Management Committee. “The auction's results demonstrated that a niche for auction gas trade exists, and that this trading scheme can successfully work on the Baltic market too. We are satisfied with the results of our second gas auction, and we will use this model for the other European gas markets as well,” said Elena Burmistrova, Director General of Gazprom Export (Gazprom Export 2016).
Appendix

45Will There Be a Price War Between Russian Pipeline Gas and US LNG in Europe?
Notes

46Will There Be a Price War Between Russian Pipeline Gas and US LNG in Europe?
Notes

47Will There Be a Price War Between Russian Pipeline Gas and US LNG in Europe?
About the Project
KAPSARC is analyzing the shifting dynamics of the global gas markets, which have turned upside down during the past five years. North America has emerged as a large potential future LNG exporter while gas demand growth has been slowing down as natural gas gets squeezed between coal and renewables. While the coming years will witness the fastest LNG export capacity expansion ever seen, many questions are raised on the next generation of LNG supply, the impact of low oil and gas prices on supply and demand patterns and how pricing and contractual structure may be affected by both the arrival of U.S. LNG on global gas markets and the desire of Asian buyers for cheaper gas.
Anne-Sophie Corbeau
Anne-Sophie is a research fellow specializing in global gas markets. Before joining KAPSARC, she worked for the International Energy Agency and IHS CERA.
Vitaly Yermakov
Vitaly is a visiting researcher at KAPSARC with expertise in global oil and gas markets and over 20 years experience with the world's largest E&P and consulting companies. He is head of the Center for Energy Policy Research at Russia's National Research University – Higher School of Economics.
About the Authors

48Will There Be a Price War Between Russian Pipeline Gas and US LNG in Europe?
www.kapsarc.org
Related Documents