Wildlife on the Working Landscape CHARTING A WAY FOR BIODIVERSITY AND AGRICULTURAL PRODUCTION TO THRIVE TOGETHER WHITE PAPER | AUGUST 2020

Welcome message from author
This document is posted to help you gain knowledge. Please leave a comment to let me know what you think about it! Share it to your friends and learn new things together.
Transcript
Wildlife on the Working LandscapeCHARTING A WAY FOR BIODIVERSITY AND AGRICULTURAL PRODUCTION TO THRIVE TOGETHER
WHITE PAPER | AUGUST 2020
American Farmland Trust / Farms Under Threat
C A M PA I G N L O G O G U I D E L I N E S
L O G O C O L O R PA L E T T E
Dark GreenLight Green
Hexadecimal: #527b39RGB: 82,123, 57
CMYK: 60, 15, 90, 34
Hexadecimal: #76aa52RGB: 117,170, 82
CMYK: 60, 15, 90, 0
3.28.18
Farms Under Threat:WhiteBackground Box:
Light Green
Farm Scene:Dark Green
1
WILDLIFE ON THE WORKING LANDSCAPE: CHARTING A WAY FOR BIODIVERSITY AND AGRICULTURAL PRODUCTION TO
THRIVE TOGETHER
A. Ann Sorensen and Mitchell C. Hunter
A white paper from the Farms Under Threat Initiative1 American Farmland Trust
August 20202
In the coming decades, agricultural land in the United States will need to produce more food, fiber, and energy to support an expanding population. But, just as importantly, these lands can and must play a stronger role in conserving and safeguarding biodiversity: all of the variety of life that can be found on Earth. The first step is to determine where and how agriculture can help conserve biodiversity while meeting the growing needs of our population. Keeping the most productive, versatile, and resilient agricultural lands in food production is a must. More marginal agricultural lands can provide additional wildlife habitat given the right incentives. However, even the land we use for intensive food and crop production may need to strike more of a balance between commercial production and the maintenance of biodiversity to ensure long-term sustainability.
1 This white paper was made possible by a grant from the Sarah K. deCoizart TENTH Perpetual Trust in support of AFT’s Farms Under Threat Initiative. More on Farms Under Threat at https://farmland.org/project/farms-under-threat/. 2 Suggested citation: Sorensen, A. A. and M. C. Hunter. 2020. Wildlife on the Working Landscape: Charting a Way for Biodiversity and Agricultural Production to Thrive Together. Washington, DC: American Farmland Trust.
2
Table of Contents
BACKGROUND ............................................................................................................................................ 3
INTRODUCTION .......................................................................................................................................... 3
WILDLIFE REQUIREMENTS ...................................................................................................................... 5
THE THREATS TO WILDLIFE HABITAT AND BIODIVERSITY .............................................................. 6
HIGH-VALUE HABITATS FOR WILDLIFE AND BIODIVERSITY ........................................................... 8
LAND-USE CHANGE THREATENS BIODIVERSITY ............................................................................. 12
DEVELOPMENT, TRANSPORTATION, AND ENERGY ...................................................................... 14
AGRICULTURE .......................................................................................................................................... 15
OVERCOMING CHALLENGES THAT WILDLIFE POSE TO AGRICULTURAL PRODUCTION ...... 26
INCREASING WILDLIFE HABITAT ON AGRICULTURAL LANDS ..................................................... 28
MOVING FORWARD: BALANCING LAND-USE DEMANDS ............................................................ 33
CONCLUSIONS ......................................................................................................................................... 35
APPENDIX I: USING MODELS AND METRICS TO DETERMINE THE CAPACITY OF
AGRICULTURAL LANDS TO SUPPORT WILDLIFE HABITAT ........................................................... 37
REFERENCES ............................................................................................................................................ 40
3
WILDLIFE ON THE WORKING LANDSCAPE: CHARTING A WAY FOR BIODIVERSITY AND AGRICULTURAL PRODUCTION TO THRIVE TOGETHER
A white paper from AFT’s Farms Under Threat Initiative
August 2020
BACKGROUND
In 2016, American Farmland Trust (AFT) launched Farms Under Threat, using advanced spatial analyses to map the location and quality of agricultural land converted to developed uses in the past and what might be at risk in the future. AFT released its first report, a national analysis of the conversion of agricultural land to developed uses between 1992 and 2012, in May 2018 (Sorensen et al. 2018). The second report (May 2020) considered the conversion of each state’s agricultural land to developed uses between 2001 and 2016 and analyzed state policy responses (Freedgood et al. 2020). A future report will focus on the impacts of development and climate change to 2040 in order to help states plan ahead. A critical part of this effort will look at how agricultural lands can balance the production of food, fiber, and energy with the need to conserve and safeguard biodiversity. As with other Farms Under Threat efforts, we will conduct a spatially explicit analysis of wildlife habitat and connectivity on and across agricultural land in the conterminous United States. This white paper will guide our analysis by providing a grounding in the literature on biodiversity and wildlife conservation on agricultural lands. Biodiversity makes our planet habitable and encompasses wild animals (mammals, birds,
3 More on what biodiversity means for human health along with documents and resources are available from the World Health Organization: www.who.int/globalchange/ecosystems/biodiversity/en/
fish, amphibians, reptiles, insects, etc.), plants, fungi, and microbes, which together form ecological communities in specific habitats. During the past 50 years, changes in land use coupled with logging, hunting, fishing, climate change, pollution, and invasive alien species have led to a rate of global change in nature that is unprecedented in human history (Diaz et al. 2019). Although agriculture has been a primary driver of land-use change and habitat destruction until now, how farmers and ranchers manage their agricultural lands from this point on could help reverse the decline in biodiversity.
INTRODUCTION
“The astounding wealth of biodiversity that we collectively share is on loan from future generations” (United Nations Environment 2019). Biodiversity plays a key role in achieving a healthy planet and human well-being (United Nations Environment 2019). Changes in biodiversity affect ecosystem functioning that is vital for growing food, delivering fresh water, and providing sources of fuel. Human health ultimately depends on our ability to maintain biodiversity. Losses can impact nutrition, the availability of traditional medicines, and patterns of infectious diseases.3 Biodiversity is inextricably linked to climate, and the cost of inaction for biodiversity conservation and restoration is extremely high because the loss of biodiversity is largely irreversible. The American public highly values wildlife, a highly visible proxy for biodiversity.
4
Biodiversity encompasses all life forms including animals, plants, and micro-organisms, but wildlife—which typically refers to wild game and non-game animals—is a useful proxy because its status is unique. It is considered a publicly owned resource held in trust and managed by federal and state agencies (US GAO 2001). In general, while the federal government manages threatened and endangered species, migratory birds and marine resources, the states manage big game and other mammals and birds. Often, critical habitat is privately owned. The U.S. Department of Agriculture (USDA) offers a variety of policy incentives and tools to farmers and ranchers that help them protect wildlife habitat, and USDA has found that many, if not most, farmers and ranchers are willing to voluntarily shift additional land and water resources into habitat provided they are compensated. Significant and unprecedented losses of biodiversity now threaten our planet. Out of the eight million known species of animals and plants, about one million are under threat of extinction. Even more are declining in numbers (Diaz et al. 2019). Since 1900, the average abundance of native species in most major terrestrial biomes has fallen by at least 20 percent, and the decline is accelerating. The direct drivers of this change, ranked in descending order, are changes in land (principally agriculture) and sea use, the direct exploitation of organisms (e.g. logging, hunting, fishing), climate change, pollution, and invasive alien species. We have 10 years to reverse the trajectory of climate change and biodiversity loss. If global emissions begin to fall by 2020, it is still possible to meet the Paris Agreement
4 The implications of the 2017 withdrawal of the United States, the second-largest greenhouse gas emitter, from the Paris Agreement are mixed because the withdrawal does not preclude individual states from stepping up (UN Environment 2019). The 24 U.S. Climate Alliance states are taking real, on-the-ground actions to help meet the Paris Agreement. More information about the Alliance at: http://www.usclimatealliance.org/
temperature goals4 (UN Environment 2019). But regardless of future mitigation or adaptation actions, some of the impacts are now irreversible and may continue for centuries even if greenhouse gas emissions are stopped (e.g. extinction of species and loss of biodiversity; rising sea levels). According to the World Economic Forum (2020), the top five global risks that are most likely to happen are extreme weather, climate action failure, natural disasters, biodiversity loss, and human-made environmental disasters. The top five global risks with the greatest impacts are climate action failure, weapons of mass destruction, biodiversity loss, extreme weather, and water crises. Although all sectors must focus on doing their part to meet the Paris Agreement temperature goals, for agriculture many of the same conservation practices that mitigate climate change also protect wildlife habitat and conserve biodiversity (Lin et al. 2020) (See Table 2). With the right mix of policies, incentives, and collective goals, agricultural lands can help slow down global warming and reverse the accelerating decline in biodiversity. Agricultural lands can provide more suitable wildlife habitat and help buffer between natural areas and more highly altered landscapes (Blann 2006). For AFT, the first step will be to spatially identify the key wildlife habitats, including movement corridors and refugia that are associated with agricultural lands. Not acting on these findings is no longer an option. The following review puts wildlife habitat threats in context, considers the capacity of agriculture to provide wildlife habitat, looks at how wildlife interacts with agriculture (both benefits and damages), mentions some of the policy tools and incentives used
5
to help make agriculture more compatible with wildlife, and introduces some illustrative examples of the interactions between agriculture and biodiversity.
WILDLIFE REQUIREMENTS
Wildlife need food and water, shelter from the weather and predators, and space to obtain food and water and to attract a mate. Intact natural systems generally support a broader range of habitats and benefits than altered systems (Vickerman and Kagan 2014). At the landscape scale, rangelands, grasslands, wetlands, forested lands, and undegraded waterways provide the highest valued wildlife habitats. A variety of productive wildlife habitat types are found on farms and ranches, but much of U.S. grasslands and wetlands and some of U.S. rangelands and forestlands have long since been plowed up and converted into croplands. Many of the original grasslands and wetlands in the Corn Belt, northern prairies, and California’s Central Valley were converted to agricultural use (U.S. Department of Agriculture 2011). Likewise, the original bottomland hardwood forested wetlands of the Southeast and the sagebrush habitats of the western rangelands are now producing crops and/or used for grazing livestock. Some critical areas have been maintained or restored as part of our federal land system; some privately owned agricultural lands are protected by short- or long-term easements (e.g. land in the Conservation Reserve Program (CRP), Wetlands Reserve Program (WRP), and Grasslands Reserve Program (GRP)5); and some forestlands are maintained and managed as woodlands associated with farms.
5 The Farm and Ranch Lands Protection Program, Grassland Reserve Program, Healthy Forests Reserve Program, Wetlands Reserve Program, and Wetland Reserve Enhancement Partnership were merged into the Agricultural Conservation Easement Program as part of the 2014 Farm Bill. More information about USDA conservation programs in the 2018 Farm Bill at: https://www.nrcs.usda.gov/wps/portal/nrcs/main/national/programs/farmbill/
Wildlife also need corridors or landscape linkages that allow them to move between habitats. These landscape linkages permit the daily and seasonal movements of animals within home ranges (connectivity) and facilitate the dispersal and genetic interchange between populations. Any comprehensive strategy for conserving biodiversity requires maintaining habitat across a variety of spatial scales and improving landscape connectivity is viewed as a critical strategy in allowing biodiversity to adapt to new conditions (Haber and Nelson 2015). In 2009, the Department of the Interior issued a Secretarial Order to establish a network of 22 collaborative “Landscape Conservation Cooperatives” (LCC) to provide scientific and technical expertise and capacity for meeting natural and cultural resource priorities. Managing for ecological connectivity was a priority
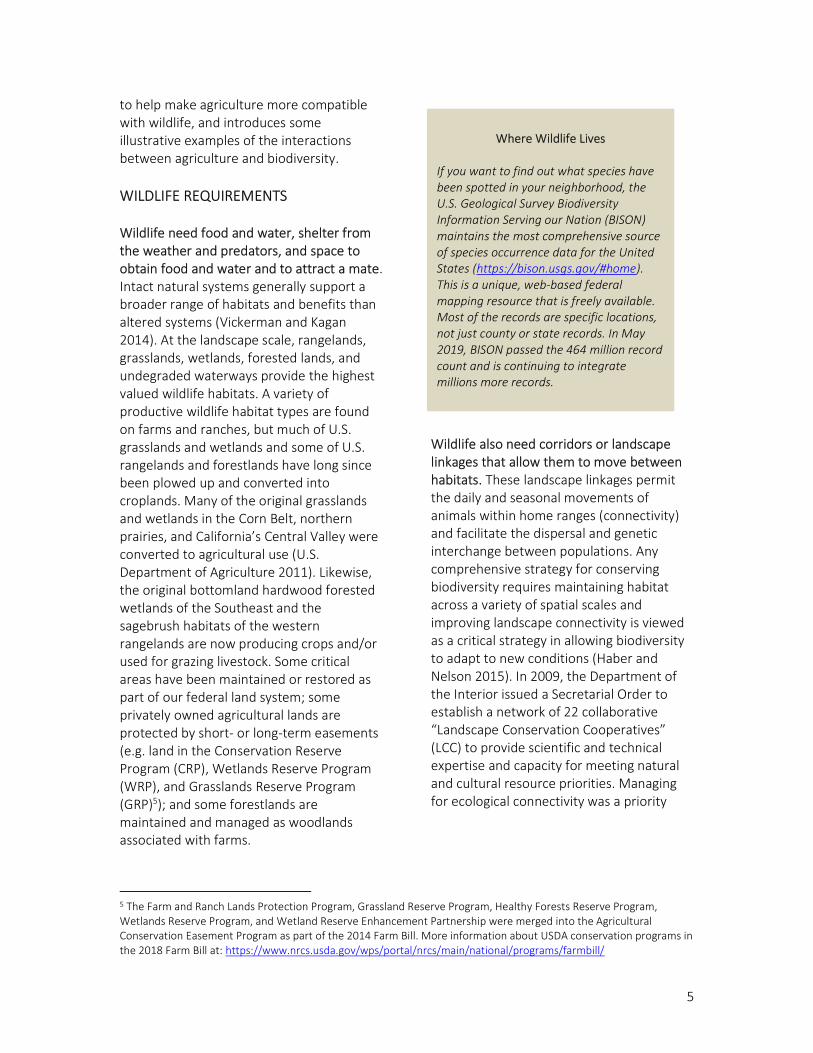
Where Wildlife Lives
If you want to find out what species have been spotted in your neighborhood, the U.S. Geological Survey Biodiversity Information Serving our Nation (BISON) maintains the most comprehensive source of species occurrence data for the United States (https://bison.usgs.gov/#home). This is a unique, web-based federal mapping resource that is freely available. Most of the records are specific locations, not just county or state records. In May 2019, BISON passed the 464 million record count and is continuing to integrate millions more records.
6
goal (National Academy of Sciences, Engineering and Medicine 2016).6 Connectivity is also a key component of the U.S. Forest Service 2012 Planning Rule which requires the agency to manage for ecological connectivity across land ownerships: the first such requirement in the history of U.S. public land management. For many species, persistence within a national forest depends on connectivity that extends beyond the forest boundaries (Haber and Nelson 2015). The Nature Conservancy’s Resilient and Connected Landscapes project has mapped climate-resilient areas and species movement across the eastern United States, showing vital corridors and landscape linkages that can facilitate species range shifts (Anderson et al. 2016). The analysis assumes that natural lands have the least resistance to species movement, agriculture and modified lands
6 More information on the LCCs at: https://lccnetwork.org/. Federal funding for the LCCs was withdrawn in April 2019, causing 16 of the LCCs to close or enter hiatus.
more resistance, and developed lands have the highest resistance.
THE THREATS TO WILDLIFE HABITAT AND BIODIVERSITY
The loss of biodiversity has critical implications for all of us—from the collapse of food and health systems to the disruption of entire supply chains (World Economic Forum 2020). The goods and services provided by biodiversity are estimated to be $33 trillion a year, close to the gross domestic product (GDP) of the United States and China combined. The current rate of extinction is tens to hundreds of times higher than the average over the past 10 million years, and the rate is accelerating. Over-exploitation, agriculture, and urban development are responsible for most of the declines in biodiversity. More than 80 percent of the nearly 9,000 threatened or
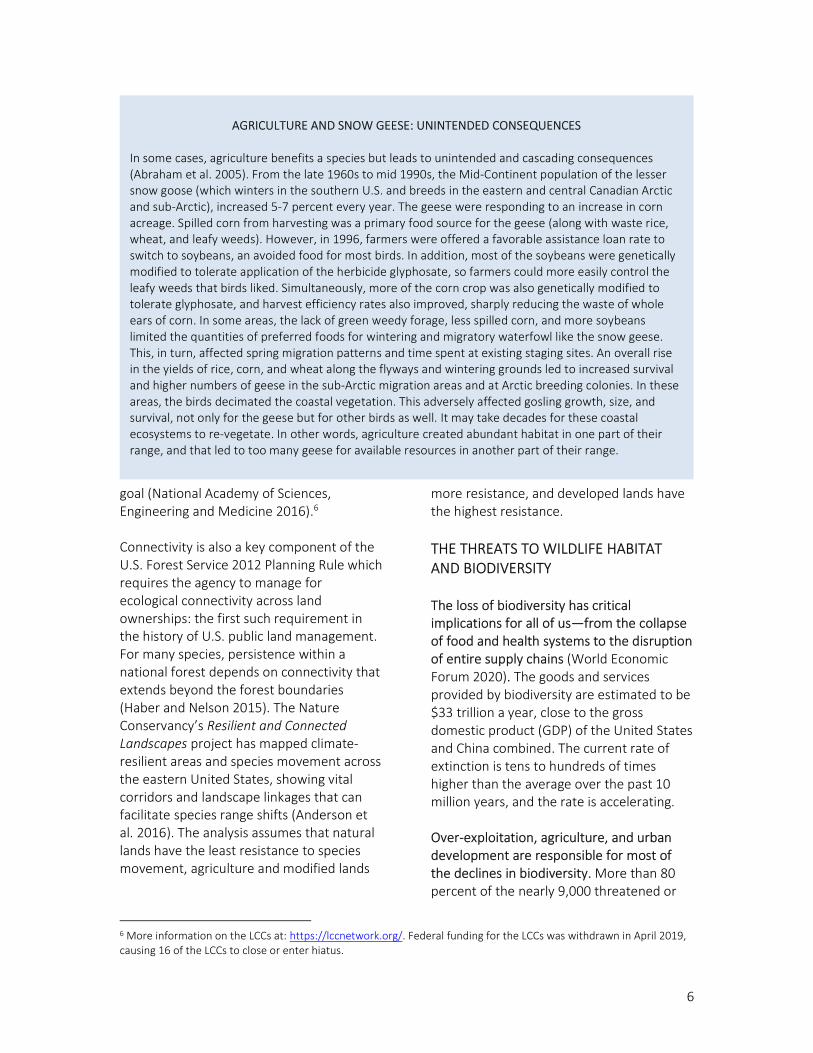
AGRICULTURE AND SNOW GEESE: UNINTENDED CONSEQUENCES
In some cases, agriculture benefits a species but leads to unintended and cascading consequences (Abraham et al. 2005). From the late 1960s to mid 1990s, the Mid-Continent population of the lesser snow goose (which winters in the southern U.S. and breeds in the eastern and central Canadian Arctic and sub-Arctic), increased 5-7 percent every year. The geese were responding to an increase in corn acreage. Spilled corn from harvesting was a primary food source for the geese (along with waste rice, wheat, and leafy weeds). However, in 1996, farmers were offered a favorable assistance loan rate to switch to soybeans, an avoided food for most birds. In addition, most of the soybeans were genetically modified to tolerate application of the herbicide glyphosate, so farmers could more easily control the leafy weeds that birds liked. Simultaneously, more of the corn crop was also genetically modified to tolerate glyphosate, and harvest efficiency rates also improved, sharply reducing the waste of whole ears of corn. In some areas, the lack of green weedy forage, less spilled corn, and more soybeans limited the quantities of preferred foods for wintering and migratory waterfowl like the snow geese. This, in turn, affected spring migration patterns and time spent at existing staging sites. An overall rise in the yields of rice, corn, and wheat along the flyways and wintering grounds led to increased survival and higher numbers of geese in the sub-Arctic migration areas and at Arctic breeding colonies. In these areas, the birds decimated the coastal vegetation. This adversely affected gosling growth, size, and survival, not only for the geese but for other birds as well. It may take decades for these coastal ecosystems to re-vegetate. In other words, agriculture created abundant habitat in one part of their range, and that led to too many geese for available resources in another part of their range.
7
endangered species are harmed by multiple threats (Maxwell et al. 2016). The percent of the threatened or endangered species affected by each threat are: 1) Over-exploitation, 72% (includes logging, hunting, fishing, and gathering plants); 2) Agricultural activity, 62% (includes crop farming, livestock farming, timber plantations, and aquaculture); 3) Urban development, 35% (includes housing, tourism and recreation, and industrial); 4) Invasive species and disease, 26% (includes invasive species, problematic native species, and introduced genetic material); 5) Pollution, 22% (includes agriculture, domestic waste, industrial, and airborne); 6) System modification, 21% (includes fire, dams, and other); 7) Climate change, 19% (includes storms and flooding, habitat modification, extreme temperatures, and drought); 8) Human disturbance, 14% (includes recreation, work, and war); 9) Transport, 14% (includes roads and railways, shipping lanes and service lines, and infrastructure; and 10) Energy production, 10.5% (includes mining, oil and gas, and renewable energy). Because overexploitation and agricultural activity tend to occur in fertile places where biodiversity is higher—and human development and population growth continue to increase—these patterns are likely to extend to many of the other species that have not yet been assessed. Adding to the crisis, protected areas that were intended to safeguard biodiversity in perpetuity have been undermined by widespread legal changes (Golden Kroner et al. 2019). Despite clear evidence that protected areas have been successful in helping reduce biodiversity loss, less than 15 percent of the world’s terrestrial and inland waters; less than 11 percent of the coastal
7 In 2018, President Trump issued Executive Order 13840, which redirected federal ocean policy towards a focus on economic growth and national security rather than preserving the ecological health of the ocean. https://eelp.law.harvard.edu/2018/09/national-ocean-policy-executive-order/ 8 The NCED database can be accessed at: https://www.conservationeasement.us/
and marine areas within national jurisdiction7; and less than four percent of the global ocean is covered by protected areas (United Nations Environment 2019). In addition, a third of the land area within protected area boundaries is already degraded by human impacts. Countries are easing restrictions on the use of protected areas, shrinking their boundaries, or eliminating legal protections entirely. These legal changes are referred to as “protected area downgrading, downsizing, and degazettement” (PADDD). Degazettment is the loss of legal protection for an entire protected area. Seventy-three countries have enacted 3,749 PADDD events over the last 200 years, removing 200,718 square miles from protection and tempering regulations in an additional 640,919 square miles (equal to one fifth of the United States). In the United States, 269 PADD events were enacted. Seventy-eight percent of the global PADDD events have occurred since 2000. The majority of PADDD actions are associated with industrial-scale resource extraction and development. Only an estimated 40 million acres of natural habitat are permanently protected by easements in the United States. The National Conservation Easement Database (NCED) currently contains about 49 percent of the publicly held easements and 90 percent of the privately held easements.8 In the United States, habitat destruction, pollution, disease, overharvest, and the spread of invasive species threaten biodiversity. Future population growth is expected to increase the frequency of threats to biodiversity from urbanization, water development, land conversion, and agriculture (Wilcove et al. 1998). In the eastern portion of the United States, nearly
8
400 species are awaiting evaluation for potential protection under the Endangered Species Act.9 Agrobiodiversity, the genetic diversity that backstops our food supply, is also at risk. Since the 1900s, 75 percent of plant genetic diversity has been lost as farmers have abandoned their multiple local varieties for genetically uniform, high-yielding varieties (Food and Agriculture Organization 1999). Just a small number of crops now form the cornerstone of a global food economy (Shelef et al. 2017). This lack of genetic diversity means that crops are more susceptible to abiotic and biotic stresses and the catastrophic losses that can result from plant diseases or insect pests (see text box on agrobiodiversity, pg. 34). Although there are an estimated 30,000 edible plant species worldwide, humans cultivate only about 150 of them, and of those, 30 plant species comprise the majority of our diets. The status of animal genetic diversity is also insecure. There are 8,800 recognized animal breeds worldwide. Sixty-five percent of the existing local animal breeds are classified as “status unknown” because of missing population data, 20 percent as “at risk,” and only 16 percent are “not at risk” (United Nations Environment 2019). The long-term declines in the number of varieties of crops and breeds of livestock continues, and much of this diversity, including wild relatives and lesser used species, still lack sufficient protection (UN Environment 2019). In addition, the sources of new genetic diversity that could be harnessed by agriculture are also at risk due to land use changes. Fallow fields and natural lands support large numbers of species that can be useful for agriculture, and their loss is speeding the genetic erosion of agrobiodiversity.
9 U.S. Fish and Wildlife New England Field Office: www.fws.gov/newengland/endangeredspecies/at-risk.html
HIGH-VALUE HABITATS FOR WILDLIFE AND BIODIVERSITY
Forests are home to 80 percent of the world’s terrestrial species. In the United States, forests cover about one third of the land area and range from wildland forests to urban forests (Alig et al. 2010). More than half the woods and forests in the United States (441 million acres) are owned or managed by some 11 million private owners (U.S. Forest Service 2015). Most are located in the east. Collectively, forests provide a variety of habitats for wildlife, including white-tailed deer, opossums, porcupines, red foxes, and raccoons. The number and type of wildlife species typically shift as a forest stand matures (U.S. Department of Agriculture NRCS 2002). Tree density, canopy height, percent canopy closure, and the number of standing and fallen dead trees are key structural features that affect habitat quality. Some wildlife species are dependent on a particular forest type or successional stage. Forests provide both shelter and food with seeds, berries, fleshy fruits, herbaceous forbs, legumes, grasses, buds, twigs, and leaves of wood plants all providing food for various wildlife species. Lakes, rivers, streams, and creeks support wildlife and aquatic organisms: Lakes, rivers, and streams cover about two percent of the land surface in the contiguous 48 states (Conservation Science Partners 2020) and provide critical habitat for aquatic species along with providing habitat and water for terrestrial species. Aquatic habitats are undergoing tremendous change due to a multitude of stressors, including land and water use changes; invasive species and disease outbreaks; and increased drought,
9
flooding, and water temperatures.10 Streams are the dominant source of water in most rivers, and the majority of tributaries are perennial, intermittent, or ephemeral headwater streams (U.S. Environmental Protection Agency 2015).11 Headwater streams provide habitat for complex life-cycle completion; refuge from predators, competitors, parasites, or adverse physical conditions in rivers (e.g., temperature or flow extremes, low dissolved oxygen, high sediment); and reservoirs of genetic- and species-level diversity. Use of headwater streams as habitat is especially critical for the many species that migrate between small streams and marine environments during their life cycles (e.g., Pacific and Atlantic salmon, American eels, certain lamprey species). Wetlands and open waters in riparian areas and floodplains are physically, chemically, and biologically integrated with rivers and can be critical for feeding and spawning during high water. Aquatic reptiles and amphibians typically use both streams and riparian/floodplain areas to hunt, forage, overwinter, rest, or hide from predators. Floodplains are important foraging, hunting, and breeding sites for fish, amphibians, and aquatic invertebrates. Wetlands rival tropical forests as the most biologically productive habitats in the world. Wetlands are defined by having wetland vegetation (hydrophytes), hydric soils, and wetland hydrology. Wetland ecosystems make up four percent of the Earth’s surface yet comprise about 45 percent of the realized value of natural ecosystems (Gray et al. 2013). Wetlands in the United States
10 USGS Fisheries Program covers aquatic habitats at: www.usgs.gov/ecosystems/fisheries-program/science/aquatic-habitats 11 In January 2020, EPA announced a major rollback to protections for streams and other smaller bodies of waters (the Navigable Waters Protection Rule), narrowing the scope of the Clean Water Act. A number of states and environmental groups already are publicly committed to challenging the Final Rule in federal courts across the country. Overview of the NWPR at: https://www.epa.gov/nwpr/navigable-waters-protection-rule-overview 12 For information about wetlands and how USDA NRCS has been protecting them for over 25 years, see: www.nrcs.usda.gov/wps/portal/nrcs/detail/national/newsroom/features/?cid=nrcseprd1398821
support nearly 200 species of amphibians, 5,000 plant species, and one third of all native bird species including beavers, otters, bobcats, minks, alligators, turtles, and frogs. About half of the animals that are endangered or threatened depend on wetlands, and most freshwater fish need wetlands for all or part of their life. About 53 percent of wetland acreage in the conterminous United States has been lost since the 1900s, with some states (e.g. California, Arkansas, and Illinois) losing more than 90 percent of their wetlands. Interior wetlands comprise the majority of wetland acreage in North America (94 percent). Seventy-five percent of U.S. wetlands are located on private and tribal lands.12 The most common wetland type is forested wetlands associated with rivers (hardwood bottomland). In the north-central United States, millions of depressional wetlands (prairie potholes) support wildlife. Wetlands with herbaceous vegetation can be emergent wetlands (semi-permanent to permanently flooded) or moist-soil wetlands (temporarily or seasonally flooded). Until the 1970s, wetlands were regarded as swampy lands that bred diseases, restricted overland travel, impeded farming, and were generally not useful (Dahl and Allord 1997). From the mid-1950s to the mid-1970s, an estimated 87 percent of the wetland losses were due to agricultural conversion. However, increasing awareness of the environmental values of wetlands began to be translated into protective policies in the
10
latter part of the 20th century. Wetlands on agricultural land now receive potential protection from the “swampbuster” provision of the federal farm bill, which withholds agricultural subsidy payments from farmers who drain, fill, or significantly alter wetlands with the intent of farming.13 Grasslands can contain as many as 89 vascular plant species in a square meter (roughly 10 square feet) (Wilson et al. 2012). Grasses and broad-leafed herbaceous plants or forbs dominate grassland ecosystems, and they are characterized by climates that have distinct wet and dry seasonal patterns (hot summers, extremely cold winters) (Grassland, Shrubland, Desert and Tundra Technical Team 2011). Grasslands transition toward desert or shrublands in the drier regions of the West and Southwest and merge into temperate forest along the coast in the Mid-Atlantic region. When Europeans first settled in North America, the northern temperate grasslands of the United States and Canada covered almost 600,000 square miles. However, these deep-rooted, densely packed plants also produced deep, rich topsoils that are ideal for cultivating crops. Only five percent of the original prairie in the United States remains, and the tallgrass prairies and savannas of the mid-western states have declined by as much as 99 percent as a result of habitat fragmentation, conversion to cropland, and undesirable habitat changes (Glaser 2012). Today, the native grassland ecosystem is considered the most endangered ecosystem in the United States, yet the remaining fragments provide habitat for numerous species
13 The Highly Erodible Land Conservation and Wetland Conservation Compliance provisions (Swampbuster) were introduced in the 1985 Farm Bill with amendments in 1990, 1996, and 2002. The wetland conservation provisions sharply reduced wetland conversions for agricultural uses, from 235,000 acres per year before 1985 to 27,000 acres per year from 1992 through 1997. Overview of the Wetland Conservation Provisions (Swampbuster) at: https://www.nrcs.usda.gov/wps/portal/nrcs/detailfull/national/water/wetlands/?cid=stelprdb1043554 14 For more information about rangelands and indicators of rangeland health, visit the USDA NRCS Rangelands page at: https://www.nrcs.usda.gov/wps/portal/nrcs/detailfull/national/landuse/rangepasture/range/?cid=STELPRDB1043345
including bison, antelope, birds, gophers, prairie dogs, coyotes, and insects. More than 80 percent of U.S. grasslands are now privately owned (La Follette and Maser 2017). In the north-central part of the U.S., the prairie pothole region contains wetland-grassland complexes that are critical to producing 50-80 percent of the continent’s duck populations and provide breeding habitat for more than half of the grassland bird species breeding in North America. Converting grasslands located near wetlands may have a disproportionate impact on the habitat potential of the surrounding areas, beyond just acres directly converted (Field to Market 2016). Rangelands encompass a wide variety of landscapes including grasslands, shrublands, wetlands, tundra, and deserts. They include native grasses, grass-like plants, forbs, or shrubs suitable for grazing or browsing and introduced forage species that are managed like rangeland.14 Rangelands make up about 50 percent of the land area in the world (Hobbs et al. 2008). During some part of the year, rangeland ecosystems are associated with 84 and 74 percent of the total number of mammalian and avian species, respectively, found in the U.S. (Flather and Hoekstra 1989). Rangeland ecosystems sequester carbon and provide critical habitat for pollinators and numerous imperiled species, including the lesser prairie chicken, black-footed ferret, Rocky Mountain bighorn sheep, and Sonoran pronghorn. Before the European settlers arrived in the continental United States, rangelands covered a billion acres. Now they occupy about 662 million
11
acres, two thirds of which are privately held agricultural land (Reeves et al. 2018). Rangelands are also commonly used for energy production, including oil, gas, and, more recently, wind and solar. Lands retired from agriculture and protected by short- and long-term easements also provide important wildlife
15 Land enrolled in CRP is environmentally sensitive land that has been set aside due to serious erosion or other problems and converted from cropland to permanent vegetative cover under 10-year contracts with USDA. As of December 2019, about 22 million acres were enrolled in the CRP program. Enrollment peaked at over 36.8 million in 2007. It was capped at 32 million acres in the 2008 Farm Bill and 27 million acres in the 2018 Farm Bill. Enrollment in recent years has tended to decline because of increased demand for cropland, particularly for corn production to produce ethanol, but USDA expects the sign-up in 2020 to be the largest in a decade considering the number of acres lost in 2019 to weather disasters. More information on the CRP at: https://www.fsa.usda.gov/programs-and-services/conservation-programs/conservation-reserve-program/
habitat. The tens of millions of acres enrolled in CRP15 and smaller easement programs like WRP and GRP have benefited wildlife of all kinds. A comprehensive review of studies showcases what researchers have learned about agricultural land retirement programs since CRP was initiated in 1985 (Allen and Vandever 2012). For example, the studies show it is not possible to furnish
RING-NECKED PHEASANTS: INTRODUCED AND DEPENDENT ON FARMLAND
The ring-necked pheasant was introduced over a century ago from Asia and by the 1880s, sustainable breeding populations had been established in most of the U.S. (U.S. Department of Agriculture NRCS 1999). Pheasants are highly dependent on habitats in and around croplands and agricultural landscapes. Their two most important habitat needs are an adequate winter cover of shrubs and dense grass that provide overhead protection from wind and snow and nesting cover of grasses and stubble high enough to conceal nests but allow easy travel on the ground. These needs are met by corn, sorghum, oats, wheat, and barley stubble, unmowed wild haylands, native grasslands, grassy roadside ditches, fencerows, windbreaks, shelterbelts, woodlots, and gassy/shrub mixed field corners. However, many of the production techniques introduced within the last half of the 20th century reduced both protective cover and nesting sites. The North American Breeding Bird Survey noted that there was an overall population decline of about 32 percent between 1966 and 2014. During this time, as smaller diversified farms were being replaced by larger farms growing just one or two crops, farmers removed many of their hedgerows and overgrown fencerows and eliminated edge habitat. Some replaced open, native grasslands and other idle lands with non-native grasses and moved up hay-mowing dates. The increased use of insecticides with high toxicity to birds (particularly organophosphates and carbamates) also appeared to be a significant contributing factor in the decline (Mineau and Whiteside 2013).1 In 1985, the Conservation Reserve Program (CRP) was established to compensate farmers for retiring marginal lands and helped conserve and restore some habitat for the pheasant. It also benefited quail populations. In 2012, a national strategy to increase and maintain pheasant populations (Midwest Pheasant Study Group 2012) set a goal of adding 13 million CRP or other conservation acres to the 2010 CRP total within the pheasant range (20 states), bringing CRP total acreage to 40 million acres nationwide—along with promoting no-till agriculture, active grassland management, and later mowing of hay. Since then, the 2018 Farm Bill capped enrollment in the CRP at 27 million acres. increased use of insecticides with high toxicity to birds (particularly organophosphates and carbamates) also appeared to be a significant contributing factor in the decline (Mineau and Whiteside 2013). Note that this analysis covered 1980-2003 and these insecticides have since been gradually withdrawn from the market.
12
ideal habitat for all species on any particular unit of land at any given time, so objectives must be clearly defined. CRP is one of most beneficial programs for the enhancement of wildlife, restoring grassland habitat that is critically missing from many landscapes. The effects of other conservation practices (e.g. conservation tillage, grass border strips, etc.) on lands remaining in active production also have beneficial effects on wildlife but are not easy to quantify (see Table 2). Finally, grasslands support more beneficial insects than pest species and, properly managed, permissive uses of CRP grasslands benefit habitat quality over the long term. These wildlife and biodiversity benefits are lost when CRP lands and other conservation practices are converted back to crop production. In addition, most farms and ranches protected by permanent easements protect biodiversity by implementing conservation plans and improving the wildlife habitat on their farms. About 6.5 million acres of farmland and ranchland are protected by permanent easements (Freedgood et.al. 2020). AFT surveyed Farm and Ranchland Protection Program (FRPP) participants and found more than two-thirds of respondents had a written conservation plan; 92 percent reported progress in implementing the plan; and half had completely implemented their plan (American Farmland Trust 2013). Twenty percent had used their easement proceeds to install or expand conservation practices. Forty-one percent had applied practices to protect or improve wildlife habitat. In addition, 75 percent reported applying at least one conservation practice, many applied multiple practices, and more than two-thirds had implemented practices to prevent soil erosion and to protect water quality. In comparison, only 23 percent of operators responding to the 2007 Census of Agriculture survey said they used
conservation methods to achieve comparable outcomes.
LAND-USE CHANGE THREATENS BIODIVERSITY
Since 1970, land-use change has had the largest relative negative impact on terrestrial and freshwater ecosystems. All high value wildlife habitats had been significantly altered by multiple human activities including development, transportation, energy use, and agriculture (Diaz et al. 2019). Impacts of land-use change on native animals can vary (Marzluff and Ewing 2001). Development has the greatest local effect on native animals because it is almost always permanent and very dissimilar to native land covers. In comparison, agriculture is intermediate in its effects on native animals and varies depending on the intensity of land conversion and use, while limited, well-managed timber harvest has the least effect on native animals provided vegetation grows back rapidly. The resulting pollution from various land uses also causes problems for wildlife. For freshwater ecosystems, agricultural nonpoint source pollution (pesticides, fertilizers, soil sediments, etc.), runoff from existing and new development, and altered hydrologic regimes due to dams, impoundments, and land-use changes pose significant threats (Richter et al. 1997). In the most recent national aquatic resource surveys (2008-2012), 55 percent of U.S. rivers were considered “poor” and 23 percent just “fair” (U.S. Environmental Protection Agency 2016a). Only 21 percent were considered “good” with healthy biological communities. Conditions appeared to be getting worse over time.
13
Forty percent of lakes had excessive levels of total phosphorus, and 35 percent had excessive levels of total nitrogen (U.S. Environmental Protection Agency 2016b). Thirty-one percent of lakes had degraded benthic macroinvertebrate communities while 21 percent had degraded zooplankton
communities. A comparison of the 2007 and 2012 National Lakes Assessments indicated little change between surveys. Land-use changes continue to fragment habitat at an alarming rate. In 2019, the Center for American Progress and
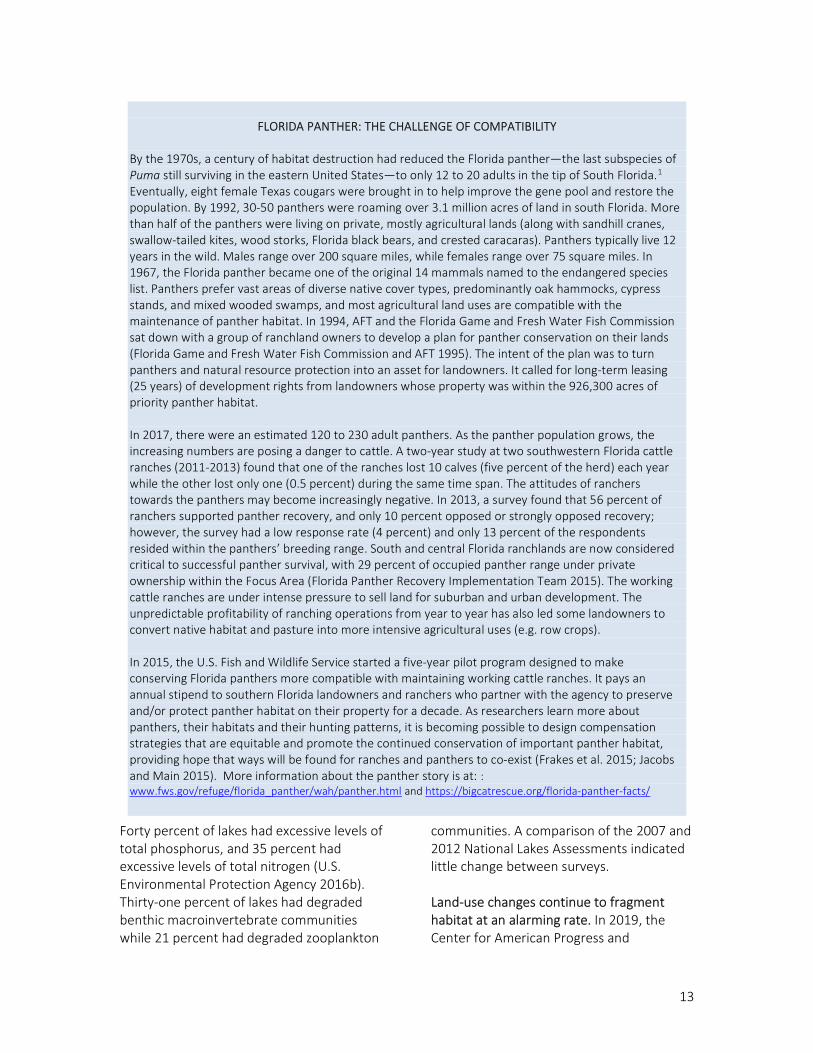
FLORIDA PANTHER: THE CHALLENGE OF COMPATIBILITY
By the 1970s, a century of habitat destruction had reduced the Florida panther—the last subspecies of Puma still surviving in the eastern United States—to only 12 to 20 adults in the tip of South Florida.1 Eventually, eight female Texas cougars were brought in to help improve the gene pool and restore the population. By 1992, 30-50 panthers were roaming over 3.1 million acres of land in south Florida. More than half of the panthers were living on private, mostly agricultural lands (along with sandhill cranes, swallow-tailed kites, wood storks, Florida black bears, and crested caracaras). Panthers typically live 12 years in the wild. Males range over 200 square miles, while females range over 75 square miles. In 1967, the Florida panther became one of the original 14 mammals named to the endangered species list. Panthers prefer vast areas of diverse native cover types, predominantly oak hammocks, cypress stands, and mixed wooded swamps, and most agricultural land uses are compatible with the maintenance of panther habitat. In 1994, AFT and the Florida Game and Fresh Water Fish Commission sat down with a group of ranchland owners to develop a plan for panther conservation on their lands (Florida Game and Fresh Water Fish Commission and AFT 1995). The intent of the plan was to turn panthers and natural resource protection into an asset for landowners. It called for long-term leasing (25 years) of development rights from landowners whose property was within the 926,300 acres of priority panther habitat. In 2017, there were an estimated 120 to 230 adult panthers. As the panther population grows, the increasing numbers are posing a danger to cattle. A two-year study at two southwestern Florida cattle ranches (2011-2013) found that one of the ranches lost 10 calves (five percent of the herd) each year while the other lost only one (0.5 percent) during the same time span. The attitudes of ranchers towards the panthers may become increasingly negative. In 2013, a survey found that 56 percent of ranchers supported panther recovery, and only 10 percent opposed or strongly opposed recovery; however, the survey had a low response rate (4 percent) and only 13 percent of the respondents resided within the panthers’ breeding range. South and central Florida ranchlands are now considered critical to successful panther survival, with 29 percent of occupied panther range under private ownership within the Focus Area (Florida Panther Recovery Implementation Team 2015). The working cattle ranches are under intense pressure to sell land for suburban and urban development. The unpredictable profitability of ranching operations from year to year has also led some landowners to convert native habitat and pasture into more intensive agricultural uses (e.g. row crops). In 2015, the U.S. Fish and Wildlife Service started a five-year pilot program designed to make conserving Florida panthers more compatible with maintaining working cattle ranches. It pays an annual stipend to southern Florida landowners and ranchers who partner with the agency to preserve and/or protect panther habitat on their property for a decade. As researchers learn more about panthers, their habitats and their hunting patterns, it is becoming possible to design compensation strategies that are equitable and promote the continued conservation of important panther habitat, providing hope that ways will be found for ranches and panthers to co-exist (Frakes et al. 2015; Jacobs and Main 2015). More information about the panther story is at: : www.fws.gov/refuge/florida_panther/wah/panther.html and https://bigcatrescue.org/florida-panther-facts/
14
Conservation Science Partners released an online analysis of the loss of the remaining natural landscapes in the contiguous 48 states due to human modification from 2001 to 2017.16 Natural areas were shrinking at different rates and for different reasons around the country: an oil boom, a surge in logging on private lands, plowing up grasslands for agricultural crops, and urban sprawl. According to the analysis, the resulting fragmentation of natural areas was now so severe that “a pin dropped at random” anywhere in the 48 states can be expected to “land less than half a mile from human development.” Between 2001 and 2017, the average distance from natural habitat to the nearest human development had shrunk by more than 40 percent. The South and Midwest experienced the steepest losses of natural areas.
DEVELOPMENT, TRANSPORTATION, AND ENERGY
By disrupting habitats, development and transportation corridors can be more damaging to wildlife than agricultural land. Sprawl associated with highway construction and expanding urban centers, and the tendency to subdivide and settle formerly extensive ranches and wildlands, increasingly fragments large portions of land.17 Roads, highways, and railways impact wildlife in a variety of ways. Although roads and roadsides cover approximately one percent of the United States, an estimated 15-20 percent of the land is directly affected by roads and vehicles (Jackson 2000). Transportation corridors can lead to the direct loss of habitat, the degradation of
16 See the Center for American Progress Issues on Energy and Environment: www.americanprogress.org/issues/green/reports/2019/08/06/473242/much-nature-america-keep/ and www.americanprogress.org/issues/green/reports/2019/10/22/476220/the-green-squeeze/ 17 Fragmentation happens when once continuous mosaics of native vegetation become “transformed into disjunct pieces of native vegetation surrounded by a matrix of cement, grass, crops, and degraded lands” (Marzluff and Ewing 2001).
habitat quality, habitat fragmentation, and many other impacts. In 2008, the U.S. Department of Transportation estimated there were one to two million wildlife-vehicle collisions a year, and that this rate would continue to rise (Huijser et al. 2008). Although more and more wildlife crossings are being built, there are many thousands of miles of roadways where collisions and fragmented habitats are not being addressed. In California alone, mitigating this threat would require fencing and adding crossings to more than 3,000 miles of roads (Shilling et al. 2019). While developed areas can support some biodiversity, it can be more difficult to mitigate their impact (Wilson and Peter 1988). Even low-density residential housing that is more sparsely scattered away from cities has a measurable impact on biodiversity. By 2005, these large-lot developments covered nearly 25 percent of the area of the lower 48 states both in counties adjacent to metropolitan counties and in rural areas well removed from cities (e.g. Rocky Mountain West, Pacific Northwest, upper Midwest and the Southeast) (Hansen et al. 2005). The survival and reproduction of native species was reduced while the density of some exotic species and human-adapted native species was increased. Sometimes biological diversity changed abruptly with incremental increases in exurban intensity. In other areas, it took several decades for biodiversity to decline and effects to be seen. In addition to local effects, large-lot residential development appeared to also alter ecological processes on adjacent and distant public lands.
15
Subdividing ranches into smaller parcels for residential use has a measurable impact on biodiversity. In Texas, where many of the large ranches were divided into smaller parcels, the resulting “ranchettes” were too small for traditional farming, ranching, and forestry uses (Wilkins et al. 2003). At the same time, this fragmentation led to declines in open space and wildlife habitat and was causing increased erosion and runoff resulting in more water quality problems. Comparing plants and wildlife on ranches, nature reserves, and subdivided ranches (ranchettes) in the Front Range of Colorado, there are fewer birds of concerns, more generalist species, more introduced plant species, and fewer native predators on ranchettes (U.S. Department of Agriculture NRCS 2009b). When songbird, nest density, and plant species in large-lot developments, clustered developments, and undeveloped land were compared in Boulder County, clustered developments are more similar to dispersed developments than undeveloped land because of their closer proximity to humans and lack of native plants. In addition, the effects of low-density residential development can be disproportionately large because people prefer landscapes that support high biodiversity. For example, the warm climate and varied topography in the western and southern United States support both extremely diverse biological communities and—unfortunately—very appealing home sites.18 In these cases, slowing development by protecting agricultural lands can help wildlife and wildlife habitat. AFT’s Farms Under Threat has uniquely identified where agricultural lands have been converted both to urban and highly developed uses and low-density residential uses and how state
18 USDA Economic Research Service has created a natural amenities scale that ranks counties on the physical characteristic that most people prefer based on climate (warm winter, winter sun, temperate summer, low summer humidity), topography, and water area). Overview at: https://www.ers.usda.gov/data-products/natural-amenities-scale/
policies are or are not addressing the threat (Freedgood et al. 2020). Over 60 percent of the agricultural land converted to developed uses between 2001 and 2016 was a result of low-density residential development. Urbanization accounted for less than 40 percent of the conversion to developed uses. Domestic energy production adds an additional threat by impacting both agricultural lands and biodiversity. Domestic energy production (nuclear, natural gas, coal, renewables, oil, and biofuels) is projected to impact more than 197 million additional acres of land by 2040, much of it on rangeland and cropland (Trainor et al. 2016). The accompanying impacts on wildlife mortality, habitat loss, fragmentation, noise and light pollution, invasive species, and changes in carbon stock and water resources will need to be managed and mitigated (Jones et al. 2015; Sanchez-Zapata et al. 2016). For biofuels, conserving biodiversity for first-generation biofuels like corn ethanol and second-generation biofuels like switchgrass will depend on the specific crops grown, the lands brought into production, the management practices adopted, and whether at-risk species are present (Evans et al. 2013).
AGRICULTURE
In the U.S., agriculture is a leading cause of wildlife endangerment. By 2000, agricultural land uses affected almost 40 percent of listed species (Groves et al. 2000; Blann 2006). Agriculture directly impacts wildlife habitat by converting it to cultivate crops and/or graze livestock and then repeatedly disturbing the resulting habitat throughout
16
the year as part of production (Brady and Flather 2001). It also affects wildlife habitat indirectly through water management practices for irrigation and drainage, soil erosion and sedimentation, the use of pesticides, and the runoff of nutrients and other pollutants into the environment. These cumulative impacts are amplified by agriculture’s significant footprint on the land. Vast quantities of land and water resources are directly affected by farming and ranching. The USDA Natural Resources Conservation Service (NRCS) National Resources Inventory (NRI) 2015 land use estimates for the contiguous 48 states, Hawaii, Puerto Rico, and the U.S. Virgin Islands cover over 1.94 billion acres of land and water (U.S. Department of Agriculture 2018). Nearly half the U.S. land base is in private agricultural use. While federally owned land occupies 21 percent, privately owned lands included rangeland (21 percent), forestland (21 percent), cropland (19 percent), pastureland (six percent), developed lands (six percent), water (three percent) and CRP land (one percent). If we include federal lands used for grazing livestock, agricultural operations impacted 60 percent of the lands in the contiguous United States, a very large footprint indeed (Freedgood et al. 2020). Agricultural land types include cropland, rangeland, pastureland, and woodlands. Within the contiguous 48 states, privately held rangelands cover 20.5 percent, croplands 18.5 percent, pasturelands 5.6 percent, and woodlands 2.8 percent (Conservation Science Partners 2020). Woodlands are the small or large expanses of forested lands that many farmers and ranchers maintain. In 2017, the Census of Agriculture identified 73 million acres (U.S. Department of Agriculture NASS 2019). AFT’s Farms Under Threat has mapped where these critical woodland acres are on the landscape (Freedgood et al. 2020), an
important step in mapping the location of prime wildlife habitat on agricultural lands. USDA NRCS started tracking the conversion of agricultural land to developed uses through the NRI in 1982. Cropland acres, which provide the least suitable wildlife habitat, steadily declined from 1982 to 2007 but cropland acreage has increased since then (U.S. Department of Agriculture 2018). Between 2012 to 2015, cropland acres increased about 1.3 percent (4.6 million acres), mostly comprised of land that came out of the CRP with the rest converted from pastureland and, to a much lesser percent, rangeland and forestland. The gains in cropland were counterbalanced somewhat by the conversion of cropland to other land uses (3.6 million acres or one percent), mainly to pasture (70 percent) but also to development, rangeland, and other rural lands, CRP, forest and water. Pastureland and rangeland can be plowed and converted to cropland, and forests can be chopped down and converted to cropland or pasture. In addition, wetlands can be drained and used for pasture or cropland and floodplains next to rivers can be cropped in drier years. Agricultural lands can also be abandoned, converted to grasses or trees, and restored to wetland. Lands of low agricultural quality are more likely to move into and out of intensive agricultural uses. Almost 75 percent of the cropland that shifted out of cultivation between 1982 and 1997 had soil productivity ratings below the average acre of cropland (Luowski et al. 2006). Some was planted to grasses and became pastureland. A recent study found that converting annual crops on marginal soils to perennial grasslands could increase bee abundance by as much as 600 percent and bee diversity by as much as 53 percent (Koh et al. 2016). Grasslands are at risk of being converted to croplands particularly when commodity
17
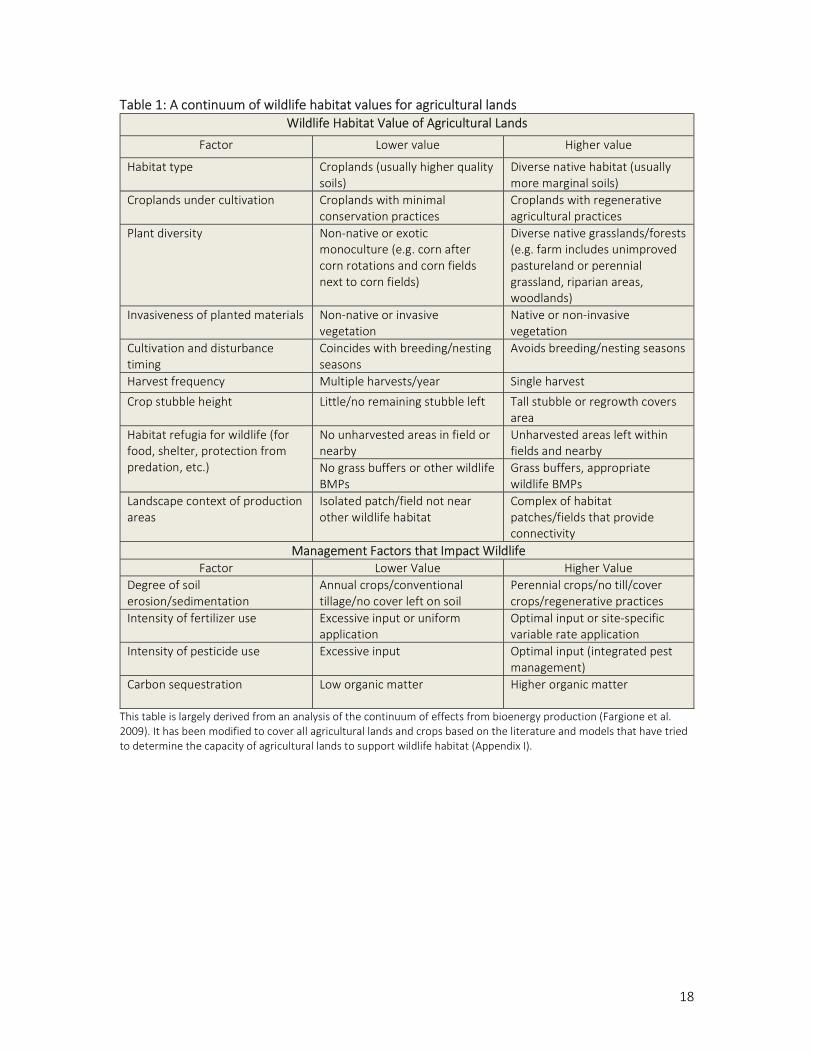
prices are high. In a six-year study of grassland conversion in South Dakota, researchers found that 6.87 percent of the grasslands were converted to cropland, and 4.2 percent of the croplands were converted to grasslands from 2006 and 2012, when corn prices tripled (Reitsma et al. 2015). South Dakota was selected as a model system because it is located in a climate and grassland/cropland transition zone. No one factor was linked to the conversion of grasslands, but the desire to increase financial returns, changes in the land ownership structure, technology improvements, government policies (e.g. crop insurance and crop subsidies), climate change, and an aging workforce were identified as possible contributing factors. Roughly 55.7 million acres of grassland were converted to cropland in the Great Plains between 2009-2016 (World Wildlife Fund 2017). Although roughly half of this acreage was returned to grass or permanent cover during this time, it takes a long period of time to fully restore what has been lost. AFT’s Farms Under Threat has worked with USDA NRCS to map the grasslands of environmental significance in the 48 contiguous states, an important step in mapping critical wildlife habitat associated with agricultural lands. Agricultural lands offer a continuum of wildlife habitat values depending on the agricultural land type and how it is managed. By examining the literature and the models that have tried to determine the capacity of agricultural lands to support wildlife habitat (see Appendix I), it is possible to envision a continuum of wildlife habitat values (Table 1). Agricultural lands must be managed to conserve sufficient biological integrity (e.g. maintaining plant communities and habitat patches compatible with the surrounding landscape)
19 See USDA NRCS information on land capability class by state for 1997 under Natural Resources Assessment at: www.nrcs.usda.gov/wps/portal/nrcs/detail/national/technical/nra/?cid=nrcs143_014040
(Blann 2006; Brady 2007; Erisman et al. 2016). Strategies include maintaining the diversity of habitats, both cropped and uncropped, by using rotations, agroforestry and fallows, maintaining marginal acreage in wildlife habitat (e.g. CRP), and using on-farm conservation measures like buffers and windbreaks (Firbank et al. 2007). The most suitable wildlife habitats are found on marginal lands where food production is rarely a viable option. On the more marginal agricultural lands (e.g. wetlands, woodlands, rangelands, unimproved pastures, and CRP), intensive crop cultivation is rarely a viable option. Lands can quickly revert to semi-natural or natural habitats that support wildlife if cultivation is avoided. Marginal lands are characterized by low productivity or by severe limitations for agricultural use (Kang et al. 2013). USDA identifies land capability classes by grouping soils primarily on the basis of their capability to produce commonly cultivated crops and pasture plants without deteriorating over a long period, taking into account erosion, wetness, root zone limitations, and climatic, conditions (U.S. Department of Agriculture SCS 1961). Soils in class codes 5 to 8 have limitations that restrict their use mainly to pasture, rangeland, forestland, or wildlife habitat (both food and cover), adding up to about 42 percent of agricultural lands.19 Wildlife is least compatible with highly productive cropping systems.
18
Table 1: A continuum of wildlife habitat values for agricultural lands Wildlife Habitat Value of Agricultural Lands
Factor Lower value Higher value
Habitat type Croplands (usually higher quality soils)
Diverse native habitat (usually more marginal soils)
Croplands under cultivation Croplands with minimal conservation practices
Croplands with regenerative agricultural practices
Plant diversity Non-native or exotic monoculture (e.g. corn after corn rotations and corn fields next to corn fields)
Diverse native grasslands/forests (e.g. farm includes unimproved pastureland or perennial grassland, riparian areas, woodlands)
Invasiveness of planted materials Non-native or invasive vegetation
Native or non-invasive vegetation
Cultivation and disturbance timing
Coincides with breeding/nesting seasons
Avoids breeding/nesting seasons
Harvest frequency Multiple harvests/year Single harvest
Crop stubble height Little/no remaining stubble left Tall stubble or regrowth covers area
Habitat refugia for wildlife (for food, shelter, protection from predation, etc.)
No unharvested areas in field or nearby
Unharvested areas left within fields and nearby
No grass buffers or other wildlife BMPs
Grass buffers, appropriate wildlife BMPs
Landscape context of production areas
Isolated patch/field not near other wildlife habitat
Complex of habitat patches/fields that provide connectivity
Management Factors that Impact Wildlife Factor Lower Value Higher Value
Degree of soil erosion/sedimentation
Annual crops/conventional tillage/no cover left on soil
Perennial crops/no till/cover crops/regenerative practices
Intensity of fertilizer use Excessive input or uniform application
Optimal input or site-specific variable rate application
Intensity of pesticide use Excessive input Optimal input (integrated pest management)
Carbon sequestration Low organic matter Higher organic matter
This table is largely derived from an analysis of the continuum of effects from bioenergy production (Fargione et al. 2009). It has been modified to cover all agricultural lands and crops based on the literature and models that have tried to determine the capacity of agricultural lands to support wildlife habitat (Appendix I).
19
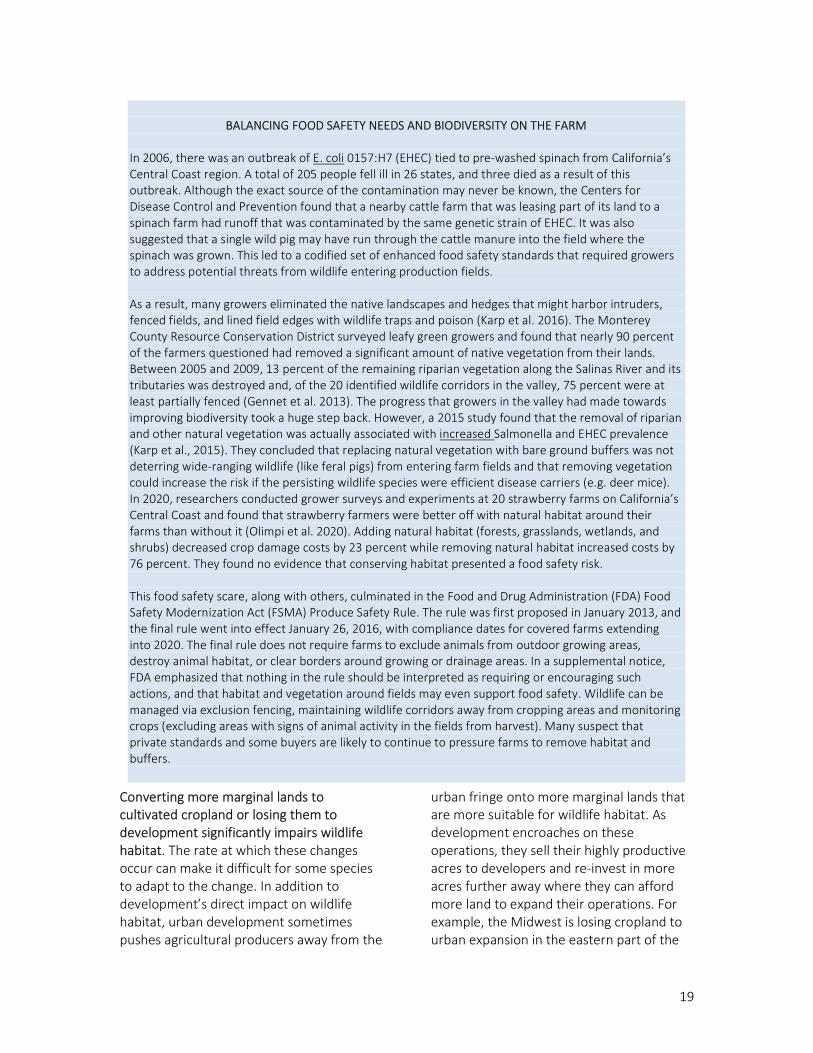
Converting more marginal lands to cultivated cropland or losing them to development significantly impairs wildlife habitat. The rate at which these changes occur can make it difficult for some species to adapt to the change. In addition to development’s direct impact on wildlife habitat, urban development sometimes pushes agricultural producers away from the
urban fringe onto more marginal lands that are more suitable for wildlife habitat. As development encroaches on these operations, they sell their highly productive acres to developers and re-invest in more acres further away where they can afford more land to expand their operations. For example, the Midwest is losing cropland to urban expansion in the eastern part of the
BALANCING FOOD SAFETY NEEDS AND BIODIVERSITY ON THE FARM
In 2006, there was an outbreak of E. coli 0157:H7 (EHEC) tied to pre-washed spinach from California’s Central Coast region. A total of 205 people fell ill in 26 states, and three died as a result of this outbreak. Although the exact source of the contamination may never be known, the Centers for Disease Control and Prevention found that a nearby cattle farm that was leasing part of its land to a spinach farm had runoff that was contaminated by the same genetic strain of EHEC. It was also suggested that a single wild pig may have run through the cattle manure into the field where the spinach was grown. This led to a codified set of enhanced food safety standards that required growers to address potential threats from wildlife entering production fields. As a result, many growers eliminated the native landscapes and hedges that might harbor intruders, fenced fields, and lined field edges with wildlife traps and poison (Karp et al. 2016). The Monterey County Resource Conservation District surveyed leafy green growers and found that nearly 90 percent of the farmers questioned had removed a significant amount of native vegetation from their lands. Between 2005 and 2009, 13 percent of the remaining riparian vegetation along the Salinas River and its tributaries was destroyed and, of the 20 identified wildlife corridors in the valley, 75 percent were at least partially fenced (Gennet et al. 2013). The progress that growers in the valley had made towards improving biodiversity took a huge step back. However, a 2015 study found that the removal of riparian and other natural vegetation was actually associated with increased Salmonella and EHEC prevalence (Karp et al., 2015). They concluded that replacing natural vegetation with bare ground buffers was not deterring wide-ranging wildlife (like feral pigs) from entering farm fields and that removing vegetation could increase the risk if the persisting wildlife species were efficient disease carriers (e.g. deer mice). In 2020, researchers conducted grower surveys and experiments at 20 strawberry farms on California’s Central Coast and found that strawberry farmers were better off with natural habitat around their farms than without it (Olimpi et al. 2020). Adding natural habitat (forests, grasslands, wetlands, and shrubs) decreased crop damage costs by 23 percent while removing natural habitat increased costs by 76 percent. They found no evidence that conserving habitat presented a food safety risk. This food safety scare, along with others, culminated in the Food and Drug Administration (FDA) Food Safety Modernization Act (FSMA) Produce Safety Rule. The rule was first proposed in January 2013, and the final rule went into effect January 26, 2016, with compliance dates for covered farms extending into 2020. The final rule does not require farms to exclude animals from outdoor growing areas, destroy animal habitat, or clear borders around growing or drainage areas. In a supplemental notice, FDA emphasized that nothing in the rule should be interpreted as requiring or encouraging such actions, and that habitat and vegetation around fields may even support food safety. Wildlife can be managed via exclusion fencing, maintaining wildlife corridors away from cropping areas and monitoring crops (excluding areas with signs of animal activity in the fields from harvest). Many suspect that private standards and some buyers are likely to continue to pressure farms to remove habitat and buffers.
20
region and gaining cropland at the expense of rangeland, grasslands, and wetlands in the western part of the region (Emili and Greene 2014; Wright and Wimberly 2013). Equally troubling, much of this production is dependent on the use of irrigation and the High Plains aquifer. Over the last few years, demands for corn ethanol have also driven production onto more marginal lands, much of it former CRP acres (Lark et al. 2015). The adverse effects of producing crops can be reduced when permanent habitat is interspersed throughout the mosaic of the agricultural landscape. These strips or areas of less disturbed habitat can provide shelter, food, and corridors that allow wildlife to travel between larger areas of suitable habitat. Small changes like windbreaks, shelter belts, and filter strips20 can have significant effects on landscape permeability to animal movement (Kostyack et al. 2011). Set-aside acres, like those in the CRP, WRP, and GRP, also provide high value habitat for wildlife. The movement of species usually happens over generations, but now the climate is changing more rapidly than any time in recorded history and outstripping the capacity of many species to adapt (Radchuk et al. 2019). They must contend with a landscape that is fragmented by roads, dams, development, and other barriers to movement (Anderson et al. 2016). Agricultural windbreaks and shelter belts could be helping species move across agricultural lands. However, over the last few decades, many producers have
20 USDA NRCS provides a comprehensive list of conservation practices that describes their impacts on soil, water, air, plants animals, energy and land, labor, capital, and risk. The Conservation Practice Physical Effects (CPPE) matrix and associated planning tools cover the environmental and economic effects of each conservation practice and provide a relative cost estimate for use by field planners. Learn more about the CPPE at: https://www.nrcs.usda.gov/wps/portal/nrcs/detail/national/technical/econ/tools/?cid=nrcs143_009740 21 USDA NRCS has developed a comprehensive watershed scale wildlife habitat planning tool to help watersheds craft a structure of patches, corridors, and matrices that optimizes wildlife conservation within the economic realities of a working landscape. The Corridors Handbook and Case Study can be accessed under USDA NRCS Plants & Animals/Fish and Wildlife/Publications & Features at: https://www.nrcs.usda.gov/wps/portal/nrcs/detailfull/national/plantsanimals/fishwildlife/pub/?cid=nrcs143_022363
responded to expanded world export markets by eliminating the patchwork of fencerows, field edges, pastures, small wetlands, and other remnant natural habitats on croplands that provided habitat for many species of animals and native plants (Blann 2006). At the landscape level, agricultural lands can help provide critical environmental corridors for wildlife. These are areas in the landscape that contain and connect natural areas and open space and provide landscape connectivity (Church 2001). They often lie along streams, rivers, or other natural features and protect wildlife by providing linkages in the landscape and potential buffers between natural and/or human communities. Corridors can vary by size and type. Regional corridors (tens of miles wide) that connect large areas of highly diverse ecosystems facilitate the movement of wildlife over broad geographies (Dickson et al. 2016). The physical environment (e.g. limestone valley, fine silt floodplain, granite summit), microclimate, and degree of natural cover helps predict where strongholds for biodiversity currently exist or may occur in the future (Anderson et al. 2016). Watershed corridors (a fraction of a mile to miles long) can facilitate movement of wildlife within a watershed. These riparian corridors, many of which cross agricultural lands, play an essential role in facilitating range shifts because they are cooler, wetter, and more intact than their surroundings (Anderson et al. 2016).21 Some
21
agricultural lands also serve as essential buffers for nearby wildlife reserves or connecting corridors between reserves (Ewing et al. 2005: Blann 2006). For example, in south Florida, cattle ranches that preserve patches of forestland provide valuable habitat for the endangered Florida panther (see text box on Florida panther, pg. 13) and the Florida black bear. At the field level, farm corridors can allow the localized movement of wildlife. Some wildlife corridors may only be hundreds of feet in width. Types vary from undisturbed natural areas, strips of land missed by development (e.g. remaining farmland between communities), strips of vegetation planted for conservation purposes (e.g. grassed terraces, hedgerows, in-field buffers, grassed waterways, field borders, windbreaks and shelterbelts, vegetated ditches and filter strips) and mowed roadsides and regrowth areas (like abandoned rail rights-of-way) (University of Illinois 2017). In rural areas, the most prevalent land-use change affecting corridors has been conversion to crop production. But although this may cause fragmentation, the land can usually be easily restored to some type of corridor (Church 2001). By contrast, many land uses associated with urban development eliminate any feasible restoration. However, maintaining patches of suitable wildlife habitat on the farm can be incompatible with larger farm equipment. The use of larger and wider farm equipment saves labor and increases efficiency, but when small habitat patches interfere with crop tillage, planting, spraying, and harvesting operations, they are often eliminated (Corry and Nassauer 2004). When this happens, it increases the distance
22 One such company is AgSolver (https://agsolver.com/), which uses satellite imagery and data maps to predict yields at a 30 m resolution, identify unprofitable and at-risk acres (marginal grounds) and suggest alternative management practices.
between remaining small habitat patches, reduces the landscape diversity, and makes it more difficult for species to reach the safety of suitable habitats through the farm landscape (see text box on ring-necked pheasants, pg. 11). In addition, to accommodate the heavier equipment and facilitate longer cropping seasons, farmers may install subsurface drainage tiles that further fragment the landscape by isolating and shrinking small wet patches. However, inaccessibility to large field equipment has allowed some indigenous prairie patches to remain, and field corners where cultivation, planting, spraying, and harvesting may be difficult or time-consuming can revert to small habitat patches. The increasing use of precision agriculture could reverse some habitat patch loss by encouraging producers to retire unprofitable acres. The field data generated by geographic information systems (GIS) coupled with soil testing and yield monitors can identify soil conditions that limit profitable production (e.g. chronically wet, droughty, or eroded soils) where the farmer is better served by planting alternative cover types for biodiversity. These tools, technology, and processes associated with precision agriculture can be adapted to inform conservation practice adoption, and wildlife objectives can be explicitly incorporated into a farm- and landscape-level decision framework (McConnell and Burger 2016). One sign that more heterogeneity may return to the agricultural landscape is the emergence of companies that offer to help farmers identify the three to 15 percent of acres that are consistently unprofitable while finding alternative management techniques to increase their total profit.22 Although adoption rates of precision agriculture technologies are
22
generally increasing, they rarely reach 50 percent of the farms or even 50 percent of planted acres and are generally higher among larger farms (more than 3,800 acres) (Thompson et al. 2019). Crop and livestock production can also incorporate wildlife-friendly practices to minimize many indirect effects on wildlife. Wildlife-friendly practices (Tables 1 and 2) include those that promote soil quality and health (e.g. keeping the soil covered and undisturbed, using cover crops, and rotating crops to help feed the many soil organisms that are essential for plant growth; and implementing integrated pest management to reduce the use of harmful pesticides (European Commission 2010)). Some practices can be as simple as changing the timing of mowing. USDA NRCS lists a number of wildlife conservation practices for landowners or farm operators to consider (see Table 2). For example, Iowa NRCS suggests the use of field borders, filter strips, riparian forest buffers, stream habitat improvement and management, fish pond management, hedgerow planting, windbreaks or shelterbelts, wetland restoration, conservation cover, early successional habitat management for grasslands, residue and tillage management, prescribed burning, prescribed grazing, and wildlife habitat assessment. In addition, the use of cover crops, conservation tillage, organic agriculture, grazing land management, sustainable forest management, and retaining or returning native ecosystems are considered to be “shovel-ready” practices that can reduce costs associated with water filtration, flood prevention, wildlife habitat preservation, and other critical land management issues (Stockwell and Bitan 2012). Transitioning annual crops into perennial crops, which grow several years and can be harvested multiple times before dying, could also benefit biodiversity. The use of
perennials reduces soil erosion, soil compaction, chemical and nutrient runoff, helps mitigate greenhouse gas emissions, and conserves freshwater. Ten of the 13 most common cereals and oilseeds are suitable candidates for breeding perennial alternatives (The Land Institute 2009; Glover and Reganold 2010). The primary obstacles to using perennial cereals, oilseeds, and legumes are the lack of economically viable plant strains and the willingness to invest in research and readjust farm subsidies to support their use. While efforts to develop these novel perennials continue, the inclusion of proven perennials such as alfalfa in crop rotations can provide the same benefits (Fernandez et al. 2019). However, economic tradeoffs can make it difficult for farmers and ranchers to support wildlife conservation efforts on their own (U.S. Department of Agriculture ERS 2003). By changing management practices to be more wildlife-friendly or by taking land out of production, they may lose money. They may give up the income they could have earned by selling their crop. Crop damage from wildlife often increases as a result, further impacting income. Restricting livestock from riparian areas takes time, and it costs money to fence off land and construct alternative watering sources. Even finding out how to access USDA programs that can provide cost-share dollars and technical assistance to install wildlife habitat may represent a cost to farmers. On the benefits side, conservation efforts may enhance the hunting, fishing, viewing, and other wildlife-related opportunities associated with wildlife habitat. And in many rural areas, especially areas where people have limited access to public lands, landowners can earn income through hunting leases. Conservation efforts can also support wild pollinators and beneficial insects and other predators that can help keep damage from crop pests in check.
23
Ultimately, agricultural production systems need to become more sustainable. In 1993, the National Academy of Sciences strongly recommended a more ecological systems-based approach and greater use of field and landscape buffer zones in its landmark report on improving the performance of farming systems while maintaining profitability (National Academy of Sciences 1993). At that time, they focused on
improving soil and water quality. Almost 30 years later, the urgent need to combat climate change and reverse the loss of natural and semi-natural habitats now drive the need to switch to more sustainable agricultural systems (Duru et al. 2015). The use of regenerative agricultural practices that combat climate change is a priority. Unchecked climate change and extreme weather are the most significant and immediate risks to the planet—improved land management is a critical step in transitioning to a carbon neutral economy and a stable climate (Duru et al. 2015; Griscom et al. 2017). Critically, many of the same conservation and management practices that conserve biodiversity also improve soil health and sequester carbon which, in turn, helps mitigate climate change (Lin et al. 2020). These wildlife-friendly regenerative practices (see Table 2) include the use of conservation tillage, cover crops, diverse crop rotations, integrated pest management, strip-cropping, filter strips, riparian forest buffers, hedgerows, and other practices. Eighty-nine percent of 27 conservation practices recommended by USDA NRCS to improve wildlife habitat also improve soil health (see text box on biodiversity in the soil, pg. 25) and sequester carbon and can be prioritized in areas where critical wildlife corridors must be maintained. Many farms and ranches in the U.S. have already started along the path to regenerative, wildlife-friendly agriculture. Lagging behind, research into biologically diversified farming and ranching systems (systems-based agroecology and sustainable agriculture research) represented only 0.6 to 1.5 percent of the USDA Research, Extension and Economics budget in 2014 (DeLonge et al. 2016). Terms that encompass these ecological approaches include “eco-friendly” agriculture, “conservation friendly farming,”
REGENERATIVE AGRICULTURE
Regenerative agricultural practices are most effective when used in combination. AFT research shows that using a core set of regenerative practices (cover crops, conservation tillage, and nutrient management) on all U.S. cropland acres could sequester enough carbon to counter over 85 percent of U.S. agriculture’s current greenhouse gas emissions (https://farmland.org/testimony-of-dr-jennifer-moore-kucera/). Implementing regenerative practices on rangeland, pastureland, and woodland would provide even more benefits. Equally important, conservation management systems (combinations of no-till, cover crops, nutrient optimization, and crop rotation) can be less costly than conventional management and, in some cases, increase yield and yield stability (Monast et al. 2019). However, it can take time to determine the right mix of practices and make the necessary adjustments to fit these practices into the farm operation. There may also be a lag time before the benefits of the practices outweigh the initial costs of implementing them (Monast et al. 2019), but the end results are worth the time and adjustments. AFT looked at the net economic benefits that eight farmers experienced from investing in soil health practices (no-till, strip-till, cover crops, nutrient management, conservation cover, compost application, and mulching) (https://farmland.org/soil-health-case-studies-findings). We found that yields improved, net income increased, nitrogen, phosphorus and sediment losses were reduced, and greenhouse gas emissions were reduced.
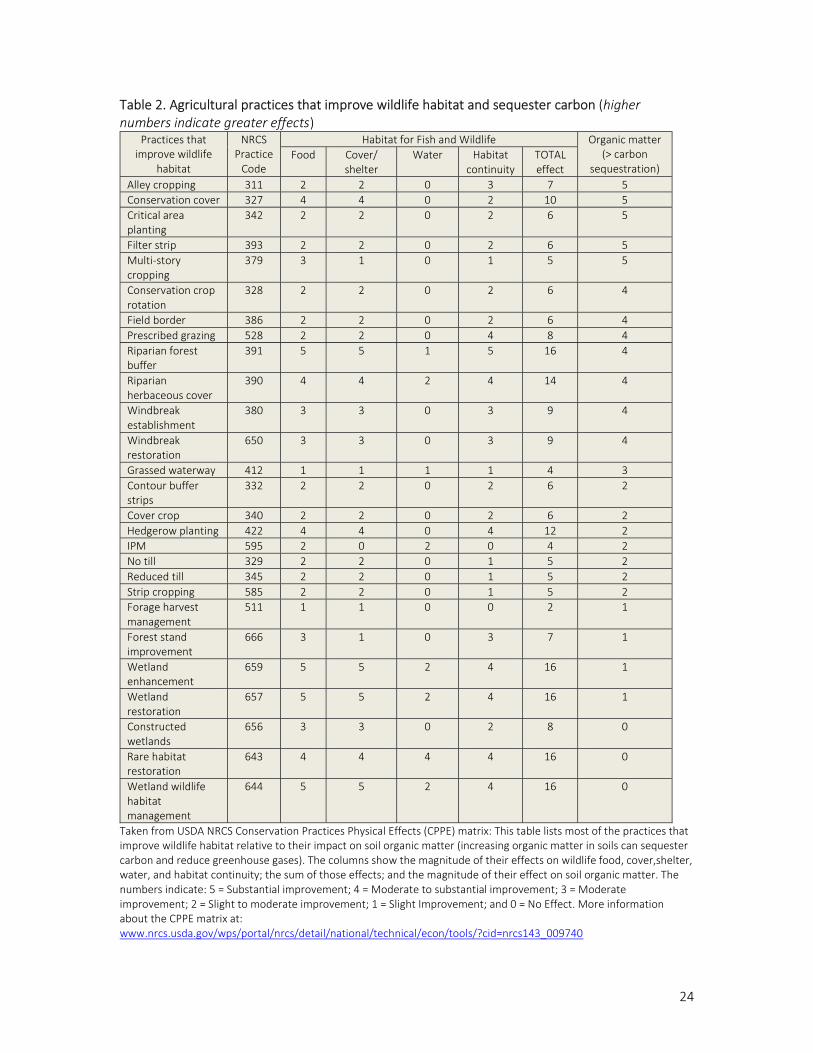
24
Table 2. Agricultural practices that improve wildlife habitat and sequester carbon (higher numbers indicate greater effects)
Practices that improve wildlife
habitat
NRCS Practice
Code
Habitat for Fish and Wildlife Organic matter (> carbon
sequestration) Food Cover/
shelter Water Habitat
continuity TOTAL effect
Alley cropping 311 2 2 0 3 7 5 Conservation cover 327 4 4 0 2 10 5 Critical area planting
342 2 2 0 2 6 5
Filter strip 393 2 2 0 2 6 5 Multi-story cropping
379 3 1 0 1 5 5
Conservation crop rotation
328 2 2 0 2 6 4
Field border 386 2 2 0 2 6 4 Prescribed grazing 528 2 2 0 4 8 4 Riparian forest buffer
391 5 5 1 5 16 4
Riparian herbaceous cover
390 4 4 2 4 14 4
Windbreak establishment
380 3 3 0 3 9 4
Windbreak restoration
650 3 3 0 3 9 4
Grassed waterway 412 1 1 1 1 4 3 Contour buffer strips
332 2 2 0 2 6 2
Cover crop 340 2 2 0 2 6 2 Hedgerow planting 422 4 4 0 4 12 2 IPM 595 2 0 2 0 4 2 No till 329 2 2 0 1 5 2 Reduced till 345 2 2 0 1 5 2 Strip cropping 585 2 2 0 1 5 2 Forage harvest management
511 1 1 0 0 2 1
Forest stand improvement
666 3 1 0 3 7 1
Wetland enhancement
659 5 5 2 4 16 1
Wetland restoration
657 5 5 2 4 16 1
Constructed wetlands
656 3 3 0 2 8 0
Rare habitat restoration
643 4 4 4 4 16 0
Wetland wildlife habitat management
644 5 5 2 4 16 0
Taken from USDA NRCS Conservation Practices Physical Effects (CPPE) matrix: This table lists most of the practices that improve wildlife habitat relative to their impact on soil organic matter (increasing organic matter in soils can sequester carbon and reduce greenhouse gases). The columns show the magnitude of their effects on wildlife food, cover,shelter, water, and habitat continuity; the sum of those effects; and the magnitude of their effect on soil organic matter. The numbers indicate: 5 = Substantial improvement; 4 = Moderate to substantial improvement; 3 = Moderate improvement; 2 = Slight to moderate improvement; 1 = Slight Improvement; and 0 = No Effect. More information about the CPPE matrix at: www.nrcs.usda.gov/wps/portal/nrcs/detail/national/technical/econ/tools/?cid=nrcs143_009740
25
“conservation-based” agriculture, “sustainable agriculture,” “organic agriculture,” “permaculture,” “integrated pest management” and “ecoagriculture” (Blann 2006). Newer terms describing
production systems that focus on developing healthy soils to become more resilient to a changing climate (“regenerative” agriculture, “climate-smart” agriculture) also fit into the “eco-friendly”
PROTECTING BIODIVERSITY IN THE SOIL
The most biologically diverse community is under our feet, and these organisms are largely responsible for maintaining the continuing productivity of agriculture and supporting all other ecosystems on the planet. A single spade full of rich garden soil contains more species of organisms than can be found above ground in the entire Amazon rain forest.1 In fact, in most ecosystems, there is more life and diversity underground than above ground. Soil biota include bacteria, fungi, protozoa, nematodes, arthropods, and earthworms, and each group plays an important role. Soil organisms drive decomposition and mineralization, help store and release nutrients, degrade pollutants before they reach groundwater or surface water, and cycle and sequester carbon as soil organic matter. Much of this activity takes place in the interface between plant roots and the soil (the rhizosphere). Mature trees can have as many as five million active root tips, while the wheat on two acres of farmland can have more than 30,000 miles of roots. The activity of the soil biota substantially affects soil structure which, in turn, impacts how water flows over, into and through soil, and how much water is retained within reach of plant roots. One cup of soil may hold as many bacteria as people on earth, and the weight of all the bacteria in one acre of soil can equal the weight of a cow or two. The ecosystem characteristics largely determine the structure of soil communities. For example, grasslands have near equal amounts of fungal and bacterial biomass, although some may be dominated by bacteria. Coniferous forests may have 100 to 1,000 times more fungal biomass than bacterial biomass. The ability of the soil to recover its functions after any disturbance (e.g. fires, cultivation, compaction, lack of vegetation or plant litter) is partially determined by the mix of its soil biota. USDA NRCS leads a national campaign to raise awareness about the importance of soil quality and to help farmers and landowners build “soil equity” for healthy, sustainable long-term returns. Their soil health materials eloquently and convincingly tell us why our soils are so important. If soils are healthy, they help reduce production costs and improve profits for farmers. They also reduce the amount of nutrients and soil sediments that wash off farm fields, and they can help sustain wildlife habitat. Healthy soils hold more water by binding it to organic matter, so less water is lost to runoff and evaporation. Remarkably, organic matter actually holds 18-20 times its weight in water and recycles nutrients for plants to use. One percent of organic matter in the top six inches of soil holds 27,000 gallons of water per acre. Most farmers can increase their soil organic matter in three to 10 years by adopting conservation practices. To achieve this goal, producers should keep soil covered and not disturb it, use cover crops, rotate crops, and develop a soil health management plan with the help of USDA NRCS. Recommended practices include conservation crop rotation, cover crops, no till, mulching, nutrient management, and integrated pest management. Side benefits include saving energy by using less fuel for tillage; maximizing nutrient cycling so less fertilizer is needed; saving water by increasing infiltration and water holding capacity as soil organic matter increases; reducing disease and pest problems; and improving plant health. In 2019, USDA NRCS released a selection of soil health indicators for use by producers and their advisors as the first step in expanding “the capacity of the soil to function as a vital living ecosystem that supports plants, animals, and humans” (U.S. Department of Agriculture NRCS 2019). See www.nrcs.usda.gov/wps/portal/nrcs/main/soils/health/ and https://soilhealthinstitute.org/ for more information about the importance of soil quality and soil health
26
framework. A global assessment that looked at the adoption of IPM, conservation agriculture, integrated crop and biodiversity, pasture and forage, trees, irrigation management, and small/patch systems estimates that 29 percent of farms worldwide practice some of these eco-friendly approaches on about nine percent of the world’s agricultural land (Pretty et al. 2018).23 They optimistically conclude that integrating more forms of eco-friendly agriculture in farming systems may be approaching a tipping point that could be transformational. Although eco-friendly agriculture could result in more wildlife damage to crops (see below), the benefits far outweigh any risks.
OVERCOMING CHALLENGES THAT WILDLIFE POSE TO AGRICULTURAL PRODUCTION More than half of all farmers and ranchers experience damage from wildlife every year (U.S. Department of Agriculture APHIS 2012). While some growers may experience little to no damage, others can suffer severe losses. Crop and livestock losses from wildlife in the United States totaled $944 million in 2001 (U.S. Department of Agriculture NASS 2002).24 Sixty-six percent of the damage occurred in field crops, 19 percent to livestock and poultry, and 15 percent to vegetables, fruits, and nuts. Deer were responsible for 58 percent of the damage to field crops, and 33 percent of the damage in vegetables, fruits, and nuts. Coyotes caused 57 percent of the damage to livestock and poultry. Livestock losses attributed to coyotes, mountain lions, bears,
23 There are 570 million farms worldwide, and 84 percent are landholdings of less than five acres (see Food and Agriculture Organization of the United Nations Family Farming Knowledge Platform (www.fao.org/family-farming/detail/en/c/386784/). The average farm in the U.S. is 444 acres according to the 2017 U.S. Census of Agriculture (U.S. Department of Agriculture NASS 2019). 24 Additional Information on wildlife damage management at the National Wildlife Research Center can be accessed at: https://www.aphis.usda.gov/aphis/ourfocus/wildlifedamage/programs/nwrc/
and wolves cost ranchers and other producers nearly $138 million every year. Wildlife-borne diseases also pose a serious threat to livestock. In 2017, a survey of state farm bureaus, wildlife agencies, and wildlife extension specialists found they broadly agreed that wildlife damage in agriculture had increased over the last 30 years, with deer causing the most damage from a national perspective, followed by feral hogs (Conover et al. 2018). A review and synthesis of bird and rodent damage to 19 California crops in 2011 found that 30-93 percent of acres were damaged (depending on the crop; the highest damage was to artichokes, wine grapes, and wild rice) (Gebhardt et al. 2011). The percent total yield lost to bird and rodent species ranged from 0.2 percent (carrots) up to 8.3 percent (artichokes). Damage varied by time and by geography and was both direct and indirect (e.g. crows consuming grapes and almonds; ground squirrels girdling trees and feeding on alfalfa) (see text box on food safety and biodiversity, pg. 19). A survey in North Florida that asked about wildlife damage to row crops in the previous two years (2009-2010) found that all respondents reported damage (Ober et al. 2011). The median acreage per farmer was 450 acres, and crops most commonly grown were peanuts, corn, cotton, soybeans, peas, and watermelons. Most of the crop damage was attributed to white-tailed deer, wild hogs, coyotes, raccoons, armadillos and rabbits. Estimates of acreage damaged ranged from 0.2 percent to 9.6 percent, and most respondents felt that damage was increasing.
27
Field edges appear to be most at risk from wildlife damage. The probability of wildlife damage in corn and soybean rises significantly when field portions are adjacent to forested habitats (DeVault et al. 2007). However, many nongame species (e.g. passerine birds, bats, small mammals, reptiles, amphibians) also rely heavily on small forested habitats for food, cover, and breeding, so producers are balancing the benefits provided by wildlife habitat with the almost certain damage that may result. Field edges next to a mature woodland may suffer at least a 30 percent reduction in yield, making these areas unprofitable to plant, fertilize, treat with pesticides, and harvest. The woody vegetation competes for nutrients and sunlight. Converting these field edges to a border of early-successional vegetation can be a viable alternative for the grower (Pierce et al. 2008). Although distance from habitat is an important predictor of possible damage, the availability and variety of alternative food sources for wildlife and landscape level habitat features may also be determining factors. For most producers, it is the number of on-farm wildlife, not their presence, that is the problem. This is defined as a “tolerance threshold,” and it varies with landowner characteristics, attitudes towards wildlife, farm characteristics, wildlife species, regional wildlife population levels, and commodities grown (Rollins et al. 2004). And while landowners may tolerate “resident” wildlife, their frustrations may be greatest when the depredating wildlife are migratory, since landowners may be left with significant damage while deriving only limited pleasure during a brief stop-over (Wywialowski 1998) (see text box on snow geese, pg. 6). Despite crop and livestock losses, maintaining wildlife habitat provides multiple benefits. In 2009, USDA NRCS concluded that the direct benefits from
wildlife habitat development and improvements on agricultural land included enjoyment from the presence of fish and wildlife on their land and possible monetary benefits through offering various recreational activities (hunting, fishing, trapping, bird watching, and other eco-tourism activities) (U.S. Department of Agriculture NRCS 2009a). They also concluded that the many conservation practices that benefit wildlife could improve both air and water quality, reduce soil erosion, improve rainwater infiltration, reduce pest infestations, and increase soil productivity. The primary ecological goods and services benefits resulting from wildlife habitat improvement included: 1) increased stability of fish and wildlife populations, which results in greater biodiversity and better natural control of invasive species introductions; 2) benefits for rare and declining threatened and endangered species; 3) the linkage of wildlife corridors to provide safe passage for migratory species (travel corridors are also extremely important for wildlife adapting to climate change and can connect larger swaths of native non-agricultural habitat together, which benefits genetic diversity); 4) on-site physical effects (reduced erosion, water quality, and quality benefits, etc.); 5) economic stimulus to local economies due to increased recreational activities; and 6) the maintenance of adequate numbers of native pollinators to ensure complete pollination of crops (see text box on pollinators, pg. 29). A national survey of over 2,000 agricultural landowners holding existing CRP contracts in 2001 found that over 75 percent believed the CRP benefits to wildlife were important (Allen and Vandever 2003). Thirty-eight percent of respondents reported the CRP provided more opportunities to hunt; 12 percent mentioned increased opportunities to lease land for hunting; and nearly 60
28
percent believed simply observing wildlife was an important benefit of the program. However, 18 percent indicated that the CRP had caused problems due to greater numbers of wildlife, which included insects, deer, coyotes, and pocket gophers. Many farmers and ranchers purposefully use management practices that benefit wildlife despite the crop damage that wildlife can cause. Because of the benefits, many landowners will tolerate some damage from wildlife as an unavoidable cost because they enjoy its presence on their land for recreation and aesthetic reasons or because they value their role as stewards of the land and habitat (Rollins et al. 2004). Those who consider themselves good stewards will often take into account wildlife needs when assessing the productivity of their lands. A survey of Illinois producers found that while 65 percent had experienced crop damage from wildlife in the previous 12 months (mostly by deer), almost half were specifically using management practices to benefit wildlife (e.g. conservation tillage; planting trees/shrubs/grasses; forest management and wetland management) (Miller et al. 2003). In general, respondents in the Illinois survey felt that set-aside programs provided benefits beyond wildlife habitat; that landowners had the right to use their land as they saw fit; that property owners should have more control over wildlife on their land; and that people outside the farming community should not be able to tell farmers how to control wildlife on their land. The Land Stewardship Project in Minnesota provides a wildlife habitat cost/benefit table that can help producers and landowners make decisions about the total value over time of adding habitat. 25
25 The Land Stewardship Project’s Farm Transitions Toolkit is available at: https://landstewardshipproject.org/farmtransitionsvaluingsustainablepracticesintroduction
More than half of the agricultural landowners who lease their land for farming are willing to include lease provisions relating to specific conservation practices like wildlife habitat. Nearly 40 percent of U.S. farmland is rented or leased from agricultural landowners (often referred to as non-operating landowners). AFT surveyed non-operating landowners in 11 states between 2018 and 2019 (Petrzelka et al. 2020). Fifty percent or more of the respondents in Iowa, Illinois, Indiana, Kansas, Ohio, and New York indicated that they would be willing to include lease provisions relating to specific conservation practices (e.g. grassed waterways, no-till, adaptive nutrient management, cover crops, filter strips, and wildlife habitat). And 50 percent or more of respondents in Iowa, Illinois, Kansas, New York, and Texas indicated that they would be willing to include a lease provision that requires their operator to implement wildlife-friendly soil erosion practices to conserve and improve soil health.
INCREASING WILDLIFE HABITAT ON AGRICULTURAL LANDS
The ongoing efforts by federal agencies to protect and enhance wildlife resources associated with agricultural lands try to strike a balance. Although the potential for agriculture to support wildlife and biodiversity is significant, agencies must balance what is ecologically meaningful with what is economically feasible. Currently, federal agencies (USDA, U.S. Department of the Interior) use a mix of long-term land retirement programs, conservation compliance, cost-sharing conservation practices, technical assistance, conservation partnerships, compensation, and safe-
29
POLLINATORS: A PERFECT STORM OF HABITAT LOSS, PESTICIDES, PARASITES, VIRUSES, AND A
CHANGING CLIMATE Pollinators are vital to production agriculture and include bees, other insects, birds, and other animals. Native pollinators help maintain higher yields, improve yield quality, and serve as a form of crop insurance. They contributed approximately $29 billion to farm income in the United States in 2010 (Calderone 2012). To ensure yields of the insect-pollinated crops, growers often use large, active colonies of honeybees to provide abundant pollinators that can be moved as needed. However, a combination of pesticides, parasites, viruses, and a changing climate had killed off over 30 percent of managed honeybee colonies by 2007 (Rice et al. 2007). Between April 2018 to April 2019, U.S. beekeepers lost over 40 percent of their colonies. This presents a huge challenge because the United States relies primarily on honeybees to pollinate one third of its food supply, including apples, peaches, almonds, strawberries, soybeans, lettuces, broccoli, cranberries, squashes, melons, and blueberries. Native pollinators also play a critical role, and at least one study (hybrid sunflower production) found that the only fields that achieved 100 percent pollination were those that had abundant native bees due to critical interactions between native bees and honey bees that increased the per visit effectiveness of honey bees (Rice et al. 2007). A recent international study (Garibaldi et al. 2013) found that fruit set was positively correlated with wild-insect visits to flowers in 41 crop systems worldwide. Honeybee visitations alone significantly increased fruit set in only 14 percent of the systems surveyed. Overall, wild insects pollinated crops more effectively, and an increase in their visitations enhanced fruit set by twice as much as an equivalent increase in honeybee visitation. Furthermore, visitation by wild insects and honeybees promoted fruit set independently, so a high abundance of managed honeybees was supplementing pollination by wild insects but was not an adequate substitute for them. In addition to increasing yields, encouraging multiple species of pollinators mitigated the risks of relying on a single species that could be at risk from predators, parasites, and pathogen development. There are 4,000 native bee species in the United States (Moisset and Buchmann 2011). Some are ground nesters, while others prefer nesting in already existing holes in hollow stems or trees. Their foraging ranges vary from about 100 yards to over a mile (Koh et al. 2016). The U.S. Fish and Wildlife Service lists over 50 pollinator species as threatened or endangered, and wild honeybee populations have dropped 25 percent since 1990. A recent study using a spatial habitat model projected that wild bee populations declined by as much as 23 percent over the U.S. land area between 2008 and 2013. This decline was generally associated with the conversion of natural habitats to row crops (Koh et al. 2016). The study identified 139 counties where low bee abundance corresponded to large areas of pollinator-dependent crops (comprising 39 percent of the pollinator-dependent crop area in the United States). These trends, if they continue, could increase costs for U.S. farmers and could even destabilize crop production over time (Koh et al. 2016). The most promising solutions include conserving or restoring natural or semi-natural areas within croplands, promoting land-use heterogeneity, adding diverse floral and nesting sources, and being very careful with pesticide applications (Garibaldi et al. 2013). In terms of key practices, this approach involves actively managing farmland to increase the intensity of the ecological processes that support production. Ecological Intensification includes the use of compost or manure, intercropping (to increase landscape complexity and connectivity), agroforestry, targeted flower strips, reduced or no-till, crop rotations, cover crops or green manures, leaving some land fallow, border plantings (e.g. hedgerows and windbreaks), riparian buffers, patches of semi-natural zones (woodlands and wetlands), crop varieties that enhance recruitment of pollinators or natural enemies, strategies to reduce pesticide use, and dedicated nesting or overwintering resources for pollinators or natural enemies (Kovacs-Hostyanszki et al. 2017).
30
harbor agreements to help agriculture and wildlife co-exist (U.S. Department of Agriculture ERS 2003) (see Text Box on Florida Panther, pg. 13). These programs must take into consideration the economics of producing food and fiber, the distribution of legal property rights, the biological needs of desired species and habitats, and societal preferences around wildlife conservation (U.S. Department of Agriculture ERS 2003). And they can either directly or indirectly protect or enhance wildlife resources by minimizing impacts of agricultural production on wild species and habitats, minimizing the impacts of wildlife conservation programs on agricultural producers, protecting threatened and endangered species, improving water quality, and reducing soil erosion and protecting open space. 26 Annotated bibliographies from USGS and USDA NRCS provide a comprehensive look at these efforts (Allen and Vandever 2012; U.S. Department of Agriculture NRCS 2009c). Several lessons have been learned from past USDA programs to protect wildlife: 1) farmers and ranchers will shift land and water resources into habitat provided they are compensated for the resulting loss of income; 2) rigid program designs are likely to be needlessly costly; and 3) the environmental benefits of programs to protect wildlife will be higher if they target those lands with the most potential for producing desired wildlife goods and services (U.S. Department of Agriculture ERS 2003). Wildlife habitat that works has been well-documented. The Wildlife Habitat
26 Changes in major conservation program funding under the 2018 Farm Bill effectively halt the shift toward increasing the share of conservation funding for working land programs that began in the 2002 Farm Bill: https://www.ers.usda.gov/amber-waves/2019/december/2018-farm-act-retains-conservation-programs-but-could-reduce-payments-for-land-retirement/ 27 USDA NRCS Interim Technical Report Fish and Wildlife Technology Findings under USDA NRCS/Plants & Animals/Fish & Wildlife/Fish and Wildlife Technology Findings: https://www.nrcs.usda.gov/wps/portal/nrcs/main/national/plantsanimals/fishwildlife/tech/
Management Institute (WHMI) (1996-2006, replaced in 2006-2011 by the Agricultural Wildlife Conservation Center) developed guidelines and recommendations for conservation program options based on the fish and wildlife technologies they developed (U.S. Department of Agriculture NRCS 2009b). Their studies showed the value of winter-flooded farmland fields to wetland wildlife species; the importance of high intensity, short duration rotational grazing systems in riparian areas; the need to establish some grass in intensively farmed agricultural areas; the benefits of block habitat over strip habitat, and the need for wider strips of vegetation, especially to connect larger tracks of grasslands; the importance of the structure of grasses used (i.e. height variation, density and mixture of plant types); and the finding that surrounding landscapes may be more important to wildlife than management practices on any particular field.27 Their recommendations included offering higher incentives for landowners willing to make wider buffers, prioritizing buffers that connected large habitat blocks, actively managing grasslands for wildlife, installing new habitat that enhances surrounding habitat, and placing more emphasis on using existing seedbanks rather than seeding new grasses. USDA has been tracking the wildlife benefits of implemented practices and documenting successes (U.S. Department of Agriculture NRCS 2009c). The USDA NRCS Conservation Effects Assessment Project (CEAP) is a multi-agency effort to quantify the environmental effects of conservation practices and programs. It provides a scientific base for
31
how to manage agricultural landscapes for environmental quality and helps establish a baseline of current effects to help us measure improvements.28 Since 2006, over 50 regional assessments of the effects of conservation practices on various terrestrial and aquatic species have been conducted or are underway.29 All of the observed species have benefited from conservation practices (e.g. bobwhite breeding densities have increased by 70-75 percent in 14 states, and total wild trout density increased by 59 percent in a Montana river). The CEAP projects and literature reviews continue to advance our understanding of how agricultural producers can better integrate fish and wildlife habitat considerations into their land management activities.30 Currently, the Working Lands for Wildlife Initiative works with producers to create and improve wildlife habitat. USDA NRCS established this initiative in 2013 to create and improve wildlife habitat with regulatory predictability from the U.S. Fish and Wildlife Service. The focus was originally on eight species where: 1) conservation on private lands can help reverse species’ decline; 2) the needs of the species are compatible with agricultural land management; 3) tools from the Endangered Species Act are in place to provide regulatory predictability; and 4) habitat improvements will benefit other species. Seven of the eight species were on agricultural lands. Since 2013, USDA NRCS has expanded this effort to include several more species. As of June 2018, the Working Lands for Wildlife (WLFW) program had helped producers conserve more than 7.1 million acres of habitat in 19 key landscapes across 48 states, benefiting
28 More information on the CEAP project at: https://www.nrcs.usda.gov/wps/portal/nrcs/main/national/technical/nra/ceap/ 29 USDA NRCS CEAP Wildlife Story Map: www.arcgis.com/apps/MapJournal/index.html?appid=2205f3e668ff447093ceb2f7b95b2267 30 More information about the USDA NRCS Wildlife National Assessment is under USDA NRCS/Technical Resources/Natural Resources Assessment/Conservation Effects Assessment Project (CEAP)/National Assessment: https://www.nrcs.usda.gov/wps/portal/nrcs/detailfull/national/technical/nra/ceap/na/?cid=nrcs143_014151
hundreds of rural communities, agricultural rangeland, and wildlife resources. Additional data from USDA can guide agriculture in reducing its impacts on the environment and improve wildlife habit. The CEAP analyses help identify what works (www.nrcs.usda.gov/wps/portal/nrcs/main/national/technical/nra/ceap/). Cultivated croplands: CEAP analyses of the nation’s large regional watershed basins (2010-2014) assessed the effects of conservation practices on cultivated croplands using a sampling and modeling approach. These analyses conclude that about 20 percent of cultivated cropland is losing soil and nutrients at an alarming rate, and roughly 46 percent is losing soil and nutrients that do not have to be lost. Implementing all the necessary conservation practices on agricultural lands that are critically undertreated (20 percent of the croplands) could deliver 54 and 45 percent of potential sediment and nutrient reductions, respectively.
Wetlands: Regional CEAP studies are identifying ways to improve wetland management. Removing accumulated eroded sediments can result in increased floodwater storage, biodiversity benefits, and contaminant mitigation. In the Mississippi Alluvial valley, better management of water control structures and increased planting of diverse tree species will likely improve wildlife habitat quality. In the High Plains, cultivation has altered or eliminated wetland services provided by most playa wetlands, and the use of native short-grass prairie plants for
32
CRP easements is highly recommended. Playa wetlands are seasonally flooded shallow depressions that are the low point in a watershed. They are generally circular and less than 30 acres in size. In the Central Valley of California and Upper Klamath River Basin, actively managed WRP wetlands support more waterfowl. In Ohio and Indiana, future WRP and CRP efforts should focus on establishing riparian buffers. In the Southeast, the wide variation in wetland types, prior habitat conditions, and tract sizes has landscape-level implications for ecosystem services gained from individual projects. In the Delmarva Peninsula, longer easement/contract periods, avoiding soil compaction, restoring wetlands in locations that are more likely to intercept upgradient groundwater from agricultural lands, and using shallow wetland basins can improve wetland functions.
Grazing lands: USDA evaluated 22 resource concerns in 19 states using USDA NRCS NRI data collected between 2004 to 2010 and 2011 to 2015. They used the collected rangeland health data to assess soil and site stability, hydrologic function, and biotic integrity.31 About 77 percent of the non-federal rangeland in the contiguous 48 states is in relatively healthy condition and has no significant soil, hydrologic, or biotic integrity problems. However, the areas of rangeland that show moderate, moderate-to-extreme, or extreme-to-total departure from reference conditions have increased since 2004 and are now at 25.8 percent. Federal programs are available to help farmers and ranchers improve wildlife
31 For more information about the NRI Rangeland Resource Assessment and Rangeland Health and a summary of Rangeland Health in 2018, visit USDA NRCS Technical Resources/Natural Resources Assessment/National Resources Inventory/Results/2018 Rangeland Health at: https://www.nrcs.usda.gov/wps/portal/nrcs/detail/national/technical/nra/nri/results/?cid=nrcseprd1343027 32 Wildlife Damage: Reports and Publications are available through USDA APHIS at: https://www.aphis.usda.gov/aphis/ourfocus/wildlifedamage/sa_reports/ct_reports_and_publications 33 U.S. Fish and Wildlife Service/Endangered Species provides an overview for landowners and information about approaches at: https://www.fws.gov/endangered/landowners/index.html
habitat on their land. In addition to WLFW and the easement programs discussed above (e.g. CRP, WRP, GRP, FRPP, ACEP, etc.), NRCS provides assistance with implementing practices on working lands through its Environmental Quality Incentives Program (EQIP) and Conservation Stewardship Program (CSP). Beyond NRCS, in May 2019, USDA APHIS Wildlife Services established a new publication series on wildlife damage management to prevent and resolve conflicts.32 In addition, for landowners who have a listed species on their land, the U.S. Fish and Wildlife Service offers a number of options including Habitat Conservation Plans, Safe Harbor Agreements, Candidate Conservation Agreements, Conservation Banking, and Recovery Credits and Tax Deductions.33 A number of state programs also provide incentives or grants to improve wildlife habitat. For example, Michigan supports a wildlife habitat grant program to enhance and improve the quality and quantity of game species habitat. Texas provides technical assistance to those who want to include wildlife management considerations in present or future land-use practices. New Hampshire offers small grants to help landowners who own a minimum of 25 contiguous acres to restore or enhance habitat for wildlife. In 2002, Defenders of Wildlife inventoried state programs and published examples of landowner incentive programs that were making a difference (George 2002). The growing conservation finance market may help make maintaining and improving
33
wildlife habitat more attractive to producers. Participants in these markets can invest capital to support conservation in ways that provide a financial return to the investor but also have a positive impact on the environment. The total potential for global conservation impact investment between 2016 to 2020 was recently estimated at $200 to $400 billion (Huwyler et al. 2016). In 2016, USDA NRCS established the Conservation Innovations Team to help support the development of promising environmental markets and conservation finance approaches that align conservation and economic outcomes.34 As part of this effort, AFT is leading a project to establish Pollinator habitat on permanently protected farms in Michigan’s Grand Traverse region. The resulting pollinator habitat credits (one acre of pollinator habitat and yearly maintenance for the next five years) are being offered to corporations, small businesses, and community organizations to directly fund pollinator habitat expansion in an agricultural region heavily dependent on pollinators. The cost of one credit is $3,125.35 The major food retailers and companies that recognize agricultural sustainability is a core issue for their businesses are helping their growers transition. Walmart, Smithfield Foods, Unilever, General Mills and Tyson, among others, have established sustainability commitments and programs to expand the adoption of conservation practices by farmers in their supply chains (Monast et al. 2019). The farm input sector is also pursuing ways to expand voluntary conservation activities. Land O’Lakes, a farmer-owned cooperative that reaches 50 percent of the harvested acres in the United States, launched its SUSTAIN platform (a
34 USDA NRCS/Technical Resources/Environmental Markets & Conservation Finance provides updates on what the Conservation Innovations Team is doing: https://www.nrcs.usda.gov/wps/portal/nrcs/main/national/technical/emkts/ 35 American Farmland Trust provides more information about its pollinator protection project at: https://farmland.org/invest-in-the-farmland-pollinator-protection-project/ 36 The One Planet Business for Biodiversity (op2b) can be accessed at: https://op2b.org/
suite of on-farm conservation tools) in 2018 to help agricultural retailers, farmers and food companies improve air quality, soil health, and water quality. One Planet Business for Biodiversity (OP2B), an international coalition of 21 businesses with a specific focus on agriculture, was launched in September 2019 to scale up regenerative agricultural practices, boost cultivated biodiversity and diets through product portfolios, and eliminate deforestation while enhancing the management, restoration, and protection of high-value natural ecosystems.36 These efforts can help producers make the transition to more sustainable practices by taking on some of the risks and helping cover some costs until they gain the full benefits of conservation management. However, the mainstream farm financial sector (including lenders and insurers) still lags behind (Monast et al. 2019).
MOVING FORWARD: BALANCING LAND-USE DEMANDS
Given increasing demands for food, energy, and housing in the future, most predict that we will need to convert more land into agriculture. This, in turn, will continue to negatively impact biodiversity by either eliminating or polluting more wildlife habitat (Firbank et al. 2007). By following eight key ecological principles for managing land use, we can move toward a future in which biodiversity, wildlife, and agriculture thrive together. They include the need to: 1) Examine the impacts of local decisions in a regional context; 2) Plan for long-term change and unexpected events; 3) Preserve rare landscape elements, critical
34
habitats, and associated species; 4) Avoid land uses that deplete natural resources over a broad area; 5) Retain large contiguous or connected areas that contain critical habitats; 6) Minimize the introduction and spread of nonnative species; 7) Avoid or compensate for the effects of development on ecological processes; and 8) Implement land-use-and-management practices that are compatible with the natural potential of the area (Dale et al. 2000; Damschen et al. 2019). While some suggest that we can reduce the land requirement for agriculture (Green et al. 2005) by increasing the productivity per unit area (agricultural intensification), the key ecological principles stated above for managing land use suggest a more balanced strategy. AFT would argue that we should prioritize the protection of the farmland and ranchland with the highest potential for intensive crop and food production (the most productive, versatile, and resilient lands) to minimize the possibility of having
to convert marginal lands back into agricultural production. To better support biodiversity at the farm level, more effort, time, and resources should go into designing, developing, and managing farming systems according to ecological principles at the watershed or regional levels (Allen and Vandever 2012). We need to consider farmland within a watershed and ecosystem context. The scientific literature on agricultural landscapes and the conservation of wildlife habitat supports farming systems that mimic the scale and function of key ecological processes as they have evolved historically in a given region. This includes maintaining a matrix of natural grasslands, grazing lands, and pasture in prairie-forest border ecosystems; aggressively protecting natural habitat remnants and remaining natural wetlands; maintaining adequate patch size and corridors for wildlife; protecting farms where agriculture is compatible with
AGROBIODIVERSITY: THE GENETIC DIVERSITY BACKSTOPPING OUR FOOD SUPPLY
Agrobiodiversity encompasses the genetic diversity of the cultivated crop breeds and livestock that backstop the resilience of agricultural systems and food security. This vital subset of biodiversity is developed and managed by farmers, ranchers, and herders worldwide. Conserving the huge diversity of plant and livestock species that can be used for food is accomplished through farmers who raise native plants, lesser-used species, locally adapted varietals, and “heritage breeds” as well as gene banks and seed collections that are maintained at the local and national levels (UN Environment 2019). In addition, fallow fields and natural lands support large numbers of species that can be useful for agriculture. Since the 1900s, many farmers have abandoned their multiple local varieties and native plants for genetically uniform, high yielding varieties (Food and Agriculture Organization 1999). This lack of genetic diversity puts crops and livestock at risk. For example, the great Irish potato famine of the 1940s happened because the high-yielding potato varieties favored by Irish farmers succumbed to an airborne fungus that turned them rotten overnight. In the 1970s, genetic uniformity in the U.S. corn crop made it susceptible to southern leaf blight and reduced yields by as much as 50 percent. Resistance to the blight was eventually found in an African maize variety and incorporated into commercial varieties. And the banana export trade is almost entirely based on vast plantations filled with genetically identical Cavendish clones. The Cavendish bananas are now susceptible to fungal and viral diseases that are impacting banana growers around the world (Canine 2005). Foresight demands that both traditional landraces and wild relatives be protected; in the process, natural areas and broader biodiversity would benefit as well.
35
biodiversity protection but threatened by urban or suburban development; and drastically reducing nutrient, soil, chemical, and sediment losses (Blann 2006). Research is also starting to answer how much habitat we might need to maintain biodiversity by habitat types and helps put the role that agriculture might play into a broader context (Blann 2006). The need to apply restorative, working lands conservation approaches on agricultural land continues to gain traction. A recent review of landscapes that work for biodiversity and people concludes that working lands conservation will be a key strategy in combatting biodiversity loss, climate change, and unsustainable land use (Kremen and Merenlender 2018). The U.S. Congress is starting to respond. The Agriculture Resilience Act (ARA), introduced February 12, 2020, sets a bold vision of reaching net zero greenhouse gas emissions in agriculture by 2040.37 It focuses on six policy areas: increasing research, improving soil health, protecting existing farmland, supporting pasture-based livestock systems, boosting investments in on-farm energy, and reducing food waste. Progress on these fronts would provide countless co-benefits for wildlife.
CONCLUSIONS
Agriculture can minimize its negative effects on wildlife, but the loss of farmland to urban and low-density residential development can significantly limit any opportunities for positive impacts. Going forward, agricultural lands in the United States will need to produce more food, fiber, and energy for an expanding population. Equally important, these lands can and must be managed and
37 A summary of H.R. 5861 – The Agriculture Resilience Act and its status is available at: https://www.congress.gov/bill/116th-congress/house-bill/5861
protected to play a role in preserving biodiversity. Any expansion of biofuel production—a potentially major driver of additional demand for agricultural products—must be undertaken carefully to minimize the cost to biodiversity (Behrman et al. 2015). Balancing competing needs going forward will require us to focus on a landscape scale. We need to determine where food production is the most appropriate and what lands are more marginal while better serving the public by providing habitat for wildlife or other ecosystem services like water filtration, flood mitigation, pollinator conservation, etc. Under rapid landscape change, we also need to significantly expand and connect protected areas to prevent the further loss of biodiversity and preserve ecological functions across broad geographies. Agricultural lands with riparian buffers, grass filter strips, woodlots, CRP acreage, and rangelands and pasture lands can help provide the “connective tissue” that creates these environmental corridors and can play a critical role in providing refugia and facilitating species adaptation to climate change. The necessary shift to regenerative practices to combat climate change is compatible with these goals. There are many success stories of public and private partnerships to protect declining species, often built on trusting and open long-term partnerships and relationships between landowners, land managers, and the agencies that serve them. Going forward, we must enhance these pragmatic-yet-progressive efforts to find and maintain the balance between agriculture and wildlife habitat preservation, for the sake of the species that our biosphere depends on.
36
AFT’s Farms Under Threat is currently collecting the datasets that will help us identify key wildlife habitat associated with agricultural lands. We plan to provide new, high-resolution, and spatially consistent data to help identify habitat patches and movement corridors that are associated with agricultural lands. This data will complement on-going regional analyses of resilient and connected landscapes that
focus on preserving natural areas. This novel research will provide a powerful tool for targeting investments in land protection for wildlife conservation, so our committed landowners and conservation professionals can simultaneously protect biodiversity and conserve productive, versatile, and resilient farmland and ranchland for future generations.
37
APPENDIX I: USING MODELS AND METRICS TO DETERMINE THE CAPACITY OF AGRICULTURAL LANDS TO SUPPORT WILDLIFE HABITAT
As the recognition of the importance of conserving biodiversity has grown, researchers have focused more attention on the role that agricultural lands play. In particular, several efforts have developed models to determine the capacity of agricultural lands to support wildlife habitat, strengthening our understanding of how agriculture and biodiversity can co-exist. MODELS A comprehensive analysis in Canada found that 75 percent of species could fulfill both their breeding and feeding habitat requirements entirely within marginal agricultural lands. However, many are generalist species, and the wildlife species that are most at risk are specialists and rely on a particular habitat type. Agriculture can be very good for some species (e.g. white-tailed deer) and detrimental to others (e.g. songbirds that require contiguous blocks of forest to survive). The Canadian researchers analyzed trends in wildlife habitat capacity on agricultural lands in Canada over 1986 to 2006 (Javorek and Grant 2011). They identified 15 habitat categories and looked at their comparative value for wildlife: Cereals (oats, millets); Winter Cereals (rye, wheat, barley, triticale); Oilseeds (rapeseed, sunflower); Corn; Soybeans; Vegetables; Berries; Fruit trees; Other crops (potatoes, tobacco, millet, caraway, ginseng, coriander); Pulses (beans, chickpeas, lentils, dry peas); Summer fallow (cropland purposely kept out of production during a growing season); Tame Hay (hay cut from cultivated grasses); Improved Pasture; Unimproved Pasture (natural lands used for grazing); and All other lands (wetland with margins, without margins and open water), riparian (woody, herbaceous and crop),
shelterbelts (including hedgerows), woodland, idle land/old field and anthropogenic (farm buildings, lanes)). All Other Land ranked highest by far followed by unimproved pasture. Improved pasture, tame hay, and fruit trees ranked next but showed a marked decline in their value as both breeding and feeding habitat. Cultivated lands (summer fallow and annual crops) were ranked very low, particularly for breeding habitat. While 75 percent of species could fulfill both their breeding and feeding habitat requirements entirely within All Other Land, only 13 percent could fulfill both breeding and feeding on cropland habitats. When other land cover types were present, however, the value of cultivated cropland for wildlife increased dramatically to 36 percent. Twenty-nine percent of species used Unimproved Pasture for both breeding and feeding habitat. Again, when other land cover types were present, this increased to 48 percent. The European Union concluded that the intensity of production and presence of key landscape elements determined whether agricultural lands will support biodiversity. The E.U. developed the Common Agricultural Policy Regionalized Impact modeling system to evaluate the likelihood that an agricultural system would support biodiversity (Paracchini and Britz 2010). It recognizes that high fertilization inputs, short crop rotations, and monocultures combined with pesticides can all negatively impact species richness and diversity. For a landscape unit to be considered of High Nature Value (HNV), both the intensity of agricultural practices and landscape elements (edges, hedgerows, ditches, terraces) are considered. The known
38
characteristics of HNV are low input, presence of semi-natural vegetation, low grazing pressure, and crop and land diversity. The model creates four indexes that roll up into an indicator of biodiversity friendly farming practices. The arable crops index includes a sum of manure and mineral nitrogen (N) applied per hectare and a measure of crop diversity. For the grassland index, stocking density was selected as a proxy for management intensity with reference to environmental zones and the optimal grazing regime with regards to biodiversity. For the permanent crop index, they used the same N input index created for arable crops. Permanent crops are associated with a high nature value when they are traditionally managed (presence of old trees, permanent vegetation cover of the flow, very low input of pesticides and fertilizers). The final aggregated indicator is obtained by adding the arable crops, grasslands, and permanent crops scores weighted by the respective shares in the Utilized Agricultural Area (UAA) (the share of arable crops, grasslands, and the rest of the UAA). Researchers working with the U.S. Environmental Protection Agency used a habitat change model to assess the potential impacts of alternative agricultural practices on wildlife in two agricultural watersheds in Iowa. They estimated the suitability of 26 habitat classes for 239 native vertebrate species and 117 butterfly species (Santelmann et al. 2006). They mapped three future scenarios for the watersheds: Production (more land converted to cultivation, woodlands mostly disappeared, riparian areas with narrow (3-6 m) grass buffers, corn and soybeans in limited crop rotations, little land in pasture or alfalfa); Water Quality (woodlands maintained; riparian buffers widened from 3-6 m to 15-60 m, small wetlands created to process flow from tile drains and substantial areas in pasture and alfalfa production; and
Biodiversity (at least 642 acres set aside in permanent, indigenous ecosystem core reserves in each watershed; riparian areas 30-60 m wide, agroforestry and strip intercropping used which intersperse native perennial species with corn and soybean). In the Production scenario, all taxa and native vertebrates lost habitat except for mammals (conservation tillage in row crops provided more cover to small mammals than use of conventional tillage). In the Water Quality and Biodiversity scenarios, all taxa had more habitat and the estimated changes in wildlife habitat were similar to each other. Species richness of native vertebrates was highest in the ungrazed riparian forests, upland forest, wet prairie and perennial herbaceous cover and lowest in row crops. The researchers cautioned that the potential effects of global climate change should also be considered, indicating that the more diverse agricultural and forestry production systems would not only be more sustainable but also more conducive to the migration of species among nature reserves as they coped with rapidly changing environmental conditions. METRICS Metrics on the landscape scale. In 2000, USDA explored the idea of using habitat patch size as an indicator of habitat diversity. Spatial patterns are important determinants of the ecological value of agricultural habitats (Brady and Flather 2001), and the 1997 NRI sampled spatial patterns of nine general cover types and determined patch sizes (U.S. Department of Agriculture 2000). The size of habitat patches can be of critical importance for some species and, as expected, the largest cropland patch sizes occurred where cropland was most abundant. Smaller cropland patches interspersed among other cover types such as forest or rangeland generally provide greater habitat values for many species, however large cropland fields
39
may attract large flocks of migrating birds for feeding areas during migration. Rangelands generally occurred in larger patches than cropland. Cropland cover types were much more highly fragmented in the eastern United States than elsewhere, corresponding also to the areas where the indicator of cropland patch sizes was smaller. Fragmentation of rangelands was also greatest where rangeland patch size was the smallest. Metrics for on-farm habitat and biodiversity for specialty crops. A multi-stakeholder initiative in California to measure farm sustainability performance throughout the specialty crop supply chain has developed a metric to measure on-farm habitat and biodiversity (Stewardship Index for Specialty Crops 2016). The metric considers the total farmed area (including creeks, riparian areas, buffer zones, grasslands/scrub, wetlands, and non-built areas that are not under cultivation) and provides an online tool to help farmers measure their fields, patches of habitat, and other features. It also measures the extent to which the operation is “wildlife friendly,” e.g. diverse
crop production and crop rotations, use of cover crops, tillage, timing of cultivation, crop protection techniques, conservation practices (like conservation buffers or hedgerows), and maintenance of corridors that allow wildlife to move safely through the farm landscape (wildlife connectivity). Metrics for farm-level habitat and landscape change for row crops. Also, at the farm level, Farm to Market has been pilot-testing a farm-scale biodiversity metric: the Habitat Potential Index. It quantifies farm-level habitat and landscape change from year to year and recognizes land management practices that preserve important buffers of native perennial grasses or trees and other wildlife habitat (Field to Market 2016). Metrics for biodiversity in organic and low-input-farming. In Europe, biodiversity in organic and low-input farming is measured with a set of 23 indicators (BioBio): three for the genetic diversity of crops and livestock, four for species diversity, eight for habitat diversity, and eight for farm management (Herzog et al. 2012).
40
REFERENCES
Abraham, K. F., R. L. Jefferies and R. T. Alisauskas. 2005. The dynamics of landscape change and snow geese in mid-continent North America. Global Change Biology 11: 841-855. Blackwell Publishing Ltd. Allen, A. QW. And M. W. Vandever. 2012. Conservation Reserve Program (CSP) contributions to wildlife habitat, management issues, challenges and policy choices. An annotated bibliography. U.S. Geological Survey Scientific Investigations Report 201205066. 185 pp. Alig, R., S. Stewart, D. Wear, S. Stein and D. Nowak. 2010. Conversions of Forest Land: Trends, Determinants, Projections, and Policy Considerations, pp. 1-25. In: Advances in Threat Assessment and Their Application to Forest and Ranchland Management. Pye, J. M., H. M. Rauscher, Y Sands, D. C. Lee, J. S. Beatty, Eds. USDA, Forest Service, Pacific Northwest and Southern Research Stations. General Technical Report PNW-GTR-802. Portland, Oregon. 708 pp. Allen, A. W. and M. W. Vandever. 2003. A national survey of Conservation Reserve Program (CRP) participants on environmental effects, wildlife issues and vegetation management on program lands. Biological Science Report. U.S. Dept. of the Interior and U.S. Geological Survey. USGS/BRD/BSR-2003-0001. July 2003. 60 pp. American Farmland Trust. 2013. Impacts of the Federal Farm and Ranch Lands Protection Program: An Assessment Based on Interviews with Participating Landowners. American Farmland Trust: Washington, D.C. 12 pp. https://farmlandinfo.org/publications/impacts-of-the-federal-farm-and-ranch-lands-protection-program-an-assessment-based-on-interviews-with-participating-landowners-summary-of-findings/ Anderson, M. G., A. Barnett, M. Clark, J. Prince, A. Olivero Sheldon and B. Vickery. 2016. Resilient and Connected Landscapes for Terrestrial Conservation. The Nature Conservancy, Eastern Conservation Science, Eastern Regional Office. Boston, MA. 161 pp. https://www.conservationgateway.org/ConservationByGeography/NorthAmerica/UnitedStates/edc/reportsdata/terrestrial/resilience/Pages/default.aspx Behrman, K.D., T. E. Juenger, J. R. Kiniry and T. H. Keitt. 2015. Spatial land use trade-offs for maintenance of biodiversity, biofuel and agriculture. Landscape Ecology (2015) 30:1987-1999. Blann, K. 2006. Habitat in Agricultural Landscapes: How Much is Enough? A state-of-the-science literature review. Defenders of Wildlife. West Linn, Oregon and Washington, D.C. 84 pp. Brady, S. J. 2007. Effects of Cropland Conservation Practices on Fish and Wildlife Habitat. pp. 9-24. In: Ed. J. B. Haufler: Fish and Wildlife Response to Farm Bill Conservation Practices. The Wildlife Society. Technical Review 07-1. September 2007. 118 pp. Brady, S. J. and C. H Flather. 2001. Estimating Wildlife Habitat Trends on Agricultural Ecosystems in the United States. Paper presented to the: OECD Expert Meeting on Agri-Biodiversity Indicators, November 5-8, 2001 in Zurich, Switzerland. 13 pp.
41
Calderone, N.W. 2012. Insect Pollinated Crops, Insect Pollinators and U.S. Agriculture: Trend Analysis of Aggregate Data for the Period 1992-2009. PLoS ONE 7(5):e37235. Canine, C. 2005. Building a better banana. Smithsonian October 2005. https://www.smithsonianmag.com/science-nature/building-a-better-banana-70543194/ Church, J. 2001. Environmental Corridors: “Lifelines for Living.” University of Illinois Extension. Local Community Resources. LGIEN Fact Sheet Series 2001-013: http://extension.illinois.edu/lcr/environmental.cfm Conover, M., E. Butikofe and D. Decker. 2018. Perceptions of Wildlife Damage on Agriculture; Management Implications. Wildlife Department, College of Natural Resources, Utah State University. Poster Paper. Conservation Science Partners (CSP). 2020. Description of the approach, data, and analytical methods used for the Farms Under Threat: State of the States project, version 2.0. Final Technical Report. Truckee, CA.
Corry, R. C. and J. I. Nassauer. 2004. Small-patch patterns in human-dominated landscapes. 92-111. In: Eds. J.Liu and W. W. Taylor. Integrating Landscape Ecology into Natural Resources Management. Cambridge University Press, Cambridge, United Kingdom. 518 pp. Ewing, R., J. Kostyack, D. Chen, B. Stein and M. Ernst. 2005. Endangered by Sprawl: How Runaway Development Threatens American’s Wildlife. National Wildlife Federation, Smart Growth American and NatureServe. Washington, DC., January 2005. 68 pp. Dahl, T. E. and G. J. Allord. 1997. Technical Aspects of Wetlands: History of Wetlands in the Conterminous United States. In: National Water Summary-Wetland Resources. U.S. Geological Survey Water-Supply Paper 2425. 8 pp. Dale, V. H., S. Brown, R. A. Haeuber, N. T Hobbs, N. Huntly, R. J. Naiman, W. E. Riebsame, M. G. Turner and T. J. Valone. 2000. Ecological principles and guidelines for managing the use of land. Ecological Applications, Vol. 10 No. 3:639-670. June 2000. Damschen, E.I., L. A. Brudvig, M. A. Burt, R. J. Fletcher Jr., N. M. Haddad, D. J. Levey, J. L. Orrock, J. Resasco and J. T. Tewksbury. 2019. Ongoing accumulation of plant diversity through habitat connectivity in an 18-year experiment. Science 365 (6460) (2019): 1478–1480, available at https://science.sciencemag.org/content/365/6460/1478 DeLonge, M. S., A. Miles and L. Carlisle. 2016. Investing in the transition to sustainable agriculture. Environmental Science & Policy 55 (2016):266-273. DeVault, T. L., J. S. Beasley, L. A. Humberg, B. J. MacGowan, M. I. Retamosa and O. E. Rhodes, Jr.. 2007. Intrafield patterns of wildlife damage to corn and soybeans in northern Indiana. Human–Wildlife Conflicts 1:205–213. Diaz, S., J. Settele, and E. Brondizio (Co-Chairs). 2019. Intergovernmental Science-Policy Platform on Biodiversity and Ecosystem Services. 2019. Report of the Plenary of the IPBES on the work of
42
its seventh session. Addendum. Summary for policy makers of the global assessment report on biodiversity and ecosystem services of the IPBES. United Nations IPBES/7/10/Add. 1. 29 May 2019. 45 pp. Dickson, B., C. M. Albano, B. H. McRae, J. J. Anderson, D. M. Theobald, L. J. Zachmann, T. D. Sisk and M. P. Dombeck. 2016. Informing strategic efforts to expand and connect protected areas using a model of ecological flow, with application to the Western United States. Conservation Letters, October 2016. doe: 10.1111/concl. 12322. 8 pp. Duru, M., O. Therond, G. Martin, R. Martin-Clouaire, M. Magne, E. justes, E. Journet, J. Augertot, S. Savary, J. Bergez, and J. Sarthou. 2015. How to implement biodiversity-based agriculture to enhance ecosystem services: a review. Agron. Sustain. Dev. (2015) 35:1259-1281 DOI 10.1007/s13593-015-0306-1. Emili, L.A. and R. P Greene. 2014. New Cropland on former rangeland and lost cropland from urban development: The “replacement land” Debate.” Land 2014, 3(3):658-674. Erisman, J. W., N van Eckeren, J. de Witt, C. Koopmans, W. Cuijpers, N. Oerlemans and B. J. Koks. 2016. Agricultural and biodiversity: a better balance benefits both. AIMS Agricultural and Food, 1(2):157-174. European Commission. 2010. The factory of life. Why soil biodiversity is so important. Luxemburg doi 10.2779/17050. 22 pp. Evans, S. G., L. C. Kelley and M. D. Potts. 2013. The potential impact of second-generation biofuel landscapes on at-risk species in the U.S. Global Change Biology: Bioenergy. Vol. 7, Issue 2:337-348. March 2015. https://doi.org/10.1111/gcbb.12131 Ewing, R., J. Kostyack, D. Chen, B. Stein, and M. Ernst. 2005. Endangered by Sprawl: How Runaway Development Threatens America’s Wildlife. National Wildlife Federation, Smart Growth America, and NatureServe. Washington, D.C., January 2005. Fargione, J.E., T. R. Cooper, D. J. Flaspohler, J. Hill, C. Lehman, T. McCoy, S. McLeod, E. J. Nelson, K. S. Oberhauser and D. Tilman. 2009. Bioenergy and wildlife: Threats and opportunities for grassland conservation. Bio Science Vol 29, No. 9: 767-777. October 2009. Fernandez, A.L., C.C. Sheaffer, N.E. Tautges, D.H. Putnam, and M.C. Hunter. 2019. Alfalfa, Wildlife, and the Environment (2nd ed.). National Alfalfa and Forage Alliance, St. Paul, MN. Field to Market: The Alliance for Sustainable Agriculture. 2016. Environmental and Socioeconomic Indicators for Measuring Outcomes of On-Farm Agricultural Production in the United States. Third Edition, December 2016. 71 pp. ISBN: 978-0-692-81902-9. Firbank, G., S. Petit, S. Smart, A. Blain and R. J. Fuller. 2007. Assessing the impacts of agricultural intensification on biodiversity: a British perspective. Phil. Trans. R. Soc. B (2008) 363:777-787. Published online 4 September 2007 doi:10.1098/rstb.2007.2183
43
Flather, C. H. and T. W. Hoekstra. 1989. An analysis of the wildlife and fish situation in the United States: 1989-2040. General Technical Report RM-178. Fort Collins, Colo.: Rocky Mountain Forest and Experiment Station, U.S. Forest Service, U.S. Department of Agriculture. Florida Game and Fresh Water Fish Commission and American Farmland Trust. 1995. A Landowners’ Strategy for Protecting Florida Panther Habitat on Private Lands in South Florida. A Project Report. June 1995. 71 pp. Florida Panther Recovery Implementation Team. 2015. Incentivizing Panther Conservation on Working Lands in the Florida Panther Focus Area. A concept paper. U.S. Fish and Wildlife Service and USFWS Partners for Fish and Wildlife. February 18, 2015. 21 pp. Food and Agriculture Organization. 1999. Women: users, preservers and managers of agrobiodiversity. Food and Agriculture Organization of the United Nations. Rome 1999. Frakes, R. A., R. C. Belden, B. A. Wood and F. E. James. 2015. Landscape Analysis of Adult Florida Panther Habitat. PLOS ONE 10(7): | DOI:10.1371/journal.pone.0133044 July 29, 2015. 18 pp. Freedgood, J., M. Hunter, J. Dempsey and A. Sorensen. 2020. Farms Under Threat: The State of the States. Washington, DC: American Farmland Trust. Garibaldi, L.A., I. Steffan-Dewenter, R. Winfree, M. A. Aizen, R. Bommarco, S. A. Cunningham, C. Kremen, L. G. Carvalheiro, L.D. Harder, O. Afik I. Bartomeus, F. Benjamin, V. Boreux, D. Cariveau, N. P. Chacoff, J. H. Dudenhoffer, B. M Freitas, J. Ghazoul, S. Greenleaf, J. Hipolito, A. Holzschuh, B. Howlett, R. Isaacs, S. K. Javorek, C. M. Kennedy, K. Krewenka, S. Krishnan, Y. Mandelik, M. M. Mayfield, I. Motzke, T. Munyuli, B. A. Nault, M. Otieno, J. Peterson, G. Pisanty, S. G. Potts, R. Rader, T.H. Ricketts, M. Rundlof, C. L. Seymour, C. Schuepp, H. Szentgyorgyi, H Taki, T. Tscharntke, C. H. Vergara, B. F. Viana, T. C. Wanger, C. Westphal, N. Williams and A. M. Klein. 2013. Wild pollinators enhance fruit set of crops regardless of honeybee abundance. Science 2013 Mar 29;339(6127):1608-11. doi: 10.1126/science.1230200. Epub 2013 Feb 28. Gebhardt, K., A. M. Anderson, K. N. Kirkpatrick and S. A. Shwiff. 2011. A review and synthesis of bird and rodent damage estimates to select California crops. Crop Protection 30(2011): 1109-1116. Gennet, S., J. Howard, J. Langholz, K. Andrews, M.D. Reynolds and S. A. Morrison. 2013. Farm practices for food safety: an emerging threat to floodplain and riparian ecosystems. Research Communications. Front Ecol. Environ 2013; 11(5):236-242. George, S. 2002. Conservation in America: State Government Incentives for Habitat Conservation. A Status Report. Defenders of Wildlife. 108 pp. Glaser, A. (Editor). 2012. America’s Grasslands Conference: Status, Threats and Opportunities. Proceeding of the 1st Biennial Conference on the Conservation of America’s Grasslands. August 15-17, 2011. Sioux Falls, S.D. Washington, D.C. and Brookings, S.C, National Wildlife Federation and South Dakota State University. 92 pp.
44
Glover, J. D., and J. P. Reganold. 2010. Perennial grains: Food security for the future. Issues in Science and Technology, 26(2), 41-47. Golden Kroner, R.E., S. Qin, C.N. Cook, R. Krithivasan, S. M. Pack, O.D. Bonilla, K. A. Cort-Kansinally, B. Coutinho, M. Feng, M.I. Martinez Garcia, Y. He, C. J. Kennedy, C. Lebreton, J. C. Ledezma, T. E. Lovejoy, D. A. Luther, Y. Parmanand, C.A. Ruiz-Agudelo, E. Yerena, V. Moron Zambrano and M. B. Mascia. 2019. The uncertain future of protected lands and waters. Science. 2019 May 31:364(6443):881-886. DOI: 10.1126/science.aau5525 Grassland, Shrubland, Desert and Tundra Technical Team. 2011. National Fish, Wildlife and Plants Climate Adaptation Strategy: Grassland Ecosystems. Draft. 23 pp. Gray, M. J., H. M. Hagy, J. A. Nyan and J. D. Stafford. 2013. Chapter 4: Management of Wetlands for Wildlife. USGS staff- published research. Paper 803. 61 pp. In: J.T. Anderson and C. A. Davis (Eds). 2013. Wetland Techniques: Volume 3: Applications and Management. Griscom, B., J. Adams, P. Ellis, R. Houghton, G. Lomax, D. Miteva, W. Schlesinger, D. Shoch, J. Siikamäki, P. Smith, P. Woodbury, C. Zganjar, A. Blackman, J. Campari, R. Conant, C. Delgado, Patricia Elias, Trisha Gopalakrishna, M. Hamsik, M. Herrero, J. Kiesecker, E. Landis, L. Laestadius, S. Leavitt, S. Minnemeyer, S. Polasky, P. Potapov, F. Putz, J. Sanderman, M. Silvius, E. Wollenberg, and J. Fargione. 2017. Natural Climate Solutions. PNAS October 31, 2017 114 (44) 11645-11650; first published October 16, 2017 https://doi.org/10.1073/pnas.1710465114 Groves, C. R., L. S. Kutner, D. M. Stoms, M. P. Murray, J. M. Scott, M. Schafale, A. S. Weakley, and R. L. Pressey. 2000. Owning up to our responsibilities: Who owns lands important for Biodiversity? Pp 275-300 in Precious Heritage: The Status of Biodiversity in the United States, Stein, B. A., L.S. Kutner, and J.S. Adams (eds.) New York: Oxford University Press. Haber, J. and P. Nelson. 2015. Planning for Connectivity: A guide to connecting and conserving wildlife within and beyond America’s national forests. The Center for Large Landscape Conservation, Defenders of Wildlife, Wildlands Network and Yellowstone to Yukon Conservation Initiative. 28 pp. Hansen, A. J., R. L. Knight, J. M. Marzluff, S. Powell, K. Brown, P.H. Gude and K. Jones. 2005. Effects of exurban development on biodiversity: patterns, mechanisms and research needs. Ecological Applications 15(6): 1893-1905. Land Use Change in Rural America. Ecological Society of America. December 2005. Herzog, F., K. Balázs, P. Dennis, J. Friedel, R. Jongman, P. Jeanneret, M. Kainz and P. Pointereau 2012. Report on the final indicator set after stakeholder audit. BioBio: Indicators for biodiversity in organic and low-input farming systems. European Commission within the Seventh Framework Programme (2009-2012). Project Nol 227161. 16 pp. Hobbs, N. T., K. A. Galvin, C. J. Stokes, J. M. Lackett, A. J. Ash, R. B. Boone, R. S. Reid and P. K. Thornton. 2008. Fragmentation of rangelands: Implications for humans, animals and landscape. Global Environmental Change 18(4): 776-785.
45
Huijser, M. P., P. McGowen, J. Fuller, A. Hardy, A. Kociolek, A. P. Clevenger, D. Smith and R. Ament. 2008. Wildlife-Vehicle Collusion Reduction Study: Report to Congress. FHWA-HRT-08-034. Federal Highway Administration. Western Transportation Institute. August 2008. 254 pp. Huwyler, F., J. Kappeli and J. Tobin. 2016. Conservation Finance. From Niche to Mainstream: The Building of an Institutional Asset Class. Credit Suisse Group AG and McKinsey Center for Business and Environment. 24 pp. January 2016. Jackson, S.D. 2000. Overview of Transportation Impacts on Wildlife Movement and Populations. Pp. 7-20 In Messmer, T.A. and B. West, (eds) Wildlife and Highways: Seeking Solutions to an Ecological and Socio-economic Dilemma. The Wildlife Society. Jacobs, C. E. and M.B. Main. 2015. A conservation-based approach to compensation for livestock depredation: The Florida Panther study. PLOS: ONE:DOI:10.1371/journal.pone.0139203 September 30, 2015. 19 pp. Javorek, S.K. and M.C. Grant. 2011. Trends in wildlife habitat capacity on agricultural land in Canada, 1986-2006. Canadian Biodiversity: Ecosystem Status and Trends 2010. Technical Thematic Report No. 14. Canadian Councils of Resource Ministers. Ottawa, ON. vi + 46 pp. Jones, N. F., L. Pejchar and J. M. Kiesecker. 2015. The energy footprint: How oil, natural gas and wind energy affect land for biodiversity and the flow of ecosystem services. BioScience Vol. 65, No. 3: 290-301. Kang, S., W. M. Post, J. A. Nichols, D. Wang, T. O. West, V. Bandaru and R. C. Izaurralde. 2013. Marginal lands: Concept, assessment and management. J. Ag. Science Vol. 5, No. 5: 129-139. Published online April 15, 2013. doi:10.5539/jas.v5n5p129. Karp, D.S., P. Baur, E. R. Atwill K. De Master, S. Gennet, A. Iles, J.L. Nelson, A.R. Sciligo and C. Kremen. 2016. The unintended ecological and social impacts of food safety regulations in California’s Central Coast Region. Bioscience Vol. 65, Issue 12:1173-1183. Karp, D. S., S. Gennet, C. Kilonzo, M. Partyka, N. Chaumount, E.R. Atwill and C. Kremen. 2015. Comanaging fresh produce for nature conservation and food safety. PNAS Vol. 112, no. 35:1126-1131. Koh, I., E. V. Lonsdorf, N. M. Williams, C. Brittain, R. Isaacs, J. Gibbs and T. H. Ricketts. 2016. Modeling the status, trends, and impacts of wild bee abundance in the United States. PNASS Vol. 113(1):140-145. January 5, 2016. Kostyack, J., J. Lawler, D. Goble, J. Olden and J. Scott. 2011. Beyond Reserves and Corridors: Policy Solutions to Facilitate the Movement of Plants and Animals in a Changing Climate. BioScience, Vol. 61, Issue 9: 713-719. September 2011. https://doi.org/10.1525/bio.2011.61.9.10 Kovacs-Hostyanszki, A., A. Espindola, A. J. Vanbergen, J. Settele, C. Kremen and L. V. Dicks. 2017. Ecological intensification to mitigate impacts of conventional intensive land use on pollinators and pollination. Ecological Letters (2017). 17 pp.
46
Kremen, C. and A. M. Merenlender. 2018. Landscapes that work for biodiversity and people. Science 362, eaau6020 (2018). 19 October 2018. La Follette, C. and C. Maser. 2017. Sustainability and the Rights of Nature: An Introduction. CRC Press., June 1, 2017. 406 pp. Lark, T. J., J. M. Salmon and H.K Gibbs. 2015. Cropland expansion outpaces agricultural and biofuel policies in the United States. Environ. Res. Lett. 10(2015)044003. 12 pp. http://sustainableagriculture.net/wp-content/uploads/2015/04/2015-U_of_W-study.pdf Lin, B., S. Macfadyen, A. Renwick, S. Cunningham and N. Schellhorn, 2020. Maximizing the environmental benefits of carbon farming through ecosystem service delivery. BioScience 63: 793–803. ISSN 0006-3568, electronic ISSN 1525-3244. Luowski, R. N., S. Bucholtz, R. Claassen, M. J. Roberts, J.C. Cooper, A. Gueorguieva and R. Johansson. 2006. Environmental Effects of Agricultural Land-Use Change: The Role of Economics and Policy. USDA ERS Report No. 25. August 2006. 82 pp. Marzluff, J. M. and K. Ewing. 2001. Restoration of Fragmented Landscapes for the Conservation of Birds: A General Framework and Specific Recommendations for Urbanizing Landscapes. Restoration Ecology Vol. 9(3): 280-292. September 2001. Maxwell, S., R. A. Fuller, T. M. Brooks and J. E.M. Watson. 2016. The ravages of guns, nets and bulldozers. Nature Vol. 536:143- 145. August 11, 2016. McConnell, M.D. and L. W. Burger, Jr. 2016. Precision Conservation to Enhance Wildlife Benefits in Agricultural Landscapes. In: Precision Conservation: Geospatial Techniques for Agricultural and Natural Resources Conservation. J. Delgado, G. Sassenrath, and T. Mueller, editors. Agronomy Monograph 59. doi:10.2134/agronmonogr59.2013.0031 Midwest Pheasant Study Group. 2012. National wild pheasant conservation plan. N. B. Veverka (ed.). Association of Fish and Wildlife Agencies. 111 pp. Miller, C. A., W. L. Anderson, L. K. Cambell and J. A. Yeagle. 2003. Perceptions of wildlife crop damage and depredation among agricultural producers in Illinois. Job Completion Report, Federal Aid in Wildlife Restoration W-112-R-11. Human dimensions Program Report SR-02-04. Illinois Natural History Survey, Champaign, IL. 33 pp. Mineau, P. and M. Whiteside. 2013. Pesticide acute toxicity is a better correlate of U.S. grassland bird declines than agricultural intensification. PLoS ONE 8(2);e57457. February 20, 2013. Moisset, B. and S. Buchmann. 2011. Bee Basics: An introduction to our native bees. USDA Forest Service and Pollinator Partnership. FS-960. March 2011. 48 pp. Monast, M., L. Sands and A. Grafton. 2019. Farm finance and conservation: How stewardship generates value for farmers, lenders, insurers and landowners. Environmental Defense Fund and K-Coe Isom AgKnowledge. 49 pp. edf.org/farm-finance.
47
National Academy of Sciences. 1993. Soil and Water Quality: An Agenda for Agriculture. Committee on Long-Range Soil and Water Conservation, Board on Agriculture, National Research Council. National Academy Press, Washington, DC. 541 pp. National Academies of Sciences, Engineering, and Medicine 2016. A Review of the Landscape Conservation Cooperatives. Washington, DC: The National Academies Press. https://doi.org/10.17226/21829. Ober, H.K., G. R. Edmondson, W. M. Giuliano, D. L. Wright, J. Atkins, A. Andreasen, S. Eubanks, L. Johnson, C. Brasher and G. Hicks. 2011. Farmer perceptions of wildlife damage to row crops in North Florida. University of Florida IFAS Extension. WEC311. July 2011. Revised October 2014. Olimpi, E.M., K. Garcia, D. gonthier, K. T. DeMaster, A. Echeverri, C. Kremen, A.R. Sciligo et al. 2020. Shifts in species interactions and farming contexts mediate net effects of birds in agroecosystems. Ecological Applications 07 March 2020. doi:10.1002/eap.2115. Paracchini, M. L. and W. Britz. 2010. Quantifying effects of changed farm practices on biodiversity in policy impact assessment - an application of CAPRI-Spat. OECD. 16 pp. Petrzelka, P., J. Fillipiak. G. Roesch-McNally and M. Barnett. 2020. Understanding and activating non-operating landowners: Non-operator landowner survey multi-state report. American Farmland Trust. 42 pp. https://farmlandinfo.org/publications/understanding-and-activating-non-operator-landowners/ Pierce, R. A. II, B. White, D. T. Jones-Farrand, T. V. Dailey and B. Carpenter. 2008. Field Borders for Agronomic, Economic and Wildlife Benefits. Agricultural MU Guide. University of Missouri Extension. GP421. November 2008. 8 pp. Pretty, J., T. Benton, Z. Bharucha, L. Dicks, C. Flora, H. Godfray, D. Goulson, S. Hartley, N. Lampkin, C. Morris, G. Pierzynski, P. Prasad, R. Vara, J. Reganold, J. Rockstrom, P. Smith, P. Thorne and S. Wratten. 2018. Global assessment of agricultural system redesign for sustainable intensification. Nature Sustainability, 1(8). pp. 441-446. ISSN 2398-9629. Radchuk, V., T. Reed, C. Teplitsky, M. van de Pol, A. Charmantier, C. Hassall, P. Adamik, F. Adriaensen, M. P. Ahola, P. Arcese, J. M. Aviles, J. Balbontin, K. s. Berg, A. Borras, S. Burthe, J. Clobert, N. Dehnhard, F. de Lope, A. A. Dhondt, N. J. Dingemanse, H. Doi, T. Eeva, J. Fickel, I. Filella, F. Fossoy, A. G. Goodenough, S. J. G Hall, B. Hansson, M. Harris, D. Hasselquist, T. Hickler, J. Joshi, H. Kharouba, J. G. Martinez, J-B Mihoub, J. A. Mills, M. Molina-Morales, A. Moksnes, A. Ozgul, D. Parejo, P. Pilard, M. Poisbleau, F. Rousset, M-O Rodel, D. Scott, J. C. Senar, C. Stefanescu, B. G. Stokke, T. Kusano, M. Tarka, C. E. Tarwater, K. Thonicke, J. Thorley, A. Wilting, P. Tryjanowski, J. Merila, B. C. Sheldon, A. P. Moller, E. Matthysen, F. Janzen, F. S. Dobson, M. E. Visser, S. R. Beissinger, A. Courtiol and S. K-Schadt. 2019. Adaptive responses of animals to climate change are most likely insufficient. 14 pp. Nature Communications. https://doi.org/10.1038/s41467-019-10924-4 Reeves, M. C., M. Krebs, I. Leinwand, D. M. Theobald and J. E. Mitchell. 2018. Rangelands on the Edge: Quantifying the Modification, Fragmentation and Future Residential Development of U.S.
48
Rangelands. General Technical Report RMRS-GTR-382. Fort Collins, CO: USDA Forest Service Rocky Mountain Research Station. 31 pp. August 2018. Reitsma, K.D., B. H. Dunn, U. Mishra, S. A. Clay, T. DeSutter and D. E. Clay. 2015. Land-Use Change Impact on Soil Sustainability in a Climate and Vegetation Transition Zone. Agron. J. 107:2363-2372 (2015). Rice, R., E. C. Shea, A. Boren, R.Bugg, J. Eberspacher, Y. Erickson, F. Hall, A. G. Kawamura, C. Kremen, J. Lafleur, K. Scanlon, K. Schescke, L. Smith, L. Synder, A. Straughn, M. Vaughan and J. Vroom. 2007. Enhancing Pollination Services and Profitability - an Opportunity for U. S Agriculture. June 2007. 23 pp. Richter, B.D., D. P. Braun, M.A. Mendelson, and L.L. Master. 1997. Threats to imperiled freshwater fauna. Conservation Biology 11: 1081-1093. Rollins, K., L. Heigh and V. Kanetkar. 2004. Net costs of wildlife damage on private lands. Western Agricultural Economics Association. J. Ag. and Resource Econ. 29(3);517-536. Sánchez-Zapata, J. A, M. Clavero, M. Carrete, T. L. DeVault, V.; Hermoso, M. A. Losada, M. J. Polo, S. Sánchez-Navarro, J. M. Pérez-García, F. Botella, C. Ibáñez and J. A. Donázar. 2016. Effects of renewable energy production and infrastructure on wildlife. USDA National Wildlife Research Center – Staff Publications. 1845. https://digitalcommons.unl.edu/icwdm_usdanwrc/1845 Santelmann, M., K. Freemark, J. Sifneos and D. White. 2006. Assessing effects of alternative agricultural practices on wildlife habitat in Iowa, USDA. U.S Environmental Protection Agency Papers. Paper 22 (published in Agriculture, Ecosystems and Environment 113(2006):243-253). Shelef, O., P. J. Weisberg and F. D. Provenza. 2017. The value of native plants and local production in an era of global agriculture. Frontiers in Plant Science, Vol. 8, article 2069. December 5, 201. doi: 10.3389/fpls.2017.02069 Shilling, F., D. Waetjen, K. Harrold and P. Farman. 2019. Impact of Wildlife-Vehicle Conflict on California Drivers and Animals. Road Ecology Center. U. C. Davis. August 1, 2019. 14 pp. Sorensen, A. A., J. Freedgood, J. Dempsey and D. M. Theobald. 2018. Farms Under Threat: The State of America’s Farmland. Washington, DC: American Farmland Trust. Stewardship Index for Specialty Crops (SISC). 2016. Metric: Habitat and Biodiversity. 16 pp. (available at: http://www.stewardshipindex.org/working_metrics.php) Stockwell, R. and E. Bitan. 2012. Understanding opportunities and increasing implementation of climate friendly conservation. J. Soil and Water Cons. May 2012, 67 (3) 67A-69A; DOI: https://doi.org/10.2489/jswc.67.3.67A The Land Institute. 2009. A 50-year farm bill. The Land Institute, Salina, Kansas. June 2009. 19 pp.
49
Thompson, N. M., C. Bir, D. A. Widmar and J. R. Mintert. 2019. Farmer perceptions of precision agriculture technology benefits. J. of Agricultural and Applied Economics Vol. 51, Issue 1: 142-163. February 2019. DOI: https://doi.org/10.1017/aae.2018.27 Trainor, A. M., R. I. McDonald and J. Fargione. 2016. “Energy sprawl is the largest driver of land use change in United States.” PLOS ONE 11(9): e0162269. https://doi.org/10.1371/journal.pone.0162269 United Nations Environment. 2019. Global Environment Outlook – GEO-6: Healthy Planet, Healthy People. Nairobi. DOI 10.1017/9781108627146. 745 pp. University of Illinois. 2017. Land Use Planning. University of Illinois Extension Local Community Resources. Environmental Corridors: “Lifelines for Living.” Available at: http://extension.illinois.edu/lcr/landuse.cfm U. S. Department of Agriculture. 2000. Summary Report: 1997 National Resources Inventory (revised December 2000). NRCS and Iowa State University Statistical Laboratory. Ames, Iowa. 87 pp. U.S. Department of Agriculture. 2011. Resource Conservation Act (RCA) Appraisal: Soil and Water Conservation Act. 112 pp. U.S. Department of Agriculture. 2018. Summary Report: 2015 National Resources Inventory. Natural Resources Conservation Service, Washington, DC and Center for Survey Statistics and Methodology, Iowa State University, Ames, Iowa. September 2018. 210 pp. U.S. Department of Agriculture Animal Plant and Health Inspection Service. 2012. Managing Wildlife Damage to Crops and Aquaculture. Wildlife Services. 5 pp. U.S. Department of Agriculture Economic Research Service. 2003. Agricultural Resources and Environmental Indications. Chapter 3.3: Wildlife Resources Conservation, Agriculture Handbook No. (AH722). February 2003. U.S. Department of Agriculture National Agricultural Statistics Service. 2002. U.S. Wildlife Damage. 2 pp. U.S. Department of Agriculture National Agricultural Statistics Service. 2019. 2017 Census of Agriculture. United States Summary and State Data, Volume 1, Geographic Area Series, Part 51. AC-17-A-51. 820 pp. U.S. Department of Agriculture Natural Resources Conservation Service. 1999. Ring-necked Pheasant. Wildlife Habitat Management Institute Leaflet. Number 10. October 1999. 12 pp. U.S. Department of Agriculture Natural Resources Conservation Service. 2002. Managing Forests for Fish and Wildlife. Fish and Wildlife Habitat Management Leaflet Number 18. NRCS Wildlife Habitat Management Institute and Wildlife Habitat Council. December 2002. 44 pp.
50
U.S. Department of Agriculture Natural Resources Conservation Service. 2009a. Interim Final Benefit-Cost Analysis for the Wildlife Habitat Incentives Program (WHIP). Food, Conservation, and Energy Act of 2008. Title II - Conservation. Subtitle G - Other Conservation Programs. Section 2601 - Wildlife Habitat Incentive Program. January 9, 2009. 24 pp. U.S. Department of Agriculture Natural Resources Conservation Service. 2009b. Interim Technical Report: Fish and Wildlife Technology Findings from projects of the NRCS Agricultural Wildlife Conservation Center. Madison, Mississippi. January 2009. 32 pp. U.S. Department of Agriculture Natural Resources Conservation Service. 2009c. Work Plan for the Wildlife Component. Conservation Effects Assessment Project (CEAP) National Assessment. Working Draft. August 15, 2006 updated February 2, 2009. USDA NRCS Research Inventory and Assessment Division, Beltsville, Maryland. 41 pp. U.S. Department of Agriculture Natural Resources Conservation Service. 2019. Soil Health Technical Note No. 450-03. Recommended soil health indicators and associated laboratory procedures. May 2019. 76 pp. U. S. Department of Agriculture Soil Conservation Service. 1961. Land-Capability Classification. Agriculture Handbook No. 210. 25 pp. U.S. Environmental Protection Agency. 2015. Connectivity of streams & wetlands to downstream waters: A review & synthesis of the scientific evidence. Office of Research and Development. EPA/600/R-14/475F. January 2015. 408 pp. U.S. Environmental Protection Agency. 2016a. Office of Water and Office of Research and Development. National Rivers and Streams Assessment 2008-2009: A Collaborative Survey EPA/841/R-16/007. Washington, DC. http://www.epa.gov/national-aquatic-resource-surveys/nrsa U. S. Environmental Protection Agency. 2016b. National Lakes Assessment 2012: A Collaborative Survey of Lakes in the United States. EPA 841-R-16-113. U.S. Environmental Protection Agency, Washington, DC. https://nationallakesassessment.epa.gov/ U.S. Forest Service. 2015. Who Owns America’s Trees, Woods and Forests? Results from the U.S. Forest Service 2011-2013 National Woodland Owner Survey. U.S. Forest Service Northern Research Station. NRS-INF-31-15. March 2015. 12 pp. U.S. Government Accounting Office. 2001. Wildlife Services Program: Information on Activities to Manage Wildlife Damage. GAO-02-138. November 2001. 74 pp. Vickerman, S. and J. Kagan. 2014. Assessing ecological integrity across jurisdictions and scales. Defenders of Wildlife. 42 pp. http://www.defenders.org/publication/eco-integrity-measures-across-jurisdictions-and-scales Wilcove, D.S., D. Rothstein, J. Dubow, A. Phillips and E. Losos. 1998. Quantifying Threats to Imperiled Species in the United States. BioScience Vol. 48(8): 607-615. August 1998.
51
Wilkins, N., A. Hays, D. Kubenka, D. Steinbach and J. Shackelford. 2003. Texas Rural Lands: Trends and Conservation Implications for the 21st Century. Texas A&M University System and American Farmland Trust. March 2003. 28 pp. Wilson, E. O. and F.M. Peter (Editors). 1998. Biodiversity. Chapter 7, Challenges to Biological Diversity in Urban Areas. Washington (DC): National Academies Press (US); Available from: https://www.ncbi.nlm.nih.gov/books/NBK219328/ Wilson, J. B., R. K. Peet, I. Dengler and M. Partel. 2012. Plant species richness: the world records. Journal of Vegetation Science 23(2012):796-802 World Economic Forum. 2020. The Global Risks Report 2020. Insight Report, 15th Edition in partnership with Marsh $ McLennan and Zurich Insurance Group. 102 pp. World Wildlife Fund. 2017. 2017 Plowprint. Annual Report. Northern Great Plains Program. Bozeman, MT. 12 pp. Wright, C. K. and M. C. Wimberly. 2013. Recent land use change in the Western Corn Belt threatens grasslands and wetlands. Proceedings of National Acad. Sci. 110(10): 4134-4139. March 2013 http://www.ncbi.nlm.nih.gov/pmc/articles/PMC3593829/ Wywialowski, A. 1998. Are wildlife-caused losses of agriculture increasing? Proceedings of the Eighteenth Vertebrate Pest Conference. Paper 82. University of Nebraska-Lincoln. 9 pp.
Related Documents