Surveys Wildfires in Poland: The impact of risk preferences and loss aversion on environmental choices Anna Bartczak a, ⁎, Susan Chilton b , Jürgen Meyerhoff c a University of Warsaw, Faculty of Economic Sciences, Warsaw Ecological Economics Center, ul. Dluga 44/50, 00-241 Warsaw, Poland b Newcastle University Business School, 5 Barrack Road, Newcastle NE4 4SE, UK c Technische Universität Berlin, Institute for Landscape and Environmental Planning, Straße des 17. Juni 145, D-10623 Berlin, Germany abstract article info Article history: Received 28 April 2014 Received in revised form 6 May 2015 Accepted 11 May 2015 Available online xxxx JEL classification: Q51 D03 D81 Keywords: Risk preferences over financial and environmental domains Forest fires Loss aversion Probability weighting Prospect Theory This paper examines how risk preferences and loss aversion affect individual choices regarding environmental risks, specifically forest wildfires in Poland. We also examine how the same individuals make choices in the con- text of financial risks. Estimating risk, loss aversion and weighting probability parameters allows us to directly test whether Prospect Theory or Expected Utility Theory is the better underlying behavioural model in both do- mains. We find that in a sample consisting of a general population of Poles, the majority of respondents demon- strate behaviour consistent with Prospect Theory in both environmental and financial domains. This finding has significant implications for future non-market valuation studies. Additionally, in this study, we find evidence for similar risk preferences across those two domains. © 2015 Elsevier B.V. All rights reserved. 1. Introduction The valuation of risky environmental goods is an area of non-market valuation that raises fundamental questions regarding respondent cogni- tion and subsequent analysis as well as interpretation. While a growing body of evidence exists with respect to people's preferences about such goods – focussing, for example, on outcome uncertainty (Richardson and Loomis, 2009) or supply uncertainty (Rigby et al., 2011 or Rolfe and Windle, 2010) – many open questions remain. One important knowledge gap involves identifying the most appropriate behavioural model to guide analysis and ultimately improve the predictive powers of willingness-to-pay (WTP) models. Standard economic analytical techniques assume Expected Utility Theory (EUT) as the underlying model in estimating WTP. If this as- sumption is inappropriate for risky environmental decisions, WTP esti- mations can be biased (Shaw and Woodward, 2008). A core assumption of EUT is that the risk preference function is linear in the outcome prob- abilities. However, in experimental situations individuals often do not behave in a manner consistent with this theory, and they place too much weight on low-probability events and underweight high- probability events. This approach is more consistent with Prospect Theory (PT), a non-expected utility theory (NEUT) introduced by Kahneman and Tversky in 1979, which allows preferences for risky de- cisions to be nonlinear in both outcomes and probabilities. If people do not weight probabilities linearly, then the utility of a policy option should be calculated by multiplying the utility of a desired good by the decision weights associated with the policy outcome, instead of sim- ply multiplying the utility of end-states by the probabilities of achieving the end-state (Roberts et al., 2008). Shaw and Woodward (2008) stress that the limitations of EUT are often relevant for environmental problems as they are often high- consequence, low-probability events (e.g., natural catastrophes, expo- sure to toxics, or wildfires). If PT applies and probability weighting is ex- cluded, then the social benefits of environmental programmes that offer low probabilities of large environmental improvements can be underestimated in non-market valuation studies (Riddel, 2012). Roberts et al. (2008) noted that confounding the consistency of be- haviour with NEUT leads to a conclusion that decision weights might be good and context specific. Domain effects may also affect risky Ecological Economics 116 (2015) 300–309 ⁎ Corresponding author. E-mail address: [email protected] (A. Bartczak). http://dx.doi.org/10.1016/j.ecolecon.2015.05.006 0921-8009/© 2015 Elsevier B.V. All rights reserved. Contents lists available at ScienceDirect Ecological Economics journal homepage: www.elsevier.com/locate/ecolecon

Welcome message from author
This document is posted to help you gain knowledge. Please leave a comment to let me know what you think about it! Share it to your friends and learn new things together.
Transcript
Ecological Economics 116 (2015) 300–309
Contents lists available at ScienceDirect
Ecological Economics
j ourna l homepage: www.e lsev ie r .com/ locate /eco lecon
Surveys
Wildfires in Poland: The impact of risk preferences and loss aversion onenvironmental choices
Anna Bartczak a,⁎, Susan Chilton b, Jürgen Meyerhoff c
a University of Warsaw, Faculty of Economic Sciences, Warsaw Ecological Economics Center, ul. Dluga 44/50, 00-241 Warsaw, Polandb Newcastle University Business School, 5 Barrack Road, Newcastle NE4 4SE, UKc Technische Universität Berlin, Institute for Landscape and Environmental Planning, Straße des 17. Juni 145, D-10623 Berlin, Germany
⁎ Corresponding author.E-mail address: [email protected] (A. Bartczak
http://dx.doi.org/10.1016/j.ecolecon.2015.05.0060921-8009/© 2015 Elsevier B.V. All rights reserved.
a b s t r a c t
a r t i c l e i n f oArticle history:Received 28 April 2014Received in revised form 6 May 2015Accepted 11 May 2015Available online xxxx
JEL classification:Q51D03D81
Keywords:Risk preferences over financial andenvironmental domainsForest firesLoss aversionProbability weightingProspect Theory
This paper examines how risk preferences and loss aversion affect individual choices regarding environmentalrisks, specifically forest wildfires in Poland. We also examine how the same individuals make choices in the con-text of financial risks. Estimating risk, loss aversion and weighting probability parameters allows us to directlytest whether Prospect Theory or Expected Utility Theory is the better underlying behavioural model in both do-mains. We find that in a sample consisting of a general population of Poles, the majority of respondents demon-strate behaviour consistent with Prospect Theory in both environmental and financial domains. This finding hassignificant implications for future non-market valuation studies. Additionally, in this study, we find evidence forsimilar risk preferences across those two domains.
© 2015 Elsevier B.V. All rights reserved.
1. Introduction
The valuation of risky environmental goods is an area of non-marketvaluation that raises fundamental questions regarding respondent cogni-tion and subsequent analysis as well as interpretation. While a growingbody of evidence exists with respect to people's preferences about suchgoods – focussing, for example, on outcome uncertainty (Richardsonand Loomis, 2009) or supply uncertainty (Rigby et al., 2011 or Rolfeand Windle, 2010) – many open questions remain. One importantknowledge gap involves identifying the most appropriate behaviouralmodel to guide analysis and ultimately improve the predictive powersof willingness-to-pay (WTP) models.
Standard economic analytical techniques assume Expected UtilityTheory (EUT) as the underlying model in estimating WTP. If this as-sumption is inappropriate for risky environmental decisions, WTP esti-mations can be biased (Shaw andWoodward, 2008). A core assumptionof EUT is that the risk preference function is linear in the outcome prob-abilities. However, in experimental situations individuals often do not
).
behave in a manner consistent with this theory, and they place toomuch weight on low-probability events and underweight high-probability events. This approach is more consistent with ProspectTheory (PT), a non-expected utility theory (NEUT) introduced byKahneman and Tversky in 1979, which allows preferences for risky de-cisions to be nonlinear in both outcomes and probabilities. If people donot weight probabilities linearly, then the utility of a policy optionshould be calculated by multiplying the utility of a desired good bythe decisionweights associatedwith the policy outcome, instead of sim-plymultiplying the utility of end-states by the probabilities of achievingthe end-state (Roberts et al., 2008).
Shaw and Woodward (2008) stress that the limitations of EUT areoften relevant for environmental problems as they are often high-consequence, low-probability events (e.g., natural catastrophes, expo-sure to toxics, orwildfires). If PT applies and probabilityweighting is ex-cluded, then the social benefits of environmental programmes that offerlow probabilities of large environmental improvements can beunderestimated in non-market valuation studies (Riddel, 2012).
Roberts et al. (2008) noted that confounding the consistency of be-haviour with NEUT leads to a conclusion that decision weights mightbe good and context specific. Domain effects may also affect risky
2 Chetan et al. (2010) or Charness et al. (2013) provide reviews of different risk prefer-ence elicitation methods.
3 Robustness of theMPL design that elicits respondents' stated preferences was investi-gated in a few studies. After controlling for order effect, both Harrison et al. (2005) andHolt and Laury (2005) found that scaling up real payments resulted in significantly higherlevels of risk aversion, but it had no impact on hypothetically elicited risk aversion coeffi-
301A. Bartczak et al. / Ecological Economics 116 (2015) 300–309
choices and may or may not change the degree of risk aversion that anindividual displays in each domain. Economic theory makes no predic-tion with respect to the impact of context on a decision.1
A number of psychological studies, in particularWeber et al. (2002),have provided strong evidence that risk preferences are domainspecific, but their findings only partially explain how respondents' fun-damental risk preferences may influence their choices. Against thisbackground, Riddel (2012) provided a framework for capturing envi-ronmental risk preferences in a way that allows environmental choicesto be elicited, interpreted and analysed in the same way as risky finan-cial choices. By eliciting a probabilityweighting function aswell as a riskpreference function, she was also able to establish that PT describes be-haviour better than EUT.
The aim of this paper is fourfold. First, we investigate whether indi-viduals' behaviour is more consistent with EUT or with NEUT in finan-cial and environmental domains by adding more empirical evidence tothe small number of studies that have so far investigated this issue inan environmental context. Second, we test whether preferences withregard to risks differ across the financial and the environmental do-mains. Third, we check whether risk preferences are heterogeneousacross individuals. Additionally, we examine the results of two differentrisk aversion elicitation methods. The first allows inferring risk prefer-ences based on individuals' choices in hypothetical games (Tanakaet al., 2010), and the second elicits risk attitudes based on self-reported engagement in risky situations in daily life (Weber et al.,2002).
The study is built upon themethodology proposed by Riddel (2012)and Tanaka et al. (2010). Risk preferenceswithin the environmental do-main are examined in the context of forest wildfires in Poland. The ef-fects of natural disturbances, including wildfires, are often directly tiedto efforts by government agencies to decrease the likelihood that a dis-turbancewill occur and tomitigate negative consequenceswhen it doestake place. The main effects of forest wildfires in Poland are losses inbiodiversity, changes to the landscape and reduced recreational oppor-tunities. Although the vast majority of forest wildfires in Poland are sin-gle, small scale events, the negative externalities, when aggregated,could potentially generate significant welfare losses to the populationat the national level.
Only a few studies so far have investigated risk preferences in thecontext of wildfires and those conducted have mainly used an indirectapproach. For example, Wibbenmeyer et al. (2013) used a CE to mea-sure attitudes of U.S. wildfire managers toward wildfire risk. Theyfound that the managers' decisions are consistent with NEUT of deci-sions under risk; that is, the managers may over-allocate resourceswhen the likelihood or the magnitude of potential fire damage is low.In a recent study Holmes et al. (2013) designed a CE study to estimatehomeowners'WTP in the context ofmitigation programmes that reducethe risks and economic losses from wildfires. They found that respon-dents' strategy for avoiding wildfire damage to their houses is consis-tent with PT.
To our knowledge, this is the first study focusing on risk preferencesregarding forest wildfires in Europe and the first in which environmen-tal outcomes from wildfire protection programmes are described as apublic good. The remainder of the paper is as follows. The next sectiondiscusses theoretical and empirical methodological literature pertinentto this study. Section 3 describes the method used to define and elicitthe relevant parameters. Section 4 details the survey and sample char-acteristics, while Section 4 contains the results of our analysis.Section 5 discusses these results and offers some observations on theirimplications for future stated preference survey design.
1 The economic theory of risk aversion is only well established for financial risks (Dyerand Sarin, 1982). To directly compare risk preferences across domains would requirestrong assumptions of theoretical transferability which have as yet not been established.This problem exists in all studies comparing risks in different domains. Therefore, whileempirical comparisons can be made, any inferences are by definition quite tentative.
2. Related Literature
2.1. Prospect Theory and Risk Elicitation
Expected Utility Theory (von Neumann andMorgenstern, 1944) haslong been the standard approach in economicmodelling. This theory as-sumes that individuals do not have preferences for probabilities them-selves, but only for the outcomes that are conditioned by probabilities.Additionally, individuals' risk attitude is assumed to be entirely associat-ed with the marginal utility of a risky good, and marginal utility overoutcomes is expected to be constant. However, an increasing numberof studies document behaviour of individuals that is inconsistent withEUT. For example, EUT does not explain Allais' Paradox on framing ef-fects or loss aversion.
Due to the limitations of EUT, several alternatives have been devel-oped, with the most notable being PT (Kahneman and Tversky, 1979).One of the key differences between PT and EUT is that the first inte-grates the loss aversion aspect of risk behaviour into the utility function.The other key issue is how the theories account for non-linear probabil-ities. PT allows transforming objective probabilities into decisionweights by using a probability weighting function (see e.g., Tverskyand Fox, 1995, or Tversky and Kahneman, 1992). Probability weightingand loss aversion can have important implications for placing value ontypically uncertain effects of environmental policies and interventions.
A variety of methods have been developed to elicit individual riskpreferences. So far, none of them has emerged as the standardapproach.2 Experimental studies have recently gained prominence.One of the most commonly used experimental risk elicitation methodsis the multiple price list (MPL), originally proposed by Binswanger(1980, 1981). In this approach individuals are asked tomake choices be-tween different lotteries. This approach has been popularized by Holtand Laury (2002) who, assuming that EUT applies, used it to estimaterisk parameters. In their study, individuals made ten choices betweentwo lotteries. For each lottery, payoffs were fixed, but the probabilitiesvaried. Rewards were structured such that one lottery was less riskythan the other. To estimate risk preferences, the expected gains in twosubsequent choices were compared, assuming that the relative riskaversion functional form was constant. As pointed out by Mason et al.(2005), MPLs have been mainly employed for gains rather than losses.
Tanaka et al. (2010) extended theMPL design by allowing for the es-timation of empirical specifications that nest both EUT and PT to testwhich theory better describes the data. They asked individuals tomake choices in three series of paired lotteries. Making strict assump-tions regarding the functional form, Tanaka et al. were able to estimatethe following three parameters within the PT framework: probabilityweighting parameter, value function curvature and loss aversion pa-rameters. This design has been applied inter alia by Nguyen and Leung(2009) and Liu (2013) who showed that less educated people are alsoable to understand MPL with paired lotteries.3
TheMPL approach is generally used to elicit risks in the financial do-main. However, some authors have used the approach to measure riskpreferences in other domains, including the environmental domain.The environmental lotteries depict nonmonetary states of nature ratherthan monetary gains and losses. Cherry et al. (2003), for example,
cients. Considering the risk elicitation format itself (i.e., the MPL), Anderson et al. (2007)found it to be robust to framing effects. Several other studies have investigated links be-tween risk preferences elicited using the experimental approach and real-world risky be-haviours. Anderson and Mellor (2008), for example, showed that individuals who aremore risk averse are less likely to smoke and more likely to wear seat belts, and Luskand Coble (2005) found that risk preferences are significant determinants of acceptanceof genetically modified food.
302 A. Bartczak et al. / Ecological Economics 116 (2015) 300–309
applied environmental lotteries on wildlife events such as seeing aneagle or catching a lake trout in Yellowstone National Park. Their objec-tive was to investigate whether rationality stimulated by market-likediscipline extends to a nonmarket setting.
2.2. Heterogeneity of Risk PreferencesWithin a Given Domain and BetweenDomains
In the key reference paper for this study, Riddel (2012) adapted theMPL approach used by Tanaka et al. (2010) to an environmental context(offshore oil spill damages) to examine the shape of the probabilityweighting function for environmental risks. She additionally examinedthe differences in the probability weighting function between the envi-ronmental and financial lotteries. The environmental lotteries wereframed as environmental clean-up programmes employed after oilspills and were a monotonic transformation of the financial lotteries.To avoid difficulties in making comparisons between the two domains,neither set of lotteries was incentivized.4
To investigate heterogeneity in the probability weighting function,Riddel (2012) chose three groups of individuals with potentially differ-ent risk preferences: race-car drivers, rock climbers and university stu-dents. She found that most respondents over-weighted extremepositive outcomes both in the financial and environmental domains,but in the environmental context they revealed a comparatively morepronounced curvature in the weighting function. A small group of peo-ple, however, displayed consistent expected utility maximizing behav-iour. This group comprised the more experienced risk takers; that is,the race-car drivers, who exhibited little probability weighting in bothdomains, and the rock climbers, who revealed EU-type preferences forfinancial risks.
Other researchers, including Weber et al. (2002) and Dohmen et al.(2011), have also found that risk preferences can vary across domainsbased on individuals' self-reported engagement in risky situations indaily life. Weber et al. (2002) developed the Domain-Specific-Risk-Taking (DOSPERT) scale, which identifies risk in five content domains:financial, health/safety, recreational, ethical, and social decisions. Apply-ing this scale allows ranking risk aversion, but not the elicitation of riskpreference parameters, across domains. Weber et al. found that respon-dents reported a relatively high willingness to take risks in the health/safety domain but a low willingness to take risks in the social domain.Among others, Hanoch et al. (2006) showed that the scores of theDOSPERT subdomains are associated with real-life risk taking activities.In a later study, Dohmen et al. (2011), using a method akin to theDOSPERT scale, found that the best predictor of behaviour in a particulardomain was the corresponding domain-specific measure, although thegeneral risk question had some predictive power across domains aswell.
When heterogeneity in risk preferences among individuals is inves-tigated, it is conventional to assume that utility is linear in the probabil-ities. In contrast, studies such as Tanaka et al. (2010) consider theprobability weighting function as a possible source of risk aversion. Re-sults vary, but higher degrees of risk aversion have generally been foundamong older people, wealthier people and the more highly educated(Tanaka et al., 2010; Liu, 2013). The results of Tanaka et al. (2010) alsosuggest that mean income is strongly correlated with loss aversion.5
Nguyen and Leung (2009) found that loss aversionwas positively corre-lated with age and negatively correlated with gender (being male) andeducation. However, Liu (2013) did not find any significant demograph-ic variables in models of loss aversion. Riddel (2012) was the first to
4 While incentives can easily be used in lotteries in the financial domain by paying re-spondentsmoney according to the outcome of the lotteries, incentives aremuchmore dif-ficult to use in the environmental domain; for example, no clean-up programme can beimplemented directly after the lotteries.
5 They point out, however, that income may be endogenous; therefore, it is difficult toknow whether income explains risk preferences or vice versa.
estimate decision-weighted preference functions in both the financialand the environmental domains. In that study, age, income and genderdid not help to explain domain specificity or heterogeneity within agiven domain.
3. Method
To investigate individuals' preferences with regard to financial andenvironmental risks, we use sets of two-outcome lotteries in environ-mental and financial domains. We assume the utility function for atwo-outcome gamble takes the following form:
U x;p; y; qð Þ ¼ π pð Þv xð Þ þ 1−π pð Þð Þv yð Þif x N y N 0 or x b y b 0π pð Þv xð Þ þ π qð Þv yð Þ if x b 0 b y
�ð1Þ
where v(x) and v(y) are value functions, π(p) and π(q) are probabilityweighting functions, x and y are the outcomes, and p and q are probabil-ities associated with those outcomes (and p + q = 1).
The value function considered in this application is:
v xð Þ ¼ x1−σ if x ≥ 0−λ −xð Þ1−σ if x b 0
�ð2Þ
where x is an outcome, σ represents curvature of the value function andλ is the degree of loss aversion. If an individual is risk loving thenσ b 0, ifhe or she is risk neutral then σ=0, and risk averse if σ N 0. However, λcan take only positive values. It measures one's sensitivity to loss com-pared to gain. The higher the value of λ, themore loss averse an individ-ual is.
In PT, gains and losses are compared to a reference point (the currentposition) and can accommodate different weightings— specifically thatlosses are weighted more heavily than equivalent gains. FollowingTanaka et al. (2010), we assume nonlinear probability weighting mea-sure (see: Prelec, 1998). In this case, the probability weighting functionis written as follows6:
π pð Þ ¼ exp − − lnpð Þα� � ð3Þ
where p is the probability of the outcome x and α is the probability sen-sitivity parameter. If α b 1, the weighting function takes an inverted S-shape; that is, individuals overweight small probabilities and under-weight large probabilities (Tversky and Kahneman, 1992). Hence,these individuals are probabilistic risk averse for low likelihood lossesand high likelihood gains and conversely probabilistic risk seeking forlow likelihood gains and high likelihood losses. If α N 1 then theweighting function is S-shaped. In both cases, preferences are non-linear. By contrast, if preferences are linear and probability weightingis absent, the probability sensitivity parameter α equals 1, as the lossaversion parameter (i.e., λ = 1) and EUT applies (Table 1).7
To capture risk preferences, we apply the MPL design introduced byTanaka et al. (2010). Following this approach, individuals are presentedwith three series of lottery pairs and asked to choose one lottery for eachpair. Moving down the list of lotteries, payoffs in Option B increase, buteverything else is fixed. The lotteries are designed so that any combina-tion of choices in the three series determines a particular interval of PTparameter values (see Table 2).8
The switching points in Series 1 and 2 jointly determine the param-eter for the curvature of the value function (σ) and the probabilityweighting parameter (α). In Series 1, if an individual switches fromOp-tion A in rowN itmeans that he or she prefers Option A over Option B atN− 1 rows and prefers Option B over Option A in row N (and following
6 This process of transforming the probabilities into decision weights breaks the inde-pendence axiom; that is, probabilities and outcomes are independent (Starmer, 2000).
7 In EUT the utility function is linear in p; that is, EU(x; p) = ∑ipi v(xi).
8 The standardMPL approach assumes underlying EUT behaviour in the lottery choices(see e.g., Binswanger, 1980, or Holt and Laury, 2002).
Table 2Three series of pairwise lottery choices for the financial outcome domain.
Option A Option B EV(A)–EV(B)
Prob. Payoff Prob. Payoff Prob. Payoff Prob. Payoff
Series 10.3 400 zł 0.7 100 zł 0.1 680 zł 0.9 50 zł 77 zł0.3 400 zł 0.7 100 zł 0.1 750 zł 0.9 50 zł 70 zł0.3 400 zł 0.7 100 zł 0.1 830 zł 0.9 50 zł 62 zł0.3 400 zł 0.7 100 zł 0.1 930 zł 0.9 50 zł 52 zł0.3 400 zł 0.7 100 zł 0.1 1060 zł 0.9 50 zł 39 zł0.3 400 zł 0.7 100 zł 0.1 1250 zł 0.9 50 zł 20 zł0.3 400 zł 0.7 100 zł 0.1 1500 zł 0.9 50 zł −5 zł0.3 400 zł 0.7 100 zł 0.1 1850 zł 0.9 50 zł −40 zł0.3 400 zł 0.7 100 zł 0.1 2200 zł 0.9 50 zł −75 zł0.3 400 zł 0.7 100 zł 0.1 3000 zł 0.9 50 zł −155 zł0.3 400 zł 0.7 100 zł 0.1 4000 zł 0.9 50 zł −255 zł0.3 400 zł 0.7 100 zł 0.1 6000 zł 0.9 50 zł −455 zł0.3 400 zł 0.7 100 zł 0.1 10,000 zł 0.9 50 zł −855 zł0.3 400 zł 0.7 100 zł 0.1 17,000 zł 0.9 50 zł −1555 zł
Series 20.9 400 zł 0.1 300 zł 0.7 540 zł 0.3 50 zł −3 zł0.9 400 zł 0.1 300 zł 0.7 560 zł 0.3 50 zł −17 zł0.9 400 zł 0.1 300 zł 0.7 580 zł 0.3 50 zł −31 zł0.9 400 zł 0.1 300 zł 0.7 600 zł 0.3 50 zł −45 zł0.9 400 zł 0.1 300 zł 0.7 620 zł 0.3 50 zł −59 zł0.9 400 zł 0.1 300 zł 0.7 650 zł 0.3 50 zł −80 zł0.9 400 zł 0.1 300 zł 0.7 680 zł 0.3 50 zł −101 zł0.9 400 zł 0.1 300 zł 0.7 720 zł 0.3 50 zł −129 zł0.9 400 zł 0.1 300 zł 0.7 770 zł 0.3 50 zł −164 zł0.9 400 zł 0.1 300 zł 0.7 830 zł 0.3 50 zł −206 zł0.9 400 zł 0.1 300 zł 0.7 900 zł 0.3 50 zł −255 zł0.9 400 zł 0.1 300 zł 0.7 1000 zł 0.3 50 zł −325 zł0.9 400 zł 0.1 300 zł 0.7 1100 zł 0.3 50 zł −395 zł0.9 400 zł 0.1 300 zł 0.7 1300 zł 0.3 50 zł −535 zł
Table 1Values of EUT and PT parameters.
Function Parameters Theory
Expected utilitya Prospect
Weighting function Probability sensitivity α = 1 Probability weighting is absent. α b 1 Overweight small probabilities and underweight large probabilitiesValue function Loss aversion λ = 1 Losses are weighted the same as gains. λ N 1 Losses are weighed more heavily than gains.
a Assuming a standard EU functional form.
303A. Bartczak et al. / Ecological Economics 116 (2015) 300–309
rows).9 The same approach is used in Series 2 (rows notation K− 1 andK). To determine the value ranges for both parameters the following in-equalities should be satisfied:
xS1;A;N−1� �1−σ exp − − ln pS1;N−1
� �� �αh iþ yB;N−1� �1−σ 1− exp − − ln pS1;N−1
� �� �αh in oN
xS1;B;N−1� �1−σ exp − − ln qS1;N−1
� �� �αhþ yS1;A;N−1� �1−σ 1− exp − − ln qS1;N−1
� �� �αh in oxS1;B;N� �1−σ exp − ln −pS1;N
� �� �αh iþ yA;N� �1−σ 1− exp − − ln pS1;N
� �� �αh in oN
xS1;A;N� �1−σ exp − − ln qS1;N
� �� �α þ yS1;B;N� �1−σ 1− exp − − ln qS1;N
� �� �αh in ohxS2;A;K−1� �1−σ exp − − ln pS2;K−1
� �� �αh iþ yB;K−1� �1−σ 1− exp − − ln pS2;K−1
� �� �αh in oN
xS2;B;K−1� �1−σ exp − − ln pS2;K
� �� �α þ yS2;A;K−1� �1−σ 1− exp − − ln qS2;K−1
� �� �αh in ohxS2;B;K� �1−σ exp − − ln pS2;K
� �� �αh iyA;K� �1−σ 1− exp − − ln pS2;K
� �� �αh in oN
xS2;A;K� �1−σ exp − − ln qS2;K
� �� �α þ yS2;B;K� �1−σ 1− exp − − ln qS2;K
� �� �αh in oh
8>>>>>>>>>>>>>>>>>>><>>>>>>>>>>>>>>>>>>>:
ð4Þ
where x and y are outcomes, p is the probability of the outcome x,N andK denote the number of rows, A and B indicate the lottery options, andS1 and S2 denote Series 1 and Series 2, respectively. The paired param-eters α and σ are not uniquely determinable. Here, we follow Tanakaet al. (2010) and their convention of approximating α and σ by takingthe midpoint of the interval.
The loss aversion parameter can be determined by the switchingpoints in Series 3 after obtaining an estimate ofσ based on choices in Se-ries 1 and 2. Similar toα andσ, the loss aversion parameterλ can also beestimated as the midpoint of an interval; a higher λ represents a higherdegree of loss aversion.
Aswewanted to capture risk preferences not only in the financial butalso in the environmental domain, we followed Riddel (2012) andestablished a set of corresponding hypothetical lotterieswhose outcomeswere reductions in the risk of forest wildfires in Poland. In addition to fol-lowing Riddel, we also developed and applied a third set of lotteries (Se-ries 3) to explore individuals' loss aversion. This way, we framed ouranalysis in both the gain and loss domains. The environmental lotteriesare monotonic transformations of the financial lotteries (Table 2).
The environmental lottery tasks are presented in Table 3. In the firsttwo series of lotteries, respondents were asked to choose betweenprogrammes that present environmental effects, specifically reducingthe risk of forest wildfires, instead of financial rewards. They were toldthat two other programmes to further reduce the risk of forest firesare available in addition to the current fire protection management,but the success rate differs between the two options. The results weredescribed as the average annual reduction of burned forest area inPoland and were presented as uncertain (as they might depend on var-ious factors earlier explained to the respondents). The respondentswere asked to assume the costs of these programmes were the same.
In Series 3, respondentswere told that each programme, when com-pleted, could end in either success or failure. In the latter case, more for-ests would be burned than would be the case under the currentmanagement regime.10 Payoffs from the environmental lotteries in
9 Similar to Tanaka et al. (2010), we tried to enforce monotonic switching by asking re-spondents to indicate at which row they would switch from Option A to Option B in eachseries, noting that they can also start to choose Option B with the first row. Those whoinsisted on switching back, however, were allowed to do so.10 At the beginning of the survey, the risk of forest wildfires in Poland, their effects, riskfactors and the possible methods to reduce this risk were described to respondents basedon historical data.
Series 3 were therefore presented as either additional forest areasaved from burning or an increase in the area of forest burned relativeto the current area damaged by wildfires.
4. Survey
4.1. Survey Background
Poland has about 9.4 million hectares of evenly distributed forestscovering 29.3% of its territory (the average in Europe is 31%). Easily ac-cessible and free of charge, they are popular places for outdoor recrea-tion for Poles, with the vast majority visiting such areas at least once ayear (Bartczak et al., 2008). Most of the forests in Poland are stateowned and administrated by a single state enterprise (State Forests Na-tional Forest Holding, SFNFH). Forests being publicly owned and man-aged by one company might facilitate the implementation and successof the objectives of sustainable forest development and forest fireprevention.
Series 30.5 250 zł 0.5 −40 zł 0.5 300 zł 0.5 −210 zł 60 zł0.5 40 zł 0.5 −40 zł 0.5 300 zł 0.5 −210 zł −45 zł0.5 10 zł 0.5 −40 zł 0.5 300 zł 0.5 −210 zł −60 zł0.5 10 zł 0.5 −40 zł 0.5 300 zł 0.5 −160 zł −85 zł0.5 10 zł 0.5 −80 zł 0.5 300 zł 0.5 −160 zł −105 zł0.5 10 zł 0.5 −80 zł 0.5 300 zł 0.5 −140 zł −115 zł0.5 10 zł 0.5 −80 zł 0.5 300 zł 0.5 −110 zł −130 zł
Table 4Sample descriptive statistics.
Share Mean St. dev. Median
Table 3Three series of pairwise lotteries in the environmental outcome domain.
Series 1
Programme A Programme B EV(A)–EV(B)
Prob. Savedforest
Prob. Savedforest
Prob. Savedforest
Prob. Savedforest
0.3 100 ha 0.7 25 ha 0.1 170.0 ha 0.9 12.5 ha 19.3 ha0.3 100 ha 0.7 25 ha 0.1 187.5 ha 0.9 12.5 ha 17.5 ha0.3 100 ha 0.7 25 ha 0.1 207.5 ha 0.9 12.5 ha 15.5 ha0.3 100 ha 0.7 25 ha 0.1 232.5 ha 0.9 12.5 ha 13.0 ha0.3 100 ha 0.7 25 ha 0.1 265.0 ha 0.9 12.5 ha 9.8 ha0.3 100 ha 0.7 25 ha 0.1 312.5 ha 0.9 12.5 ha 5.0 ha0.3 100 ha 0.7 25 ha 0.1 375.0 ha 0.9 12.5 ha −1.3 ha0.3 100 ha 0.7 25 ha 0.1 462.5 ha 0.9 12.5 ha −10.0 ha0.3 100 ha 0.7 25 ha 0.1 550.0 ha 0.9 12.5 ha −18.8 ha0.3 100 ha 0.7 25 ha 0.1 750.0 ha 0.9 12.5 ha −38.8 ha0.3 100 ha 0.7 25 ha 0.1 1000.0 ha 0.9 12.5 ha −63.8 ha0.3 100 ha 0.7 25 ha 0.1 1500.0 ha 0.9 12.5 ha −113.8 ha0.3 100 ha 0.7 25 ha 0.1 2500.0 ha 0.9 12.5 ha −213.8 ha0.3 100 ha 0.7 25 ha 0.1 4250.0 ha 0.9 12.5 ha −388.8 ha
Series 2
Programme A Programme B EV(A)–EV(B)
Prob. Savedforest
Prob. Savedforest
Prob. Savedforest
Prob. Savedforest
0.9 100 ha 0.1 75 ha 0.7 135.0 ha 0.3 12.5 ha −0.8 ha0.9 100 ha 0.1 75 ha 0.7 140.0 ha 0.3 12.5 ha −4.3 ha0.9 100 ha 0.1 75 ha 0.7 145.0 ha 0.3 12.5 ha −7.8 ha0.9 100 ha 0.1 75 ha 0.7 150.0 ha 0.3 12.5 ha −11.3 ha0.9 100 ha 0.1 75 ha 0.7 155.0 ha 0.3 12.5 ha −14.8 ha0.9 100 ha 0.1 75 ha 0.7 162.5 ha 0.3 12.5 ha −20.0 ha0.9 100 ha 0.1 75 ha 0.7 170.0 ha 0.3 12.5 ha −25.3 ha0.9 100 ha 0.1 75 ha 0.7 180.0 ha 0.3 12.5 ha −32.3 ha0.9 100 ha 0.1 75 ha 0.7 192.5 ha 0.3 12.5 ha −41.0 ha0.9 100 ha 0.1 75 ha 0.7 207.5 ha 0.3 12.5 ha −51.5 ha0.9 100 ha 0.1 75 ha 0.7 225.0 ha 0.3 12.5 ha −63.8 ha0.9 100 ha 0.1 75 ha 0.7 250.0 ha 0.3 12.5 ha −81.3 ha0.9 100 ha 0.1 75 ha 0.7 275.0 ha 0.3 12.5 ha −98.8 ha0.9 100 ha 0.1 75 ha 0.7 325.0 ha 0.3 12.5 ha −133.8 ha
Series 3
Programme A Programme B EV(A)–EV(B)
Prob. Savedforest
Prob. Burnedforest
Prob. Savedforest
Prob. Burnedforest
0.5 62.5 ha 0.5 10 ha 0.5 75 ha 0.5 52.5 ha 15.0 ha0.5 10.0 ha 0.5 10 ha 0.5 75 ha 0.5 52.5 ha −11.3 ha0.5 2.5 ha 0.5 10 ha 0.5 75 ha 0.5 52.5 ha −15.0 ha0.5 2.5 ha 0.5 10 ha 0.5 75 ha 0.5 40.0 ha −21.3 ha0.5 2.5 ha 0.5 20 ha 0.5 75 ha 0.5 40.0 ha −26.3 ha0.5 2.5 ha 0.5 20 ha 0.5 75 ha 0.5 35.0 ha −28.8 ha0.5 2.5 ha 0.5 20 ha 0.5 75 ha 0.5 27.5 ha −32.5 ha
304 A. Bartczak et al. / Ecological Economics 116 (2015) 300–309
In the last 10 years the average annual number of recorded forestwildfires in Poland has been about 9600. The burnt area has equalled6000 ha annually (JRC, 2014).11 In the vast majority of cases, the firesoccurred on a very small scale (i.e., a surface area of less than 1 ha).12
The most common forest fires in Poland are so-called surface fireswhich are fuelled by low-lying vegetation such as leaf and timber litter,debris, grass and shrubbery. Human activity (arson and carelessness)has remained the main cause of forest wildfires in Poland, as in therest of the European countries.
Due to the vast majority of forest fires in Poland being small, the riskof respiratory diseases in humans is not increased. Fatalities due to
11 According to Runkle (1985) natural disturbances such as wildfires, insects or wind-storms affect about 1% of the temperate forest landscape annually.12 The corresponding number of forest fires for France, Germany, Spain and Italy (otherEuropean countries with similar territories as Poland) is 4.4, 0.94, 16.3 and 7.4 thousandsrespectively. The average area of burned forest per fire in the period 2003–2012 for thosecountries is 4.1, 0.5, 7.4 and 11.6 ha, respectively (JRC, 2014).
forest fires have not occurred within the last 30 years. Thus, as notedearlier, the main effects of forest wildfires in Poland are losses in biodi-versity, changes to the landscape and reduced recreational opportuni-ties. To prevent fire outbreaks and to reduce their spread, the SFNFHand voluntary fire brigades implement various measures (excludingprescribed burnings which are not allowed in Poland).
4.2. Survey Structure and Sample
The survey consisted of five main sections. The first provided re-spondents with general information about forests in Poland and collect-ed data about their recreation patterns and whether they consideredwildfires in Polish forests to be a serious problem. In the second section,the forest wildfire situation in Poland was described. The annual num-ber of forestwildfires and the number of burned forests over the last de-cade were given at the national and the regional level. Pictures andgraphical illustrations supported the text. Respondents were informedthat the main cause of forest wildfires in Poland is human activity. Ageneral description of ecological, economic and social effects of forestwildfires was provided, with an emphasis that fires mainly cause lossesin forest biodiversity and fatal accidents related to them have been ex-tremely rare in Poland. Next, the measures used in Poland to preventand to fight forest wildfires were presented. In the third section, finan-cial risk preferences were elicited by using the financial MPL precededby the instructions adapted from Tanaka et al. (2010) explaining thetask mechanism. In the fourth section, environmental risk preferenceswere elicited using the environmental lotteries, again preceded by in-structions adapted to the forest wildfire context. Both sets of instruc-tions were given to respondents and were also read aloud by theinterviewer. The fifth section contained theDOSPERT scale that assessesrisk taking infive content domains:financial, health/safety, recreational,ethical, and social based on the respondents' stated likelihood of engag-ing in domain-specific risky activities (see Appendix A). Finally, stan-dard socio-economics data were requested.
Interviews were conducted face-to-face withmembers of the publicby a professional polling agency in five cities in Poland in August andSeptember 2013 (Gdańsk, Łódź, Katowice, Poznań, and Warsaw). Aquota sampling framewas applied,whichwas representative of the Pol-ish population in terms of age and gender. In total, 630 interviews wereconducted. Among them, 34mademultiple switches in the lottery tasksand were therefore excluded from any further analysis. Understandingof the scenario, the questionnaire and the financial and environmentallotteries were tested with students from the Faculty of Economics atthe University of Warsaw and representatives of the general public.
5. Results
5.1. Descriptive Statistics
After excluding interviews that are not suitable for analysis due tonon-responses the final sample comprises 596 interviews. Table 4 re-ports the basic socio-demographic characteristics of the final sample(i.e., excluding omitted respondents). Sixty-seven percent of individualsindicated that the forest nearest to their place of residence is less than
Women 56%Age 39 12 37Education
Primary 1%Secondary 58%High 41%
Net monthly individual income in zł 2365 1726 2500
Note: Number of respondents, N = 596. Nominal exchange rate 1€ = 4.12 zł.
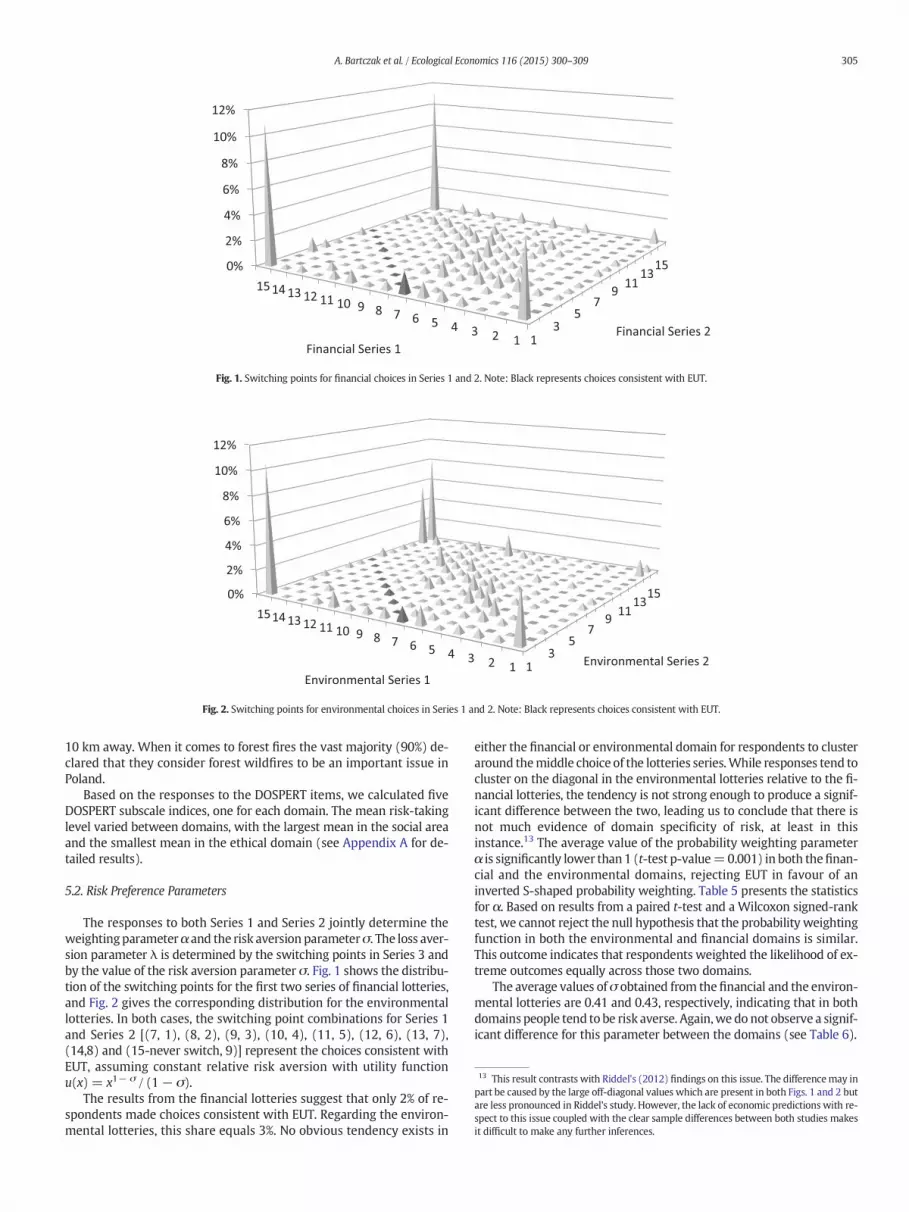
Fig. 1. Switching points for financial choices in Series 1 and 2. Note: Black represents choices consistent with EUT.
Fig. 2. Switching points for environmental choices in Series 1 and 2. Note: Black represents choices consistent with EUT.
13 This result contrasts with Riddel's (2012) findings on this issue. The differencemay inpart be caused by the large off-diagonal values which are present in both Figs. 1 and 2 butare less pronounced in Riddel's study. However, the lack of economic predictions with re-spect to this issue coupled with the clear sample differences between both studies makesit difficult to make any further inferences.
305A. Bartczak et al. / Ecological Economics 116 (2015) 300–309
10 km away. When it comes to forest fires the vast majority (90%) de-clared that they consider forest wildfires to be an important issue inPoland.
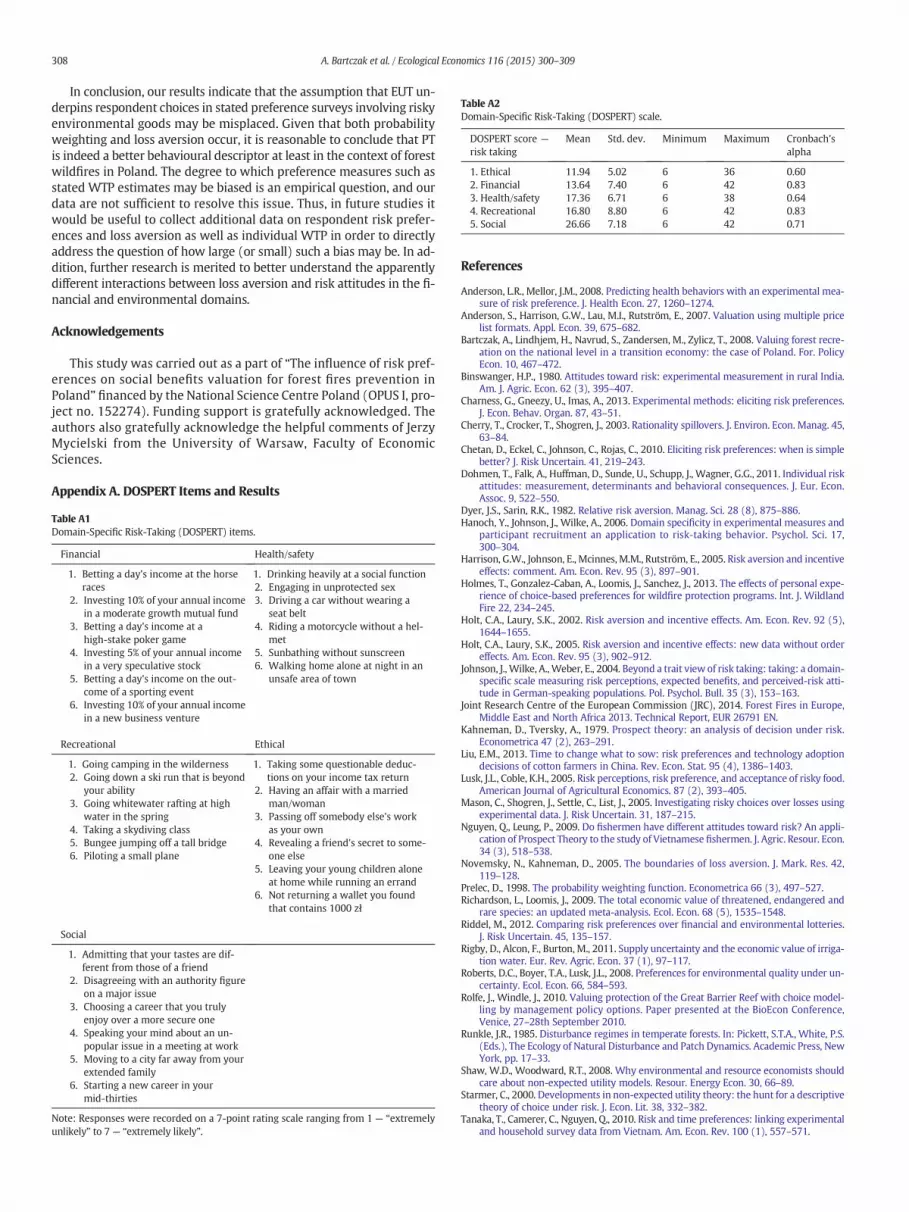
Based on the responses to the DOSPERT items, we calculated fiveDOSPERT subscale indices, one for each domain. The mean risk-takinglevel varied between domains, with the largest mean in the social areaand the smallest mean in the ethical domain (see Appendix A for de-tailed results).
5.2. Risk Preference Parameters
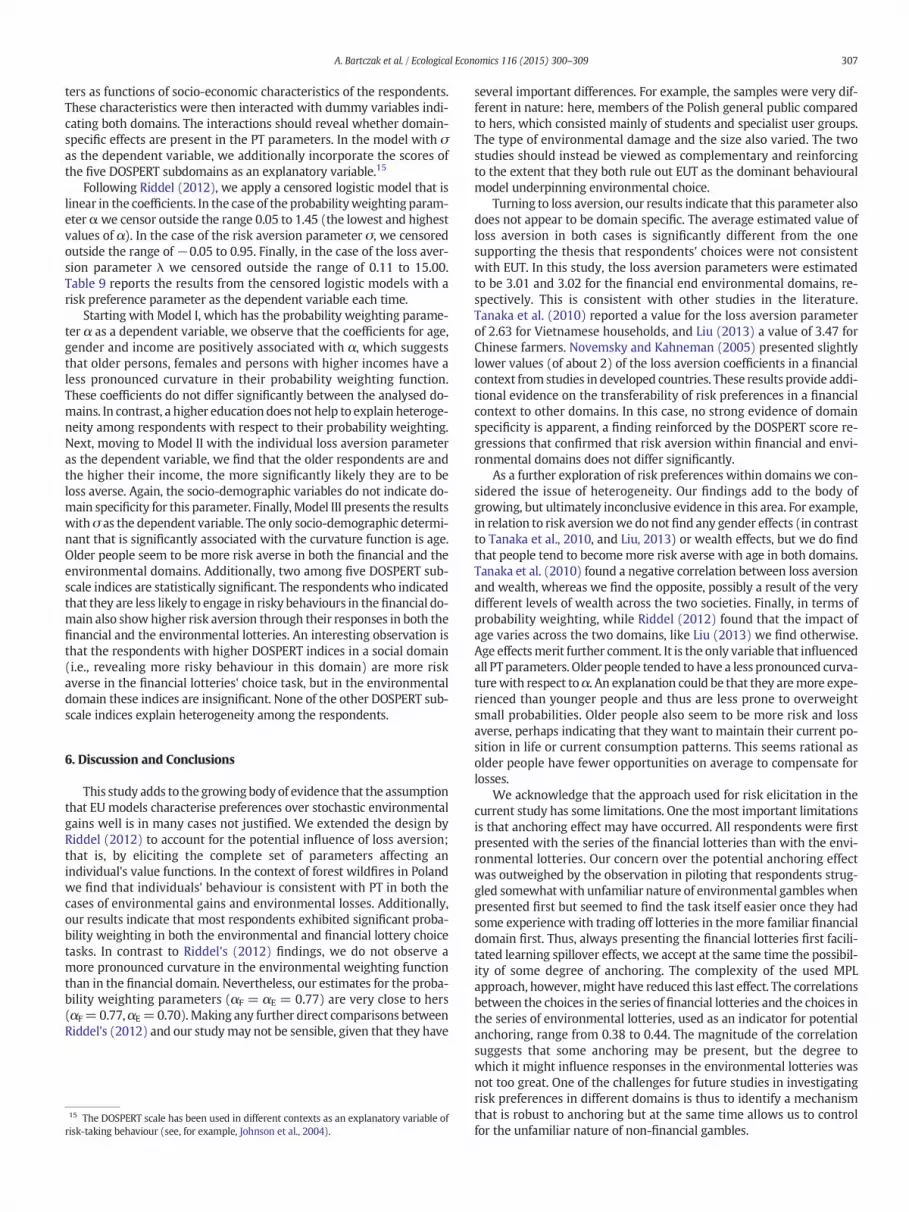
The responses to both Series 1 and Series 2 jointly determine theweightingparameterα and the risk aversion parameterσ. The loss aver-sion parameter λ is determined by the switching points in Series 3 andby the value of the risk aversion parameter σ. Fig. 1 shows the distribu-tion of the switching points for the first two series of financial lotteries,and Fig. 2 gives the corresponding distribution for the environmentallotteries. In both cases, the switching point combinations for Series 1and Series 2 [(7, 1), (8, 2), (9, 3), (10, 4), (11, 5), (12, 6), (13, 7),(14,8) and (15-never switch, 9)] represent the choices consistent withEUT, assuming constant relative risk aversion with utility functionu(x) = x1− σ / (1− σ).
The results from the financial lotteries suggest that only 2% of re-spondents made choices consistent with EUT. Regarding the environ-mental lotteries, this share equals 3%. No obvious tendency exists in
either the financial or environmental domain for respondents to clusteraround themiddle choice of the lotteries series.While responses tend tocluster on the diagonal in the environmental lotteries relative to the fi-nancial lotteries, the tendency is not strong enough to produce a signif-icant difference between the two, leading us to conclude that there isnot much evidence of domain specificity of risk, at least in thisinstance.13 The average value of the probability weighting parameterα is significantly lower than1 (t-test p-value=0.001) in both thefinan-cial and the environmental domains, rejecting EUT in favour of aninverted S-shaped probability weighting. Table 5 presents the statisticsfor α. Based on results from a paired t-test and a Wilcoxon signed-ranktest, we cannot reject the null hypothesis that the probability weightingfunction in both the environmental and financial domains is similar.This outcome indicates that respondents weighted the likelihood of ex-treme outcomes equally across those two domains.
The average values ofσ obtained from the financial and the environ-mental lotteries are 0.41 and 0.43, respectively, indicating that in bothdomains people tend to be risk averse. Again,we do not observe a signif-icant difference for this parameter between the domains (see Table 6).

Table 7Risk aversion in the financial and environmental domains.
RLE RNE RAE Total
RLF 4% 1% 7% 11%RNF 1% 1% 3% 5%RAF 6% 3% 75% 84%Total 11% 5% 84% 100%
Note: RL, RN and RA stand for risk lovers, risk neutral and risk averse, respectively. Sub-scripts F and E denote the financial domain and the environmental domain, respectively.
Fig. 3. Distribution of switch-points between lotteries A to B.
Table 8Loss aversion parameter (λ) in financial and environmental domains.
Mean Std. dev. Paired t-test Wilcoxonsigned-rank test
t-Value p-Value z-Value p-Value
λF 3.010 3.934 −1.039 0.299 0.112 0.911λE 3.019 3.916
Note: Subscripts F and E denote the financial domain and the environmental domain,respectively.
Table 5Probability sensitivity parameters in Prelec's weighting function (α) in the financial andenvironmental domains.
Mean Std. dev. Paired t-test Wilcoxonsigned-rank test
t-Value p-Value z-Value p-Value
αF 0.770 0.329 −0.166 0.868 −1.395 0.163αE 0.773 0.324
Note: Subscripts F and E denote the financial domain and the environmental domain,respectively.
Table 6Risk aversion parameter (σ) in financial and environmental domains.
Mean Std. dev. Paired t-test Wilcoxonsigned-rank test
t-Value p-Value z-Value p-Value
σF 0.405 0.388 −1.265 0.207 −0.879 0.379σE 0.426 0.387
Note: Subscripts F and E denote the financial domain and the environmental domain,respectively.
306 A. Bartczak et al. / Ecological Economics 116 (2015) 300–309
In both domains risk lovers and risk-neutral individuals constituteabout 11% and 5% of the sample, respectively. The vast majority of therespondents reveal similar levels of risk aversion in the two domains(see Table 7).
Fig. 3 shows the distribution of switching points for Series 3 of the fi-nancial and environmental lotteries.
The proportion of individuals with a λ value between 0.9 and 1.1(consistent with EUT) in the financial and the environmental lotteriesis 4% and 5%, respectively. In both domains, the average estimatedvalue of loss aversion is significantly different from 1, indicating thatchoices are not consistent with EUT. Using a t-test we can reject thenull hypotheses λF = 1 and λE = 1 at the 1% level.
The average estimated value of the loss aversion parameter in the fi-nancial series of lotteries is calculated to be 3.010, whereas for the envi-ronmental series it equals 3.019.14 These values are not statisticallysignificantly different from each other (see Table 8), suggesting that in-dividuals weighted losses more heavily than equivalent gains similarlyin both domains.
5.3. Heterogeneity of Risk Preferences
As reported, tests conducted at the individual level show that theprobability weighting parameter, α, the risk aversion parameter σ andthe loss aversion parameter λ do not differ significantly in both do-mains. However, this does not rule out preference heterogeneity acrossrespondents within each domain; that is, respondents might differ withrespect to their preferences with regard to financial or environmentalrisks. To investigate this possibility, we run regressions specifying theprobability weighting, the risk aversion and the loss aversion parame-
14 Following Liu (2013) we assigned the maximum value of λ at 15 instead of infinity.
Table 9Drivers of individual risk preferences in financial and environmental domains.
Parameter Model I Model II Model III
Probabilityweights (α)
Loss aversion (λ) Value functioncurvature/riskaversion (σ)
Coeff. |z-val.| Coeff. |z-val.| Coeff. |z-val.|
Age ∗ F 0.0133 17.28 0.0397 6.53 0.0062 5.89Age ∗ E 0.0129 17.27 0.0401 6.58 0.0067 6.16Gender ∗ F 0.1056 3.43 0.0587 0.24 0.0533 1.50Gender ∗ E 0.1069 3.47 0.0526 0.21 0.0581 1.62Higher edu ∗ F 0.0016 0.05 0.3618 1.43 0.0030 0.09Higher edu ∗ E 0.0102 0.32 0.3486 1.38 0.0637 1.79Income ∗ F(in 1000 zł)
0.0245 5.02 0.0734 1.94 −0.0035 −0.77
Income ∗ E(in 1000 zł)
0.0290 6.44 0.0727 1.92 0.0034 0.76
DOS_eth. ∗ F 0.0307 1.21DOS_eth. ∗ E 0.0218 0.79DOS_fin. ∗ F −0.0436 −2.07DOS_fin. ∗ E −0.0506 −2.64DOS_health. ∗ F 0.0200 1.06DOS_health ∗ E 0.0357 1.71DOS_rec. ∗ F −0.0129 −0.90DOS_rec. ∗ E −0.0051 −0.33DOS_social ∗ F 0.0417 2.77DOS_social. ∗ E 0.0155 0.99Scale 0.3910 40.06 3.3097 36.57 0.4488 0.0157AIC 1074.27 6138.02 1529.84BIC 1119.59 6183.34 1629.73Log likelihood −528.13 −3060.01 −744.54Observations 1136
Note: F and E denote the domain term: the financial and environmental domains,respectively.
307A. Bartczak et al. / Ecological Economics 116 (2015) 300–309
ters as functions of socio-economic characteristics of the respondents.These characteristics were then interacted with dummy variables indi-cating both domains. The interactions should reveal whether domain-specific effects are present in the PT parameters. In the model with σas the dependent variable, we additionally incorporate the scores ofthe five DOSPERT subdomains as an explanatory variable.15
Following Riddel (2012), we apply a censored logistic model that islinear in the coefficients. In the case of the probabilityweighting param-eterαwe censor outside the range 0.05 to 1.45 (the lowest and highestvalues of α). In the case of the risk aversion parameter σ, we censoredoutside the range of −0.05 to 0.95. Finally, in the case of the loss aver-sion parameter λ we censored outside the range of 0.11 to 15.00.Table 9 reports the results from the censored logistic models with arisk preference parameter as the dependent variable each time.
Starting with Model I, which has the probability weighting parame-ter α as a dependent variable, we observe that the coefficients for age,gender and income are positively associated with α, which suggeststhat older persons, females and persons with higher incomes have aless pronounced curvature in their probability weighting function.These coefficients do not differ significantly between the analysed do-mains. In contrast, a higher education does not help to explain heteroge-neity among respondents with respect to their probability weighting.Next, moving to Model II with the individual loss aversion parameteras the dependent variable, we find that the older respondents are andthe higher their income, the more significantly likely they are to beloss averse. Again, the socio-demographic variables do not indicate do-main specificity for this parameter. Finally, Model III presents the resultswith σ as the dependent variable. The only socio-demographic determi-nant that is significantly associated with the curvature function is age.Older people seem to be more risk averse in both the financial and theenvironmental domains. Additionally, two among five DOSPERT sub-scale indices are statistically significant. The respondents who indicatedthat they are less likely to engage in risky behaviours in the financial do-main also show higher risk aversion through their responses in both thefinancial and the environmental lotteries. An interesting observation isthat the respondents with higher DOSPERT indices in a social domain(i.e., revealing more risky behaviour in this domain) are more riskaverse in the financial lotteries' choice task, but in the environmentaldomain these indices are insignificant. None of the other DOSPERT sub-scale indices explain heterogeneity among the respondents.
6. Discussion and Conclusions
This study adds to the growing bodyof evidence that the assumptionthat EU models characterise preferences over stochastic environmentalgains well is in many cases not justified. We extended the design byRiddel (2012) to account for the potential influence of loss aversion;that is, by eliciting the complete set of parameters affecting anindividual's value functions. In the context of forest wildfires in Polandwe find that individuals' behaviour is consistent with PT in both thecases of environmental gains and environmental losses. Additionally,our results indicate that most respondents exhibited significant proba-bility weighting in both the environmental and financial lottery choicetasks. In contrast to Riddel's (2012) findings, we do not observe amore pronounced curvature in the environmental weighting functionthan in the financial domain. Nevertheless, our estimates for the proba-bility weighting parameters (αF = αE = 0.77) are very close to hers(αF=0.77,αE=0.70). Making any further direct comparisons betweenRiddel's (2012) and our studymay not be sensible, given that they have
15 The DOSPERT scale has been used in different contexts as an explanatory variable ofrisk-taking behaviour (see, for example, Johnson et al., 2004).
several important differences. For example, the samples were very dif-ferent in nature: here, members of the Polish general public comparedto hers, which consisted mainly of students and specialist user groups.The type of environmental damage and the size also varied. The twostudies should instead be viewed as complementary and reinforcingto the extent that they both rule out EUT as the dominant behaviouralmodel underpinning environmental choice.
Turning to loss aversion, our results indicate that this parameter alsodoes not appear to be domain specific. The average estimated value ofloss aversion in both cases is significantly different from the onesupporting the thesis that respondents' choices were not consistentwith EUT. In this study, the loss aversion parameters were estimatedto be 3.01 and 3.02 for the financial end environmental domains, re-spectively. This is consistent with other studies in the literature.Tanaka et al. (2010) reported a value for the loss aversion parameterof 2.63 for Vietnamese households, and Liu (2013) a value of 3.47 forChinese farmers. Novemsky and Kahneman (2005) presented slightlylower values (of about 2) of the loss aversion coefficients in a financialcontext from studies in developed countries. These results provide addi-tional evidence on the transferability of risk preferences in a financialcontext to other domains. In this case, no strong evidence of domainspecificity is apparent, a finding reinforced by the DOSPERT score re-gressions that confirmed that risk aversion within financial and envi-ronmental domains does not differ significantly.
As a further exploration of risk preferences within domains we con-sidered the issue of heterogeneity. Our findings add to the body ofgrowing, but ultimately inconclusive evidence in this area. For example,in relation to risk aversionwe do not find any gender effects (in contrastto Tanaka et al., 2010, and Liu, 2013) or wealth effects, but we do findthat people tend to becomemore risk averse with age in both domains.Tanaka et al. (2010) found a negative correlation between loss aversionand wealth, whereas we find the opposite, possibly a result of the verydifferent levels of wealth across the two societies. Finally, in terms ofprobability weighting, while Riddel (2012) found that the impact ofage varies across the two domains, like Liu (2013) we find otherwise.Age effectsmerit further comment. It is the only variable that influencedall PT parameters. Older people tended to have a less pronounced curva-turewith respect toα. An explanation could be that they aremore expe-rienced than younger people and thus are less prone to overweightsmall probabilities. Older people also seem to be more risk and lossaverse, perhaps indicating that they want to maintain their current po-sition in life or current consumption patterns. This seems rational asolder people have fewer opportunities on average to compensate forlosses.
We acknowledge that the approach used for risk elicitation in thecurrent study has some limitations. One themost important limitationsis that anchoring effect may have occurred. All respondents were firstpresented with the series of the financial lotteries than with the envi-ronmental lotteries. Our concern over the potential anchoring effectwas outweighed by the observation in piloting that respondents strug-gled somewhatwith unfamiliar nature of environmental gambles whenpresented first but seemed to find the task itself easier once they hadsome experience with trading off lotteries in themore familiar financialdomain first. Thus, always presenting the financial lotteries first facili-tated learning spillover effects, we accept at the same time the possibil-ity of some degree of anchoring. The complexity of the used MPLapproach, however, might have reduced this last effect. The correlationsbetween the choices in the series of financial lotteries and the choices inthe series of environmental lotteries, used as an indicator for potentialanchoring, range from 0.38 to 0.44. The magnitude of the correlationsuggests that some anchoring may be present, but the degree towhich it might influence responses in the environmental lotteries wasnot too great. One of the challenges for future studies in investigatingrisk preferences in different domains is thus to identify a mechanismthat is robust to anchoring but at the same time allows us to controlfor the unfamiliar nature of non-financial gambles.
1234
308 A. Bartczak et al. / Ecological Economics 116 (2015) 300–309
In conclusion, our results indicate that the assumption that EUT un-derpins respondent choices in stated preference surveys involving riskyenvironmental goods may be misplaced. Given that both probabilityweighting and loss aversion occur, it is reasonable to conclude that PTis indeed a better behavioural descriptor at least in the context of forestwildfires in Poland. The degree to which preference measures such asstated WTP estimates may be biased is an empirical question, and ourdata are not sufficient to resolve this issue. Thus, in future studies itwould be useful to collect additional data on respondent risk prefer-ences and loss aversion as well as individual WTP in order to directlyaddress the question of how large (or small) such a bias may be. In ad-dition, further research is merited to better understand the apparentlydifferent interactions between loss aversion and risk attitudes in the fi-nancial and environmental domains.
Acknowledgements
This study was carried out as a part of “The influence of risk pref-erences on social benefits valuation for forest fires prevention inPoland” financed by the National Science Centre Poland (OPUS I, pro-ject no. 152274). Funding support is gratefully acknowledged. Theauthors also gratefully acknowledge the helpful comments of JerzyMycielski from the University of Warsaw, Faculty of EconomicSciences.
Appendix A. DOSPERT Items and Results
Table A1Domain-Specific Risk-Taking (DOSPERT) items.
Financial
R
S
Health/safety
1. Betting a day's income at the horseraces
2. Investing 10% of your annual incomein a moderate growth mutual fund
3. Betting a day's income at ahigh-stake poker game
4. Investing 5% of your annual incomein a very speculative stock
5. Betting a day's income on the out-come of a sporting event
6. Investing 10% of your annual incomein a new business venture
1. Drinking heavily at a social function2. Engaging in unprotected sex3. Driving a car without wearing a
seat belt4. Riding a motorcycle without a hel-
met5. Sunbathing without sunscreen6. Walking home alone at night in an
unsafe area of town
ecreational
Ethical1. Going camping in the wilderness2. Going down a ski run that is beyond
your ability3. Going whitewater rafting at high
water in the spring4. Taking a skydiving class5. Bungee jumping off a tall bridge6. Piloting a small plane
1. Taking some questionable deduc-tions on your income tax return
2. Having an affair with a marriedman/woman
3. Passing off somebody else's workas your own
4. Revealing a friend's secret to some-one else
5. Leaving your young children aloneat home while running an errand
6. Not returning a wallet you foundthat contains 1000 zł
ocial
1. Admitting that your tastes are dif-ferent from those of a friend
2. Disagreeing with an authority figureon a major issue
3. Choosing a career that you trulyenjoy over a more secure one
4. Speaking your mind about an un-popular issue in a meeting at work
5. Moving to a city far away from yourextended family
6. Starting a new career in yourmid-thirties
Note: Responses were recorded on a 7-point rating scale ranging from 1 — “extremelyunlikely” to 7 — “extremely likely”.
Table A2Domain-Specific Risk-Taking (DOSPERT) scale.
DOSPERT score —
risk taking
Mean Std. dev. Minimum Maximum Cronbach'salpha
. Ethical
11.94 5.02 6 36 0.60. Financial
13.64 7.40 6 42 0.83. Health/safety
17.36 6.71 6 38 0.64. Recreational
16.80 8.80 6 42 0.83. Social
26.66 7.18 6 42 0.71 5References
Anderson, L.R., Mellor, J.M., 2008. Predicting health behaviors with an experimental mea-sure of risk preference. J. Health Econ. 27, 1260–1274.
Anderson, S., Harrison, G.W., Lau, M.I., Rutström, E., 2007. Valuation using multiple pricelist formats. Appl. Econ. 39, 675–682.
Bartczak, A., Lindhjem, H., Navrud, S., Zandersen, M., Zylicz, T., 2008. Valuing forest recre-ation on the national level in a transition economy: the case of Poland. For. PolicyEcon. 10, 467–472.
Binswanger, H.P., 1980. Attitudes toward risk: experimental measurement in rural India.Am. J. Agric. Econ. 62 (3), 395–407.
Charness, G., Gneezy, U., Imas, A., 2013. Experimental methods: eliciting risk preferences.J. Econ. Behav. Organ. 87, 43–51.
Cherry, T., Crocker, T., Shogren, J., 2003. Rationality spillovers. J. Environ. Econ. Manag. 45,63–84.
Chetan, D., Eckel, C., Johnson, C., Rojas, C., 2010. Eliciting risk preferences: when is simplebetter? J. Risk Uncertain. 41, 219–243.
Dohmen, T., Falk, A., Huffman, D., Sunde, U., Schupp, J., Wagner, G.G., 2011. Individual riskattitudes: measurement, determinants and behavioral consequences. J. Eur. Econ.Assoc. 9, 522–550.
Dyer, J.S., Sarin, R.K., 1982. Relative risk aversion. Manag. Sci. 28 (8), 875–886.Hanoch, Y., Johnson, J., Wilke, A., 2006. Domain specificity in experimental measures and
participant recruitment an application to risk-taking behavior. Psychol. Sci. 17,300–304.
Harrison, G.W., Johnson, E., Mcinnes, M.M., Rutström, E., 2005. Risk aversion and incentiveeffects: comment. Am. Econ. Rev. 95 (3), 897–901.
Holmes, T., Gonzalez-Caban, A., Loomis, J., Sanchez, J., 2013. The effects of personal expe-rience of choice-based preferences for wildfire protection programs. Int. J. WildlandFire 22, 234–245.
Holt, C.A., Laury, S.K., 2002. Risk aversion and incentive effects. Am. Econ. Rev. 92 (5),1644–1655.
Holt, C.A., Laury, S.K., 2005. Risk aversion and incentive effects: new data without ordereffects. Am. Econ. Rev. 95 (3), 902–912.
Johnson, J., Wilke, A., Weber, E., 2004. Beyond a trait view of risk taking: taking: a domain-specific scale measuring risk perceptions, expected benefits, and perceived-risk atti-tude in German-speaking populations. Pol. Psychol. Bull. 35 (3), 153–163.
Joint Research Centre of the European Commission (JRC), 2014. Forest Fires in Europe,Middle East and North Africa 2013. Technical Report, EUR 26791 EN.
Kahneman, D., Tversky, A., 1979. Prospect theory: an analysis of decision under risk.Econometrica 47 (2), 263–291.
Liu, E.M., 2013. Time to change what to sow: risk preferences and technology adoptiondecisions of cotton farmers in China. Rev. Econ. Stat. 95 (4), 1386–1403.
Lusk, J.L., Coble, K.H., 2005. Risk perceptions, risk preference, and acceptance of risky food.American Journal of Agricultural Economics. 87 (2), 393–405.
Mason, C., Shogren, J., Settle, C., List, J., 2005. Investigating risky choices over losses usingexperimental data. J. Risk Uncertain. 31, 187–215.
Nguyen, Q., Leung, P., 2009. Do fishermen have different attitudes toward risk? An appli-cation of Prospect Theory to the study of Vietnamese fishermen. J. Agric. Resour. Econ.34 (3), 518–538.
Novemsky, N., Kahneman, D., 2005. The boundaries of loss aversion. J. Mark. Res. 42,119–128.
Prelec, D., 1998. The probability weighting function. Econometrica 66 (3), 497–527.Richardson, L., Loomis, J., 2009. The total economic value of threatened, endangered and
rare species: an updated meta-analysis. Ecol. Econ. 68 (5), 1535–1548.Riddel, M., 2012. Comparing risk preferences over financial and environmental lotteries.
J. Risk Uncertain. 45, 135–157.Rigby, D., Alcon, F., Burton, M., 2011. Supply uncertainty and the economic value of irriga-
tion water. Eur. Rev. Agric. Econ. 37 (1), 97–117.Roberts, D.C., Boyer, T.A., Lusk, J.L., 2008. Preferences for environmental quality under un-
certainty. Ecol. Econ. 66, 584–593.Rolfe, J., Windle, J., 2010. Valuing protection of the Great Barrier Reef with choice model-
ling by management policy options. Paper presented at the BioEcon Conference,Venice, 27–28th September 2010.
Runkle, J.R., 1985. Disturbance regimes in temperate forests. In: Pickett, S.T.A., White, P.S.(Eds.), The Ecology of Natural Disturbance and Patch Dynamics. Academic Press, NewYork, pp. 17–33.
Shaw, W.D., Woodward, R.T., 2008. Why environmental and resource economists shouldcare about non-expected utility models. Resour. Energy Econ. 30, 66–89.
Starmer, C., 2000. Developments in non-expected utility theory: the hunt for a descriptivetheory of choice under risk. J. Econ. Lit. 38, 332–382.
Tanaka, T., Camerer, C., Nguyen, Q., 2010. Risk and time preferences: linking experimentaland household survey data from Vietnam. Am. Econ. Rev. 100 (1), 557–571.

309A. Bartczak et al. / Ecological Economics 116 (2015) 300–309
Tversky, A., Kahneman, D., 1992. Advances in prospect theory: cumulative representationof uncertainty. J. Risk Uncertain. 5 (4), 297–323.
Tversky, A., Fox, C.R., 1995. Weighing Risk and uncertainty. Psychological Review. 102 (2),269–283.
von Neumann, J., Morgenstern, O., 1944. Theory of Games and Economic Behavior.Princeton University Press, Princeton, New Jersey.
Weber, E.U., Blais, A.R., Betz, N.E., 2002. A domain-specific risk-attitude scale: measuringrisk perceptions and risk behaviors. J. Behav. Decis. Mak. 15, 263–290.
Wibbenmeyer, M., Hand, M., Calkin, D., Venn, T., Thompson, M., 2013. Risk preferences instrategic wildfire decision making: a choice experiment with U.S. wildfire managers.Risk Anal. 33 (6), 1021–1037.
Related Documents