World Institute for Development Economics Research wider.unu.edu WIDER Working Paper 2014/063 Aid and the environment in Africa A synthesis of eight case studies Edwin Muchapondwa* March 2014

Welcome message from author
This document is posted to help you gain knowledge. Please leave a comment to let me know what you think about it! Share it to your friends and learn new things together.
Transcript

World Institute for Development Economics Research wider.unu.edu
WIDER Working Paper 2014/063 Aid and the environment in Africa A synthesis of eight case studies Edwin Muchapondwa* March 2014

* University of Cape Town, [email protected]
This study has been prepared within the UNU-WIDER project ‘ReCom–Foreign Aid: Research and Communication’, directed by Tony Addison and Finn Tarp.
Copyright © UNU-WIDER 2014
ISSN 1798-7237 ISBN 978-92-9230-784-4
Typescript prepared by Janis Vehmaan-Kreula at UNU-WIDER.
UNU-WIDER gratefully acknowledges specific programme contributions from the governments of Denmark (Ministry of Foreign Affairs, Danida) and Sweden (Swedish International Development Cooperation Agency—Sida) for ReCom. UNU-WIDER also gratefully acknowledges core financial support to its work programme from the governments of Denmark, Finland, Sweden, and the United Kingdom.
The World Institute for Development Economics Research (WIDER) was established by the United Nations University (UNU) as its first research and training centre and started work in Helsinki, Finland in 1985. The Institute undertakes applied research and policy analysis on structural changes affecting the developing and transitional economies, provides a forum for the advocacy of policies leading to robust, equitable and environmentally sustainable growth, and promotes capacity strengthening and training in the field of economic and social policy-making. Work is carried out by staff researchers and visiting scholars in Helsinki and through networks of collaborating scholars and institutions around the world.
UNU-WIDER, Katajanokanlaituri 6 B, 00160 Helsinki, Finland, wider.unu.edu
The views expressed in this publication are those of the author(s). Publication does not imply endorsement by the Institute or the United Nations University, nor by the programme/project sponsors, of any of the views expressed.
Abstract: This study seeks to understand what aid flows have been doing to the environment in eight countries in Eastern, Western and Southern Africa. Total aid to these countries’ environmental sectors for the 2000s decade is about US$10.17 billion and bilateral aid has been on the rise. There seems to have been a structural change in some countries where donors have been increasing the number of small projects. Aid is perceived to play a significant role in enhancing environmental quality because of constant environmental mainstreaming. Therefore, a general increase in unmarked aid will improve environmental conditions as long as mainstreaming of either biodiversity or climate change or desertification or the environment takes place. Keywords: Africa, aid, environment, environmental mainstreaming JEL classification: F35, O13, Q01 Acknowledgements: This paper has been written as part of a collaboration between UNU-WIDER and the African Economic Research Consortium (AERC) within the UNU-WIDER project ‘ReCom–Foreign Aid: Research and Communication’, directed by Tony Addison and Finn Tarp. With contributions from Channing Arndt, Yiriyibin Bambio, Nícia Givá, James Juana, Godius Kahyarara, Eseza Kateregga, Tidiane Ngaido, Wilfred Nyangena, Alda Tomo and Daniel Kwabena Twerefou.
1
1 Introduction
The major motivation for aid is the promotion of economic development and welfare of developing countries (Hicks et al. 2008). The fulfilment of this goal usually manifests itself in enhanced economic growth, poverty reduction and a better quality of life. The effectiveness of aid in achieving these components of economic development and welfare has been a subject of intense debate in recent years (Hicks et al. 2008). In this context, literature has also highlighted the side effects of aid namely, environmental degradation, unbalanced appreciation of the recipient country’s currency; increasing dependency and corruption; supporting programmes which are of less importance to developing countries; encouraging dumping which reduces the competitiveness of local industries as well as aid-tying which increases the cost to developing countries’ programmes.1
The issue of how aid can damage or protect the global environment has been the source of protest, legislative debate and reform efforts at development agencies around the world since the first Earth Summit in Stockholm in 1972 (Hicks et al. 2008). With some of the richest stores of biodiversity, natural resources and carbon located in poor countries, the potential for environmental damage is greatest in places outside the sovereign control of Western governments. Consequently, environmentalists and voters in Western countries have put pressure on their elected officials to be more proactive about protecting the environment particularly in developing countries (Hicks et al. 2008). In this regard, the dilemma for the West has been to determine how less developed countries can be encouraged to act on the environment which often ranks far below security, health care and education on their domestic agendas (Hicks et al. 2008). Partly in response to this lack of incentives amongst developing countries of acting on the environment, there has been aid consciously geared towards achieving positive environmental outcomes since the 1972 Stockholm Declaration. However, in general, aid may affect the environment in either negative or positive or both ways in a recipient country.
The negative perspective would suggest that aid may promote environmental degradation by promoting economic growth, which is ordinarily dirty (Arvin et al. 2006).2,3 Thus, aid transfers may lead to unsustainable development at an excessive pace resulting in environmental and ecological degradation. A manifestation of this may be seen, for example, in the acceleration in the rate of exploitation of an economy’s natural resource base (Arvin et al. 2006). Addison et al. (2005) use the aid-economic growth nexus to imply that environmental degradation would have
1 To make aid more effective, the 2005 Paris Declaration on Aid Effectiveness provides a blueprint for the poorest and wealthiest countries as well as development institutions to improve the quality of aid and enhance its efficiency. The Paris Declaration calls for recipients to take lead in co-ordinating aid at all tiers in combination with other developmental resources in consultation with donors, private sector and civil society. The 2008 Accra Agenda for Action and 2011 Busan Partnership for Effective Development Co-operation re-enforces the Paris Declaration. 2 Burnside and Dollar (2000) provide empirical evidence that the impact of aid on GDP growth is positive and significant in developing countries with sound institutions and economic policies (i.e. open trade, fiscal and monetary discipline) but aid has less or no significant impact in countries with poor institutions and policies. Easterly et al. (2004) re-estimated the Burnside and Dollar estimate with an updated and extended dataset but could not find any significant aid-policy interaction term. 3 Among other ways, aid may have a deleterious impact on the environment in poorer countries if polluters in relatively well-regulated richer countries seek to relocate their operations to low-income countries whose governments may turn a blind eye to environmental transgressions in return for aid from richer countries so as to meet their employment and income priorities (Arvin et al. 2006).
2
been lower in recent years amongst developing countries had the amount of official aid been lower as well.
On the positive side, if there is a willingness to transform to a green economy, aid may facilitate a green growth path which inevitably avoids or pre-empts environmental degradation that would otherwise have been inflicted. Thus, aid may allow recipient countries to invest in the environment, something which would never have occurred without it. Furthermore, the Environmental Kuznets Curve hypothesis suggests that, by allowing recipient countries to reach the turning point faster, aid may be beneficial. The work by Asafu-Adjaye (1999) is instructive. The major assumption in the above arguments is that environmental degradation in many poorer countries is largely related to a lack of funds for environmental clean-up and conservation (Arvin et al. 2006).4
Conserving the environment is important from both national and international perspectives. Given the ambiguous effects of aid, there is a noticeable gap in research on how aid flows are linked to the environment in developing countries (Arvin et al. 2006). In Africa, donor rhetoric frequently emphasizes the need to protect natural resources and to prepare the continent for the challenges posed by climate change both in terms of adaptation and mitigation. Three major cases in point are the Stockholm Earth Summit (1972), Rio Earth Summit (1992), and the Johannesburg Earth Summit (2002). In addition, there have been several platforms where climate change has been discussed particularly the Conferences of Parties. Furthermore, thinking about the messages from the major donors to Africa, the G8 Summit in Gleneagles, Scotland, in 2005 promised a substantial increase in aid in order to eliminate poverty and more action on climate change. The G8 pledged to explore opportunities to increase the volume of investments on renewable energy and energy efficient technologies. Despite all such promises, it is not clear how much real progress has been made in transferring resources to Africa to mitigate, prevent or remediate damage to the environment (Hicks et al. 2008). Additionally, there is very little information on the relative importance of the environment in the aid commitments and activities undertaken by donors. Likewise, information about the impacts of aid on the environment is lacking.
Some databases on aid, which are primarily based on commitments by the donors, are widely available. However, it remains difficult to know the amount of resources that goes to the environment because the environment is a cross-cutting issue. As such, expenditure in other sectors may have a direct and/or indirect impact on the environment. For example, some expenditure on education or fertility may have impacts on the environment but will be captured under non-environmental sectors’ budgets. Therefore, a proper assessment of the financing of the environment also needs to account for the funding of projects located in other sectors, which may even have a higher environmental impact. Moreover, many environmental projects have national, regional and international dimensions requiring different institutions to take charge and, consequently, funding for the environment in any nation will be incorrectly assessed if the regional and international budgets were ignored. Most importantly, the problem of assessing aid is constrained by the lack of information collected on the ground to complement the databases. Thus, there is currently no full understanding of the link between aid and the environment in Africa, making it difficult to know what aid has been doing on the environmental sector in Africa. There have been renewed calls to put sustainable development at the core in the post Millennium Development Goals period. For example, the Report of the UN Secretary General’s High-Level Panel of Eminent Persons on the post-2015 Development Agenda
4 Indeed, if environmental quality is a normal good, then poorer countries tend to adopt lower environmental standards. By increasing income in poorer economies, aid can then raise these standards. As such, aid has a role to at least decelerate environmental degradation (Arvin et al. 2006).

3
suggests that we must act now to halt the alarming pace of climate change and environmental degradation which pose unprecedented threats to humanity (United Nations 2013).
Accordingly, this study seeks to determine what aid flows have actually been doing and are doing on the environmental sector in Africa. The specific objectives of the study are to estimate the amounts of aid and government development expenditure allocated to environmental interventions; identify and discuss the top aid donors’ environmental interventions; and analyse the perceptions of donors on aid and the environment in Africa. This is done through the analysis of findings from primary research conducted in eight carefully selected countries in Southern Africa (Botswana and Mozambique), East Africa (Kenya, Uganda and Tanzania) and West Africa (Burkina Faso, Ghana, and Senegal). Thus, this paper presents a synthesis of the country case studies of these eight African countries (Bambio 2013; Juana 2014; Kahyarara 2014; Kateregga 2013; Ngaido 2014; Nyangena 2013; Tomo and Givá 2014; Twerefou 2013). This work is helpful in bringing out the reality about the impact of aid on the environment from the ground and in suggesting how future disbursements should be structured for maximum positive impact on the environment.
The rest of the paper is arranged as follows: Section 2 presents the background, policies and developmental priorities of the selected countries. Section 3 outlines the structure of the environmental sectors in the selected countries, highlighting the key financing needs. Section 4 briefly outlines the methodology used. Section 5 reports the structure and statistics of aid received by each of the selected countries. Section 6 presents a sample of successful and unsuccessful environmental projects in the selected countries. Section 7 attempts to unravel the impact of aid on the environment using data from a survey of donors and observations on the ground. Section 8 concludes the paper.
2 The background, policies and developmental priorities of the selected countries
This section briefly outlines the backgrounds of the selected countries and highlights where environmental issues lie in their developmental priorities. The countries’ own efforts towards addressing environmental issues are presented particularly allocations from the fiscus. The existence of enabling policy frameworks for proactive effort on the environment is also discussed.
2.1 Botswana
With the discovery of diamonds in 1976 and the implementation of sound macroeconomic policies, coupled with good governance, the country experienced the highest growth rates in the world between 1966 and 2004; hence, Botswana graduated from being a low-income country to a middle-income country (Anderson 2005). Over time, Botswana’s development priorities have been set in National Development Plans (NDPs). For example, since the mid-2000s, Botswana’s emphasis has been on economic diversification and combating the HIV/AIDS pandemic. As a result, the NDP 9 and NDP 10’s main focus was on infrastructure development and improving the business climate for private sector investment (NDP 10 2009).
Botswana still has a high poverty rate (Central Statistics Office [CSO] 2010). The majority of the poor population lives in rural areas and depend on natural resources for their livelihoods. Botswana has a host of environmental problems. These include water scarcity and pollution, land degradation, biodiversity loss, deforestation, desertification, climate change and waste generation and poor disposal methods. The Government of Botswana has since formulated the long-term
4
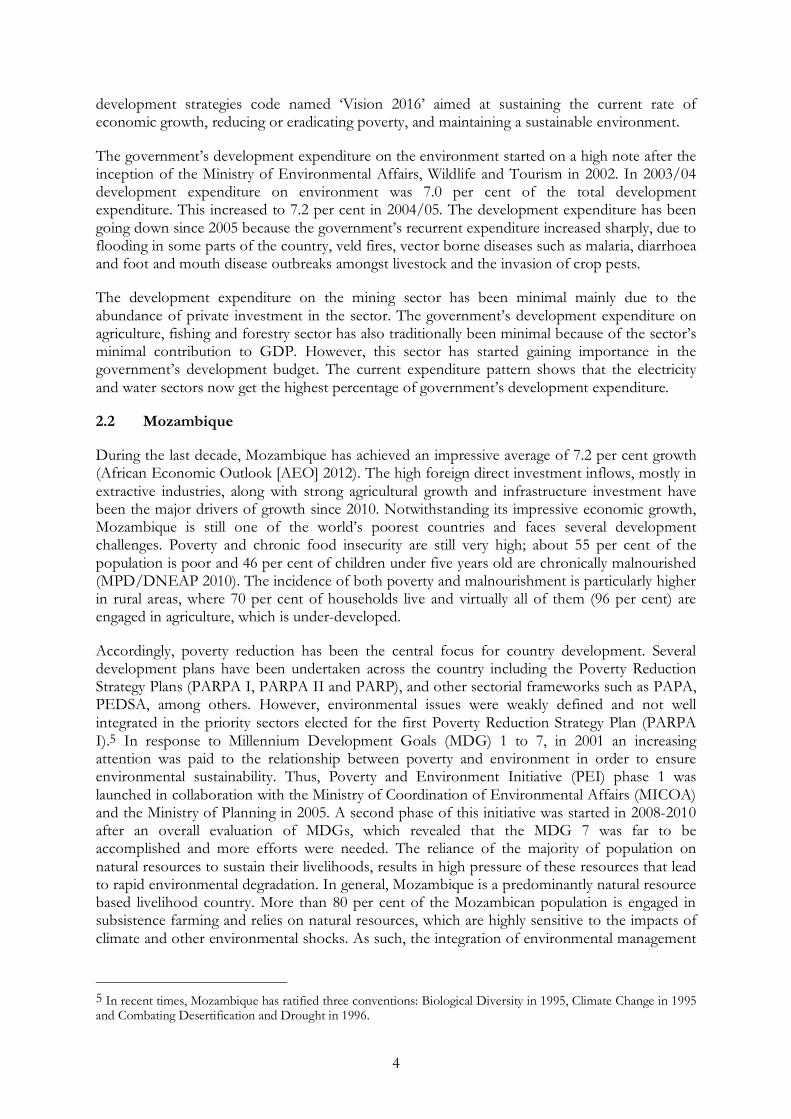
development strategies code named ‘Vision 2016’ aimed at sustaining the current rate of economic growth, reducing or eradicating poverty, and maintaining a sustainable environment.
The government’s development expenditure on the environment started on a high note after the inception of the Ministry of Environmental Affairs, Wildlife and Tourism in 2002. In 2003/04 development expenditure on environment was 7.0 per cent of the total development expenditure. This increased to 7.2 per cent in 2004/05. The development expenditure has been going down since 2005 because the government’s recurrent expenditure increased sharply, due to flooding in some parts of the country, veld fires, vector borne diseases such as malaria, diarrhoea and foot and mouth disease outbreaks amongst livestock and the invasion of crop pests.
The development expenditure on the mining sector has been minimal mainly due to the abundance of private investment in the sector. The government’s development expenditure on agriculture, fishing and forestry sector has also traditionally been minimal because of the sector’s minimal contribution to GDP. However, this sector has started gaining importance in the government’s development budget. The current expenditure pattern shows that the electricity and water sectors now get the highest percentage of government’s development expenditure.
2.2 Mozambique
During the last decade, Mozambique has achieved an impressive average of 7.2 per cent growth (African Economic Outlook [AEO] 2012). The high foreign direct investment inflows, mostly in extractive industries, along with strong agricultural growth and infrastructure investment have been the major drivers of growth since 2010. Notwithstanding its impressive economic growth, Mozambique is still one of the world’s poorest countries and faces several development challenges. Poverty and chronic food insecurity are still very high; about 55 per cent of the population is poor and 46 per cent of children under five years old are chronically malnourished (MPD/DNEAP 2010). The incidence of both poverty and malnourishment is particularly higher in rural areas, where 70 per cent of households live and virtually all of them (96 per cent) are engaged in agriculture, which is under-developed.
Accordingly, poverty reduction has been the central focus for country development. Several development plans have been undertaken across the country including the Poverty Reduction Strategy Plans (PARPA I, PARPA II and PARP), and other sectorial frameworks such as PAPA, PEDSA, among others. However, environmental issues were weakly defined and not well integrated in the priority sectors elected for the first Poverty Reduction Strategy Plan (PARPA I).5 In response to Millennium Development Goals (MDG) 1 to 7, in 2001 an increasing attention was paid to the relationship between poverty and environment in order to ensure environmental sustainability. Thus, Poverty and Environment Initiative (PEI) phase 1 was launched in collaboration with the Ministry of Coordination of Environmental Affairs (MICOA) and the Ministry of Planning in 2005. A second phase of this initiative was started in 2008-2010 after an overall evaluation of MDGs, which revealed that the MDG 7 was far to be accomplished and more efforts were needed. The reliance of the majority of population on natural resources to sustain their livelihoods, results in high pressure of these resources that lead to rapid environmental degradation. In general, Mozambique is a predominantly natural resource based livelihood country. More than 80 per cent of the Mozambican population is engaged in subsistence farming and relies on natural resources, which are highly sensitive to the impacts of climate and other environmental shocks. As such, the integration of environmental management
5 In recent times, Mozambique has ratified three conventions: Biological Diversity in 1995, Climate Change in 1995 and Combating Desertification and Drought in 1996.
5
into poverty reduction strategies and other development plans has been identified as a priority in the country’s policy framework.
On the environmental side, climate change is believed to pose the major challenge to the country (AEO 2012). Under the Convention on Climate Change, the government created an inter-institutional working group integrating different ministries, private sector and civil society with the main objective of mainstreaming climate change into sector plans. The group is engaged in preparing the national capacity for the implementation of the Clean Development Mechanism (CDM) and in the elaboration of the National Action Plan for Adaptation (NAPA). NAPA was approved by the government in December 2007 targeting four major areas: early warning, agricultural production, water resources management and coastal zones (MICOA 2007). In addition, for the past two years, the working group has been active preparing a strategy for reducing emissions from deforestation and forest degradation (REDD). The main objective of REDD is to forge a sustainable use of natural resources including a payment system for environmental services in Mozambique (MICOA 2010). Furthermore, in November 2012, the government approved the National Strategy for Climate Change Adaptation and Mitigation (2013-15) aimed at facilitating and promoting a harmonious development and resilient to the climate change and the mechanisms for energy efficiency and sustainable use of natural resources. Despite all this proactive work on the policy front, the government has not committed any meaningful funds for the environment from the Treasury.
2.3 Kenya
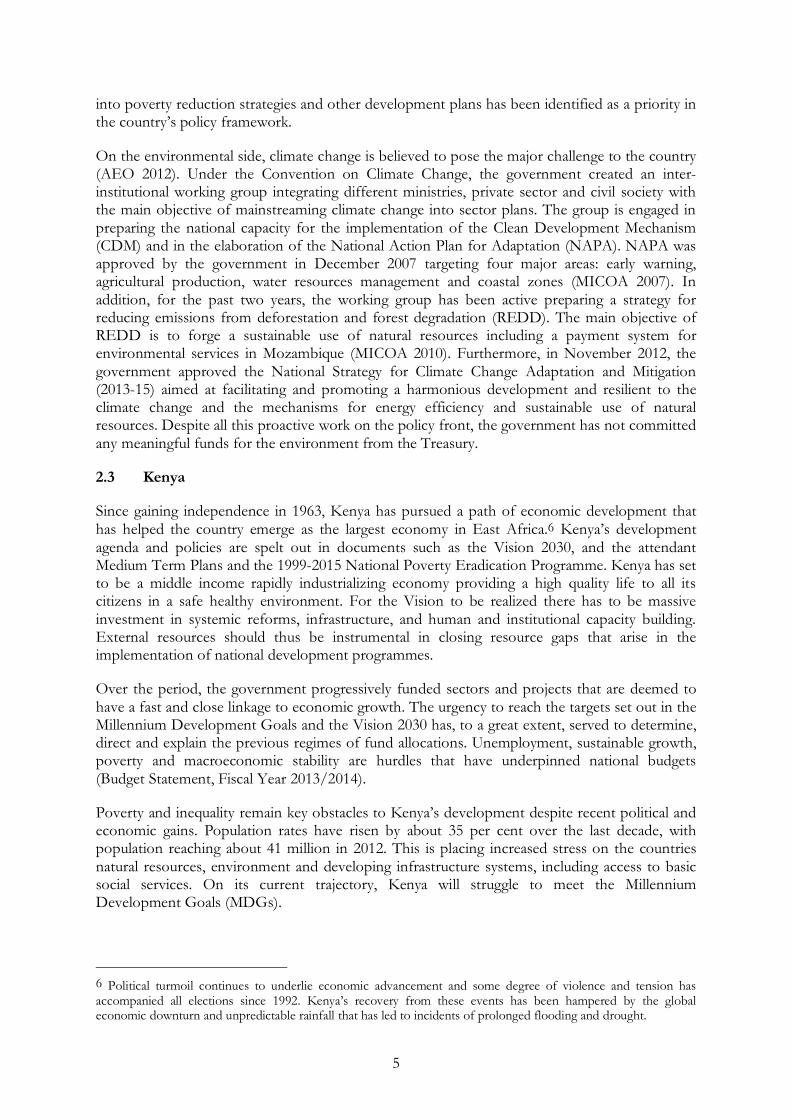
Since gaining independence in 1963, Kenya has pursued a path of economic development that has helped the country emerge as the largest economy in East Africa.6 Kenya’s development agenda and policies are spelt out in documents such as the Vision 2030, and the attendant Medium Term Plans and the 1999-2015 National Poverty Eradication Programme. Kenya has set to be a middle income rapidly industrializing economy providing a high quality life to all its citizens in a safe healthy environment. For the Vision to be realized there has to be massive investment in systemic reforms, infrastructure, and human and institutional capacity building. External resources should thus be instrumental in closing resource gaps that arise in the implementation of national development programmes.
Over the period, the government progressively funded sectors and projects that are deemed to have a fast and close linkage to economic growth. The urgency to reach the targets set out in the Millennium Development Goals and the Vision 2030 has, to a great extent, served to determine, direct and explain the previous regimes of fund allocations. Unemployment, sustainable growth, poverty and macroeconomic stability are hurdles that have underpinned national budgets (Budget Statement, Fiscal Year 2013/2014).
Poverty and inequality remain key obstacles to Kenya’s development despite recent political and economic gains. Population rates have risen by about 35 per cent over the last decade, with population reaching about 41 million in 2012. This is placing increased stress on the countries natural resources, environment and developing infrastructure systems, including access to basic social services. On its current trajectory, Kenya will struggle to meet the Millennium Development Goals (MDGs).
6 Political turmoil continues to underlie economic advancement and some degree of violence and tension has accompanied all elections since 1992. Kenya’s recovery from these events has been hampered by the global economic downturn and unpredictable rainfall that has led to incidents of prolonged flooding and drought.
6
Environmental and natural resource degradation constitute a major challenge in Kenya’s development process (GoK 2012). These resources are increasingly under pressure as a result of unsustainable utilization. This has resulted in pollution, soil erosion, resource depletion and extinctions. The country faces a major challenge in planning for sustainable use of natural resources in the face of limited arable land, water, rapid population growth, poverty and limited financial capital. Increased economic activities have caused conflict with environment.
Kenya’s future sustained economic growth depends on better environmental management. Forest ecosystems, wetlands and semi-arid and arid lands contain Kenya’s key biodiversity habitats and many of its cultural sites, supply much of Kenya’s domestic energy, and provide crucial environmental services, such controlling erosion, maintaining water quality and absorbing carbon. Despite the importance of sound environmental management to both agriculture and tourism, which together account for over one-third of GDP, widespread degradation of the environment and overexploitation of natural resources remain serious problems in Kenya.
During the past decade, development expenditure has been disbursed through four broad classes namely: general public services, economic affairs, health, and education. The scope of these classes may have changed over the period under study because various regimes redefined the sectoral structure of the economy with some times aggregation of several independent ministries. This poses a great challenge in determining and tracking the trends of expenditure by ministries which appear and/or disappear in the period. Nevertheless, analysis of available statistics shows that development expenditure has improved gradually through the years.
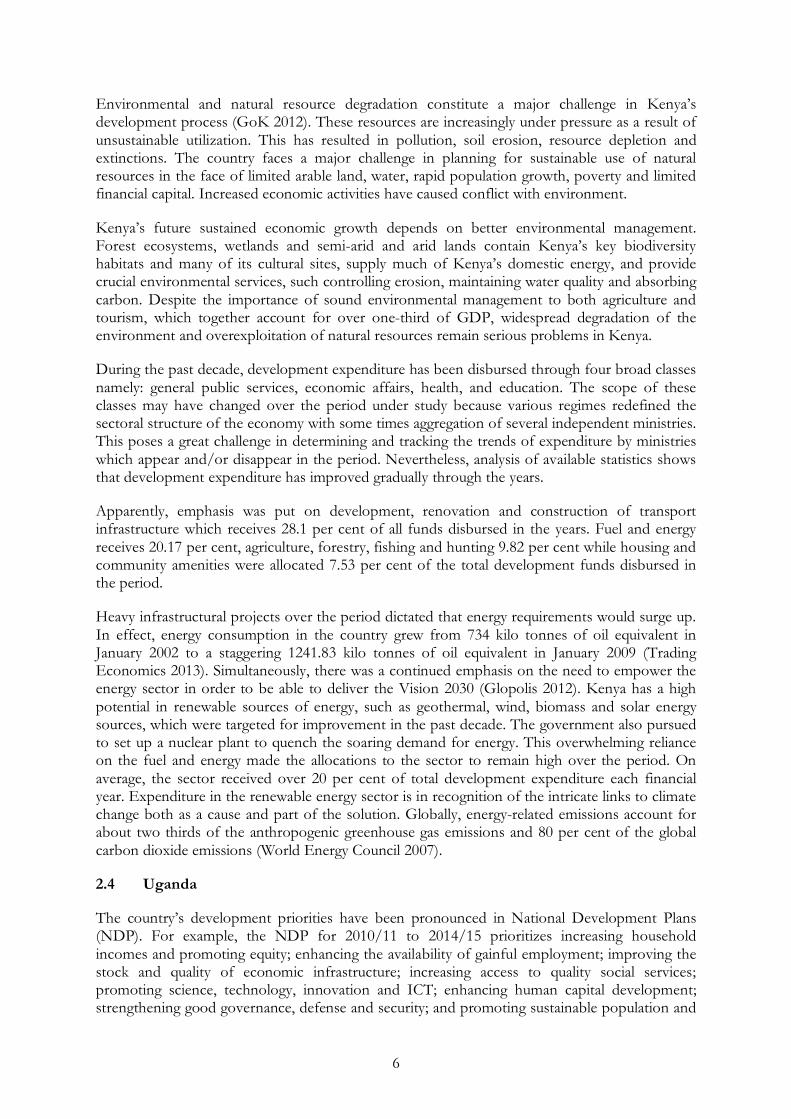
Apparently, emphasis was put on development, renovation and construction of transport infrastructure which receives 28.1 per cent of all funds disbursed in the years. Fuel and energy receives 20.17 per cent, agriculture, forestry, fishing and hunting 9.82 per cent while housing and community amenities were allocated 7.53 per cent of the total development funds disbursed in the period.
Heavy infrastructural projects over the period dictated that energy requirements would surge up. In effect, energy consumption in the country grew from 734 kilo tonnes of oil equivalent in January 2002 to a staggering 1241.83 kilo tonnes of oil equivalent in January 2009 (Trading Economics 2013). Simultaneously, there was a continued emphasis on the need to empower the energy sector in order to be able to deliver the Vision 2030 (Glopolis 2012). Kenya has a high potential in renewable sources of energy, such as geothermal, wind, biomass and solar energy sources, which were targeted for improvement in the past decade. The government also pursued to set up a nuclear plant to quench the soaring demand for energy. This overwhelming reliance on the fuel and energy made the allocations to the sector to remain high over the period. On average, the sector received over 20 per cent of total development expenditure each financial year. Expenditure in the renewable energy sector is in recognition of the intricate links to climate change both as a cause and part of the solution. Globally, energy-related emissions account for about two thirds of the anthropogenic greenhouse gas emissions and 80 per cent of the global carbon dioxide emissions (World Energy Council 2007).
2.4 Uganda
The country’s development priorities have been pronounced in National Development Plans (NDP). For example, the NDP for 2010/11 to 2014/15 prioritizes increasing household incomes and promoting equity; enhancing the availability of gainful employment; improving the stock and quality of economic infrastructure; increasing access to quality social services; promoting science, technology, innovation and ICT; enhancing human capital development; strengthening good governance, defense and security; and promoting sustainable population and

7
use of the environment and natural resources. With regard to the environment, the NDP seeks to (i) restore degraded ecosystems (e.g. wetlands, forests, rangelands and catchments), (ii) ensure sustainable management of environmental resources and minimize degradation, and (iii) identify and address emerging environmental issues and opportunities. The urgent need to address the issue of climate change is also well acknowledged.
Indeed, Uganda’s economy and human livelihood is directly underpinned by the integrity of the environment (NEMA 2010), and it is estimated that 87 per cent of households’ needs are met through direct access to the natural resources. For example, the environment sector contributed 55 per cent to total GDP in 2010 (MFPED 2012). The government’s expenditure on the environment has also not been impressive given the sector’s contribution to GDP.7 For example, expenditure on the agriculture sector steadily increased between 2004 and 2008 but thereafter fluctuates though remaining above UGX110 billion. The same trend is exhibited by expenditure on animal resources. However, funds allocated to the livestock and fisheries sectors steadily decline after 2010. The aggregate expenditure allocations for the water sector steadily increase after 2009. Over the period 2006/07–2008/09 spending on forestry declines even though it increases steadily thereafter.
2.5 Tanzania
The development priorities of Tanzania have recently been espoused in the National Strategies for Growth and Reduction of Poverty (NSGRPs). Forest and natural resource management has clear relevance to the poverty reduction outcomes aspired in the NSGRP I: 2005–2010. Similarly, the NSGRP II: 2010–2015 considers agriculture as a growth driver, which supports the majority of the poor rural population and has the potential of lifting the majority out of poverty. Looking forward, the Tanzania Development Vision 2025 also emphasizes the need to achieve high quality livelihoods of its people through strategies that will ensure food self-sufficiency and food security while effectively reversing current adverse trends in the loss and degradation of environmental resources (forests, fisheries, fresh water, soil and biodiversity) (United Republic of Tanzania 2010).
Therefore, there is political will for action in the environmental sector. In fact, there has been a more broad-reaching effort to manage environmental issues at a national level since 1983, through the establishment of the National Environment Management Council (NEMC) and instituting the Environment Act. Tanzania is a signatory to a significant number of international conventions, including the Rio Declaration on Development and Environment 1992 and the Convention on Biological Diversity 1996. The Environmental Management Act, 2004, is the first comprehensive legal and institutional framework to guide environmental-management decisions. Controlling habitat destruction and fragmentation in high biodiversity areas is one of the focus areas in the forestry sector. Besides, there are specific efforts towards government support on climate change. Among the key impacts of climate change, Tanzania’s National Adaptation Programme of Action (NAPA) predicts overall decrease in crop productivity, even though the effects will likely vary from harmful (estimated 33 per cent decrease for maize), to beneficial (16-18 per cent increase for coffee). As such, the government also seeks to strengthen mitigation and
7 Of course, we acknowledged that there are challenges in getting continuous expenditure figures for the environment as some sub-sectors have been shifting from one Ministry to another. Besides, funds spent on livestock and fisheries are coded as Animal Resources making it difficult to decompose the sum to determine how much was spent on the livestock sector or fisheries. Furthermore, in some periods, funds spent on wetlands are reported separately while in other periods they are lumped together with expenditure on wildlife and other natural resources. Before 2004/05, expenditure on forestry was lumped together with other items in the environmental sector. Likewise expenditure on the wildlife sector is captured under the spending for Ministry of Tourism, Trade and Industry.

8
adaptation action to climate change by supporting research programmes to improve and develop new technologies, quality seeds, pest control, and information collection and dissemination for early warning systems (United Republic of Tanzania 2010). Tanzania has developed a National REDD+ Strategy that ensures conservation and/or enhancements of its unique biodiversity values and forest ecosystems and the corresponding benefits, goods and services are equitably shared by all stakeholders for adaptation, mitigation and adoption of a low carbon development pathway under all processes as required by the UNFCCC.
Statistics reveal that expenditure in environment issues is a small fraction of the total government expenditure. Studies estimate such expenditure at less than 0.05 per cent. Therefore, implementation of all environmental projects requires external funding that is likely to be sourced from donors.
2.6 Burkina Faso
The development policies implemented in Burkina Faso during the last ten years, led to an average real gross domestic product (GDP) growth of 5.2 per cent. This economic growth was 5.2 per cent, 5.7 per cent, 6.5 per cent and 6.2 per cent in 2009, 2010, 2011, and 2012 respectively (African Economic Outlook 2013). The contribution of primary, secondary and tertiary sectors are 25 per cent, 15 per cent and 60 per cent respectively. In Burkina Faso, 80 per cent of active population works in the primary sector, including subsistence agriculture, livestock and forestry. This sector accounts for 70 per cent of the country export values. The development priorities have been laid out in the Poverty Reduction Strategy Document (CSLP) and recently in the Strategy for Accelerated Growth and Sustainable Development (SCADD).
Most of life quality indicators are morose for Burkina Faso since 20 years at least. The share of people living below US$1.25 a day has decreased at about 40 per cent over 1994-2009 period (Millennium Development Goals Report 2012). The life expectancy at birth was 50 years in 2000 and 55 years in 2011. In 2010, about 73 per cent of rural population had access to improved water. The carbon dioxide emissions are 0.1 metric ton per capita in 2009. In the UNDP last report in 2013, Burkina Faso’s HDI was 0.313 corresponding to a rank of 183 out of 187 countries, and is lower than the average HDI of the Low Human Development countries. The poverty headcount ratio at national poverty line was 49.2 per cent and 46.7 per cent in 2003 and 2009 respectively (World Development Indicators 2013).
The SCADD was adopted in December 2010 to focus on combining increased economic growth, improved environment and resources management, and social equity, for sustainable development. With respect to the environment, the Ministry of Environment takes the lead. However, every other Ministry should also include environment concerns in its development programmes. Focus on environmental issues in Burkina Faso has increased in the last decade. To this end, a national office for the monitoring and evaluation of environmental impacts from development projects (BUNED) has been created. The most important environmental issues include degradation of soil and water resources, and erosion of biodiversity. In addition, the energy sources are not sustainable.
With regards to government spending on the environment, the sector’s needs have been insufficiently funded in the development programmes such as CSLP and SACCD. This has mainly been due to budget constraints. The current budget of Burkina Faso is about US$3.3 billion with only about 62 per cent of this budget being covered nationally. Government’s investment in the environment sector has been about CFA 400 million per year during the period 2000–09. This is against a background of needs of at least €8 million to deal with the climate change in the country (European Commission 2013).

9
2.7 Ghana
The longest series of medium term stabilization programmes began in 1983 with the Economic Recovery Programme (ERP) and Structural Adjustment Programmes (SAP) (1983-1999). Since 1996, the Government of Ghana has re-oriented all development policies around economic and social development, more specifically poverty reduction and has mainstreamed environment and social issues into all these plans to some extent to ensure sustainable development. The First Medium Term Development Plan (MTDP) carved out of Vision 2020 was implemented from 1996 to 2000. Vision 2020 was discontinued in 2000 due to macroeconomic imbalances and substituted by the World Bank/International Monetary Fund sponsored Interim Poverty Reduction Strategy Paper (IPRSP) (2000-2002), Ghana Poverty Reduction Strategy I (GPRS I) (2003-2005), Growth and Poverty Reduction Strategy Paper (GPRS II) (2006-2009) and currently the Ghana Shared Growth and Development Agenda (GSGDA) 2010-2013.
Proper integration of the economic, social and environmental pillars of sustainable development started with the implementation of GPRSs. Even though GPRS I was directed primarily at attaining anti-poverty objectives, GPRS II ensured better integration of the three pillars. The GSGDA continued to expand this integration. An observation by the country is that climate change will have adverse repercussions on all sectors of the economy and even has the potential to reverse the little economic and social gains made if measures are not taken to adapt and mitigate the impacts. In line with this understanding, the GSGDA has mainstreamed climate change activities into all development programmes and projects. Several other development and environmental issues confront the country in its attempt to ensure sustainable development. These among others include energy, transport, agriculture, water, forestry, and urban management.
Government expenditure has increased from about 186 million GHC in 2000 to about 7,725 million GHC in 2011 at an average annual growth of about 43 per cent. The key sectors including Education, Health, Finance, Interior, Defense and Foreign Affairs together take about 78.78 per cent of all government expenditure. However, none of these sectors do have strong links with the environment. Expenditure on the Ministry of Environment (MESTI) and the broader environmental sector has roughly been 1.3 per cent and 6 per cent on average between 2000 and 2011.8 Even though overall government expenditure has been increasing rapidly, the same cannot be said of the expenditure on MESTI and the broader environmental sector. Thus, the share of environmental expenditure in total expenditure has generally decreased over time.
2.8 Senegal
The Poverty Reduction Strategy Paper (PRSP) has also guided the developmental priorities of Senegal. Senegal, located in the Sahel area, between the equator and the Sahara is confronted with a tropical climate characterized by frequent droughts and galloping environmental degradation. The environmental sector contribution is always undervalued and was estimated to have contributed about 81 billion CFA which was 1.7 per cent of the GNI of Senegal in 2006.
Regarding financing environmental expenditures, there are numerous mechanisms through which the sector can receive funding. The most important ones in recent years have been the Medium-term Sectorial Expenditure Framework (CDS-MT, Cadre de depenses sectorial a Moyen Term), the Poverty Reduction Strategy Paper (PRSP), and other thematic and regional support.
8 The broader environment sector includes ministries such as MESTI, Ministry of Local Government and Rural Development (MLGRD), Ministry of Food and Agriculture, Ministry of Lands and Natural Resources (MLNR) and the Ministry of Fisheries.

10
The CDS-MT remains the main instrument, which the GoS uses to allocate resources between the various sectors. In 2008, the Ministry of Environment and Nature Protection (MEPN) developed its Sectorial Policy Letter for the environment and natural resources for the period ranging between 2009 and 2015 (Lettre de Politique Sectorielle de l’Environnement et des Ressources Naturelles 2009-2015 (LPSERN). The expectations of the policy letter were an allocation of 2 per cent of the national budget to the environmental sector. The ministry received 83.082 billion CFA Francs (about US$166 million) of which 68 per cent was considered as investment and 32 per cent for operations to cover investment and operation between 2009 and 2011. The sector is, however, experiencing yearly decreases of its budget and is threatening the capacity of the ministry to implement some of its programmes or receive funding for new conceived projects.
3 Environmental sub-sectors
This section presents the key environmental sub-sectors which are prioritized by the selected countries and donors. There are ongoing interventions in some sub-sectors in certain countries while other countries have identified challenges for future action in the sub-sectors. Overall, it appears that the water, forestry and biodiversity sub-sectors are highly prioritized across the selected countries. One of the major issues which cut across these sub-sectors is climate change. Another significant sector which has a close interface with the key environmental sectors is agriculture. As such, we will first discuss agriculture in general then followed by the specific key environmental sectors in the selected countries.
Agriculture is still considered the foundation of most of Africa including the selected countries since a vast majority of the countries’ populations derive their livelihoods from it. For example, in Uganda, 85 per cent of the population that live in the rural areas derive their livelihood from this sector, it employs more than 60 per cent of the country’s rural workforce and contributes close to 21 per cent of the country’s GDP (MFPED 2012). In Ghana, agriculture supports about 70-80 per cent of the total rural population, majority of who are extremely poor. Agriculture in the selected countries is mainly subsistence-based with limited use of improved technology. The majority of the activities are still based on small, hand-cultivated and rain-fed units, with no application of improved inputs, and mainly managed by women. With the large majority of agricultural production being rain-fed, climate change is set to be one of the major constraints in the future.9
Agriculture is also one of the key economic sectors that directly threaten the environment. Activities performed in this sector can cause environmental degradation through land conversion, biodiversity loss, land degradation, and fragmentation of natural ecosystems. For example, the annual rate of cultivated land expansion in Burkina Faso was 2 per cent and 3 per cent in 1975-2000 and 1992-2002 respectively (MEF 2011). On the one hand, the reliance on poor farming practices by the majority of farmers in the selected countries has caused accelerated land degradation, soil quality depletion and biodiversity loss.10 On the other hand, the poor performance of agriculture has led to overexploitation of forest resources, rapid depletion of the 9 For example, the climate situation in Burkina Faso, as in many regions, is characterized by climate extremes including droughts and floods. The driest years in Burkina Faso include 1973, 1984, 1991, 2004, 2010, and 2012, while the worst flood years are 1988, 2007, 2009 (the worst), and 2012 (Wikipedia 2013). Floods are particularly notable on the last decade. These extremes are consequences of climate change and contribute to the worsening environment. 10 In Burkina Faso, the main characteristic of this farming is an extensive farming technique that impoverishes soil and increases erosion by water and wind. About 50 per cent and 20 per cent of the country land are annually exposed to these erosion factors.

11
forests and accelerated biodiversity loss. Climate change has also been contributing to these effects.
3.1 Water
Botswana
Botswana is a water stressed country, with an average annual precipitation rate of 416 mm/year, which ranges from 650 mm/year in the northwest to 250 mm/year in the southwest. The total internal renewable water resource is 2.4km3/year. Of this total, surface water produced internally accounts for 0.8 (km3), while groundwater accounts for 1.7km3/year and an overlap of 0.1 km3/year (FAO 2005). Apart from the perennial rivers and wetlands in the north, and the over utilized Limpopo River and its tributaries in the east, Botswana lacks enough surface water for both socio-economic and environmental sustainable development. The availability of water in the environment is influenced by climate. In Botswana, factors influencing water availability and distribution are low and variable rainfall leading to low rates of surface runoff and ground water recharge, and high evaporation rates (Du Plessis and Rowntree 2003). In 2000, total water withdrawals increased to 194 million cubic meters. Of this figure, about 41 per cent was used for irrigation, forestry, livestock and wildlife; about the same percentage was used by urban, villages, settlements and small industries, and 18 per cent for mining and energy generation (Du Plessis and Rowntree 2003).
The problem of water scarcity in the country is expected to be exacerbated by the impact of climate change, which will lead to increased livestock and crop water requirements, as well as increased evaporation of surface water, resulting from increases in temperature. It is also predicted that rainfall will be erratic and unevenly distributed, leading to decreased surface water availability; hence, heavy dependence on groundwater sources in the country (Du Plessis and Rowntree 2003). The main environmental problem associated with increased dependence on groundwater use is underground water pollution due to leakage from septic tanks and pit latrines, which is also a health hazard to the inhabitants (Swedish International Development Agency [Sida] 2008). The problem of groundwater pollution is exacerbated by the discharge of high concentrations of various metals from mining operations is in the country (SIDA 2008)
To respond to the issue of water scarcity and water pollution the government has outlined strategies in the National Development Plan (NDP 10) under three major headings: (i) provision of clean, reliable and affordable water supply by 2016 at an estimated costs of P5.23 billion (NDP 10 2009), (ii) launch a major village water supply and development project, by the extension and rehabilitation of existing village water supply networks to increase efficiency and coverage at an estimated cost of P2.58 billion, and (iii) instituting regular water quality monitoring and test of dams and well fields, and developing wastewater treatment infrastructure to increase portable water in the country at an estimated cost of P75 million.
Kenya
Kenya is a water scarce country; moreover, the water resources are unevenly distributed in time and space, a situation that is made worse by climate variability. The high population growth rate and expansion of economic activities have caused pressure on water resources. Water resources are also threatened by soil erosion and siltation, water catchment destruction, low level compliance to Water Quality Regulations, inefficient water use strategies, over abstraction of water resources and invasive species. National Development Plans (2002-2008, 2008-2012) recognize Kenya as a water scarce country whereby water demand exceeds renewable fresh water sources. Per capita availability is estimated at 647m3, and is projected to fall to 245m3 per capita

12
by the year 2025 which far too below the recommended minimum of 1000m3. The bulk of the country’s land mass is either arid or semi-arid but it contains 34 per cent of the human population and 50 per cent of the livestock population (UN-WATER 2005). Thus, improved access to safe water and sanitation in both rural and urban areas, and increasing the area under irrigation are given prominence. Indeed rehabilitation and expansion of water supply and sanitation in urban areas and construction of water storage dams are identified as flagship projects. In the National Water Sector Strategy (2007-2015), the country targets improving access to safe water and sanitation to cover 75 per cent of urban areas and 70 per cent of the rural areas.
Uganda
The water and sanitation sub-sector is composed of four sub-sectors: rural water and sanitation; urban water and sewerage; water for production and; water resources management. The regular supply of clean and safe water for domestic, agricultural and industrial use remains a key development challenge in Uganda. Water supply and quality deterioration is a big problem in the country. This has been mainly due to degradation of the water catchment areas. For instance, the degradation of wetlands has exacerbated the water supply problem, first by undermining the water filtering function of wetlands, but also by reducing their water storage capacity (NEMA 2011). In the recent past much emphasis is geared toward pollution control; provision of knowledge and infrastructure for alternative water sources, and ecological sanitation.
Burkina Faso
The principal hydrographical basins in Burkina Faso are the Comoé, Mouhoun, Nakanbé, and Niger. Only Mouhoun and Comoé basins are perennial because they are located in the southern Sudan climatic zone, the rainiest area in the country. In addition to these basins, there are at least 1,300 lakes, dams, or ponds, with about 30 per cent that are perennial (SP/CONNEDD 2010). However, these basins and lakes are increasingly silting up and drying due to factors including agriculture and wrong water use, leading to reduction of aquatic resources and other ecological issues. A particular concern is related to water pollution by use of chemical fertilizers and pesticides. This issue is particularly remarkable in the cotton basin in the south-western part of the country.
Ghana
Ghana has abundant water resources but many Ghanaians do not have access to potable water. Ghana’s water resources face several challenges including managing quantity, quality, flooding, drought and maintaining ecosystem services.11 The low access to potable water is largely as a result of low investment to address the issues of obsolete infrastructure, low tariffs, poor management and pollution. A major issue that arises is the development of Integrated Water Resource Management to promote sustainable water use and water resource protection.
3.2 Biodiversity/wildlife
Botswana
Botswana has a wide diversity of wildlife (flora and fauna) including globally endangered species. However, the country has witnessed a decline in numbers over the years due to illegal hunting,
11 Pollution from mining and agriculture is leading to the inability of communities to use water from rivers like the Pra and Birim while felling of trees along river banks has exposed many rivers such as Densu to siltation and drying.

13
drought and habitat destruction (SOER 2002). The population of Botswana has more than doubled between 1971 and 2011. This has had an impact on biodiversity through habitat modification for crop production, grazing land and urban development (SOER 2002). Major threats to biodiversity are rangeland degradation, inappropriate harvesting methods, habitat destruction, climate change, increased elephant population, fuel wood collection, inadequate management of waste in rural, and lack of information on hazardous waste.
Mozambique
Mozambique is very rich in fisheries resources, with an Indian Ocean coastline of over 2,750 km in length and a marine exclusive area of 572,000 km2, the coastal and marine ecosystems offer resources such as coral reefs, mangroves, and sea-grass beds that are extremely important for the food security and nutrition. Over two thirds of the Mozambican population lives within 150 km of the coast, and the diverse fish and shellfish tapped by artisanal fisheries are an important source of both protein and employment, contributing greatly to food security and nutrition for a large fraction of coastal population.
In addition, the country has extensive freshwater and wetland ecosystems such as rivers and their riparian zones and deltas, natural lakes, and artificial lakes created by dams, which have a relevant role in provision of fresh water fish. Some of the freshwater and wetland ecosystems national, regional or internationally recognized in the fishery industry are Lake Niassa, Zambezi Delta and Cahora Basa Lake.
Mozambican fisheries sector is still very underdeveloped representing only about 3 per cent of Mozambique’s GDP. The majority of the Mozambican use artisanal tools in their fishing activities. One of the major challenges within this sector is the illegal fishery exploitation leading to severe overfishing since the policy implementation is constrained by a lack of operational funds. Climate change also poses a challenge to the fisheries sector, as more people are relying increasingly on this activity for their livelihood, also leading to overexploitation of fish.
Kenya
Kenya has a wide range of plant and animal life. These are important sources of food, beverages, medicine, forage, vegetables, hides and skins. There are an estimated 35,000 known species of plants and animals and micro-organisms. However, many species still remain unknown. One of the major threats facing Kenya is the loss of biological diversity. Land use changes favouring agriculture and urban development have led to the reduction and modification of wild areas resulting in the extinction of or threat of extinction to wildlife species and natural areas which serve as habitat.
Uganda
Uganda is rich in biodiversity and wildlife. Wildlife and Biodiversity played a critical role in the country’s welfare and particularly to communities living around the protected areas. The Uganda Wildlife Authority’s (UWA) role is to conserve and manage Uganda’s wildlife and biodiversity. The continued loss and degradation of Uganda’s biodiversity has been widely acknowledged as a serious challenge to livelihoods, economic growth and human well-being. There is thus efforts directed toward increased protection of forest habitats to reduce deforestation induced biodiversity loss; further implementation of the National Land Use Policy to address issues of encroachment on forests, wetlands and other fragile but biodiversity rich ecosystems; and better management of invasive alien species (NEMA 2010).

14
Ghana
Ghana is one of the countries that share the Guinea Current Large Marine Ecosystem (GCLME) belt, which is very rich in fishery resources. In addition, there are several water bodies—lakes, rivers, streams and wetlands. These resources provide significant economic benefits such as fisheries which is an important source of protein for Ghanaians. A challenge that confronts Ghana today is the unprecedented degradation, pollution and over-exploitation of fishery resources beyond their maximum sustainable yield. Building capacities in the area of aquaculture as well as educating communities on sustainable fishing and water use would be very imperative.
3.3 Forestry
Energy use also has huge implications on the environment especially the forestry sector. Most of Africa has abundant and yet largely unexplored energy resources.12 The majority of the population has been relying on forestry resources as the sources of energy. This has led to severe deforestation and biodiversity loss problems. Unfortunately, the abundant wind and solar resources have barely been exploited to generate cleaner energy.
Botswana
Fuel wood from forests and woodlands accounts for 70 per cent of net energy supply in Botswana, therefore this high reliance on wood for fuel has resulted in a substantial depletion around major settlements. Over-exploitation of forests and range resources was cited as a major challenge in the NDP 9, and this was attributed mainly to the commercialization of the resources, expansion of agricultural activities, wild land fires/bush fires and urbanization (NDP 10 2009).
Mozambique
Mozambique is very rich in forest resources. The major forest ecosystems in Mozambique include Miombo Woodland; Coastal Forest; Mopane Woodland; Grassland, Wooded Savanna, and Bushland; and Montane Ecosystems. Forests cover an area of 406,000 km2, about 51 per cent of the country; while other wooded formations (thickets, shrubs and forests with shifting cultivation) cover around 147,000 km2, about 19 per cent of land in the country (Marzoli 2007b).
The country holds a total of 13,400 km2 of coastal forests (Marzoli 2007b), mainly found from the northern border to the Zambezi River. This ecosystem is considered by Conservation International to be a global biodiversity hotspot—an area of high diversity and endemism under increasing threat. The threat to this ecosystem is exacerbated by the expansion of development and exploitation of natural resources (USAID 2013).
Mangrove ecosystems provide physical protection from cyclones, winds, waves, and storm surges and have the ability to trap and hold sediment and thereby build land. These ecosystem services increase the resilience of coastal communities. Thus, measures to reduce deforestation and forest degradation in mangroves allow for climate change adaptation and mitigation and biodiversity conservation.
The estimated annual rate of deforestation during the period between 1990 and 2002 was 0.58 per cent (Marzoli 2007a). The major causes of deforestation and forest degradation include
12 For example, Mozambique hosts one of the largest hydropower installations in Africa (Cahora Bassa hydro dam) but only a very small portion of its population has access to electricity.

15
clearing for agriculture (shifting cultivation), firewood collection and charcoal production for commercial purposes, forest fires, hunting based on traditional techniques (use of fire), exploitation of construction material, timber harvesting and establishment of commercial forest plantations. The initiative for Reducing Emissions from Deforestation and Forest Degradation (REDD) is being implemented across the country to forge a sustainable use of natural resources including a payment system for environmental services.
Kenya
Kenya is a low-forestry cover country as it has less than 10 per cent of its total land area classified as forest. However, the forestry sector makes an important contribution to the Kenyan economy. Forests play a vital role in the livelihood of the Kenyan population through provision of invaluable forest related goods and services. The most significant contribution is in the energy sector for both domestic and industrial processes, provision of timber for construction and trees for regulation of water flow. It is estimated that about 80 per cent of the population use biomass energy. Approximately 5,000 ha of forest cover is lost every year through illegal logging, encroachment, cultivation and development projects in forest reserves. In addition to the unsustainable utilization of these resources, lack of capacity to value forest goods and services, forest fires, and the lack of harmonized guidelines on the management of trans-boundary forest resources have exacerbated this trend. Decrease in forest cover has led to the decline of ecological functions, including prevention of soil erosion, water yield and the conservation of wildlife habitats and genetic resources. This has also led to sedimentation and siltation of downstream water resources. The Kenyan government appreciates the important function that forests play in underpinning development. In fact, it has underscored the contribution of forests in attainment of the Millennium Development Goals (MDGs) and Vision 2030.
Uganda
Uganda has lost approximately 1.7 million hectares of forest cover since 1990. This is almost 30 per cent of the 1990 forest coverage acreage. The main factors at play are the rapid expansion of farmlands, a rapidly growing human population and increased urbanization (NEMA 2010).13 Forest coverage has decreased also due to weak management policies and enforcement of laws, and because over 90 per cent of total energy resources used in the country are derived from fuel wood.
With effect from November 2004, the management of forest resources was placed under the custody of the National Forestry Authority (NFA). NFA develops management plans and enforces them; mobilizes farmers into tree planting groups; develops seedlings and sells to the public; providing scientific knowledge in forest management; develops participatory plantation action plans and promotes tree planting in private lands, local forest reserves and in degraded areas; strengthens institutional and community capacity for water shed management; licenses and monitors the production, processing and movement of timber and timber products; maintains forest roads for ease of eco-tourism; create incentives for community based forest projects. In the NDP it is clearly shown that the key objective in this sector is to increase forest cover from 3,604,176 to 4,933,748 hectares by the end of 2015.
13 In the recent past, the tendency for people to migrate out of the increasingly crowded city into suburbs of Kampala has seen the forest coverage in the districts of Wakiso, Mukono and Mpigi reduce to 22 per cent of what they were during 1990 (NFA 2011).

16
Burkina Faso
Savanna is the predominant type of land-cover. Its area has decreased by about 14 per cent during 1975-2000 because of clearing for cropland purpose. Burkina Faso has gallery forests along drainage channels than true forests. Its area has decreased by about 24 per cent during 1975-2000. In general, the forestry is characterized by increasing deforestation. Deforestation is estimated at about 19 per cent during the two last decades (FAO 2010). The most important forest resources have been put under the control of the Forestry Commission, including 77 enclosed areas accounting for about 14 per cent of the country’s land area (DIFOR 2007). The principal factors for deforestation include domestic use (fire wood) and bush fire. About 87 per cent of households rely on wood as a principal domestic energy source.
Ghana
The majority of Ghanaians live in rural areas and depend on the forest for their livelihoods. Unfortunately, forests are being degraded at a rapid rate. Various programmes and projects have been put in place to reduce deforestation in line with the National Forest and Wildlife Policy. Initiatives such as the Reduced Emissions from Deforestation and Forest Degradation plus (REDD+) have been negotiated and being implemented. The challenge now is the intensification of current programmes including the assessment of the value of forest products to enable economic pricing of forest resources.
4 Methodology
This study seeks to determine what aid flows have actually been doing and are doing on the environmental sector in Africa. The research has two methodological components: quantitative and qualitative. The quantitative component mainly involves the generation of descriptive statistics for key variables and relationships. The qualitative component involves interviews with relevant stakeholders. Thus, the study makes use of secondary data from government departments in the selected countries, a very comprehensive database on aid by AidData and primary data from a survey conducted on a sample of donors in the selected countries. The AidData database contains information for the period of 1947-2011, including some environmental-related information. A range of sources including the OECD creditor reporting system (CRS), donor annual reports, projects documents from bilateral and multilateral aid agencies and data gathered directly from donor agency sources, websites and databases were used to compile the primary variables for the AidData database.
5 Structure of aid
Africa has been a significant beneficiary of Official Development Assistance (ODA) from the West. The Organization for Economic Cooperation and Development (OECD)’s Development Assistance Committee (DAC)’s ODA to Africa increased annually by 8 per cent during the period 2000-06 and 5 per cent during the period 2006-10. At the Gleneagles Summit in 2005, the G8 promised to double aid to Africa by 2010. Political pressure has maintained this relatively high level of commitment, although delivery has fallen well short of the targets agreed (Kaberuka 2011). Figure 1 shows the aid trend to Africa for the period 2001-10.

17
Figure 1: Net ODA to Africa 2000-11 (US$b, constant 2005)
Source: OECD data. Over the period 2000-2011, the total aid flows to Africa from all sources stood at about US$569 billion (Strange et al. 2013). These data include the OECD DAC categories of ODA and Other Official Flows (OOF). The OECD-DAC flows contribute the bulk of aid at US$404 billion while the United States and China contributes the remainder (US$90 billion and US$75 billion respectively). These data come from the comparison conducted by Strange et al. (2013) (see Figure 2).14,15 The rest of the section provides a brief overview of aid flows to the selected countries. The section reports the source, purpose and magnitude of the aid during a period roughly coinciding with the 2000s decade.16 We also comment on the deviations between commitments and disbursements of aid to the selected countries. Table 1 show the top donors for the selected countries. It is clear that the top three donors of the selected countries are the World Bank, United States of America (USA) and the European Union (EU). Total aid to the eight countries’ environmental sectors for the 2000s decade is estimated at a minimum of US$10.17 billion against an estimated total aid budget of about US$100 billion. Thus, the environmental sector has received about 10 per cent of total aid.
14 These measures of Chinese official flows includes pipeline (commitments), implemented, and completed projects that received either the ODA-like, OOF-like, or Vague Official Finance designation (Strange et al. 2013). 15 Strange et al. (2013) demonstrates that in the early-2000s China was already providing almost the amount of official financing to Africa as the United States. At the peak in 2006, China was providing almost twice the amount of total U.S.-ODA and -OOF, and about one-third of the ODA and OOF to Africa from the entire OECD-DAC combined. All three trend upward over time. 16 There were differences in the quality of data for the various countries such it was not possible to choose a common period.
0
10
20
30
40
50
60
70
2000 2001 2002 2003 2004 2005 2006 2007 2008 2009 2010 2011

18
Figure 2: Chinese, OECD-DAC, and US official flows over time, 2000-11
Source: AidData’s Chinese Official Finance to Africa Dataset, Version 1.0 and OECD DAC Creditor Reporting System as cited in Strange et al. (2013).
Table 1: The top donors for the selected countries
No. Botswana Mozambique Kenya Uganda Tanzania Burkina Faso
Ghana Senegal
1 USA Ireland World Bank
USA World Bank World Bank World Bank
Netherlands
2 EU Portugal USA AfDB UK EU USA France 3 Japan Spain IMF Norway Netherlands France AfDB Japan 4 Private
Donors USA EU Denmark Sweden USA China World Bank
5 UN UNICEF UK Germany EU Netherlands FORTIS USA 6 France Norway AfDB Ireland Norway AfDB SOGE Spain 7 Multilateral Italy Japan UK Japan Germany Canada Canada 8 Norway Germany France UN Ireland UN KBC Bank IFAD 9 Sweden Sweden Germany EU Finland Japan EU Belgium 10 AfDB France Global
Fund Sweden Denmark Canada UK GEF
Env Aid
US$61.67m 1.35% 2000-2010
US$2.40b 9% 2000-2010
US$5.29b 21% 2000-2011
US$173.40m 4% 2004-2009
US$2.36m 0.05% 2010-2012
US$135.00m 1.5% 2000-2011
US$1.71b 10.6% 2000-2011
US$397.07m n.a. 2000-2010
Total Aid
US$4.57b 2000-2010
US$27.40b 2000-2010
US$25.20b 2000-2011
US$4.34 b 2004-2009
US$4.72b 2010-2012
US$9.00b 2000-2011
US$16.16b 2000-2011
US$7.41b 1993-2010
Source: Compiled from data provided by Bambio (2013); Juana (2014); Kahyarara (2014); Kateregga (2013); Ngaido (2014); Nyangena (2013); Tomo and Givá (2014) and Twerefou (2013).
5.1 Botswana
Most bilateral and multilateral aid donor agencies withdrew from the country after its graduation to a middle-income country in 2004 (Anderson 2005). However, with the upsurge in HIV/AIDS infection in the country most foreign donors came back but redirected their commitment to combating the pandemic. Currently, about two-thirds of the foreign aid disbursed in the country is allocated to HIV/AIDS activities. In 2007, the Ministry of Finance and Development Planning
010
2030
4050
Am
ount
in b
illio
ns o
f co
nsta
nt 2
009
US
D
2000 2005 2010year
DAC ODA to Africa US ODA to AfricaChinese ODA to Africa ... incl. vague flows

19
(MFDP) launched the Development Partners Coordination Forum for the purpose of documenting, co-ordinating, reporting and avoiding duplication of the activities of donor agencies in the country.
The top ten aid donors are the United States of America (USA), European Union (EU), Japan, Private Donors (the main private donor agencies are the Bill and Melinda Gates Foundation and OPEC fund for international development), United Nations, France, Other Multilateral Organizations (assistance was mainly from the Global Environmental Facility [GEF]), Norway, Sweden and the African Development Bank. Other multilateral organizations include the World Bank and Global Environmental Facility and SACU.
The total aid commitment to Botswana between 2000 and 2010 was US$4,567,996,165 (2009=100). In 2000 about 37 per cent of the donor aid commitment was to the environment sector. This declined to a minimum of 0.15 per cent in 2004 and has been among the lowest ever since that time.17 The percentage of donor aid commitment to the environment sector in Botswana for the period 2000-10 is 1.35 per cent. However, there are aid dispensations to other sectors that have environmental implications. For example, forest conservation and afforestation, sustainable fisheries management water and sanitation, sustainable management of agricultural land for livestock grazing and arable farming, appropriate municipal waste disposal methods, water quality improvements for rural and urban areas and eco-tourism. All these were not considered in the strictly environmental donor aid commitments. If these are considered, the scenario presented above will be different.18
The total aid disbursement in Botswana for the past five years is US$578,948,063. Most aid donors in Botswana stopped funding in 2009. This is because the country has attained a middle-income level of development; hence graduated from aid donor or assistantship. Out of the total of US$578,946,063 aid disbursement in Botswana, only US$9,737,020 has been used in environmental projects. This represents about 1.68 per cent of the total aid inflows into the country between 2008 and 2012. This amount is quite insignificant, given the global importance of environment and sustainable development. This indicates that, although the majority of the activities or programmes implemented by donor agencies have environmental consequences, the issue of environmental sustainability is not given the priority that it deserves. Currently, in Botswana, the most environmental aid donor is Global Environmental Facility (GEF). In order of magnitude the United Nations Development Project (UNDP) and Government of France are ranked second and third respectively. Sectors like agriculture, forestry and fishing, energy generation and supply, water supply and sanitation, and disaster prevention have received minimum attention from the bilateral and multi-lateral donor agencies.
17 The period 2002-04 saw the aid focus shifting from the environmental sector to transport infrastructure, energy, industrial development and mining. At the same time concern for the high HIV prevalence rate in the country caught the attention of the international community, who saw the pandemic as a national disaster and therefore focused attention to this at the expense of the environment. 18 While we have discussed the interventions that lead to improved environmental benefits in the country, the converse (i.e. the negative impact of foreign aid on the environment) has not been considered. While it is difficult to exactly quantify the negative and positive environmental impacts of foreign aid in the country, we can qualitatively present the possible negative environmental impacts from the sectors that can potentially have adverse impacts on the environment. These include the energy sector, especially the construction of coal fired and nuclear power plants; transport infrastructure, which include the construction and extension of airports and rural road networks, as well as upgrading major highways in the country; mining and industrial development.

20
5.2 Mozambique
Official Development Assistance is a major source of funding for public development programmes in Mozambique. For instance, aid flows covered about 51.4 per cent of the national budget in 2010 (AEO 2012). In fact, Mozambique’s main medium-term economic structural challenge is the broadening of its fiscal base.
In fact, due to the growing awareness and interest in environmental issues in the development arena and Mozambique´s increasing vulnerability to climate change and the recurrent occurrence of climate-related disasters, much attention and assistance addressing environmental issues have been given to the country. Mozambique is one of the three African pilot countries selected for implementation of the Strategic Climate Fund of the Climate Investment Funds under which, the PPCR is being implemented by the government with the support of the African Development Bank, the World Bank and the International Finance Corporation (AEO 2012). The objective of the PPCR is to deliver incentives for scaled-up action and transformational change through pilot projects that reveal how to integrate climate risk and resilience into basic development planning.
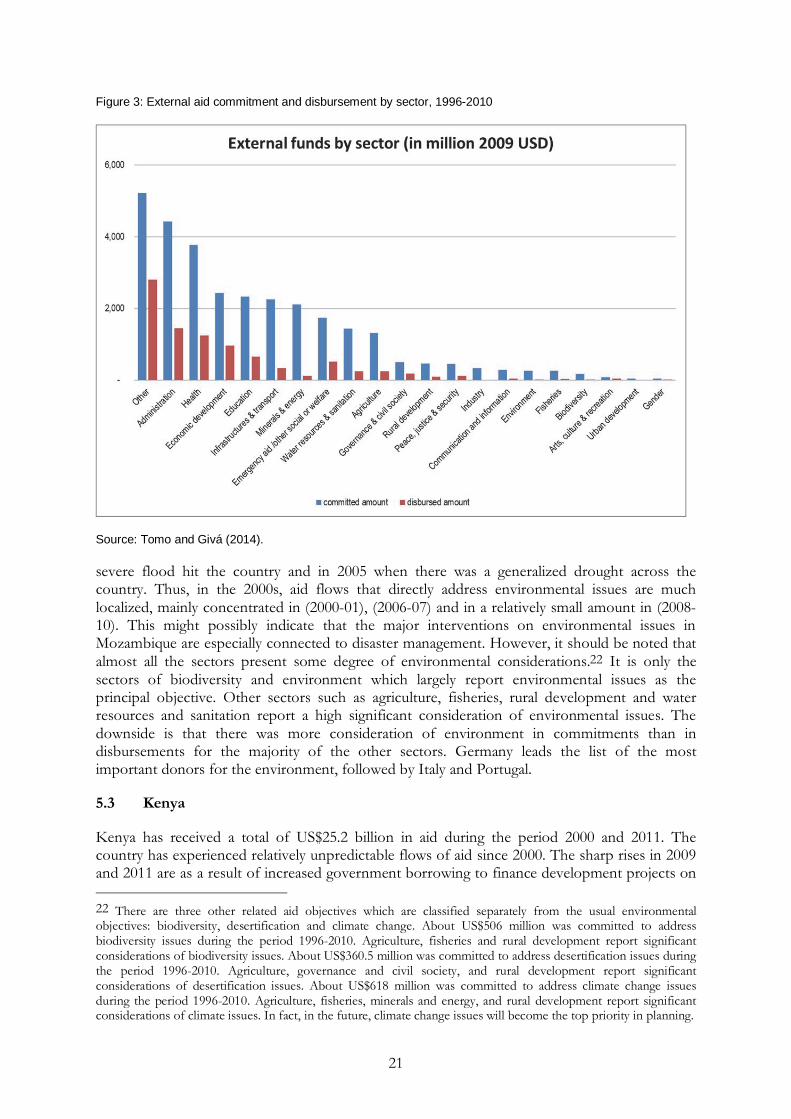
During the period from 2000-10, Mozambique benefited from external cumulative aid of about US$27.398 billion (2009=100).19 The largest contributor during this period is Ireland, accounting for about 15.3 per cent of total aid flows in the country, followed by Portugal, Spain, United States and United Nations Children’s Fund (UNICEF). The top ten contributors account for over 75 per cent of the overall aid flows (Tierney et al., 2011). Health, natural disaster management, agriculture and water resources are the four most important beneficiary sectors, which is obvious, since they are also the priority sectors in the Action Plan for Poverty Reduction. Agriculture, water resources and sanitation, infrastructures and transports, minerals and energy and emergency aid and other welfare/social services also seem to be important in donors planning considerations (see Figure 3). The analysis of total aid shares for the period 2000-10 reveals that only 9 per cent of the amount addresses environmental issues, and climate change issues carry the top priority.20 The cumulative amount of aid allocated to address environmental issues in the 2000s is about US$2.4 billion.21 Over a long term of 1996-2010, only 7 per cent of the committed amount addresses the environment as a significant objective and only 3 per cent tackle explicitly environment as the principal objective. Thus, the relevance of environmental issues relative to other development issues is fairly small in the disbursed funds. Furthermore, the flows for the environment are sporadic because most aid is given in response to environmental stresses like droughts or flooding. This is why there would be spikes in aid, for example, in 2000 when a
19 During the period 1996 to 2010, donors committed a cumulative value of at least US$30.017 billion (2009=100). However, the disbursements have only been about US$9.249 billion, corresponding to about 31 per cent of the commitments. UNICEF, European Communities (EC), Liechtenstein, Iceland, Chile and the African Capacity Building Foundation (ACBF) stand out as they disbursed more than 50 per cent of their commitments. Even though Portugal, France, Switzerland, Belgium, Austria, Denmark, United Kingdom and World Bank disbursed less than 50 per cent of their commitments, their disbursements exceed the average disbursement level of 31 per cent. 20 However, within environmental aid, more resources go to institutional support rather than direct environmental amenity provision. 21 However, the data for 1996-2010 shows that the cumulative aid committed to address environmental issues was about US$3.145 billion. However, only US$557 million of this was actually disbursed.
21
Figure 3: External aid commitment and disbursement by sector, 1996-2010
Source: Tomo and Givá (2014).
severe flood hit the country and in 2005 when there was a generalized drought across the country. Thus, in the 2000s, aid flows that directly address environmental issues are much localized, mainly concentrated in (2000-01), (2006-07) and in a relatively small amount in (2008-10). This might possibly indicate that the major interventions on environmental issues in Mozambique are especially connected to disaster management. However, it should be noted that almost all the sectors present some degree of environmental considerations.22 It is only the sectors of biodiversity and environment which largely report environmental issues as the principal objective. Other sectors such as agriculture, fisheries, rural development and water resources and sanitation report a high significant consideration of environmental issues. The downside is that there was more consideration of environment in commitments than in disbursements for the majority of the other sectors. Germany leads the list of the most important donors for the environment, followed by Italy and Portugal.
5.3 Kenya
Kenya has received a total of US$25.2 billion in aid during the period 2000 and 2011. The country has experienced relatively unpredictable flows of aid since 2000. The sharp rises in 2009 and 2011 are as a result of increased government borrowing to finance development projects on 22 There are three other related aid objectives which are classified separately from the usual environmental objectives: biodiversity, desertification and climate change. About US$506 million was committed to address biodiversity issues during the period 1996-2010. Agriculture, fisheries and rural development report significant considerations of biodiversity issues. About US$360.5 million was committed to address desertification issues during the period 1996-2010. Agriculture, governance and civil society, and rural development report significant considerations of desertification issues. About US$618 million was committed to address climate change issues during the period 1996-2010. Agriculture, fisheries, minerals and energy, and rural development report significant considerations of climate issues. In fact, in the future, climate change issues will become the top priority in planning.

22
infrastructure as well as increased inflows of grants to support government efforts in social sectors and humanitarian responses to droughts. The largest donor is the World Bank International Development Association (IDA) followed by the United States and the International Monetary Fund (see Table 3).
Table 3: Ranking of the contribution by each of the donors between 2001 and 2012 in US$
Ranking Donor Total commitment (US$)
1 World Bank International Development Association 3,538,952,225
2 United States 3,476,114,748
3 International Monetary Fund 3,286,708,419
4 European Communities 1,241,329,052
5 United Kingdom 1,206,533,083
6 African Development Fund 1,133,604,388
7 Japan 919,674,749
8 France 866,953,537
9 Germany 749,533,535
10 Global Fund to Fight Aids n.a. Source: Nyangena (2013).
To a large extent, each donor independently decides on issues they fund, which inevitably leads to problems of co-ordination and harmonization. This problem has been progressively addressed through various co-ordination mechanisms. Key among those was the development of the Kenya Joint Assistance Strategy (KJAS) for the period 2007-12 by donors working jointly with the government and non-state actors. It provides the basis for the partners’ support for the implementation of the government’s development strategy, including the evolving 2030 Vision. KJAS was prepared collaboratively by the KJAS partners: Canada, Denmark, European Union, Finland, France, Germany, Italy, Japan, the Netherlands, Norway, Spain, Sweden, the United Kingdom, the United States, the African Development Bank, the United Nations, and the World Bank Group.
Among the key thematic areas that KJAS identified as priority a number of them have climate change relevance such as energy; water supply and sanitation services and water resources management; enhancing agricultural productivity and rural development and encouraging sound environmental management.
Environment is a cross-cutting issue and therefore includes expenditures in other sectors that have both indirect and direct impact. For example sub-sectors such as agriculture, fishing and forestry are included in environment, whilst energy is listed on its own. Disaggregation of total aid by sector shows the combined environment sub-sector had a share of 21 per cent (see Figure 4) for the period 2000-11, which amounts to US$5.29 billion.
The funding by donors is provided both bilaterally and multi-laterally and delivered as grants, loans and technical assistance to autonomous projects or through government departments and agencies. There are a number of instances where the finance is channelled through the core budget, for example, the DANIDA funded Natural Resource Management (NRM) programme. The project donors vary from UN bodies (such as UNDP, UNIDO, UNDP, FAO), bilateral donor agencies (such as DFID, DANIDA, Sida, JICA, USAID, FINIDA etc.) and multi-lateral donors (World Bank, AfDB etc.) working in collaboration with the Government of Kenya.
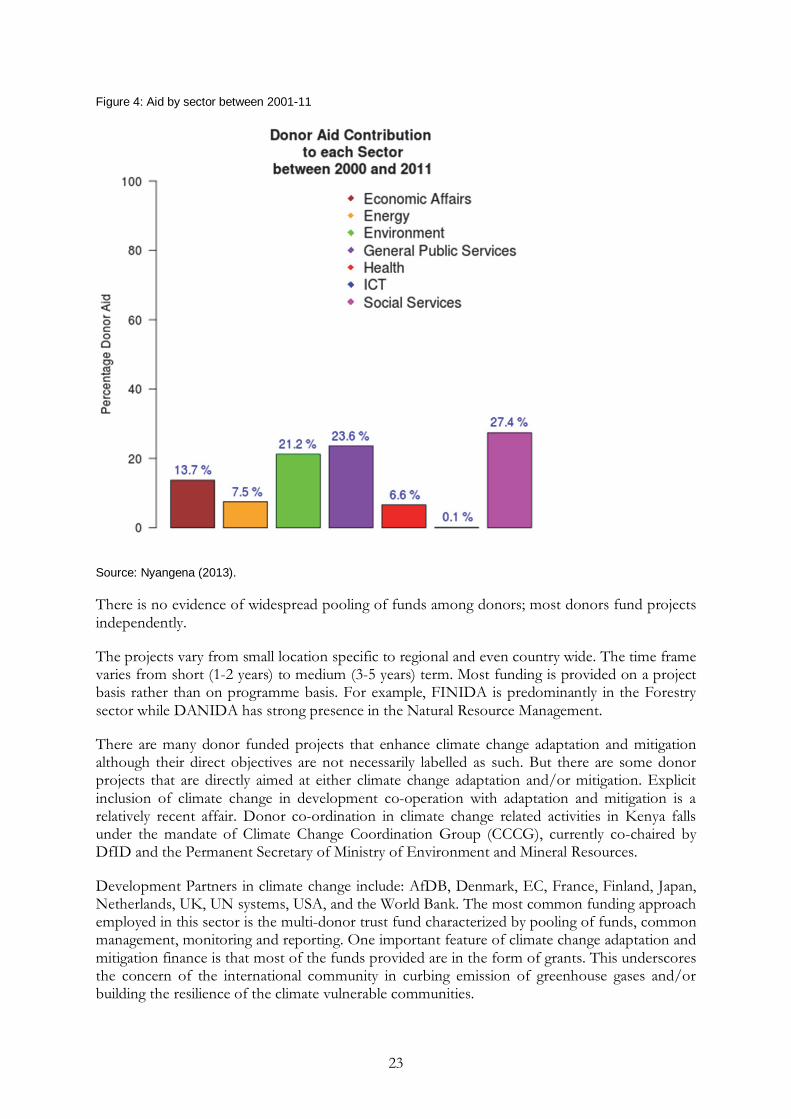
23
Figure 4: Aid by sector between 2001-11
Source: Nyangena (2013).
There is no evidence of widespread pooling of funds among donors; most donors fund projects independently.
The projects vary from small location specific to regional and even country wide. The time frame varies from short (1-2 years) to medium (3-5 years) term. Most funding is provided on a project basis rather than on programme basis. For example, FINIDA is predominantly in the Forestry sector while DANIDA has strong presence in the Natural Resource Management.
There are many donor funded projects that enhance climate change adaptation and mitigation although their direct objectives are not necessarily labelled as such. But there are some donor projects that are directly aimed at either climate change adaptation and/or mitigation. Explicit inclusion of climate change in development co-operation with adaptation and mitigation is a relatively recent affair. Donor co-ordination in climate change related activities in Kenya falls under the mandate of Climate Change Coordination Group (CCCG), currently co-chaired by DfID and the Permanent Secretary of Ministry of Environment and Mineral Resources.
Development Partners in climate change include: AfDB, Denmark, EC, France, Finland, Japan, Netherlands, UK, UN systems, USA, and the World Bank. The most common funding approach employed in this sector is the multi-donor trust fund characterized by pooling of funds, common management, monitoring and reporting. One important feature of climate change adaptation and mitigation finance is that most of the funds provided are in the form of grants. This underscores the concern of the international community in curbing emission of greenhouse gases and/or building the resilience of the climate vulnerable communities.
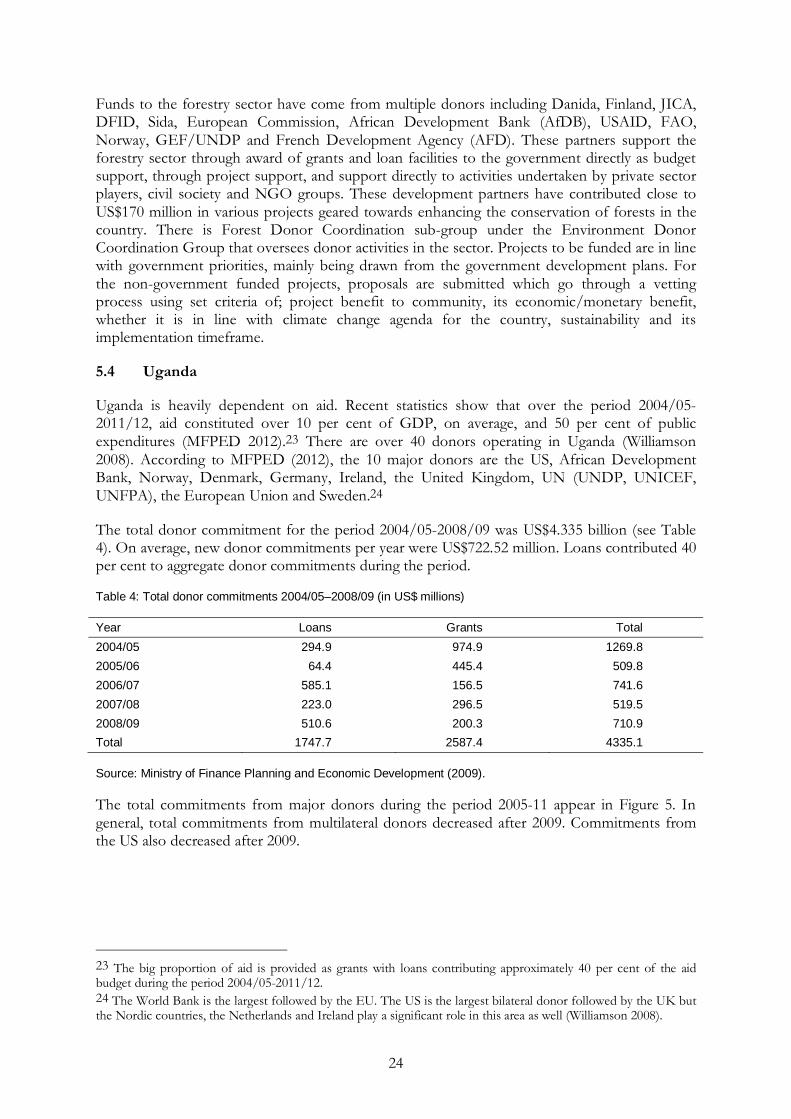
24
Funds to the forestry sector have come from multiple donors including Danida, Finland, JICA, DFID, Sida, European Commission, African Development Bank (AfDB), USAID, FAO, Norway, GEF/UNDP and French Development Agency (AFD). These partners support the forestry sector through award of grants and loan facilities to the government directly as budget support, through project support, and support directly to activities undertaken by private sector players, civil society and NGO groups. These development partners have contributed close to US$170 million in various projects geared towards enhancing the conservation of forests in the country. There is Forest Donor Coordination sub-group under the Environment Donor Coordination Group that oversees donor activities in the sector. Projects to be funded are in line with government priorities, mainly being drawn from the government development plans. For the non-government funded projects, proposals are submitted which go through a vetting process using set criteria of; project benefit to community, its economic/monetary benefit, whether it is in line with climate change agenda for the country, sustainability and its implementation timeframe.
5.4 Uganda
Uganda is heavily dependent on aid. Recent statistics show that over the period 2004/05-2011/12, aid constituted over 10 per cent of GDP, on average, and 50 per cent of public expenditures (MFPED 2012).23 There are over 40 donors operating in Uganda (Williamson 2008). According to MFPED (2012), the 10 major donors are the US, African Development Bank, Norway, Denmark, Germany, Ireland, the United Kingdom, UN (UNDP, UNICEF, UNFPA), the European Union and Sweden.24
The total donor commitment for the period 2004/05-2008/09 was US$4.335 billion (see Table 4). On average, new donor commitments per year were US$722.52 million. Loans contributed 40 per cent to aggregate donor commitments during the period. Table 4: Total donor commitments 2004/05–2008/09 (in US$ millions)
Year Loans Grants Total
2004/05 294.9 974.9 1269.8
2005/06 64.4 445.4 509.8
2006/07 585.1 156.5 741.6
2007/08 223.0 296.5 519.5
2008/09 510.6 200.3 710.9
Total 1747.7 2587.4 4335.1
Source: Ministry of Finance Planning and Economic Development (2009). The total commitments from major donors during the period 2005-11 appear in Figure 5. In general, total commitments from multilateral donors decreased after 2009. Commitments from the US also decreased after 2009.
23 The big proportion of aid is provided as grants with loans contributing approximately 40 per cent of the aid budget during the period 2004/05-2011/12. 24 The World Bank is the largest followed by the EU. The US is the largest bilateral donor followed by the UK but the Nordic countries, the Netherlands and Ireland play a significant role in this area as well (Williamson 2008).

25
Figure 5: Total commitments, major donors 2005–11 (US$)
Source: AidData (2011). Table 5 shows the aid focus areas of the major donors. The sum of the amount of funds committed to listed areas exceeded 50 per cent of commitments from the donors during the period 2005-11.
Table 5: Aid commitment priorities areas by major donor
Donor Major aid focus areas
EU Humanitarian aid, budget support
World Bank IDA Energy (electricity projects), health, and agriculture sectors, and the recovery of northern Uganda
US Food aid and health support, budget support, governance peace and reconciliation efforts
UK Health sector, recovery of northern Uganda, food aid and social protection, and budget support
Source: Aiddata.org database.
There were commitments to environmental protection from Denmark, Norway, the US, IDA and UNDP during the period. However, apart from the UNDP the percentage commitments were below 15 per cent. The donor funds for environmental protection are mainly channelled through the National Environmental Management Authority. These are resources spent on the protection of wetlands, wildlife among others. Donor funding for environmental protection increased between 2010/11 and 2011/12. The World Bank is the only multilateral donor that committed funds to projects aimed at addressing climate change issues during the considered period. The formation of the National Forestry Authority (NFA) was supported by a grant by the World Bank IDA of US$6.42m. The water sector has also received attention from all bilateral donors in the top ten donors though the percentage commitments have been quite small. During the period 2007/8 to 2010/11 donor funding to the water sector steadily declines. It increased in 2011/12. With regards to projects in this sector, the Lake Victoria Environmental Management Project (LVEMP) has been funded by the World Bank for two phases. The project area is Lake Victoria and its basin. The water and environmental sector’s share of disbursed aid ranged between 2 per cent and 7.4 per cent over the period 2006/7-2008/9 i.e. an average of 4 per cent.
0
100000000
200000000
300000000
400000000
500000000
600000000
2005 2006 2007 2008 2009 2010 2011

26
The EU only committed funds to the agriculture and water sectors, but the percentage of total was less than 10 per cent.25 With the exception of Sweden, the UK and Netherlands all the bilateral donors in the top ten donors committed funds to the agriculture sector, though the percentages are quite small. The percentage of commitments to the agriculture sector was 33 per cent in 2010 and that to the livestock sector was 84 per cent in 2008 by World Bank IDA. Donor funding to the agriculture sector exhibits fluctuations during the period 2003-2012. Funding was lowest in 2009/10 and highest in 2010/11. Donor funding for the livestock sector was highest in 2010/11, thereafter it drastically reduces to UGX 2.5bn. Donor funding for the sector was highest in 2005/06 and declines in 2006/07. There are two observations to note about aid to Uganda. First, there have been very low aid disbursement rates both among the multilateral and bilateral donors. Second, a big percentage of bilateral aid has been going to poverty alleviation projects, humanitarian aid and budget support. Budget support is the highest type of assistance Uganda received during the period. The donors that have been active in giving budget support include the World Bank, the EU, the UK, Netherlands, Sweden, Norway, Germany, Denmark, and Germany.
5.5 Tanzania
Just like many other African countries, Tanzania budget expenditure in environment is heavily dependent on donor money. There are three channels through which Tanzania receives aid from its Development Partners (DPs): budget support, common basket funds and project funds. In 2001 nine DPs started to provide budget support to the implementation of the Poverty Reduction Strategy (PRS). In the FY 2007/8 budget support made up 15 per cent of the GoT’s budget. Budget support was provided by 11 bilateral and 3 multilateral donors and the budget support contribution for FY 2007/8 was around US$673 million compared to US$277 million in FY 2002/03. Total grants for the year ending June 2009 declined in relative terms from 6.9 per cent of GDP in 2007/08 to 4.7 per cent of GDP in 2008/09. This decline is primarily attributed to the persisting problems in disbursement of project grants. The declining proportion of general budget support (GBS) in relation to total grants shows that donors are increasingly earmarking their funds and channelling them to specific areas, rather than letting the Government of Tanzania choose where to invest the aid money in line with its development strategy. In the financial year 2010-11, approximately 33 per cent of Government spending was financed by foreign aid.
Currently 12 donors give GBS to Tanzania. They are the African Development Bank, Canada, Denmark, the European Union, Finland, Germany, Ireland, Japan, Norway, Sweden, the United Kingdom, and the World Bank.26 The largest aid contributors to Tanzania are the World Bank, USA, UK and EU. The World Bank and DfID are the main budget support DPs contributing 57 per cent of the total budget support funds. The typical aid picture is presented in Table 6 which shows total ODA for FY2010/11 and FY2011/12.
25 A big percentage of commitments from the EU were for transport infrastructure development. Ireland and the Netherlands did not commit funds to transport infrastructure development during the period. 26 Recently the Swiss and Dutch pulled out of GBS. The UK (DfID) has decreased its GBS and is shifting funds to sector support instead. Finland has indicated that it will decrease the proportion of GBS in its ODA from half to a quarter in the coming years.

27
Table 6: Summary of aid commitment and disbursement for FY 2010/11 and 2011/12
Commitment Disbursement Commitment Disbursement
2010/11 2011/12
S/N Modality US$ US$ US$ US$
1 General budget support 598,393,806 623,243,376 562,090,544 576,948,315
2 Basket funds 366,380,124 381,122,429 430,000,000 292,196,131
3 Direct projects funds 1,478,835,604 878,398,250 1,284,213,264 865,273,976
Subtotal (government implementation
2,443,609,553 1,845,914,572 2,276,303,908 1,734,382,422
4 Non-government organizations
*** 504,431,523 *** 744,807,641
Total ODA 2,350,346,093 2,479,190,063
Source: Kahyarara (2014).
Since mid-2004, the Government of Tanzania has led a process to develop a Tanzania Joint Assistance Strategy (JAS) set in the global context of the Rome and Paris Declarations on aid effectiveness. The Joint Assistance Strategy for Tanzania (JAST) MoU was signed between the Government and 19 Development Partners, including the African Development Bank, Belgium, Canada, Denmark, European Commission, Finland, France, Ireland, Germany, Japan, Netherlands, Norway, Spain, Sweden, Switzerland, UK, UN, USA, and the World Bank. The Development Partners Group (DPG) has prepared a Joint Programme Document (JPD) which provides a common frame in which their individual agency programmes are embedded. The JPD reflects DPG planned support and aid effectiveness commitments to Tanzania over the four remaining years of MKUKUTA, FY06/07-09/10.
Whilst donors continue to allocate funding for climate change, it is currently not possible to capture climate change financing on the government budget. Aid being provided through budget support is allocated by government for national development priorities, with very little of this funding going to climate change activities as such. Where climate change financing is included in wider sector programme it is not yet reported on separately.
Given the nature of forest and its major link with climate change, over the past six years fundamental changes in forest policies, strategies, legislation and institutions in Tanzania have created a conducive environment for a much greater role for non-state stakeholders, particularly villagers, NGOs and community based organizations, as well as wood processors and other private sector actors, in the use and management of Tanzanian forests and woodlands.
5.6 Burkina Faso
The overall development process in the country relies significantly on donors. At least one-third of the financial needs of the new development strategy in Burkina Faso (SCADD) are covered by donors. About US$8.5 billion of aid has been committed to Burkina Faso over the period 1993-2010 with about 30 per cent disbursed. It corresponds to a US$470 million commitment per year on average (AidData 2011). The trend of the aid in Burkina Faso has been on the rise in the last decade (see Figure 6). Some specific variations are remarkable and seem to be closely linked to specific events. For example, commitment and disbursement have considerably increased during most of the drought and flood years: 2005 (after the 2004 drought), 2007-2009 (flood period).
28
Figure 6: Aid trend in Burkina Faso, 1993-2010
Source: Bambio (2013).
At least 50 donors are implementing more than 500 projects per year in Burkina Faso in rural finance, extractive industry, transport infrastructure building, tourism, energy, education, health, environment, etc.27 The principal donors in Burkina Faso during the 2000s decade include the World Bank, European Union, France, USA, the Netherlands, African Development Bank, Germany, United Nations System, Japan, and Canada (see Figure 7).28
Multilateral aid is the most important aid in Burkina Faso. It represents about 58 per cent of the total aid during the 2001-2011 period. About 70 per cent of the total aid has been received as direct aid, compared to concessionary loans. Table 7 gives the core areas of focus of the top four donors. Donors attach high priorities to some sectors as education, agriculture, health, or economy (see Figure 8). The amounts committed by donors in these sectors are usually disbursed. However, there is a deviation most often between the commitment and the disbursement in other sectors. The total commitment and disbursement amounts during 1994-2010 are US$3.552 billion and US$1.143 billion respectively, corresponding to a 32 per cent disbursement rate.
27 The donor countries include Germany, Austria, Belgium, Denmark, France, Italy, Luxembourg, the Netherlands, Sweden, Switzerland, USA, Canada, Cuba, Morocco, and Taiwan. Bilateral and multilateral donors include the United Nations System (UNS), the World Bank, the African Development Bank (ADB), the International Monetary Fund, and the West African Development Bank (WADB). 28 The World Bank, European Commission, USA, UNS, and ADB were the five main donors of Burkina Faso in 2011.
0.0
200.0
400.0
600.0
800.0
1000.0
1200.0
1400.0
1600.0Aid (US$ million)
Year
Aid in Burkina Faso
Commitment Disbursement

29
Figure 7: Principal donors in Burkina Faso, 2002-2010
Source: Bambio (2013).
Table 7: Core areas of focus of the top donors in Burkina Faso, 1993-2010
Donor Strategic priorities Shares of core area
(%)
World Bank IDA
Economic and development policy 37
General budget support 20
Transport and storage 15
Government administration 10
Energy supply 6
European Communities
General budget support 61
Road transport 17
France Debt forgiveness 16
General budget support 14
Higher education 7
Water supply and sanitation 7
United States Road transport 31
Food security 26
Agricultural water resources 16
Multi-sector aid 17
Basic life skills for youth and adults 5
Public sector policy and administration management 5
Source: AidData (2011).
World Bank, 26%
European Union, 21%
France, 13%
USA, 10%
Nertherland, 9%
African Development
Bank, 6%
Germany, 5%
United Nations System, 4%
Japan, 3% Canada, 3%

30
Figure 8: Level of aid funding, 1993-2010 (nominal US$ million)
Source: Bambio (2013).
Donors are sensitive to environmental issues as the relationship between the environment and poverty is very high. However, only about 1.5 per cent of aid has been allocated to environmental activities. The total commitments and disbursements to environment sector in 1993-2010 are US$69 million and US$36 million respectively, corresponding to about 52 per cent of disbursement rate. Aid to environment sector in Burkina Faso is relatively small considering the challenges to be dealt with and the weakness of the Government’s contribution in this sector. However, it is challenging to separate aid data on funds allocated to environment as this sector cuts across other sectors.29 As expected, Environment (85 per cent), Rural Development (28 per cent), Agriculture (20 per cent) and Water (12 per cent) are the main sectors that have the environment as a principal consideration. Peace and Security, Urban, Civil Society, and Administration also have a significant environmental regard although the Fisheries and Industry sectors seem to take environmental issues into account less than expected. The environment sector could be considered as a medium priority for donors. This sector is ranked at the 9th, 11th, and 6th positions (out of 19) in terms of the number of projects, the commitment and the disbursement rate respectively. The main donors in the environment sector in the 2000s decade include the World Bank, Global Environment Facility, Arab Bank for Economic Development in Africa, USA, and the African Development Fund.
5.7 Ghana
The International Development Association (IDA), US Millennium Challenge Authority (US-MCA), African Development Fund (ADF), China Exim Bank, China, FORTIS, SOGE, Canada, KBC Bank, European Union (EU) and United Kingdom (UK) are the major aid providers in terms of total resources provided from 2008-2011 in order of decreasing resources provided. 29 At least half of the sectors have consideration for biodiversity in their project design and implementation. A few other sectors, including Rural Development and Industry, have some regard for climate change. Desertification is gnawing the country land at a high speed from the north to the south and, surprisingly, it is not a principal or significant objective for most sectors funded by donors.
0102030405060708090100
0
100
200
300
400
500
600
700
800
Commitment Disbursement Level of disbursement

31
The total aid for Ghana for the period 2000-11 was US$16.159 billion. Disbursement of total external aid has consistently increased from about 992 million US dollars in 2000 to about US$2075 million in 2011 at an annual average growth of about 12 per cent. Loans constitute the majority of external aid increasing from about US$704 million in 2000 to about US$1364 million in 2011 at an average annual growth of about 15.0 per cent while grants increased from about US$288 million in 2000 to about US$711 million in 2011 at an average annual growth of about 16 per cent. Overall, loans form about 60 per cent of all external disbursement from 2000 to 2011. The total aid to the environmental sector for the period 2000-11 was US$1.714 billion. External aid disbursements to environmental sectors have increased from about US$85 million in 2000 to about US$220 million in 2011. Loans have exceeded grants in all the years apart from 2001, 2006, and 2007 where grants exceeded loans. Over the period under consideration loans have formed about 57 per cent of all disbursements to environmental sectors with the remaining (43 per cent) being grants. With regards to the MESTI which is the main ministry in charge of the environment, total disbursement to the ministry from 2000 to 2011 amounted to about US$83.4 million with about 86 per cent being loans. Effort is being made by donors to put more grant into environment related activities than loans. The share of grants that went into environmental related sectors increased from about 13.5 per cent in 2001 to about 18.3 per cent in 2011, while the share of loans that went into environmental related activities decreased from about 6.5 per cent in 2000 to about 0.2 per cent in 2011. Overall the share of external aid (loans and grants) that went into environmental-related activities increased from about 8.5 per cent in 2000 to about 17.1 per cent in 2011. The share of environmental aid to total aid for the period 2000-11 was about 10.6 per cent. A few other sectors would naturally have positive environmental impacts by accounting for biodiversity, climate change and desertification.30 In order to ascertain if indeed commitments made by donors are actually disbursed and if disbursements to the environmental sector are higher than non-environmental sectors, we use information from the AidData. The dataset provides information on both commitment and disbursement amounts in constant 2009 US$ for each project. Generally one could observe that the disbursement rate of less than 41 per cent for environmental, non-environmental and overall disbursement for all the decades is quite low. This may indicate that donors are not fulfilling their commitments or recipients are not doing what they should do for donors to provide support or a combination of both. Possibly the increase in the disbursement rate in the decade 2001-10 may be attributed to the introduction of the Heavily Indebted Poor Countries’ initiative and the associated development of Poverty Reduction
30 Sectors such as water, fisheries, agriculture and infrastructure have a somehow significant consideration for environmental concerns in the implementation of their projects even though arts, culture and recreation sector has the least regard for the environment. A few other sectors also consider biodiversity issues although it is worrying that more than half of the sectors regard biodiversity as insignificant and hence would not factor biodiversity conservation measures in their sectoral policies. The environment, infrastructure, water, agriculture and administration sectors consider climate change to be a principal objective. The urban, education, civil society and health sectors consider climate change to be significant but not principal. There are about nine sectors which have no regard for climate change issues in their sector policies. The health, infrastructure, industry, civil society, rural development and administration sectors consider desertification as significant while gender, communication, peace and security, arts culture and recreation, fisheries, economic development, emergency aid and the urban sectors do not consider desertification in any of their projects.

32
strategies as well as the introduction of the Multi-Donor Budget Support that to some extent streamlined the disbursement of aid from both the donor and the recipient sides. An important observation is that the disbursement rate to the environmental sectors is lower than the other sectors for all the decades except 1991-2000, indicating the dearth of aid in the sector.
5.8 Senegal
The total aid for Senegal for the period 1993-2010 was estimated at US$7.408 billion while the share going to the environmental sector during the period 2000-2010 was US$397.07 million. The level of commitment and disbursements for the various sectors is shown in Figure 9.
Figure 9: Level of funding (nominal US$-millions) in Senegal from 1993-2010
Source: Ngaido (2014).
The most noticeable change concerns the shift of the economic development sector, which was classified in the second group because it had 498 projects, but received the highest level of funding commitment (US$1839.17 million) as well as the highest disbursement (US$1146.09 million). This sector also had the second largest highest disbursement rate of 62.32 per cent on average. These results are consistent because economic development is a crosscutting objective and a high priority. The environment sector comes at the 9th place at the level of funding commitment US$455.613 million and received effectively US$158.864 million. This disbursement rate was about 34.87 per cent. Such low disbursement suggests that there is constraint somewhere and may have negative effects in the capacity of the ministry to address very difficult issues.
Three sectors (Emergency Aid/other support, Education, and Economic development) received about 50 per cent of committed grants. Agriculture and environment received respectively, 6.861 per cent and 5.241 per cent. In addition, all grants were either full grants or co-shared. The grants were classified into three categories. The first category was the high level grants, where the

33
donor provided between 70 per cent and 100 per cent of the financial resources and the beneficiaries were expected to provide 30 per cent. The second category included the mixed portfolio where by the donor provided between 26 per cent and 50 per cent and the beneficiary 74 per cent to 50 per cent. The third category was grants between 50 per cent and 70 per cent. The majority of the grants (92 per cent) are more than 70 per cent. The grants where the GoS provided a higher share of the funding accounted for 8 per cent. The economic development and education sectors received the highest committed grants, US$1449.356 and US$1287.863 million, respectively. Moreover, the sectors, which received all the types of grants (agriculture, economic development, infrastructure, environment, water, industry, and urban), totalled 50.55 per cent and the remaining sectors received 49.45 per cent. This suggests that most of the projects are grants and should not be affected by constraining requirements.
The environment is a cross-cutting issue that interests all the various sectors. And since the 1990s, all the different sectors have been mobilizing new projects and integrating environmental issues on those projects. The AidData has a very interesting variable called environment. This variable classifies whether or not environment is significant or principal consideration and for Senegal it largely is principal or significant in all sectors except three (education, economic development and peace and security). Besides the environment itself, some sectors consider biodiversity as insignificant. The groups whose funding does not have anything to do with biodiversity are health, infrastructure, other, gender, peace and security. Biodiversity, however, is the significant and principal objective for funding in all the remaining sectors. The highest level of biodiversity consideration of more than 70 per cent was in funding for rural development. The results show a very interesting pattern. Amongst all the 19 sectors, except for the peace and security sector, the findings suggest that the environment is either a principal or significant or both. However, such significance is at varying degrees of importance. The highest one which is above 70 per cent was rural development, which recorded more than 70 per cent. The environments, civil society, urban, are considered as principal with about more than 50 per cent. This is an interesting indication and confirms the increasing trend of NGO involvement in NRM management following the various devolution and decentralization processes that are requiring communities to take over or directly contribute in the management of their forests and pasture resources.
The sectors could be classified into three main groups. The first group, which included all the sectors where climate change was not considered significant or principal, was peace and security, communication, other, administration. The second group was composed of the health, aid, emergency aid, rural development, arts, culture, recreation, and gender sectors. The findings show that, at varying degrees, that climate change was significant in the projects. But the highest share was for the Economic development, rural development and gender had the highest rates showing that climate change is principal. The remaining group, composed if the education, agriculture, water, industry, environment, civil society, and fisheries considered, for more than 50 per cent, that climate change was both principal and significant.
In the data set we focus directly on 462 environmental projects and programmes. The overall commitments were about 455.613 million US$-nominal which accounted for 4.36 per cent of the overall projects. Moreover, 388.269 million of the commitments were grants, representing 85.22 per cent of the overall commitment to the sector and 5.241 per cent of all the grants. The total disbursement in the sector was about 158.864 million dollars, which accounted for 34.87 per cent of the commitments. This rate of disbursement was ranked 10th. Agriculture’s rate was 38.7 per cent, water’s 22.44 per cent, fisheries’ 25.82 per cent. It was surprising to find such rate of
34
disbursement compared to education which accounted for 60.37 per cent, health 50.38 per cent, economic development 62.32 per cent. However, we found a lot of discrepancies, especially in those sectors related to environment where all of them were below 50 per cent disbursement.
The data suggests that the 2003 levels of commitment and disbursement were the best as even when funding increased, in 2004 and in 2005, in 2007 it dropped and went back to the 2003 level of US$11.44 million. A look at the evolution of projects funded over time shows that we are having a structural change of the implementation of the environmental related projects. Indeed many new stakeholders are taking over some of the activities especially when it comes to community development by many different NGOs. Therefore we are having smaller projects rather than big ones. If such a change is increasing the efficiency of project implementation, that would be great. More than 85 per cent of resources committed to the environment were under the forms of grant. Overall, only 34.87 per cent were dispersed for project implementation. The donors can be classified into three groups. The first group is those who committed but did not disburse the money. The total amount of commitments was US$15.4 million (3.38 per cent of commitment). The second group is the most interesting one because they have the highest level of commitment US$265.71 million (58.32 per cent of commitment), but they disbursed only US$20.86 million on average. One would say that the Netherlands, which had US$202.275 million commitments, but only disbursed US$29.483 million. The third group is the countries that disbursed more than 50 per cent of their commitments. The total commitment of that group is about US$174.02 million (38.30 per cent of commitments), but they disbursed 79.14 per cent of their commitments. The highest donors are France, Japan, and Spain.
6 Case studies of projects
The study made an attempt to zoom-in on few environmental projects in the selected countries to provide evidence on whether they had actually been implemented and what their success status had been. Thus, we will briefly discuss which key environmental projects were successful and unsuccessful in each country and draw conclusions on what determines success or failure of environmental projects. In other words, this section provides an attempt at ground-truthing environmental projects!
6.1 Botswana
Three development partners were asked about their perceptions on successful projects and the reasons why these projects were considered to be successful. Table 8 presents the responses from the interviewed donor agencies.
As can be seen from Table 8 the majority of the successful implemented projects by GEF and UNDP are environmentally related projects, and the communities or stakeholders or beneficiaries have played important roles in the success of these projects. The key factors that contributed to the success of projects in Botswana included high counterparts’ ownership towards a project; the degree of skills/capacity of counterparts to implement the project; the involvement of the beneficiaries as leaders of the project on a voluntary basis; the target beneficiaries should be aware of the benefits of the project; strong support institutional support outside the community; adequate financial resources; projects should address key development

35
Table 8: Successful projects implemented by the donor agencies in Botswana
Donor agency Successful project(s) Reason
European Union
Human Resource Development Programme
Has contributed to the improvement in the technical skills of public employees in Botswana
The Bicycle for Education Project School enrolment has increased, absenteeism reduced and secondary schools’ public exam results improved
Waste Recycling Project in Mochudi
Because of community participation, partnership with the private sector and regular consultations with the authorities
Global Environmental Facility
Integrated Water Resources Management
Increased water use efficiency
Strategic Partnership to improve the operational sustainability of protected areas
Periodic engagement with all the stakeholders (Multi-stakeholders) and dealt with critical sustainable development issues
UNDP Renewable Rural Electrification Project
Contributed to rural communities accessing solar energy, and has facilitated the discourse on renewable energy in the community
Source: Juana (2014).
issues which are also included in national priorities; good monitoring tools, formation and co-ordination of project implementation committees; that projects should address key development issues; and wide participation of relevant stakeholders, political will and commitment among key drivers and beneficiaries.
It is clear that for projects to succeed, the beneficiaries should be part of the implementation process, and acclaim ownership of such projects. As such, even when the implementation phase is over, there are higher chances that the beneficiaries will design methods of sustaining the project and its benefits. The responses also show that the projects should address key development issues that are highly prioritized by the national government. Furthermore, the successful implementation of projects requires an effective and efficient monitoring and reporting system at all the implementation phases.
With regards to the failed environmental projects implemented by the donor agencies, only the European Union reported that the Women’s Empowerment for Natural Resources Based Livelihood in Kasane has failed. The project failed because of the slow take-off, and that the planned implementation time ran out before the relevant activities were done.
6.2 Kenya
The active development partners in the water sector have committed about US$950 million towards water and sanitation projects in the country. Notable contributions have come from the World Bank, KfW, Japan, AfDB, and AFD. Currently Athi Water Services Board (AWSB) and Coast Water Services Board (CWSB) are supported by the World Bank and AFD, Lake Victoria North Water Services Board (LVNWSB) is supported by the WB and KfW while Rift Valley Water Services Board (RVWSB), Lake Victoria South Water Services Board (LVSWSB), Tana Water Services Board (TWSB), Nairobi Water Services Board (NWSB) and AWSB are supported by the African Development Bank (AfDB). Other donors to the sector include EU, Sida, Danida, UNICEF, Government of Netherlands, United Nations Fund for International Partnerships (UNFIP), Government of Finland (contributing to the Water Services Trust Fund)

36
and UN-Habitat. Most of the funding is implemented by the respective water services boards except for the sector wide or regional projects which are executed by the Ministry of Water and Irrigation, donor agencies or NGOs. A closer look at the donor projects implemented for the water sector indicates that over 60 per cent have targeted urban water supply and sanitation. The rest of the projects have had rural, regional or national coverage. The World Bank is by far the largest financier to the sector followed by KfW according to the 2009 available statistics. About 84 per cent of the funds are provided as loans, of which bilateral arrangements dominate, while only 16 per cent are provided as grants. Collaboration of the donors in the water sector has been scaled up with the formation of the Water Sector Technical Group (WSTG) which meets once every two months. The group is currently chaired by KfW.
The African Development Bank notes six success factors for a water and sanitation project as:
a) Adequate audit and oversight arrangements;
b) Adequate funding for exhaustive site investigation to avoid increases in measured work and engineering claims during project implementation;
c) Incorporating recommendations of project panel of experts in dam design before tendering;
d) Close monitoring of the conditions related to land acquisition to avoid delays and escalation of costs;
e) Adequate allowance for increased physical and price contingencies; and
f) Proper sensitization of communities about resettlement and compensation arrangements (AfDB 2009).
6.3 Uganda
The Trees for Global Benefits project has been the most successful because it is community-based, the long term returns to community involvement in terms of enhanced income sources and farm diversification attract the loyalty and commitment to the project goal.
The worst project is the Agricultural Extension. The problem here was governance. The project was implemented in the period when the country was carrying out decentralization, and the scaling down of the public sector staff. Districts lacked specialized officers to carry out the project assignments.
6.4 Tanzania
In January 2003, the Forestry and Beekeeping Division (FBD) of the Ministry of Natural Resources and Tourism (MNRT), with funding support from the Danish Ministry of Foreign Affairs (Danida), initiated a five year programme on Participatory Forest Management (PFM). The programme is co-financed by the World Bank (WB) and the Ministry for Foreign Affairs (MFA), Finland. The donors have allocated support to various districts and through different programmes. Danida’s support organized as a PFM component of the MIFRESTA Environment Sector Programme. Further funding has been earmarked for continued PFM activities under the new Danida Environmental Sector Programme Support (ESPS). The content and extent of this new PFM allocation has not yet been described in details, inter alia awaiting the outcome of this joint review. The WB supported the national PFM framework through a PFM Sub Component (1.2) of Tanzanian Forest Conservation and Management Programme (TFCMP), which was terminated by the end of 2009. Districts are being supported through a financing window in the Tanzania Social Action Fund (TASAF II).

37
Finland provided PFM support to districts through the National Forest Programme, and is presently in the process of deciding on its support to the National Forest and Beekeeping Programme (NFBKP II). There is thus a need for assessing how the NFBKP II (2008/09-2010/11) as well as other MFA Finland funded tree planting programmes best can be integrated into PFM, so funds could be earmarked for PFM if feasible. The project outcomes were as follows:
o The PFM guidelines have been prepared, and only the Joint Forest Management (JFM) Guideline is pending final endorsement by the Ministry of Finance (MoF) with regard to the benefit sharing between villages and the central government.
o District staff and villagers have been trained in applying PFM which they now do with apparent success and enthusiasm in at least 63 districts in about 14 per cent of all Tanzania’s villages covering 4 million hectares of forest or 12 per cent of Tanzania’s forest cover.
o There seems to be a positive impact on the environment, and villagers are gradually, but slowly, benefiting from income generating activities and revenue from the forest.
The change of forest management paradigm under new forest policy and legislation has enabled local communities to have more responsibility in forest management under PFM. Based on PFM goals, its progress can be assessed with regard to (1) improved forest quality and condition; (2) enhanced livelihoods; and (3) improved forestry governance. Local livelihood enhancement is through increased forest revenues and secured supply of subsistence forest products. This goal is directly linked to the National Strategy for Growth and Reduction of Poverty (Swahili acronym: MKUKUTA). The proportion of household subsistence and cash based income derived from harvesting, processing, marketing and sale of forest products is another outcome indicator under this goal. The project by 2010 reached 15 per cent of household subsistence and cash income should derive from forest products. Tree planting, though not systematically dealt with in PFM, is an important mean of supporting the villagers. The districts often provide seedlings and advice to the communities on how and where to establish woodlots on community land. Since tree planting provides opportunities for community benefiting, and also adds to improvement of the environment, there is scope for including tree planting in the PFM guidelines as one of the important means within PFM for both compensating and adding to the livelihoods of the villages in question.
6.5 Burkina Faso
No specific projects were inspected. However, interviews with stakeholders suggested the factors that are positively linked to the success of environmental projects, while some others would contribute to the failure of the environmental projects.
• Success factors of environmental projects in Burkina Faso o strong political lobbying for project success, o capacity building in project management, o implication and motivation of technical staff, o implication of local private sector, o participation of stakeholders, including main beneficiaries, o consideration of compatible basic needs in environmental resources for local
population.
38
• Failure factors of environmental projects in Burkina Faso
o poor understanding of the issue by the project implementers, o poor knowledge of local realities, o weak adaptation of the environmental investment plan to local concerns, o insufficient competence or experience of implementing institutions, o inappropriate communication plans with the local community, o low appropriation of the project by beneficiaries, o conflicts of interest between the project stakeholders, o weak motivation or reticence of some stakeholders of the project, o weak transparency in the management of the project funds, o accommodating environmental project design, without real conviction, and just
willing to benefit for donor’s funds.
6.6 Ghana
To assess the factors that underline the success and failure of environmental projects, DPs were asked to provide the names of two environmental projects that have been successful and two environmental projects that have not been successful as well as the factors behind the success or failure. Many of the DPs were able to mention environmental projects that were successful and the majority of them were in the agriculture and forestry sectors and linked to rural communities. Success factors of the projects include increased incomes and jobs creation potentials of projects, strong commitment by Ghanaian counterparts, good relationship of Ghanaian and foreign teams, quick and visible impacts, emphasis on the development of the capacity of youth and women, ownership and buy-in of key stakeholders and partners at all levels, leadership and commitment, involvement of both senior management and technical staff, collaboration and partnerships, knowledge and use of the right steps in implementation and the creation of awareness. Factors that led to the failure of projects included technology to be used by the project alien to the community and the poor knowledge of consultants on local environment. About half of the DPs also believed that their views on success or lack of projects are shared by the host country whereas the remaining (50 per cent) shared the opposing view, indicating that there exist some tension between DPs and the country.
6.7 Senegal
A subset of the projects (207 projects), which had dating information were selected for this analysis. The majority of the projects, about 155 (74.88 per cent), were mainly one year projects. The projects ranged from one year to nine years.
Moreover, the same projects were reorganized to see the target activities of the funding and to potentially draw some lessons to help understand the potential affects coming from the funding. We distinguish into three groups. The first group is knowledge-base, policy, administration, and management. The second group are linked to production and development. The remaining are those that have larger and global issues like river development. The first group had about 86 projects, about 54.11 per cent of the whole projects US$75.867 million of commitments and received about US$25.403 million which equals to 33.48 per cent of disbursement rate. The second group had 44 projects with US$40.766 million of commitments. The disbursement rate was about 15.83 per cent. The third group had about 50 projects and received US$24.387 million. This group received US$21.745 million which equals to about 89.17 per cent disbursement rate.
39
Most resources are going to environmental policies. Looking at this we see the areas where there is higher funding: forestry policy (US$18.259 million), forestry development (US$21.995 million), side preservation (US$23.51 million), and biodiversity (US$15.623 million). This clearly shows that the focus of the environmental sector is in the forestry.
The analysis of the financing of the environment in Senegal suggests three interesting trends: (1) the focus on the forestry sector, which received most of the funding and a heavy emphasis on the policy and research; (2), the crisis management which is characterized by more commitments and disbursements during the years of crisis than in the other years; and (3) the structural changes that are happening since 2007, with the increasing number of small projects.
7 The impact of aid
To reiterate, this study seeks to determine what aid flows have actually been doing and are doing on the environmental sector in Africa. We have reported the dynamics of aid flows in the selected countries. This section reports results from the surveys which were conducted with donors in some of the selected countries on their perceptions of the impact of aid on the environment.31 One of the main impacts of aid coming through from the donors responses has been the benefits associated with mainstreaming environmental issues in all projects. Even though the primary focus of most donors seems to be in disbursing non-environmental aid, environmental objectives are necessarily taken into account in order to prevent unintended harmful effects. Depending on the nature of projects, aid has often provided enhanced income sources and farm diversification; for example, with tree planting projects, they have provided these benefits but also resulted in positive biophysical changes on the environment.
7.1 Botswana
Four donor agencies namely the European Union (EU), Japan International Cooperation Agency (JICA), Global Environmental Facility (GEF) and the United Nations Development Programme were interviewed.32 The European Union started providing aid to Botswana in 1975. The Japan International Cooperation Agency started in 1986, Global Environmental Facility in 1992 and UNDP in 1975. Three of these donor agencies are engaged in the environment, agriculture, forestry and fishing sectors.
All the four respondents consider the environment as an important sector in sustainable development, with three of them stating that it is very important and one of them rating it as moderately important. However, these responses are not consistent with the general donor aid disbursements which show that only 1.68 per cent of the total aid disbursement goes to environmental projects. The possible reason is that all the main donor agencies interviewed have been engaged in some level of environmental interventions, while the majority of those who
31 The intention was to implement a common survey instrument in all countries but only a few country teams were successful in getting responses from the donors. It was really challenging to engage the donors in this work. Most of them are very bureaucratic with restrictive policies on information sharing; it took significant effort and persistence to reach appropriate contact persons who, even after following all the requested procedures, eventually did not respond positively. Aid data tends to be rather political in some of the countries and as such independent researchers can encounter difficulties in convincing both donors and recipients to declare aid data and perceptions about progress of aid projects. 32 Seven out of the ten top donor agencies were approached for interview. Some of the organizations referred us to the head offices in their respective countries. Therefore, the analysis presented below reflects the opinions of only those donor agencies that were willing to respond to the questions.

40
were not interviewed have no environmental projects on their list of interventions in the secondary data collected from MFDP.
Two of the respondents indicated that they spend less than 20 per cent of their aid disbursement on the environmental sector while another spends between 61 and 80 per cent and the last one between 80 and 100 per cent. Those who disbursed less than 20 per cent of the funding to the environmental sector explained that their organization’s focus area is not the environment and that they tend to fund government’s priority sectors. Those who disbursed above 60 per cent of their funding to the environmental sector did so because (i) either the agency exclusively funds environmental projects or because they think the environmental sector is not receiving enough government’s funding, and (ii) they stand for sustainable global, regional and national development, which they see lacking in government’s development funding budgets.
The donor agencies measure the successes or failures of their projects/programmes in any of four different ways: (i) Projects are evaluated from the views of relevance, effectiveness, efficiency, impact and sustainability. Where these criteria are not satisfactorily met, the project is not considered to be successful. Conversely, when the criteria are met, the project is rated as successful. (ii) By using post programme evaluation to see whether or not the pre-programme objectives were achieved. (iii) Measure projects success in terms of project outputs and compare these outputs to the predetermined targets, and (iv) Through the positive contribution the project/programme makes to government policy objectives.
All the four donor agencies said that their interventions have had no negative impact on the environment.
7.2 Mozambique
The development partners perceive environmental aid as all the funds linked to projects dealing directly with natural resources management and/or that include environmental considerations in their implementation. Both environmental and non-environmental objectives require serious consideration as the country still has very high levels of poverty incidence and high needs in basic services for economic development. Therefore, the view of development partners is that non-environmental sectors require more support than environmental sectors. However, given the increased dependency on natural resources extraction, appropriate considerations to environmental issues posed by any economic sector are increasingly becoming more relevant. Environmental issues need to be mainstreamed in all development efforts, and all the sectors of the economy should have environmentally sound policies and environmentally friendly practices. The development partners perceive a high importance of environmental consideration in their support. The priority sectors for environmental considerations in Mozambique were Agriculture, Forestry, Land, Extractive Industry, Water and Fisheries, in that order.
Overall, the interviewed partners indicated that less than 20 per cent of their aid funds addressed environmental issues. However, they recognized that it was actually difficult to clearly disaggregate the environmental funds as mainly the funds were directed to support the overall budgets either at national or provincial level, or even more decentralized levels, rather than targeting specific sectors or projects. In this context, it is really difficult to indicate the actual share addressing environmental issues, as the environment is crosscutting and usually mainstreamed across sectors.
The development partners were asked to assess the impact of different types of aid on both welfare and the environment. The results indicate that all types of aid are generally considered to be effective in enhancing both welfare and the environment. However, non-environmental aid

41
tends to have a higher impact on welfare than on the environment. By design, both types of aid can have undifferentiated impacts on welfare33 though the effectiveness of environmental aid on the environment could be relatively higher when compared to the other type of aid.
The success factors of aid projects included visible impacts in the specific targets such as: increased access to land resources; increased awareness regarding country land legal framework and rights; increased access of potable water and improved sanitation, increased adoption of improved agricultural technologies. In addition, the projects were able to spin-off other development initiatives at local level, that have effects in other broader development issues such as nutrition, food security, among others.
The key drivers for getting a good impact from projects identified by the development partners in the country include: (i) the use of combination of demand and supply driven approaches in the allocation of funds which allow for the alignment of partners priorities to local priorities and to meet critical needs; (ii) environment enabling close dialogue/relationship with partners at all levels.
On the other hand, the lack of data and transparency, the weak multi-sectorial co-ordination and the poor technical capacity for implementation are the major obstacles to the success of aid projects identified by the development partners.
7.3 Uganda
Only two donors were interviewed: the World Bank and the United Nations Development Programme (UNDP). The proportion of funding to environmental sectors from UNDP has ranged between 13-22 per cent over the last six years. The UNDP’s priority areas in the environmental sector have been sustainable land management, forests, wetlands and climate change. Sustainable land management has the first priority because there is massive land productivity decline across the country, and agriculture is the backbone for industries and many household livelihoods heavily depend on it. Enhancing land productivity will increase available raw materials to agro-based industries as well as improving household earnings and ensure food security. There is an ongoing sustainable land management project running in the cattle corridor. The objective is to introduce farmers in the corridor to conservation agriculture with minimum tillage in dry land. Forestry is the second area of importance that the institution focuses on. Forest management projects have been implemented to increase forest coverage in eastern Uganda to curb land-slides. Tree planting projects have been implemented to support biodiversity and ecosystem management, increase energy sources, and to ensure that the eco-functions of forests are sustained. The link between forests, energy supply, water purification functions, climate change and eco-tourism is the main factor contributing to the weight this area commands. Wetlands are prioritized due to their linkage with water quality and quantity while climate change adaptation and mitigation gets attention because it cuts across everything else. The World Bank’s Sector Distribution of Uganda Portfolio for the last five years appears in Figure 10. The Energy and Mining, Transport and Urban development sectors have dominated funding over the period. The Water and Agriculture sectors both received funding amounting to 9 per cent each. Environmental protection per se received only 0.5 per cent of the World Bank’s total funding during the period.
33 These findings are consistent with current development planning that set poverty alleviation as an ultimate goal of aid.

42
Figure 10: World Bank sector distribution of Uganda portfolio
Source: World Bank (2013). Both donors revealed that they aim at giving support to Uganda to address the country’s most pressing needs aimed at reducing poverty and inequality and fostering economic growth. Thus to a greater extent the aid they give is demand driven. The proposed priority areas for future funding are water resource management, land management and climate change. The choice of these priority areas is mainly driven by the overarching goal is poverty reduction. Both donors revealed that in many of the projects the eventual impacts of environmental aid have been in line with the objectives for which the aid was intended. The most successful projects have been those geared towards poverty alleviation. As a result Uganda has already achieved the MDG target of reducing the specified proportion of people below the national poverty line.
7.4 Ghana
Ghana has also not benefited immensely from funding for environmental activities, more specifically climate change activities due to lack of awareness of the existence of such facilities and the country’s ineligibility. In many cases, funds pursued are not approved by fund administrators due to procedural flaws and the inability to demonstrate institutional competencies in managing funds.34
Six development partners (DPs) were interviewed. Four of the DPs were of the view that non-environmental sectors require aid the most. The reason given for this view was that the core goal of the country is poverty reduction which requires expanding economic opportunities for the
34 For example information from Climate Finance indicates that the country has successfully secured only about US$21.3 million over US$30 billion pledged for climate change related actions globally. These funds, designated for five mitigation and three adaptation projects were sourced from four of the more than 25 international public funded initiatives since 2008.
43
poor through job creation. It was also argued that the non-environmental sectors such as education, health, infrastructure, etc., are more focused in the Ghana Shared Growth Development Agenda (GSGDA) than the environmental sectors and therefore it is easier to provide aid to those sectors. Also, DPs were of the view that environmental issues are cross-cutting and are factored into projects meaning that they are indirectly taken into consideration in development. However, on the average, the DPs believe that the environmental sector’s need for aid is important. The DPs interviewed were asked to indicate the percentage of their aid to Ghana that can be classified as environmental aid. Two DPs each had allocated between less than 20 per cent and 21-40 per cent of their aid to the environmental sectors while one each had allocated between 41-60 per cent and 81-100 per cent. As expected, UNEP had allocated between 81-100 per cent of its aid to the environment. Half of the DPs responded that their decision to provide aid to a specific sector is demand driven while the other half said it was supply driven. Five of the six DPs believe that non-environmental aid has environmental impacts and they consider the environmental impacts of non-environmental aid in their decisions to grant non-environmental aid. On a Likert-scale of 1 to 5 (1 - low and 5 very high), the average ranking provided by DPs on their environmental consideration in relation to other considerations in their decisions to extend non-environmental aid was 4, indicating that environmental considerations are high in their decisions to extend non-environmental aid compared to other issues. This assertion is consistent with the law as every project in Ghana should undergo Environmental Impact Assessments. On a Likert-scale of 1 to 5 (1-not effective and 5 more effective) DPs were asked to assess the impact of overall, non-environment and environmental aid on welfare and the environment. The results showed that DPs rate the impact of non-environmental aid to be higher than overall aid and environmental aid. This probably may be the reason why they believe non-environmental sectors require more aid than the environmental sectors. Four of the six DPs also reported that the different kinds of aid (i.e. environmental and non-environmental) are yielding the expected results. DPs were asked to provide five environmental sectors that should be prioritized and the reasons for the prioritization. Environmental issues related to land-based natural resources:
green and sustainable agriculture; protection of water bodies and aquatic resources; forest restoration and conservation; urban (waste) management; mining; climate change; biodiversity; invasive aquatic weeds; noise and air pollution; control of heavy metal and toxic items
are quite important for DPs and consequently projects in these areas may attract funding. DPs were asked to mention sectors/issues they consider as environmental and the following list was generated:
agriculture and natural resources;

44
infrastructure and human settlements; forest, rivers and marine systems; water and transport; sanitation; conservation of wildlife; control of poisonous and toxic items; climate change; chemicals management; energy; climate change mitigation and adaptation; biodiversity and disaster risk reduction; and pollution.
All the DPs interviewed undertake external evaluation of their projects on semi-annually or annual bases with a mid-term evaluation and a comprehensive evaluation done at the end of the project. One of the DPs mentioned the criteria for evaluation to include disbursement rates, implementation progress, lapse between approval and effectiveness of project, payment of government counterpart fund and an internal formula based on achievement of development objective. A vivid look at these criteria suggest that they are all input oriented than out oriented and therefore does not look at the outcome which is very important. Also, monitoring of the problem is not done. To assess the factors that underline the success and failure of environmental projects, DPs were asked to provide the names of two environmental projects that have been successful and two environmental projects that have not been successful as well as the factors behind the success or failure. Many of the DPs were able to mention environmental projects that were successful and the majority of them were in the agriculture and forestry sectors and linked to rural communities. Success factors of the projects include increased incomes and jobs creation potentials of projects, strong commitment by Ghanaian counterparts, good relationship of Ghanaian and foreign teams, quick and visible impacts, emphasis on the development of the capacity of youth and women, ownership and buy-in of key stakeholders and partners at all levels, leadership and commitment, involvement of both senior management and technical staff, collaboration and partnerships, knowledge and use of the right steps in implementation and the creation of awareness. Factors that led to the failure of projects included technology to be used by the project alien to the community and the poor knowledge of consultants on local environment. About half of the DPs also believed that their views on success or lack of projects are shared by the host country whereas the remaining (50 per cent) shared the opposing view, indicating that there exist some tension between DPs and the country.
7.5 Senegal
The efficiency of the environmental sector depends very much also on the other relating sectors that use natural resources as their main input in the functioning of their projects and programmes: agriculture, infrastructure, water, industries, fisheries, rural development, and urban development. All these sectors share water resources and land resources and any activity they conduct may have negative effects on the people but also on the sustainability of natural resources.

45
8 Conclusion
This study sought to understand what aid flows have actually been doing in the environmental sector in eight carefully selected countries in Southern Africa (Botswana and Mozambique), East Africa (Kenya, Uganda, and Tanzania) and West Africa (Burkina Faso, Ghana, and Senegal). Two major considerations were highlighted as deserving attention during efforts to enhance the environment. First, there should be realization that agriculture has a close interface with the key environmental sectors. Second, climate change is a cross-cutting issue which needs to be mainstreamed in projects in environmental and non-environmental sectors. The research applied two methodological approaches: quantitative and qualitative. The quantitative component mainly involved the generation of descriptive statistics for key variables and relationships from a very comprehensive database on aid by AidData and primary data from a survey conducted on a sample of donors in the selected countries.
The study outlined the backgrounds of the selected countries and highlighted that environmental issues lie in their developmental priorities. The countries’ own efforts towards addressing environmental issues from the fiscus are generally minimal. There is therefore a need for external funding to enhance environmental outcomes given that enabling policy frameworks for proactive effort already exists. The key environmental sub-sectors given priority by the selected countries and donors were identified to be water, forestry and biodiversity.
Total aid to the eight countries’ environmental sectors for the 2000s decade is estimated at a minimum of US$10.17 billion against an estimated total aid budget of about US$100 billion. Thus, the environmental sector has received about 10 per cent of total aid. However, there have been significant deviations between commitment and disbursement of aid to the selected countries. The top three donors of the selected countries are the World Bank, USA and the EU even though the amount of bilateral aid has gradually been on the rise.
The study focussed on few successful and unsuccessful environmental projects in the selected countries and drew the conclusion that there seems to have been a structural change in some countries where donors have been increasing the number of small projects presumably to improve disbursement rates.
The survey results from interviews with donors show that aid is perceived to play a significant role in enhancing environmental quality. One of the benefits is associated with the policy of mainstreaming environmental issues in all projects. Even though the primary focus of most donors seems to be in disbursing non-environmental aid, environmental objectives are necessarily taken into account in order to prevent unintended harmful effects. Depending on the nature of projects, aid has often provided enhanced income sources and farm diversification; for example, with tree planting projects, they have provided these benefits but also resulted in positive biophysical changes on the environment.
The donors believe that all types of aid are generally effective in enhancing both welfare and the environment. However, in general, non-environmental aid tends to have a higher impact on welfare than on the environment and, by design, both types of aid can have undifferentiated impacts on welfare. There are three other aid objectives which are classified separately from the usual environmental objectives: biodiversity, desertification and climate change. Taking these objectives into account will generally improve the scores on environmental impact of aid.
This study has helped bring out the reality about the impact of aid on the environment in Africa. The results show that a general increase in unmarked aid will improve environmental conditions as long as mainstreaming of either biodiversity or climate change or desertification or the
46
environment takes place. This is a message of hope as we are unlikely to see surges of environmental aid in the near future given the stubbornness of poverty on Africa.
References
Addison, T., G. Mavrotas, and M. McGillivray (2005). ‘Aid, Debt Relief and New Sources of Finance for Meeting the Millennium Development Goals’. Journal of International Affairs, 58: 113-27.
African Development Bank (AfDB) (2009). AfDB Group Annual Report 2009. www.afdb.org. Accessed 20 July 2013.
African Economic Outlook (AEO) (2013). http://www.africaneconomicoutlook.org.
AidData (2011). www.aiddata.org
Anderson, S. (2005). ‘Botswana: Land of Paradoxes. Mercatus Policy Series Country Brief No. 1’. Mercatus Centre, George Washington University.
Arvin, B.M., P. Dabir-Alai, and B. Lew (2006). ‘Does Foreign Aid Affect the Environment in Developing Economies?’. Journal of Economic Development, 31(1): 63-87.
Asafu-Adjaye, J. (1999). ‘The Environment and Development: Theory and Empirical Evidence’. International Journal of Development Planning Literature, 14: 117-34.
Bambio, Y. (2013). ‘Aid and Environment in Burkina Faso’. WIDER Working Paper 2013/139. Helsinki: UNU-WIDER.
Burnside, C. and D. Dollar (2000). ‘Aid, Policies, and Growth’. American Economic Review, 90(4): 847-68.
CSO (2010). ‘Households’ Opinion Survey for Vision 2016’. Central Statistics Office, Government Printing.
DIFOR (2007). ‘Situation des forêts classées du Burkina Faso et plan de réhabilitation’. Ouagadougou: Ministère de l’Environnement et du Cadre de Vie.
Du Plessis, A. and K. Rowntree (2003). ‘Water Resources in Botswana with Particular Reference to the Savanna Regions’. South African Geographical Journal, 85(1): 42-9.
Easterly, W., R. Levine, and D. Roodman (2004). ‘New Data, New Doubts: A Comment on Burnside and Dollar’s “Aid, Policies, and Growth”’. American Economic Review, 94(3): (June).
European Commission (2013). ‘Country Strategy Paper and the National Indicative Programme for the period 2008-13’ (‘Document de stratégie pays et programme indicative national pour la période 2008-13, in French). Brussels: European Commission.
FAO (2005). Food and Agricultural Organisation. Retrieved 3 January 2011, from http://www.fao.org/nr/water/aquastat/countries/botswana/index.stm
FAO (2010). Global Forest Resources Assessment. Country report-Ghana. FRA 2010/077.
Glopolis (2012). Renewable Energy Sources in Kenya. http://glopolis.org. Accessed 19 July 2013.
GoK (Government of Kenya) (2012). ‘National Environment Policy Available at: www.environment.go.ke (accessed 21 July 2013).
Hicks, R.L., B.C. Parks, J.T. Roberts, and M.J. Tierney (2008). Greening Aid: Understanding the Environmental Impact of Development Assistance. Oxford: Oxford University Press.

47
Juana, J. (2014). ‘Aid and the Environment in Botswana’. WIDER Working Paper 2014/007. Helsinki: UNU-WIDER.
Kaberuka, D. (2011). ‘Development and Aid in Africa: What Have we Learned from the Past 50 years?’. OECD, Development Cooperation Report 2011: 50th Anniversary Edition, OECD Publishing. http://dx.doi.org/10.1787/dcr-2011-10-en
Kahyarara, G. (2014, forthcoming). ‘Aid and the Environment in Tanzania’. WIDER Working Paper. Helsinki: UNU-WIDER.
Kateregga, E. (2013). ‘Aid and the Environment: Uganda’. WIDER Working Paper 2013/142. Helsinki: UNU-WIDER.
Marzoli (2007a). National Forest Inventory. Mozambique.
Marzoli (2007b). Integrated Assessment of Mozambican Forests. Ministry of Agriculture, Italian Cooperation, and Agriconsulting. Mozambique
MFPED (2012). ‘Summary of Project Support Managed outside Government Systems’. Kampala: Government of Uganda.
MICOA (2007). Programa de Acção Nacional para Adaptação às Mudanças Climáticas (NAPA). Moçambique.
MICOA (2010). Estratégia Nacional de Redução de Emissões por Desmatamento e Degradação (EN REDD) documento draft (Setembro 2010). Maputo.
MICOA (2012). Estratégia Nacional de Adaptação e Mitigação as Mudanças Climáticas (ENAMMC) Moçambique.
Millennium Development Goals Report (2012). ‘Assessing Progress in Africa Toward the Millennium Development Goals’. http://www.un.org/millenniumgoals.
Ministério de Planificação e Desenvolvimento (MPD) (2010). Pobreza e Bem-Estar em Moçambique: Terceira Avaliação Nacional. Direcção Nacional de Estudos e Análise de Politicas. Moçambique.
Ministry of Finance Planning and Economic Development (MFPED) (2009). Development Cooperation Uganda Report. Government of Uganda.
National Environmental Management Authority (NEMA) (2010). State of the Environment Report.
National Environmental Management Authority (NEMA) (2011). State of the Environment Report.
NDP 10 (2009). National Development Plan 10. Gaborone, Botswana: Government Printer.
NFA (National Forest Authority) (2011). Annual Report. Kampala: Government of Uganda.
Ngaido, T. (2014). ‘Aid, Environment, and Climate Change in Africa: The Case of Senegal’. WIDER Working Paper 2014/005. Helsinki: UNU-WIDER.
Nyangena, W. (2013). ‘Aid and the Environment: The Case of Kenya’. WIDER Working Paper 2013/133. Helsinki: UNU-WIDER.
OECD (2011). DAC News, Paris: OECD Development Assistance Committee (DAC). (December). http://www.oecd.org/dac/49266238.pdf (accessed 21 September 2013).
OECD (2012). ‘Trends in Aid to Environment, a Component of Sustainable Development Finance (1991-2011)’, in Development Co-operation Report 2012: Lessons in Linking

48
Sustainability and Development, OECD Publishing. http://dx.doi.org/10.1787/dcr-2012-10-en
Sida (2008). Environmental Economics Programme Annual Report, School of Business, Economics and Law, Goteborg University.
SOER (2002). State of the Environment Review Report. Retrieved February 2013, from http://www.envirobotswana.gov.bw
SP/CONNEDD (Secrétariat Permanent du Conseil National pour l’Environnement et le Développement Durable) (2010). ‘Convention sur la Diversité Biologique: Quatrième rapport national à la conférence des parties’. Ouagadougou.
Strange, A., B. Parks, M.J. Tierney, A. Fuchs, A. Dreher, and V. Ramachandran (2013). ‘China’s Development Finance to Africa: A Media-Based Approach to Data Collection’. CGD Working Paper 323. Washington, DC: Center for Global Development. http://www.cgdev.org/publication/chinas-development-finance
Tomo, A. and N. Givá (2014, forthcoming). ‘Aid and the Environment in Mozambique’. WIDER Working Paper. Helsinki: UNU-WIDER.
Trading Economics (2013). Kenya Government Debt to GDP, accessed on 23 July 2013 http://www.tradingeconomics.com/kenya/government-debt-to-gdp
Tregenna, F. (2007). ‘Explaining Botswana’s Growth with Comparison to Chile’.
Twerefou, D.K. (2013). ‘Aid and Environment in Ghana’. WIDER Working Paper 2013/123. Helsinki: UNU-WIDER.
United Nations (2013). ‘A New Global Partnership: Eradicate Poverty and Transform Economies through Sustainable Development – The Report of the High-Level Panel of Eminent Persons on the Post-2015 Development Agenda’. New York: United Nations Publications.
UN-WATER (2005). Building the Resilience of Nations and Communities to Disasters: Framework for Action 2005-2015. UN-Water Series Vol. 1.
United Republic of Tanzania (URT) (2010). ‘National Strategy for Growth and Reduction of Poverty’. Ministry of Finance, Tanzania.
United States International Development Agency (USAID) - Mozambique 2013. Mozambique Environmental Threats and Opportunities Assessment. Technical Report.
Williamson T. (2008). ‘Putting Aid On Budget: A Case Study of Uganda’. A Study for the Collaborative Africa Budget Reform Initiative (CABRI) and the Strategic Partnership with Africa (SPA) unpublished.
World Development Indicators (WDI) (2013). http://data.worldbank.org/country/burkina-faso
World Energy Council (2007). 2007 Survey of Energy Resources, www.worldenergy.org/publications/survey. (Accessed on 19 July 2013).

49
Appendix: Aid to climate change mitigation and adaptation in Africa Donors’ aid for climate change mitigation and adaptation objectives is mostly allocated to Asia (51 per cent for mitigation and 41 per cent for adaptation), followed by Africa (30 per cent and 37 per cent respectively) and the Americas (13 per cent and 14 per cent) (OECD 2012). The two figures A1 and A2 highlight the geographical distribution of climate change mitigation and adaptation aid, respectively. Figure A1: Aid to climate change mitigation (2010 US$ million, current prices)
Source: OECD (2012) http://dx.doi.org/10.1787/888932699877. Figure A2: Aid to climate change adaptation (2010 US$ million, current prices)
Source: OECD (2012) http://dx.doi.org/10.1787/888932699896.

50
Since 1998, the DAC has monitored aid for climate change mitigation. In December 2009, DAC members approved a new marker to track aid in support of climate change adaptation. The OECD released the figures on climate change aid in December 2012 (see Figure A3). The data show that these flows reached US$22.9 billion in 2010, representing 15 per cent of total official development assistance (see Figure A4). One-third of the estimated climate-change-related aid in 2010 went to support adaptation (US$9.3 billion) while two-thirds was for mitigation (US$17.6 billion, up 69 per cent from 2009). Of the total US$22.9 billion, an estimated US$4 billion supported both mitigation and adaptation objectives (OECD 2011). Figure A3: Trends in climate change mitigation-related aid, 2006-2010
Source: OECD (2011). Figure A4: Total climate change-related aid in 2010
Source: OECD (2011).
02468
101214161820
2006 2007 2008 2009 2010Climate change mitigation: principal objective
Climate change mitigation: upper bound estimate (principal+significantobjective)
USD billion
48%
11%6%
17%
18%
0
5
10
15
20
25
2010
Activities marked both formitigation and adaptation("overlap")Adaptation only:significant objective
Adaptation only: principalobjective
Mitigation only:significant objective
Mitigation only: principalobjective
Total climate change-related aid: USD 22.9 billion
USD billion

51
By 2020, developing countries will receive US$100 billion every year to combat climate change–nearly as much as they receive in official development assistance. Discussions in Nairobi during the African Climate Change Finance and Development Effectiveness Dialogue (21-23 September 2011) centred on how this money can be governed effectively to maximize its positive impact towards low-carbon and climate-resilient development in Africa (OECD 2011).
Related Documents