ISSN 1998-0124 CN 11-5974/O4 2020, 13(9): 2492–2499 https://doi.org/10.1007/s12274-020-2884-8 Research Article Wide emission shifts and high quantum yields of solvatochromic carbon dots with rich pyrrolic nitrogen Hua Wang 1 , Philip Haydel 1 , Ning Sui 2 , Lina Wang 2 , Yan Liang 3 ( ), and William W. Yu 1,2 ( ) 1 Department of Chemistry and Physics, Louisiana State University, Shreveport, LA 71115, USA 2 College of Materials Science and Engineering, Qingdao University of Science and Technology, Qingdao 266042, China 3 College of Food Science and Engineering, Qilu University of Technology (Shandong Academy of Sciences), Jinan 250353, China © Tsinghua University Press and Springer-Verlag GmbH Germany, part of Springer Nature 2020 Received: 22 March 2020 / Revised: 15 May 2020 / Accepted: 17 May 2020 ABSTRACT Carbon dots (CDs) with solvatochromic emission colors in different solvents have attracted much attention as a new class of luminescent nanomaterial owing to their facile synthesis and low production cost. In this work, we prepared two kinds of CDs with solvatochromic emissions: green emission CDs (G-CDs) and multicolor emission CDs (M-CDs). G-CDs synthesized from o-phenylenediamine exhibited weak photoluminescence emission (quantum yield 2.8%6.1%) and 39 nm solvatochromic shifts (492531 nm). In contrast, M-CDs prepared from o-phenylenediamine and 4-aminophenol showed 87 nm solvatochromic shift range (505592 nm) and much higher photoluminescence quantum yield (18.4%32.5%). The two CDs exhibited different emission, absorption, and photoluminescence lifetime. The origin of solvatochromic shifts and the formation mechanism of CDs were demonstrated by analyzing the structures and compositions of two CDs. High percentages of pyrrolic nitrogen and amino nitrogen make wider solvatochromic shifts and higher quantum yields. The results were well supported by density functional theory calculations. This effective strategy to expand solvatochromic shift range and improve quantum yields could open a new window to prepare satisfied solvatochromic carbon dots. KEYWORDS carbon dot, solvatochromism, density functional theory (DFT) calculation, quantum yield, pyrrolic nitrogen 1 Introduction Carbon dots (CDs) have attracted much attention as a new class of fluorescent nanomaterial owing to their distinct merits, such as high quantum yield (QY), low production cost, and excellent biocompatibility [1, 2]. To date, CDs have already been studied in broad applications including fluorescent probes and sensors [3], biological labels [4, 5], and optoelectronic devices [2, 6]. In those applications, the photoluminescence (PL) emission colors from blue to red are all in demand [7, 8]. However, most reported CDs show blue emissions, which severely limit their applications [9, 10]. Therefore, developing multicolor emission CD materials, especially from green and red is still highly desirable [11]. Many attempts have been tried to prepare CDs with multicolor emissions, such as different precursors [12, 13], variation of temperature [14], change of reaction solvent [15], and different nanoparticle sizes [14, 16], which could affect the carbonization process and the formation of emission centers. Recently, a few CD materials have been reported to show different emission colors in different solvents, i.e., solvatochromism. Jiang et al. reported that the CDs from m-phenylenediamine exhibited strong solvent-dependent emission from 400 to 500 nm [17]. Ren et al. synthesized CDs with a solvatochromic shift range of 527619 nm using p-phenylenediamine and 3-isocyanatopropyltriethoxysilane [18]. Wang et al. prepared CDs from p-phenylenediamine via a solvothermal method using diphenyl ether as the reaction solvent; the CD emissions were from 511 to 615 nm in different solvents and the missions were excitation-wavelength independent [11]. Some efforts have been addressed to reveal the solvatochromic mechanism of these CDs. Reckmeier et al. found that solvent had different influences on the CD’s structural components: sp 2 -hybridized core, the edge, and the functional surface groups, respectively [19]. Sciortino et al. investigated the interactions between CDs and solvents, and found that the PL mechanism was the radiative recombination of a photoexcited electron migrated from carbon core to surface groups [20]. Basu and Mandal reported that the solvatochromic responses of CDs were from the interactions between solvents with different CD’s emission centers [21]. Although some successes have been achieved, designing novel CDs with wide solvatochromic shift range, especially the longer wavelength emissions still has serious challenges. In this work, an effective strategy to expand solvatochromic shift range and improve quantum yields of carbon dots was demonstrated. Two kinds of CDs with solvent-dependent emissions were prepared via a solvothermal method: green emission CDs (G-CDs) and multicolor emission CDs (M-CDs). As shown in Fig. 1, G-CDs synthesized from o-phenylenediamine exhibited weak PL emissions and a narrow solvatochromic shift range (492531 nm) in different solvents. In contrast to G-CDs, M-CDs prepared from o-phenylenediamine and Address correspondence to Yan Liang, [email protected]; William W. Yu, [email protected]

Welcome message from author
This document is posted to help you gain knowledge. Please leave a comment to let me know what you think about it! Share it to your friends and learn new things together.
Transcript
ISSN 1998-0124 CN 11-5974/O4
2020, 13(9): 2492–2499 https://doi.org/10.1007/s12274-020-2884-8
Res
earc
h Ar
ticle
Wide emission shifts and high quantum yields of solvatochromic carbon dots with rich pyrrolic nitrogen Hua Wang1, Philip Haydel1, Ning Sui2, Lina Wang2, Yan Liang3 (), and William W. Yu1,2 ()
1 Department of Chemistry and Physics, Louisiana State University, Shreveport, LA 71115, USA 2 College of Materials Science and Engineering, Qingdao University of Science and Technology, Qingdao 266042, China 3 College of Food Science and Engineering, Qilu University of Technology (Shandong Academy of Sciences), Jinan 250353, China © Tsinghua University Press and Springer-Verlag GmbH Germany, part of Springer Nature 2020 Received: 22 March 2020 / Revised: 15 May 2020 / Accepted: 17 May 2020
ABSTRACT Carbon dots (CDs) with solvatochromic emission colors in different solvents have attracted much attention as a new class of luminescent nanomaterial owing to their facile synthesis and low production cost. In this work, we prepared two kinds of CDs with solvatochromic emissions: green emission CDs (G-CDs) and multicolor emission CDs (M-CDs). G-CDs synthesized from o-phenylenediamine exhibited weak photoluminescence emission (quantum yield 2.8%6.1%) and 39 nm solvatochromic shifts (492531 nm). In contrast, M-CDs prepared from o-phenylenediamine and 4-aminophenol showed 87 nm solvatochromic shift range (505592 nm) and much higher photoluminescence quantum yield (18.4%32.5%). The two CDs exhibited different emission, absorption, and photoluminescence lifetime. The origin of solvatochromic shifts and the formation mechanism of CDs were demonstrated by analyzing the structures and compositions of two CDs. High percentages of pyrrolic nitrogen and amino nitrogen make wider solvatochromic shifts and higher quantum yields. The results were well supported by density functional theory calculations. This effective strategy to expand solvatochromic shift range and improve quantum yields could open a new window to prepare satisfied solvatochromic carbon dots.
KEYWORDS carbon dot, solvatochromism, density functional theory (DFT) calculation, quantum yield, pyrrolic nitrogen
1 Introduction Carbon dots (CDs) have attracted much attention as a new class of fluorescent nanomaterial owing to their distinct merits, such as high quantum yield (QY), low production cost, and excellent biocompatibility [1, 2]. To date, CDs have already been studied in broad applications including fluorescent probes and sensors [3], biological labels [4, 5], and optoelectronic devices [2, 6]. In those applications, the photoluminescence (PL) emission colors from blue to red are all in demand [7, 8]. However, most reported CDs show blue emissions, which severely limit their applications [9, 10]. Therefore, developing multicolor emission CD materials, especially from green and red is still highly desirable [11].
Many attempts have been tried to prepare CDs with multicolor emissions, such as different precursors [12, 13], variation of temperature [14], change of reaction solvent [15], and different nanoparticle sizes [14, 16], which could affect the carbonization process and the formation of emission centers. Recently, a few CD materials have been reported to show different emission colors in different solvents, i.e., solvatochromism. Jiang et al. reported that the CDs from m-phenylenediamine exhibited strong solvent-dependent emission from 400 to 500 nm [17]. Ren et al. synthesized CDs with a solvatochromic shift range of 527619 nm using p-phenylenediamine and 3-isocyanatopropyltriethoxysilane [18]. Wang et al. prepared CDs from p-phenylenediamine
via a solvothermal method using diphenyl ether as the reaction solvent; the CD emissions were from 511 to 615 nm in different solvents and the missions were excitation-wavelength independent [11].
Some efforts have been addressed to reveal the solvatochromic mechanism of these CDs. Reckmeier et al. found that solvent had different influences on the CD’s structural components: sp2-hybridized core, the edge, and the functional surface groups, respectively [19]. Sciortino et al. investigated the interactions between CDs and solvents, and found that the PL mechanism was the radiative recombination of a photoexcited electron migrated from carbon core to surface groups [20]. Basu and Mandal reported that the solvatochromic responses of CDs were from the interactions between solvents with different CD’s emission centers [21]. Although some successes have been achieved, designing novel CDs with wide solvatochromic shift range, especially the longer wavelength emissions still has serious challenges.
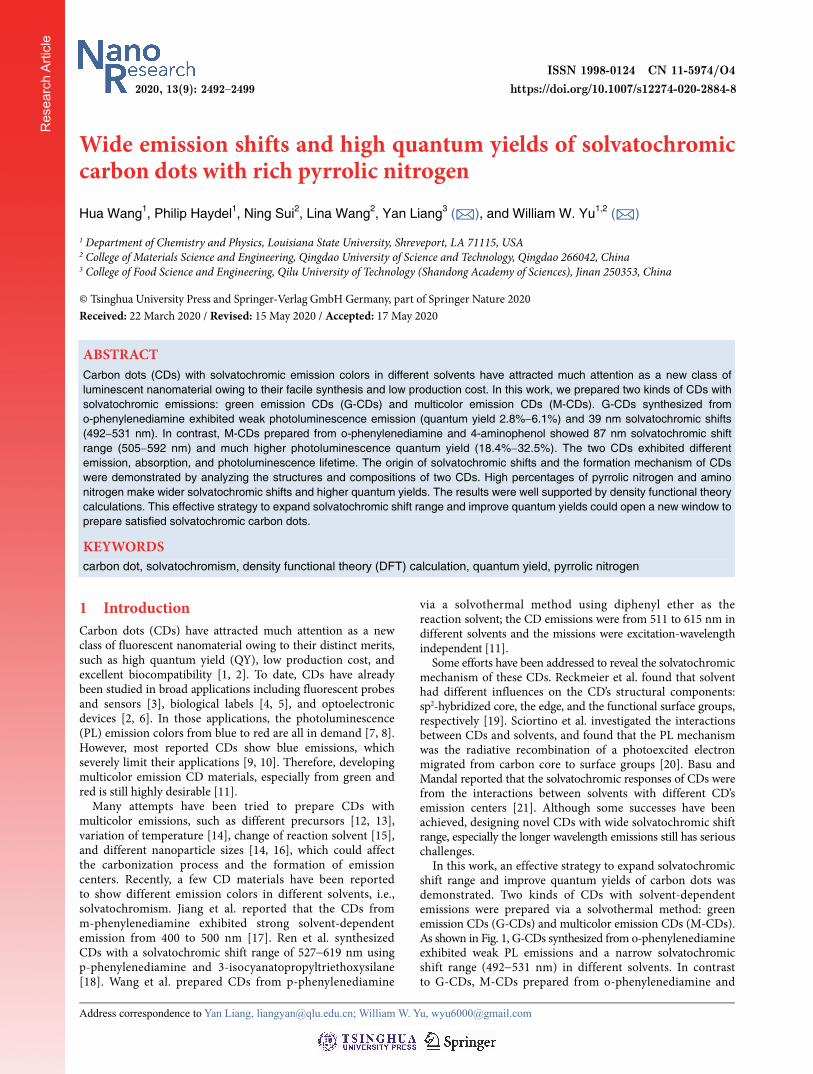
In this work, an effective strategy to expand solvatochromic shift range and improve quantum yields of carbon dots was demonstrated. Two kinds of CDs with solvent-dependent emissions were prepared via a solvothermal method: green emission CDs (G-CDs) and multicolor emission CDs (M-CDs). As shown in Fig. 1, G-CDs synthesized from o-phenylenediamine exhibited weak PL emissions and a narrow solvatochromic shift range (492531 nm) in different solvents. In contrast to G-CDs, M-CDs prepared from o-phenylenediamine and
Address correspondence to Yan Liang, [email protected]; William W. Yu, [email protected]
Nano Res. 2020, 13(9): 2492–2499
www.theNanoResearch.com∣www.Springer.com/journal/12274 | Nano Research
2493
Figure 1 Syntheses of G-CDs and M-CDs.
4-aminophenol showed longer wavelength emissions, much wider solvatochromic shift range (505592 nm), and much higher QYs (up to eight times). The emission behaviors in aprotic and protic solvents of these two CDs were investigated by comparing their absorption, PL emission, and emission lifetime. The structures and compositions of G-CDs and M-CDs were analyzed in detail to discuss the solvatochromic shift mechanisms in aprotic and protic solvents. Moreover, density functional theory (DFT) calculations were performed to study the reason of the expanded solvatochromic shift range and improved quantum yields.
2 Experimental
2.1 Chemicals
Diphenyl ether, o-phenylenediamine, 4-aminophenol, polystyrene (PS, MW = 35,000), poly(methyl methacrylate) (PMMA, MW = 350,000), and poly(ethylene glycol) (PEG, MW = 7,0009,000) were purchased from Alfa Aesar. The organic solvents of toluene, chloroform, acetone, N, N-dimethylformamide (DMF), and methanol were purchased from Pharmco and used directly.
2.2 Synthesis of carbon dots (G‐CDs and M‐CDs)
15 mL diphenyl ether was heated to 250 °C in a three-neck and round bottomed flask with reflux condensation system. Organic compounds (0.20 g o-phenylenediamine for G-CDs, 0.20 g o-phenylenediamine and 0.10 g 4-aminophenol for M-CDs) were dispersed in 2 mL diphenyl ether at 80 °C to a complete dissolution. Then this solution was quickly injected into the flask. The mixture solution was kept at 250 °C for 6 h and then cooled down to room temperature. Then the mixture solution was poured into 100 mL hexane and centrifuged at 4,000 rpm for 20 min to get precipitated. Black powder was obtained after repeating this process for three times.
2.3 Preparation of M‐CD/polymer composites
For each M-CD/polymer film preparation, 0.20 g selected polymer was mixed with 1.0 mg M-CD in 1 mL chloroform and treated by ultrasound to a complete dissolution. Then the obtained mixture was transferred into a clean glass vial and dried overnight under ambient temperature.
2.4 Characterizations
Transmission electron microscope (TEM) images were collected on TECNAI F20. The fluorescence spectra were recorded using a Horiba JobinYvon Fluorolog-3 Spectrofluorometer. The ultra- violet visible (UV−vis) absorption spectra were conducted on a PerkinElmer Lambda 25 UV–vis spectrometer. The Fourier transform infrared (FTIR) spectra were measured on a Thermo Scientific SMART FTIR spectrometer. X-ray photoelectron spectroscopy (XPS) was obtained on an ESCALAB250 spec-trometer. The fluorescence lifetime of the CDs in different solvents were collected on Edinburgh Analytical Instrument
FLS 920 time-resolved spectrofluorometer (UK).
2.5 QY measurement
Rhodamine 6G with QY 95% in ethanol was used for the measurements of the emission range of 500560 nm (for CDs in toluene, chloroform, acetone, and DMF). Rhodamine B with QY 56% in ethanol was used for the emission range of 580615 nm (for CDs in methanol).
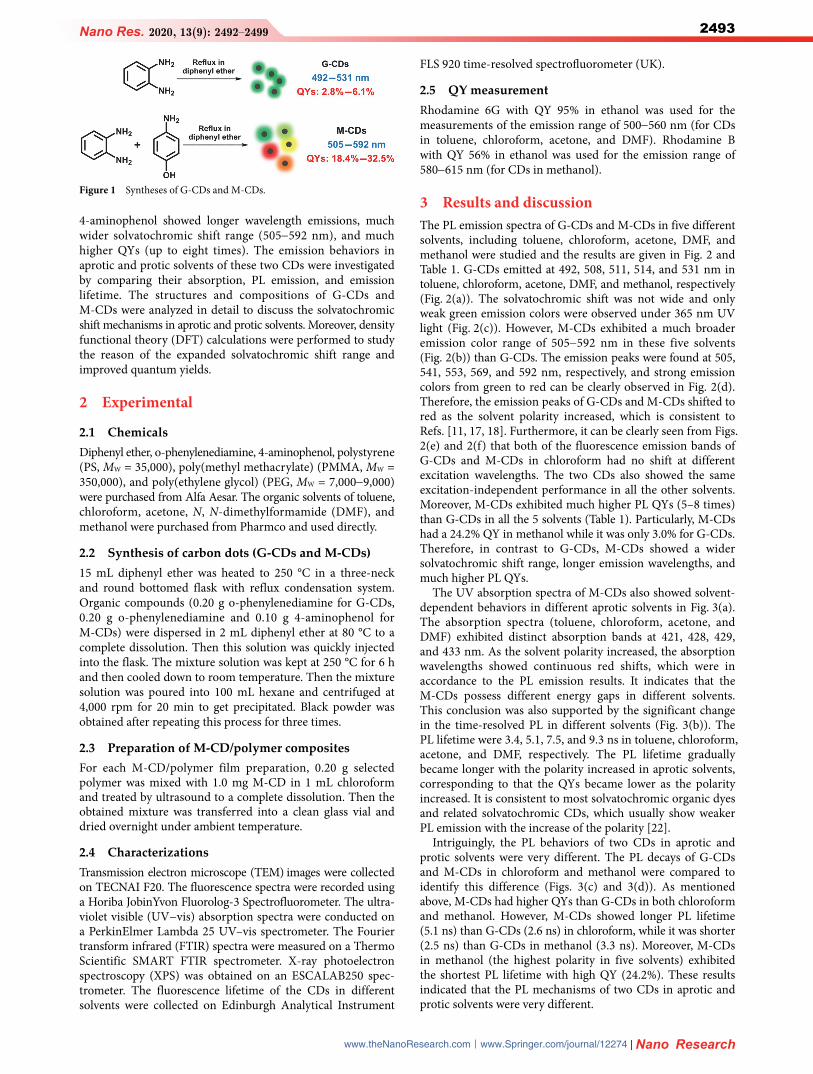
3 Results and discussion The PL emission spectra of G-CDs and M-CDs in five different solvents, including toluene, chloroform, acetone, DMF, and methanol were studied and the results are given in Fig. 2 and Table 1. G-CDs emitted at 492, 508, 511, 514, and 531 nm in toluene, chloroform, acetone, DMF, and methanol, respectively (Fig. 2(a)). The solvatochromic shift was not wide and only weak green emission colors were observed under 365 nm UV light (Fig. 2(c)). However, M-CDs exhibited a much broader emission color range of 505592 nm in these five solvents (Fig. 2(b)) than G-CDs. The emission peaks were found at 505, 541, 553, 569, and 592 nm, respectively, and strong emission colors from green to red can be clearly observed in Fig. 2(d). Therefore, the emission peaks of G-CDs and M-CDs shifted to red as the solvent polarity increased, which is consistent to Refs. [11, 17, 18]. Furthermore, it can be clearly seen from Figs. 2(e) and 2(f) that both of the fluorescence emission bands of G-CDs and M-CDs in chloroform had no shift at different excitation wavelengths. The two CDs also showed the same excitation-independent performance in all the other solvents. Moreover, M-CDs exhibited much higher PL QYs (5–8 times) than G-CDs in all the 5 solvents (Table 1). Particularly, M-CDs had a 24.2% QY in methanol while it was only 3.0% for G-CDs. Therefore, in contrast to G-CDs, M-CDs showed a wider solvatochromic shift range, longer emission wavelengths, and much higher PL QYs.
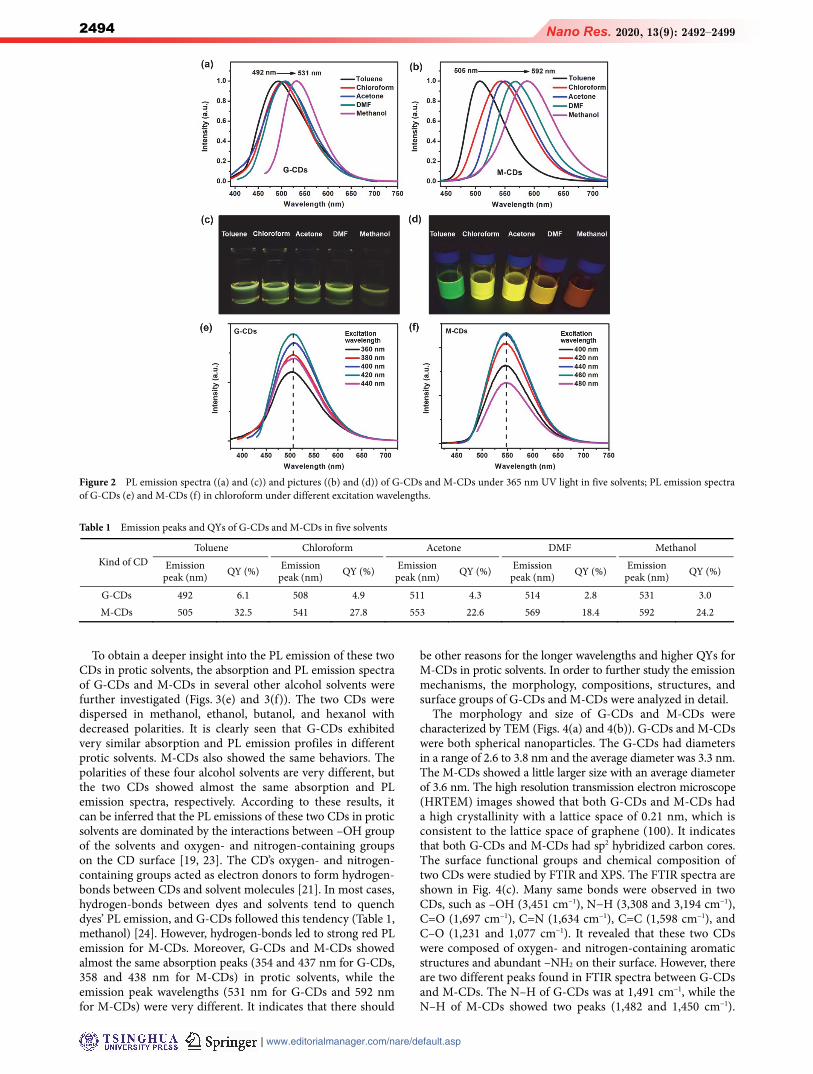
The UV absorption spectra of M-CDs also showed solvent- dependent behaviors in different aprotic solvents in Fig. 3(a). The absorption spectra (toluene, chloroform, acetone, and DMF) exhibited distinct absorption bands at 421, 428, 429, and 433 nm. As the solvent polarity increased, the absorption wavelengths showed continuous red shifts, which were in accordance to the PL emission results. It indicates that the M-CDs possess different energy gaps in different solvents. This conclusion was also supported by the significant change in the time-resolved PL in different solvents (Fig. 3(b)). The PL lifetime were 3.4, 5.1, 7.5, and 9.3 ns in toluene, chloroform, acetone, and DMF, respectively. The PL lifetime gradually became longer with the polarity increased in aprotic solvents, corresponding to that the QYs became lower as the polarity increased. It is consistent to most solvatochromic organic dyes and related solvatochromic CDs, which usually show weaker PL emission with the increase of the polarity [22].
Intriguingly, the PL behaviors of two CDs in aprotic and protic solvents were very different. The PL decays of G-CDs and M-CDs in chloroform and methanol were compared to identify this difference (Figs. 3(c) and 3(d)). As mentioned above, M-CDs had higher QYs than G-CDs in both chloroform and methanol. However, M-CDs showed longer PL lifetime (5.1 ns) than G-CDs (2.6 ns) in chloroform, while it was shorter (2.5 ns) than G-CDs in methanol (3.3 ns). Moreover, M-CDs in methanol (the highest polarity in five solvents) exhibited the shortest PL lifetime with high QY (24.2%). These results indicated that the PL mechanisms of two CDs in aprotic and protic solvents were very different.
Nano Res. 2020, 13(9): 2492–2499
| www.editorialmanager.com/nare/default.asp
2494
To obtain a deeper insight into the PL emission of these two CDs in protic solvents, the absorption and PL emission spectra of G-CDs and M-CDs in several other alcohol solvents were further investigated (Figs. 3(e) and 3(f)). The two CDs were dispersed in methanol, ethanol, butanol, and hexanol with decreased polarities. It is clearly seen that G-CDs exhibited very similar absorption and PL emission profiles in different protic solvents. M-CDs also showed the same behaviors. The polarities of these four alcohol solvents are very different, but the two CDs showed almost the same absorption and PL emission spectra, respectively. According to these results, it can be inferred that the PL emissions of these two CDs in protic solvents are dominated by the interactions between –OH group of the solvents and oxygen- and nitrogen-containing groups on the CD surface [19, 23]. The CD’s oxygen- and nitrogen- containing groups acted as electron donors to form hydrogen- bonds between CDs and solvent molecules [21]. In most cases, hydrogen-bonds between dyes and solvents tend to quench dyes’ PL emission, and G-CDs followed this tendency (Table 1, methanol) [24]. However, hydrogen-bonds led to strong red PL emission for M-CDs. Moreover, G-CDs and M-CDs showed almost the same absorption peaks (354 and 437 nm for G-CDs, 358 and 438 nm for M-CDs) in protic solvents, while the emission peak wavelengths (531 nm for G-CDs and 592 nm for M-CDs) were very different. It indicates that there should
be other reasons for the longer wavelengths and higher QYs for M-CDs in protic solvents. In order to further study the emission mechanisms, the morphology, compositions, structures, and surface groups of G-CDs and M-CDs were analyzed in detail.
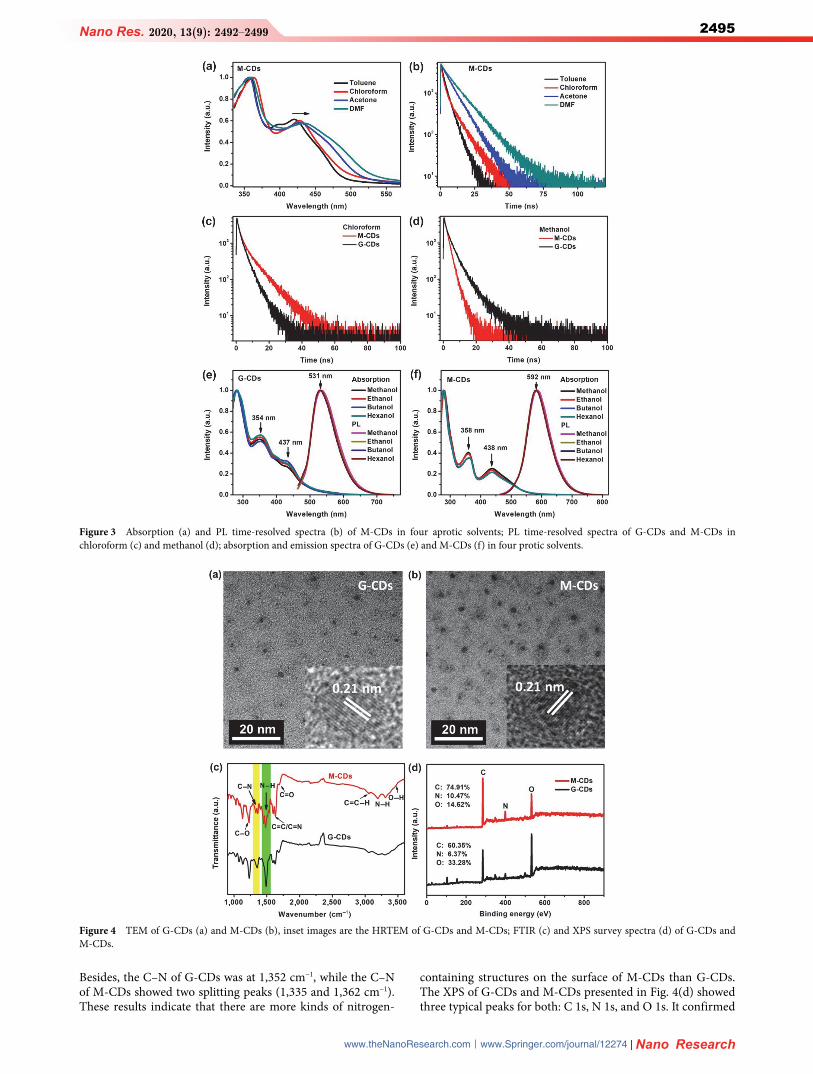
The morphology and size of G-CDs and M-CDs were characterized by TEM (Figs. 4(a) and 4(b)). G-CDs and M-CDs were both spherical nanoparticles. The G-CDs had diameters in a range of 2.6 to 3.8 nm and the average diameter was 3.3 nm. The M-CDs showed a little larger size with an average diameter of 3.6 nm. The high resolution transmission electron microscope (HRTEM) images showed that both G-CDs and M-CDs had a high crystallinity with a lattice space of 0.21 nm, which is consistent to the lattice space of graphene (100). It indicates that both G-CDs and M-CDs had sp2 hybridized carbon cores. The surface functional groups and chemical composition of two CDs were studied by FTIR and XPS. The FTIR spectra are shown in Fig. 4(c). Many same bonds were observed in two CDs, such as –OH (3,451 cm−1), N−H (3,308 and 3,194 cm−1), C=O (1,697 cm−1), C=N (1,634 cm−1), C=C (1,598 cm−1), and C–O (1,231 and 1,077 cm−1). It revealed that these two CDs were composed of oxygen- and nitrogen-containing aromatic structures and abundant –NH2 on their surface. However, there are two different peaks found in FTIR spectra between G-CDs and M-CDs. The N–H of G-CDs was at 1,491 cm−1, while the N–H of M-CDs showed two peaks (1,482 and 1,450 cm−1).
Figure 2 PL emission spectra ((a) and (c)) and pictures ((b) and (d)) of G-CDs and M-CDs under 365 nm UV light in five solvents; PL emission spectra of G-CDs (e) and M-CDs (f) in chloroform under different excitation wavelengths.
Table 1 Emission peaks and QYs of G-CDs and M-CDs in five solvents
Toluene Chloroform Acetone DMF Methanol Kind of CD Emission
peak (nm) QY (%) Emission peak (nm) QY (%) Emission
peak (nm) QY (%) Emission peak (nm) QY (%) Emission
peak (nm) QY (%)
G-CDs 492 6.1 508 4.9 511 4.3 514 2.8 531 3.0 M-CDs 505 32.5 541 27.8 553 22.6 569 18.4 592 24.2
Nano Res. 2020, 13(9): 2492–2499
www.theNanoResearch.com∣www.Springer.com/journal/12274 | Nano Research
2495
Besides, the C–N of G-CDs was at 1,352 cm−1, while the C–N of M-CDs showed two splitting peaks (1,335 and 1,362 cm−1). These results indicate that there are more kinds of nitrogen-
containing structures on the surface of M-CDs than G-CDs. The XPS of G-CDs and M-CDs presented in Fig. 4(d) showed three typical peaks for both: C 1s, N 1s, and O 1s. It confirmed
Figure 3 Absorption (a) and PL time-resolved spectra (b) of M-CDs in four aprotic solvents; PL time-resolved spectra of G-CDs and M-CDs in chloroform (c) and methanol (d); absorption and emission spectra of G-CDs (e) and M-CDs (f) in four protic solvents.
Figure 4 TEM of G-CDs (a) and M-CDs (b), inset images are the HRTEM of G-CDs and M-CDs; FTIR (c) and XPS survey spectra (d) of G-CDs and M-CDs.
Nano Res. 2020, 13(9): 2492–2499
| www.editorialmanager.com/nare/default.asp
2496
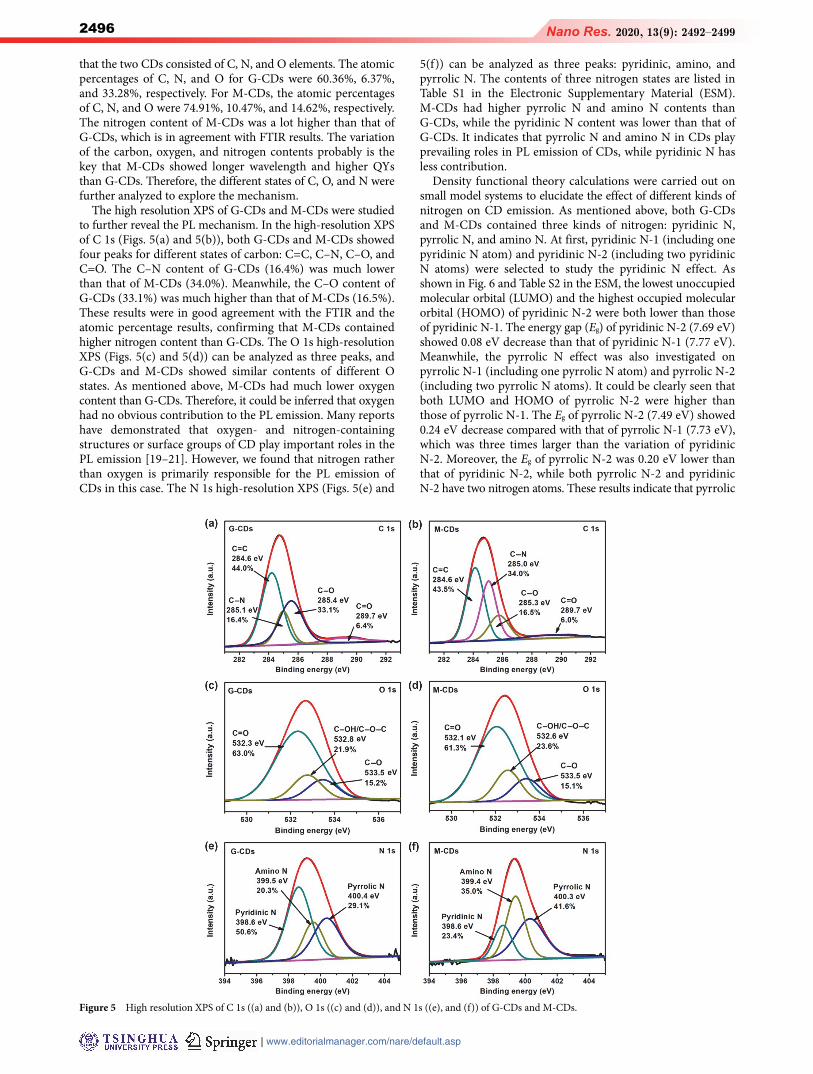
that the two CDs consisted of C, N, and O elements. The atomic percentages of C, N, and O for G-CDs were 60.36%, 6.37%, and 33.28%, respectively. For M-CDs, the atomic percentages of C, N, and O were 74.91%, 10.47%, and 14.62%, respectively. The nitrogen content of M-CDs was a lot higher than that of G-CDs, which is in agreement with FTIR results. The variation of the carbon, oxygen, and nitrogen contents probably is the key that M-CDs showed longer wavelength and higher QYs than G-CDs. Therefore, the different states of C, O, and N were further analyzed to explore the mechanism.
The high resolution XPS of G-CDs and M-CDs were studied to further reveal the PL mechanism. In the high-resolution XPS of C 1s (Figs. 5(a) and 5(b)), both G-CDs and M-CDs showed four peaks for different states of carbon: C=C, C–N, C–O, and C=O. The C–N content of G-CDs (16.4%) was much lower than that of M-CDs (34.0%). Meanwhile, the C–O content of G-CDs (33.1%) was much higher than that of M-CDs (16.5%). These results were in good agreement with the FTIR and the atomic percentage results, confirming that M-CDs contained higher nitrogen content than G-CDs. The O 1s high-resolution XPS (Figs. 5(c) and 5(d)) can be analyzed as three peaks, and G-CDs and M-CDs showed similar contents of different O states. As mentioned above, M-CDs had much lower oxygen content than G-CDs. Therefore, it could be inferred that oxygen had no obvious contribution to the PL emission. Many reports have demonstrated that oxygen- and nitrogen-containing structures or surface groups of CD play important roles in the PL emission [19–21]. However, we found that nitrogen rather than oxygen is primarily responsible for the PL emission of CDs in this case. The N 1s high-resolution XPS (Figs. 5(e) and
5(f)) can be analyzed as three peaks: pyridinic, amino, and pyrrolic N. The contents of three nitrogen states are listed in Table S1 in the Electronic Supplementary Material (ESM). M-CDs had higher pyrrolic N and amino N contents than G-CDs, while the pyridinic N content was lower than that of G-CDs. It indicates that pyrrolic N and amino N in CDs play prevailing roles in PL emission of CDs, while pyridinic N has less contribution.
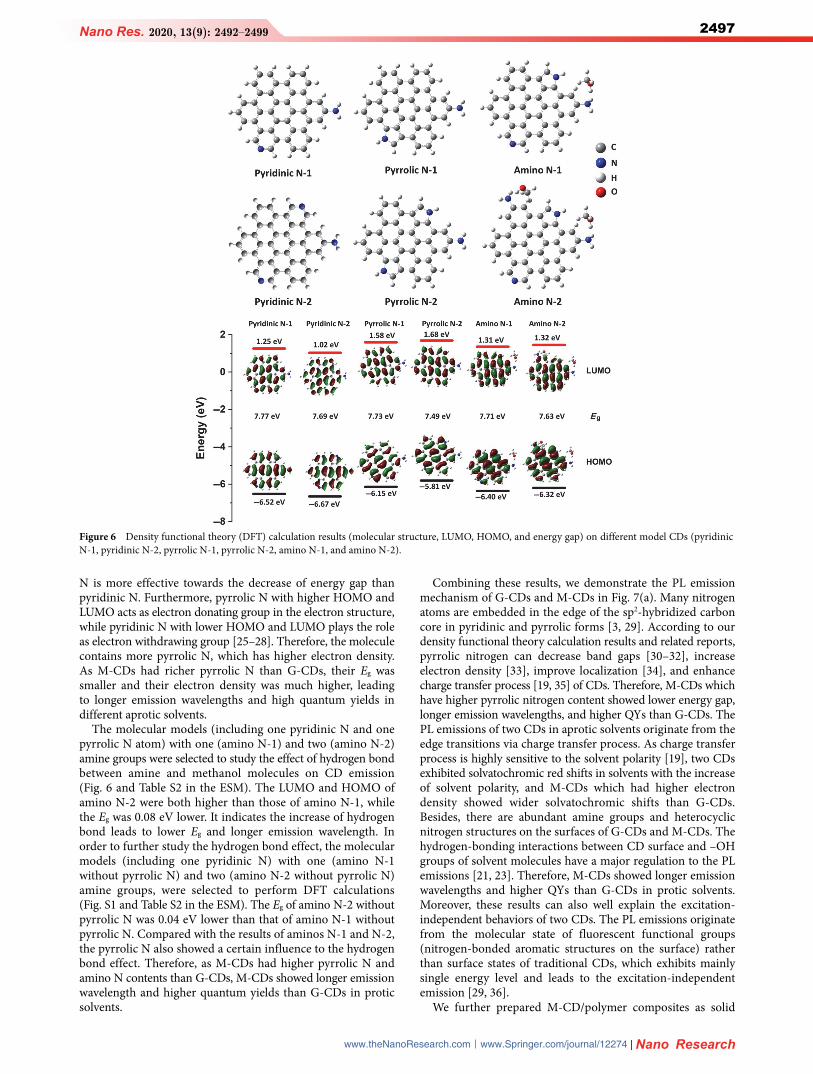
Density functional theory calculations were carried out on small model systems to elucidate the effect of different kinds of nitrogen on CD emission. As mentioned above, both G-CDs and M-CDs contained three kinds of nitrogen: pyridinic N, pyrrolic N, and amino N. At first, pyridinic N-1 (including one pyridinic N atom) and pyridinic N-2 (including two pyridinic N atoms) were selected to study the pyridinic N effect. As shown in Fig. 6 and Table S2 in the ESM, the lowest unoccupied molecular orbital (LUMO) and the highest occupied molecular orbital (HOMO) of pyridinic N-2 were both lower than those of pyridinic N-1. The energy gap (Eg) of pyridinic N-2 (7.69 eV) showed 0.08 eV decrease than that of pyridinic N-1 (7.77 eV). Meanwhile, the pyrrolic N effect was also investigated on pyrrolic N-1 (including one pyrrolic N atom) and pyrrolic N-2 (including two pyrrolic N atoms). It could be clearly seen that both LUMO and HOMO of pyrrolic N-2 were higher than those of pyrrolic N-1. The Eg of pyrrolic N-2 (7.49 eV) showed 0.24 eV decrease compared with that of pyrrolic N-1 (7.73 eV), which was three times larger than the variation of pyridinic N-2. Moreover, the Eg of pyrrolic N-2 was 0.20 eV lower than that of pyridinic N-2, while both pyrrolic N-2 and pyridinic N-2 have two nitrogen atoms. These results indicate that pyrrolic
Figure 5 High resolution XPS of C 1s ((a) and (b)), O 1s ((c) and (d)), and N 1s ((e), and (f)) of G-CDs and M-CDs.
Nano Res. 2020, 13(9): 2492–2499
www.theNanoResearch.com∣www.Springer.com/journal/12274 | Nano Research
2497
N is more effective towards the decrease of energy gap than pyridinic N. Furthermore, pyrrolic N with higher HOMO and LUMO acts as electron donating group in the electron structure, while pyridinic N with lower HOMO and LUMO plays the role as electron withdrawing group [25–28]. Therefore, the molecule contains more pyrrolic N, which has higher electron density. As M-CDs had richer pyrrolic N than G-CDs, their Eg was smaller and their electron density was much higher, leading to longer emission wavelengths and high quantum yields in different aprotic solvents.
The molecular models (including one pyridinic N and one pyrrolic N atom) with one (amino N-1) and two (amino N-2) amine groups were selected to study the effect of hydrogen bond between amine and methanol molecules on CD emission (Fig. 6 and Table S2 in the ESM). The LUMO and HOMO of amino N-2 were both higher than those of amino N-1, while the Eg was 0.08 eV lower. It indicates the increase of hydrogen bond leads to lower Eg and longer emission wavelength. In order to further study the hydrogen bond effect, the molecular models (including one pyridinic N) with one (amino N-1 without pyrrolic N) and two (amino N-2 without pyrrolic N) amine groups, were selected to perform DFT calculations (Fig. S1 and Table S2 in the ESM). The Eg of amino N-2 without pyrrolic N was 0.04 eV lower than that of amino N-1 without pyrrolic N. Compared with the results of aminos N-1 and N-2, the pyrrolic N also showed a certain influence to the hydrogen bond effect. Therefore, as M-CDs had higher pyrrolic N and amino N contents than G-CDs, M-CDs showed longer emission wavelength and higher quantum yields than G-CDs in protic solvents.
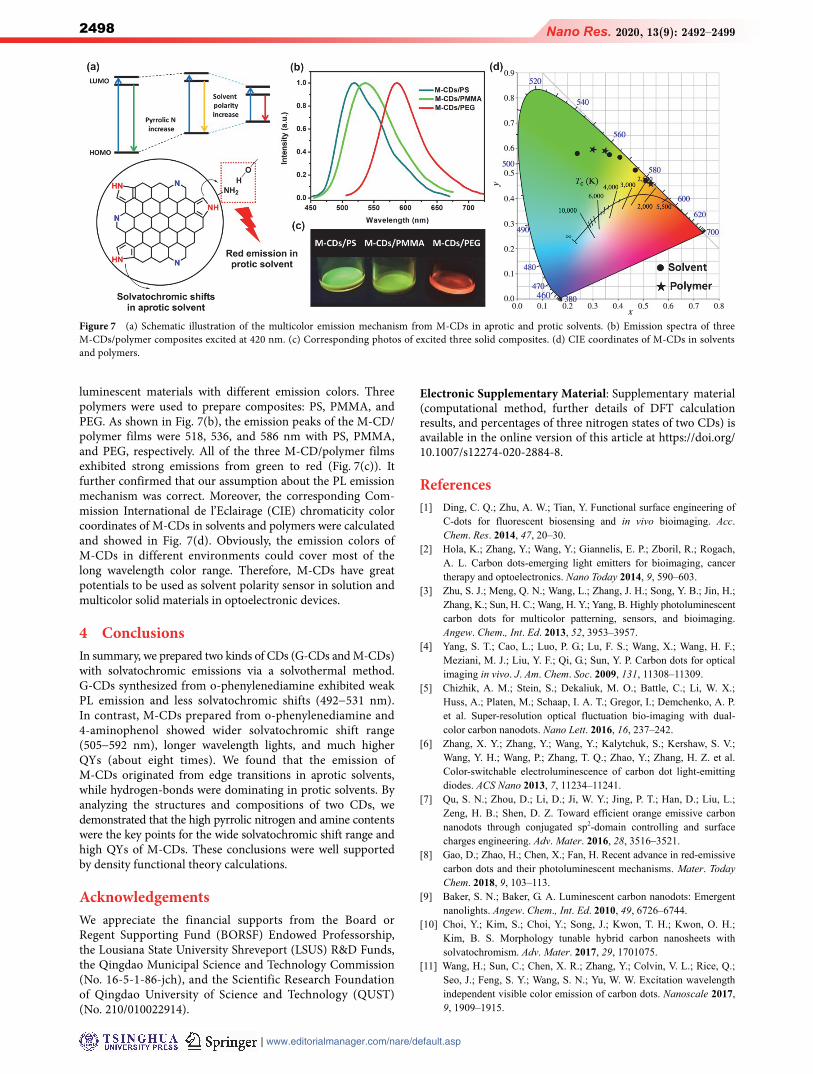
Combining these results, we demonstrate the PL emission mechanism of G-CDs and M-CDs in Fig. 7(a). Many nitrogen atoms are embedded in the edge of the sp2-hybridized carbon core in pyridinic and pyrrolic forms [3, 29]. According to our density functional theory calculation results and related reports, pyrrolic nitrogen can decrease band gaps [30–32], increase electron density [33], improve localization [34], and enhance charge transfer process [19, 35] of CDs. Therefore, M-CDs which have higher pyrrolic nitrogen content showed lower energy gap, longer emission wavelengths, and higher QYs than G-CDs. The PL emissions of two CDs in aprotic solvents originate from the edge transitions via charge transfer process. As charge transfer process is highly sensitive to the solvent polarity [19], two CDs exhibited solvatochromic red shifts in solvents with the increase of solvent polarity, and M-CDs which had higher electron density showed wider solvatochromic shifts than G-CDs. Besides, there are abundant amine groups and heterocyclic nitrogen structures on the surfaces of G-CDs and M-CDs. The hydrogen-bonding interactions between CD surface and –OH groups of solvent molecules have a major regulation to the PL emissions [21, 23]. Therefore, M-CDs showed longer emission wavelengths and higher QYs than G-CDs in protic solvents. Moreover, these results can also well explain the excitation- independent behaviors of two CDs. The PL emissions originate from the molecular state of fluorescent functional groups (nitrogen-bonded aromatic structures on the surface) rather than surface states of traditional CDs, which exhibits mainly single energy level and leads to the excitation-independent emission [29, 36].
We further prepared M-CD/polymer composites as solid
Figure 6 Density functional theory (DFT) calculation results (molecular structure, LUMO, HOMO, and energy gap) on different model CDs (pyridinic N-1, pyridinic N-2, pyrrolic N-1, pyrrolic N-2, amino N-1, and amino N-2).
Nano Res. 2020, 13(9): 2492–2499
| www.editorialmanager.com/nare/default.asp
2498
luminescent materials with different emission colors. Three polymers were used to prepare composites: PS, PMMA, and PEG. As shown in Fig. 7(b), the emission peaks of the M-CD/ polymer films were 518, 536, and 586 nm with PS, PMMA, and PEG, respectively. All of the three M-CD/polymer films exhibited strong emissions from green to red (Fig. 7(c)). It further confirmed that our assumption about the PL emission mechanism was correct. Moreover, the corresponding Com-mission International de l’Eclairage (CIE) chromaticity color coordinates of M-CDs in solvents and polymers were calculated and showed in Fig. 7(d). Obviously, the emission colors of M-CDs in different environments could cover most of the long wavelength color range. Therefore, M-CDs have great potentials to be used as solvent polarity sensor in solution and multicolor solid materials in optoelectronic devices.
4 Conclusions In summary, we prepared two kinds of CDs (G-CDs and M-CDs) with solvatochromic emissions via a solvothermal method. G-CDs synthesized from o-phenylenediamine exhibited weak PL emission and less solvatochromic shifts (492531 nm). In contrast, M-CDs prepared from o-phenylenediamine and 4-aminophenol showed wider solvatochromic shift range (505592 nm), longer wavelength lights, and much higher QYs (about eight times). We found that the emission of M-CDs originated from edge transitions in aprotic solvents, while hydrogen-bonds were dominating in protic solvents. By analyzing the structures and compositions of two CDs, we demonstrated that the high pyrrolic nitrogen and amine contents were the key points for the wide solvatochromic shift range and high QYs of M-CDs. These conclusions were well supported by density functional theory calculations.
Acknowledgements We appreciate the financial supports from the Board or Regent Supporting Fund (BORSF) Endowed Professorship, the Lousiana State University Shreveport (LSUS) R&D Funds, the Qingdao Municipal Science and Technology Commission (No. 16-5-1-86-jch), and the Scientific Research Foundation of Qingdao University of Science and Technology (QUST) (No. 210/010022914).
Electronic Supplementary Material: Supplementary material (computational method, further details of DFT calculation results, and percentages of three nitrogen states of two CDs) is available in the online version of this article at https://doi.org/ 10.1007/s12274-020-2884-8.
References [1] Ding, C. Q.; Zhu, A. W.; Tian, Y. Functional surface engineering of
C-dots for fluorescent biosensing and in vivo bioimaging. Acc. Chem. Res. 2014, 47, 20–30.
[2] Hola, K.; Zhang, Y.; Wang, Y.; Giannelis, E. P.; Zboril, R.; Rogach, A. L. Carbon dots-emerging light emitters for bioimaging, cancer therapy and optoelectronics. Nano Today 2014, 9, 590–603.
[3] Zhu, S. J.; Meng, Q. N.; Wang, L.; Zhang, J. H.; Song, Y. B.; Jin, H.; Zhang, K.; Sun, H. C.; Wang, H. Y.; Yang, B. Highly photoluminescent carbon dots for multicolor patterning, sensors, and bioimaging. Angew. Chem., Int. Ed. 2013, 52, 3953–3957.
[4] Yang, S. T.; Cao, L.; Luo, P. G.; Lu, F. S.; Wang, X.; Wang, H. F.; Meziani, M. J.; Liu, Y. F.; Qi, G.; Sun, Y. P. Carbon dots for optical imaging in vivo. J. Am. Chem. Soc. 2009, 131, 11308–11309.
[5] Chizhik, A. M.; Stein, S.; Dekaliuk, M. O.; Battle, C.; Li, W. X.; Huss, A.; Platen, M.; Schaap, I. A. T.; Gregor, I.; Demchenko, A. P. et al. Super-resolution optical fluctuation bio-imaging with dual- color carbon nanodots. Nano Lett. 2016, 16, 237–242.
[6] Zhang, X. Y.; Zhang, Y.; Wang, Y.; Kalytchuk, S.; Kershaw, S. V.; Wang, Y. H.; Wang, P.; Zhang, T. Q.; Zhao, Y.; Zhang, H. Z. et al. Color-switchable electroluminescence of carbon dot light-emitting diodes. ACS Nano 2013, 7, 11234–11241.
[7] Qu, S. N.; Zhou, D.; Li, D.; Ji, W. Y.; Jing, P. T.; Han, D.; Liu, L.; Zeng, H. B.; Shen, D. Z. Toward efficient orange emissive carbon nanodots through conjugated sp2-domain controlling and surface charges engineering. Adv. Mater. 2016, 28, 3516–3521.
[8] Gao, D.; Zhao, H.; Chen, X.; Fan, H. Recent advance in red-emissive carbon dots and their photoluminescent mechanisms. Mater. Today Chem. 2018, 9, 103–113.
[9] Baker, S. N.; Baker, G. A. Luminescent carbon nanodots: Emergent nanolights. Angew. Chem., Int. Ed. 2010, 49, 6726–6744.
[10] Choi, Y.; Kim, S.; Choi, Y.; Song, J.; Kwon, T. H.; Kwon, O. H.; Kim, B. S. Morphology tunable hybrid carbon nanosheets with solvatochromism. Adv. Mater. 2017, 29, 1701075.
[11] Wang, H.; Sun, C.; Chen, X. R.; Zhang, Y.; Colvin, V. L.; Rice, Q.; Seo, J.; Feng, S. Y.; Wang, S. N.; Yu, W. W. Excitation wavelength independent visible color emission of carbon dots. Nanoscale 2017, 9, 1909–1915.
Figure 7 (a) Schematic illustration of the multicolor emission mechanism from M-CDs in aprotic and protic solvents. (b) Emission spectra of three M-CDs/polymer composites excited at 420 nm. (c) Corresponding photos of excited three solid composites. (d) CIE coordinates of M-CDs in solvents and polymers.
Nano Res. 2020, 13(9): 2492–2499
www.theNanoResearch.com∣www.Springer.com/journal/12274 | Nano Research
2499
[12] Jiang, K.; Sun, S.; Zhang, L.; Lu, Y.; Wu, A. G.; Cai, C. Z.; Lin, H. W. Red, green, and blue luminescence by carbon dots: Full-color emission tuning and multicolor cellular imaging. Angew. Chem., Int. Ed. 2015, 54, 5360–5363.
[13] Hu, S. L.; Trinchi, A.; Atkin, P.; Cole, I. Tunable photoluminescence across the entire visible spectrum from carbon dots excited by white light. Angew. Chem., Int. Ed. 2015, 54, 2970–2974.
[14] Bao, L.; Liu, C.; Zhang, Z. L.; Pang, D. W. Photoluminescence-tunable carbon nanodots: Surface-state energy-gap tuning. Adv. Mater. 2015, 27, 1663–1667.
[15] Zhan, J.; Geng, B. J.; Wu, K.; Xu, G.; Wang, L.; Guo, R. Y.; Lei, B.; Zheng, F. F.; Pan, D. Y.; Wu, M. H. A solvent-engineered molecule fusion strategy for rational synthesis of carbon quantum dots with multicolor bandgap fluorescence. Carbon 2018, 130, 153–163.
[16] Yuan, F. L.; Yuan, T.; Sui, L. Z.; Wang, Z. B.; Xi, Z. F.; Li, Y. C.; Li, X. H.; Fan, L. Z.; Tan, Z. A.; Chen, A. M. et al. Engineering triangular carbon quantum dots with unprecedented narrow bandwidth emission for multicolored LEDs. Nat. Commun. 2018, 9, 2249.
[17] Jiang, K.; Zhang, L.; Lu, J. F.; Xu, C. X.; Cai, C. Z.; Lin, H. W. Triple-mode emission of carbon dots: Applications for advanced anti-counterfeiting. Angew. Chem., Int. Ed. 2016, 55, 7231–7235.
[18] Ren, J. K.; Sun, J. B.; Sun, X. M.; Song, R.; Xie, Z.; Zhou, S. Y. Precisely controlled up/down-conversion liquid and solid state photoluminescence of carbon dots. Adv. Opt. Mater. 2018, 6, 1800115.
[19] Reckmeier, C. J.; Wang, Y.; Zboril, R.; Rogach, A. L. Influence of doping and temperature on solvatochromic shifts in optical spectra of carbon dots. J. Phys. Chem. C 2016, 120, 10591–10604.
[20] Sciortino, A.; Marino, E.; van Dam, B.; Schall, P.; Cannas, M.; Messina, F. Solvatochromism unravels the emission mechanism of carbon nanodots. J. Phys. Chem. Lett. 2016, 7, 3419–3423.
[21] Basu, N.; Mandal, D. Solvatochromic response of carbon dots: Evidence of solvent interaction with different types of emission centers. J. Phys. Chem. C 2018, 122, 18732–18741.
[22] Klymchenko, A. S. Solvatochromic and fluorogenic dyes as environment-sensitive probes: Design and biological applications. Acc. Chem. Res. 2017, 50, 366–375.
[23] Mukherjee, S.; Prasad, E.; Chadha, A. H-bonding controls the emission properties of functionalized carbon Nano-dots. Phys. Chem. Chem. Phys. 2017, 19, 7288–7296.
[24] Han, K. L.; Zhao, G. J. Hydrogen Bonding and Transfer in the Excited State; John Wiley & Sons: New York, 2011.
[25] Gierschner, J.; Cornil, J.; Egelhaaf, H. J. Optical bandgaps of π-conjugated organic materials at the polymer limit: Experiment and
theory. Adv. Mater. 2007, 19, 173–191. [26] Hashemi, D.; Ma, X.; Ansari, R.; Kim, J.; Kieffer, J. Design principles
for the energy level tuning in donor/acceptor conjugated polymers. Phys. Chem. Chem. Phys. 2019, 21, 789–799.
[27] Kim, B. G.; Ma, X.; Chen, C.; Le, Y.; Coir, E. W.; Hashemi, H.; Aso, Y.; Green, P. F.; Kieffer, J.; Kim, J. Energy level modulation of HOMO, LUMO, and band-gap in conjugated polymers for organic photovoltaic applications. Adv. Funct. Mater. 2013, 23, 439–445.
[28] Eakins, G. L.; Alford, J. S.; Tiegs, B. J.; Breyfogle, B. E.; Stearman, C. J. Tuning HOMO-LUMO levels: Trends leading to the design of 9-fluorenone scaffolds with predictable electronic and optoelectronic properties. J. Phys. Org. Chem. 2011, 24, 1119–1128.
[29] Dong, Y. Q.; Pang, H. C.; Yang, H. B.; Guo, C. X.; Shao, J. W.; Chi, Y. W.; Li, C. M.; Yu, T. Carbon-based dots co-doped with nitrogen and sulfur for high quantum yield and excitation-independent emission. Angew. Chem., Int. Ed. 2013, 52, 7800–7804.
[30] Jin, S. H.; Kim, D. H.; Jun, G. H.; Hong, S. H.; Jeon, S. Tuning the photoluminescence of graphene quantum dots through the charge transfer effect of functional groups. ACS Nano 2013, 7, 1239–1245.
[31] Chen, X. X.; Jin, Q. Q.; Wu, L. Z.; Tung, C. H.; Tang, X. J. Synthesis and unique photoluminescence properties of nitrogen-rich quantum dots and their applications. Angew. Chem., Int. Ed. 2014, 53, 12542–12547.
[32] Sarkar, S.; Sudolska, M.; Dubecký, M.; Reckmeier, C. J.; Rogach, A. L.; Zboril, R.; Otyepka, M. Graphitic nitrogen doping in carbon dots causes red-shifted absorption. J. Phys. Chem. C 2016, 120, 1303–1308.
[33] Holá, K.; Sudolská, M.; Kalytchuk, S.; Nachtigallová, D.; Rogach, A. L.; Otyepka, M.; Zbořil, R. Graphitic nitrogen triggers red fluorescence in carbon dots. ACS Nano 2017, 11, 12402–12410.
[34] Ong, W. J.; Putri, L. K.; Tan, Y. C.; Tan, L. L.; Li, N.; Ng, Y. H.; Wen, X. M.; Chai, S. P. Unravelling charge carrier dynamics in protonated g-C3N4 interfaced with carbon nanodots as co-catalysts toward enhanced photocatalytic CO2 reduction: A combined experimental and first-principles DFT study. Nano Res. 2017, 10, 1673–1696.
[35] Liang, J.; Jiao, Y.; Jaroniec, M.; Qiao, S. Z. Sulfur and nitrogen dual-doped mesoporous graphene electrocatalyst for oxygen reduction with synergistically enhanced performance. Angew. Chem., Int. Ed. 2012, 51, 11496–11500.
[36] Yang, C. H.; Zhu, S. J.; Li, Z. L.; Li, Z.; Chen, C.; Sun, L.; Tang, W.; Liu, R.; Sun, Y.; Yu, M. Nitrogen-doped carbon dots with excitation- independent long-wavelength emission produced by a room- temperature reaction. Chem. Commun. 2016, 52, 11912–11914.
Related Documents