Wide angle conoscopic interference patterns in uniaxial crystals Francisco E. Veiras, 1, * María T. Garea, 1 and Liliana I. Perez 1,2 1 GLOmAe, Departamento de Física, Facultad de Ingeniería, Universidad de Buenos Aires, Av. Paseo Colón 850, Ciudad Autónoma de Buenos Aires, C1063ACV, Argentina 2 INTECIN CONICET, Av. Paseo Colón 850, Ciudad Autónoma de Buenos Aires, C1063ACV, Argentina *Corresponding author: [email protected] Received 25 January 2012; accepted 19 March 2012; posted 23 March 2012 (Doc. ID 162093); published 18 May 2012 The fringe pattern obtained when a divergent (or convergent) beam goes through a sample of birefringent crystal between two crossed polarizers contains information that is inherent to the crystalline sample under study. The formation of fringe patterns is analyzed from distinct approaches and with different degrees of approximation considering cones of light of large numerical aperture. We obtain analytic explicit formulas of the phase shift on the screen and compare them with the exact numerical solution. The results obtained are valid for arbitrary orientation of the optical axis and are not restricted either to low birefringence or to small angles of incidence. Moreover, they enable the extraction of the main fea- tures related to the characterization of uniaxial crystal slabs, such as the optical axis tilt angle and the principal refractive indices. © 2012 Optical Society of America OCIS codes: 100.2650, 160.1190, 230.5440, 260.1180, 260.1440, 260.3160. 1. Introduction The characterization of uniaxial crystals has been ex- tensively studied since long ago. However, its current importance in diverse fields of science and technol- ogy has reencouraged this challenge. Nowadays, high quality liquid crystal displays, spatial light modula- tors, and birefringent devices demand better char- acterization [ 1– 4] and modeling [ 5, 6]. Moreover, current trends in technology and science require wide angle illumination systems. The first step deals with the accurate determination of the directions of the optical axis and the measurement of the principal indices: n e (extraordinary index) and n o (ordinary index). Several methods have been proposed to mea- sure these characteristics. The measurement meth- ods are generally divided into two types: reflection and transmission. It has been shown in a previous communication [ 4] that a conoscopic measurement by transmission provides information about a crystal sample. As a starting point, plane-parallel uniaxial crystal samples are studied. Plane-parallel uni- axial plates are quite simple and have been widely used in many devices (e.g., wave retarders). They also constitute the building blocks of more complex devices (e.g., twisted nematic LCDs) [ 7]. We consider the particular case where the birefringent element only consists of a plane-parallel plate of uniaxial crystal with arbitrary orientation of the optical axis (i.e., arbitrary optical axis tilt angle). The conoscopic measurements are based on the interference be- tween ordinary waves and extraordinary waves due to a crystal plate sandwiched between crossed polar- izers when it is illuminated by a cone of light (conver- gent or divergent). Experimental fringe patterns corresponding to uniaxial crystals [ 8, 9] show a strong dependence on the direction of the optical axis. More- over, a large numerical aperture (NA) cone of light gives more information about the sample under study [ 10]. This deviation from the paraxial situation leads us to analyze the differences between paraxial 1559-128X/12/153081-10$15.00/0 © 2012 Optical Society of America 20 May 2012 / Vol. 51, No. 15 / APPLIED OPTICS 3081

Welcome message from author
This document is posted to help you gain knowledge. Please leave a comment to let me know what you think about it! Share it to your friends and learn new things together.
Transcript
Wide angle conoscopic interference patternsin uniaxial crystals
Francisco E. Veiras,1,* María T. Garea,1 and Liliana I. Perez1,2
1GLOmAe, Departamento de Física, Facultad de Ingeniería, Universidad de Buenos Aires, Av. Paseo Colón 850,Ciudad Autónoma de Buenos Aires, C1063ACV, Argentina
2INTECIN CONICET, Av. Paseo Colón 850, Ciudad Autónoma de Buenos Aires, C1063ACV, Argentina
*Corresponding author: [email protected]
Received 25 January 2012; accepted 19 March 2012;posted 23 March 2012 (Doc. ID 162093); published 18 May 2012
The fringe pattern obtained when a divergent (or convergent) beam goes through a sample of birefringentcrystal between two crossed polarizers contains information that is inherent to the crystalline sampleunder study. The formation of fringe patterns is analyzed from distinct approaches and with differentdegrees of approximation considering cones of light of large numerical aperture. We obtain analyticexplicit formulas of the phase shift on the screen and compare them with the exact numerical solution.The results obtained are valid for arbitrary orientation of the optical axis and are not restricted either tolow birefringence or to small angles of incidence. Moreover, they enable the extraction of the main fea-tures related to the characterization of uniaxial crystal slabs, such as the optical axis tilt angle and theprincipal refractive indices. © 2012 Optical Society of AmericaOCIS codes: 100.2650, 160.1190, 230.5440, 260.1180, 260.1440, 260.3160.
1. Introduction
The characterization of uniaxial crystals has been ex-tensively studied since long ago. However, its currentimportance in diverse fields of science and technol-ogy has reencouraged this challenge. Nowadays, highquality liquid crystal displays, spatial light modula-tors, and birefringent devices demand better char-acterization [1–4] and modeling [5,6]. Moreover,current trends in technology and science requirewide angle illumination systems. The first step dealswith the accurate determination of the directions ofthe optical axis and themeasurement of the principalindices: ne (extraordinary index) and no (ordinaryindex). Several methods have been proposed to mea-sure these characteristics. The measurement meth-ods are generally divided into two types: reflectionand transmission. It has been shown in a previouscommunication [4] that a conoscopic measurement
by transmission provides information about a crystalsample. As a starting point, plane-parallel uniaxialcrystal samples are studied. Plane-parallel uni-axial plates are quite simple and have been widelyused in many devices (e.g., wave retarders). Theyalso constitute the building blocks of more complexdevices (e.g., twisted nematic LCDs) [7]. We considerthe particular case where the birefringent elementonly consists of a plane-parallel plate of uniaxialcrystal with arbitrary orientation of the optical axis(i.e., arbitrary optical axis tilt angle). The conoscopicmeasurements are based on the interference be-tween ordinary waves and extraordinary waves dueto a crystal plate sandwiched between crossed polar-izers when it is illuminated by a cone of light (conver-gent or divergent). Experimental fringe patternscorresponding to uniaxial crystals [8,9] show a strongdependence on the direction of the optical axis. More-over, a large numerical aperture (NA) cone of lightgives more information about the sample understudy [10]. This deviation from the paraxial situationleads us to analyze the differences between paraxial
1559-128X/12/153081-10$15.00/0© 2012 Optical Society of America
20 May 2012 / Vol. 51, No. 15 / APPLIED OPTICS 3081

and nonparaxial approximations. First, we explainthe experimental setup and the models that allow forthe description of its results. Second, we analyze thedifference between the distinct approximations, theirvalidity, and how to easily extract information on thesample under study.
2. Experimental Setup
There are diverse ways of obtaining a conoscopicinterference pattern. We analyze one of themost sim-ple experimental setups that allows us to obtain awide angle conoscopic interference pattern. It con-sists of a source of monochromatic linearly polarizedlight (HeNe laser λ � 632.8 nm). Then a diffuser(grounded glass) is placed following the beam axis(x axis) in order to expand the beam divergenceand generate a smooth speckle pattern of high NA[11–14]. After that, we place a crystal sample ofthickness H sandwiched between a polarizer andan analyzer. Then a fringe pattern is collected on aprojecting screen that is placed at a distance xD fromthe first interface of the crystal (Fig. 1). However,more complex experimental setups can be arranged.For instance, it is also possible to use high NA lensesto get a converging beam and reduce the size of thescreen (recording medium).
The intensity of the light on the screen (plane�y; z�) can be calculated as the resulting interferenceof waves
I � Io � Ie � 2�IoIe�12 cos Δϕ; (1)
where the intensities Io and Ie correspond to the or-dinary and the extraordinary beams, respectively,and Δϕ corresponds to the phase shift between theordinary and the extraordinary waves. We do notconsider differences between the intensities of bothbeams. Moreover, the intensities of ordinary and ex-traordinary beams are considered uniform on thesurface of the screen.
3. Ray Tracing for Conical Beams
As known, ray tracing is widely used in optics, due tothe fact that it is a fundamental tool for the design ofoptical instruments. Moreover, it has been used toanalyze the first order geometrical deformations that
a limited beam suffers when it propagates, reflects,or transmits through an optical device for isotropic oranisotropic media [15–20]. The paraxial or the non-paraxial approaches are used in accordance with thecharacteristics of the device (material, shape, use,etc.) and the difficulty of ray-tracing formulas. Whendealing with anisotropic media, ray tracing for theordinary wave is the same as in isotropic media,but it is more difficult for the extraordinary wave. Inthis case, the directions of the normal to the wave-front and the ray direction are generally nonidenticaland the ray may not be contained in the plane ofincidence. These complex characteristics have stimu-lated the use of paraxial approximations. Neverthe-less, when considering a conic cylindrical beamnormally impinging on an arbitrary plane-parallelplate of uniaxial crystal, it is relatively simple to ob-tain nonparaxial formulas [21–24]. We analyze thetransmitted extraordinary rays that correspond todifferent separate surfaces of impinging rays for dis-tinct apertures. Each ray diverges from (or convergesto) point P, which is located along the x axis at x � xPand impinges on the first interface at an angle of in-cidence α. The angle δ is the angle between the planeof incidence and the optical axis projection on the in-terface (Fig. 2). The principal refractive indices of thecrystal are no and ne, and the surrounding mediumindex is n.
Fig. 1. (Color online) Scheme of the experience. Light propagates in the direction of the x axis, while the screen is placed perpendicular toit. θ is the angle between the optical axis and the interface, �x; y; z�, is the lab frame fixed to the first interface of the crystal where z is theprojection of the optical axis on the interface of the plate. The diffuser is located at xP and the screen at xD.
Fig. 2. (Color online) A ray impinging on the first interface �x �0� of a plane-parallel uniaxial plate. �x; σ; t� is the coordinate sys-tem associated to the incident wave. x, t is the plane of incidence.As in Fig. 1(b), �x; y; z� is the lab frame. θ is the angle between theoptical axis and the interface.
3082 APPLIED OPTICS / Vol. 51, No. 15 / 20 May 2012
By means of exact geometrical ray tracing, it ispossible to determine the location of the points of in-tersection (either real or virtual) of both ordinary andextraordinary rays (Fig. 3). The points of intersectionfor ordinary rays can be found along the x axis
Xo�α� � xP �H�1 −
n cos α�n2
o − n2 sin2 α�12
�(2)
resulting in a different point on the x axis for eachimpinging conical surface of rays of aperture α con-sidered. If xP < 0, the beam considered is divergingfrom a point source P, whereas if xP > 0, it is conver-ging to a point P. Here xP is the distance between thefirst interface and the point P. If xP > 0, then P is thepoint of convergence of a converging beam that is im-pinging on the plate. On the other hand, if xP < 0,then P is the point of divergence of a diverging beam.In both cases, spherically shaped beams impinge onthe first interface.
The convergence of extraordinary rays is quite dis-similar. Because of the astigmatism, the points ofintersection are located on two principal planes.One of them corresponds to the plane z � Δz [9,25]
Δz � −H�n2
e − n2o� sin θ cos θ
n2o cos2 θ� n2
e sin2 θ . (3)
On this plane, we find the intersection of the pairsof rays corresponding to δ and �π − δ�. The x coordi-nate of the points of intersection on this planeXeZ�α; δ� is
XeZ�α;δ��xP�H�1
−nn2
eno cosαhx�n2
ehx−�n2e cos2δ�hxsin2δ�n2sin2α�12
�; (4)
where hx � n2o cos2 θ� n2
e sin2 θ has been defined asan auxiliary parameter in [23]. For the same imping-ing conical surface of rays, we also find the intersec-tion of the pairs of extraordinary rays correspondingto δ and −δ. In this case, this intersection takes place
on the other principal plane corresponding to y � 0,where the x coordinate XeY �α; δ� of the points of inter-section is given by
XeY �α;δ�� xP�H�1
−nno cos α
�n2ehx − �n2
e cos2 δ�hx sin2 δ�n2 sin2α�12
�. (5)
These exact ray tracing formulas allow us to depictthe location of the intersection points of both ordin-ary and extraordinary rays (Fig. 3). We considerquartz plates (no � 1.5426 and ne � 1.5516) in twodistinguishable cases of special symmetry. One ofthem corresponds to the optical axis parallel to theinterfaces, i.e., tilt angle θ � 0 [Fig. 3(a)]. In this case,the displacement Δz is zero [Eq. (3)] and both ordin-ary and extraordinary beams are coaxial. The otherone corresponds to a tilt angle of θ � 45° [Fig. 3(b)].This value of θ makes the displacement Δz approxi-mate to its maximum. The absolute value of this dis-placement reaches a maximum when the anglebetween the optical axis and the interfaces is
θ⌊Δz max � � arccos�
ne
�n2e � n2
o�12
�. (6)
For quartz plane-parallel plates, it corresponds toθ � 44.83°. For Fig. 3 we calculated the intersectionpoints that correspond to discrete apertures(α � 0°; 5°; 10°; 15°). Each impinging conical surfaceof rays represented by 36 rays (δ in 10° steps) canbe analyzed separately. In the ordinary case, eachsurface of rays results in the intersection of all ofits rays in a single point along the x axis. In the ex-traordinary case, each surface of rays results in theintersection of rays on two lines where each dot alongthese lines consists in the intersection of two rays(except δ � 0°; 90°; 180°; 270°). One of them is paral-lel to the z axis, and the other is parallel to the y axis.Each extraordinary ray intersects both lines and thescreen where the fringe pattern is recovered.
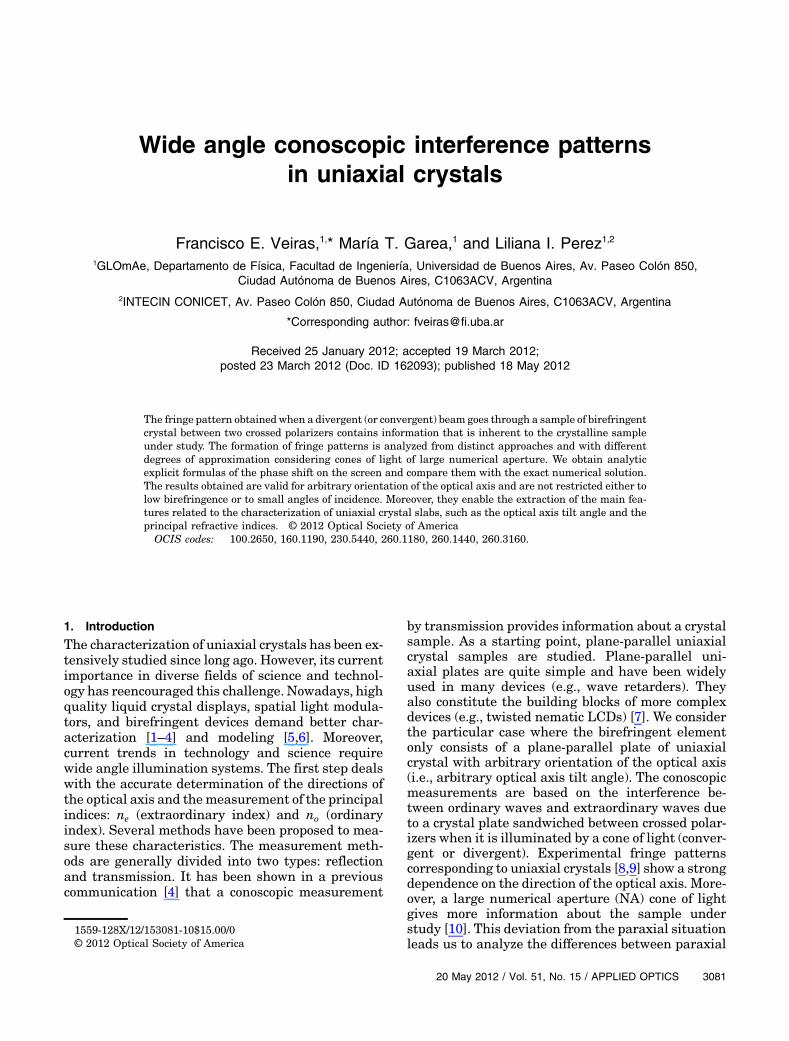
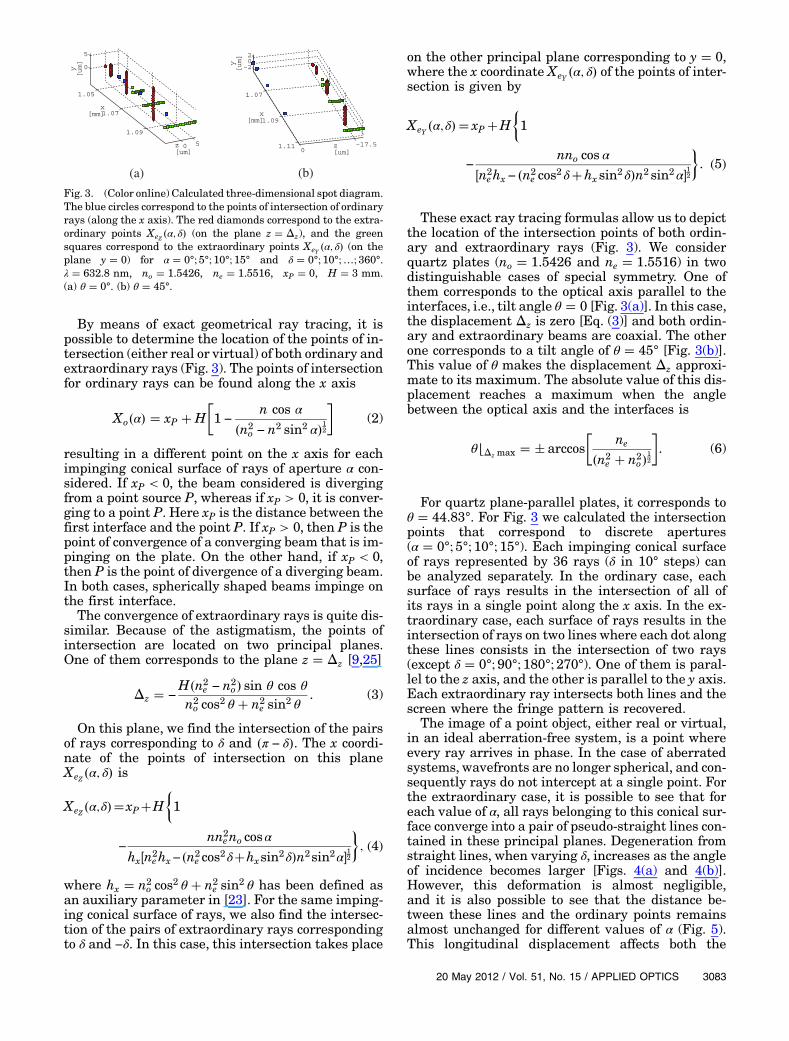
The image of a point object, either real or virtual,in an ideal aberration-free system, is a point whereevery ray arrives in phase. In the case of aberratedsystems, wavefronts are no longer spherical, and con-sequently rays do not intercept at a single point. Forthe extraordinary case, it is possible to see that foreach value of α, all rays belonging to this conical sur-face converge into a pair of pseudo-straight lines con-tained in these principal planes. Degeneration fromstraight lines, when varying δ, increases as the angleof incidence becomes larger [Figs. 4(a) and 4(b)].However, this deformation is almost negligible,and it is also possible to see that the distance be-tween these lines and the ordinary points remainsalmost unchanged for different values of α (Fig. 5).This longitudinal displacement affects both the
(a) (b)
Fig. 3. (Color online) Calculated three-dimensional spot diagram.The blue circles correspond to the points of intersection of ordinaryrays (along the x axis). The red diamonds correspond to the extra-ordinary points XeZ �α; δ� (on the plane z � Δz), and the greensquares correspond to the extraordinary points XeY �α; δ� (on theplane y � 0) for α � 0°; 5°; 10°; 15° and δ � 0°; 10°;…; 360°.λ � 632.8 nm, no � 1.5426, ne � 1.5516, xP � 0, H � 3 mm.(a) θ � 0°. (b) θ � 45°.
20 May 2012 / Vol. 51, No. 15 / APPLIED OPTICS 3083
ordinary and the extraordinary wavefronts in a simi-lar way (i.e., we have approximately the sameamount of defocus for ordinary and extraordin-ary waves).
If we take the limit as α → 0° on Eqs. (2), (4), and(5) (i.e., small angle or paraxial approach), we obtainthe location of a point image for the ordinary caseand an astigmatic image for the extraordinary case[9]. This way, the ordinary image is located in
xord � xP �H�1 −
nno
�; (7)
and the extraordinary image is determined by thelocalization of the two foci lines
xeZ � xP �H�1 −
nneno
�n2o cos2 θ� n2
e sin2 θ�32
�; (8)
xeY � xP �H�1 −
nno
ne�n2o cos2 θ� n2
e sin2 θ�12
�. (9)
4. Phase Shift Calculation
In this section, we calculate the phase shift by dif-ferent approaches. We obtain the formulas of thephase shift between waves on the screen of coordi-nates �xD; y; z�.A. Image formation approach
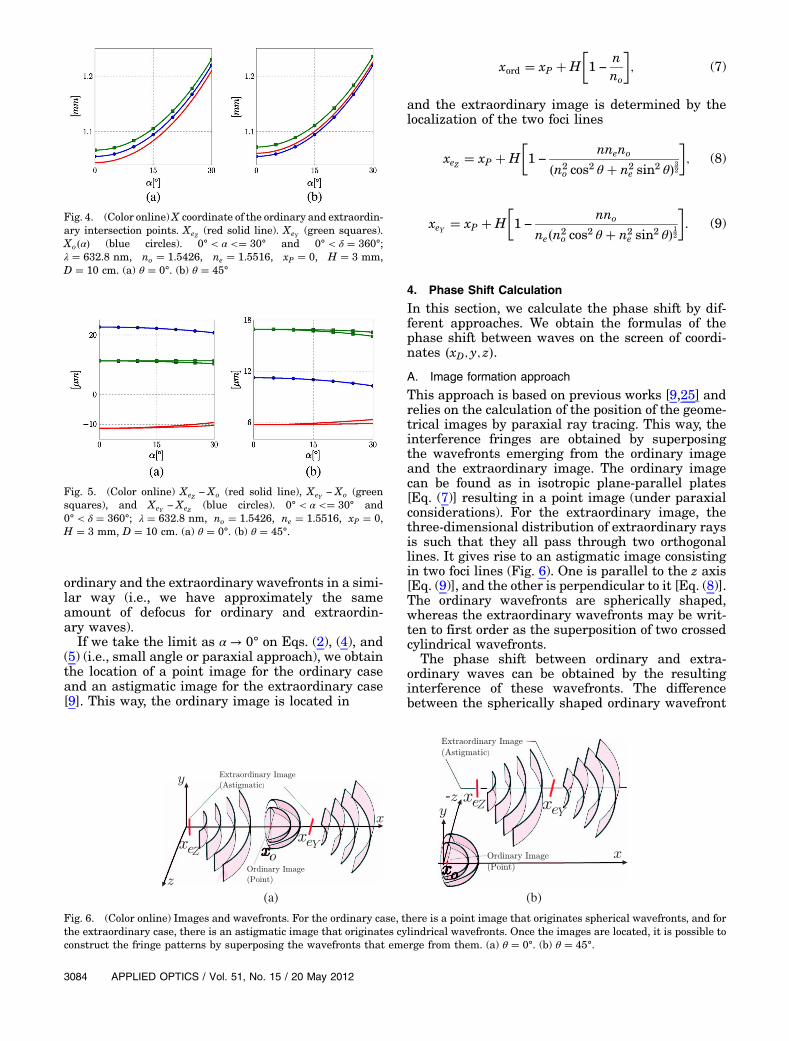
This approach is based on previous works [9,25] andrelies on the calculation of the position of the geome-trical images by paraxial ray tracing. This way, theinterference fringes are obtained by superposingthe wavefronts emerging from the ordinary imageand the extraordinary image. The ordinary imagecan be found as in isotropic plane-parallel plates[Eq. (7)] resulting in a point image (under paraxialconsiderations). For the extraordinary image, thethree-dimensional distribution of extraordinary raysis such that they all pass through two orthogonallines. It gives rise to an astigmatic image consistingin two foci lines (Fig. 6). One is parallel to the z axis[Eq. (9)], and the other is perpendicular to it [Eq. (8)].The ordinary wavefronts are spherically shaped,whereas the extraordinary wavefronts may be writ-ten to first order as the superposition of two crossedcylindrical wavefronts.
The phase shift between ordinary and extra-ordinary waves can be obtained by the resultinginterference of these wavefronts. The differencebetween the spherically shaped ordinary wavefront
Fig. 4. (Color online)X coordinate of the ordinary and extraordin-ary intersection points. XeZ (red solid line). XeY (green squares).Xo�α� (blue circles). 0° < α <� 30° and 0° < δ � 360°;λ � 632.8 nm, no � 1.5426, ne � 1.5516, xP � 0, H � 3 mm,D � 10 cm. (a) θ � 0°. (b) θ � 45°
Fig. 5. (Color online) XeZ − Xo (red solid line), XeY − Xo (greensquares), and XeY − XeZ (blue circles). 0° < α <� 30° and0° < δ � 360°; λ � 632.8 nm, no � 1.5426, ne � 1.5516, xP � 0,H � 3 mm, D � 10 cm. (a) θ � 0°. (b) θ � 45°.
(a) (b)
Fig. 6. (Color online) Images and wavefronts. For the ordinary case, there is a point image that originates spherical wavefronts, and forthe extraordinary case, there is an astigmatic image that originates cylindrical wavefronts. Once the images are located, it is possible toconstruct the fringe patterns by superposing the wavefronts that emerge from them. (a) θ � 0°. (b) θ � 45°.
3084 APPLIED OPTICS / Vol. 51, No. 15 / 20 May 2012

and the astigmatically aberrated extraordinarywavefront gives rise to an optical path difference(OPD) on a plane parallel to the plate of coordinates�xD; y; z�
Δϕaberra � 2πnλv
�y2
xo − xeY2�xD − xo��xD − xeY �
� z2xo − xeZ
2�xD − xo��xD − xeZ�� z
Δz
xD − xeZ
�. (10)
Under the assumptions we made, this phase shifttakes into account the difference between the aberra-tion-free ordinary wavefront and the aberratedextraordinary wavefront. Higher order aberrationshave not been considered in this approach. The aber-rations considered are the lateral shift Δz and theastigmatism, whereas longitudinal defocus has notbeen considered, since it has poor influence, as itaffects both ordinary and extraordinary wavefrontsin a similar way. In order to obtain the total amountof phase shift on the screen, we have to add the OPDbetween the ordinary and extraordinary waves fornormal incidence to Δϕaberra�y; z�,
Δϕimage�y; z� � Δϕaberra�y; z� �Δϕα�0; (11)
where Δϕα�0 (Eq. (19) in [5]) is the phase differencebetween the ordinary and extraordinary waves in thecenter of the screen
Δϕα�0 � 2πλv
H�no − n00α�0� (12)
with n00α�0,
n00α�0 � none
�n2o cos2 θ� n2
e sin2 θ�12�13�
being the index of refraction associated to the extra-ordinary wave for normal incidence.
If the distance between the localization of the para-xial images and the screen is such that xD − xo≃xD − xeZ ≃ xD − xeY , we can approximate all of thesequantities by ρ≐xD − xo. Thus, by replacing Eqs. (10),(12), and (13) in Eq. (11), we recover the result ob-tained in [9], where it is shown that the phase shiftΔϕ between the ordinary and the extraordinary
waves on the screen is given by a conic formula(Eqs. (42)–(44) in [9])
Δϕimage�xD; y; z�
≃2πHλv
�A� n
Bjρj z� n2 CY
ρ2 y2 � n2 CZ
ρ2 z2�; (14)
where for A, B, CY , and CZ,
A � no −none
�n2o cos2 θ� n2
e sin2 θ�12; (15)
B � �n2o − n2
e � sin θ cos θ�n2
o cos2 θ� n2e sin2 θ� ; (16)
CY � n2o − ne�n2
o cos2 θ� n2e sin2 θ�12
2none�n2o cos2 θ� n2
e sin2 θ�12; (17)
CZ � n2one − �n2
o cos2 θ� n2e sin2 θ�32
2no�n2o cos2 θ� n2
e sin2 θ�32. (18)
On the one hand, the whole expression correspond-ing toΔϕimage�xD; y; z� depends on the characteristicsof both the uniaxial crystal sample (refractive in-dices, orientation of the optical axis, and thickness)and the design of the experience (Fig. 1). On the otherhand, A, B, CY , and CZ only depend on the principalrefractive indices no and ne, and the angle θ betweenthe optical axis and the interfaces.
B. Nonapproximated approach
In a previous communication [5], we obtained anexplicit formula for the phase shift introduced byan anisotropic uniaxial plane–parallel plate witharbitrary orientation of the optical axis when the in-cident plane wave has an arbitrary direction
Δϕexact�α; δ� �2πHλv
��n2
o − n2 sin2 α�12 � n�n2o − n2
e � sin θ cos θ cos δ sin αn2e sin2 θ� n2
o cos2 θ
� −nofn2e �n2
e sin2 θ� n2o cos2 θ� − �n2
e − �n2e − n2
o�cos2 θ sin2 δ�n2 sin2 αg12n2e sin2 θ� n2
o cos2 θ
�. (19)
This expression is also suitable for calculating thephase shift on the screen as long as we place it at theFraunhofer zone. If the screen is far enough, the dis-tance between the emerging ordinary and extraor-dinary wavefronts remains almost unchanged, andit is possible to calculate the phase shift by meansof Eq. (19). In order to obtain the resulting interfer-ence between waves as a function of the coordinatesof the screen �xD; y; z�, we have to calculate the phase
20 May 2012 / Vol. 51, No. 15 / APPLIED OPTICS 3085

shift between them on this surface. Because of itssimplicity, we follow the ordinary rays instead ofthe extraordinary ones that are a bit more difficult.The incident rays impinge with a direction given by�α; δ�, and we follow the ordinary ones from the firstinterface of the plate up to the screen. This way, thecoordinates of the screen and the angle of incidence αare exactly related by
�y2 � z2�12 � �xD −H − xP� tan α�Hn sin α
�n2o − n2 sin2 α�12
.
(20)
It is not possible to obtain an exact explicit analyticexpression for α as a function of y, z. However, it ispossible to numerically solve Eq. (20) and find foreach point of the screen �xD; y; z� the correspondingvalue of sin α. For the azimuth angle, δ, it is easyto find the relationship with the screen coordinates
cos δ � z
�y2 � z2�12; sin2 δ � y2
y2 � z2. (21)
By means of Eqs. (20) and (21), it is possible to nu-merically obtain the exact phase shiftΔϕexact�xD; y; z�as a function of the coordinates of the screen andthen the corresponding interference pattern. Bymaking approximations, it is possible to obtain expli-cit expressions of the phase shift as a function of thecoordinates of the screen.
1. Different approximations on the exact phaseshift formulasThe first approximation we proposed is based on ageometry relation between sin α, the points of inter-section of the ordinary rays Xo�α� [Eq. (2)], and thecoordinates of the screen
sin α ��
y2 � z2
�xD − Xo�α��2 � y2 � z2
�12
. (22)
If xD ≫ Xo�α� for every value of α considered, it ispossible to estimate
sin α≃
�y2 � z2
�xD − xo�2 � y2 � z2
�12
. (23)
For small angles, we can see that if α tends to zero,Xo�α� tends to xo. On the other hand, for large valuesof α (i.e., large values of y2 � z2), the differences be-tween xD − Xo�α� and xD − xo are minimal in compar-ison to the value of y2 � z2. This first approximationallows us to obtain a quasi nonparaxial but explicitand analytic expression ΔϕQNP�xD; y; z� by replacingEqs. (21) and (23) in Eq. (19). In order to reduce thecomplexity of ΔϕQNP�xD; y; z�, several approxima-
tions could be proposed. Even though higher orderexpansions could be made, we propose anotherapproximation by developingΔϕexact�α; δ� to a secondorder expansion in sin α
Δϕsec�α; δ� �2πHλv
�A� B cos δn sin α
� �CY sin2 δ� CZ cos2 δ�n2 sin2 α�; (24)
where A, B, CY , and CZ coincide with those obtainedin Eqs. (15), (16), (17), and (18). If we replace Eqs. (21)and (23) in Eq. (24), we obtain an explicit approxima-tion of the phase shift Δϕsec�xD; y; z� (less accuratethan ΔϕQNP�xD; y; z�).
Finally, if we expand ΔϕQNP�xD; y; z� to second or-der in y, z, we recover the expression correspondingto Δϕimage�xD; y; z� [Eq. (14)]. Even though it is alsopossible to develop higher order expansions and findhigher order terms, we will thoroughly investigatethis expression due to its simplicity.
In the following section, we will compare the differ-ent approximations we obtained, ΔϕQNP�xD; y; z�,Δϕsec�xD; y; z�, andΔϕimage�xD; y; z�, by means of com-puter generated interferograms. We will analyze thefringe formation by means of these three differentexplicit formulas of the phase shift, and we will com-pare them to the exact formulas.
5. Computer Generated Interferograms
The intensity of the light on the screen can be calcu-lated as the resulting interference of waves by repla-cing the considered value ofΔϕ�xD; y; z� in Eq. (1). Bymeans of this formula and the proper parameters, wegenerate computer intensity images of the fringe pat-terns that are similar to those that can be experimen-tally obtained [9]. Since approximations were madearound normal incidence, it will be expectable to ob-tain differences for high NA conoscopic figures. FromEqs. (14), (19), and (24), we can observe that differ-ences between approximations are sensible to largeapertures and are also amplified by a factor H∕λv.In order to make comparisons, we set experimen-tally achievable practical values of both param-eters, which allow us to see the differences due totheir corresponding amplification factor: H � 3 mmand λ � 632.8 nm. We placed the point source atxP � 0, just on the first interface of a quartz slab.The screen is placed at xD � 10 cm, and it is a10 cm × 10 cm square surface.
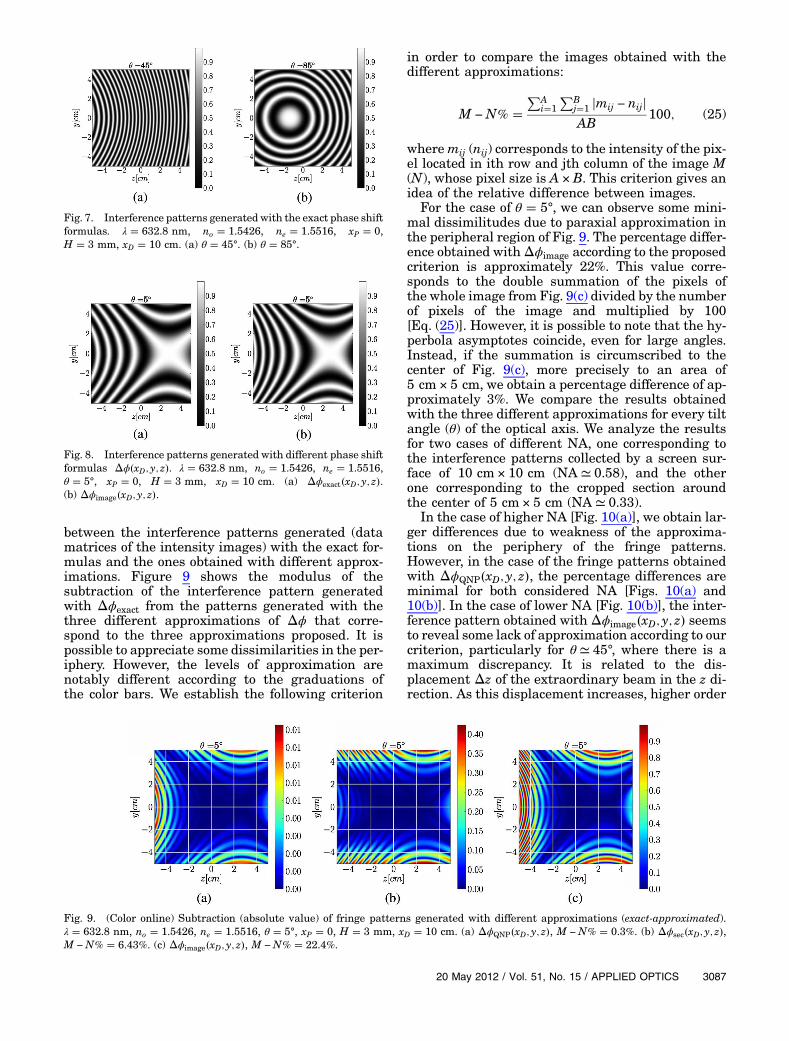
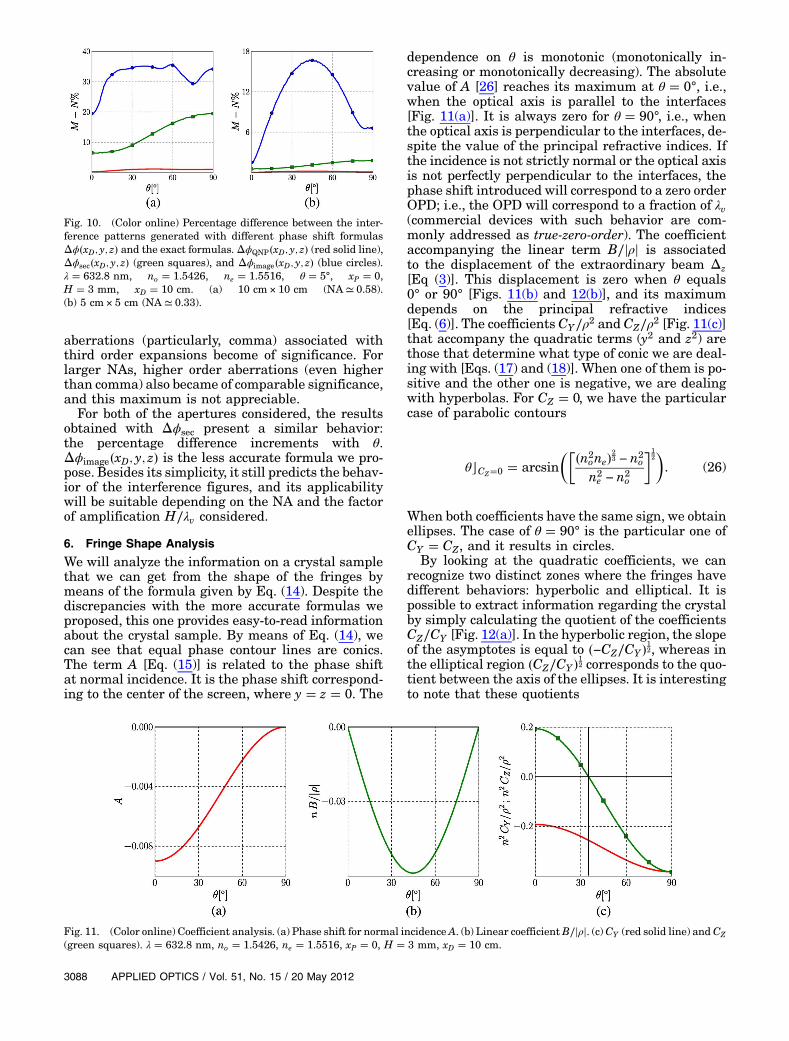
In order to illustrate the behavior of the crystals,we arbitrarily select three distinct tilt angles of theoptical axis, θ (45°; 85°, and θ � 5°), which are ex-amples of the different fringe shapes that uniaxialplane-parallel plates can provide. Figures 7(a),7(b), and 8(a) were calculated with the exactformulas.
For the case of θ � 5°, fringes are hyperbolas. InFigs. 8(a) and 8(b), we show the results of calcula-tions with the exact formulas and with the less accu-rate one (Δϕimage�xD; y; z�). Since disparities cannotbe fully appreciated, we calculate the subtraction
3086 APPLIED OPTICS / Vol. 51, No. 15 / 20 May 2012
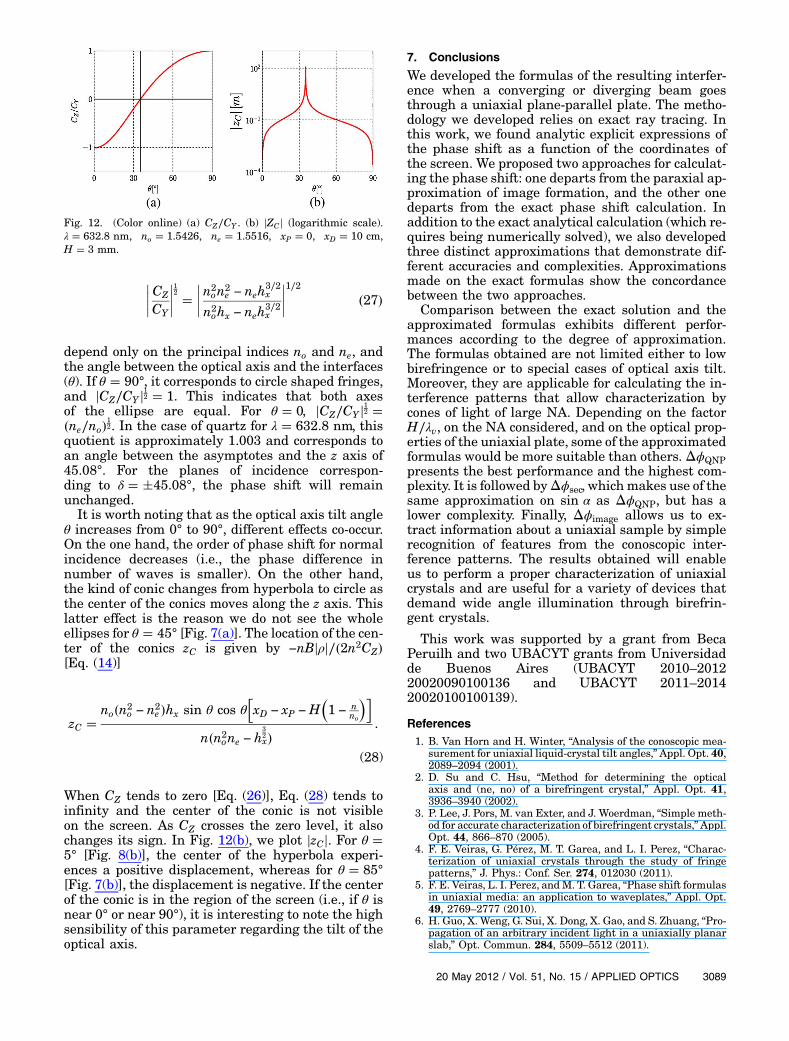
between the interference patterns generated (datamatrices of the intensity images) with the exact for-mulas and the ones obtained with different approx-imations. Figure 9 shows the modulus of thesubtraction of the interference pattern generatedwith Δϕexact from the patterns generated with thethree different approximations of Δϕ that corre-spond to the three approximations proposed. It ispossible to appreciate some dissimilarities in the per-iphery. However, the levels of approximation arenotably different according to the graduations ofthe color bars. We establish the following criterion
in order to compare the images obtained with thedifferent approximations:
M −N% �PA
i�1
PBj�1 jmij − nijjAB
100; (25)
wheremij (nij) corresponds to the intensity of the pix-el located in ith row and jth column of the image M(N), whose pixel size is A × B. This criterion gives anidea of the relative difference between images.
For the case of θ � 5°, we can observe some mini-mal dissimilitudes due to paraxial approximation inthe peripheral region of Fig. 9. The percentage differ-ence obtained withΔϕimage according to the proposedcriterion is approximately 22%. This value corre-sponds to the double summation of the pixels ofthe whole image from Fig. 9(c) divided by the numberof pixels of the image and multiplied by 100[Eq. (25)]. However, it is possible to note that the hy-perbola asymptotes coincide, even for large angles.Instead, if the summation is circumscribed to thecenter of Fig. 9(c), more precisely to an area of5 cm × 5 cm, we obtain a percentage difference of ap-proximately 3%. We compare the results obtainedwith the three different approximations for every tiltangle (θ) of the optical axis. We analyze the resultsfor two cases of different NA, one corresponding tothe interference patterns collected by a screen sur-face of 10 cm × 10 cm (NA ≃ 0.58), and the otherone corresponding to the cropped section aroundthe center of 5 cm × 5 cm (NA ≃ 0.33).
In the case of higher NA [Fig. 10(a)], we obtain lar-ger differences due to weakness of the approxima-tions on the periphery of the fringe patterns.However, in the case of the fringe patterns obtainedwith ΔϕQNP�xD; y; z�, the percentage differences areminimal for both considered NA [Figs. 10(a) and10(b)]. In the case of lower NA [Fig. 10(b)], the inter-ference pattern obtained with Δϕimage�xD; y; z� seemsto reveal some lack of approximation according to ourcriterion, particularly for θ ≃ 45°, where there is amaximum discrepancy. It is related to the dis-placement Δz of the extraordinary beam in the z di-rection. As this displacement increases, higher order
Fig. 9. (Color online) Subtraction (absolute value) of fringe patterns generated with different approximations (exact-approximated).λ � 632.8 nm, no � 1.5426, ne � 1.5516, θ � 5°, xP � 0, H � 3 mm, xD � 10 cm. (a) ΔϕQNP�xD; y; z�, M −N% � 0.3%. (b) Δϕsec�xD; y; z�,M −N% � 6.43%. (c) Δϕimage�xD; y; z�, M −N% � 22.4%.
Fig. 8. Interference patterns generated with different phase shiftformulas Δϕ�xD; y; z�. λ � 632.8 nm, no � 1.5426, ne � 1.5516,θ � 5°, xP � 0, H � 3 mm, xD � 10 cm. (a) Δϕexact�xD; y; z�.(b) Δϕimage�xD; y; z�.
Fig. 7. Interference patterns generated with the exact phase shiftformulas. λ � 632.8 nm, no � 1.5426, ne � 1.5516, xP � 0,H � 3 mm, xD � 10 cm. (a) θ � 45°. (b) θ � 85°.
20 May 2012 / Vol. 51, No. 15 / APPLIED OPTICS 3087
aberrations (particularly, comma) associated withthird order expansions become of significance. Forlarger NAs, higher order aberrations (even higherthan comma) also became of comparable significance,and this maximum is not appreciable.
For both of the apertures considered, the resultsobtained with Δϕsec present a similar behavior:the percentage difference increments with θ.Δϕimage�xD; y; z� is the less accurate formula we pro-pose. Besides its simplicity, it still predicts the behav-ior of the interference figures, and its applicabilitywill be suitable depending on the NA and the factorof amplification H∕λv considered.
6. Fringe Shape Analysis
We will analyze the information on a crystal samplethat we can get from the shape of the fringes bymeans of the formula given by Eq. (14). Despite thediscrepancies with the more accurate formulas weproposed, this one provides easy-to-read informationabout the crystal sample. By means of Eq. (14), wecan see that equal phase contour lines are conics.The term A [Eq. (15)] is related to the phase shiftat normal incidence. It is the phase shift correspond-ing to the center of the screen, where y � z � 0. The
dependence on θ is monotonic (monotonically in-creasing or monotonically decreasing). The absolutevalue of A [26] reaches its maximum at θ � 0°, i.e.,when the optical axis is parallel to the interfaces[Fig. 11(a)]. It is always zero for θ � 90°, i.e., whenthe optical axis is perpendicular to the interfaces, de-spite the value of the principal refractive indices. Ifthe incidence is not strictly normal or the optical axisis not perfectly perpendicular to the interfaces, thephase shift introduced will correspond to a zero orderOPD; i.e., the OPD will correspond to a fraction of λv(commercial devices with such behavior are com-monly addressed as true-zero-order). The coefficientaccompanying the linear term B∕jρj is associatedto the displacement of the extraordinary beam Δz[Eq (3)]. This displacement is zero when θ equals0° or 90° [Figs. 11(b) and 12(b)], and its maximumdepends on the principal refractive indices[Eq. (6)]. The coefficients CY∕ρ2 and CZ∕ρ2 [Fig. 11(c)]that accompany the quadratic terms (y2 and z2) arethose that determine what type of conic we are deal-ing with [Eqs. (17) and (18)]. When one of them is po-sitive and the other one is negative, we are dealingwith hyperbolas. For CZ � 0, we have the particularcase of parabolic contours
θ⌋CZ�0 � arcsin���n2
one�23 − n2o
n2e − n2
o
�12�. (26)
When both coefficients have the same sign, we obtainellipses. The case of θ � 90° is the particular one ofCY � CZ, and it results in circles.
By looking at the quadratic coefficients, we canrecognize two distinct zones where the fringes havedifferent behaviors: hyperbolic and elliptical. It ispossible to extract information regarding the crystalby simply calculating the quotient of the coefficientsCZ∕CY [Fig. 12(a)]. In the hyperbolic region, the slopeof the asymptotes is equal to �−CZ∕CY�12, whereas inthe elliptical region �CZ∕CY�12 corresponds to the quo-tient between the axis of the ellipses. It is interestingto note that these quotients
Fig. 11. (Color online) Coefficient analysis. (a) Phase shift for normal incidenceA. (b) Linear coefficientB∕jρj. (c)CY (red solid line) andCZ
(green squares). λ � 632.8 nm, no � 1.5426, ne � 1.5516, xP � 0, H � 3 mm, xD � 10 cm.
Fig. 10. (Color online) Percentage difference between the inter-ference patterns generated with different phase shift formulasΔϕ�xD; y; z� and the exact formulas.ΔϕQNP�xD; y; z� (red solid line),Δϕsec�xD; y; z� (green squares), and Δϕimage�xD; y; z� (blue circles).λ � 632.8 nm, no � 1.5426, ne � 1.5516, θ � 5°, xP � 0,H � 3 mm, xD � 10 cm. (a) 10 cm × 10 cm (NA ≃ 0.58).(b) 5 cm × 5 cm (NA ≃ 0.33).
3088 APPLIED OPTICS / Vol. 51, No. 15 / 20 May 2012
����CZ
CY
����12 �
����n2on2
e − neh3∕2x
n2ohx − neh
3∕2x
����1∕2
�27�
depend only on the principal indices no and ne, andthe angle between the optical axis and the interfaces(θ). If θ � 90°, it corresponds to circle shaped fringes,and jCZ∕CY j12 � 1. This indicates that both axesof the ellipse are equal. For θ � 0, jCZ∕CY j12 ��ne∕no�12. In the case of quartz for λ � 632.8 nm, thisquotient is approximately 1.003 and corresponds toan angle between the asymptotes and the z axis of45.08°. For the planes of incidence correspon-ding to δ � �45.08°, the phase shift will remainunchanged.
It is worth noting that as the optical axis tilt angleθ increases from 0° to 90°, different effects co-occur.On the one hand, the order of phase shift for normalincidence decreases (i.e., the phase difference innumber of waves is smaller). On the other hand,the kind of conic changes from hyperbola to circle asthe center of the conics moves along the z axis. Thislatter effect is the reason we do not see the wholeellipses for θ � 45° [Fig. 7(a)]. The location of the cen-ter of the conics zC is given by −nBjρj∕�2n2CZ�[Eq. (14)]
zC �no�n2
o − n2e �hx sin θ cos θ
hxD − xP −H
�1 −
nno
i
n�n2one − h
32x�
.
(28)
When CZ tends to zero [Eq. (26)], Eq. (28) tends toinfinity and the center of the conic is not visibleon the screen. As CZ crosses the zero level, it alsochanges its sign. In Fig. 12(b), we plot jzCj. For θ �5° [Fig. 8(b)], the center of the hyperbola experi-ences a positive displacement, whereas for θ � 85°[Fig. 7(b)], the displacement is negative. If the centerof the conic is in the region of the screen (i.e., if θ isnear 0° or near 90°), it is interesting to note the highsensibility of this parameter regarding the tilt of theoptical axis.
7. Conclusions
We developed the formulas of the resulting interfer-ence when a converging or diverging beam goesthrough a uniaxial plane-parallel plate. The metho-dology we developed relies on exact ray tracing. Inthis work, we found analytic explicit expressions ofthe phase shift as a function of the coordinates ofthe screen. We proposed two approaches for calculat-ing the phase shift: one departs from the paraxial ap-proximation of image formation, and the other onedeparts from the exact phase shift calculation. Inaddition to the exact analytical calculation (which re-quires being numerically solved), we also developedthree distinct approximations that demonstrate dif-ferent accuracies and complexities. Approximationsmade on the exact formulas show the concordancebetween the two approaches.
Comparison between the exact solution and theapproximated formulas exhibits different perfor-mances according to the degree of approximation.The formulas obtained are not limited either to lowbirefringence or to special cases of optical axis tilt.Moreover, they are applicable for calculating the in-terference patterns that allow characterization bycones of light of large NA. Depending on the factorH∕λv, on the NA considered, and on the optical prop-erties of the uniaxial plate, some of the approximatedformulas would be more suitable than others. ΔϕQNPpresents the best performance and the highest com-plexity. It is followed byΔϕsec, whichmakes use of thesame approximation on sin α as ΔϕQNP, but has alower complexity. Finally, Δϕimage allows us to ex-tract information about a uniaxial sample by simplerecognition of features from the conoscopic inter-ference patterns. The results obtained will enableus to perform a proper characterization of uniaxialcrystals and are useful for a variety of devices thatdemand wide angle illumination through birefrin-gent crystals.
This work was supported by a grant from BecaPeruilh and two UBACYT grants from Universidadde Buenos Aires (UBACYT 2010–201220020090100136 and UBACYT 2011–201420020100100139).
References1. B. Van Horn and H. Winter, “Analysis of the conoscopic mea-
surement for uniaxial liquid-crystal tilt angles,”Appl. Opt. 40,2089–2094 (2001).
2. D. Su and C. Hsu, “Method for determining the opticalaxis and (ne, no) of a birefringent crystal,” Appl. Opt. 41,3936–3940 (2002).
3. P. Lee, J. Pors, M. van Exter, and J. Woerdman, “Simple meth-od for accurate characterization of birefringent crystals,”Appl.Opt. 44, 866–870 (2005).
4. F. E. Veiras, G. Pérez, M. T. Garea, and L. I. Perez, “Charac-terization of uniaxial crystals through the study of fringepatterns,” J. Phys.: Conf. Ser. 274, 012030 (2011).
5. F. E. Veiras, L. I. Perez, andM. T. Garea, “Phase shift formulasin uniaxial media: an application to waveplates,” Appl. Opt.49, 2769–2777 (2010).
6. H. Guo, X. Weng, G. Sui, X. Dong, X. Gao, and S. Zhuang, “Pro-pagation of an arbitrary incident light in a uniaxially planarslab,” Opt. Commun. 284, 5509–5512 (2011).
Fig. 12. (Color online) (a) CZ∕CY . (b) jZCj (logarithmic scale).λ � 632.8 nm, no � 1.5426, ne � 1.5516, xP � 0, xD � 10 cm,H � 3 mm.
20 May 2012 / Vol. 51, No. 15 / APPLIED OPTICS 3089

7. D.-K. Yang and S.-T. Wu, Fundamentals of Liquid CrystalDevices (Wiley, 2006).
8. M. Françon, Encyclopedia of Physics. Fundamental of Optics,S. Flugge, ed.(Springer, 1956), vol. XXIV.
9. M. C. Simon and M. T. Garea, “Plane parallel birefringentplates as polarization interferometers,” Optik 87, 95–102(1991).
10. F. E. Veiras, M. T. Garea, and L. I. Perez, “Fringe patternanalysis by means of wide angle conoscopic illumination ofuniaxial crystals,” in Conf. Proc. VII International Con-ference of young scientists and specialists “Optics–2011” (StPetersburg, Russia, 17–21 Oct. 2011), pp. 55–57.
11. J. W. Goodman Speckle Phenomena in Optics: Theory andApplications (Ben Roberts, 2007).
12. J. W. Goodman, J W Statistical Optics (Wiley Classics Library,2000).
13. A. Gatti, D. Magatti, and F. Ferri, “Three-dimensional coher-ence of light speckles: theory,” Phys. Rev. A 78, 063806 (2008).
14. D. Magatti, A. Gatti, and F. Ferri, “Three-dimensional coher-ence of light speckles: experiment,” Phys. Rev. A 79, 053831(2009).
15. M. A. Alonso, “Exact description of free electromagnetic wavefields in terms of rays,” Opt. Express 11, 3128–3135 (2003).
16. M. Anwar and R. Small, “Geometrical-optics solution for self-focusing in nonlinear optics,” J. Opt. Soc. Am. 71, 124–126(1981).
17. P. Berczynski, “Complex geometrical optics of nonlinearinhomogeneous fibres,” J. Opt. 13, 035707 (2011).
18. M. Sluijter, M. Xu, H. P. Urbach, and D. K. G. de Boer, “Applic-ability of geometrical optics to in-plane liquid-crystal config-urations,” Opt. Lett. 35, 487–489 (2010).
19. L. I. Perez and M. T. Garea, “Propagation of 2D and 3D Gaus-sian beams in an anisotropic uniaxial medium: vectorial andscalar treatment,” Optik 111, 297–306 (2000).
20. L. I. Perez, “Nonspecular transverse effects of polarized andunpolarized symmetric beams in isotropic-uniaxial inter-faces,” J. Opt. Soc. Am. 20, 741–752 (2003).
21. M. C. Simon, “Ray tracing formulas for monoaxial opticalcomponents,” Appl. Opt. 22, 354–360 (1983).
22. M. C. Simon and R. M. Echarri, “Ray tracing formulas formonoaxial optical components: vectorial formulation,” Appl.Opt. 25, 1935–1939 (1986).
23. M. C. Simon and K. V. Gottschalk, “Waves and rays in uniaxialbirefringent crystals,” Optik 118, 457–470 (2007).
24. M. C. Simon, L. I. Perez, and F. E. Veiras, “Parallel beams andfans of rays in uniaxial crystals,”AIP Conf. Proc. 992, 714–719(2008).
25. M. C. Simon, “Image formation through monoaxial plane-parallel plates,” Appl. Opt. 27, 4176–4182 (1988).
26. Note that the sign of A is related to the arbitrary way in whichwe compute the phase difference between waves: ordinaryminus extraordinary.
3090 APPLIED OPTICS / Vol. 51, No. 15 / 20 May 2012
Related Documents