Please Power Down “All you bloggers need to turn off your base stations,” an increasingly annoyed Steve Jobs told the crowd at the June 2010 iPhone 4 demo. “If you want to see the demos, shut off your laptops, turn off all these MiFi base stations, and put them on the floor, please.” In a crowd of 5000 people, roughly 500 Wi-Fi devices were active. It was the wireless apocalypse, and not even a fleet of Silicon Valley’s finest backstage engineers could do a thing about it. WHY YOUR WI-FI SUCKS and How It Can Be Helped by William Van Winkle, July 2011 The Internet’s premiere resource for “unbiased reviews, news and information on technology.”

Welcome message from author
This document is posted to help you gain knowledge. Please leave a comment to let me know what you think about it! Share it to your friends and learn new things together.
Transcript

Please Power Down
“All you bloggers need to turn off your base stations,” an increasingly annoyed Steve Jobs told the crowd at the June 2010 iPhone 4 demo. “If you want to see the demos, shut off your laptops, turn off all these MiFi base stations, and put them on the floor, please.”
In a crowd of 5000 people, roughly 500 Wi-Fi devices were active. It was the wireless apocalypse, and not even a fleet of Silicon Valley’s finest backstage engineers could do a thing about it.
WHY YOUR WI-FI SUCKS and How It Can Be Helpedby William Van Winkle, July 2011
The Internet’s premiere resource for “unbiased reviews, news and information on technology.”

2
If this example of 802.11 extremity sounds inapplica-ble to your everyday world, refer back to August 2009, when Tom’s Hardware took its first look at Ruckus Wireless’s beamforming technology in Beamforming: The Best WiFi You’ve Never Seen. In that story, we introduced the concepts of beamforming and exam-ined some competitive test results in a big office envi-ronment. As enlightening as this was at the time, there is clearly much more of the tale to be told.
This literally came home to me a few months ago after setting up a nettop for my children and using a dual-spectrum (2.4 GHz and 5.0 GHz) Linksys 802.11n USB dongle to connect to my Cisco small business-class 802.11n access point. The wireless performance was horrific. We couldn’t even stream YouTube videos. I assumed the problem was the nettop’s feeble process-ing and graphics capabilities. One day, I tried substi-tuting the 7811 wireless bridge kit from that previous piece. The difference was instantaneous, and video looked perfectly fluid. It was as if I had plugged in a wired Ethernet connection.
What was going on here? I wasn’t in an auditorium filled with 500 live bloggers crushing my connection. I was using supposedly best-of-breed small business Cisco/Linksys gear that I’d personally tested and knew had higher performance than most competing brands. It wasn’t enough to have switched to the Ruckus-based wireless bridge. That left too many unanswered ques-tions. Why was one product performing better than the other? Why had editor Chris Angelini himself observed in our original article that not only did the up-close proximity between his client and the access point impact performance but so did the shape of the AP itself?
Unanswered QuestionsSix months ago, Ruckus tried to set up a test scenario to help us answer those unanswered questions through analysis of RF interference on Wi-Fi perfor-mance, but just before the tests were set to begin, the
company halted its experiment. Engineers had set up RF noise generators and sample client machines, but a test result measurement taken one minute would come back two minutes later with numbers that were wildly differ-ent. Even averaging a set of five results in a given loca-tion would be meaningless. This is why you never see real-world interference studies done in the press. It’s so hard to control the environment and the variables that testing is effectively impossible. Vendors can spout all of the performance numbers they like from optimally-configured testing done in RF isolation chambers, but those statistics are meaningless out in the real world.
Frankly, we’ve never seen these issues explained and explored before, so we chose to pick up the reins, shed some light on Wi-Fi performance, and expose its inner mysteries. This is not going to be a short trip. We have a lot of ground to cover, which is why we’re going to break the story into two pieces. Today, we’ll be exploring the theoretical aspects (how Wi-Fi works at the data and hardware levels). Then we’ll proceed to put this theory to the test in the most extreme wireless environment we’ve ever encountered, which includes 60 notebooks and nine tablets all pounding a single access point. Whose tech-nology will stand up and whose will crumble and cry for mercy? By the time we’re done, you’ll not only have the answer, but you’ll understand why we saw those results and how the technologies behind those results work.
Hang on tight. It’s going to get a bit congested in here.
Congestion Vs. ContentionWe normally use the word “congestion” when describ-ing wireless traffic overload situations, but, when you get down into the networking nitty-gritty, congestion doesn’t really mean anything. The better term is “con-tention.” Packets must contend with each other for per-mission to send and receive during open opportunities, like gaps in traffic. Remember that Wi-Fi is a half-duplex technology, so at any given moment, only one device on a channel can transmit, either the AP or one of its clients. The more devices on a wireless LAN, the more important contention management becomes, as many clients compete for airtime.

Why Your Wi-Fi Sucks and How It Can Be Helped
3
Given the ever-increasing proliferation of Wi-Fi net-works, exactly who gets to transmit, and when, is hugely important. There is only one rule: whoever talks into silence wins. If no one else is trying to transmit when you do, then you get to talk unhindered. But if two or more clients try to talk at the same time, you have a problem. It’s like talking to your buddy with a walkie-talkie. When you talk, your friend has to wait and lis-ten. If you both try to talk at the same time, neither one of you will be heard. To communicate with each other effectively, the two of you must manage your airtime access and contention. This is why you say something like “over” when you’re done talking. You signal that the air is free for someone else to talk.
If you’ve ever taken walkie-talkies on a trip, you may have noticed there were only a few available chan-nels—and lots of other people who had the same idea. Especially in the days before cheap cell phones, it felt like everybody was on walkie-talkies. You and your friend might not talk over each other, but that still left every other walkie-talkie user near you who happened to be using the same channel. Every time you wanted to get a word in, someone would already be on your chan-nel, forcing you to wait...and wait...and wait.
This kind of interference is called “co-channel” inter-ference, wherein interferers clog your channel. To get around the problem, you can try moving to another channel, but if nothing better is available, you’re stuck with very, very slow communication speeds. You only get to transmit when all of those longwinded so-and-sos around you all have a rare moment of silence. You
might only want to say one small thing, like “Holy cow, co-channel interference bites!” But you might have to wait 15 minutes for an opening in which make your quick, pithy statement.
Interference SourcesCompounding the co-channel problem is the fact that Wi-Fi traffic flow is never smooth. We have radio fre-quency (RF) interference randomly interjecting itself into packet paths, striking anywhere at any time for any duration. Interference can come from a wide vari-ety of sources, everything from cosmic rays to com-peting Wi-Fi networks. For example, microwave ovens and cordless phones are notorious offenders for the 2.4 GHz Wi-Fi spectrum.
To illustrate, imagine you’re play-ing Hot Wheels cars with a friend, and each car that you shove across the floor to your friend represents a packet. Interference is like your little brother playing marbles with his friend across your line of traffic. A marble might not hit your Hot Wheels rig at any given time, but eventually you will get nailed. When a collision does happen, you have to stop what you’re doing, take the car that got hit back to the starting line, and try sending it again. And just to be a brat, your little brother doesn’t always use marbles. Sometimes he sends in a beach ball or a dog.
Effective wireless networking is all about managing the Wi-Fi or RF spectrum—getting the user on and off the wireless road as quickly as possible. How do you get your Hot Wheels to travel faster and aim more accu-rately? How do you get more cars passed back and forth and ignore your little brother’s feeble efforts to interfere with your day? Therein lies the secret sauce of wireless networking vendors.
The Difference Between Wi-Fi Traffic and InterferenceWe’ll come back to this in a bit, but understand up front that the 802.11 standard does many things to regulate how packets get handled. Again, take an automotive

4
metaphor. When you drive a car onto the road, you have lanes, speed laws, and other rules that govern how your car should behave within certain parameters. But if your great grandmother with her Coke bottle glasses and Lawrence Welk eight-track plods down the inter-state doing 35 in a 65, the other drivers will get upset and honk. Traffic slows down. But everyone keeps driv-ing, even if at a reduced speed.
This is analogous to what happens when your neighbor’s Wi-Fi traffic enters your own wireless LAN. Because all of the traffic is 802.11, all packets are governed by the same rules. That unwanted traffic gets in your way and slows down overall packet flow, but it doesn’t have the same impact as microwave oven emissions, which play by no rules and simply plow across the various Wi-Fi traffic lanes (channels) like a line of suicidal pedestrians.
Obviously, the relative impact of RF noise in Wi-Fi’s 2.4 or 5.0 GHz ranges is worse than that of compet-ing WLAN traffic, but one of the objects in improving performance is mitigating both. As we’ll see, there are many ways to do this. For now, just keep in mind that all of this competing traffic and interference ultimately becomes background noise. A packet stream that starts out strong at -30 dB will ultimately fade to -100 dB and less over distance. Such levels are far too low to be intel-ligible to an access point, but it can still disrupt traffic, just like that old lady in the Coke bottle glasses.
All’s Fair In War And AirtimeLet’s talk about how access points (including the access points buried in routers) administer traffic rules.
Consider your typical two-lane freeway onramp. You have cars lined up in each lane, and each lane has a stop/go light timed to regulate how traffic enters the main roadway. Each green light lasts for, say, five seconds.
Wi-Fi tweaks this idea slightly with a process called airtime fairness. The access point assesses the number of client devices present and assigns equal time blocks for each device, as if a camera overlooking the onramp could judge the amount of backed up traffic and use that information to decide how long each green light should last. As long as the light is green, cars can keep moving from that onramp into traffic. When the light turns red, that onramp lane stops and the next lane turns green.
Now say we have three lanes in that onramp, one each for 802.11b, 11g, and 11n. Obviously, the packets travel at different speeds, like one lane being for zippy sports cars and another for slow 18-wheelers. You’re going to get more fast packets than slow packets into traffic dur-ing a given time period.

Why Your Wi-Fi Sucks and How It Can Be Helped
5
Without airtime fairness, traffic sinks to the lowest common denominator. All vehicles line up in one lane, and if a fast car (11n) gets stuck behind a semi (11b), the whole chain slows down to the semi’s speed. This is why, if you’ve done much traffic analysis with consumer routers and APs, you find that performance can tank when you bring an old 11b device onto an 11n network, which is why many APs feature an “11n only” mode. Doing this, of course, forces the AP to ignore the slower device. Unfortunately, most consumer Wi-Fi products do not yet support airtime fairness. This is an increas-ingly common feature in the enterprise world that will hopefully trickle down to the masses soon.
When Bad Things Happen To Good PacketsEnough about cars. Let’s look at packets and interfer-ence in a slightly different way. As said before, interfer-ence can strike at any time and last for any amount of time. You see this in the fol-lowing page’s image with its blue bars, which represent interference. When interference strikes a data packet,
the packet becomes corrupted and must be resent, causing latencies and increasing total send time.
When we say we want faster wireless performance, that largely means we want our packets to get from the AP to the client (or vice versa) more quickly. To make this possible, APs tend to use any or all of three tactics: low-ering the PHY data rate, lowering transmit power (Tx), and changing the radio channel.
The PHY rate is like a speed limit sign (really, I am try-ing to back off the car thing). It’s the theoretical data rate at which traffic is supposed to move. When your wireless client says you’ve connected at 54 Mb/s, you’re not actually moving packets at that rate; it’s only the approved speed level at which the access point and client hardware are interoperating. What happens to packets and the real-world performance rates realized after that negotiation remains to be seen.
PHY Rate, ContinuedWhen interference slams into a Wi-Fi stream and starts resulting in packet resends, the access point may opt to lower the PHY rate. This is akin to talking more slowly to someone who doesn’t speak your language fluently,
When Bad Things Happen
-

6
and in the wired networking world, it works pretty well. But take another look at the image to the left. We had a packet that had been previously running at the 150 Mb/s PHY rate get resent at 25 Mb/s. In the face of spo-radic interference, what happens to the likelihood that our packet will get hit with another interference blast? It increases, right?
The longer a packet is in the air, the higher the prob-ability that it will get hit. So yes, the technique of drop-ping PHY rates that worked so well in the wired world now becomes a liability with wireless. To make mat-ters worse, lower PHY rates make Wi-Fi channel bond-ing (in which two channels in a 2.4 or 5.0 GHz band are used in tandem for higher bandwidth) much more difficult because there’s a higher risk of the respective streams working at different rates.
The incredible and sad thing is that the practice of drop-ping PHY rates in the face of interference is pervasive. Nearly every vendor does it, despite the fact that doing so is counterproductive to performance. It’s as if all of the vendors are facing this rising tide of RF interfer-ence, scratching their heads, and muttering, “well, we just don’t know what else to do!”
Say What?In a way, wireless networking is just a big shouting match. Imagine you’re at a dinner party. It’s 6:00, and only a few people have shown up. They’re mulling about, chatting quietly. You can hear the whisper and rumble of the room’s air conditioner. Your partner approaches you, and the two of you have no trouble carrying on a conversation. The host’s four-year-old wanders up to you and starts singing the theme to Sesame Street. But even with those three sources of interference, you and your partner have no trouble understanding each other, in part because your partner was raised in a huge fam-ily and talks like a bullhorn.
In this example, the sounds of other people chatting and the air conditioning are the “noise floor.” It’s always there, always at that volume. When we talk about how much noise interferes with your conversa-tion, we discount the noise floor. It’s like putting the tray on a food scale and then hitting the button to zero the weight readout. The scale’s tray and background noise are constants, just like the background RF noise present all around us. Every environment has its own noise floor.
Why Your Wi-Fi Sucks and How It Can Be Helped
7
However, the kid and his Big Bird homage are inter-ference. With a partner speaking loudly, you can still converse effectively, but what happens when a soft-spoken friend walks up and joins the discussion? You find yourself casting annoyed glances at the (previously charming) toddler and asking “what?” to your new conversation mate.
Now consider our graphic. Against a background RF noise floor, we have a cordless phone generating inter-ference measuring -77 dB at our client device’s location. This is our singing four-year-old. If you have a soft-spo-ken access point that only transmits a -70 dB signal, this is strong enough to be “heard” by the client above the interference, but not by much. The difference between the noise floor and the receive (listening) signal is only 7 dB. However, if we have an access point that broadcasts more loudly, say at -60 dB, then we have a much more generous 17 dB difference between the interference and receive signal. When you can comfortably hear some-one, the conversation flows much more effectively than when you can barely make out what someone is saying. Moreover, consider what happens when another four-year-old shows up singing Lady Gaga. The two kids combined will probably swamp your soft-spoken friend, while your more voluble partner is still intelligible.
Say What? Say SINR!In the radio world, the range from the noise floor to the receive signal is the signal-to-noise ratio (SNR). This is what you see printed on practically every access point, but it’s not really what you care about. It’s the gap from the top of the interference to the receive sig-nal, the signal-to-noise+interference (SINR) measure-ment, that matters. It’s not that you can ever know in advance what a product’s SINR will be, because you can’t know the level of interference at a given time and place until you measure it. But you can get a sense of a specific environment’s average interference level. And with this, you’ll have a better idea what sort of signal strength an access point needs to maintain in order to function dependably.
Knowing this, you may ask, “why on earth would any-one lower the transmit signal strength (Tx) in the face
of interference?” Good question, because it’s one of the three common responses to packet resends. The answer is that dropping Tx power condenses an AP’s zone of coverage. If you have an interference source on the outer edge of your coverage area, effectively eliminating that source from the AP’s awareness frees the AP from hav-ing to try and cope with the problem. Assuming that the client is within the reduced coverage zone, this can help significantly decrease co-channel interference and improve total performance. However, if your client is also on the outer range of the AP’s coverage (as with Client 1 in our illustration), then it just dropped off the map. Even in the best case, the transmit power drop just whacked out a big chunk of your SINR and left you more open to impaired data rates.
So Many Channels, So Little To WatchAs we’ve seen, the first two common approaches for dealing with interference are lowering the PHY rate and lowering power. The third approach is one we touched on in the walkie-talkie example: change the wireless channel, which in effect changes the frequency on which the signal is being carried. This is the key idea behind spread spectrum technology, or frequency hop-ping, which was invented by Nikola Tesla at the turn of the 20th century and gained notable military use dur-ing World War II. In one instance, famous and beau-tiful actress Hedy Lamarr helped invent a frequency hopping approach to thwart enemy jamming of radio-controlled torpedoes. When frequency hopping is

8
employed over a wider range of frequencies than that on which the signal is normally carried, this is known as spread spectrum.
Wi-Fi uses spread spectrum technology primarily to improve bandwidth, reliability, and security. As anyone who’s ever been under the hood of his or her Wi-Fi set-tings knows, the 2.4 to 2.4835 GHz band has 11 chan-nels. However, because the total bandwidth used for 2.4 GHz Wi-Fi spread spectrum is 22 MHz, you get over-lapping between these channels. In reality, you only have three channels in North America—1, 6, and 11—which will not overlap. Europe can use channels 1, 5, 9, and 13. If you’re using 2.4 GHz 802.11n with a “bonded” 40 MHz channel width, your options shrink to only two: channels 3 and 11.
In the 5 GHz range, things improve somewhat. Here, we have eight non-overlapping indoor channels (36, 40, 44, 48, 52, 56, 60, and 64.) Higher-end access points usu-ally integrate both 2.4 GHz and 5.0 GHz radios, and the correct assumption is that there is less interference on the 5.0 GHz band. Just getting rid of 2.4 GHz Bluetooth interference can make a difference. Unfortunately, the end result is inevitable: the 5.0 GHz spectrum is now filling up with traffic, just as the 2.4 GHz spectrum did.
With 40 MHz channel bonding used in 802.11n, the number of non-overlapping channels shrinks to just four (dynamic frequency selection, or DFS, channels are excluded due to military worries about conflicting with radar signals), and users are already finding times
when there isn’t a decently open channel within range. It’s like having more channels of TV to watch all day but still nothing on except personal hygiene commer-cials. Nobody wants to see that.
Omnidirectional, Not OmnipotentWe’ve covered a fair amount of bad news so far. There’s more. It’s time to discuss antennas.
We mentioned signal strength, but not signal direction. As you probably know, most antennas are omnidirec-tional. Like a ring of speakers blaring in every direction at once (with attached microphones receiving from all 360 degrees equally), omnidirectional microphones give you excellent coverage. It doesn’t matter where the client is located. As long as the client is within range, an omni-directional antenna should be able to find and com-municate with it. The downside, of course, is that the same omnidirectional antenna is also picking up every other source of noise and interference within range. Omnidirectional systems hear everything—good, bad, and ugly—and there’s very little you can do about it.
Imagine standing in a crowd, and you’re trying to talk with someone several feet away. You can barely hear someone over the ambient noise. What’s the natural thing to do? Cup a hand to your ear, of course. You’re trying to better focus the sound coming from one direction, while simultane-ously blocking sounds coming from other directions, namely behind your hand. An even better sound iso-lator is a stethoscope. These try to block all ambient sound by plugging your ears, only allowing passing sounds carried through the flat chestpiece.
In the world of radio, the equivalent of a stethoscope is a technique called beamforming.
Beamforming RevisitedWe covered beamforming in considerable depth during our prior visit with Ruckus our prior visit with Ruckus, so we’ll only briefly review here.
The Wi-Fi Spectrum: 2.4GHz
The Wi-Fi Spectrum: 5GHz
C H A N N E L
F R E Q U E N C Y
1 6 11 2.4 GHz
2.412GHz 2.437GHz 2.462GHz 2.4 835GHz
5.15GHz
5.25GHz
5.35GHz
5.470GHz
5.725GHz
5.825GHz
UNII-1 UNII-2 DFS
UNII-3 UNII-2e DFS

Why Your Wi-Fi Sucks and How It Can Be Helped
9
The object in beamforming is to create a directed zone of heightened wave energy. The classic example of this is shown with water drops into a pool. If you were to hold two spigots over a pool of water and opened each spigot in just the right way that they released synchronized water droplets every so often, the concentric wave rings that flowed from each epicenter (where the droplets land) would create an overlapping pattern. You can see this pattern in the above illustration. Where the wave crests overlap, you have an additive effect, where the energy of both waves combine to create an even larger crest in the waveform. Because of the regularity of the drops, these amplified crests manifest in certain direc-tions, forming a sort of “beam” of heightened energy.
The waves in this example are omnidirectional. They flow outward uniformly from the point of origin until reaching some opposing object or energy. Wi-Fi signals emitted from an omnidirectional antenna behave in the same way, outputting waves of radio energy that, when combined with waves from another antenna source, can create beams of heightened sig-nal strength. When you have two waveforms in phase, the result can be a beam with nearly double the signal strength of the original wave.
Omnidirectionality HarnessedAs the interference photo on the prior page shows, the beamforms from omnidirectional antennas project in multiple, and often opposing, directions. By modifying the timing of the signals from each antenna, one can control the shape of a beamform pattern. This is good because it focuses power in fewer directions. If your AP
knows that its client is at three o’clock, does it make sense to send a beam to nine o’clock or 11 o’clock? Well, yes...if having that wasted beam is unavoidable.
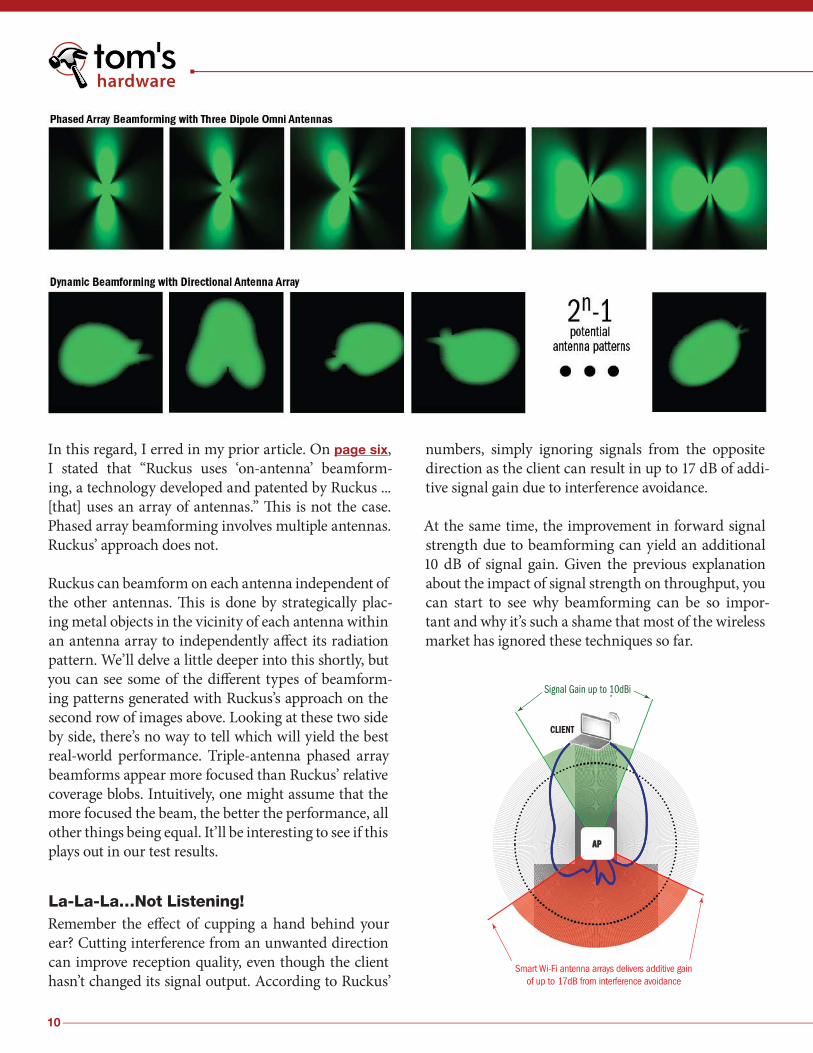
In fact, with omnidirectional antennas, this waste is unavoidable. Technically speaking, what you’re seeing in this top row is the result of a phased array, a group of antennas in which the relative phases of the respective signals feeding the antennas are varied in such a way that the effective radiation pattern of the array is rein-forced in a desired direction and suppressed in some undesired directions. It’s a bit like squeezing the middle of a partially inflated balloon. When you tighten your grip, you can make part of the balloon pop out dramat-ically in one direction, but you also get a corresponding surge in a different direction. You can see in the image above how the top row showcases different beamform patterns generated by two dipole omni antennas.
A Beamforming CorrectionObviously, you want a beamform to cover your cli-ent. With phased array beamforming, as illustrated in the top row images above (this time shown with three dipole antennas), the AP analyzes signals from the cli-ent and uses algorithms to alter the emitting pattern, thus changing the path direction to better target the cli-ent. These algorithms are computed in the AP’s control-ler, which is why you sometimes see the process referred to as “chip-based beamforming.” The technique is also commonly called transmit beamforming by Cisco and others, and it remains an optional, if widely unimple-mented, component of the 802.11n specification.
Chip-based, phased array beamforming is the method used by most vendors who currently advertise beam-forming support. It is not the method used by Ruckus.
Phased Array Beamforming with Three Dipole Omni Antennas
Phased Array Beamforming with Two Dipole Omni Antennas
Directional Antennas
1 2 3 4 5 6
• • •
2n
10
In this regard, I erred in my prior article. On page six, I stated that “Ruckus uses ‘on-antenna’ beamform-ing, a technology developed and patented by Ruckus ... [that] uses an array of antennas.” This is not the case. Phased array beamforming involves multiple antennas. Ruckus’ approach does not.
Ruckus can beamform on each antenna independent of the other antennas. This is done by strategically plac-ing metal objects in the vicinity of each antenna within an antenna array to independently affect its radiation pattern. We’ll delve a little deeper into this shortly, but you can see some of the different types of beamform-ing patterns generated with Ruckus’s approach on the second row of images above. Looking at these two side by side, there’s no way to tell which will yield the best real-world performance. Triple-antenna phased array beamforms appear more focused than Ruckus’ relative coverage blobs. Intuitively, one might assume that the more focused the beam, the better the performance, all other things being equal. It’ll be interesting to see if this plays out in our test results.
La-La-La…Not Listening!Remember the effect of cupping a hand behind your ear? Cutting interference from an unwanted direction can improve reception quality, even though the client hasn’t changed its signal output. According to Ruckus’
numbers, simply ignoring signals from the opposite direction as the client can result in up to 17 dB of addi-tive signal gain due to interference avoidance.
At the same time, the improvement in forward signal strength due to beamforming can yield an additional 10 dB of signal gain. Given the previous explanation about the impact of signal strength on throughput, you can start to see why beamforming can be so impor-tant and why it’s such a shame that most of the wireless market has ignored these techniques so far.

Why Your Wi-Fi Sucks and How It Can Be Helped
11
Spatial MultiplexingOne of the main enhancements in the 802.11n speci-fication was the addition of spatial multiplexing. This involves using the natural fracturing, so to speak, of one primary radio signal into sub-signals that arrive at the recipient at slightly different times. If you picture an access point at one end of a gym and a client at the other end, a straight radio path down the center of the gym will take slightly less travel time than a signal bounced off the side wall. There are usually multiple possible signal paths (spatial streams) between wireless devices, each of which can carry a different data stream. The recipient takes these sub-streams and recombines them. This process is sometimes called link diversity. Spatial multiplexing (SM) tends to work very well indoors, but terribly in less boxed-in environments like open fields, because there are no objects for signals to bounce off of in order to create a sub-stream. The bottom line is that, when it can be implemented, SM serves to increase channel bandwidth and improve signal-to-noise ratios.
To visualize the difference between SM and beam-forming, imagine a two buckets—one filled with water (data) and the other sitting empty. We want to move the data from one bucket to the other. Beamforming involves having one hose connecting the two buck-ets, and we’re increasing the water pressure in order to move the fluid more quickly. With SM, we have two (or more) hoses moving water with the usual amount of pressure. With a single radio chain, meaning one trans-mit radio linked to one or more antennas, SM typically
outperforms beamforming. With two or more radio chains, the opposite is often the case.
Can You Do Both?I’m not crazy about this image, but it tries to explain why you can’t combine spatial multiplexing and beamform-ing with a three-antenna design, which is what we have in many access points today. Essentially, if two anten-nas are tied up doing beamforming of a first stream, that leaves one antenna left to run a second stream. You might think that with two incoming streams, SM should be no problem. However, the beamformed stream is likely to have a much faster data rate—so much faster that the receiving client can’t synchronize the two streams effectively. The only way to bring these two streams close enough in data rate for synchroniza-tion is to drop the power in the beamformed stream...
...0010
Tx 1
Tx 2
Duplicated forbeamforming?
Weaker signal strength on stream 1 than on stream 2, so lower data rate?
Rx 1
Rx 2Data stream recombinationout of sync
...?0?0?1?01
... 1 1
Tx 3
...0010
...0010
...1011
...1101001101
or, alternatively, extra signal strength in stream 2 goes unused for higher throughput, causing unnecessary and harmful self-interference in the network
How SM Fails in Combination with Phase-based Beamforming with 3 Tx Antennas.
12
which sort of kills the whole reason for beamforming in the first place. You’re left with two “standard pressure” streams, to reuse our former illustration.
What if you had four antennas? Yes, that would work. Two would handle beamforming and the other two would tackle SM. Naturally, adding another antenna increases cost. In the enterprise AP world, buyers might readily absorb the upcharge, but consider the client, which would also need four antennas. We only recently got three antennas in notebooks, and that was a battle. Where would the fourth go? Perhaps more importantly, what would it do to power consumption? In the absence of answers and/or enthusiasm from the market, ven-dors have held off on pursuing four-antenna designs.
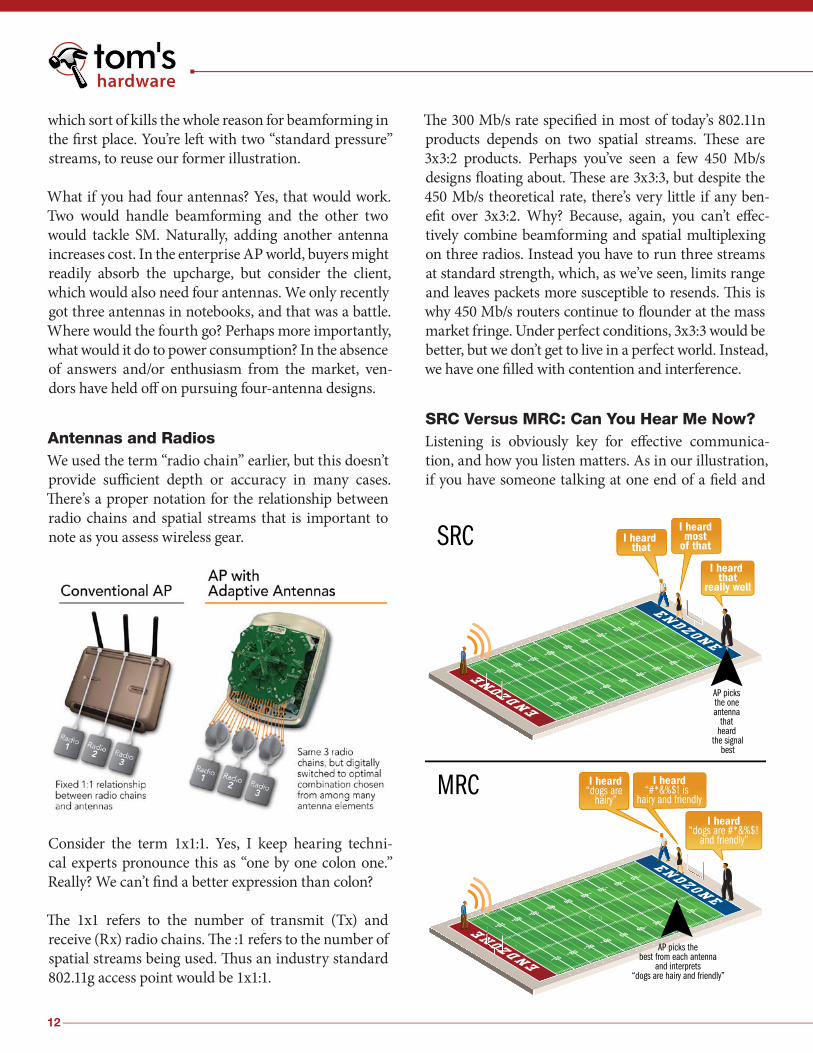
Antennas and RadiosWe used the term “radio chain” earlier, but this doesn’t provide sufficient depth or accuracy in many cases. There’s a proper notation for the relationship between radio chains and spatial streams that is important to note as you assess wireless gear.
Consider the term 1x1:1. Yes, I keep hearing techni-cal experts pronounce this as “one by one colon one.” Really? We can’t find a better expression than colon?
The 1x1 refers to the number of transmit (Tx) and receive (Rx) radio chains. The :1 refers to the number of spatial streams being used. Thus an industry standard 802.11g access point would be 1x1:1.
The 300 Mb/s rate specified in most of today’s 802.11n products depends on two spatial streams. These are 3x3:2 products. Perhaps you’ve seen a few 450 Mb/s designs floating about. These are 3x3:3, but despite the 450 Mb/s theoretical rate, there’s very little if any ben-efit over 3x3:2. Why? Because, again, you can’t effec-tively combine beamforming and spatial multiplexing on three radios. Instead you have to run three streams at standard strength, which, as we’ve seen, limits range and leaves packets more susceptible to resends. This is why 450 Mb/s routers continue to flounder at the mass market fringe. Under perfect conditions, 3x3:3 would be better, but we don’t get to live in a perfect world. Instead, we have one filled with contention and interference.
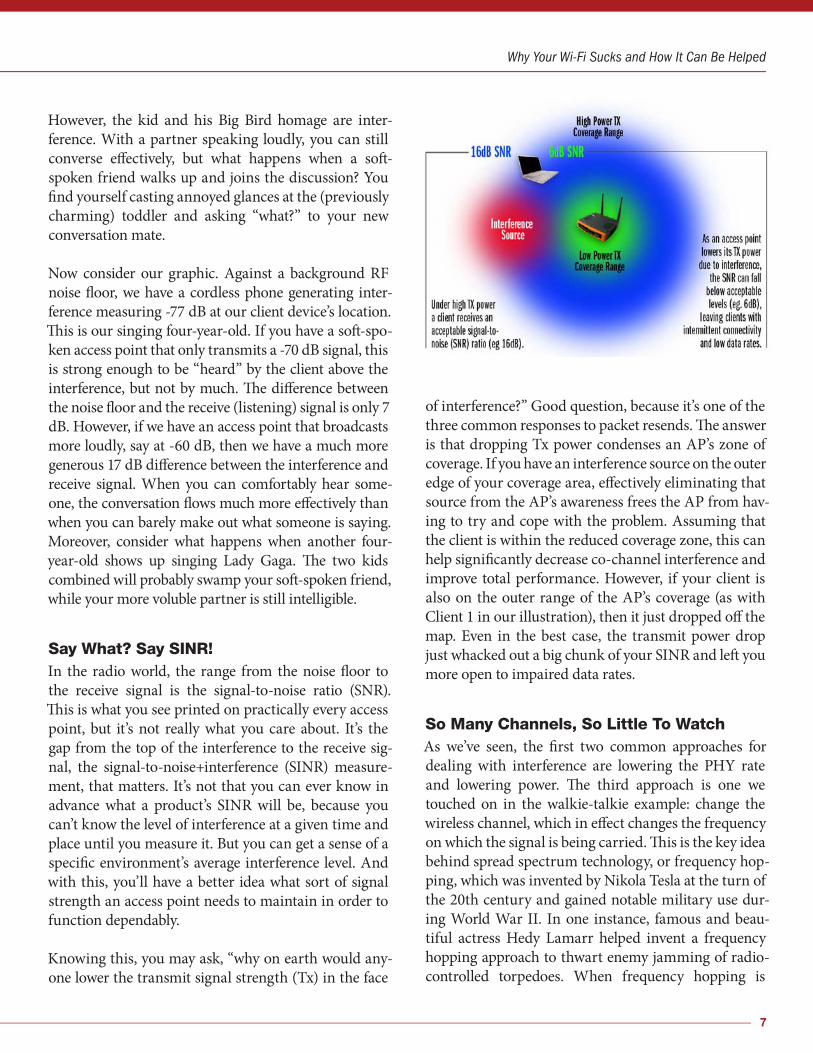
SRC Versus MRC: Can You Hear Me Now?Listening is obviously key for effective communica-tion, and how you listen matters. As in our illustration, if you have someone talking at one end of a field and
I heard that
I heardmost
of that
I heard that
really well
AP picks the one antenna
that heard
the signalbest
SRC
MRC I heard“dogs are
hairy”
AP picks thebest from each antenna
and interprets“dogs are hairy and friendly”
I heard“#*&%$! is
hairy and friendly
I heard“dogs are #*&%$!
and friendly”
Why Your Wi-Fi Sucks and How It Can Be Helped
13
three people listening at the other end, odds are that the listeners, for whatever various reasons, will not hear exactly the same thing. In wireless communication, you can ask, “OK, which of you three receivers heard what that transmitter said the best?” Whichever receiver seems to have heard the most is selected. This is called simple ratio combining (SRC), and it’s closely related to the idea of antenna switching, wherein whichever antenna has the best channel gain is used.
A more effective and widely used approach with mul-tiple antennas is maximal ratio combining (MRC). In the most basic terms, this involves the three receivers putting their heads together and comparing notes to arrive at a consensus opinion of what was said. With MRC, the client enjoys better wireless coverage and improved quality of service. The client is also less sensi-tive to exact antenna location.
Of course, this begs another question: if three antennas beat two, then...
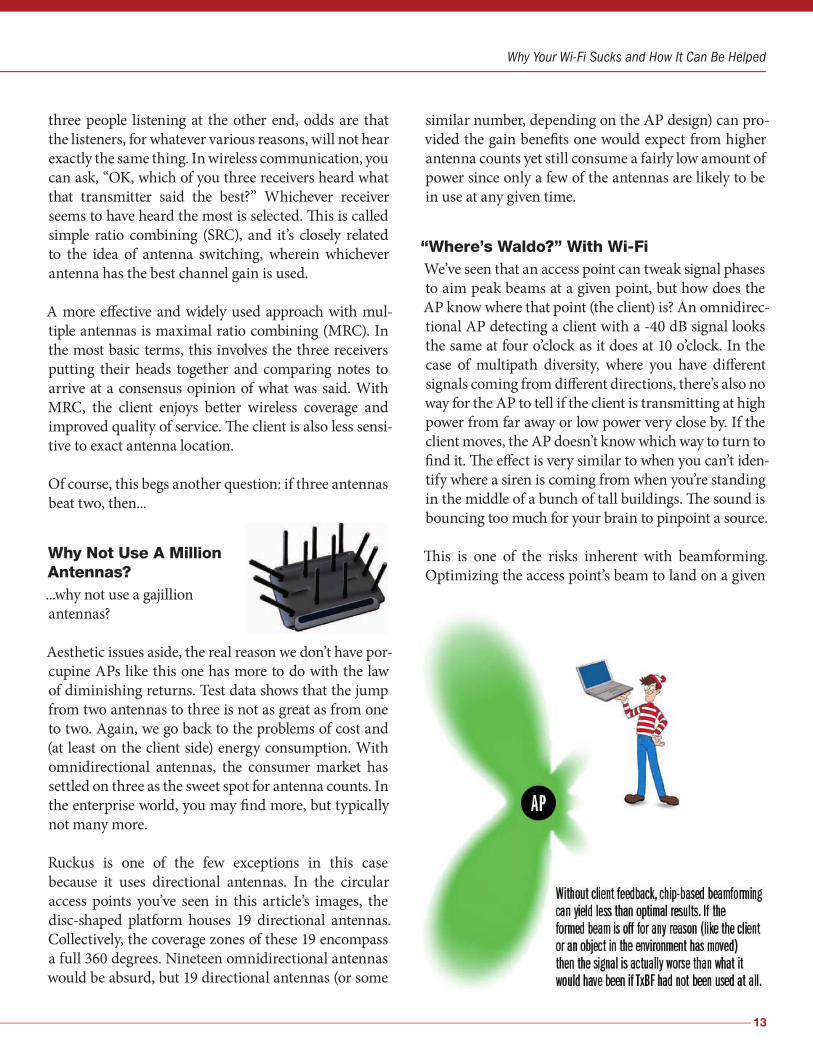
Why Not Use A Million Antennas?...why not use a gajillion antennas?
Aesthetic issues aside, the real reason we don’t have por-cupine APs like this one has more to do with the law of diminishing returns. Test data shows that the jump from two antennas to three is not as great as from one to two. Again, we go back to the problems of cost and (at least on the client side) energy consumption. With omnidirectional antennas, the consumer market has settled on three as the sweet spot for antenna counts. In the enterprise world, you may find more, but typically not many more.
Ruckus is one of the few exceptions in this case because it uses directional antennas. In the circular access points you’ve seen in this article’s images, the disc-shaped platform houses 19 directional antennas. Collectively, the coverage zones of these 19 encompass a full 360 degrees. Nineteen omnidirectional antennas would be absurd, but 19 directional antennas (or some
similar number, depending on the AP design) can pro-vided the gain benefits one would expect from higher antenna counts yet still consume a fairly low amount of power since only a few of the antennas are likely to be in use at any given time.
“Where’s Waldo?” With Wi-FiWe’ve seen that an access point can tweak signal phases to aim peak beams at a given point, but how does the AP know where that point (the client) is? An omnidirec-tional AP detecting a client with a -40 dB signal looks the same at four o’clock as it does at 10 o’clock. In the case of multipath diversity, where you have different signals coming from different directions, there’s also no way for the AP to tell if the client is transmitting at high power from far away or low power very close by. If the client moves, the AP doesn’t know which way to turn to find it. The effect is very similar to when you can’t iden-tify where a siren is coming from when you’re standing in the middle of a bunch of tall buildings. The sound is bouncing too much for your brain to pinpoint a source.
This is one of the risks inherent with beamforming. Optimizing the access point’s beam to land on a given

14
client requires knowing where the client is, mathemati-cally if not spatially. The AP gets bombarded with sig-nals, and it has to track on the right one or two of these over time. With so many similar types of signals and so many environmental distractions (in RF terms), the result for an access point can be a lot like searching for one character in a Where’s Waldo poster. How quickly the AP can locate its wily client has a lot to do with how the client tries to convey its location back to the AP, if it tries at all.
Implicit And ExplicitReturning to that idea of how your ears can deceive you, we normally isolate acous-tic directionality based on the time difference between when a sound reaches one ear and then the other. This is why it’s so confusing when you hear a sound bounced off a building, because it throws off our sense of how long it should take a sound to reach each ear. Our brain perceives the source signal’s phase difference to be out of whack.
With multiple antennas on an access point, the AP uses these antennas like ears and then assesses the sig-nal phase difference in order to get a fix on the client’s directionality. This is called implicit beamforming. The beamform is directed to a course derived implicitly from the detected signal phase. However, the AP can be confused by odd signal bounces just like your brain can. This confusion can be compounded by differences in the uplink and downlink paths.
With explicit beamforming, the client says exactly what it wants, just as if it was placing a complicated espresso order. The client makes requests regarding transmit phase, power, and other factors relative to its current cir-cumstances in the radio environment. The results are far more accurate and effective than implicit beamforming. So what’s the catch? Nobody supports explicit beamform-ing, at least not in today’s client devices. Both implicit
and explicit methods must be built into the Wi-Fi chip-set. Hopefully, explicit support will arrive soon.
PolarizationOn top of all the other issues we’ve encountered with wireless communications so far, we can add polariza-tion to the list. Polarization is a bigger deal than many people suspect, and I had the chance to witness its effects first-hand with an iPad 2. But first, the theory...
You probably know that light travels in waves, and all waveforms have a directional orientation. This is why polarized sunglasses work so well. Light that reflects off of the road or snow and into your eyes tends to be polarized along a horizontal orientation, parallel to the ground. The polarized filter coating in sunglasses is ori-ented in a vertical orientation. Think of the waveform as a big, long piece of cardboard you’re trying to slide through window blinds. If you’re holding the cardboard horizontally, and it encounters vertical blinds, the card-board will be blocked. If the blinds are horizontal, like Venetian blinds, then the cardboard can slide through unimpeded. Sunglasses are designed to cut glare in particular, which has a horizontal orientation.
Back to Wi-Fi. When a signal emits from an antenna, it carries the polarization orientation of that antenna. So if the AP is sitting on a table and the emitting antenna

Why Your Wi-Fi Sucks and How It Can Be Helped
15
is pointing straight up, then the emitted waveform will have a vertical orientation. It follows that the receiving antenna, if it’s going to have the best reception possible, should also have a vertical orientation. The reverse is also true—the receiving AP should have antenna(s) in polarization alignment with the sending client. The fur-ther out of polarization alignment the antennas are, the worse the signal reception. The good news here is that most routers and access points have moveable antennas that allow users to suit their positioning to the best pos-sible client reception, much like bunny ears on TV sets. The bad news is that because so few people understand the principles of how their Wi-Fi gear uses polarization, hardly anyone performs this orientation optimization.
With all of that said, as you look at the above illustra-tion, you’ll see that the access point is emitting both a horizontal (top) and a vertical signal waveform to the iPad 2 client. Which orientation results in better recep-tion quality and performance? That depends on how many antennas are operating within the client and the orientation of those antennas.
Taking A Bad BounceNow, about that first-hand experience I had with iPad 2 polarization. I was standing just about where the cam-era was when the above picture was taken. You can see the Aruba access point to which I was connected hang-ing from the ceiling in the background. I held the tablet up by its corners with two hands. I was simply looking for reception quality and happened to position it first in landscape orientation. The signal was fair and showed a sustained connection over time. When I turned the iPad back to portrait orientation, the connection dropped. I didn’t change my hand positioning, grip, or the tablet’s position in space. But there was no signal...just like that. I wouldn’t have believed it if it hadn’t hap-pened in my hands.
After reading the prior page, you can guess the phys-ics behind what happened. As it turns out, whereas the original iPad had two Wi-Fi antenna elements, the iPad 2 uses only one, and it’s located along the bottom edge. Obviously, in landscape mode, the tablet’s antenna was in polar alignment with the access point’s antennas,
which you can see were all pointing down from the ceiling. In portrait mode, we were perfectly misaligned with the AP.
A couple more things to keep in mind: the lens effect in the photos above makes the AP look a bit closer than it really was. While we had direct line of sight between the client and the AP, there was about 40 feet of distance to contend with, which was greater than the distances you’ll see in our polarization tests in part two of this article. Moreover, if I took a couple of steps back, I couldn’t reproduce these results. My assessment is that I wasn’t quite in a Wi-Fi dead spot...only a spot that was mostly dead. A little farther back, I must have been picking up a bounced signal path. But keep in mind that a bounce can alter a waveform’s polar orientation. A signal that might have been per-fectly aligned through line of sight could be many degrees askew after a bounce or two, and this will impact reception quality.

16
Mobile MadnessHaving seen our iPad 2 example, now consider signal polarization in relation to other mobile devices. How about that smartphone—flat on the table, propped up for video viewing, pressed to your ear, and so on. Now think about how wildly your signal bars, both cellular and Wi-Fi, can fluctuate through just slight movement. We take these signals for granted, but they can actu-ally be very finicky and in need of all the help we can give them.
802.11n (What you get) Adaptive Antennas (What’s added)
Multiple spatial streams Best path signal path selection for each spatial stream
Increased channel bandwidth through channel bonding (40MHz vs. 20MHz wide channels)
Effectively guaranteed multipath with polarization diversity
Frame aggregation Implicit client feedback
Variable guard interval Extended range with directional antennas that form and direct Wi-Fi transmissions
Block acknowledgement Interference rejection, avoidance (switches to the signal path with least interference)
Maximal ratio combining Maximal ratio combining with polarization diversity
With cellular signals, there’s obviously not much you can do short of having a phone with an external antenna input (as with car phones). In fact, with any handheld wireless device, about all you can do is shoot for polarization diversity (multiple antenna orienta-tions) and push the gain as far as regulations and/or battery life allow. Where this starts to get interesting is with notebooks. Most models keep their antenna(s) in the frame around the LCD display. Did you ever think

Why Your Wi-Fi Sucks and How It Can Be Helped
17
that you might significantly improve your reception by tilting the display back or forward, or perhaps by turn-ing the notebook itself a few degrees?
Similarly, the AP, which must accommodate multi-ple clients, may provide better service if one antenna points vertically and another points horizontally. The problem in this arrangement, of course, is that both antennas can’t cooperate and beamform effectively. Their polarizations don’t match, so if the client is get-ting one signal really well, the other signal is impaired due to misalignment.
If Rx antennas are only looking for waveforms in one orientation, that’s a recipe for failure. This is why it’s important to have more orientations on the receiv-ing end. If you had two receiving antennas, one verti-cal and one horizontal, and two vertical Tx, you would only receive one stream well.
Putting Pieces TogetherThe material you’ve seen over the preceding pages is necessary background for making sense of the results you’ll soon survey in our benchmark analysis. When an access point excels in a given test or falls over dead, it’s important to understand why. You now under-stand that, for optimal 802.11n performance, AP/cli-ent communication could benefit from beamforming,
spatial multiplexing, antenna diversity, optimal signal polarization, and other factors.
Some of these factors are probably already integrated into your nearby access point. The chart above shows a list of several features present in most of today’s 802.11n APs. The points from this chart that I consid-ered essential for interpreting our forthcoming data have been covered here in Part 1.
Even if you miss Part 2, I hope you see by now just how much our mainstream 802.11n products can ben-efit from several design improvements. Especially at the consumer level, we’re really missing out. Vendors have dictated a “good enough” approach for us when there’s clearly room for considerable improvement.
How much improvement? Tune in next week for the answer...

In Part 1, we explained what can go wrong with
Wi-Fi signals and how access points can work to
improve your wireless performance. It’s time for
a reality check. We throw six contenders against
65 clients and some hellish interference.
Who’s left standing?
Why your Wi-Fi SuckS and How It Can Be Helpedby William Van Winkle, July 2011
The Internet’s premiere resource for unbiased reviews, news and information on technology.

2
We took a lengthy journey through the ins and outs of Wi-Fi signals in last week’s Why Your Wi-Fi Sucks And How It Can Be Helped, Part 1, examining many of the factors that can both damage and improve signal performance. This week, it’s time to tie it all together in a real-world arena and let vying wireless technologies duke it out to the death—sometimes almost literally.
As we mentioned before, prior attempts to stage this sort of test failed because the results were too variable to be accurate. We regrouped, though, and came back with a new test setup that proved far more reliable and useful. In the image below, you see a panorama view of our test
environment. Essentially, this is an empty office environ-ment we filled with 60 Dell notebooks and nine iPad and iPad 2 tablets. We then picked five competing access points and their respective controllers (when applicable) and tested them in various scenarios. All told, the rental bill totaled about $15,000, and a testing team put in three heavy days of benchmarking time. You simply don’t see wireless inter-ference testing done at this scale in the wild.
As we suggested in the first part of this story, we’re unaware of any testing ever having been done quite like this. Our objective was to test access point performance under heavy interference conditions, and from this derive some sense of
Tom’s WLAN Test Environment

Why Your Wi-Fi Sucks and How It Can Be Helped
3
how the wireless technologies we previously examined play out in the real world. If you missed our prior article, we strongly suggest reviewing it now. Otherwise, the results we explain later may not make as much sense.
In the following pages, we’ll take a look at our access point contestants, how we tested, and analyze the test results. To give you an early hint, there turns out not to be a one-size-fits-all product. Best results will vary according to the dynamics of the access point/client arrangement. Which technologies make the most sense for your situation? Keep reading!
As you can see, we conducted two line-of-sight tests, one at 10 feet between the access point and client and another at 70 feet. The map shows desk areas and partitions within the line-of-sight path, but as you can see below, no obstructions were actually in place. A third test at 100 feet was done with a large kitchen/break area blocking the direct data path.
We had a wired side of the network, attached to which was the access point being tested. For all tests, we used an AP and whatever network infrastructure was necessary to sup-port it. For example, the Ruckus and Aruba APs used wireless controllers, while the HP and Apple did not. Attached to this was a data server running an IxChariot (version 7.1) endpoint, a program that drives data back and forth and reports results back to the console, which was running on a sepa-rate wired network node. We ran another IxChariot endpoint on the wireless client connected to the AP.
Specifically, our hardware was as follows:
Devices Under TestApple AirPort Extreme: Dual-band 802.11n (3x3:2), standalone, version 7.5.1
Aruba AP125: Dual-band 802.11n (3x3:2) with Aruba 3200 controller running ArubaOS (ver. 6.0.0.1)
Cisco Aironet 3502i: Dual-band 802.11n (2x3:2) with Cisco 4402 controller (ver. 7.0.98.0)
HP E-MSM460: Dual-band 802.11n (3x3:3) standalone running version 5.5.0.0-01-9514
Meraki MR24: Dual-band 802.11n (3x3:3) running Mer-aki Enterprise Cloud Controller
Ruckus ZoneFlex 7363: Dual-band 802.11n (2x2:2) with Ruckus ZoneDirector 1106 (version 9.1.0.0.38)
We brought in the Apple for two reasons. First, we wanted an example of a good consumer-grade router/access point as a basis for comparison against e nterprise gear, because a lot of consumers and small business people remain baffled by the massive price gap between the two groups. Second, in the last couple of router roundups we did at Tom’s Hard-ware, readers complained that we omitted Apple. Well...here you go.

4
Of these six APs, only Meraki and HP employ triple-antenna, three-stream (3x3:3) configurations. In fact, these were the only two 3x3:3 APs we were able to find on the market in time for testing. The Aruba AP125 is a fairly standard model for the company, and it’s been around for a while. Likewise, Ruckus’s 2x2:2 ZoneFlex 7363 is fairly mid-range within the company’s lineup. The Cisco 3500 is the networking titan’s current high-end AP.
We would also like to point out that most of the access points reviewed here use omnidirectional antennas, as dis-cussed extensively in our precursor to this piece. Ruckus, which we showed last time, and Meraki, shown here, are two exceptions. To the untrained eye, Meraki and Ruckus seem to use very similar designs, each employing directional antennas in an effectively circular pattern. However, Meraki is using planar inverted F antennas (PIFAs). The larger ones are for 2.4 GHz and the smaller are for 5 GHz, thus leaving only three antennas for each band. We’ll see how this spin on the circular design performs in a bit.
ClientsFor our single client, we used a Dell Latitude E6410 with the following specifications:
• Intel Core i7-620M (2.67 GHz)• 4 GB RAM• Centrino Ultimate-N 6300 (3x3:3)• Windows 7 Professional (64-bit)• Power plugged in for all tests
Each wireless test on this client was run four times, with the laptop turned 90 degrees for each instance. Throughput numbers represent an average of these four results.
For our 5 GHz interference and load tests, we used 60 Dell Vostro 3500 laptops with the following specs:
• Intel Core i3 2.27 GHz• 3 GB RAM• DW1520 Wireless-N WLAN half-mini card
(Broadcom, driver 5.60.48.35)• Windows XP Professional SP3• Power plugged in for all tests
Not least of all, we used five Apple iPad 2 tablets to better examine the impact of ultramobile devices in a mixed wire-less network. Careful readers might remember from part 1 that we noted having nine iPads and iPad 2 units—which we did. However, when push came to shove, we ended up only using data from tests featuring the five iPad 2 tablets. The remaining four iPads didn’t play into the data we even-tually recorded in order to have consistent client antenna designs. At least they made for impressive photography.
We debated for some time over whether to run the bulk of our tests on 2.4 GHz or 5.0 GHz and ultimately sided with the latter for two reasons. First, while most consumer products are clearly using 2.4 GHz, enterprises are now transition-ing to 5 GHz on new roll-outs because of it is the less-used band. In testing predominantly enterprise-class equipment, we wanted to use today’s best of breed spectrum, and right now that means 5 GHz. There is simply far less traffic in that
Ruckus puts forth the best effort in the largest number of tests, but it does so with a mere 2x2:2 design through engineering and deep attention to the factors necessary to provide a high-quality wireless experience in increasingly hostile RF conditions.
iPad running IxChariot
60 laptops and 5 Apple iPad 2 tablets

Why Your Wi-Fi Sucks and How It Can Be Helped
5
band, which means (in general) better client performance. Second, you’re seeing increasing numbers of dual-band rout-ers and access points appearing in the consumer space as ven-dors bring their higher-end technologies to the mainstream. Ultimately, as Wayne Gretzky would say, we decided to tar-get where the puck is going, not where it has been.
For 2.4 GHz testing, we placed all devices on channel 1. For 5 GHz, we went with channel 36.
In our 5 GHz interference testing, interference and adverse contention conditions were generated by the 60 Dell clients all connecting to an AP mounted to the ceiling roughly above the middle of the client cluster. In the corner of our office space, shown by the green dot on the previous envi-ronment map, we mounted the AP being tested to the ceil-ing. Thus we had two discrete wireless LANs, the small one (single client and AP under test) having to function in the face of 61 interfering Wi-Fi devices. In effect, this setup is like two people trying to have a normal conversation on a patio overlooking an adjacent open-air rock concert. We wanted two separate WLANs in order to isolate interfer-ence as our main variable, not interference and client load.
For our 2.4 GHz tests, we wanted a worst-case scenario, so we combined a 100-foot client-to-AP distance, plus obstructed line-of-sight, plus having a non-Wi-Fi RF noise generator
placed right on the spot where our client sat for the 70-foot 5 GHz tests. This raises an interesting point from our part 1 discussion about the difference between types of interfer-ence and their impact on communication performance.
Using Metageek’s Chanalyzer Pro, we took several measure-ments near our test access point. In this first image, you see the impact of running our non-Wi-Fi interference genera-tor. In real life, this might be something like a microwave oven—some device spewing out gobs of noise smack on the same frequency used by channel 1 in the 2.4 GHz spectrum. As you can see in the duty cycle measurement, roughly 30% of the available bandwidth around our channel is blown out by the noise. Also notice how the amplitude of this noise registers just about the -80 dBm level.
Next, we add one client connecting to our target access point. The amplitude doesn’t budge, but now we see the duty cycle spiking up over 80%.
If you’re curious, that bump in traffic around channel 11 is an unrelated WLAN running in a nearby building.
Finally, we add wireless traffic from all 60 of our Vostro cli-ents into the mix. Amplitude jumps above -60 dBm and the duty cycle nearly redlines, peaking at 95%. You know how your PC performs when CPU utilization holds at or above
Non-802.11 Interference (2.4 GHz) — Channel Utilization with No Tests Running

6
Non-802.11 Interference (2.4 GHz) — Channel Utilization During Single Client Performance Tests
802.11 Co-Channel Interference (5 GHz) — Channel Capacity During Multi Client Performance Tests

Why Your Wi-Fi Sucks and How It Can Be Helped
7
90%? Imagine something analogous with Wi-Fi contention. Refer back to our contention discussion in part 1 and con-sider how common it would be for packets to require resend-ing over and over in such an environment. How the access point deals with this situation will be critical in determining the end-user’s experience.
Before we delve into any hard testing, we felt it was impor-tant to give a sense of wireless coverage from each of our six access points. You’ve seen where the laptop systems are located within our environment. If we were running a normal office, the logical placement of the access point would be directly above the middle of our 60-cli-ent cluster (which is where we mounted our second access point, not the unit under test, during interference testing). So, to get an idea of how well each access point might serve such an environment in terms of coverage, we worked with commercial wireless solutions provider Connect802 to perform a thorough site survey for all six APs.
With a test notebook strapped into a harness and running AirMagnet Survey Professional Edition, our Connect802 technician made six complete walking tours of our office area. In the following images, you can see the path he walked marked by the little red arrows on each map.
We did make one modification from the software’s default setting. When our Connect802 specialist men-tioned that an access point would need a roughly -70 to -75 dBm sig-nal in order to hold a usable Wi-Fi connection, we had the technician change the color scale on his maps such that light blue hits at -75 dBm and light blue/green is at -70 dBm. This way, you can assume that green shading (and on into the stronger
yellow and red zones) represents a dependable Wi-Fi signal.
In the 2.4 GHz range, HP clearly fares worst. Kudos to Apple for making a fairly equivalent showing to Aruba, Cisco, and Meraki, although note how Apple, Aruba, and Meraki all have one quirky dead spot in each of their decent
Wi-Fi Signal Heat Maps: 2.4 GHz

8
coverage areas. Cisco and Ruckus do not share this problem. In terms of green coverage to the building’s far wall, Ruckus provides the most coverage.
With 5 GHz mapping, this second verse runs very similar to the first, only this time we’d give the nod to Cisco for hav-ing the most -70 dBm or better coverage. With its longer wavelengths, 2.4 GHz is known to be somewhat more pen-etrating and long-reaching than 5 GHz. Either way, though,
such maps are essential when deploying wireless coverage across a broad area because you have to know how many APs you’ll need to service your users. Better coverage is one of the factors that lead to purchasing fewer APs.
We begin with the single-client downlink test at 5 GHz with a 10-foot line-of-sight distance. HP handily trounces the field here, thanks to its triple-stream capability. Given that, it’s not surprising that Meraki comes in second place.
Downlink TCP Performance at 10’ LoSOne 5 GHz client
Meraki 24
Aruba 125
Ruckus 7363
Apple Extreme
Cisco 3500
140 150 160
Mb/s170 180
169.52
166.25
161.45
156.03
152.42
Uplink TCP Performance at 10’ LoSOne 5 GHz client
Meraki 24
Aruba 125
Ruckus 7363
HP 460
Apple Extreme
Cisco 3500
Mb/s0 10 20 30 40 50 60 70 80 90 100 110 120 130140 150160 170
157.47136.55
129.51128.47
126.15113.68
Wi-Fi Signal Heat Maps: 2.4 GHz
Why Your Wi-Fi Sucks and How It Can Be Helped
9
These are the only two APs able to leverage all three of the client’s potential streams.
In the 10-foot uplink test, Meraki soars out to 157 Mb/s, leaving the next four contenders clustered around 130 Mb/s and Cisco bringing up the rear at 114 Mb/s. Why would the triple-stream HP fall back into the pack here? We don’t have a good explanation. Theoretically, it should have done bet-ter. Our only explanation would be that perhaps HP has a somewhat asymmetrical orientation in its omnidirectional antennas. This might explain the lag we see, as well as the jump witnessed on the next page—if the client happened to fall in a sweet spot for that AP’s signal.
After all of the many optimizations we discussed in part 1, why doesn’t Ruckus sweep the field and win here? Because in all wireless approaches, there are compromises. Ruckus APs are designed for adaptability. Keep in mind that the AP being tested doesn’t know its distance from the client. It only senses signal strength. So, if an AP is programmed to keep continually searching for a better pattern, it’s going to spend resources essentially saying, “Can I hear you bet-ter this way? Nope, so I’ll go back to how I was. Well, how
about this way? Nope, back again. How about...?” At such close range, there’s only one best path: direct line-of-sight. Attempting to optimize to anything else is only going to hamper performance, but Ruckus keeps trying. That’s the trade-off. Additionally, the benefits of single-antenna beam-forming and signal steering vanish in such close quarters.
Does it need to be said that anything over 100 Mb/s is a very respectable result for 802.11n? Still, we have a roughly 30% variance from low (HP) to high (Ruckus) here, so obviously something is afoot if both three-stream APs are trailing the two-stream Ruckus. Meraki puts on a good show in second place, but HP now comes in last. This may be a case of the AP’s inability to maintain all three diverse streams.
Imagine standing in an open field trying to run three streams with spatial multiplexing. It wouldn’t work, right? There’s nothing to bounce those secondary signals off of. The only stream available is the direct line-of-sight between the AP and client. To some degree, that principle may be influencing these results. If the HP can’t effectively utilize
the nearby walls and other objects to sustain three reliable streams, then it may have to drop down to two streams, or even one (we suspect two in this case). Meanwhile, the dif-ference between 10 feet and 70 is huge for Ruckus, which can now bring its arsenal of transmit/receive options to bear on the current conditions. Again, note Cisco’s 10% boost here over the herd with only two streams.
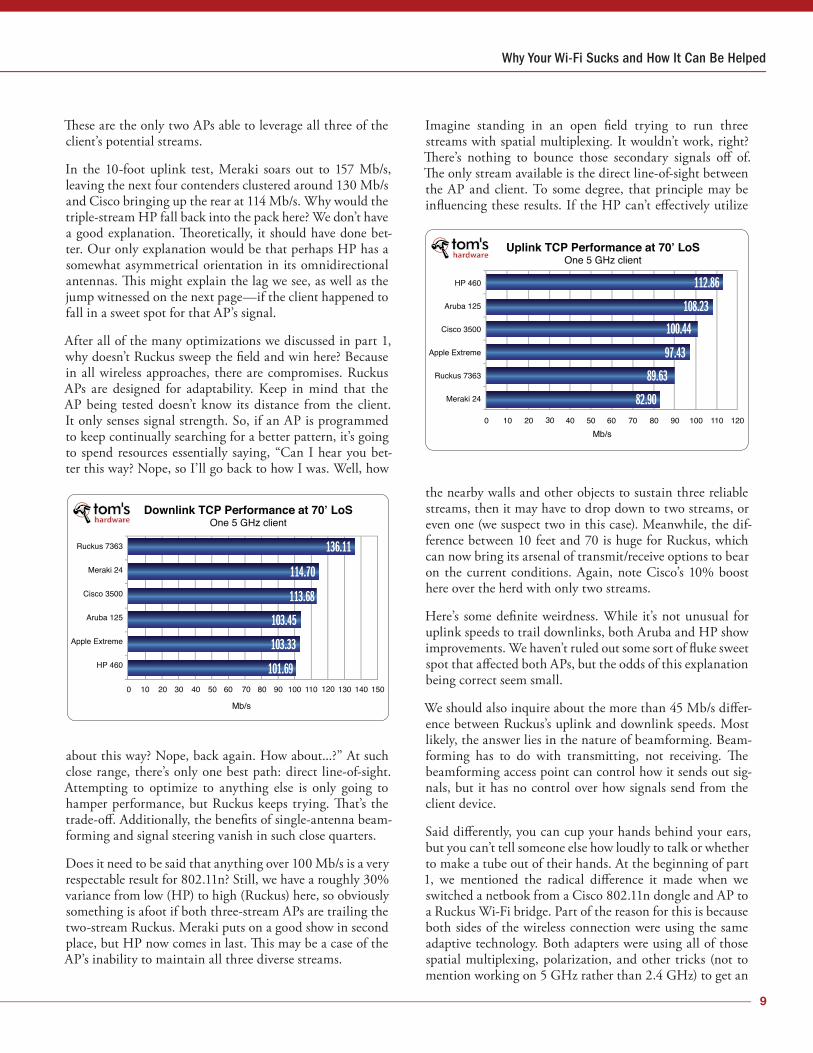
Here’s some definite weirdness. While it’s not unusual for uplink speeds to trail downlinks, both Aruba and HP show improvements. We haven’t ruled out some sort of fluke sweet spot that affected both APs, but the odds of this explanation being correct seem small.
We should also inquire about the more than 45 Mb/s differ-ence between Ruckus’s uplink and downlink speeds. Most likely, the answer lies in the nature of beamforming. Beam-forming has to do with transmitting, not receiving. The beamforming access point can control how it sends out sig-nals, but it has no control over how signals send from the client device.
Said differently, you can cup your hands behind your ears, but you can’t tell someone else how loudly to talk or whether to make a tube out of their hands. At the beginning of part 1, we mentioned the radical difference it made when we switched a netbook from a Cisco 802.11n dongle and AP to a Ruckus Wi-Fi bridge. Part of the reason for this is because both sides of the wireless connection were using the same adaptive technology. Both adapters were using all of those spatial multiplexing, polarization, and other tricks (not to mention working on 5 GHz rather than 2.4 GHz) to get an
Downlink TCP Performance at 70’ LoSOne 5 GHz client
Ruckus 7363
Meraki 24
Cisco 3500
Aruba 125
Apple Extreme
HP 460
Mb/s
0 10 20 30 40 50 60 70 80 90 100 110 120 130 140 150
136.11
114.70
113.68
103.45
103.33
101.69
Uplink TCP Performance at 70’ LoSOne 5 GHz client
HP 460
Aruba 125
Cisco 3500
Apple Extreme
Ruckus 7363
Meraki 24
Mb/s0 10 20 30 40 50 60 70 80 90 100 110 120
112.86
108.23
100.44
97.43
89.63
82.90
10
optimal connection in both directions. Obviously, though, we had to settle on a single client adapter that would best represent what people would be using in an average high-demand environment.
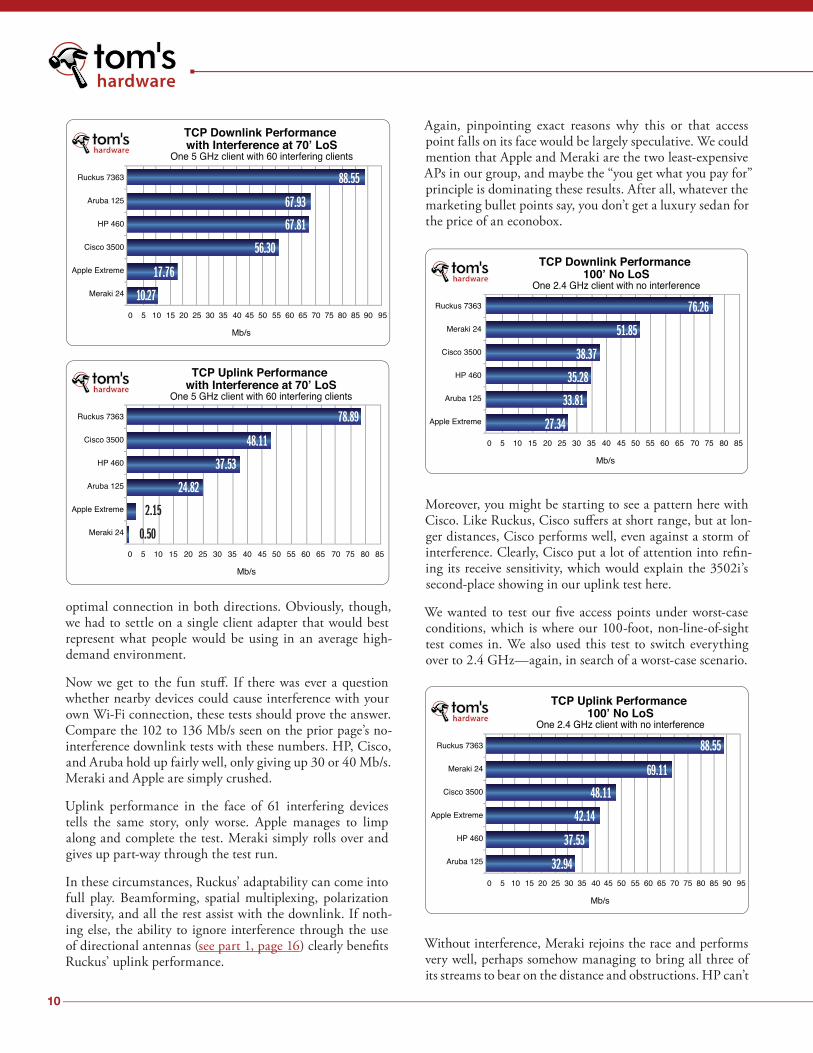
Now we get to the fun stuff. If there was ever a question whether nearby devices could cause interference with your own Wi-Fi connection, these tests should prove the answer. Compare the 102 to 136 Mb/s seen on the prior page’s no-interference downlink tests with these numbers. HP, Cisco, and Aruba hold up fairly well, only giving up 30 or 40 Mb/s. Meraki and Apple are simply crushed.
Uplink performance in the face of 61 interfering devices tells the same story, only worse. Apple manages to limp along and complete the test. Meraki simply rolls over and gives up part-way through the test run.
In these circumstances, Ruckus’ adaptability can come into full play. Beamforming, spatial multiplexing, polarization diversity, and all the rest assist with the downlink. If noth-ing else, the ability to ignore interference through the use of directional antennas (see part 1, page 16) clearly benefits Ruckus’ uplink performance.
Again, pinpointing exact reasons why this or that access point falls on its face would be largely speculative. We could mention that Apple and Meraki are the two least-expensive APs in our group, and maybe the “you get what you pay for” principle is dominating these results. After all, whatever the marketing bullet points say, you don’t get a luxury sedan for the price of an econobox.
Moreover, you might be starting to see a pattern here with Cisco. Like Ruckus, Cisco suffers at short range, but at lon-ger distances, Cisco performs well, even against a storm of interference. Clearly, Cisco put a lot of attention into refin-ing its receive sensitivity, which would explain the 3502i’s second-place showing in our uplink test here.
We wanted to test our five access points under worst-case conditions, which is where our 100-foot, non-line-of-sight test comes in. We also used this test to switch everything over to 2.4 GHz—again, in search of a worst-case scenario.
Without interference, Meraki rejoins the race and performs very well, perhaps somehow managing to bring all three of its streams to bear on the distance and obstructions. HP can’t
TCP Downlink Performance with Interference at 70’ LoS
One 5 GHz client with 60 interfering clients
Ruckus 7363
Aruba 125
HP 460
Cisco 3500
Apple Extreme
Meraki 24
Mb/s
95908580757065605550454035302520151050
88.55
67.93
67.81
56.30
17.76
10.27
TCP Uplink Performance with Interference at 70’ LoS
One 5 GHz client with 60 interfering clients
Ruckus 7363
Cisco 3500
HP 460
Aruba 125
Apple Extreme
Meraki 24
Mb/s
8580757065605550454035302520151050
78.89
48.11
37.53
24.82
2.15
0.50
TCP Downlink Performance 100’ No LoS
One 2.4 GHz client with no interference
Ruckus 7363
Meraki 24
Cisco 3500
HP 460
Aruba 125
Apple Extreme
Mb/s
8580757065605550454035302520151050
76.26
51.85
38.37
35.28
33.81
27.34
TCP Uplink Performance 100’ No LoS
One 2.4 GHz client with no interference
Ruckus 7363
Meraki 24
Cisco 3500
Apple Extreme
HP 460
Aruba 125
Mb/s
95908580757065605550454035302520151050
88.55
69.11
48.11
42.14
37.53
32.94
Why Your Wi-Fi Sucks and How It Can Be Helped
11
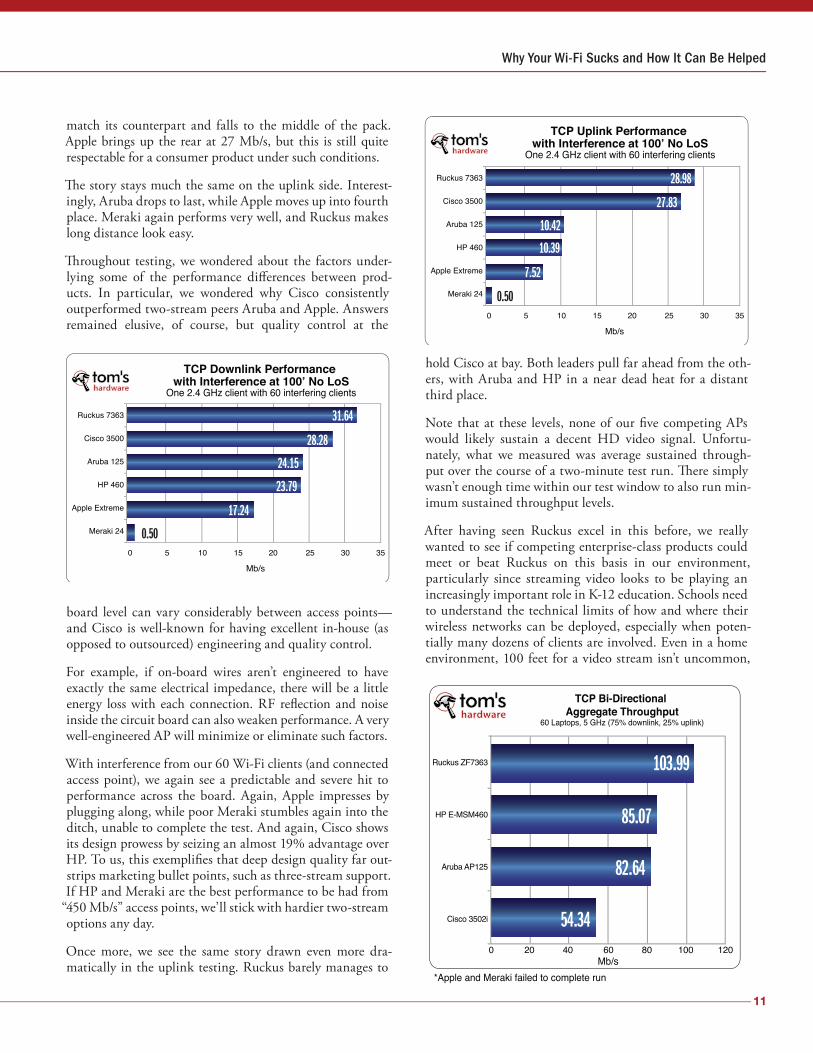
match its counterpart and falls to the middle of the pack. Apple brings up the rear at 27 Mb/s, but this is still quite respectable for a consumer product under such conditions.
The story stays much the same on the uplink side. Interest-ingly, Aruba drops to last, while Apple moves up into fourth place. Meraki again performs very well, and Ruckus makes long distance look easy.
Throughout testing, we wondered about the factors under-lying some of the performance differences between prod-ucts. In particular, we wondered why Cisco consistently outperformed two-stream peers Aruba and Apple. Answers remained elusive, of course, but quality control at the
board level can vary considerably between access points—and Cisco is well-known for having excellent in-house (as opposed to outsourced) engineering and quality control.
For example, if on-board wires aren’t engineered to have exactly the same electrical impedance, there will be a little energy loss with each connection. RF reflection and noise inside the circuit board can also weaken performance. A very well-engineered AP will minimize or eliminate such factors.
With interference from our 60 Wi-Fi clients (and connected access point), we again see a predictable and severe hit to performance across the board. Again, Apple impresses by plugging along, while poor Meraki stumbles again into the ditch, unable to complete the test. And again, Cisco shows its design prowess by seizing an almost 19% advantage over HP. To us, this exemplifies that deep design quality far out-strips marketing bullet points, such as three-stream support. If HP and Meraki are the best performance to be had from
“450 Mb/s” access points, we’ll stick with hardier two-stream options any day.
Once more, we see the same story drawn even more dra-matically in the uplink testing. Ruckus barely manages to
hold Cisco at bay. Both leaders pull far ahead from the oth-ers, with Aruba and HP in a near dead heat for a distant third place.
Note that at these levels, none of our five competing APs would likely sustain a decent HD video signal. Unfortu-nately, what we measured was average sustained through-put over the course of a two-minute test run. There simply wasn’t enough time within our test window to also run min-imum sustained throughput levels.
After having seen Ruckus excel in this before, we really wanted to see if competing enterprise-class products could meet or beat Ruckus on this basis in our environment, particularly since streaming video looks to be playing an increasingly important role in K-12 education. Schools need to understand the technical limits of how and where their wireless networks can be deployed, especially when poten-tially many dozens of clients are involved. Even in a home environment, 100 feet for a video stream isn’t uncommon,
TCP Downlink Performance with Interference at 100’ No LoS
One 2.4 GHz client with 60 interfering clients
Ruckus 7363
Cisco 3500
Aruba 125
HP 460
Apple Extreme
Meraki 24
Mb/s
35302520151050
31.64
28.28
24.15
23.79
17.24
0.50
TCP Uplink Performance with Interference at 100’ No LoS
One 2.4 GHz client with 60 interfering clients
Ruckus 7363
Cisco 3500
Aruba 125
HP 460
Apple Extreme
Meraki 24
Mb/s
35302520151050
28.98
27.83
10.42
10.39
7.52
0.50
*Apple and Meraki failed to complete run
Ruckus ZF7363
HP E-MSM460
Aruba AP125
Cisco 3502i
TCP Bi-Directional Aggregate Throughput
60 Laptops, 5 GHz (75% downlink, 25% uplink)
Mb/s20 40 60 80 100 1200
103.99
85.07
82.64
54.34

12
although the amount of interference likely to be encoun-tered by consumers should be less than we inflicted here.
In a modern tech enthusiast’s home, it’s not unthinkable that there could be a dozen Wi-Fi devices connecting to a single access point. Just counting laptops and smartphones, how many devices there are connecting at your local coffee shop? Imagine how many there would be in a school gym-nasium for a community event or a corporate board room for an all-hands executive meeting. Having 60 notebooks connect to a single AP, all of them running bi-directional traffic concurrently, isn’t far-fetched. How well a given AP performs under such conditions not only determines the quality of the end-user’s experience, but also how many APs
an organization has to buy to handle an anticipated load in a given area.
Here we get our first look at how our APs stack up when get-ting hammered by 60 laptop clients. Trying to reflect a real-istic usage scenario, we settled on the ratio of 75% downlink and 25% uplink traffic. Only four APs survived the test.
We know from our first results that optimal throughput for one client is in the 160 to 170 Mb/s range. You’ll get a sense from the iPad data coming up shortly how aggre-gate throughput increases for multiple, concurrent clients. But there are limits. Any given AP can only handle so much traffic before it starts to strain under the load. Even
Aggregate Throughput (TCP Downlink)60 Laptops
(Simultaneous downloads of 1MB file)
Elapsed time (h:mm:ss)
147.00140.00
120.00
100.00
80.00
60.00
40.00
20.00
0.000:00:00 0:00:20 0:00:40 0:01:00 0:01:20 0:01:40 0:01:50
*failed to complete test runs
Mbp
s
Throughput
Ruckus 7363: 111.10 Mbit/s
HP E-MSM460: 88.41 Mbit/s
Aruba AP125: 76.42 Mbit/s
Meraki MR24: 48.68 Mbit/s*Cisco 3502i: 38.17 Mbit/s
AirPort Extreme: 3.83 Mbit/s*
147.00140.00
120.00
100.00
80.00
60.00
40.00
20.00
0.000:00:00 0:00:20 0:00:40 0:01:00 0:01:20 0:01:40 0:01:50
Aggregate Throughput (TCP Uplink)60 Laptops
(Simultaneous downloads of 1MB file)
Elapsed time (h:mm:ss)
115.50110.00
100.00
90.00
80.00
70.00
60.00
50.00
40.00
20.00
10.00
30.00
0.000:00:00 0:00:20 0:00:40 0:01:00 0:01:20 0:01:40 0:01:50
*failed to complete test runs
Mbp
s
Throughput
Ruckus 7363: 95.59 Mbit/s
HP E-MSM460: 76.81 Mbit/sAruba AP125: 68.76 Mbit/s
Meraki MR24: 41.98 Mbit/s*
Cisco 3502i: 61.81 Mbit/sAirPort Extreme: 53.75 Mbit/s

Why Your Wi-Fi Sucks and How It Can Be Helped
13
when we compared aggregate performance of one note-book against ten, Ruckus, Aruba, and HP only showed a 10% to 20% total throughput gain for the notebook group. The aggregate performance for Apple and Meraki actually dropped substantially, already forced to their knees by just ten clients.
Sixty laptops, all transferring 1 MB test files repeatedly, is a pretty heavy burden—too heavy for Apple and Meraki to sustain. Let’s take a closer look at the actual IxChariot data to see what’s really happening.
One of the qualities to look for in an access point or router is the consistency of its connections. When viewed in terms of throughput over time, you don’t want a lot of crazy peaks and troughs. You want users to have a stable connec-tion speed, and the floor of the throughput range is at least equally important. Consider the impact on playback of a 10 Mb/s video stream when 15 Mb/s of average throughput keeps dipping down into the 3 to 5 Mb/s range.
Cisco’s flat download range here looks outstanding. The problem is that it’s so low. Incredibly, both Cisco and Apple fare far better on uplink performance than downlink, no doubt because there’s far less uplink traffic.
Ruckus offers the flattest, highest results across both data sets, with HP and Aruba both putting in impressive show-ings. Poor Apple’s chart is almost comical, like it managed a single downlink heartbeat before passing into the great beyond. Meraki at least flopped about in cardiac arrest for a while.
Now that we know how laptops perform in aggregate, how about the tablets rising up in the market to replace many of them? This is why we brought our assortment of iPads and iPad 2s into the fray.
The bad news with the iPad 2 is that it’s a poky performer. The good news is that it is reliably poky under even terri-ble conditions. The following images use the same AP color scheme we employed on the prior page. Surprisingly, Cisco turns out to be the laggard of the group at roughly 10 Mb/s, but everyone else packs into that tight 12 to 14 Mb/s band.
If aggregate performance scaled perfectly, we’d see five iPad 2s topping out around 60 Mb/s. Instead, our best-perform-ing APs in this test peak just over 40 Mb/s. Cisco seems to hover around the 28 Mb/s mark.
As we look back, we see that even a mid-range laptop blows the iPad 2 away on Wi-Fi speed, thanks in part to having three antennas instead of one. Maybe this is an unfair com-parison because the expected usage for both device types is very different. Still, it’s reasonable to expect that tablets will continue to gain market traction and seek to take on new, more demanding applications as they evolve. Obvi-ously, wireless capabilities in tablets are not keeping pace with processor and graphics improvements, and this needs to change—quickly.
More to the point of this article, having an AP able to make the best of underperforming devices is only going to become more important as we continue to move away from larger systems (desktops and notebooks) into handheld
Single iPad2 vs. LaptopTCP Throughput
(5 GHz, 70’ LoS)Throughput
Mbp
s
Elapsed time (h:mm:ss)
136.50
100.00
80.00
60.00
40.00
20.00
0.000:00:00
LaptopsiPads
0:01:00
120.00
5 iPad2s vs. 5 LaptopsAggregate TCP Throughput
(5 GHz, 70’ LoS)Throughput
Mbp
sElapsed time (h:mm:ss)
147.00140.00
100.00
80.00
60.00
40.00
20.00
0.000:00:00
LaptopsiPads
0:01:00
120.00

14
Aggregate Throughput (TCP Downlink)Single iPad 2
(Simultaneous downloads of 1MB file)Throughput
Elapsed time (h:mm:ss)Not all results are graphed
Mbp
s
17.850
16.000
14.000
12.000
10.000
8.000
6.000
4.000
2.000
0.0000:00:00 0:00:10 0:00:20 0:00:30 0:00:40 0:00:50 0:01:00
Aggregate Throughput (TCP Downlink)Five x iPad 2
(Simultaneous downloads of 1MB file)Throughput
Elapsed time (h:mm:ss)Not all results are graphed
Mbp
s
47.25044.000
40.000
36.000
32.000
28.000
24.000
20.000
16.000
12.000
8.000
4.000
0.0000:00:00 0:00:10 0:00:20 0:00:30 0:00:40 0:00:50 0:01:00

Why Your Wi-Fi Sucks and How It Can Be Helped
15
client devices and their scaled-back wireless capabilities. Smartphones have even smaller single antennas than the iPad. And remember from part 1, page 6 how airtime fair-ness works. If you allow those slow handhelds on your WLAN without airtime fairness implemented at the access point, those devices will significantly drag down the per-formance of larger, faster systems. Our next page illustrates this dramatically.
We already know that Apple and Meraki collapse under 60 clients, but for the remaining contenders, what happens when you bring another five iPad 2 tablets into the mix? For one thing, HP seems to hold up surprisingly well. While the HP disappointed in our interference testing, it seems revitalized when it comes to handling massive traffic loads...or does it?
When we break out the data for laptops versus iPad 2s, a dif-ferent story appears. Recall from our single laptop versus iPad comparison how the laptop’s throughput was roughly 7.5x
greater than that of the tablet. Yet we have 12 times as many laptops as tablets. What should be the proper ratio of note-book to tablet bandwidth in this test—7.5x, 12x, or some-where in between? There may be no perfect answer, but it’s safe to assume that somewhere in the middle is best. Ruckus and Cisco both land in this zone, showing notebook through-put of about 11x and 9x that of the five attached tablets. HP, however, comes in with nearly 60x, starving the iPads with only a trickle of data. Not much airtime fairness there.
Aruba goes in the opposite direction, giving the iPads far more time than they deserve—over one-third of the total bandwidth. Given this, perhaps it should come as no sur-prise that Aruba disabled airtime fairness by default. We can only assume that this is a gross oversight on Aruba’s part, but our mission to only use default AP settings before starting testing was clear. Regardless, this highlights the importance of airtime fairness in a crowded Wi-Fi environ-ment with mixed device types.
5 iPads + 60 Laptops Aggregate TCP Throughtput
70’ LoS (5 GHz)
Ruckus
HP
Aruba
Cisco
0 20 40 60 80 100 120
108.602
77.641
58.05
31.848
Mb/s
5 iPads + 60 Laptops Comparative Aggregate TCP Throughput
70’ LoS (5 GHz)
Ruckus
HP
Aruba
Cisco
0 20 40 60 80 100
Laptops iPads
120
99.429
76.355
36.134
28.779
21.871
9.173
1.286
3.069
Mb/s
147.00140.00
120.00
100.00
80.00
60.00
40.00
20.00
0.000:00:10 0:00:30 0:00:50 0:01:10 0:01:30
Cisco.tstRuckus.tst
0:01:50
Elapsed time (h:mm:ss)
60 Laptops, TCP Downlink
Mbp
s
HP.tstAruba.tst

16
Just to make this airtime fairness point even more explicit, let’s dig into a further breakdown of access point perfor-mance. Going back to our 60-laptop downlink tests, the original throughput chart of the four survivors looks like this in IxChariot:
As we saw in the bar graphs, Ruckus tops the field, HP and Aruba battle for runner-up, and Cisco pulls along slow but steady around 40 Mb/s. The extra insight you get here is that HP demonstrates a tighter bandwidth range than its Aruba counterpart, making it an even better choice between the pair.
Now look at how these four APs divide up their bandwidth on a per-client basis.
Cisco and Ruckus both do excellent jobs at making sure each client gets a fairly equal slice of the available band-width. HP does fairly even work, save for that one 9.4% slice. Aruba, which did not have airtime fairness enabled, slips even further, giving over 20% of the bandwidth pie to only two clients, leaving that much less for the other 58.
But even Aruba’s favoritism can be overlooked in the face of Meraki’s egregious, haphazard allocations. We ran a
Aruba Cisco
HP Ruckus
0.7% Pair 10.6% Pair 31.5% Pair 50.9% Pair 70.6% Pair 90.7% Pair 110.9% Pair 130.4% Pair 161.3% Pair 181.1% Pair 200.7% Pair 220.6% Pair 241.7% Pair 261.5% Pair 281.4% Pair 302.4% Pair 321.3% Pair 341.7% Pair 362.3% Pair 387.6% Pair 401.3% Pair 421.3% Pair 441.4% Pair 463.0% Pair 481.3% Pair 501.8% Pair 5213.9% Pair 540.9% Pair 562.0% Pair 580.9% Pair 60
1.2% Pair 11.7% Pair 32.2% Pair 52.1% Pair 71.4% Pair 91.1% Pair 111.4% Pair 131.2% Pair 151.1% Pair 171.4% Pair 192.2% Pair 211.5% Pair 231.3% Pair251.7% Pair 271.6% Pair 291.6% Pair 311.3% Pair 332.1% Pair 351.7% Pair 371.4% Pair 391.4% Pair 411.3% Pair 431.0% Pair 451.0% Pair 473.4% Pair 493.0% Pair 511.7% Pair 531.3% Pair 551.3% Pair 571.1% Pair 59
1.2% Pair 21.2% Pair 41.5% Pair 61.1% Pair 81.2% Pair 101.4% Pair 121.5% Pair 141.0% Pair 161.5% Pair 181.5% Pair 201.4% Pair 221.7% Pair 241.5% Pair 261.0% Pair 281.6% Pair 301.6% Pair 329.1% Pair 342.1% Pair 361.7% Pair 382.0% Pair 401.5% Pair 421.5% Pair 441.3% Pair 461.4% Pair 482.2% Pair 501.6% Pair 521.8% Pair 541.3% Pair 561.7% Pair 581.1% Pair 60
2.1% Pair 10.9% Pair 31.9% Pair 51.0% Pair 71.6% Pair 90.5% Pair 111.0% Pair 131.8% Pair 151.8% Pair 172.2% Pair 192.1% Pair 210.7% Pair 231.9% Pair 251.8% Pair 272.2% Pair 292.1% Pair 312.1% Pair 331.1% Pair 351.6% Pair 372.1% Pair 391.3% Pair 411.0% Pair 431.3% Pair 450.8% Pair 472.1% Pair 492.1% Pair 512.2% Pair 531.3% Pair 552.0% Pair 571.8% Pair 59
2.2% Pair 22.0% Pair 42.0% Pair 62.1% Pair 81.8% Pair 101.3% Pair 122.1% Pair 142.2% Pair 161.9% Pair 182.0% Pair 202.2% Pair 221.9% Pair 241.3% Pair 260.4% Pair 281.8% Pair 300.2% Pair 322.0% Pair 342.2% Pair 361.6% Pair 382.3% Pair 401.2% Pair 422.2% Pair 441.6% Pair 462.3% Pair 481.0% Pair 502.2% Pair 522.1% Pair 541.1% Pair 560.7% Pair 581.7% Pair 60
1.5% Pair 11.0% Pair 31.5% Pair 51.8% Pair 71.7% Pair 91.3% Pair 111.5% Pair 131.1% Pair 151.6% Pair 171.9% Pair 191.6% Pair 211.3% Pair 231.9% Pair 251.4% Pair 271.8% Pair 292.1% Pair 311.7% Pair 331.7% Pair 351.9% Pair 372.1% Pair 391.8% Pair 411.3% Pair 431.9% Pair 451.8% Pair 471.5% Pair 491.8% Pair 511.5% Pair 531.5% Pair 552.3% Pair 572.1% Pair 59
1.8% Pair 21.5% Pair 42.0% Pair 62.0% Pair 81.8% Pair 101.4% Pair 121.6% Pair 141.5% Pair 161.7% Pair 182.0% Pair 201.8% Pair 221.6% Pair 241.6% Pair 261.7% Pair 281.4% Pair 301.6% Pair 322.0% Pair 341.7% Pair 361.9% Pair 381.7% Pair 401.2% Pair 421.7% Pair 441.5% Pair 461.6% Pair 482.1% Pair 501.8% Pair 521.4% Pair 542.3% Pair 561.2% Pair 581.1% Pair 60
0.7% Pair 20.3% Pair 41.3% Pair 60.5% Pair 80.8% Pair 101.1% Pair 120.9% Pair 150.5% Pair 171.1% Pair 191.8% Pair 210.6% Pair 231.2% Pair 251.1% Pair 272.6% Pair 291.4% Pair 312.7% Pair 331.9% Pair 352.2% Pair 373.7% Pair 390.7% Pair 411.2% Pair 431.1% Pair 451.0% Pair 473.5% Pair 491.2% Pair 512.3% Pair 531.6% Pair 552.4% Pair 570.8% Pair 59
Per Client Airtime by Vendor

Why Your Wi-Fi Sucks and How It Can Be Helped
17
sequence of tests on the MR24, looking to see how the AP handled fairness under increasing load. The results are very telling.
Notice that the aggregate bandwidth with five laptops is almost on par with that of only two laptops. However, even with only five laptops in play, one client receives 45% of the bandwidth while another gets just 2%. Remember that these notebooks are all identical in both hardware and soft-ware configuration. There is no reason at all for the access point to favor one client over another. With 10 clients, this simply turns ridiculous. One client gets 85% of the band-width and eight clients get absolutely nothing. Yet the aggregate bandwidth still reports as almost 90 Mb/s, which sounds rosy on its surface. Out of 60 laptops (before the AP gave up trying), only three received any appreciable band-width; 54 received no data at all.
Deep analysis like what we’ve done here—well over 300 test runs across a wide array of variable factors—is essential if buyers want any kind of true understanding about client performance. When it comes to total environment band-width, those big average Mb/s numbers you see in most router and access point reviews are not painting anything close to a complete picture.
In this two-part series, we sought to take a deeper look at performance by spotlighting the two primary environmental factors that weigh on Wi-Fi performance—interference and
Meraki MR24 Airtime Fairness2 Laptops, 100.97 Mb/s average
45.5% Pair 154.5% Pair 2
5 Laptops, 99.65 Mb/s average 10 Laptops, 89.39 Mb/s average
60 Laptops, 46.69 Mb/s average
27.4% Pair 145.4% Pair 3
0.0% Pair 10.0% Pair 30.0% Pair 50.0% Pair 70.0% Pair 9
0.0% Pair 10.0% Pair 30.0% Pair 50.0% Pair 82.2% Pair 11
0.0% Pair 210.0% Pair 2319.8% Pair 2543.1% Pair 270.0% Pair 29
0.0% Pair 130.0% Pair 150.0% Pair 170.0% Pair 19
0.0% Pair 320.0% Pair 340.0% Pair 360.0% Pair 380.0% Pair 40
4.1% Pair 510.0% Pair 530.0% Pair 550.0% Pair 570.0% Pair 59
0.0% Pair 420.0% Pair 440.0% Pair 470.0% Pair 49
0.0% Pair 20.0% Pair 40.0% Pair 70.0% Pair 90.0% Pair 12
0.0% Pair 220.0% Pair 240.0% Pair 260.0% Pair 280.0% Pair 31
0.0% Pair 140.0% Pair 160.0% Pair 180.0% Pair 20
0.0% Pair 330.0% Pair 350.0% Pair 370.0% Pair 390.0% Pair 41
0.0% Pair 520.0% Pair 540.0% Pair 560.0% Pair 581.7% Pair 60
0.0% Pair 430.0% Pair 460.0% Pair 4829.1% Pair 50
14.8% Pair 20.0% Pair 485.2% Pair 60.0% Pair 80.0% Pair 10
2.0% Pair 5
20.3% Pair 24.9% Pair 4
client load—and many of the technologies access points can use to combat those factors. In part because wireless inter-ference is so difficult to control, most reviewers have never sought to tackle it in a real-world context. And certainly, our results shouldn’t be taken as fixed gospel. Someone could roughly duplicate our test setup and, because of fluctuating conditions, see different test results, if only through product tweaking. As stated earlier, we did no tweaking here—we only tested and reported. Had we started tweaking, we’d still be in that office recording throughput scores.
By now, the results should lead to their own inevitable
Smart, adaptive antenna technology is not analogous to clean alternative ener-gies, but it does provide a giant leap forward in how well we can utilize existing bandwidth resources.

18
conclusions. Apple makes a fine consumer router, but the difference between enterprise-class equipment and con-sumer gear here is glaring. This should be a red flag to power users placing an increasing number of Wi-Fi devices in their homes, as well as any business looking to save dollars by grabbing off-the-shelf gear at the nearest big retailer. The levels of engineering and component quality between the two product classes are worlds apart.
At the same time, there are obviously qualitative differences between enterprise access points. If you want performance under fire from ambient interference, Cisco and especially Ruckus are the two clear choices from our group. The same statement applies to airtime fairness and making sure that all clients get an approximately equal amount of bandwidth at any given time. When it comes to distance, you have to take a closer look at the environmental conditions and the specific attributes of your wireless devices.
In optimal, close-range, with little to no interference and only one client vying for the access point’s attention, the Meraki MR24 suddenly morphs into our top performer, most likely thanks to its three-stream design meshing well with our 3x3:3 Intel client adapter. Start adding distance and obstructions, and the situation changes. It also matters whether you want to emphasize downstream or upstream bandwidth from your AP. Aruba and HP are neither stun-ningly bad nor particularly impressive, but again—mileage may vary according to how you fine-tune the device.
Good Wi-Fi is not about brute force and raw speed. It’s about understanding RF and doing something about it. The products that outperformed in our testing weren’t the
biggest and most expensive, or even the ones that used the highest number of streams. Ruckus puts forth the best effort in the largest number of tests, but it does so with a mere 2x2:2 design through engineering and deep attention to the factors necessary to provide a high-quality wireless experience in increasingly hostile RF conditions. From our group, Cisco is the only other vendor that seems to have provided even close to the same level of attention and control.
A Ruckus representative once mentioned to us in passing that his company had been in advanced talks with at least one panel manufacturer that was interested in putting the company’s antenna technology on a circuit board mounted behind the notebook’s LCD panel, built right into the lid. Can you imagine how performance might differ with both the client and access point using the same adaptive tech-nologies? Sadly, the talks went nowhere because the ven-dor refused to pay Ruckus’ asking price for the technol-ogy. Even in the consumer world, we know that Netgear once brought Ruckus tech to market in one of its 802.11g products, but this soon died out for similar reasons. People don’t understand the qualitative difference between wire-less approaches. Instead they see Mb/s and access times, and that ends the discussion.
It shouldn’t be this way. In the Wi-Fi arena, we’re facing a bandwidth dilemma not unlike the world’s impending oil shortage. As demand and usage continue to climb, our abil-ity to effectively and efficiently use those resources will con-tinue to diminish. Smart, adaptive antenna technology is not analogous to clean alternative energies, but it does pro-vide a giant leap forward in how well we can utilize existing bandwidth resources.
Buy smart and, when possible, demand better from wireless manufacturers.Buy smart and, when possible, demand better from wireless manufacturers.
Ruckus ZoneFlex 7363Mid-Range Dual-Band802.11n (2x2:2) AP
Related Documents


![OdakyuAndroid t Google play] Wi-Fi Android ios t App Store] Wi-Fi [App Store] [iPhone Profile) Wi-Fi # —E Odakyu Odakyu Free Wi-Fi Android [Google play] WI-Fi Android [App Wi-Fi](https://static.cupdf.com/doc/110x72/5fcc31f69b77e950d81a9828/android-t-google-play-wi-fi-android-ios-t-app-store-wi-fi-app-store-iphone.jpg)