Why, who, when and how? An empirical view of the UK construction industry’s decision making process

Welcome message from author
This document is posted to help you gain knowledge. Please leave a comment to let me know what you think about it! Share it to your friends and learn new things together.
Transcript
Why, who, when and how?
An empirical view of the UK construction industry’s
decision making process
Tony Williams
Building Value Ltd
the independent strategic advisor to the building materials, construction
& support services sectors
11 June 2004
UK construction industry is the focus of the study
Number three market in Europe
Accounts for 8% of GDP (below average)
Largest single domestic industry
Some 1.5 million employees
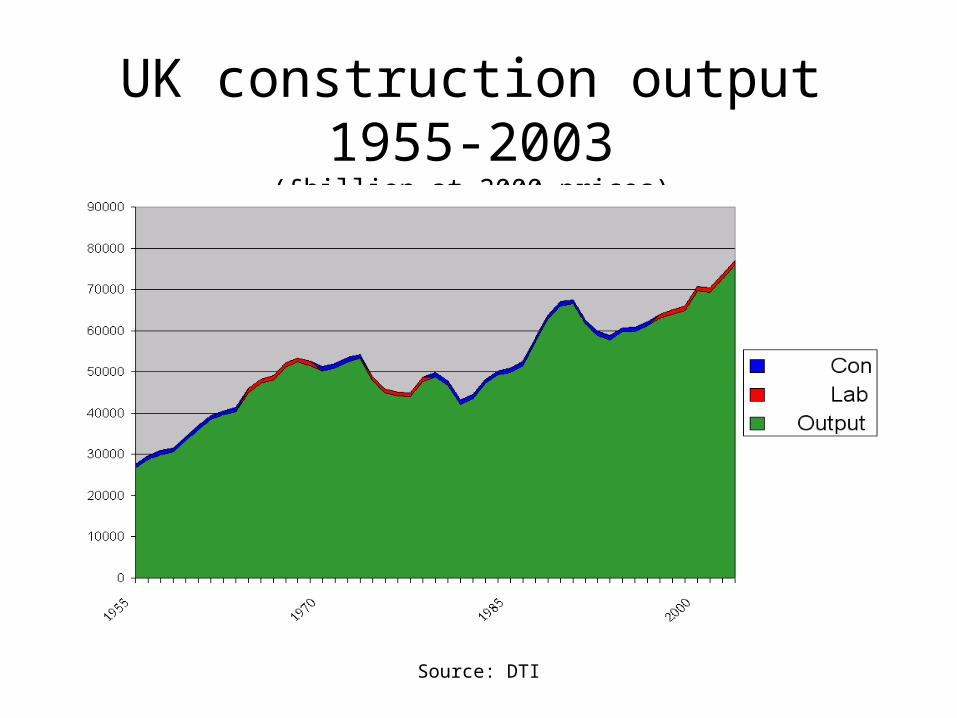
Source: DTI
UK construction output 1955-2003
(£billion at 2000 prices)
UK construction - history
Sustained growth since 1994
Relatively impervious to politics, aside from mid-1970s
Three major collapses in 1974-7; 1980-1; and 1991-3
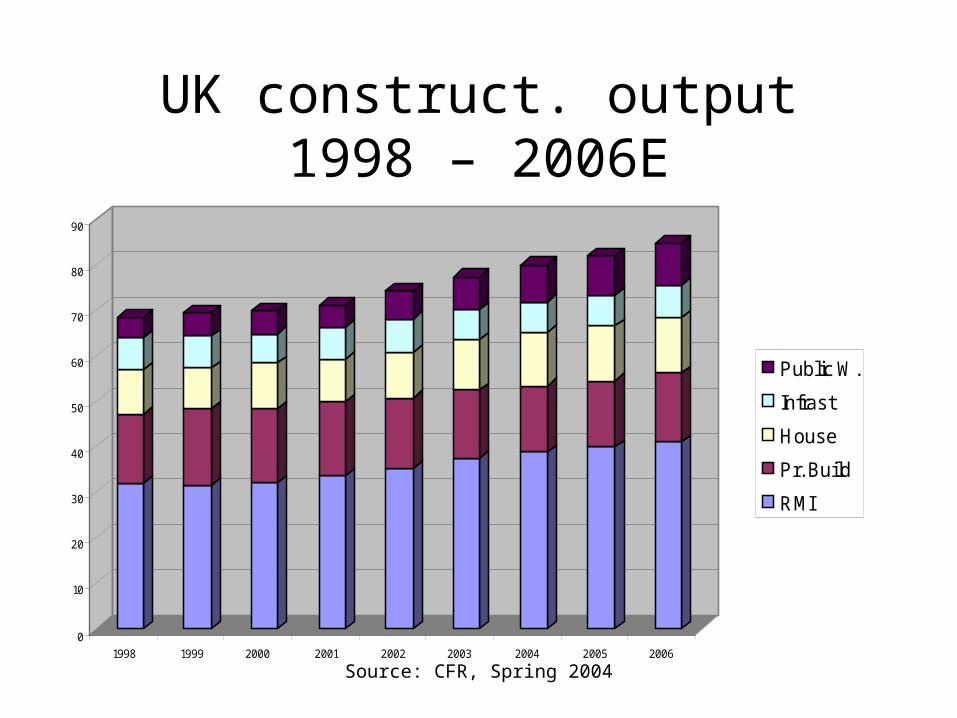
Source: CFR, Spring 2004
UK construct. output 1998 – 2006E
0
10
20
30
40
50
60
70
80
90
1998 1999 2000 2001 2002 2003 2004 2005 2006
Public W.
Infrast
House
Pr. Build
RMI
UK construction – the future
Average ‘3% plus’ real growth through 2006
One of best major markets in Europe
Private Finance Initiative increasingly important
Repair, maintenance & improvement (RMI) averaging more than 48% of total
Methodology
All UK publicly quoted companies on London Stock Exchange; the sector is world’s biggest 65 companies and £52 billion of value
35 large privately owned businesses; many large
Wrote to the CEO with confidentiality assured
46 multi-choice questions and one written answer with expected completion time of five minutes
Supplied SAE, promised to send results and donate £1 per questionnaire to industry charity (CITY)
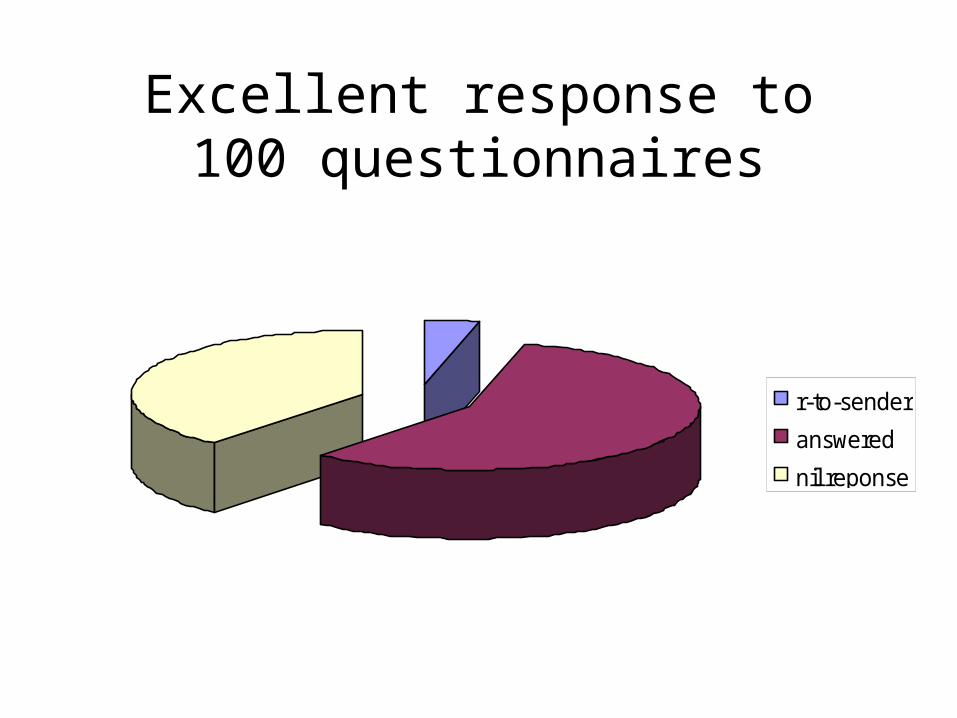
Excellent response to 100 questionnaires
r-to-sender
answered
nil reponse

Those who volunteered identity, others guessed plus anonymous
volunteered
guessed
anonymous
Questionnaire idiosyncrasies
90% of respondents used ticks in the question boxes; with 5% each employing crosses or slashes
Two thirds used black pen, 30% blue and 3% red
The PA of one CEO called, emailed and wrote to say he didn’t have time to fill it in; another declined my invitation to the conference
5% eschewed the SAE and one send it back empty
40% of companies identified themselves
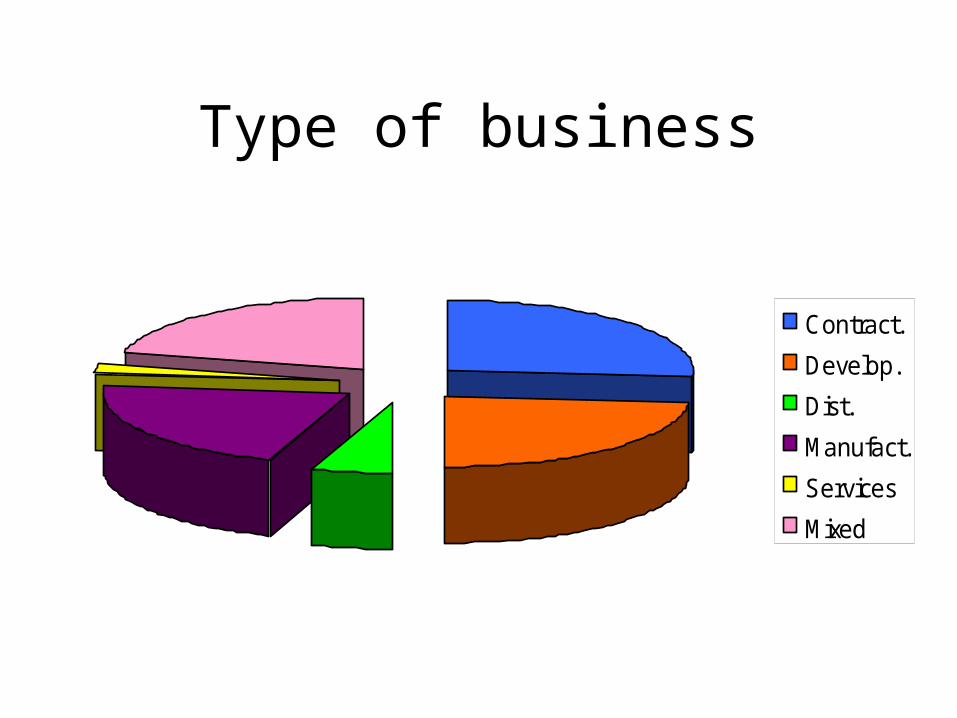
Type of business
Contract.
Develop.
Dist.
Manufact.
Services
Mixed
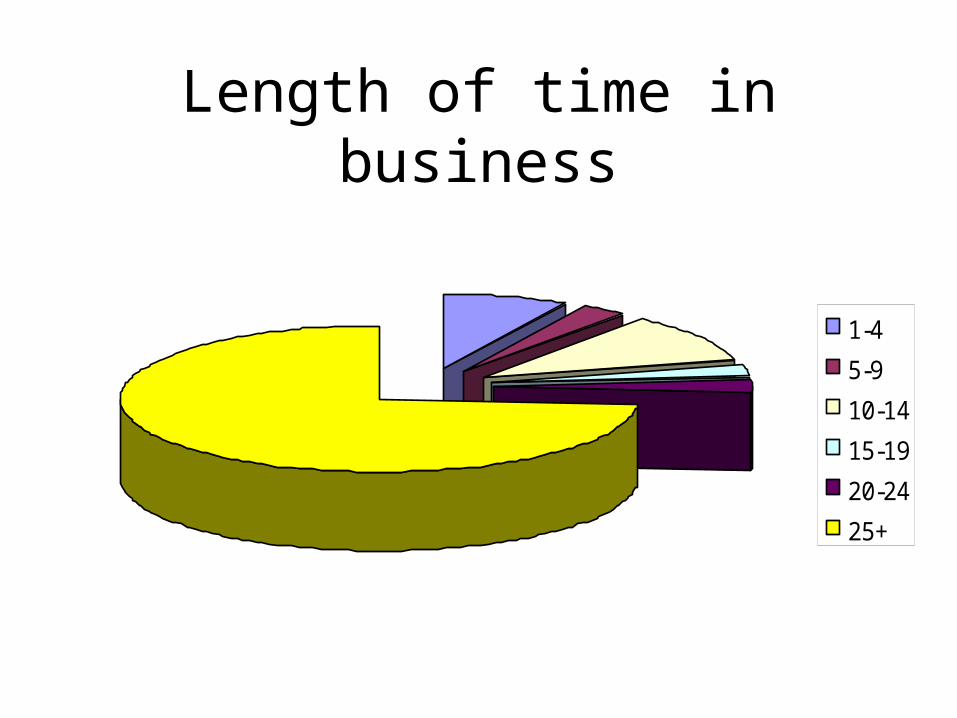
Length of time in business
1-4
5-9
10-14
15-19
20-24
25+
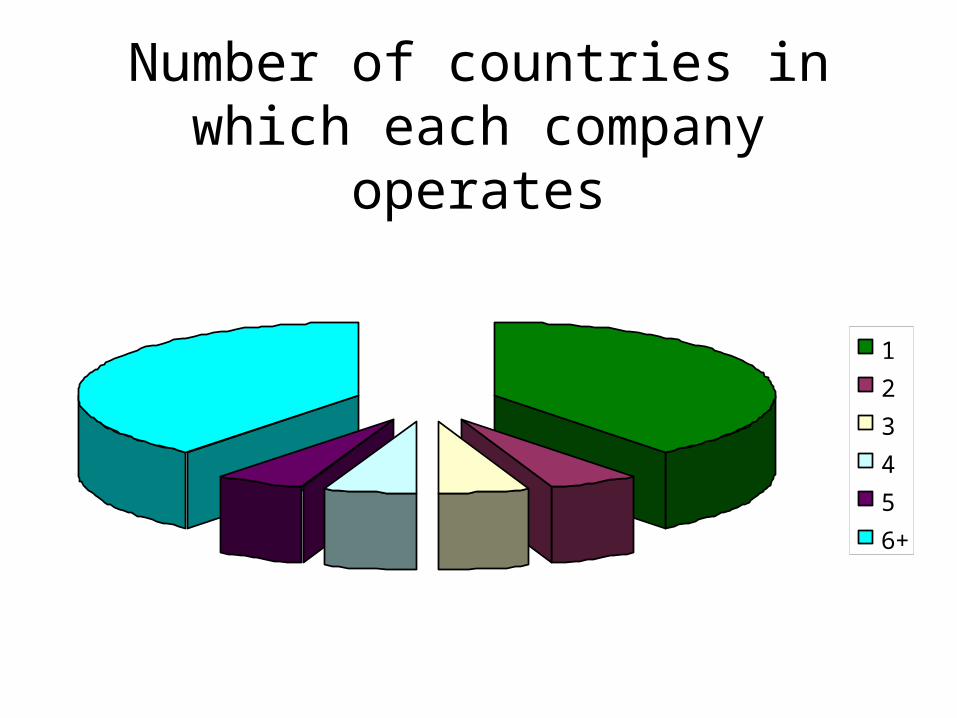
Number of countries in which each company operates
1
2
3
4
5
6+
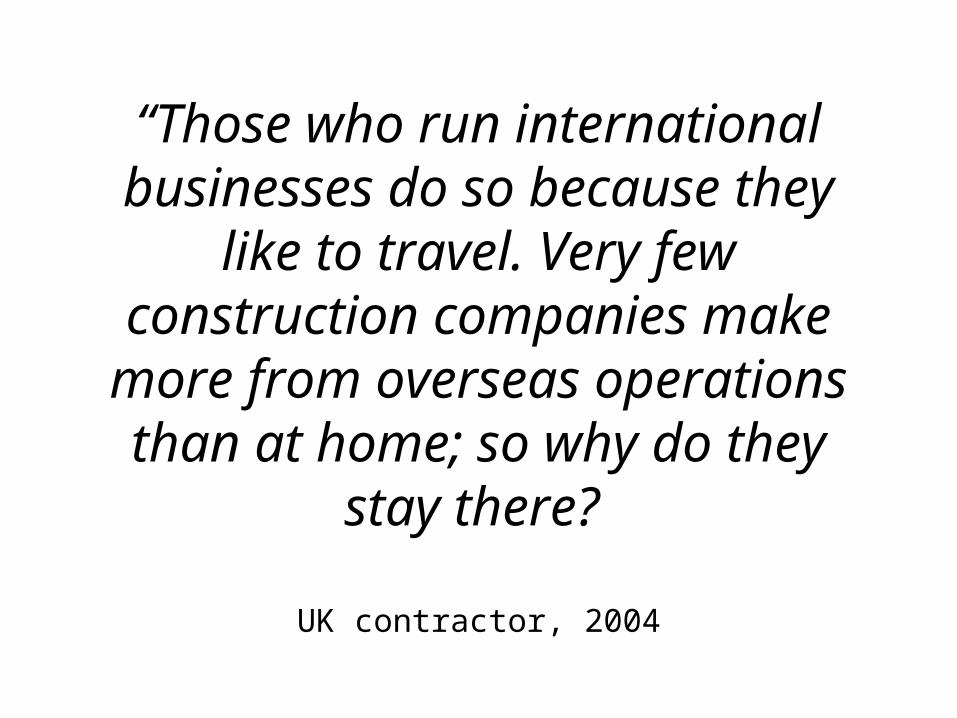
“Those who run international businesses do so because they like to
travel. Very few construction companies make more from overseas operations than at home; so why do
they stay there?
UK contractor, 2004
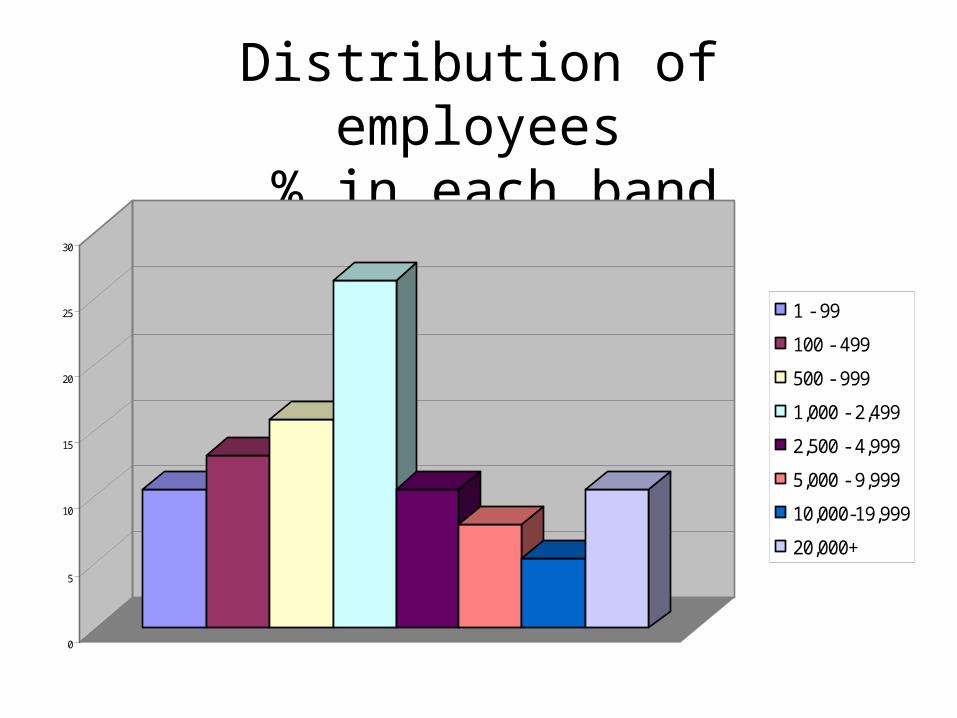
Distribution of employees % in each band
0
5
10
15
20
25
30
1 - 99
100 - 499
500 - 999
1,000 - 2,499
2,500 - 4,999
5,000 - 9,999
10,000-19,999
20,000+
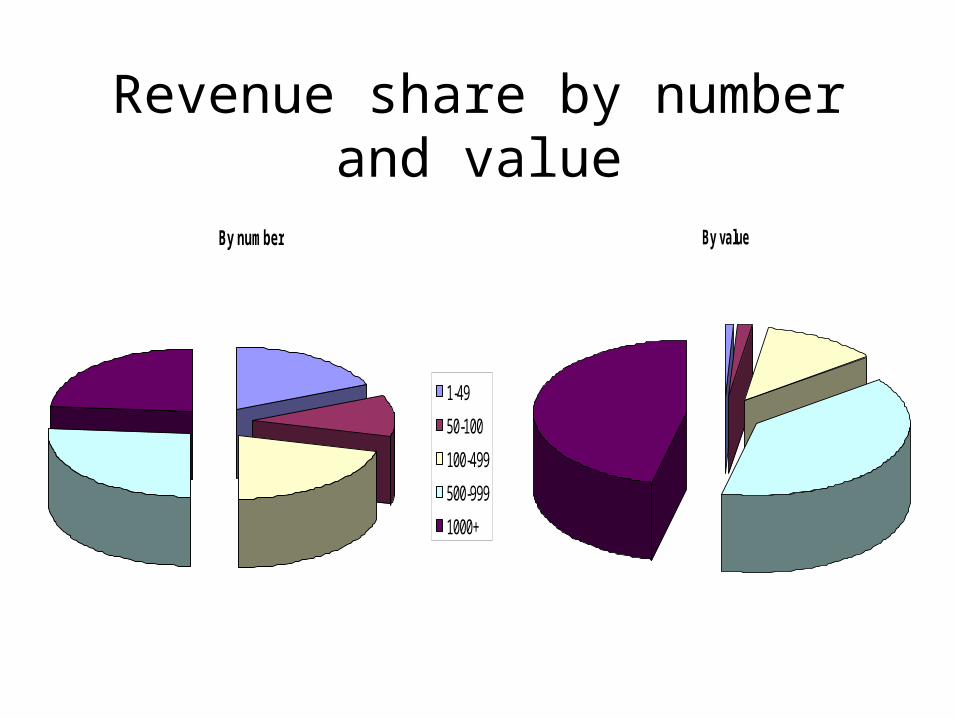
Revenue share by number and value
By valueBy number
1-49
50-100
100-499
500-999
1000+
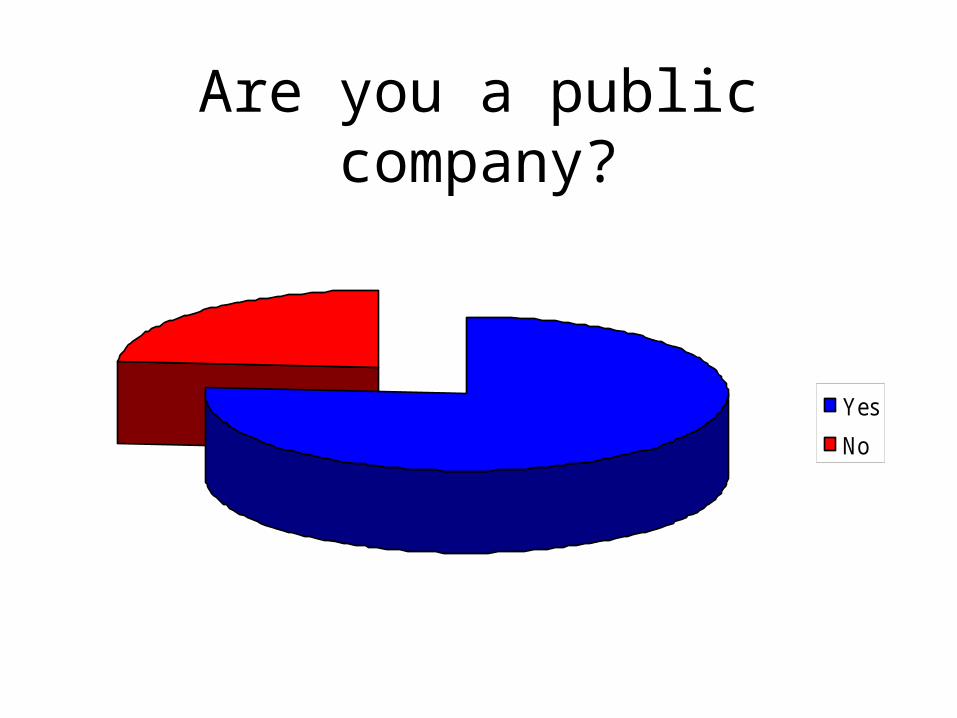
Are you a public company?
Yes
No
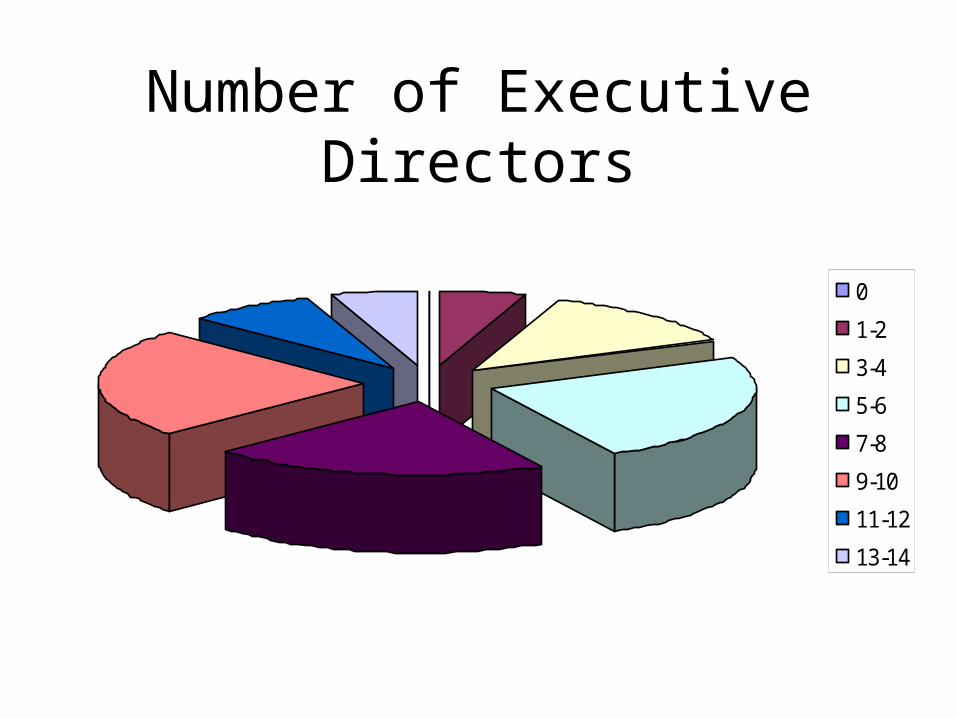
Number of Executive Directors
0
1-2
3-4
5-6
7-8
9-10
11-12
13-14
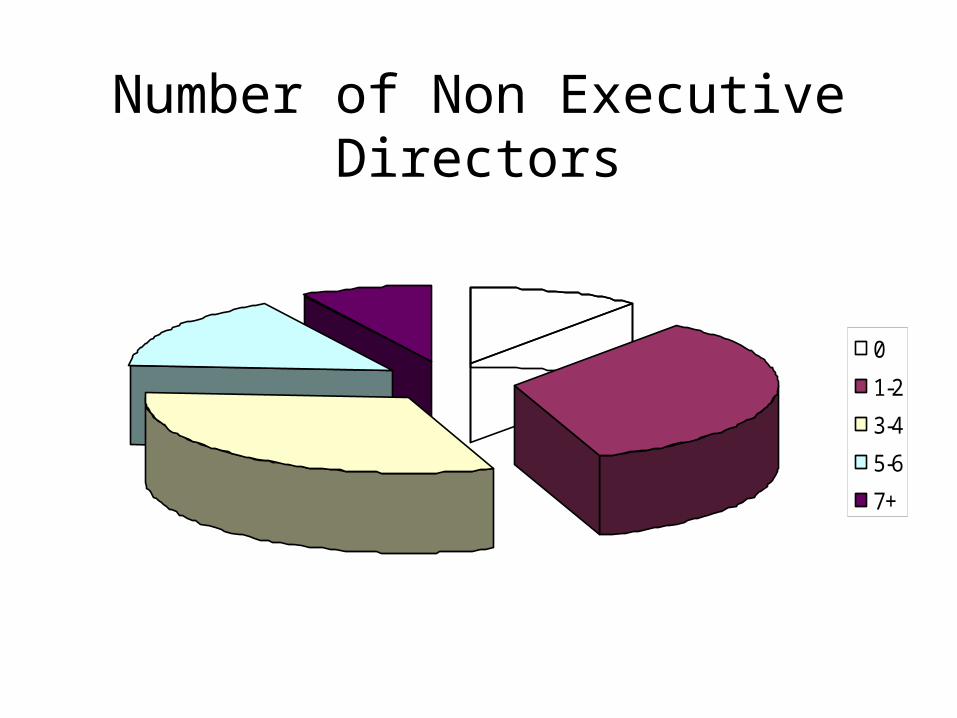
Number of Non Executive Directors
0
1-2
3-4
5-6
7+
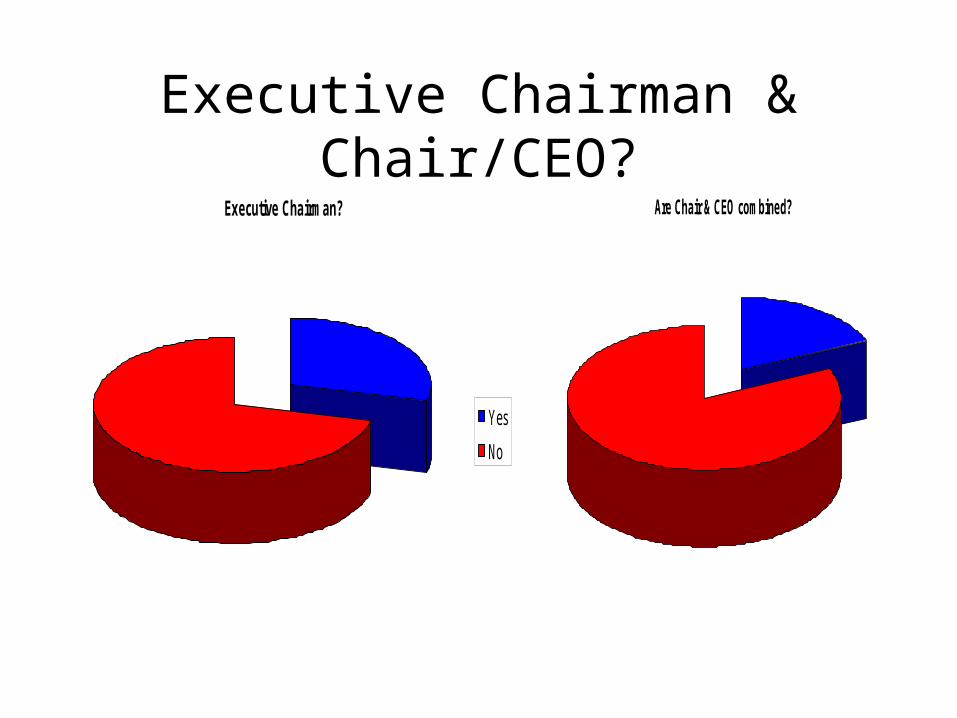
Executive Chairman & Chair/CEO?Executive Chairman?
Yes
No
Are Chair & CEO combined?
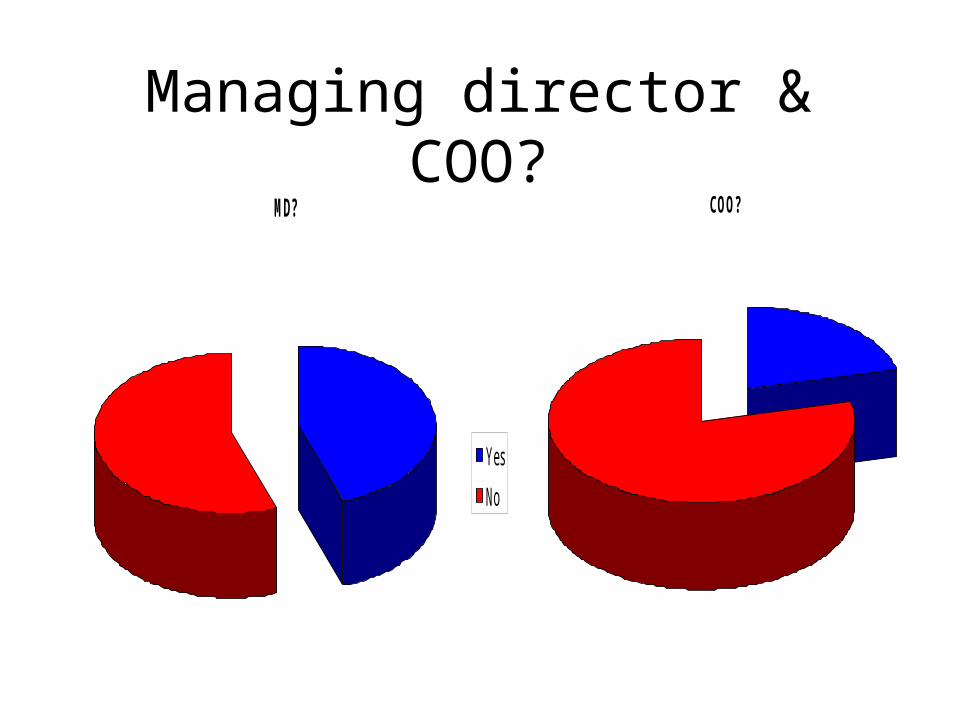
Managing director & COO?MD?
Yes
No
COO?
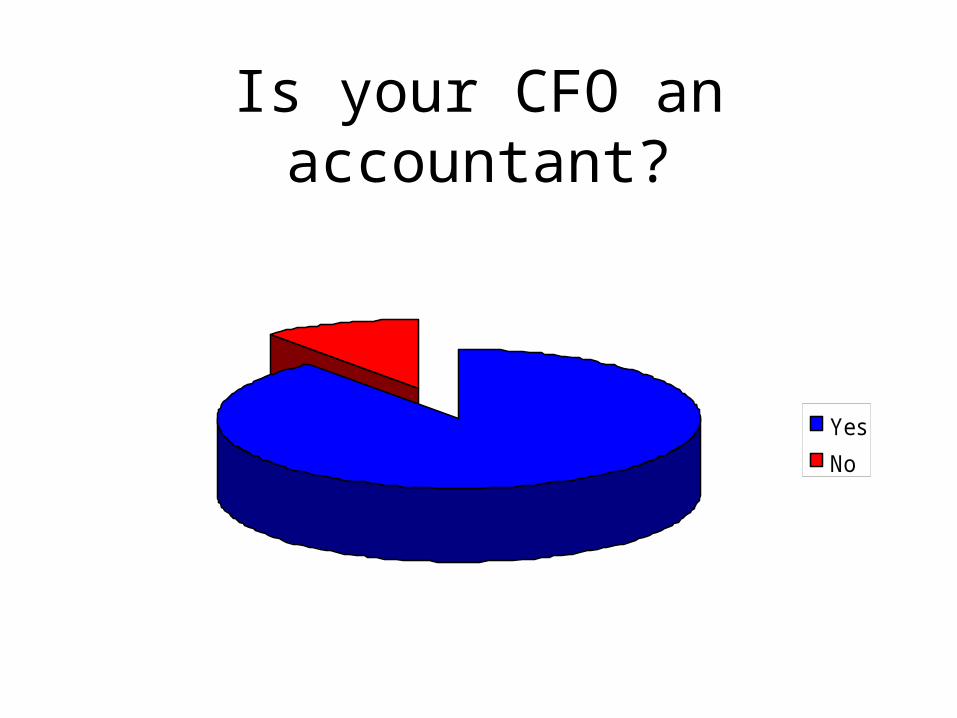
Is your CFO an accountant?
Yes
No
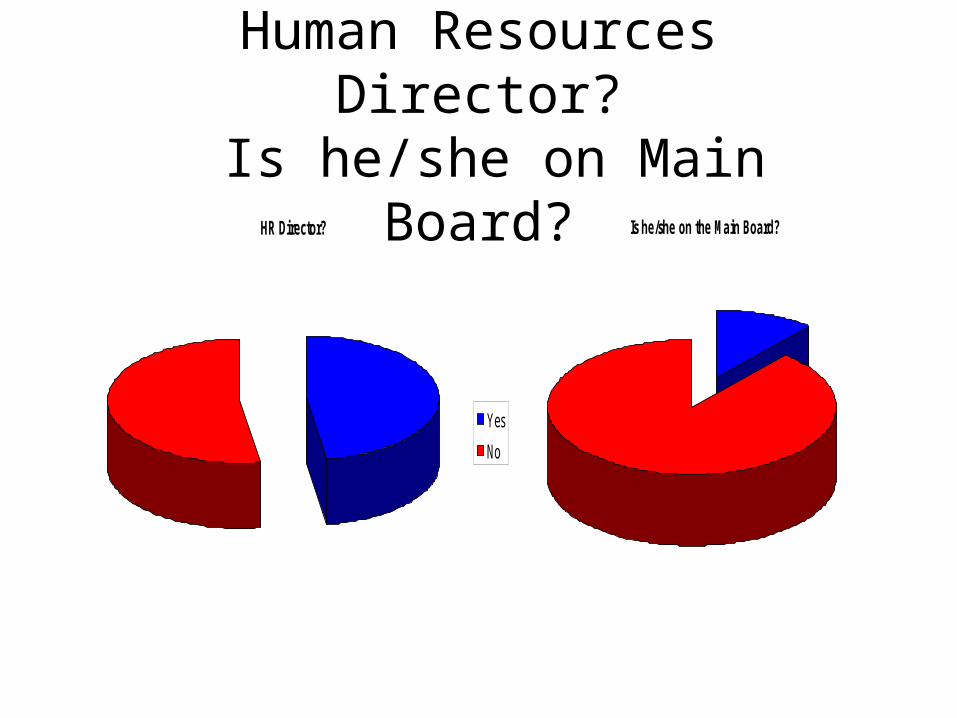
Human Resources Director? Is he/she on Main Board?
HR Director?
Yes
No
Is he/she on the Main Board?
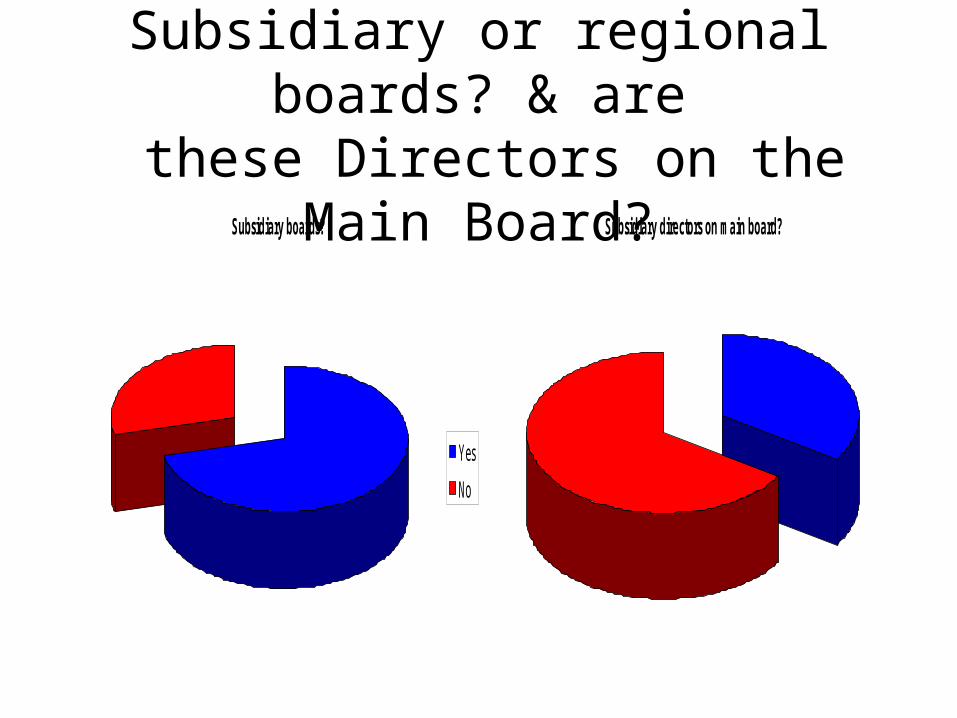
Subsidiary or regional boards? & are
these Directors on the Main Board?Subsidiary boards?
Yes
No
Subsidiary directors on main board?
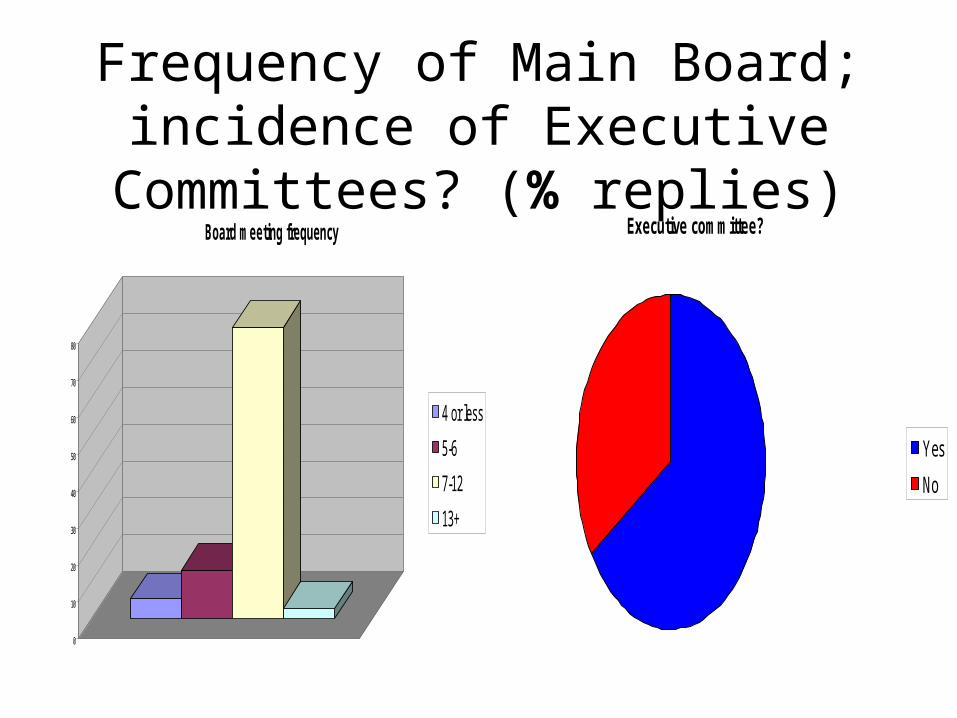
Frequency of Main Board; incidence of Executive
Committees? (% replies)Executive committee?
Yes
No
0
10
20
30
40
50
60
70
80
Board meeting frequency
4 or less
5-6
7-12
13+
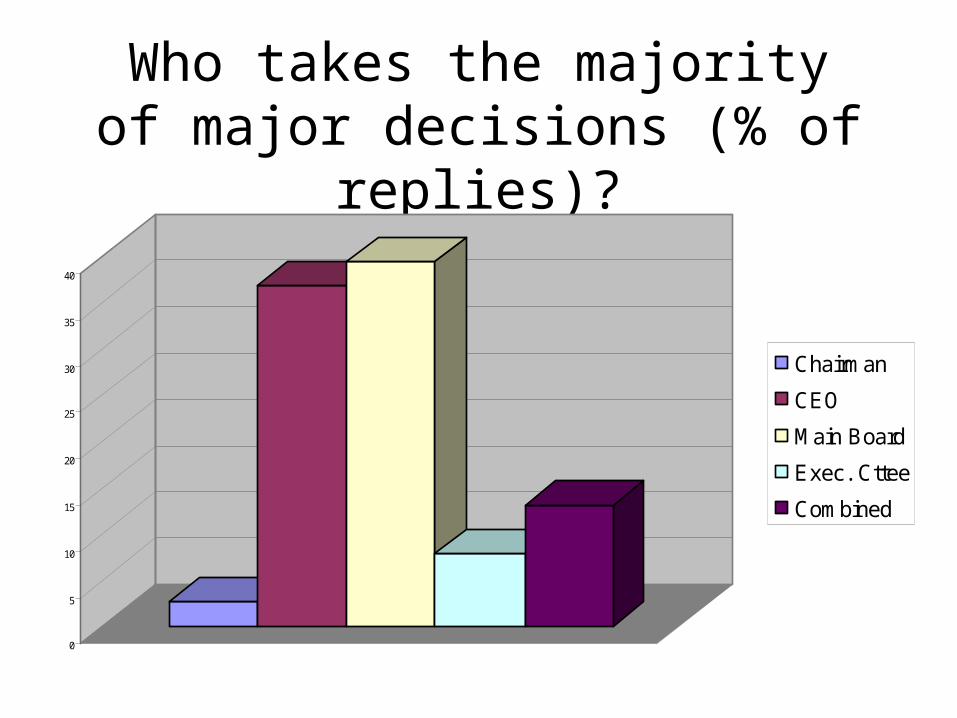
Who takes the majority of major decisions (% of replies)?
0
5
10
15
20
25
30
35
40
Chairman
CEO
Main Board
Exec. Cttee
Combined
“A poorly controlled area at large corporate level is strategic decision making that doesn’t hold firm for the medium term. This means subsidiary
managers never get to understand how they can be part of group-wide
goals......
“…The lack of political will ‘to stick to one’s knitting’, even if market
conditions change, means that a lot of second tier decision making is in
vain”
UK construction CEO, 2004
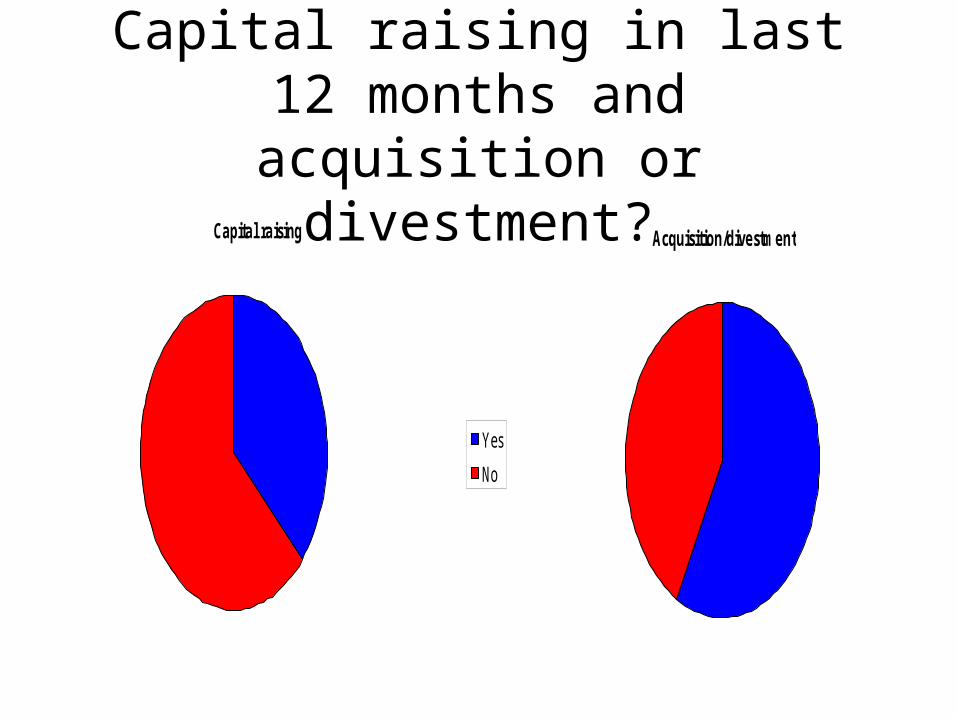
Capital raising in last 12 months and acquisition or
divestment?Capital raising
Yes
No
Acquisition/divestment
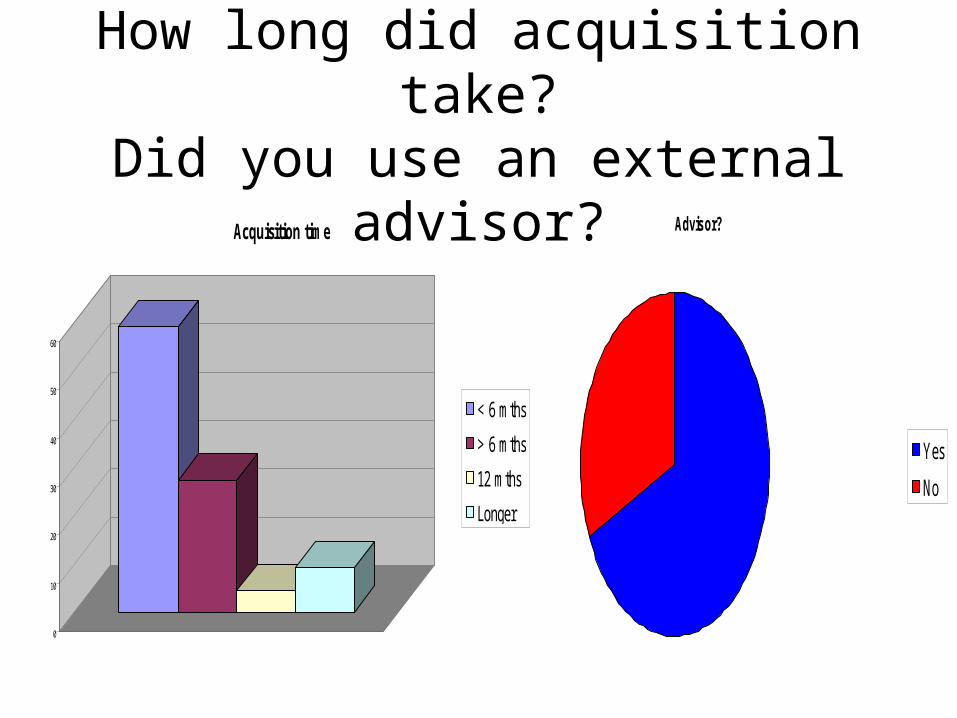
How long did acquisition take?
Did you use an external advisor? Advisor?
Yes
No
0
10
20
30
40
50
60
Acquisition time
< 6 mths
> 6 mths
12 mths
Longer
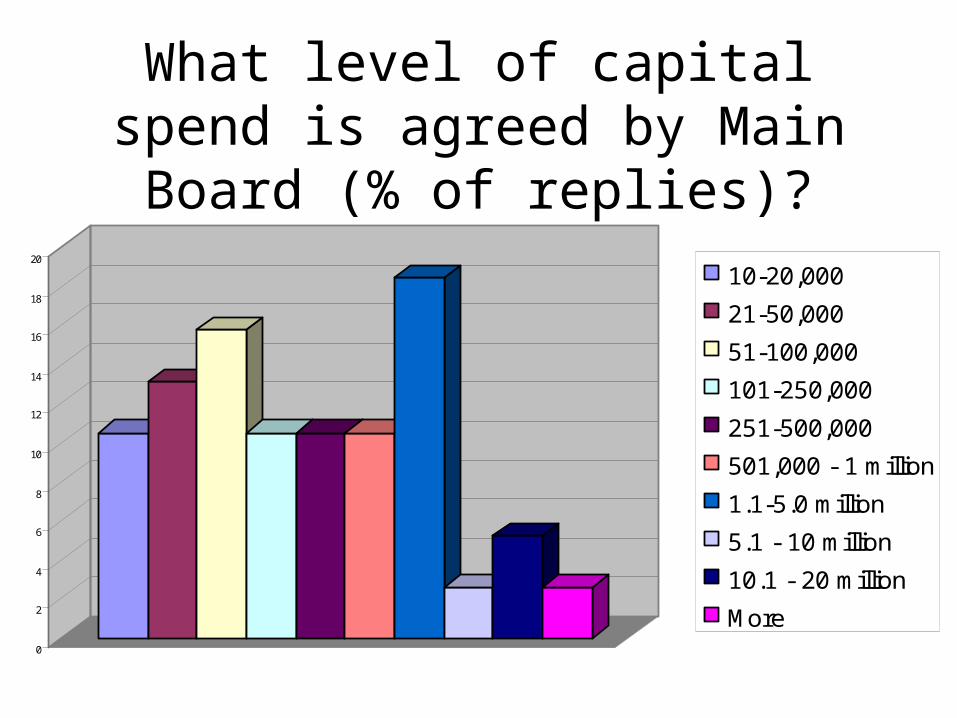
What level of capital spend is agreed by Main Board (% of replies)?
0
2
4
6
8
10
12
14
16
18
20
10-20,000
21-50,000
51-100,000
101-250,000
251-500,000
501,000 - 1 million
1.1-5.0 million
5.1 - 10 million
10.1 - 20 million
More
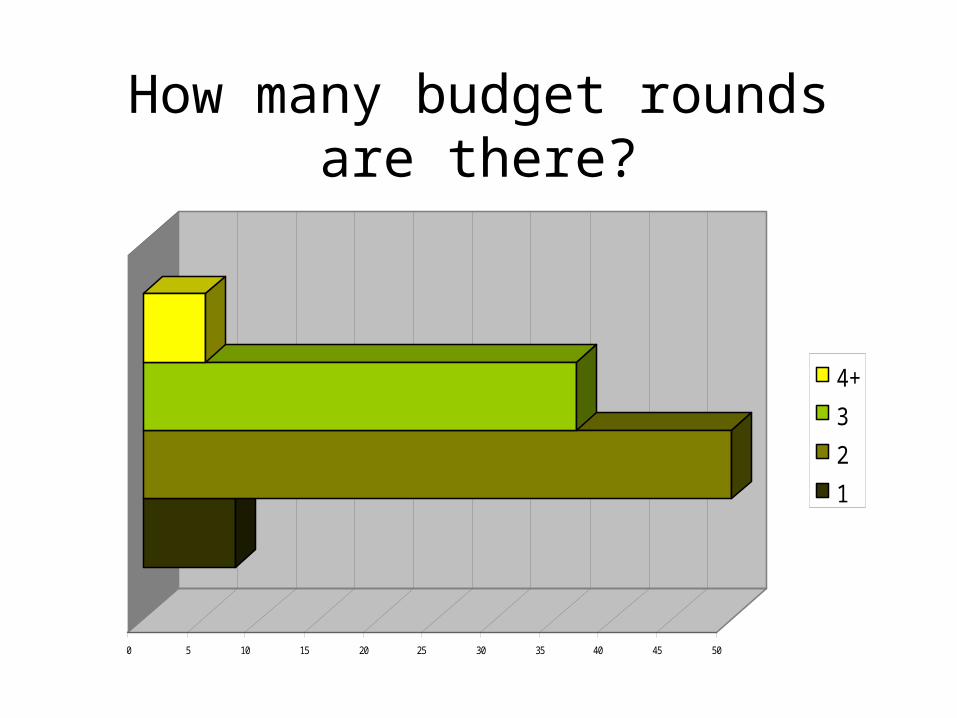
How many budget rounds are there?
0 5 10 15 20 25 30 35 40 45 50
4+
3
2
1
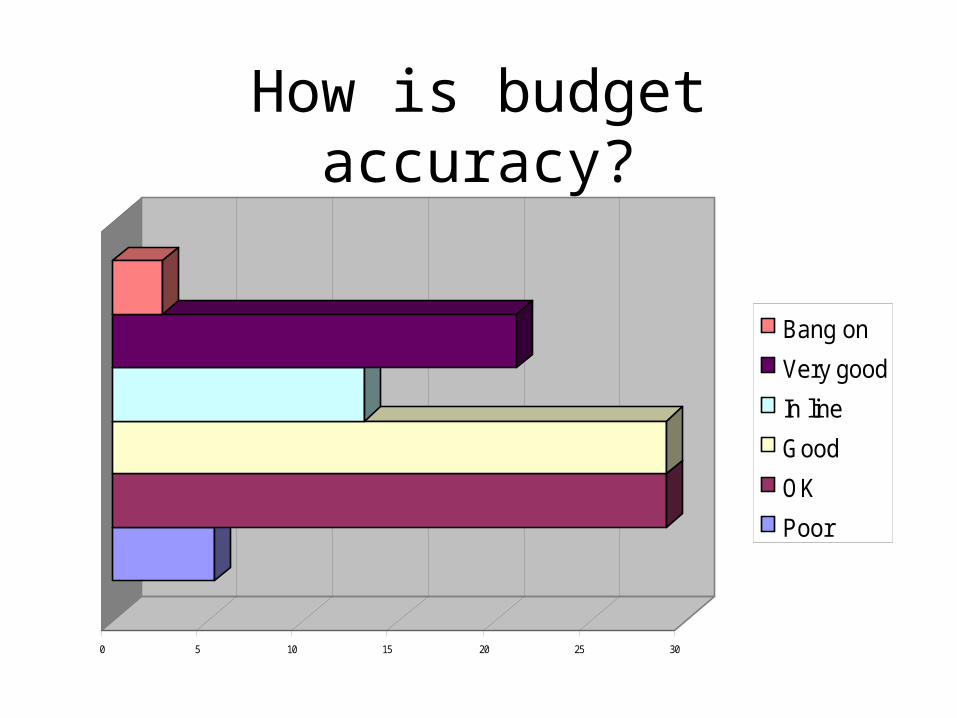
How is budget accuracy?
0 5 10 15 20 25 30
Bang on
Very good
In line
Good
OK
Poor
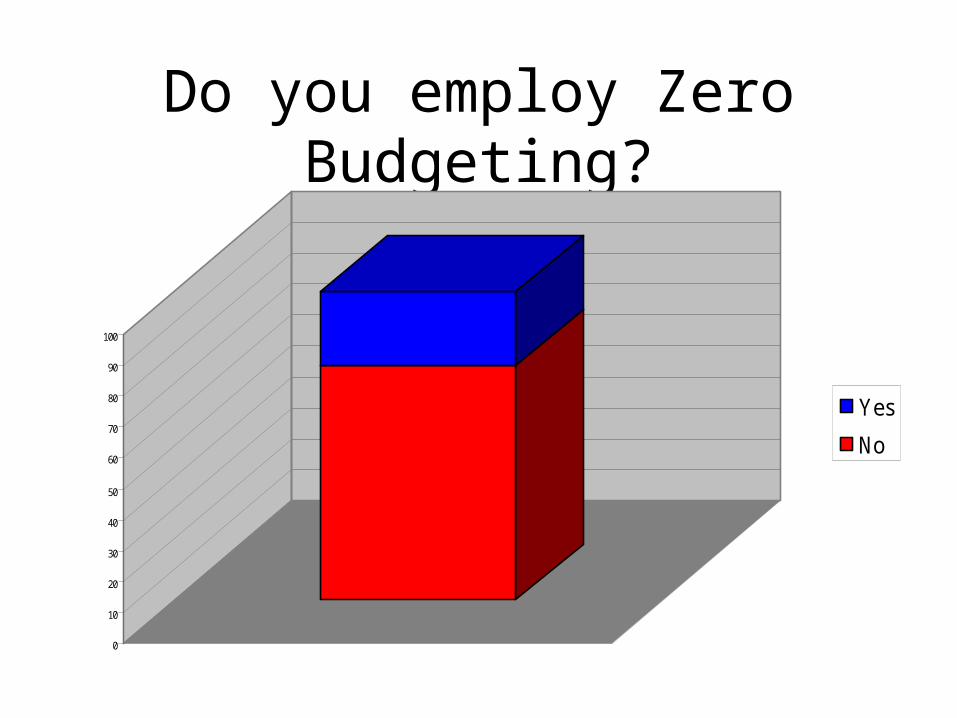
Do you employ Zero Budgeting?
0
10
20
30
40
50
60
70
80
90
100
Yes
No
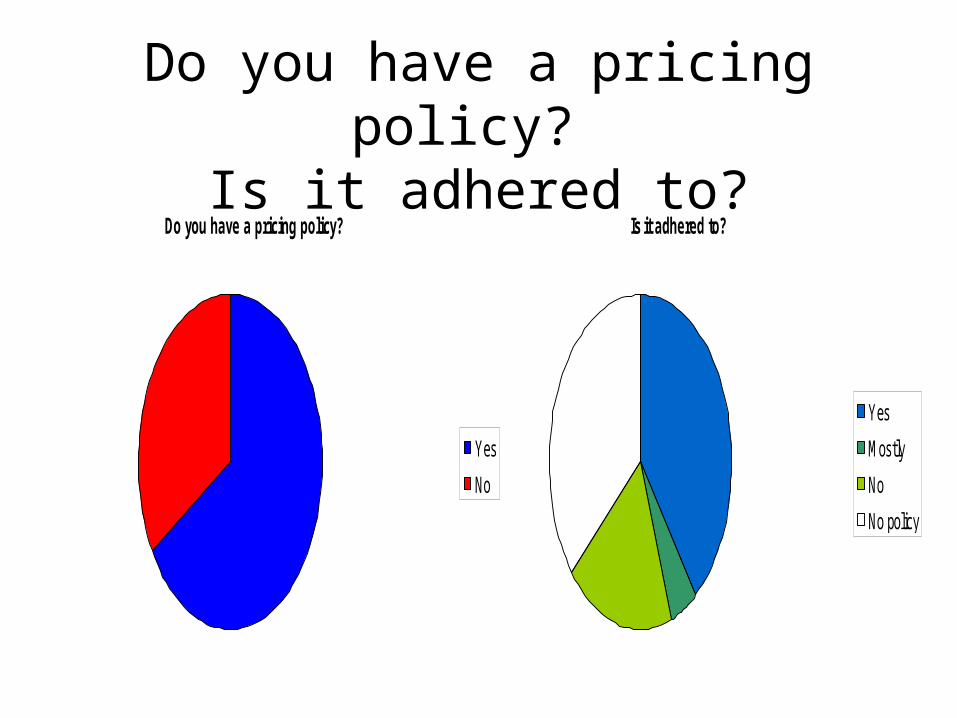
Do you have a pricing policy?
Is it adhered to?Is it adhered to?
Yes
Mostly
No
No policy
Do you have a pricing policy?
Yes
No
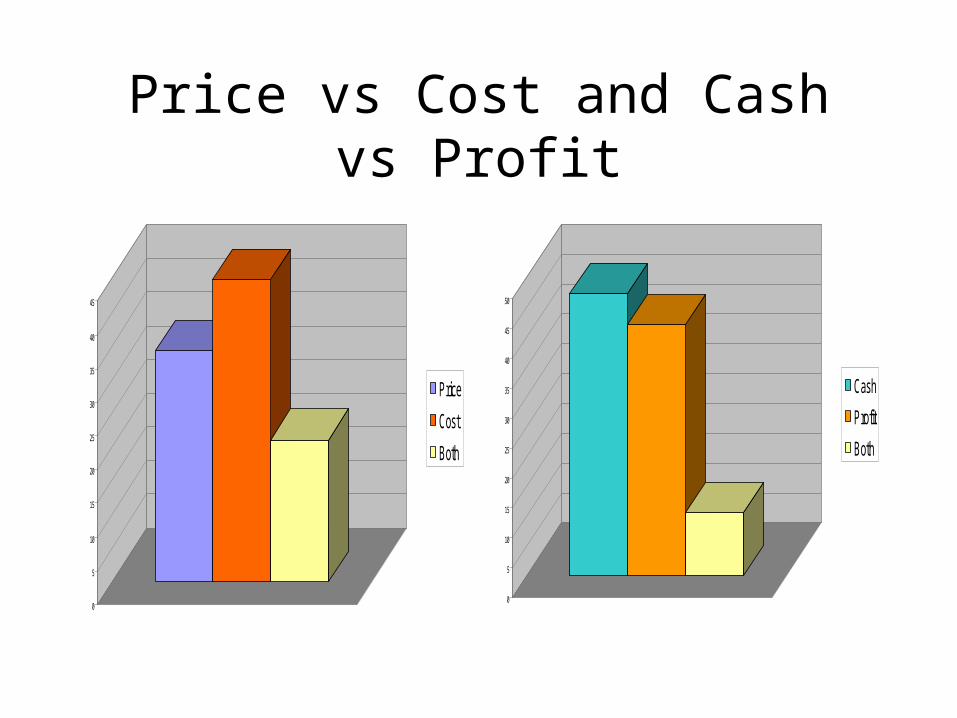
Price vs Cost and Cash vs Profit
0
5
10
15
20
25
30
35
40
45
50
Cash
Profit
Both
0
5
10
15
20
25
30
35
40
45
Price
Cost
Both
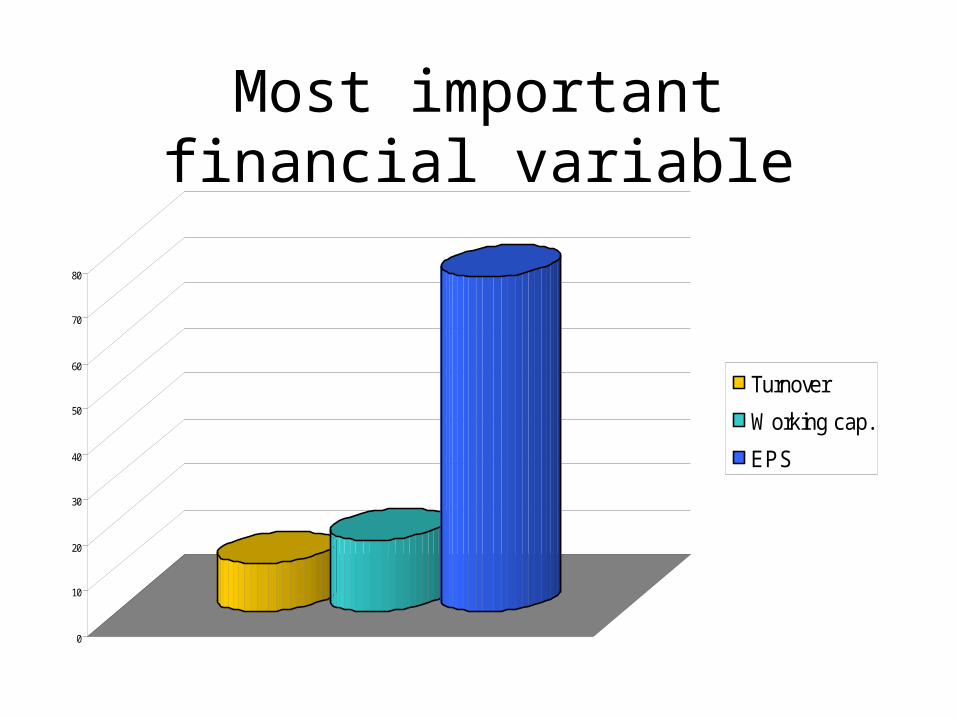
Most important financial variable
0
10
20
30
40
50
60
70
80
Turnover
Working cap.
EPS
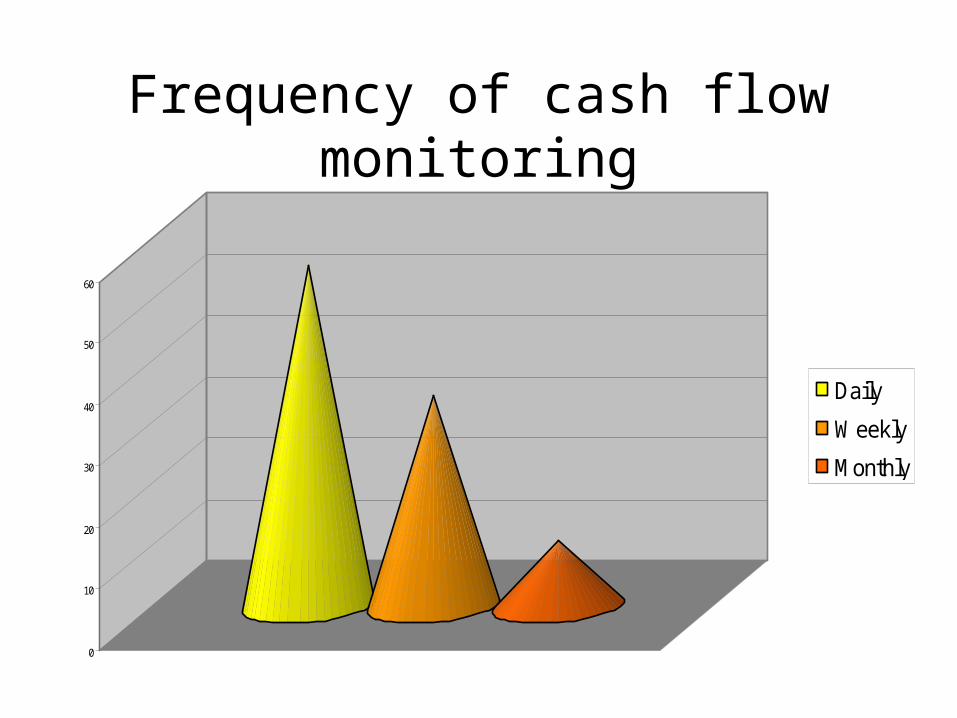
Frequency of cash flow monitoring
0
10
20
30
40
50
60
Daily
Weekly
Monthly
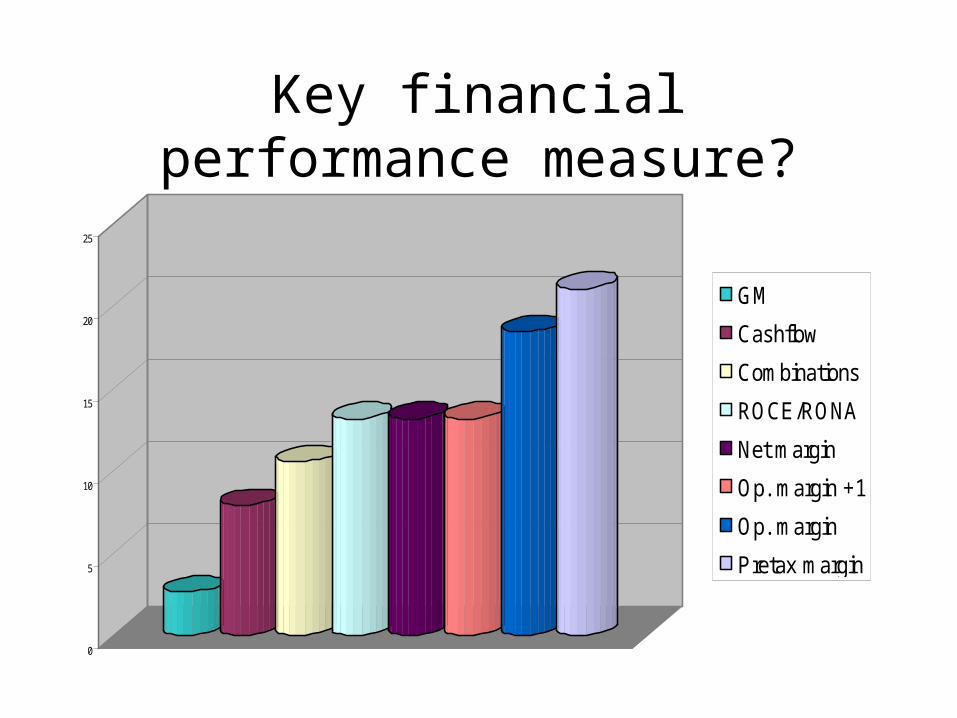
Key financial performance measure?
0
5
10
15
20
25
GM
Cashflow
Combinations
ROCE/RONA
Net margin
Op. margin +1
Op. margin
Pretax margin
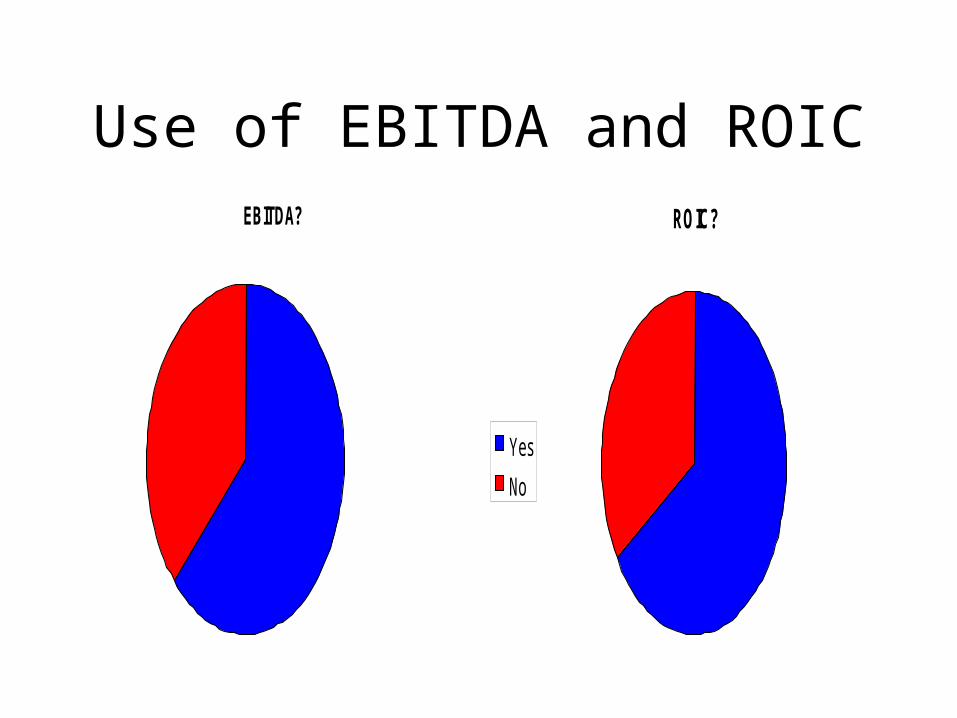
Use of EBITDA and ROICEBITDA?
Yes
No
ROIC?
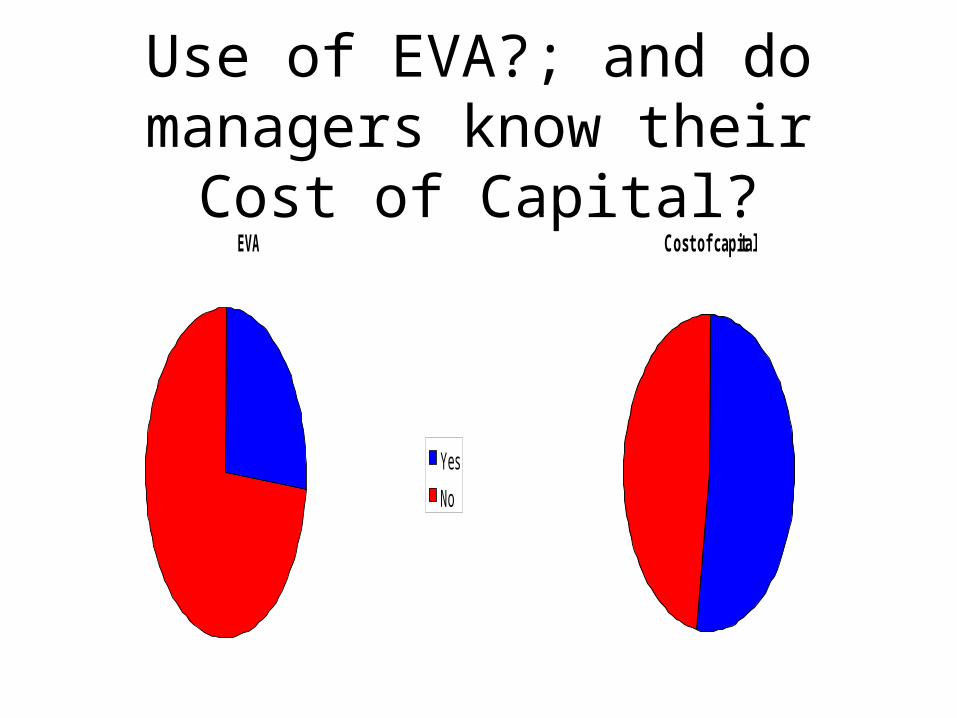
Use of EVA?; and do managers know their Cost of Capital?
EVA
Yes
No
Cost of capital
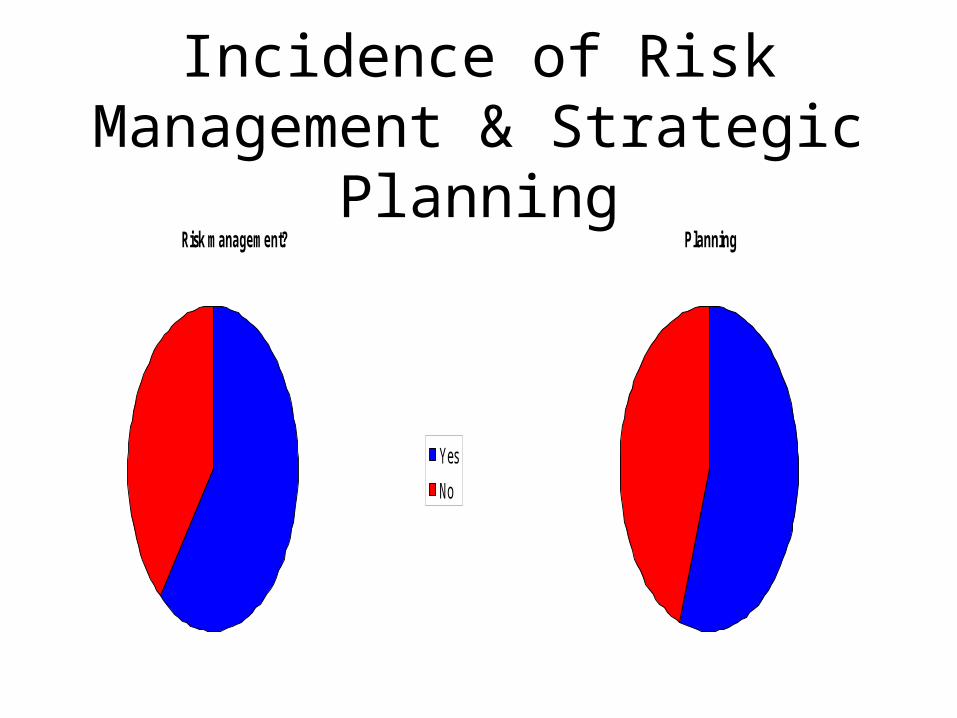
Incidence of Risk Management & Strategic Planning
Risk management?
Yes
No
Planning
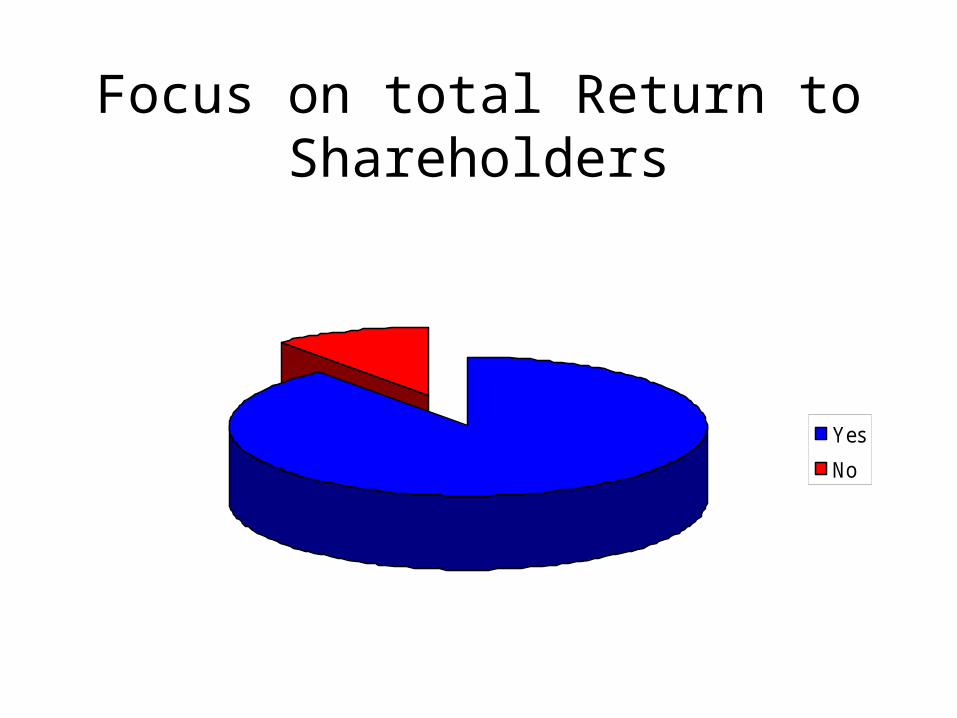
Focus on total Return to Shareholders
Yes
No
“What surprises me about construction is that decisions are
taken without a proper review of the facts, particularly the risks, which many refuse to quantify by arguing that such issues are subjective or
even emotive…
“…Not pricing for a known exposure at the bidding stage is very blinkered
indeed – to say the very least”
Development company CEO, 2004
“Risk is not related to size. You could just as easily lose £1 million on a £5 million job as one that is
worth £50 million”
Construction CEO, 2004
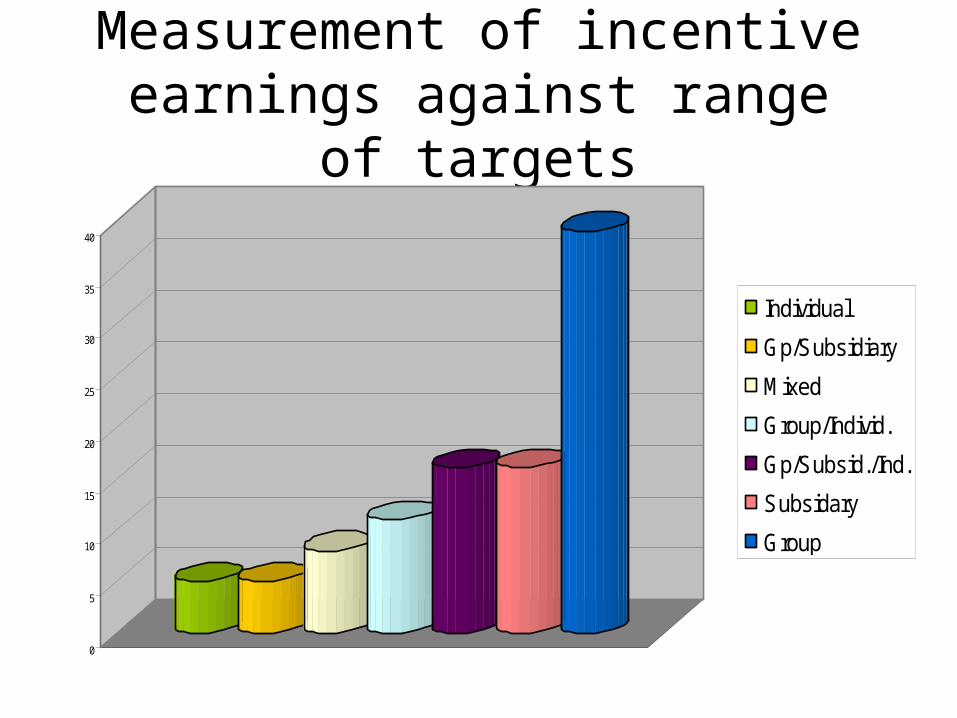
Measurement of incentive earnings against range of targets
0
5
10
15
20
25
30
35
40
Individual
Gp/Subsidiary
Mixed
Group/Individ.
Gp/Subsid./Ind.
Subsidary
Group
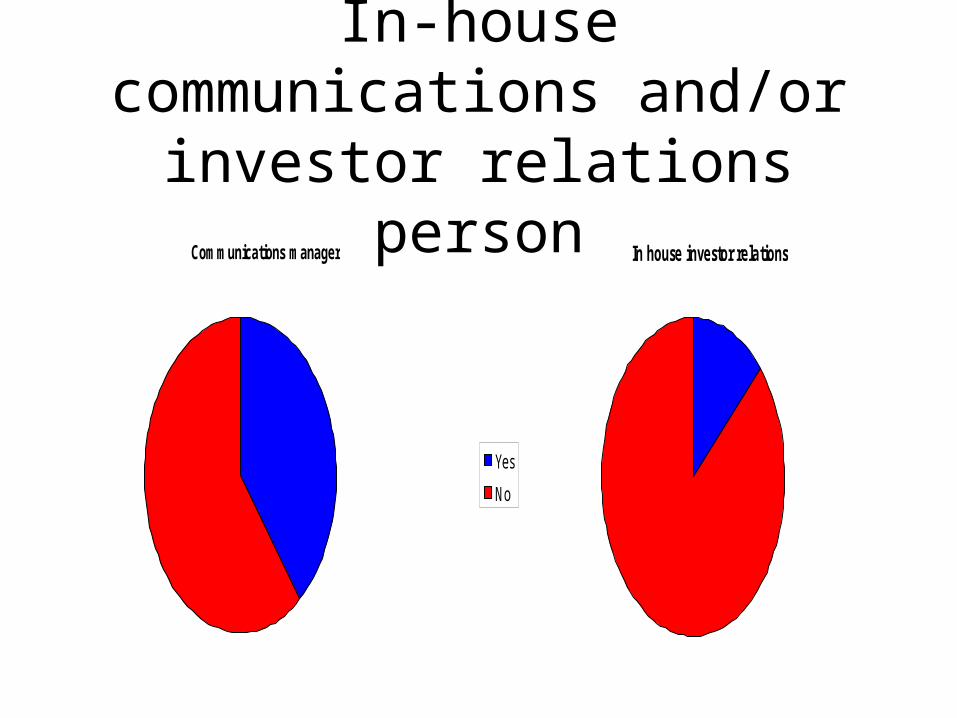
In-house communications and/or investor relations personCommunications manager
Yes
No
In house investor relations
“Construction is a long term business and trying to make
decisions to satisfy shareholders on a quarterly basis can be inconsistent
with the strategic plan.......
…and if decision making favours one group of stakeholders at the expense of others, for a prolonged period, the
business is virtually guaranteed to under perform”
Construction CEO, 2004
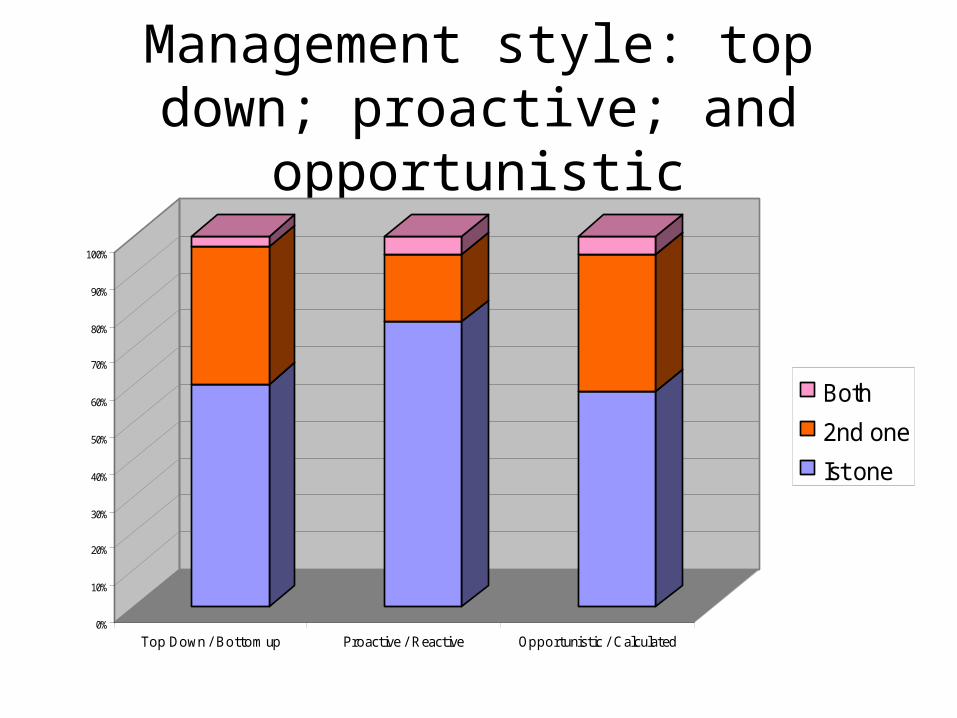
Management style: top down; proactive; and opportunistic
0%
10%
20%
30%
40%
50%
60%
70%
80%
90%
100%
Top Down / Bottom up Proactive / Reactive Opportunistic / Calculated
Both
2nd one
Ist one
Summary and conclusions
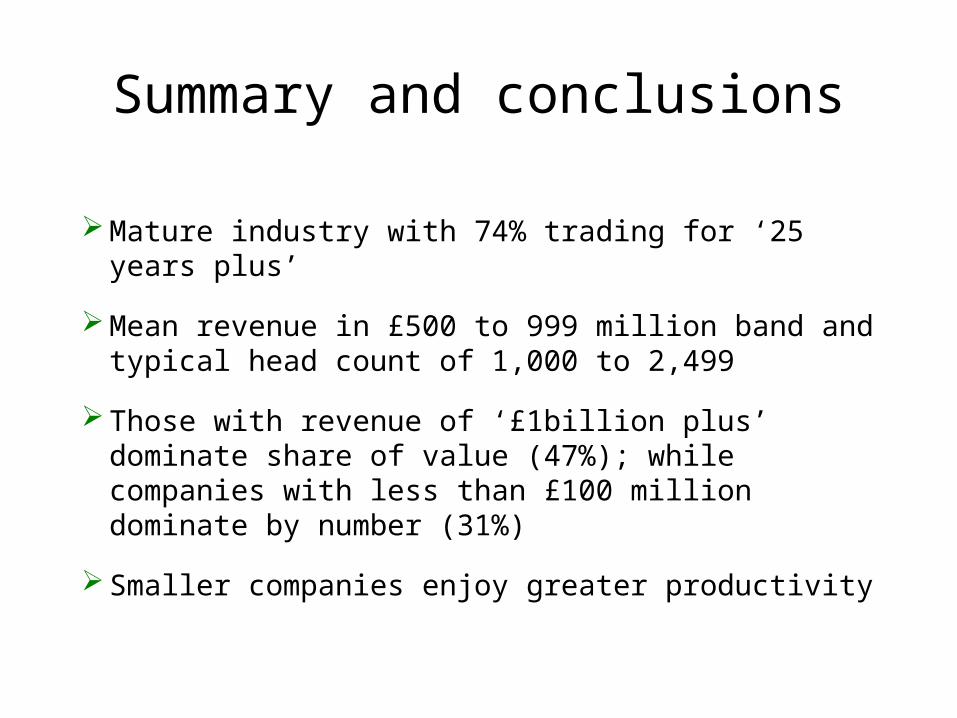
Mature industry with 74% trading for ‘25 years plus’
Mean revenue in £500 to 999 million band and typical head count of 1,000 to 2,499
Those with revenue of ‘£1billion plus’ dominate share of value (47%); while companies with less than £100 million dominate by number (31%)
Smaller companies enjoy greater productivity
Summary and conclusions
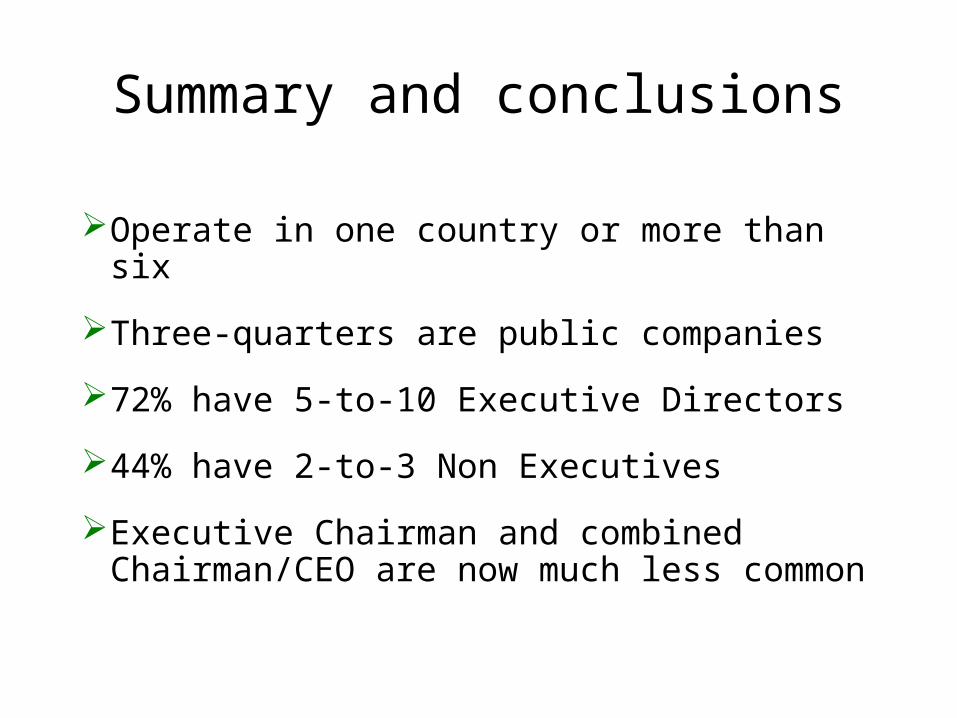
Operate in one country or more than six
Three-quarters are public companies
72% have 5-to-10 Executive Directors
44% have 2-to-3 Non Executives
Executive Chairman and combined Chairman/CEO are now much less common
Summary and conclusions
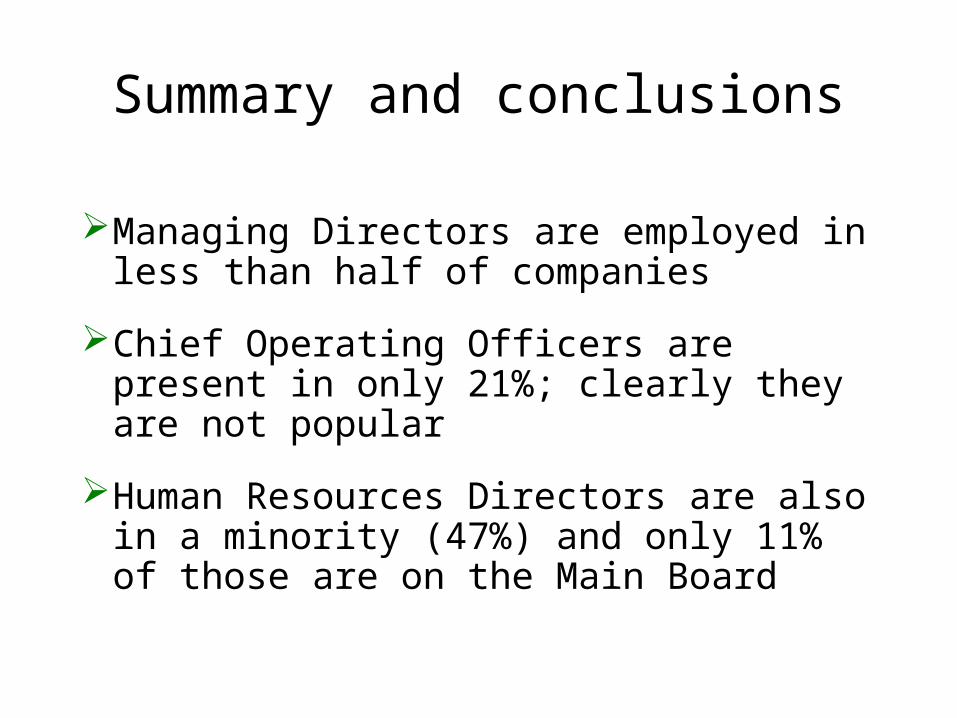
Managing Directors are employed in less than half of companies
Chief Operating Officers are present in only 21%; clearly they are not popular
Human Resources Directors are also in a minority (47%) and only 11% of those are on the Main Board
Summary & conclusions
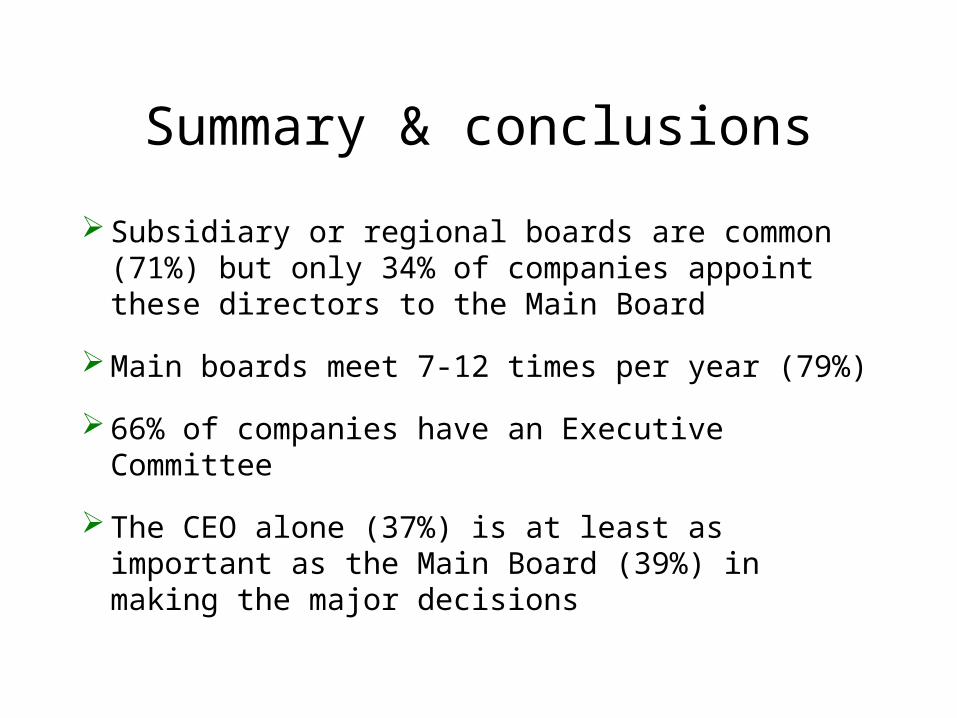
Subsidiary or regional boards are common (71%) but only 34% of companies appoint these directors to the Main Board
Main boards meet 7-12 times per year (79%)
66% of companies have an Executive Committee
The CEO alone (37%) is at least as important as the Main Board (39%) in making the major decisions
Summary & conclusions
In acquisitions or divestments, 68% of those active used an external advisor
No definite relationship between size of firm and spending limits to be agreed by main board
63% claimed that budget accuracy was ‘good’, ‘in line’ or ‘very good’; only 5% said it was poor
Two budget rounds – the most popular - produced an outturn ‘in line’ or better in 63% of cases
Summary & conclusions
Only one quarter of respondents employs Zero Budgeting; however it led to 78% hitting ‘good’ or better budget accuracy
66% employ a pricing policy but one third did not adhere to it
Cost and Cash are more important, than Price and Profit, respectively
Summary & conclusions
Earnings per share are the single most important financial variable (74%)
Only 55% monitor cash daily
Operating & pretax profit margins are most favoured financial performance measures
Summary & conclusions
ROIC is used by a majority (66%)…
… but less (53%) say that regional managers know or understand their Cost of Capital
EVA is cited by only 26% of respondents
Summary & conclusions
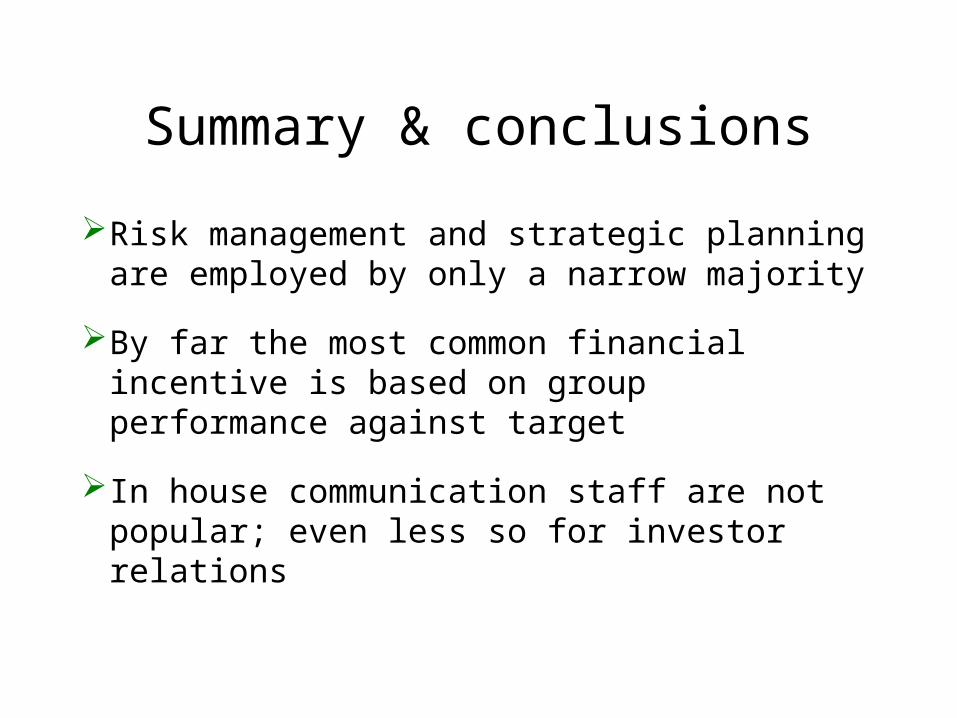
Risk management and strategic planning are employed by only a narrow majority
By far the most common financial incentive is based on group performance against target
In house communication staff are not popular; even less so for investor relations
Summary & conclusions
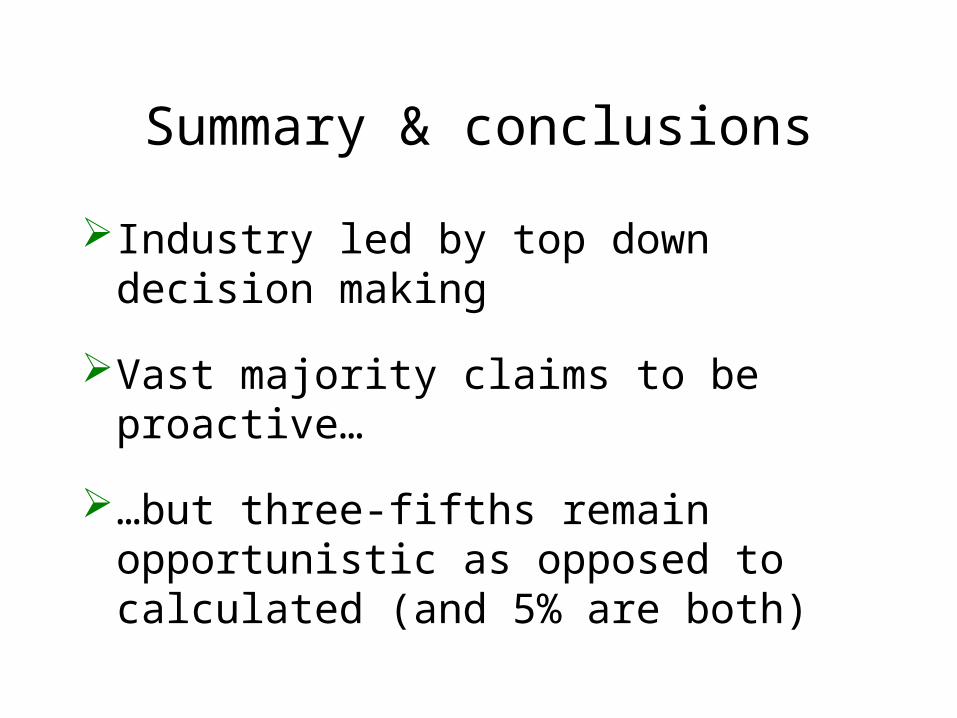
Industry led by top down decision making
Vast majority claims to be proactive…
…but three-fifths remain opportunistic as opposed to calculated (and 5% are both)
Final word
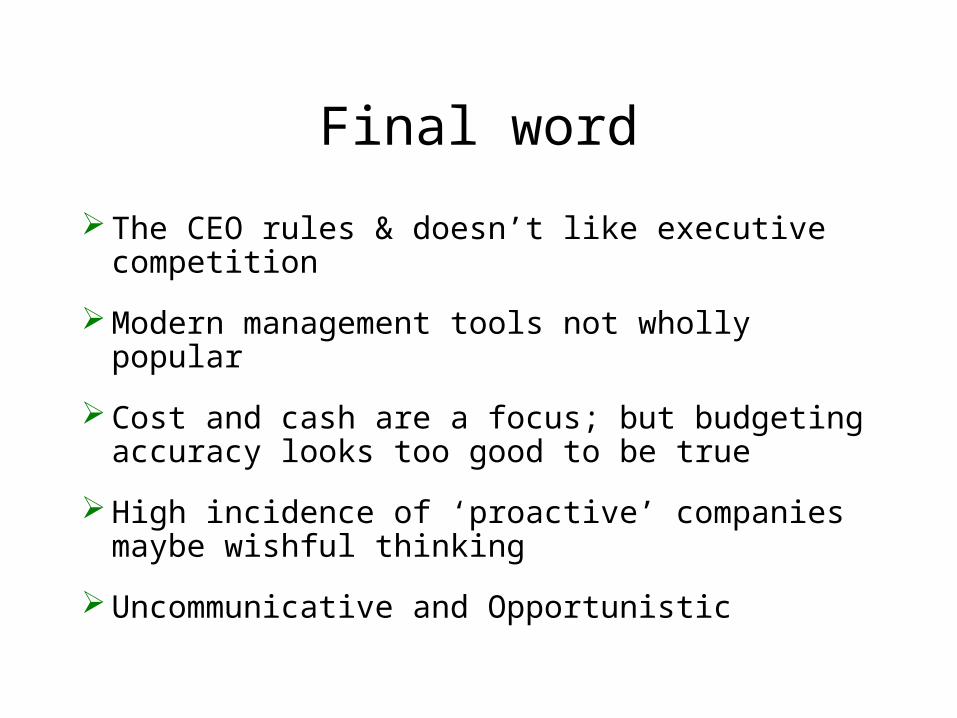
The CEO rules & doesn’t like executive competition
Modern management tools not wholly popular
Cost and cash are a focus; but budgeting accuracy looks too good to be true
High incidence of ‘proactive’ companies maybe wishful thinking
Uncommunicative and Opportunistic
“Prevarication is the bane of British management: a bad decision is
better than no decision”
Building materials CEO, 2004
Related Documents