Why Isn’t More U.S. Farmland Organic? Nicolai V. Kuminoff and Ada Wossink 1 Abstract We develop a theoretical model to assess the dollar compensation required to induce conventional growers to convert to organic. The model incorporates the uncertainty in producers’ expectations about future returns and about the impact of policy changes on these expectations in particular. We demonstrate that a new policy which favours organic can have opposing effects on the rate of conversion. An increase in relative returns to organic today will increase conversion rates. However, if the future of the policy program is uncertain, its introduction can increase the value of waiting to switch, which will decrease conversion rates. We then develop an empirical switching regression model that enables direct estimation of the value associated with being able to postpone the conversion decision until some of the uncertainty is resolved. The model is applied to data on organic and conventional soybeans before and after major changes in U.S. farm policy toward organic growers. The results suggest that sunk costs associated with conversion to organic coupled with uncertainty about future returns can help to explain why there is so little organic farmland in the United States. Keywords: organic farming, direct payments, real options theory, switching regression. JEL classification: D81, Q18. 1 Senior authorship is shared. Nicolai V. Kuminoff is an Assistant Professor in the Economics Department at Arizona State University, Main Campus, PO Box 873806, Tempe, AZ 85287-3806, U.S.A. E-mail: [email protected] . Ada Wossink is a Professor in the Economics Department at the University of Manchester, Manchester M13 9PL, United Kingdom. E-mail: [email protected] . We thank Peyton Ferrier, Cathy Greene, David Harvey, Anni Huhtala, Guido van Huylenbroeck, Philip Kostov, Michelle Marra, Jack Peerlings, Marty Smith, Scott Swinton, two anonymous reviewers, and seminar participants at Wageningen University (Netherlands) and Birmingham University (U.K.) for helpful comments on this research. Support from the U.S. Department of Agriculture IFAFS Grant, the Organic Farming Research Foundation, and Virginia Agricultural Experiment Station is gratefully acknowledged.

Welcome message from author
This document is posted to help you gain knowledge. Please leave a comment to let me know what you think about it! Share it to your friends and learn new things together.
Transcript

Why Isn’t More U.S. Farmland Organic?
Nicolai V. Kuminoff and Ada Wossink1
Abstract
We develop a theoretical model to assess the dollar compensation required to induce
conventional growers to convert to organic. The model incorporates the uncertainty in
producers’ expectations about future returns and about the impact of policy changes on
these expectations in particular. We demonstrate that a new policy which favours organic
can have opposing effects on the rate of conversion. An increase in relative returns to
organic today will increase conversion rates. However, if the future of the policy
program is uncertain, its introduction can increase the value of waiting to switch, which
will decrease conversion rates. We then develop an empirical switching regression
model that enables direct estimation of the value associated with being able to postpone
the conversion decision until some of the uncertainty is resolved. The model is applied to
data on organic and conventional soybeans before and after major changes in U.S. farm
policy toward organic growers. The results suggest that sunk costs associated with
conversion to organic coupled with uncertainty about future returns can help to explain
why there is so little organic farmland in the United States.
Keywords: organic farming, direct payments, real options theory, switching regression.
JEL classification: D81, Q18.
1 Senior authorship is shared. Nicolai V. Kuminoff is an Assistant Professor in the Economics
Department at Arizona State University, Main Campus, PO Box 873806, Tempe, AZ 85287-3806, U.S.A. E-mail: [email protected]. Ada Wossink is a Professor in the Economics Department at the University of Manchester, Manchester M13 9PL, United Kingdom. E-mail: [email protected]. We thank Peyton Ferrier, Cathy Greene, David Harvey, Anni Huhtala, Guido van Huylenbroeck, Philip Kostov, Michelle Marra, Jack Peerlings, Marty Smith, Scott Swinton, two anonymous reviewers, and seminar participants at Wageningen University (Netherlands) and Birmingham University (U.K.) for helpful comments on this research. Support from the U.S. Department of Agriculture IFAFS Grant, the Organic Farming Research Foundation, and Virginia Agricultural Experiment Station is gratefully acknowledged.

1. Introduction
Organic farming is one of the fastest growing segments of U.S. agriculture. The high prices
commanded by organic products and often unmet demand have enticed growers to enter the
market. Certified organic farmland doubled between 1995 and 2000, and then doubled
again between 2000 and 2005. In total, there were 4 million acres of cropland and pasture
dedicated to organic production in 2005 (USDA, Economic Research Service). Yet despite
this fast-paced growth, organic agriculture is limited to a very small fraction of U.S.
farmland—approximately one half of one percent.
There are social benefits to increasing organic production. Price premiums for
organic products can increase farm profitability. Likewise, consumers can benefit from
greater choice at the supermarket and from lower prices due to increased competition among
suppliers (Dhar and Foltz, 2006). Converting a conventional farm to organic can also
increase its provision of ecosystem services. For example, in a review of the literature on
the biological differences between conventional and organic systems, Hole et al. (2005)
conclude that organic farms have greater species abundance and biodiversity than
conventional farms. These potential benefits provide some rationale for the increasing
government support of organic agriculture.
Over the past decade, U.S. agricultural policy has evolved in ways that have favoured
organic farmers. This process began with the 2000 Agricultural Risk Protection Act which first
made organic farms eligible for federal crop insurance. Shortly thereafter, the 2002 farm bill
introduced a subsidy program for those converting to organic and a new system of payments
for conservation practices. The 2008 farm bill continues these programs (with some
2
modification) while simultaneously expanding organic farmers’ eligibility to receive cost-share
payments. Perhaps most importantly, the 2008 farm bill adds a new title for organic
agriculture, signaling that organic farms will continue to benefit from future farm programs.
With all of these developments, why is there still so little organic farmland?
There is virtually no theoretical or empirical evidence on the dollar compensation
needed to induce farmers to adopt organic practices, despite the body of literature on organic
farming and the adoption of environmentally friendlier practices in general. Most of the
relevant literature has focused on the use of discrete choice methods to analyze farmers’
choice between conventional and organic technologies (Burton, Rigby, and Young, 1999;
Lohr and Salomonsson, 2000; Pietola and Oude Lansink, 2001). These methods identify
the factors which prompt farmers to adopt the alternative farming practices, assess
their relative importance in that decision, and yield probabilities of adoption. The
resulting estimates cannot be readily converted into dollar compensation levels.
A related body of previous research examines organic crop returns using data from
long-term experimental trials (for an overview see McBride and Greene, 2008) or
investigates the impact of organic conversion on financial performance through simulation
(e.g., Archer and Kludze, 2006; Acs et al., 2009)). Importantly, these studies leave out the
actual farm setting and they assume decisions are based on the expected net present value of
returns to alternative land uses. While the net present value rule is simple and direct, it fails
to address the role of sunk costs and uncertainty in the farmer’s decision process. These
factors can be the main determinants of actual land conversion decisions (Tegene et al.,
1999; Schatzki 2003; Musshoff and Hirschhauer, 2008). With federal conservation

3
programs that rely on land use conversion to achieve environmental policy goals we would
argue that improved understanding of strategic land use decision making has become
increasingly important.
This article investigates how uncertainty and sunk costs affect the farmer’s decisions
about if and when to convert to organic and how this is affected by policy in particular. The
basic intuition underlying our model is straightforward. There may be a value associated
with the option to postpone the conversion decision until some of the uncertainty about the
stream of future returns is resolved (Dixit and Pindyck, 1994). The value of this option to
switch at a later date raises the dollar compensation needed to induce the farmer to convert
to organic today, as first highlighted by Odening et al. (1994).
Our analysis provides three new insights into the impacts of farm policy on organic
agriculture that have not been addressed in the literature. Our theoretical model illustrates
how the uncertainty of the three-year transition period required to obtain organic
certification provides an incentive for potential organic farmers to postpone conversion. We
demonstrate that a new policy which favours organic can have opposing effects on this
conversion decision. An increase in relative returns to organic today will decrease the value
of waiting to switch and increase conversion rates. However, if the future of the policy is
uncertain, its introduction can increase the value of waiting to convert, which will decrease
conversion rates. Secondly, if there is heterogeneity in the value of the option to switch, one
can separately identify the time-constant and time-variant components using a switching
regime estimator. Our estimator builds on Wossink and Gardebroek (2006) who apply a
switching regime to quantify the impact of policy uncertainty on the decision to invest in
4
tradable quota. Third, by applying this estimator to data on conventional and organic
soybeans before and after shocks to farm policy that favoured organic growers, we provide
the first empirical evidence for the U.S. that values for the option to switch to organic
farming exist and that these values are economically significant.
We proceed as follows. Section 2 begins by developing a formal model of the
decision to convert to organic in the presence of policy uncertainty. Section 3 proposes the
switching regime estimator that permits identification of the latent sunk cost of transition as
well as time-constant and time-variant components of the value of the option to convert.
Section 4 applies the estimator to data on conventional and organic soybeans before and
after the Agricultural Risk Protection Act and introduction of the Conservation Security
Program. Our empirical results help to explain why organic acres changed little following
the introduction of these programs. After interpreting the results, we offer concluding
comments and identify next steps in this line of research.
2. Theoretical Model
Our theoretical model begins from the observation that non-organic farmers typically
perceive organic farming as being more risky than conventional farming. There are many
reasons why this is true. First, the inability to intervene with chemical fertilizers and
pesticides can increase the costs of pest management and increase the risks of crop loss.
Second, organic farming systems often have greater agronomic complexity than
conventional systems, and there is less information on how to manage organic farming
systems efficiently (Padel and Lampkin, 1994). Third, organic farmers are exposed to
higher market risks. Organic crop prices tend to be more volatile than conventional prices,

5
partly due to the comparatively small scale of organic markets (Klonsky and Smith, 2002).
Finally, government support of organic agriculture in the United States has been more
volatile in the past than support for conventional agriculture. Prior to the 2008 farm bill, it
would have been natural to expect organic growers to be less certain of their inclusion in
future support programs. Even if a conventional farmer is willing to take on these various
sources of production and market risk, they must still undergo a rigorous process of
converting their farm from conventional to organic before they can be legally certified as an
organic grower.
Survey research has demonstrated that farmers perceive the conversion process as a
major obstacle to making the transition from conventional to organic (Padel, 2001). A farm
in transition must keep detailed records for three years before they can receive organic
certification. The physical transition cost may be incurred for several years more through
penalties in yield or cost incurred due to agro-ecosystem adjustments and management
inefficiency as new practices are learnt. During the conversion process, a grower also faces
important financial constraints including a lack of access to premium prices until conversion
is complete, conversion-related investments and disinvestments, and information gathering
costs for production and marketing (Lohr, 2001). Gardebroek (2006) identifies additional
non-pecuniary psychological and sociological costs of switching to organic farming.
In the presence of these sunk costs and uncertainty about future development of
earnings, a risk neutral farmer will not be indifferent between organic and conventional if
their current expected returns are identical. To begin to investigate the role of sunk costs
and uncertainty in the farmer’s decision making process, we develop a model of conversion

6
decisions using real options theory (Merton, 1976; McDonald and Siegel, 1986; Dixit and
Pindyck, 1994).
2.1. A Real Options Approach to Modeling Conversion to Organic An important pre-condition for widespread adoption of organic farming, or any new
technology, is its profitability. A truism in the organic community is that the more recent
converters are motivated by profitability, not ideology (Lohr, 2000; Padel, 2001).
Therefore, our theoretical model begins with the assumption of profit maximization.
In the current period, 0=t , a representative risk-neutral farmer values the expected
lifetime returns from conventional farming as 0C . In the meantime he scans the expected
returns from organic farming. Let 0O denote the present value of the expected lifetime
earnings of organic farming. To obtain 0O the farmer must incur fixed costs that become
sunk upon transition. These sunk costs include the record keeping, physical transition,
management, financial and information costs discussed above. Let tR denote the
differential between the discounted stream of expected cash flows for a farmer who gives up
conventional farming for organic farming at time t, and let T denote the fixed transition
costs. Under a conventional net present value (NPV) calculation, the farmer will make the
switch from conventional to organic if and only if 0≥−TRt .
While the NPV approach is simple and direct, it fails to capture the role of uncertainty
in the decision making process. In contrast, the real options approach focuses on the
opportunity of making decisions after some uncertainties have been resolved. One would
expect the value of Rt to become increasingly uncertain the further t lies in the future

7
because of production and market uncertainty. One way to depict this uncertainty is to
model R as following a geometric Brownian motion with drift:
RdzRdtdR σµ += . (1)
In the equation, µ is the expected growth rate of the stream of value differences between the
discounted expected cash flows, σ is the standard deviation of those differences, and dz is the
random increment of a standard Wiener process such that [ ] 0d =Ε z and [ ] tz dd 2 =Ε . With
geometric Brownian motion the present value of switching from conventional to organic
farming may be different if the transition is postponed.
Equation (1) implies that future values of the investment are log-normally distributed
with expected value [ ] )exp(00 tRRt µΕ = , where 0Ε denotes the expectation at time 0=t . For
an infinitely lived investment, McDonald and Siegel (1986) demonstrate that the expected
value of the investment opportunity, F[R], can be expressed as:
[ ] ( )
Ω−−Ε= 0max rteTtRRF , (2)
where the time of investment, t, is the control variable, r is the discount rate, and 0Ω denotes
the set of information available to the farmer at t = 0. In this case, the return to investing at the
beginning of the period is rF and the value of postponing the investment decision is equal to the
increase in F that is expected to occur during the period.
The first order condition to the investment problem is [ ]tFtrF ΩΕ dd = . Using Ito’s
lemma to obtain the total differential for Fd , the first order condition can be rewritten as
0)()(222
1 =−′+′′ rFRFRRFR µσ . Equation (3) provides the analytical solution.
8
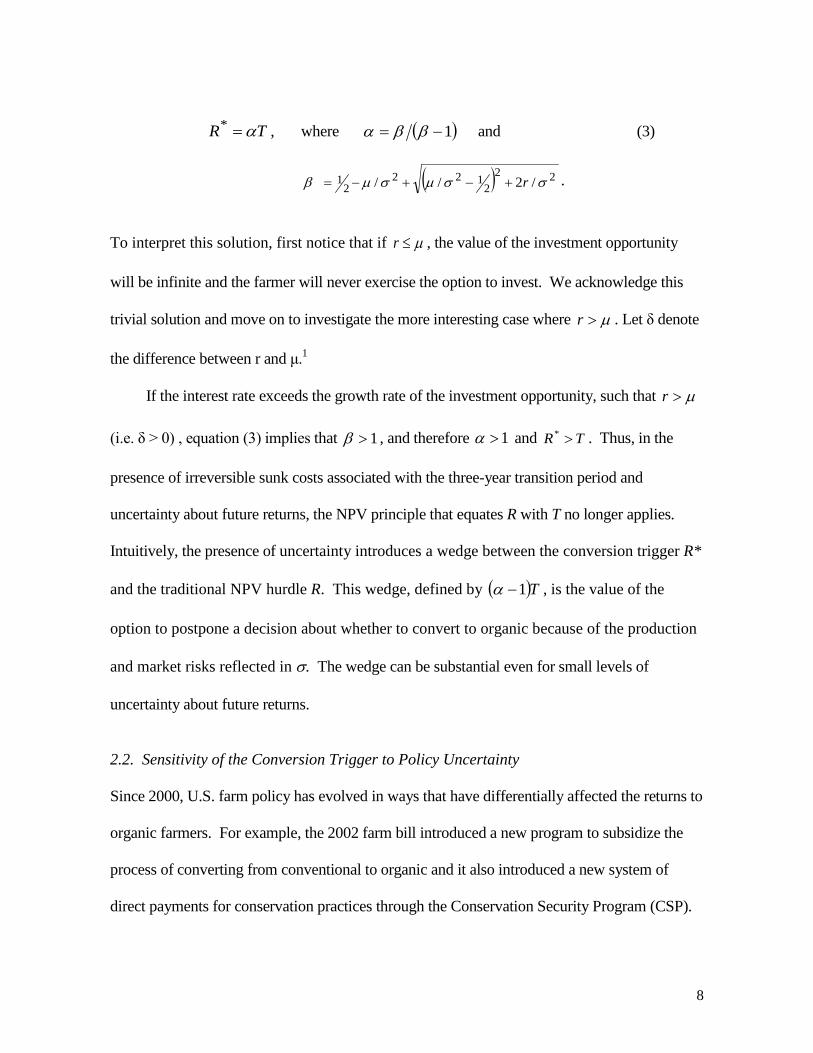
TR α=* , where ( )1−= ββα and (3)
( ) 222
1222
1 /2// σσµσµβ r+−+−= .
To interpret this solution, first notice that if µ≤r , the value of the investment opportunity
will be infinite and the farmer will never exercise the option to invest. We acknowledge this
trivial solution and move on to investigate the more interesting case where µ>r . Let δ denote
the difference between r and μ.1
If the interest rate exceeds the growth rate of the investment opportunity, such that µ>r
(i.e. δ > 0) , equation (3) implies that 1>β , and therefore 1>α and TR >* . Thus, in the
presence of irreversible sunk costs associated with the three-year transition period and
uncertainty about future returns, the NPV principle that equates R with T no longer applies.
Intuitively, the presence of uncertainty introduces a wedge between the conversion trigger R*
and the traditional NPV hurdle R. This wedge, defined by ( )T1−α , is the value of the
option to postpone a decision about whether to convert to organic because of the production
and market risks reflected in σ. The wedge can be substantial even for small levels of
uncertainty about future returns.
2.2. Sensitivity of the Conversion Trigger to Policy Uncertainty
Since 2000, U.S. farm policy has evolved in ways that have differentially affected the returns to
organic farmers. For example, the 2002 farm bill introduced a new program to subsidize the
process of converting from conventional to organic and it also introduced a new system of
direct payments for conservation practices through the Conservation Security Program (CSP).
9
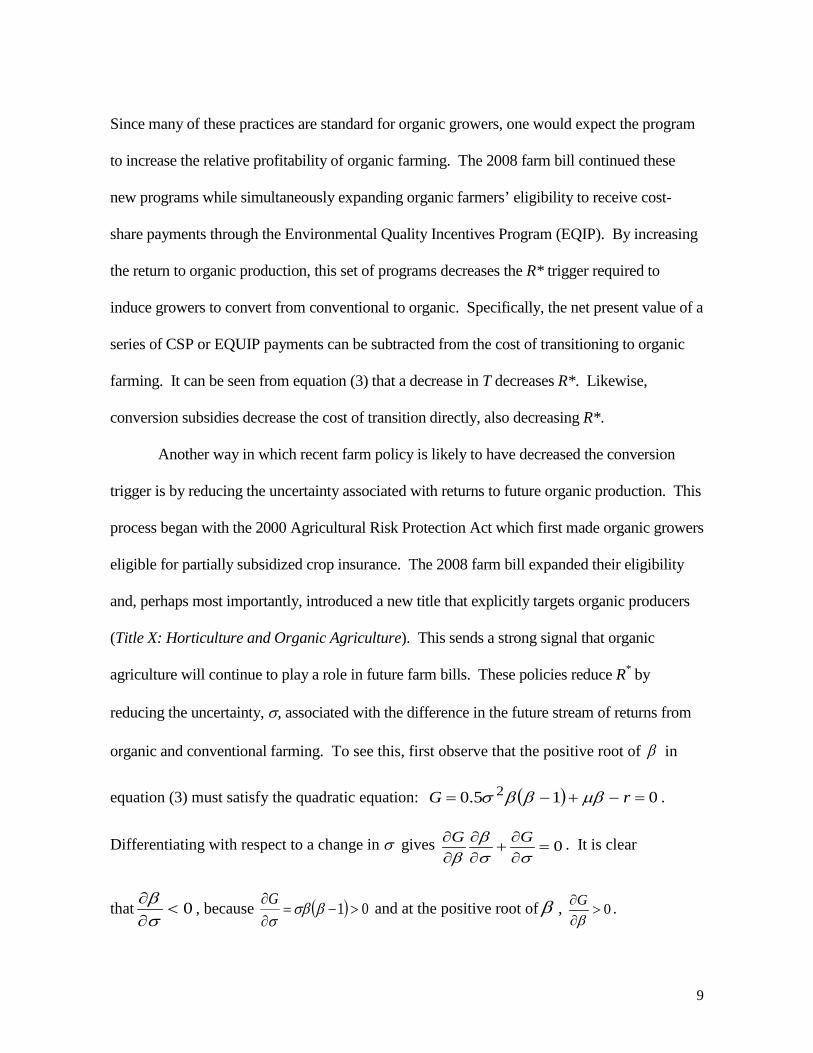
Since many of these practices are standard for organic growers, one would expect the program
to increase the relative profitability of organic farming. The 2008 farm bill continued these
new programs while simultaneously expanding organic farmers’ eligibility to receive cost-
share payments through the Environmental Quality Incentives Program (EQIP). By increasing
the return to organic production, this set of programs decreases the R* trigger required to
induce growers to convert from conventional to organic. Specifically, the net present value of a
series of CSP or EQUIP payments can be subtracted from the cost of transitioning to organic
farming. It can be seen from equation (3) that a decrease in T decreases R*. Likewise,
conversion subsidies decrease the cost of transition directly, also decreasing R*.
Another way in which recent farm policy is likely to have decreased the conversion
trigger is by reducing the uncertainty associated with returns to future organic production. This
process began with the 2000 Agricultural Risk Protection Act which first made organic growers
eligible for partially subsidized crop insurance. The 2008 farm bill expanded their eligibility
and, perhaps most importantly, introduced a new title that explicitly targets organic producers
(Title X: Horticulture and Organic Agriculture). This sends a strong signal that organic
agriculture will continue to play a role in future farm bills. These policies reduce R* by
reducing the uncertainty, σ, associated with the difference in the future stream of returns from
organic and conventional farming. To see this, first observe that the positive root of β in
equation (3) must satisfy the quadratic equation: ( ) 015.0 2 =−+−= rG µβββσ .
Differentiating with respect to a change in σ gives 0=∂∂
+∂∂
∂∂
σσβ
βGG . It is clear
that 0<∂∂σβ , because ( ) 01 >−=
∂∂ βσβσG and at the positive root of β , 0>
∂∂βG .

10
While the direct effect of conversion subsidies, payments, and crop insurance is to
reduce the value of being able to postpone the conversion decision, these policies also
introduce a new dimension of uncertainty both before their actual introduction and if farmers
are unsure about the life of the programs and other changes that might occur in the future.
This uncertainty may, in turn, affect the value of the option to switch. The effect may
increase or decrease the conversion trigger depending on the nature of the policy.
The standard case in the literature is that of policy uncertainty surrounding a
potential one time subsidy. For example, Hassett and Metcalf (1999) and Isik (2004)
discuss policy uncertainty for the case of one-time cost share payments. An increase in the
probability of a future policy that would make these payments would delay conversion (by
increasing the value of the option to wait). Alternatively, if the cost share subsidy were
currently in effect an increase in the probability of withdrawal of the program would
encourage adoption now (by decreasing the value of the option to wait).
To extend our option model to include policy uncertainty, we generalize equation (1)
to allow a discrete jump process that provides a second source of randomness. While there
are many possible sources of policy uncertainty (see Gardner (2001) for a useful review), we
focus on a single fairly general case. Suppose that farmers believe that at some unknown date
in the future the difference in returns from organic and conventional farming may take a
discrete jump down because of a policy change that reduces the profitability of organic
farming. For example, a recession of the national economy could shrink the federal budget
for the environmental programs that disproportionately benefit organic farmers (e.g. CSP,
EQIP). Because these programs are relatively new, their funding levels may be more sensitive

11
to macroeconomic shocks than the long-standing income support programs for major
commodities. With this in mind, equation (1) can be rewritten as a mixed Wiener-Poisson
process:
RdqRdzRdtdR −+= σµ , (4)
where the Poisson (policy) event is uncorrelated with R and defined as :
( )
−=
dt
dtdq
λθ
λθ
1y probabilit with
y probabilit with. (5)
Equations (4)-(5) imply that at each point in time there is a probability λ that returns will
drop by θ percent. In this case, the expected trend in differential returns reflects the degree
of policy uncertainty: [ ] λθµ −=RdRE .
We assume that the jump component represents non-systematic risk (Merton (1976,
p. 133) in the sense that policy events related to organic farming are industry specific rather
than affecting the entire agriculture sector. In this case, the drift variable µ can be modeled
as including a “compensation” term equal to λθ in addition to any deviation, δ, from the
risk-free interest rate r such that:
λθδµ +−= r . (6)
This analytical result follows from Merton (1976) and Martzoukos and Trigeorgis (2002).
In the presence of policy uncertainty, the first order condition for the value of the
opportunity to convert to organic at a future date, [ ]tFtrF ΩΕ dd = , can be rewritten as
( ) ( )[ ] 01)()()(222
1 =+++−′+′′ RFRFrRFRRFR θλλµσ . The solution to this problem has a
structure that parallels the simpler case without policy uncertainty:

12
TR αˆ * = , where ( )1ˆ/ˆˆ −= ββα and (7)
[ ] ( ) 0)1(1 : ˆ 221 =+++−+−= βθλλµβββσββ r .
Here β is implicitly defined as the root to a nonlinear equation. Combining (6) and (7)
illustrates how policy uncertainty can delay conversion. It can be seen from (6) that
conditional on θ , an increase in λ will have the same effect as an increase in r. It can be
demonstrated from (7) that an increase in either term will decrease β , which will increase
α and increase the conversion trigger. Intuitively, an increase in the chance that a new farm
policy (which is favourable to organic) might be terminated or cut in the future increases the
value of the option to wait and see whether the program will be continued before investing in
conversion.
2.3. Discussion
The main implication of the real option framework is that farmers will make choices today
based partly on their beliefs about future production and market uncertainty. In order to
characterize the role of uncertainty in the decision making process, we have made
simplifying assumptions about the nature of the stochastic process used to characterize
uncertainty, about farmers’ attitudes toward risk, and about heterogeneity in the distribution
of the value of the real option within the farming community. These assumptions deserve
some additional discussion.
First, it is important to emphasize that our main results in (3) and (7) depend only on
the properties of dz . Geometric Brownian motion serves as a convenient example because it
has an analytical solution. However, geometric Brownian motion and the Weiner process can,
13
in principle, be generalized to a broad class of continuous-time stochastic processes (Merton,
1990). For example, in a recent application to hog farming, Odening, Musshoff, and Balmann
(2005) obtain similar theoretical results by assuming that R follows a mean reverting process.
One could use numerical methods to develop intuition for the theoretical properties of our
model under a variety of alternative parametric or nonparametric descriptions for dz .
Second, our theoretical model treats farmers as if they are risk neutral. Gardebroek
(2006) and Serra, Zilberman, and Gil (2008) provide preliminary evidence that both organic
and conventional growers display decreasing absolute risk aversion (DARA). Incorporating
risk aversion into the theoretical model would not necessarily affect the overall pattern of
results or the approach we take to characterizing optional behavior. This follows from Dixit
(1989). Using a general real options model, he demonstrates that when the discount rate r is
replaced by a risk-adjusted rate, the solutions for the trigger value can be determined in exactly
the same way. Extending our model to explicitly incorporate DARA preferences (or other non-
neutral attitudes toward risk) would be an interesting topic for future research.
Third, because the theoretical model describes a representative farmer, we do not
provide a statistical distribution to describe heterogeneity in the real option value within the
farming community. Of course farmers differ. This makes it important to recognize that our
option value model can be applied equally well to different “types” of farmers. Differently
skilled farmers will differ in the relative returns they would earn from organic and
conventional systems. Likewise, they may differ in their expectations about the evolution of
the stream of future relative returns to organic and in their assessment of policy uncertainty.
Generalizing the theoretical model to depict these sources of heterogeneity would simply

14
require adding farmer-specific subscripts to ,,,, σµTR and λ . Different farmer “types”
would have different real option values, but the comparative statics from our representative
agent model would still apply to each type.
As we move from theory to practice, the key variable of interest is the “reduced
form” multiplication factor α, which reflects all of the structural parameters ( θλσµ ,,, ).
The multiplication factor is what distinguishes the NPV trigger, R, from its real-options
counterpart R* and has the potential to influence the rates at which farmers convert to organic.
Studying the evolution of α over time offers the potential to reveal how changes in farm policy
influence the value of postponing the conversion decision.2
Our model illustrates how a change in agricultural policy that seemingly favours
organic farmers can have opposing effects on the conversion trigger. Holding the transition
cost fixed, an increase in returns to investment through direct payments, for example, would
decrease the trigger. At the same time, if there is uncertainty about the continuity of the
policy or about the actual level of payments, producers will have an incentive to postpone
their investment decision until the uncertainty is resolved.3 For example, the 2000
Agricultural Risk Protection Act and the 2002 Farm Bill both introduced polices that, once
enacted, would increase relative returns to organic. Yet if growers were uncertain about the
continuation of these policies in future farm bills, this added source of uncertainty could
actually increase the value of postponing the conversion decision. Our next task is to
develop an empirical model capable of identifying the net effect of these opposing forces.
3. Empirical Model
We envision that conventional growers differ in the values they assign to having the option
15
to convert. In addition to the sources of grower heterogeneity described above, real option
values may differ systematically across space according to differences in market access and
differences in experience. One would expect conventional growers to look to their organic
neighbours to learn about transition costs, production costs, and the organic supply chain,
for example. Where there is a more established population of organic growers the remaining
conventional growers may be more certain about access to processors and about production
costs. Systematic differences in real option values across space would support a strategy to
identify the distribution of values in the farmer population. We implemented our model at
the regional/county level. This avoids the need to have a complete set of individualized data;
farm and farmer specific conditions both for conventional and organic are averaged out.
We develop a simple switching regime model that is capable of identifying real
option values when there are two types of regions: those with positive values and those with
zero values. In the latter case, the various sources of uncertainty have been resolved in the
minds of conventional growers so that the difference in returns between conventional and
organic simply equals the transition cost. In the formative regions, considerable uncertainty
remains, driving a wedge between the conventional net present value trigger and the real
option value trigger. Under the maintained assumption that farmers/regions can be
classified according to these two categories, the observed difference in returns can be used
to identify the (constant) transition cost and a parameter that represents the real option value
“wedge”.
The differential between the discounted expected future stream of cash flows from
organic and conventional farming can be attributed to unobservable transition costs and a real

16
option value, as in (3). Assuming this value is nonnegative, the differential can be depicted
as follows for an individual observation i:
ia
i TeR = if positive real option value (8)
ii TR = if no real option value (9)
Following Spiller and Huang (1986) we specify transition cost Ti as a random variable with
constant mean:
ii TeT ν= , (10)
where T is the mean and iν is a normally distributed random variable with zero mean and
constant variance 2νσ . Substituting (10) into (8) and (9) and taking natural logs gives:
ii TaR ν++= lnln , if positive real option value (11)
ii TR ν+= lnln , if no real option value. (12)
Equations (11) and (12) may be expressed as a switching regression system with a probability
of observing an option value and a probability −1 of observing no option value. When
returns follow a random walk, the rational expectations forecast for future returns is simply
today’s returns. The definition of Rt in the empirical model is based on this principle:
itt
itit Tar
COν++=
−lnln , with probability . (13)
itt
itit Tr
COν+=
−lnln , with probability −1 . (14)
Here, itO is net earnings in organic farming for region i at time t, itC is observed net
earnings in conventional farming, rt is the interest rate, νit is a normally distributed iid

17
random variable, and a and T are parameters to be estimated. If equation (14) prevails,
production and market risk are of no significance to organic growers. In the case of
equation (13), there is a positive real option value if 0>a . Using the estimates of T and a,
real option values can be calculated as Tea )1( − .
Equations (13) and (14) imply that real option values are time-constant. To allow for
temporal shocks to the value we can replace equation (8) with iiDa
i TeR γ+= , where 1=iD
if the observation relates to the specific year. In this case, equation (13) is replaced with
(15).
ititt
itit TDar
COνγ +++=
−lnln . (15)
All of the parameters of the switching regime model defined in (14)-(15) can be estimated
by maximizing the log of the following likelihood function:
])1([ 21
1
11 ii
N
iflflL −+∏=
=. (16)
Here, N represents the total number of observations in both regimes, and fi1and fi
2 denote the
density functions:
=
νν σφ
σ11 1 Zfi , where ( )
TDar
COZ it
t
itit lnln1 −−−
−= γ (17)
=
νν σφ
σ22 1 Zfi , where ( )
Tr
COZ
t
itit lnln2 −
−= , (18)
where φ is the density of a standard normal variable. With access to data on the differential
returns to organic and conventional production, estimation of (16) can identify the constant
transition cost (T ), the real option value parameter (a), and discrete shifts in real option

18
value that occur over time (γ ) as uncertainty begins to be resolved and formative markets
begin to mature. We estimate this model using data on returns to conventional and organic
soybeans before and after farm policy shocks.
4. Estimating the Impact of Farm Policy Changes on the Option to Switch to Organic
The summer and fall of 2000 marked the beginning of a dramatic change in U.S. farm policy
toward organic growers. In June, the Agricultural Risk Protection Act was passed. Prior to
the Act, organic growers were eligible for less financial support than their conventional
counterparts. While organic growers received compensation from standard commodity
support programs, federal crop insurance policies would generally not compensate them for
losses because organic farming prevented the use of some of the (chemical) techniques
expected under the official definition of “good farming practices”. This changed under the
2000 Agricultural Risk Protection Act (ARPA) and crop insurance for many organic crops
first became available by May 2001.
Then, in October, 2000, the senate began to debate a proposal introduced by Senator
Harkin to amend the farm bill to establish the Conservation Security Program (CSP).4 This
program, which eventually became part of the 2002 Farm Bill, introduced a new system of
direct payments to growers for ongoing environmental stewardship on agricultural land.5
This was the first time that a farm bill contained an explicit provision for “green” payments,
and the proposed system for distributing payments favoured organic growers.6 The duration
and amount of payments depended on the extent of conservation work performed on the
farm and on the number of acres enrolled. Payment rates differed across three “tiers” of
conservation activity, with a payment ceiling of $45,000 per farm.7

19
The bill introduced to the Senate in October, 2000 envisioned the CSP as an
entitlement program. However, because of funding limits, it was initially operated on the
basis of individual watersheds, and rotated around the country with signups for different
areas each year. Program officials speculated that by 2010, every farmer in the U.S. would
have had an opportunity to enroll (USDA, 2004). This did not happen. Funding limits
required the program to be scaled back, and it was eventually restructured (and renamed) in
the 2008 Farm Bill. However, organic farmers are unlikely to have foreseen this in 2001,
the last year of our study period.
4.1. Data on Conventional and Organic Soybeans
We obtained data on individual organic soybean farms from the Organic Farm Research
Foundation, which originally collected the data through national surveys in 1997 and 2001.
The survey was discontinued after 2001 and the data we were able to obtain represent the
most comprehensive source of micro data on organic farmers that is currently available.8 In
recent years, the USDA has also collected data on organic production practices for a
restricted number of crops in certain States through a sub-sample in their Agricultural
Resource Management Survey. While the OFRF survey is not designed to be as
comprehensive as the Census of Agriculture it represents a sizable portion of certified
organic farms (approximately 23%). Moreover, soybeans account for a sizeable share of
organic farmland in the United States. For example, in 2001, soybeans accounted for 16%
of all certified organic cropland in the U.S. other than hay and pasture (Greene and Kremen,
2003).
Each organic farm-year observation in the OFRF data consists of a set of economic
20
variables and a spatial identifier. The spatial identifier includes the state and zip code. The
economic variables include acreage, production, price, and yield. Together, these variables
allow us to construct county-level organic prices and yields. As a proxy for conventional
returns, we use county-level data on price and yield reported by the USDA National
Agricultural Statistics Service. We use gross returns as a proxy for profitability under the
maintained assumption that there is little difference between operating costs for
conventional and organic soybeans. This is consistent with McBride and Greene (2008).9
After eliminating OFRF observations that lacked information on either price or yield,
we were left with 247 farm level observations that stretch across 142 counties in 16 states.
For 1997 these data represent 16% of all certified organic soybean acres in the nation.
While the number of soybean acres certified as organic expanded in 2001, the size of the
sample did not and the percentage dropped to 6%. Nevertheless, this sample is still quite
large relative to the standard sampling frequencies for Census micro data.
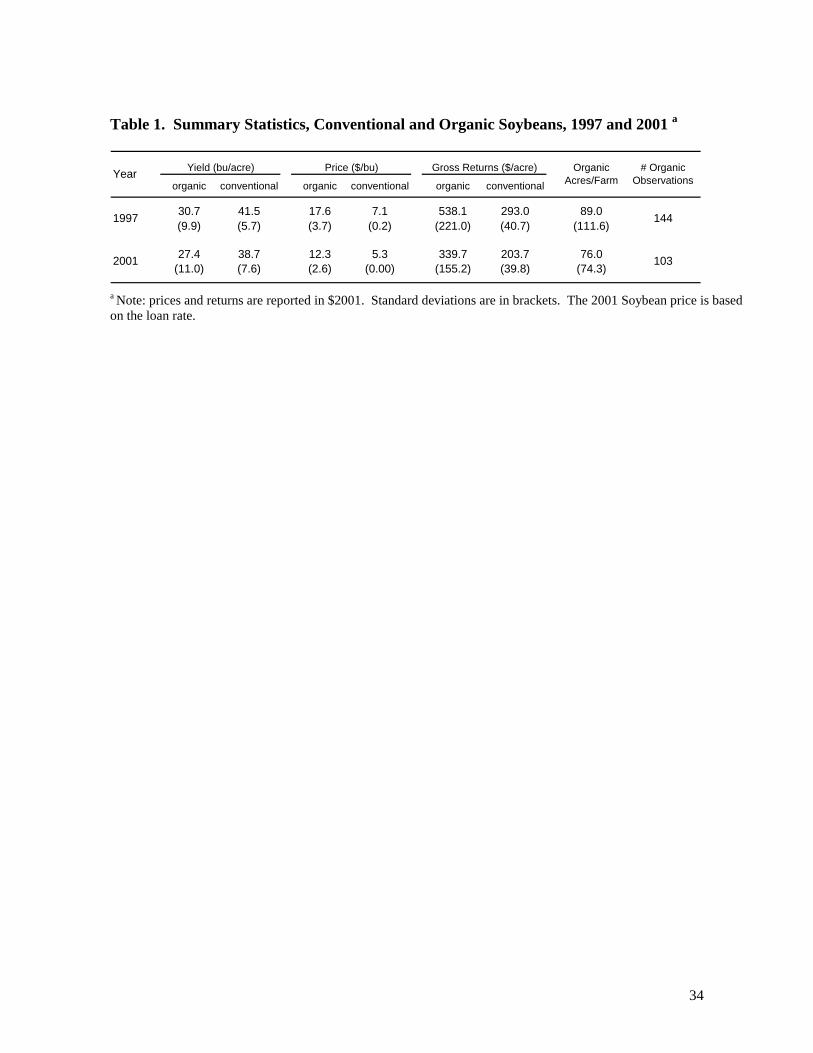
Table 1 provides summary statistics for our data. They conform to the conventional
wisdom about the differences between conventional and organic farming. Yields for
conventional varieties are higher, but their average prices are lower. The higher price
premiums more than compensate for lower average yields so that organic soybeans have
higher average returns. At the same time, organic returns are more variable.
After omitting the counties with only one observation for organic production, we
were left with data on 45 counties, each of which is treated as a unique observation for the
purposes of estimation. These data were used to estimate the switching regime model with
and without an indicator variable to allow for changes in policy uncertainty between 1997

21
and 2001. The coefficient on the indicator variable provides a test of whether the change in
farm policy toward organic growers conveyed by passage of the Agricultural Risk
Protection Act and introduction of the Conservation Security Program in the Senate altered
the value associated with postponing the conversion decision.
4.2. Results
Before interpreting the results, it is important to highlight a caveat to the identification of the
model. Without data on the interest rate (r), one cannot separately identify r and T. This
can be seen from (13)-(14). Therefore, we maximize the likelihood function for a range of
interest rates between 0.05 and 0.15. The lower bound on this range is defined by the annual
average return on 6-month T-bills, which was approximately 5% between 1997 and 2001.
The upper bound is set to 15% to recognize that the relevant interest rate must also
incorporate non-diversifiable risk associated with organic farming. We expect this risk to be
substantial because price premiums in organic markets may depend on supply and demand
factors that are largely uncorrelated with conventional markets. This helps to explain why
organic farmers were ineligible to purchase government crop insurance before 2001.
Finally, we use a baseline interest rate of 10% as the focal point for model comparison.
Table 2 summarizes the results from estimating the likelihood function for the
switching regime model under the maintained assumption of a time-constant real option
value. The estimate for the regime probability is consistent with the presence of real
option values in a subset of markets. Its point estimate, 0.91, suggests that the regime with
an option value was dominant. The estimate for the conversion cost, T, ranges from $267 to
$801 per acre. The option value parameter, a, is positive and statistically significant. The
22
last row of table 2 reports the real option value implied by our parameter estimates for the
parameter a and the conversion cost, T, for each of five interest rates. The real option value
ranges from $2,588 to $3,882 per acre.
Table 3 reports the results from estimating the likelihood function for the more
general version of the switching regime model, where the option value is allowed to vary
over time in response to changes in policy uncertainty. Estimates for the option model
parameters ( vTa σ,,, ) are not statistically different from the more restrictive version of the
model. However, we find a significant 30% reduction in the option value between 1997 and
2001. For example, conditional on a discount rate of 0.1, the value of being able to postpone
the decision to convert to organic decreased from $2,124 in 1997 to $1,451 in 2001.
There are at least three potential explanations for this decrease in our estimate for the
option value. One possibility is that the passage of the Agricultural Risk Protection Act and
the introduction of the Conservation Security Program in 2000 reduced growers’ uncertainty
about future organic returns. The reduction in uncertainty would decrease their incentive to
further postpone the conversion decision. An alternative explanation is that the increase in
the quantity of organic soybeans grown between 1997 and 2001 led growers to revise their
expectations for the future organic price premium. A lower expectation for the future price
premium would also decrease the value of waiting to convert. A third explanation would be
that of a “growing knowledge stock”. In time, the direct costs of transition may reduce with
an increase in the stock of public knowledge on how to grow organically and how to go
through the transition process.
Finally, we use the estimates in Table 3 to compare actual CSP payment levels with

23
the predicted level of “green” payments that would be required to induce a risk neutral
conventional farmer to switch to organic. Assuming an interest rate of 10 percent, a
conventional soybean farmer would need to receive a one-time payment of $462 per acre as
a compensation for the conversion cost and an additional $1,451 per acre to cover the long
run higher production and market risk of the organic practices. Combining these two values
implies an annual payment of $311 per acre for a 10-year contract (the maximum contract
length allowed under the CSP).
The original CSP limit of $45,000 for total annual payments implies a farm could
receive a payment of $311 per acre per year for up to 144 acres. However, to qualify for
payments, farmers would have needed to implement conservation practices on their entire
operation and this could have served as an important barrier to participation given the size of
the average soybean farm. According to the 2002 Census of Agriculture, the average
soybean farm harvested 228 acres of soybeans. This provides a lower bound on the size of
the farm itself, since other crops may have been harvested as well. Thus, our estimates
imply that the Conservation Security Program payment levels were too low to offset the
option value associated with postponing conversion in 2001 for the majority of conventional
soybean growers. This helps to explain why organic soybean acreage has not increased
from its peak in 2001.
5. Conclusions
We have developed a formal model to assess the dollar compensation required for
widespread conversion of land use from conventional to organic farming. Integrating
production and market uncertainty into the model, given sunk costs, implies that the organic

24
price premium which implicitly defines the optimal conversion trigger may be much higher
than the trigger that would be predicted by the conventional net present value model. A
difference in triggers leads to inertia in conversion: farmers will wait until the option value
trigger is exceeded before switching to organic. We demonstrate that a new policy which
favours organic can have opposing effects on the rate of conversion. An increase in relative
returns to organic today will increase conversion rates. However, if the future of the policy
program is uncertain, its introduction can increase the value of waiting to switch which will
decrease conversion rates. These theoretical results have potentially significant
implications for (a) the design of future agri-environmental programs that rely on land
conversion, and for (b) the evaluation of program performance.
An empirical switching regime model was developed to test key implications from
the theory. This model enables direct estimation of the transition cost and the option value.
In future work, the estimator could be applied to other environmentally friendly land use
practices or bundles of practices in order to provide information on the payment levels
needed to trigger participation. The model could also be relevant for situations where the
expected returns to the conventional practice under consideration are unobserved but can be
constructed based on biophysical and agronomic information, as in Schatzki (2003) and
Kurkalova, Kling, and Zhao (2006).
Applying the model to conventional and organic soybeans provided strong evidence
that is consistent with the real option value theory. However, it is also important to
acknowledge that other theoretical explanations can be offered for the empirical results
including adjustment of expectations, each farmer’s unique degree of risk aversion, and

25
market imperfections. Thus our result adds to other economic, social and psychological
explanations of the friction in adoption of organic practices. Previous studies cite organic
marketing constraints, the social acceptance of organic technologies, and farmers’ attitude
towards environmental problems.
Our estimate for the level of payments that would trigger conversion helps to explain
why organic soybean acres did not increase following the introduction of the Conservation
Security Program. Assuming an interest rate of 10%, our results imply that the typical
conventional soybean grower would have needed to receive an annual payment of $311 per
acre for a 10 year contact to induce them to convert to organic. This is much larger than the
maximum payment that could have been obtained by the average soybean farmer through
the Conservation Security Program ($197).
There are several ways in which this research could be extended. One possibility
would be to generalize the empirical model to include a drift term. Bentsson and Olhager
(2002) suggest that real option values may drift systematically according to a product’s
maturity. Our estimates for the real option value decreased substantially between 1997 and
2001. One explanation for this phenomenon is that the value of postponing conversion
decreased due to major changes in farm policy in the summer and fall of 2000. An
alternative explanation is that the increased supply of organic soybeans during this period
changed growers’ expectations about future returns. Adding a drift term to the model would
make it possible to distinguish these two explanations using a longer panel of data. A longer
panel would also make it possible to test the maintained assumption of geometric Brownian
motion against alternative hypotheses for the stochastic process that guides the evolution of

26
the differential between conventional and organic returns.
A second task for future research would be to generalize both the theoretical and
empirical models to develop a more flexible treatment of option values and policy
uncertainty. While we model the impact of uncertainty on the decision to convert from
conventional to organic, farmers also have the option to revert back to conventional
practices. Both options however interact and thus could be analysed simultaneously. We did
not go this route because our data revealed that organic returns were generally higher than
for conventional. In the longer run this could change. A ‘third regime’ would also have
policy implications. In particular, unanticipated changes in incentive policies could leave
some organic growers ‘stranded’ in organic where the negative real option value keeps them
from converting back to conventional despite losing money.
Our empirical specification depicts markets with and without option values, but
treats the option value as being constant across space at a point in time. Increasing the
resolution of the data to include information on the heterogeneous prices and costs faced by
the population of growers would make it possible to extend the estimator to attempt to
identify parameters describing a continuous distribution of option values. Finally, another
way in which heterogeneity may be important is that farmers may assign different risk
probabilities to the continuation of different farm programs. Investigating the implications
of this heterogeneity would require extending the theoretical and empirical models to
address the impact of multiple sources of rare events.

27
Footnotes
1. The δ parameter can be interpreted generally as any deviation from the equilibrium rate
of return that creates an incentive for investment. Martzoukos and Trigeorgis (2002)
discuss alternative interpretations of δ in the finance literature.
2. Estimation of the structural parameters ( θλσµ ,,, ), while ambitious, offers the potential
for counterfactual policy simulation, making it an important topic for future research.
3. The option value implications of combining payments with policy uncertainty can also
help to explain other investment phenomena. For example, Miller and Zhang (1996)
suggest that a similar combination of circumstances can help to explain the impact of the
1990-1991 Gulf War on oil field development.
4. Key features of the program were outlined in two senate bills, S. 3223 and S. 3260,
introduced in October 2000. A less detailed version of the proposal (S. 1426) was
introduced in July 1999, and a subsequent revision (S. 932) was introduced in May 2001.
5. The 2002 farm bill also funded “agricultural management assistance” which could be
used to pay for 75% of the cost of conversion to organic, up to $50,000 per producer.
However, it is not clear that conventional growers could have foreseen the introduction
of this provision during our study period.
6. By virtue of their certification, organic farmers automatically satisfied a subset of the
conservation practices required to receive funding. It was widely believed that the
average organic farm would be closer to enrollment in the program than the average
conventional farm and certified and in-transition organic farmers would be likely to
qualify for the highest level of payments (Lohr 2001).

28
7. A full description of the three tiers and their associated payment levels is provided in
USDA (2004). The key details about the conservation practices and payment levels
were included in the bills introduced to the senate in October 2000.
8. When we first started our project, the OFRF was considering a survey for 2006/7 and we
would have included this material in our analysis. However, the survey was postponed
and eventually discontinued.
9. Delate et al. (2003), Delate and Cambardella (2004) find that higher seed, fieldwork and
production costs incurred in organic corn and soybean production are slightly
outweighed by higher pesticide and fertilizer costs for conventional varieties. We
choose to take a conservative stance and assume equal production costs for conventional
and organic. This is in line with McBride and Greene (2008, table 2) who report
statistically insignificant differences in the operating cost for organic and conventional
soybeans in dollars per planted acre based on survey data.
References
Acs, S. Berentsen, P., Huirne, R. van Asseldonk. M (2009) ‘Effect of yield and price risk on
conversion from conventional to organic farming’, Australian Journal of Agricultural
and Resource Economics, Vol. 53 (2009), pp. 393-411.
Archer, D.W and Kludze, H. ‘Transition to Organic Cropping Systems under Risk’, Selected
paper Meetings American Agricultural Economics Association, Long Beach CA, 23-
26 July 2006.
Bengtsson, J. and Olhager, J. ‘Valuation of product-mix flexibility using real
options’, International Journal of Production Economics, Vol. 78, (2002) pp. 13-28.

29
Burton, M., Rigby, D, Young, T. ‘Analysis of the Determinants of Adoption of Organic
Horticultural Techniques in the UK’, Journal of Agricultural Economics, Vol. 50,
(1999) pp. 48-63.
Dhar, T. and Foltz, J.D. ‘Milk By Any Other Name …Consumer Benefits from Labeled
Milk’, American Journal of Agricultural Economics, Vol. 87, (2005) pp. 214-228.
Delate, K., Duffy, M., Chase, C. Holste, A., Friedrich, H. and Wantate, N. ‘An Economic
Comparison of Organic and Conventional Grain Crops in a Long-term Agroecological
Research Site in Iowa’, American Journal of Alternative Agriculture, Vol. 18, (2003)
pp. 59-69.
Delate, K. and Cambardella, C.A.‘Agroecosystem Performance During Transition to
Certified Organic Grain Production’, Agronomy Journal, Vol. 96, (2004) pp. 1288-
1298.
Dixit, A. ‘Entry and Exit Decisions under Uncertainty’, Journal of Political Economy, Vol.
97, (1989) pp. 620-638.
Dixit, A.K. and Pindyck, R.S. Investment under uncertainty. (Princeton, N.J.: Princeton
University Press, 1994).
Gardebroek, C. ‘Risk Attitudes of Organic and Non-organic Farmers with a Bayesian
Random Utility Model’. European Review of Agricultural Economics, Vol. 33, (2006)
pp. 485-510.
Gardner, B.L. ‘Risks Created by Policy in Agriculture’, in R.E. Just, and R.D. Pope (eds), A
Comprehensive Assessment of the Role of Risk in U.S. Agriculture (Boston: Kluwer
Academic Publishers, 2001, pp. 489-510).

30
Greene, C. and Kremen, A..Organic Farming Emerges in 2000-2001: Adoption of Certified
Systems, Economic Research Service, U.S. Department of Agriculture, 2003.
Available at DOI: www.ers.usda.gov/publications/aib780
Hassett, K.A. and Metcalf, G.E. ‘Investment with Uncertain Tax Policy: Does Random Tax
Policy Discourage Investment’, Economic Journal, Vol. 109, (1999) pp. 372-393.
Hole, D.G., Perkins, A.J., Wilson, J.D., Alexander, I.H., Grice, P.V., and Evans, A.D. ‘Does
Organic Farming Benefit Biodiversity?’, Biological Conservation, Vol. 122, (2005)
pp.113-130.
Isik, M. ‘Incentives for Technology Adoption under Environmental Policy Uncertainty:
Implications for Green Payment Programs’, Environmental and Resource Economics
Vol. 27, (2004) pp. 247-263.
Klonsky, K. and Smith, M.D. ‘Entry and Exit in California’s Organic Farming Sector ’, in
D.C. Hall and L.J. Mofitt (eds), Economics of Pesticides, Sustainable Food
Production, and Organic Food Markets (Amsterdam etc: Elsevier Science, 2004).
Kurkalova, L., Kling, C. and Zhao, J. ‘Green Subsidies in Agriculture: Estimating the
Adoption Cost of Conservation Tillage from Observed Behavior’, Canadian Journal
of Agricultural Economics, Vol. 54, (2006) pp. 247-267.
Lohr, L. ‘The Importance of the Conservation Security Act to US Competitiveness in Global
Organic Markets’, Faculty Series 01-19 (Dept. Agricultural and Applied Economics,
University of Georgia, Athens GA, 2001).
Lohr, L. and Salomonson, L. ‘Conversion Subsidies for Organic Production: Results from
Sweden and Lessons for the United States’, Agricultural Economics, Vol. 22, (2000)

31
pp. 133-146.
Martzoukos, S.H., Trigeorgis, L. ‘Real (Investment) Options with Multiple Sources of Rare
Events’, European Journal of Operational Research, Vol. 136, (2002) pp. 696-706.
McBride, W.D. and Greene, C. ‘The Profitability of Organic Soybean Production’, Selected
paper Meetings American Agricultural Economics Association, Orlando FL CA, 27-29
July 2008.
McDonald, R. and Siegel, D. ‘The Value of Waiting to Invest’, Quarterly Journal of
Economics, Vol. 101, (1986) pp. 707-728.
Merton, R.C. Continuous-Time Finance (Cambridge, MA: Basil Blackwell, 1990).
Miller, M. and Zhang, L. ‘Oil Price Hikes and Development Triggers in Peace and Wars’,
The Economic Journal, Vol. 106, (1996) pp. 445-457.
Musshoff, O. and Hirschhauer, N. ‘Adoption of organic farming in Germany and Austria: an
integrative dynamic investment perspective’, Agricultural Economics Vol. 39, (2008)
pp.135-145.
Odening, M., Musshoff, O and Utesch, V. ‘Der Wechsel vom konventionellen zum
ökologischen Landbau: Eine investitionstheoretische Betrachtung’, Agrarwirtschaft
Vol. 53, (1994) pp. 223-224.
Odening, M., Musshoff, O. and Balmann, A. ‘Investment Decisions in Hog Finishing: An
Application of the Real Options Approach’, Agricultural Economics, Vol. 32, (2005)
pp. 47-60.
Padel, S. ‘Conversion to Organic Farming: A Typical Example of the Diffusion of an
Innovation?’, Sociologia Ruralis, Vol. 41, (2001): 40-61.
32
Padel, S. and Lampkin, N.H. ‘Farm-level Performance of Organic Farming Systems’, in
N.H. Lampkin and Padel, S. (eds), The Economics of Organic farming: An
International Perspective (Wallingford U.K.: CAB International, pp. 201-218, 1994).
Pietola, K.S. and Oude Lansink, A. ‘Farmer Response to Policies Promoting Organic
Farming Technologies in Finland’, European Review of Agricultural Economics Vol.
28, (2001) pp. 1-15.
Schatzki, T. ‘Options, Uncertainty and Sunk Costs: An Empirical Analysis of Land Use
Change’, Journal of Environmental Economics and Management Vol. 46, (2003) pp.
86-105.
Serra, T., Zilberman D., and Gil. J.M. ‘Differential Uncertainties and Risk Attitudes
between Conventional and Organic Producers: the Case of Spanish Arable Crop
Farmers’, Agricultural Economics Vol. 39, (2008) pp. 219-229.
Spiller, P.T. and Huang, C.J. ‘On the Extent of the Market: Wholesale Gasoline in the
Northeastern United States’, Journal of Industrial Economics, Vol. 35, (1986) pp. 131-
145.
Tegene, A., Wiebe, K., Kuhn, B. ‘Irreversible investment under uncertainty: Conservation
easements and the option to develop agricultural land’, Journal of Agricultural
Economics, Vol. 50, (1999) pp. 203-219.
United States Department of Agriculture — Natural Resources Conservation Service. Farm
Bill 2002 (Conservation Security Program Comprehensive Questions and Answers.
Dec 2005. Available at http://www.nrcs.usda.gov/programs/csp/)
33
U.S. Dept. of Agriculture — Economic Research Service. Organic Production.
(http://www.ers.usda.gov/Data/Organic/. <accessed April 17, 2009).
Wossink, A. and Gardebroek, C. (2006) Environmental Policy Uncertainty and Marketable
Permit Systems: The Dutch Phosphate Quota Program, American Journal of
Agricultural Economics, Vol. 88, (2006) pp. 16-27.
34
Table 1. Summary Statistics, Conventional and Organic Soybeans, 1997 and 2001 a
organic conventional organic conventional organic conventional
30.7 41.5 17.6 7.1 538.1 293.0 89.0(9.9) (5.7) (3.7) (0.2) (221.0) (40.7) (111.6)
27.4 38.7 12.3 5.3 339.7 203.7 76.0(11.0) (7.6) (2.6) (0.00) (155.2) (39.8) (74.3)
# Organic Observations
Gross Returns ($/acre)Yield (bu/acre) Price ($/bu)Year Organic Acres/Farm
103
1441997
2001
a Note: prices and returns are reported in $2001. Standard deviations are in brackets. The 2001 Soybean price is based on the loan rate.

35
Table 2. Option Value Estimates for Soybean Data a
r = 0.05 r = 0.075 r = 0.1 r = 0.125 r = 0.15
1.77*** 1.77*** 1.87*** 1.87*** 1.87***(0.28) (0.28) (0.28) (0.28) (0.28)
801.38** 534.32** 400.60** 320.60** 267.18**(219.25) (146.18) (109.59) (87.73) (73.11)
0.91*** 0.91*** 0.91*** 0.91*** 0.91***(0.05) (0.05) (0.05) (0.05) (0.05)
0.42*** 0.42*** 0.42*** 0.42*** 0.42***(0.05) (0.05) (0.05) (0.05) (0.05)
Implied option value ($/acre) 3,882 2,588 1,941 1,553 1,294
LLF probability l
Discount Rate
Option value parameter a
Parameter symbol
Mean conversion cost/acre T
Standard deviation σv
a Note: standard errors are in brackets. ***,**: Significant at 2.5%, 5% (two-sided).

36
Table 3. Option Value Estimates for Soybean Data, with Policy Uncertainty a
r = 0.05 r = 0.075 r = 0.1 r = 0.125 r = 0.15
1.74*** 1.72*** 1.72*** 1.72*** 1.72***(0.25) (0.25) (0.25) (0.25) (0.25)
909.73** 615.21** 461.73** 369.52** 308.04**(232.79) (158.82) (119.24) (95.46) (79.60)
0.92*** 0.92*** 0.92*** 0.92*** 0.92***(0.05) (0.05) (0.05) (0.05) (0.05)
0.40*** 0.40*** 0.40*** 0.40*** 0.40***(0.05) (0.05) (0.05) (0.05) (0.05)
-0.30** -0.30** -0.30** -0.30** -0.30**(0.14) (0.14) (0.14) (0.14) (0.14)
1997 Option Value ($/acre) 4,256 2,832 2,124 1,699 1,416
2001 Option Value ($/acre) 2,922 1,935 1,451 1,160 967
Dummy, year=2001 γ
Parameter symbol
Mean conversion cost/acre T
Standard deviation σv
Discount Rate
Option value parameter a
LLF probability l
a Note: standard errors are in brackets. ***,**: Significant at 2.5%, 5% (two-sided).
Related Documents