HAL Id: hal-00916531 https://hal-unilim.archives-ouvertes.fr/hal-00916531 Submitted on 10 Dec 2013 HAL is a multi-disciplinary open access archive for the deposit and dissemination of sci- entific research documents, whether they are pub- lished or not. The documents may come from teaching and research institutions in France or abroad, or from public or private research centers. L’archive ouverte pluridisciplinaire HAL, est destinée au dépôt et à la diffusion de documents scientifiques de niveau recherche, publiés ou non, émanant des établissements d’enseignement et de recherche français ou étrangers, des laboratoires publics ou privés. Why Have Bank Interest Margins Been so High in Indonesia Since the 1997/1998 Financial Crisis? Irwan Trinugroho, Agusman Agusman, Amine Tarazi To cite this version: Irwan Trinugroho, Agusman Agusman, Amine Tarazi. Why Have Bank Interest Margins Been so High in Indonesia Since the 1997/1998 Financial Crisis?. 2012. <hal-00916531>

Welcome message from author
This document is posted to help you gain knowledge. Please leave a comment to let me know what you think about it! Share it to your friends and learn new things together.
Transcript

HAL Id: hal-00916531https://hal-unilim.archives-ouvertes.fr/hal-00916531
Submitted on 10 Dec 2013
HAL is a multi-disciplinary open accessarchive for the deposit and dissemination of sci-entific research documents, whether they are pub-lished or not. The documents may come fromteaching and research institutions in France orabroad, or from public or private research centers.
L’archive ouverte pluridisciplinaire HAL, estdestinée au dépôt et à la diffusion de documentsscientifiques de niveau recherche, publiés ou non,émanant des établissements d’enseignement et derecherche français ou étrangers, des laboratoirespublics ou privés.
Why Have Bank Interest Margins Been so High inIndonesia Since the 1997/1998 Financial Crisis?
Irwan Trinugroho, Agusman Agusman, Amine Tarazi
To cite this version:Irwan Trinugroho, Agusman Agusman, Amine Tarazi. Why Have Bank Interest Margins Been so Highin Indonesia Since the 1997/1998 Financial Crisis?. 2012. <hal-00916531>

1
Why Have Bank Interest Margins Been so High in Indonesia since the 1997/1998
Financial Crisis?
Irwan Trinugrohoa, Agusman Agusman
b1, Amine Tarazi
a
a Université de Limoges, LAPE, 5 rue Félix Eboué, 87031 Limoges Cedex, France
b Bank Indonesia, Jl. M. H. Thamrin, No.2, Jakarta 10350, Indonesia
This draft: August 8, 2012
Please do not quote without the permission of the authors
Abstract
We investigate the determinants of net interest margins of Indonesian banks after the
1997/1998 financial crisis. Using data for 93 Indonesian banks over the 2001-2009 period,
we estimate an econometric model using a pooled regression as well as static and dynamic
panel regressions. Our results confirm that the structure of loan portfolios matters in the
determination of interest margins. Operating costs, market power, risk aversion and liquidity
risk have positive impacts on interest margins, while credit risk and cost to income ratio are
negatively associated with margins. Our results also corroborate the loss leader hypothesis on
cross-subsidization between traditional interest activities and non-interest activities. State-
owned banks set higher interest margins than other banks, while margins are lower for large
banks and for foreign banks.
JEL Classification: G21, G28, G32
Keywords: Bank interest margins, Financial intermediation, Small scale loans, Indonesia
1 The views expressed in this paper are the authors’ only and do not necessarily reflect those of Bank Indonesia

2
1. Introduction
It is widely known that the average net interest margin, the difference between interest
income and expenses divided by interest-earning assets, of Indonesian banks is relatively
higher than those observed in other countries particularly in the East Asia region (Rosengard
and Prasetyantoko, 2011). A number of cross country studies point out this fact. Demirgüç-
Kunt and Huizinga (1998) show that the average margins of Indonesian banks for the 1988-
1995 period was 3.6%, higher than those of neighboring countries such as Singapore (2.2%),
and Malaysia (2.7%). Using data after the 1997/1998 financial crisis from 1999 to 2008,
López-Espinosa et al. (2011) show that, in Indonesia, average bank interest margins (4.85%)
were much higher than, for example, the average interest margins of Japanese banks (1.92%).
Recently, Lin et al. (2012) have indicated that with a value of 6.36% the average bank margin
of Indonesian banks over the 1997-2005 period, was the highest compared to other Asian
countries in their sample2. Their work also shows that the interest margin of Indonesian banks
is significantly higher after the 1997/1998 crisis than before3.
The present paper extends the literature on the determinants of net interest margins by
studying Indonesian banks which have experienced a problem of persistently high net interest
margins since the 1997/1998 financial crisis. We hypothesize that the persistence of high
interest margins in Indonesia is affected by a set of simultaneous factors which are the
structure of loan portfolios, the degree of competition, the level of income diversification,
cost efficiency, bank size as well as credit risk and liquidity risk. We also assume that net
interest margins are influenced by bank ownership characteristics. To our knowledge, this
paper is the first that comprehensively studies the determinants of net interest margins in
Indonesia after the crisis. We incorporate two unique loan portfolio components, small scale
loans and property loans, as factors explaining interest margins which contextually matter in
Indonesia. Studying interest margins with regard to the ownership and governance
characteristics of banks is also important. Using pooled regression techniques as well as static
and dynamic panel regressions, we find evidence that the structure of loan portfolios do
matter in the determination of interest margins. Specifically, small scale loans contribute to
increase bank margins, whereas housing (property) loans tend to reduce interest margins.
Also, operating costs, market power, risk aversion and liquidity risk significantly and
2 We conduct our own computations using data from BankScope for banks in 9 East Asia countries from 2005 to
2009. The average margin of Indonesian banks is 5.7% far above the 3.03 % on average for the 8 other
countries. 3 López-Espinosa et al. (2011) also show that average interest margins of Indonesian banks have increased over
their sample period.

3
positively affect margins, while credit risk and cost to income ratio are negatively associated
with margins. Our results also corroborate the loss leader hypothesis on cross-subsidization
of lending and non-interest activities. Furthermore, state-owned banks have higher margins
than other banks, while foreign banks and large banks set lower margins.
The remainder of this paper is organized as follows. Section 2 reviews previous work
on related issues. In section 3, we provide some background on Indonesian banking. In
Section 4, we describe our data, variables, and empirical model. Section 5 reports the results
and robustness checks. Section 6 concludes our findings and provides policy implications.
2. Literature Review
As financial intermediary institutions, banks collect deposits from surplus spending
units with an interest cost and distribute it to deficit spending units by charging an interest
rate. Although high interest margins are associated with inefficiency (Drakos, 2003; Beck and
Hesse, 2009; López-Espinosa et al., 2011), some studies, however, use interest margins as a
measure of bank profitability (e.g. Chen and Liao, 2011). The issue of how banks set their
interest margin has been extensively studied in the literature. In a seminal paper, Ho and
Saunders (1981) introduce the dealership model in which banks perform as a risk-averse
intermediary between the demanders and suppliers of funds. Their model posits that positive
interest margins will prevail as long as banks are risk-averse agents and face uncertainty even
in a highly competitive market. They conclude that a bank's interest margin is determined by
four factors: the degree of managerial risk aversion, the size of transactions, market structure,
and the variance of the market interest rate. Many empirical studies have expanded and
examined the dealership model using cross-country data or by focusing on a single country in
the context of developed and developing countries (e.g. Angbazo, 1997; Saunders and
Schumacher, 2000; Maudos and de Guevara, 2004; Carbó and Rodriguez, 2007; Hawtrey and
Liang, 2008; Maudos and Solís, 2009; Poghosyan, 2010; Fungáčová and Poghosyan, 2011;
Lin et al., 2012). The literature has also provided theoretical microeconomic approaches to
optimal interest margin setting (Allen, 1988; Angbazo, 1997; Maudos and de Guevara, 2004;
Maudos and Solís, 2009). Another comprehensive study on the determinants of interest
margins is proposed by Beck and Hesse (2009) enlightening four major perspectives which
determine interest margins and spread: i) risk-based view concerning the compensation for
the riskiness of loans, ii) small financial system focuses on the fixed cost component of
financial service provision and the resulting scale economies, iii) market structure matters for
competitiveness and ownership structure of the banking market, iv) macroeconomic view

4
reveals that spreads and margins are affected by monetary and exchange rate policies as well
as economic cycles.
From a risk-based perspective and in line with previous studies, Beck and Hesse
(2009) argue that higher risk in bank lending contributes to positively affect margins. Under
this view, banks will charge a higher risk premium for riskier loans. Subsequently, the level
of risk compensation may depend on the structure of the loan portfolio. More specifically, in
the case of a developing country such as Uganda, Beck and Hesse (2009) find that sectoral
loan portfolio composition of banks influences the variation of margins4. In the present paper,
we consider two types of lending which may significantly contribute to determine interest
margins. Firstly, like in other developing countries, bank lending to small medium enterprises
(SMEs) is prevalent in Indonesian banks especially in domestic banks. Loans to SMEs may
require a higher risk premium because SMEs are more financially constrained than large
firms and they are relatively opaque (de la Torre et al., 2010) due to weaker or non-existent
accounting standards (Behr et al., 2011). Moreover, lending to these firms is typically costly
in the context of Indonesia (Agung et al., 2001). Secondly, we consider that the proportion of
housing (property) loans could affect the setting of interest margins. As a large market,
Indonesia has been undergoing consumption-driven economic growth. One of the drivers is
the growth of housing demand (Hoek-Smit, 2005) which subsequently leads to escalate the
demand of housing loans. This type of lending is considered as less risky because for each
loan banks hold the certificate of ownership as collateral with a value that will increase over
time under normal conditions. Moreover, the policy of the Government of Indonesia to widen
the access to housing finance for the poor imposes banks to charge a lower rate.
Ho and Saunders (1981) argue that banks facing relatively inelastic demand and
supply functions can exercise their monopoly power to set a greater margin. A number of
empirical studies have examined how market structure and banking competitive conditions
impact on interest margins5. Maudos and de Guevara (2004) find a positive effect of bank
market power estimated by the Lerner index on interest margins in the banking sectors of the
European Union. Claeys and Vennet (2008) find that a higher interest margin is associated
with a higher concentration of the banking industry in Central and Eastern European
4 Using data of Ugandan banking, they include a number of sectors which are agriculture, mining,
manufacturing, trade, transportation, construction, and other services. 5 There are two widely used methods to measure market structure and its impact on bank margins in the
literature which are the Herfindahl Hirschman Index (HHI) and the Lerner index. However, these two measures
do not necessarily reflect the same dimension. HHI measures the concentration of the industry, while the Lerner
index reflects the degree of competition as it measures the ability of a bank to influence the price of products
and is therefore directly linked to competition (Weill, 2011).

5
countries. Using data of Mexican banks, Maudos and Solís (2009) find that banks with
greater market power, measured by a Lerner index, have higher interest margins. Following
the studies of Maudos and de Guevara (2004) and Maudos and Solís (2009), we use the
Lerner index to represent the degree of competition. Banks having a greater market power are
supposed to set higher interest margins6.
All around the world banks have now become more diversified in their revenues'
sources. Deregulation and technological changes have triggered the development of non-
interest activities and reduced the importance of traditional intermediation activities (Lepetit
et al., 2008; Elsas et al., 2010). Lepetit et al. (2008) test the loss leader hypothesis contending
that the link between diversification in bank activities and interest margins could be negative
as banks might be charging a lower lending rate to attract new customers and to build long-
term relationship enabling the sales of services and higher gains from non-interest income
activities. They empirically test this hypothesis in the context of European banks. Similarly,
Maudos and Solís (2009) find that diversified banks, i.e. with a higher degree of non-interest
income, have lower interest margins. Although income diversification is also widespread in
Indonesian banks, the dependency on traditional banking activities is still prevalent as well7.
We also take into account the efficiency in the production process, bank size, risk
aversion, credit risk and liquidity risk to explain the persistence of high interest margins in
Indonesia. We follow the studies of Maudos and de Guevara (2004); Beck and Hesse (2009);
Maudos and Solís (2009); Fungáčová and Poghosyan (2011) to include operating (overhead)
costs in the determination of interest margins. Maudos and de Guevara (2004) extend the
dealership model by including operating costs to represent how efficient banks are in their
production process. The higher the ratio of operating costs to total assets, the higher the
interest margins banks set. The other proxy of efficiency is the cost to income ratio which
also measures the quality of bank management as argued by Maudos and Solís (2009) as this
ratio reflects a spent cost for a selected asset. They find that this ratio has a negative effect on
interest margins. Bank size is also included. Some empirical studies find that large banks
have lower margins because these banks may reach economies of scale enabling them to
decrease their margins (Fungáčová and Poghosyan, 2011) and they tend to grow in loans
markets with low margins (Lopez-Espinosa et al., 2011). Beck and Hesse (2009) also argue
that smaller banks may encounter higher costs and therefore set higher margins. We
6 We report in the robustness check's section the results obtained with HHI instead of the Lerner index.
7 In this paper, we show that the average diversification index is only 0.16 indicating that as a whole, Indonesian
banks are less diversified than in other countries.

6
incorporate the ratio of equity to total assets which is considered to represent the degree of
bank risk aversion (Maudos and Solís, 2009; Poghosyan, 2010). In the dealership model, Ho
and Saunders (1981) explain that higher managerial risk aversion will increase interest
margins. We follow a number of previous studies which include credit risk as a determinant
of interest margins. Regarding the effect of credit risk on bank margins, there are two
competing arguments. On the one hand, banks facing higher credit risk will charge a higher
risk premium on the loans they grant (Angbazo, 1997; Maudos and de Guevara, 2004; López-
Espinosa et al., 2011). On the other hand, as argued by Fungáčová and Poghosyan (2011)
risky banks could be punished by depositors in the form of a higher interest rate required on
deposits implying that margins should be lower for these banks. Another factor that we
consider to influence margins is liquidity risk. López-Espinosa et al. (2011) contend that the
higher opportunity cost of holding reserves as a result of higher liquid assets would decrease
net interest margins. Similar results are also found in other studies (Maudos and de Guevara,
2004; Chen and Liao, 2011).
We also question whether bank interest margins differ across ownership types. Firstly,
we consider the interest margins of state-owned (government) banks. The role of state-owned
banks in a banking system has been studied in several perspectives, particularly in the context
of developing countries in which the behaviors of these banks matter more (Micco et al.,
2007). According to social or development theory of public enterprises, these banks are often
inefficient because they play a specific role as development agencies. Sometimes they are
assigned to fund unprofitable government projects. Additionally, labor surplus could also be a
form of policy burden that should be borne by these banks to help government reduce
unemployment. Such development roles of these banks may lead them to be more costly and
in turn set higher interest margins. Another possible difference between state-owned banks
and private banks regarding margin setting could stem from implicit guarantees and too-big-
to-fail considerations. Depositors may perceive state-owned banks as less risky because they
believe that the government will rescue them if they face financial problems which mean that
these banks are perceived to have a larger implicit guarantee (Mondschean and Opiela, 1999).
Moreover, given that state-owned banks in Indonesia are mostly large banks, the too-big-to-
fail dimension should also be considered. These two factors could lead such banks to charge a
lower rate on deposits, which ultimately could spread their margins. Secondly, we examine
whether the interest margins of foreign banks are different from those of other banks. It is
generally argued that foreign banks in emerging countries have positive economic impacts on
the host country in terms of resources allocation and higher efficiency (Claessens et al.,

7
2001). Having better hard information and technology may lead these banks to perform more
efficiently than domestic banks.
Few studies examine the role of ownership in the determination of interest margins8.
Contrary to the common expectation, Drakos (2003), using data of banks in Central and
Eastern European Countries (CEECs) and the Former Soviet Union countries (FSU), finds
that state-owned banks typically set lower margins. Martinez-Peria and Mody (2004) show
that foreign banks in 5 Latin American Countries charge lower interest margins than
domestic banks. Poghosyan (2010), by considering the dealership approach, finds that foreign
bank participation does not affect interest margins in Central and Eastern European countries.
Fungáčová and Poghosyan (2011) find that in Russia, the impact of some interest margins
determinants differs across state banks, domestic private banks and foreign banks. Though
the results of previous studies on this issue are inconclusive, the unique feature of the
Indonesian banking structure is worth be considering in our investigation on the determinants
of interest margins.
3. Indonesian Banking Post-Financial Crisis
The 1997/1998 financial crisis has led to severe consequences regarding the
intermediation function of Indonesian banks. Early after the crisis, the Indonesian banking
system experienced a credit crunch phenomenon banks being reluctant to grant new loans9.
This credit crunch led to a sharp decrease in intermediation as shown by a lower ratio of
loans to deposits. Banks then charged a strangling interest rate on loans to cover their
intermediation costs. The credit crunch was considered as the factor causing the slower
process of Indonesia’s economic recovery compared to other Asian countries that have
suffered from the crisis such as South Korea and Thailand (Agung et al., 2001). To accelerate
the economic recovery, the Government of Indonesia then conducted several policies relying
on banks as the locomotive given their importance in the financial system10
. Thus, the
8 Poghosyan (2010) argues that no theoretical paper has incorporated the role of ownership in the determination
of interest margins. Moreover, he denotes that any potential impact of ownership, particularly foreign banks
versus domestic banks, have already been accounted for in the dealership model and its extension. 9 The banks' reluctance to grant loans was considered as the result of the excessive bank lending behavior during
the banking deregulation regime which amplified the impact of the financial crisis. Therefore, banks then
behaved very carefully in their lending activities. In the aftermath of the crisis, other affected countries in the
region such as Malaysia, Thailand, South Korea, and Philippines also faced the credit crunch problem (Ding et
al., 1998). Bank credit in Indonesia then continued to grow slowly due to banks being confronted with higher
credit risk, capital crunch, and lack of information regarding the quality of borrowers (Agung et al., 2001). In
2001, the average loan to deposit ratio of banks included in our sample was only 54% (more details are provided
in our descriptive statistics' tables 1 and 2). 10
The capital market and other financial intermediation institutions were still relatively underdeveloped.

8
government bolstered banks to improve their intermediation activities. Though several
improvements in the banking sector have been implemented following the institutional
reforms and economic recovery, the problem of high interest margins has been a serious
problem in this country. Regulators have paid a greater attention on this issue by issuing a
number of regulations to promote healthy competition, to improve market discipline, to boost
good governance which expectedly could decrease interest margins and subsequently
improve the efficiency of financial intermediation. Moreover, Bank Indonesia recently
released a direct regulation on prime lending rate transparency for commercial banks. This
regulation is intended to promote the transparency of banking products, including their
benefits, costs and risks. At the primary stage, this regulation is addressed for those having
assets more than 10 trillion Rupiah.
Like in other developing countries, the existence of micro, small, and medium
enterprises (MSMEs) was an important issue in Indonesia11
because of their significant
contribution to the economy in forms work force and output, high priorities given by the
government, and better response to the harmful 1997/1998 economic crisis (Hill, 2001;
Hayashi, 2002) even though they faced several problems such as access to capital markets,
and lack in technology that made them less competitive than others (Najib et al., 2011). As
the importance of MSMEs in the economy, the government encouraged banks to increase the
accessibility to financing for MSMEs12
. In 2001, Bank Indonesia issued a regulation (PBI
No: 3/2/PBI/2001) on small scale loans stating that banks were recommended to channel
small scale loans in their lending portfolio13
. Improving access of MSMEs to credit and
financing was also highlighted in the implementation plan of the Indonesian Banking
Architecture (IBA)14
.
Following the economic recovery, the Indonesian economy then consistently grew
majorly driven by consumption. This fourth most populated country in the world faced an
11
The Indonesia Statistics Bureau released data presenting that in 2007, 99.99 % of business units are micro,
small, and medium enterprises and they account for 97.3 % of the total workforce in Indonesia (Statistics of
Micro, Small and Medium Enterprises 2007-2008). 12
Agung et al. (2001) reveal that lending to SMEs in Indonesia was relatively low risk, however, banks were
still reluctant to release loans to SMEs due to the fact that loans to these firms were very costly and because
banks lacked experience in dealing with SMEs. Wattanapruttipaisan (2003) explains the factors causing the
unsuccessful small and medium enterprises (SMEs) financing in ASEAN countries, including Indonesia, after
the financial crisis that come from demand and supply sides. In the supply side, banks were reluctant to channel
loans to SMEs because they would be the major debtor that looks risky even though they could charge a high
risk premium. 13
This regulation defined small scale loan as a bank lending to borrowers for an investment and/or working
capital (productive purposes) up to 500 million Rupiah. 14
In 2004, the government introduced a concept of Indonesian Banking Architecture (IBA), a road map of the
Indonesian banking sector which would be implemented gradually.

9
escalating housing demand in line with the growth of its population which was one of the
main growth drivers. Hoek-Smit (2005) points out that the demand for new housing in
Indonesia is more than 800,000 units per year (3.5 to 3.75 %) which lead the growth in
housing (mortgage) loans to exceed growth in other types of credit. The government released
policies to ease the access to housing loans for the poor to reduce the number of homeless
people and as one of the poverty alleviation programs. The Ministry of Public Housing then
issued a regulation on the subsidy of housing loans for the poor in form of a lower-fixed
interest rate.
Indonesian banking is featured by a number of state-owned banks which are
distinguished based on which government controls the banks. Regional development banks
are owned by regional (provincial and district) governments, while state-owned banks are
controlled by the central government15
. As public enterprises, these banks are subject to
government policies. However, they also benefit from funding under the form of deposits
particularly from small depositors. Two aspects may arise regarding the intermediation cost,
i) these banks could charge a lower rate for deposits, ii) the inefficiency of these banks could
increase the overhead costs. Therefore the interest margins of state-owned banks could be
higher than those of other banks. Another issue regarding bank ownership structure is the
foreign banks' participation in this industry16
. In principle, foreign banks’ presence should
benefit the domestic market since they have a better technology that could lead them to
perform more efficiently and therefore contribute to lower the cost of intermediation.
4. Data, Variables, and Empirical Model
This study aims to investigate the factors behind the persistence of high interest
margins in Indonesian banking after the 1997/1998 financial crisis. We hypothesize that
several factors play a role in explaining the interest margins of Indonesian banks spreading
from the structure of loan portfolios, the degree of competition, the level of income
diversification, cost efficiency, bank size, risk aversion, credit risk, liquidity risk and
ownership structure.
15
Four state-owned banks in our sample are publicly traded banks. The government, however, maintains its
majority ownership. 16
Hamada (2003) shows that foreign banks’ presence in Indonesia started in 1968. However, the number of
foreign banks was stable until the deregulation of the Indonesian banking sector in 1988 which then doubled the
number of foreign banks.

10
4.1. Data and Sample
We use yearly bank-level data for the 2001–2009 period. Annual banks’ financial
reports (balance sheets and income statements) come from Bank Indonesia and Ekofin
Konsultindo. Data on the proportion of small scale loans and the proportion of property loans
are reported by banks in the additional information of their financial reports. Our sample
covers 93 commercial banks resulting in 617 bank-year observations. We end up with an
unbalanced panel because we exclude banks exhibiting negative equity value, incomplete
data for some variables and a number of outliers17
.
4.2. Variables
3.2.1 Dependent variable
- Net interest margins
The dependent variable of this study is the net interest margin (NIM) which is the
difference between interest income and interest expenses divided by interest-earning assets.
3.2.2 Independent variables
- Loan portfolio
We use two kinds of lending shares which are the proportion of small scale loans to
total loans (SMALL) and the proportion of property (housing) loans to total loans
(PROPERTY). A positive sign is expected for the small scale loans because these loans may
require a higher risk premium and these loans are costly. The coefficient of property loans is
expected to be negative as these loans are less risky. Moreover government policy could
reduce the interest rate on these loans.
- Market Power (Degree of competition)
We use a Lerner index (LERNER) to measure the degree of competition as banks
with a higher spread between price and marginal cost could be considered to have a higher
degree of monopoly power. Banks having a greater market power are supposed to set a higher
interest margins (Maudos and de Guevara, 2004; Maudos and Solís, 2009). Referring to
Koetter et al. (2012), Lerner index (LERNER) is the difference between average revenues
17
We need to eliminate banks with a negative value of equity in the computation of the Lerner index. For some
variables, especially the non-performing loans ratio, we have some missing data. Finally, we ignore extreme
observations (outliers) for all the variables, particularly for our dependent variable (net interest margins), which
in total corresponds to excluding around 5% bank-year observations.

11
(AR) and marginal costs (MC) divided by average revenues (AR) which can be written as
follow:
LERNER = (AR – MC)/AR …………………………………………………..................... (1)
To calculate the marginal costs, we employ a translog total cost function which
includes three input factors (interest on total borrowed funds, labor cost, and cost of fixed
assets), four outputs (loans, other earnings assets, total securities, and off-balance sheet
items), total equity, and time trend. The total cost function is estimated using a stochastic
frontier analysis (SFA) following the work of Koetter et al. (2012).
A positive sign is expected as banks having a greater market power can set a higher
interest margin. In addition, we report the results obtained by considering the Herfindahl
Hirschman Index (HHI) instead of the Lerner index as a robustness check.
- Diversification
We follow the method of Elsas et al. (2010) to measure the degree of bank
diversification (DIV). Basically, their diversification index is an adjusted Herfindahl-
Hirschman index. The index ranges from 0 (fully specialized bank) to 0.75 (bank with fully
balanced revenue).
The diversification index is defined as:
DIV = [1 – [(INT/REV)2 + (COM/REV)
2 + (TRAD/REV)
2 + (OTHER/REV)
2]] x 100 …..(2)
where INT is the gross interest income, COM is the commission income, TRAD represents
the trading revenue, and OTHER is other revenue. The denominator is total revenues (REV).
As argued above, we expect a negative sign for the coefficient of this variable because
more diversified banks tend to set a lower interest rate (cross subsidization strategy).
- Efficiency
First, following the studies of Maudos and de Guevara (2004), Beck and Hesse (2009)
and Maudos and Solís (2009), we include the ratio of operating costs to total assets
(OVERHEAD) to represent the efficiency of the production process. The higher the operating
costs, the higher the interest margin banks will charge. Second, the ratio of cost to gross
income (CIR) is also employed to measure the efficiency (quality) of management following

12
Maudos and Solís (2009). This ratio reflects how much management spends to obtain a unit
of income; therefore, a negative sign is expected for this ratio.
- Bank size
Bank size is measured by the natural logarithm of total assets orthogonalized with
equity (ORTHOLNTA) because of their strong correlation following the study of Barry et al.
(2011). Large banks are expected to set a lower bank margin due to economies of scale
enabling them to decrease their margins (Fungáčová and Poghosyan, 2011). Such banks have
been found to grow in loan markets with low margins (López-Espinosa et al., 2011).
- Risk aversion
The ratio of equity to total assets (EQTA) measures the degree of risk aversion as
proposed by Maudos and Solís (2009) and Poghosyan (2010). A higher degree of risk
aversion is expected to be associated to a higher interest margin set by the bank.
- Credit Risk
We measure credit risk using the ratio of non-performing loans to total loans (NPL)
following the study of Fungáčová and Poghosyan (2011). There are two competing
arguments regarding the relationship between credit risk and margins. On the one hand,
banks facing higher credit risk might charge a higher risk premium on their loans (Maudos
and de Guevara, 2004) thereby increasing interest margins. On the other hand, as argued by
Fungáčová and Poghosyan (2011) depositors might require higher interest rates on their
deposits because they feel that the bank is more risky and therefore interest margins could be
lower. Hence, the expected sign for credit risk is ambiguous.
- Liquidity Risk
The ratio of loans to deposits stands for bank liquidity risk (LDR). The higher this
ratio, the higher the liquidity risk and the lower the bank holds reserves. As argued by López-
Espinosa et al. (2011), a higher level of liquid assets would decrease net interest margins. We
therefore expect a positive sign for the coefficient of LDR.
- State-owned banks
As explained above, state-owned banks in Indonesia consist of central government-
owned banks and regional development banks. We use a dummy variable (SOB) to identify

13
the state-owned banks. These banks are expected to charge a lower rate for deposits because
they are perceived as less risky by depositors. Moreover, the development roles of these
banks may lead them to be more costly. Therefore a positive sign is expected.
- Foreign banks
Foreign banks (FOB) in Indonesia consist of branches of foreign banks, subsidiaries
of foreign banks, and joint venture banks (Hadad et al., 2011). We use a dummy variable
(FOB) to categorize foreign banks. Benefiting from better hard information and technology
may lead these banks to perform more efficiently than domestic banks. Accordingly, a
negative sign is expected.
3.2.3 Control variables
- Listed banks
Publicly traded banks are supposed to have a better monitoring and efficiency.
Therefore, we incorporate a dummy variable for listed banks (LISTED) as a control variable.
- Year dummies
We include year dummies (YEARS) in all of our regressions to capture time effects
which could matter because of time-variant macroeconomic factors as argued by Beck and
Hesse (2009).
4.3. Empirical Model
To deal with multicolinearity issues, we orthogonalize the proxy of size which is the
natural log of total assets with equity. Moreover, because our bank diversification variable is
highly correlated with the variable capturing small scale loans as well as bank size, we do not
introduce the diversification variable concomitantly to these two variables. Likewise, we do
not introduce bank size concurrently with operating costs and the cost to income ratio due to
their high correlations.
The specifications of the determinants of interest margins to be estimated are
formulated as follows:
NIMi,t = α0 + α1SMALLi,t + α2PROPERTYi,t + α3LERNERi,t + α4OVERHEADi,t + α5CIRi,t +
α6EQTAi,t + α7NPLi,t + α8LDRi,t + α9SOBi + α10FOBi + α11LISTEDi,t + YEARS + εi,t
……………………………………………………………………………………………….. (3)

14
NIMi,t = α0 + α1SMALLi,t + α2PROPERTYi,t + α3LERNERi,t + α4ORTHOLNTAi,t + α5EQTAi,t
+ α6NPLi,t + α7LDRi,t + α8SOBi + α9FOBi + α10LISTEDi,t + YEARS + εi,t
……………………………......................................................................................... (4)
NIMi,t = α0 + α1PROPERTYi,t + α2LERNERi,t + α3DIVi,t + α4OVERHEADi,t + α5CIRi,t +
α6EQTAi,t + α7NPLi,t + α8LDRi,t + α9SOBi + α10FOBi + α11LISTEDi,t + YEARS + εi,t
……………………………………………………………………………………………….. (5)
where i, t represent bank and time, respectively. NIM is the net interest margin. SMALL and
PROPERTY are the proportion of small scale loans to total loans and the proportion of
property (housing) loans to total loans, respectively. LERNER is the Lerner index. DIV is the
bank diversification index. OVERHEAD is the ratio of operating costs to total assets, while
CIR denotes the cost to income ratio. ORTHOLNTA is the natural logarithm of total assets
orthogonalized with equity. EQTA is the ratio of equity to total assets. NPL is the ratio of
non-performing loans to total loans. LDR stands for the loans to deposits ratio. SOB is a
dummy taking value 1 for state-owned banks. FOB is a dummy taking value 1 for foreign-
banks. LISTED is a dummy taking value 1 for publicly traded banks. YEARS represents a
vector of year (time) dummies. We estimate the empirical model in equation 3 using pooled
and static panel regressions.
Carbó and Rodriguez (2007), and Maudos and Solís (2009) consider that bank interest
margins is influenced by their previous values given the fact that banks have to match across
periods the deposits and lending which are randomly determined as well as non-interest
activities. Therefore, they argue that the determination of interest margins should also be
tested using a dynamic panel method. Hence, we also estimate a dynamic panel data model
employing a two-step Generalized Method of Moments/ GMM estimator18
. The equations
can be written as follows:
NIMi,t = α0 + α1NIMi,t-1 + α2SMALLi,t + α3PROPERTYi,t + α4LERNERi,t + α5OVERHEADi,t +
α6CIRi,t + α7EQTAi,t + α8NPLi,t + α9LDRi,t + α10SOBi + α11FOBi + α12LISTEDi,t +
YEARS + εi,t …………………………….................................................................... (6)
NIMi,t = α0 + α1NIMi,t-1 + α2SMALLi,t + α3PROPERTYi,t + α4LERNERi,t + α5ORTHOLNTAi,t
+ α6EQTAi,t + α7NPLi,t + α8LDRi,t + α9SOBi + α10FOBi + α11LISTEDi,t + YEARS
+ εi,t ……………………………................................................................................ (7)
18
We use a two-step GMM estimator, particularly the System GMM proposed by Arellano and Bover (1995)
and Blundell and Bond (1998) which extends the standard GMM of Arellano and Bond (1991). The System
GMM estimator uses both first-differences and levels.

15
NIMi,t = α0 + α1NIMi,t-1 + α2PROPERTYi,t + α3LERNERi,t + α4DIVi,t + α5OVERHEADi,t +
α6CIRi,t + α7EQTAi,t + α8NPLi,t + α9LDRi,t + α10SOBi + α11FOBi + α12LISTEDi,t +
YEARS + εi,t …………………………….................................................................... (8)
5. Results
5.1. Descriptive Statistics
Table 1 presents the descriptive statistics for the variables of our full sample and the
sub-samples by ownership type (state-owned banks, foreign banks, and private-domestic
banks), while table 2 reports the statistics year by year. The dependent variable (NIM) has a
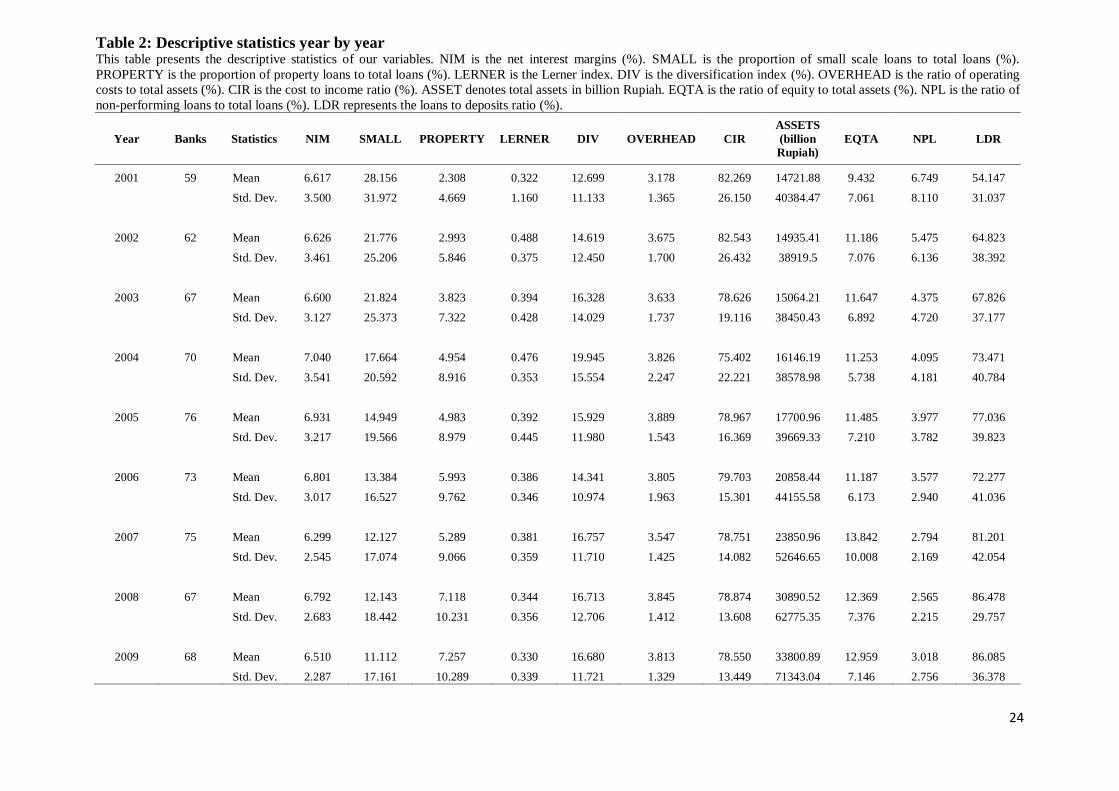
mean (median) of 6.61% (5.91%). As shown in table 2, the yearly average interest margins of
Indonesian banks are persistently high during the period we study. The means (medians) of
the proportion of small scale loans and the proportion of property loans are 16.33% (7.78%)
and 4.98% (0.77%) respectively. The mean (median) of Lerner index is 0.393 (0.369), while
the average (median) of the diversification index is 16.61% (11.51%). The ratio of overhead
costs to total assets has an average (median) of 3.73% (3.61%), whereas the cost to income
ratio has a mean (median) of 79.48% (80.25%). The average size (total assets) is 20,593.86
billion Rupiah. The smallest bank has assets of 52.65 billion Rupiah, while 370,000 billion
Rupiah is the total assets of the largest bank. 11.76% (9.73%) is the average (median) of the
ratio of equity to total assets. The mean (median) of the ratio of non-performing loans to total
loans is 4% (2.8%). The average (median) of the loans to deposits ratio in our sample is
74.18% (69.78%).
-----------------------------
Insert Table 1 here
-----------------------------
-----------------------------
Insert Table 2 here
-----------------------------
5.2. Correlation Matrix
Table 3 reports the correlation matrix between variables of this study. The correlations
between the dependent variable (interest margin) and the explanatory variables are shown in
the first column of the table. As expected, net interest margins (NIM) is found to be
positively correlated with small scale loans, the Lerner index, the ratio of overhead costs to
total assets, and the ratio of equity to total assets. We observe, as expected, negative

16
correlations between NIM and property loans, diversification, the cost to income ratio, as
well as between NIM and size. The ratio of non-performing loans to total loans and the loans
to deposits ratio are found to be negatively correlated with NIM.
-----------------------------
Insert Table 3 here
-----------------------------
5.3. Regressions
We analyze the determinants of interest margins of Indonesian banks by employing
pooled regression and static panel regression techniques, as well as a two-step GMM
estimator. Table 4 presents the regression results of pooled regression (column 1, 2 and 3),
random effect panel data (column 4, 5 and 6), and two-step GMM estimation (column 7, 8
and 9). The Wald test, the Sargan test, and the Arellano-Bond test (autocorrelation) of the
GMM estimation meet the requirements. The Wald test in the random effect model is found
to satisfy the requirement as well.
-----------------------------
Insert Table 4 here
-----------------------------
As expected, we find a positive and significant impact of small scale loans (SMALL)
on interest margins (NIM) in all models. Banks with a greater proportion of small scale loans
in their loan portfolio set a higher interest margin. In the pooled regression, the ratio of
property loans to total loans (PROPERTY), as expected, has a negative effect on interest
margins. However, the coefficient of this variable is not significant in the random effect panel
data and GMM estimations. In line with Beck and Hesse (2009), the results suggest that the
structure of bank loan portfolios matters in the determination of interest margins. Banks set a
higher interest margin if they are more exposed to riskier loans.
As shown in all models, we confirm the findings of Maudos and de Guevara (2004),
and Maudos and Solís (2009) that market power, measured by Lerner index (LERNER), is
positively associated with interest margins. Banks set a higher interest margins when they
face relatively inelastic demand and supply functions in the markets enabling them to
exercise their monopoly power (Ho and Saunders, 1981).
Our results is consistent with the loss leader hypothesis on the cross-subsidization
strategy of income diversification (Lepetit et al., 2008; Maudos and Solís, 2009), as shown by
the negative coefficients of the diversification index (DIV) in all regression models. More

17
diversified banks charge a lower interest rate as they are able to gain a higher income from
non-interest activities because the lower rate might attract new clients to the banks. Such
clients are expected to buy fee generating services from the bank. Subsequently, more
diversified banks have a lower interest margin.
We find that the ratio of overhead costs to total assets (OVERHEAD) is positively and
significantly associated with interest margins using all methods. These results confirm the
findings of Beck and Hesse (2009) and Maudos and Solís (2009) as well as the extension of
the dealership model proposed by Maudos and de Guevara (2004) which includes operating
costs to represent how efficient banks are in their production process. As expected, the
second proxy of efficiency which is the cost to income ratio (CIR) has a negative impact on
interest margins using all methods. This result confirms the finding of Maudos and de
Guevara (2004), Maudos and Solís (2009) and Lopez-Espinosa et al. (2011).
Strong evidence is also found regarding the negative effect of bank size, measured by
the natural logarithm of total assets orthogonalized with equity (ORTHOLNTA) on interest
margins. This negative impact confirms the hypothesis that large banks achieve economies of
scale that can decrease their margins (Beck and Hesse, 2009; Fungáčová and Poghosyan,
2011). The ratio of equity to total assets (EQTA) which is a proxy of risk aversion has a
positive and significant coefficient in all the regressions. In line with the dealership model
(Ho and Saunders, 1981) higher managerial risk aversion will increase interest margins. This
result is similar to those of previous studies such as Maudos and Solís (2009), Poghosyan
(2010).
Our results show that credit risk, measured by the ratio of non-performing loans to total
loans (NPL), has a negative and significant effect on interest margins in the pooled and
random effect regression models which confirm the finding of Fungáčová and Poghosyan
(2011). The results are also in line with the findings of Hadad et al., (2011) that in Indonesia
market discipline by depositors is pronounced in the price of deposits. Depositors require a
higher interest rate on deposits for riskier banks. The loans to deposits ratio (LDR) as the
proxy of liquidity risk has a positive impact on bank margins using all regression methods.
The results are consistent with the findings of Maudos and de Guevara (2004), López-
Espinosa et al. (2011), Chen and Liao (2011). More liquid banks (banks with lower liquidity
risk) with higher opportunity cost have lower interest margins.
Regarding the influence of bank ownership, in all our models, the coefficient of the
dummy for state-owned banks (SOB) exhibits a positive and significant sign. The results
show that state-owned banks set a higher interest margin than other banks. There are a

18
number of possible explanations for such a result. First, as they are perceived less risky by
depositors because of implicit guarantee and too-big-to-fail considerations, specifically by a
large number of small depositors, they can easily obtain resources under the form deposits
with a lower cost than other funds. Second, as explained by Rosengard and Prasetyantoko
(2011), the higher interest margins of Indonesian state-owned banks (both provincial and
central) are mainly driven inefficiency considerations. Third, labor surplus in these banks
may contribute to increase the operating costs which subsequently lead them to increase their
margins.
The coefficient of the dummy for foreign banks (FOB) is found to be negative and
significant in all models. The results are consistent with those of previous studies such as
Martinez-Peria and Mody (2004) in which foreign banks are found to charge a lower interest
margin than domestic banks. This evidence may result from the better hard information and
technology from which foreign banks benefit which in turn enables them to perform more
efficiently than domestic banks.
Finally, we find little evidence on the difference regarding interest margins between
listed (LISTED) and non-listed banks in all models.
5.4. Robustness Checks
We conduct several robustness checks. Firstly, we follow the method of Maudos and de
Guevarra (2004) by replacing the Lerner index by the Herfindahl Hirschman Index (HHI),
calculated on the basis of total assets, as a measure of banking market structure. As expected,
the coefficient of HHI is positive and significant in some models, while the results for the
other variables are stable (the results are presented in table 5).
-----------------------------
Insert Table 5 here
-----------------------------
Secondly, we exclude the dummy for state-owned banks (SOB), the dummy for foreign
banks (FOB), and the dummy for listed banks (LISTED) to enable us to test the empirical
model using fixed-effect panel data techniques. For all the remaining variables, except for the
Lerner index, the results are similar to those of the random effect regressions presented in
column 4 - 6 of table 4 although the effect of the Lerner index is slightly weaker but still
significant.

19
6. Conclusion and Policy Implications
We analyze the determinants of net interest margins in Indonesia after the 1997/1998
financial crisis. We use data of 93 commercial banks over the 2001-2009 period. We estimate
the empirical model using pooled regression techniques as well as static and dynamic panel
methods.
We confirm that the structure of loan portfolio matters in the determination of interest
margins. In the context of Indonesian banking, small scale loans contribute to increase bank
margins, whereas housing (property) loans reduce interest margins. Our results also show that
Indonesian banks with a greater market power set higher interest margins. Furthermore, we
also corroborate the loss leader hypothesis on cross-subsidization of lending and non-interest
activities. The results also validate that higher margins are driven by higher operating costs,
higher risk aversion and higher liquidity risk. Consistent with previous literature the cost to
income ratio is also found to negatively affect intermediation margins. We also find that
credit risk has a negative impact on bank margins. Strong evidence is found that large banks
set lower interest margins.
We then turn our analysis to the role of ownership as a determinant of interest margins.
Considering whether there is a difference in interest margins between state-owned
(government) banks and private banks, we find that the latter have lower margins. Our
findings also confirm that foreign banks are beneficial to the banking sector and the economy
as a whole as they charge lower margins.
These empirical results have several noteworthy policy implications. Firstly, we show
that banks with a higher market power “enjoy” higher interest margins. Therefore, promoting
a more healthy banking competition should be pursued by regulators to specifically improve
transparency and disclosure on banking products. Secondly, the regulation on the
transparency of the prime lending rate has been released by the Bank Indonesia in March
2011 but only for corporate, retail, housing and consumption loans. Extending the regulation
on prime lending rates to include loans to MSMEs should be strongly recommended. Thirdly,
the positive impact of small scale loans on interest margins may come from the fact that loans
to micro, small and medium enterprises require a higher risk premium. Imposing on banks
that they charge a lower rate on these loans may not be a proper answer as these loans are
costly and riskier. Regulators should therefore direct banks to appropriately estimate risk

20
premia on loans to MSMEs, for instance by using credit scoring systems. Lastly, Regulators
need to bring banks to perform more efficiently.
References
Agung, J., Kusmiarso, B., Pramono, B., Hutapea, E.G., Prasmuko, A., Prastowo, N.J., 2001.
Credit crunch in Indonesia in the aftermath of the crisis: Facts, causes and policy
implications. Policy paper, Directorate of Economic Research and Monetary Policy,
Bank Indonesia.
Angbazo, L., 1997. Commercial bank net interest margins, default risk, interest rate risk and
off-balance sheet banking. Journal of Banking & Finance 21, 55–87.
Allen, L., 1988. The determinants of bank interest margins: a note. Journal of Financial and
Quantitative Analysis 23, 231–235.
Arellano, M., Bond, S., 1991. Some tests of specification for panel data: Monte Carlo
evidence and an application to employment equations. Reviews of Economic Studies
58, 277–297.
Arellano, M., Bover, O., 1995. Another look at the instrumental variable estimation of error-
component models. Journal of Econometrics 68, 29–51.
Barry, T.A., Lepetit, L., Tarazi, A., 2011. Ownership structure and risk in publicly held and
privately owned banks. Journal of Banking & Finance 35, 1327–1340.
Beck, T., Hesse, H., 2009. Why are interest spreads so high in Uganda? Journal of
Development Economics 88, 192–204.
Behr, P., Entzian, A., Güttler, A., 2011. How do lending relationships affect access to credit
and loan conditions in microlending? Journal of Banking & Finance 35, 2169–2178.
Blundell, R. and S. Bond., 1998. Initial conditions and moment restrictions in dynamic panel
data models. Journal of Econometrics 87, 115-143.
Carbó Valverde, S., Rodriguez Fernandez, F., 2007. The determinants of bank margins in
European banking. Journal of Banking & Finance 31, 2043–2063.
Chen, S-H., Liao, C-C., 2011. Are foreign banks more profitable than domestic banks?
Home- and host-country effects of banking market structure, governance, and
supervision. Journal of Banking & Finance 35, 819–839.
Claessens, S., Kunt, D., Huizinga, H., 2001. How does foreign entry affect domestic banking
markets? Journal of Banking & Finance 25, 891-911.
Claeys, S., Vennet, R.V., 2008. Determinants of bank interest margins in Central and Eastern
Europe: A comparison with the West. Economic Systems 32, 197–216

21
De la Torre, A., Martínez Pería, M.S., Schmukler, S.L., 2010. Bank involvement with SMEs:
Beyond relationship lending. Journal of Banking & Finance 34, 2280–2293.
Demirgüç-Kunt, A., Huizinga, H., 1998. Determinants of commercial bank interest margins
and profitability: some international evidence. World Bank Policy Research Working
Paper 1900.
Ding, W., Domac, I., Ferri., G., 1998. Is there a credit crunch in East Asia? World Bank
Policy Research Working Paper No. 1959.
Drakos, K., 2003. Assessing the success of reform in transition banking 10 years later: an
interest margins analysis. Journal of Policy Modeling 25, 309–317.
Elsas, R., Hackethal, A., Holzhäuser, M., 2010. The anatomy of bank diversification. Journal
of Banking & Finance 34, 1274–1287.
Fungáčová, Z., Poghosyan, T., 2011. Determinants of bank interest margins in Russia: Does
bank ownership matter? Economic Systems 35, 481–495.
Hadad, M.D., Agusman, A., Monroe, G.S., Gasbarro, D., Zumwalt, J.K., 2011. Market
discipline, financial crisis and regulatory changes: Evidence from Indonesian banks.
Journal of Banking & Finance 35, 1552–1562.
Hamada, M., 2003. Transformation of the financial sector in Indonesia. IDE Research Paper
No. 6.
Hawtrey, K., Liang, H., 2008. Bank interest margins in OECD countries. North American
Journal of Economics and Finance 19, 249–260.
Hayashi, M., 2002. The role of subcontracting in SME development in Indonesia: Micro-
level evidence from the metalworking and machinery industry. Journal of Asian
Economics 13, 1-26.
Hill, H., 2001. Small and medium enterprises in Indonesia: Old policy challenges for a new
administration. Asian Survey 41, 248-270.
Ho, T., Saunders, A., 1981. The determinants of bank interest margins: theory and empirical
evidence. Journal of Financial and Quantitative Analysis 16, 581–600.
Hoek-Smit, M.C., 2005. The housing finance sector in Indonesia. Working Paper, The
Housing Finance Business Group, World Bank.
Koetter, M., Kolari, J.W., Spierdijk, J., 2012. Enjoying the quiet life under deregulation?
Evidence from adjusted lerner indices for U.S. banks. Review of Economics and
Statistics 94, 462-480.
Lin, J-R., Chung, H., Hsieh, M-H., Wu, S., 2012. The determinants of interest margins and
their effect on bank diversification: Evidence from Asian banks. Journal of Financial
Stability 8, 96– 106.

22
Lepetit, L., Nys, E., Rous, P., Tarazi, A., 2008. The expansion of services in European
banking: implications for loan pricing and interest margins. Journal of Banking &
Finance 32, 2325–2335.
López-Espinosa, G., Moreno, A., de Gracia, F.P., 2011. Banks’ net interest margin in the
2000s: A macro-accounting international perspective. Journal of International Money
and Finance 30, 1214–1233.
Martinez Peria, M., Mody, A., 2004. How foreign participation and market concentration
impact bank spreads: evidence from Latin America. Journal of Money Credit and
Banking 36, 511–537.
Maudos, J., de Guevara, J.F., 2004. Factors explaining the interest margin in the banking
sectors of the European Union. Journal of Banking & Finance 28, 2259–2281.
Maudos, J., Solís, L., 2009. The determinants of net interest income in the Mexican banking
system: an integrated model. Journal of Banking & Finance 33, 1920–1931.
Micco, A., Panizza, U., Yanez, M., 2007. Bank ownership and performance. Does politics
matter? Journal of Banking & Finance 31, 219–241.
Mondscean, T.S, Opiela, T.P., 1999. Bank time deposit rates and market discipline in Poland:
The impact of state ownership and deposit insurance reform. Journal of Financial
Services Research 15, 179-196.
Najib M., Kiminami, A. Yagi, H., 2011. Competitiveness of Indonesian small and medium
food processing industry: Does the location matter? International Journal of Business
and Management 6, 57-67.
Poghosyan, T., 2010. Re-examining the impact of foreign bank participation on interest
margins in emerging markets. Emerging Markets Review 11, 390–403.
Rosengard, J.K., Prasetyantoko, A., 2011. If the banks are doing so well, why can’t I get a
loan? Regulatory constraints to financial inclusion in Indonesia. Asian Economic
Policy Review 6, 273–296.
Saunders, A., Schumacher, L., 2000. The determinants of bank interest rate margins: an
international study. Journal of International Money and Finance 19, 813–832.
Wattanapruttipaisan, T., 2003. Four proposals for improved financing of SME development
in ASEAN. Asian Development Review 20, 66-104.
Weill, L., 2011. Do Islamic banks have greater market power? Comparative Economic
Studies 53, 291–306.

23
Table 1: Descriptive Statistics – based on ownership type This table presents the descriptive statistics of our variables. NIM is the net interest margins (%). SMALL is the proportion of small scale loans to total loans (%). PROPERTY is the
proportion of property loans to total loans (%). LERNER is the Lerner index. DIV is the diversification index (%). OVERHEAD is the ratio of operating costs to total assets (%). CIR is
the cost to income ratio (%). ASSET denotes total assets in billion Rupiah. EQTA is the ratio of equity to total assets (%). NPL is the ratio of non-performing loans to total loans (%). LDR
represents the loans to deposits ratio (%).
Sample Banks Statistics NIM SMALL PROPERTY LERNER DIV OVERHEAD CIR
ASSETS
(billion
Rupiah)
EQTA NPL LDR
Full Sample 617 Mean 6.693 16.697 5.037 0.391 16.068 3.700 79.205 21003.25 11.760 3.999 74.181
Median 5.980 8.030 0.786 0.366 11.301 3.616 80.144 4070.27 9.729 2.800 69.781
Maximum 16.640 100.000 53.610 2.208 57.349 16.729 219.940 370000 51.069 44.000 313.446
Minimum -0.650 0.000 0.000 -7.930 0.864 0.195 21.850 52.65 0.466 0.010 5.104
Std. Dev. 3.046 22.039 8.722 0.507 12.609 1.668 18.846 49010.14 7.348 4.519 38.775
Skewness 0.828 1.971 2.771 -7.020 1.324 1.319 1.710 4.08189 1.940 3.443 2.133
State-owned 207 Mean 9.109 31.901 4.568 0.535 10.299 4.265 76.575 32029.3 9.077 3.165 60.772
Banks
Median 9.230 21.370 0.328 0.547 8.392 4.403 76.570 4566.6 8.656 2.010 56.458
Maximum 16.640 100.000 53.610 0.995 31.043 7.589 108.290 370000 19.274 26.660 129.593
Minimum 0.900 0.000 0.000 -0.075 2.573 0.958 38.920 208.62 3.133 0.090 10.037
Std. Dev. 3.097 27.435 10.700 0.260 5.973 1.456 9.561 71330.99 3.137 3.433 25.996
Skewness 0.095 1.091 3.302 -0.140 1.347 -0.091 -0.370 2.836817 0.833 3.189 0.341
Foreign Banks 127 Mean 4.741 0.302 1.129 0.484 33.237 2.711 65.700 10907.23 15.216 5.948 111.844
Median 4.390 0.000 0.000 0.507 35.386 2.509 63.620 5509.92 14.520 4.090 98.983
Maximum 10.000 13.000 19.765 1.991 57.349 8.537 219.000 52329.46 40.872 44.000 313.446
Minimum 1.470 0.000 0.000 -0.997 6.865 0.195 21.850 410.01 0.466 0.100 22.466
Std. Dev. 1.653 1.462 3.046 0.468 13.682 1.507 24.910 11548.69 9.013 6.132 57.073
Skewness 0.824 6.582 4.058 -0.435 -0.250 0.862 2.318 1.546831 0.211 2.766 1.365
Private
Domestic 283 Mean 5.802 12.933 7.134 0.243 12.583 3.730 87.190 17468.99 12.170 3.735 67.087
Banks
Median 5.570 7.310 4.869 0.187 10.124 3.529 86.930 2403.2 9.866 2.750 68.753
Maximum 15.100 81.130 41.081 2.208 43.298 16.729 219.940 281000 51.069 29.020 152.650
Minimum -0.650 0.010 0.000 -7.930 0.864 1.012 34.450 52.65 1.301 0.010 5.104
Std. Dev. 2.291 14.328 8.181 0.611 8.259 1.683 16.752 36370.19 7.976 4.113 22.667
Skewness 0.957 2.167 1.422 -8.159 1.118 2.662 3.180 3.953469 2.350 3.597 -0.128
24
Table 2: Descriptive statistics year by year This table presents the descriptive statistics of our variables. NIM is the net interest margins (%). SMALL is the proportion of small scale loans to total loans (%).
PROPERTY is the proportion of property loans to total loans (%). LERNER is the Lerner index. DIV is the diversification index (%). OVERHEAD is the ratio of operating
costs to total assets (%). CIR is the cost to income ratio (%). ASSET denotes total assets in billion Rupiah. EQTA is the ratio of equity to total assets (%). NPL is the ratio of
non-performing loans to total loans (%). LDR represents the loans to deposits ratio (%).
Year Banks Statistics NIM SMALL PROPERTY LERNER DIV OVERHEAD CIR
ASSETS
(billion
Rupiah)
EQTA NPL LDR
2001 59 Mean 6.617 28.156 2.308 0.322 12.699 3.178 82.269 14721.88 9.432 6.749 54.147
Std. Dev. 3.500 31.972 4.669 1.160 11.133 1.365 26.150 40384.47 7.061 8.110 31.037
2002 62 Mean 6.626 21.776 2.993 0.488 14.619 3.675 82.543 14935.41 11.186 5.475 64.823
Std. Dev. 3.461 25.206 5.846 0.375 12.450 1.700 26.432 38919.5 7.076 6.136 38.392
2003 67 Mean 6.600 21.824 3.823 0.394 16.328 3.633 78.626 15064.21 11.647 4.375 67.826
Std. Dev. 3.127 25.373 7.322 0.428 14.029 1.737 19.116 38450.43 6.892 4.720 37.177
2004 70 Mean 7.040 17.664 4.954 0.476 19.945 3.826 75.402 16146.19 11.253 4.095 73.471
Std. Dev. 3.541 20.592 8.916 0.353 15.554 2.247 22.221 38578.98 5.738 4.181 40.784
2005 76 Mean 6.931 14.949 4.983 0.392 15.929 3.889 78.967 17700.96 11.485 3.977 77.036
Std. Dev. 3.217 19.566 8.979 0.445 11.980 1.543 16.369 39669.33 7.210 3.782 39.823
2006 73 Mean 6.801 13.384 5.993 0.386 14.341 3.805 79.703 20858.44 11.187 3.577 72.277
Std. Dev. 3.017 16.527 9.762 0.346 10.974 1.963 15.301 44155.58 6.173 2.940 41.036
2007 75 Mean 6.299 12.127 5.289 0.381 16.757 3.547 78.751 23850.96 13.842 2.794 81.201
Std. Dev. 2.545 17.074 9.066 0.359 11.710 1.425 14.082 52646.65 10.008 2.169 42.054
2008 67 Mean 6.792 12.143 7.118 0.344 16.713 3.845 78.874 30890.52 12.369 2.565 86.478
Std. Dev. 2.683 18.442 10.231 0.356 12.706 1.412 13.608 62775.35 7.376 2.215 29.757
2009 68 Mean 6.510 11.112 7.257 0.330 16.680 3.813 78.550 33800.89 12.959 3.018 86.085
Std. Dev. 2.287 17.161 10.289 0.339 11.721 1.329 13.449 71343.04 7.146 2.756 36.378

25
Table 3: Correlation Matrix This table presents the pairwise correlation between the variables used in this study. NIM is the net interest margins (%). SMALL is the proportion of small scale loans to
total loans (%). PROPERTY is the proportion of property loans to total loans (%). LERNER is the Lerner index. DIV is the diversification index (%). OVERHEAD is the
ratio of operating costs to total assets (%). CIR is the cost to income ratio (%). ORTHOLNTA denotes the natural logarithm of total assets orthogonalized with equity.
EQTA is the ratio of equity to total assets (%). NPL is the ratio of non-performing loans to total loans (%). LDR represents the loans to deposits ratio (%).
NIM SMALL PROPERTY LERNER DIV OVERHEAD CIR ORTHOLNTA EQTA NPL LDR
NIM 1
SMALL 0.384 1
PROPERTY -0.165 -0.025 1
LERNER 0.192 0.069 -0.082 1
DIV -0.400 -0.378 -0.059 0.122 1
OVERHEAD 0.339 0.178 -0.053 -0.032 -0.081 1
CIR -0.158 0.108 0.055 -0.207 -0.116 0.176 1
ORTHOLNTA -0.182 -0.276 0.200 0.137 0.359 -0.331 -0.318 1
EQTA 0.124 -0.081 -0.086 -0.014 -0.085 0.005 -0.196 0.000 1
NPL -0.251 -0.082 -0.044 0.044 0.274 -0.023 0.226 -0.003 0.007 1
LDR -0.035 -0.222 -0.071 -0.034 0.138 -0.011 -0.057 0.100 0.302 0.068 1

26
Table 4: Regressions results This table presents the results of pooled regression (column 1, 2 and 3), random effect panel data (column 4, 5 and 6), and two-step GMM estimation (column 7, 8 and 9). The dependent
variable is net interest margins (NIM, presenting in percentage). SMALL is the proportion of small scale loans to total loans (%). PROPERTY is the proportion of property loans to total loans
(%). LERNER is the Lerner index. DIV is the diversification index (%). OVERHEAD is the ratio of operating costs to total assets (%). CIR is the cost to income ratio (%). ORTHOLNTA
denotes the natural logarithm of total assets orthogonalized with equity. EQTA is the ratio of equity to total assets (%). NPL is the ratio of non-performing loans to total loans (%). LDR
represents the loans to deposits ratio (%). SOB is the dummy variable for state-owned banks. FOB represents the dummy variable for foreign banks. LISTED is the dummy variable for
publicly traded banks. The values in parentheses are standard errors. ∗, ∗∗ and *** indicate significance at the 10%, 5%, and 1% levels, respectively.
Dependent Variable: Net Interest Margin (NIM)
Pooled Random Effect GMM
1 2 3 4 5 6 7 8 9
NIM (t-1)
0.378*** 0.419*** 0.387***
(0.030) (0.042) (0.030)
SMALL 0.010** 0.008*
0.013*** 0.010**
0.009** 0.007
(0.004) (0.005)
(0.004) (0.005)
(0.004) (0.005)
PROPERTY -0.038*** -0.041*** -0.035*** -0.014 0.003 -0.013 -0.002 0.013 -0.001
(0.009) (0.011) (0.009) (0.012) (0.014) (0.012) (0.014) (0.015) (0.013)
LERNER 0.555*** 0.858*** 0.611*** 0.284** 0.260** 0.298** 0.401** 0.549*** 0.445**
(0.149) (0.182) (0.146) (0.124) (0.131) (0.123) (0.168) (0.202) (0.174)
DIV
-0.050***
-0.047***
-0.017**
(0.009)
(0.010)
(0.008)
OVERHEAD 0.839***
0.861*** 0.554***
0.580*** 0.379***
0.378***
(0.048)
(0.047) (0.051)
(0.050) (0.070)
(0.072)
CIR -0.049***
-0.054*** -0.035***
-0.038*** -0.026***
-0.027***
(0.005)
(0.005) (0.005)
(0.005) (0.004)
(0.004)
ORTHOLNTA
-0.268***
-0.485***
-0.412**
(0.075)
(0.120)
(0.204)
EQTA 0.059*** 0.095*** 0.050*** 0.069*** 0.112*** 0.068*** 0.060*** 0.090*** 0.062***
(0.012) (0.013) (0.011) (0.013) (0.015) (0.013) (0.009) (0.014) (0.009)
NPL -0.053*** -0.113*** -0.030 -0.042** -0.078*** -0.027 -0.027** -0.059*** -0.021
(0.019) (0.021) (0.019) (0.017) (0.016) (0.017) (0.012) (0.018) (0.013)
LDR 0.004* 0.006** 0.002 0.005** 0.006** 0.004* 0.009*** 0.011*** 0.008***
(0.002) (0.003) (0.002) (0.002) (0.003) (0.002) (0.002) (0.003) (0.002)
SOB 2.004*** 3.167*** 2.065*** 2.631*** 3.865*** 2.754*** 0.883*** 1.677*** 0.999***
(0.205) (0.259) (0.191) (0.361) (0.473) (0.335) (0.309) (0.342) (0.294)

27
Table 4. (Continued)
1 2 3 4 5 6 7 8 9
FOB -1.799*** -1.547*** -0.808** -1.596*** -0.901* -0.762* -1.517*** -0.200 -1.112**
(0.269) (0.334) (0.323) (0.416) (0.334) (0.443) (0.486) (0.670) (0.529)
LISTED -0.178 -0.058 0.086 -0.038 0.361 0.088 -0.436** 0.008 -0.341
(0.207) (0.306) (0.209) (0.284) (0.344) (0.279) (0.215) (0.258) (0.218)
Year dummies Included Included Included Included Included Included Included Included Included
Constant Included Included Included Included Included Included Included Included Included
Method Pooled Pooled Pooled
Panel
(Random
effect/GLS)
Panel
(Random
effect/GLS)
Panel
(Random
effect/GLS)
GMM GMM GMM
Observations 617 617 617 617 617 617 554 554 554
Overall R-squared 0.678 0.510 0.692 0.647 0.478 0.663
R-Squared between
0.728 0.560 0.752
R-Squared within
0.271 0.171 0.281
Wald Test
chi2(19)=
462.59
(0.000)***
chi2(18)=
227.40
(0.000)***
chi2(19)=
513.87
(0.000)***
chi2(19)=
881.34
(0.000)***
chi2(18)=
842.04
(0.000)***
chi2(19)=
953.44
(0.000)***
Sargan Test
chi2(32)=
38.45 (0.201)
chi2(32)=
38.45 (0.201)
chi2(32)=
39.08 (0.181)
Arellano–Bond test
for AR(1)
N(0, 1)=
-3.341
(0.001)***
N(0, 1)=
-3.495
(0.000)***
N(0, 1)=
-3.376
(0.001)***
Arellano–Bond test
for AR(2)
N(0, 1)=
-0.029
(0.977)
N(0, 1)=
-0.902
(0.367)
N(0, 1)=
-0.030
(0.976)

28
Table 5: Robustness Check – alternative measure of market structure This table presents the results of pooled regression (column 1, 2 and 3), random effect panel data (column 4, 5 and 6), and two-step GMM estimation (column 7, 8 and 9). The dependent
variable is net interest margins (NIM, presenting in percentage). SMALL is the proportion of small scale loans to total loans (%). PROPERTY is the proportion of property loans to total loans
(%). HHI is the Herfindahl Hirschman Index. DIV is the diversification index (%). OVERHEAD is the ratio of operating costs to total assets (%). CIR is the cost to income ratio (%).
ORTHOLNTA denotes the natural logarithm of total assets orthogonalized with equity. EQTA is the ratio of equity to total assets (%). NPL is the ratio of non-performing loans to total loans
(%). LDR represents the loans to deposits ratio (%). SOB is the dummy variable for state-owned banks. FOB represents the dummy variable for foreign banks. LISTED is the dummy variable
for publicly traded banks. The values in parentheses are standard errors. ∗, ∗∗ and *** indicate significance at the 10%, 5%, and 1% levels, respectively.
Dependent Variable: Net Interest Margin (NIM)
Pooled Random Effect GMM
1 2 3 4 5 6 7 8 9
NIM (t-1)
0.407*** 0.449*** 0.419***
(0.030) (0.040) (0.031)
SMALL 0.010** 0.009*
0.013*** 0.010**
0.008* 0.007
(0.004) (0.005)
(0.004) (0.005)
(0.004) (0.005)
PROPERTY -0.039*** -0.044*** -0.037*** -0.015 0.004 -0.013 -0.001 0.016 -0.001
(0.009) (0.011) (0.009) (0.012) (0.014) (0.012) (0.014) (0.015) (0.014)
HHI 0.114 -0.021 0.097 0.172** -0.012 0.181** 0.092* -0.021 0.114**
(0.078) (0.097) (0.076) (0.070) (0.082) (0.068) (0.049) (0.066) (0.049)
DIV
-0.048***
-0.047***
-0.014*
(0.009)
(0.010)
(0.008)
OVERHEAD 0.844***
0.866*** 0.549***
0.571*** 0.367***
0.358***
(0.049)
(0.048) (0.051)
(0.051) (0.068)
(0.070)
CIR -0.053***
-0.058*** -0.035***
-0.039*** -0.028***
-0.029***
(0.005)
(0.005) (0.005)
(0.005) (0.004)
(0.004)
ORTHOLNTA
-0.222***
-0.501***
-0.338*
(0.076)
(0.125)
(0.200)
EQTA 0.056*** 0.094*** 0.047*** 0.070*** 0.114*** 0.069*** 0.061*** 0.092*** 0.065***
(0.012) (0.014) (0.012) (0.013) (0.015) (0.013) (0.010) (0.014) (0.009)
NPL -0.045** -0.109*** -0.022 -0.038** -0.075*** -0.023 -0.028** -0.064*** -0.023*
(0.019) (0.022) (0.019) (0.017) (0.016) (0.017) (0.012) (0.019) (0.013)
LDR 0.004* 0.007** 0.002 0.004* 0.005* 0.003 0.009*** 0.012*** 0.008***
(0.002) (0.003) (0.002) (0.002) (0.003) (0.002) (0.002) (0.003) (0.003)
SOB 2.118*** 3.355*** 2.203*** 2.705*** 3.963*** 2.844*** 1.037*** 1.893*** 1.177***
(0.205) (0.261) (0.191) (0.361) (0.500) (0.341) (0.297) (0.343) (0.283)

29
Table 5. (Continued)
1 2 3 4 5 6 7 8 9
FOB -1.738*** -1.435*** -0.791** -1.557*** -0.817 -0.723* -1.327*** -0.193 -1.028*
(0.271) (0.339) (0.328) (0.418) (0.558) (0.450) (0.500) (0.631) (0.542)
LISTED -0.154 -0.119 0.095 -0.040 0.373 0.089 -0.336 0.089 -0.256
(0.210) (0.311) (0.212) (0.286) (0.346) (0.282) (0.209) (0.245) (0.213)
Year dummies Included Included Included Included Included Included Included Included Included
Constant Included Included Included Included Included Included Included Included Included
Method Pooled Pooled Pooled
Panel
(Random
effect/GLS)
Panel
(Random
effect/GLS)
Panel
(Random
effect/GLS)
GMM GMM GMM
Observations 617 617 617 617 617 617 554 554 554
Overall R-squared 0.670 0.491 0.683 0.639 0.466 0.663
R-Squared between
0.73 0.546 0.752
R-Squared within
0.266 0.170 0.281
Wald Test
chi2(18)=
452.75
(0.000)***
chi2(17)=
210.67
(0.000)***
chi2(18)=
493.07
(0.000)***
chi2(18)=
897.39
(0.000)***
chi2(17)=
734.27
(0.000)***
chi2(18)=
950.37
(0.000)***
Sargan Test
chi2(32)=
40.10 (0.154)
chi2(32)=
40.51 (0.144)
chi2(32)=
41.23 (0.127)
Arellano–Bond test
for AR(1)
N(0, 1)=
-3.327
(0.001)***
N(0, 1)=
-3.497
(0.000)***
N(0, 1)=
-3.392
(0.001)***
Arellano–Bond test
for AR(2)
N(0, 1)=
-0.067
(0.947)
N(0, 1)= -
1.006 (0.314)
N(0, 1)=
-0.071
(0.943)
Related Documents