1 Why Evaluation & Assessment is Why Evaluation & Assessment is Important Important •Feedback to students •Feedback to teachers •Information to parents •Information for selection and certification •Information for accountability •Incentives to increase student effort Bottom Line: It provides sources of information to Bottom Line: It provides sources of information to aid in the educational process aid in the educational process On the purpose of testing: On the purpose of testing: • The purpose of testing is to SAMPLE a test-taker’s knowledge about a given topic. It is typically not intended to measure ALL of the test- taker’s knowledge. • The results of the test are intended to assist us in making inferences BEYOND that of the specific test.

Welcome message from author
This document is posted to help you gain knowledge. Please leave a comment to let me know what you think about it! Share it to your friends and learn new things together.
Transcript
1
Why Evaluation & Assessment isWhy Evaluation & Assessment isImportantImportant
•Feedback to students•Feedback to teachers•Information to parents•Information for selection and certification•Information for accountability•Incentives to increase student effortBottom Line: It provides sources of information toBottom Line: It provides sources of information toaid in the educational processaid in the educational process
On the purpose of testing:On the purpose of testing:
• The purpose of testing is to SAMPLEa test-taker’s knowledge about agiven topic. It is typically notintended to measure ALL of the test-taker’s knowledge.
• The results of the test are intendedto assist us in making inferencesBEYOND that of the specific test.

2
AssessmentAssessment• Comes in many forms including informal
questioning in the classroom.• It is important to choose the most appropriate
method of assessment to measure the topic athand
• Ultimately, the purpose of assessment is to assiststudents in attaining learning goals.
DevelopDevelopLearningLearningGoals/ObjectivesGoals/Objectives
Pretest ofPretest ofKnowledgeKnowledge
InstructionInstruction MeetingMeetingLearningLearningGoals?Goals?
InformalInformalAssessmentAssessment
FormalFormalCheckpointsCheckpoints
ObserveObservevariability invariability instudentsstudents’’abilitiesabilities
Develop understandingof choosing appropriatemethods
Feedback to re-align objectives, instruction, & assessment
Feedback toFeedback toStudentsStudents
The Assessment Process:
3
Important terms . . .Important terms . . .• Formative vs. Summative evaluation
– Formative -- “How are you doing?”– Summative -- “How did you do?”
• Norm-referenced assessment vs. Criterion-referenced/Mastery assessment– Norms -- comparison to peer group– Criterion -- meeting instructional objectives
Traditional Traditional vsvs. Authentic. AuthenticAssessmentAssessment
Traditional -- measuring basic knowledge & skills• Spelling test• Math word problems• Physical fitness testsAuthentic -- measuring skills in a “real-life” context• Develop a school newspaper• Build a model city• Present a persuasive argument• Portfolios
4
Variable TypesVariable Types
• Dichotomous = variable that hasonly two categories (either\or)
• Discrete = variables that increaseor decrease by whole units
• Continuous = variables that cantheoretically assume infinitenumber of values
Scales of MeasurementScales of Measurement(Stevens, 1951)
1. Nominal or Categorical1. Nominal or Categorical2. Ordinal2. Ordinal3. Interval3. Interval4. Ratio4. Ratio
5
1.1. Nominal or CategoricalNominal or Categorical(naming scale)(naming scale)
• Classification according to presence orabsence of qualities
• No information provided on order ormagnitude of differences
• Because nominal scales have noquantitative properties, data consist offrequencies only
• E.g., sex, race, religion, political party
2. Ordinal2. Ordinal(ranking scale)(ranking scale)
• Classification according to degree ofquality present
• Distinguish between orderedrelationships between classes orcharacteristics, but no informationabout the magnitude of difference
• E.g., tall > normal > short, first > second > third
• E.g., percentile ranks
6
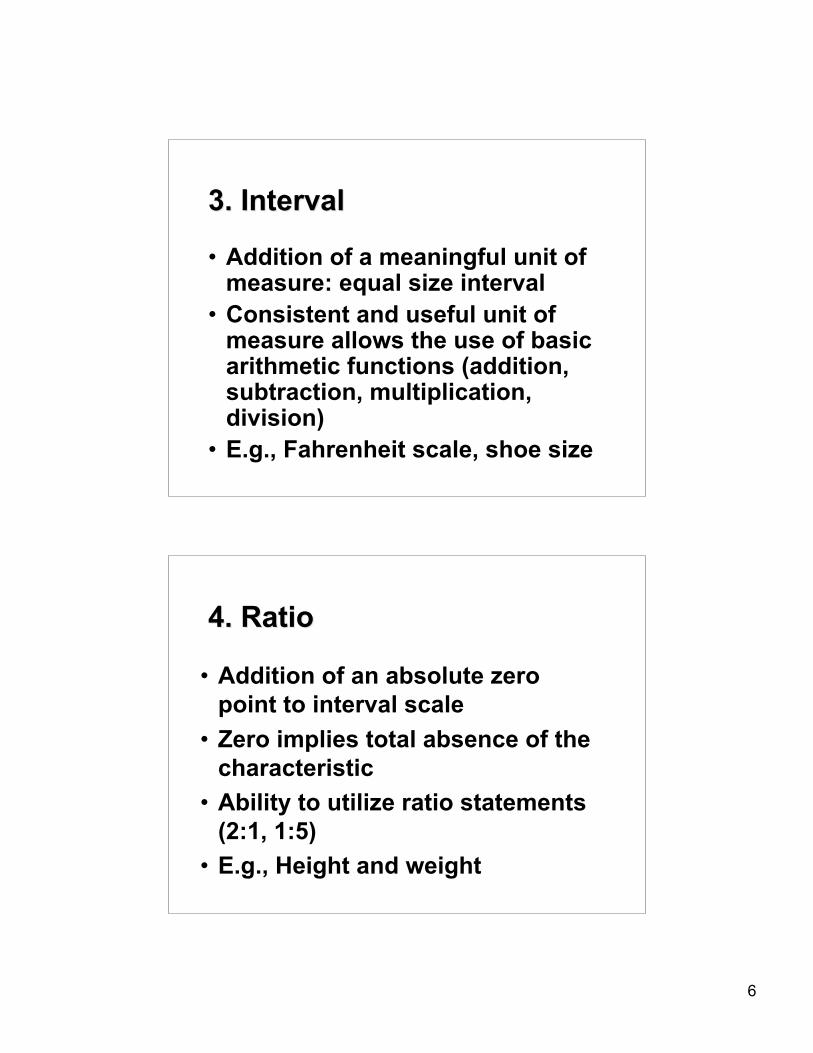
3. Interval3. Interval
• Addition of a meaningful unit ofmeasure: equal size interval
• Consistent and useful unit ofmeasure allows the use of basicarithmetic functions (addition,subtraction, multiplication,division)
• E.g., Fahrenheit scale, shoe size
4. Ratio4. Ratio
• Addition of an absolute zeropoint to interval scale
• Zero implies total absence of thecharacteristic
• Ability to utilize ratio statements(2:1, 1:5)
• E.g., Height and weight
7
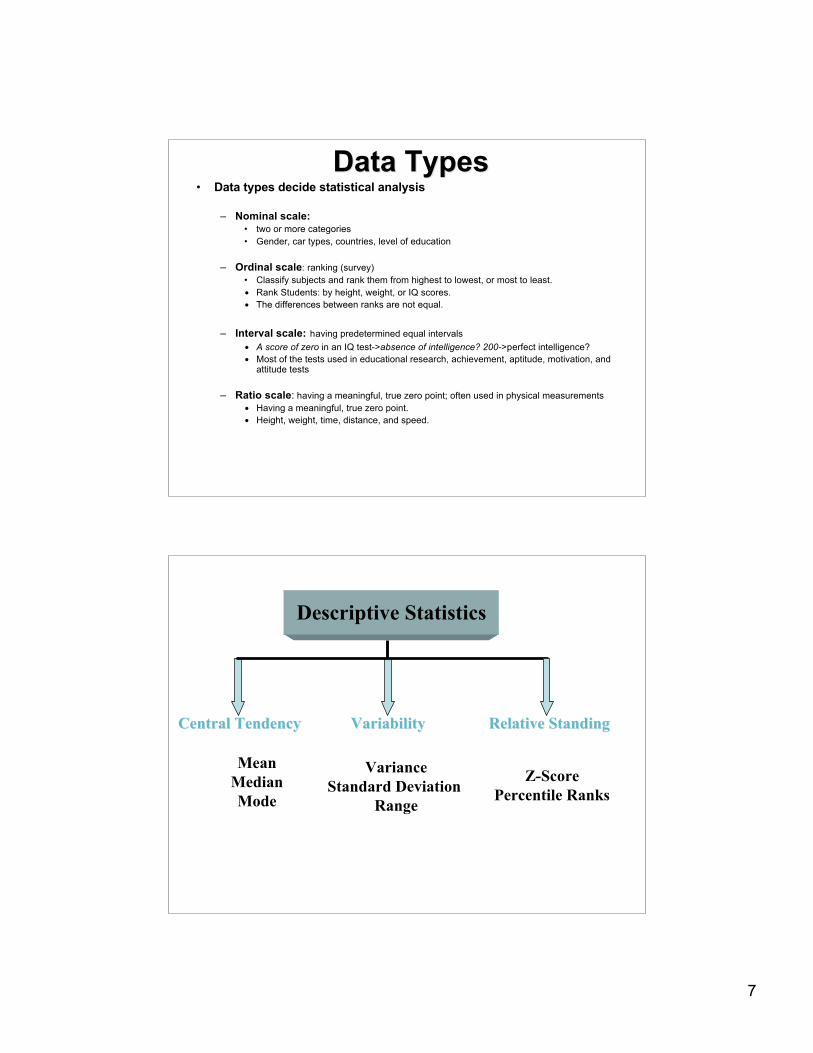
Data TypesData Types• Data types decide statistical analysis
– Nominal scale:• two or more categories• Gender, car types, countries, level of education
– Ordinal scale: ranking (survey)• Classify subjects and rank them from highest to lowest, or most to least.• Rank Students: by height, weight, or IQ scores.• The differences between ranks are not equal.
– Interval scale: having predetermined equal intervals• A score of zero in an IQ test->absence of intelligence? 200->perfect intelligence?• Most of the tests used in educational research, achievement, aptitude, motivation, and
attitude tests
– Ratio scale: having a meaningful, true zero point; often used in physical measurements• Having a meaningful, true zero point.• Height, weight, time, distance, and speed.
Descriptive Statistics
Central TendencyCentral Tendency VariabilityVariability Relative StandingRelative Standing
MeanMedianMode
VarianceStandard Deviation
Range
Z-ScorePercentile Ranks
8
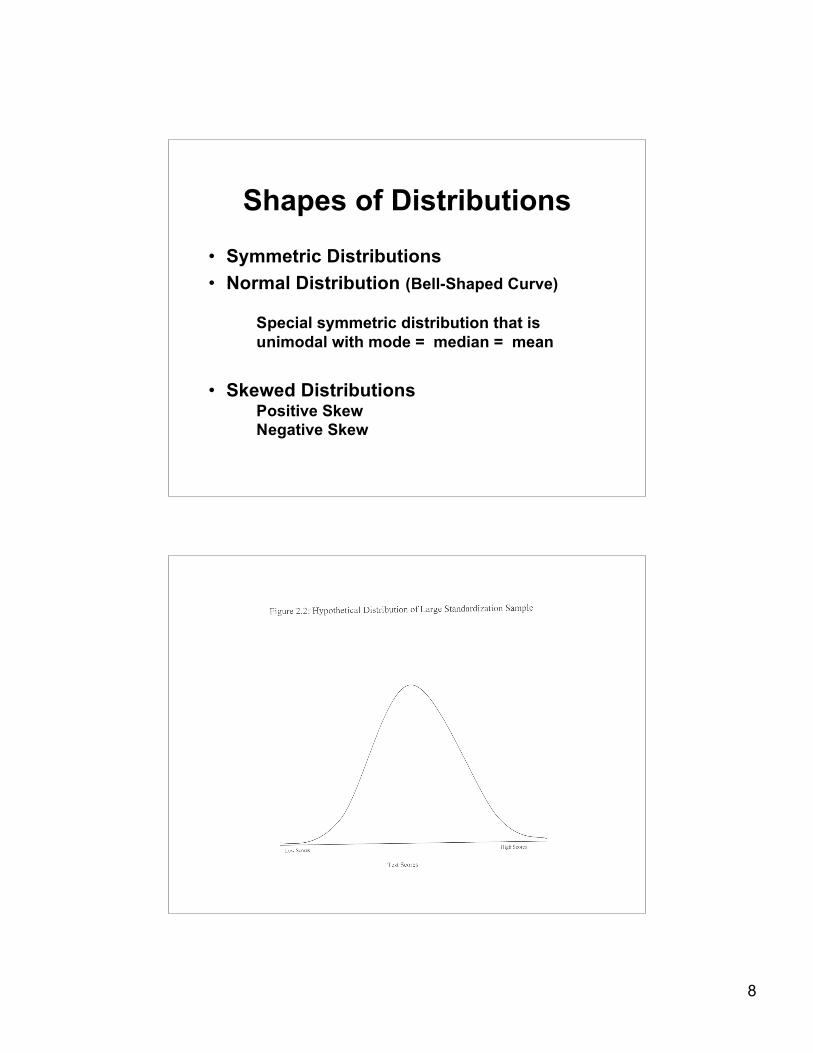
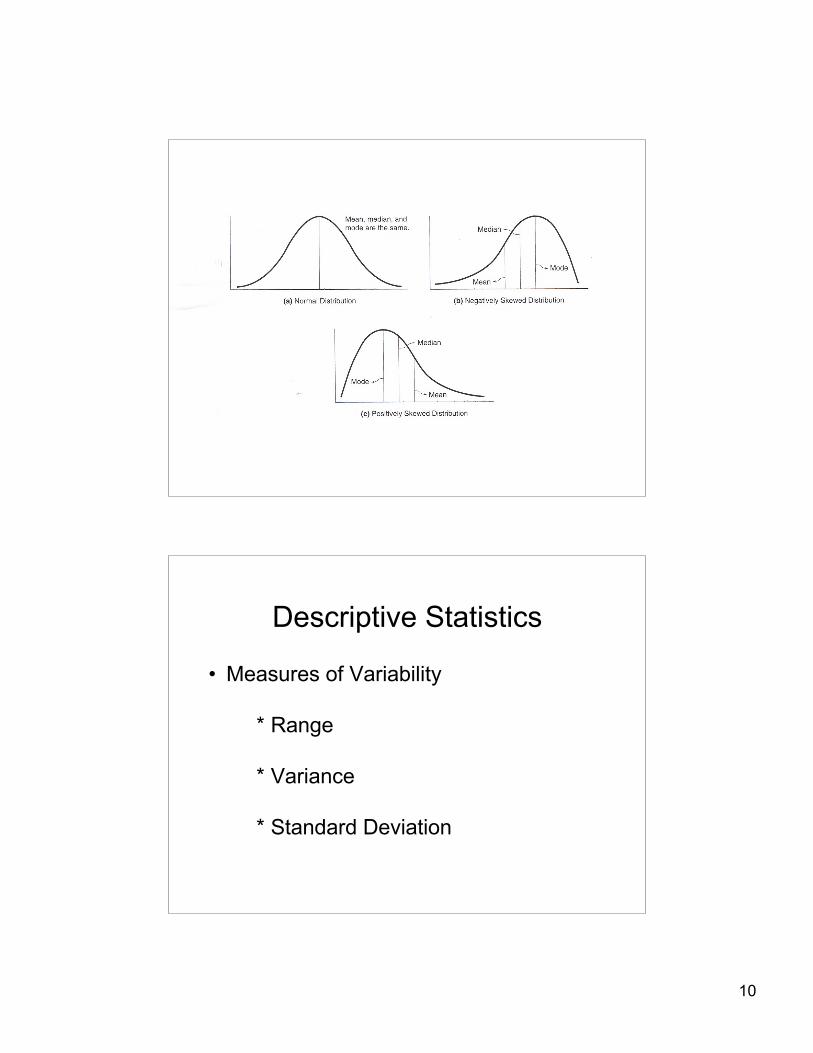
Shapes of Distributions
• Symmetric Distributions• Normal Distribution (Bell-Shaped Curve)
Special symmetric distribution that isunimodal with mode = median = mean
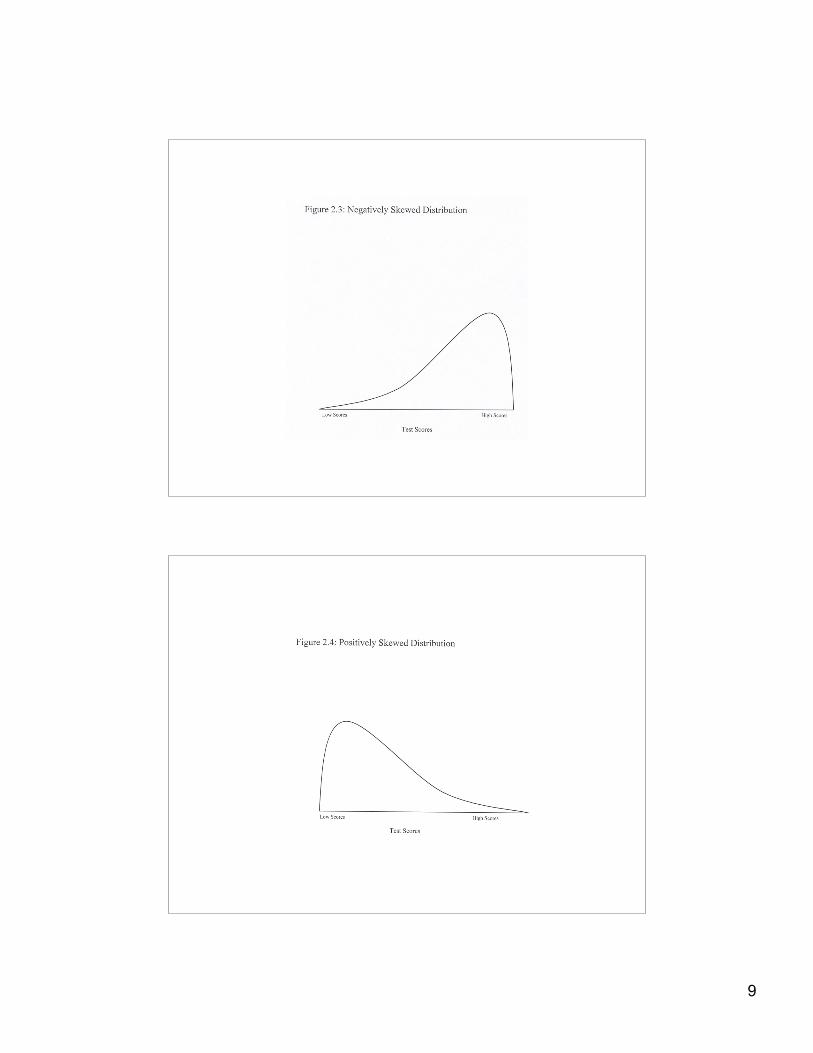
• Skewed DistributionsPositive SkewNegative Skew
9
10
Descriptive Statistics
• Measures of Variability
* Range
* Variance
* Standard Deviation
11
Standard Deviation:Standard Deviation:• Accurate measure of dispersion--
how spread out the scores are• Average distance of each score in
a distribution is from the mean
Measure of AssociationMeasure of Association
• Describes the degree ofrelationship that exists betweentwo variables
• Bivariate relationships
12
CorrelationsCorrelations• A relationship between two variables• NO CAUSATION!• Size: Correlations range from -1 to +1• Sign:• Zero means no relationship• Positive correlation--As one variable goes up (or
down) the other variable goes up (or down)• Negative correlation--As one variable goes up the
other goes down
Uses of coefficient:Uses of coefficient:1. Prediction - if related
systematically use one variableto predict the other
2. Validity - measures of the sameconstruct should have highdegree of relationship
13
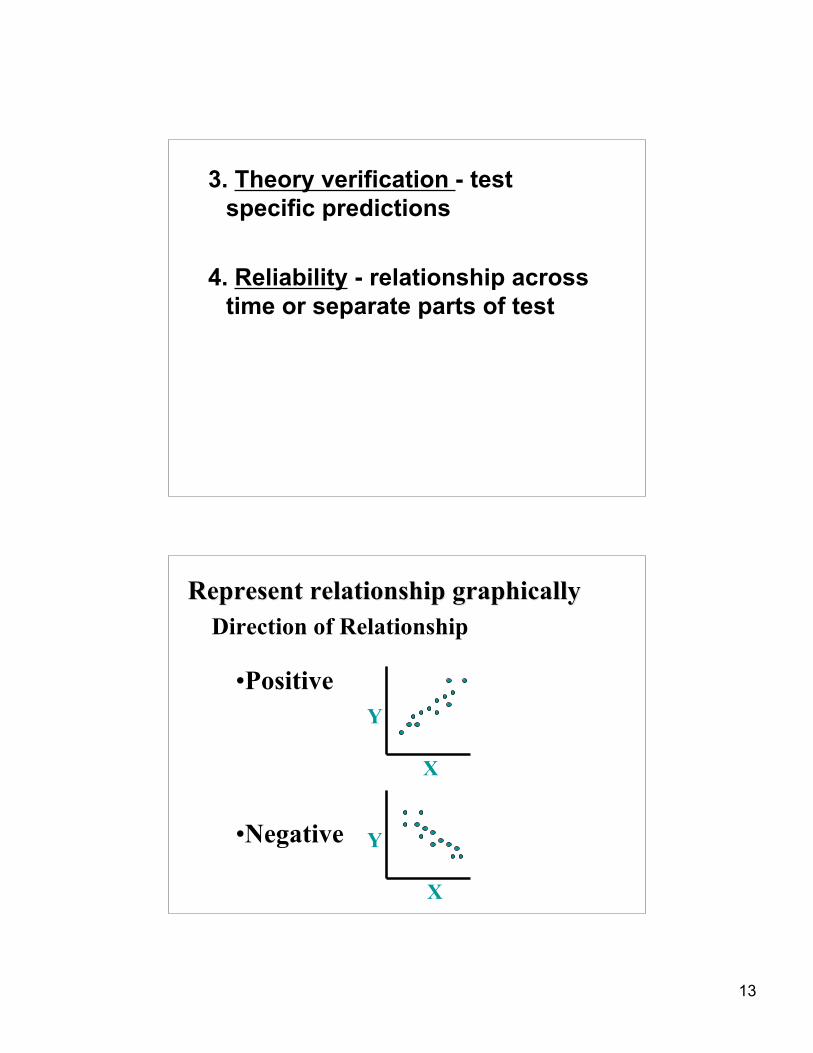
3. Theory verification - testspecific predictions
4. Reliability - relationship acrosstime or separate parts of test
Represent relationship graphicallyRepresent relationship graphicallyDirection of Relationship
•Positive
•Negative
X
X
Y
Y
14
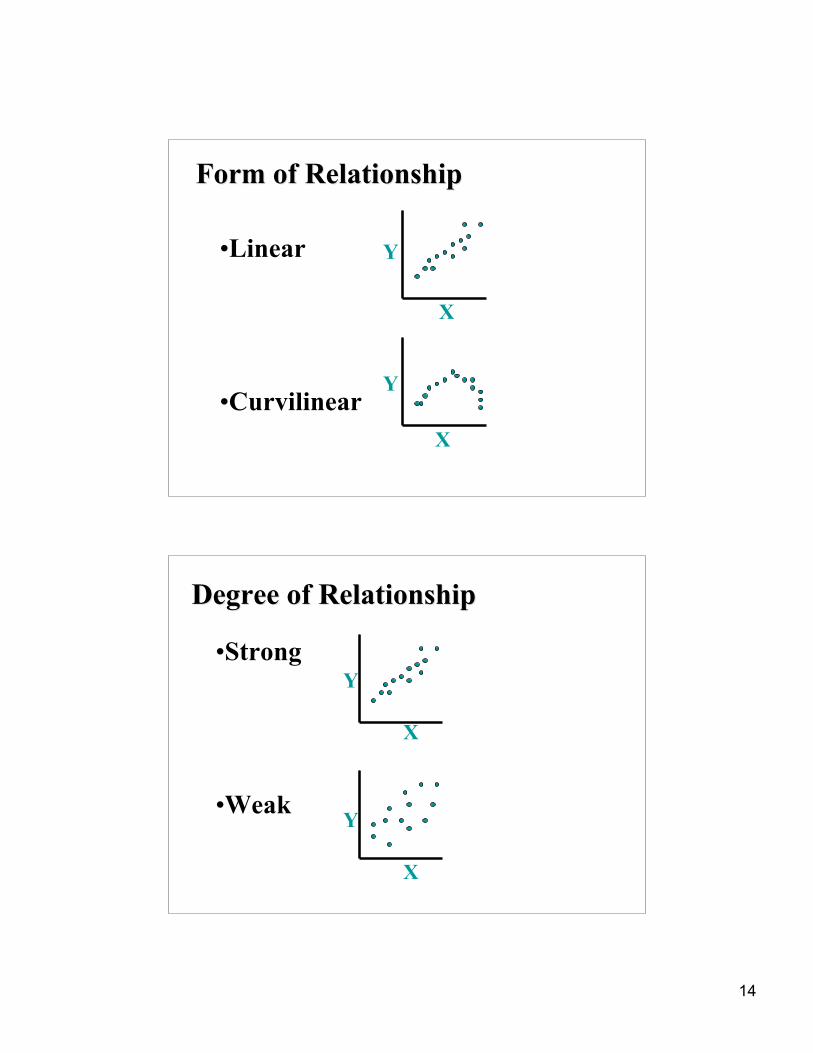
Form of RelationshipForm of Relationship
•Linear
•CurvilinearX
Y
X
Y
Degree of RelationshipDegree of Relationship
•Strong
•Weak
X
Y
X
Y
15
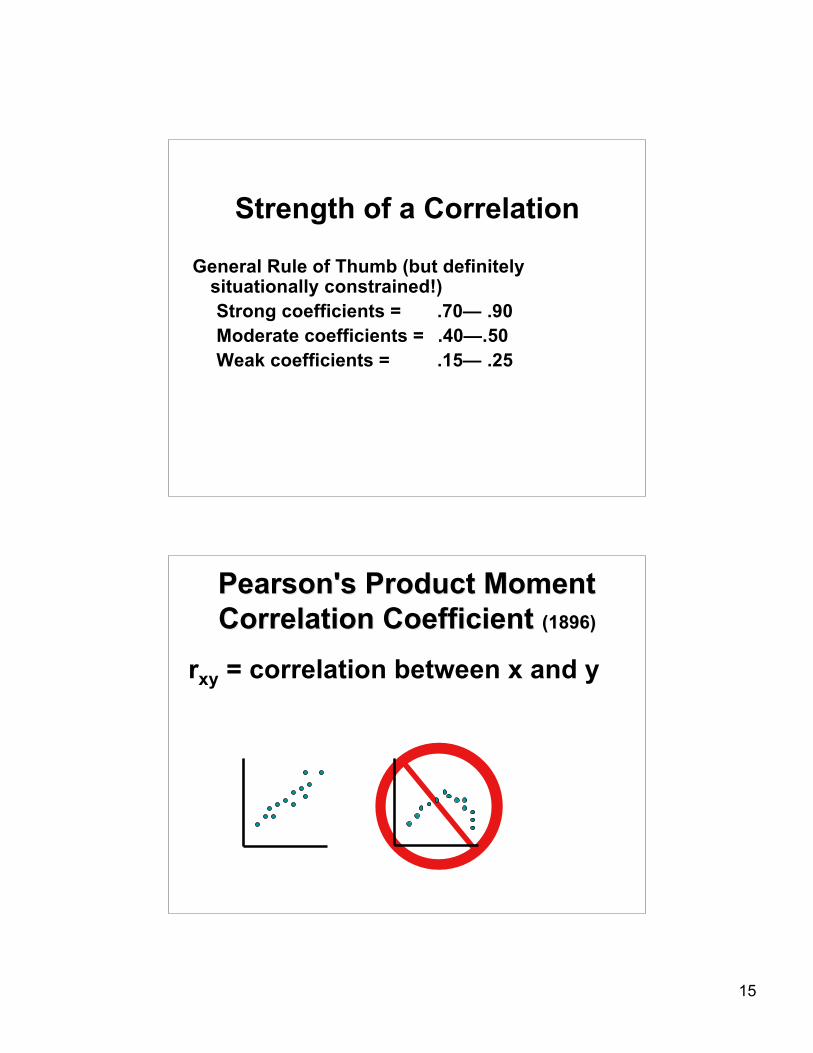
Strength of a Correlation
General Rule of Thumb (but definitelysituationally constrained!)Strong coefficients = .70— .90Moderate coefficients = .40—.50Weak coefficients = .15— .25
Pearson's Product MomentPearson's Product MomentCorrelation Coefficient Correlation Coefficient (1896)(1896)
rxy = correlation between x and y
16
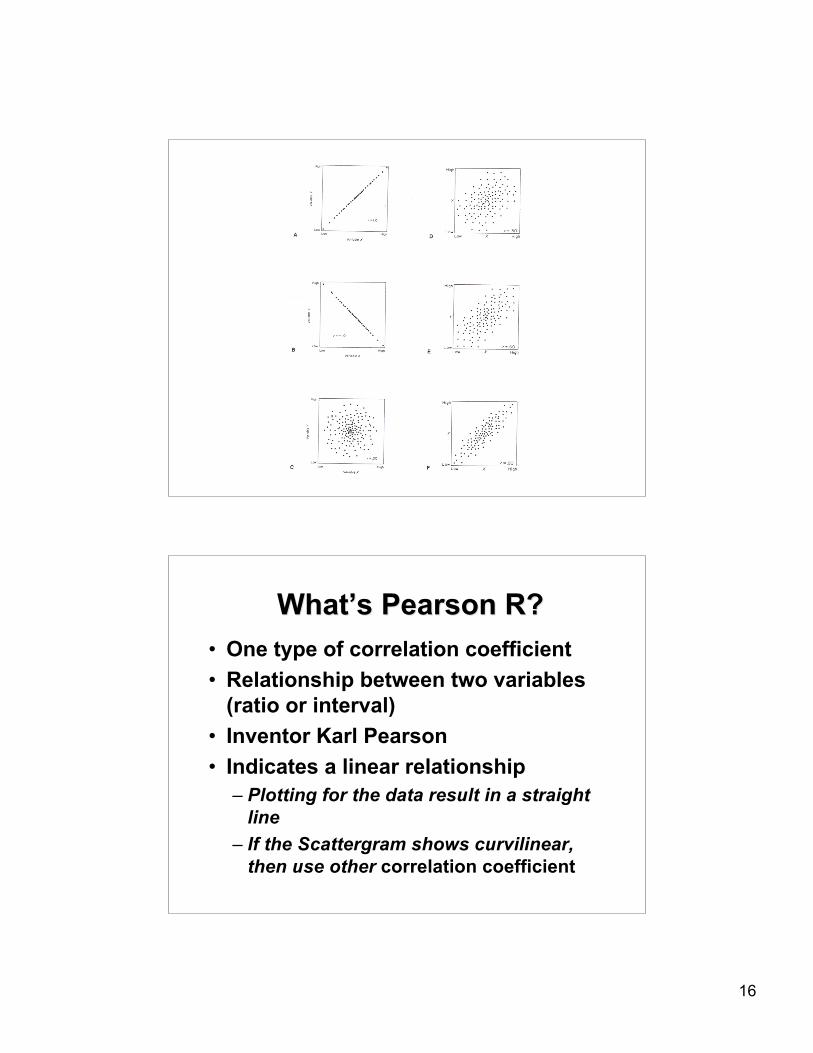
WhatWhat’’s Pearson R?s Pearson R?• One type of correlation coefficient• Relationship between two variables
(ratio or interval)• Inventor Karl Pearson• Indicates a linear relationship
– Plotting for the data result in a straightline
– If the Scattergram shows curvilinear,then use other correlation coefficient
17
Other Measures ofOther Measures ofAssociationAssociation
• Spearman rho (rs) - correlationcoefficient for nonlinear ordinal data
• Point-biserial - used to correlatecontinuous interval data with adichotomous variable
• Phi-coefficient - used to determinethe degree of association when bothvariable measures are dichotomous
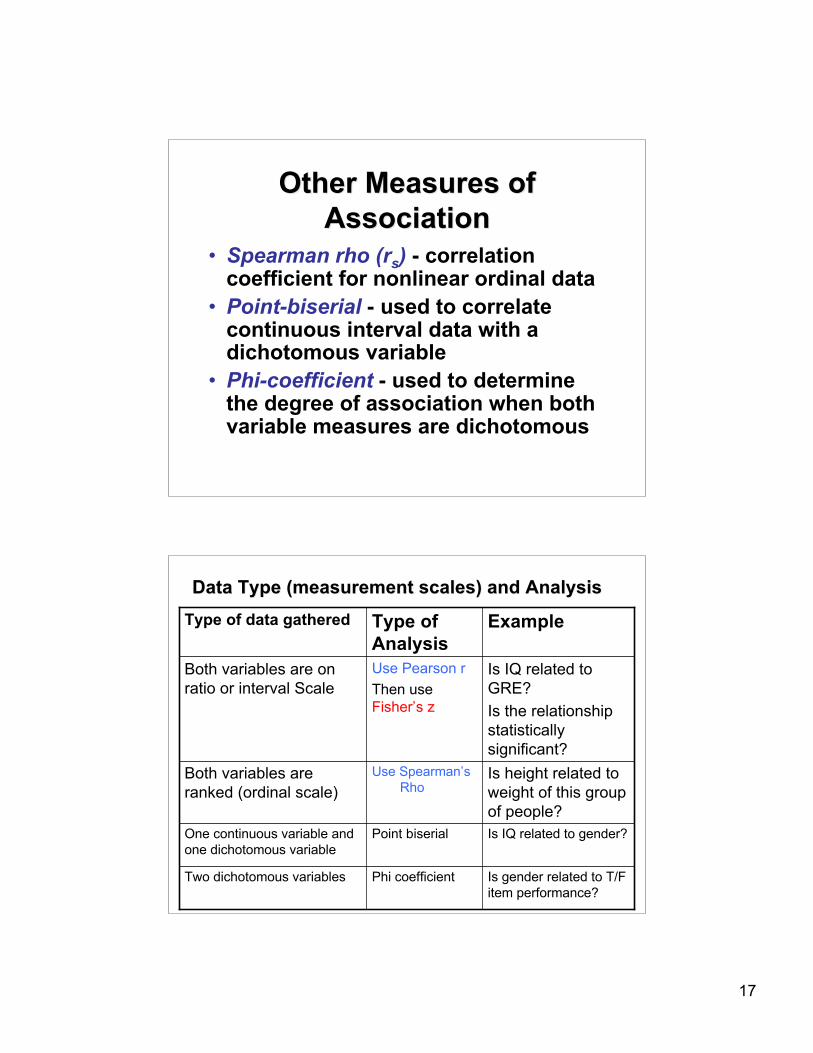
Data Type (measurement scales) and AnalysisData Type (measurement scales) and Analysis
Is gender related to T/Fitem performance?
Phi coefficientTwo dichotomous variables
Is IQ related to gender?Point biserialOne continuous variable andone dichotomous variable
Is height related toweight of this groupof people?
Use Spearman’sRho
Both variables areranked (ordinal scale)
Is IQ related toGRE?Is the relationshipstatisticallysignificant?
Use Pearson rThen useFisher’s z
Both variables are onratio or interval Scale
ExampleType ofAnalysis
Type of data gathered
18
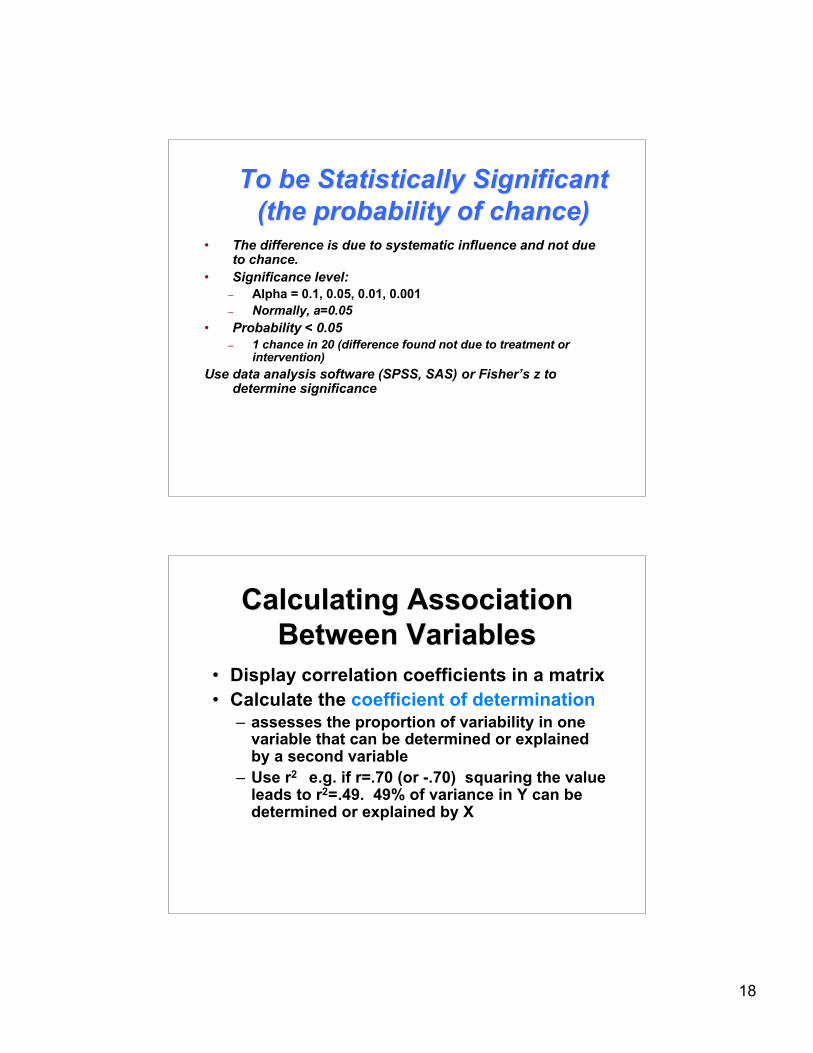
To be Statistically SignificantTo be Statistically Significant(the probability of chance)(the probability of chance)
• The difference is due to systematic influence and not dueto chance.
• Significance level:– Alpha = 0.1, 0.05, 0.01, 0.001– Normally, a=0.05
• Probability < 0.05– 1 chance in 20 (difference found not due to treatment or
intervention)Use data analysis software (SPSS, SAS) or Fisher’s z to
determine significance
Calculating AssociationCalculating AssociationBetween VariablesBetween Variables
• Display correlation coefficients in a matrix• Calculate the coefficient of determination
– assesses the proportion of variability in onevariable that can be determined or explainedby a second variable
– Use r2 e.g. if r=.70 (or -.70) squaring the valueleads to r2=.49. 49% of variance in Y can bedetermined or explained by X
19
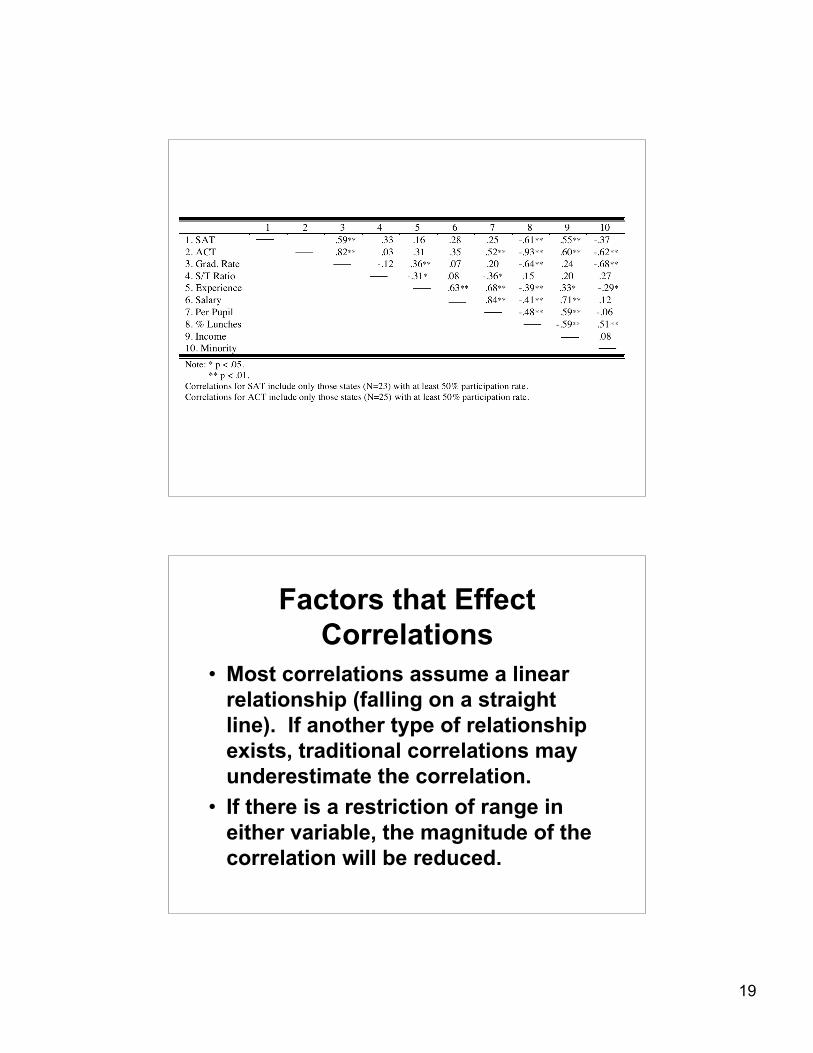
Factors that EffectCorrelations
• Most correlations assume a linearrelationship (falling on a straightline). If another type of relationshipexists, traditional correlations mayunderestimate the correlation.
• If there is a restriction of range ineither variable, the magnitude of thecorrelation will be reduced.
20
Linear Regression• A statistical technique for predicting scores on
one variable (criterion or Y) given a score onanother (predictor or X).
• Predicts criterion scores based on a perfectlinear relationship.
• Strong correlations result in accuratepredictions; weak correlations result in lessaccurate predictions.
Related Documents