Why do people watch Reality TV soap operas? – A comparison between the psychological variables Uses & Gratifications, Parasocial Interaction and Identification with reality TV soap media characters and perceived realism Bachelor theses: Psychology – C&M Melanie Heering (s0132985) University of Twente Enschede, August 2012 1 st supervisor: Dr. A. Heuvelman 2 nd supervisor: Dr. P.A.M. Kommers

Welcome message from author
This document is posted to help you gain knowledge. Please leave a comment to let me know what you think about it! Share it to your friends and learn new things together.
Transcript

Why do people watch Reality TV soap operas? –
A comparison between the psychological variables Uses &
Gratifications, Parasocial Interaction and Identification with reality
TV soap media characters and perceived realism
Bachelor theses: Psychology – C&M
Melanie Heering (s0132985)
University of Twente
Enschede, August 2012
1st supervisor:
Dr. A. Heuvelman
2nd
supervisor:
Dr. P.A.M. Kommers

2
Abstract
Several studies examined the general television program choice of audiences and discussed
psychological motives such as Uses and Gratifications (U&G), parasocial interaction (PSI)
and identification (ID) with media characters. This research focused on soaps within the genre
reality TV (RTV) and compared the three psychological variables for watching TV with each
other, as was the perceived realism of the programs. A total of 149 participants filled in an
online questionnaire about the motives of watching the television programs “Farmer wants a
wife” and “Oh Oh Cherso/Tirol”. The findings showed U&G motives to be the most
explaining motive of watching RTV soaps, followed by PSI and at last ID. Furthermore,
perceived realism significantly correlates with the frequency of viewing the program and
showed a high accountability for the differences on the compiled scale means of the three
psychological variables.
Samenvatting
Verschillende onderzoeken hebben de algemene televisieprogramma-keuze van kijkers
geanalyseerd en verschillende kijkmotieven als Uses- and Gratifications (U&G), parasociale
interactie (PSI) en identificatie (ID) met media karakters onderzocht. Dit onderzoek richt zich
op soaps binnen het genre reality TV (RTV) en vergelijkt naast de drie kijkmotieven
onderling ook de waargenomen realiteit van het programma. In totaal hebben 149 deelnemers
de online vragenlijst ingevuld over de kijkmotieven van de programma formats “Boer zoekt
vrouw” en “Oh Oh Cherso / Tirol”. De bevindingen laten zien dat U&G motieven de meest
verklarende waarde hebben voor het kijkgedrag van RTV soaps, gevolgd van PSI en ID.
Bovendien is de waargenomen realiteit van de programma’s sterk gecorreleerd met de
kijkfrequentie en was deze voor een groot deel verantwoordelijk voor de verschillen tussen de
samengevoegde gemiddelde waardes van de drie verschillende psychologische variabelen.
.

3
1. Introduction
On January 30th
, 2011 the reality television program “Boer Zoekt Vrouw1” got with 5.381.000
viewers again a new record on the Dutch TV and, thus, was 2011 the most watched TV
format in the Netherlands (excluding sport programs). On January 30th
, 2011 the reality
television program “Boer Zoekt Vrouw” broke the Dutch record for the program with
5.381.000 viewers. This format - which originated in England - is only one example of
programs in the factual television genre which have been successful worldwide. In Germany
for example, non-fictional programs have been getting more and more broadcasting time. At
least on the private channels this genre has a broadcasting time fraction between 23,3%
(ProSieben) and 32,3% (Sat.1) of the total broadcasting time in 2009 (Krüger, 2010). On RTL
(28,4% of the broadcasting time was non-fictional) more than 20,5% of all non-fictional
programs belonged to the genre docu-soap or docu-production as “Bauer sucht Frau2”. The 7
th
season of “Bauer sucht Frau” was seen by 7,71 million viewers in average, thus reached an
impressive market share of 23,5% (RTL, 2011).
What are the reasons for the occurance of this phenomenon? Several studies examined why
people watch reality TV formats in general (Giles, 2003; Gleich, 2001; Lundy, Ruth, & Park,
2008; Nabi, Biely, Morgan, & Stitt, 2003; Nabi, Stitt, Halford, & Finnerty, 2006; Papacharissi
& Mendelson, 2007; Reiss & Wiltz, 2004), others addressed the motives to watch soap operas
on TV (Cohen, 2001, 2006; Giles, 2003; Rubin & Perse, 1987; Vorderer, 2001). Yet, there is
a research gap about why people watch reality TV soap operas. This research paper aims to
fill in this gap by investigating which psychological variables could best explain the
enjoyment of RTV soap operas.
By doing so, the focus lies most on the successful international reality TV program format of
the Dutch version “Farmer wants a wife”, called “Boer zoekt vrouw”, and in Germany “Bauer
sucht Frau”. This format is broadcasted in at least twenty-seven countries, including The
Netherlands, and Germany, and to name some more Australia, Bulgaria, France, Hungary,
South Africa and United States. Furthermore, the successful Dutch reality TV soap format
“Oh Oh Cherso/Tirol” is included. These formats are chosen for two reasons; their high
1 Dutch variant of “Farmer wants a wife”
2 German variant of “Farmer wants a wife”

4
viewing rates and the formats lasted at least three seasons. The results of this study could be
relevant for academic professors, students, film produces and program directors.
2. Literature Review
Different perspectives about the motives of viewers are found in the literature to explain
reality TV consumption in general. Some researchers found the uses & gratifications motives
(U&G) the most appropriate concept (Conway & Rubin, 1991; Lundy et al., 2008;
Papacharissi & Mendelson, 2007; Reiss & Wiltz, 2004; Rubin, 2009; Vorderer, 2001), while
others adhere to the concept parasocial interactions (PSI) (Conway & Rubin, 1991; Hartmann
& Goldhoorn, 2011; Klimmt, Hartmann, & Schramm, 2006; Rubin & Perse, 1987), or the
identification (ID) with the media characters (Chory-Assad & Ciccirillo, 2005; Cohen, 2006).
2.1 From Soap operas to Reality TV soaps
This chapter first defines soap operas and the genre RTV. Furthermore the formats “Farmer
wants a wife” and “Oh Oh Cherso / Tirol” are described and how these formats can be
classified as RTV soaps.
2.1.1 Soap operas (soaps)
Giles (2003) considered tree formal features of soaps: 1) personal life is the “core
problematic”, 2) they are marked by melodramatic excess, necessary for their emotional
impact and 3) a lack of narrative resolution, thereby maintaining their continuous existence.
He found that men tend to watch more nonfictional programs than woman. The target
audience of soap operas are fourteen to twenty-nine year old people, most of which are female
(Gleich, 2001, p. 525). Next to ID, PSI seems the most important reason why people like to
watch soaps (Giles, 2003, p. 255f). However, nothing was found in the literature about RTV
soaps.
2.1.2 Reality TV (RTV)
According to Nabi et al. (2003) Reality-based TV programming is distinct from major
programming, but is not a genre on its own and “lacks a clear definition” (Lundy et al., 2008).
Giles (2003) describes RTV “as an umbrella term for audience-participation shows”, which
means “talk shows, docu-soaps, fly-on-the-wall documentaries and makeover shows” (Giles,
2003, p. 234). All were classified as entertainment-oriented programs (Hall, 2009, p. 431;
Nabi et al., 2003) and were perceived as entertainment (Krüger, 2010).

5
Different names are used in the literature, varying from “factual television programming”, to
“reality based programming”. Some of the characteristics are (Hall, 2009; Lundy et al., 2008,
p. 209; Nabi et al., 2003):
1) characters are real people (not actors)
2) programs are not filmed on a set, but in natural living or working environments
3) programs are not scripted
4) events are unplanned, but evolve from narrative contexts, and
5) the primary purpose is viewer entertainment
The antecedents of factual television were news or sports, and mostly men seemed to be
interested, while women were traditionally more interested in fictional television. Since
programs for men were traditionally more factual than fictional (e.g. sports), other formats
within the genre realty TV seems also to catch the interest of men as well, thus, also in reality
TV soap operas (Giles, 2003, p. 256).
2.1.3 Reality TV Soaps “Farmer wants a wife” and “Oh Oh Cherso/Tirol”
Both formats, the Dutch and German version of the format of “Farmer wants a wife” and “Oh
Oh Cherso / Tirol”, can be classified as a reality TV soap opera as defined by Giles (2003)
and Krüger (2010). First, in both formats ordinary people are the actors and their life is the
central theme, secondly some melodramatic situations as the emotions of the actors are shown
(e.g. the crying of a farmer or different kind of conflicts in Oh Oh Cherso/Tirol are typical)
and thirdly, there is no final narrative resolution; maybe every season has got some new
actors, but the storyline of both goes on to some extent.
In “Farmer wants a wife” the farmers are filmed most of the time on their own farm, where
three selected woman are invited to spend some time on the farm with goal of finding a new
spouse. This concept is the same worldwide, thus, also in this study about the Dutch format
“Boer zoekt vrouw” as well as the German program “Bauer sucht Frau”. There are only slight
differences in the way of presenting. While in the Dutch format the farmers are called only by
their first name, in the German version the characters get nicknames by adding a verb before
their first name, for instance “Martin – der treue Milchbauer” (Engl.: “Martin – the
trustworthy dairy farmer”).
In “Oh Oh Cherso/Tirol” a group of young people are sent on vacation for a few weeks. In
the first and third season they were sent to the Greek Island Hersonissos (Dutch:

6
Chersonisos), for the second season they were send to the ski-region Tirol in Austria. There
they were followed by cameras while partying and earning money as they were assigned jobs.
2.2 Perceived realism (RTV and general)
Hall (2009) defined perception of realism as “1) factuality or the degree to which a text is
understood to accurately portray specific real-world events or people, and 2) realism as real
world similarity, or whether what is portrayed in a text is like what the audience would expect
to find in the real world” (Hall, 2009, p. 424). Although, reality TV programming is often
presented as non-scripted and complete nonfictional, reality-based TV programming is
viewed as only moderately real (Nabi et al., 2003, p. 303).
Different researches found several correlations between the perceived realism of a program
and the U&G motives, as well as between PSI and ID. For example Hall and Bracken (2011)
found significant correlations between realism and three out of four empathy dimensions, as
part of PSI, (perspective taking: r = .20, p < 0.01; fantasy empathy: r = .15, p < .01; empathic
concern: r = .24, p < .01).
2.3 Uses and Gratifications Motives (U&G)
In this paragraph first a definition of the U&G perspective is presented, next the belonging
sub-dimensions are mentioned followed by a few findings about the predicting value of U&G
on program consumption and rating of a program.
Rubin (2009) stresses the new U&G perspective in media research, referring to Fischer (1987)
he defines the U&G perspective as a “psychological communication perspective …, shifting
the focus from the direct and undue influence of the media on passive and isolated individuals
to active audience members using the media” (Rubin, 2009, p. 148). RTV formats holds
different gratifications compared to fictive television formats for the viewers (Nabi et al.,
2006; Papacharissi & Mendelson, 2007).
There are several concepts that belonging to the U&G perspective. In literature the following
sub-dimensions are used frequently: Reality entertainment (watching because of its reality
character), relaxation / escapism (coping with own life realty), pass time, companionship (to
feel not alone), social interaction (e.g. have something to do with other people) voyeurism
(enjoying a peek into others life) and downward social comparison (to feel better after having
seen the characters) (Nabi et al., 2003; Papacharissi & Mendelson, 2007; Vorderer, 2001).

7
Between these constructs there are different findings about their predictive value on amount
of program consumption and valuation of the program. For example, Nabi et al. (2006)
demonstrated that voyeurism is with M = 3.46 and p <0.05, one of the most predictive sub-
dimension of viewing RTV (Nabi et al., 2006; Rubin & Perse, 1987), while others could not
confirm this findings for voyeurism (Baruh, 2010; Nabi et al., 2003; Papacharissi &
Mendelson, 2007; Reiss & Wiltz, 2004), but Baruh (2010) found voyeurism motives
correlated with watching fictional programs ( = .18, p < 0.01). Thus, voyeurism is a quite
controversial sub-dimension which is discussed often and, therefore, interesting to measure.
In conclusion, there are controversial findings about the U&G perspective and its sub-
dimensions as a predictor for viewing RTV or program rating. Other factors also could be
important, such as the format itself (Nabi et al., 2006), the RTV viewing frequency and
program rating (or pleasure experience) (Nabi et al., 2003) and there was a positive
correlation found by Papacharissi and Mendelson (2007) between reality entertainment (as
sub-dimension of U&G) and perceived realism.
2.4 Parasocial interaction (PSI)
After describing the concept of PSI and the difference with parasocial relationship (PSR), this
paragraph describes the sub-dimension of PSI and mentions some important correlations with
perceived realism.
The concept parasocial interaction, first mentioned by Horton & Wohl (1956), was later
redefined by Cohen (2009) as “the emotions, thoughts, and actions (i.e., speech) that occur
during exposure to a media performer and that are geared toward a performer” (Cohen, p.
227). PSI is perceived as an “immediate, personal, and reciprocal” relationship (Hartmann &
Goldhoorn, 2011, p. 1105; Horton & Strauss, 1957), and is received by the viewer as similar
to real life social interaction (Hartmann & Goldhoorn, 2011). The concept is broadly
researched across media like radio, books and television, notably with fictional soap
characters, although it is not fully developed on a theoretical level (Giles, 2002) and there is a
shortage of literature about PSI and the genre RTV.
Some authors stressed the difference between PSI (the one-sided process of perception during
media exposure) and parasocial relationship (PSR) (the cross-situational relationship with a
media person, with affective components, first mentioned by Horton and Strauss (1957))

8
(Klimmt et al., 2006, p. 293; Schramm & Hartmann, 2008). This article makes
interchangeable use of both terms.
Different dimensions are a part of the concept PSI. Auter and Palmgreen (2000) pointed out
the following four sub-dimensions: identification with a media character, interest in the media
character, group identification/ interaction and media character problem solve ability. Reiss
and Wiltz (2004) observed amongst other sub-dimensions also the dimensions sexual
attraction (or romantic desire for sex) and social contact (people like to talk about) as
important factors for the consuming of RTV.
PSI is correlated with factors as the amount of TV viewing and the perceived realism.
According to Rubin and Perse (1987, p. 250) perceived realism predicts parasocial
interaction. This is also supported by Auter and Palmgreen (2000) (identify scale: r = .25, p <
.01). Thus, if RTV is perceived as relatively real, measures of PSI should be high.
Furthermore, Conway & Rubin (1991) confirmed that PSI is significantly correlated with TV
viewing in general. Higher TV viewing is related to the perceived realism, which also
correlates significantly with PSI (r =.26, p < .01) as written about by Auter and Palmgreen
(2000) and supported by Giles (2002).
To summarize, the amount of general TV viewing and the perceived realism is closely related
to the measured values on the PSI scales.
2.5 Identification (ID)
The first part of this paragraph compares ID with PSI. Next, the sub-dimensions of ID are
described, followed by past findings of their impact on watching TV programs.
Cohen (2006) defines identification as “an imaginative process in which we adopt a
character’s point of view and develop an empathic understanding of his or her plight and
motivations” (Cohen, p. 194). In the literature the concept of identification seems not to be
clearly separated from PSI. For example, Tian and Hoffner (2010, p. 261) found significant
correlations between those concepts. Other authors even uses identification as a sub-
dimension of PSI (Auter & Palmgreen, 2000; Giles, 2002).
Giles (2002) attempted to make a clear distinction between the two concepts; he referred to
Rosengren & Windahl (1972) and stated “PSI could be identified when a viewer interacted
with a media figure, but did not identify with the figure”. In other words, for ID the viewer
needs to be absorbed into the program and loose himself in the process of identifying with a

9
character, while for a relationship a conscious self is needed (Cohen, 2001). In this way
identification with media characters is a different type of reaction to media; it is “to become
one” with a media character.
There are four dimensions of identification defined by Cohen (2001): empathy, cognitive
sharing of perspectives (also called cognitive-emotional ID), motivational sharing of goals
and absorption. Other sub-dimensions are social comparison (Baruh, 2010; Gleich, 2001),
cognitive-emotional ID (Chory-Assad & Ciccirillo, 2005; Cohen, 2001; Godlewski & Perse,
2010) and similarity ID (Auter & Palmgreen, 2000; Chory-Assad & Ciccirillo, 2005; Tian &
Hoffner, 2010).
Support for the ID motive as a variable to watch RTV was found by different authors.
According to Cohen (2006), the most important predictor of ID is similarity and homophile
with the TV characters or the situations in which the characters are placed. Reiss & Wiltz
(2004) found the joy “self-importance” (motive: status) to have a significant effect on the
enjoyment of RTV. This could be because ordinary people are an important factor why people
watch reality TV programs, as the audience “see people like themselves, and fantasize that
they could gain celebrity status by being on television” (Reiss & Wiltz, 2004, p. 374).
Furthermore, self-realization or personal enhancement (working on the own identity), is
correlated to the need for entertainment (Vorderer, 2001). As a result, RTV viewers are
expected to show a high ID with the characters and since ID is correlated with enjoyment,
high ID values should result in a high program rating.
On the other hand, since the situation and the characters are not expected to be exactly the
same as the viewers (i.e. educational level of the characters, which is somewhat lower in “Oh
Oh Cherso/Tirol), only viewers with a somewhat lower educational level are expected to
watch the format because they could more identify with them. If they watch the format, but
can not identify with the characters, another factor (e.g. U&G motives) has to be the reason
for watching. Furthermore, Baruh (2010) showed social comparison as a factor for watching
fictional TV, but did not find significant support for RTV ( = .07, ns). Thus, the concept of
ID with RTV characters seems questionable reason for watching RTV soaps.
To conclude, it is expected to find a positive correlation between PSI and ID. Yet, the author
does not expect to find significant support for ID as the only explaining variable for the
viewing frequency or program rating of RTV programs.

10
3. Research questions and hypotheses
The discussed literature supports the U&G perspective as the probably most important
psychological variable for watching RTV, although there is some discussion about the impact
of PSI and ID. Thus, in line with the review of the literature the following research questions
were defined:
Research question one - Which psychological factor explains the viewing of RTV soaps most:
U&G motives, PSI or ID?
H1a: The average scores on the U&G motives scales are higher than on the scales for PSI,
while the average scores on PSI are higher than the scores on ID.
H1b: The psychological variables U&G, PSI and ID, have different effects on the program
rating.
Research question two - Which influence has perceived realism in the research findings?
H2a: The perceived realism is higher than 3.5 (average of the scale).
H2b: The more often a program is seen, the more real it is perceived.
H2c: Perceived realism is significantly correlated to the findings on the psychological
variables.
4. Method & instrumentation
4.1 Participants
The sample included 149 adults, whereof 93 filled in the whole questionnaire and thus, were
counted as valid. Out of the valid responses 46.2% were female (n = 43) and 51.6% male (n =
48). The sample mean age was 30.2 years (SD=10.79) and 77.4% (n = 113) of the participants
filled in the Dutch version, 22.6% the German version (n = 33). Most respondents were
working (28.8%, n = 42), 17.1% students (n = 25) or were working students (n = 19, 13%).
The gross of participants are or were students at the university (n = 50, 34.0%).
Most respondents knew at least one of the three presented programs (n = 123). Out of this
group 41% answered the questionnaire about the program “Boer zoekt vrouw” (n = 60), and
27% (n = 40) chose “Oh Oh Cherso/Tirol” (both are Dutch formats and only presented in the

11
Dutch questionnaire) and 15.8% (n = 23) answered for “Bauer sucht Frau” (German format,
the only format presented in the German questionnaire).
4.2 Procedure
Data was collected in June and July 2012 and were gathered via self-report online
questionnaires. The survey took 10-20 minutes to complete and was provided in two
languages; the Dutch audience got a Dutch questionnaire while the German audience got the
German version.
Participants were asked to participate by advertising the questionnaire on social media sites
(i.e. facebook, twitter and hyves) and the community3 of the fan page of “Boer zoekt vrouw”,
provided by the KRO. “Oh Oh Cherso/ Tirol” did not had an official fan community.
Furthermore, participants were contacted by email, wherein the receivers were asked to invite
their friends and family as well. This would enhance the personal chance to win a voucher of
an online warehouse. Participation in this study was voluntary.
4.3 Measurement
The questionnaire was developed based on scales found as useful in the past for the
measurement of psychological variables and media motives (Conway & Rubin, 1991, p. 450).
The scales U&G viewing motives, PSI and ID with media characters were measured by a 7
point Likert scale, where higher values represent a higher agreement with the items.
Additionally questions about their knowledge of the programs, watch-frequency, program
rating (from 1 to 10, where higher values represent a higher rating), their favorite RTV
character, perceived realism (seven-point-Likert scale), and the general TV viewing was
included next to demographic questions about gender, age, education and working status.
All scales were translated from English to Dutch and German, except from the PSI scale by
Hartmann & Goldhoorn (2011), which already used a validated Dutch version, and thus, only
needed to be translated to German. To reach a better fit with the RTV soap context, some
items were slightly adapted.
3 http://community.kro.nl/boer_zoekt_vrouw/default.aspx

12
4.3.1 U&G Motives
Motives as U&G are measured by the scale of Papachassi & Mendelson (2007, p. 362), who’s
original items already were successfully used by different authors (Conway & Rubin, 1991;
Godlewski & Perse, 2010; Rubin, Perse, & Powell, 1985). Unless otherwise noted, all U&G
sub-scales were adapted from Godlewski and Perse (2010).
Six items were added to measure reality entertainment. Items included statements like “I
watch the RTV soaps because it is enjoyable” or “because it’s exiting”. All items were
compiled into a mean index ( = . 79, M = 4.54, SD = 1.25).
Relaxation was measured with four statements as “I watch it because it gives me something to
occupy my time” and “So I can forget about school, work, or other things”. All items were
compiled into a mean index ( = .81, M = 3.99, SD = 1.43).
Four items were included to measure habitual pass time. After scale reliability analyses only
tree items were significant correlated at a p < 0.01 level, thus only the three highly correlating
items were taken into account for further analyses and compiled into a mean index ( = .69,
M = 3.16, SD = 1.45). An example of the statements is “it’s a habit, just something that I do”.
Companionship was measured by three statements as “it makes me feel less lonely” or “so I
won’t have to be alone”. All tree items were compiled into a mean index ( = .87, M = 1.78,
SD = 1.14).
Three items were replied to measure social interaction. Items included statements like „So I
can be with other family or friends” and “so I can talk with other people about what’s on TV”.
All items were compiled into a mean index ( = .78, M = 2.86, SD = 1.55).
Because of the conflicting findings about voyeurism, this sub-dimension was measured by
items from different authors. First, the two-item statements used by Godlewski and Perse
(2010) (called here voyerismUG) ( = .50), second the five inter-correlating items by Nabi et
al. (2003) are included (three items, called voyerism, = .81 and two items called
voyerismBM, = .62). Example of the statements: “I find the characters attractive” and
“when I watch that program, I get to see a side of people that I wouldn’t normally get to see”.
Items of these different scales differed much in inter-correlation, thus only the three item scale
“voyeurism” by Nabi et al. (2003) was taken into account for further analysis. These three
items were compiled into a mean index ( = .81, M = 1.78, SD = 1.14).
13
Downward social comparison, only used by Nabi et al. (2003), was measured with the two
items “I feel better about myself after watching the people on that program” and “My
problems don’t seem so bad after I see what happens in the lives of the people on that
program”. Both items were compiled into a mean index ( = .70, M = 2.81, SD = 1.51).
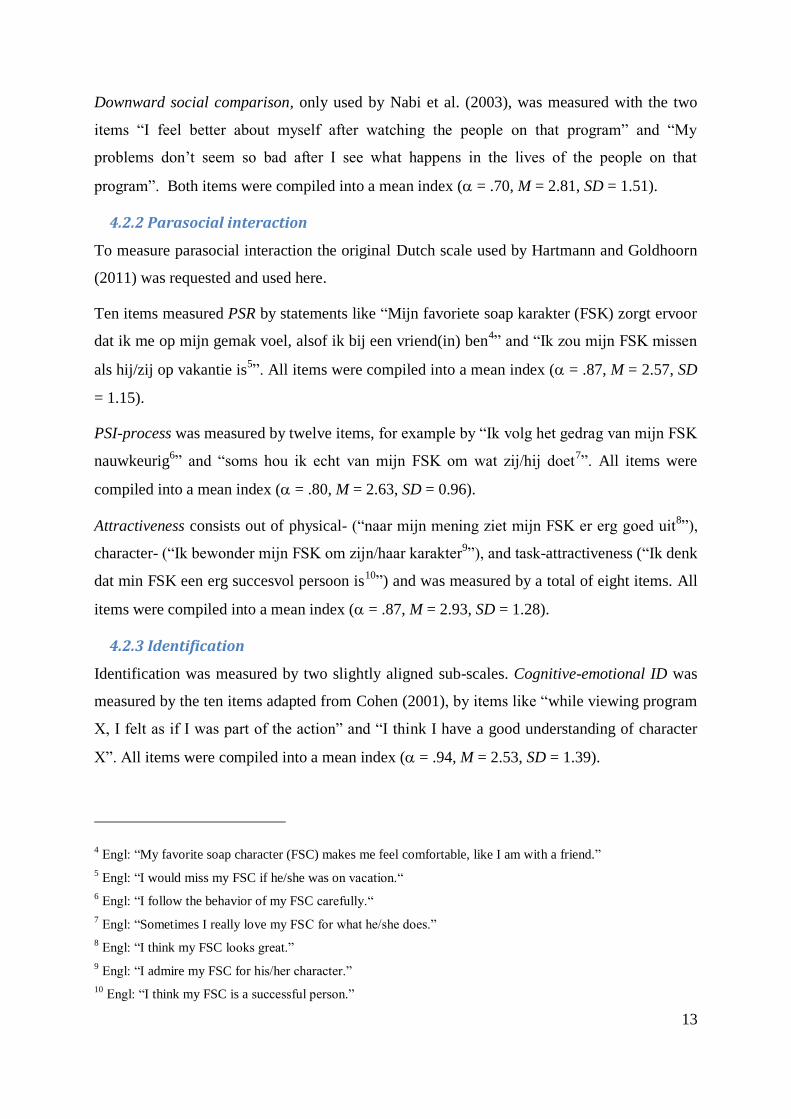
4.2.2 Parasocial interaction
To measure parasocial interaction the original Dutch scale used by Hartmann and Goldhoorn
(2011) was requested and used here.
Ten items measured PSR by statements like “Mijn favoriete soap karakter (FSK) zorgt ervoor
dat ik me op mijn gemak voel, alsof ik bij een vriend(in) ben4” and “Ik zou mijn FSK missen
als hij/zij op vakantie is5”. All items were compiled into a mean index ( = .87, M = 2.57, SD
= 1.15).
PSI-process was measured by twelve items, for example by “Ik volg het gedrag van mijn FSK
nauwkeurig6” and “soms hou ik echt van mijn FSK om wat zij/hij doet
7”. All items were
compiled into a mean index ( = .80, M = 2.63, SD = 0.96).
Attractiveness consists out of physical- (“naar mijn mening ziet mijn FSK er erg goed uit8”),
character- (“Ik bewonder mijn FSK om zijn/haar karakter9”), and task-attractiveness (“Ik denk
dat min FSK een erg succesvol persoon is10
”) and was measured by a total of eight items. All
items were compiled into a mean index ( = .87, M = 2.93, SD = 1.28).
4.2.3 Identification
Identification was measured by two slightly aligned sub-scales. Cognitive-emotional ID was
measured by the ten items adapted from Cohen (2001), by items like “while viewing program
X, I felt as if I was part of the action” and “I think I have a good understanding of character
X”. All items were compiled into a mean index ( = .94, M = 2.53, SD = 1.39).
4 Engl: “My favorite soap character (FSC) makes me feel comfortable, like I am with a friend.”
5 Engl: “I would miss my FSC if he/she was on vacation.“
6 Engl: “I follow the behavior of my FSC carefully.“
7 Engl: “Sometimes I really love my FSC for what he/she does.”
8 Engl: “I think my FSC looks great.”
9 Engl: “I admire my FSC for his/her character.”
10 Engl: “I think my FSC is a successful person.”
14
To measure similarity ID seven-items like “my favor soap character reminds me of myself”
and “I seem to have the same beliefs or attitudes as my favor soap character” adapted from
Auter and Palmgreen (2000) were used. All items were compiled into a mean index ( = .95,
M = 1.99, SD = 1.32).
4.2.4 Perceived realism
Perceived realism was measured by nine items adapted from Green (2004) like “the dialogue
in the narrative is realistic and believable” and “the setting for the narrative just doesn’t seem
real”. All items were compiled into a mean index ( = .71, M = 3.58, SD = 0.91).
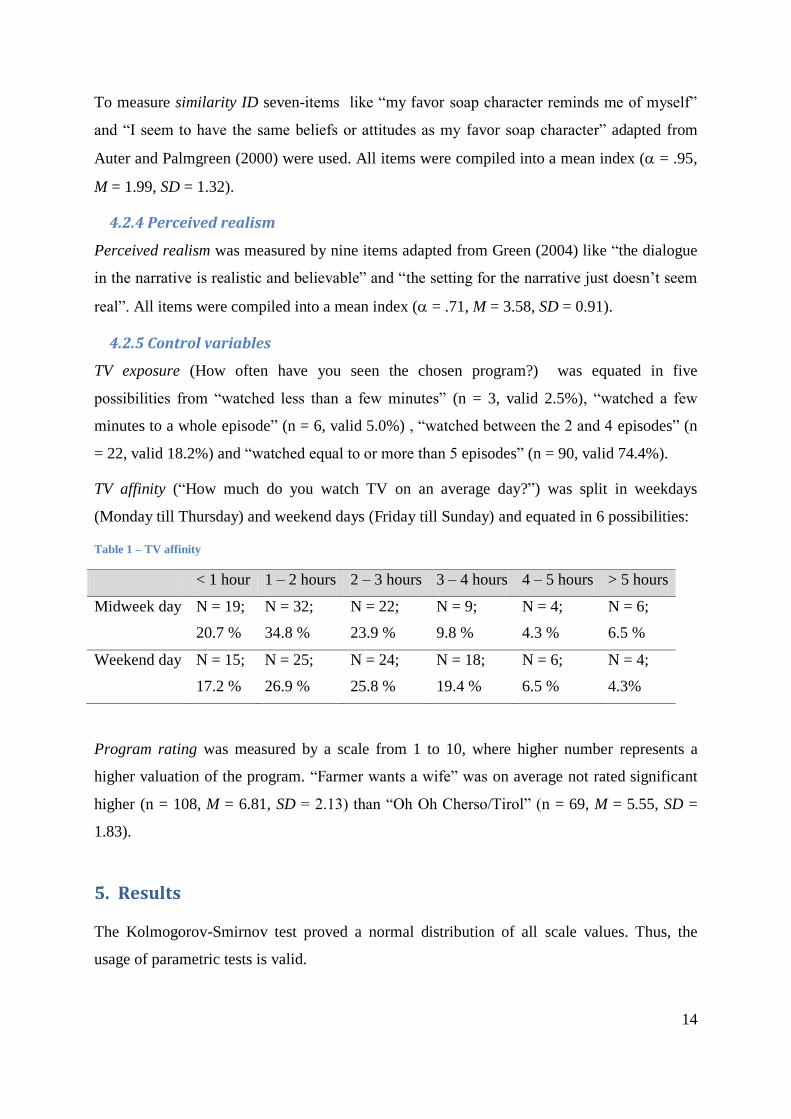
4.2.5 Control variables
TV exposure (How often have you seen the chosen program?) was equated in five
possibilities from “watched less than a few minutes” (n = 3, valid 2.5%), “watched a few
minutes to a whole episode” (n = 6, valid 5.0%) , “watched between the 2 and 4 episodes” (n
= 22, valid 18.2%) and “watched equal to or more than 5 episodes” (n = 90, valid 74.4%).
TV affinity (“How much do you watch TV on an average day?”) was split in weekdays
(Monday till Thursday) and weekend days (Friday till Sunday) and equated in 6 possibilities:
Table 1 – TV affinity
< 1 hour 1 – 2 hours 2 – 3 hours 3 – 4 hours 4 – 5 hours > 5 hours
Midweek day N = 19;
20.7 %
N = 32;
34.8 %
N = 22;
23.9 %
N = 9;
9.8 %
N = 4;
4.3 %
N = 6;
6.5 %
Weekend day N = 15;
17.2 %
N = 25;
26.9 %
N = 24;
25.8 %
N = 18;
19.4 %
N = 6;
6.5 %
N = 4;
4.3%
Program rating was measured by a scale from 1 to 10, where higher number represents a
higher valuation of the program. “Farmer wants a wife” was on average not rated significant
higher (n = 108, M = 6.81, SD = 2.13) than “Oh Oh Cherso/Tirol” (n = 69, M = 5.55, SD =
1.83).
5. Results
The Kolmogorov-Smirnov test proved a normal distribution of all scale values. Thus, the
usage of parametric tests is valid.

15
5.1 Research question one
Hypotheses H1a: „The mean scores on the U&G motives scales and the sub-scales are higher
than on the scales and sub-scales of PSI and ID“, could be confirmed.
As expected, the highest mean scores were found on the U&G gratifications scales (M = 3.33,
SD = .79), followed by the scores on the PSI scales (M = 2.65, SD = 1.01) and the lowest
scores were measured on the ID scale (M = 226, SD = 1.16). The paired differences of the
variables U&G & PSI (M = 0.72, SD = .82), PSI & ID (M = 0.36, SD = .69), and U&G & ID
(M = 1.07, SD = .93) were al significant at p < .001. In other words, viewers watched RTV
soaps because of U&G motives, than of PSI, and even less because they could identify with
the characters of the RTV soaps.
With regression analysis the predictive values of the psychological variables on the program
rating was measured. Here, the compiled means on the U&G scale explained 18.5% (adjusted
R²) the variance in the program rating (F (1, 91) = 21.8, p < 0.001). Compared to PSI, which
explains 13.8% of the variance on the rating, with F (1, 67) = 11.9, p < .001 and ID, which
explains 11.7% of the variance, F(1, 75) = 11.1, p < .001. The means on the three
psychological variables together explained 17.9% of the rating variance, with F(3,63) = 5.8,
p<0.001. In other words, the values of the U&G could explain most of the differences
between the program ratings, followed by values found with the PSI scales then ID scales.
Hypotheses H1b: “The psychological variables U&G, PSI and ID, have different effects on
the program rating“, could be confirmed.
With regression analysis the subscales were examined on their accountability of program
rating variance.
Uses & Gratifications in sub-dimensions
Regression analysis results for reality entertainment showed a significant effect on the
program rating; F(1,102) = 118.4; p < .001, thus explained 53.3% of the variance.
The construct U&G, relaxation explained 33.1 % of the program rating variance, F(1,101) =
51.5; p < .001.
With 9.4% the sub-dimension habitual pass time counted for the program rating variance,
with F(1,95) = 10.95; p < .001.

16
Companionship explained less than < 1.0% of the program rating variance, and there was no
significant regression found, F(1,95) = 0.109; p = 0.74 (ns).. The same counts for social
interaction, as it explained less than 1.0% of the program rating variance, F(1,95) = 1.31; p <
.25 (ns).
Voyerism explained 21.6% of the program rating variance; F(1,91) = 26.4, p < .001.
With 9.6% of the rating variance and F(1,91) = 10.8, p < .001 downward-social comparison
was accountable.
On the whole, within the U&G perspective the sub-dimensions reality entertainment,
relaxation and voyeurism are the most important factors for the prediction of the RTV
program rating.
Parasocial interaction
The values on the sub-scale for PSI could explains 17.3% of the valuation variance, with
F(1,73) = 16,5, p < .001, while parasocial-processes with 2.5% on F(1,77), p < .09 was not
significant, as well as the quite low accountability of attractiveness of 8.3%, but well
significant on F(1,77), p < .01.
Identification
Cognitive-emotional ID with F(1,75) = 18.7, p < .001 explained 18.9% of the variance in
program valuation, while similarity ID was not significant (p =.15), F(1,75) = 2,1 and
explained only 1.4% of the variance in program rating.
To conclude, also if the scores on the subscale PSI as well as cognitive emotional ID
explained part of the variance on the program rating, the U&G sub-dimensions reality
entertainment, relaxation and voyeurism explained most of the variance.
Control variables
Gender was not significantly correlated with neither the rating on the program, the program
choice, watch-frequency, nor with the scores on the subscales, except for parasocial-processes
(r = . 26, p < .05; female: n = 32, M = 2.36, SD = .91; male: n = 40, M = 2.86, SD = .93).
Viewing frequency of the program was found to be significantly positively correlated with
program value (r = .56, p < .01), and the number of hours spent watching TV on weekdays (r
= .33, p < .01) and in the weekend (r = .31, p < .01). Thus, viewing frequency is accountable
for 31.4% of the variance in program value ( F(1,119) = 55.8).

17
Significant correlations were found between the program choice (BZV, OhOh and BSF) and
several sub-dimensions of U&G (e.g. relaxation, pass time, voyeurism) and all scales of PSI
and ID (see appendix for more detailed correlations). Thus, the program format seems also to
be important in comparison to what Nabi et al. (2003) found.
Since the U&G sub-dimensions relaxation and voyeurism accounts most for the differences in
RTV viewing and valuation, these two were analyzed in more detail here: BZV (n = 46, M =
4.6, SD = 1.29) had significant higher values on the relaxation scale than OhOh (p < .001; n =
36, M = 3.6, SD = 1.15) and BSF (p < 0.01; n = 21, M = 3.5, SD = 1.80), while the differences
between OhOh and BSF were not significant (p = 0.81). On the voyeurism scale the programs
had the following differences: BZV (n = 41, M = 5.0, SD = 1.21) got significantly higher
scores (p < 0.001) on the scale than OhOh (n = 33, M = 3.4, SD = 1.49) and BSF (N = 19, M =
3.7, SD = 1.44). The differences between OhOh and BSF were not significant (p = .52).
There was a significant correlation found between FAV and all three subscales of PSI (.001 <
p < .05). Most often the RTV soap character BZV Gijsbert (n = 14, 15.4% valid) was chosen.
Followed by OhOh Matsoe Matsoe (n = 12, 13.2% valid), BZV Frank (n = 7, 7.7% valid) and
OhOh Jokertje (n = 5, 5.5% valid). But due to too much different FAV choices, no more
detailed significant correlation between character and the PSI subscales could be found.
5.2 Research question two
In order to examine research question two, “Which influence has perceived realism on the
research findings?”, the following hypotheses are tested.
Hypotheses H2a: „ The perceived realism is higher than 3.5 (average of the scale)“, could not
be confirmed.
With a t-test for one group the scores on the realism scale were tested and results showed no
significant higher means than M = 3.5 (p = .43 two-tailed, mean difference = .08) in the whole
group. Only if differentiated between groups by viewing frequency of the chosen program,
there were a significant difference found between “more than 5 times” and perceived realism
higher than M = 3.5 (N = 58, M = 3.75, SD = .57, p < .01).
Hypotheses H2b: “The more often a program is seen, the more real it is perceived “, could be
confirmed.
18
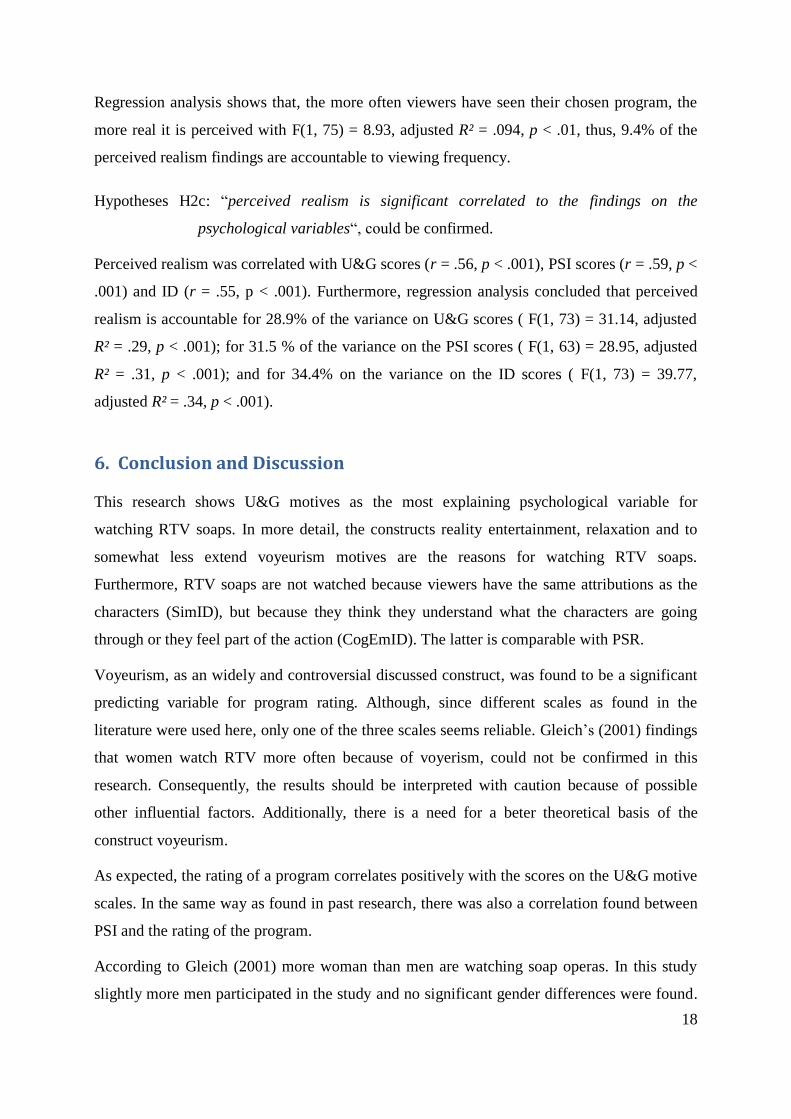
Regression analysis shows that, the more often viewers have seen their chosen program, the
more real it is perceived with F(1, 75) = 8.93, adjusted R² = .094, p < .01, thus, 9.4% of the
perceived realism findings are accountable to viewing frequency.
Hypotheses H2c: “perceived realism is significant correlated to the findings on the
psychological variables“, could be confirmed.
Perceived realism was correlated with U&G scores (r = .56, p < .001), PSI scores (r = .59, p <
.001) and ID (r = .55, p < .001). Furthermore, regression analysis concluded that perceived
realism is accountable for 28.9% of the variance on U&G scores ( F(1, 73) = 31.14, adjusted
R² = .29, p < .001); for 31.5 % of the variance on the PSI scores ( F(1, 63) = 28.95, adjusted
R² = .31, p < .001); and for 34.4% on the variance on the ID scores ( F(1, 73) = 39.77,
adjusted R² = .34, p < .001).
6. Conclusion and Discussion
This research shows U&G motives as the most explaining psychological variable for
watching RTV soaps. In more detail, the constructs reality entertainment, relaxation and to
somewhat less extend voyeurism motives are the reasons for watching RTV soaps.
Furthermore, RTV soaps are not watched because viewers have the same attributions as the
characters (SimID), but because they think they understand what the characters are going
through or they feel part of the action (CogEmID). The latter is comparable with PSR.
Voyeurism, as an widely and controversial discussed construct, was found to be a significant
predicting variable for program rating. Although, since different scales as found in the
literature were used here, only one of the three scales seems reliable. Gleich’s (2001) findings
that women watch RTV more often because of voyerism, could not be confirmed in this
research. Consequently, the results should be interpreted with caution because of possible
other influential factors. Additionally, there is a need for a beter theoretical basis of the
construct voyeurism.
As expected, the rating of a program correlates positively with the scores on the U&G motive
scales. In the same way as found in past research, there was also a correlation found between
PSI and the rating of the program.
According to Gleich (2001) more woman than men are watching soap operas. In this study
slightly more men participated in the study and no significant gender differences were found.

19
As Giles (2003, p. 256) stated, perhaps indeed more men get interested in RTV soaps because
of its factual television character, since men traditionally seemed to be interested more in
factual television (e.g. sports or news) in the past.
In this study the participated group with a mean age of 30,16 (SD=10,79) is slightly older but
close to what Gleich (2001) stated the target group of soap operas are (between 14 and 29
years old).
As Nabi et al. (2003) stresses, this research showed evidence for the importance of program
format rather than genre. As the comparisons of the formats shows, there were differences in
rating as well as other factors found between the programs.
Overall, the RTV soaps are watched because of their specific provided gratifications and thus,
are in line with what past research has found to be the motives of watching reality TV
programs in general. Further research is needed to compare RTV soaps witch fictional TV
soaps in more detail.
7. Implications for television producers
There is a twofold of suggestions for program producers. First, keep the perceived realism of
probably new RTV soaps high, and second, enhance the possibility for PSI and ID of viewers
to the media characters.
In order to get higher program rates, and accordingly, higher watch frequencies, it is advised
to keep the perceived realism high. This is because regression analysis showed a positive
relationship between perceived realism and program rating (F(1,75) = 5.96, adjusted R² = .07,
p < .05). This could be done by making sure that people know it is a non-scripted program,
for example by mentioning that in advertisements, discussions about the realism on social
media (i.e. facebook and twitter), or ask actors and other personel to write blogs on the
internet about the realism of the program. Yet, more research is needed to test these methods
for their usability and reliability.
By providing more possibilities for ID and PSI, program producers could make the RTV
programs more like a common fictional soap (e.g. cast the same characters in more than just
one season, therefore they will become more like regular friends and thus hold a greater
chance for parasocial relationships) and make extensive use of the internet (e.g. set up internet
communities concerning the program in question). Personal information about the media

20
characters can enhance this connection. (maar ik snap niet hoe die met de volgende zin te
maken heeft??) For example, for the program OhOh no official well administered fan page
could be found in contrary to BZV; KRO has got a very well administered official fan page
with a many users. This may be one of the reasons why for the program BZV showed
significant higher PSI (M of difference = .58, SD of difference = .27, p < .05 two tailed), and
ID (M of difference = .82, SD of difference = .30, p < .01 two tailed). This difference was also
shown between BZV and BSF, which had a fan page that was used scarcely (for PSI: M of
difference = 1.23, SD of difference = .29, p < .001 two tailed; for ID: M of difference = 1.17,
SD of difference = .36, p < .01 two tailed). As one example, it was very difficult on the Oh Oh
and BSF fan page to get to know the age of all media characters. Although, needs to be done
to confirm the relationship of making use of the fan pages and higher ID or PSI with media
characters.
To conclude, program directors are advised to expand the non-fictional character of the RTV
soaps, and furthermore, to set up a broad platform (i.e. on the internet) for a fan community to
enhance the possibility of PSI and ID with media characters.
8. Limitations
Since the respondents are perhaps not representative for the program viewers’ population, all
findings need to be interpreted with caution. Here more students answered the questionnaire,
which might not be representative for the general viewer population of RTV soaps. Although
here no significant differences between working status and program valuation or between the
three psychological variables and working status were found, it might be the case in a bigger,
more representative sample. Further research is needed to examine this influence.
Different scale items issues might happen. For example there might be influences because of
the fact of translation of the items from English to Dutch and German.
The format of FWW as a dating soap might be more appreciated by singles than by married
viewers. Thus, since the marital status was not included in this study, especially simID might
be different between singles and married viewers. It is advisable to include marital status in
further research.
The placement of this research in time could have been better chosen. The last season of both
programs was broadcasted a while ago, thus perhaps the memories of the respondents are less
21
accurate, which might influence the findings of notably ID and PSI. The new season of BZV
had just started with the cast for new wives, but a regular episode of the new season had not
aired yet. Thus, the findings for PSI might be affected, since PSI needs time to develop
(Cohen, 2001). Maybe a better point of time could have been after the third or fourth episode
for a much stronger correlation between PSI and ID with RTV viewing.
Furthermore PSI depends on the types of media figures. Thus, there will probably be a
difference between the chosen characters and the accountability for variance of PSI found
here (Green, 2004). Since there was a significant correlation found between PSI and character
choice, but there were too many different characters, thus too little viewers chose for the same
character, the findings of Green (2004) could not be replicated with this research design.
9. Acknowledgements
First and foremost, I would like to thank my supervisors of this research, Dr. Ard Heuvelman
and Dr. Piet Kommers, for their always very fast and valuable guidance and advice about all
my questions during this research project.
Besides, I would like to thank my friends Heleen, Jeroen, Jutta, Kyra, Maike, Patricia and
Robertjan for their answers on my questions, critical feedback, tips and support with
translational issues.
Furthermore, I would like to thank my family and friends, especially Erika, Tina and Monika,
for their never ending trust in my abilities and their emotional as well as financial support
during the whole time of my bachelor study.
Last but not least, I would like to thank my friends, for broadcasting my questionnaire on
facebook, Twitter and by email.

22
10. References
Auter, P. J., & Palmgreen, P. (2000). Development and validation of a parasocial interaction measure: The audience-persona interaction scale. Communication Research Reports, 17, 79-89.
Baruh, L. (2010). Mediated Voyeurism and the Guilty Pleasure of Consuming Reality Television. Media Psychology, 13, 201-221.
Chory-Assad, R. M., & Ciccirillo, V. (2005). Empathy and Affective Orientation as Predictiors of Identification with Television Characters. Communication Research Reports, 22(2), 151-156.
Cohen, J. (2001). Defining Identification: A Theoretical Look at the Identification of Audiences With Media Characters. Mass Communication and Society, 4(3), 245-264.
Cohen, J. (2006). Audience Identification with Media Characters. In J. Bryant & P. Vorderer (Eds.), Psychology of Entertainment (pp. 183 - 198). London: Lawrence Erblaum Associates.
Cohen, J. (2009). Mediated Relationships and Media Effects. In R. L. Nabi & M. B. Oliver (Eds.), The Sage Handbook of Media Processes and Effects (pp. 223-236). Los Angeles: SAGE Publications
Conway, J. C., & Rubin, A. M. (1991). Psychological Predictors of Television Viewing Motivation. Communicaiton Research, 18(4), 443-463.
Giles, D. C. (2002). Parasocial interaction: A review of the literature and a model for future research. Media Psychol., 4(3), 279-304.
Giles, D. C. (2003). Media Psychology. Mahwah, New Jersey: London: Lawrence Erlbaum Associates. Gleich, U. (2001). Populäre Unterhaltungsformate im Fernsehen und ihre Bedeutung für die
Zuschauer - Forschungsüberblick zu Nutzungsmotiven, Funtionen und Wirkungen von Soap Operas, Talkshows und Reality-TV. Media Perspektiven, 10, 524-532.
Godlewski, L. R., & Perse, E. M. (2010). Audience Activity and Reality Television: Identification, Online Activity and Satisfaction. Communication Quaterly, 58(2), 148-169.
Green, M. C. (2004). Transportation Into Narrative Worlds: The Role of Prior Knowledge and Perceived Realism. Discourse Processes, 38(2), 247-266.
Hall, A. E. (2009). Perceptions of Media Realism and Reality TV. In R. L. Nabi & M. B. Oliver (Eds.), The Sage Handbook of Media Processes and Effects (pp. 423-438). Los Angeles, CA etc.: Sage Publications
Hall, A. E., & Bracken, C. C. (2011). ‘‘I Really Liked That Movie’’. Testing the Relationship Between Trait Empathy, Transportation, Perceived Realism, and Movie Enjoyment. Journal of Media Psychology, 23(2), 90–99.
Hartmann, T., & Goldhoorn, C. (2011). Horton and Wohl Revisited: Exploring Viewer's Experience of Parasocial Interaction. Journal of Communication, 61, 1104-1121.
Horton, D., & Strauss, A. (1957). Interaction in audience-participation shows. American Journal of Sociology, 579-587.
Horton, D., & Wohl, R. R. (1956). Mass Communication and Para-Social Interaction. Psychiatry, 19, 215-229.
Klimmt, C., Hartmann, T., & Schramm, H. (2006). Parasocial Interactions and Relationships. In J. Bryant & P. Vorderer (Eds.), Psychology of Entertainment (pp. 291 - 314). London: Lawrence Erlbaum Associates.
Krüger, U. M. (2010). Factual Entertainment - Fernsehunterhaltung im Wandel. Media Perspektiven, 4, 158-181.
Lundy, L. K., Ruth, A. M., & Park, T. D. (2008). Simple Irresistible: Reality TV Consumption Patterns. Communication Quaterly, 56(2), 208-225.
Nabi, R. L., Biely, E. N., Morgan, S. J., & Stitt, C. R. (2003). Reality-based television programming and the psychology of its appeal. Media Psychol., 5(4), 303-330.
Nabi, R. L., Stitt, C. R., Halford, J., & Finnerty, K. L. (2006). Emotional and Cognitive Predictors of the Enjoyment of Reality-Based and Fictional Television Programming: An Elaboration of the Uses and Gratifications Perspective. Media Psychology, 8, 421-447.

23
Papacharissi, Z., & Mendelson, A. L. (2007). An exploratory study of reality appeal: Uses and gratifications of reality TV shows. Journal of Broadcasting & Electronic Media, 51(2), 355-370.
Reiss, S., & Wiltz, J. (2004). Why people watch reality TV. Media Psychol., 6(4), 363-378. RTL. (2011, 20.12.2011). Guter Abschluss für "Bauer sucht Frau" - Das ist aus den Paaren der siebten
Staffel geworden Retrieved 3 august, 2012, from http://kommunikation.rtl.de/de/pub/aktuell/i33037_1.cfm
Rubin, A. M. (Ed.). (2009). Uses and gratifications - An evolving perspective of media effects. Thousands Oaks, California et al. : Sage Publications, Inc. .
Rubin, A. M., & Perse, E. M. (1987). Audience Activity and Soap Opeara Involvement - A Uses and Effects Investigation. Human Communication Research, 14(2), 246-268.
Rubin, A. M., Perse, E. M., & Powell, R. A. (1985). Loneliness, parasocial interaction and local television news viewing. Human Communication Research, 12, 155-180.
Schramm, H., & Hartmann, T. (2008). The PSI-Process Scales. A new measure to asses the intensity and breadth of parasocial processes. Communications, 33, 385-401.
Tian, Q., & Hoffner, C. A. (2010). Parasocial Interaction With Liked, Neutral, and Diskliked Characters on a Popular TV Series. Mass Communicaiton & Society, 13, 250-269.
Vorderer, P. (2001). It's all entertainment - sure. But what exactly is entertainment? Communication reserach, media psyhology, and the explanation of entertainment experiences. Poetics, 29, 247-261.

24
11. Appendix
Abbreviations
Program related abbreviations
BZV = the Dutch program format “Boer zoekt vrouw”
BSF = the German program format “Bauer sucht Frau”
FWW = the program format “Famer wants a wife”, here representative for the
combined measures on BZV and BSF
OhOh = the Dutch program “Oh Oh Cherso /Tirol“
RTV = reality TV program genre
Soaps = soap operas
FAV = Favorite soap character
Psychological concepts/ perspectives
PSI = parasocial interaction
ID = identification with media characters
U&G = Uses and Gratifications perspective
Scales
REnt = reality entertainment
Relax = relaxation
PassTime = (habitual) pass time
Comp = companionship
SI = social interaction
VoyerismUG = Voyeurism scale by Godlewski and Perse (2010) (excluded)
Voyerism = voyeurism scale by Nabi et al. (2003)
VoyerismBM = behavior monitoring by Nabi et al. (2003) ( exluded)
DSC = downward social comparison
PSI = parasocial interaction
PSProcess = parasocial processes
PSA.ALL = Attractiveness scale (physical, charater and task attractiveness)
IDcogEm = cognitive-emotional identification
IDsim = similarity identification
Real = perceived realism

25
Reliability of scales and compiled means correlation
Table 1 – Reliability Measurement Summary
Measures Items valid N M Variance Cronbachs
U&G Motives
Reality Entertainment 6 104 4.55 0.49 .79
Relaxation 4 104 3.95 0.18 .81
Habitual Pass Time (deleted1) 3 98 3.13 0.18 .69
Companionship 3 98 1.76 0.12 .87
Social Interaction 3 98 2.83 0.11 .78
Voyerism 3 94 4.14 0.05 .81
Downward Social Comparison 2 94 2.78 0.29 .70
Parasocial Interaction
Parasocil
Parasocial interaction 10 75 2.57 0.54 .87
Parasocial Processes 12 80 2.60 0.77 .80
Attractiveness 8 80 2.89 0.68 .88
Identification
Cognitive-emotional ID 10 78 2.49 0.14 .94
Similarity ID 7 78 1.96 0.04 .95
Perceived Realism
Perceived Realism 9 78 3.54 0.31 .71

26
Subscales Correlations Figure 1 - compiled means correlation
27
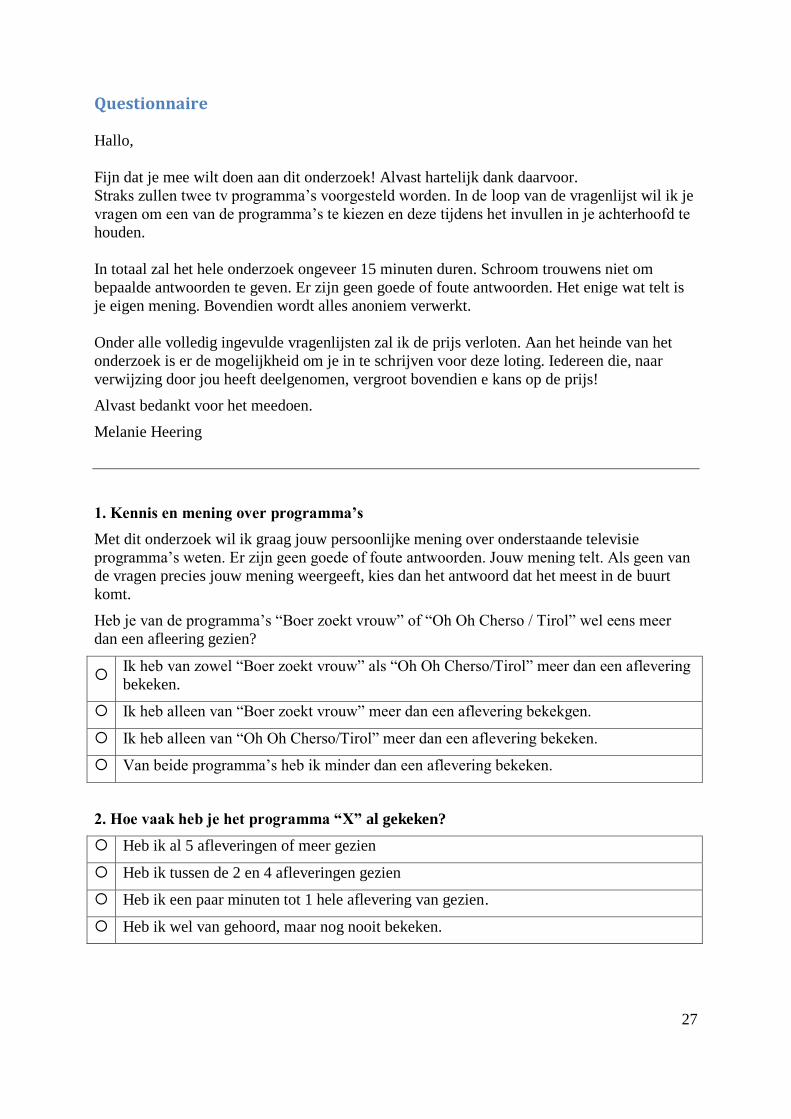
Questionnaire
Hallo,
Fijn dat je mee wilt doen aan dit onderzoek! Alvast hartelijk dank daarvoor.
Straks zullen twee tv programma’s voorgesteld worden. In de loop van de vragenlijst wil ik je
vragen om een van de programma’s te kiezen en deze tijdens het invullen in je achterhoofd te
houden.
In totaal zal het hele onderzoek ongeveer 15 minuten duren. Schroom trouwens niet om
bepaalde antwoorden te geven. Er zijn geen goede of foute antwoorden. Het enige wat telt is
je eigen mening. Bovendien wordt alles anoniem verwerkt.
Onder alle volledig ingevulde vragenlijsten zal ik de prijs verloten. Aan het heinde van het
onderzoek is er de mogelijkheid om je in te schrijven voor deze loting. Iedereen die, naar
verwijzing door jou heeft deelgenomen, vergroot bovendien e kans op de prijs!
Alvast bedankt voor het meedoen.
Melanie Heering
1. Kennis en mening over programma’s
Met dit onderzoek wil ik graag jouw persoonlijke mening over onderstaande televisie
programma’s weten. Er zijn geen goede of foute antwoorden. Jouw mening telt. Als geen van
de vragen precies jouw mening weergeeft, kies dan het antwoord dat het meest in de buurt
komt.
Heb je van de programma’s “Boer zoekt vrouw” of “Oh Oh Cherso / Tirol” wel eens meer
dan een afleering gezien?
Ik heb van zowel “Boer zoekt vrouw” als “Oh Oh Cherso/Tirol” meer dan een aflevering
bekeken.
Ik heb alleen van “Boer zoekt vrouw” meer dan een aflevering bekekgen.
Ik heb alleen van “Oh Oh Cherso/Tirol” meer dan een aflevering bekeken.
Van beide programma’s heb ik minder dan een aflevering bekeken.
2. Hoe vaak heb je het programma “X” al gekeken?
Heb ik al 5 afleveringen of meer gezien
Heb ik tussen de 2 en 4 afleveringen gezien
Heb ik een paar minuten tot 1 hele aflevering van gezien.
Heb ik wel van gehoord, maar nog nooit bekeken.

28
3. Hoe leuk vind je de programma’s?
Geef een cijfer tussen de 1 = “vind ik helemaal niet leuk” en 10 = “vind ik echt leuk”
Boer zoekt vrouw
Oh Oh Cherso/Tirol
4. Jouw reden om het programma “X” te kijken11
Nu wil ik je vragen voor de rest van deze vragenlijst het programma X in je achterhoofd te
houden. Op basis daarvan vraag ik je mening in te vullen. De vragen hieronder gaan over
jouw redenen waarom je het programma X kijkt of waarom je het wel eens hebt gekeken.
Met de cijfers kan je aangeven in hoeverre je het eens bent met de uitspraken, waarbij 1 =
“helemaal niet mee eens” aangeeft en 7 = “helemaal mee eens”.
“Ik kijk graag naar het programma X (omdat)…”
1 2 3 4 5 6 7
1. … echte karakters interessanter zijn dan fictieve karakters
2. … het leuker is dan fictieve programma’s
3. … ik er gewoon graag naar kijk
4. … het mij amuseert
5. … het mij vermaakt
6. … het opwindend is
7. … het rustgevend is
8. … het de mogelijkheid geeft te ontspannend
9. … het een plezierig rustmoment geeft
10. … ik dan zaken die te maken hebben met school, werk en
andere dingen even kan vergeten
11. … het er gewoon is
12. … ik niks anders te doen heb
13. … het me iets geeft om de tijd te vullen
14. … het niks meer dan een gewoonte is
11 Item 1 to 6: reality entertainment; item 7 to 10: relaxation; item 11 to 14: Passtime (while item 11 was
excluded from further analysis); item 15 to 17: companionship; item 18 to 20: social interaction; item 21 and 22:
voyerismUG (voyeurism UG not included in further analysis).

29
15. … het me een minder eenzaam gevoel geeft
16. … ik dan niet alleen hoef te zijn
17. … als er niemand anders is om mee te praten of bij te zijn
18. … ik dan met andere familieleden of vrienden kan zijn
19. … het iets is wat ik met vrienden kan doen
20. … ik dan met andere mensen kan praten over wat er op
televisie wordt uitgezonden
21. … ik de karakters aantrekkelijk vind
22. … het programma seksuele aantrekkingskracht heeft
5. Je gedachten TIJDENS het kijken van programma X12
Met de cijfers kan je aangeven in hoeverre je het eens bent met de uitspraken, waarbij 1 =
“helemaal niet mee eens” aangeeft en 7 “helemaal mee eens”.
1 2 3 4 5 6 7
1. Als ik het programma kijk, krijg ik het gevoel in het leven
van anderen mee te kunnen kijken
2. Als ik het programma kijk, krijg ik een kant van mensen te
zien die ik normaal niet te zien krijg
3. Ik kijk het programma graag omdat je nooit weet wat er
gaat gebeuren.
4. De personen in het programma zijn er niet zo bewust van
dat ze gefilmd worden.
5. De mensen in het programma gedragen zich niet
anders dan ze zich zouden gedragen als er geen
camera’s zouden zijn.
6. Je gedacht en NA het kijken van programma X13
Met de cijfers kan je aangeven in hoeverre je het eens bent met de uit spraken, waarbij 1 =
“helemaal niet mee eens” aangeeft en 7 = “helemaal mee eens”.
1 2 3 4 5 6 7
1. Ik voel me beter, nadat ik de mensen in het programma heb
gezien.
12 Item 1 to 3: voyerism (included in analysis); item 4 and 5 VoyersismBM (excluded from further analysis).
13 Downward social comparison

30
2. Mijn problemen lijken niet zo erg als ik heb gezien wat er
in het leven van de mensen in het programma gebeurt.
7. Je favoriete karakter in programma X
De volgende vragen gaan over je favoriete soap karakter. Hiermee wil ik achterhalen hoe jij je
favoriete karakter in "programma X" ziet en wat voor effect zijn of haar aanwezigheid op je
heeft.
Zijn er meerdere karakters die je graag ziet, kies dan degene die je het meest bijgebleven is op
dit moment. Op de volgende pagina kun je uit de lijst van namen je favoriete karakter kiezen.
Als je de naam niet (zeker) weet, heb je ook de mogelijkheid nog even de foto's en bijhorende
namen te zien.
Weet je de naam van je favoriete karakter?
Ja, ik weet al de naam van mijn favoriete karakter (link naar vraag 8)
Nee, ik zou graag nog even de foto's willen zien (link naar foto’s)
(FOTOS EN NAMEN VAN KARAKTEREN VAN PROGRAMMA X)
8. Wie is jouw favoriet e karakter bij "programma X"?
Om het overzichtelijk te houden, staan hier alleen de meest recente namen in de lijst. Als je
iemand anders uit de serie het liefst zag, kun je het laatste vakje kiezen en de naam invullen.
Karakter A Karakter …
Karakter B Karakter Z
Karakter C Anders, namelijk ___________
9. Jouw favoriete karakter (deel 1 van 3)14
In het vervolg zal de door jou zonet gekozen karakter afgekort worden met “FSK” (=
favoriete soap karakter):
Met de cijfers kan je aangeven in hoeverre je het eens bent met de uit spraken, waarbij 1
=“helemaal niet waar” aangeeft en 7 = “helemaal waar”.
1 2 3 4 5 6 7
1. Mijn favoriete soap karakter (FSK) zorgt ervoor dat ik me
op mijn gemakt voel, alsof ik bij een vriend(in) ben
2. Ik zie mijn FSK als een natuurlijk, nuchtere persoon
3. Ik kijk er naar uit om mijn FSK in de volgende aflevering
te zien
14 Parasocial interaction

31
4. Als mijn FSK in een ander programma zou verschijnen,
zou ik dat programma kijken
5. Mijn FSK lijkt te begrijpen wat voor dingen ik wil weten
6. Als ik een verhaal over mijn FSK in een krant of tijdschrift
zou zien, zou ik het lezen.
7. Ik zou mijn FSK missen als hij/zij ziek of op vakantie is
8. Ik zou mijn FSK in persoon willen ontmoeten
9. Ik voel medelijden met mijn FSK wanneer zij/ hij een
vergissing maakt
10. Ik vind mijn FSK aantrekkelijk
10. Jouw favoriete karakter (deel 2 van 3)15
Ook hier is je favoriet e soap karakter met "FSK" afgekort. Met de cijfers kan je aangeven in
hoeverre je het eens bent met de uit spraken, waarbij 1 = “helemaal niet waar” aangeeft en 7 =
“helemaal waar”.
1 2 3 4 5 6 7
1. Ik volg het gedrag van mijn FSK nauwkeurig
2. Ik denk nauwelijks na over waarom mijn FSK sommige
dingen doet.
3. Ik blijf me afvragen of ik mensen ken die lijken op mijn
FSK
4. Ik ben me bewust van aspecten van mijn FSK die ik echt
leuk vind of juist niet
5. Ik blijf me afvragen hoe dingen zullen ontwikkelen
rondom mijn FSK
6. Soms vraag ik me af of mijn FSK op mij lijkt of niet
7. Soms hou ik echt van mijn FSK om wat zij/hij doet
8. Wanneer mijn FSK zich slecht voelt, voel ik me ook slecht
en andersom.
9. Mijn FSK doet me niks
10. Wat mijn FSK ook zegt of doet – ik blijf stil
11. Soms zeg ik iets tegen mijn FSK uit een impuls
12. Soms heb ik zin om hardop tegen mijn FSK te praten
11. Jouw favoriete karakter (deel 3 van 3)16
15 Parasocial processes (sup-dimension of PSI)

32
Ook hier is je favoriet e soap karakter met "FSK" afgekort. Met de cijfers kan je aangeven in
hoeverre je het eens bent met de uit spraken, waarbij 1 = “helemaal niet waar” aangeeft en 7 =
“helemaal waar”.
1 2 3 4 5 6 7
1. Naar mijn mening ziet mijn FSK er erg goed uit
2. Ik houd niet van de verschijning van mijn FSK
3. Ik vind dat mijn FSK er erg aantrekkelijk uitziet
4. Mijn FSK heeft veel eigenschappen die ik ook zou willen
hebben
5. Ik bewonder mijn FSK om zijn/haar karakter
6. Ik denk dat mijn FSK altijd alles bereikt wat hij/zij wil
bereiken
7. Ik denk dat mijn FSK een erg succesvol persoon is
8. Ik ben erg geï nteresseerd in de dingen waar mijn FSK mee
omgaat
12. Je gedachten en gevoelens tijdens het kijken naar je favoriete karakter in
"Programma X"17
Met dit onderdeel wil ik je graag een paar vragen st ellen over je belevenis, je gedachten en je
gevoelens onder het kijken van "Programma X" en je favoriet e soap karakter (=FSK).
1 2 3 4 5 6 7
1. Als ik “Boer Zoekt Vrouw” kijk, voelt het alsof ik
onderdeel ben van de situatie.
2. Als ik “Boer Zoekt Vrouw” kijk, vergeet ik mezelf en
word ik volledig meegenomen in het programma.
3. Ik kan de situaties in het programma op dezelfde manier
als mijn favoriete soap (=FSK) karakter begrijpen.
4. Ik denk dat ik mijn FSK goed kan begrijpen.
5. Ik probeer te begrijpen waarom mijn FSK doet wat hij of
zij doet.
6. Als ik het programma kijk, kan ik de emoties voelen van
mijn FSK.
7. Tijdens het kijken van “Boer Zoekt Vrouw” voelt het alsof
ik echt in het hoofd van mijn FSK kan kijken.
8. Op essentiële momenten in het programma kan ik precies
16 Attractiveness (sub-dimension of PSI)
17 Cognitive-emotional ID

33
voelen wat mijn FSK doormaakt.
9. Terwijl ik het programma kijk hoop ik dat mijn FSK zijn
of haar doelen bereikt.
13. Heb je dingen gemeen met je favoriet e soap karakter (=FSK)?18
Hieronder staan een aantal stellingen, waar je aan kunt geven in hoeverre je het met die
stellingen eens bent: 1 = klopt helemaal niet, 7 = klopt helemaal
1 2 3 4 5 6 7
1. Mijn FSK doet me aan mezelf denken.
2. Ik heb dezelfde eigenschappen als mijn FSK.
3. Ik lijk dezelfde houding te hebben als mijn FSK.
4. Ik lijk dezelfde overtuigingen te hebben als mijn FSK. …..
5. Ik heb dezelfde problemen als mijn FSK.
6. Ik kan me in mijn FSK inbeelden.
7. Ik kan me met mijn FSK identificeren.
14. Je inschatting van de realiteit van het programma
Hieronder vind je een paar stellingen over de realiteit van het programma. Hier telt wederom
je eigen mening. 1 = helemaal mee oneens; 7 = helemaal mee eens
1 2 3 4 5 6 7
1. De dialogen in het programma zijn realistisch en
geloofwaardig.
2. De setting voor het programma komt niet realistisch over.
3. Personen in dit programma hebben veel overeenkomsten
met mensen die ik ken.
4. De manier waarop mensen zich in hun dagelijks leven
gedragen is niet erg accuraat weergegeven in het programma.
5. De ontwikkelingen in het programma die zijn gebeurd of
zouden kunnen gebeuren worden van te voren besproken.
6. Het programma laat zien dat de mens zowel de goede als
de slechte kanten heeft.
7. Ik kan het moeilijk geloven dat de personen in dit
programma echt zijn, omdat het basis idee en de omgeving zo
ver gezocht zijn.
8. Het verhaal behandelt de moeilijke keuzes die mensen in
18 Similarity ID

34
het echte leven ook moeten maken.
9. De acties en reacties van de personen zijn geloofwaardig.
16. Welk geslacht heb je?
vrouw
man
17. Hoe oud ben je op dit moment (in jaren)?
Leeftijd (in jaren) _____
18. Wat is de hoogst e opleiding die je óf afgerond hebt of nu volgt?
Vmbo
MBO
VWO
HBO
Universiteit
andere, namelijk ___________
19. Ben je momenteel student / werkzaam?
werkend
student
werkende student
scholier
werkende scholier
(tijdelijk) werkloos
andere, namelijk ___________
20. Hoeveel uur kijk je gemiddeld op een doordeweekse dag (maandag t /m donderdag)
naar t v programma's?
Ik bedoel hier op t elevisie en/of op een andere wijze, op bijvoorbeeld “uit zending gemist ”
en “youtube”.
21. Hoeveel uur kijk je gemiddeld op een dag in het weekend (vrijdag t /m zondag) naar
t v-programma's?

35
Ik bedoel hier op televisie en/of op een andere wijze, zoals bijvoorbeeld op “uit zending
gemist ” en “youtube“.
Dit waren de laatst e vragen van het onderzoek. Ik wil je heel hartelijk bedanken voor je
medewerking!
Mocht je nog opmerkingen hebben, kan je ze hieronder achterlaten. De e-mail adressen
worden eenmalig voor de verloting van de prijs en/of voor het op de hoogte brengen van de
resultaten gebruikt en worden niet aan je resultaten gekoppeld.
Met elk persoon, die mede door jou heeft deel genomen aan dit onderzoek, vergroot je je kans
op de prijs.
Ben je voor dit onderzoek door iemand geworven?
nee
Ja, haar/zijn naam: _________________________________
Wil je aan de loting deelnemen? Vul dan hieronder je naam en e-mailadres in:
Voornaam:
Achternaam:
e-mailadres
Related Documents