Why do Firms Co-operate for Innovation? A comparison of Austrian and Finnish CIS 3 results Bernhard Dachs, Bernd Ebersberger, Andreas Pyka Beitrag Nr. 255, Januar 2004

Welcome message from author
This document is posted to help you gain knowledge. Please leave a comment to let me know what you think about it! Share it to your friends and learn new things together.
Transcript

Why do Firms Co-operate for Innovation?
A comparison of Austrian and Finnish CIS 3 results
Bernhard Dachs, Bernd Ebersberger, Andreas Pyka
Beitrag Nr. 255, Januar 2004

Why do Firms Co-operate for Innovation?
A comparison of Austrian and Finnish CIS 3 results Bernhard Dachs1), Bernd Ebersberger2), and Andreas Pyka3)
January, 2004
Abstract: This paper analyzes differences in the co-operative behaviour of innovative firms in Finland
and Austria. We use data from the third wave of the Community Innovation Survey (CIS 3). Descrip-
tive statistics indicate that the rate of innovators is quite similar in Austria and Finland, while the
number of co-operating enterprises is considerably higher in Finland. Econometric analysis reveals
that a number of factors that determine co-operative arrangements are only significant in one or the
other country. We conclude that co-operative behaviour in the two countries is much more dependent
on national factors and much deeper rooted in the underlying innovation systems than the existing lit-
erature may assume.
Key Words: innovation, co-operation, CIS 3, Austria, Finland JEL Codes: O310, L240 1) ARC systems research GmbH, Department of Technology Policy, Seibersdorf, Austria. Email: [email protected]
2) VTT, Technical Research Center of Finland, Technology Studies, Espoo, Finland. Email: [email protected] 3) University of Augsburg, Department of Economics. Email: [email protected]
The authors want to thank Mikael Åkerblom, Olavi Lehtoranta (Statistics Finland) and Karl Messmann (Statistics Austria) for data supply and preparation. Raimo Lovio and Doris Schartinger have contributed helpful comments on an earlier version of the paper. The authors are also grateful to Tekes for supplying the information about publicly subsidized firms. The Finnish part of the analysis of this paper was pre-pared for the project ‘Dynamic Patterns of Innovative Activities among Finnish Firms’, funded by Tekes and the Finnish Ministry of Trade and Industry. The authors gratefully acknowledge the resources supplied by Tekes and the Ministry to carry out this research. Furthermore, the support of the DAAD is acknowledged.

Introduction
This paper examines cross-country differences in co-operative behaviour of innovating firms be-
tween Austria and Finland: Finnish firms, while showing a comparable level of innovative activ-
ity, exhibit a much higher propensity to enter into co-operations for innovation than their Austrian
counterparts. This fact has been brought up by Eurostat’s Second Community Innovation Survey
(CIS-2; European Commission 2001) and is confirmed by the first results of the Third round of
CIS.
These differences are surprising to us, as successful innovation is increasingly recognized as re-
quiring the convergence of many sources of knowledge and skills in all sectors of the economy.
Empirical evidence for the superior innovation performance of co-operating companies can be
found, among others, in Gemunden et al. (1992), Palmberg et. al (1999), Czarnitzki and Fier
(2003). Controlling for various exogenous influences, a comparable level of innovative activity –
should therefore require a comparable level of mutual learning and transfer of knowledge. Other-
wise, firms would turn down the possibility to improve innovative performance.
Moreover, the theoretical literature – at least in the neoclassical tradition – offers only little expla-
nation for these cross-country differences. It explains the motives for co-operation as being intrin-
sic to the firm and its strategy and as a result of external constraints. Vonortas, Caloghirou and
Ioannides (2003) list, among other, the sharing of R&D cost and risk, the reduction of duplication,
spillover internalisation, access to complementary resources and knowledge, or the promotion of
standards as relevant motives for joint ventures in innovation. These advantages of co-operation
should be valid both for Austrian and Finnish firms to a comparable degree.
This paper analyzes the co-operative behaviour of innovative firms in Austria and Finland with
data from the third wave of the Community Innovation Survey (CIS 3). It is structured as follows:
Chapter 2 provides a brief theoretical background of the ongoing discussion on co-operative be-
haviour. Chapter 3 gives some descriptive features of the datasets. An econometric analysis of the
co-operative behaviour is delivered in chapter 4. Chapter 5 summarizes the main findings and
concludes with some directions for future research.
Theoretical background
Theoretical approaches like the knowledge-based view, as well as the resource-based view are
increasingly criticised in recent discussions of co-operative behaviour due to their emphasis of
firm-specific capabilities only. Although both approaches emphasize that firms do have dynamic
capabilities in order to sustain their competitive advantage, it has to be ascertained the these ap-
proaches lack an explanation, how these sources of competitive advantage are built up. The rea-
son for this can be seen in the neglect of the firms’ network of external relationships. As a conse-
- 2 -
quence of this critic, the so-called relational-based view of the firm (Dyer and Sing 1998) has
emerged which focuses on inter-firm relationships as a source of competitive advantage. Accord-
ing to this view, competitive advantages cannot be generated by a firm in isolation but only in
collaborative relationships with other actors, namely other firms (including competitors) but also
institutions which were created with the purpose of knowledge generation (i.e. universities and
public research laboratories), as well as vertically linked actors (as suppliers and customers).
These co-operations are characterized by intensive knowledge exchange and learning processes
basically by the combination of complementary assets as well as the realisation of synergies.
Empirical investigations of R&D collaborations (see e.g. Hagedoorn and Schakenraad (1989) and
Vonortas, Caloghirou and Ioannides (2003) for an excellent survey) have identified a number of
motives for firms joining these collaborations. Furthermore, the empirical investigations also
show that R&D collaborations are not uniquely distributed among firms with respect to different
industries but show rather specific patterns. With respect to the motives of firms to enter into col-
laborations, the aim of our paper is to compare two different economies and to explore country
specificities. This finally should also allow us to shed some light on the reasons for the differences
in co-operative behaviour described in Chapter 3.
In order to reduce the large number of different motives and reasons for firms to collaborate for
innovation, the different motives and characteristics can be grouped into sectoral, company, stra-
tegic and political characteristics. Furthermore, a firm’s propensity to collaborate is also deter-
mined by the firm’s management of appropriability as well as its intentions and targets pursued
while joining a joint venture.
On the sectoral level, the propensity to collaborate is influenced by the technology intensity of the
sector. Due to the higher degree of complexity (Malerba and Orsenigo 1993) as well as a faster
speed of knowledge generation and utilisation processes (Pyka and Saviotti 2002) collaborative
behaviour is more likely in industries which can be characterized as high technology industries
(Dodgson 1994). In order to introduce novelties to the market, firms are compelled to focus on
their core competencies and collaborate with other actors who are offering the necessary comple-
mentary assets. The industrial organization of the sector also influences the collaboration behav-
iour of its firms. The most relevant category in this respect is the intensity of competition within
the industry. It is argued that industries characterized by a high degree of intensity in competition
are less likely to show cooperative behaviour (Von Hippel 1989) as leaking knowledge leading to
minor innovations could give rise to decisive competitive advantages. Moreover, the identification
of appropriate collaboration partners is easier in sectors with only a few large firms. A higher
concentration may be associated with reduced search costs and higher propensity to collaborate.
Finally, also the appropriability conditions on the industry level are considered relevant. In indus-
- 3 -

tries characterized by low appropriability conditions technological spillover effects can be seen as
the decisive source of external knowledge. In the case of higher degrees of appropriability, how-
ever, the firms do get access to external knowledge only via collaboration (Pyka 2002). Here,
successful knowledge transfer is crucially linked to communication and mutual learning proc-
esses; simple imitation is not possible (Winter 1987).
Beside industry characteristics, firm-specific characteristics such as size and export orientation,
also determine firms’ collaborative behaviour. Larger firms having their own R&D departments
are supposed to be engaged more actively in R&D collaboration as they have a broader scope of
activities and can devote the necessary resources for partner search. Furthermore, firms who sell
large parts of their production abroad are also more likely to be engaged in R&D collaboration.
Thereby, it is implicitly assumed that in highly industrialized countries export activities are
strongly influenced by the international technological competitiveness (Kang and Sakai 2000).
Closely related to firm characteristics is the third group of influences relating to the strategic de-
sign of a firm’s R&D activities. The absolute amounts of R&D expenditures as well as their per-
sistence are supposed to be positively correlated with the willingness of firms to join a R&D part-
nership. Additionally, firms do follow different strategic orientations with respect to the design of
their R&D activities. Some firms rely basically on their own R&D efforts without considering
other knowledge sources seriously, whereas other firms choose a much broader R&D orientation
considering also different external knowledge sources and the building up of absorptive capacities
as relevant (Cantner and Pyka 1998).
Even though appropriability conditions are shaped by general features of the knowledge relevant
for an industry and therefore can be considered as sectoral characteristics (Klevorick et al. 1995,
Levin et al. 1987, Cohen et al 2000) a firm can influence the appropriability by employing meas-
ures to protect the generated knowledge. It can do so by making use of formal instruments such as
patents and trademarks but can also use more strategic and less formal instruments such as se-
crecy and lead time advantages. These different means to ensure appropriability also influence the
propensity of firms to join R&D collaborations. In the biotechnology based industries, for exam-
ple, there is an increasing trend in co-patenting (Pyka and Saviotti 2002) indicating that the possi-
bility of joint and enforceable intellectual property rights is conducive to collaboration in these
industries. On the more strategic side of appropability management, increasing the complexity of
design, secrecy, lead time advantages are among the most important means. In cases where these
strategic means are considered to be effective in R&D co-operations also, they should have a
positive influence on the collaboration decisions.
Increasing costs in R&D and an increasing innovation dynamics are among the most frequently
mentioned reasons why firms join R&D collaborations (e.g. Hagedoorn and Schakenraad 1989).
- 4 -

The different motives related to this discussion of overcoming knowledge and financial obstacles
can be summarized under the group of targets and intentions for collaborative R&D. On the one
hand firms are supposed to overcome economic hampering effects by sharing the costs of R&D in
co-operations. On the other hand, cooperative R&D is supposed to give the actors access to larger
spillover pools where knowledge is shared voluntarily (e.g. Nelson 1987) among the actors par-
ticipating the cooperation. This is of particular importance if the knowledge is characterized as
complex and/or tacit.
Finally, the decision of a firm to collaborate with other actors in R&D can also be influenced by
policy measures. Meanwhile there exist on a national as well as on a European level a bunch of
R&D subsidy programmes which are strongly connected to the prerequisite for the participants of
performing collaborative R&D.
Besides these motives for collaboration from the viewpoint of industrial organization and indus-
trial dynamics the literature on national innovation systems also highlights country specificities
for R&D collaboration (e.g. Lundval et al. 2002). Different national contexts are considered to be
responsible for disparate possibilities for establishing organised markets and processes of interac-
tive learning which might also be relevant for the differences to be observed between Austria and
Finland.
Austria and Finland – Differences and similarities
The work is based on the first available results from the Third Community Innovation Survey
(CIS 3) for Austria and Finland which covers the period 1998 to 2000. In the two countries, the
survey has been organized and carried out by the two national statistical agencies, Statistics Aus-
tria and Statistics Finland who also provided the data for this paper. We restrict our analysis to
manufacturing enterprises (NACE 15-37).
The two samples1 comprise of 453 (Austria) and 1,046 firms (Finland), respectively. The differ-
ence in sample size mainly originates form the number of small and medium firms (10 – 49, 50 –
248 employees, see Chart 1). In these two size classes the Finnish sample outnumbers the Aus-
trian by more than 500 observations. The sectoral composition of the two samples, in contrast, fits
quite well. Classified by the OECD taxonomy of manufacturing industries based on technology
(see OECD 2001), we just find a higher share of low technology firms in Austria and, vice versa,
a higher share of high technology and high-medium technology enterprises in Finland.
Chart 1: Composition of the samples by size class and sector, Austria and Finland, 1998-2000
1 Due to legal restrictions in the usage of the data, we were not allowed to pool all observations into a single sample.
- 5 -

38%
51%
34%
34%
22%
11%
6% 4%
0%
10%
20%
30%
40%
50%
60%
70%
80%
90%
100%as
% of
the t
otal s
ample
> 1000 Empl.
250 - 1000 Empl.
50 - 249 Empl.
10 - 49 Empl.
FinlandAustria
46%37%
28%
28%
22%27%
5% 8%
0%
10%
20%
30%
40%
50%
60%
70%
80%
90%
100%
as %
of th
e tot
al sa
mple
High TechnologyHigh-Medium TechnologyLow-Medium TechnologyLow Technology
FinlandAustria
Source: Statistics Austria, Statistics Finland; own calculations
Innovative and co-operative behaviour
The most basic indicator of innovative activity in the CIS survey is if the enterprise has intro-
duced any technologically new or significantly improved products or processes which were new
to the firm, if such an innovation project is still ongoing, or if an innovation project has been
abandoned in the years under observation. If a company answered “yes” to either of these ques-
tions we regard it as an innovating company, meaning that the company exhibited innovative ac-
tivities.
Comparing the share of innovators, we find an approximately equal level of innovative activity in
the two countries. The share of innovative enterprises is roughly the same2 (57% for Austrian
enterprises vs. 61% for Finnish firms). We see only minor differences if we examine the share of
innovators for different sectors and size classes (see Chart 2). The only exception is the scale of inno-
vative activity in small enterprises (10 – 49 employees) which is considerably higher in Finland than in
Austria.
2 As we do not apply a weighting scheme these results are not representative for the national level and may dif-
fer from the national CIS results published by Statistics Austria and Statistics Finland.
- 6 -

Chart 2: Share of innovative enterprises in manufacturing by size class and sector, Austria and Finland, 1998-2000
0% 20% 40% 60% 80% 100%
10 - 49 Empl.
50 - 249 Empl.
250 - 1000 Empl.
> 1000 Empl.
Share of all enterprises
Finland Austria
0% 20% 40% 60% 80% 100%
High Technology
High-MediumTechnology
Low-MediumTechnology
Low Technology
Share of all enterprises
Source: Statistics Austria, Statistics Finland; own calculations
Austrian and Finnish enterprises, however, differ considerably, if we turn to co-operative behav-
iour. The CIS questionnaire asks for co-operative arrangements3 only if the enterprise has re-
ported innovative activity. In Finland, 61% of all innovators have entered in a co-operative ar-
rangement. The rate drops to 29% in Austria. In other words, the probability to find a co-operating
enterprise in the Finnish sample – given a comparable propensity to innovate - is two times higher
than in the Austrian one. Especially, we find a considerable higher number of co-operating com-
panies among small and medium-sized enterprises. Also Finnish companies reveal a higher pro-
pensity to co-operate in all sectors of the OECD classification (see chart 3).
3 The exact wording is: ’Did your enterprise have any co-operation arrangements on innovation activities with other enterprises or institutions in 1998-2000?’
- 7 -
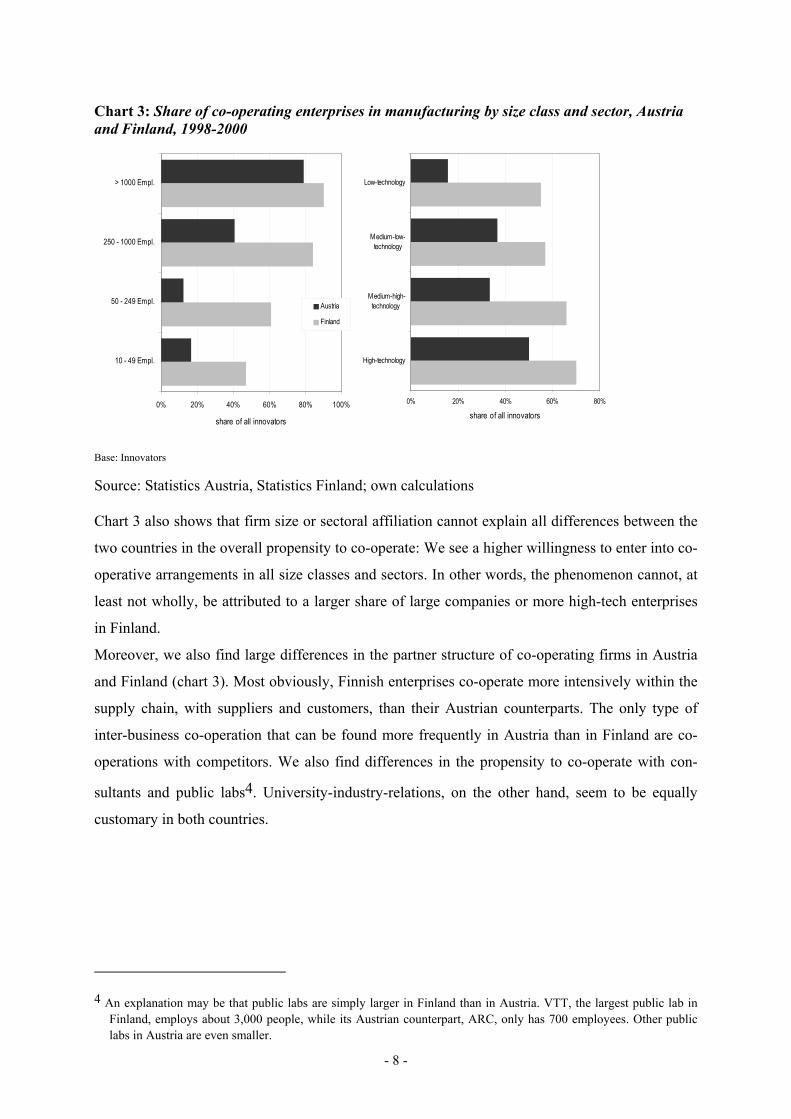
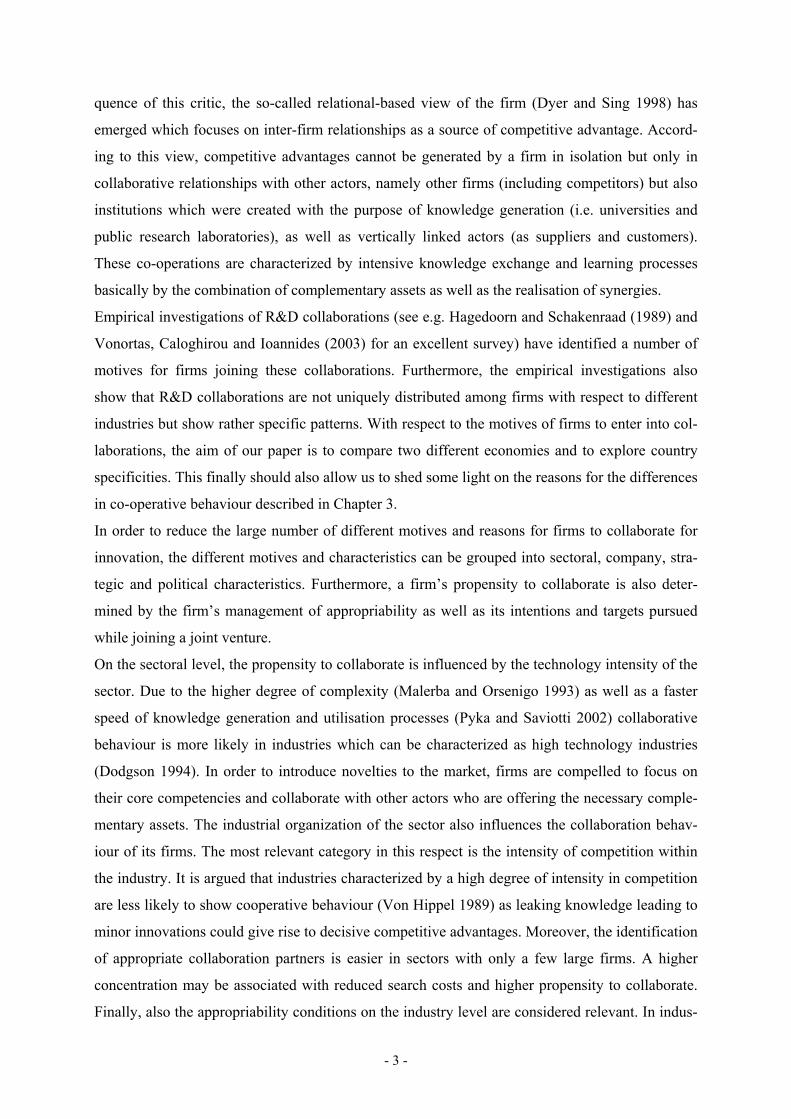
Chart 3: Share of co-operating enterprises in manufacturing by size class and sector, Austria and Finland, 1998-2000
0% 20% 40% 60% 80% 100%
10 - 49 Empl.
50 - 249 Empl.
250 - 1000 Empl.
> 1000 Empl.
share of all innovators
Austria
Finland
0% 20% 40% 60% 80%
High-technology
Medium-high-technology
Medium-low-technology
Low-technology
share of all innovators
Base: Innovators
Source: Statistics Austria, Statistics Finland; own calculations
Chart 3 also shows that firm size or sectoral affiliation cannot explain all differences between the
two countries in the overall propensity to co-operate: We see a higher willingness to enter into co-
operative arrangements in all size classes and sectors. In other words, the phenomenon cannot, at
least not wholly, be attributed to a larger share of large companies or more high-tech enterprises
in Finland.
Moreover, we also find large differences in the partner structure of co-operating firms in Austria
and Finland (chart 3). Most obviously, Finnish enterprises co-operate more intensively within the
supply chain, with suppliers and customers, than their Austrian counterparts. The only type of
inter-business co-operation that can be found more frequently in Austria than in Finland are co-
operations with competitors. We also find differences in the propensity to co-operate with con-
sultants and public labs4. University-industry-relations, on the other hand, seem to be equally
customary in both countries.
4 An explanation may be that public labs are simply larger in Finland than in Austria. VTT, the largest public lab in Finland, employs about 3,000 people, while its Austrian counterpart, ARC, only has 700 employees. Other public labs in Austria are even smaller.
- 8 -
Chart 4: Partners of co-operating enterprises, Austria and Finland, 1998-2000
0% 10% 20% 30% 40% 50% 60% 70% 80% 90%
Consultants
Public labs
Competitors
Commercial labs
Customers
Within the enterprise group
Suppliers
Universities
Share of all co-operating enterprises
Austria
Finland
Base: Innovators; co-operations with more than one partner possible
Source: Statistics Austria, Statistics Finland; own calculations
Econometric analysis
Descriptive statistics has shown that the differences in co-operative behaviour between Finland
and Austria presented in chapter 3 cannot be explained by size or sectoral affiliation. Therefore,
we want to dig deeper into the patterns of collaboration of Finnish and Austrian firms and identify
the main influences for the co-operative behaviour in the two countries by econometric analysis
Variables in the analysis
In the following section we introduce the dependent variables for the analysis below. According
to the previous discussion of the theory, we group the independent variables in our analysis into
six different groups that represent the underlying level of influence and focus of the variables.
Innovation and collaboration
The dependent variables represent both the innovative behaviour as well as the co-operative be-
haviour of the companies. The variable measuring innovative activity (INNOV) contains the in-
formation whether companies introduced a product innovation or a process innovation, including
abandoned or not yet finished projects. INPDT and INPCS indicate product and process innova-
tors, respectively. The variables about co-operative behaviour contain information about the col-
laboration partner regardless of whether the partner is domestic or international. The variables
used in the analysis below are summarized in Table 1.
- 9 -

Table 1: Dependent variables Variable Description
INNOV Dummy for innovation activity
INPDT Dummy for product innovation
INPCS Dummy for process innovation
COGEN Dummy for collaboration with any partner
COSUP Dummy for collaboration with a supplier
COCUS Dummy for collaboration with customers
COCOM Dummy for collaboration with competitors
COUNI Dummy for collaboration with universities or research institutes
Sectoral characteristics
The independent variables describing characteristics of the sector of the firm’s activity indicate
sectoral classification, industry structure, sectoral innovation dynamics and the sectoral level of
outgoing spillovers. We characterize the sectors according to their technology intensity (OECD
2001, Annex). The analysis below will assume low technology manufacturing as the basis sector.
To capture the effects caused by the industry structure we include the average size of the enter-
prise in the industry (SIZEAV). The velocity of innovation dynamics is approximated by the
number of market novelties as a fraction of the number of product innovations in the sector
(SPEED). The construction of the innovation dynamics variable follows Belderbos et al (2003).
We also construct a variable indicating the appropriability conditions in a sector. As the appropri-
ability conditions cannot be directly observed, the company’s appreciation of competitors as a
knowledge source for innovation is used as a proxy. Weak appropriability conditions coincide
with a high appreciation of the competitor as an information source. APPCON is the average im-
portance of competitors as an information source in a sector. We construct the variable on the
basis of the 2-digit industries. The construction is in line with the indicator for outgoing spillovers
in Belderbos et al. (2003).
Policy and funding
The national and international policy influence on collaboration is represented by the funding
variables. The variables FUNGMT and FUNEU indicate funding from the national government
and from the EU.
Company characteristics
The companies are characterized by the size, the export orientation and the affiliation to a group
of enterprises. The size of the company is captured by the number of employees (EMPL); accord-
ing to conventional practice we include the natural log of the firm size in the regressions. We also
include the share of exports on turnover to approximate the export orientation of the companies.
This strikes us as particularly important as we compare two small open economies. Furthermore,
- 10 -
an external orientation of an economy is likely to be accompanied by a potential access to foreign
external knowledge sources. Veugelers and Cassiman (2002) include the export share such as to
proxy the competitiveness of the enterprises.
Innovation strategy
The characterization of the innovative process, which co-operation is a part of, is achieved by the
sheer magnitude of the innovative efforts, their diversity, their endurance, and the targeted inno-
vations such as process innovations or new products to the markets.
To capture firm level heterogeneity concerning the intensity by which innovation activities are
pursued we include the total sum of innovation expenditure as a fraction of turnover (INNOEXP).
We include the innovative intensity squared to account for a non linear impact on the probability
to collaborate. Belderbos et. al (2003) argue that increasing innovative intensity and a positive
impact on collaboration can be closely related to absorptive capacities (e.g. Cohen and Levinthal,
1990). We also include a dummy indicating the permanent engagement in R&D activities (cf.
Cassiman and Veugelers 2002). The variable RDENG takes a value of 1 if firms are engaged in
continuous R&D activities.
Furthermore, we include a measure to indicate the diversity of innovation activities pursued by the
individual company. According to the Oslo manual (OECD 1997) the innovation activities are
broken down into (i) intramural research & experimental development, (ii) acquisition of R&D
(extramural R&D), (iii) acquisition of machinery and equipment, (iv) acquisition of other external
knowledge, (v) training,(vi) market introduction of innovations and (vii) design & other prepara-
tions for production/deliveries. Categories (v) to (vii) are covered in the innovation surveys in a
composite category.
We use an entropy measure to summarize the diversity of the innovation activities of the compa-
nies:
∑∈
⋅=}5...1{
)log(j
jijii ppINNODIV (1)
where is the expenditure for the jth category of innovation activities as a fraction of the total
sum of innovation activities of firm i.5
jip
We also distinguish between various types of innovation. INMAR codes the introduction of a
product innovation that is new to the market, whereas INPCSO indicates companies which intro-
duced process innovations only. Although product or process innovations are both the result of
the innovation process and of the collaboration, it can be argued that it is the search for certain
5 For computational ease log (0) has been defined to be 0.
- 11 -

types of innovations that drove the companies to collaborate with one type of partner or the other.
As such, INMAR and INPCSO reflect the desired innovation and the collaboration the means to
achieve it. INMAR then indicates the companies’ ambition to introduce novelties, where INPCSO
reveals strong cost awareness and the desire to reduce costs (cf. Frisch and Lukas 2001, Tether
2002).
Management of appropriability
The management of the collaboration is characterized by the utilization of strategic and formal
protection mechanisms.
As firms are actively protecting their innovations in various ways the efforts to strategically pro-
tect the innovations are included in the variable PROTS. The more formal protection activities are
captured in the variable PROTF. The strategic methods comprise of (i) secrecy (ii) complexity of
design and (iii) lead-time advantage. The formal methods of protection include (i) patents, (ii)
design patterns, (iii) trademarks, and (iv) copyrights. The value of the protection variables indi-
cates the fraction of methods used by the companies.
Targets and intentions
Co-operation is commonly associated with a knowledge sharing or a cost sharing motive. The
targets and motives for collaboration can be derived from the perceived shortages in financing or
knowledge or by the knowledge flows that informally spillover from or into the company and its
utilization.
As also suggested by the Oslo manual (OECD 1997) the factors hampering innovative activities
in companies are summarized by economic factors and internal (enterprise) factors. For both cate-
gories we created a variable indicating the severity of the factors by summing up the companies
assessment of the severity of the sub-categories (0 to 3) and dividing the sum by the number of
sub-categories. Hence, the variables HAMPECO and HAMPINT6 are bound below by zero and
bound above by 1.
Recent empirical research has increasingly tried to analyze the effects spillovers have on the com-
panies’ propensity to collaborate (e.g. Kaiser 2002, Cassiman and Veugelers 2002, Hernan et. al.
2003). The literature follows two different approaches. The first approach establishes a spillover
pool which defines the source of the spillovers. The magnitude of the spillover a company re-
ceives depends on the companies distance to the spillover pool. Various concepts exist to ap-
proximate the distance to the spillover pool (Kaiser 1999, Jaffe 1986 and Jaffe 1988). In studying
- 12 -
the collaboration for R&D, Kaiser (2002) follows the first approach. The second approach is more
subjective from the surveyed firms’ point of view. It refers to the firms’ assessment of the impor-
tance of different sources of information for the innovation. As the question does not target to
formal relationships with the sources of information it also covers information that has been ac-
quired through informal channels. Cassiman and Veugelers (2002) and Belderbos et. al. (2003)
follow this approach. As it reflects the managerial decision for collaboration more closely we also
follow the latter approach.7
We base our construction of incoming spillovers on the companies’ assessment of the importance
of certain information sources. These information sources are (i) the enterprise itself, (ii) other
enterprises within the same group, (iii) suppliers, (iv) customers, (v) competitors, (vi) universi-
ties, (vii) research institutes, (viii) professional conferences, journals and (ix) fairs and exhibi-
tions. The variables approximating the spillovers are constructed by summing up the importance
of the sources (0 to 3) and dividing it by the number of sources involved. Hence the variables are
bound below by zero and bound above by one.
SPILLVERT approximates the incoming vertical spillovers and refer to the sources (iii) suppliers
and (iv) customers. The horizontal spillovers (SPILLHOR) are constructed on the basis of the
source (v) competitors. Institutional spillovers (SPILLINST) capture the effects that originate
from (vi) universities and (vii) research institutes. Belderbos et. al. (2003) use this construction of
the incoming spillovers. We also include spillovers that originate from publicly available sources
as suggested in Cassiman und Veugelers (2002). SPILLPUB is calculated on the basis of the
companies’ assessment of (viii) professional conferences & journals and (ix) fairs & exhibitions
as information sources. All spillover variables give the difference between the industry mean (2-
digit industries) and the company’s assessment of the spillover.
As far as collaboration is about knowledge sharing, the internal flow of knowledge within the
enterprise should have an influence on the company’s propensity to collaborate. The internal flow
of knowledge is approximated by an indicator (INTKNO) constructed in the same way as the
spillover variables above. It is based on the importance of internal knowledge sources for innova-
tion. With reference to Kamien and Zang (2000) and Cassiman and Veugelers (2002) we argue
that companies which value sources associated with basic research and development more than
sources of applied R&D benefit more from incoming spillovers. In this vein we include an indica-
6 HAMPECO includes constraints from too high economic risk, too high innovation costs and the lack of finan-
cial resources. The variable HAMPINT depicts organisational rigidities within the enterprise, a lack of quali-fied personnel, technological information or a lack of market information
7 A third approach can be identified that bases on Mansfield (1985). It differs from the approaches above as it does not allow to compute firm specific spillovers. Depending on the industry it assigns sector specific spillovers on a 2- to 4-digit level. Henan et al. (2003) follow this approach.
- 13 -

tor (UTILIZ) for the basicness of R&D in our analysis. It is the valuation of universities and re-
search institutes as sources of information relative to the valuation of customers, suppliers and
competitors as sources.
Summary of the independent variables used
Table 2 summarizes the independent variables in the analysis. It also gives the descriptive statis-
tics for the variables for the Austrian and the Finnish sample.
- 14 -

Table 2: Summary of the independent variables Variable Description AT FI Variable Description AT FI
GP Mean 0.426 0.483 SPILLINST Mean 0.000 0.000
Med. 0.000 0.000 Med. -0.042 0.009
Max 1.000 1.000 Max 0.756 0.778
dummy for companies that belong to a group of companies
Min 0.000 0.000
index for incoming spill overs from universities and research institutes
Min -0.430 -0.410
EMPL Mean 4.502 4.136 SPILLVERT Mean 0.000 0.000
Med. 4.331 3.850 Med. 0.000 0.010
Max 8.931 10.048 Max 0.481 0.492
log employment of the company in the year 2000, in 1000 employees
Min 2.303 2.303
index for vertical spillovers
Min -0.644 -0.611
EXPSHR Mean 0.347 0.389 SPILLHOR Mean 0.000 0.000
Med. 0.188 0.400 Med. -0.028 -0.011
Max 1.000 1.000 Max 0.718 0.700
export share of the company
Min 0.000 0.000
index for horizontal spillovers
Min -0.583 -0.542
INNOEXP Mean 0.031 0.041 SPILLPUB Mean 0.000 0.000
Med. 0.004 0.006 Med. 0.000 0.000
Max 1.023 1.000 Max 0.538 0.628
innovation expenditure as a fraction of the turnover
Min 0.000 0.000
index for spillovers from publicly available sources
Min -0.570 -0.486
INNODIV Mean 0.341 0.321 APPCON Mean 1.329 0.893
Med. 0.000 0.000 Med. 1.385 0.923
Max 1.481 1.584 Max 2.500 1.625
index for diversification of the innovative efforts
Min 0.000 0.000
index for appropriability conditions in the industry
Min 0.000 0.000
HAMPECO Mean 0.494 0.223 TECHH Mean 0.049 0.078
Med. 0.556 0.000 Med. 0.000 0.000
Max 1.000 1.000 Max 1.000 1.000
index for the severity of economic hampering factors
Min 0.000 0.000
dummy for companies in a high technology manufacturing sector
Min 0.000 0.000
HAMPINT Mean 0.350 0.217 TECHMH Mean 0.216 0.274
Med. 0.333 0.167 Med. 0.000 0.000
Max 1.000 1.000 Max 1.000 1.000
index for the severity of internal hampering factors
Min 0.000 0.000
dummy for companies in a medium-high technol-ogy manufacturing sector
Min 0.000 0.000
INTKNO Mean 0.325 0.339 TECHML Mean 0.278 0.282
Med. 0.333 0.333 Med. 0.000 0.000
Max 1.000 1.000 Max 1.000 1.000
index for the internal knowledge flow
Min 0.000 0.000
dummy for companies in a medium-low technol-ogy manufacturing sector
Min 0.000 0.000
UTILIZ Mean 0.729 1.108 RDENG Mean 0.318 0.393
Med. 0.643 1.200 Med. 0.000 0.000
Max 3.750 7.500 Max 1.000 1.000
index for the basicness of R&D
Min 0.167 0.167
dummy for continuous engagement in R&D
Min 0.000 0.000
PROTF Mean 0.220 0.199 INMAR Mean 0.287 0.381
Med. 0.000 0.000 Med. 0.000 0.000
Max 1.000 1.000 Max 1.000 1.000
index for the utilization of formal means of protection
Min 0.000 0.000
dummy for product innovation new to the market
Min 0.000 0.000
PROTS Mean 0.344 0.347 INPCSO Mean 0.0817 0.066
Med. 0.000 0.333 Med. 0.000 0.000
Max 1.000 1.000 Max 1.000 1.000
index for the utilization of strategic means of protection
Min 0.000 0.000
dummy for process innovation only
Min 0.000 0.000
FUNGMT Mean 0.302 0.350 SIZEAV Mean 55.492 68.398
Med. 0.000 0.000 Med. 34.349 27.016
Max 1.000 1.000 Max 262.463 679.734
dummy for receiving public funding from governmental agencies
Min 0.000 0.000
average size of the company in the sector
Min 1.228 6.026
FUNEU Mean 0.108 0.073 SPEED Mean 0.574 0.745
Med. 0.000 0.000 Med. 0.615 0.750
Max 1.000 1.000 Max 0.900 0.867
dummy for receiving public funding from the EU
Min 0.000 0.000
speed of technological development in the sector or
Min 0.000 0.000
LPROD Mean 149.837 181.841
Med. 112.515 118.897
Max 725.544 11708.6
Labour productivity
Min 7.75 0.07
- 15 -

The econometric model
In the following multivariate analysis we use a quite straight forward econometric setup. We re-
gress the probability of collaboration on the independent variables given in table 2.8
)(1),|1Pr( ββ iii xFxy ′−−== (2)
As the linking function F any function can be used which is continuous, strictly increasing func-
tion that takes a real value and returns a value in between zero and one. We use the cumulative
distribution function for the logistic distribution and obtain the logit model:
))exp(1/()exp())exp(1/()exp(1),|1Pr( βββββ iiiiii xxxxxy +=−+−−== (3)
where is the vector of the independent variables for the i-th observation and ix β is the vector of
coefficients.
We run the Logit regressions on the Austrian and the Finnish sample independently to obtain the
parameters Aβ and FINβ . The parameter estimates can be compared according to their signifi-
cance in both country regressions. However they do not give an estimate about the strength of an
influence of the independent on the dependent variable as the linking function F is non linear. We
compute the marginal effects of the independent variables and use those for the cross country
comparison. The regression results in the following section report the marginal effects instead of
the parameter estimates.
Results of the multivariate analysis
In this section we report the results of the multivariate analysis. In this setup we used the data as
they are supplied. We do not employ a weighting scheme such as to make the sample representa-
tive for the companies in the given economies. We do not apply any correction here, as we recog-
nize that the sample is only a small fraction of the whole population of businesses in Austria as
well as in Finland, which makes any correction quite unreliable. Tether (2001, p. 7) argues that
corrections may be misleading as due to the sampling methodology in the CIS firms the uncor-
rected distribution is closer to the real distribution in terms of economic significance.
8 As the collaboration question is posed only to companies that conduct some innovation activities i.e. product innova-tion, process innovation, abandoned or ongoing innovation projects see OECD (1997), we can only include firms with innov=1 in the collaboration regression. It cannot be reasonably assumed that the conducting innovation activi-ties is a purely random event some selection bias may exist. To tackle the selection bias, we include the propensity score of the Logit regression identifying the innovators (as given in below) in the set of independent vari-ables (Olsen 1980). It is labeled INNOVPROB
Table 3
- 16 -

Identifying innovators
The first step of the analysis is to identify the innovating firms from the total set of manufacturing
firms.
Table 3: Identifying the innovators
Innovators Product Innovators Process Innovators
(INNOV) (INPDT) (INPCS)
Finland Austria Finland Austria Finland Austria
C -0.438 *** -0.537 *** -0.508 *** -0.546 *** -0.536 *** -0.724 ***
GP -0.043 0.052 -0.022 0.035 -0.079 ** -0.022
EMPL 0.110 *** 0.111 *** 0.101 *** 0.080 *** 0.100 *** 0.120 ***
LPROD 0.000 ** 0.000 0.000 0.000 0.000 0.000
EXPSHR 0.048 0.190 *** -0.012 0.198 *** 0.003 0.154 **
TECHH 0.277 *** 0.044 0.269 *** 0.086 -0.034 0.038
TECHMH 0.161 *** 0.106 * 0.212 *** 0.127 ** 0.020 -0.006
TECHML 0.044 -0.015 0.059 0.014 0.034 0.059
SIZEAV 0.000 0.000 0.000 0.000 0.000 0.000
Num of Obs 1046 453 1046 453 1046 453
McFadden 0.0967 0.2503 0.0873 0.1964 0.0575 0.1932
LR statistic 134.90 154.99 126.40 122.66 77.90 115.65
Prob (LR stat) 0.0000 0.0000 0.0000 0.0000 0.0000 0.0000
* indicates significance at 10% ** indicates significance at 5% ***indicates significance at 1% It turns out that the influence of firm size on the propensity to innovate is of comparable magni-
tude in both countries. In Finland we also experience that innovative behaviour increases with
technology intensity, a result that is in line with the theory. The propensity to engage in innova-
tive activities and the propensity to launch a product innovation in Austria is ruled by an inverted
u-shaped influence of the technology intensity. Innovative activities and product innovations are
more likely in the medium high technology sectors than they are in the low technology and the
high technology sectors. Moreover, the export share plays an important role for innovation in
Austria. In neither of the countries the propensity to introduce process innovations is influenced
by the technology intensity of the sector. In contrast to the Finnish experience the Austrian results
reveal that the propensity to innovate increases with the export orientation of the companies.
Cooperation in general
From a theoretical point of view (see chapter 2), the decision to co-operate for innovation may be
influenced by factors specific to a certain national innovation system as well as factors independ-
ently of the location of the firm.
We find only three factors that are significant for co-operation in both countries. First, the utiliza-
tion of incoming spillovers influences positively the propensity to cooperate in R&D. The asso-
ciated variable UTILIZ is closely connected to the companies’ assessment of basic research and
- 17 -

development relative to applied research. The obtained result can also indicate that the more in-
formation companies exchange on basic issues rather than on issues concerning the immediate
application of technologies, the more likely they are to collaborate. The further away the informa-
tion exchange is from immediate application, the more likely companies are to collaborate. This
may also be an indicator for the companies’ fear to exchange applied knowledge that may in turn
leak to a competitor.
Table 4: Results of the multivariate analysis
Cooperation COGEN Finland Austria
C -0.517 *** -0.176 INNOVPROB 0.007 0.224
APPCON -0.078 0.011
TECHH -0.019 -0.052
TECHMH 0.018 -0.040
TECHML -0.010 0.231 ***
SIZEAV 0.000 0.000
Sectoral Charac-teristics
SPEED -0.144 -0.165
FUNEU 0.174 ** 0.111 * Policy
FUNGMT 0.136 *** 0.059
EMPL 0.049 ** -0.102
EXPSHR -0.017 -0.046
Company Charac-teristics GP 0.017 -0.111
RDENG 0.042 -0.036
INMAR 0.090 ** 0.026
INPCSO 0.132 ** -0.014
INNODIV 0.115 *** 0.042
INNOEXP 0.643 1.134 *
Innovation Strat-egy
INNOEXP2 -1.106 -1.095
PROTF 0.157 ** -0.030 Management of Appropriability
PROTS 0.090 * 0.058
HAMPECO 0.150 ** 0.098
HAMPINT 0.016 -0.056
INTKNO 0.105 0.146
SPILLHOR -0.211 *** 0.238 **
SPILLINST -0.108 0.129
SPILLPUB -0.011 0.131
SPILLVERT 0.464 *** -0.104
Targets and Intensions
UTILIZ 0.135 *** 0.162 * Num of Obs 643 258 McFadden 0.2791 0.3557 LR statistic 240.57 109.35 Prob (LR stat) 0.0000 0.0000
* indicates significance at 10% ** indicates significance at 5% ***indicates significance at 1%
Second, the results of the regression show that enterprises receiving European Union funding
(FUNEU) tend to co-operate more frequently. As the framework programmes require joint re-
search project, this result needs no further interpretation. Third, we see that horizontal spillovers
(SPILLHOR) also matter significantly. However, the coefficients have opposite signs in Finland
and Austria. Finnish companies receiving high spillovers from competitors are less likely to col-
- 18 -

laborate than companies that receive lower horizontal spillovers. Yet, Austrian companies receiv-
ing high spillovers from competitors have a higher propensity to cooperate as compared to com-
panies that receive less horizontal spillovers. This indicates that the informational gain through
competitors substitutes for collaborative efforts in Finland. Whereas in Austria, the information
supplied by competitors is likely to be augmented by information and other resources from other
collaboration partners.
A striking result is that the sectoral affiliation of enterprises does not influence the propensity to
collaborate significantly. More surprising, medium-low technology manufacturing in Austria is
the only sector which is significantly linked to collaboration. Examples of these more traditional
industries are coke and petroleum products, rubber and plastic products or basic metals and fabri-
cated metal products. These industries still represent a higher-than-average share of manufactur-
ing in Austria compared to other European countries, in particular compared to their weight
within the Finnish industry. Leitner (2003) has shown that the label ‘medium-low technology’
may be misleading, as a number of major innovations have been made in theses sectors. More-
over, Austrian enterprises in low and medium technology industries exhibit considerably higher
R&D expenditures than their European competitors (Dachs et al. 2003).
Their role for co-operation may be explained by what has been identified as one typical mode of
innovation in Austria: A constant upgrading and improvement of products and processes in tradi-
tional industries, like the ones listed above. Steel producers, manufacturers of textiles or simple
metal products increasingly have diversified downstream the value chain into semi-final products
and became important suppliers for the electrical and electronics, the consumer goods or the
automotive industry in Germany and Northern Italy. This hypothesis would also explain why in-
novative activity is linked to a higher export share in Austria (see Table 3). Evidence for this ex-
planation has been delivered by the CIS 2 results (Leo 1999) and a number of case studies of in-
novative enterprises (Leitner 2003). Internationalisation and diversification in semi-final products
may have increased the need to co-operate for innovation.
Another factor which distinguishes Finland from Austria is the importance of governmental
funding for co-operation. The corresponding variable is highly significant in Finland with a posi-
tive sign for the general model as well as for regression models of co-operation with suppliers,
competitors, universities and research institutions (Table 5). In Austria, however, the variable is
insignificant for the general model as well as for co-operations with most partners. The only ex-
ceptions are co-operations with universities and research institutes, and customers. Governmental
funding is one of the variables, where national policy priorities and special features of the prevail-
ing innovation system become most striking: Austria has done a lot in recent years to promote
contacts between science and industry, but there is only little initiative at the national level to
- 19 -

promote co-operative arrangements between innovating firms. Co-operation is not a pre-requisite
to receive grants from the promotion agencies for research and development, like the FFF or the
ERP (see also Leo and Ziegler 2003). Activities to promote clustering of firms mainly exist at the
level of provincial governments and the Austrian Economic Chamber, but have less financial
means than national activities.
In Finland, on the other hand, strengthening of inter-firm networking and co-operation has been a
top priority of technology policy. The Trend Chart country report for Finland lists a number of
measures towards this goal (see Kutinlahti and Oksanen 2003). The National Technology Agency
(Tekes) is strongly committed towards fostering collaboration for innovation in Finland in all of
their programmes. Finland experiences a longer history with a collaboration targeted public fund-
ing policy than most of the other European countries. Since Tekes started its first technology pro-
gramme, collaboration has been a part of the financing principles. Tekes’ notion of collaboration,
however, is not focused on a special kind of collaboration; it rather includes a whole plethora of
different types of networks covering the whole spectrum of activities from basic R&D up to mar-
keting. It induces pre-competitive horizontal collaboration, vertical cooperation as well as net-
works of small and medium sized companies with R&D institutions or large companies, where the
latter cannot get funding unless they cooperate with SMEs or R&D institutes (Schienstock and
Hämäläinen 2001)9 .
Both countries show a different picture concerning the innovative efforts. The magnitude of in-
novative efforts, measured by the fraction of turnover spent for innovation, influences the propen-
sity to co-operate positively in Austria. The sheer magnitude has no significant influence in the
sample of Finnish firms, though. Rather, it is the diversity of efforts that has a positive bearing on
the companies’ tendency to collaborate. The more diverse the innovation activities are, the more
likely the company engages in collaborative activities. Moreover, the use of protection mecha-
nisms plays an important role for Finnish firms to co-operate for innovation. Both, the use of stra-
tegic and formal means of protection increases the likelihood of collaboration. In Austria, on the
other hand, protection mechanisms seem rather unrelated to the collaboration decision.
Our results also show that Finnish companies that strive for products that are new to the market
(INMAR) and companies which aspire only process innovations (INPCSO) tend to collaborate
more often than companies that strive for product and process innovations, where the product
9 Another program that might have influenced the collaboration propensity in the years 1998 to 2000 is the National Workplace Development Programme of the Finnish Ministry of Labor. In the years 1996 to 1999 it aims at increas-ing productivity and quality of working life. The funding focused on the development and the utilization of knowl-edge and innovation in Finnish workplaces. The program includes 13 networking projects and circa 100 organiza-tions be it companies or R&D institutes (Schienstock and Hämäläinen 2001).
- 20 -

innovations are not completely new to the market. Within the sample of Austrian firms, the type
of innovation the companies search for is not of any significance for their collaboration behaviour.
Summary: The model depicts a rather complex picture of determinants explaining collaborative
R&D in Finland. The explanations cover structural variables (firm size), strategic variables as
well as policy variables. The situation in Austria instead is determined prominently by the inten-
sity of innovative efforts and technology indicators (TECHML) by the propensity to export.
- 21 -
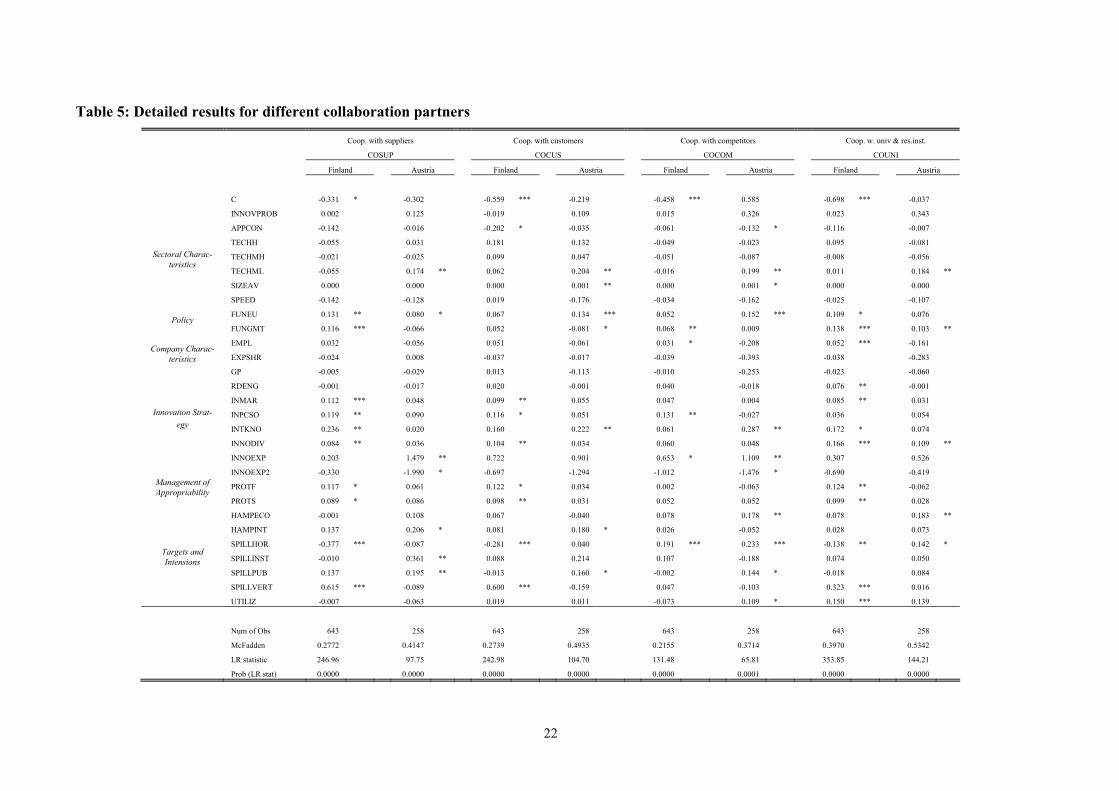
Table 5: Detailed results for different collaboration partners Coop. with suppliers Coop. with customers Coop. with competitors Coop. w. univ & res.inst.
COSUP COCUS COCOM COUNI Finland Austria Finland Austria Finland Austria Finland Austria
C -0.331 * -0.302 -0.559 *** -0.219 -0.458 *** 0.585 -0.698 *** -0.037 INNOVPROB
0.002 0.125 -0.019 0.109 0.015 0.326 0.023 0.343
APPCON -0.142 -0.016 -0.202 * -0.035 -0.061 -0.132 * -0.116 -0.007
TECHH -0.055 0.031 0.181 0.132 -0.049 -0.023 0.095 -0.081
TECHMH -0.021 -0.025 0.099 0.047 -0.051 -0.087 -0.008 -0.056
TECHML -0.055 0.174 ** 0.062 0.204 ** -0.016 0.199 ** 0.011 0.184 **
SIZEAV 0.000 0.000 0.000 0.001 ** 0.000 0.001 * 0.000 0.000
Sectoral Charac-teristics
SPEED -0.142 -0.128 0.019 -0.176 -0.034 -0.162 -0.025 -0.107
FUNEU 0.131 ** 0.080 * 0.067 0.134 *** 0.052 0.152 *** 0.109 * 0.076 Policy
FUNGMT 0.116 *** -0.066 0.052 -0.081 * 0.068 ** 0.009 0.138 *** 0.103 **
EMPL 0.032 -0.056 0.051 -0.061 0.031 * -0.208 0.052 *** -0.161
EXPSHR -0.024 0.008 -0.037 -0.017 -0.039 -0.393 -0.038 -0.283
Company Charac-
teristics GP -0.005 -0.029 0.013 -0.113 -0.010 -0.253 -0.023 -0.060
RDENG -0.001 -0.017 0.020 -0.001 0.040 -0.018 0.076 ** -0.001
INMAR 0.112 *** 0.048 0.099 ** 0.055 0.047 0.004 0.085 ** 0.031
INPCSO 0.119 ** 0.090 0.116 * 0.051 0.131 ** -0.027 0.036 0.054
INTKNO 0.236 ** 0.020 0.160 0.222 ** 0.061 0.287 ** 0.172 * 0.074
INNODIV 0.084 ** 0.036 0.104 ** 0.034 0.060 0.048 0.166 *** 0.109 **
INNOEXP 0.203 1.479 ** 0.722 0.901 0.653 * 1.109 ** 0.307 0.526
Innovation Strat-egy
INNOEXP2 -0.330 -1.990 * -0.697 -1.294 -1.012 -1.476 * -0.690 -0.419
PROTF 0.117 * 0.061 0.122 * 0.034 0.002 -0.063 0.124 ** -0.062 Management of Appropriability
PROTS 0.089 * 0.086 0.098 ** 0.031 0.052 0.052 0.099 ** 0.028
HAMPECO -0.001 0.108 0.067 -0.040 0.078 0.178 ** 0.078 0.183 **
HAMPINT 0.137 0.206 * 0.081 0.180 * 0.026 -0.052 0.028 0.073
SPILLHOR -0.377 *** -0.087 -0.281 *** 0.040 0.191 *** 0.233 *** -0.138 ** 0.142 *
SPILLINST -0.010 0.361 ** 0.088 0.214 0.107 -0.188 0.074 0.050
SPILLPUB 0.137 0.195 ** -0.013 0.160 * -0.002 0.144 * -0.018 0.084
SPILLVERT 0.615 *** -0.089 0.600 *** -0.159 0.047 -0.103 0.323 *** 0.016
Targets and Intensions
UTILIZ -0.007 -0.063 0.019 0.011 -0.073 0.109 * 0.150 *** 0.139 Num of Obs
643 258 643 258 643 258 643 258 McFadden 0.2772 0.4147 0.2739 0.4935 0.2155 0.3714 0.3970 0.5342 LR statistic 246.96 97.75 242.98 104.70 131.48 65.81 353.85 144.21 Prob (LR stat) 0.0000 0.0000 0.0000 0.0000 0.0000 0.0001 0.0000 0.0000
22

Pattern of collaboration
In this section we discuss the results of the analysis of the determinants for collaboration for dif-
ferent partners as displayed in table 5. The discussion structured according to the blocks of influ-
ences discussed above.
Sectoral characteristics
Medium-low technology manufacturing in Austria is the only sector which is significantly linked
to collaboration. This higher collaboration probability can be found for vertical, horizontal and
industry science collaborations. In Finland, we find no significant differences across the sectors.
In Austria, our proxy for the competitive structure of the industry does have a significant influ-
ence on the cooperation with customers and competitors; however, the coefficient is near zero.
The competitive situation within the sector of activity does not have an influence on the collabora-
tion for innovation frequency of the companies in Finland. Beyond the measures for technological
intensity and the firm level innovation activities, the innovative pressure caused by the speed of
the technological dynamic does not cause significant impacts on the companies’ likelihood of
collaboration.
Austrian companies in sectors with strong appropriability conditions tend to collaborate more
frequently vertically such as to manage the appropriability problem. Weak appropriability condi-
tions in the sector cause companies to collaborate less with their customers in Finland.
Summary: Sectoral differences help to explain the collaboration pattern in Austria, whereas the
Finnish pattern of cooperation for innovation is less affected by characteristics related to the sec-
tor of the companies’ activities.
Policy
The innovation policy variables in our analysis only cover public funding. We cover it both on
the national as well as on the EU level. The Finnish innovation policy succeeds in increasing the
collaboration with suppliers, competitors and university and research institutes. We do not find an
influence on the collaboration with customers. This is caused by the design of the public funding,
which explicitly focuses on the creation of a network structure and to induce companies to col-
laborate with partners that they would have not collaborated with, had they not received funding.
The rationale for the state intervention are the indirect beneficial effects that derive from collabo-
ration. The direct economic benefit of collaboration with customers is so obvious for the individ-
ual firms that there seems hardly any rationale for policy to foster it beyond the level that compa-
nies engage in customer collaborations anyway.
23

In Austria, the innovation policy succeeds in fostering science-industry collaboration. However,
as an unintended side effect, it also succeeds in decreasing the collaboration with customers.
Both in Finland and in Austria we find a positive influence of the EU funding. Finnish companies
receiving EU support collaborate more frequently with suppliers and universities. Although hori-
zontal collaboration corresponds best to the EU’s notion of pre-competitive research, Finnish
firms are reluctant to engage in these types of networks even if EU funding is available. Compa-
nies tend to arrange their collaborative networks along the value chain in case of EU funding
(Luukkonen and Niskanen 1998). In Austria, however, vertical and horizontal cooperation for
innovation is positively affected by the availability of EU funding.
Summary: The national policy seems to be of greater relevance to collaboration in Finland than it
is in Austria. EU policy affects both countries to the same extent.
Company characteristics
The affiliation of a company to a group of companies (GP) plays no role in the determination of
collaborative behaviour in both countries. Although both Austria and Finland are small and open
economies, the export orientation does not influence the propensity to collaborate for innova-
tion. However, export orientation is strongly linked to innovation in Austria.
The size of the company has the expected positive impact only on certain types of collaboration
partners of the Finnish companies. Predominantly, it influences the collaboration with competitors
and universities & research institutes. This size effect is in excess of the size effect that is already
included in the regression identifying the innovators. In Finland, collaboration for innovation with
universities and research institutes and with competitors is positively size dependent. In Austria,
no significant influence can be detected for single forms of co-operation. If size is a proxy for the
market power in a certain industry, the collaboration with competitors can be of collusive nature.
The size dependency of collaboration with universities and research institutes can be interpreted
as a self-selection process of the Finnish companies. It is a common belief that research centres
and academic research institutes are only willing to collaborate with larger firms. Moreover, the
collaboration with competitors requires resources for the management of the collaboration and
translating the shared knowledge into a competitive advantage. The availability of these resources
may be strongly size dependent and so may be the propensity to collaborate with competitors. The
collaboration with universities and research institutes is size dependent as with the size of the
company and its internal functional diversification its capability to process the generated (scien-
tific) knowledge increases.
Summary: In both countries, company characteristics have almost no influence on the frequency
and the structure of the collaboration for innovation, once the selection bias of the innovators is
controlled for.
24

Innovation strategy
The innovative intensity has a different impact in Austria and in Finland. Except for competitors
as collaboration partners, the relative size of the innovative efforts does not have a significant
impact on the collaboration probability of Finnish companies. The results for Austrian firms show
a totally different picture. Both for co-operations with suppliers and with competitors we observe
a significant inverted U-shaped relationship. For both cases the innovative intensity has a positive
influence up to the level of about 0.37. Beyond the innovative intensity of 0.37, increasing inno-
vative expenditure results in a decreasing likelihood of collaboration.
The sheer size of the innovative efforts does not determine the collaboration for innovation in
Finland, rather is it the diversity of the innovative activities that has a positive impact on the
propensity to collaborate vertically and with universities and research institutes. The more diversi-
fied the R&D efforts of a firm are, the more likely it is to collaborate with either one of those
partners. This is caused by the comprehensive view Finnish companies maintain of R&D and in-
novation as a core part of their business activities. It also suggests that collaboration is seen as an
integral part of successful innovation activities, whereas the findings for the Austrian companies
suggest, that even if companies maintain a comprehensive approach to innovation this does not
influence their propensity to collaborate significantly. Only science-industry collaboration is de-
termined by the diversity of the innovative activities.
Finnish companies also reveal that science-industry collaboration patterns are closely linked not
only to the comprehensiveness of the R&D approach, but also to its endurance suggesting that
collaboration with universities is a strategic decision being beneficial in the long run.
Cost awareness as indicated by the search for process innovation only causes companies in
Finland to cooperate vertically and horizontally. Yet, cost awareness does not have influence in
Austria, though. The higher vertical collaboration frequency of pure process innovators can also
be explained by the technical requirements and pre-conditions process innovations pose up and
down the value chain. As the Finnish environment is not characterized by fierce price competi-
tion, we suspect that process innovators’ collaboration with competitors concerns the improve-
ment of processes by way of mutual learning that does not directly affect the relevant dimensions
of competition. The more relevant dimension of competition in the case of Finland is certainly
products that are new to the market. In the case of new products to the market we do not see a
significant parameter estimate for collaboration with competitors. With customers and suppliers
involved in the shaping of new products we observe a positive influence of the high level innova-
25
tion dummy.10 Neither the pure process innovators nor the high level innovators reveal a higher
collaboration propensity in Austria.
Summary: The various variables characterizing the design of the companies’ innovative activities
have a strong influence on the composition of the companies’ portfolio of collaboration partners
in Finland. In Austria, however, those variables exhibit only a limited influence on the collabora-
tion pattern.
Targets and intentions
As compared to Austria, the spillovers, be it horizontal or vertical, have a strong influence on
the companies propensity to collaborate in Finland. Vertical spillovers have positive influence on
the frequency of vertical collaboration and science industry collaboration, whereas horizontal
spillovers have a negative influence. Horizontal cooperation, however, is positively influenced by
horizontal spillovers. Vertical spillovers have a negative impact on horizontal collaboration, not
significantly, though.
Public spillovers do not exert any significant influence on any collaboration form. In our analysis,
shortages in economic resources and internal hampering factors have no influence in Finland,
too.
In Austria, horizontal spillovers influence the collaboration probability positively both in the
case of competitors and in the case of universities and research institutes. The latter result contra-
dicts the finding for the Finnish sample. Spillovers from public sources positively influence verti-
cal and horizontal cooperation for innovation. In case of shortages in economic resources the
companies tend to collaborate more frequently with competitors and universities or research insti-
tutes. The first effect points to a cost sharing motive, the latter underpins the common notion of
universities and research institutes as ‘cheap’ collaboration partners. In the case of internal ham-
pering factors vertical collaboration seems mandated. As the internal hampering factors directly
relate to shortages in knowledge there seems to be a knowledge sharing motive behind vertical
collaboration. Spillovers from the science base increase the propensity to collaborate with suppli-
ers.
The utilization of spillovers increases the collaboration probability with universities and research
institutes in Finland supporting the importance of absorptive capacities in science-industry col-
laboration. In Austria, however, it increases the propensity to collaborate with competitors.
10 Also other studies point to the relevance of vertical collaboration for successful innovation, see e.g. Palmberg, Leppälahti, Lemola, and Toivonen, (1999), Palmberg, Niininen, Toivanen, and Wahlberg, (2000).
26

Summary: In both countries the motives for cooperation as exemplified by the spillover variables
and the hampering factor variables are of crucial influence on the amount of collaboration and
structure of the collaboration pattern.
Management of appropriability
The more elaborate the management of appropriability is the more likely Finnish companies are to
collaborate with customers, suppliers and universities and research institutes. Both formal and
strategic methods are used to protect the knowledge and the intellectual property of the firms.
Two interesting facts stand out here. First, the increasing probability to collaborate with universi-
ties and research institutes points to the use of protection mechanisms to protect the intellectual
property generated during the projects, whereas the increasing probability to collaborate with cus-
tomers and suppliers may also point to already protected property that can only be used by the
collaboration partners by way of formal cooperation. Second, the collaboration with competitors
is not affected by the companies’ attitude towards protection methods. Collaboration with com-
petitors is not about issues that can be protected through those mechanisms.
Summary: The management of appropriability determines the collaboration pattern only in
Finland. In Austria appropriability questions do not relate to collaboration issues.
Conclusion
In the sections above we have analyzed and compared the patterns of collaboration for innovation
in Austria and in Finland. Although both countries share some common characteristics such as
being small open economies, being members of the euro-zone, having joined the EU in 1995 and
showing some comparable innovation pattern, we find only little similarities in the factors affect-
ing the company’s decision to collaborate for innovation. Finnish and Austrian firms seem to react
to different influences from their business environment and, in some cases even appraise the same
factors differently. This makes it difficult to answer the question posed at the beginning of the
paper: What makes the difference?
Among the significant independent variables, we find that the presence of vertical spillovers
(Finland) and horizontal spillovers (Austria) have the strongest influence on the co-operation de-
cision. The results also indicate that Austrian firms are strongly influenced in their decision to co-
operate by their sectoral affiliation. However, opposed to conventional wisdom, not only high-
technology but also enterprises from medium-low technology sectors are actively co-operating.
Innovative intensity is another influential factor that affects co-operational behaviour. The results
also show, not surprisingly, the influence of EU policies. Finnish enterprises, on the other hand,
seem to be more influenced by factors within the company’s innovation strategy, like the nature
27
of the innovation pursed, the structure of innovative efforts, or their management of appropriabil-
ity.
A type of co-operation where Finland clearly differs form Austria is collaboration with suppliers
and/or customers. Descriptive analysis shows that co-operations within the supply chain are con-
siderably less common in Austria compared to Finland. Moreover, we found that vertical spill-
overs do not significantly influence the company’s decision to co-operate within the vertical pro-
duction chain in Austria.
Another finding that shed light on the higher co-operation propensity in Finland is the role of pub-
lic funding for the co-operation decision. Governmental funding for innovation seems to be less
effective in Austria when it comes to the promotion of R&D co-operation11. In Finland, the un-
derlying variable is highly significant with a positive coefficient for the general model as well as
for three of the four special models. In Austria, however, we could detect a positive significant
relationship between funding and co-operation only for science-industry co-operations. Moreover,
reviews of the national promotional systems indeed point to the fact that the promotion of co-
operation between enterprises is well implemented in the Finnish promotional system, but not a
top priority of the Austrian technology policy.
Another surprising result is that the sectoral affiliation of the companies cannot explain the vast
differences observed. Indeed, we find a higher propensity among high-tech enterprises to co-
operate than among other classes; however, this connection did not turn out to be significant. The
only sectoral influence we found was that Austrian enterprises in medium-low tech sectors tend to
co-operate significantly more often.
In the light of these results, the co-operative behaviour of firms in Austria and Finland seems to
be embedded to a high degree in the respective national innovation system and a national ‘culture
of co-operation’. This is somehow surprising, given the tendency of firms to globalize their opera-
tions, including R&D.
The existing body of theoretical and empirical literature in the Industrial Organisation or Strategic
Management tradition does not deny the importance of these influences, although they are not at
the core of the explanation. Instead, much of the determinants discussed in the literature (size,
technology content etc.) should be implicitly valid for all enterprises regardless of location. The
idea of the uniqueness and specificity of a single innovation system is more present in the litera-
ture dealing with National Systems of Innovation (recent contributions to this approach are,
among others, Lundvall et al 2002 or Larédo and Mustar 2001). A cross-country approach may be
11 This is not a judgement on the effectiveness of the promotional system with respect to innovation!
28

able to widen the view of the determinants of co-operative behaviour contribute valuable insights
beyond the existing single-country studies.
References
Bayona, C., Garcia-Marco, T., Huerta, E. (2001). Firms' motivations for cooperative R&D: an empirical analysis of Spanish firms, Research Policy 30, 1289-1307.
Belderbos, R., Carree, M. A., Diederen, B., Lokshin, B., Veugelers, R. (2003). Heterogeneity in R&D Cooperation Strategies, Discussion Paper 4021, CEPR, London.
Cantner, U., Pyka, P. (1998). Absorbing Technological Spillovers – Simulations in an Evolu-tionary Framework, Industrial and Corporate Change 7, 369-397.
Cassiman, B. and Veugelers, R. (2002). R&D Cooperation and Spillovers: some empirical evidence from Belgium. American Economic Review, 92, 1169-1184
Cohen, W., Nelson, R. and Walsh, J. (2000). Protecting their Intellectual Assets: Appropri-ability Conditions and Why U.S. Manufacturing Firms Patent (or Not), Working Paper 7552, February, 2000, National Bureau of Economic Research, Cambridge, Mass.
Czarnitzky, D. and Fier, A. (2003). Publicly funded R&D collaborations and patent outcome in Germany, ZEW Working Paper, Center for European Economic Research, Mann-heim.
Dachs, B., Diwisch, S., Kubeczko, K., Leitner, K H., Schartinger, D., Weber, M., Gassler, H., Polt, W., Schibany, A., Streicher. (2003): Zukunftspotentiale der Österreichischen For-schung [Future Potentials of Austrian Research]. Study on behalf Austrian Council for Research and Technology Development. Vienna.
Dodgson, M. (1994). Technological collaboration and innovation, in Dodgson, M., Rothwell, R. (eds), The Handbook of Industrial Innovation, Edward Elgar, Cheltenham, pp. 285–292.
Dyer, J., Singh, H.: (1998). The Relational View: Co-operative Strategy and Sources of Inter-organizational Competitive Advantage, Academy of Management Review, Vo. 23, 660-679.
European Commission (2001). Statistics on Innovation in Europe, Luxemburg
Fritsch, M., Lukas, R. (2001). Who cooperates for R&D? Research Policy 30, 297-312.
Gemunden, H.G., Heydebreck, P., Herden, R. (1982). Technological interweavement: A means of achieving innovation success. R&D Management 22, 359–375
Hagedoorn, J., Schakenraad, J. (1989). Strategic Partnering and Technological Cooperation, in: Dankbaar, B., Groenewegen, J. and Schenk, H. (eds.), Perspectives in Industrial Economics, Dordrecht, Kluwer Academic Publishers.
Hernan, R., Marin, P. L., Siotis, G. (2003). An empirical evaluation of the determinants of research joint venture formation, Journal of Industrial Economics 51, 75 -89.
Jaffe, A. B. (1986). Technological opportunity and spillovers of R&D: evidence from firm’s patents, profits, and market value, American Economic Review 76, 584-1001.
Jaffe, A. B. (1988). Demand and supply influences in R&D intensity and productivity growth, Review of Economics and Statistics 70, 431-437.
Kamien, M. I., Zang, I. (2000). Meet me halfway: research joint ventures and absorptive ca-pacity, International Journal of Industrial Organization 18, 995-1012.
29

Kaiser, U. (1999). Measuring knowledge spillovers in manufacturing and services: an em-pirical assessment of alternative approaches, Discussion Paper 99-62, ZEW Mannheim.
Kaiser, U. (2002). An empirical test of models explaining research expenditures and research cooperation: evidence for the German service sector. International Journal of Industrial Organization 20, 747-774.
Kang, N., Sakai, K. (2000). International Strategic Alliances – Their Role in Industrial Glob-alisation, STI Working Paper, 2000/5, OECD, Paris.
Klevorick, A., Levin, R., Nelson, R., Winter, S. (1995). On the Sources and Significance of Interindustry Differences in technological Opportunities, Research Policy 24, 185-205.
Kutinlahti, P., Oksanen, J. (2003). Trend Chart Country Report Finland. Covering Period: September 2002 to August 2003. http://www.vtt.fi/ttr/pdf2003/trend03.pdf
Larédo, P., Mustar, P. (eds., 2001). Research and Innovation Policies in the New Global Economy. An International Comparative Analysis. Eward Elgar, Cheltenham.
Leitner, K.-H. (2003). Von der Idee zum Markt. Die 50 besten Innovationen Österreichs. Böhlau, Vienna
Leo, H. (1999). Innovationsaktivitäten der österreichischen Wirtschaft, Band 1: Sachgüter-produktion. WIFO Report, Vienna.
Leo, H., Ziegler, E. (2002). Trend Chart Country Report Austria, http://www.cordis.lu/trendchart
Levin, R., Cohen, W., Nelson, R., Winter, S. (1987). Appropriating the Returns from Indus-trial R&D, Brooking Papers on Economic Activity, 783-820.
Lundvall, B.A., Johnson, B., Anderson, E.S. and Dalum, B. (2002). National Systems of Pro-duction, Innovation and Competence Building, Research Policy, Vol. 31, 213-231.
Luukkonen, T., Niskanen, P. (1998). Learning Through Collaboration – Finnish Participa-tion In EU Framework Programmes, VTT Technology Studies, Espoo.
Malerba, F., Orsenigo, L. (1993). Technological Regimes and Firm Behaviour, Industrial and Corporate Change, 2, 45-71.
Mansfield, E. (1985). How rapidly does new industrial technology leak out? Journal of Indus-trial Economics 34, 217-223.
Nelson, R. R. (1987). Understanding Technical Change as an Evolutionary Process, Amster-dam, Elsevier, North Holland.
OECD (1997). Oslo Manual - Proposed Guidelines For Collecting and Interpreting Techno-logical Innovation Data, OECD, Paris.
OECD (2001). Science, Technology and Industry Outlook 2001, Paris.
Olsen, R. J. (1980). A Least Squares Correction for Selectivity Bias, Econometrica, 48, 1815-20.
Palmberg, C., Leppälahti, A., Lemola, T. and Toivonen, H. (1999). Towards a better under-standing of innovation and industrial renewal in Finland - a new perspective, Vol. 41 of Working Papers, VTT Group for Technology Studies, Espoo.
Palmberg, C., Niininen, P., Toivanen, H. and Wahlberg, T. (2000). Industrial innovation in Finland, Vol. 47/00 of Working Paper Series, VTT Technology Studies, Espoo.
Pyka, A. (2000). Informal Networking and Industrial Life Cycles, Technovation, 20, 25-35
30
31
Pyka, A. (2002). Innovation Networks in Economics – From the Incentive Based to the Knowledge Based Approaches, European Journal of Innovation Management, 5, 152-163.
Pyka, A., Saviotti, P.P. (2002). Innovation Networks in the Biotechnology-Based Industries, in: Pyka, A., Küppers, G. (eds.), Innovation Networks – Theory and Practice, Edward Elgar, Cheltenham, 2002.
Schienstock, G., Hämäläinen, T. (2001). Transformation of The Finnish Innovation System: A Nework Approach, Sitra Reports Series 7, Sitra, Helsinki.
Tether, B. S. (2001). Identifying Innovation, Innovators and Innovative Behaviours: A Criti-cal Assessment of The Community Innovation Survey (CIS), CRIC Discussion Paper 48, Manchester.
Tether, B. S. (2002). Who cooperates for innovation, and why: An empirical analysis, Re-search Policy 31, 947–967.
Vonortas, N., Caloghiorou, Y., Ioabbides, S. (2003). Research joint ventures: A critical sur-vey of theoretical and empirical literature, Journal of Economic Surveys, 17, 541.
Von Hippel, E.: 1989, Cooperation between Rivals: Informal Know how Trading, in: Carls-son, B. (ed.), Industrial Dynamics, Dordrecht, Kluwer Academic Publishers.
Winter, S. G.: 1984, Schumpeterian Competition in Alternative Technological Regimes, Journal of Economic Behaviour and Organization 5, 287-320.
Related Documents