Why did Britain’s households get richer? Decomposing UK household income growth between 1968 and 2008–09 (IFS analysis for the Resolution Foundation) IFS Briefing Note 125 Mike Brewer Liam Wren-Lewis

Welcome message from author
This document is posted to help you gain knowledge. Please leave a comment to let me know what you think about it! Share it to your friends and learn new things together.
Transcript
Why did Britain’s households get richer? Decomposing UK household income growth between 1968 and 2008–09 (IFS analysis for the Resolution Foundation)
IFS Briefing Note 125
Mike Brewer Liam Wren-Lewis
1
© Institute for Fiscal Studies, 2011
Why did Britain’s households get richer?
Decomposing UK household income
growth between 1968 and 2008–091
Mike Brewer
Institute for Fiscal Studies and Institute for Social and Economic Research,
University of Essex
Liam Wren-Lewis
ECARES, Université libre de Bruxelles and Overseas Development Institute
December 2011
1 The Resolution Foundation has funded this work as an input to its Commission on Living
Standards. The authors also acknowledge support from the ESRC Centre for the
Microeconomic Analysis of Public Policy at IFS and from the ESRC Research Centre on Micro-
Social Change at ISER, University of Essex. This work builds on past collaboration with Alastair
Muriel. The authors have benefited greatly from comments and suggestions from Richard
Dickens, Paul Gregg and Paul Johnson. James Plunkett and the team at Resolution Foundation
provided helpful guidance and feedback throughout. The authors would also like to thank
Cormac O’Dea for providing help with the Family Expenditure Survey data. The Family
Resources Survey and Households Below Average Income series were made available by the
Department for Work and Pensions, which bears no responsibility for the interpretation of the
data in this report. Family Expenditure Survey data were collected by the Office for National
Statistics and distributed by the Economic and Social Data Service. Crown copyright material is
reproduced with the permission of the Controller of HMSO and the Queen’s Printer for
Scotland.
2
© Institute for Fiscal Studies, 2011
Executive summary
Average UK household income has almost doubled in real terms over the past
forty years. This report asks ‘From where has the growth in household income
come?’ and answers this by documenting and analysing the various factors that
have contributed to this growth. Although many of these have been analysed
individually, this is the first detailed study of their relative importance. The
report covers all elements of income, but two prove particularly significant: first,
employment income, which can be broken down in three different ways – into
earnings from the main earner and earnings from others in the household, into
earnings from men and earnings from women, and as a combined effect of
employment rates, average working hours and average hourly pay; second,
income from the benefit and tax credit system. In all cases, we quantify the
importance of each factor and how this has changed over time.
The report has been prepared for the Resolution Foundation Commission on
Living Standards, a wide-ranging investigation into the material well-being of
low- to middle-income Britain. Much of the focus of this report is therefore on the
low- to middle-income group and on how the experience of this group has
differed from that of the rest of the population, a fact that comes out strongly in
the results. In our analysis, ‘low- to middle-income’ means households in the 10th
to 50th percentiles of the gross income distribution that receive less than 50% of
their income from benefits (including tax credits).2
All working-age households
As might be expected, employment income has, on average, been the main driver
of household income growth for working-age households. Increases in hourly
wages are in turn the main explanation both of this growth in employment
income and of the way its rate of growth has fluctuated over time. Wage growth
was strongest between 1968 and 1973 and between 1980 and 1990, but has
slowed since 1990. Since 1968, male employment has fallen and female
employment has risen, producing a major shift in the gender composition of
employment income. Both effects occurred throughout the period, though the
rise in women’s employment has slowed over time and the fall in male
2 This is slightly different from the usual definition used (which requires households to receive
no more than 20% of their gross income in means-tested benefits), but leads to a population
that is broadly the same. The alternative definition is used since we cannot separate out
means-tested benefits for our entire sample period.
3
© Institute for Fiscal Studies, 2011
employment was most concentrated in the 1980s. Since 1990, though, changes in
the average number of hours worked a week have had a greater impact on
household income than changes in the employment rate, with men working
fewer hours and women working more.
Other sources of income have also played an important role. Rises in employment
taxes have generally accompanied rises in gross employment income, with
particularly large rises between 1972 and 1975 and between 2003–04 and
2007–08. Income from social security benefits rose considerably between 1973
and 1980 and between 1990 and 2002–03, and tax credits became an important
component of household income from 2000–01 onwards. A rise in self-
employment income was a major factor in household income growth in the
1980s, but this income source had a minimal impact in other periods. Similarly,
most of the growth in income from investments and pensions occurred during
that decade.
Low- to middle-income households
The pattern of growth is quite different among low- to middle-income (LMI)
households. Rises in gross hourly wages have, again, been the most important
factor overall. But two more striking trends emerge from the data.
First, there has been a quite dramatic shift from male to female employment
income: between 1968 and 2008–09, 78% of all of the growth in gross
employment income among LMI households came from women. Income from
men’s work has barely increased for low- to middle-income households since
1968, growing at less than a quarter of the rate it has for the overall population.
This stagnation in male earned income stems from the fact that the growth in
male wages has been all but cancelled out by falls in male employment. Among all
households, male wage growth has been strong enough to more than offset any
falls in employment, but this has not been the case among LMI households since
1980. In earlier decades, rising employment among female earners in the
household made up for the decline in male earnings. As a result, employment
income for LMI households has become increasingly sourced from female
earners: in 1968, 86% of household gross employment income came from men
and 14% from women; in 2008–09, 63% came from men and 37% from women.
The second major pattern has been the importance of benefit and tax credit
income. Benefits and tax credits together explain around a third of the total rise
in household income for LMI households since 1968. Tax credits have increased
gradually since 2000–01, and their importance has grown even when
4
© Institute for Fiscal Studies, 2011
employment rates have not been falling. For some household types, notably lone
parents with children, tax credits have made up a substantial portion of income
growth, in this case 68% in the entire period, in spite of their recent introduction.
Between 2002–03 and 2008–09, because of falls in income from other sources
(notably male earnings), tax credits rose by four times the total rise in LMI
household income growth; in other words, all else equal, LMI household income
would have fallen significantly without the rise in income from tax credits.
The role of other factors has been more complicated. The impact of employment
taxes on the income of low- to middle-income households has fluctuated
substantially: between 1973 and 1980, the rise in employment taxes was several
times the rise in gross employment income; and the amount of employment taxes
paid also rose, on average, between 2002–03 and 2008–09 despite households
receiving less gross employment income. On the other hand, the amount paid in
employment taxes fell substantially between 1980 and 1990, and barely rose
between 1990 and 2002–03. These trends broadly match changes to key rates
and allowances of income tax and National Insurance contributions. Income from
self-employment, investments and pensions also contributed to income growth,
with most of their rise taking place in the 1980s.
Conclusions
In little more than a generation, low- to middle-income households have seen a
major shift in the sources of their income, while the richest households have seen
little change. The key dynamic has been one of diversification; having been
dominated by the earnings of a (generally male) main earner, LMI households
today receive large portions of their income from female employment and from
the benefit and tax credit system. This greater diversity of income sources may
reduce the risk of negative income shocks. But these changes mean that LMI
households are now more dependent on external support, whether directly
(through the generosity of the benefit and tax credit system) or indirectly
(through the availability of services, such as childcare, that make dual earning, or
lone-parent working, possible).
Looking forwards, these trends carry one inescapable implication for the
prospects of future growth in LMI household income. Because wages now make
up less of LMI household income, wage growth – even if it is flat across the
household income distribution – does less to raise the income of this group than
it does to raise the income of households higher up the distribution. In other
words, even if wage growth is spread equally across all households, LMI
5
© Institute for Fiscal Studies, 2011
households will fall behind unless benefits and tax credits see year-on-year
above-inflation increases, or there is a substantial increase in employment rates
or hours worked in LMI households relative to the overall population. If, instead,
earnings growth is not flat but regressive across the household income
distribution, as it has been consistently for several decades, these pressures will
be increased.
1. Introduction
Average household income has almost doubled over the past forty years. A
number of factors have been identified as being behind this, including increases
in wages, a greater number of women in work and a rise in the generosity of state
benefits and tax credits. Although many of these drivers of household income
have been analysed individually, there has been comparatively little study of the
relative importance of each factor. This is particularly true for low- to middle-
income households, for which we know wage and benefit changes have been
substantially different from those for higher-income households.
This report therefore documents what factors lay behind the rise in average
household income growth over the period 1968 to 2008–09.
With four decades of micro-data on household incomes, and relatively simple
methods, we decompose changes in household income by income source and by
household size, and we further break down changes in employment income by
household member and into separate employment, hours and hourly wage
effects. In all instances, our goal is to answer the question, ‘How much of the
change in income is a result of a change in this factor?’. We examine changes in
household income for the whole sample of working-age households and for those
categorised by the Resolution Foundation as ‘low- to middle-income’.3 We also
examine these changes for those in the 10th–50th percentiles of gross income and
for individuals in the richest 10% of households; these results are presented in
Appendix B.
The report builds on previous work undertaken by the Resolution Foundation
that sought to understand income growth (and its absence) amongst low- to
3 In this report, we consider low- to middle-income households to be those that lie between
the 10th and 50th percentiles of the distribution of gross household income receiving less than
50% of their gross income from benefits (including tax credits). This is slightly different from
the usual definition used (which requires households to receive no more than 20% of their
gross income in means-tested benefits), but leads to a population that is broadly the same.
6
© Institute for Fiscal Studies, 2011
middle-income households. Plunkett (2011) considered how a range of income
sources – including wages, benefits and taxes – have affected households’ total
income, whilst Whittaker and Savage (2011) sought to understand the recent
slowdown in low-earner wage growth. This report also complements work that
focused on decomposing changes in the distribution of household income,
including Jenkins (1995) and Brewer, Muriel and Wren-Lewis (2009). Indeed, we
apply a similar decomposition methodology to one of those used by Brewer et al.
but here we focus directly on income growth whereas they looked at inequality.
This report is organised as follows. Section 2 describes the data used, which are
principally based on the Households Below Average Income (HBAI) data series.
Section 3 describes the decomposition methodology. The results are presented in
Section 4, which is divided into two subsections: results for all working-age
households and results for ‘low- to middle-income’ households. Section 5
concludes by summarising the results and suggesting their possible policy
implications.
2. Data
We base our analysis on the ‘Households Below Average Income’ (HBAI) data
series, produced by the Department for Work and Pensions and used by DWP to
provide annual snapshots of Britain’s income distribution. The HBAI series is
derived from two large cross-sectional household surveys: the Family
Expenditure Survey (FES) for the years between 1968 and 1993 and the Family
Resources Survey (FRS) for the years between 1994–95 and 2008–09. The FES
provides a representative sample of around 7,000 households per year, and the
introduction of the FRS provides a substantially larger sample size of around
24,000 households per year. Our data cover all the years from 1968 to 2008–09.4
We use the normal measure of income provided in the HBAI data sets, which is
weekly net disposable household income summed across all individuals living in
4 HBAI data sets also exist for the years 1961 to 1967, but we do not use these, for two
reasons. First, the FES sample size was considerably smaller prior to 1968 (around 3,000
households, compared with 7,000 households from 1968 onwards). Although this smaller
sample size need not prevent us using the data, there is a second problem with these early
years: in both 1964 and 1967, data are only available for the first two quarters of the year
(giving an effective sample size of just 1,500 households in 1964). The resulting data sets thus
give an incomplete picture of incomes in those years.
7
© Institute for Fiscal Studies, 2011
the same household.5 Incomes are measured net of taxes and benefits – i.e. after
all direct taxes (income tax, National Insurance contributions and council tax)
have been deducted from income, and all state benefits and tax credits have been
added. Incomes are then adjusted (‘equivalised’) to take into account the size and
composition of households, using the modified OECD equivalence scale.6 All
financial values in this paper are expressed in 2008–09 prices, inflated using a
variant of the RPI.7
Our initial sample includes all individuals in the HBAI sample that live in Great
Britain.8 Since the processes determining the income of pensioners are very
different from those for people of working age, we remove all households where
the household head is above working age, i.e. heads of 65 or over for men and 60
or over for women.9 We then ‘trim’ the income distribution by removing the top
and bottom 1%. In trimming the income distribution in this way, we certainly do
not wish to downplay the importance of the ‘tails’ of the distribution to overall
trends. Nor, however, do we wish our results to be driven by changes in the
worst-measured parts of the income distribution. Our decision to trim only the
top and bottom 1% of the distribution represents a trade-off between these two
concerns. We use the trimmed income distribution in all decompositions
contained in this report.
5 Further information on the HBAI measurement of income can be found at
http://campaigns.dwp.gov.uk/asd/index.php?page=hbai_arc#hbai.
6 For more information, see the OECD document ‘What are equivalence scales?’
(http://www.oecd.org/dataoecd/61/52/35411111.pdf). By using a constant equivalence scale,
we are abstracting from any changes in equivalence scales over time – see Banks and Johnson
(1994) for a discussion of the effect of choosing different equivalence scales in different years.
The OECD modified equivalence scale was calculated based on analysis in 1994.
7 The deflator accounts for the fact that council tax payments have been deducted from
income.
8 Data from Northern Ireland are not available consistently across the four decades, and so we
exclude it.
9 The definition of head of household we use is that in the Family Resources Survey. The head
of household is the person, or husband of the person, who owns the accommodation or pays
the rent. When two members of different sex have equal claim, the male is taken as head of
household; when two members of the same sex have equal claim, the elder is taken as head of
household. There are some attractions to setting the main earner as the head of household, but
it is not possible to construct such a variable for all the years of the data.
8
© Institute for Fiscal Studies, 2011
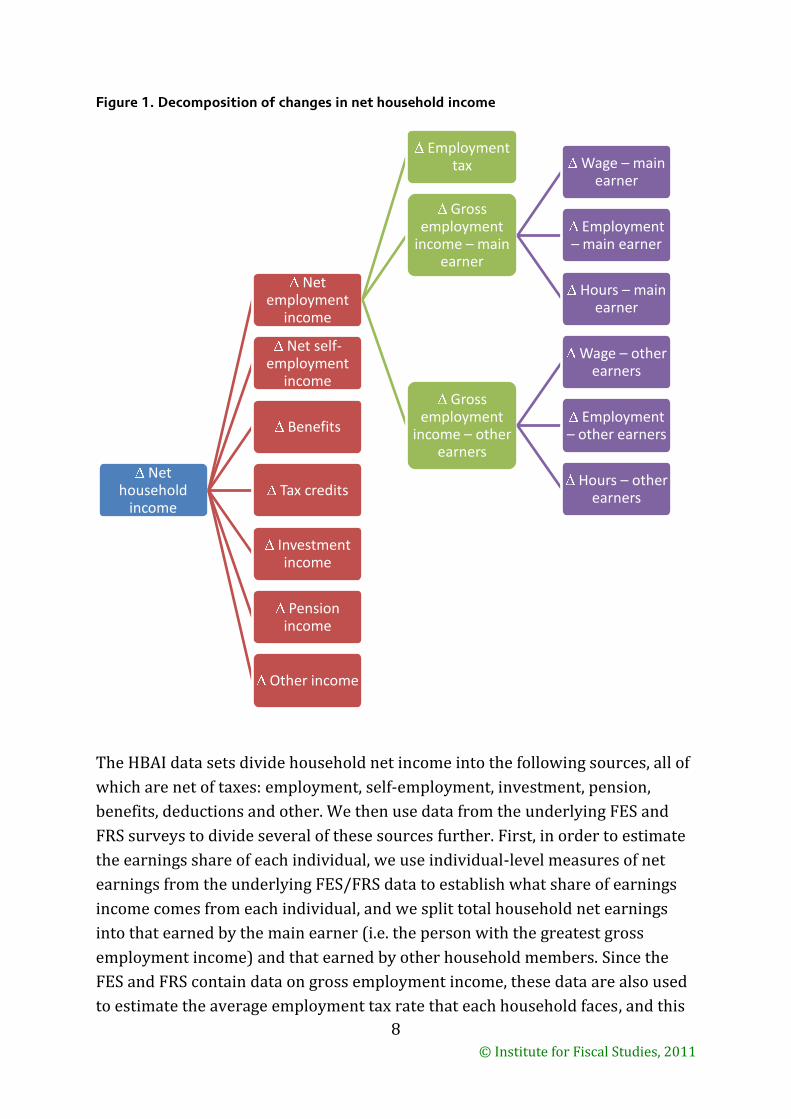
Figure 1. Decomposition of changes in net household income
The HBAI data sets divide household net income into the following sources, all of
which are net of taxes: employment, self-employment, investment, pension,
benefits, deductions and other. We then use data from the underlying FES and
FRS surveys to divide several of these sources further. First, in order to estimate
the earnings share of each individual, we use individual-level measures of net
earnings from the underlying FES/FRS data to establish what share of earnings
income comes from each individual, and we split total household net earnings
into that earned by the main earner (i.e. the person with the greatest gross
employment income) and that earned by other household members. Since the
FES and FRS contain data on gross employment income, these data are also used
to estimate the average employment tax rate that each household faces, and this
Net household
income
Net employment
income
Employment tax
Gross employment
income – main earner
Wage – main earner
Employment – main earner
Hours – main earner
Gross employment
income – other earners
Wage – other earners
Employment – other earners
Hours – other earners
Net self-employment
income
Benefits
Tax credits
Investment income
Pension income
Other income
9
© Institute for Fiscal Studies, 2011
tax rate is used to estimate a measure of the total employment tax paid by each
household.10 We also use data from the FRS to estimate the share of each
household’s benefit income that is received in the form of tax credits; this is then
used to create a tax credit income source from 2000–01 onwards.11
Figure 1 demonstrates how the data allow us to break down the changes in total
household income. The precise decomposition can be found in Section 3.
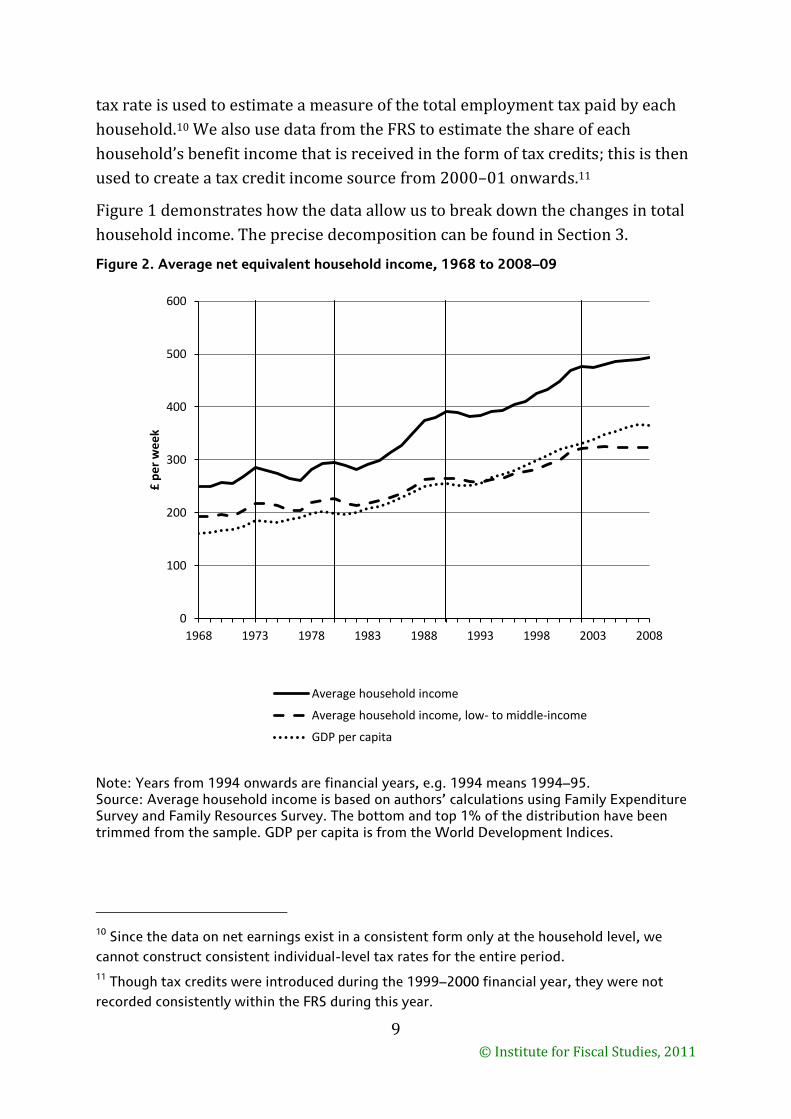
Figure 2. Average net equivalent household income, 1968 to 2008–09
Note: Years from 1994 onwards are financial years, e.g. 1994 means 1994–95. Source: Average household income is based on authors’ calculations using Family Expenditure Survey and Family Resources Survey. The bottom and top 1% of the distribution have been trimmed from the sample. GDP per capita is from the World Development Indices.
10 Since the data on net earnings exist in a consistent form only at the household level, we
cannot construct consistent individual-level tax rates for the entire period.
11 Though tax credits were introduced during the 1999–2000 financial year, they were not
recorded consistently within the FRS during this year.
0
100
200
300
400
500
600
1968 1973 1978 1983 1988 1993 1998 2003 2008
£ p
er
we
ek
Average household income
Average household income, low- to middle-income
GDP per capita
10
© Institute for Fiscal Studies, 2011
As background to our detailed results in Section 4, Figure 2 shows how mean net
equivalised household income (hereafter, ‘average household income’ or
‘household income’) has changed over the period we analyse.
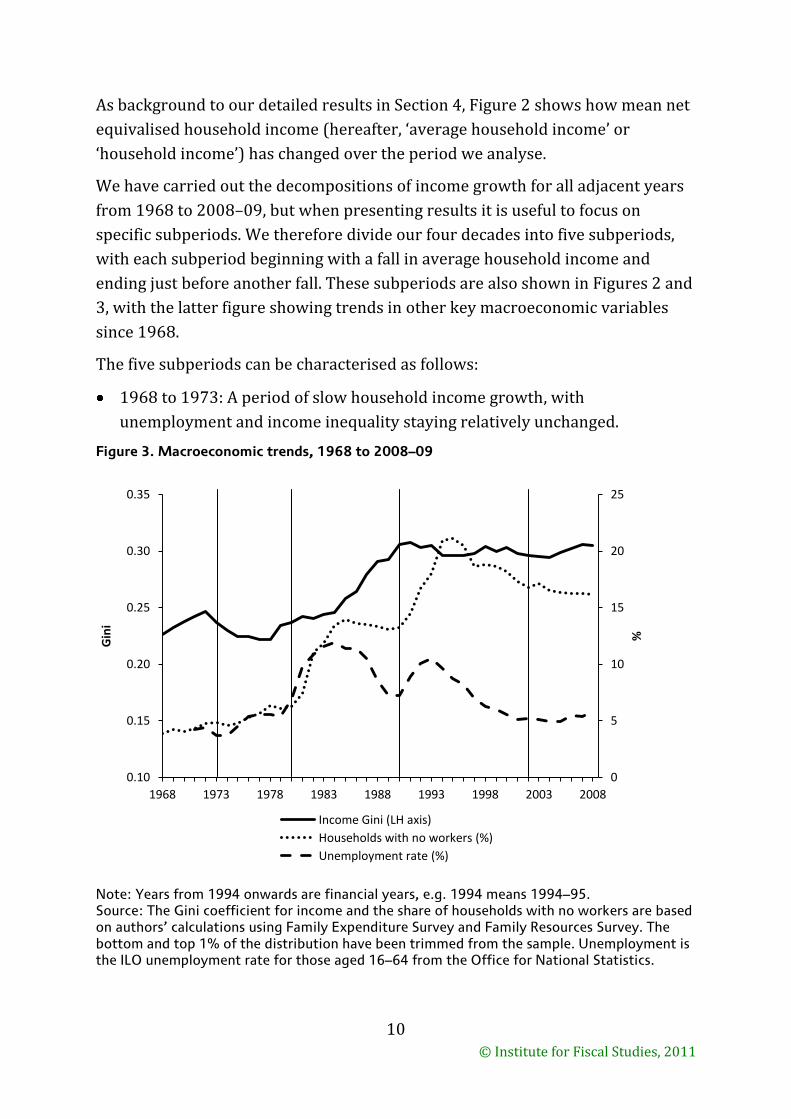
We have carried out the decompositions of income growth for all adjacent years
from 1968 to 2008–09, but when presenting results it is useful to focus on
specific subperiods. We therefore divide our four decades into five subperiods,
with each subperiod beginning with a fall in average household income and
ending just before another fall. These subperiods are also shown in Figures 2 and
3, with the latter figure showing trends in other key macroeconomic variables
since 1968.
The five subperiods can be characterised as follows:
1968 to 1973: A period of slow household income growth, with
unemployment and income inequality staying relatively unchanged.
Figure 3. Macroeconomic trends, 1968 to 2008–09
Note: Years from 1994 onwards are financial years, e.g. 1994 means 1994–95. Source: The Gini coefficient for income and the share of households with no workers are based on authors’ calculations using Family Expenditure Survey and Family Resources Survey. The bottom and top 1% of the distribution have been trimmed from the sample. Unemployment is the ILO unemployment rate for those aged 16–64 from the Office for National Statistics.
0
5
10
15
20
25
0.10
0.15
0.20
0.25
0.30
0.35
1968 1973 1978 1983 1988 1993 1998 2003 2008
%
Gin
i
Income Gini (LH axis)
Households with no workers (%)
Unemployment rate (%)
11
© Institute for Fiscal Studies, 2011
1973 to 1980: A substantial decline in household income followed by a
recovery, with little overall growth over the cycle. Unemployment grew over
the period, whilst income inequality dipped slightly but remained close to
1973 levels.
1980 to 1990: After an initial dip in average income, a period of rapid
household income growth. Unemployment and the percentage of households
without work grew rapidly in the first half of the decade, with only the former
falling back by 1990. This subperiod also contained a very large rise in income
inequality.
1990 to 2002–03: A period of very low income growth followed by a period of
steady income growth. This subperiod saw a recession at the beginning,
followed by a period of steady GDP per capita growth and decline in
unemployment. Income inequality remained largely unchanged.
2002–03 to 2008–09: A very small dip in household incomes followed by a
gradual rise mainly concentrated amongst the upper half of the income
distribution. This was accompanied by a slight increase in inequality and
unemployment.
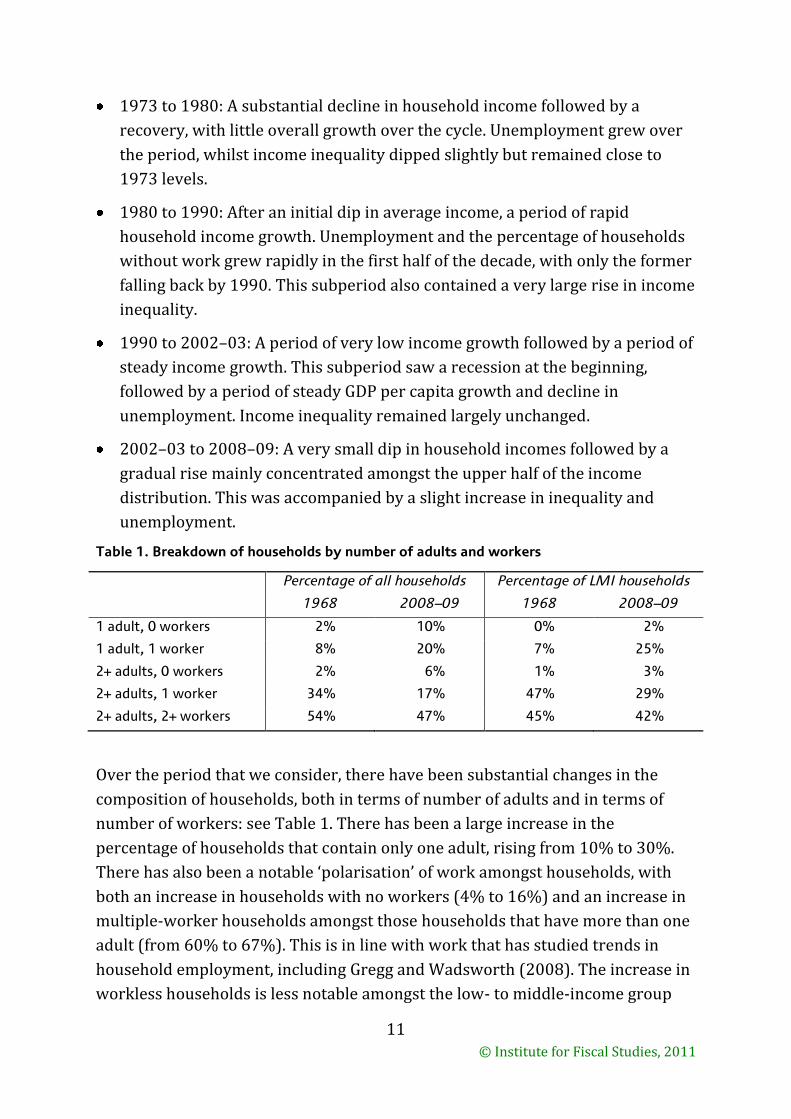
Table 1. Breakdown of households by number of adults and workers
Percentage of all households Percentage of LMI households
1968 2008–09 1968 2008–09
1 adult, 0 workers 2% 10% 0% 2%
1 adult, 1 worker 8% 20% 7% 25%
2+ adults, 0 workers 2% 6% 1% 3%
2+ adults, 1 worker 34% 17% 47% 29%
2+ adults, 2+ workers 54% 47% 45% 42%
Over the period that we consider, there have been substantial changes in the
composition of households, both in terms of number of adults and in terms of
number of workers: see Table 1. There has been a large increase in the
percentage of households that contain only one adult, rising from 10% to 30%.
There has also been a notable ‘polarisation’ of work amongst households, with
both an increase in households with no workers (4% to 16%) and an increase in
multiple-worker households amongst those households that have more than one
adult (from 60% to 67%). This is in line with work that has studied trends in
household employment, including Gregg and Wadsworth (2008). The increase in
workless households is less notable amongst the low- to middle-income group
12
© Institute for Fiscal Studies, 2011
since many workless households fall in the bottom decile or receive at least 50%
of their income through benefits, and so are not included in the LMI group.
3. Methodology
This section sets out the decomposition method used in this report. A
decomposition approach allows us to build up a rich data set that breaks down
annual changes in household income by population group and by income source
over a period of forty years. These data can then be aggregated in a variety of
ways, which provides a great deal of flexibility compared with a simulation
approach. The approach also allows us to consider the influence of many sources
simultaneously without being path-dependent.12
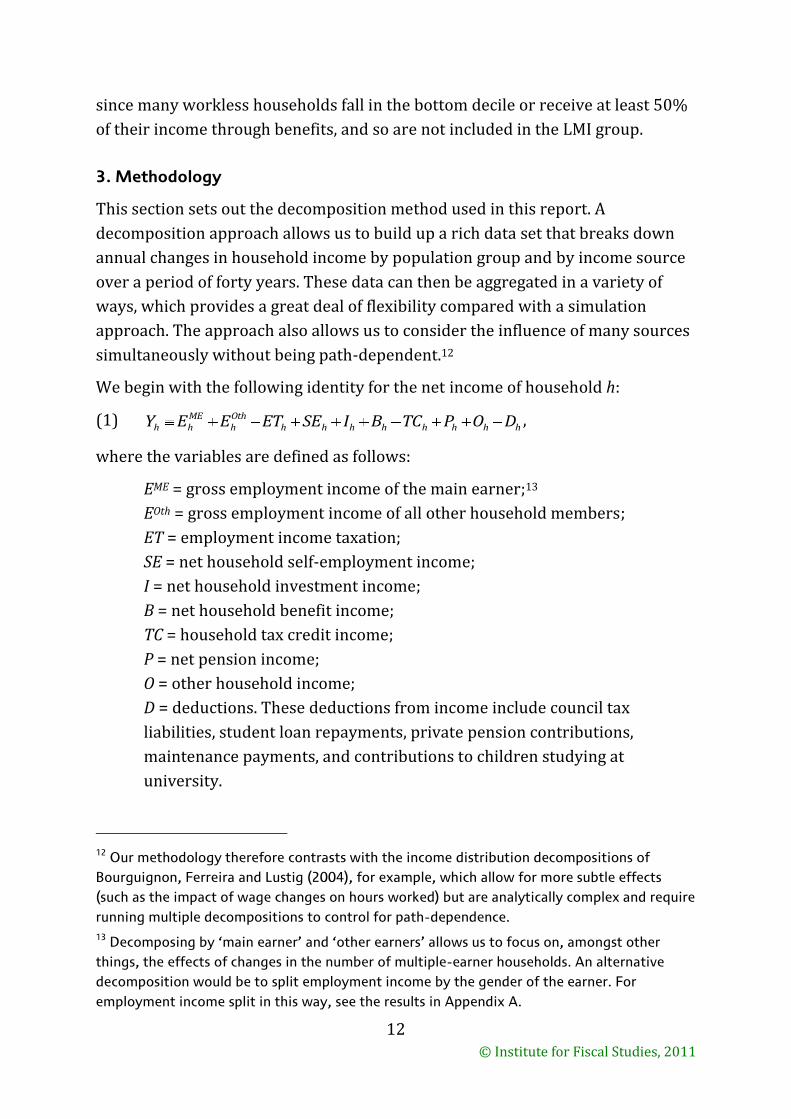
We begin with the following identity for the net income of household h:
(1) Othh h h h h hME
h h h h hY E E ET SE I B TC P O D ,
where the variables are defined as follows:
EME = gross employment income of the main earner;13
EOth = gross employment income of all other household members;
ET = employment income taxation;
SE = net household self-employment income;
I = net household investment income;
B = net household benefit income;
TC = household tax credit income;
P = net pension income;
O = other household income;
D = deductions. These deductions from income include council tax
liabilities, student loan repayments, private pension contributions,
maintenance payments, and contributions to children studying at
university.
12 Our methodology therefore contrasts with the income distribution decompositions of
Bourguignon, Ferreira and Lustig (2004), for example, which allow for more subtle effects
(such as the impact of wage changes on hours worked) but are analytically complex and require
running multiple decompositions to control for path-dependence.
13 Decomposing by ‘main earner’ and ‘other earners’ allows us to focus on, amongst other
things, the effects of changes in the number of multiple-earner households. An alternative
decomposition would be to split employment income by the gender of the earner. For
employment income split in this way, see the results in Appendix A.
13
© Institute for Fiscal Studies, 2011
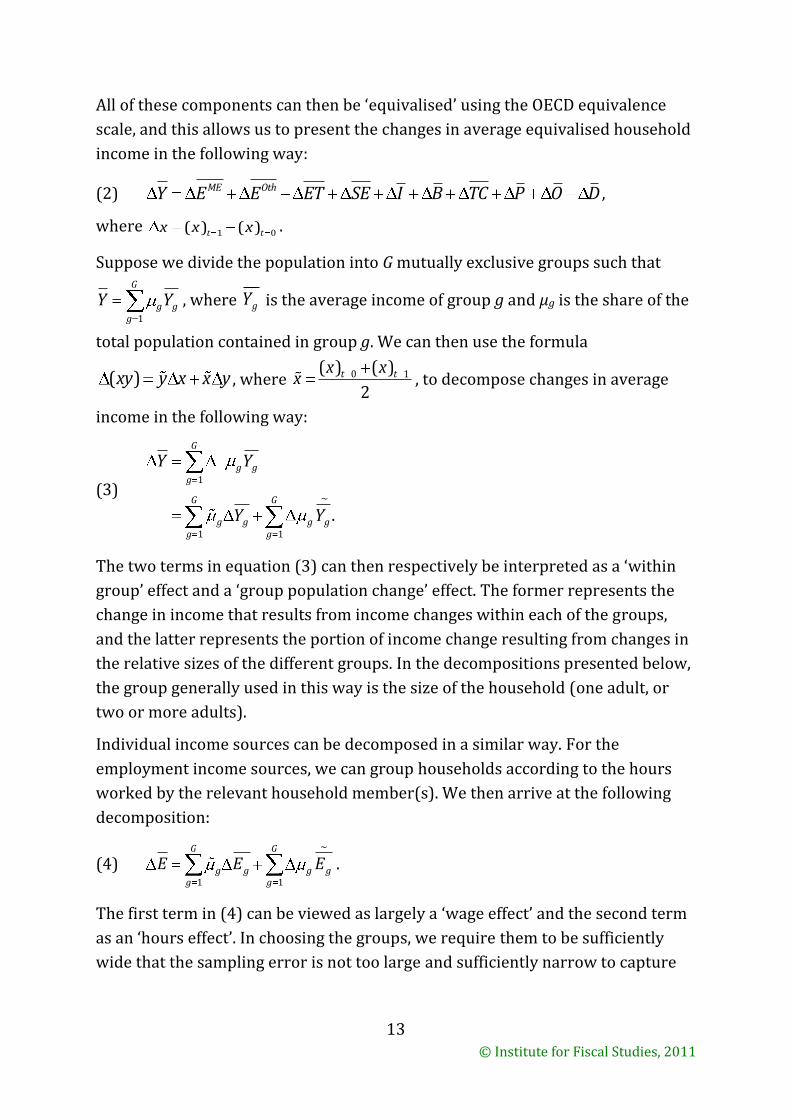
All of these components can then be ‘equivalised’ using the OECD equivalence
scale, and this allows us to present the changes in average equivalised household
income in the following way:
(2) OthMEY E E ET SE I B TC P O D ,
where 1 0( ) ( )t tx x x .
Suppose we divide the population into G mutually exclusive groups such that
1
G
g gg
Y Y , where gY is the average income of group g and μg is the share of the
total population contained in group g. We can then use the formula
( )xy y x x y , where 0 1( ) ( )
2t tx x
x , to decompose changes in average
income in the following way:
(3) 1
~
1 1
.
G
g gg
G G
g g g gg g
Y
Y Y
Y
The two terms in equation (3) can then respectively be interpreted as a ‘within
group’ effect and a ‘group population change’ effect. The former represents the
change in income that results from income changes within each of the groups,
and the latter represents the portion of income change resulting from changes in
the relative sizes of the different groups. In the decompositions presented below,
the group generally used in this way is the size of the household (one adult, or
two or more adults).
Individual income sources can be decomposed in a similar way. For the
employment income sources, we can group households according to the hours
worked by the relevant household member(s). We then arrive at the following
decomposition:
(4) ~
1 1
G G
g g g gg g
EE E .
The first term in (4) can be viewed as largely a ‘wage effect’ and the second term
as an ‘hours effect’. In choosing the groups, we require them to be sufficiently
wide that the sampling error is not too large and sufficiently narrow to capture
14
© Institute for Fiscal Studies, 2011
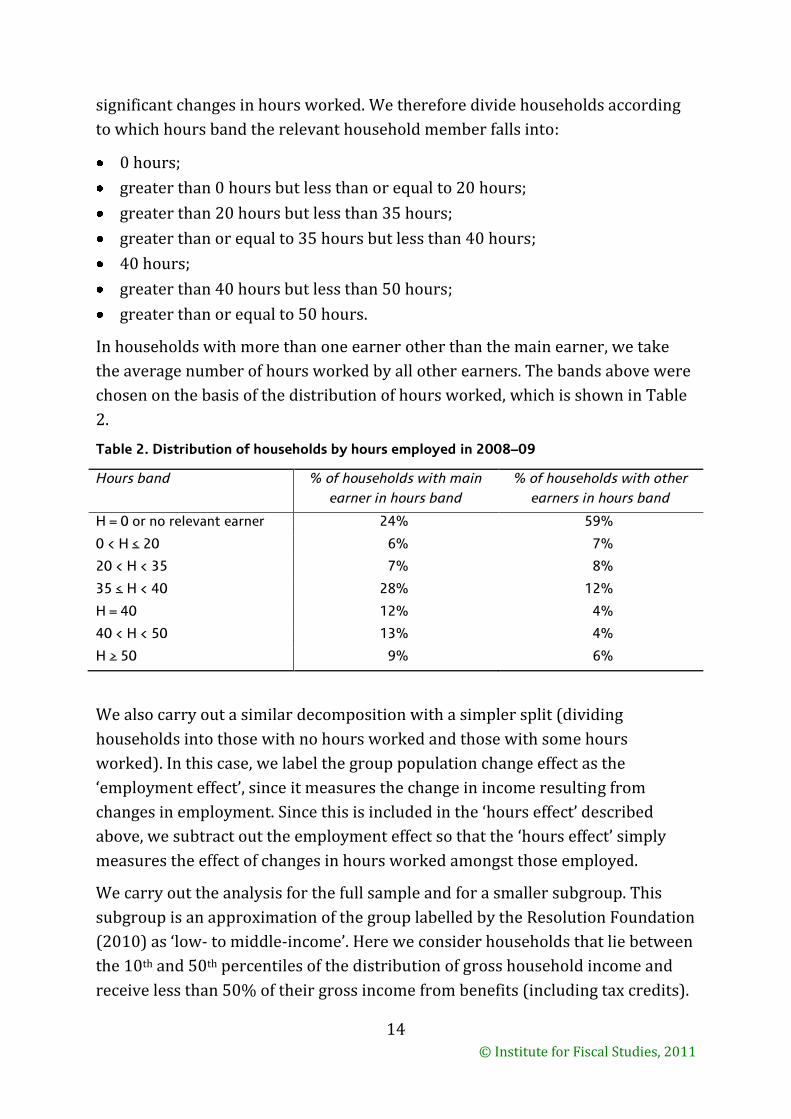
significant changes in hours worked. We therefore divide households according
to which hours band the relevant household member falls into:
0 hours;
greater than 0 hours but less than or equal to 20 hours;
greater than 20 hours but less than 35 hours;
greater than or equal to 35 hours but less than 40 hours;
40 hours;
greater than 40 hours but less than 50 hours;
greater than or equal to 50 hours.
In households with more than one earner other than the main earner, we take
the average number of hours worked by all other earners. The bands above were
chosen on the basis of the distribution of hours worked, which is shown in Table
2.
Table 2. Distribution of households by hours employed in 2008–09
Hours band % of households with main
earner in hours band
% of households with other
earners in hours band
H = 0 or no relevant earner 24% 59%
0 < H ≤ 20 6% 7%
20 < H < 35 7% 8%
35 ≤ H < 40 28% 12%
H = 40 12% 4%
40 < H < 50 13% 4%
H ≥ 50 9% 6%
We also carry out a similar decomposition with a simpler split (dividing
households into those with no hours worked and those with some hours
worked). In this case, we label the group population change effect as the
‘employment effect’, since it measures the change in income resulting from
changes in employment. Since this is included in the ‘hours effect’ described
above, we subtract out the employment effect so that the ‘hours effect’ simply
measures the effect of changes in hours worked amongst those employed.
We carry out the analysis for the full sample and for a smaller subgroup. This
subgroup is an approximation of the group labelled by the Resolution Foundation
(2010) as ‘low- to middle-income’. Here we consider households that lie between
the 10th and 50th percentiles of the distribution of gross household income and
receive less than 50% of their gross income from benefits (including tax credits).
15
© Institute for Fiscal Studies, 2011
Note that since we are using repeated cross-sectional data rather than a panel,
the composition of this group changes over time. Indeed, the group size falls from
containing 39% of the population to 33% of the population as more households
cross the 50% benefit income threshold. Changes in the income of this group are
therefore made up of both the income changes of households that remain ‘low- to
middle-income’ and changes in which households fall into this category. In
Appendix B, we also present decompositions of income growth for two further
subgroups: households that lie between the 10th and 50th percentiles and
households that lie between the 90th and 99th percentiles.
4. Results
This section presents the main results. We first consider growth in average
household income for the entire population. We then focus more specifically on
those households between the 10th and 50th percentiles receiving less than 50%
of their income from benefits (including tax credits), and compare this group
with those in other percentiles.
4.1 All working-age households
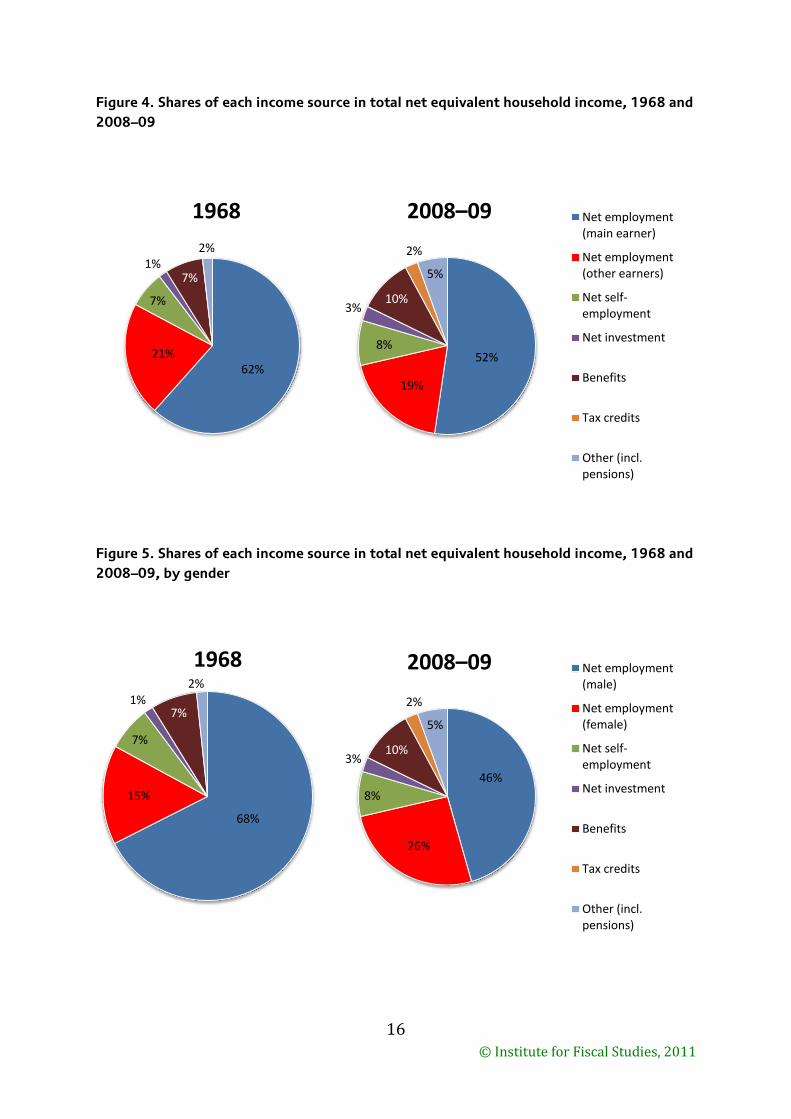
Figure 4 shows the composition of average net household income at the start and
end of our period of study.14 Figure 5 is the same, only rather than splitting net
employment income into income earned by the main earner and income earned
by other earners, the split is by gender.
Net income from the main earner’s employment is by far the biggest income
source at both the beginning and the end of the period. However, its share has
fallen notably, as has the share of household income coming from employment
income of other earners. As a result, average household income is more
diversified in 2008–09 than in 1968, with more than a quarter of household
income now not coming directly from employment. From Figure 5, we can see
that the fall in the share of income from employment is due to a fall in men’s
earnings. Indeed, the share of household income stemming from women’s
employment has substantially increased, rising from 15% in 1968 to 26% in
2008–09.
14 Note that this is net income before deductions are subtracted since it is convenient to show
only the positive sources of net household income in these charts.
16
© Institute for Fiscal Studies, 2011
Figure 4. Shares of each income source in total net equivalent household income, 1968 and
2008–09
Figure 5. Shares of each income source in total net equivalent household income, 1968 and
2008–09, by gender
62% 21%
7%
1% 7%
2%
1968
52%
19%
8%
3% 10%
2%
5%
2008–09 Net employment (main earner)
Net employment (other earners)
Net self-employment
Net investment
Benefits
Tax credits
Other (incl. pensions)
68%
15%
7%
1% 7%
2%
1968
46%
26%
8%
3% 10%
2%
5%
2008–09 Net employment (male)
Net employment (female)
Net self-employment
Net investment
Benefits
Tax credits
Other (incl. pensions)
17
© Institute for Fiscal Studies, 2011
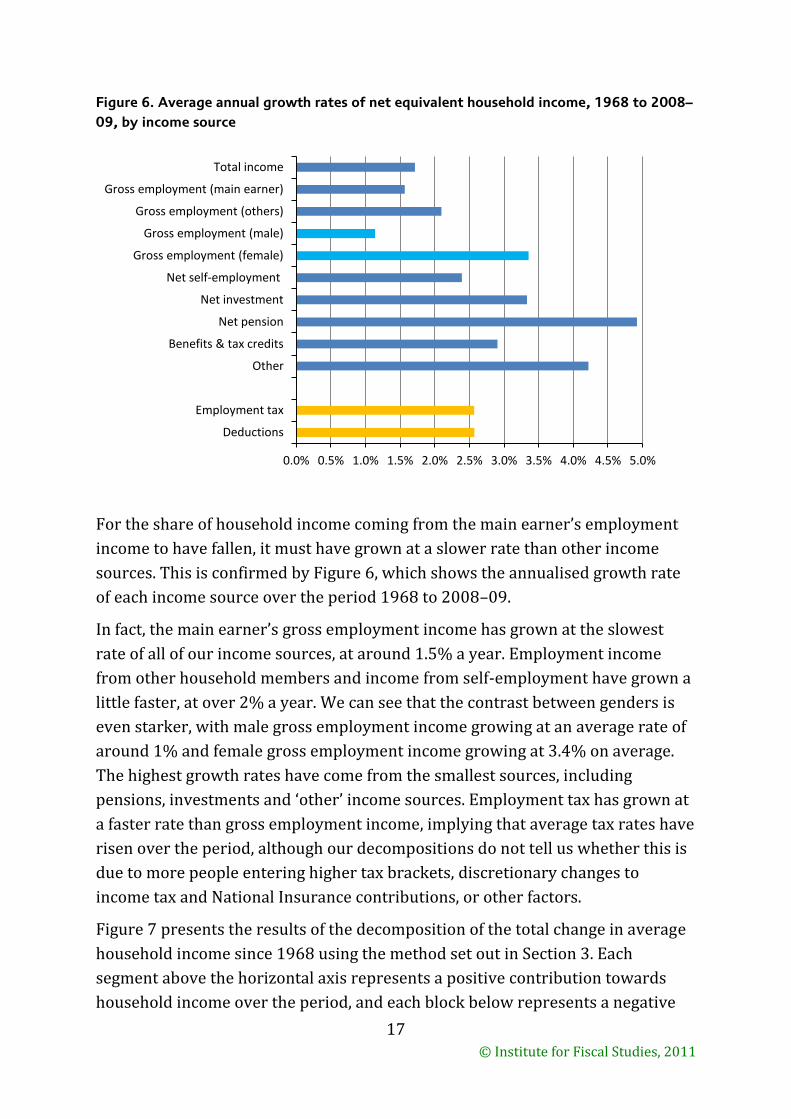
Figure 6. Average annual growth rates of net equivalent household income, 1968 to 2008–
09, by income source
For the share of household income coming from the main earner’s employment
income to have fallen, it must have grown at a slower rate than other income
sources. This is confirmed by Figure 6, which shows the annualised growth rate
of each income source over the period 1968 to 2008–09.
In fact, the main earner’s gross employment income has grown at the slowest
rate of all of our income sources, at around 1.5% a year. Employment income
from other household members and income from self-employment have grown a
little faster, at over 2% a year. We can see that the contrast between genders is
even starker, with male gross employment income growing at an average rate of
around 1% and female gross employment income growing at 3.4% on average.
The highest growth rates have come from the smallest sources, including
pensions, investments and ‘other’ income sources. Employment tax has grown at
a faster rate than gross employment income, implying that average tax rates have
risen over the period, although our decompositions do not tell us whether this is
due to more people entering higher tax brackets, discretionary changes to
income tax and National Insurance contributions, or other factors.
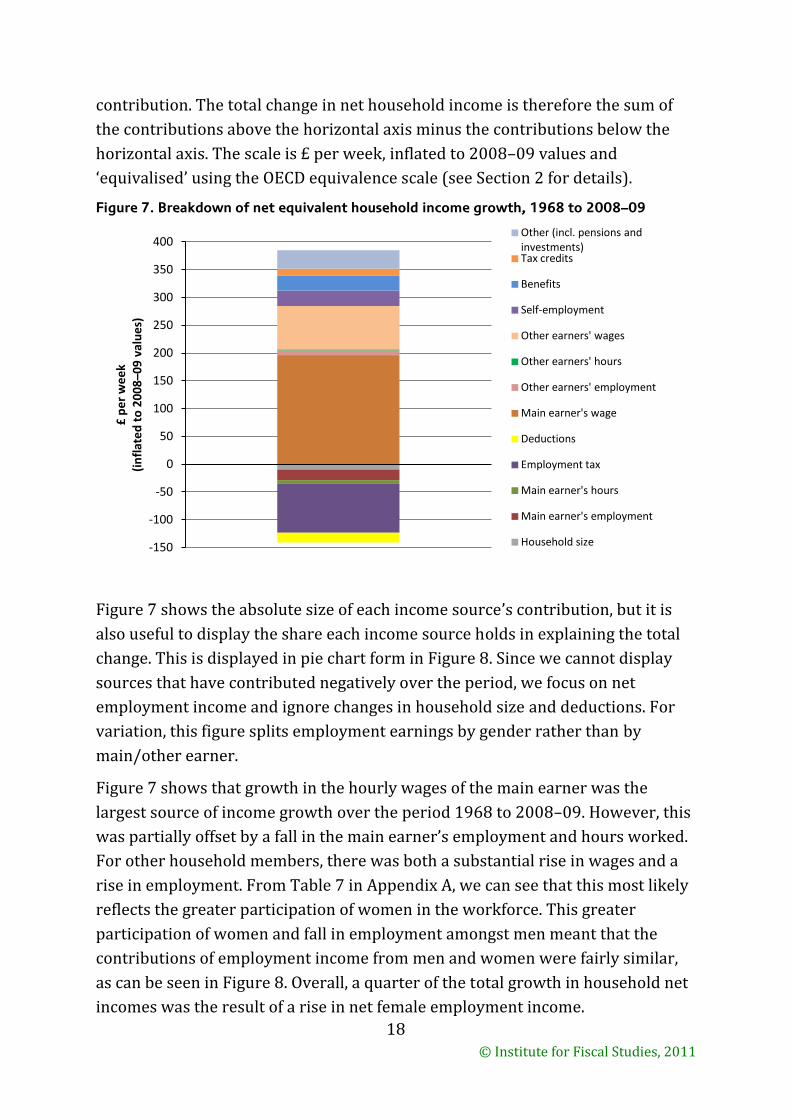
Figure 7 presents the results of the decomposition of the total change in average
household income since 1968 using the method set out in Section 3. Each
segment above the horizontal axis represents a positive contribution towards
household income over the period, and each block below represents a negative
0.0% 0.5% 1.0% 1.5% 2.0% 2.5% 3.0% 3.5% 4.0% 4.5% 5.0%
Deductions
Employment tax
Other
Benefits & tax credits
Net pension
Net investment
Net self-employment
Gross employment (female)
Gross employment (male)
Gross employment (others)
Gross employment (main earner)
Total income
18
© Institute for Fiscal Studies, 2011
contribution. The total change in net household income is therefore the sum of
the contributions above the horizontal axis minus the contributions below the
horizontal axis. The scale is £ per week, inflated to 2008–09 values and
‘equivalised’ using the OECD equivalence scale (see Section 2 for details).
Figure 7. Breakdown of net equivalent household income growth, 1968 to 2008–09
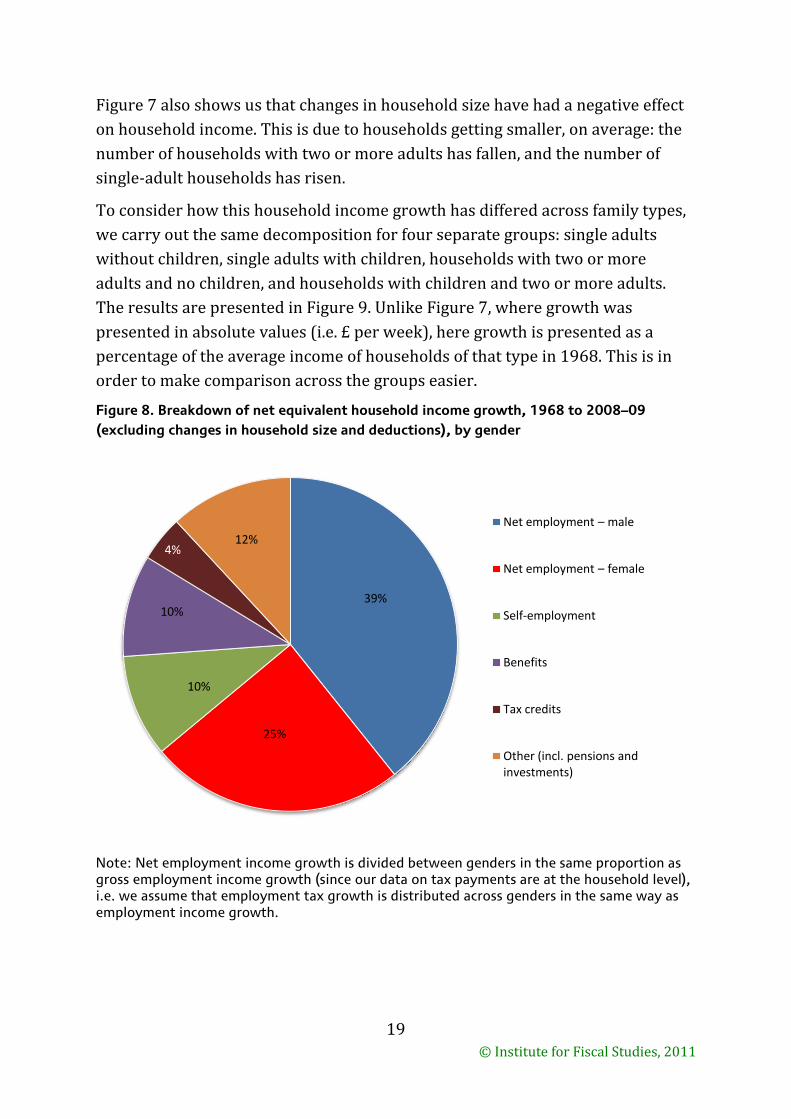
Figure 7 shows the absolute size of each income source’s contribution, but it is
also useful to display the share each income source holds in explaining the total
change. This is displayed in pie chart form in Figure 8. Since we cannot display
sources that have contributed negatively over the period, we focus on net
employment income and ignore changes in household size and deductions. For
variation, this figure splits employment earnings by gender rather than by
main/other earner.
Figure 7 shows that growth in the hourly wages of the main earner was the
largest source of income growth over the period 1968 to 2008–09. However, this
was partially offset by a fall in the main earner’s employment and hours worked.
For other household members, there was both a substantial rise in wages and a
rise in employment. From Table 7 in Appendix A, we can see that this most likely
reflects the greater participation of women in the workforce. This greater
participation of women and fall in employment amongst men meant that the
contributions of employment income from men and women were fairly similar,
as can be seen in Figure 8. Overall, a quarter of the total growth in household net
incomes was the result of a rise in net female employment income.
-150
-100
-50
0
50
100
150
200
250
300
350
400
£ p
er
we
ek
(i
nfl
ate
d t
o 2
00
8–0
9 v
alu
es)
Other (incl. pensions and investments) Tax credits
Benefits
Self-employment
Other earners' wages
Other earners' hours
Other earners' employment
Main earner's wage
Deductions
Employment tax
Main earner's hours
Main earner's employment
Household size
19
© Institute for Fiscal Studies, 2011
Figure 7 also shows us that changes in household size have had a negative effect
on household income. This is due to households getting smaller, on average: the
number of households with two or more adults has fallen, and the number of
single-adult households has risen.
To consider how this household income growth has differed across family types,
we carry out the same decomposition for four separate groups: single adults
without children, single adults with children, households with two or more
adults and no children, and households with children and two or more adults.
The results are presented in Figure 9. Unlike Figure 7, where growth was
presented in absolute values (i.e. £ per week), here growth is presented as a
percentage of the average income of households of that type in 1968. This is in
order to make comparison across the groups easier.
Figure 8. Breakdown of net equivalent household income growth, 1968 to 2008–09
(excluding changes in household size and deductions), by gender
Note: Net employment income growth is divided between genders in the same proportion as gross employment income growth (since our data on tax payments are at the household level), i.e. we assume that employment tax growth is distributed across genders in the same way as employment income growth.
39%
25%
10%
10%
4% 12%
Net employment – male
Net employment – female
Self-employment
Benefits
Tax credits
Other (incl. pensions and investments)
20
© Institute for Fiscal Studies, 2011
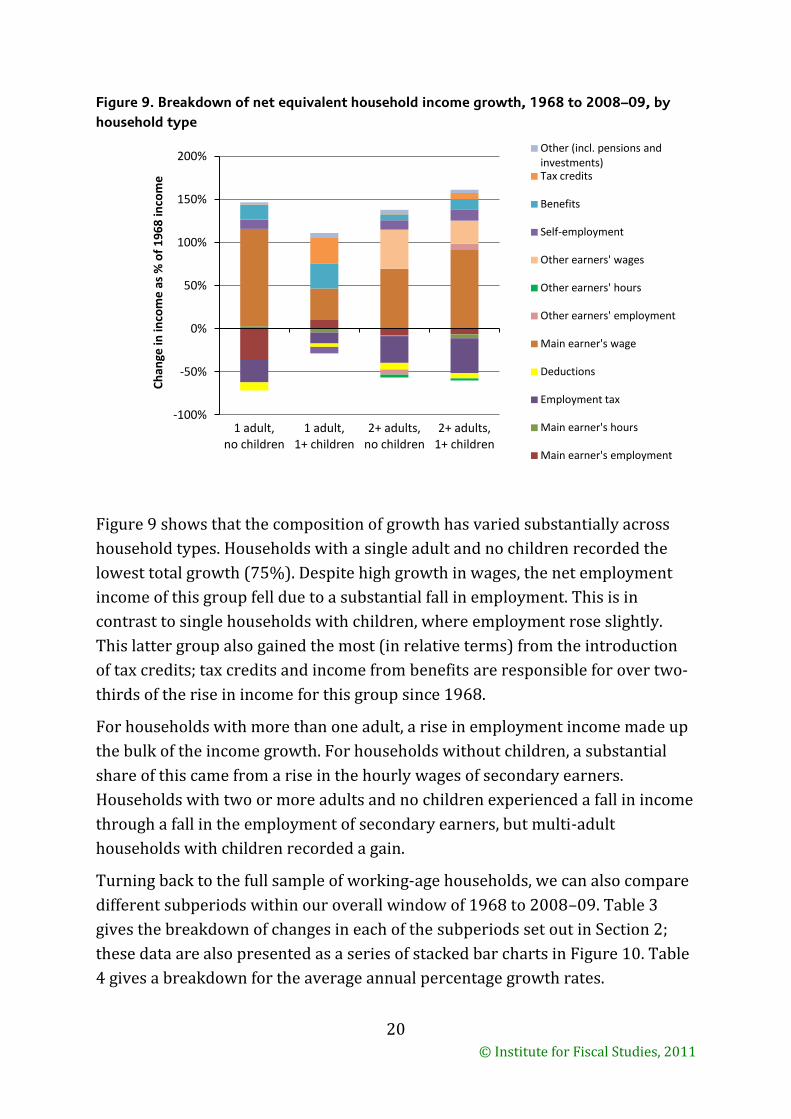
Figure 9. Breakdown of net equivalent household income growth, 1968 to 2008–09, by
household type
Figure 9 shows that the composition of growth has varied substantially across
household types. Households with a single adult and no children recorded the
lowest total growth (75%). Despite high growth in wages, the net employment
income of this group fell due to a substantial fall in employment. This is in
contrast to single households with children, where employment rose slightly.
This latter group also gained the most (in relative terms) from the introduction
of tax credits; tax credits and income from benefits are responsible for over two-
thirds of the rise in income for this group since 1968.
For households with more than one adult, a rise in employment income made up
the bulk of the income growth. For households without children, a substantial
share of this came from a rise in the hourly wages of secondary earners.
Households with two or more adults and no children experienced a fall in income
through a fall in the employment of secondary earners, but multi-adult
households with children recorded a gain.
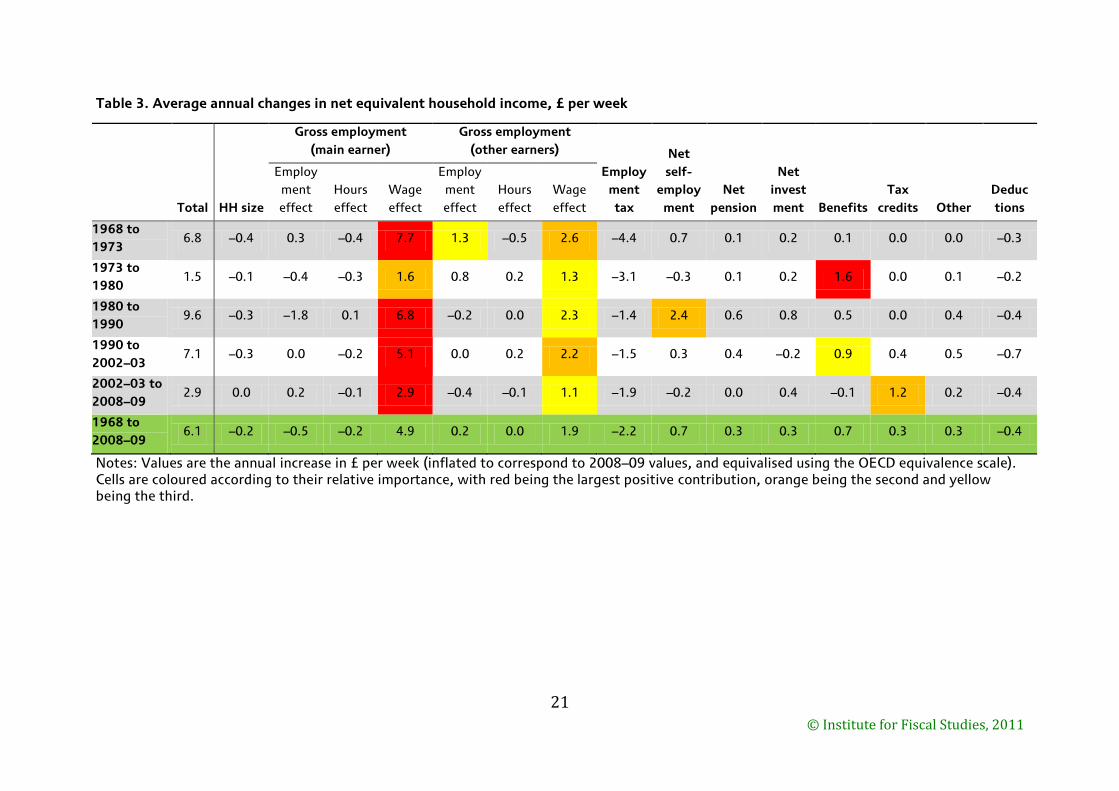
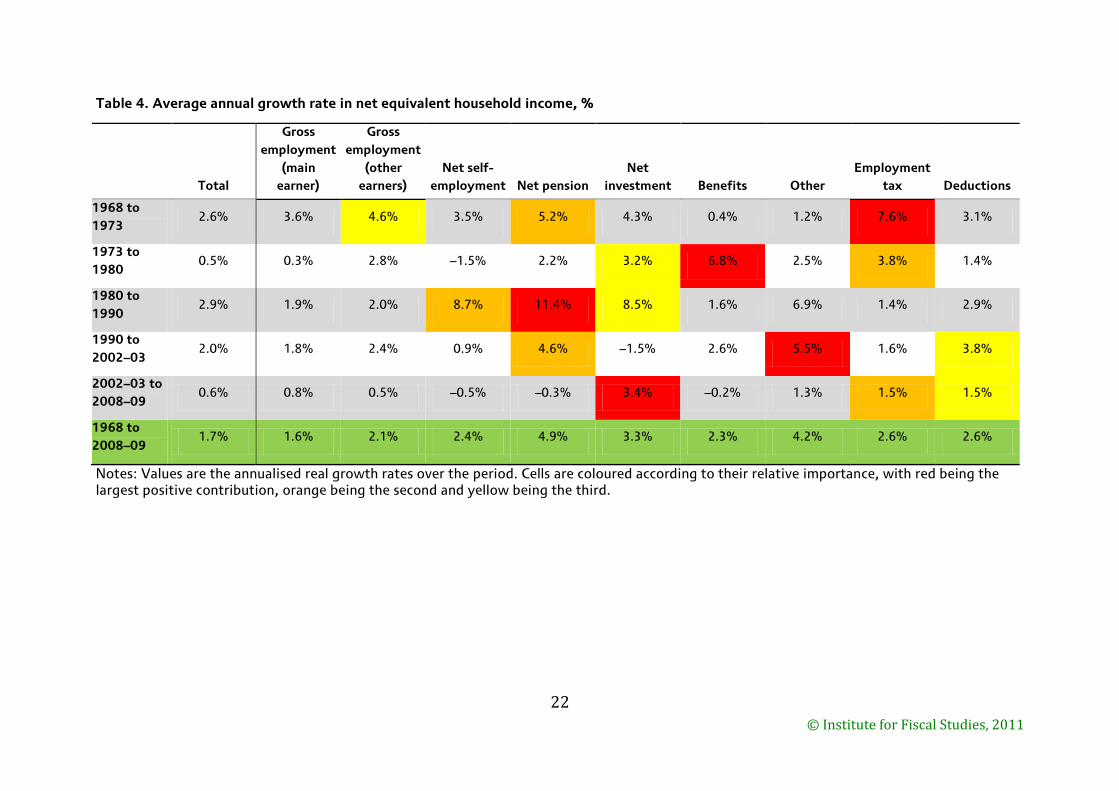
Turning back to the full sample of working-age households, we can also compare
different subperiods within our overall window of 1968 to 2008–09. Table 3
gives the breakdown of changes in each of the subperiods set out in Section 2;
these data are also presented as a series of stacked bar charts in Figure 10. Table
4 gives a breakdown for the average annual percentage growth rates.
-100%
-50%
0%
50%
100%
150%
200%
1 adult, no children
1 adult, 1+ children
2+ adults, no children
2+ adults, 1+ children
Ch
ange
in in
com
e a
s %
of
19
68
inco
me
Other (incl. pensions and investments) Tax credits
Benefits
Self-employment
Other earners' wages
Other earners' hours
Other earners' employment
Main earner's wage
Deductions
Employment tax
Main earner's hours
Main earner's employment
21
© Institute for Fiscal Studies, 2011
Table 3. Average annual changes in net equivalent household income, £ per week
Total HH size
Gross employment
(main earner)
Gross employment
(other earners)
Employ
ment
tax
Net
self-
employ
ment
Net
pension
Net
invest
ment Benefits
Tax
credits Other
Deduc
tions
Employ
ment
effect
Hours
effect
Wage
effect
Employ
ment
effect
Hours
effect
Wage
effect
1968 to
1973 6.8 –0.4 0.3 –0.4 7.7 1.3 –0.5 2.6 –4.4 0.7 0.1 0.2 0.1 0.0 0.0 –0.3
1973 to
1980 1.5 –0.1 –0.4 –0.3 1.6 0.8 0.2 1.3 –3.1 –0.3 0.1 0.2 1.6 0.0 0.1 –0.2
1980 to
1990 9.6 –0.3 –1.8 0.1 6.8 –0.2 0.0 2.3 –1.4 2.4 0.6 0.8 0.5 0.0 0.4 –0.4
1990 to
2002–03 7.1 –0.3 0.0 –0.2 5.1 0.0 0.2 2.2 –1.5 0.3 0.4 –0.2 0.9 0.4 0.5 –0.7
2002–03 to
2008–09 2.9 0.0 0.2 –0.1 2.9 –0.4 –0.1 1.1 –1.9 –0.2 0.0 0.4 –0.1 1.2 0.2 –0.4
1968 to
2008–09 6.1 –0.2 –0.5 –0.2 4.9 0.2 0.0 1.9 –2.2 0.7 0.3 0.3 0.7 0.3 0.3 –0.4
Notes: Values are the annual increase in £ per week (inflated to correspond to 2008–09 values, and equivalised using the OECD equivalence scale). Cells are coloured according to their relative importance, with red being the largest positive contribution, orange being the second and yellow being the third.
22
© Institute for Fiscal Studies, 2011
Table 4. Average annual growth rate in net equivalent household income, %
Total
Gross
employment
(main
earner)
Gross
employment
(other
earners)
Net self-
employment Net pension
Net
investment Benefits Other
Employment
tax Deductions
1968 to
1973 2.6% 3.6% 4.6% 3.5% 5.2% 4.3% 0.4% 1.2% 7.6% 3.1%
1973 to
1980 0.5% 0.3% 2.8% –1.5% 2.2% 3.2% 6.8% 2.5% 3.8% 1.4%
1980 to
1990 2.9% 1.9% 2.0% 8.7% 11.4% 8.5% 1.6% 6.9% 1.4% 2.9%
1990 to
2002–03 2.0% 1.8% 2.4% 0.9% 4.6% –1.5% 2.6% 5.5% 1.6% 3.8%
2002–03 to
2008–09 0.6% 0.8% 0.5% –0.5% –0.3% 3.4% –0.2% 1.3% 1.5% 1.5%
1968 to
2008–09 1.7% 1.6% 2.1% 2.4% 4.9% 3.3% 2.3% 4.2% 2.6% 2.6%
Notes: Values are the annualised real growth rates over the period. Cells are coloured according to their relative importance, with red being the largest positive contribution, orange being the second and yellow being the third.
23
© Institute for Fiscal Studies, 2011
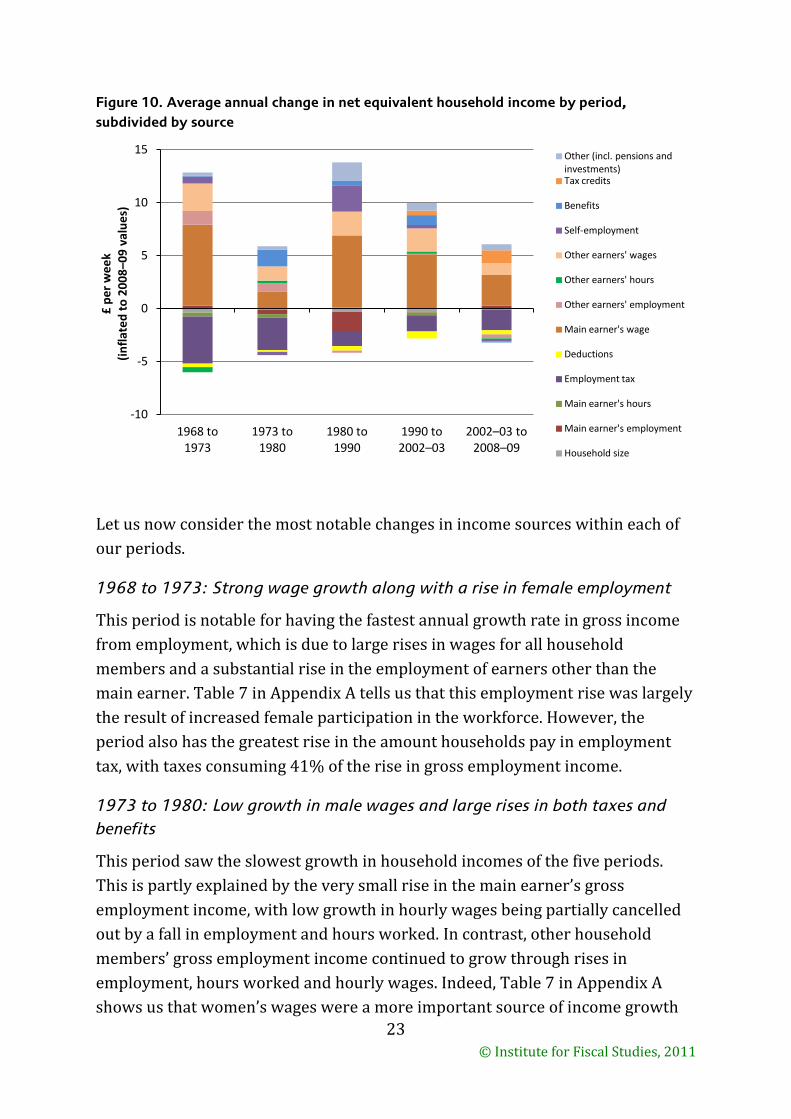
Figure 10. Average annual change in net equivalent household income by period,
subdivided by source
Let us now consider the most notable changes in income sources within each of
our periods.
1968 to 1973: Strong wage growth along with a rise in female employment
This period is notable for having the fastest annual growth rate in gross income
from employment, which is due to large rises in wages for all household
members and a substantial rise in the employment of earners other than the
main earner. Table 7 in Appendix A tells us that this employment rise was largely
the result of increased female participation in the workforce. However, the
period also has the greatest rise in the amount households pay in employment
tax, with taxes consuming 41% of the rise in gross employment income.
1973 to 1980: Low growth in male wages and large rises in both taxes and
benefits
This period saw the slowest growth in household incomes of the five periods.
This is partly explained by the very small rise in the main earner’s gross
employment income, with low growth in hourly wages being partially cancelled
out by a fall in employment and hours worked. In contrast, other household
members’ gross employment income continued to grow through rises in
employment, hours worked and hourly wages. Indeed, Table 7 in Appendix A
shows us that women’s wages were a more important source of income growth
-10
-5
0
5
10
15
1968 to 1973
1973 to 1980
1980 to 1990
1990 to 2002–03
2002–03 to 2008–09
£ p
er
we
ek
(in
flat
ed
to
20
08–0
9 v
alu
es)
Other (incl. pensions and investments) Tax credits
Benefits
Self-employment
Other earners' wages
Other earners' hours
Other earners' employment
Main earner's wage
Deductions
Employment tax
Main earner's hours
Main earner's employment
Household size
24
© Institute for Fiscal Studies, 2011
than men’s wages. However, gains in all earners’ gross employment income were
more than cancelled out by the large rise in employment taxes that took place
during this period, most strikingly between 1972 and 1975.
This period also saw a rise in income from benefits, which rose for households
both with and without children, and for households with or without anyone
active in the labour market. This rise was most substantial during the late 1970s.
1980 to 1990: Strong growth in wages and self-employment income, but a
large fall in male employment
During the 1980s, the rate of wage growth of all household members returned to
levels similar to those seen in 1968 to 1973. However, unlike in this earlier
period, the effect of changes in employment was to lower average household
income substantially, with the employment of both the main and other earners
falling over the period. Table 7 in Appendix A tells us that this fall in employment
was concentrated amongst men, with women’s employment rising slightly over
the period. Employment taxes grew relatively slowly, taking only 20% of the total
rise in gross household employment income.
Besides the large fall in male employment, perhaps the most notable property of
this period was the large growth in the relatively small components of average
household income. Growth in net self-employment income was particularly
impressive, accounting for around a quarter of the total income growth in this
period. Indeed, 87% of the growth in self-employment income between 1968 and
2008–09 occurred in the 1980s.15 Similarly, net incomes from pensions and from
investments both grew at very high rates. Average household income from
benefits also rose in this period, largely due to a rise in the number of households
without any active workers.
1990 to 2002–03: Medium wage growth with a rise in benefits
The 1990s and early 2000s saw a fairly moderate rise in average household
income, mainly led by growth in the wages of the employed. There was little
change resulting from movements in employment or hours worked over this
period.
Households’ average income from benefits rose markedly over the period. As in
the 1980s, the rise in benefits mainly accrued to households without an active
15 This should not be over-interpreted, given the relative ease of shifting income from
employment to self-employment and the existence of tax incentives to do just that.

25
© Institute for Fiscal Studies, 2011
worker. However, unlike in the 1980s, this was not due to a rise in the number of
such households, but due to these households receiving a greater amount of
benefits, on average. The introduction of tax credits mainly benefited families
with a worker and at least one child in the household.
This period also saw the largest average annual rise in deductions, concentrated
between 1993 and 2000: this most likely reflects the large real-terms rises in
council tax bills over this period. Income from investments fell over the period,
possibly due to the fall in nominal interest rates.
2002–03 to 2008–09: Low wage growth with a rise in taxes and tax credits
This period saw slow growth in average household net income, mainly explained
by slow growth in employment income for all household members. This in turn
can be explained by slow growth in hourly wages; the effect of changes in
employment and hours worked was very small. The increase in employment
taxes was large, consuming over half of the gains in gross employment income.
Average income from benefits fell slightly over the period, but average income
from tax credits increased substantially. Indeed, increases in tax credit income
accounted for around 40% of the increase in average net household income over
the period 2002–03 to 2008–09. These tax credit increases generally accrued to
families with children.
Summary
For all working-age households, increases in hourly wages have been the largest
force driving growth in household income over the past four decades, and
fluctuations in the rate of wage growth have been a major factor in determining
the pattern of household income growth. Wage growth was strongest between
1968 and 1973 and between 1980 and 1990, but has slowed since 1990. The
source of employment income has also steadily changed over time, as male
employment has fallen and female employment has risen. Both effects occurred
throughout the period, though the rise in women’s employment has slowed over
time and the fall in male employment was most concentrated in the 1980s. Since
1990, changes in hours worked have had a greater effect than changes in
employment, with men working fewer hours and women working more.
Other sources of income have also played an important role. Rises in employment
taxes have generally accompanied rises in gross employment income, but there
were particularly large rises between 1972 and 1975 and between 2003–04 and
2007–08. Income from social security benefits rose considerably between 1973
26
© Institute for Fiscal Studies, 2011
and 1980 and between 1990 and 2002–03, and tax credits became an important
component of household income from 2000–01 onwards. A rise in self-
employment income was a major factor in household income growth in the
1980s, but this income source had minimal impact in other periods. Similarly,
most of the growth in income from investments and pensions occurred during
that decade.
4.2 Low- to middle-income households
In this subsection, we carry out the same analysis on a particular subset of the
population – low- to middle-income households. These are households that lie
between the 10th and 50th percentiles when ranked in order of gross income and
receive less than 50% of their gross income from benefits (including tax credits).
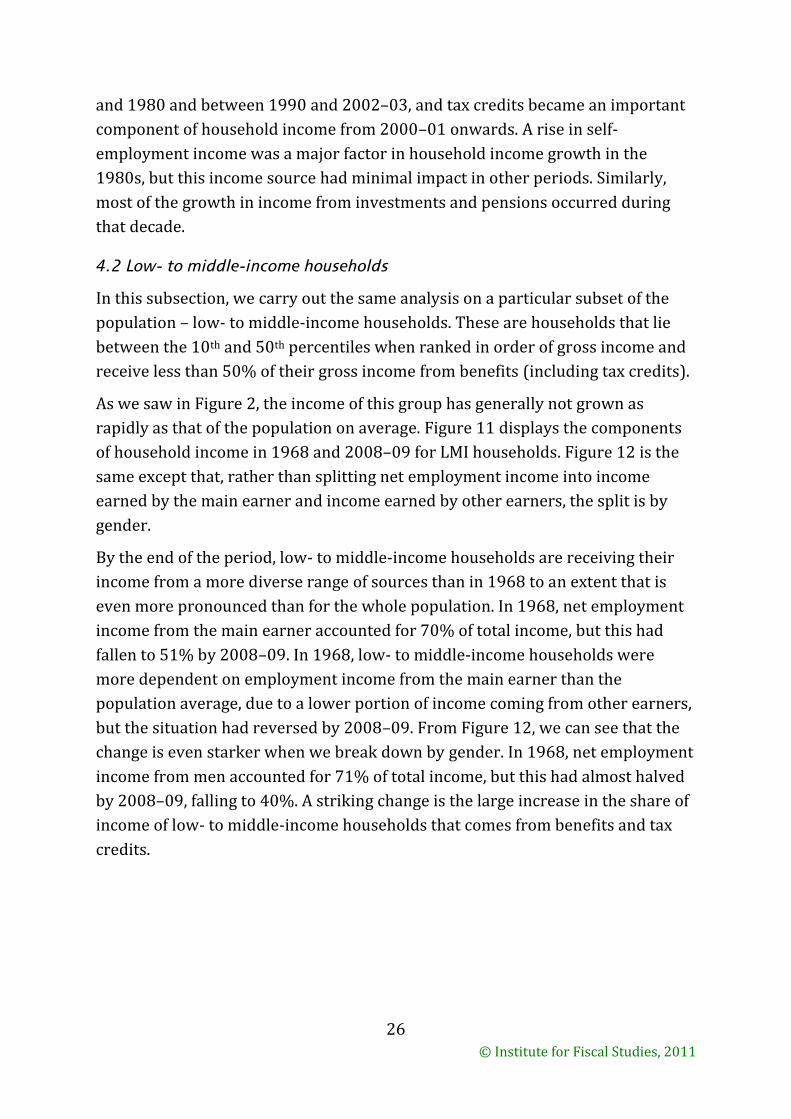
As we saw in Figure 2, the income of this group has generally not grown as
rapidly as that of the population on average. Figure 11 displays the components
of household income in 1968 and 2008–09 for LMI households. Figure 12 is the
same except that, rather than splitting net employment income into income
earned by the main earner and income earned by other earners, the split is by
gender.
By the end of the period, low- to middle-income households are receiving their
income from a more diverse range of sources than in 1968 to an extent that is
even more pronounced than for the whole population. In 1968, net employment
income from the main earner accounted for 70% of total income, but this had
fallen to 51% by 2008–09. In 1968, low- to middle-income households were
more dependent on employment income from the main earner than the
population average, due to a lower portion of income coming from other earners,
but the situation had reversed by 2008–09. From Figure 12, we can see that the
change is even starker when we break down by gender. In 1968, net employment
income from men accounted for 71% of total income, but this had almost halved
by 2008–09, falling to 40%. A striking change is the large increase in the share of
income of low- to middle-income households that comes from benefits and tax
credits.
27
© Institute for Fiscal Studies, 2011
Figure 11. Shares of each income source in total net equivalent household income, low- to
middle-income households, 1968 and 2008–09
Figure 12. Shares of each income source in total net equivalent household income, low- to
middle-income households, 1968 and 2008–09, by gender
69%
13%
7%
1% 8%
2%
1968
50%
14%
9%
2%
11%
7% 7%
2008–09 Net employment (main earner)
Net employment (other earners)
Net self-employment
Net investment
Benefits
Tax credits
Other (incl. pensions)
71%
11%
7%
1% 8%
2%
1968
40%
24%
9%
2%
11%
7% 7%
2008–09 Net employment (male)
Net employment (female)
Net self-employment
Net investment
Benefits
Tax credits
Other (incl. pensions)
28
© Institute for Fiscal Studies, 2011
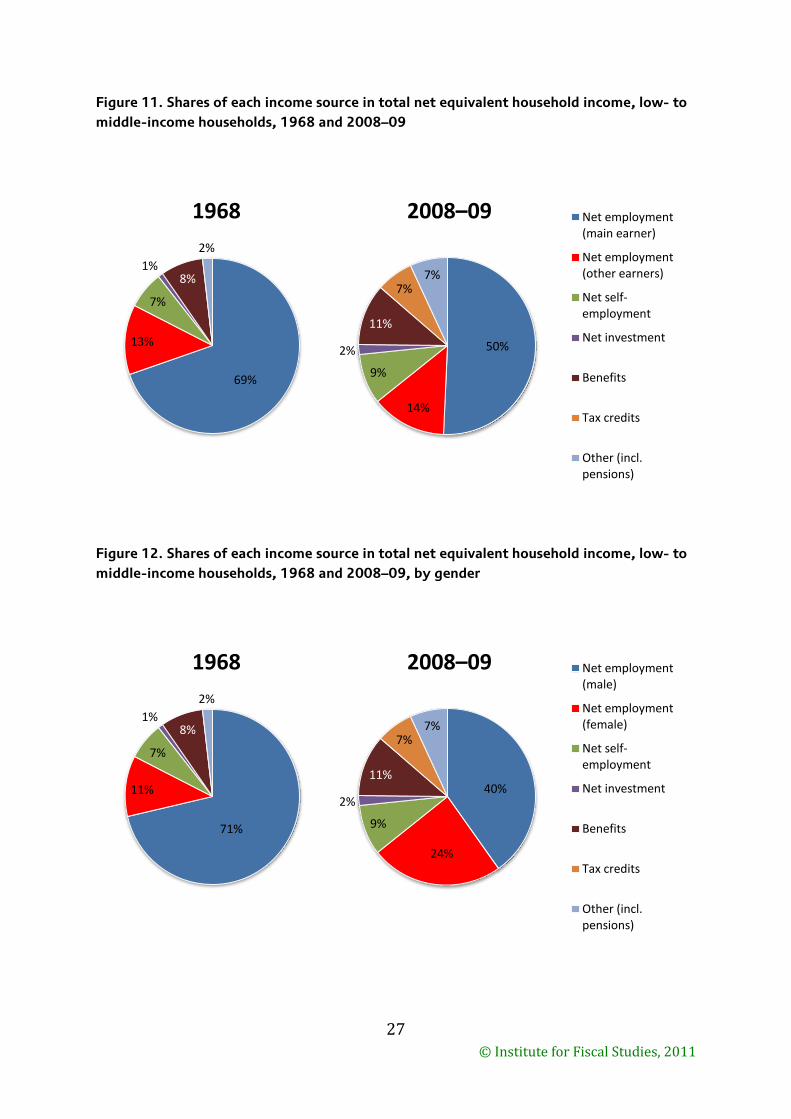
Figure 13 displays the annualised growth rate of each income source over the
period 1968 to 2008–09. It shows that the rise in the share of income coming
from benefits stems from two sources. First, the annualised growth rate of
income from benefits for LMI households was 3.4%, which is above that for the
total population on average (2.9%). Second, income from employment grew
relatively slowly: gross employment income from the main earner rose at an
average annual rate of 0.7%, less than half of the rate for the whole population.
Also, gross employment income from other earners and net self-employment
income both grew at slower rates for LMI households than for the whole
population. Gross employment income growth was particularly bad for men, at
an annualised rate of just 0.3%.
Figure 13. Average annual growth rates of net equivalent household income, 1968 to
2008–09, by income source, low- to middle-income households
Figure 14 presents the total change in household income decomposed into its
constituent parts. As before, each block above the horizontal axis represents a
positive contribution towards household income over the period, and each block
below represents a negative contribution. The total change in net household
income is therefore the sum of the contributions above the horizontal axis minus
the contributions below the horizontal axis. The scale is £ per week, inflated to
2008–09 values and ‘equivalised’ using the OECD equivalence scale (see Section
2 for details).
0.0% 1.0% 2.0% 3.0% 4.0% 5.0% 6.0%
Deductions
Employment tax
Other
Benefits and tax credits
Net investment
Net pension
Net self-employment
Gross employment (female)
Gross employment (male)
Gross employment (others)
Gross employment (main earner)
Total income
Non-LMI Whole population LMI
29
© Institute for Fiscal Studies, 2011
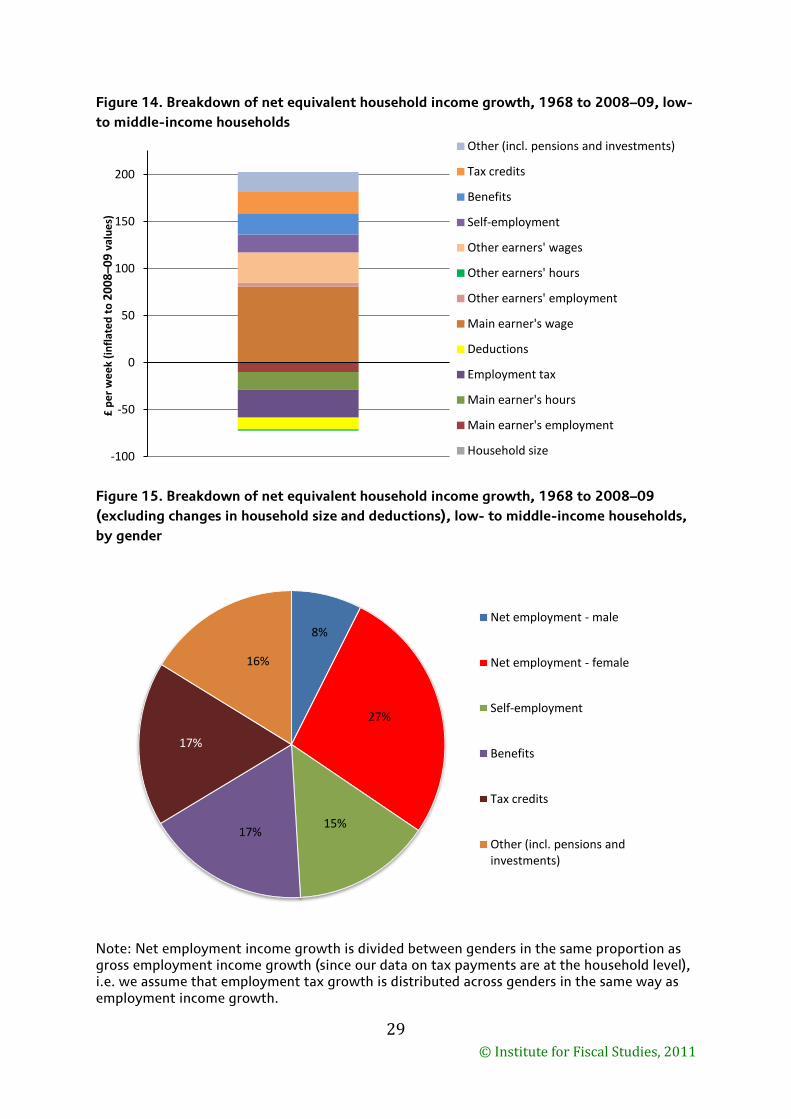
Figure 14. Breakdown of net equivalent household income growth, 1968 to 2008–09, low-
to middle-income households
Figure 15. Breakdown of net equivalent household income growth, 1968 to 2008–09
(excluding changes in household size and deductions), low- to middle-income households,
by gender
Note: Net employment income growth is divided between genders in the same proportion as gross employment income growth (since our data on tax payments are at the household level), i.e. we assume that employment tax growth is distributed across genders in the same way as employment income growth.
-100
-50
0
50
100
150
200
£ p
er
we
ek
(in
flat
ed
to
20
08–0
9 v
alu
es)
Other (incl. pensions and investments)
Tax credits
Benefits
Self-employment
Other earners' wages
Other earners' hours
Other earners' employment
Main earner's wage
Deductions
Employment tax
Main earner's hours
Main earner's employment
Household size
8%
27%
15% 17%
17%
16%
Net employment - male
Net employment - female
Self-employment
Benefits
Tax credits
Other (incl. pensions and investments)
30
© Institute for Fiscal Studies, 2011
Figure 14 shows the absolute size of each income source’s contribution, but it is
also useful to display the share each income source holds in explaining the total
change. This is displayed in pie chart form in Figure 15. Since we cannot display
sources that have contributed negatively over the period, we focus on net
employment income and ignore changes in household size and deductions. For
variation, this figure splits employment earnings by gender rather than by
main/other earner.
Low- to middle-income households’ income growth has come from a more
diverse range of sources than is the case for the whole population. Growth in the
hourly wages of the main or sole earner in households was the largest source, but
it was substantially less important than for the whole population: income gained
from the main earner’s wage growth was 62% of the total income increase over
the period for LMI households, compared with 80% for the whole population.
Similarly, the rise in gross employment income from other earners’ wage growth
was only 25% of the total rise in LMI household incomes, compared with 32% for
the whole population. Figure 15 demonstrates that the vast majority (78%) of
the increase in employment income that did occur came from women. Overall,
27% of the growth in net income for LMI households came from an increase in
women’s employment income, which is a slightly larger percentage than the
average across all working-age households. As a result, employment income for
LMI households has therefore become increasingly sourced from female earners:
in 1968, 86% of household gross employment income came from men and 14%
from women; in 2008–09, 63% came from men and 37% from women.
Two sources that were much more substantial for low- to middle-income
households than for the population on average were benefits and tax credits,
each explaining 17% of the total rise in incomes. The rise in self-employment
income also explains a slightly higher proportion of total income growth than for
the population on average: 15% compared with 11%. Interestingly, the LMI
group appears not to have suffered a fall in incomes due to changes in household
size, unlike the population as a whole.
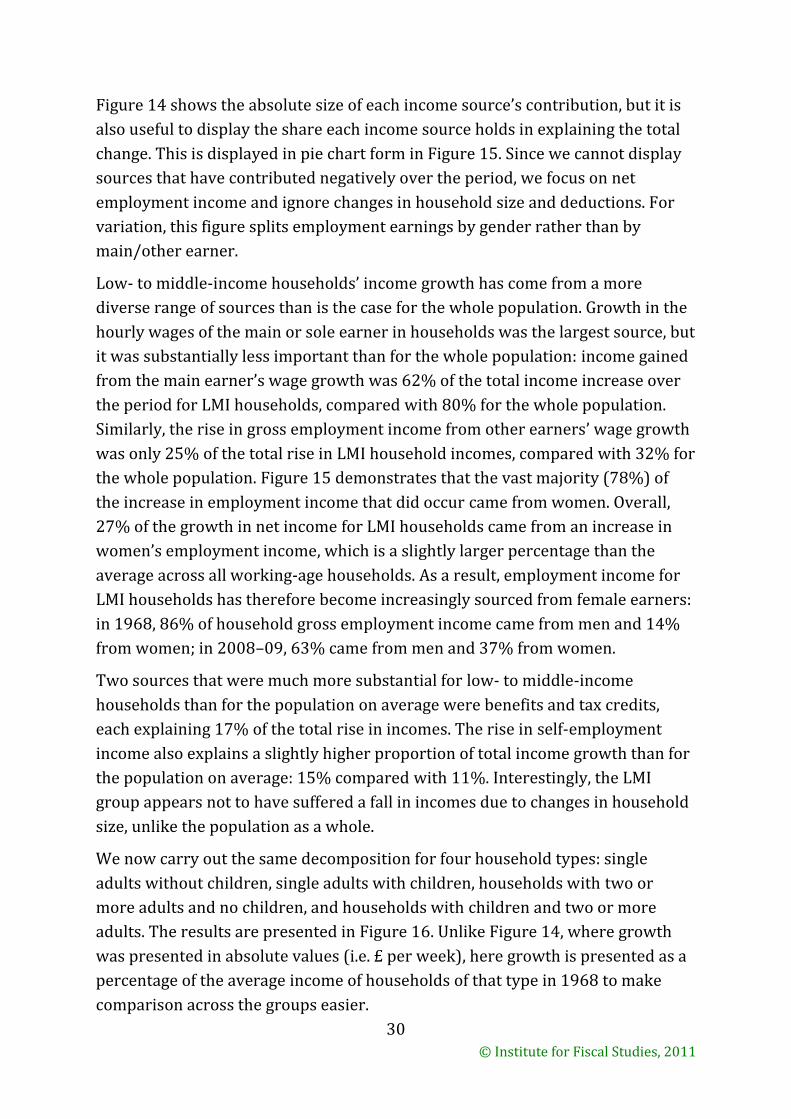
We now carry out the same decomposition for four household types: single
adults without children, single adults with children, households with two or
more adults and no children, and households with children and two or more
adults. The results are presented in Figure 16. Unlike Figure 14, where growth
was presented in absolute values (i.e. £ per week), here growth is presented as a
percentage of the average income of households of that type in 1968 to make
comparison across the groups easier.
31
© Institute for Fiscal Studies, 2011
For single-adult households without children, Figure 16 paints a picture for LMI
households which is similar to the one for the whole population that we saw in
the last subsection: income growth is dominated by a rise in hourly wages, but
partially offset by a fall in employment. However, one notable difference from the
whole population is that single-person households with low to middle incomes
have not seen a rise in benefit income, unlike the population average (which we
presume is because the rise in benefit income has been experienced by non-
working single-adult households).
Figure 16. Breakdown of net equivalent household income growth, 1968 to 2008–09, by
household type, low- to middle-income households
Single adults living with children who are low- to middle-income households also
received a smaller rise in benefit income than such families in the population as a
whole: the growth in benefit income was 15% of their total income in 1968,
compared with 29% for the whole population. On the other hand, increases in tax
credits for single LMI households with children were much higher than those for
other LMI households, and increased their income by 45%. This group also saw a
large fall in their hours worked (but not their rate of employment), which is not
evident amongst all lone parents. Overall, therefore, tax credits explained 62% of
total household income growth of single-parent LMI households between 1968
and 2008–09, despite the fact that they were only introduced in 1999.
The majority of the growth in income of LMI households with more than one
adult came from employment income, and a substantial share of this came in turn
-60%
-40%
-20%
0%
20%
40%
60%
80%
100%
120%
1 adult, no children
1 adult, 1+ children
2+ adults, no children
2+ adults, 1+ children
Ch
ange
in in
com
e a
s %
of
19
68
inco
me
Other (incl. pensions and investments) Tax credits
Benefits
Self-employment
Other earners' wages
Other earners' hours
Other earners' employment
Main earner's wage
Deductions
Employment tax
Main earner's hours
Main earner's employment
32
© Institute for Fiscal Studies, 2011
from rises in the hourly wages of secondary earners, especially for households
without children. Multi-adult LMI households with and without children saw a
rise in the employment of other earners, but a fall in the number of hours they
worked. The ones with children also saw a notable gain in income from tax
credits, which made up 21% of their total income growth between 1968 and
2008–09.
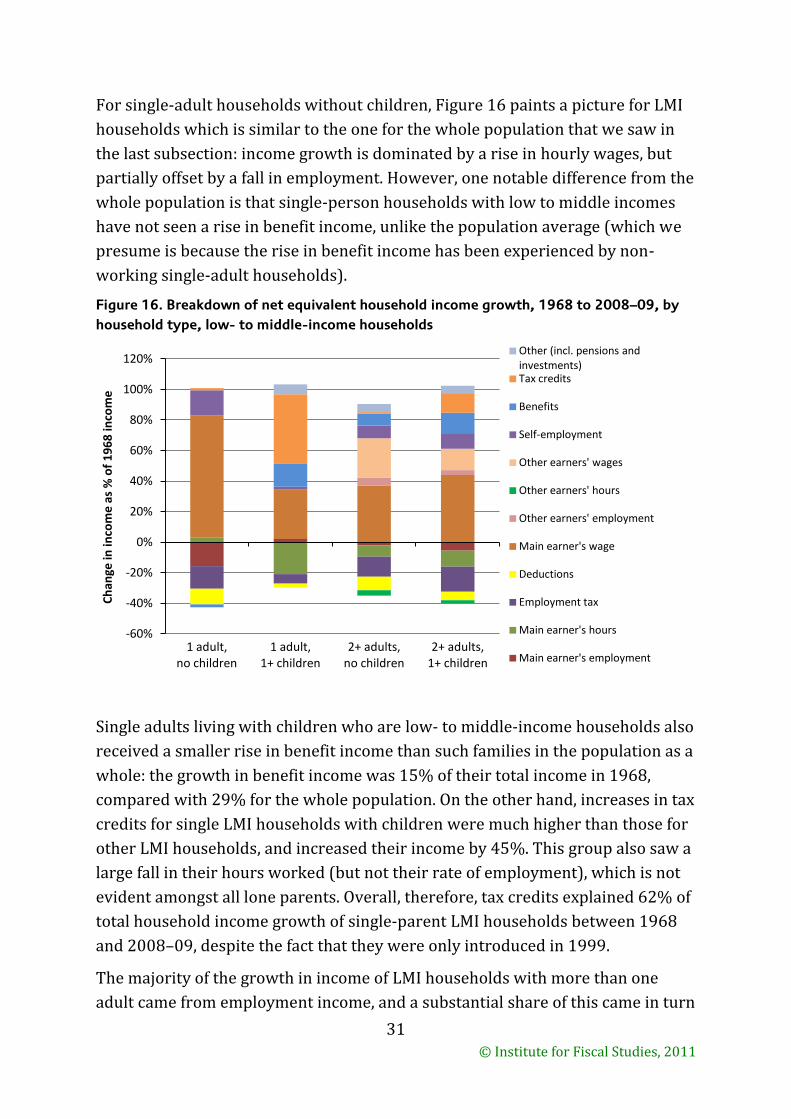
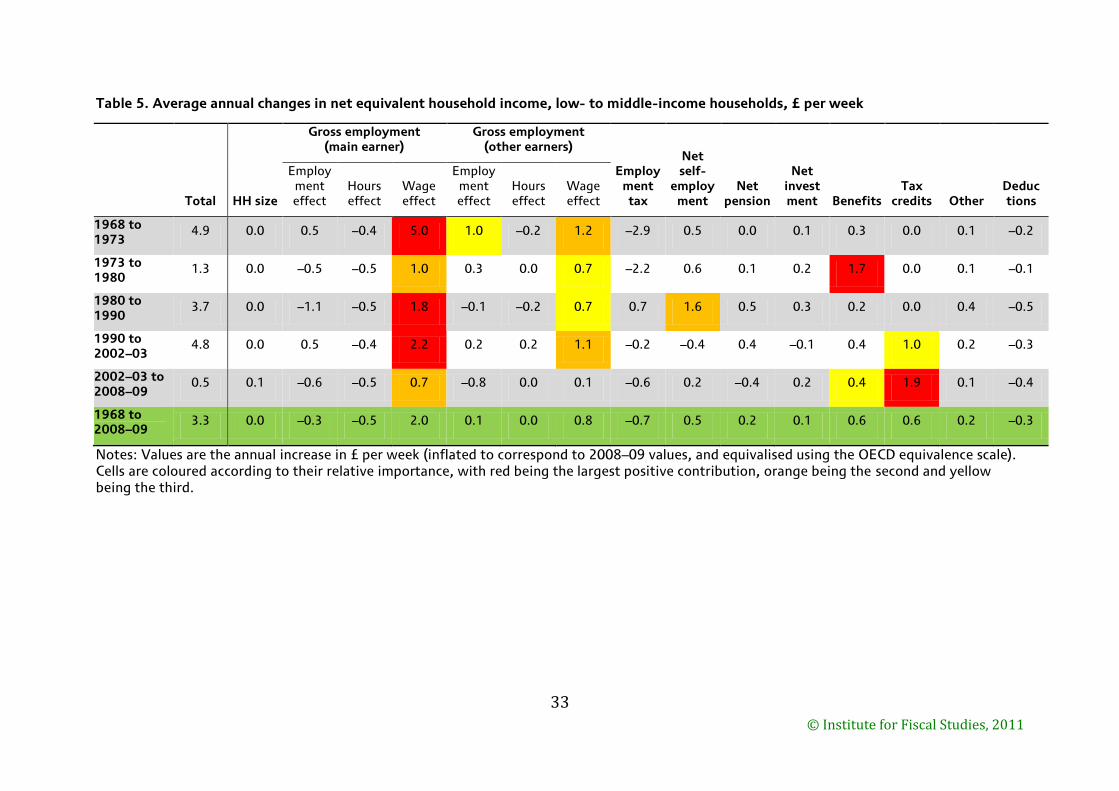
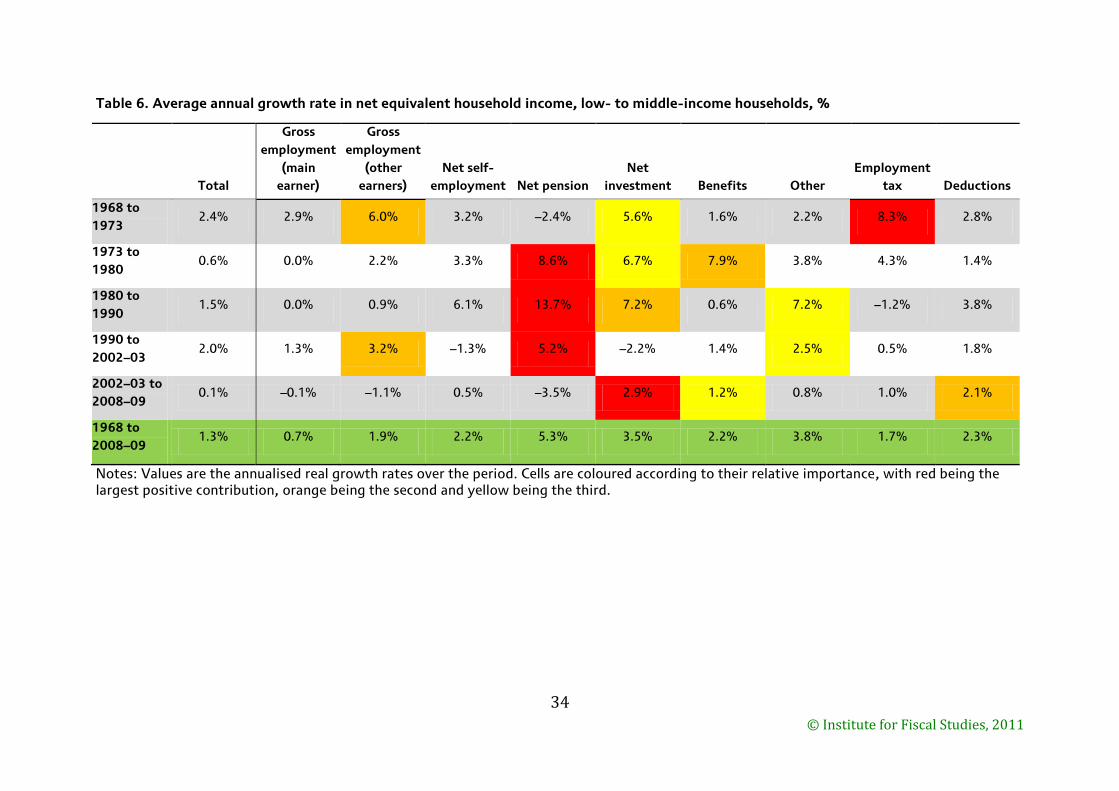
Returning to all low- to middle-income households, Table 5 gives the breakdown
of changes in each of the subperiods set out in Section 2. These data are also
presented as a series of stacked bar charts in Figure 17. Table 6 gives a
breakdown for the average annual percentage growth rates.
We now consider the most notable changes in income sources within each of
these periods.
Figure 17. Average annual change in net equivalent household income by period,
subdivided by source, low- to middle-income households
-4
-2
0
2
4
6
8
1968 to 1973
1973 to 1980
1980 to 1990
1990 to 2002–03
2002–03 to 2008–09
£ p
er
we
ek
(in
flat
ed
to
20
08–0
9 v
alu
es
Other (incl. pensions and investments) Tax credits
Benefits
Self-employment
Other earners' wages
Other earners' hours
Other earners' employment
Main earner's wage
Deductions
Employment tax
Main earner's hours
Main earner's employment
Household size
33
© Institute for Fiscal Studies, 2011
Table 5. Average annual changes in net equivalent household income, low- to middle-income households, £ per week
Total HH size
Gross employment (main earner)
Gross employment (other earners)
Employment tax
Net self-
employment
Net pension
Net invest ment Benefits
Tax credits Other
Deduc tions
Employment effect
Hours effect
Wage effect
Employment effect
Hours effect
Wage effect
1968 to 1973
4.9 0.0 0.5 –0.4 5.0 1.0 –0.2 1.2 –2.9 0.5 0.0 0.1 0.3 0.0 0.1 –0.2
1973 to 1980
1.3 0.0 –0.5 –0.5 1.0 0.3 0.0 0.7 –2.2 0.6 0.1 0.2 1.7 0.0 0.1 –0.1
1980 to 1990
3.7 0.0 –1.1 –0.5 1.8 –0.1 –0.2 0.7 0.7 1.6 0.5 0.3 0.2 0.0 0.4 –0.5
1990 to 2002–03
4.8 0.0 0.5 –0.4 2.2 0.2 0.2 1.1 –0.2 –0.4 0.4 –0.1 0.4 1.0 0.2 –0.3
2002–03 to 2008–09
0.5 0.1 –0.6 –0.5 0.7 –0.8 0.0 0.1 –0.6 0.2 –0.4 0.2 0.4 1.9 0.1 –0.4
1968 to 2008–09
3.3 0.0 –0.3 –0.5 2.0 0.1 0.0 0.8 –0.7 0.5 0.2 0.1 0.6 0.6 0.2 –0.3
Notes: Values are the annual increase in £ per week (inflated to correspond to 2008–09 values, and equivalised using the OECD equivalence scale). Cells are coloured according to their relative importance, with red being the largest positive contribution, orange being the second and yellow being the third.
34
© Institute for Fiscal Studies, 2011
Table 6. Average annual growth rate in net equivalent household income, low- to middle-income households, %
Total
Gross
employment
(main
earner)
Gross
employment
(other
earners)
Net self-
employment Net pension
Net
investment Benefits Other
Employment
tax Deductions
1968 to
1973 2.4% 2.9% 6.0% 3.2% –2.4% 5.6% 1.6% 2.2% 8.3% 2.8%
1973 to
1980 0.6% 0.0% 2.2% 3.3% 8.6% 6.7% 7.9% 3.8% 4.3% 1.4%
1980 to
1990 1.5% 0.0% 0.9% 6.1% 13.7% 7.2% 0.6% 7.2% –1.2% 3.8%
1990 to
2002–03 2.0% 1.3% 3.2% –1.3% 5.2% –2.2% 1.4% 2.5% 0.5% 1.8%
2002–03 to
2008–09 0.1% –0.1% –1.1% 0.5% –3.5% 2.9% 1.2% 0.8% 1.0% 2.1%
1968 to
2008–09 1.3% 0.7% 1.9% 2.2% 5.3% 3.5% 2.2% 3.8% 1.7% 2.3%
Notes: Values are the annualised real growth rates over the period. Cells are coloured according to their relative importance, with red being the largest positive contribution, orange being the second and yellow being the third.
35
© Institute for Fiscal Studies, 2011
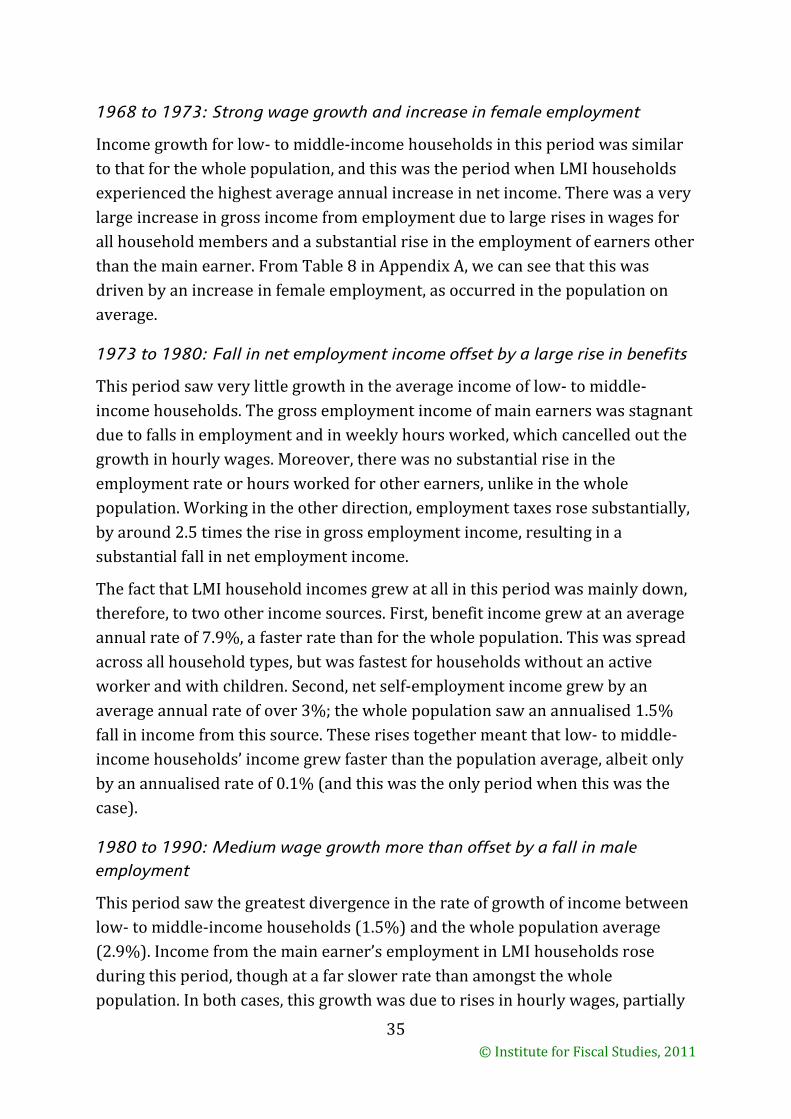
1968 to 1973: Strong wage growth and increase in female employment
Income growth for low- to middle-income households in this period was similar
to that for the whole population, and this was the period when LMI households
experienced the highest average annual increase in net income. There was a very
large increase in gross income from employment due to large rises in wages for
all household members and a substantial rise in the employment of earners other
than the main earner. From Table 8 in Appendix A, we can see that this was
driven by an increase in female employment, as occurred in the population on
average.
1973 to 1980: Fall in net employment income offset by a large rise in benefits
This period saw very little growth in the average income of low- to middle-
income households. The gross employment income of main earners was stagnant
due to falls in employment and in weekly hours worked, which cancelled out the
growth in hourly wages. Moreover, there was no substantial rise in the
employment rate or hours worked for other earners, unlike in the whole
population. Working in the other direction, employment taxes rose substantially,
by around 2.5 times the rise in gross employment income, resulting in a
substantial fall in net employment income.
The fact that LMI household incomes grew at all in this period was mainly down,
therefore, to two other income sources. First, benefit income grew at an average
annual rate of 7.9%, a faster rate than for the whole population. This was spread
across all household types, but was fastest for households without an active
worker and with children. Second, net self-employment income grew by an
average annual rate of over 3%; the whole population saw an annualised 1.5%
fall in income from this source. These rises together meant that low- to middle-
income households’ income grew faster than the population average, albeit only
by an annualised rate of 0.1% (and this was the only period when this was the
case).
1980 to 1990: Medium wage growth more than offset by a fall in male
employment
This period saw the greatest divergence in the rate of growth of income between
low- to middle-income households (1.5%) and the whole population average
(2.9%). Income from the main earner’s employment in LMI households rose
during this period, though at a far slower rate than amongst the whole
population. In both cases, this growth was due to rises in hourly wages, partially
36
© Institute for Fiscal Studies, 2011
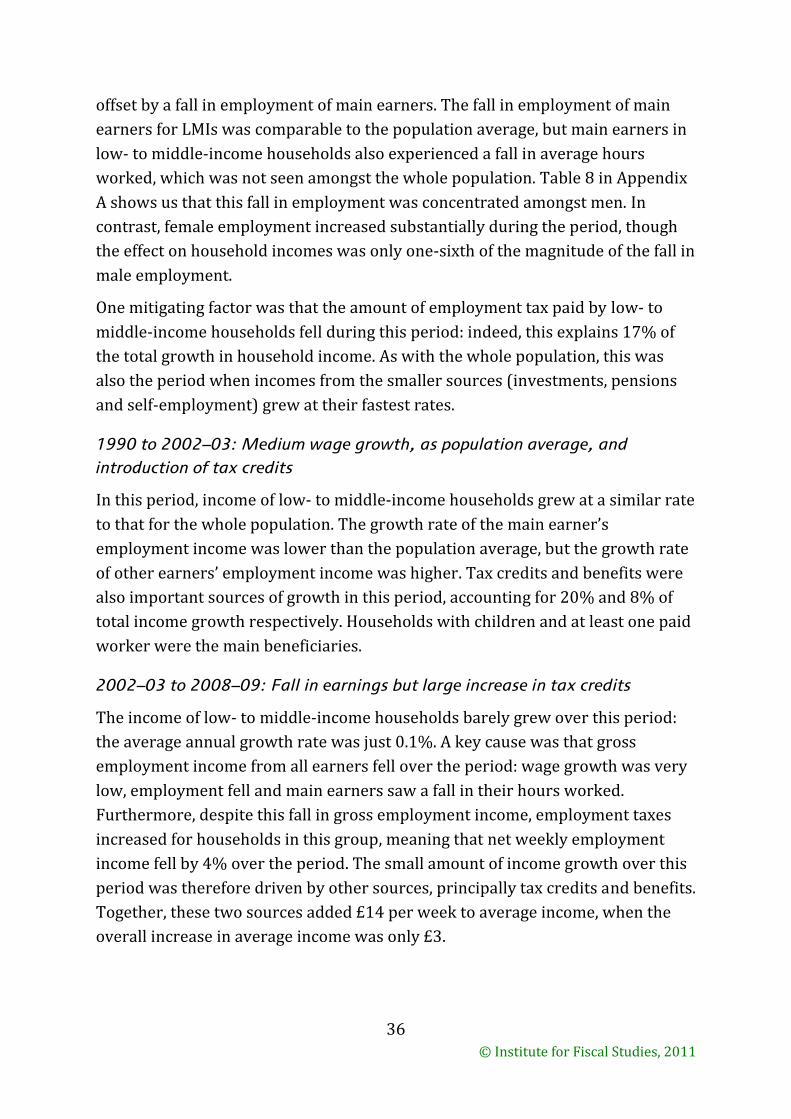
offset by a fall in employment of main earners. The fall in employment of main
earners for LMIs was comparable to the population average, but main earners in
low- to middle-income households also experienced a fall in average hours
worked, which was not seen amongst the whole population. Table 8 in Appendix
A shows us that this fall in employment was concentrated amongst men. In
contrast, female employment increased substantially during the period, though
the effect on household incomes was only one-sixth of the magnitude of the fall in
male employment.
One mitigating factor was that the amount of employment tax paid by low- to
middle-income households fell during this period: indeed, this explains 17% of
the total growth in household income. As with the whole population, this was
also the period when incomes from the smaller sources (investments, pensions
and self-employment) grew at their fastest rates.
1990 to 2002–03: Medium wage growth, as population average, and
introduction of tax credits
In this period, income of low- to middle-income households grew at a similar rate
to that for the whole population. The growth rate of the main earner’s
employment income was lower than the population average, but the growth rate
of other earners’ employment income was higher. Tax credits and benefits were
also important sources of growth in this period, accounting for 20% and 8% of
total income growth respectively. Households with children and at least one paid
worker were the main beneficiaries.
2002–03 to 2008–09: Fall in earnings but large increase in tax credits
The income of low- to middle-income households barely grew over this period:
the average annual growth rate was just 0.1%. A key cause was that gross
employment income from all earners fell over the period: wage growth was very
low, employment fell and main earners saw a fall in their hours worked.
Furthermore, despite this fall in gross employment income, employment taxes
increased for households in this group, meaning that net weekly employment
income fell by 4% over the period. The small amount of income growth over this
period was therefore driven by other sources, principally tax credits and benefits.
Together, these two sources added £14 per week to average income, when the
overall increase in average income was only £3.
37
© Institute for Fiscal Studies, 2011
Summary
As with the whole population, rises in gross hourly wages have been the most
important driver of growth in the income of low- to middle-income households.
Total employment income has, however, suffered from a large fall in male
employment, particularly during the 1980s and between 2002–03 and 2008–09.
LMI households have seen a rise in female employment (which mainly took place
between 1968 and 1973) being somewhat cancelled out by a fall in male
employment (which mainly took place in the 1980s).
The impact of employment taxes on the income of low- to middle-income
households has fluctuated substantially: in the period 1973 to 1980, the rise in
employment taxes was several times the rise in gross employment income; and
the amount of employment taxes paid rose, on average, between 2002–03 and
2008–09 despite households receiving less gross employment income. On the
other hand, the amount paid in employment taxes fell substantially between
1980 and 1990, and barely rose between 1990 and 2002–03. These trends
broadly match changes to key rates and allowances of income tax and National
Insurance contributions.
Income sources other than earnings from employment have also been key
drivers of growth for low- to middle-income households. Benefits and tax credits
together explain around a third of the rise in income since 1968. Benefits rose in
all periods, but most of the growth came between 1973 and 1980. Tax credits
were a more recent phenomenon, increasing gradually since 2000–01. Income
from self-employment, investments and pensions also contributed to income
growth, with most of their rise taking place in the 1980s.
5. Conclusion
In this report, we have sought to investigate the sources of the rise in average
household income that has occurred in the UK over the last four decades. We
have found that there are several important sources of this growth, and that
these sources have varied substantially across time and across different parts of
the income distribution.
Across the whole population, increases in hourly wages have been the largest
force driving growth in household income over the past four decades, and
fluctuations in the rate of wage growth have been a major factor in determining
the pattern of household income growth. However, other factors have also played
a role. A fall in male employment and a rise in female employment have shifted
38
© Institute for Fiscal Studies, 2011
the source of employment income away from the main earner. Sources of income
other than earnings have also contributed to the growth in average household
incomes, but their impact has not been uniform across the four decades. Income
from social security benefits rose considerably between 1973 and 1980 and
between 1990 and 2002–03, and tax credits became an important component of
household income from 2000–01 onwards. A rise in self-employment income
was a major factor in household income growth in the 1980s, but this income
source had minimal impact in other periods. Similarly, most of the growth in
income from investments and pensions occurred during that decade.
For low- to middle-income households, the story has been different. In particular,
gross male employment income has barely grown since 1968, with a growth rate
of less than a quarter of the population average. This is because male wage
growth has been substantially slower for LMI households than for the total
population since 1980, and what gains there were in wages were all but
cancelled out by falls in male employment. Indeed, since 1980, low- to middle-
income households’ incomes have only grown because of rises in other income
sources, most notably benefits and tax credits. Meanwhile, employment income
for LMI households has become increasingly sourced from female earners, with
women earning 37% of household net employment income in 2008–09,
compared with 14% in 1968.
Low- to middle-income households have therefore seen a major change in the
sources of their income, but the richest households have seen little change. For
LMIs, the greater diversity of income sources may reduce the risk of negative
income shocks. However, the changes also make these households more
dependent on external sources such as the generosity of the tax–benefit system
and the availability of childcare.
Since LMI households receive a smaller portion of their income from wages than
the average household does, wage increases will have a relatively smaller impact
on household income. For example, if everyone’s net wage doubled, but all other
income sources remained constant, then household incomes before deductions
would increase by 71% on average, but they would only increase by 64% for LMI
households. For these households to keep up with the average would therefore
require an increase in income through another source, most likely increased
employment or state transfers. If income from benefits did not rise, LMI
households would need to increase their hours worked by around 5% on average
in order to keep up.
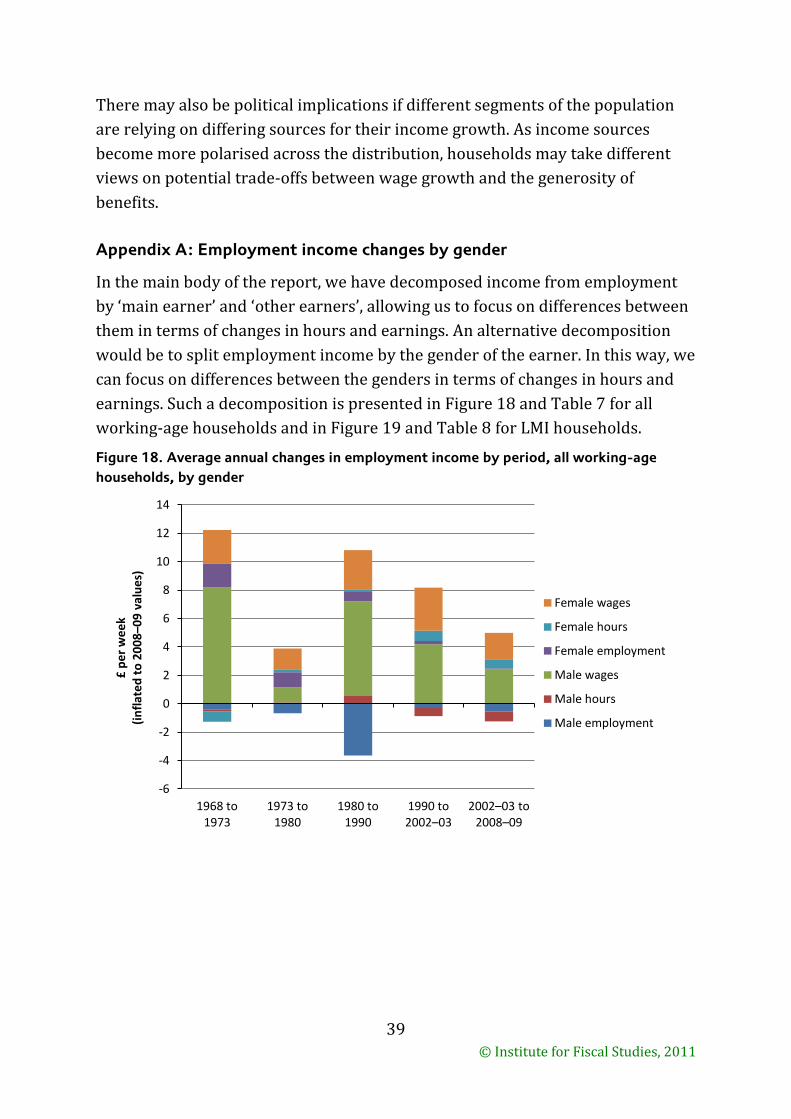
39
© Institute for Fiscal Studies, 2011
There may also be political implications if different segments of the population
are relying on differing sources for their income growth. As income sources
become more polarised across the distribution, households may take different
views on potential trade-offs between wage growth and the generosity of
benefits.
Appendix A: Employment income changes by gender
In the main body of the report, we have decomposed income from employment
by ‘main earner’ and ‘other earners’, allowing us to focus on differences between
them in terms of changes in hours and earnings. An alternative decomposition
would be to split employment income by the gender of the earner. In this way, we
can focus on differences between the genders in terms of changes in hours and
earnings. Such a decomposition is presented in Figure 18 and Table 7 for all
working-age households and in Figure 19 and Table 8 for LMI households.
Figure 18. Average annual changes in employment income by period, all working-age
households, by gender
-6
-4
-2
0
2
4
6
8
10
12
14
1968 to 1973
1973 to 1980
1980 to 1990
1990 to 2002–03
2002–03 to 2008–09
£ p
er
we
ek
(in
flat
ed
to
20
08–0
9 v
alu
es)
Female wages
Female hours
Female employment
Male wages
Male hours
Male employment
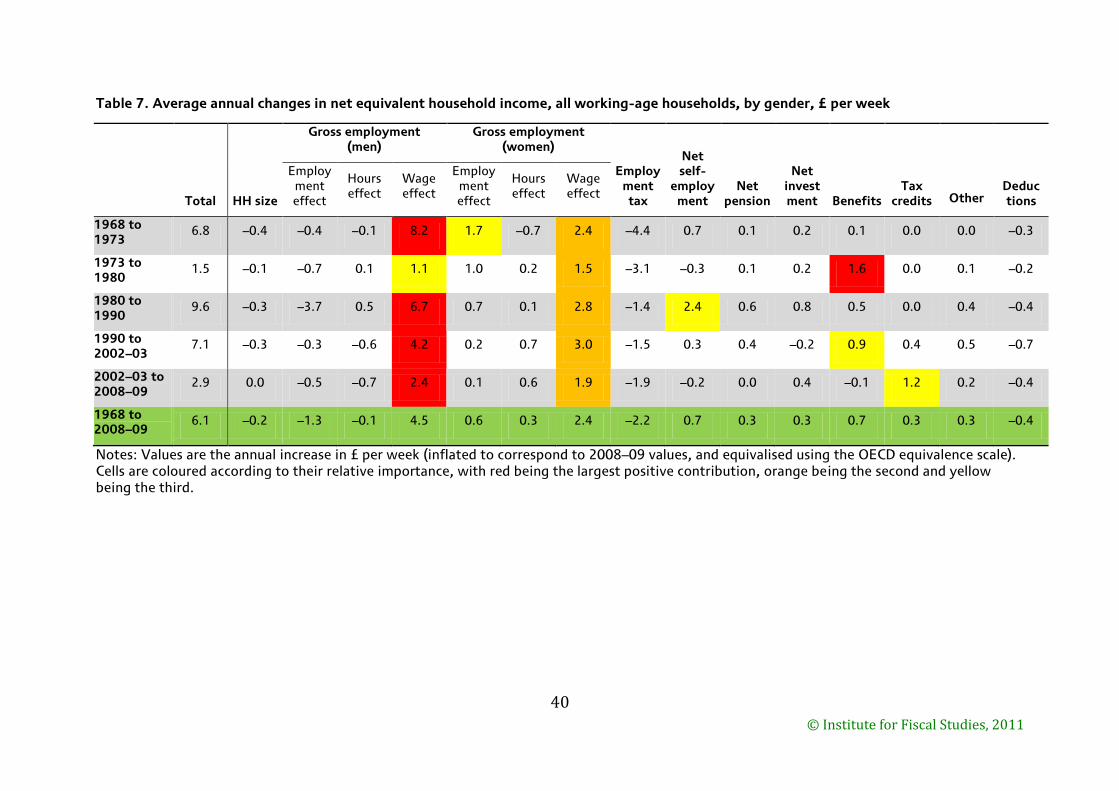
40
© Institute for Fiscal Studies, 2011
Table 7. Average annual changes in net equivalent household income, all working-age households, by gender, £ per week
Total HH size
Gross employment (men)
Gross employment (women)
Employment tax
Net self-
employment
Net pension
Net invest ment Benefits
Tax credits Other
Deduc tions
Employment effect
Hours effect
Wage effect
Employment effect
Hours effect
Wage effect
1968 to 1973
6.8 –0.4 –0.4 –0.1 8.2 1.7 –0.7 2.4 –4.4 0.7 0.1 0.2 0.1 0.0 0.0 –0.3
1973 to 1980
1.5 –0.1 –0.7 0.1 1.1 1.0 0.2 1.5 –3.1 –0.3 0.1 0.2 1.6 0.0 0.1 –0.2
1980 to 1990
9.6 –0.3 –3.7 0.5 6.7 0.7 0.1 2.8 –1.4 2.4 0.6 0.8 0.5 0.0 0.4 –0.4
1990 to 2002–03
7.1 –0.3 –0.3 –0.6 4.2 0.2 0.7 3.0 –1.5 0.3 0.4 –0.2 0.9 0.4 0.5 –0.7
2002–03 to 2008–09
2.9 0.0 –0.5 –0.7 2.4 0.1 0.6 1.9 –1.9 –0.2 0.0 0.4 –0.1 1.2 0.2 –0.4
1968 to 2008–09
6.1 –0.2 –1.3 –0.1 4.5 0.6 0.3 2.4 –2.2 0.7 0.3 0.3 0.7 0.3 0.3 –0.4
Notes: Values are the annual increase in £ per week (inflated to correspond to 2008–09 values, and equivalised using the OECD equivalence scale). Cells are coloured according to their relative importance, with red being the largest positive contribution, orange being the second and yellow being the third.
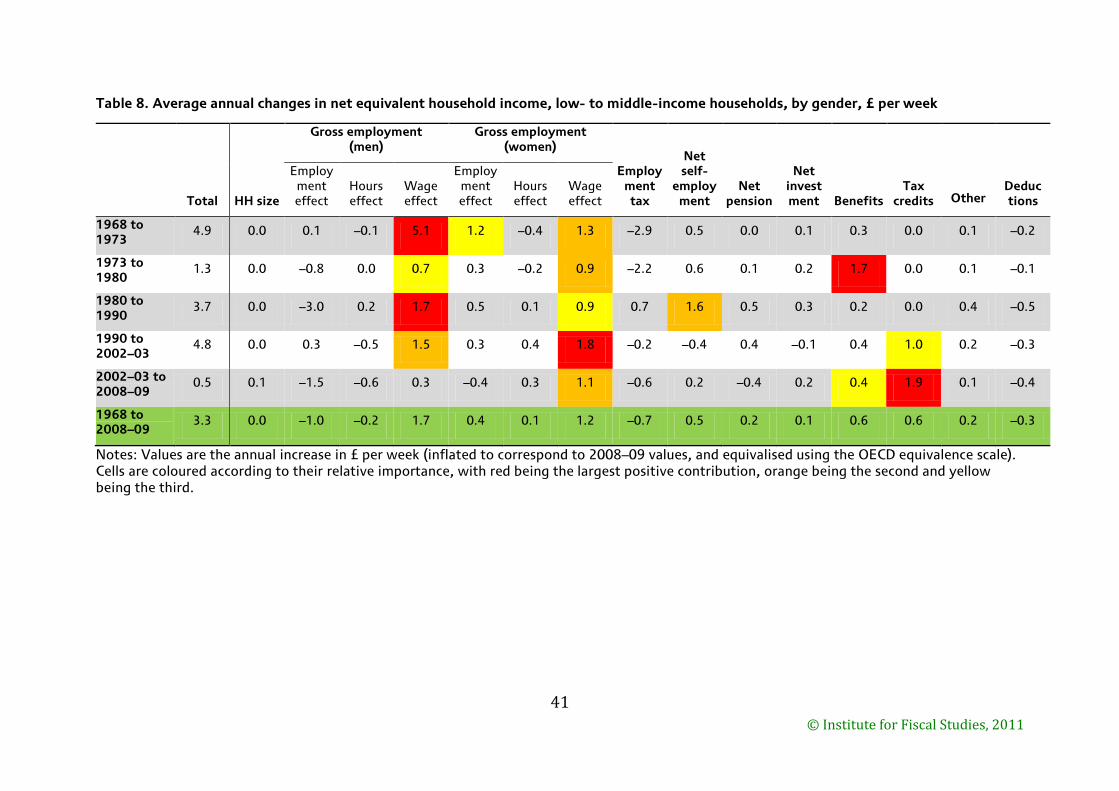
41
© Institute for Fiscal Studies, 2011
Table 8. Average annual changes in net equivalent household income, low- to middle-income households, by gender, £ per week
Total HH size
Gross employment (men)
Gross employment (women)
Employment tax
Net self-
employment
Net pension
Net invest ment Benefits
Tax credits Other
Deduc tions
Employment effect
Hours effect
Wage effect
Employment effect
Hours effect
Wage effect
1968 to 1973
4.9 0.0 0.1 –0.1 5.1 1.2 –0.4 1.3 –2.9 0.5 0.0 0.1 0.3 0.0 0.1 –0.2
1973 to 1980
1.3 0.0 –0.8 0.0 0.7 0.3 –0.2 0.9 –2.2 0.6 0.1 0.2 1.7 0.0 0.1 –0.1
1980 to 1990
3.7 0.0 –3.0 0.2 1.7 0.5 0.1 0.9 0.7 1.6 0.5 0.3 0.2 0.0 0.4 –0.5
1990 to 2002–03
4.8 0.0 0.3 –0.5 1.5 0.3 0.4 1.8 –0.2 –0.4 0.4 –0.1 0.4 1.0 0.2 –0.3
2002–03 to 2008–09
0.5 0.1 –1.5 –0.6 0.3 –0.4 0.3 1.1 –0.6 0.2 –0.4 0.2 0.4 1.9 0.1 –0.4
1968 to 2008–09
3.3 0.0 –1.0 –0.2 1.7 0.4 0.1 1.2 –0.7 0.5 0.2 0.1 0.6 0.6 0.2 –0.3
Notes: Values are the annual increase in £ per week (inflated to correspond to 2008–09 values, and equivalised using the OECD equivalence scale). Cells are coloured according to their relative importance, with red being the largest positive contribution, orange being the second and yellow being the third.
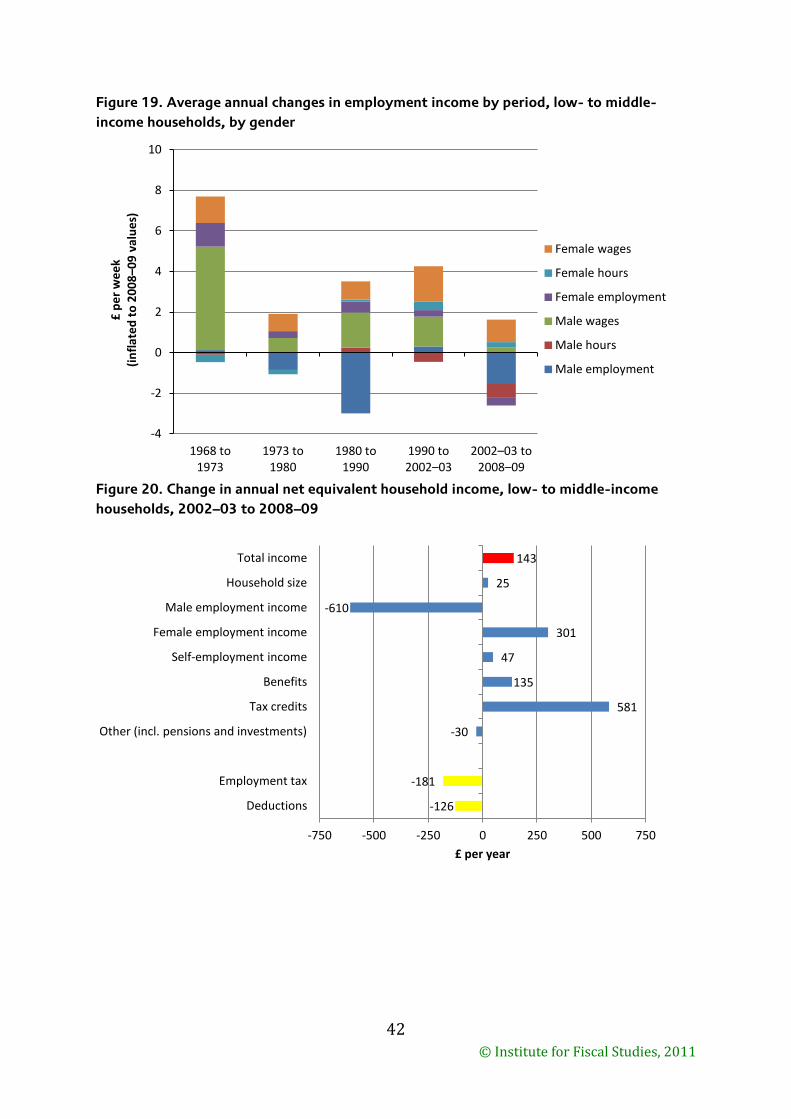
42
© Institute for Fiscal Studies, 2011
Figure 19. Average annual changes in employment income by period, low- to middle-
income households, by gender
Figure 20. Change in annual net equivalent household income, low- to middle-income
households, 2002–03 to 2008–09
-4
-2
0
2
4
6
8
10
1968 to 1973
1973 to 1980
1980 to 1990
1990 to 2002–03
2002–03 to 2008–09
£ p
er
we
ek
(in
flat
ed
to
20
08–0
9 v
alu
es)
Female wages
Female hours
Female employment
Male wages
Male hours
Male employment
-126
-181
-30
581
135
47
301
-610
25
143
-750 -500 -250 0 250 500 750
Deductions
Employment tax
Other (incl. pensions and investments)
Tax credits
Benefits
Self-employment income
Female employment income
Male employment income
Household size
Total income
£ per year
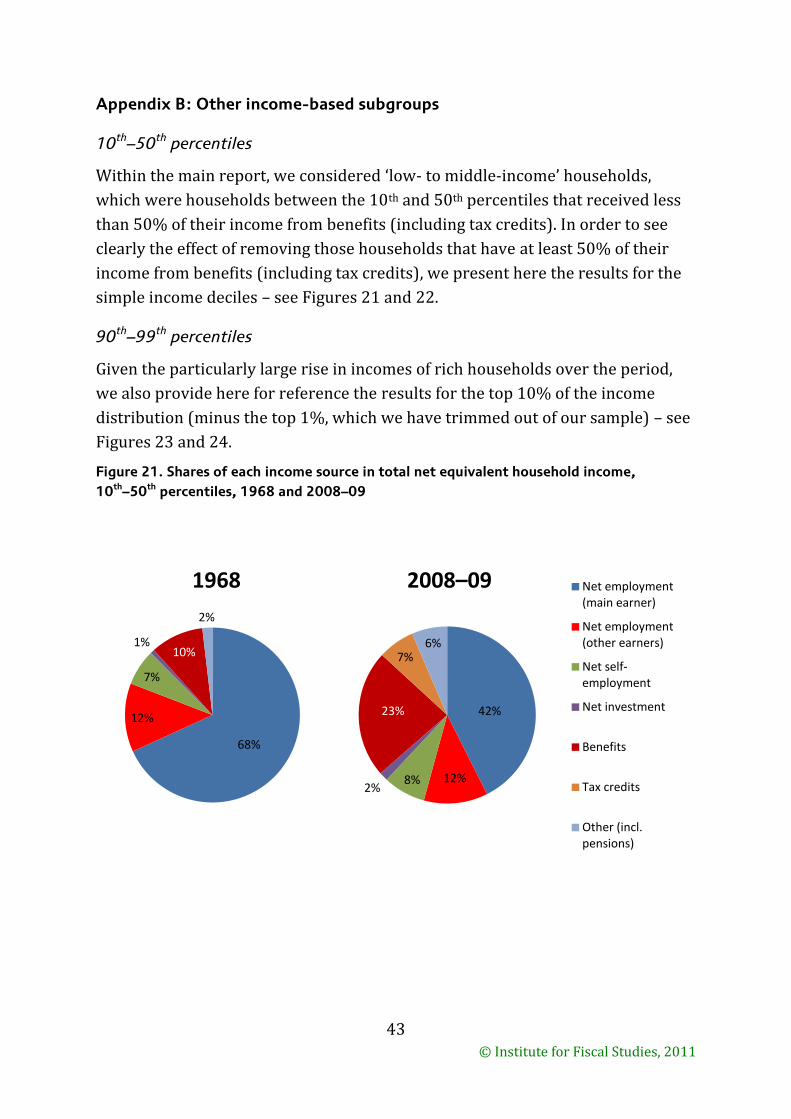
43
© Institute for Fiscal Studies, 2011
Appendix B: Other income-based subgroups
10th–50
th percentiles
Within the main report, we considered ‘low- to middle-income’ households,
which were households between the 10th and 50th percentiles that received less
than 50% of their income from benefits (including tax credits). In order to see
clearly the effect of removing those households that have at least 50% of their
income from benefits (including tax credits), we present here the results for the
simple income deciles – see Figures 21 and 22.
90th–99
th percentiles
Given the particularly large rise in incomes of rich households over the period,
we also provide here for reference the results for the top 10% of the income
distribution (minus the top 1%, which we have trimmed out of our sample) – see
Figures 23 and 24.
Figure 21. Shares of each income source in total net equivalent household income,
10th–50th percentiles, 1968 and 2008–09
68%
12%
7%
1% 10%
2%
1968
42%
12% 8% 2%
23%
7% 6%
2008–09 Net employment (main earner)
Net employment (other earners)
Net self-employment
Net investment
Benefits
Tax credits
Other (incl. pensions)
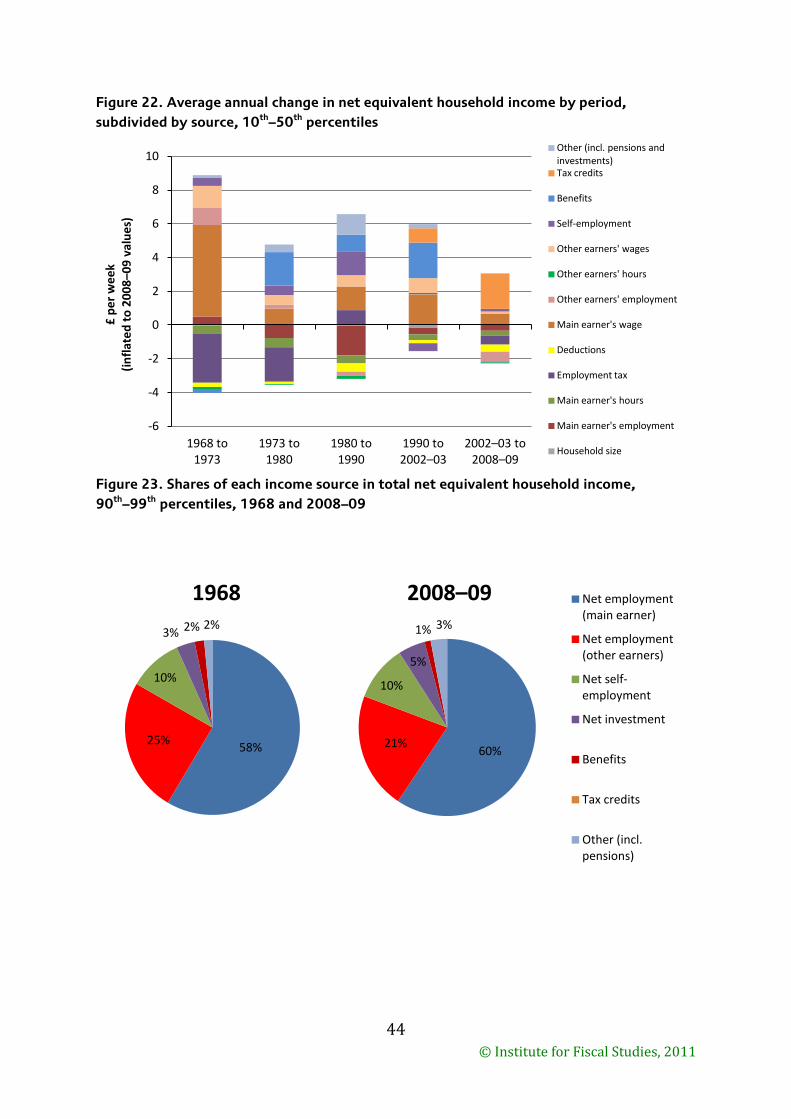
44
© Institute for Fiscal Studies, 2011
Figure 22. Average annual change in net equivalent household income by period,
subdivided by source, 10th–50th percentiles
Figure 23. Shares of each income source in total net equivalent household income,
90th–99th percentiles, 1968 and 2008–09
-6
-4
-2
0
2
4
6
8
10
1968 to 1973
1973 to 1980
1980 to 1990
1990 to 2002–03
2002–03 to 2008–09
£ p
er
we
ek
(in
flat
ed
to
20
08–0
9 v
alu
es)
Other (incl. pensions and investments) Tax credits
Benefits
Self-employment
Other earners' wages
Other earners' hours
Other earners' employment
Main earner's wage
Deductions
Employment tax
Main earner's hours
Main earner's employment
Household size
58% 25%
10%
3% 2% 2%
1968
60% 21%
10%
5%
1% 3%
2008–09 Net employment (main earner)
Net employment (other earners)
Net self-employment
Net investment
Benefits
Tax credits
Other (incl. pensions)
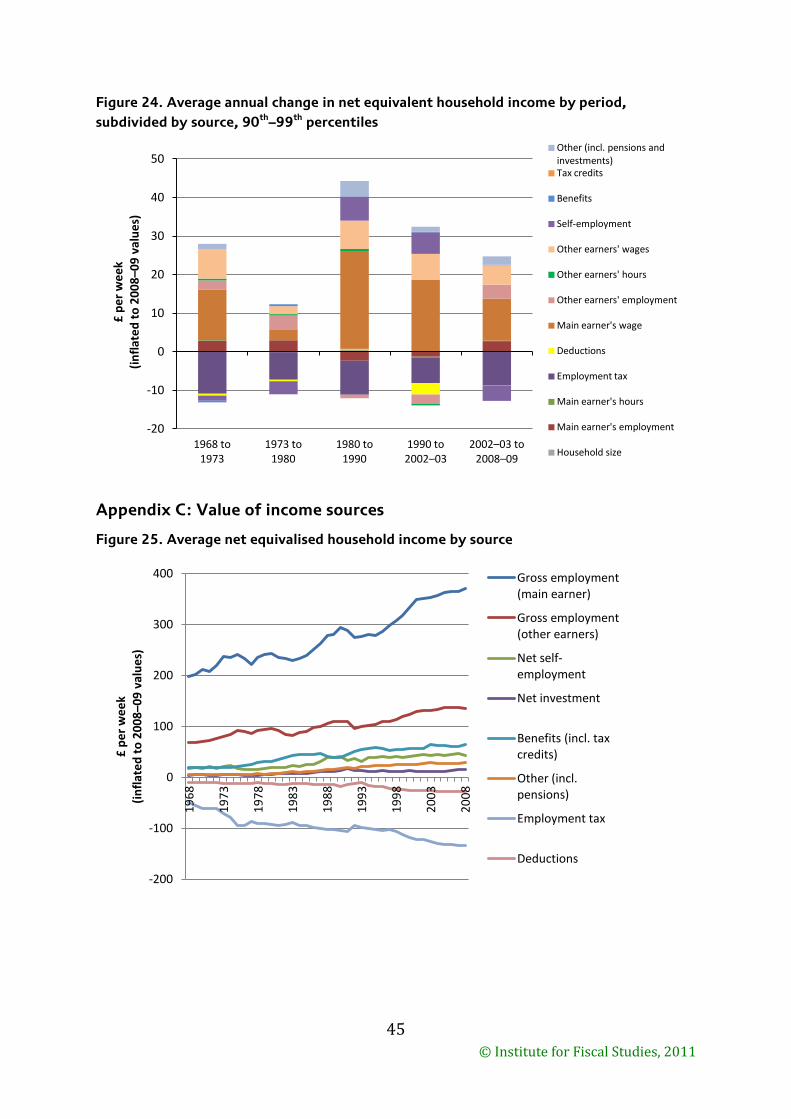
45
© Institute for Fiscal Studies, 2011
Figure 24. Average annual change in net equivalent household income by period,
subdivided by source, 90th–99th percentiles
Appendix C: Value of income sources
Figure 25. Average net equivalised household income by source
-20
-10
0
10
20
30
40
50
1968 to 1973
1973 to 1980
1980 to 1990
1990 to 2002–03
2002–03 to 2008–09
£ p
er
we
ek
(in
flat
ed
to
20
08–0
9 v
alu
es)
Other (incl. pensions and investments) Tax credits
Benefits
Self-employment
Other earners' wages
Other earners' hours
Other earners' employment
Main earner's wage
Deductions
Employment tax
Main earner's hours
Main earner's employment
Household size
-200
-100
0
100
200
300
400
19
68
19
73
19
78
19
83
19
88
19
93
19
98
20
03
20
08
£ p
er
we
ek
(in
flat
ed
to
20
08–0
9 v
alu
es)
Gross employment (main earner)
Gross employment (other earners)
Net self-employment
Net investment
Benefits (incl. tax credits)
Other (incl. pensions)
Employment tax
Deductions
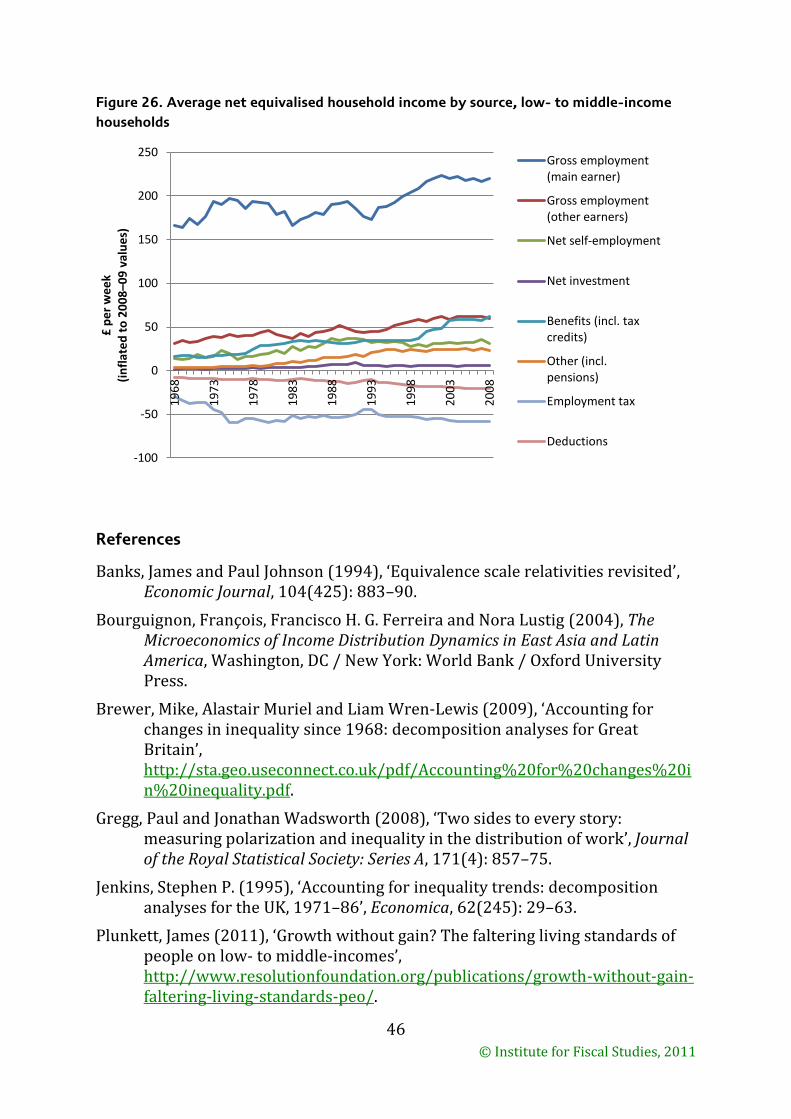
46
© Institute for Fiscal Studies, 2011
Figure 26. Average net equivalised household income by source, low- to middle-income
households
References
Banks, James and Paul Johnson (1994), ‘Equivalence scale relativities revisited’, Economic Journal, 104(425): 883–90.
Bourguignon, François, Francisco H. G. Ferreira and Nora Lustig (2004), The Microeconomics of Income Distribution Dynamics in East Asia and Latin America, Washington, DC / New York: World Bank / Oxford University Press.
Brewer, Mike, Alastair Muriel and Liam Wren-Lewis (2009), ‘Accounting for changes in inequality since 1968: decomposition analyses for Great Britain’, http://sta.geo.useconnect.co.uk/pdf/Accounting%20for%20changes%20in%20inequality.pdf.
Gregg, Paul and Jonathan Wadsworth (2008), ‘Two sides to every story: measuring polarization and inequality in the distribution of work’, Journal of the Royal Statistical Society: Series A, 171(4): 857–75.
Jenkins, Stephen P. (1995), ‘Accounting for inequality trends: decomposition analyses for the UK, 1971–86’, Economica, 62(245): 29–63.
Plunkett, James (2011), ‘Growth without gain? The faltering living standards of people on low- to middle-incomes’, http://www.resolutionfoundation.org/publications/growth-without-gain-faltering-living-standards-peo/.
-100
-50
0
50
100
150
200
250
19
68
19
73
19
78
19
83
19
88
19
93
19
98
20
03
20
08
£ p
er
we
ek
(i
nfl
ate
d t
o 2
00
8–0
9 v
alu
es)
Gross employment (main earner)
Gross employment (other earners)
Net self-employment
Net investment
Benefits (incl. tax credits)
Other (incl. pensions)
Employment tax
Deductions

47
© Institute for Fiscal Studies, 2011
Resolution Foundation (2010), ‘Squeezed Britain: low-to-middle earners audit 2010’, http://www.resolutionfoundation.org/publications/squeezed-britain-low-middle-earners-audit-2010/.
Whittaker, Matthew and Lee Savage (2011), ‘Missing out: why ordinary workers are experiencing growth without gain’, http://www.resolutionfoundation.org/publications/missing-out/.
Related Documents