LAIRD NORTON INVESTMENT MANAGEMENT, INC. 2010 ANNUAL REPORT

Welcome message from author
This document is posted to help you gain knowledge. Please leave a comment to let me know what you think about it! Share it to your friends and learn new things together.
Transcript

LAIRD NORTON
INVESTMENT MANAGEMENT, INC. 2010 ANNUAL REPORT

A HIGHER STANDARD
T W O T H O U S A N D T E N A N N U A L R E P O R T 1
Dear Shareholders,
Wentworth, Hauser and Violich (WHV) is one of the oldest investment counseling firms on the West Coast. Founded in 1937, the firm provides investment management services on marketable securities to institutional, individual and broker-sponsored investors. The firm manages a number of equity asset classes including domestic - ranging from micro-cap to large-cap core, international, global and fixed income.
WHV had a good year in 2010, and is poised to having an even better year in 2011, barring any exogenous and unforeseen events in the geopolitical arena. The year marked the sixteenth year of ownership by the Laird Norton family, through their ownership of Laird Norton Investment Management (LNIM). During that period through the end of 2010, WHV has returned to the family $25.9 million in dividends and payouts from an investment in 1994 of $13.7 million. At year end 2010, WHV had no debt and cash of $22 million. The global accounting firm KPMG International provides an annual valuation of the firm which will be completed in time for the Laird Norton family summit in June 2011.
FINANCIAL RESULTSBy virtually all financial measures, 2010 exceeded the results of 2009. Assets under management (AUM) increased 20% to $15.22 billion from $12.65 billion at year-end 2009. Earnings before interest, taxes, depreciation and amortization (EBITDA) increased 30% to $7.06 million from $5.44 million, while net income increased 36% to $3.80 million from $2.79 million. Per share earnings increased 36% to $26.28 from $19.36 in 2009.
ACCOMPLISHMENTSIn 2010, WHV hired the internationally known investment consulting firm Casey Quirk to undertake an independent review and study of WHV to help us focus on our strengths and identify our weaknesses. We were pleased that our strengths were many including a cohesive management team with broad firm loyalty, a strong and efficient distribution team, firm longevity and heritage, low employee turnover
and favorable investment performance for key asset classes. The result of this undertaking was a strategic plan and road map to the future growth of WHV. Working together, Management and the Board adopted a plan that will increase the potential for WHV to achieve an ambitious goal of expansion in the years ahead. As we entered 2011, the initial steps of this plan have been implemented.
Again, WHV’s investment strategies performed well in 2010 overall, with eight of the eleven equity asset classes exceeding their benchmark returns. The WHV International Mutual Fund experienced a total rate of return for 2010 of 16.35%, almost double the return of the benchmark MSCI EAFE Index return of 8.21%. For the two calendar years that this fund has been offered it has returned 97%.
Our newest asset class, Emerging Markets Equity, launched in mid-2009, experienced its first calendar year rate of return in 2010 of 19.62% compared to a 18.88% return for the MSCI Emerging Markets Index.
At the beginning of 2011, we launched the WHV Emerging Market Mutual Fund which is available through Schwab and Fidelity and is part of the FundAdvantage Family of mutual funds. This fund has two classes of shares: “A” class shares (WHEAX) and “I” class shares (WHEIX) with minimum investments of $5,000 and $500,000, respectively. This fund invests in a diversified portfolio of equity securities of growth oriented companies located in developing countries throughout the world.
Looking at historical performance, for the seven WHV investment strategies with at least three to five years of investment performance, six exceeded their respective benchmarks.

2 L A I R D N O R T O N I N V E S T M E N T M A N A G E M E N T , I N C .
For more details regarding the historical performance information and disclosures of WHV’s investment asset classes, please refer to the “Strategy Overview” section in this report.
THE OUTLOOKThe economic recovery that began in June 2009, following the eighteen-month recession of 2007-2009, has been underway for seven quarters through the end of the first quarter of 2011. The recovery to date has been weak by past standards with Gross Domestic Product (GDP), the total output of goods and services within the United States, expanding at only half the rate of prior post-World War II. However, the expansion in the economy appears to have gained some strength recently as measured by the various economic indicators.
While the housing industry remains depressed, other sectors of GDP have improved including personal income, consumer spending, business spending and exports. The labor markets are improving, although job growth is disappointing by past standards. The global economy, propelled by the developing markets, is experiencing robust growth. Corporate profits are near record levels relative to GDP and corporations are in excellent financial shape with record levels of cash.
Threats to the global economy include rising inflation in the developing countries, rising interest rates and the sovereign debt situation in Europe. Barring an implosion of the euro or an unforeseen geopolitical event, the outlook for the global and United States economy is favorable with continued growth in both output and corporate profits. While the domestic and international stock markets remain volatile, valuations appear reasonable by historic standards providing a foundation to the equity markets.
MANAGEMENT CHANGESIn February 2010, Kenneth E. Piper, who had been a consultant to WHV on the automation of our back office systems, came to work full-time as Vice President, Managing Director, Operations.
During the latter part of 2010, Todd Morton retired as Senior Vice President, Managing
Director, Human Resources. Todd was a long-time employee; his contributions to WHV will be missed and we thank him for his service.
Subsequently, the Human Resources department was folded into the Finance department and Heather L. Hall, who joined WHV as Controller in 2008, assumed the position of Vice President, Managing Director, Finance and Human Resources, Corporate Secretary.
Finally, Pavita Fleischer was appointed Vice President, Chief Compliance Office and a member of the management team. Pavita joined WHV in April 2010 after a distinguished career with the Securities Exchange Commission (SEC) and as a compliance officer at several private investment firms.
LOOKING FORWARDWHV is well positioned to take advantage of the opportunities ahead. One of the strengths highlighted by the Casey Quirk study was the competency of our management team, the members of which are listed on the back cover of this annual report.
The team did a splendid job of managing the firm during the financial crisis in terms of client service and retention, employee retention, dedication and loyalty and new product introductions. We also owe thanks and gratitude to our employees who are as dedicated a group of workers that could ever be assembled. The combined efforts of management and staff resulted in WHV emerging from the downturn a stronger firm.
To conclude, I would like to thank our shareholders, many of whom are clients, for your continued loyalty and for giving me the opportunity to serve you as Chairman. I look
forward to sharing with you our future successes.

T W O T H O U S A N D T E N A N N U A L R E P O R T 3
FROM THE PRESIDENT AND CEO
Judith R. Stevens President and Chief Executive Officer
While excellent investment performance enhances new business opportunities, it takes a professional sales team dedicated to the success of a firm in order to make an impact in the investment management marketplace. Wentworth, Hauser and Violich is fortunate to have a strong and efficient distribution
team due to the leadership of Jeffrey K. Romrell who joined the firm in April 2003.
Shortly after coming on board, Jeff began restructuring our Business Development model. At the time, despite being ranked in the first percentile of International Equity managers in the PSN EAFE universe, WHV’s International Equity strategy had about $180 million in assets under management (AUM). WHV had the performance but lacked the sales infrastructure to reach the proper channels in order to grow the asset base.
Jeff set his course to assemble a team of seasoned, highly-qualified sales professionals who could tactically leverage the firm’s investment success. The distribution team grew in size, skills and experience; adding several with MBA degrees and/or CFA designations. In the years that followed, the firm’s AUM increased dramatically to $2.0 billion by the end of 2005 and well past $10.0 billion by the end of 2007. The team, relative to its peers, has been very productive as measured by AUM per sales professional, but it is currently stretched primarily due to its additional client service responsibilities.
In consultation with Casey Quirk, the internationally known investment consulting firm mentioned in our Chairman’s letter, and Management’s introspection, WHV has begun the migration of the Institutional Business Development team to a functional specialization structure which will result in establishing separate sales, consultant relations and client service departments. In 2011, we plan to hire an experienced consultant relationship professional to lead the new department and a seasoned institutional sales professional to replace Miriam Ballert who will move from sales to build a dedicated client service department, initially focused on clients in WHV’s International strategy.
We also plan to include our talented investment professionals more often in the entire sales process when appropriate. Our Chief Investment Officer, Reiner M. Triltsch, is fully engaged in assisting the sales team to grow the firm’s asset base with an emphasis on asset diversification. Reiner has been invited to speak at several important industry conferences; these speaking engagements are wonderful opportunities to showcase the investment expertise of WHV.
In closing, we believe we have a distribution road map to achieve above industry average sales growth and we look forward to sharing our successes with you along the way.

STRATEGY OVERVIEW

T W O T H O U S A N D T E N A N N U A L R E P O R T 5
Freeport-Mcmoran Copper & Gold
Baker Hughes Inc.
Occidental Petroleum Corporation
Qualcomm Inc.
Intercontinental Exchange Inc.
Peabody Energy Corporation
JPMorgan Chase & Company
Colgate-Palmolive
FedEx Corp.
Canadian National Railway
RepResentative Holdings
Investment ObjectiveThe objective of the WHV Large Cap Core equity strategy is to create a focused, domestic large capitalization, Growth-at-a-Reasonable-Price (GARP) oriented equity portfolio that is expected to outperform the Standard and Poor’s 500 Index over a full market cycle.
Investment StrategyWHV utilizes a bottom-up/top-down overlay approach to construct a Large Cap Core equity portfolio. Emphasis is first placed on individual stock attributes using fundamental research and disciplined valuation techniques to identify portfolio candidates. WHV then assesses macroeconomic factors and economic sector exposure to ensure construction of a diversified, well-positioned portfolio.
DISCLOSURESThe computations of performance numbers are size weighted and include cash. As of December 31, 2010 the WHV Large Cap Core equity composite had a value of $373 million representing six tax-exempt accounts. Net of fees performance is calculated using the highest annual fee for this product, 0.80%. Management fees are fully described in the firm’s ADV Part II. Results reflect reinvestment of income. Comparison of the composite to the S&P 500 is for illustrative purposes only and the volatility of each may be materially different due to varying degrees of diversification and/or other factors. The performance of actual client accounts may vary due to client restrictions, timing of initial investment, actual fees paid and/or other factors. Past performance does not guarantee future results.
Annualized Performance
The representative holdings are the ten largest positions held in a representative account and are subject to change without notice at WHV’s sole discretion.
All data is for the period ending December 31, 2010.
10 Years5 Years3 Years1 Year
12.89
15.0613.79
-0.76
-2.85
0.04
1.90 2.29
2.72
1.841.41
2.65
WHV Net of Fees WHV Gross of Fees S&P 500
For the period ending December 31, 2010
Large Cap Core equity
6 L A I R D N O R T O N I N V E S T M E N T M A N A G E M E N T , I N C .
TRW Automotive Holdings Corp.
Apple Computer
Google Inc.
Expeditors International
Qualcomm Inc.
Timken Co.
Walter Industries Inc.
Dupont E I De Nemours
Anadarko Petroleum Corp.
Schlumberger Ltd.
RepResentative Holdings
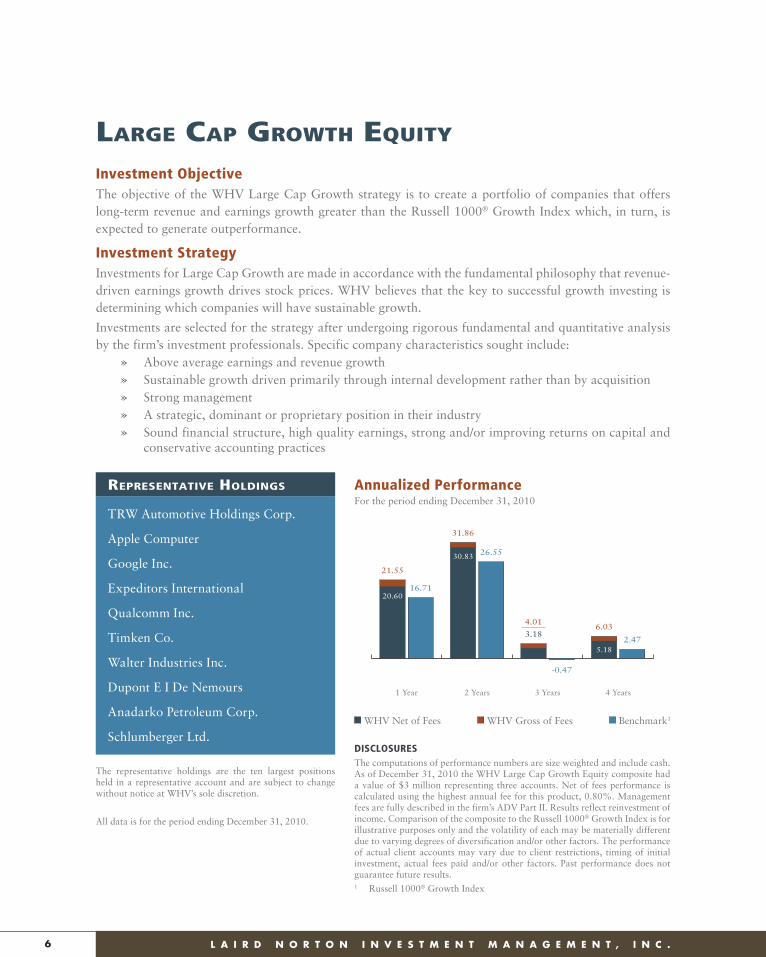
Investment ObjectiveThe objective of the WHV Large Cap Growth strategy is to create a portfolio of companies that offers long-term revenue and earnings growth greater than the Russell 1000® Growth Index which, in turn, is expected to generate outperformance.
Investment StrategyInvestments for Large Cap Growth are made in accordance with the fundamental philosophy that revenue-driven earnings growth drives stock prices. WHV believes that the key to successful growth investing is determining which companies will have sustainable growth.
Investments are selected for the strategy after undergoing rigorous fundamental and quantitative analysis by the firm’s investment professionals. Specific company characteristics sought include:
» Above average earnings and revenue growth » Sustainable growth driven primarily through internal development rather than by acquisition » Strong management » A strategic, dominant or proprietary position in their industry » Sound financial structure, high quality earnings, strong and/or improving returns on capital and
conservative accounting practices
DISCLOSURESThe computations of performance numbers are size weighted and include cash. As of December 31, 2010 the WHV Large Cap Growth Equity composite had a value of $3 million representing three accounts. Net of fees performance is calculated using the highest annual fee for this product, 0.80%. Management fees are fully described in the firm’s ADV Part II. Results reflect reinvestment of income. Comparison of the composite to the Russell 1000® Growth Index is for illustrative purposes only and the volatility of each may be materially different due to varying degrees of diversification and/or other factors. The performance of actual client accounts may vary due to client restrictions, timing of initial investment, actual fees paid and/or other factors. Past performance does not guarantee future results.1 Russell 1000® Growth Index
Annualized Performance
The representative holdings are the ten largest positions held in a representative account and are subject to change without notice at WHV’s sole discretion.
All data is for the period ending December 31, 2010.
4 Years3 Years2 Years1 Year
20.6016.71
21.55
30.83 26.55
31.86
3.18
-0.47
4.01
5.182.47
6.03
WHV Net of Fees WHV Gross of Fees Benchmark1
For the period ending December 31, 2010
Large Cap growth equity
T W O T H O U S A N D T E N A N N U A L R E P O R T 7
Panera Bread Company
Roper Industries
WW Grainger Inc.
Affiliated Managers Group
Varian Medical Systems Inc.
Robert Half International
CME Group Inc.
FTI Consulting Inc.
Mattel Inc.
Plantronics
RepResentative Holdings
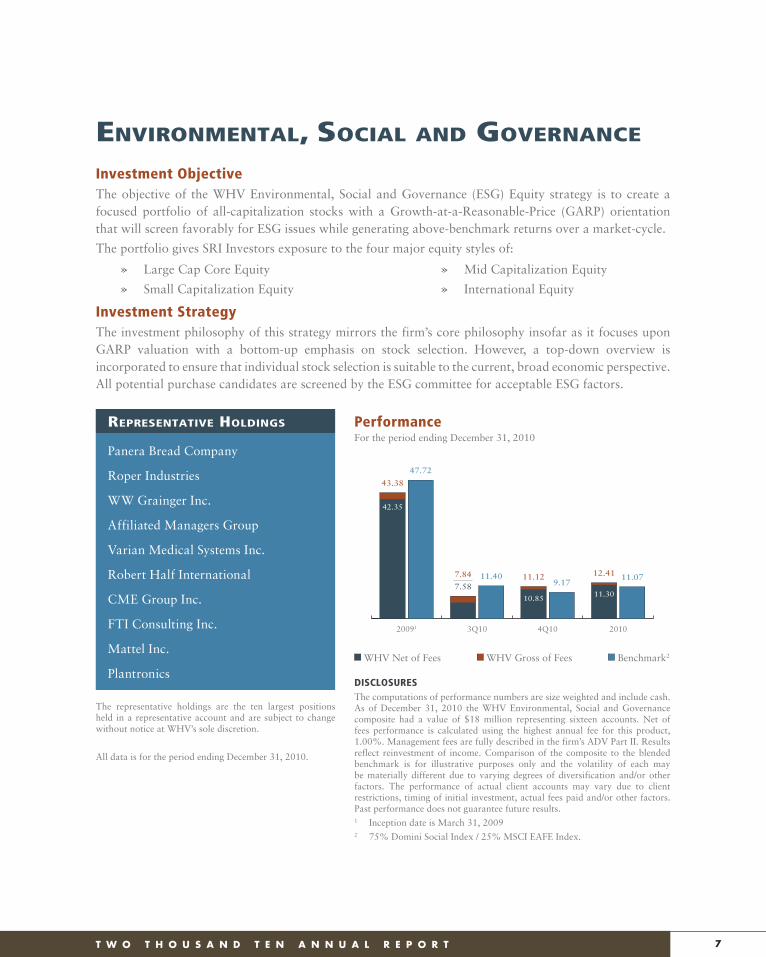
Investment ObjectiveThe objective of the WHV Environmental, Social and Governance (ESG) Equity strategy is to create a focused portfolio of all-capitalization stocks with a Growth-at-a-Reasonable-Price (GARP) orientation that will screen favorably for ESG issues while generating above-benchmark returns over a market-cycle.
The portfolio gives SRI Investors exposure to the four major equity styles of:
Investment StrategyThe investment philosophy of this strategy mirrors the firm’s core philosophy insofar as it focuses upon GARP valuation with a bottom-up emphasis on stock selection. However, a top-down overview is incorporated to ensure that individual stock selection is suitable to the current, broad economic perspective. All potential purchase candidates are screened by the ESG committee for acceptable ESG factors.
DISCLOSURESThe computations of performance numbers are size weighted and include cash. As of December 31, 2010 the WHV Environmental, Social and Governance composite had a value of $18 million representing sixteen accounts. Net of fees performance is calculated using the highest annual fee for this product, 1.00%. Management fees are fully described in the firm’s ADV Part II. Results reflect reinvestment of income. Comparison of the composite to the blended benchmark is for illustrative purposes only and the volatility of each may be materially different due to varying degrees of diversification and/or other factors. The performance of actual client accounts may vary due to client restrictions, timing of initial investment, actual fees paid and/or other factors. Past performance does not guarantee future results.1 Inception date is March 31, 20092 75% Domini Social Index / 25% MSCI EAFE Index.
Performance
The representative holdings are the ten largest positions held in a representative account and are subject to change without notice at WHV’s sole discretion.
All data is for the period ending December 31, 2010.
20104Q103Q1020091
42.35
47.72
43.38
7.5811.407.84
10.85
9.1711.12
11.30
11.0712.41
WHV Net of Fees WHV Gross of Fees Benchmark2
For the period ending December 31, 2010
» Large Cap Core Equity
» Small Capitalization Equity
» Mid Capitalization Equity
» International Equity
environmentaL, SoCiaL and governanCe
8 L A I R D N O R T O N I N V E S T M E N T M A N A G E M E N T , I N C .
Core Laboratories N.V.
Brigham Exploration Co.
Timken Co.
Alpha Natural Resources
Check Point Software
Cliffs Natural Resources Inc.
Plantronics
Affiliated Managers Group
Emergency Medical Svcs.
LKQ Corp.
RepResentative Holdings
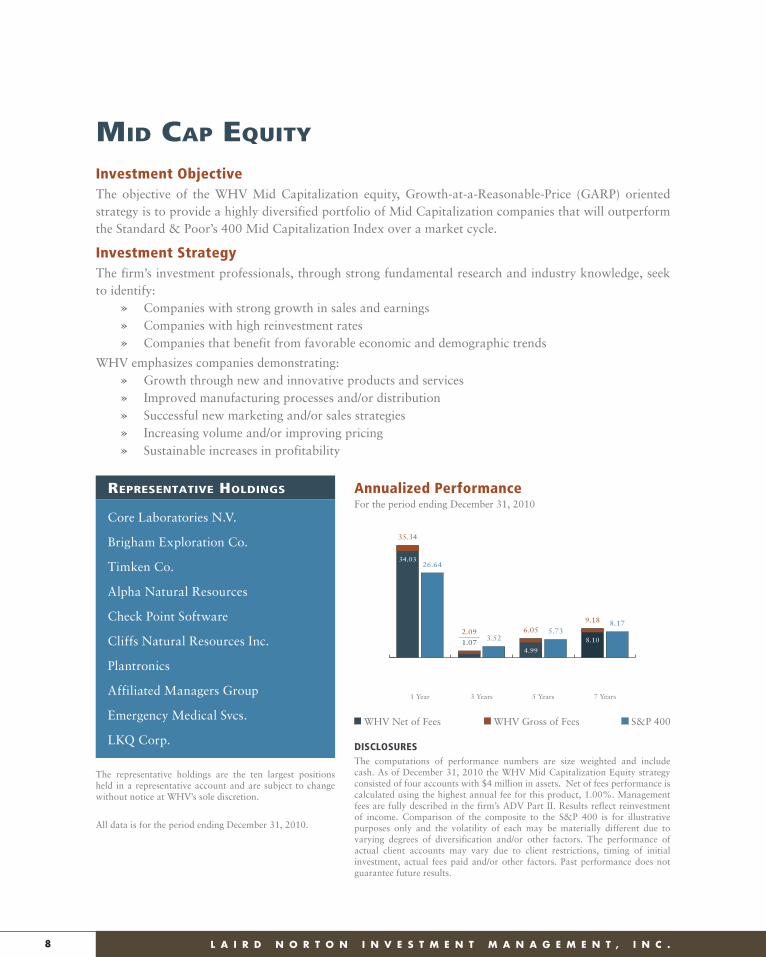
Investment ObjectiveThe objective of the WHV Mid Capitalization equity, Growth-at-a-Reasonable-Price (GARP) oriented strategy is to provide a highly diversified portfolio of Mid Capitalization companies that will outperform the Standard & Poor’s 400 Mid Capitalization Index over a market cycle.
Investment StrategyThe firm’s investment professionals, through strong fundamental research and industry knowledge, seek to identify:
» Companies with strong growth in sales and earnings » Companies with high reinvestment rates » Companies that benefit from favorable economic and demographic trends
WHV emphasizes companies demonstrating: » Growth through new and innovative products and services » Improved manufacturing processes and/or distribution » Successful new marketing and/or sales strategies » Increasing volume and/or improving pricing » Sustainable increases in profitability
DISCLOSURESThe computations of performance numbers are size weighted and include cash. As of December 31, 2010 the WHV Mid Capitalization Equity strategy consisted of four accounts with $4 million in assets. Net of fees performance is calculated using the highest annual fee for this product, 1.00%. Management fees are fully described in the firm’s ADV Part II. Results reflect reinvestment of income. Comparison of the composite to the S&P 400 is for illustrative purposes only and the volatility of each may be materially different due to varying degrees of diversification and/or other factors. The performance of actual client accounts may vary due to client restrictions, timing of initial investment, actual fees paid and/or other factors. Past performance does not guarantee future results.
Annualized Performance
The representative holdings are the ten largest positions held in a representative account and are subject to change without notice at WHV’s sole discretion.
All data is for the period ending December 31, 2010.
7 Years5 Years3 Years1 Year
34.0326.64
35.34
1.073.52
2.09
4.99
5.736.058.10
8.179.18
WHV Net of Fees WHV Gross of Fees S&P 400
For the period ending December 31, 2010
mid Cap equity
T W O T H O U S A N D T E N A N N U A L R E P O R T 9
Dril-Quip
Hecla Mining Company
Oceaneering International Inc.
Bristow Group Inc.
Chart Industries Inc.
Intrepid Potash Inc.
Vishay Intertechnology
International Rectifier
Lattice Semiconductor Corp.
Huron Consulting Group
RepResentative Holdings
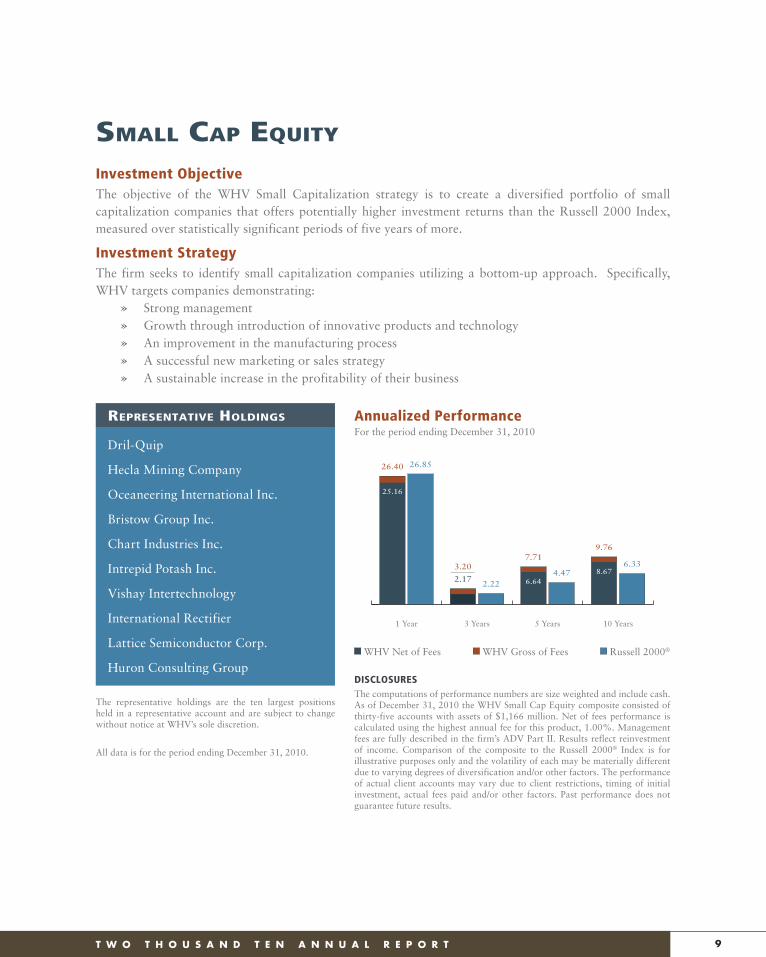
Investment ObjectiveThe objective of the WHV Small Capitalization strategy is to create a diversified portfolio of small capitalization companies that offers potentially higher investment returns than the Russell 2000 Index, measured over statistically significant periods of five years of more.
Investment StrategyThe firm seeks to identify small capitalization companies utilizing a bottom-up approach. Specifically, WHV targets companies demonstrating:
» Strong management » Growth through introduction of innovative products and technology » An improvement in the manufacturing process » A successful new marketing or sales strategy » A sustainable increase in the profitability of their business
DISCLOSURESThe computations of performance numbers are size weighted and include cash. As of December 31, 2010 the WHV Small Cap Equity composite consisted of thirty-five accounts with assets of $1,166 million. Net of fees performance is calculated using the highest annual fee for this product, 1.00%. Management fees are fully described in the firm’s ADV Part II. Results reflect reinvestment of income. Comparison of the composite to the Russell 2000® Index is for illustrative purposes only and the volatility of each may be materially different due to varying degrees of diversification and/or other factors. The performance of actual client accounts may vary due to client restrictions, timing of initial investment, actual fees paid and/or other factors. Past performance does not guarantee future results.
Annualized Performance
The representative holdings are the ten largest positions held in a representative account and are subject to change without notice at WHV’s sole discretion.
All data is for the period ending December 31, 2010.
10 Years5 Years3 Years1 Year
25.16
26.8526.40
2.172.22
3.20
6.644.47
7.71
8.676.33
9.76
WHV Net of Fees WHV Gross of Fees Russell 2000®
For the period ending December 31, 2010
SmaLL Cap equity
10 L A I R D N O R T O N I N V E S T M E N T M A N A G E M E N T , I N C .
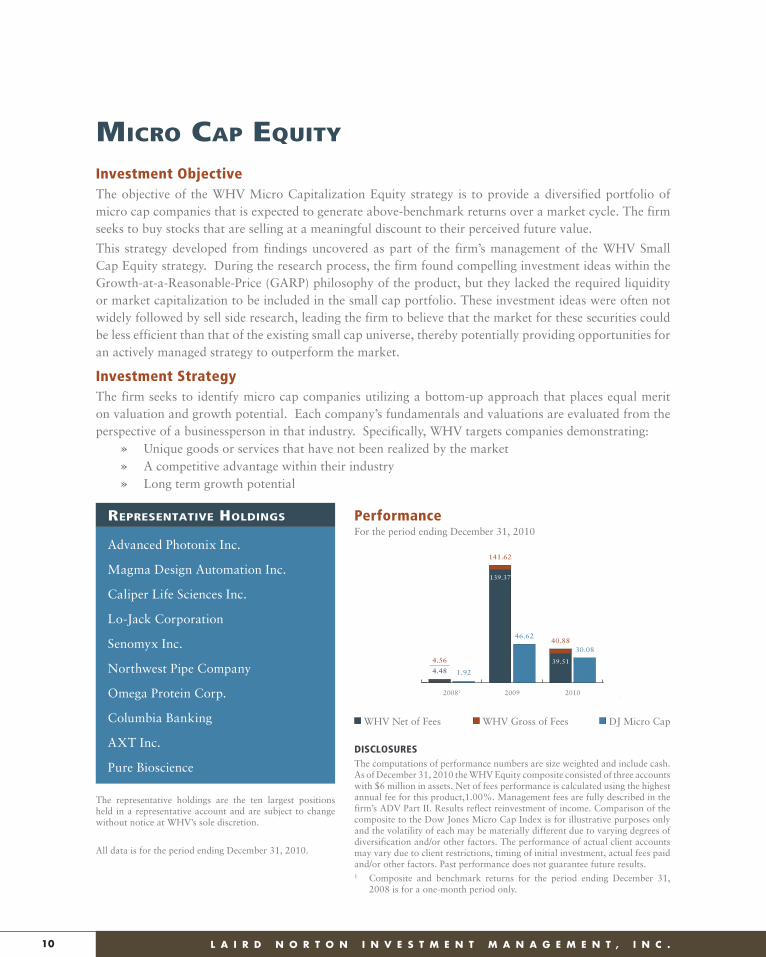
Investment ObjectiveThe objective of the WHV Micro Capitalization Equity strategy is to provide a diversified portfolio of micro cap companies that is expected to generate above-benchmark returns over a market cycle. The firm seeks to buy stocks that are selling at a meaningful discount to their perceived future value.
This strategy developed from findings uncovered as part of the firm’s management of the WHV Small Cap Equity strategy. During the research process, the firm found compelling investment ideas within the Growth-at-a-Reasonable-Price (GARP) philosophy of the product, but they lacked the required liquidity or market capitalization to be included in the small cap portfolio. These investment ideas were often not widely followed by sell side research, leading the firm to believe that the market for these securities could be less efficient than that of the existing small cap universe, thereby potentially providing opportunities for an actively managed strategy to outperform the market.
Investment StrategyThe firm seeks to identify micro cap companies utilizing a bottom-up approach that places equal merit on valuation and growth potential. Each company’s fundamentals and valuations are evaluated from the perspective of a businessperson in that industry. Specifically, WHV targets companies demonstrating:
» Unique goods or services that have not been realized by the market » A competitive advantage within their industry » Long term growth potential
Advanced Photonix Inc.
Magma Design Automation Inc.
Caliper Life Sciences Inc.
Lo-Jack Corporation
Senomyx Inc.
Northwest Pipe Company
Omega Protein Corp.
Columbia Banking
AXT Inc.
Pure Bioscience
RepResentative Holdings Performance
The representative holdings are the ten largest positions held in a representative account and are subject to change without notice at WHV’s sole discretion.
All data is for the period ending December 31, 2010.
Inception-to-Date2010200920081
4.48 1.92
4.56
139.37
46.62
141.62
39.51
30.0840.88
49.0015.00
50.00
WHV Net of Fees WHV Gross of Fees DJ Micro Cap
For the period ending December 31, 2010
DISCLOSURESThe computations of performance numbers are size weighted and include cash. As of December 31, 2010 the WHV Equity composite consisted of three accounts with $6 million in assets. Net of fees performance is calculated using the highest annual fee for this product,1.00%. Management fees are fully described in the firm’s ADV Part II. Results reflect reinvestment of income. Comparison of the composite to the Dow Jones Micro Cap Index is for illustrative purposes only and the volatility of each may be materially different due to varying degrees of diversification and/or other factors. The performance of actual client accounts may vary due to client restrictions, timing of initial investment, actual fees paid and/or other factors. Past performance does not guarantee future results.1 Composite and benchmark returns for the period ending December 31,
2008 is for a one-month period only.
miCro Cap equity
T W O T H O U S A N D T E N A N N U A L R E P O R T 11
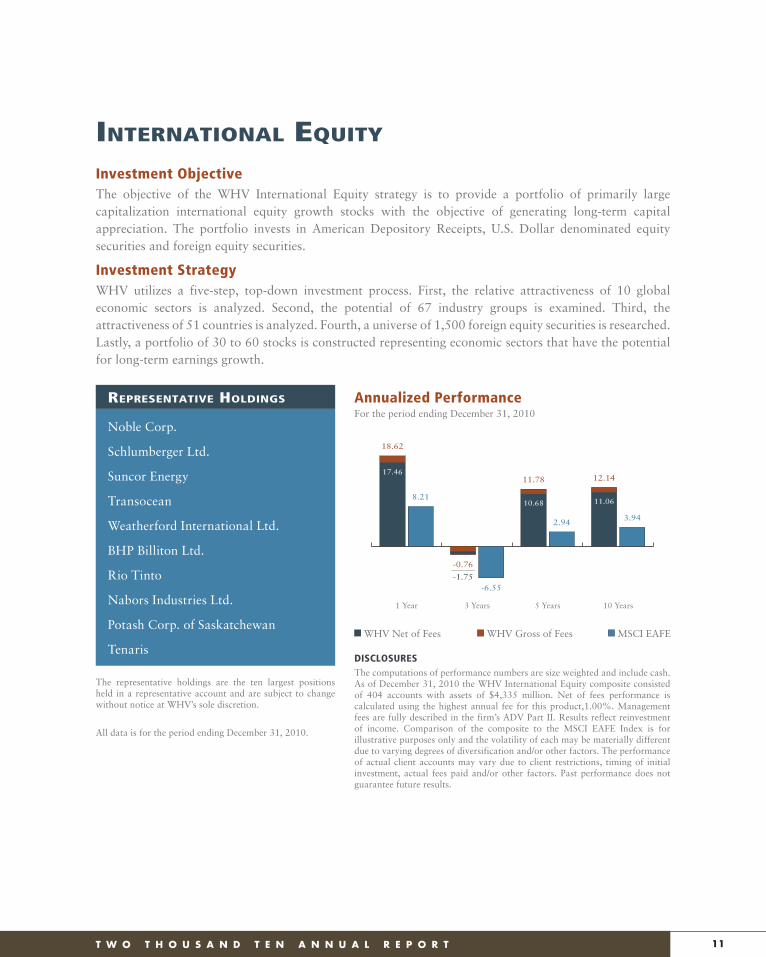
Noble Corp.
Schlumberger Ltd.
Suncor Energy
Transocean
Weatherford International Ltd.
BHP Billiton Ltd.
Rio Tinto
Nabors Industries Ltd.
Potash Corp. of Saskatchewan
Tenaris
RepResentative Holdings
Investment ObjectiveThe objective of the WHV International Equity strategy is to provide a portfolio of primarily large capitalization international equity growth stocks with the objective of generating long-term capital appreciation. The portfolio invests in American Depository Receipts, U.S. Dollar denominated equity securities and foreign equity securities.
Investment StrategyWHV utilizes a five-step, top-down investment process. First, the relative attractiveness of 10 global economic sectors is analyzed. Second, the potential of 67 industry groups is examined. Third, the attractiveness of 51 countries is analyzed. Fourth, a universe of 1,500 foreign equity securities is researched. Lastly, a portfolio of 30 to 60 stocks is constructed representing economic sectors that have the potential for long-term earnings growth.
DISCLOSURESThe computations of performance numbers are size weighted and include cash. As of December 31, 2010 the WHV International Equity composite consisted of 404 accounts with assets of $4,335 million. Net of fees performance is calculated using the highest annual fee for this product,1.00%. Management fees are fully described in the firm’s ADV Part II. Results reflect reinvestment of income. Comparison of the composite to the MSCI EAFE Index is for illustrative purposes only and the volatility of each may be materially different due to varying degrees of diversification and/or other factors. The performance of actual client accounts may vary due to client restrictions, timing of initial investment, actual fees paid and/or other factors. Past performance does not guarantee future results.
Annualized Performance
The representative holdings are the ten largest positions held in a representative account and are subject to change without notice at WHV’s sole discretion.
All data is for the period ending December 31, 2010.
10 Years5 Years3 Years1 Year
17.46
8.21
18.62
-1.75-6.55
-0.76
10.68
2.94
11.78
11.06
3.94
12.14
WHV Net of Fees WHV Gross of Fees MSCI EAFE
For the period ending December 31, 2010
internationaL equity

12 L A I R D N O R T O N I N V E S T M E N T M A N A G E M E N T , I N C .
Weatherford International Ltd.
BHP Billiton Ltd.
Potash Corp. of Saskatchewan Inc.
Rio Tinto
Schlumberger Ltd.
Noble Corp.
Suncor Energy Inc.
Vale S.A.
Transocean Ltd.
Canadian Pacific Railway Ltd.
RepResentative Holdings
Investment ObjectiveThe objective of the WHV International Equity Fund, an open end Mutual Fund, is to provide a portfolio of primarily large capitalization international equity growth stocks that is expected to generate long-term capital appreciation. The Fund invests in American Depository Receipts, U.S. Dollar denominated foreign equity securities and foreign equity securities.
Investment StrategyThe investment philosophy of the WHV International Equity Fund is grounded in the belief that investing in the most attractive global economic sectors can generate superior investment performance. The mutual fund employs the same top-down sector allocation approach as the long-running WHV International Equity strategy and is managed by Mr. Richard K. Hirayama.
DISCLOSURESThe performance data quoted represents past performance. Past performance does not guarantee future results. The investment return and principal value of an investment will fluctuate so that an investor’s shares, when redeemed, may be worth more or less than their original cost and current performance may be lower or higher than the performance quoted. Sales charges would reduce performance of the Fund’s A shares.
For performance data current to the most recent month end, please call 888-948-4685.
The Maximum Sales Charge for the A Class of the fund is 5.75%. The fund charges a 2.0% redemption fee on shares redeemed within 60 days. It is possible to lose money by investing in the Fund.
The Fund is subject to the additional risk of investing in foreign markets and is also subject to the risk of losses caused by changes in foreign currency exchange rates.
The Fund may also invest in securities of companies operating in emerging market countries. Securities of such companies may be more volatile than securities of companies
WHvaXWHvaX
( w/ m a x lo a d 5 .7 5% ) WHviX MsCi eaFe3
4Q10 13.75% 7.23% 13.74% 6.65%
1 Year 16.10% 9.44% 16.35% 8.21%
2 Year -.--% -.--% 40.50% 19.72%
Since Inception (Annualized)
29.54% 19.44% 43.67%14.46%4/ 20.05%5
A Share I ShareClass Retail Institutional
Ticker WHVAX WHVIX
Inception 7/31/2009 12/19/2008
Prospectus Expense Ratio (gross)1 2.32% 2.50%
Investor Expense Ratio (net)2 1.50% 1.25%
Minimum Investment $5,000 $500,000
operating in more developed markets and therefore may involve greater risks. No more than 10% of the Fund at cost may be invested in emerging markets.
You should carefully consider the investment objectives, risks, charges and expenses of the WHV International Equity Fund before investing. For a copy of the prospectus with this and other information about the funds, please call 888-948-4685. You should read the prospectus carefully before investing.1,2 WHV has a greed to contractually limit expenses to 1.50% (Class A) and
1.25% (Class I) through August 31, 2013.3 The benchmark referenced is as follows: MSCI EAFE Index (Europe,
Australasia, Far East) is a free float-adjusted market capitalization index that is designed to measure the equity market performance of developed markets, excluding the U.S. and Canada. As of December 2009, the MSCI EAFE Index consisted of the following twenty-one developed markets countries indices: Australia, Austria, Belgium, Denmark, Finland, France, Germany, Greece, Hong Kong, Ireland, Italy, Japan, the Netherlands, New Zealand, Norway, Portugal, Singapore, Spain, Sweden, Switzerland, and the United Kingdom. It is not possible to invest directly in an index.
Inception: 4WHVAX - 07/31/09 | 5WHVIX - 12/19/08
whv internationaL equity Fund
T W O T H O U S A N D T E N A N N U A L R E P O R T 13
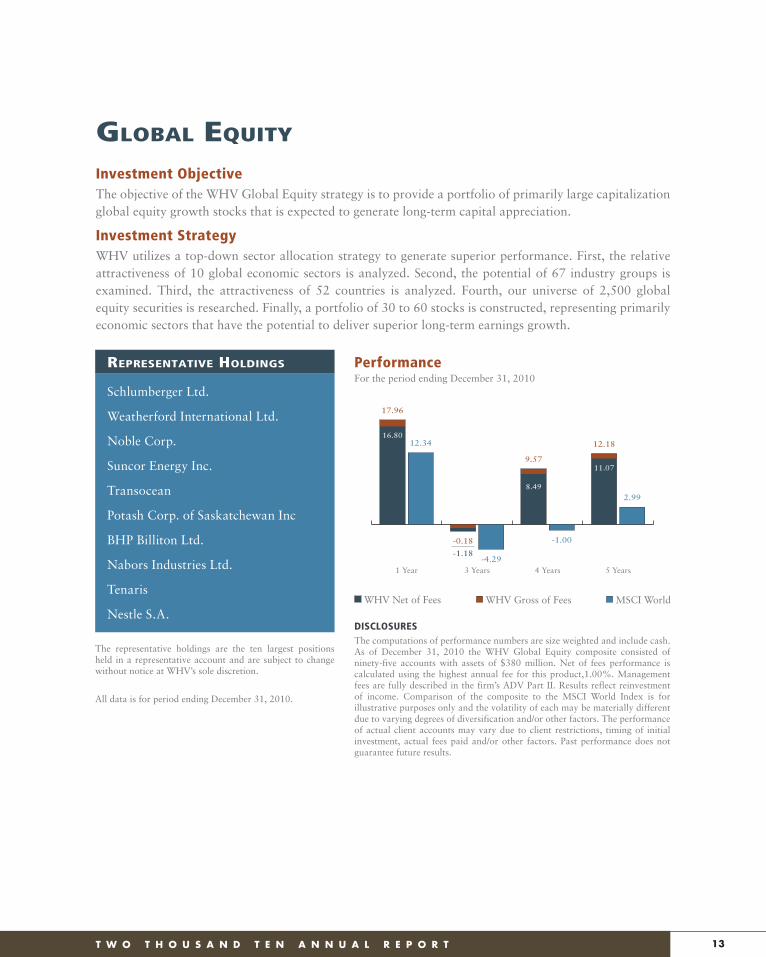
Schlumberger Ltd.
Weatherford International Ltd.
Noble Corp.
Suncor Energy Inc.
Transocean
Potash Corp. of Saskatchewan Inc
BHP Billiton Ltd.
Nabors Industries Ltd.
Tenaris
Nestle S.A.
RepResentative Holdings
The representative holdings are the ten largest positions held in a representative account and are subject to change without notice at WHV’s sole discretion.
All data is for period ending December 31, 2010.
Investment ObjectiveThe objective of the WHV Global Equity strategy is to provide a portfolio of primarily large capitalization global equity growth stocks that is expected to generate long-term capital appreciation.
Investment StrategyWHV utilizes a top-down sector allocation strategy to generate superior performance. First, the relative attractiveness of 10 global economic sectors is analyzed. Second, the potential of 67 industry groups is examined. Third, the attractiveness of 52 countries is analyzed. Fourth, our universe of 2,500 global equity securities is researched. Finally, a portfolio of 30 to 60 stocks is constructed, representing primarily economic sectors that have the potential to deliver superior long-term earnings growth.
DISCLOSURESThe computations of performance numbers are size weighted and include cash. As of December 31, 2010 the WHV Global Equity composite consisted of ninety-five accounts with assets of $380 million. Net of fees performance is calculated using the highest annual fee for this product,1.00%. Management fees are fully described in the firm’s ADV Part II. Results reflect reinvestment of income. Comparison of the composite to the MSCI World Index is for illustrative purposes only and the volatility of each may be materially different due to varying degrees of diversification and/or other factors. The performance of actual client accounts may vary due to client restrictions, timing of initial investment, actual fees paid and/or other factors. Past performance does not guarantee future results.
Performance
5 Years4 Years3 Years1 Year
16.8012.34
17.96
-1.18-4.29
-0.18
8.49
-1.00
9.5711.07
2.99
12.18
WHV Net of Fees WHV Gross of Fees MSCI World
For the period ending December 31, 2010
gLobaL equity
14 L A I R D N O R T O N I N V E S T M E N T M A N A G E M E N T , I N C .
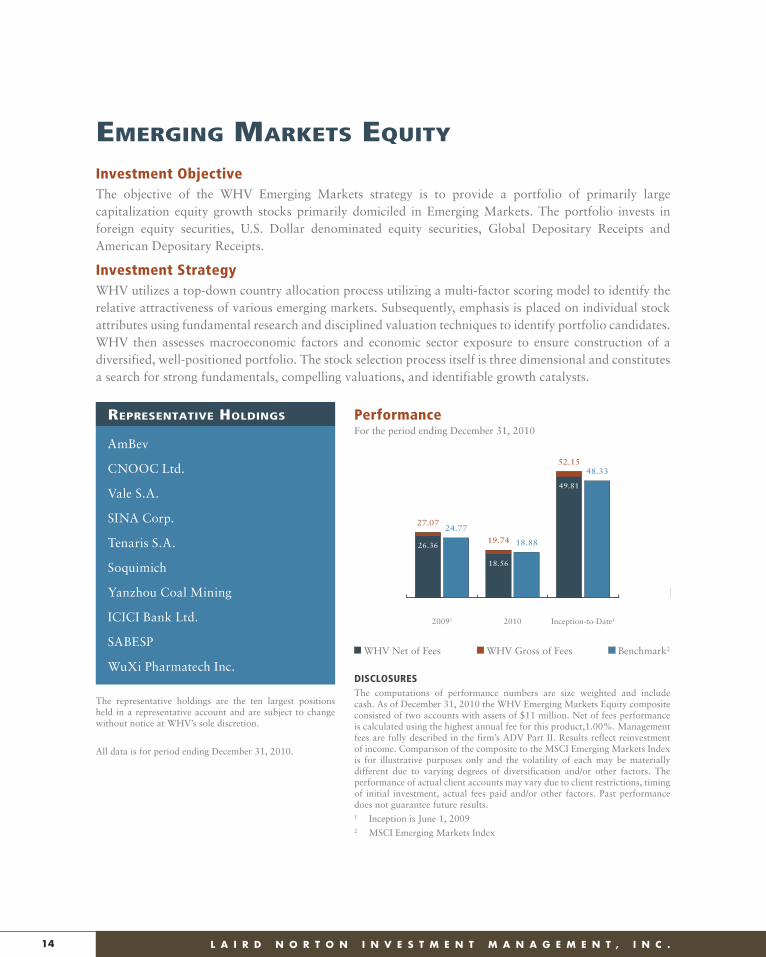
AmBev
CNOOC Ltd.
Vale S.A.
SINA Corp.
Tenaris S.A.
Soquimich
Yanzhou Coal Mining
ICICI Bank Ltd.
SABESP
WuXi Pharmatech Inc.
RepResentative Holdings
The representative holdings are the ten largest positions held in a representative account and are subject to change without notice at WHV’s sole discretion.
All data is for period ending December 31, 2010.
Investment ObjectiveThe objective of the WHV Emerging Markets strategy is to provide a portfolio of primarily large capitalization equity growth stocks primarily domiciled in Emerging Markets. The portfolio invests in foreign equity securities, U.S. Dollar denominated equity securities, Global Depositary Receipts and American Depositary Receipts.
Investment StrategyWHV utilizes a top-down country allocation process utilizing a multi-factor scoring model to identify the relative attractiveness of various emerging markets. Subsequently, emphasis is placed on individual stock attributes using fundamental research and disciplined valuation techniques to identify portfolio candidates. WHV then assesses macroeconomic factors and economic sector exposure to ensure construction of a diversified, well-positioned portfolio. The stock selection process itself is three dimensional and constitutes a search for strong fundamentals, compelling valuations, and identifiable growth catalysts.
DISCLOSURESThe computations of performance numbers are size weighted and include cash. As of December 31, 2010 the WHV Emerging Markets Equity composite consisted of two accounts with assets of $11 million. Net of fees performance is calculated using the highest annual fee for this product,1.00%. Management fees are fully described in the firm’s ADV Part II. Results reflect reinvestment of income. Comparison of the composite to the MSCI Emerging Markets Index is for illustrative purposes only and the volatility of each may be materially different due to varying degrees of diversification and/or other factors. The performance of actual client accounts may vary due to client restrictions, timing of initial investment, actual fees paid and/or other factors. Past performance does not guarantee future results.1 Inception is June 1, 20092 MSCI Emerging Markets Index
Performance
3 YearsInception-to-Date1201020091
26.36
24.7727.07
18.56
18.8819.74
49.81
48.3352.15
9.357.29
10.50
WHV Net of Fees WHV Gross of Fees Benchmark2
For the period ending December 31, 2010
emerging marketS equity
T W O T H O U S A N D T E N A N N U A L R E P O R T 15
Dollar Tree
Canadian National Railway
Apple Computers
Bucyrus International
Cliffs Natural Resources Inc.
Core Laboratories NV
Panera Bread Company
Texas Capital Bancshares
BHP Billiton Ltd.
Vale S.A.
RepResentative Holdings
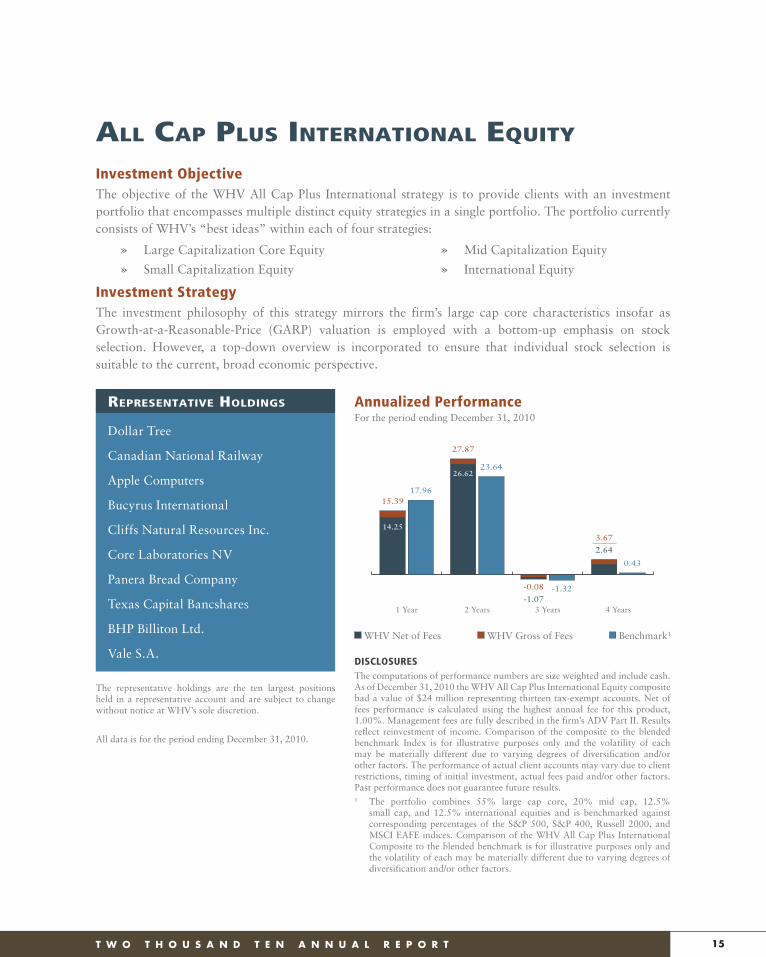
Investment ObjectiveThe objective of the WHV All Cap Plus International strategy is to provide clients with an investment portfolio that encompasses multiple distinct equity strategies in a single portfolio. The portfolio currently consists of WHV’s “best ideas” within each of four strategies:
Investment StrategyThe investment philosophy of this strategy mirrors the firm’s large cap core characteristics insofar as Growth-at-a-Reasonable-Price (GARP) valuation is employed with a bottom-up emphasis on stock selection. However, a top-down overview is incorporated to ensure that individual stock selection is suitable to the current, broad economic perspective.
Annualized Performance
The representative holdings are the ten largest positions held in a representative account and are subject to change without notice at WHV’s sole discretion.
All data is for the period ending December 31, 2010.
4 Years3 Years2 Years1 Year
14.25
17.9615.39
26.6223.64
27.87
-1.07-1.32-0.08
2.64
0.43
3.67
WHV Net of Fees WHV Gross of Fees Benchmark1
For the period ending December 31, 2010
» Large Capitalization Core Equity
» Small Capitalization Equity
» Mid Capitalization Equity
» International Equity
DISCLOSURESThe computations of performance numbers are size weighted and include cash. As of December 31, 2010 the WHV All Cap Plus International Equity composite had a value of $24 million representing thirteen tax-exempt accounts. Net of fees performance is calculated using the highest annual fee for this product, 1.00%. Management fees are fully described in the firm’s ADV Part II. Results reflect reinvestment of income. Comparison of the composite to the blended benchmark Index is for illustrative purposes only and the volatility of each may be materially different due to varying degrees of diversification and/or other factors. The performance of actual client accounts may vary due to client restrictions, timing of initial investment, actual fees paid and/or other factors. Past performance does not guarantee future results.1 The portfolio combines 55% large cap core, 20% mid cap, 12.5%
small cap, and 12.5% international equities and is benchmarked against corresponding percentages of the S&P 500, S&P 400, Russell 2000, and MSCI EAFE indices. Comparison of the WHV All Cap Plus International Composite to the blended benchmark is for illustrative purposes only and the volatility of each may be materially different due to varying degrees of diversification and/or other factors.
aLL Cap pLuS internationaL equity
16 L A I R D N O R T O N I N V E S T M E N T M A N A G E M E N T , I N C .
Coupon Maturity
FNMA 4.75% 11/19/12
FHLMC 4.63% 10/25/12
FHLMC 4.13% 12/21/12
FNMA 2.63% 11/20/14
JP Morgan 4.65% 06/01/14Chase & Co.
Bank of America 7.38% 05/15/14Senior Notes
Goldman Sachs 5.15% 01/15/14Group
FHLMC 5.50% 08/20/12
Morgan Stanley 6.00% 04/28/15
FNMA 4.00% 03/27/13
RepResentative Holdings
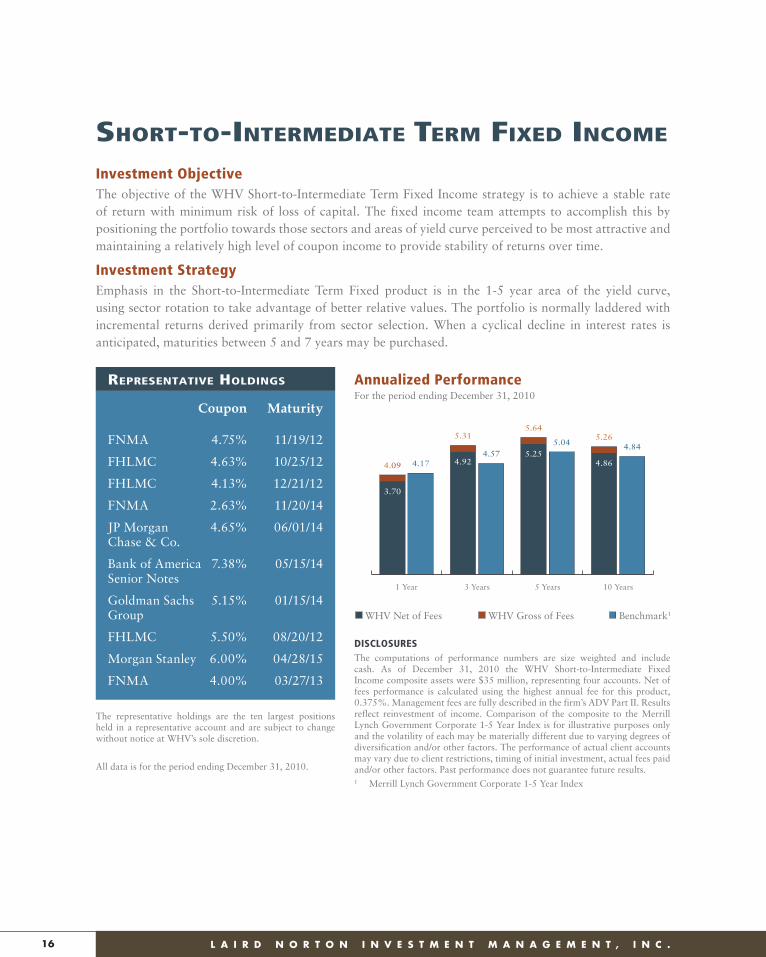
Investment ObjectiveThe objective of the WHV Short-to-Intermediate Term Fixed Income strategy is to achieve a stable rate of return with minimum risk of loss of capital. The fixed income team attempts to accomplish this by positioning the portfolio towards those sectors and areas of yield curve perceived to be most attractive and maintaining a relatively high level of coupon income to provide stability of returns over time.
Investment StrategyEmphasis in the Short-to-Intermediate Term Fixed product is in the 1-5 year area of the yield curve, using sector rotation to take advantage of better relative values. The portfolio is normally laddered with incremental returns derived primarily from sector selection. When a cyclical decline in interest rates is anticipated, maturities between 5 and 7 years may be purchased.
DISCLOSURESThe computations of performance numbers are size weighted and include cash. As of December 31, 2010 the WHV Short-to-Intermediate Fixed Income composite assets were $35 million, representing four accounts. Net of fees performance is calculated using the highest annual fee for this product, 0.375%. Management fees are fully described in the firm’s ADV Part II. Results reflect reinvestment of income. Comparison of the composite to the Merrill Lynch Government Corporate 1-5 Year Index is for illustrative purposes only and the volatility of each may be materially different due to varying degrees of diversification and/or other factors. The performance of actual client accounts may vary due to client restrictions, timing of initial investment, actual fees paid and/or other factors. Past performance does not guarantee future results.1 Merrill Lynch Government Corporate 1-5 Year Index
Annualized Performance
The representative holdings are the ten largest positions held in a representative account and are subject to change without notice at WHV’s sole discretion.
All data is for the period ending December 31, 2010.
10 Years5 Years3 Years1 Year
3.70
4.174.09 4.924.57
5.31
5.255.04
5.64
4.86
4.845.26
WHV Net of Fees WHV Gross of Fees Benchmark1
For the period ending December 31, 2010
Short-to-intermediate term Fixed inCome
T W O T H O U S A N D T E N A N N U A L R E P O R T 17
Coupon Maturity
Berkshire 4.63% 10/15/13Hathaway Fin.
FHLB 3.63% 10/10/12
FNMA 4.75% 11/19/12
FHLB 4.63% 10/18/13
FFCB 3.40% 02/07/13
Wells Fargo Co. 3.75% 10/01/14
FHLMC 3.75% 03/27/19
FNMA 3.00% 03/20/14
FFCB 4.60% 03/11/19
Morgan Stanley 4.10% 01/26/15
RepResentative Holdings
The representative holdings are the ten largest positions held in a representative account and are subject to change without notice at WHV’s sole discretion.
All data is for the period ending December 31, 2010.
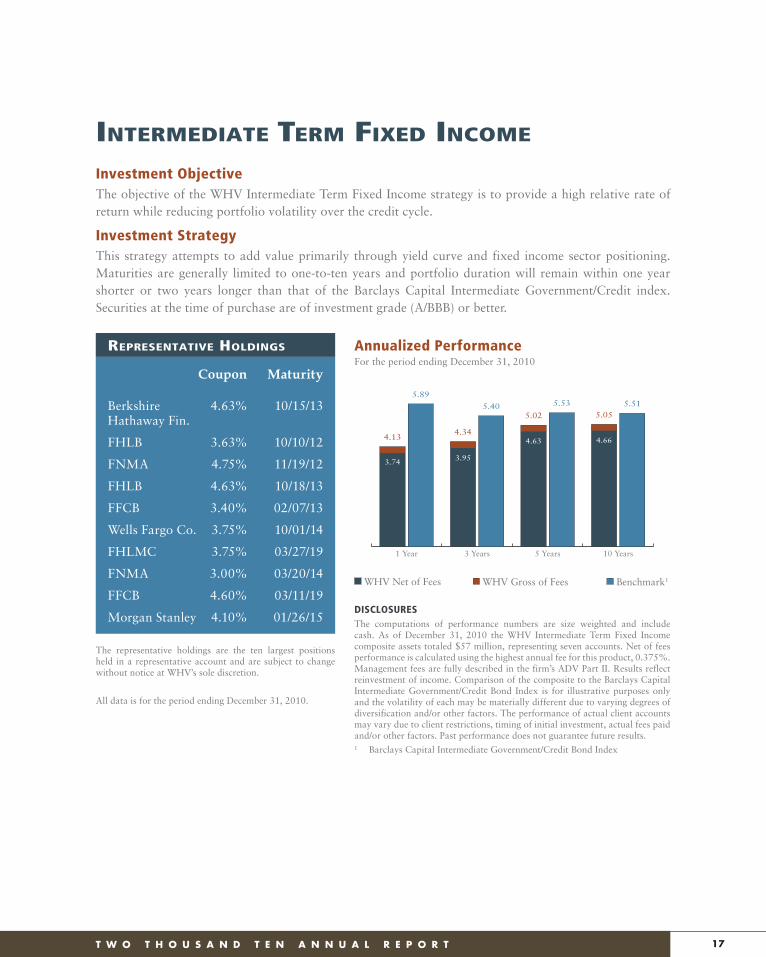
Investment ObjectiveThe objective of the WHV Intermediate Term Fixed Income strategy is to provide a high relative rate of return while reducing portfolio volatility over the credit cycle.
Investment StrategyThis strategy attempts to add value primarily through yield curve and fixed income sector positioning. Maturities are generally limited to one-to-ten years and portfolio duration will remain within one year shorter or two years longer than that of the Barclays Capital Intermediate Government/Credit index. Securities at the time of purchase are of investment grade (A/BBB) or better.
DISCLOSURESThe computations of performance numbers are size weighted and include cash. As of December 31, 2010 the WHV Intermediate Term Fixed Income composite assets totaled $57 million, representing seven accounts. Net of fees performance is calculated using the highest annual fee for this product, 0.375%. Management fees are fully described in the firm’s ADV Part II. Results reflect reinvestment of income. Comparison of the composite to the Barclays Capital Intermediate Government/Credit Bond Index is for illustrative purposes only and the volatility of each may be materially different due to varying degrees of diversification and/or other factors. The performance of actual client accounts may vary due to client restrictions, timing of initial investment, actual fees paid and/or other factors. Past performance does not guarantee future results.1 Barclays Capital Intermediate Government/Credit Bond Index
Annualized Performance
10 Years5 Years3 Years1 Year
3.74
5.89
4.13
3.95
5.40
4.344.63
5.53
5.02
4.66
5.515.05
WHV Net of Fees WHV Gross of Fees Benchmark1
For the period ending December 31, 2010
intermediate term Fixed inCome
18 L A I R D N O R T O N I N V E S T M E N T M A N A G E M E N T , I N C .
RepResentative Holdings
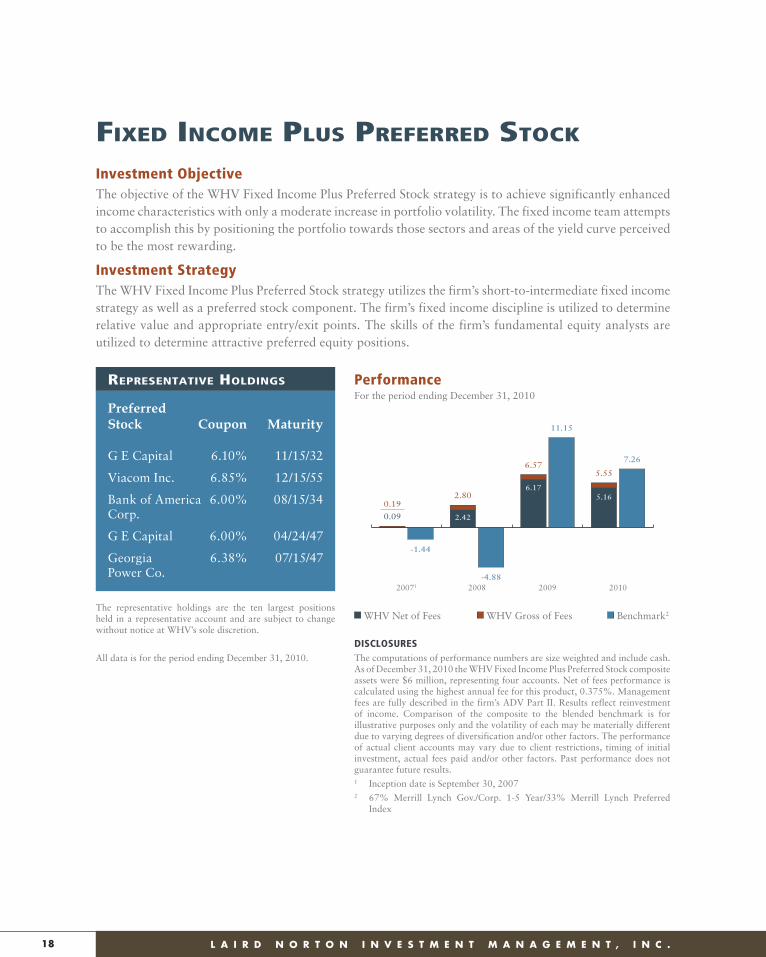
Investment ObjectiveThe objective of the WHV Fixed Income Plus Preferred Stock strategy is to achieve significantly enhanced income characteristics with only a moderate increase in portfolio volatility. The fixed income team attempts to accomplish this by positioning the portfolio towards those sectors and areas of the yield curve perceived to be the most rewarding.
Investment StrategyThe WHV Fixed Income Plus Preferred Stock strategy utilizes the firm’s short-to-intermediate fixed income strategy as well as a preferred stock component. The firm’s fixed income discipline is utilized to determine relative value and appropriate entry/exit points. The skills of the firm’s fundamental equity analysts are utilized to determine attractive preferred equity positions.
DISCLOSURESThe computations of performance numbers are size weighted and include cash. As of December 31, 2010 the WHV Fixed Income Plus Preferred Stock composite assets were $6 million, representing four accounts. Net of fees performance is calculated using the highest annual fee for this product, 0.375%. Management fees are fully described in the firm’s ADV Part II. Results reflect reinvestment of income. Comparison of the composite to the blended benchmark is for illustrative purposes only and the volatility of each may be materially different due to varying degrees of diversification and/or other factors. The performance of actual client accounts may vary due to client restrictions, timing of initial investment, actual fees paid and/or other factors. Past performance does not guarantee future results.1 Inception date is September 30, 20072 67% Merrill Lynch Gov./Corp. 1-5 Year/33% Merrill Lynch Preferred
Index
Performance
The representative holdings are the ten largest positions held in a representative account and are subject to change without notice at WHV’s sole discretion.
All data is for the period ending December 31, 2010.
20102009200820071
0.09
-1.44
0.19
2.42
-4.88
2.806.17
11.15
6.57
5.16
7.26
5.55
WHV Net of Fees WHV Gross of Fees Benchmark2
For the period ending December 31, 2010Preferred Stock Coupon Maturity
G E Capital 6.10% 11/15/32
Viacom Inc. 6.85% 12/15/55
Bank of America 6.00% 08/15/34Corp.
G E Capital 6.00% 04/24/47
Georgia 6.38% 07/15/47Power Co.
Fixed inCome pLuS preFerred StoCk

CONSOLIDATED FINANCIAL STATEMENTS

20 L A I R D N O R T O N I N V E S T M E N T M A N A G E M E N T , I N C .
LAIRD NORTON INVESTMENT MANAGEMENT, INC. AND SUBSIDIARY
CONSOLIDATED BALANCE SHEETSas of December 31, 2010 and 2009
ASSETS
CURRENT ASSETS 2010 2009
Cash and cash equivalents $22,328,706 $16,652,825
Fees receivable - billed 798,480 671,991
Fees receivable - unbilled 13,507,043 11,917,796
Other receivables 538,564 133,473
Prepaid expenses 1,021,631 935,497
Deferred income taxes 3,153,543 2,075,646
Income taxes receivable — 208,350
Investment in securities 3,095,835 2,112,453
Total current assets 44,443,802 34,708,031
FIXED ASSETS - AT COST
Furniture and equipment 1,327,614 1,325,714
Computer equipment and software 1,735,495 1,535,311
Leasehold improvements 4,095,144 4,187,838
Total fixed assets - at cost 7,158,253 7,048,863
Less accumulated depreciation (3,331,639) (2,668,422)
Net fixed assets 3,826,614 4,380,441
OTHER ASSETS
Long-term investment in affiliated entity 50,000 50,000
Goodwill 8,656,655 8,656,655
Other 985,680 888,582
Total other assets 9,692,335 9,595,237
TOTAL $57,962,751 $48,683,709
Audited financial statements and their accompanying footnotes will be provided upon request when available.

T W O T H O U S A N D T E N A N N U A L R E P O R T 21
LAIRD NORTON INVESTMENT MANAGEMENT, INC. AND SUBSIDIARY
CONSOLIDATED BALANCE SHEETSas of December 31, 2010 and 2009
LIABILITIES AND SHAREHOLDERS’ INVESTMENT
CURRENT LIABILITIES 2010 2009
Accounts payable and accrued expenses $23,591,937 $18,047,789
Current maturities of deferred compensation 144,743 137,465
Income taxes payable 1,153,331 —
Deferred rent 205,883 186,673
Total current liabilities 25,095,894 18,371,927
NONCURRENT LIABILITIES
Deferred compensation - net of current maturities 1,231,708 1,272,226
Deferred income taxes 3,152,012 3,353,158
Deferred rent 1,319,245 1,525,128
Total noncurrent liabilities 5,702,965 6,150,512
SHAREHOLDERS’ INVESTMENT
Common stock - $10 par. Authorized 200,000 shares; outstanding144,414 shares and 144,380 shares, respectively 1,444,140 1,443,800
Additional paid-in capital 2,201,462 2,163,647
Retained earnings 22,802,309 20,117,179
Accumulated other comprehensive income, net of tax effect of $462,200 and $293,865, respectively 715,981 436,644
Total shareholders' investment 27,163,892 24,161,270
TOTAL $57,962,751 $48,683,709
Audited financial statements and their accompanying footnotes will be provided upon request when available.
22 L A I R D N O R T O N I N V E S T M E N T M A N A G E M E N T , I N C .
LAIRD NORTON INVESTMENT MANAGEMENT, INC. AND SUBSIDIARY
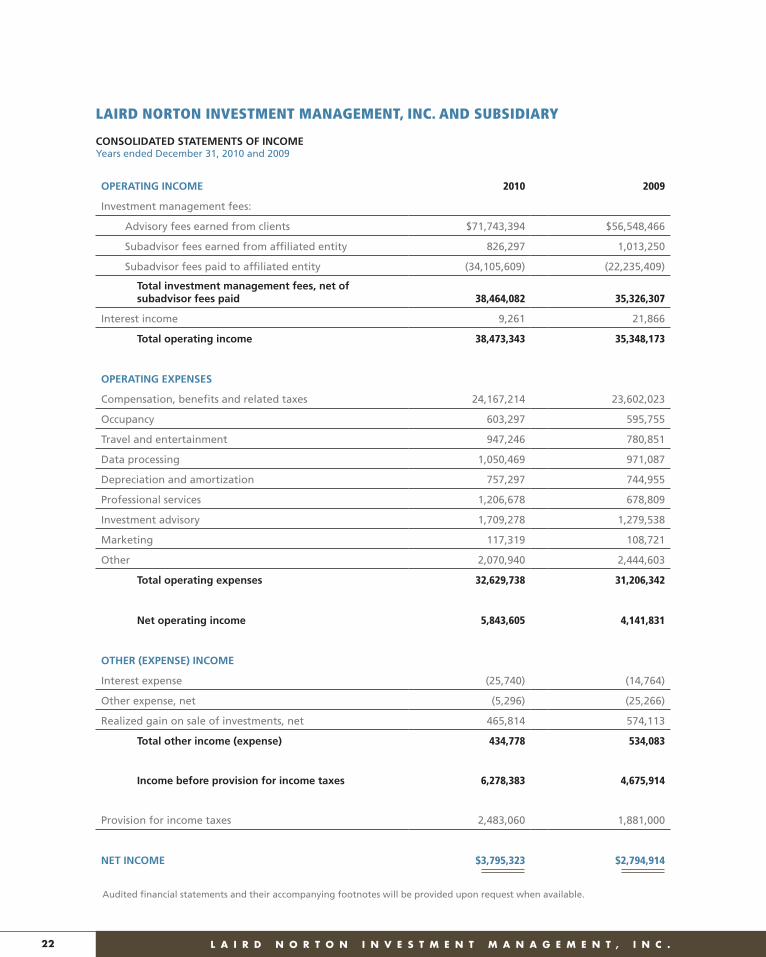
CONSOLIDATED STATEMENTS OF INCOMEYears ended December 31, 2010 and 2009
OPERATING INCOME 2010 2009
Investment management fees:
Advisory fees earned from clients $71,743,394 $56,548,466
Subadvisor fees earned from affiliated entity 826,297 1,013,250
Subadvisor fees paid to affiliated entity (34,105,609) (22,235,409)
Total investment management fees, net of subadvisor fees paid 38,464,082 35,326,307
Interest income 9,261 21,866
Total operating income 38,473,343 35,348,173
OPERATING EXPENSES
Compensation, benefits and related taxes 24,167,214 23,602,023
Occupancy 603,297 595,755
Travel and entertainment 947,246 780,851
Data processing 1,050,469 971,087
Depreciation and amortization 757,297 744,955
Professional services 1,206,678 678,809
Investment advisory 1,709,278 1,279,538
Marketing 117,319 108,721
Other 2,070,940 2,444,603
Total operating expenses 32,629,738 31,206,342
Net operating income 5,843,605 4,141,831
OTHER (EXPENSE) INCOME
Interest expense (25,740) (14,764)
Other expense, net (5,296) (25,266)
Realized gain on sale of investments, net 465,814 574,113
Total other income (expense) 434,778 534,083
Income before provision for income taxes 6,278,383 4,675,914
Provision for income taxes 2,483,060 1,881,000
NET INCOME $3,795,323 $2,794,914
Audited financial statements and their accompanying footnotes will be provided upon request when available.
T W O T H O U S A N D T E N A N N U A L R E P O R T 23
LAIRD NORTON INVESTMENT MANAGEMENT, INC. AND SUBSIDIARY
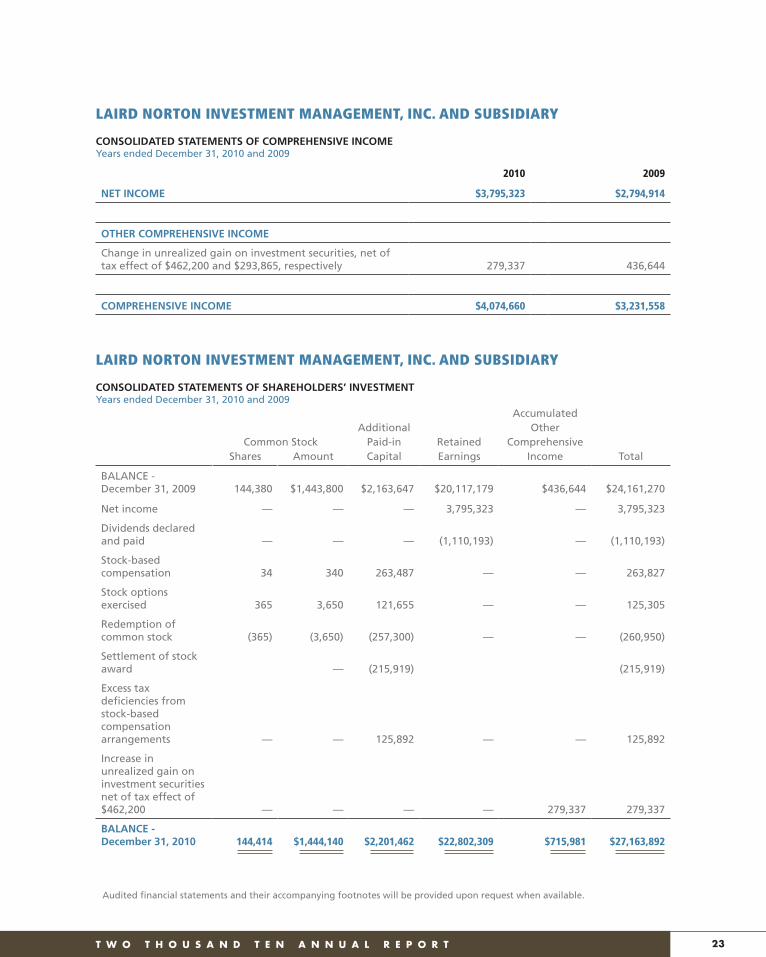
CONSOLIDATED STATEMENTS OF COMPREHENSIVE INCOMEYears ended December 31, 2010 and 2009
2010 2009
NET INCOME $3,795,323 $2,794,914
OTHER COMPREHENSIVE INCOME
Change in unrealized gain on investment securities, net of tax effect of $462,200 and $293,865, respectively 279,337 436,644
COMPREHENSIVE INCOME $4,074,660 $3,231,558
LAIRD NORTON INVESTMENT MANAGEMENT, INC. AND SUBSIDIARY
CONSOLIDATED STATEMENTS OF SHAREHOLDERS’ INVESTMENTYears ended December 31, 2010 and 2009
AccumulatedAdditional Other
Common Stock Paid-in Retained ComprehensiveShares Amount Capital Earnings Income Total
BALANCE - December 31, 2009 144,380 $1,443,800 $2,163,647 $20,117,179 $436,644 $24,161,270
Net income — — — 3,795,323 — 3,795,323
Dividends declared and paid — — — (1,110,193) — (1,110,193)
Stock-based compensation 34 340 263,487 — — 263,827
Stock options exercised 365 3,650 121,655 — — 125,305
Redemption of common stock (365) (3,650) (257,300) — — (260,950)
Settlement of stock award — (215,919) (215,919)
Excess tax deficiencies from stock-based compensation arrangements — — 125,892 — — 125,892
Increase in unrealized gain on investment securities net of tax effect of $462,200 — — — — 279,337 279,337
BALANCE - December 31, 2010 144,414 $1,444,140 $2,201,462 $22,802,309 $715,981 $27,163,892
Audited financial statements and their accompanying footnotes will be provided upon request when available.

24 L A I R D N O R T O N I N V E S T M E N T M A N A G E M E N T , I N C .
LAIRD NORTON INVESTMENT MANAGEMENT, INC. AND SUBSIDIARY
CONSOLIDATED STATEMENTS OF CASH FLOWSYears ended December 31, 2010 and 2009
CASH FLOWS FROM OPERATING ACTIVITIES 2010 2009
Net income $3,795,323 $2,794,914
Adjustments to reconcile net income to net cash provided by operating activities:
Depreciation and amortization 757,297 744,955
Stock-based compensation 263,827 423,064
Accretion of deferred compensation expense 19,611 39,052
Deferred income taxes (1,447,378) 1,395,328
Deferred compensation (52,850 (317,547)
Deferred rent (186,673) (167,463)
Realized gain on sale of investments, net (465,814) (574,113)
Excess tax benefits (deficiencies) from stock-based compensation arrangements 136,175 (23,712)
(Increase) decrease in:
Fees and other receivable (2,120,828) 207,289
Prepaid expenses (86,134) 7,619
Other assets (97,098) 125,829
Income taxes receivable/payable 1,361,681 (1,400,012)
Increase in:
Accounts payable and accrued expenses 5,544,148 676,255
Net cash provided by operating activities 7,421,287 3,931,458
CASH FLOWS FROM INVESTING ACTIVITIES
Purchases of fixed assets (203,470) (229,381)
Purchases of investments (1,582,191) (2,226,911)
Proceeds from sales of investments 1,512,295 1,369,080
Net cash used in investing activities (273,366) (1,087,212)
CASH FLOWS FROM FINANCING ACTIVITIES
Proceeds from exercised stock options 125,305 91,218
Redemption of common stock (260,950) (142,236)
Settlement of stock award (215,919) —
Dividends paid on common stock (1,110,193) (2,174,875)
Excess tax deficiencies from stock-based compensation arrangements (10,283) —
Net cash used in financing activities (1,472,040) (2,225,893)
Increase in cash and cash equivalents 5,675,881 618,353
CASH AND CASH EQUIVALENTS - beginning of year 16,652,825 16,034,472
CASH AND CASH EQUIVALENTS - end of year $22,328,706 $16,652,825
Audited financial statements and their accompanying footnotes will be provided upon request when available.

W. Kurt HauserChairman
Gary R. Severson Scott C. Altonian(Associate Director)
Steven K. Buster
Theodore H. Smyth, Jr.
Dr. C. Budd Colby
Judith R. Stevens
Richard J. Forster Jeffrey K. Romrell
Jeffery S. Vincent
MANAGEMENT TEAM
Judith R. Stevens - President and Chief Executive Office, Chair
Reiner M. Triltsch - Executive Vice President, Chief Investment Officer
Deirdre J. G. Porter - Executive Vice President, Managing Director
Jeffrey K. Romrell - Executive Vice President, Managing Director, Business Development
John A. Gagliano - Senior Vice President, Managing Director, Broker-Sponsored Programs
Pavita Fleischer - Vice President, Chief Compliance Officer
Heather L. Hall - Vice President, Managing Director, Finance and Human Resources, Corporate Secretary
Kenneth E. Piper - Vice President, Managing Director, Operations
BOARD OF DIRECTORS

SEATTLE
801 Second Avenue, Suite 1210
Seattle, Washington 98104
Tel: 800.258.1388
SAN FRANCISCO
301 Battery Street, Suite 400
San Francisco, California 94111
Tel: 800.204.2650 www.whv.com
All images in the 2010 WHV Annual Report are of WHV’s office in San Francisco, California.
Related Documents