Running Head: INDIVIDUAL DIFFERENCES IN RHYTHMIC ABILITIES 1 Who’s Got the Rhythm?: Individual Differences in Rhythmic Abilities by Ashley Perl Senior Honors Thesis Department of Psychology University of Western Ontario London, Ontario, CANADA April 2011 Thesis Advisor: Jessica Grahn, Ph.D

Welcome message from author
This document is posted to help you gain knowledge. Please leave a comment to let me know what you think about it! Share it to your friends and learn new things together.
Transcript

Running Head: INDIVIDUAL DIFFERENCES IN RHYTHMIC ABILITIES 1
Who’s Got the Rhythm?: Individual Differences in Rhythmic Abilities
by Ashley Perl
Senior Honors Thesis Department of Psychology
University of Western Ontario London, Ontario, CANADA
April 2011
Thesis Advisor: Jessica Grahn, Ph.D

INDIVIDUAL DIFFERENCES IN RHYTHMIC ABILITIES 2
Abstract
There are many different parts of music – one of them being rhythm. Though rhythm
has been examined in relation to various factors (e.g. memory), differences that occur
among individuals have never been examined as a whole. The current study will
examine a set of variables known to contribute to differences in rhythmic abilities
including: auditory short-term memory, temporal structure detection, basic timing
abilities, and musical training. Scores for these variables were determined by
performing a digit span test, duration discrimination test, Beat Alignment Test (BAT),
and musical training questionnaire, respectively. The scores from the tasks were used to
see how well they predict performance on the Rhythm Reproduction task. The rhythms
in this task varied in beat (beat based or non-beat based) and length (short, medium, or
long). Participants in this study include both male and female introductory psychology
undergraduate students from the University of Western Ontario. A 2x3 repeated
measures ANCOVA was used to analyze the relationship. The two factors included beat
and length. In addition, all other variable scores were entered as covariates. The results
revealed significant main effects for beat and length. Furthermore, a significant three-
way interaction between beat, duration discrimination, and Beat Alignment Test scores
were revealed. There was also a marginally significant four-way interaction found
between beat, Digit Span, BAT scores, and musical training. Overall, the results suggest
that beat, length, digit span, basic timing abilities, the ability to detect temporal structure,
and musical training all contribute to an overall rhythmic ability.

INDIVIDUAL DIFFERENCES IN RHYTHMIC ABILITIES 3
Acknowledgements
First and foremost, I would like to thank Dr. Jessica Grahn for her support and guidance
throughout this entire project. It was truly a pleasure to work with her. Thank you also
goes to Tram Ngyuen for her support and being able to work out ideas with her
throughout the entire year. I would also thank to thank my family and friends for their
support throughout the entire past four years. I could not have done it without them.

INDIVIDUAL DIFFERENCES IN RHYTHMIC ABILITIES 4
Who’s got the rhythm?: Individuals Differences in Rhythmic Abilities
Music production requires the ability to comprehend timing, timbre, pitch, beat,
accents (in other words, volume), and rhythm, to name a few. Rhythm is one of the key
components of music; it incorporates timing, accents, and beat within a musical piece.
Similarly, rhythmic ability refers to an individual’s ability to perceive and process timing,
accents, and a beat, within a musical context. Being able to perceive rhythm is
considered something innate. It was found that even infants could be taught to
differentiate rhythmic sequences (Phillips-Silver & Trainor, 2005). Despite the suggested
innate nature of rhythmic ability, individual differences are apparent. Rhythmic
reproduction abilities are known to be influence by different individual factors (eg. Saito,
2001). However, the collaborative contribution of these factors that contribute to
rhythmic ability have never been considered at an individual level. This study will
address the gap in the literature regarding underlying factors that contribute to individual
differences in rhythmic abilities. In other words, this study will ask the question: what
factors contribute an individual’s rhythmic ability?
A relationship between short-term memory and rhythm reproduction has been
established. For instance, it has been found that the presence of a rhythm aids memory in
facilitating recall (Silverman, 2010). Additionally, a study conducted by Saito (2001)
measured individual differences in the ability to reproduce rhythm, with respect to
memory. This study also found there is in fact a relationship between short-term memory
and rhythm reproduction– those with better short-term memories were also better at
remembering and reproducing rhythms. Thus, it can be suggested that there is
mechanism behind auditory short-term memory and rhythm reproduction.

INDIVIDUAL DIFFERENCES IN RHYTHMIC ABILITIES 5
In a musical sense, to have an understanding of timing suggests the capacity to
distinguish between two perceptual events, known as duration (Keele, Pokorny, Corcos,
& Ivry, 1985). Relationships between basic timing ability and rhythm reproduction have
been revealed. For instance, a study conducted by Keele et al. (1985) found that
participants who were able to accurately reproduce a rhythm by tapping their finger, were
also able to reproduce rhythms accurately with their foot. Some participants were overall
better at this task. This study concluded that some people were better at perceiving time
than others.
Musical training is also thought to influence individual differences in rhythmic
abilities. Past research has demonstrated that musicians are better at adapting to rhythm
reproduction tasks where unnaturally long gaps between beats were present, in
comparison to non-musicians (Repp & Doggett, 2007). Importantly, this study also
found more variability on rhythm reproduction performance within the non-musician
group than in the musician group. Thus, suggesting that musical training influences the
ability to adapt to unusual rhythmic sequences. Similarly, another study illustrated that
highly skilled piano players were better at perceptually timing rhythms than non-
musicians (Keele et al., 1985). These studies highlight that musical training does in fact
influence individual rhythmic abilities.
Another important component of rhythm is temporal structure, which refers to the
organization of musical intervals into a rhythmic sequence (Ehrlé & Samson, 2004).
These intervals can further be organized into different types of rhythms. For instance,
there are beat-based rhythms where the intervals in the musical sequence are organized
into regular integer numbers. In other words the intervals are more or less evenly spaced.

INDIVIDUAL DIFFERENCES IN RHYTHMIC ABILITIES 6
Alternatively, there are also non-beat based rhythms where the musical sequence is
organized by intervals that are non-integer numbers. Simply, the intervals are unevenly
spaced (described as metric and nonmetric rhythms in Grahn, 2009). Having the ability to
detect temporal structure means that the individual is able to distinguish what the
organization intervals are in a musical sequence. In simpler terms, this is often thought of
the ability to “feel the beat.”
Temporal structure has also been examined in relation to rhythm. A study by
Grahn and Brett (2007) examined participant’s ability to reproduce beat based and non-
beat based rhythms. It was found that beat based rhythms were reproduced more
accurately than non-beat based rhythms. This finding seems to be consistent across other
studies as well (Grahn, 2009). Additionally, it was also found that musicians are more
sensitive to detecting beat structure than non-musicians (Grahn and Rowe 2009). Thus,
training helps to influence an individual’s ability to perceive a beat, which in turn
influences how rhythm is perceived. Furthermore, neurological based findings suggest
that beat based rhythms are more easily perceived than non-beat based rhythms (Grahn,
2009). It is important to note that individual differences in the ability to detect temporal
structure have not yet been examined.
Even though rhythm has received a lot of research attention, little is known about
individual cognitive traits that contribute to an overall rhythmic aptitude. Past studies
have looked at individual differences in rhythmic abilities however, there were variables
missing that were known to be important in rhythmic ability (e.g. memory, Satio, 2005;
timing, Keele et al., 1985; musical training, Repp & Doggett, 2007). The aim of the
current study is to provide more conclusive evidence as to what individual factors

INDIVIDUAL DIFFERENCES IN RHYTHMIC ABILITIES 7
contribute to an overall rhythmic ability. More specifically, this study will examine four
factors that previous literature suggests may influence individual rhythmic abilities:
short- term auditory memory capacity, basic timing ability, temporal structure detection,
and musical training. To clarify, short-term auditory memory capacity refers to an
individual’s ability to retain auditory memories. Basic timing ability refers to an
individual’s ability to perceive and measure time in a musical sequence. Temporal
structure detection insinuates the ability to detect the structure of timing used within a
rhythm sequence. Finally, musical training refers to how much musical training an
individual has received. These four factors will be analyzed to help determine which
factor, or combination of factors, best predict an individual’s overall rhythmic ability.
Participants in the current study will be required to complete an Auditory Digit
Span test, Duration Discrimination test, Beat Alignment test, and a Musical Training
Questionnaire. These tests determine individual scores for the four predictor factors:
auditory short-term memory, basic timing abilities, the ability to detect temporal
structure, and musical training, respectively (see Table 1 for clarification). Additionally
participants are required to complete a Rhythm Reproduction Test which determine each
participants ability to reproduce rhythms. All predictor variables were used to predict
performance on the rhythm reproduction task.
Analysis of the previous literature suggests that there should be underlying
individual differences in rhythmic ability. Based on previous findings, five different
hypotheses can be generated: 1) those with a better auditory short-term memory will also
be better at rhythm reproduction; 2) those who demonstrate the ability to detect temporal
structure will also be better at reproducing rhythms, when a beat based rhythm is present;

INDIVIDUAL DIFFERENCES IN RHYTHMIC ABILITIES 8
3) there will be a relationship between auditory short-term memory and rhythm length; 4)
those with basic timing abilities will be overall better at reproducing rhythms; and finally
5) musical training will influence overall abilities to reproduce rhythms.
Table 1.
Predictor factors and tests used to assess them.
Predictor Factor Test
Short-term Auditory Memory Auditory Digit Span Test
Basic Timing Abilities Duration Discrimination Test
Ability to detect Temporal Structure Beat Alignment Test
Musical Training Musical Training Questionnaire
Method
Participants
Thirty-three participants took part in the study (16 females, 17 males).
Participants ranged from 18 to 20 years old (M = 18.33, SD = 0.60). All participants
were undergraduate students enrolled in the introductory psychology course at the
University of Western Ontario and received academic credit for their participation in this
study.
Materials
Participants were required to complete five separate tasks: digit span test, duration
discrimination test, Beat Alignment Task (BAT), Rhythm Reproduction Test (RRT), and
a musical training questionnaire. All tests, with the exception of the musical training
questionnaire, were performed on a PC laptop using E-prime software (2.0).

INDIVIDUAL DIFFERENCES IN RHYTHMIC ABILITIES 9
Digit span test. The digit span test presented was a standard auditory digit span
test. Each participant was presented with a string of digits and asked to repeat the digits
back to the experimenter. The number of digits increased in a sequential manner, and
there were two versions of each possible sequence length. Participants continued with
new trials until they either successfully repeated two nine-digit sequences or got both
trials of a shorter digit sequences wrong. Digit span is defined as the number of digits at
which a participant can successfully recall in one trial.
Duration discrimination test. The duration discrimination test assessed
participants basic timing abilities. This standard duration discrimination test presented
participants with trials containing a standard tone and a target tone. The standard tone
was held constant at 100ms, whereas the target tone varied in length from 35ms to
165ms. Participants were to determine if the target tone was longer or shorter than the
standard tone. Each participant completed 10 different trials that were randomly repeated
over four cycles in the duration discrimination test. Participants were given 10 practice
trials before data was actually recorded to ensure that they completely understood the
task.
Beat Alignment Test. The Beat Alignment Test (BAT) (Iversen & Patel, 2008)
determines participants ability to detect temporal structure. The test has participants
determine if a series of beeps superimposed over a song are “on” or “off” beat. There are
two possible “off” beat conditions: one where the beeps are consistently early or late, and
the other where the time interval between beeps are too short or too long (with respect to
the beat of the music). For further details see Iversen and Patel (2008). Participants were
randomly assigned to one of two groups. For each song, one group received an on beat

INDIVIDUAL DIFFERENCES IN RHYTHMIC ABILITIES 10
version and two off beat versions: one where the beep interval was consistently too fast
or too slow, and one where the beep interval was shorter or longer than the beep interval.
The other group received the on beat trial as well as the two off beat trials not presented
to the first group, for each song. In total, there were 12 songs, with three different
versions of each, thus each participant was exposed to 36 different trials. Participants
were given a sample of what the beeps would sound like prior to the first task.
Rhythm Reproduction Test. The Rhythm Reproduction test required
participants to listen to a rhythm and tap it back using the space bar on the keyboard.
Rhythms differed in Length; either short, medium, or long; and in Beat; either beat based
or non-beat based rhythms. Each participant heard eight short, eight medium, and eight
long rhythm sequences for both regular and non-regular beat patterns. Thus, each
participant completed 48 trials on the Rhythm Reproduction Test. All rhythms were
presented twice to allow participants to comprehend the entire rhythmic sequence before
asking participants to reproduce it. This was done in light of a study done by Grahn
(unpublished data), where it was found that the non-beat based rhythms were too difficult
to reproduce after only hearing them once. Participants could practice examples for the
short, medium, and long lengths, as well as rhythms with a regular beat and those lacking
a regular beat before data were actually collected.
Procedure
Prior to completing any of the tasks, participants were given a letter of
information and asked to sign a form indicating their consent to partake in the study.
Following consent, participants were asked to try out the head phones to ensure that they

INDIVIDUAL DIFFERENCES IN RHYTHMIC ABILITIES 11
fit properly and the volume was at comfortable level by having them listen to a novel
song.
Once set up, the digit span test was administered. The experimenter sat across
from the participant and recorded the responses to the digit span. Following the digit
span test, the duration discrimination test was administered. Upon completion of the
duration discrimination test, the Beat Alignment Test, and Rhythm reproduction tests
were administered, respectively. Following the completion of these tests, participants
were required to complete a musical training questionnaire (Appendix). At the end of the
questionnaire, participants were debriefed about the study.
Statistical Analyses
A 2x3 repeated measures ANCOVA was be used to analyze the rhythm
reproduction data collected. Each participant’s scores from the digit span test, duration
discrimination test, Beat Alignment Test, and musical training questionnaire were entered
as covariates. In addition, the ANCOVA included the factors Length (short, medium,
long) and Beat (beat and non-beat) from the Rhythm Reproduction Test. All tests were
conducted at α = .05 confidence level. Data were analyzed using SPSS and Microsoft
Excel software.
Results
The average scores on each of the covariates are as follows: mean Digit Span
score = 6.94 (SD = 1.39), mean Duration Discrimination = 0.90 (SD = 0.05), the mean
BAT score = 0.75 (SD = 0.15), and mean years of Musical Training = 6.33 (SD = 4.46).

INDIVIDUAL DIFFERENCES IN RHYTHMIC ABILITIES 12
Mauchly’s Test of Sphericity was not significant (Length: W = 0.94, X2 (2) = .99,
p = 0.61; Beat x length: W = 0.71, X2 (2) = 5.44, p = 0.066), therefore, equal variances
can be assumed. The 2x3 repeated measures ANCOVA revealed significant main effects
for both Beat (F (1, 17) = 99.80, P < 0.001) and Length (F (2, 34) = 55.15, p < 0.001).
For mean performance for Beat based and Non-beat based conditions at all three lengths
see Figure 1. The interaction between Beat and Length was also found to be significant
(F = 55.15, p < 0.001). In light of this significant interaction, the main effects of Beat
and Length should be interpreted with caution. In general, it is clear that Beat based
rhythms are reproduced more accurately than Non-beat based rhythms, and that the
shorter a Beat based rhythm is, the greater accuracy that was observed. The effect of
Length, although present, is not as pronounced for the Non-beat rhythms.
Figure 1. Effect of beat and length on rhythm reproduction accuracy. M+SD of portion
correct is represented for beat based and non-beat based rhythms that were short
medium or long.
Significant main effects and 2-way interactions were found with the four
covariates (see Table 2 for a complete list of significant effects), however, they occurred
0
0.2
0.4
0.6
0.8
1
Short Medium Long Rhy
thm
Rep
ordu
ctio
n A
ccur
acy
(Pro
port
ion
Cor
rect
)
Effect of Beat and Length
Beat
Nonbeat

INDIVIDUAL DIFFERENCES IN RHYTHMIC ABILITIES 13
in light of 3-way or 4-way interactions, and therefore will be not be described in further
detail than that presented in Table 2. The significant three-way interaction was found
between Beat, Duration Discrimination scores, and BAT scores (F (1, 17) = 5.23, p =
0.035). To examine the nature of the interaction, correlations were computed for 2
groups, created by a median split of the data into high BAT (n = 17) and low BAT (n =
16) groups. For Beat based rhythms, the high BAT groups correlation between Duration
Discrimination and rhythm performance is similar to the low BAT groups (high BAT r =
.48, low BAT r = .30; Figure 2). For the Non-beat based rhythm, the high BAT
correlation is still high (r = .50) whereas the low BAT groups’ correlation is near zero (r
= -.04), as shown in Figure 3. In other words, for participants with a high BAT score, as
their performance on the Duration Discrimination task increases, so does their ability to
reproduce rhythms. For high BAT score individuals, this is true of both Beat based and
Non-beat based rhythms. For participants with low BAT scores, this relationship is only
true in the Beat based conditions, whereas, this relationship disappears in the Non-beat
based conditions.
Table 2.
Significant Main Effects and Interactions of Beat, Length, Digit Span (DS), Duration
Discrimination (DD), Beat Alignment Scores (BAT), and Musical Training (MT) in light
of the (a) four-way interaction and (b) three-way interaction.
Effect Degrees of freedom F-value p-value
Beat x DS(a) 1, 34 7.07 0.017
Beat x BAT(a), (b) 1, 34 6.73 0.019
DS(b) 1, 17 4.43 0.050

INDIVIDUAL DIFFERENCES IN RHYTHMIC ABILITIES 14
BAT(a), (b) 1, 17 5.24 0.035
MT x DS(b) 1, 17 5.18 0.036
MT x DS x BAT(b) 1, 17 4.72 0.044
Figure 2. Effect of duration discrimination accuracy on rhythm reproduction accuracy for
beat based rhythms. Each point represents an individual participant score. Participants
were dived by the median into high BAT score and low BAT score groups. Correlations
were calculated for the high and low BAT score groups.
Figure 3. Effect of duration discrimination accuracy on rhythm reproduction accuracy for
0
0.2
0.4
0.6
0.8
1
0.6 0.7 0.8 0.9 1 1.1
Rhy
thm
repr
oduc
tion
accu
racy
(P
ropo
rtio
n C
orre
ct)
Duration discrimination accuracy (proportion correct)
Beat
High BAT
Low BAT
High BAT (r = .48)
Low BAT (r = .31)
0
0.2
0.4
0.6
0.8
1
0.6 0.7 0.8 0.9 1 1.1
Rhy
thm
repr
oduc
tion
accu
racy
(P
ropo
rtio
n C
orre
ct)
Duration discrimination accuracy (proportion correct)
Nonbeat
High BAT
Low BAT
High BAT (r = .50)
Low BAT (r = -.04)

INDIVIDUAL DIFFERENCES IN RHYTHMIC ABILITIES 15
non-beat based rhythms. Each point represents an individual participant score.
Participants were dived by the median into high BAT score and low BAT score groups.
Correlations were calculated for the high and low BAT score groups.
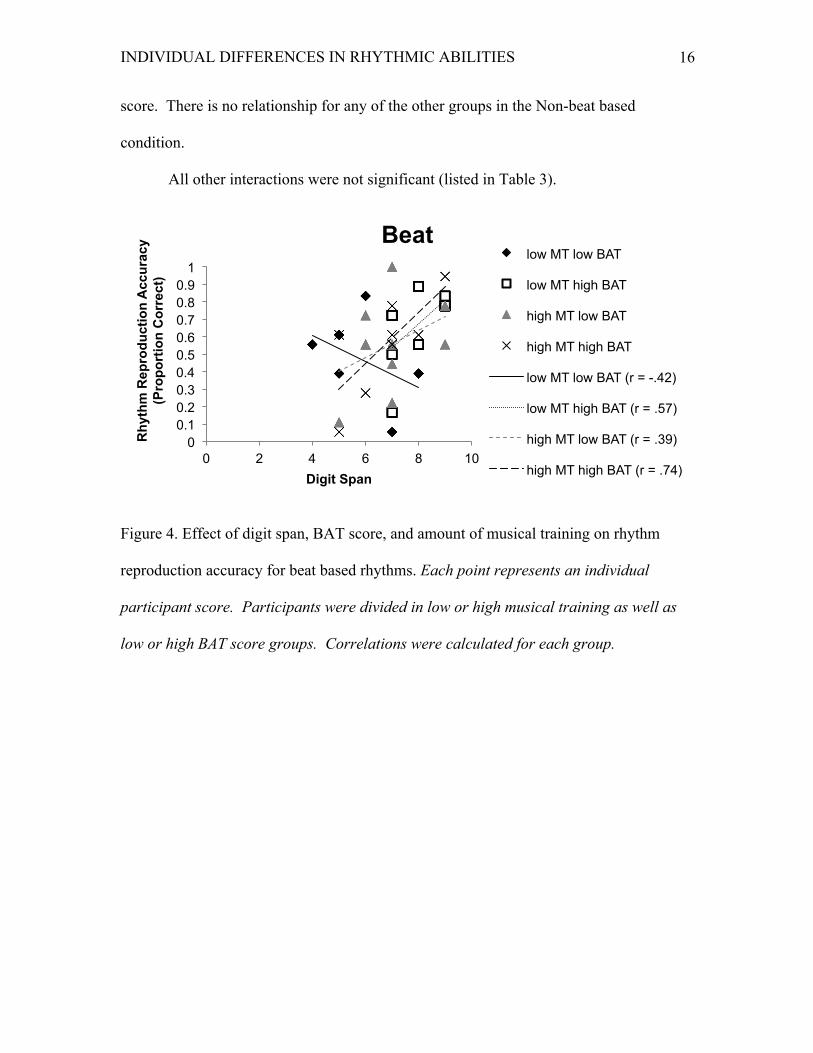
A marginally significant four-way interaction between Beat, Musical Training,
Digit Span, and BAT scores was also revealed (F (1, 17)= 4.17, p = 0.057). To illustrate
the nature of this marginally significant 4-way interaction, participants were divided into
four groups: low Musical Training, low BAT (n = 6); low Musical Training, high BAT (n
= 9); high Musical Training, low BAT (n = 10); as well as high Musical Training, high
BAT (n = 8). For the Beat based rhythms, the correlation between rhythm reproduction
and Digit Span (Figure 4) for the low Musical Training, low BAT group was much lower
than the correlation between Rhythm Reproduction accuracy and Digit Span for the other
three groups (r = -0.42, compared to low Musical Training, high BAT r = 0.57; high
Musical Training, low BAT r = 0.39; and high Musical Training, high BAT, r = 0.74,).
For Non-beat based rhythms (Figure 5), the high Musical Training, high BAT group
retained a high correlation between rhythm reproduction and Digit Span (r = 0.76).
However, the other three groups showed low or negative correlations (low Musical
Training, low BAT, r = -0.60; low Musical Training, high BAT, r = -0.10; and high
Musical Training, low BAT, r = 0.09). In the Beat based rhythms, those who have either
high Musical Training or a high BAT score display the relationship that as Digit Span
increases, so does performance on the Rhythm Reproduction task. However, if a low
Musical Training and a low BAT score are displayed, then there is no relationship
between Digit Span and Rhythm Reproduction. In the Non-beat condition, this
relationship only remains true for those with both high Musical Training and high BAT
INDIVIDUAL DIFFERENCES IN RHYTHMIC ABILITIES 16
score. There is no relationship for any of the other groups in the Non-beat based
condition.
All other interactions were not significant (listed in Table 3).
Figure 4. Effect of digit span, BAT score, and amount of musical training on rhythm
reproduction accuracy for beat based rhythms. Each point represents an individual
participant score. Participants were divided in low or high musical training as well as
low or high BAT score groups. Correlations were calculated for each group.
0 0.1 0.2 0.3 0.4 0.5 0.6 0.7 0.8 0.9
1
0 2 4 6 8 10
Rhy
thm
Rep
rodu
ctio
n A
ccur
acy
(Pro
port
ion
Cor
rect
)
Digit Span
Beat low MT low BAT
low MT high BAT
high MT low BAT
high MT high BAT
low MT low BAT (r = -.42)
low MT high BAT (r = .57)
high MT low BAT (r = .39)
high MT high BAT (r = .74)

INDIVIDUAL DIFFERENCES IN RHYTHMIC ABILITIES 17
Figure 4. Effect of digit span, BAT score, and amount of musical training on rhythm
reproduction accuracy for non-beat based rhythms. Each point represents an individual
participant score. Participants were divided in low or high musical training as well as
low or high BAT score groups. Correlations were calculated for each group.
Table 3.
Main Effects Interactions of Beat, Length, Digit Span (DS), Duration Discrimination
(DD), Beat Alignment Scores (BAT), and Musical Training (MT) that were not
significant.
Effect Degrees of
freedom
F-value p-value
Beat x Length x MT 2, 34 0.37 0.695
Beat x Length x DS 2, 34 0.24 0.791
Beat x Length x DD 2, 34 0.04 0.960
Beat x Length x BAT 2, 34 1.04 0.365
0 0.1 0.2 0.3 0.4 0.5 0.6 0.7 0.8 0.9
1
0 2 4 6 8 10
Rhy
thm
Rep
ordu
ctio
n A
ccur
acy
(Pro
port
ion
Cor
rect
)
Digit Span
Nonbeat low MT low BAT
low MT high BAT
high MT low BAT
high MT high BAT
low MT low BAT (r = -.60)
low MT high BAT (r =-.10)
high MT low BAT (r = .09)
high MT high BAT (r =.76)

INDIVIDUAL DIFFERENCES IN RHYTHMIC ABILITIES 18
Beat x Length x MT x DS 2, 34 0.85 0.438
Beat x Length x MT x DD 2, 34 0.19 0.826
Beat x Length x MT x BAT 2, 34 1.19 0.316
Beat x Length x DS x DD 2, 34 0.78 0.467
Beat x Length x DS x BAT 2, 34 0.28 0.761
Beat x Length x DD x BAT 2, 34 0.46 0.634
Beat x Length x MT x DS x DD 2, 34 0.91 0.414
Beat x Length x MT x DS x BAT 2, 34 1.96 0.156
Beat x Length x DS x DD x BAT 2, 34 1.03 0.367
Beat x Length x MT x DD x BAT 2, 34 0.07 0.931
Beat x Length x MT x DS x DD x BAT 2, 34 0.42 0.661
Beat x MT 1, 17 0.72 0.408
Beat x DD 1, 17 3.05 0.099
Beat x MT x DS 1, 17 3.73 0.070
Beat x MT x DD 1, 17 0.60 0.449
Beat x MT x BAT 1, 17 1.02 0.328
Beat x DS x DD 1, 17 2.18 0.159
Beat x DS x BAT 1, 17 0.41 0.532
Beat x MT x DS x DD 1, 17 0.17 0.682
Beat x DS x DD x BAT 1, 17 0.11 0.741
Beat x MT x DD x BAT 1, 17 2.15 0.161
Beat x MT x DS x DD x BAT 1, 17 0.01 0.931
Length x MT 2, 34 1.25 0.298

INDIVIDUAL DIFFERENCES IN RHYTHMIC ABILITIES 19
Length x DS 2, 34 0.33 0.718
Length x DD 2, 34 0.85 0.438
Length x BAT 2, 34 0.03 0.966
Length x MT x DS 2, 34 1.63 0.211
Length x MT x DD 2, 34 0.02 0.980
Length x MT x BAT 2, 34 0.05 0.947
Length x DS x DD 2, 34 0.58 0.565
Length x DS x BAT 2, 34 0.07 0.930
Length x DD x BAT 2, 34 0.37 0.692
Length x MT x DS x DD 2, 34 0.45 0.642
Length x MT x DS x BAT 2, 34 0.56 0.578
Length x DS x DD x BAT 2, 34 1.48 0.242
Length x MT x DD x BAT 2, 34 0.72 0496
Length x MT x DS x DD x BAT 2, 34 2.37 0.108
MT 1, 17 4.28 0.054
DD 1,17 2.39 0.141
MT x DD 1,17 0.04 0.840
MT x BAT 1, 17 2.76 0.115
DS x DD 1, 17 0.83 0.374
DS x BAT 1, 17 1.17 0.294
DD x BAT 1, 17 3.43 0.081
MT x DS x DD 1, 17 0.01 0.908
DS x DD x BAT 1, 17 0.49 0.495

INDIVIDUAL DIFFERENCES IN RHYTHMIC ABILITIES 20
MT x DD x BAT 1, 17 1.91 0.184
MT x DS x DD x BAT 1, 17 0.78 0.391
Discussion
This study examined individual differences in the ability to reproduce rhythms.
Specifically, this study considered individual differences in auditory STM, basic timing
abilities, temporal structure detection, and musical training in the ability to reproduce
rhythms. These rhythms varied by either being beat based or non-beat based, as well as
in length, where they were short, medium, or long. Findings from this study suggest that
there is support for hypothesis 2), in that having the ability to detect temporal structure
increases the ability to reproduce rhythms when a beat is present. There was also some
support for hypotheses 1) auditory short-term memory influences rhythm reproduction; 4)
possessing basic timing abilities influence rhythm reproduction abilities; and 5) musical
training enhances rhythm reproduction skills. However, findings from this study do not
directly support hypothesis 3), there is no direct link between auditory short-term
memory and rhythm reproduction abilities, specifically for the reproduction of longer
rhythms.
It appears that auditory short-term memory, basic timing abilities, and musical
training all influence rhythm reproduction in combination with one another in a number
of different ways. First, it was found that the ability to reproduce both beat based and
non-beat based rhythms increased as basic timing abilities increased, but only for those
who had a strong ability to detect temporal structure. This is consistent with previous
findings that those with basic timing abilities perform better on rhythm reproduction tasks
(Keele et al., 1985). Similarly, this is consistent with the finding that rhythms with a

INDIVIDUAL DIFFERENCES IN RHYTHMIC ABILITIES 21
beat-based temporal structure are more easily reproduced than those that are non-beat
based (Grahn & Brett, 2007). However, these findings also add to the literature by
suggesting that there are additional influences of individual differences in the ability to
detect temporal structure. It should be noted, that this relationship was also present for
those with a less robust ability to detect temporal structure. However, this was only true
for beat based rhythms and the relationship was not as robust. This finding contributes to
the literature suggesting that non-beat based rhythms can be reproduced more accurately
by those that have both good basic timing abilities and a good ability to detect temporal
structure.
Secondly, it was found that those with a strong ability to detect temporal
structure, or those who had some sort of musical training, were better at reproducing beat
based rhythms. For those participants, rhythm reproduction accuracy increased as short-
term auditory memory ability increased. This was also true for non-beat based rhythms,
but only for participants who had both had a large amount of musical training and a good
ability to detect temporal structure. This finding is consistent with previous literature that
suggests short-term auditory memory, musical training, and the ability to detect temporal
structure all influence rhythm reproduction ability (Saito, 2001; Repp & Doggett, 2007;
Keele et al. (1985); respectively). However, it has not been considered until now that
these factors may interact and influence each other in a way that is represented here.
These findings also suggest that having certain skills, such as musical training and the
ability to detect temporal structure, may actually help in reproducing non-beat based
rhythms. It has been found that reproduction performance of complex rhythm patterns
(Snyder, Hannon, Large, & Christiansen, 2006) or non-beat based rhythms is generally

INDIVIDUAL DIFFERENCES IN RHYTHMIC ABILITIES 22
poor. However, other studies also suggest that having musical training may help to
improve the ability to reproduce non-beat based rhythms. For example, it was found that
individuals who had musical training in percussion were better at reproducing non-beat
based rhythms than non-musicians or other instrumentalists. Additionally, the same
study found that musical training as well as working memory account for a large amount
of variance in rhythm reproduction (Ehrlé & Samson, 2005), which is consistent with the
present results.
In addition, it was found that the presence of a beat influences overall rhythm
reproduction ability. More specifically, beat-based rhythms were easily reproduced,
whereas non-beat based rhythms were hardly ever reproduced correctly. This is
consistent with previous findings that proposed beat-based rhythms are more easily
perceived than non-beat based rhythms (Grahn & Brett, 2007). Thus, even though there
are cases where some individuals, provided they have certain abilities, can reproduce
non-beat based rhythms, they are still not as accurately reproduced as rhythms with a
beat.
Despite a suspected direct relationship between ability to produce longer rhythms
length and auditory short-term memory ability, no such pattern was revealed. Although,
auditory short-term memory ability does not appear to interact with the ability to produce
longer rhythms sequences, there is an effect of length – as a rhythm gets longer,
reproduction accuracy declines. This finding is consistent with previous studies (Ehrlé &
Samson, 2005).
Overall, these findings suggest that the rhythm reproduction ability is influenced
by auditory short-term memory, basic timing abilities, the ability to detect temporal

INDIVIDUAL DIFFERENCES IN RHYTHMIC ABILITIES 23
structure, and musical training ability, as well as the beat type and length of the rhythm
presented. This study also suggests that there are individual differences in the ability to
detect temporal structure in a rhythm sequence, which has never been directly examined
before. The individual differences of rhythmic ability have never been considered in
combination with each other. The individual differences approach used here was able to
demonstrate not only that individual factors affect rhythmic ability, but that these factors
interact and influence each other.
These research findings should be considered in the context of three limitations
that should be noted. First, due to constraints on resources, only thirty-three participants
could be included in this study. Including more participants in this study would have
helped to clarify the relationships found; especially the marginally significant interaction
between beat, short-term auditory memory, temporal structure detection, and musical
training. Second, all participants from the study were from an introductory psychology
course, thus the sample is only representative of junior undergraduate students. Lastly,
even though it was demonstrated that non-beat based rhythms are reproduced more
accurately by individuals with good basic timing abilities, the ability to detect temporal
structure, and musical training, performance was still overall poor. This could be due to
the fact that reproduction of the non-beat based rhythms is so difficult that there may not
be a correlation, and the results are simply revealing a floor effect.
Future research in this area should look to consider a variety of factors that were
not considered here. For starters, if this study was to be replicated, a larger and more
diverse sample could help to further distinguish the trends represented here.
Additionally, it would be interesting to take into consideration the type of musical

INDIVIDUAL DIFFERENCES IN RHYTHMIC ABILITIES 24
training that each individual has received, such as formal or self-taught, as well as what
instrument each participant plays, as was done in Ehrlé and Samson’s (2005) study. This
would further help to distinguish the influence that musical training has on rhythm
reproduction abilities. Finally, it would be interesting to look at if practice could
diminish the ceiling effect found in reproduction of non-beat based rhythms. If so, this
relationship could be further examined to determine which other factors influence
individuals ability to learn non-beat based rhythms as well as individual differences in the
speed of learning the non-beat based rhythms.

INDIVIDUAL DIFFERENCES IN RHYTHMIC ABILITIES 25
References
E-Prime (Version 2.0) [Computer software]. Sharpsburg, PA: Psychology Software
Tools.
Ehrlé, N& Samson, S. (2005). Auditory discrimination of anisochrony: influence of the
Tempo and musical background of listeners. Brain and Cognition, 58, 133-147.
Grahn, J. (2009). The role of the basal ganglia in beat perception. Annals of the New York
Academy of Sciences,1169, 35-45.
Grahn, J. Unpublished Data. Pilot studies in rhythm reproduction ability.
Grahn, J. A., & Brett, M. (2007). Rhythm and beat perception in motor areas of the brain.
Journal of Cognitive Neuroscience, 19(5), 893-906.
Grahn, J. A., & Rowe, J. B. (2009). Feeling the beat: Premotor and striatal interactions in
musicians and nonmusicians during beat perception. The Journal of
Neuroscience, 29(23), 7540-7548.
Iversen, J. R., & Patel, A.D. (2008). The Beat Alignment Test (BAT): Surveying beat
processing abilities in the general population. In Proceedings of the 10th
International Conference on Music Perception and Cognition (ICMPC 10).
Sapporo, Japan.
Keele, S. W., Pokorny, R. A., Corcos, D. M., & Ivry, R. (1985). Do perception and motor
production share common timing mechanisms: A correlational analysis. Acta
Psychologica.Special Issue: Action, Attention and Automaticity, 60(2-3), 173-191.
Phillips-Silver, J., & Trainor, L. J. (2005). Feeling the beat: Movement influences infant
rhythm perception. Science, 308(5727), 1430-1430.
Repp, B. H., & Doggett, R. (2007). Tapping to a very slow beat: A comparison of

INDIVIDUAL DIFFERENCES IN RHYTHMIC ABILITIES 26
musicians and nonmusicians. Music Perception, 24(4), 367-376.
Saito, S. (2001). The phonological loop and memory for rhythms: An individual.
differences approach. Memory, 9(4-6), 313-322.
Silverman, J. (2010) The effect of pitch, rhythm, and familiarity on working memory and
anxiety. Journal of Music Therapy, 47(1), 70-83.
Snyder, J, Large, E, & Christiansen, M. (2006). Synchronization and continuation tapping
to complex meters. Music Perception, 24(2), 135-146.
Related Documents


