1 WHOLE RANGE BEHAVIOUR OF RESTRAINED REINFORCED CONCRETE BEAMS AND FRAMES IN FIRE A thesis submitted to The University of Manchester for the degree of Doctor of Philosophy in the Faculty of Science and Engineering 2017 Sherwan M.Z. Izzaddin Albrifkani School of Mechanical, Aerospace and Civil Engineering

Welcome message from author
This document is posted to help you gain knowledge. Please leave a comment to let me know what you think about it! Share it to your friends and learn new things together.
Transcript
1
WHOLE RANGE BEHAVIOUR OF RESTRAINED
REINFORCED CONCRETE BEAMS AND FRAMES
IN FIRE
A thesis submitted to The University of Manchester for the degree of
Doctor of Philosophy
in the Faculty of Science and Engineering
2017
Sherwan M.Z. Izzaddin Albrifkani
School of Mechanical, Aerospace and Civil Engineering

2
CONTENTS
CONTENTS ................................................................................................................. 2
LIST OF TABLES ....................................................................................................... 5
LIST OF FIGURES ..................................................................................................... 7
NOTATION ............................................................................................................... 14
ABBREVIATION ...................................................................................................... 17
ABSTRACT ............................................................................................................... 18
DECLARATION ....................................................................................................... 20
COPYRIGHT ............................................................................................................. 21
DEDICATION ........................................................................................................... 22
ACKNOWLEDGEMENTS ....................................................................................... 23
LIST OF PUBLICATIONS ....................................................................................... 24
CHAPTER 1- INTRODUCTION ........................................................................... 25
1.1 Introduction ...................................................................................................... 25
1.2 Originality and Objectives of the Research ...................................................... 26
1.3 Thesis Structure ................................................................................................ 27
CHAPTER 2- LITERATURE REVIEW ............................................................... 29
2.1 Introduction ...................................................................................................... 29
2.2 Design for Fire Resistance ............................................................................... 29
2.3 Structural Response to Fire .............................................................................. 31
2.4 Behaviour of RC Beams in Fire ....................................................................... 34
2.4.1 Simply Supported RC beams (Axially and Rotationally Unrestrained at
Ends) ................................................................................................................... 34
2.4.2 Axially Restrained RC Beams ................................................................... 35
2.4.3 Rotationally Restrained RC Beams ........................................................... 36
2.4.4 Axially and Rotationally Restrained RC Beams ....................................... 38
2.5 RC Frames in Fire ............................................................................................ 41
2.6 Concrete Spalling ............................................................................................. 46
2.7 Catenary Action ................................................................................................ 48
3
2.8 Simplified Calculation Methods of RC Beams in Fire ..................................... 56
2.9 Numerical Finite Element Models ................................................................... 57
2.10 Summary of Literature Review and Research Originality ............................. 59
CHAPTER 3- EXPLICIT MODELLING OF LARGE DEFLECTION
BEHAVIOUR OF RESTRAINED REINFORCED CONCRETE BEAMS IN
FIRE .......................................................................................................................... 61
3.1. Introduction ..................................................................................................... 61
3.2. Development of the Explicit Modelling Methodology ................................... 62
3.2.1 Brief Introduction to the Tests by Yu and Tan (2013) and Yu And Tan
(2014) .................................................................................................................. 62
3.2.2 Element Type, Boundary Conditions and Load Application ..................... 65
3.2.3 Material Constitutive Models .................................................................... 66
3.2.3.1. Concrete .............................................................................................. 66
3.2.3.2 Steel Reinforcement ............................................................................. 69
3.2.4 Mesh Sensitivity ........................................................................................ 70
3.2.5 Introduction to Dynamic Explicit Modelling............................................. 71
3.2.6 Reducing Computational Cost ................................................................... 72
3.2.6.1 Load Factoring ..................................................................................... 73
3.2.6.2 Material Damping ................................................................................ 76
3.2.6.3 Mass Scaling ........................................................................................ 78
3.2.7 Validation Against the Test Results of Yu and Tan (Yu and Tan, 2013, Yu
and Tan, 2014) .................................................................................................... 82
3.3 Comparison and Application of the Finite Element Model to RC Sructures in
Fire .......................................................................................................................... 92
3.3.1 Comparison Against the Fire Tests of Dwaikat and Kodur (Dwaikat and
Kodur, 2009a, Dwaikat, 2009)............................................................................ 92
3.4 Preliminary Investigation of the Large Deflection Behaviour of Axially
Restrained RC Beams in Fire ............................................................................... 100
3.5 Conclusions .................................................................................................... 105
CHAPTER 4- BEHAVIOUR OF AXIALLY AND ROTATIONALLY
RESTRAINED REINFORCED CONCRETE BEAMS IN FIRE ..................... 106
4.1 Introduction .................................................................................................... 106
4.2 Simulation Methodology ................................................................................ 106

4
4.3 Case Studies ................................................................................................... 111
4.4 Beams with Symmetrical End Boundary Restraints ...................................... 111
4.4.1 Effect of End Rotational Restraint ........................................................... 111
4.4.1.1 Results and Discussions ..................................................................... 112
4.4.1.2 Effects of Rotational Restraint on Bending Resistance Limit Time .. 115
4.4.1.3 Effects of End Rotational Restraint on Beam Ultimate Failure Time 123
4.4.2 Effects of Changing Axial Restraint Stiffness ......................................... 126
4.4.3 Effects of Changing Beam Load Ratio .................................................... 128
4.4.4 Axially Unrestrained Beams .................................................................... 129
4.5 Beams with Asymmetrical End Boundary Restraints .................................... 133
4.5.1 Results and Discussions ........................................................................... 134
4.6 Conclusions .................................................................................................... 143
CHAPTER 5- DEVELOPMENT OF A SIMPLIFIED METHOD FOR
ANALYSIS OF AXIALLY AND ROTATIONALLY RESTRAINED
REINFORCED CONCRETE BEAMS IN FIRE ................................................ 147
5.1Introduction ..................................................................................................... 147
5.2 Key Features of Restrained Beam Behaviour ................................................ 147
5.3 Representative Beam Model .......................................................................... 151
5.4 Development of a Simplified Model .............................................................. 152
5.4.1 Beam Deflection Profile .......................................................................... 153
5.4.2 Simplified Structural Analysis Procedure................................................ 158
5.4.3 Compatibility and Equilibrium Conditions.............................................. 160
5.5 Maximum Concrete Compressive Strain (εcmax,T) .......................................... 163
5.6 Beam Bending Failure Modes ........................................................................ 164
5.7 Beam Bending Resistance Time When kr≤ kr,D .............................................. 164
5.8 Assumptions in Catenary Action Stage .......................................................... 169
5.9 Beam Ultimate Resistance Time (tUR) in Catenary Action ............................ 170
5.10 Limitation of applicability ............................................................................ 173
5.11 Verification of the Simplified Model ........................................................... 173
5.12 Effects of Changing Different Beam Parameters ......................................... 178
5.13 Conclusions .................................................................................................. 184

5
CHAPTER 6- PERFORMANCE OF REINFORCED CONCRETE FRAMES
UNDER FIRE CONDITIONS .............................................................................. 187
6.1 Introduction .................................................................................................... 187
6.2 Simulation Parameters .................................................................................... 187
6.3 Parametric Study Cases .................................................................................. 193
6.4 Simulation Results and Discussions ............................................................... 195
6.5 Conclusions .................................................................................................... 213
CHAPTER 7- CONCLUSIONS AND RECOMMENDATIONS FOR FUTURE
STUDIES ................................................................................................................. 214
7.1 Introduction .................................................................................................... 214
7.2 Explicit Finite Element Modelling Methodology........................................... 214
7.3 Behaviour of Restrained RC Beams in Fire ................................................... 215
7.4 Development of a Simplified Method for Analysis of Axially and Rotationally
Restrained RC Beams in fire ................................................................................ 217
7.5 Behaviour of RC Frames in Fire .................................................................... 218
7.6 Recommendations for Future Studies ............................................................ 219
APPENDIX ............................................................................................................. 221
A1 Beam Cross-Section Bending Moment Capacity ........................................... 221
A2 Calculation of Rotational and Lateral Stiffness of Supporting Columns ....... 221
A2.1 Rotational Stiffness KR,sup ........................................................................ 221
A2.2 Lateral Stiffness KA,sup.............................................................................. 222
A3 Values of the Stiffness and Gaps for the Horizontal Restraints during the Tests
by Yu and Tan (2013) and Yu and Tan (2014) .................................................... 223
A4 Material Properties According to Eurocode ................................................... 224
A4.1 Free Thermal Strain εth ............................................................................. 224
A4.2 Instantaneous Stress-Related Strain εσ ..................................................... 225
A4.3 Specific Heat ............................................................................................ 229
A4.4 Density ..................................................................................................... 230
A4.5 Thermal Conductivity .............................................................................. 230
REFERENCES ……………………………………………………………..…….231
Word count: 51,284

6
LIST OF TABLES
Table 3.1: Reinforcement detailing ............................................................................ 64
Table 3.2: Mechanical properties of steel reinforcement ........................................... 64
Table 3.3: Parameters for definition of the concrete damaged plasticity model
(ABAQUS, 2013) ....................................................................................................... 67
Table 3.4: Comparison between stable time increment and CPU time using load
factoring and mass scaling for test S4 ........................................................................ 80
Table 3.5: Parameters used for modelling the tests of Yu and Tan (2013) and Yu
and Tan (2014) ........................................................................................................... 90
Table 3.6: Comparison between stable time increment and CPU time using load
factoring and mass scaling ....................................................................................... 102
Table 4.1: Parametric study cases and summary of results of beams with
asymmetrical boundary restraints ............................................................................ 134
Table 4.2: Failure time results of beams with reinforcement details 1 and 2 .......... 139
Table 5.1: Selected parameter simulation cases for the validation study ................ 174
Table 6.2: Parametric study cases and summary of main results ............................. 193
Table 6.3: Ambient temperature capacities of beam and column members ............ 195

7
LIST OF FIGURES
Figure 1.1: Collapse of an RC warehouse building in the port of Ghent-Belgium due
to fire .......................................................................................................................... 26
Figure 2.1: Non-uniform temperature distribution over the cross-section of a beam 32
Figure 2.2: Thermal expansion in a simply supported beam ..................................... 33
Figure 2.3: Thermal bowing in a simply supported beam ......................................... 34
Figure 2.4: Free body diagram of a beam with axial restraint (Buchanan, 2002)...... 35
Figure 2.5: Rotational restrained, axially unrestrained beam in fire .......................... 37
Figure 2.6: Test setup, dimensions and reinforcement details of test specimens by Lin
T.D et al. (1981) ......................................................................................................... 37
Figure 2.7: Test setup, dimensions and reinforcement details of test specimens by Shi
and Guo (1997) and Xu et al.(2015) .......................................................................... 38
Figure 2.8:Dimensions and reinforcement details of beams simulated by Dwaikat and
Kodur (2008), Riva and Franssen (2008) and Wu and Lu (2009) ............................. 39
Figure 2.9: Effect of axial restraint on beam bending failure time by Dwaikat and
Kodur (2008), Riva and Franssen (2008) and Wu and Lu (2009) ............................. 40
Figure 2.10: Lateral displacement of edge columns due to expansion of heated slabs
(Bailey, 2002) ............................................................................................................. 42
Figure 2.11: Test arrangement by Guo and Shi (2011) .............................................. 43
Figure 2.12: Position of plastic hinges of a frame specimen by Guo and Shi (2011) 44
Figure 2.13: Dimensions and reinforcement details of simulation structure of Lue
(2007) ......................................................................................................................... 45
Figure 2.14: Test setup (Raouffard and Nishiyama, 2015) ........................................ 46
Figure 2.15: Behaviour of beam-column sub-assemblage under column removal
scenario ...................................................................................................................... 49
Figure 2.16: Elevation view and reinforcing details of the three RC frames (Stinger
and Orton, 2013) ........................................................................................................ 51
Figure 2.17: Applied load versus displacement of the three test specimens by Stinger
and Orton (2013) ........................................................................................................ 51
Figure 2.18: Test arrangement and test specimen (Yu and Tan, 2013) ..................... 52
Figure 2.19: Crack patterns and failure modes of specimen S5-1.24/1.24/23 from Yu
and Tan (2013) tests ................................................................................................... 53

8
Figure 2.20: Test arrangement (Yu and Tan, 2014) ................................................... 53
Figure 2.21: Detailing techniques of test specimens (Yu and Tan, 2014) ................. 55
Figure 3.1: Geometrical details of RC beam-column sub-assemblages and frames
(Yu and Tan, 2014, Yu and Tan, 2013, Yu, 2012)……………………………….....64
Figure 3.2: Boundary conditions applied in the FE models ....................................... 66
Figure 3.3: Concrete compressive stress-strain relationship ...................................... 68
Figure 3.4: Stress-strain relationship of concrete in tension ...................................... 69
Figure 3.5: Stress-strain relationship of reinforcing bars ........................................... 69
Figure 3.6: Sensitivity of FE simulation results to mesh sizes of concrete, for test S4
.................................................................................................................................... 71
Figure 3.7: Comparison between FE simulation and test results for different
simulation loading durations for test S4..................................................................... 74
Figure 3.8: Comparison between test and load-controlled simulation results for
different simulation loading durations (test specimen S4) ......................................... 75
Figure 3.9: Comparison between test results and FE simulation results using different
damping ratio 𝜉 for test S4 ........................................................................................ 78
Figure 3.10: Comparison between simulation results using load factoring and mass
scaling for test S4 ....................................................................................................... 80
Figure 3.11: The effect of applying mass scaling to a small region of fine mesh ..... 81
Figure 3.12: Comparison between modelling and test results (model S4) ................ 83
Figure 3.13: Variation of longitudinal steel reinforcement at critical regions (model
S4) .............................................................................................................................. 84
Figure 3.14: Comparison between modelling and test results (model S5) ................ 85
Figure 3.15: Comparison between modelling and test results (model S7) ................ 86
Figure 3.16: Comparison between modelling and test results (model F2) ................ 87
Figure 3.17: Comparison between modelling and test results (model F4) ................ 88
Figure 3.18: Variation of longitudinal steel reinforcement at critical regions (model
F4) .............................................................................................................................. 89
Figure 3.19: Deformed shape and failure mode of FE simulations and tests ............ 91
Figure 3.20: Details of test beams B1, B2 and B3 with the locations of
thermocouples (Dwaikat and Kodur, 2009a) ............................................................. 93
Figure 3.21: Comparison between predicted and measured temperature for B1 ....... 95

9
Figure 3.22: Applying temperatures at nodes according to experimental
measurements of thermocouples for B2 and B3 ........................................................ 96
Figure 3.23: Tensile stress-strain relationship of concrete at elevated temperatures . 98
Figure 3.24: Mid-span deflection and kinetic energy versus fire exposure time for
different heating durations (Beam B2) ....................................................................... 99
Figure 3.25: Comparison between predicted and measured results ......................... 100
Figure 3.26: Details of the axially restrained beam ................................................. 101
Figure 3.27: General behaviour of axially restrained RC beam in fire .................... 102
Figure 3.28: Vertical reaction force, applied load and kinetic energy against time. 103
Figure 3.29: Strain profile in reinforcing bars against time ..................................... 104
Figure 3.30: Deformed shape and failure mode ....................................................... 104
Figure 4.1: Dimensions and boundary conditions of beam-column sub-frame model
.................................................................................................................................. 108
Figure 4.2: Temperature-time histories in the steel reinforcing bars, based on
numerical heat transfer modelling ............................................................................ 111
Figure 4.3: Effect of rotational restraint levels on beam behaviour (ka=0.166) ...... 113
Figure 4.4: Strain-fire exposure time relationship of longitudinal reinforcing bars at
beam mid-span (ka=0.166) ....................................................................................... 114
Figure 4.5: Effect of rotational stiffness level on beam fire resistance (ka=0.166) . 115
Figure 4.6: Deformed shapes and failure modes (kr=0.022, ka=0.166) ................... 116
Figure 4.7: Kinetic energy and beam axial force versus fire exposure time (kr=0.022
and 0.032, ka=0.166) ................................................................................................ 117
Figure 4.8: Strain-fire exposure time relationship of longitudinal reinforcing bars at
beam ends (ka=0.166) .............................................................................................. 119
Figure 4.9: Deformed shapes and failure modes (kr=0.064, ka=0.166) ................... 121
Figure 4.10: Strain-fire exposure time for concrete near the beam ends (kr=0.064,
ka=0.166) .................................................................................................................. 121
Figure 4.11: Behaviour of reinforcing bars at beam ends (kr=0.064, ka=0.166) ..... 122
Figure 4.12: Vertical reaction force, applied load and kinetic energy/internal energy
against fire exposure time (kr=0.064, ka=0.166) ..................................................... 123
Figure 4.13: Strain-fire exposure time longitudinal reinforcing bars at beam mid-span
(ka=0.166) ................................................................................................................ 124
10
Figure 4.14: Comparison of beam axial force-fire exposure time relationships
(ka=0.0275) .............................................................................................................. 127
Figure 4.15: Comparison of beam axial force-fire exposure time relationships
(ka=0.4) .................................................................................................................... 127
Figure 4.16: Effect of rotational stiffness levels on the beam fire resistance
(ka=0.0275) .............................................................................................................. 127
Figure 4.17: Effect of rotational stiffness levels on the beam fire resistance (ka=0.4)
.................................................................................................................................. 128
Figure 4.18: Comparison of beam mid-span deflections-fire exposure time
relationships (ka=0.166, LR=50%) .......................................................................... 128
Figure 4.19: Effect of rotational stiffness levels on the beam fire resistance
(ka=0.166, LR=50%) ................................................................................................ 129
Figure 4.20: Effect of rotational stiffness level on beam bending resistance (ka=0)129
Figure 4.21: Strain-fire exposure time relationship of longitudinal reinforcing bars at
beam mid-aspan (ka=0) ............................................................................................ 130
Figure 4.22: Strains of longitudinal reinforcing bars at ends against fire exposure
time (ka=0) ............................................................................................................... 130
Figure 4.23: Sagging bending failure at mid-span (kr=0.013, ka=0) ....................... 131
Figure 4.24: Hogging bending failure at supports ................................................... 131
Figure 4.25: Definition of asymmetrical boundary restraints of beam-column sub-
frame model ............................................................................................................. 133
Figure 4.26: Effect of kr,L on beam bending and ultimate resistance times (kr,R=2,
ka,R=0.166, ka,L=0) .................................................................................................... 135
Figure 4.27: Effect of kr,R on beam bending and ultimate resistance time (ka,R=0.166,
kr,L=0.0075, ka,L=0) ................................................................................................... 135
Figure 4.28: Effect of ka,L on beam bending and ultimate resistance time (kr,R=2,
ka,R=0.166, kr,L=0.0075)............................................................................................ 135
Figure 4.29: Sagging moment failure mode (bending failure mode I) (kr,R=0.025,
ka,R=0.166, kr,L=0.0075, ka,L=0) ................................................................................ 136
Figure 4.30: Beam bending failure modes ............................................................... 136
Figure 4.31: Strain-fire exposure time relationship of top longitudinal reinforcing
bars at right support (ka,R=0.166, kr,R=2, ka,L=0) ..................................................... 137
Figure 4.32: Reinforcement details 1 and 2 ............................................................. 138

11
Figure 4.33: Strain-fire exposure time relationship of top longitudinal reinforcing
bars at right support (ka,R=0.166, kr,R=2, ka,L=0) ..................................................... 139
Figure 4.34: Strain-fire exposure time relationship of longitudinal reinforcing bars
(ka,R=0.166, kr,R=2, ka,L=0)........................................................................................ 140
Figure 4.35: Strain-fire exposure time for concrete near the beam right end
(ka,R=0.166, kr,R=2, ka,L=0.08, kr,L=0.0075) .............................................................. 142
Figure 4.36: Strain of longitudinal reinforcing bars at right end and beam axial force
against fire exposure time with different ka,L values (ka,R=0.166, kr,R=2, kr,L=0.0075)
.................................................................................................................................. 142
Figure 5.1: Typical axial force-fire exposure time response of a restrained RC beam
in fire ........................................................................................................................ 148
Figure 5.2: Effects of rotational stiffness kr on RC beam behaviour in fire ............ 149
Figure 5.3: Representative restrained beam model .................................................. 152
Figure 5.4: Beam discretization for simplified analysis .......................................... 153
Figure 5.5: Comparison of beam deflection profiles in flexural action (kr=0.0064)155
Figure 5.6: Comparison of beam deflection profiles in flexural action (kr=0.032) . 156
Figure 5.7: Comparison of beam deflection profiles in flexural action (kr=0.064) . 156
Figure 5.8: Comparison of beam deflection profiles in flexural action (kr=0.125) . 156
Figure 5.9: Comparison of beam deflection profiles in flexural action (kr=2) ........ 157
Figure 5.10: Comparison of beam deflection profiles in catenary action (kr=0.0064)
.................................................................................................................................. 157
Figure 5.11: Comparison of beam deflection profiles in catenary action (kr=2) ..... 157
Figure 5.12: Distribution of total strain in a beam cross-section ............................. 159
Figure 5.13: Condition of beam at different stages .................................................. 161
Figure 5.14: Loading condition on deformed half beam ......................................... 162
Figure 5.15: Schematic M- 𝜑 at a given fire exposure time .................................... 166
Figure 5.16: Beam behaviour with kr=kr,B ................................................................ 167
Figure 5.17: Beam behaviour with kr,B<kr≤kr,D ........................................................ 168
Figure 5.18: Schematic diagram of a beam in catenary action with kr≥kr,E ............. 170
Figure 5.19: Strain profiles of top reinforcing bars at ultimate beam resistance time
.................................................................................................................................. 172
Figure 5.20: Compatibility condition for top reinforcing bars ................................. 172
Figure 5.21: Mesh density used in the simplified method for validation study ....... 175

12
Figure 5.22: Comparison between simplified method results and ABAQUS results
for different end rotational stiffness ratios (kr) ........................................................ 176
Figure 5.23: Comparison between simplified method results and ABAQUS results
for the effect of rotational stiffness on beam fire resistance .................................... 177
Figure 5.24: Comparison between simplified method results and ABAQUS results
for different load ratios (LR) .................................................................................... 179
Figure 5.25: Comparison between simplified method results and ABAQUS results
for different end axial stiffness ratios ka .................................................................. 180
Figure 5.26: Comparison between simplified method results and ABAQUS results
for different span-to-depth ratios (L/D) ................................................................... 182
Figure 5.27: Comparison between simplified method results and ABAQUS results
for different bottom reinforcement amount.............................................................. 183
Figure 5.28: Comparison between simplified method results and ABAQUS results
for different top reinforcement amount .................................................................... 184
Figure 6.1: Dimensions, loading and boundary conditions of the simulation frame 188
Figure 6.2: Transvers reinforcement and beam cross-sectional details ................... 189
Figure 6.3: Different fire scenarios .......................................................................... 190
Figure 6.4: Mesh configuration used for fire scenario 1 .......................................... 191
Figure 6.5: Selective temperature-time histories of column reinforcement, based on
numerical heat transfer analysis (Column dimensions: 400×400mm) ..................... 192
Figure 6.6: Details of longitudinal steel reinforcement for different column sizes . 194
Figure 6.7: Determining maximum beam and column resistances in the frame at
ambient temperature ................................................................................................. 195
Figure 6.8: Typical deflected frame shapes (Deformation scale factor=3) .............. 196
Figure 6.9: Effects of column size and load ratio on frame failure times ................ 197
Figure 6.10: Beam B1 axial force-fire exposure time relationship with different
column sizes and load ratios (Fire scenario 1, beam reinforcement detail 1) .......... 198
Figure 6.11: Beam B1 axial force-fire exposure time relaitonship with beam
reinforcement details 1 and 2 (Fire scenario 1, LR=50%) ....................................... 198
Figure 6.12: Comparison of results between frame loadings 1 and 2 (Fire scenario 1,
beam reinforcement detail 2, column size=400x400mm, LR=50%) ....................... 199
Figure 6.13: Strain-fire exposure time relationships of longitudinal reinforcing bars at
ends of beam B1 with different column sizes (Fire scenario 1) ............................... 200

13
Figure 6.14: Column-led failure mode in fire scenario 1 ......................................... 201
Figure 6.15: Beam-led failure mode in fire scenario 1 ............................................ 201
Figure 6.16: Strain-fire exposure time relationship of top longitudinal reinforcing
bars at right end of beam B1 (Fire scenario 1, LR=50%) ........................................ 202
Figure 6.17: Maximumn strain-fire exposure time relationship of longitudinal
reinforcing bars in beam B1 span with different column sizes (Fire scenario 1) .... 203
Figure 6.18: Horizontal displacement at the top of column C2 (Fire scenario 2) .... 203
Figure 6.19: Beam B2 deflection-fire exposure time relationship with different
column sizes and load ratios (Fire scenario 2) ......................................................... 204
Figure 6.20: Beam B2 axial force-fire exposure time relationship with different
column sizes and load ratios (Fire scenario 2) ......................................................... 204
Figure 6.21: Frame failure in fire scenario 2 (column-led failure) .......................... 205
Figure 6.22: Beam bending failure in fire scenario 2 and deformed shape of frame in
catenary action ......................................................................................................... 205
Figure 6.23: Strain-fire exposure time for concrete near beam B2 ends (Fire scenario
2, Frame F11) ........................................................................................................... 206
Figure 6.24: Maximumn strain-time relationship of longitudinal reinforcing bars in
beam B2 span with different column sizes and load ratios (Fire scenario 2) .......... 206
Figure 6.25: Strain-time relationship of longitudinal reinforcing bars at beam B2
ends with different column sizes and load ratios (Fire scenario 2) .......................... 206
Figure 6.26: Column-led failure of frame F11 in catenary action ........................... 208
Figure 6.27: Column-led failure of frame F12 in catenary action ........................... 208
Figure 6.28: Horizontal displacement of columns (Fire scenario 3, LR=30%) ....... 209
Figure 6.29: Strain-fire exposure time relationship of longitudinal reinforcing bars at
beam B1 and beam B2 ends with different column sizes and load ratios (Fire
scenario 3) ................................................................................................................ 210
Figure 6.30: Beam axial force-fire exposure time relationship with different column
sizes and load ratios (Fire scenario 3) ...................................................................... 211
Figure 6.31: Frame failure in fire scenario 3 (column-led failure) .......................... 212
Figure 6.32: Frame failure in fire scenario 3 (beam-led failure).............................. 212
Figure 6.33: Maximumn strain-time relationship of longitudinal reinforcing bars in
beam B1 span with different column sizes and load ratios (Fire scenario 3) .......... 212
14
NOTATION
A Cross-sectional area of a member section
Am Area of a concrete element in the beam cross-section
As,m Area of a steel bar element in the beam cross-section
B Width of the beam cross-section
C Viscous damping
cp Specific heat of concrete
D Depth of the beam section
E Modulus of elasticity of a material
Ea Modulus of elasticity of steel at ambient temperature
Ea,T Modulus of elasticity of steel at temperature T
Ec1 Secant modulus of elasticity of concrete from the origin to the peak
compressive stress at ambient temperature
Ecm Modulus of elasticity of concrete at ambient temperature
Ecm,T Modulus of elasticity of concrete at temperature T
Ej Modulus of elasticity of the beam-column joint
Es Modulus of elasticity of steel at ambient temperature
F Axial force in the beam
f Mass scaling factor
fcm Compressive cylinder strength of concrete at ambient temperature
fcm,T Compressive cylinder strength of concrete at temperature T
fctm Tensile strength of concrete at ambient temperature
fctm,T Tensile strength of concrete at temperature T
Fint,i Internal axial force in the beam segment i
Fmid Axial compressive force in the beam at bending failure of the mid-span
fp,T Proportional limit stress of steel at temperature T
Fres Residual axial compressive force in the beam when stability of the
beam is regained again in bending after bending failure of the mid-span
fu Tensile strength of steel at ambient temperature
fy Yield strength of steel at ambient temperature
fy,T Yield strength of steel at temperature T

15
H Height of the column
I Moment of inertial of a member section
K Stiffness matrix
KA Axial stiffness of the spring
ka,L Relative axil stiffness parameter at left beam end
ka,R Relative axil stiffness parameter at right beam end
KA,sup Lateral stiffness of the supporting columns
KR Rotational stiffness of the spring
kr Relative rotational stiffness parameter at beam ends
kr,L Relative rotational stiffness parameter at left beam end
kr,R Relative rotational stiffness parameter at right beam end
KR,sup Rotational stiffness of the supporting columns
kt,T Temperature-dependent reduction factor of concrete tensile strength
L Span length of the beam
Le Finite element characteristic length
Li Initial length of the beam segment i
Li′ Horizontal projected length of the deformed beam segment i
M Inertia mass matrix
MA Internal bending moment at the beam support
Mm Internal bending moment at the beam mid-span
MRd,fi,hog Reduced beam hogging moment resistance at elevated temperatures
t Fire time
T Temperature
T1 Temperature at the top fibre of a beam section
T2 Temperature at the bottom fibre of a beam section
tBR Beam bending resistance time at elevated temperatures
tmid Beam mid-span bending failure time at elevated temperatures
Tn Lowest natural period
tUR Beam ultimate resistance time at elevated temperatures
Ty Thermal gradient
u Concrete moisture content
w Uniformly distributed load
α Material thermal expansion coefficient

16
β Rayleigh stiffness proportional damping factor
δ Deflection profile of the beam
Δa Axial dispacemnt at beam ends at the location of the axial spring
δBR,max Maximum mid-span deflection of the beam at bending resistance time
δCPL Deflection profile of the beam under a concentrated point load
δi,a Vertical deflection at the left end of the segment i
δi,b Vertical deflection at the right end of the segment i
δLP Linear deflection profile of the beam
δmax Maximum deflection at the beam mid-span
δmid,max Mid-span deflection of the beam at the mid-span failure
δst,max Maximum mid-span deflection of the beam when stability of the beam
is regained after bending failure of the mid-span
Δt Stable time increment
ΔT Mean temperature
δt Deflection profile of the beam with total end rotational restraint
δth Thermal bowing
δz Deflection profile of the beam with zero end rotational restraint
εc Strain of concrete at ambient temperature
εc,T Strain of concrete at temperature T
εc1 Strain of concrete at peak compressive stress at ambient temperature
εc1,T Strain value of concrete at peak compressive stress at temperature T
εcmax,T Concrete crushing strain at temperature T
εcr Cracking strain of concrete at ambient temperature
εcr,T Cracking strain of concrete at temperature T
εct Tensile strain of concrete at ambient temperature
εct,T Tensile strain of concrete at temperature T
εcu1,T Strain of concrete at zero stress in the softening stage at temperature T
εmec Mechanical strain
εs,T Strain of steel at temperature T
εsh Hardening strain of steel at ambient temperature
εt,T Maximum strain of steel while maintaining the yield stress at
temperature T
εth Free thermal strain

17
εth,c Free thermal strain of concrete
εth,s Free thermal strain of steel
εtot Total strain in an element of the beam cross-section
εu Ultimate strain of steel at ambient temperature
εu,T Ultimate strain of steel at temperature T
εy,T Yield strain of steel at temperature T
λ̂ Lame’s constants
λc Thermal conductivity of concrete
μ Rayleigh mass proportional damping factor
μ̂ Lame’s constants
ν Poisson’s ratio
ξ Damping ratio
ξi Damping ratio in a mode of vibration i
ξmax Damping ratio associated with 𝜔𝑚𝑎𝑥
σc,m Stress in a concrete element in the beam cross-section
ρc,T Density of concrete at temperature T
σs,m Stress in a steel bar element in the beam cross-section
φi Total curvature in the beam segment i
φth Thermal curvature
ωi Natural frequency of the mode i
ωmax Higher natural frequency
ωmin Lowest natural frequency
ABBREVIATION
CPL Concentrated point load
DC Displacement control
HD Heating duration
IE Internal energy
KE Kinetic energy
L/D Span-to-depth ratio
LC Load control
LD Loading duration
LITS Load-induced thermal strain
LP Linear profile
LR Load ratio
MJD Middle joint displacement
MPC Multi-Point Constraint
UDL Uniformly distributed load

18
ABSTRACT
This thesis presents the results of a numerical investigation of the whole range, large
deflection behaviour of axially and rotationally restrained RC beams and interactions
between beams and columns in RC frame structures exposed to fire.
The dynamic explicit time integration algorithm implemented in the general finite
element package ABAQUS/Explicit solver was used so as to overcome various
modelling challenges including temporary instability, local failure of materials, non-
convergence and long simulation time. Either load factoring or mass scaling may be
used to speed up the simulation process. Validity of the proposed simulation model
was checked by comparison of simulation results against relevant test results of
restrained RC beams at ambient temperature and in fire.
The validated ABAQUS/Explicit model was then used to conduct a comprehensive
study of the effects of different levels of axial and rotational restraints on the whole
range behaviour of RC beams in fire, including combined bending and compression
due to restrained thermal expansion, bending failure, transition from compression to
tension when catenary action develops and complete fracture of reinforcement at
ultimate failure. The numerical results show that different bending failure modes
(middle span sagging failure, end hogging failure due to fracture of tensile
reinforcement, end hogging failure due to concrete crushing) can occur under
different levels of boundary restraints. Furthermore, release of a large amount of
energy during the rapid transition phase from compression to tension in a beam
prevents formation of a three hinge mechanism in the beam under bending. The
numerical results have also revealed that reliable catenary action develops at large
deflections following bending failure only if bending failure is governed by
compressive failure of concrete at the end supports whereby a continuous tension
path in the beam can develop in the top reinforcement.
To allow fire engineering practice to take into consideration the complex restrained
RC beam behaviour in fire, a simplified calculation method has been developed and
validated against the numerical simulation results. The proposed method is based on
sectional analysis and meets the requirements of strain compatibility and force
equilibrium. The validation study results have shown that the simplified method can

19
satisfactorily predict the various key quantities of restrained beam axial force and
beam deflection-fire exposure time relationships, with the simplified method
generally giving results on the safe side.
The validated explicit finite element model in ABAQUS was also used to investigate
structural interactions between beams and columns within an RC frame structure
with different fire exposure scenarios. When fire exposure involves beams and
columns located in edge bays of a frame, catenary action cannot develop. Also due to
thermal expansion of the connected beam, additional bending moments can generate
in the columns. Furthermore, very large hogging moments can be induced at the
beam end connected to the internal bay. It is necessary to include these bending
moments when designing beams and columns under such fire conditions. Catenary
action can develop in interior beams of the frame when fire exposure is in interior
bays where the beams have high degrees of axial restraint.

20
DECLARATION
No portion of the work referred to in the thesis has been submitted in support of an
application for another degree or qualification of this or any other university or other
institute of learning.

21
COPYRIGHT
The Author of this thesis (including any appendices and/or schedules to this thesis)
owns any copyright in it (the “Copyright”) and he has given The University of
Manchester the right to use such Copyright for any administrative, promotional,
educational and/or teaching purposes.
Copies of this thesis, either in full or in extracts, may be made only in accordance
with the regulations of the John Ryland’s University Library of Manchester. Details
of these regulations may be obtained from the Librarian. This page must form part of
any such copies made.
The ownership of any patents, designs, trade marks and any and all other intellectual
property rights except for the Copyright (the “Intellectual Property Rights”) and any
re-productions of copyright works, for example graphs and tables (“Reproductions”),
which may be described in this thesis, may not be owned by the author and may be
owned by third parties. Such Intellectual Property Rights and Reproductions cannot
and must not be made available for use without the prior written permission of the
owner(s) of the relevant Intellectual Property Rights and/or Reproductions.
Further information on the conditions under which disclosure, publication and
exploitation of this thesis, the Copyright and any Intellectual Property Rights and/or
Reproductions described in it may take place is available from the Head of School of
Mechanical, Aerospace and Civil Engineering.

22
DEDICATION
To My Parents

23
ACKNOWLEDGEMENTS
First and foremost, I wish to give all the praise to Almighty God for giving me the
strength and time to complete this research.
I would like to express my greatest gratitude to my supervisor, Professor Yong
Wang, for his constant encouragement, enthusiastic advice and professional guidance
through the undertaking of this research. He provided me with all kinds of support.
I wish to also thank Professor Martin Gillie for his advice on my yearly transfer
reports.
I would like to acknowledge the financial support given by my sponsor, Ministry of
Higher Education and Scientific Research-Kurdistan Region-Iraq. The efforts given
by the Kurdistan Regional Government UK Representation to assist with the
administration issues of my scholarship are really appreciated.
My Special thanks go to my colleagues in the research group for their help and
providing an inspiring environment.
Finally, I would like to express my deepest gratitude to my parents, my wife “Sara”,
my daughter “Leena”, my son “Mustafa”, my sisters and brothers for their endless
patience, support, encouragement and love during my PhD study. Without them, this
would not have been possible.
Sherwan Albrifkani

24
LIST OF PUBLICATIONS
1- ALBRIFKANI, S. & WANG, Y. C. (2016), “Explicit modelling of large
deflection behaviour of restrained reinforced concrete beams in fire”, Engineering
Structures Journal, Vol. 121, pp. 97-119.
2- ALBRIFKANI, S. & WANG, Y. C. (2016), “Investigation of progressive collapse
mechanisms of reinforced concrete frames in fire”, 18th Young Researchers
Conference, The Institution of Structural Engineers, April 2016, London. (Poster)
3- WANG, Y. C. & ALBRIFKANI, S. (2017), “Effects of rotational and axial
restraints on bending fire resistance of reinforced concrete beams”, ASCE EMI
conference (American Society of Civil Engineers, Engineering Mechanics Institute),
June 2017, University of California, San Diego.

CHAPTER 1 INTRODUCTION
25
CHAPTER 1
INTRODUCTION
1.1 Introduction
Fire is one of the most dangerous conditions to which a building may be subjected
during its life time. The most recent tragic fire in Grenfell building in London
graphically illustrates the destructive power of fire. Fortunately, the building
structure retained its integrity, but the fact that the fire was engulfing the entire
building puts in question one of the most basic assumptions of fire resistance:
compartmentation.
This fire, and along with many other historical fire events, makes it imperative for
the fire protection and structural engineering community to understand how building
structures perform under realistic fire conditions. Because building structures are
interconnected entities, it is necessary to understand how structural components
behave under different connecting (or restraint) conditions and how their interactions
affect fire resistance of entire structures. Whilst there have been such studies in
relation to steel and steel-concrete composite structures, reinforced concrete (RC)
structures have not undergone as much scrutiny. Consequently, fire resistance of RC
structures is based on isolated individual structural elements where preventing
degradations of material mechanical properties at elevated temperatures is of only
concern.
In a real RC frame structure in fire, restrained thermal expansion, interactions
between heated and unheated parts and large deflections lead to complicated
behaviour of RC elements that are different from that assumed in current design
methods, which may result in failure of RC structures in fire even though they were
deemed to have sufficient fire resistance according to member based design.
For example, Beitel and Iwankiw (2002) and Lue Taerwe (2007) reported a number
of RC structures that suffered collapse or partial collapse due to thermal expansion
effects in fire. In 1974, a fire developed in a three storey cast in situ RC warehouse
building in the port of Ghent in Belgium. The building was 50×50m on plan. It was
designed to satisfy tabulated fire resistance ratings regarding minimum concrete

CHAPTER 1 INTRODUCTION
26
cover over the reinforcement and minimum size of member cross-section. However,
collapse of part of the building began after about 1hr20min of fire exposure, as
shown in Figure 1.1. The main cause of the collapse was due to shear failure of some
columns caused by thermal expansion of the connected beams, which were exposed
to fire along three sides and restrained from elongation by the adjacent structure,
thereby generating additional forces.
Figure 1.1: Collapse of an RC warehouse building in the port of Ghent-Belgium
due to fire
On the other hand, for axially restrained beams, the alternative load carrying
mechanism of catenary action can develop after bending failure, which can
significantly enhance the beam survival time compared to the fire resistance
estimated based on bending resistance. Catenary action may be used to mitigate
against progressive collapse in fire situation.
1.2 Originality and Objectives of the Research
Proper consideration of the aforementioned two aspects of structural interactions in
RC structures in fire requires a thorough understanding of the whole range behaviour
of RC structures in fire. However, there is a lack of investigation on this subject. This
may be due to the perception that RC members are fire resistant due to their
relatively low thermal conductivity. However, the member based assessment method

CHAPTER 1 INTRODUCTION
27
cannot deal with structural interactions. Among research studies that have included
effects of structural interactions and restraints, they did not address the development
of catenary action at very large beam deflections. There is also an absence of
methods that may be used in design practice.
This project aims to develop thorough understanding of structural interactions in RC
frames in fire, focusing in particular on the whole range behaviour of axially and
rotationally restrained RC beams. Due to high cost of physical fire testing, this study
will be using numerical simulation. The principal objectives of this study are:
1. To develop and validate a 3D numerical simulation model using the general
finite element code ABAQUS/Explicit for analysing the highly complex,
whole range behaviour of RC structures in fire.
2. To perform extensive numerical simulations to investigate the effects of
different axial and rotational restraints on full history behaviour of RC beams
in fire until failure, including catenary action at large deflections.
3. To develop and validate a simplified calculation approach to predict the
whole history behaviour of restrained RC beams in fire.
4. To investigate interactions between RC beams and columns in RC framed
structures in fire.
1.3 Thesis Structure
This thesis is divided into seven chapters.
Chapter 2 reports the results of previous studies that are pertinent to this research
problem. After giving a brief introduction to existing design methods of RC
structures in fire, it reviews research into the behaviour of RC beams and frames
exposed to fire, followed by an introduction to the catenary action in RC beams. It
will also review existing simplified calculation and numerical simulation models to
trace fire performance of RC beams. The state of art review enables identification of
detailed gaps of knowledge in existing research.
Chapter 3 describes the development of a dynamic explicit finite element model for
simulating RC structural members subjected to large deformations at ambient and
CHAPTER 1 INTRODUCTION
28
elevated temperatures using the finite element package ABAQUS. It explains the
numerical simulation challenges, including temporary instabilities, local failure of
materials and long simulation time, and proposes methods to solve these challenges.
The developed simulation model is then validated against relevant test results.
Chapter 4 presents the numerical results, using the validated ABAQUS model
developed in Chapter 3, of a series of analyses of RC beams in fire with different
axial and rotational restraint levels, with either symmetrical or asymmetric restraint
conditions, for the entire range of behaviour . The effects of different boundary
restraints on beam bending resistance time and development of catenary action are
particular focuses of discussions.
Chapter 5 presents and validates a simplified calculation method that may be used in
practical design to include the effects of axial and rotational restraints on RC beams
in fire.
Chapter 6 presents the results of a series of simulations to investigate structural
interactions in RC framed structures in fire.
Chapter 7 concludes the present study and gives suggestions for future research work
on the topic.
CHAPTER 2 LITERATURE REVIEW
29
CHAPTER 2
LITERATURE REVIEW
2.1 Introduction
This chapter presents a background to the motivation for this research project. After
summarising the approaches for fire resistance design of RC structures, it reviews
previous research studies on RC beams and frames exposed to fire that provide
understanding leading to the performance based fire resistance design approach. The
concept of catenary action, developed in beams at large deflections, as an alternative
load-carrying mechanism to enhance structural robustness of RC framed structures at
ambient temperature and in fire is then introduced and relevant literature reviewed.
Finally, existing simplified calculation and numerical models to trace the high
temperature response of RC beams are reviewed.
2.2 Design for Fire Resistance
The design methods of specifying fire resistance of RC structures can be divided into
three principal levels based on their accuracy and complexity:
1- Standard fire resistance test;
2- Prescriptive method;
3- Performance-based method.
The standard fire resistance test is conducted by subjecting a structural element to
fire under the standard heating condition in a furnace. The furnace temperature is
controlled to follow the standard gas temperature-time curve as given in national and
international standards, such as ISO 834 (1975) and ASTM E119 (2008). Standard
fire resistance testing is costly. Also the test results are only used for grading purpose
because the standard fire test has many limitations, including idealised boundary
conditions and loading arrangements and limited dimensions (Purkiss, 2007). Testing
of a whole structure under a realistic fire is extremely expensive, impractical and
very rarely done, the fire tests on full-scale buildings at Cardington, UK (BRE, 2003)
being the only example so far.

CHAPTER 2 LITERATURE REVIEW
30
The prescriptive approach for assessing the fire resistance of RC members, in codes
such as EN 1992-1-2 (CEN, 2004), relies on tabulated fire resistance ratings
established from standard fire test data. It simply specifies the minimum concrete
cover over the reinforcement and the minimum size of member cross-section
according to the required fire resistance period and load level of the member. The
minimum concrete cover is specified to ensure that the temperature of the main
reinforcement does not exceed a temperature of 500-550oC as the reinforcement
around this temperature loses about 50% of its strength. The prescriptive approach is
straightforward and simple to use, but in many cases, it is not likely to be accurate
and economic (Khoury, 2000). The effects of specific circumstances such as support
conditions, loading conditions and interaction of structural elements are not
considered.
For reasons that physical fire tests being very expensive and technically demanding
to conduct and prescriptive provisions having many drawbacks despite simplicity, a
more rational methodology, known as the performance-based design approach, has
been developed. This approach has the potential to offer more design flexibility,
reduced construction cost and more accurate representation of how a structure will
behave in fire (Wang et al., 2013, Kodur and Dwaikat, 2007). The performance-
based approach considers realistic fire scenarios, material properties at elevated
temperatures and structural behaviour at elevated temperatures with realistic support
and loading conditions. The performance-based fire resistance approach involves
determination of: (i) fire temperature; (ii) heat transfer to the structure and (iii) the
structural behaviour at elevated temperatures.
A simplistic performance-based fire resistance approach for RC structures is
presented in EN 1992-1-2 (CEN, 2004). At the required fire resistance time,
temperature distributions in RC sections of different sizes and for standard fire
resistance durations from 30 min to 240 min are given. The effects of high
temperatures are considered by removing layers of concrete in the heated cross-
section that have attained high temperatures. These calculations can be used to
predict the fire response of RC elements in isolation. They are not sufficient for
analysing RC members within realistic structures which exhibit complex interactions
between different structural members. To address this problem, sophisticated
numerical finite element analyses will be required. However, it would be unrealistic

CHAPTER 2 LITERATURE REVIEW
31
to expect the majority of fire protection or structural engineers to use finite element
analysis in fire resistance design. In order to facilitate development of more
simplistic methods for performance-based fire resistance design of RC structures
with faithful prediction of structural interactions, it is necessary to develop a
thorough understanding of RC structures in fire.
2.3 Structural Response to Fire
Usmani et al. (2001) have laid out the most fundamental principles that govern the
behaviour of structures in fire where thermal strains play an important role. The total
stains (𝜀𝑡𝑜𝑡𝑎𝑙), which dictate the deformed shape of a structure, are the sum of the
thermal strains (𝜀𝑡ℎ) and the mechanical strains (𝜀𝑚𝑒𝑐), as shown in Equation 2-1.
Thermal strains develop due to the expansion behaviour of materials with increasing
temperatures and the stress state in the structure is only governed by the mechanical
strains.
𝜀𝑡𝑜𝑡𝑎𝑙 = 𝜀𝑡ℎ + 𝜀𝑚𝑒𝑐 (2-1)
With no externally applied load, when the element is unrestrained, thermal strains are
free to develop. No stresses induce in the element and the total strains are only a
function of thermal strains (Equation 2-2)
𝜀𝑡𝑜𝑡𝑎𝑙 = 𝜀𝑡ℎ , 𝜀𝑚𝑒𝑐 = 0 (2-2)
On the other hand, when the element is fully restrained against thermal expansion,
the total element deformation is zero. The thermal strains are therefore counter-acted
by equal and opposite thermal mechanicals, causing restraining stresses in the
element (Equation 2-3).
𝜀𝑡𝑜𝑡𝑎𝑙 = 0 = 𝜀𝑡ℎ + 𝜀𝑚𝑒𝑐 ⇒ 𝜀𝑡ℎ = −𝜀𝑚𝑒𝑐 (2-3)
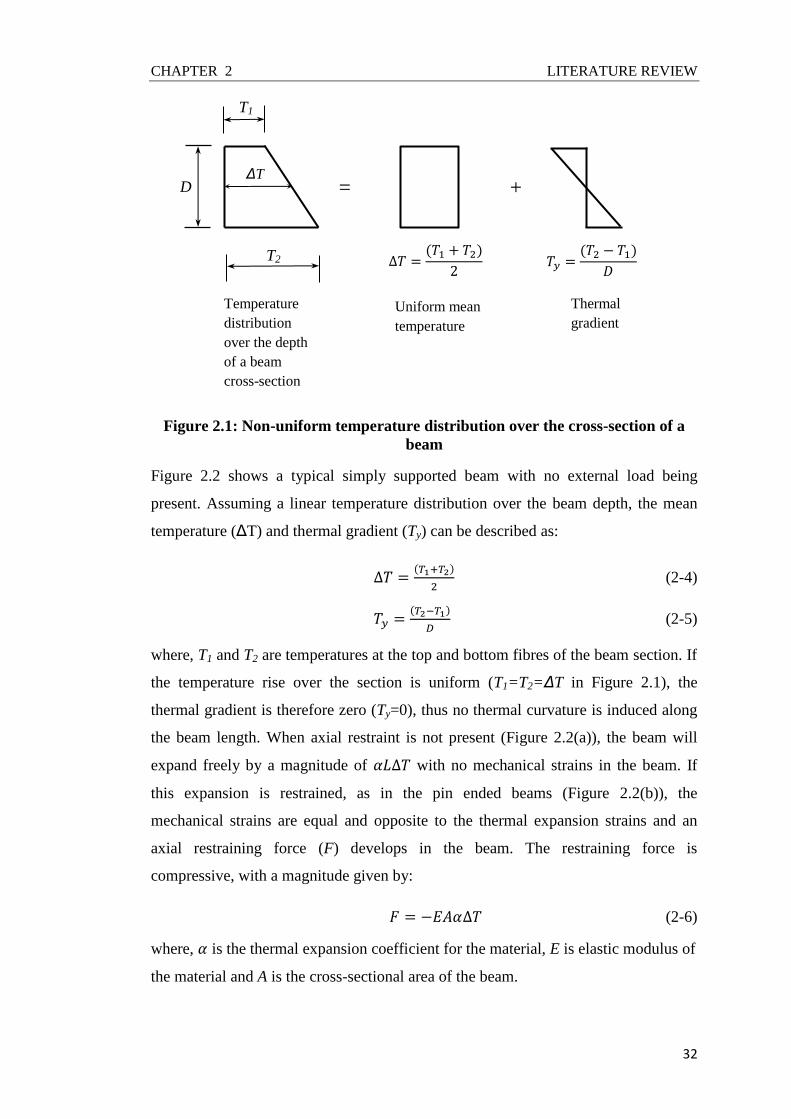
Figure 2.1 depicts the temperature regime in a beam heated uniformly along its
length (L) from underneath. The temperature distribution over the beam depth (D)
can be split into two components: (1) a uniform mean temperature (∆T) and (2) a
thermal gradient Ty. Usmani et al. (2001) described the effects of thermal strains as
twofold: (1) pure thermal expansion, which leads to an increase in the length of the
heated structural member under the mean temperature rise and (2) thermal bowing,
which is induced due to the thermal gradient Ty.
CHAPTER 2 LITERATURE REVIEW
32
Figure 2.1: Non-uniform temperature distribution over the cross-section of a
beam
Figure 2.2 shows a typical simply supported beam with no external load being
present. Assuming a linear temperature distribution over the beam depth, the mean
temperature (ΔT) and thermal gradient (Ty) can be described as:
∆𝑇 =(𝑇1+𝑇2)
2 (2-4)
𝑇𝑦 =(𝑇2−𝑇1)
𝐷 (2-5)
where, T1 and T2 are temperatures at the top and bottom fibres of the beam section. If
the temperature rise over the section is uniform (T1=T2=ΔT in Figure 2.1), the
thermal gradient is therefore zero (Ty=0), thus no thermal curvature is induced along
the beam length. When axial restraint is not present (Figure 2.2(a)), the beam will
expand freely by a magnitude of 𝛼𝐿∆𝑇 with no mechanical strains in the beam. If
this expansion is restrained, as in the pin ended beams (Figure 2.2(b)), the
mechanical strains are equal and opposite to the thermal expansion strains and an
axial restraining force (F) develops in the beam. The restraining force is
compressive, with a magnitude given by:
𝐹 = −𝐸𝐴𝛼∆𝑇 (2-6)
where, 𝛼 is the thermal expansion coefficient for the material, E is elastic modulus of
the material and A is the cross-sectional area of the beam.
T2
T1
D ΔT
∆𝑇 =(𝑇1 + 𝑇2)
2 𝑇𝑦 =
(𝑇2 − 𝑇1)
𝐷
= +
Temperature
distribution
over the depth
of a beam
cross-section
Uniform mean
temperature
Thermal
gradient

CHAPTER 2 LITERATURE REVIEW
33
Figure 2.2: Thermal expansion in a simply supported beam
In structural elements made of materials with low conductivity, such as concrete,
thermal gradients inevitably induce over their depth. The bottom layers exposed to
direct fire are at significantly higher temperatures than the top layers. This causes the
hotter layers to expand more than the cooler layers, leading to curvature (bowing) in
the element. Figure 2.3 shows the same aforementioned simply supported beam but
this time subjected to non-uniform temperature over the depth (T2>T1 in Figure 2.1).
As a result of the thermal gradient, a uniform thermal curvature 𝜑𝑡ℎ = 𝛼𝑇𝑦 is
induced along the length of the beam. In axially unrestrained beam, the beam ends
contract to accommodate the deflection caused by thermal curvature (Figure 2.3(a)).
Restraint of this contract (inward displacement) when the beam is axially restrained
will generate a tensile axial force in the beam as shown in Figure 2.3(b). In addition,
in a rotationally fix-ended beam (Figure 2.3(c)), the uniform thermal curvature
𝜑𝑡ℎ = 𝛼𝑇𝑦, described above for the simply supported beam, is counteracted by the
end moments (M). In this case, the beam remains straight with a constant moment
𝑀 = 𝐸𝐼𝜑𝑡ℎ along its length (Usmani et al., 2001). In reality, the effects of thermal
expansion, thermal bowing and end boundary restraints act together. Thermal
expansion and inward displacement caused by thermal bowing may absorb each
other. This can affect the axial compression and axial tension generated in axially
restrained beams. Moreover, compressions generated due to restrained thermal
(a) Axially unrestrained
𝐹 = −𝐸𝐴𝛼∆𝑇
𝛼𝐿∆𝑇
L
F F
Uniform temperature rise ΔT
Uniform temperature rise ΔT
(b) Axially restrained

CHAPTER 2 LITERATURE REVIEW
34
expansion and thermal bowing in fixed ended beams result in significant
compressions on the exposed layers of the beam and tensions or still small
compressions on the unexposed top layers.
Figure 2.3: Thermal bowing in a simply supported beam
2.4 Behaviour of RC Beams in Fire
2.4.1 Simply Supported RC beams (Axially and Rotationally Unrestrained at
Ends)
The fire behaviour of a simply supported RC beam is relatively straightforward.
When the beam is exposed to fire from underneath, it experiences downward
deflection due to loss of flexural stiffness and thermal bowing. During the initial
stages of fire exposure, the beam deflection is mainly due to thermal curvature
resulting from greater expansion of the bottom part of the beam than the top part. At
later stages of fire, the deflection caused by material property deterioration at high
M M
(c) Fully fixed
Uniform temperature gradient Ty
Δth
L
F F
𝛿𝑡ℎ
Uniform temperature gradient Ty
Uniform temperature gradient Ty
Uniform temperature gradient Ty
𝛿𝑡ℎ
(a) Axially unrestrained
(b) Axially restrained

CHAPTER 2 LITERATURE REVIEW
35
temperatures dominates. The rate of increase in the beam deflection accelerates until
formation of a plastic hinge at the mid-span signified by run-away deflection of the
beam. At the fire limit state, the reduced moment capacity of the beam is equal to the
applied moment (Shi et al., 2004, Dotreppe and Franssen, 1985, Lin T.D et al., 1981,
Dwaikat and Kodur, 2009a, Choi and Shin, 2011, Zha, 2003, Kodur and Dwaikat,
2007). The fire resistance of the beam based on the beam strength can be accurately
quantified by calculating the positive (sagging) moment capacity of the beam using
the reduced strengths of concrete and streel reinforcement at elevated temperatures.
2.4.2 Axially Restrained RC Beams
When a beam is axially restrained, fire exposure generates additional axial forces in
the beam. Figure 2.4 shows the typical behaviour of a simply supported RC beam in
fire with axial restraint and free rotation at the ends. As the longitudinal movement of
the beam due to thermal expansion is restrained, an axial compressive force F
develops in the beam.
Figure 2.4: Free body diagram of a beam with axial restraint (Buchanan, 2002)
At small deflections, the position of the axial compressive force at the supports is
generally close to soffit of the beam because the concrete temperatures are higher in
the lower part of the beam. Also, the line of action of the compressive force is
expected to be below the neutral axis of the cross-section at the mid-span where the
highest sagging bending moment exists. Thus, the compressive force in the beam can
be beneficial to the beam through development of arch action.
However, compressive arch action can only develop at very small beam deflections
(less than half of the beam depth) and can be rapidly lost as beam deflections
F

CHAPTER 2 LITERATURE REVIEW
36
increase (Buchanan, 2002, Wu and Lu, 2009). Afterwards, the compressive force in
the beam increases the sagging moment in the beam due to P-Δ effect. This
detrimental effect increases with increasing axial restraint due to higher compressive
force (Wu and Lu, 2009).
A review of the literature shows that among the fire resistance tests conducted on
individual RC beams with free rotation at ends, only the work by Dwaikat and Kodur
(2009a) has considered the effect of axial restraint. In their experimental work, they
examined the effects of the following variables: concrete compressive strength, fire
scenario, axial restraint condition and load level. Out of six tests, four beams were
simply supported with free expansion and rotation at ends. The other two beams
were axially restrained with a stiffness value of about 13 kN/mm but still free to
rotate at the ends. Results of these tests will be used in validating the finite element
model developed by the author in Chapter 3.
2.4.3 Rotationally Restrained RC Beams
End rotational restraint can improve the fire performance of RC beams in bending by
reducing the sagging bending moment in the span. Consider a beam with fixed-slide
end supports as shown in Figure 2.5, where the beam is free to expand but
rotationally restrained at the ends. When it is subject to fire exposure from
underneath, the beam tends to bow downward towards the fire due to non-uniform
temperature distribution within the depth of the beam. Owing to rotational restraint,
the hogging moment at the beam ends increase, causing a corresponding reduction in
sagging moment in the span. This lasts until formation of plastic hinges at the ends
when the hogging moment reaches the end moment capacities at elevated
temperatures. Afterwards, the hogging moment decreases and follows the bending
moment capacity-fire time relationship while the sagging moment increases until a
third plastic hinge forms in the span. At this stage, a complete plastic hinge
mechanism forms in the beam as shown in Figure 2.5.

CHAPTER 2 LITERATURE REVIEW
37
Figure 2.5: Rotational restrained, axially unrestrained beam in fire
Lin T.D et al. (1981) conducted a series of experimental tests to investigate the effect
of beam continuity, type of concrete, load level and moment redistribution on the
behaviour of continuous RC beams in fire. Figure 2.6 shows details of the tested
beams with a fire exposed main span of 6.1m between the supports and two short
cantilever spans beyond the supports. Different degrees of continuity were simulated
by varying the applied loads P1 and P2 on the unheated cantilevers. The results
confirm full redistribution of moments between the negative (hogging) and positive
(sagging) moments under fire before flexural failure of the beams.
Figure 2.6: Test setup, dimensions and reinforcement details of test specimens
by Lin T.D et al. (1981)
Formation a full plastic hinge mechanism in continuous beams was also reported in a
number of fire tests on two-span continuous RC beams carried out by Shi and Guo
w
Plastic hinges
6#6
2#6
Section a-a
2#6
4#6
Section b-b
6#6
2#6
Section c-c
Beam width=305mm
Beam depth=356mm
P3
1.83m 1.83m
P3 P3 P3
6.1m
P1 P2
a
a
b
b
c
c

CHAPTER 2 LITERATURE REVIEW
38
(1997) and Xu et al.(2015). Figure 2.7 provides details of the tested beams in each
study.
(a) Shi and Guo (1997) (b) Xu et al. (2015)
Figure 2.7: Test setup, dimensions and reinforcement details of test specimens
by Shi and Guo (1997) and Xu et al.(2015)
However, with axial restraint, the presence of an axial compressive force together
with bending moments in the beam will change the beam behaviour in fire. One of
the objectives of this present study is to examine whether it is possible to form a
complete hinge mechanism in axially restrained continuous beams (beams with both
axial and rotational restraints).
2.4.4 Axially and Rotationally Restrained RC Beams
In an RC frame, the adjacent structural members may impose both axial and
rotational restraints on the heated RC beam. Interactions between thermal expansion,
temperature gradient in the cross-section and material properties degradation at high
temperatures have important influences on the development of internal forces in the
beam and its failure modes. There are very few published studies on the influence of
axial and rotational restraints on the behaviour of RC beams in fire. The available
literature in this research field, which is of a numerical nature, is concerned with
l l
P P
a a
Φ8@200 Φ8@165
2Φ12
2Φ12
150
800
170
80
300
2Φ25
2Φ25
200
l=2400 mm
a=800 mm and 1600 mm l=1860 mm, a=930 mm
All dimensions in mm

CHAPTER 2 LITERATURE REVIEW
39
rotationally fix-ended beams with different axial restraint levels. This section
highlights their key findings.
Dwaikat and Kodur (2008), Riva and Franssen (2008) and Wu and Lu (2009)
performed numerical analyses on rotationally restrained RC beams subjected to a
uniformly distributed load at top and fire on three sides. Figure 2.8 shows the beam
details in these three studies. The axial restraint had temperature-independent linear
elastic behaviour. These three studies have reached different conclusions on the
effect of axial restraint on bending resistance of axially restrained and rotationally
fixed beams, as shown in Figure 2.9: the results of Dwaikat and Kodur (2008)
showing monotonically increasing bending failure time at increasing axial restraint
stiffness while those of Wu and Lu (2009) showing exactly opposite trend, and those
of Riva and Franssen (2008) showing initially increasing and then decreasing
bending resistance time.
(a) Riva and Franssen (2008) (b) Dwaikat and Kodur (2008) (c) Wu and Lu, (2009)
Figure 2.8:Dimensions and reinforcement details of beams simulated by
Dwaikat and Kodur (2008), Riva and Franssen (2008) and Wu and Lu (2009)
a
a
b
b
KA
w
L
2Φ20
2Φ20
B=350 mm
D=500 mm
L=6000 mm
4Φ20
2Φ20
Section a-a Section b-b
3Φ20
3Φ20
Section a-a &
Section b-b
B=300 mm
D=500 mm
L=6000 mm
3Φ20
3Φ20
Section a-a &
Section b-b
B=250 mm
D=400 mm
L=6000 mm
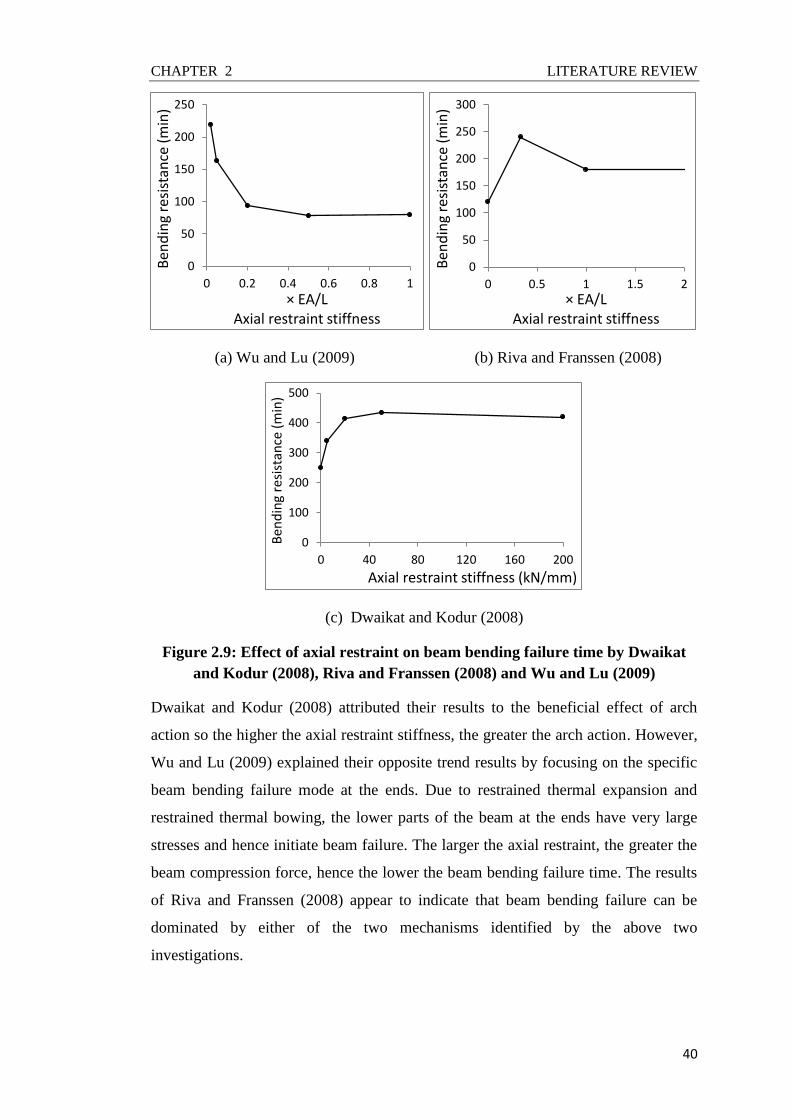
CHAPTER 2 LITERATURE REVIEW
40
(a) Wu and Lu (2009) (b) Riva and Franssen (2008)
(c) Dwaikat and Kodur (2008)
Figure 2.9: Effect of axial restraint on beam bending failure time by Dwaikat
and Kodur (2008), Riva and Franssen (2008) and Wu and Lu (2009)
Dwaikat and Kodur (2008) attributed their results to the beneficial effect of arch
action so the higher the axial restraint stiffness, the greater the arch action. However,
Wu and Lu (2009) explained their opposite trend results by focusing on the specific
beam bending failure mode at the ends. Due to restrained thermal expansion and
restrained thermal bowing, the lower parts of the beam at the ends have very large
stresses and hence initiate beam failure. The larger the axial restraint, the greater the
beam compression force, hence the lower the beam bending failure time. The results
of Riva and Franssen (2008) appear to indicate that beam bending failure can be
dominated by either of the two mechanisms identified by the above two
investigations.
0
100
200
300
400
500
0 40 80 120 160 200
Ben
din
g re
sist
ance
(m
in)
Axial restraint stiffness (kN/mm)
0
50
100
150
200
250
0 0.2 0.4 0.6 0.8 1
Ben
din
g re
sist
ance
(m
in)
× EA/L Axial restraint stiffness
0
50
100
150
200
250
300
0 0.5 1 1.5 2
Ben
din
g re
sist
ance
(m
in)
× EA/L Axial restraint stiffness

CHAPTER 2 LITERATURE REVIEW
41
Clearly, the behaviour of axially and rotationally restrained RC beams is complex
and a thorough investigation is necessary. In addition, the rotational restraint to the
RC beams will not be able to achieve the idealised fully fixed end rotational restraint
condition. Furthermore, if the ends and longitudinal steel bars in RC beams are
adequately anchored to the adjacent structure, the load carrying mechanism of
catenary action may develop at very large deflection after bending failure. So far,
there have been no studies on catenary action behaviour of RC beams in fire. The
limited studies above on restrained RC beams were only concerned with the beam
behaviour at small deflections under the combined effects of moment and
compressive force. In performance-based fire engineering design, large deflections
are permitted, provided that fire integrity is maintained. Experimental and numerical
studies on robustness of RC structures at ambient temperature have revealed the
significant role of catenary action in RC beams in mitigating progressive collapse.
The present study will investigate large deflection behaviour of RC beams in fire and
their potential in developing catenary action.
Therefore, much research is necessary to improve understanding of how different
axial and rotational boundary conditions influence the fire response of RC beams.
This will be the main focus of this research work.
2.5 RC Frames in Fire
Interactions between different structural members of a structure greatly influence the
fire resistance of structural members and the structure. Some previous research
studies have shown that the fire resistance of restrained RC beams can be much
higher than that estimated based on tabular rules. However, this depends on the
capability of the adjacent columns to withstand the additional internal forces exerted
by the connected beams. Moreover, because of interactions between structural
members, support and loading conditions of a member can be altered during fire.
This can lead to different member behaviour from that predicted assuming fixed
support and loading conditions. It is important to understand how the overall
behaviour of concrete frames is affected by structural interactions between different
structural members in fire.
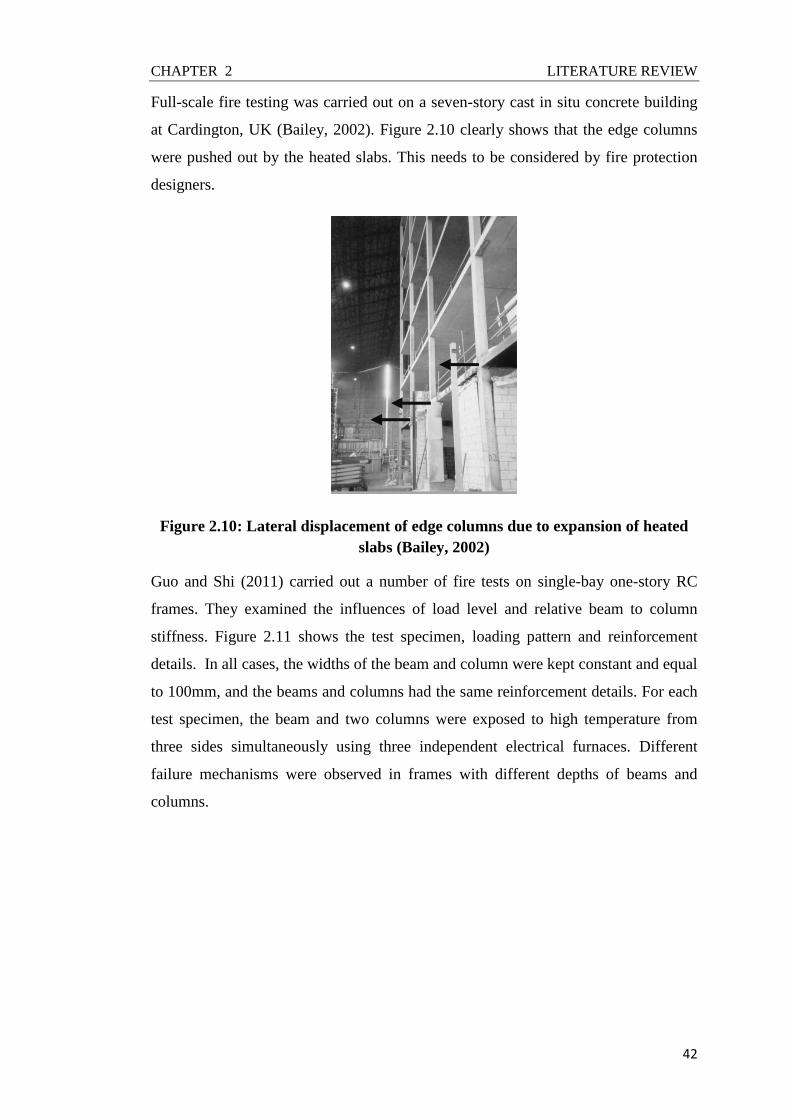
CHAPTER 2 LITERATURE REVIEW
42
Full-scale fire testing was carried out on a seven-story cast in situ concrete building
at Cardington, UK (Bailey, 2002). Figure 2.10 clearly shows that the edge columns
were pushed out by the heated slabs. This needs to be considered by fire protection
designers.
Figure 2.10: Lateral displacement of edge columns due to expansion of heated
slabs (Bailey, 2002)
Guo and Shi (2011) carried out a number of fire tests on single-bay one-story RC
frames. They examined the influences of load level and relative beam to column
stiffness. Figure 2.11 shows the test specimen, loading pattern and reinforcement
details. In all cases, the widths of the beam and column were kept constant and equal
to 100mm, and the beams and columns had the same reinforcement details. For each
test specimen, the beam and two columns were exposed to high temperature from
three sides simultaneously using three independent electrical furnaces. Different
failure mechanisms were observed in frames with different depths of beams and
columns.

CHAPTER 2 LITERATURE REVIEW
43
(a) Reinforcement details and dimensions of test specimens
(b) Test setup
Figure 2.11: Test arrangement by Guo and Shi (2011)
Frames with larger column depths failed by three plastic hinges in the beam. The first
plastic hinge was formed in the mid-span after significant reduction in the bending
moment capacity in that region. Bending moments at both ends of the beam then
increased as the load was redistributed. Two more plastic hinges formed at the ends
of the beam, resulting in failure of the frame. As the column rigidity was reduced,
due to a reduction in column depth, the bending moments at the beam ends were low
Section 1-1 Section 2-2
All dimensions
in mm
200
100
150 to
200
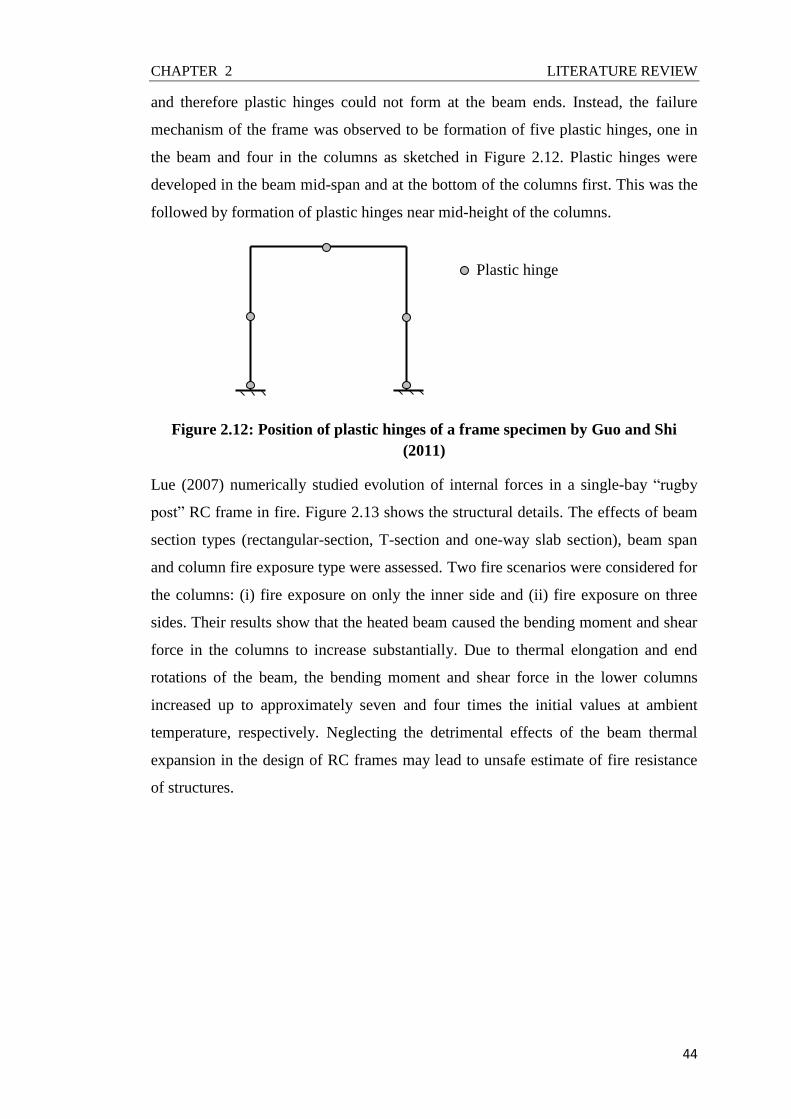
CHAPTER 2 LITERATURE REVIEW
44
and therefore plastic hinges could not form at the beam ends. Instead, the failure
mechanism of the frame was observed to be formation of five plastic hinges, one in
the beam and four in the columns as sketched in Figure 2.12. Plastic hinges were
developed in the beam mid-span and at the bottom of the columns first. This was the
followed by formation of plastic hinges near mid-height of the columns.
Figure 2.12: Position of plastic hinges of a frame specimen by Guo and Shi
(2011)
Lue (2007) numerically studied evolution of internal forces in a single-bay “rugby
post” RC frame in fire. Figure 2.13 shows the structural details. The effects of beam
section types (rectangular-section, T-section and one-way slab section), beam span
and column fire exposure type were assessed. Two fire scenarios were considered for
the columns: (i) fire exposure on only the inner side and (ii) fire exposure on three
sides. Their results show that the heated beam caused the bending moment and shear
force in the columns to increase substantially. Due to thermal elongation and end
rotations of the beam, the bending moment and shear force in the lower columns
increased up to approximately seven and four times the initial values at ambient
temperature, respectively. Neglecting the detrimental effects of the beam thermal
expansion in the design of RC frames may lead to unsafe estimate of fire resistance
of structures.
Plastic hinge

CHAPTER 2 LITERATURE REVIEW
45
Figure 2.13: Dimensions and reinforcement details of simulation structure of
Lue (2007)
Raouffard and Nishiyama (2015) conducted two one-third scale fire tests on two-
storey one-span moment resisting RC frames to study their fire behaviour and
resistance. One of the frames was heated until collapse, while the other was heated
for 60 minutes only to investigate post-fire behaviour of the frame. Figure 2.14
shows the details of the test frames. The test results of the frame heated to collapse
show appearance of flexural cracks in the mid-span and end sections. Many shear
cracks occurred in the lower columns, which was believed to be due to shear forces
caused by thermal expansion of the connected beam. The adopted seismic
reinforcement in the beam-column joints effectively contributed to prevent shear
failure in the joint and heated lower columns. At later stages of the fire test, a plastic
hinge formed in the mid-span of the heated beam. Hogging moments were noticed to
be small at the beam ends. Excessive deflections of the beam caused the beam to go
into catenary before failure of any member of the frame which was prevented from
happening by terminating the fire test to ensure safety of the test apparatuses.
400 mm
400 mm
8ϕ20
Section a-a
Beam width=350 mm
Beam depth=500 mm
3ϕ20
2ϕ20
Section b-b
2ϕ20
3ϕ20
Section c-c 6000 mm
DL=36 kN/m
LL=12 kN/m
3200 mm
1600 mm
b-b c-c
a-a
1000 kN ≈ 7 floors 1000 kN ≈ 7 floors

CHAPTER 2 LITERATURE REVIEW
46
Figure 2.14: Test setup (Raouffard and Nishiyama, 2015)
The above studies on RC frames in fire confirm importance of considering the
interactions between different structural members in a fire. However, there is a lack
of detailed quantitative understanding and a lack of simplified method to predict such
structural interactions. In particular, understanding on catenary action, developed at
very large beam deflections, has not been systematically examined. These will form
parts of the investigations in this research project.
2.6 Concrete Spalling
Fire-induced spalling involves the breaking off of layers (pieces) of concrete from
the surface of a structural element at elevated temperatures. Spalling has detrimental
consequences through (i) reducing the cross-sectional area of the structural element,
(ii) reducing the concrete covering to the steel reinforcement and (iii) increasing heat
transfer to the inner parts of the concrete cross-section. Therefore, spalling may
result in substantial reduction in the structural element load bearing capacity to a
level where the element is no longer able to withstand the load in fire.

CHAPTER 2 LITERATURE REVIEW
47
Spalling is broadly classified into three different types: explosive spalling, aggregate
spalling and corner spalling (Bailey, 2002). Explosive spalling occurs violently in the
early stages of fire due to pore water pressure and differential thermal stresses
induced within the concrete (Ali et al., 2010). The main factors influencing the
susceptibility to explosive spalling are moisture content, rate of heating, permeability
(or porosity of concrete) and mechanical stress levels (Bailey, 2002). During
exposure to fire, free and combined water in concrete close to the heated surface start
to evaporate. While some of the water vapour migrates, most of it is contained in the
gel pores, causing pore pressure to build-up. If this pore pressure exceeds the tensile
strength of the concrete, explosive spalling happens by taking chunks of concrete
from the structural element. Higher moisture content correspondingly gives rise to
increased pore pressure in the concrete, thus increasing the potential to explosive
spalling (Kodur and Dwaikat, 2012). Differential rates of thermal expansion within a
concrete cross-section are also thought to increase the risk of explosive spalling.
Furthermore, steep thermal gradient induces compressive stresses close to the heated
surface due to restrained thermal expansion and tensile stresses in the interior regions
where thermal expansion is lower (Khoury, 2000). The tensile (pore pressure)-
compressive (restrained thermal expansion) multiaxial stress state further reduces the
strength of concrete. However, pore pressure is believed to play a more significant
role in the occurrence of explosive spalling (Kodur and Dwaikat, 2012).
Aggregate spalling occurs due to aggregate failure near the fire exposed surface in
the early stages of fire. The damage of this type of spalling to a concrete member is
cosmetic and does not adversely influence its structural performance. Corner spalling
occurs in the late and often decay stages of fire, and is characterised by large pieces
of concrete at the corners of structural members falling off due to tensile cracks
forming at edges and corners. This type of spalling has minor effects on the
resistance of a concrete structure since the onset of this spalling is late, in which the
concrete and steel reinforcement have already been weakened substantially and the
fire temperature in the decay phase is lower (Bailey, 2002).
Explosive spalling is generally considered to be the most serious in terms of posing a
potential threat to structural integrity and instability. Therefore, the majority of
research and design codes are concerned with explosive spalling. Because of high
density and low permeability of high strength concrete that prevent the water vapour
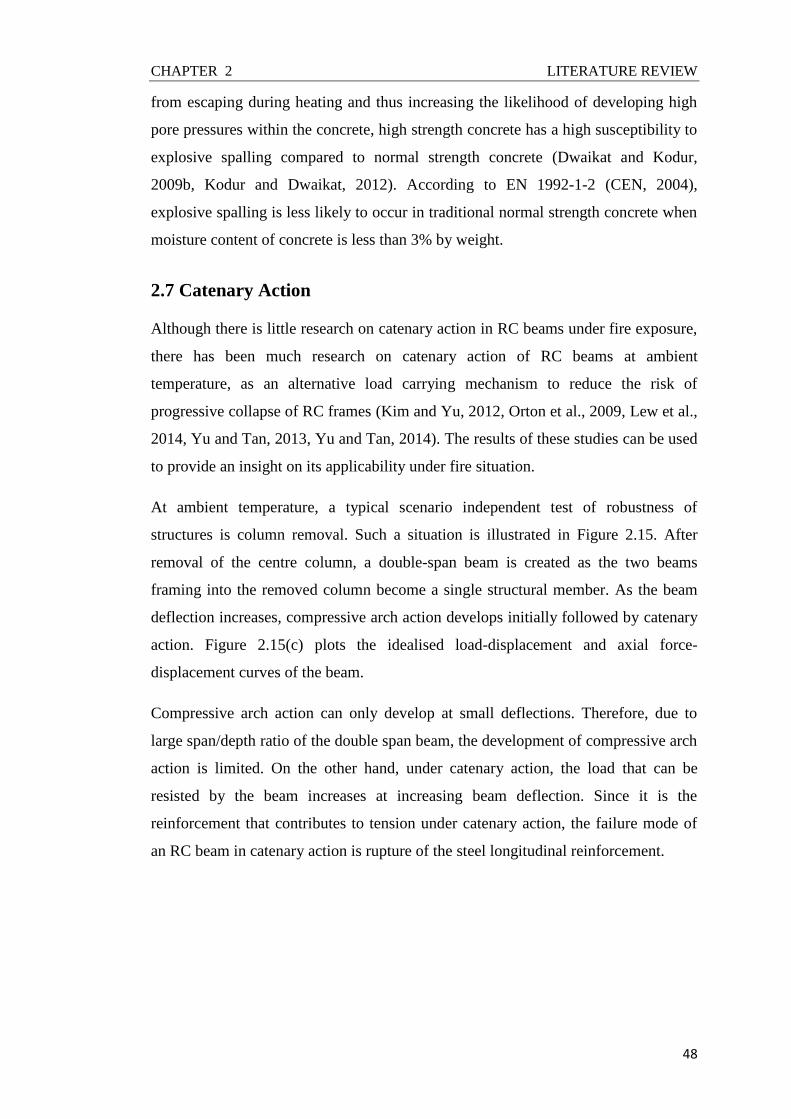
CHAPTER 2 LITERATURE REVIEW
48
from escaping during heating and thus increasing the likelihood of developing high
pore pressures within the concrete, high strength concrete has a high susceptibility to
explosive spalling compared to normal strength concrete (Dwaikat and Kodur,
2009b, Kodur and Dwaikat, 2012). According to EN 1992-1-2 (CEN, 2004),
explosive spalling is less likely to occur in traditional normal strength concrete when
moisture content of concrete is less than 3% by weight.
2.7 Catenary Action
Although there is little research on catenary action in RC beams under fire exposure,
there has been much research on catenary action of RC beams at ambient
temperature, as an alternative load carrying mechanism to reduce the risk of
progressive collapse of RC frames (Kim and Yu, 2012, Orton et al., 2009, Lew et al.,
2014, Yu and Tan, 2013, Yu and Tan, 2014). The results of these studies can be used
to provide an insight on its applicability under fire situation.
At ambient temperature, a typical scenario independent test of robustness of
structures is column removal. Such a situation is illustrated in Figure 2.15. After
removal of the centre column, a double-span beam is created as the two beams
framing into the removed column become a single structural member. As the beam
deflection increases, compressive arch action develops initially followed by catenary
action. Figure 2.15(c) plots the idealised load-displacement and axial force-
displacement curves of the beam.
Compressive arch action can only develop at small deflections. Therefore, due to
large span/depth ratio of the double span beam, the development of compressive arch
action is limited. On the other hand, under catenary action, the load that can be
resisted by the beam increases at increasing beam deflection. Since it is the
reinforcement that contributes to tension under catenary action, the failure mode of
an RC beam in catenary action is rupture of the steel longitudinal reinforcement.
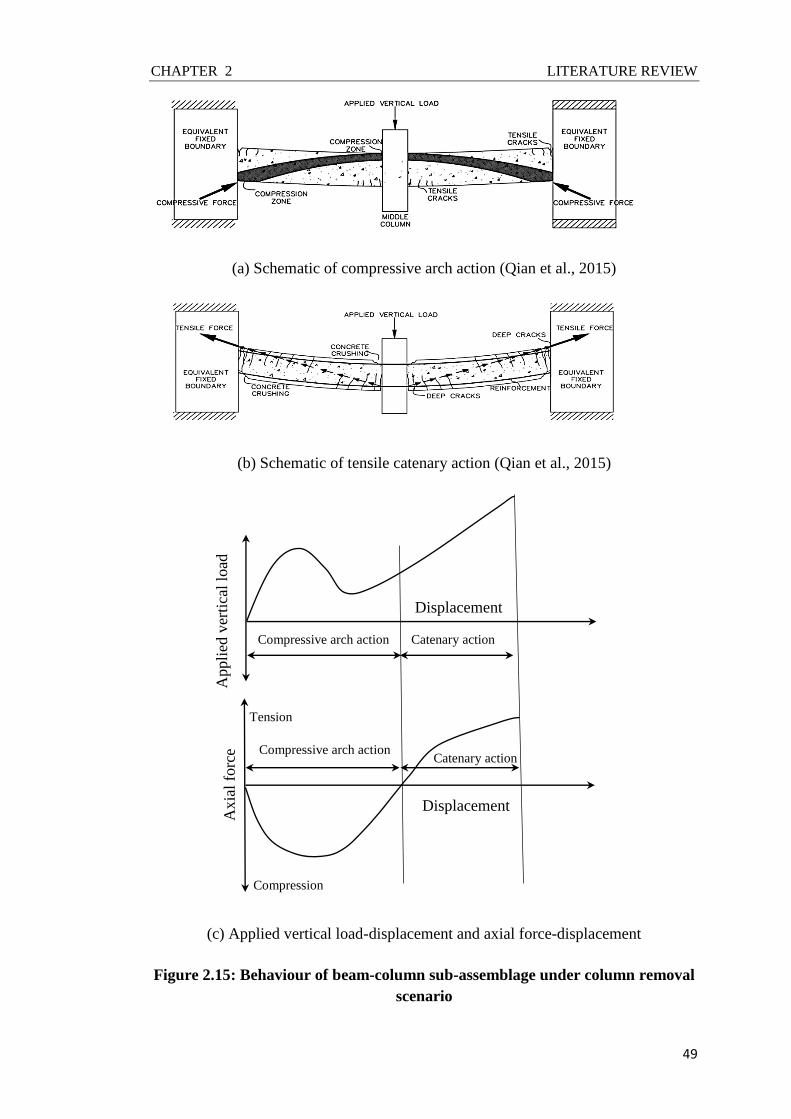
CHAPTER 2 LITERATURE REVIEW
49
(a) Schematic of compressive arch action (Qian et al., 2015)
(b) Schematic of tensile catenary action (Qian et al., 2015)
(c) Applied vertical load-displacement and axial force-displacement
Figure 2.15: Behaviour of beam-column sub-assemblage under column removal
scenario
Ax
ial
forc
e
Tension
Compression
Displacement
Compressive arch action Catenary action
Appli
ed v
erti
cal
load
Displacement
Compressive arch action Catenary action

CHAPTER 2 LITERATURE REVIEW
50
Regan (1975) performed catenary tests at Imperial College, London, on precast floor
strips. Due to poor continuity, inadequate anchorage and concentrated rotations, full
development of catenary action was not observed in some specimens. As a
conclusion, Regan stated that “the successful development of catenary action
requires that the members in question possess not only tensile strength but also
ductility, which is largely determined by detailing of the longitudinal reinforcement.”
Choi and Kim (2011) tested four scaled down two-span RC beam-column sub-
assemblages to investigate structural robustness when the middle column was
removed. The specific purpose of that experimental work was to examine the
influence of reinforcement details and concrete strength on catenary action
activation. The test results show that a seismically designed specimen based on ACI
2005 with adequate concrete compressive strength (concrete compressive cylinder
strength=30 MPa) was able to develop effective catenary action through the top bars
even after the rupture of the bottom bars. However, for specimens designed for non-
seismic loading, because of inadequate reinforcement detailing in terms of shear
reinforcement and anchoring of longitudinal bars by standard hooks, they failed
before catenary action was mobilised. Their premature failure was mainly due to
pulling out of longitudinal bars and concrete crushing at the exterior beam-column
joints. Joint failure also occurred before developing catenary action in the specimen
constructed with low concrete compressive strength of 17 MPa even with seismic
reinforcement detailing.
Stinger and Orton (2013) carried out experiments on three one-quarter scaled, two-
bay and two-storey RC frames with removed centre column at the lower storey to
improve and expand understanding of alternate load path mechanisms for
progressive collapse resistance. The first frame had no continuous reinforcement,
representing old buildings designed in accordance with ACI 318-71, while the
second one was designed to satisfy ACI-318-08 continuity requirements. A frame
was constructed with partial-height infill wall to investigate whether it could make a
contribution to collapse resistance with the same reinforcing detail as in the first
frame. Figure 2.16 shows dimensions and detailing of the frames. As regards the first
frame, because the beams experienced moment direction reversal at sections over the
removed column, discontinuity of steel bars provided little resistance to bending
moments at these sections. Nevertheless, compressive arch action significantly

CHAPTER 2 LITERATURE REVIEW
51
enhanced its flexural capacity by providing 40% of the ultimate flexural capacity of
the frame with continuous reinforcement. Another important finding was that no
noticeable increase from catenary action was achieved by the frame with continuous
bars over that without continuous bars, as demonstrated in Figure 2.17. This was due
to ability of the transverse reinforcement to transfer tension force from the positive to
negative longitudinal bars in the beam. Partial-height infill walls did not provide
apparent enhancement in progressive collapse resistance.
Figure 2.16: Elevation view and reinforcing details of the three RC frames
(Stinger and Orton, 2013)
Figure 2.17: Applied load versus displacement of the three test specimens by
Stinger and Orton (2013)

CHAPTER 2 LITERATURE REVIEW
52
Yu and Tan (2013) tested six one-half scaled RC beam-column sub-assemblages
with different reinforcement and span-to-depth ratios to study alternate load path
mechanisms for progressive collapse resistance. Each sub-assemblage was comprised
of a column stub at ends, two single-bay beams and one middle joint tested quasi-
statically. Figure 2.18 shows the test arrangement. The results show that catenary
action resistance, which was reached at deflections more than twice the beam depth,
was 28-128% higher than the compressive arch action resistance. Figure 2.19
illustrates failure mode of one of the specimens (specimen S5-1.24/1.24/23) at
catenary action capacity. Based on their parametric study results, a significant
increase in structural resistance of the sub-assemblage from catenary action can be
attained with a larger span-to-depth ratio and a higher flexural reinforcement,
especially the top reinforcement. Catenary action of a specimen with small span-to-
depth ratio had almost no effect on structural resistance because the specimen
experienced severe damage under shear failure.
Figure 2.18: Test arrangement and test specimen (Yu and Tan, 2013)
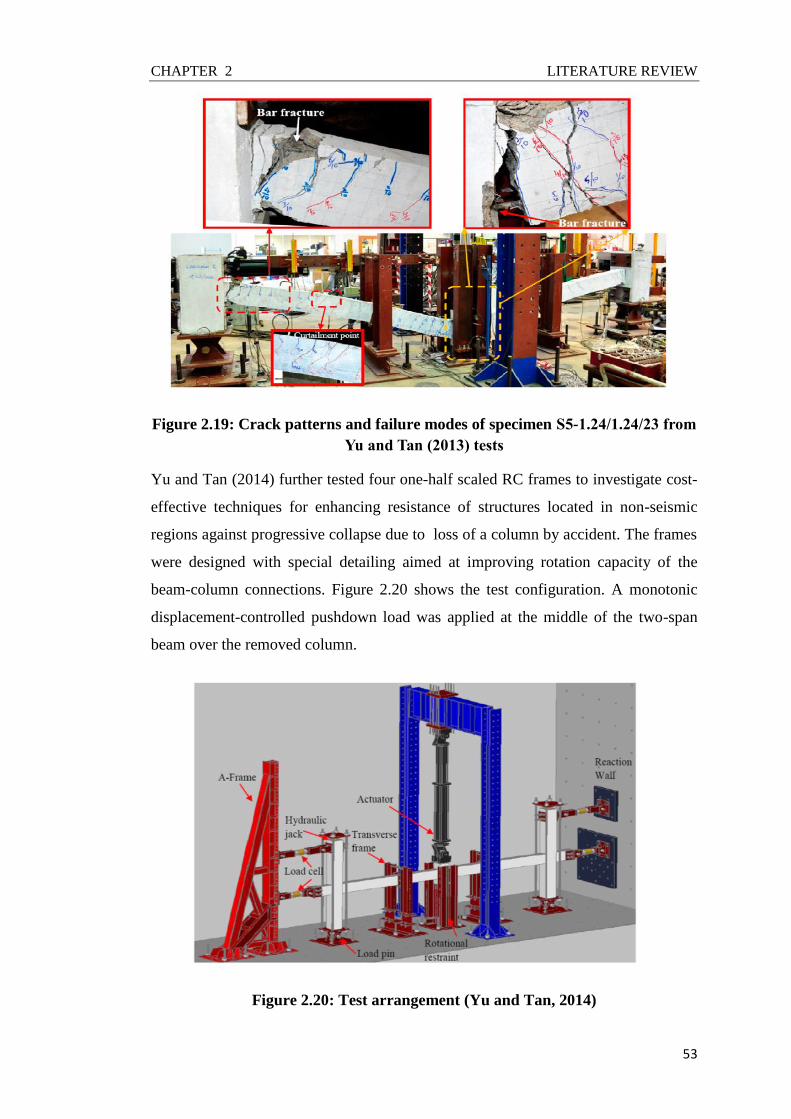
CHAPTER 2 LITERATURE REVIEW
53
Figure 2.19: Crack patterns and failure modes of specimen S5-1.24/1.24/23 from
Yu and Tan (2013) tests
Yu and Tan (2014) further tested four one-half scaled RC frames to investigate cost-
effective techniques for enhancing resistance of structures located in non-seismic
regions against progressive collapse due to loss of a column by accident. The frames
were designed with special detailing aimed at improving rotation capacity of the
beam-column connections. Figure 2.20 shows the test configuration. A monotonic
displacement-controlled pushdown load was applied at the middle of the two-span
beam over the removed column.
Figure 2.20: Test arrangement (Yu and Tan, 2014)

CHAPTER 2 LITERATURE REVIEW
54
One frame was designed with conventional detailing according to ACI 318-05
(Figure 2.21(a)). However, the frame was unable to recover after reaching
compressive arch action resistance due to limited rotational ductility of the
connections that caused successive fracture of the steel reinforcing bars. Three
innovative detailing techniques were used for the other three frames, as shown in
Figure 2.21. In the first technique (Figure 2.21(b)), a layer of reinforcement was
added at the middle-height of the beam section throughout its length. This layer of
reinforcement contributed to enhancing flexural rotation at critical sections and
functioned with the top reinforcement as ties to increase catenary action resistance.
Debonding the bottom steel bars (Figure 2.21(c)) was employed in the second
technique to prevent premature rupture of the bars due to strain concentration in the
joint areas. This was achieved by using plastic sleeves to spread out strain
concentration. In the third technique (Figure 2.21(d), partial hinges in the beam ends
were designed. The location of the partial hinges was determined so that they should
not influence flexural capacity of the beam under conventional loading and column
removal scenarios. This technique resulted in large plastic rotations of the two-span
beam and shifted the crushing and cracking of concrete and rupture of reinforcing
bars form the beam-joint interfaces to the partial hinge region. This had the effect of
reducing the length of beams which rotates as rigid blocks, thus increasing the beam
rotation without increasing reinforcement strain, thereby allowing large beam
deflections and high catenary action resistance. All the three techniques displayed
well-developed catenary action and considerably improved progressive collapse
resistance. However, the authors did not recommend using the debonding technique
for progressive collapse resistance because it may affect the arch action resistance.
The detailing technique with partial hinges was found to provide the most cost-
effective design.
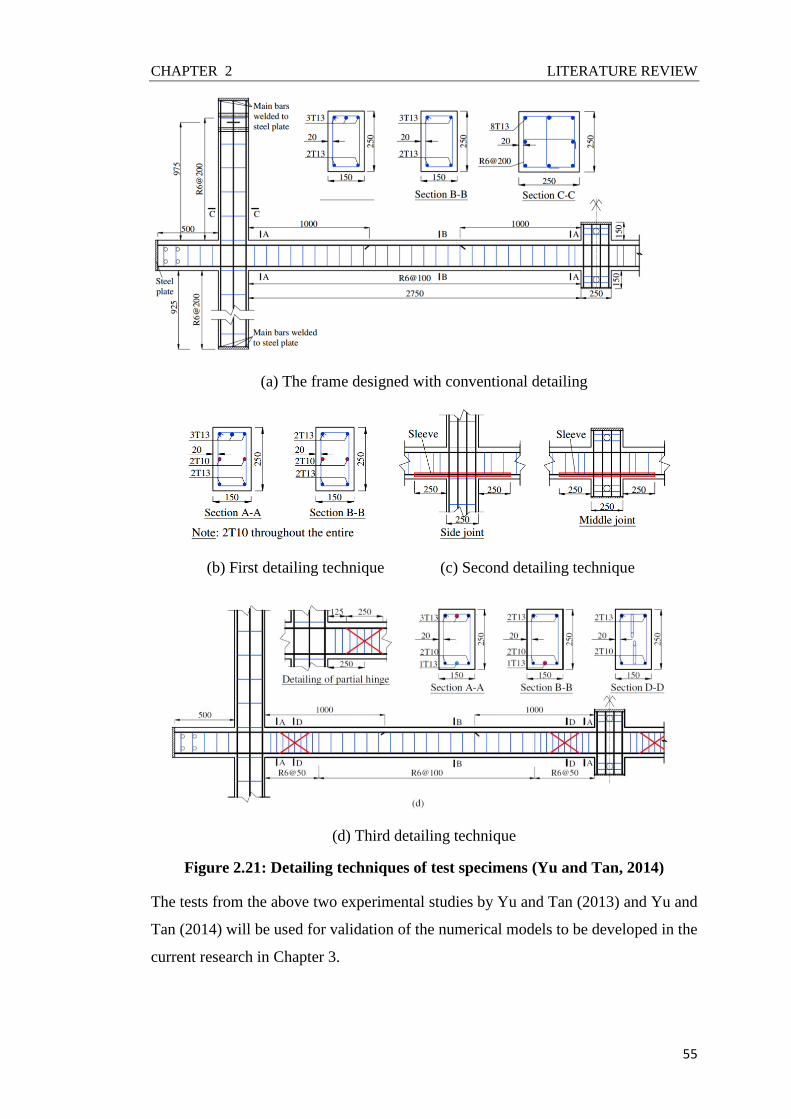
CHAPTER 2 LITERATURE REVIEW
55
(a) The frame designed with conventional detailing
(b) First detailing technique (c) Second detailing technique
(d) Third detailing technique
Figure 2.21: Detailing techniques of test specimens (Yu and Tan, 2014)
The tests from the above two experimental studies by Yu and Tan (2013) and Yu and
Tan (2014) will be used for validation of the numerical models to be developed in the
current research in Chapter 3.

CHAPTER 2 LITERATURE REVIEW
56
In summary, catenary action in RC beams can provide substantial extra load-carrying
capacity over flexural bending resistance. However, catenary action can only develop
at large beam deflections. The applied load on the beam is resisted by the vertical
components of the axial tensile catenary force sustained by the beam longitudinal
tensile reinforcement. Hence, whether catenary action will be completely developed
to resist the applied load depends on: (i) the amount of axial catenary force, (ii) the
beam deflection limit and (iii) the presence of a line of tension for the catenary force
to act throughout the beam. This study will further examine development of catenary
action in RC beams exposed to fire.
2.8 Simplified Calculation Methods of RC Beams in Fire
As an alternative to experimental tests and numerical simulations, simplified
approaches are essential and more practical for fire protection/structural engineers.
Recently, simplified methods have been developed to assess responses of RC beams
exposed to fire.
Kodur and Dwaikat (2011) derived simple analytical expressions for evaluating the
fire resistance of axially restrained RC beams. However, the approach is only aimed
at beams in flexural bending action with fully fixed rotational restraint at ends.
Kang and Hong (2004) developed an analytical model to trace the behaviour of RC
beams in fire. However, the model is limited for simply supported beams without end
axial or rotational restraint.
Kodur and Dwaikat (2008), Dwaikat and Kodur (2008) and (Kodur et al., 2009)
established a numerical computer model to simulate the response of RC beams at
elevated temperatures. In the structural analysis, sectional analysis is performed by
adopting a multi iteration approach and deriving moment-curvature relationships.
The total strain distribution of both concrete and reinforcing bars is expressed by a
reference strain and curvature. The model by Dwaikat and Kodur (2008) accounts for
the axial compressive force developed due to restrained thermal expansion. The
compressive force is predicated at each time step based on iterations through
satisfying the requirements of compatibility and equilibrium along the beam length.
The curvature at each time step is taken to be the same as in the preceding time step
for calculating the compressive force. Beam deflection is predicted through stiffness

CHAPTER 2 LITERATURE REVIEW
57
approach. The validated model was used to undertake extensive parametric studies to
quantify the effect of various parameters on the behaviour of simply supported,
axially restrained and rotationally restrained RC beams under fire. The model does
not account for different rotational restraint levels and large deflection behaviour in
catenary action.
El-Fitiany and Youssef (2014b) proposed a simplified approach to trace the fire
response of continuous RC beams, following the moment-curvature approach.
However, their proposed approach is only suitable for continuous beams with no
axial restraint.
It is clear from the aforementioned studies that there is no simplified method
available in the literature to predict behaviour of RC beams at elevated temperatures
with different degrees of axial and rotational restraints and for the entire history of
beam behaviour. Therefore, one of the main goals of this research is to propose such
a simplified method.
2.9 Numerical Finite Element Models
Ellingwood and Lin (1991), Zhaohui and Andrew (1997), Zha (2003), Bratina et al.
(2003), Capua and Mari (2007), Huang et al. (2009), Huang (2010), Wu and Lu
(2009) and Ožbolt et al. (2014) proposed numerical models to trace the behaviour of
RC structural members under fire. However, the performance of RC beams at very
large deflection in catenary action after bending failure is not reported in these finite
element models.
Riva and Franssen (2008) simulated RC beams in fire using a fibre beam element
model in the code ABAQUS. The model was proposed to study the fire performance
of restrained RC beams in flexural bending only. It was capable of capturing detailed
structural behaviour of restrained RC beams in fire associated with different failure
modes of the beam under the combined action of bending moment and axial
compressive force due to restrained thermal expansion.
Ellobody and Bailey (2008) and Ellobody and Bailey (2009) developed a robust 3D
numerical model in ABAQUS to analyse bonded and unbonded post-tensioned slabs
exposed to fire. An uncoupled thermal–mechanical analysis was performed in the
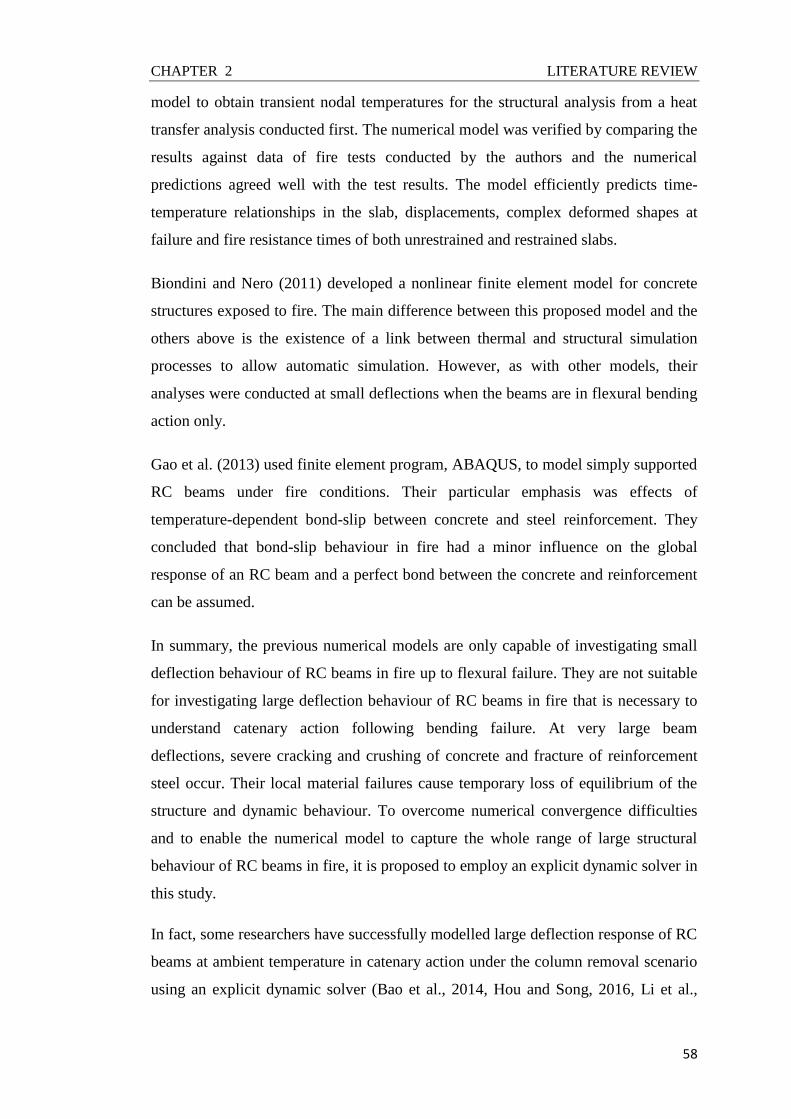
CHAPTER 2 LITERATURE REVIEW
58
model to obtain transient nodal temperatures for the structural analysis from a heat
transfer analysis conducted first. The numerical model was verified by comparing the
results against data of fire tests conducted by the authors and the numerical
predictions agreed well with the test results. The model efficiently predicts time-
temperature relationships in the slab, displacements, complex deformed shapes at
failure and fire resistance times of both unrestrained and restrained slabs.
Biondini and Nero (2011) developed a nonlinear finite element model for concrete
structures exposed to fire. The main difference between this proposed model and the
others above is the existence of a link between thermal and structural simulation
processes to allow automatic simulation. However, as with other models, their
analyses were conducted at small deflections when the beams are in flexural bending
action only.
Gao et al. (2013) used finite element program, ABAQUS, to model simply supported
RC beams under fire conditions. Their particular emphasis was effects of
temperature-dependent bond-slip between concrete and steel reinforcement. They
concluded that bond-slip behaviour in fire had a minor influence on the global
response of an RC beam and a perfect bond between the concrete and reinforcement
can be assumed.
In summary, the previous numerical models are only capable of investigating small
deflection behaviour of RC beams in fire up to flexural failure. They are not suitable
for investigating large deflection behaviour of RC beams in fire that is necessary to
understand catenary action following bending failure. At very large beam
deflections, severe cracking and crushing of concrete and fracture of reinforcement
steel occur. Their local material failures cause temporary loss of equilibrium of the
structure and dynamic behaviour. To overcome numerical convergence difficulties
and to enable the numerical model to capture the whole range of large structural
behaviour of RC beams in fire, it is proposed to employ an explicit dynamic solver in
this study.
In fact, some researchers have successfully modelled large deflection response of RC
beams at ambient temperature in catenary action under the column removal scenario
using an explicit dynamic solver (Bao et al., 2014, Hou and Song, 2016, Li et al.,

CHAPTER 2 LITERATURE REVIEW
59
2016, Pham et al., 2017, Sadek et al., 2011). However, the structures in these studies
were loaded quasi-statically under a displacement-controlled pushdown force. This is
not suitable for RC beams under distributed loads. Furthermore, the explicit
simulation approach for elevated temperature modelling of restrained RC beams has
not been utilised to date.
Therefore, an important aim of this research is to develop a robust 3D explicit
dynamic finite element model to be implemented in the computer program ABAQUS
so that it is able to trace the highly nonlinear response of RC structures at ambient
temperature and in fire. Issues and key aspects of the simulation model, including
very small time increment and means to control local instability, will be discussed in
detail in Chapter 3.
2.10 Summary of Literature Review and Research Originality
Based on the findings of literature review, the following main conclusions can be
drawn:
Although many studies have been carried out to investigate the behaviour of
RC beams in fire, very few studies have considered the effects of axial and
rotational restraints. When axial restraint is present, there is a lack of clear
understanding of beam behaviour under different rotational restraints and
there are inconsistencies in the effects of axial restraint on beam’s flexural
bending resistance.
Catenary action in RC beams at very large deflection plays a crucial role in
enhancing robustness of RC structures. However, previous research studies
have only investigated catenary action behaviour in RC structures at ambient
temperature. All the existing studies on axially RC beams in fire are
concerned with beam behaviour at small deflections up to bending failure.
The existing fire resistance design approaches do not consider realistic
boundary conditions and structural interactions.
The existing numerical simulation models for concrete structures in fire are
based on static solvers which cannot capture structural behaviour involving
temporary loss of structural equilibrium caused by local material failure
(crushing and cracking of concrete and fracture of steel reinforcement).

CHAPTER 2 LITERATURE REVIEW
60
Based on the above summary, the main objectives of this research are:
1. To develop and validate a 3D numerical simulation model using the finite
element code ABAQUS/Explicit so that it is suitable for simulating RC
structural members subject to large deformations in fire.
2. To conduct a numerical parametric study on restrained RC beams in fire to
gain a comprehensive understanding of the effects of axial and rotational
restraints on beam behaviour in flexural action and in catenary action.
3. To propose a simplified calculation approach to predict the behaviour of
axially and rotationally restrained RC beams exposed to fire throughout the
whole history of behaviour.
4. To investigate the effects of structural interaction on fire resistance of RC
framed structures using the finite element model developed in (1).
CHAPTER 3 EXPLICIT MODELLING OF LARGE DEFLECTION BEHAVIOUR OF
RESTRAINED REINFORCED CONCRETE BEAMS IN FIRE
61
CHAPTER 3
EXPLICIT MODELLING OF LARGE DEFLECTION
BEHAVIOUR OF RESTRAINED REINFORCED
CONCRETE BEAMS IN FIRE
3.1. Introduction
Faithful numerical simulation of the large deformation structural behaviour of RC
structural members presents serious challenges due to the material failures that can
occur, including concrete cracking, crushing and reinforcement fracture (which may
cause temporary loss of equilibrium of the structure and dynamic behaviour), and
very severe geometrical nonlinearities. Coupled with changing temperatures, it is not
feasible to numerically model the structure using a conventional static analysis.
The shortcoming of the static analysis in modelling structures that suffer temporary
loss of stability at large deformations can be overcome by performing a dynamic
analysis procedure with handling the problem quasi-statically. In the finite element
method, time integration algorithms for dynamic problems can generally be
classified as either implicit or explicit. In the implicit dynamic analysis, the actual
time of a quasi-static problem can be used and large time increments may be taken.
Inertia effects are introduced when loss of stability happens in the quasi-static
response. An iterative process is carried out at the end of each time increment to
satisfy the equilibrium equations. However, for problems with high geometric and
material nonlinearities, the unconditionally stable implicit procedure usually
experiences sever convergence difficulties, resulting in either taking many iterations
or premature numerical failure of the analysis. The convergence difficulties
encountered in the implicit method can be solved using explicit dynamic algorithm.
In the explicit method, central-difference time integration is employed. The solution
at the current time step is performed based on the kinematic state from the previous
time step. Local variables are directly predicted without the need of formation and
inversion of global matrices and no iterations are required.
CHAPTER 3 EXPLICIT MODELLING OF LARGE DEFLECTION BEHAVIOUR OF
RESTRAINED REINFORCED CONCRETE BEAMS IN FIRE
62
This research explores the explicit modelling approach. Because the explicit time
integration algorithm is continually stable, the time increment has to be very small.
This makes it problematic when applying this modelling approach to fire conditions
because fire exposure has long durations. In addition, several controlling parameters
should be addressed carefully to obtain quasi-static response. Therefore, an important
task in implementing the explicit simulation approach is to resolve this challenge.
Two techniques may be considered, either separately or together, to achieve a
computationally economical explicit solution without compromising accuracy of the
simulation. These are (a) artificially increasing the loading speed (load factoring) and
(b) artificially increasing the mass of the structure to increase the stable time step
(mass scaling). This chapter will present details of the above mentioned two
approaches and provide guidance on their implementations for 3D restrained RC
beams at ambient and elevated temperatures using the ABAQUS/Explicit solver. To
validate the developed explicit modelling approach, the simulation results will be
compared against relevant test results, including the ambient temperature tests on
axially restrained RC beams by Yu and Tan (2013) and Yu and Tan (2014) and the
fire tests on axially restrained RC beams by Dwaikat and Kodur (2009a).
3.2. Development of the Explicit Modelling Methodology
The ambient temperature tests of Yu and Tan (2013) and Yu and Tan (2014) on
axially restrained RC beams will be used to explain the development of the explicit
modelling approach. These tests were selected owing to their comprehensive
reporting of the test arrangement and results.
3.2.1 Brief Introduction to the Tests by Yu and Tan (2013) and Yu And Tan
(2014)
Figures 2.18 and 2.20 show the test arrangements and Figure 3.1 shows the sub-
assemblage and the frame details. The three sub-assemblage test specimens, denoted
as S4, S5 and S7, comprised of two enlarged column stubs at the ends, two single-
bay beams and one middle joint. The experiments examined the effects of varying
reinforcement ratio and beam span-to-depth ratio. In the two frame specimens,
detonated as F2 and F4, the column stubs were replaced by side columns and beam
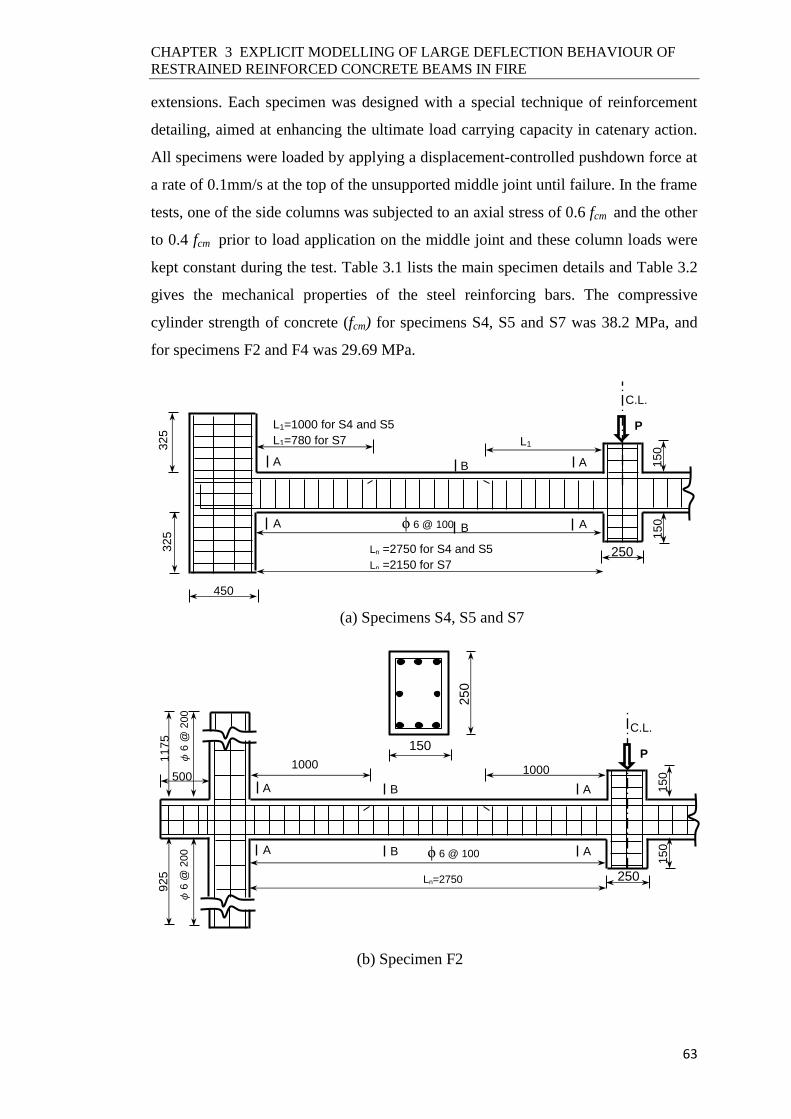
CHAPTER 3 EXPLICIT MODELLING OF LARGE DEFLECTION BEHAVIOUR OF
RESTRAINED REINFORCED CONCRETE BEAMS IN FIRE
63
extensions. Each specimen was designed with a special technique of reinforcement
detailing, aimed at enhancing the ultimate load carrying capacity in catenary action.
All specimens were loaded by applying a displacement-controlled pushdown force at
a rate of 0.1mm/s at the top of the unsupported middle joint until failure. In the frame
tests, one of the side columns was subjected to an axial stress of 0.6 fcm and the other
to 0.4 fcm prior to load application on the middle joint and these column loads were
kept constant during the test. Table 3.1 lists the main specimen details and Table 3.2
gives the mechanical properties of the steel reinforcing bars. The compressive
cylinder strength of concrete (fcm) for specimens S4, S5 and S7 was 38.2 MPa, and
for specimens F2 and F4 was 29.69 MPa.
Ln =2750 for S4 and S5
Ln =2150 for S7
15
0 L1
ϕ 6 @ 100
250
L1=1000 for S4 and S5
L1=780 for S7
15
0
32
5
32
5
450
P
C.L.
B
B
A
A
A
A
(a) Specimens S4, S5 and S7
P
C.L.
15
0
11
75
1000 500
ϕ 6 @ 100
Ln=2750 250
1000
92
5
15
0
𝜙 6
@ 2
00
𝜙 6
@ 2
00
A
A
B
B
A
A
(b) Specimen F2
150
250
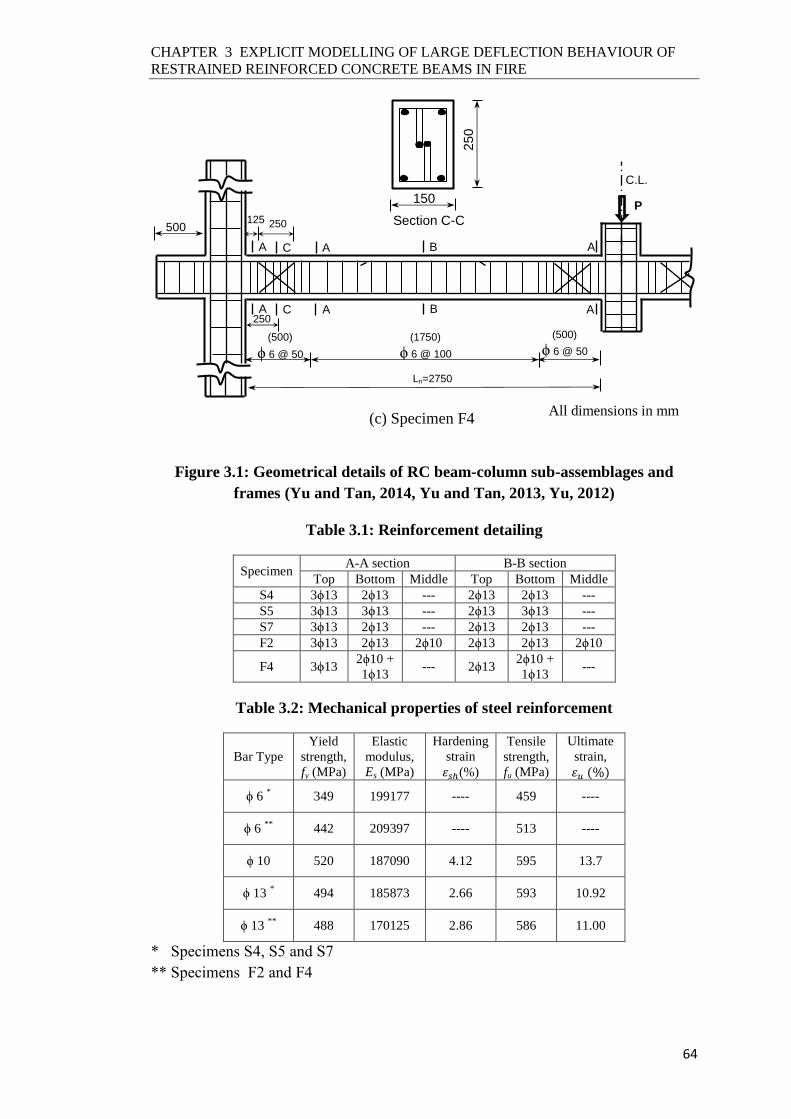
CHAPTER 3 EXPLICIT MODELLING OF LARGE DEFLECTION BEHAVIOUR OF
RESTRAINED REINFORCED CONCRETE BEAMS IN FIRE
64
Figure 3.1: Geometrical details of RC beam-column sub-assemblages and
frames (Yu and Tan, 2014, Yu and Tan, 2013, Yu, 2012)
Table 3.1: Reinforcement detailing
Specimen A-A section B-B section
Top Bottom Middle Top Bottom Middle
S4 3ϕ13 2ϕ13 --- 2ϕ13 2ϕ13 ---
S5 3ϕ13 3ϕ13 --- 2ϕ13 3ϕ13 ---
S7 3ϕ13 2ϕ13 --- 2ϕ13 2ϕ13 ---
F2 3ϕ13 2ϕ13 2ϕ10 2ϕ13 2ϕ13 2ϕ10
F4 3ϕ13 2ϕ10 +
1ϕ13 --- 2ϕ13
2ϕ10 +
1ϕ13 ---
Table 3.2: Mechanical properties of steel reinforcement
Bar Type
Yield
strength,
fy (MPa)
Elastic
modulus,
Es (MPa)
Hardening
strain
𝜀𝑠ℎ(%)
Tensile
strength,
fu (MPa)
Ultimate
strain,
𝜀𝑢 (%)
ϕ 6 * 349 199177 ---- 459 ----
ϕ 6 **
442 209397 ---- 513 ----
ϕ 10 520 187090 4.12 595 13.7
ϕ 13 * 494 185873 2.66 593 10.92
ϕ 13 **
488 170125 2.86 586 11.00
* Specimens S4, S5 and S7
** Specimens F2 and F4
All dimensions in mm
Ln=2750
(500)
ϕ 6 @ 50
500 125
(500)
ϕ 6 @ 50
(1750)
ϕ 6 @ 100
250
250
A
A
B
B
A
A
P
C.L.
C
C
A
A
(c) Specimen F4
150
250
Section C-C

CHAPTER 3 EXPLICIT MODELLING OF LARGE DEFLECTION BEHAVIOUR OF
RESTRAINED REINFORCED CONCRETE BEAMS IN FIRE
65
3.2.2 Element Type, Boundary Conditions and Load Application
In this study, three-dimensional 8-node linear reduced-integration brick elements
(C3D8R) and two-node linear three-dimensional truss elements (T3D2) in ABAQUS
are used for modelling concrete and steel reinforcement, respectively. The optimal
mesh size will be identified in the following sections. Much attention was paid to the
simulation of the boundary conditions of the beam-column sub-assemblages and
frames. This is because there were several interactions at the supports, as illustrated
in Figure 3.2, and the accuracy of FE simulation results critically depends on
accurate specification of these interactions. In the laboratory tests, one end of the
specimen was restrained by an A-Frame and the other end by a reaction wall through
two horizontal pin-pin connections. In the simulation model, in order to avoid any
local stress concentration, the same assembly of steel plates and steel rods as in the
tests was created in the simulation model to anchor the beams to the connections by
using the ABAQUS “Tie constraint”. “Tie restraint” was also used to connect the top
and bottom column end plates to the concrete columns. In order to simulate the pin
boundary condition as in the actual tests and to make sure that each plate rotated
around the pin during the loading process, all the plates were modelled as rigid
bodies using “Rigid body constraint” in ABAQUS.
(a) Specimens S4, S5 and S7 (Yu and Tan, 2013)
ux=uy=uz=0
Pin
Connect
or
Pin
uy=uz=0
Rigid plate
Beam longitudinal
bar
Beam transverse
bar
Column transverse bar
Column longitudinal
bar
4 rods to avoid stress
concentration
Steel
roller
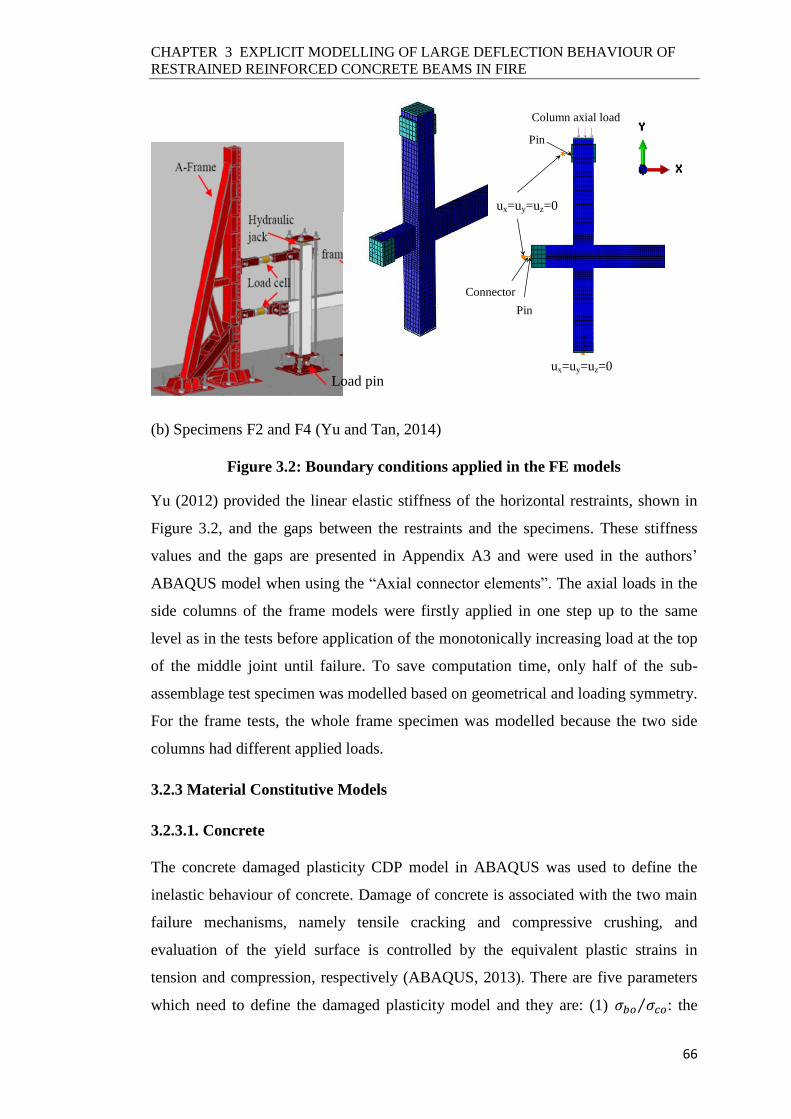
CHAPTER 3 EXPLICIT MODELLING OF LARGE DEFLECTION BEHAVIOUR OF
RESTRAINED REINFORCED CONCRETE BEAMS IN FIRE
66
(b) Specimens F2 and F4 (Yu and Tan, 2014)
Figure 3.2: Boundary conditions applied in the FE models
Yu (2012) provided the linear elastic stiffness of the horizontal restraints, shown in
Figure 3.2, and the gaps between the restraints and the specimens. These stiffness
values and the gaps are presented in Appendix A3 and were used in the authors’
ABAQUS model when using the “Axial connector elements”. The axial loads in the
side columns of the frame models were firstly applied in one step up to the same
level as in the tests before application of the monotonically increasing load at the top
of the middle joint until failure. To save computation time, only half of the sub-
assemblage test specimen was modelled based on geometrical and loading symmetry.
For the frame tests, the whole frame specimen was modelled because the two side
columns had different applied loads.
3.2.3 Material Constitutive Models
3.2.3.1. Concrete
The concrete damaged plasticity CDP model in ABAQUS was used to define the
inelastic behaviour of concrete. Damage of concrete is associated with the two main
failure mechanisms, namely tensile cracking and compressive crushing, and
evaluation of the yield surface is controlled by the equivalent plastic strains in
tension and compression, respectively (ABAQUS, 2013). There are five parameters
which need to define the damaged plasticity model and they are: (1) 𝜎𝑏𝑜 𝜎𝑐𝑜⁄ : the
Load pin
ux=uy=uz=0
Pin
Connector
Pin
ux=uy=uz=0
Column axial load

CHAPTER 3 EXPLICIT MODELLING OF LARGE DEFLECTION BEHAVIOUR OF
RESTRAINED REINFORCED CONCRETE BEAMS IN FIRE
67
ratio of initial equibiaxial compressive yield stress to initial uniaxial compressive
yield stress, (2) Kc: the ratio of the second stress invariant on the tensile meridian to
that on the compressive meridian for the yield function, which defines the shape of
the yield surface in the deviatoric plane, (3) 𝜖: the eccentricity, which defines the rate
at which the flow potential function approaches its asymptote in the meridian plane,
(4) 𝜓: the dilatation angle at high confining pressure, measured in the meridian plane
and (5) 𝜇: the viscosity parameter that represents the relaxation time of the visco-
plastic system. In this mode, the default ABAQUS values of the above five
parameters were used as listed in Table 3.3. Figure 3.3 shows the uniaxial
compressive stress-strain relationship according to CEB-FIP mode code (CEB, 1991)
up to the peak compressive stress. The softening branch was approximately modelled
by a straight line to a stress of 0.2 fcm and the rate of strength decline was controlled
by varying the limit of maximum concrete strain 𝑛1𝜀𝑐1 corresponding to 0.2 fcm.
Values of n1 between 3 and 4 were chosen in this study because they gave consistent
numerical results.
Table 3.3: Parameters for definition of the concrete damaged plasticity model
(ABAQUS, 2013)
Parameter name Value
Dilatation angle, 𝜓 36
Eccentricity, 𝜖 0.1
Ratio of initial equibiaxial compressive yield
stress to initial uniaxial compressive yield stress
𝜎𝑏𝑜 𝜎𝑐𝑜⁄
1.16
Yield surface shape factor Kc 0.667
Viscosity parameter 𝜇 0

CHAPTER 3 EXPLICIT MODELLING OF LARGE DEFLECTION BEHAVIOUR OF
RESTRAINED REINFORCED CONCRETE BEAMS IN FIRE
68
Figure 3.3: Concrete compressive stress-strain relationship
Many methods may be used to model cracked concrete. When the RC beam
deflections are small, satisfactory modelling results can be obtained by using any
shape as long as the area underneath the tension softening curve is kept constant
based on the tensile fracture energy Gf value and the crack band width. Furthermore,
the influences associated with slippage and bond between the reinforcement and the
concrete can be macroscopically represented by introducing tension stiffening effects
in the cracked concrete model. However, for problems involving large deflections
and severe tension cracks as in the current study, careful consideration should be
made when modelling tension softening behaviour in order to minimise numerical
simulation problems associated with strain localisation, stability loss and spurious
sensitivity of modelling results to mesh size. In addition, to allow the ABAQUS
option of embedding reinforcing bars in concrete, a more realistic tension stiffening
curve is necessary. This curve should implicitly consider the interactions between
reinforcement and concrete because explicit modelling of the reinforcement-concrete
bond is time consuming. In general, according to Maekawa et al. (2003), a power
form of tensile stress-strain curve, as shown in Figure 3.4, can be used. In Figure 3.4,
𝜀𝑐𝑟 is the cracking strain; c1 is a coefficient that controls the rate at which the tension
stress 𝜎𝑡 decreases with increasing strain 𝜀𝑡 after cracking. In general, the main
factors that influence the magnitude of coefficient c1 are tensile concrete fracture
energy, element mesh size and reinforcement ratio (Stevens et al., 1991, Salem and
Maekawa, 2004). The influence of fracture energy, which depends on element mesh
size, is important when dealing with propagation of cracks in plain concrete or
concrete with very little reinforcement, in which the tensile strength of concrete
𝐸𝑐𝑚 = Initial modulus of elasticity S
tres
s 𝝈𝒄
Strain 𝜺𝒄 𝜀𝑐1 𝜀𝑐𝑢 = 𝑛1𝜀𝑐1
0.2𝑓𝑐𝑚
𝑓𝑐𝑚
𝜎𝑐 =
𝐸𝑐𝑚𝐸𝑐1
𝜀𝑐𝜀𝑐1
− 𝜀𝑐𝜀𝑐1
2
1 + 𝐸𝑐𝑚𝐸𝑐1
− 2 𝜀𝑐𝜀𝑐1
𝑓𝑐𝑚
𝐸𝑐1 = 𝑓𝑐𝑚 0.0022⁄
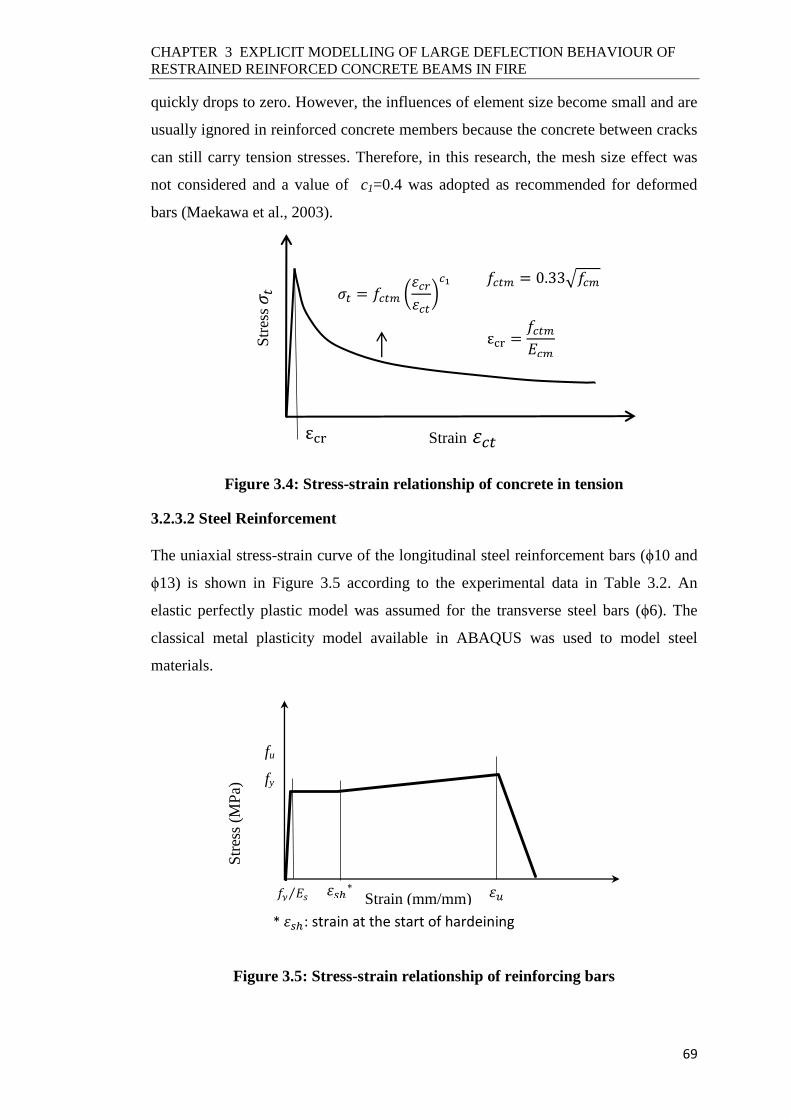
CHAPTER 3 EXPLICIT MODELLING OF LARGE DEFLECTION BEHAVIOUR OF
RESTRAINED REINFORCED CONCRETE BEAMS IN FIRE
69
quickly drops to zero. However, the influences of element size become small and are
usually ignored in reinforced concrete members because the concrete between cracks
can still carry tension stresses. Therefore, in this research, the mesh size effect was
not considered and a value of c1=0.4 was adopted as recommended for deformed
bars (Maekawa et al., 2003).
Figure 3.4: Stress-strain relationship of concrete in tension
3.2.3.2 Steel Reinforcement
The uniaxial stress-strain curve of the longitudinal steel reinforcement bars (ϕ10 and
ϕ13) is shown in Figure 3.5 according to the experimental data in Table 3.2. An
elastic perfectly plastic model was assumed for the transverse steel bars (ϕ6). The
classical metal plasticity model available in ABAQUS was used to model steel
materials.
Figure 3.5: Stress-strain relationship of reinforcing bars
𝜎𝑡 = 𝑓𝑐𝑡𝑚 𝜀𝑐𝑟𝜀𝑐𝑡
𝑐1
εcr Strain 𝜀𝑐𝑡
Str
ess 𝜎𝑡 𝑓𝑐𝑡𝑚 = 0.33 𝑓𝑐𝑚
εcr =𝑓𝑐𝑡𝑚𝐸𝑐𝑚
Str
ess
(MP
a)
Strain (mm/mm) 𝜀𝑢 𝑓𝑦 𝐸𝑠⁄
fy
fu
𝜀𝑠ℎ∗
* 𝜀𝑠ℎ: strain at the start of hardeining

CHAPTER 3 EXPLICIT MODELLING OF LARGE DEFLECTION BEHAVIOUR OF
RESTRAINED REINFORCED CONCRETE BEAMS IN FIRE
70
3.2.4 Mesh Sensitivity
Before studying parameters in the explicit simulation approach, a mesh sensitivity
study was conducted to determine the type and size of finite elements that can be
used to achieve converged solutions. In this study, three-dimensional 8-node linear
reduced-integration brick elements (C3D8R) in ABAQUS were used for modelling
concrete and two-node linear three-dimensional truss elements (T3D2), as embedded
regions in the host concrete elements, were used to model steel reinforcement.
Perfect bond between steel and concrete was assumed. Displacement-controlled
(DC) method was used. The damping ratio (𝜉), loading duration (LD) and mass
scaling factor (f) were 0%, 5s and 1.0, respectively. Determination of 𝜉, LD and f
values will be described in the following sections.
Figure 3.6 compares the simulation results using different mesh sizes against the test
results of the test structure S4. It can be found that mesh sizes between 25 to 35 mm
give results in good agreement with the test results. In the following simulations, the
concrete mesh size is 30mm. For reinforcement, an element size for 50 to 60 mm
achieved accurate results.
(a) Load-middle joint displacement
0
20
40
60
80
100
120
0 100 200 300 400 500 600
Load
(kN
)
Middle-joint displacement (mm)
25mm 30mm 35mm
40mm 50mm Test
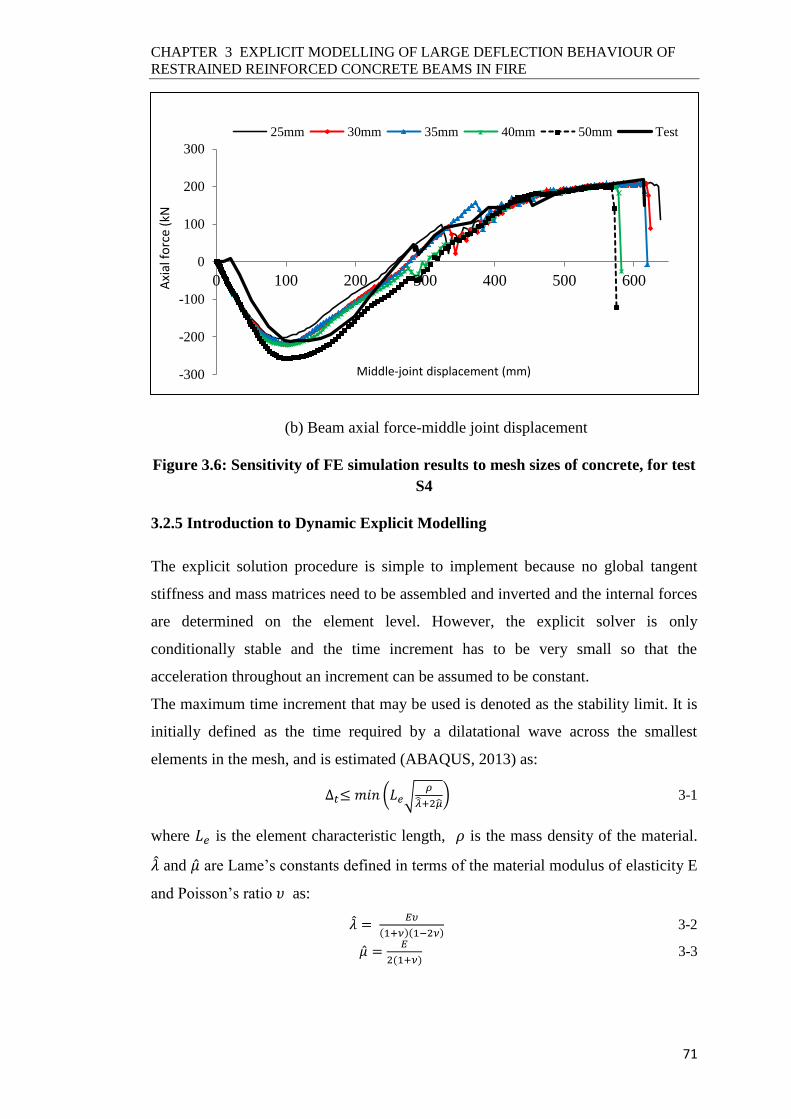
CHAPTER 3 EXPLICIT MODELLING OF LARGE DEFLECTION BEHAVIOUR OF
RESTRAINED REINFORCED CONCRETE BEAMS IN FIRE
71
(b) Beam axial force-middle joint displacement
Figure 3.6: Sensitivity of FE simulation results to mesh sizes of concrete, for test
S4
3.2.5 Introduction to Dynamic Explicit Modelling
The explicit solution procedure is simple to implement because no global tangent
stiffness and mass matrices need to be assembled and inverted and the internal forces
are determined on the element level. However, the explicit solver is only
conditionally stable and the time increment has to be very small so that the
acceleration throughout an increment can be assumed to be constant.
The maximum time increment that may be used is denoted as the stability limit. It is
initially defined as the time required by a dilatational wave across the smallest
elements in the mesh, and is estimated (ABAQUS, 2013) as:
∆𝑡≤ 𝑚𝑖𝑛 𝐿𝑒√𝜌
�̂�+2�̂� 3-1
where 𝐿𝑒 is the element characteristic length, 𝜌 is the mass density of the material.
�̂� and �̂� are Lame’s constants defined in terms of the material modulus of elasticity E
and Poisson’s ratio 𝜐 as:
�̂� = 𝐸𝜐
(1+𝜈)(1−2𝜈) 3-2
�̂� =𝐸
2(1+𝜈) 3-3
-300
-200
-100
0
100
200
300
0 100 200 300 400 500 600Axi
al f
orc
e (k
N
Middle-joint displacement (mm)
25mm 30mm 35mm 40mm 50mm Test
CHAPTER 3 EXPLICIT MODELLING OF LARGE DEFLECTION BEHAVIOUR OF
RESTRAINED REINFORCED CONCRETE BEAMS IN FIRE
72
As the analysis proceeds, the stable time increment may be defined in terms of the
highest frequency of the entire model 𝜔𝑚𝑎𝑥, satisfying the following condition:
∆𝑡≤2
𝜔𝑚𝑎𝑥(√1 + 𝜉𝑚𝑎𝑥
2 − 𝜉𝑚𝑎𝑥) 3-4
where 𝜉𝑚𝑎𝑥 is the damping ratio associated with 𝜔𝑚𝑎𝑥.
Two techniques may be used to control the time increment in ABAQUS/Explicit:
fixed time increment and full automatic time increment. In the former technique, a
constant time increment size smaller than the stability limit may be used. In the latter
technique, the integration scheme uses the stable time increment as the time interval
to establish the numerical solution. In this research, the full automatic time increment
strategy is employed because it can efficiently control the solution procedure through
updating the stability limit. This is important for problems that experience very large
deformations and high material nonlinearity that cause continual changes in the
highest system frequency, thereby changing the stability limit.
3.2.6 Reducing Computational Cost
The explicit solver is intended for high speed transient events in which the inertial
effects play a significant role in the solution. For simulating the response of RC
structures under fire exposure, because the fire duration is long, the explicit
simulation becomes computationally very expensive. This is also problematic for
simulating static response of structures under monotonic loading at ambient
temperature until failure occurs and for applying the targeted constant vertical load
before thermal loading starts. Therefore, an efficient simulation strategy is necessary
to drastically reduce the cost of computation but still ensure the solution is quasi-
static. This may be done by either artificially increasing the loading/temperature
increase rate (load factoring technique) or increasing the material density (mass
scaling). In the load factoring approach, loads, boundary conditions and nodal
temperatures imported from a heat transfer analysis can be applied over a shorter
period of time compared to the actual event time. The mass scaling option allows for
the use of the same actual event time through increasing the density of the material
so that the dilatational wave speed within the elements is reduced, leading to
increased stable time step size and so reducing the number of increments to complete
the solution. In both approaches, it is most important to determine how much a
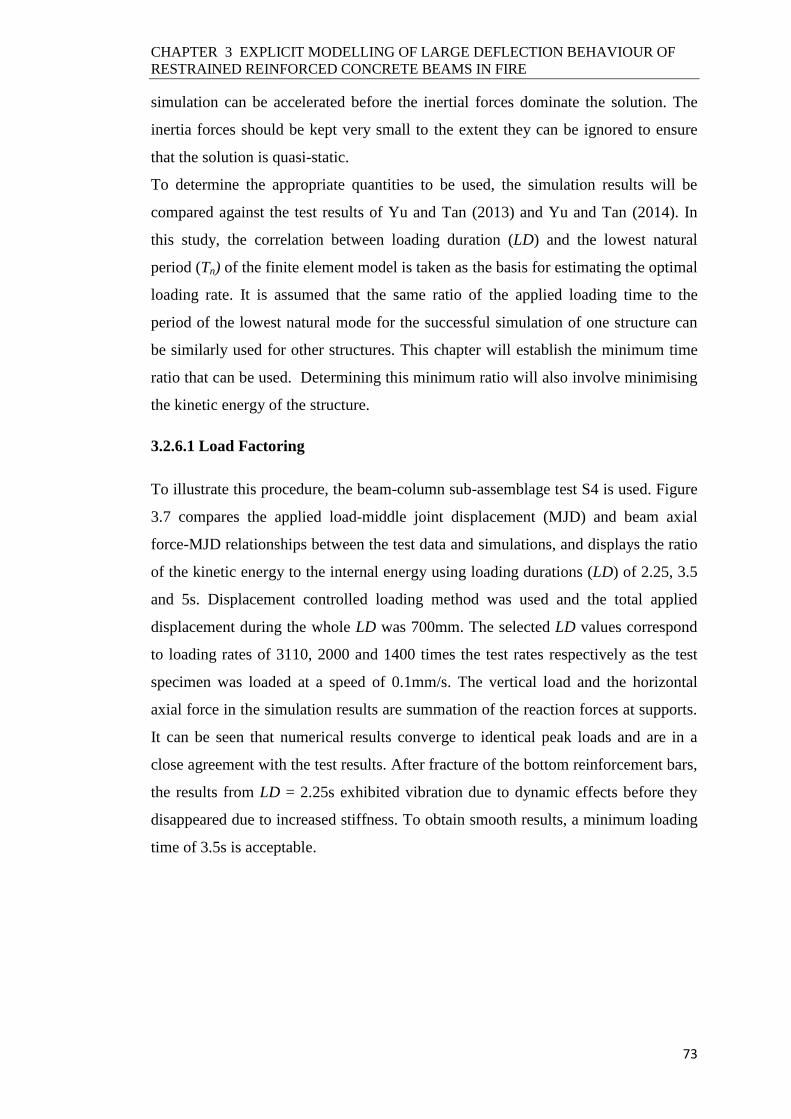
CHAPTER 3 EXPLICIT MODELLING OF LARGE DEFLECTION BEHAVIOUR OF
RESTRAINED REINFORCED CONCRETE BEAMS IN FIRE
73
simulation can be accelerated before the inertial forces dominate the solution. The
inertia forces should be kept very small to the extent they can be ignored to ensure
that the solution is quasi-static.
To determine the appropriate quantities to be used, the simulation results will be
compared against the test results of Yu and Tan (2013) and Yu and Tan (2014). In
this study, the correlation between loading duration (LD) and the lowest natural
period (Tn) of the finite element model is taken as the basis for estimating the optimal
loading rate. It is assumed that the same ratio of the applied loading time to the
period of the lowest natural mode for the successful simulation of one structure can
be similarly used for other structures. This chapter will establish the minimum time
ratio that can be used. Determining this minimum ratio will also involve minimising
the kinetic energy of the structure.
3.2.6.1 Load Factoring
To illustrate this procedure, the beam-column sub-assemblage test S4 is used. Figure
3.7 compares the applied load-middle joint displacement (MJD) and beam axial
force-MJD relationships between the test data and simulations, and displays the ratio
of the kinetic energy to the internal energy using loading durations (LD) of 2.25, 3.5
and 5s. Displacement controlled loading method was used and the total applied
displacement during the whole LD was 700mm. The selected LD values correspond
to loading rates of 3110, 2000 and 1400 times the test rates respectively as the test
specimen was loaded at a speed of 0.1mm/s. The vertical load and the horizontal
axial force in the simulation results are summation of the reaction forces at supports.
It can be seen that numerical results converge to identical peak loads and are in a
close agreement with the test results. After fracture of the bottom reinforcement bars,
the results from LD = 2.25s exhibited vibration due to dynamic effects before they
disappeared due to increased stiffness. To obtain smooth results, a minimum loading
time of 3.5s is acceptable.
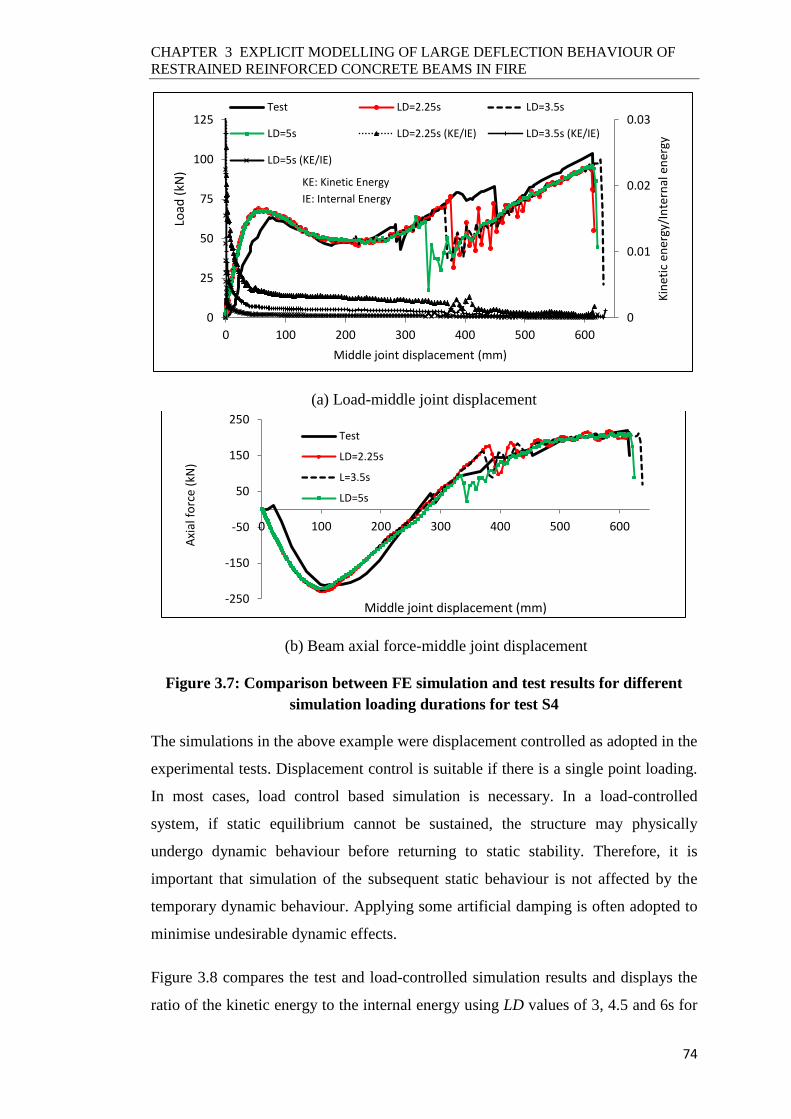
CHAPTER 3 EXPLICIT MODELLING OF LARGE DEFLECTION BEHAVIOUR OF
RESTRAINED REINFORCED CONCRETE BEAMS IN FIRE
74
(a) Load-middle joint displacement
(b) Beam axial force-middle joint displacement
Figure 3.7: Comparison between FE simulation and test results for different
simulation loading durations for test S4
The simulations in the above example were displacement controlled as adopted in the
experimental tests. Displacement control is suitable if there is a single point loading.
In most cases, load control based simulation is necessary. In a load-controlled
system, if static equilibrium cannot be sustained, the structure may physically
undergo dynamic behaviour before returning to static stability. Therefore, it is
important that simulation of the subsequent static behaviour is not affected by the
temporary dynamic behaviour. Applying some artificial damping is often adopted to
minimise undesirable dynamic effects.
Figure 3.8 compares the test and load-controlled simulation results and displays the
ratio of the kinetic energy to the internal energy using LD values of 3, 4.5 and 6s for
0
0.01
0.02
0.03
0
25
50
75
100
125
0 100 200 300 400 500 600
Kin
etic
en
ergy
/In
tern
al e
ner
gy
Load
(kN
)
Middle joint displacement (mm)
Test LD=2.25s LD=3.5s
LD=5s LD=2.25s (KE/IE) LD=3.5s (KE/IE)
LD=5s (KE/IE)
KE: Kinetic Energy
IE: Internal Energy
-250
-150
-50
50
150
250
0 100 200 300 400 500 600
Axi
al f
orc
e (k
N)
Middle joint displacement (mm)
Test
LD=2.25s
L=3.5s
LD=5s

CHAPTER 3 EXPLICIT MODELLING OF LARGE DEFLECTION BEHAVIOUR OF
RESTRAINED REINFORCED CONCRETE BEAMS IN FIRE
75
the same sub-assemblage test (S4). The total linear applied load was 110kN and the
damping ratio was 35%. Although the same maximum load carrying capacity at the
same MJD was obtained as for longer loading durations when the loading duration
was 3s, numerical oscillation during the catenary action stage continued. Therefore,
a minimum loading duration of 4.5s would be more appropriate for load-controlled
simulation.
(a) Load-middle joint displacement
(b) Beam axial force-middle joint displacement
Figure 3.8: Comparison between test and load-controlled simulation results for
different simulation loading durations (test specimen S4)
It is assumed that successful explicit simulations of different structures have similar
minimum LD/Tn ratios, i.e.:
𝐿𝐷1
𝑇𝑛,1=
𝐿𝐷2
𝑇𝑛,2 3-5
-300
-200
-100
0
100
200
300
0 100 200 300 400 500 600 700
Axi
al f
orc
e (k
N)
Middle joint displacement (mm)
Test LD=3s
LD=4.5s LD=6s
0
0.02
0.04
0.06
0.08
0.1
0
20
40
60
80
100
120
0 100 200 300 400 500 600 700
Kin
etic
en
ergy
/In
tern
al e
ner
gy
Load
(kN
)
Middle joint displacement (mm)
Test LD=3s (Load) LD=4.5s (Load)
Ld=6s (Load) LD=3s (KE/IE) LD=4.5s (KE/IE)
LD=6s (KE/IE)
KE: Kinetic Energy IE: Internal Energy

CHAPTER 3 EXPLICIT MODELLING OF LARGE DEFLECTION BEHAVIOUR OF
RESTRAINED REINFORCED CONCRETE BEAMS IN FIRE
76
The subscripts 1 and 2 denote two different structures. In the above examples, the
lowest natural frequency 𝜔𝑚𝑖𝑛1 of the model was 89.5 rad/s, giving the
corresponding 𝑇𝑛,1 of 0.070s. The value of 𝜔𝑚𝑖𝑛 can be determined from a frequency
analysis via “Static, linear perturbation” procedure in ABAQUS. Based on this
example, because the minimum LD for the displacement controlled simulation was
3.5s and that for the load controlled simulation was 4.5s, they give minimum LD/𝑇𝑛
of 50 for displacement controlled simulation and 64 for load-controlled simulation.
To demonstrate general applicability, these values will be used when comparing the
simulation results with the test results for the other structures tested by Yu and Tan
(2013) and Yu and Tan (2014) in the validation section of this chapter.
3.2.6.2 Material Damping
The temporary instability accompanying load-controlled simulation may lead to
significant increase in kinetic energy of the system. ABAQUS/Explicit introduces a
small amount of damping in the form of bulk viscosity. This damping helps to avoid
numerical issues such as element collapse in simulating extremely high-speed
dynamic problems (ABAQUS, 2013). Generally, predicting the exact value of
structural damping ratio is difficult. In the present research, Rayleigh damping in
ABAQUS/Explicit is used. It is described by a damping matrix in the following basic
form:
𝐶 = 𝜇𝑀 + 𝛽𝐾 3-6
where
C, M and K are the viscous damping, inertia mass and stiffness matrices of the
structure, respectively. 𝜇 is the mass proportional damping factor and 𝛽 is the
stiffness proportional damping factor.
For given values of 𝜇 and 𝛽, the damping ratio 𝜉𝑖 in a mode of vibration i can be
expressed as:
𝜉𝑖 =𝜇
2 𝜔𝑖+
𝛽𝜔𝑖
2 3-7
where 𝜔𝑖 is the natural frequency of mode i. The stiffness proportional damping
factor 𝛽 dramatically reduces the stable time increment and this would influence the
computational time (ABAQUS, 2013). Thus, it is more preferable to use 𝜇 to damp
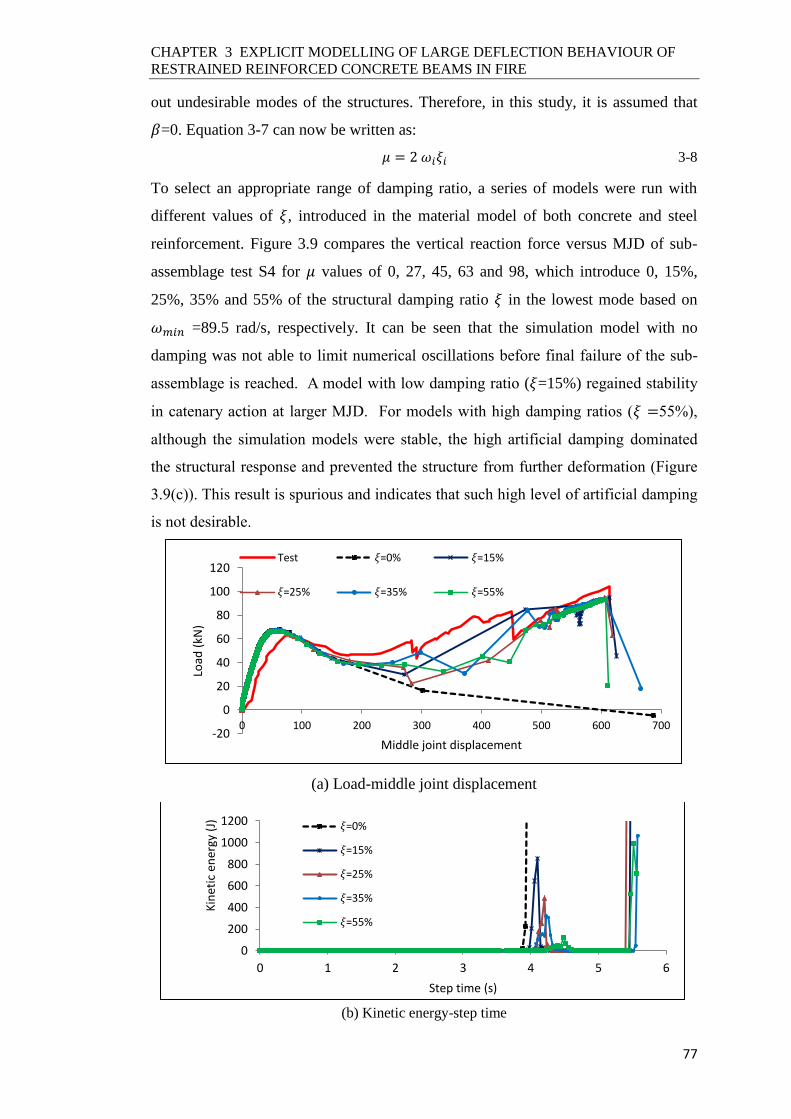
CHAPTER 3 EXPLICIT MODELLING OF LARGE DEFLECTION BEHAVIOUR OF
RESTRAINED REINFORCED CONCRETE BEAMS IN FIRE
77
out undesirable modes of the structures. Therefore, in this study, it is assumed that
𝛽=0. Equation 3-7 can now be written as:
𝜇 = 2 𝜔𝑖𝜉𝑖 3-8
To select an appropriate range of damping ratio, a series of models were run with
different values of 𝜉, introduced in the material model of both concrete and steel
reinforcement. Figure 3.9 compares the vertical reaction force versus MJD of sub-
assemblage test S4 for 𝜇 values of 0, 27, 45, 63 and 98, which introduce 0, 15%,
25%, 35% and 55% of the structural damping ratio 𝜉 in the lowest mode based on
𝜔𝑚𝑖𝑛 =89.5 rad/s, respectively. It can be seen that the simulation model with no
damping was not able to limit numerical oscillations before final failure of the sub-
assemblage is reached. A model with low damping ratio (𝜉=15%) regained stability
in catenary action at larger MJD. For models with high damping ratios (𝜉 =55%),
although the simulation models were stable, the high artificial damping dominated
the structural response and prevented the structure from further deformation (Figure
3.9(c)). This result is spurious and indicates that such high level of artificial damping
is not desirable.
(a) Load-middle joint displacement
(b) Kinetic energy-step time
-20
0
20
40
60
80
100
120
0 100 200 300 400 500 600 700
Load
(kN
)
Middle joint displacement
Test 𝜉=0% 𝜉=15%
𝜉=25% 𝜉=35% 𝜉=55%
0
200
400
600
800
1000
1200
0 1 2 3 4 5 6
Kin
etic
en
ergy
(J)
Step time (s)
𝜉=0%
𝜉=15%
𝜉=25%
𝜉=35%
𝜉=55%
CHAPTER 3 EXPLICIT MODELLING OF LARGE DEFLECTION BEHAVIOUR OF
RESTRAINED REINFORCED CONCRETE BEAMS IN FIRE
78
(c) Middle joint displacement- step time
(d) Load-step time
Figure 3.9: Comparison between test results and FE simulation results using
different damping ratio 𝝃 for test S4
The above message is reinforced when the reaction force of the structure is compared
between the simulation and test results (Figure 3.9(d)). For high damping ratios (𝜉
=55%), the simulation reaction forces are lower than the applied load. Therefore, it
is recommended using damping ratio 𝜉 in the range between 25% ≤ 𝜉 ≤ 35%.
The acceptable damping factor (𝜇) is structure specific. However, on the assumption
that successful explicit dynamic simulations (numerical stability and minor influence
of damping on structural response) have similar damping ratios and from Equation
3-8, the acceptable range of Rayleigh mass proportional damping 𝜇 for different
structures may be taken as 0.5𝜔𝑚𝑖𝑛 ≤ 𝜇 ≤ 0.7𝜔𝑚𝑖𝑛.
3.2.6.3 Mass Scaling
An alternative method to improve the efficiency of explicit dynamic simulation is to
adopt the mass scaling technique. This technique is attractive if it is desirable to
-700
-600
-500
-400
-300
-200
-100
0
0 1 2 3 4 5 6
Mid
dle
join
t d
isp
lace
men
t (m
m)
Step time (s)
𝜉=0%
𝜉=15%
𝜉=25%
𝜉=35%
𝜉=55%
-20
0
20
40
60
80
100
120
0 1 2 3 4 5 6
Load
(kN
)
Step time (s)
𝜉=0% 𝜉=15% 𝜉=25%
𝜉=35% 𝜉=55% Applied Load

CHAPTER 3 EXPLICIT MODELLING OF LARGE DEFLECTION BEHAVIOUR OF
RESTRAINED REINFORCED CONCRETE BEAMS IN FIRE
79
follow the real time structural behaviour. Furthermore, mass scaling can be applied
to some parts of structure where it is necessary to use non-uniform finite element
meshes for the structure. This is because the smallest elements will govern the stable
time for the whole system. In this case, selective mass scaling to the regions of small
elements can make the stable time increments more uniform.
From Equations 3-1 and 3-4, if the mass is scaled by a factor of say f, the stable time
increment increases by a factor of 𝑓. The number of time increments consequently
decreases by a factor of 𝑓. This would increase the dynamic side effects so the
value of f should be controlled to avoid spurious dynamic behaviour. It is necessary
to conduct a convergence study as for increasing the loading speed.
To investigate using adaptive mass scaling of structure, two analyses for the
benchmark model S4 were performed, one using displacement control and one using
load control. In the displacement control analysis, the loading speed was 0.1 mm/s
(test value) giving a loading duration of 7000s when the total imposed displacement
was 700mm. Replacing Tn in Equation 3-5 by 𝑓 gives:
𝐿𝐷1
𝑓1=
𝐿𝐷2
𝑓2 3-9
Therefore, if using mass scaling factor to achieve the same effect as shortening the
loading duration to LD1=5s, from Equation 3-9, a mass scaling factor of 1960000
(=(7000/5)2) would be necessary. In the load control simulation, assuming that the
actual loading duration was 3000s and mass scaling is applied to achieve the same
effect as shortening the loading duration to 6s but retaining the actual duration, then
the mass scaling factor would be 250000 (=(3000/6)2). Figure 3.10 compares the
simulation results and Table 3.4 shows the stable time increment and CPU
computation time for displacement-controlled and load-controlled simulations. The
closeness of the two sets of simulation results and CPU time in each case confirms
equivalence of the two simulation methods (loading factoring and mass scaling). As
stated before, adaptive mass scaling is preferred for performing an analysis with the
real process time. The results in Table 3.4 also show direct proportional reduction in
simulation time as the total loading duration is reduced (load factoring) or the stable
time step (mass factoring) is increased.

CHAPTER 3 EXPLICIT MODELLING OF LARGE DEFLECTION BEHAVIOUR OF
RESTRAINED REINFORCED CONCRETE BEAMS IN FIRE
80
(a) Displacement-controlled method
(b) Load-controlled method displacement
Figure 3.10: Comparison between simulation results using load factoring and
mass scaling for test S4
Table 3.4: Comparison between stable time increment and CPU time using load
factoring and mass scaling for test S4
Loading
method
Loading duration,
LD (s)
Mass scaling factor,
f
Stable time increment,
∆𝑡 (s)
CPU
time (s)
Displacement-
controlled
5 1 6.997E-6 4925
7000 1960000 8.88E-3 5294
Load-
controlled
6 1 6.997E-6 6887
3000 250000 3.174E-3 6966
0
20
40
60
80
100
120
0 100 200 300 400 500 600
Load
(kN
)
Middle joint displacement (mm)
Test
LD=5s, f=1, 𝜉=0%, μ=0
LD=7000s, f=1960000, 𝜉=0%, μ=0
0
20
40
60
80
100
120
0 100 200 300 400 500 600 700
Load
(kN
)
Middle joint displacement (mm)
Test
LD=6s, f=1, 𝜉=35%, μ=63
LD=3000s, f=250000, 𝜉=35%, μ=0.126

CHAPTER 3 EXPLICIT MODELLING OF LARGE DEFLECTION BEHAVIOUR OF
RESTRAINED REINFORCED CONCRETE BEAMS IN FIRE
81
It should be pointed out that because the mass is scaled, the natural frequency of the
model is changed. Therefore, a new damping value μ had to be calculated according
to Equation 3-8 for the load-controlled simulation by keeping the damping ratio 𝜉
constant. This gives a value of μ=0.126 for the analysis using mass scaling factor of
250000.
The real benefit of using mass scaling is to increase the stable time increment for the
regions of structure with very fine meshes. Figure 3.11 shows a different mesh for
test structure S4, with a patch of elements whose smallest lengths is half that of the
regular elements (shown in Figure 3.2). The stable time increment for the regular
mesh was 6.997E-6s and that for the patch with small elements was 4.202E-6s. By
increasing the density of the small elements by a factor f=4 while keeping the density
of all other elements unaltered, a stable time increment ∆𝑡 of that of the regular
elements can be applied over the entire structure. Figure 3.11(b) compares the
simulation results between with and without locally applying mass scaling. Because
the region with mass scaling is small, the two sets of results are very close. However,
applying local mass scaling reduced the simulation time considerably.
(a) FE mesh for test S4 with one (b) Load-middle joint displacement
region of fine mesh
Figure 3.11: The effect of applying mass scaling to a small region of fine mesh
In summary, either load factoring or mass scaling may be used to reduce
computation time. A particularly useful benefit of mass scaling is the possibility to
0
20
40
60
80
100
120
0 200 400 600
Load
(kN
)
Middle joint displacement (mm)
f=1 for uniform mesh, ∆t=6.997E-6 s
f=1 for non-uniform mesh, ∆t=4.202E-6 s
f=4 for non-uniform mesh, ∆t=6.997E-4 s

CHAPTER 3 EXPLICIT MODELLING OF LARGE DEFLECTION BEHAVIOUR OF
RESTRAINED REINFORCED CONCRETE BEAMS IN FIRE
82
apply this technique to the regions of structural model with fine meshes.
Furthermore, when simulating the structure using load control, material damping is
necessary to overcome the temporary instability as a result of the restrained beam
transiting from flexural action to catenary action. How to select the appropriate load
factoring and mass scaling factors depends on the minimum nature period of
structure.
3.2.7 Validation Against the Test Results of Yu and Tan (Yu and Tan, 2013, Yu
and Tan, 2014)
Figures 3.12 to 3.18 compare the simulated beam responses with the test results,
using the load-controlled (LC) and displacement-controlled (DC) methods, giving
the vertical load, beam axial force and kinetic energy against MJD. Load factoring
was used. Table 3.5 presents the lowest natural periods, loading durations and
damping factors used for the models. Axial compression is developed in the beams
due to compressive arch action as the applied load (in LC simulations) or the applied
displacement (in DC simulations) increases. After reaching the maximum
compressive force, the structural resisting load decreases. Further increasing in the
displacement and load on the middle joint causes the beam axial compressive force
to decrease and the beam transits from compressive arch action to tensile catenary
action. Since the applied load continuously increases, the LC structures become
temporarily unstable when the resisting load drops below the applied load. The loss
of static stability is identified by the dramatic increase in the ratio of the kinetic
energy to the internal energy.

CHAPTER 3 EXPLICIT MODELLING OF LARGE DEFLECTION BEHAVIOUR OF
RESTRAINED REINFORCED CONCRETE BEAMS IN FIRE
83
(a) Load and KE/IE-middle joint displacement
(b) Beam axial force-middle joint displacement
Figure 3.12: Comparison between modelling and test results (model S4)
-300
-200
-100
0
100
200
300
0 100 200 300 400 500 600 700
Axi
al f
orc
e (k
N)
Middle joint displacement (mm)
Test ABAQUS (DC) ABAQUS (LC)
0
0.02
0.04
0.06
0.08
0
20
40
60
80
100
120
0 100 200 300 400 500 600 700
Kin
etic
en
ergy
/In
tern
al e
ner
gy
Load
(kN
)
Middle joint displacement (mm)
Test
ABAQUS (Load, LC)
ABAQUS (Load, DC)
KE/IE (LC)
KE/IE (DC)
KE: Kinetic Energy
IE: Internal Energy

CHAPTER 3 EXPLICIT MODELLING OF LARGE DEFLECTION BEHAVIOUR OF
RESTRAINED REINFORCED CONCRETE BEAMS IN FIRE
84
(a) Displacement-controlled simulation
(b) Load-controlled simulation
Figure 3.13: Variation of longitudinal steel reinforcement at critical regions
(model S4)
-0.04
0.00
0.04
0.08
0.12
0.16
-30
0
30
60
90
120
0 100 200 300 400 500 600
Stra
in (
mm
/mm
)
Load
(kN
)
Middle joint displacement (mm)
Test
ABAQUS
Bottom bar strain (ABAQUS)
Top bar strain (ABAQUS)
Fracture of bottom bars near middle joint, 𝜀𝑢 = 0.109
Fracture top bars near side joint, 𝜀𝑢 = 0.109
-0.04
0.00
0.04
0.08
0.12
0.16
-30
0
30
60
90
120
0 100 200 300 400 500 600 700
Stra
in (
mm
/mm
)
Load
(kN
)
Middle joint displacement (mm)
Test
ABAQUS
Bottom bar strain (ABAQUS)
Top bar strain (ABAQUS)
Fracture of bottom bars near middle joint, 𝜀𝑢 = 0.109
Fracture top bars near side joint, 𝜀𝑢 = 0.109
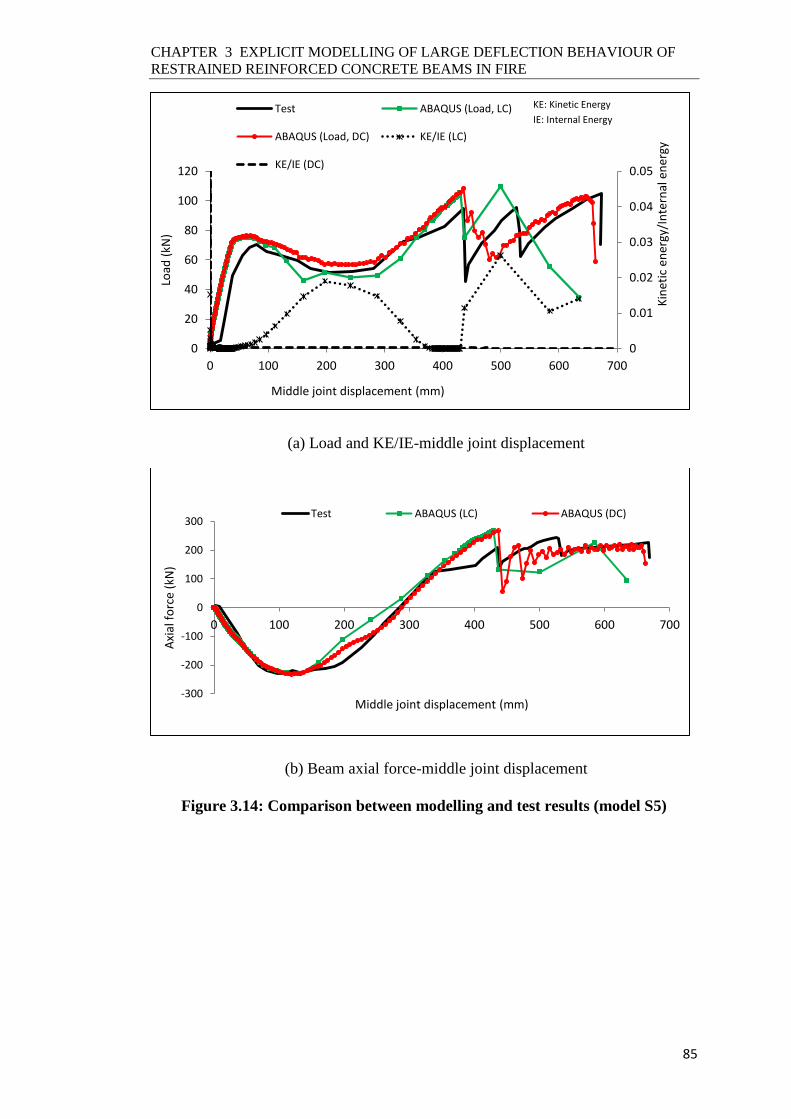
CHAPTER 3 EXPLICIT MODELLING OF LARGE DEFLECTION BEHAVIOUR OF
RESTRAINED REINFORCED CONCRETE BEAMS IN FIRE
85
(a) Load and KE/IE-middle joint displacement
(b) Beam axial force-middle joint displacement
Figure 3.14: Comparison between modelling and test results (model S5)
-300
-200
-100
0
100
200
300
0 100 200 300 400 500 600 700
Axi
al f
orc
e (k
N)
Middle joint displacement (mm)
Test ABAQUS (LC) ABAQUS (DC)
0
0.01
0.02
0.03
0.04
0.05
0
20
40
60
80
100
120
0 100 200 300 400 500 600 700
Kin
etic
en
ergy
/In
tern
al e
ner
gy
Load
(kN
)
Middle joint displacement (mm)
Test ABAQUS (Load, LC)
ABAQUS (Load, DC) KE/IE (LC)
KE/IE (DC)
KE: Kinetic Energy IE: Internal Energy

CHAPTER 3 EXPLICIT MODELLING OF LARGE DEFLECTION BEHAVIOUR OF
RESTRAINED REINFORCED CONCRETE BEAMS IN FIRE
86
(a) Load and KE/IE-middle joint displacement
(b) Beam axial force-middle joint displacement
Figure 3.15: Comparison between modelling and test results (model S7)
-300
-200
-100
0
100
200
300
0 100 200 300 400 500 600 700
Axia
l fo
rce
(kN
)
Middle joint displacement (mm)
Test ABAQUS (LC) ABAQUS (DC)
0
0.02
0.04
0.06
0.08
0
20
40
60
80
100
120
0 100 200 300 400 500 600
Kin
etic
en
ergy
/In
tern
al e
ner
gy
Lo
ad (
kN
)
Middle joint displacement (mm)
Test ABAQUS (Load, LC)
ABAQUS (Load, DC) KE/IE (LC)
KE/IE (DC)
KE: Kinetic Energy IE: Internal Energy
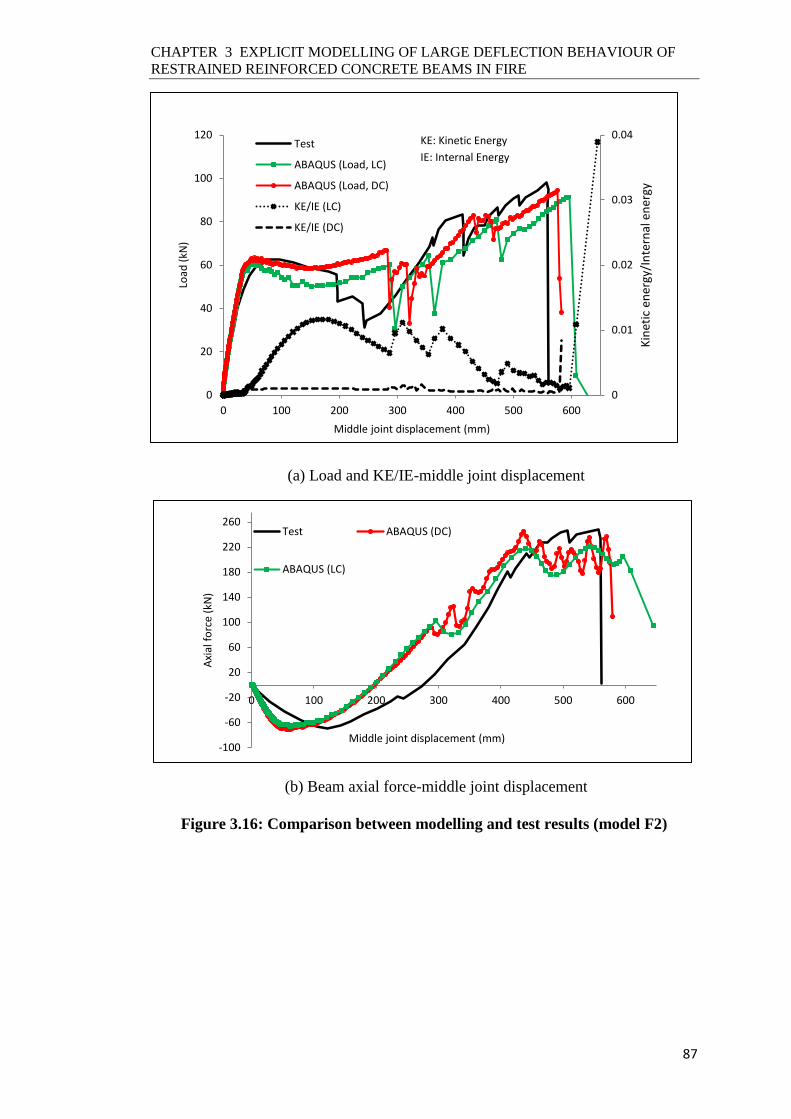
CHAPTER 3 EXPLICIT MODELLING OF LARGE DEFLECTION BEHAVIOUR OF
RESTRAINED REINFORCED CONCRETE BEAMS IN FIRE
87
(a) Load and KE/IE-middle joint displacement
(b) Beam axial force-middle joint displacement
Figure 3.16: Comparison between modelling and test results (model F2)
-100
-60
-20
20
60
100
140
180
220
260
0 100 200 300 400 500 600
Axi
al f
orc
e (k
N)
Middle joint displacement (mm)
Test ABAQUS (DC)
ABAQUS (LC)
0
0.01
0.02
0.03
0.04
0
20
40
60
80
100
120
0 100 200 300 400 500 600
Kin
etic
en
ergy
/In
tern
al e
ner
gy
Load
(kN
)
Middle joint displacement (mm)
Test
ABAQUS (Load, LC)
ABAQUS (Load, DC)
KE/IE (LC)
KE/IE (DC)
KE: Kinetic Energy
IE: Internal Energy

CHAPTER 3 EXPLICIT MODELLING OF LARGE DEFLECTION BEHAVIOUR OF
RESTRAINED REINFORCED CONCRETE BEAMS IN FIRE
88
(a) Load and KE/IE-middle joint displacement
(b) Beam axial force-middle joint displacement
Figure 3.17: Comparison between modelling and test results (model F4)
-100
-50
0
50
100
150
200
250
300
0 100 200 300 400 500 600 700
Axi
al f
orc
e (k
N)
Middle joint displacement (mm)
Test ABAQUS (DC) ABAQUS (LC)
0
0.01
0.02
0.03
0.04
0
25
50
75
100
125
0 100 200 300 400 500 600 700
Kin
etic
en
ergy
/In
tern
al e
ner
gy
Load
(kN
)
Middle joint displacement (mm)
Test
ABAQUS (LC)
ABAQUS (DC)
KE/IE (LC)
KE/IE (DC)
KE: Kinetic Energy IE: Internal Energy
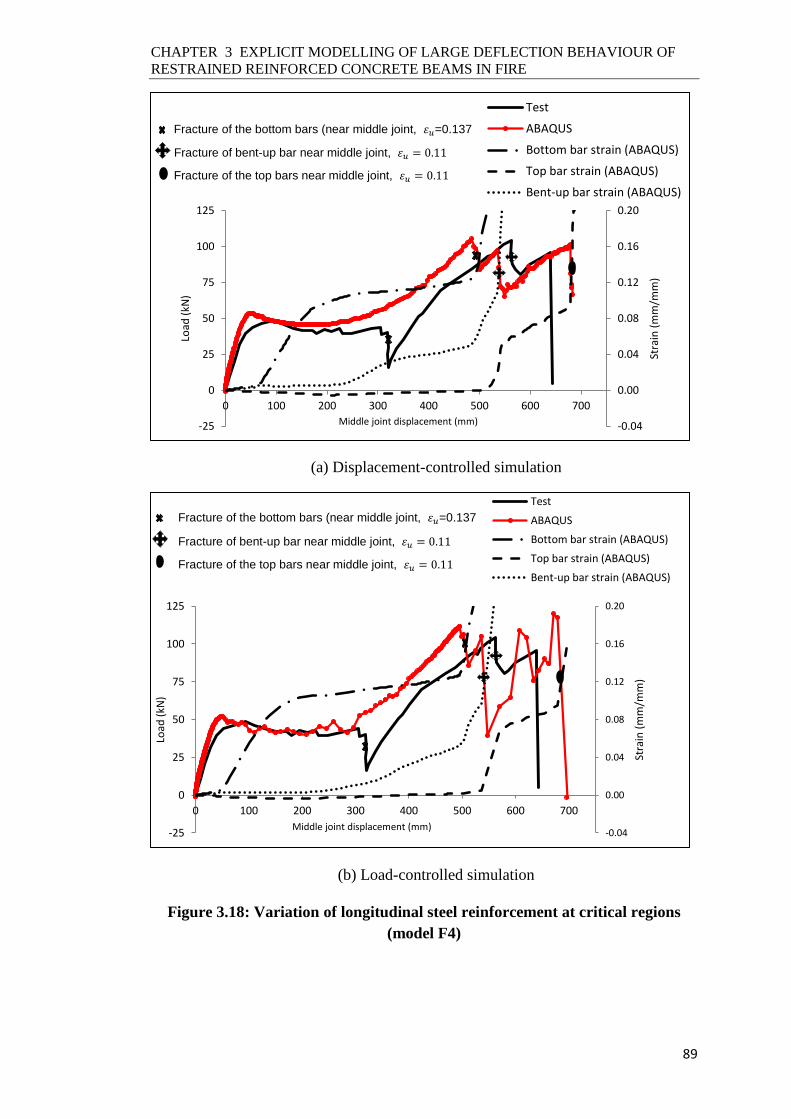
CHAPTER 3 EXPLICIT MODELLING OF LARGE DEFLECTION BEHAVIOUR OF
RESTRAINED REINFORCED CONCRETE BEAMS IN FIRE
89
(a) Displacement-controlled simulation
(b) Load-controlled simulation
Figure 3.18: Variation of longitudinal steel reinforcement at critical regions
(model F4)
-0.04
0.00
0.04
0.08
0.12
0.16
0.20
-25
0
25
50
75
100
125
0 100 200 300 400 500 600 700
Stra
in (
mm
/mm
)
Load
(kN
)
Middle joint displacement (mm)
Test
ABAQUS
Bottom bar strain (ABAQUS)
Top bar strain (ABAQUS)
Bent-up bar strain (ABAQUS)
Fracture of the bottom bars (near middle joint, 𝜀𝑢=0.137
Fracture of bent-up bar near middle joint, 𝜀𝑢 = 0.11
Fracture of the top bars near middle joint, 𝜀𝑢 = 0.11

CHAPTER 3 EXPLICIT MODELLING OF LARGE DEFLECTION BEHAVIOUR OF
RESTRAINED REINFORCED CONCRETE BEAMS IN FIRE
90
Table 3.5: Parameters used for modelling the tests of Yu and Tan (2013) and
Yu and Tan (2014)
Model
Lowest natural
frequency,
𝜔𝑚𝑖𝑛 (rad/s)
Lowest
natural
period, Tn (s)
Loading
duration,
LD (s)
Loading
speed LD/Tn
Damping
ratio, 𝜉
(%)
Mass
proportional
damping, 𝜇
Displacement-controlled (DC) method
S4,
S5, S7 89.5 0.070 5 140 mm/s 71 0 0
F2, F4 135.1 0.046 3.5 200 mm/s 76 0 0
Load-controlled (LC) method
S4,
S5, S7 89.5 0.070 6 18.35 kN/s 86 35 63
F2, F4 135.1 0.046 4 27.5 kN/s 87 35 95
During the catenary action stage, the resisting load rises again. The tensile catenary
force is withstood by the longitudinal steel bars. The sharp reductions in the applied
load are caused by the fracture of bars close to the middle joint interfaces.
Reinforcement bar fracture is accurately captured by the simulation model as
indicated by the reinforcement bar strains exceeding the bar fracture strains shown in
Figures 3.13 and 3.18 which plot the predicted strain versus MJD relationships for
sub-assemblage S4 and frame F4 for the sake of brevity. In the tests, complete
collapse of the sub-assemblage structures was due to fracture of the top bars near the
side joint interfaces and this was accurately simulated by comparison of the failure
modes between the simulation and experimental test of model S5 in Figure 3.19(a).
In order to prolong the catenary action phase, innovative reinforcement detailing
techniques were used by Yu and Tan (2014) in the frame tests, including adding a
reinforcement layer at the mid-height of the beam section in F2 and introducing a
partial hinge at the beam ends in F4 as shown in Figure 3.1. Complete collapse of the
specimens happened following rupture of all bars near the middle joint interfaces.
These failure modes were accurately captured by the simulation model, as shown in
the comparisons in Figure 3.19(b) for model F2.

CHAPTER 3 EXPLICIT MODELLING OF LARGE DEFLECTION BEHAVIOUR OF
RESTRAINED REINFORCED CONCRETE BEAMS IN FIRE
91
Figure 3.19: Deformed shape and failure mode of FE simulations and tests
In all cases, the agreement between the numerical simulation results and the test
results is very good. In particular, the numerical simulation model reliably followed
the various temporary failure phenomena, including temporary loss of the applied
load, transition from compressive arch action to catenary action and fracture of
reinforcement until the final failure of structure. The proposed accelerated techniques
reduced the computational time by 3 orders of magnitude compared to simulations
using the actual loading speed of 0.1 mm/s.
(a) Model S5
(b) Model F2
At the side joint interface
At the middle joint interface
At the middle joint interface
CHAPTER 3 EXPLICIT MODELLING OF LARGE DEFLECTION BEHAVIOUR OF
RESTRAINED REINFORCED CONCRETE BEAMS IN FIRE
92
3.3 Comparison and Application of the Finite Element Model to RC
Sructures in Fire
3.3.1 Comparison Against the Fire Tests of Dwaikat and Kodur (Dwaikat and
Kodur, 2009a, Dwaikat, 2009)
Three RC beams tested by Dwaikat and Kodur (2009a), named B1, B2 and B3, were
simulated. Figure 3.20 shows the details of the beams and the locations of
thermocouples installed to measure temperatures. The yield strength of reinforcing
bars for the three beams was 450 MPa, and the characteristic compressive cylinder
strength of concrete was 58.2 MPa for B1 and B2, and 106 MPa for B3. All the three
beams were loaded with two point loads of 50 kN each which produced a load ratio
of 55% of the beams’ bending moment capacities at ambient temperature determined
according to ACI 318. These loads were maintained constant during the subsequent
fire exposure. Beams B1 and B3 were exposed to the ASTM E119 standard fire
while beam B2 was exposed to a short fire scenario followed by a cooling phase. The
end support conditions for B1 and B3 were simply supported while B2 was axially
restrained with a stiffness value of about 13 kN/mm. “Surface-to-surface contact
(Explicit) interaction” and “axial connector element” in ABAQUS were used to
model the supports of beam B2 (Figure 3.20). The “Normal behaviour” and “hard
contact” in surface-to surface contact interaction options were used to apply physical
contact between the axial restraint system and the end section. The “Allow separation
after contact” option was activated in defining contact interaction since the end
section was not anchored to the adjacent frame during the test.

CHAPTER 3 EXPLICIT MODELLING OF LARGE DEFLECTION BEHAVIOUR OF
RESTRAINED REINFORCED CONCRETE BEAMS IN FIRE
93
Figure 3.20: Details of test beams B1, B2 and B3 with the locations of
thermocouples (Dwaikat and Kodur, 2009a)
For beam B1, the average measured temperatures of thermocouples, reported in
detail in (Dwaikat, 2009), located on the exposed concrete surface, namely T3, T14,
and T19 were used as the initial thermal boundary condition in heat transfer analysis
to obtain the cross-section temperatures. A sequentially coupled thermal-structural
analysis method was adopted by firstly carrying out a 3D heat transfer analysis in
ABAQUS/Standard solver. Then, the cross-section temperatures were imported to
the subsequent structural analysis model in the ABAQUS/Explicit solver. Evrine et
al. (2012) experimentally investigated the effect of tensile cracking of RC beams on
the temperature field within the concrete cross-section. A minor difference was
noticed between the temperatures measured by thermocouples in the undamaged
concrete sections and those measured by thermocouples positioned in the damaged
sections close to cracks of width of the order of 101 mm at the exposed surface.
Besides, no spalling was observed in beam B1 during fire exposure. Hence, it is
reasonable to assume that the structural behaviour depends on the temperature
distribution, but there is no reverse dependency.
Accurate modelling of fire-induced spalling is very complicated and it is the subject
of research efforts by many researchers at present. In the proposed finite element
All dimensions in mm
T13
254
406
44
2 𝜙 12
3 𝜙 19 T5
T11 T7,16
T18 T10
T9 T17 T6
T1,15 T8
102
38 26 37
65
37
254
406
7 37
57
T3,14,19
T12
T20,T4
150
2440 mm
1550
3660
1550 860
50 kN 50 kN
Span exposed to fire
Furnace
Flexible insulation
uy=uz=0
Axial connector
Steel plate
ux=uy=uz=0
Contact surface
Beam B2

CHAPTER 3 EXPLICIT MODELLING OF LARGE DEFLECTION BEHAVIOUR OF
RESTRAINED REINFORCED CONCRETE BEAMS IN FIRE
94
model in this research, spalling is not explicitly modelled. Therefore, this research is
applicable only to RC structures made of traditional normal strength concrete with
moisture content ≤ 3% where spalling in this concrete is uncommon or very rare
(Hertz, 2003, CEN, 2004, Choi and Shin, 2011, Dwaikat and Kodur, 2009a).
Nevertheless, the present model can be used to simulate RC elements in tensile
catenary/membrane action that develops at very large deflections following bending
failure. This is because the applied load is sustained by the top cooler and more
protected reinforcing bars.
In heat transfer analysis, concrete and reinforcing steel were modelled using first-
order eight-node elements (DC3D8) and two-node link elements (DC1D2),
respectively. “Tie constraint” was used to transfer temperatures from the concrete
element to the embedded reinforcing steel element to indicate that the steel bars and
the surrounding concrete had the same temperature. A constant convective heat
transfer coefficient (hc) of 25 W/m2K and 9 W/m
2K was assumed for the exposed
and unexposed surfaces respectively according to EN 1992-1-2 (CEN, 2004). For the
radiative heat flux boundary condition, the resultant emissivity for concrete surface
was taken as 0.7. The required thermal properties of concrete, namely density,
thermal conductivity and specific heat as a function of temperature were defined
according to EN 1992-1-2 (CEN, 2004), as presented in appendix A4. The influence
of moisture evaporation in concrete was considered implicitly by modifying the
specific heat model suggested by EN 1992-1-2 (CEN, 2004). The measured moisture
content by weight was about 3% and this was used in the numerical model. Figure
3.21 compares the heat transfer analysis results with the test results for beam B1,
indicating good accuracy. The discrepancy during the initial period of fire exposure
up to 100 o
C for concrete can be attributed to the fact that the simulation model
ignored physical water evaporation.
Significant concrete spalling occurred in specimen B3, made of high strength
concrete, during testing because of low permeability of high strength concrete that
increases the build-up of pore pressures in concrete and thus possibility of explosive
spalling. Since the current numerical model cannot simulate spalling, the recorded
temperatures in the tests within the beam sections were input directly into the
numerical model and the thermal/structural behaviour were obtained without
conducting heat transfer analysis. This was also adopted for normal strength concrete

CHAPTER 3 EXPLICIT MODELLING OF LARGE DEFLECTION BEHAVIOUR OF
RESTRAINED REINFORCED CONCRETE BEAMS IN FIRE
95
beam B2 although it suffered minor spalling. To allow direct use of the recorded
temperatures at the thermocouple locations, the cross-sections were divided into
elements according to Figure 3.22 so that the thermocouple locations coincide with
some nodes in the finite element model. The temperatures of other nodes on the
cross-section were scaled according to the temperature profiles recommended in EN
1992-1-2 (CEN, 2004).
Figure 3.21: Comparison between predicted and measured temperature for B1
0
100
200
300
400
500
600
700
0 50 100 150 200
Tem
per
atu
re (
oC
)
Time (min)
T6 (Test)
T6 (ABAQUS)
T5, T7, T16 (Test, Average)
T5, T7, T16 (ABAQUS)
0
100
200
300
400
500
600
0 50 100 150 200
Tem
per
atu
re (
oC
)
Time (min)
T10 (Test)
T10 (ABAQUS)
T11 (Test)
T11 (ABAQUS)
T12 (Test)
T12 (ABAQUS)
0
100
200
300
400
0 50 100 150 200
Tem
per
atu
re (
oC
)
Time (min)
T9 (Test)
T9 (ABAQUS)
T1, T4, T20 (ABAQUS)
T1, T4, T20 (Test, Average)
T18 (Test)
T18 (ABAQUS)
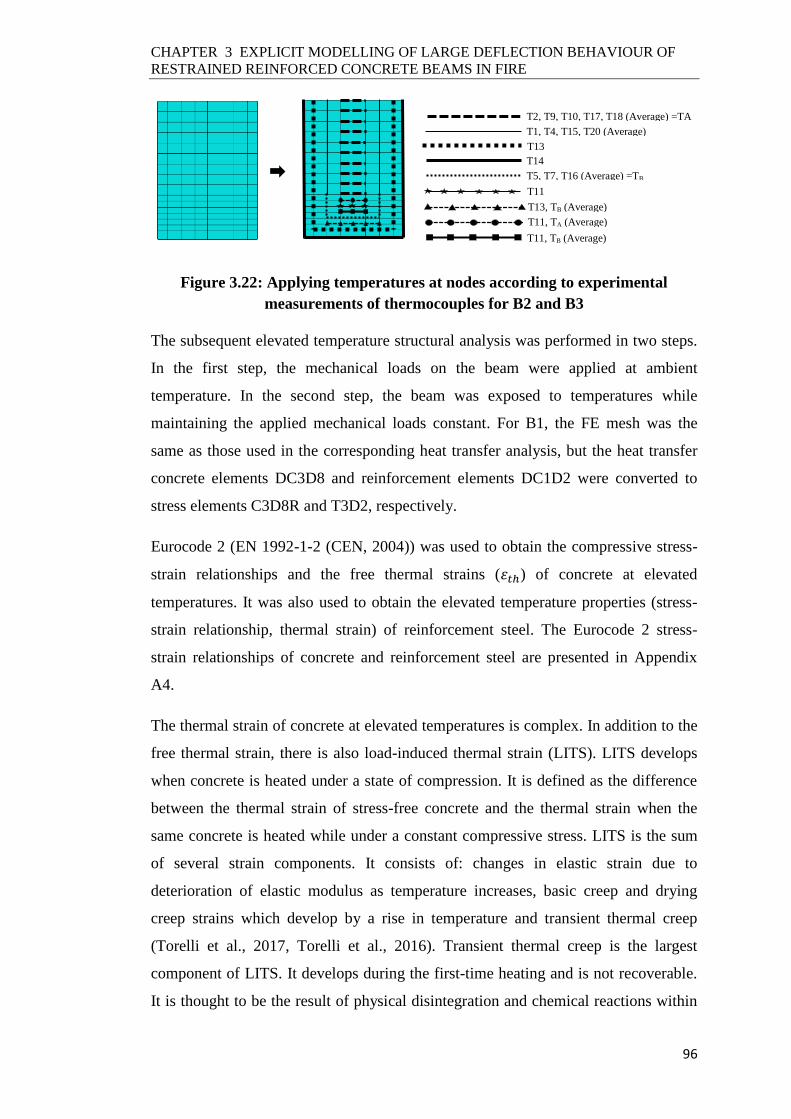
CHAPTER 3 EXPLICIT MODELLING OF LARGE DEFLECTION BEHAVIOUR OF
RESTRAINED REINFORCED CONCRETE BEAMS IN FIRE
96
Figure 3.22: Applying temperatures at nodes according to experimental
measurements of thermocouples for B2 and B3
The subsequent elevated temperature structural analysis was performed in two steps.
In the first step, the mechanical loads on the beam were applied at ambient
temperature. In the second step, the beam was exposed to temperatures while
maintaining the applied mechanical loads constant. For B1, the FE mesh was the
same as those used in the corresponding heat transfer analysis, but the heat transfer
concrete elements DC3D8 and reinforcement elements DC1D2 were converted to
stress elements C3D8R and T3D2, respectively.
Eurocode 2 (EN 1992-1-2 (CEN, 2004)) was used to obtain the compressive stress-
strain relationships and the free thermal strains (𝜀𝑡ℎ) of concrete at elevated
temperatures. It was also used to obtain the elevated temperature properties (stress-
strain relationship, thermal strain) of reinforcement steel. The Eurocode 2 stress-
strain relationships of concrete and reinforcement steel are presented in Appendix
A4.
The thermal strain of concrete at elevated temperatures is complex. In addition to the
free thermal strain, there is also load-induced thermal strain (LITS). LITS develops
when concrete is heated under a state of compression. It is defined as the difference
between the thermal strain of stress-free concrete and the thermal strain when the
same concrete is heated while under a constant compressive stress. LITS is the sum
of several strain components. It consists of: changes in elastic strain due to
deterioration of elastic modulus as temperature increases, basic creep and drying
creep strains which develop by a rise in temperature and transient thermal creep
(Torelli et al., 2017, Torelli et al., 2016). Transient thermal creep is the largest
component of LITS. It develops during the first-time heating and is not recoverable.
It is thought to be the result of physical disintegration and chemical reactions within
T13, TB (Average)
T5, T7, T16 (Average) =TB
T13
T1, T4, T15, T20 (Average)
T14
T11
T11, TA (Average)
T2, T9, T10, T17, T18 (Average) =TA
T11, TB (Average)

CHAPTER 3 EXPLICIT MODELLING OF LARGE DEFLECTION BEHAVIOUR OF
RESTRAINED REINFORCED CONCRETE BEAMS IN FIRE
97
the cement paste microstructure for temperatures up to 300-400oC and due to
mismatch of the thermal strains of cement past and aggregates (Torelli et al., 2017).
Hence, most of the LITS developed after a first heating cycle is irrecoverable on
cooling and does not develop further when the material is reheated if the first heating
temperature is not exceeded (Torelli et al., 2016).
In the Eurocode 2 model, the total strain of concrete at elevated temperatures is
considered as the sum of free thermal strain and mechanical strain. The mechanical
strain in the uniaxial compressive stress-strain relationship lumps together the
instantaneous stress-related strain and LITS, in which LITS is considered implicitly.
Previous studied have shown that using the Eurocode 2 model can properly simulate
concrete structures under constantly increasing temperature such as standard fire
exposures ISO 834 and ASTM E119 (Gernay and Franssen, 2012, Gernay, 2012).
This was revealed by comparing the structural behaviour results using the implicit
model of Eurocode 2 with those of structures with LITS considered explicitly as a
separate component of the total strain. However, the Eurocode 2 model has inherent
limitations for an accurate representation of the behaviour of structures subjected to
both heating and cooling. It has been shown that the Eurocode 2 model cannot
capture the irreversibility of the irrecoverable component of the LITS in the cooling
phase (Gernay and Franssen, 2012, Gernay, 2012).
In this study, the implicit Eurocode 2 model is used and LITS is not explicitly dealt
with. Hence, the current finite element model is limited to modelling RC structures
subjected to heating only. However, the model can be used to model RC beam and
slab members in tensile catenary/membrane action in both heating and cooling
phases because the member is fully in tension and LITS occurs only when concrete is
in compression.
The test beam B2 by Dwaikat and Kodur (2009a), used in the present validation
study, was subjected to heating with a short severe fire followed by a cooling phase.
However, this beam was simply supported with axial restraint. The behaviour of the
beam was mainly governed by the behaviour of the bottom (tensile) steel bars in the
beam mid-span and not by the behaviour of concrete. In addition, the compressive
zone at the critical mid-span section does not exhibit significant LITS because its
area is small and kept at relatively low temperatures. Therefore, using the implicit
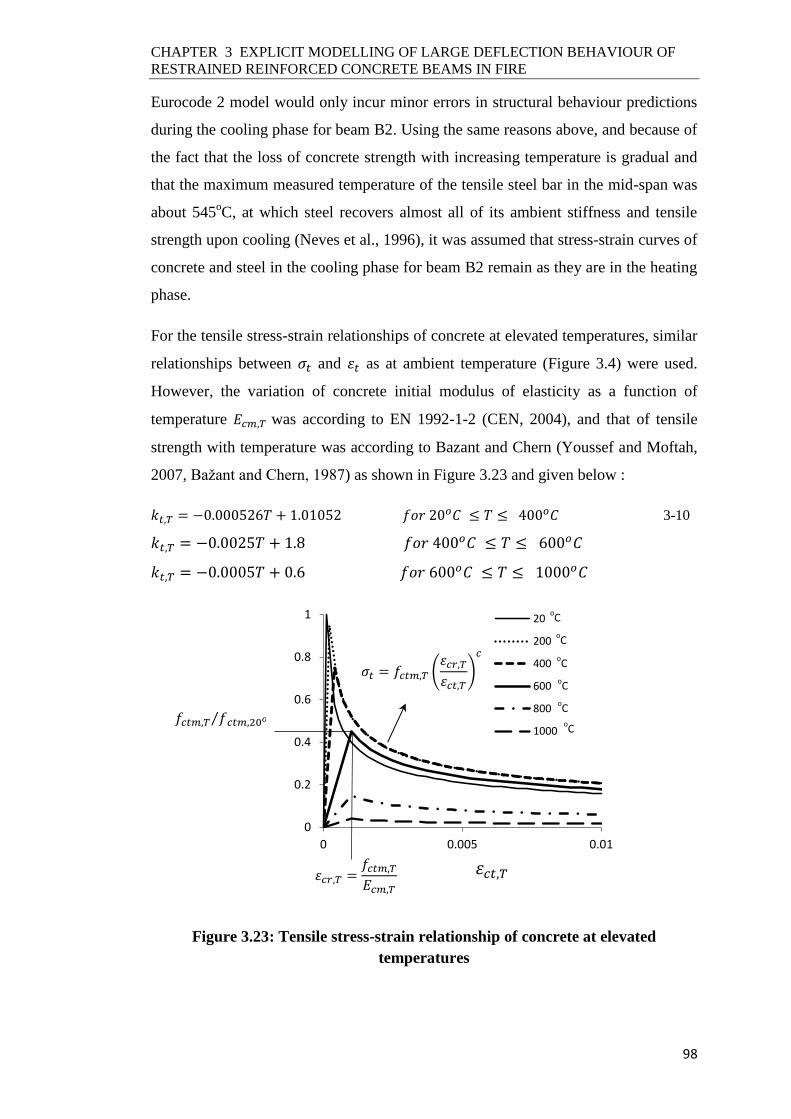
CHAPTER 3 EXPLICIT MODELLING OF LARGE DEFLECTION BEHAVIOUR OF
RESTRAINED REINFORCED CONCRETE BEAMS IN FIRE
98
Eurocode 2 model would only incur minor errors in structural behaviour predictions
during the cooling phase for beam B2. Using the same reasons above, and because of
the fact that the loss of concrete strength with increasing temperature is gradual and
that the maximum measured temperature of the tensile steel bar in the mid-span was
about 545oC, at which steel recovers almost all of its ambient stiffness and tensile
strength upon cooling (Neves et al., 1996), it was assumed that stress-strain curves of
concrete and steel in the cooling phase for beam B2 remain as they are in the heating
phase.
For the tensile stress-strain relationships of concrete at elevated temperatures, similar
relationships between 𝜎𝑡 and 𝜀𝑡 as at ambient temperature (Figure 3.4) were used.
However, the variation of concrete initial modulus of elasticity as a function of
temperature 𝐸𝑐𝑚,𝑇 was according to EN 1992-1-2 (CEN, 2004), and that of tensile
strength with temperature was according to Bazant and Chern (Youssef and Moftah,
2007, Bažant and Chern, 1987) as shown in Figure 3.23 and given below :
𝑘𝑡,𝑇 = −0.000526𝑇 + 1.01052 𝑓𝑜𝑟 20𝑜𝐶 ≤ 𝑇 ≤ 400𝑜𝐶 3-10
𝑘𝑡,𝑇 = −0.0025𝑇 + 1.8 𝑓𝑜𝑟 400𝑜𝐶 ≤ 𝑇 ≤ 600𝑜𝐶
𝑘𝑡,𝑇 = −0.0005𝑇 + 0.6 𝑓𝑜𝑟 600𝑜𝐶 ≤ 𝑇 ≤ 1000𝑜𝐶
Figure 3.23: Tensile stress-strain relationship of concrete at elevated
temperatures
𝑓𝑐𝑡𝑚,𝑇 𝑓𝑐𝑡𝑚,20𝑜⁄
0
0.2
0.4
0.6
0.8
1
0 0.005 0.01
20
200
400
600
800
1000
𝜎𝑡 = 𝑓𝑐𝑡𝑚,𝑇 (𝜀𝑐𝑟,𝑇𝜀𝑐𝑡,𝑇
)
𝑐
𝜀𝑐𝑟,𝑇 =𝑓𝑐𝑡𝑚,𝑇
𝐸𝑐𝑚,𝑇 𝜀𝑐𝑡,𝑇
oC
oC
oC
oC
oC
oC

CHAPTER 3 EXPLICIT MODELLING OF LARGE DEFLECTION BEHAVIOUR OF
RESTRAINED REINFORCED CONCRETE BEAMS IN FIRE
99
Evolution of nodal temperatures in the structural analysis model may be accelerated.
A series of analyses with various simulation heating durations (HD) for one hour of
the real fire exposure time were run for the axially restrained beam B2. The mass
scaling factor was f=1. Figure 3.24 compares the mid-span deflection versus fire
time relationship for each analysis against the test data and also displays kinetic
energy-time relationships of the models. The results from HD=0.25s display
oscillations during the initial period of fire loading application, which can also be
seen from the kinetic energy results. With HD ≥ 0.75s, the simulation results are
quasi-static, except at the start of the analysis which is associated with the transition
from mechanical load to temperature loading. The lowest natural period Tn of the
assembled beam model B2 was 0.039s. This means that a heating duration HD ≥
19Tn for one hour of the real fire exposure time could be considered appropriate for
restrained RC beams in fire if using the load factoring technique. The simulation
time may be changed for other heating durations pro-rata.
Figure 3.24: Mid-span deflection and kinetic energy versus fire exposure time
for different heating durations (Beam B2)
Figure 3.25 provides comparison for the axial force of beam B2 between the FE
simulation and the experimental results and between the mid-span deflections of
beams B1 and B3. The selected modelling parameters were: HD=19Tn, f=1 and 𝜉=0.
Damping was not required since the response of the tested beams by Dwaikat and
Kodur (2009a) were only investigated in flexural action and the numerical simulation
did not encounter any local instability. Overall, the comparisons are very good. The
simulation results display a higher deflection rate for beam B1 during the second half
0
50
100
150
200
250
0 50 100 150 200 250 300
-35
-30
-25
-20
-15
-10
-5
0
Kin
etic
en
ergy
(J)
Time (min)
Def
lect
ion
(m
m)
Deflection (Test)
Deflection (ABAQUS, HD=0.25s)
Deflection (ABAQUS, HD=0.75s)
Kinetic energy (HD=0.25s)
Kinetic energy (HD=0.75s)

CHAPTER 3 EXPLICIT MODELLING OF LARGE DEFLECTION BEHAVIOUR OF
RESTRAINED REINFORCED CONCRETE BEAMS IN FIRE
100
of heating. The same discrepancy was also observed in the numerical analysis by
Dwaikat and Kodur (2009a) and Kodur and Agrawal (2016). Beams B1 and B3
failed in flexural mode and beam B2 did not fail. It can be concluded that the
developed FE model in ABAQUS/Explicit is able to capture the performance of RC
beams at elevated temperatures with satisfactory accuracy.
Figure 3.25: Comparison between predicted and measured results
3.4 Preliminary Investigation of the Large Deflection Behaviour of
Axially Restrained RC Beams in Fire
Although beam B2 of the tests by Dwaikat and Kodur (2009a) had axial restraint,
their fire test did not continue to the catenary action stage and did not reach structural
failure. Therefore, the validity of the modelling method could not be completely
demonstrated. A new restrained beam is used in this section as an example to
demonstrate the proposed modelling method. Figure 3.26 shows details of the beam.
Only half of the beam was analysed because of symmetry to save computation time.
The ambient temperature concrete compressive cylinder strength is 30 MPa, and the
steel reinforcement yield strength is 453 MPa with the ultimate strain as 0.05. An
extended ultimate strain was defined for the bottom bars for a distance of 1.5 times
the beam depth measured from the end sections to prevent false failure of the bars in
compression. The beam is exposed to the ISO 834 standard fire on three sides. The
density of the uniformly distributed load (w =23.1kN/m) gives a load ratio of 40% of
-500
-400
-300
-200
-100
0
0 25 50 75 100 125 150 175 200
Def
lect
ion
(m
m)
Time (min)
B1 (Test)
B1 (ABAQUS)
B3 (Test)
B3 (ABAQUS)
-35
-28
-21
-14
-7
0
7
14
21
28
35
-125
-100
-75
-50
-25
0
25
50
75
100
125
0 200
Def
lect
ion
(m
m)
Axi
al f
orc
(kN
)
Time (min)
Test (Axial force)ABAQUS (Axial force)Test (Deflection)ABAQUS (Deflection)
(a) Test beam B2 (2) Test beam B1 and B3
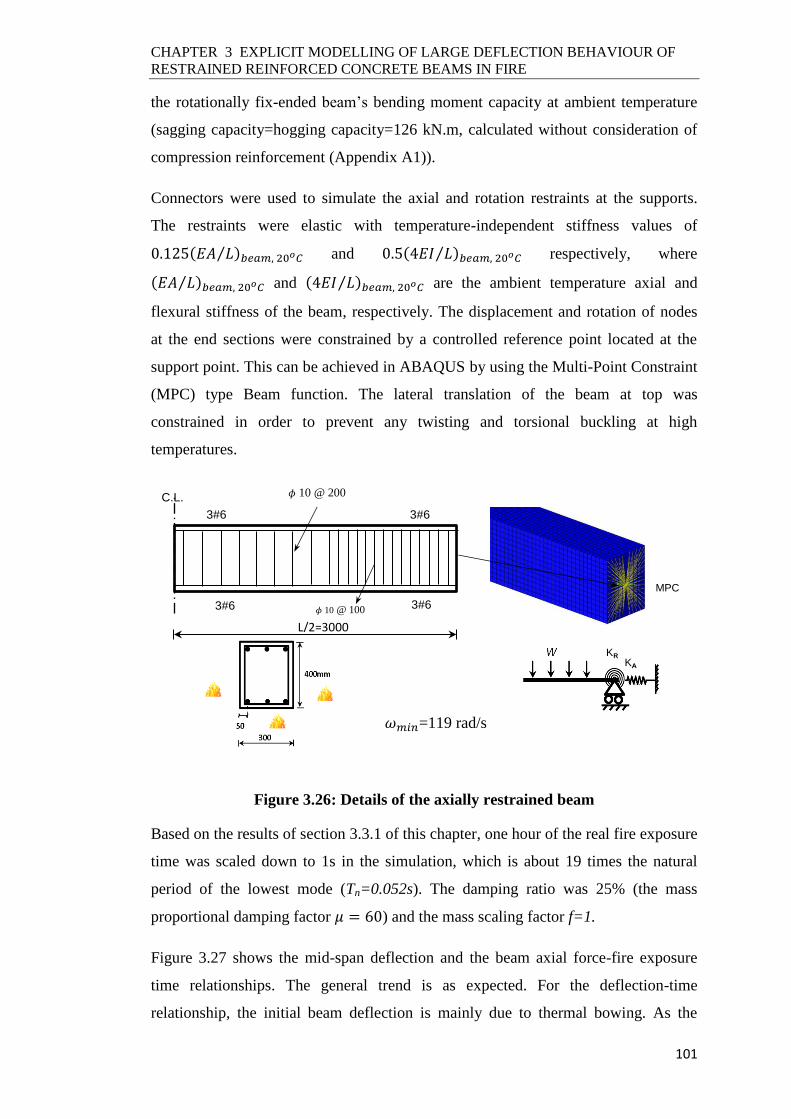
CHAPTER 3 EXPLICIT MODELLING OF LARGE DEFLECTION BEHAVIOUR OF
RESTRAINED REINFORCED CONCRETE BEAMS IN FIRE
101
the rotationally fix-ended beam’s bending moment capacity at ambient temperature
(sagging capacity=hogging capacity=126 kN.m, calculated without consideration of
compression reinforcement (Appendix A1)).
Connectors were used to simulate the axial and rotation restraints at the supports.
The restraints were elastic with temperature-independent stiffness values of
0.125(𝐸𝐴 𝐿⁄ )𝑏𝑒𝑎𝑚, 20𝑜𝐶 and 0.5(4𝐸𝐼 𝐿⁄ )𝑏𝑒𝑎𝑚, 20𝑜𝐶 respectively, where
(𝐸𝐴 𝐿⁄ )𝑏𝑒𝑎𝑚, 20𝑜𝐶 and (4𝐸𝐼 𝐿⁄ )𝑏𝑒𝑎𝑚, 20𝑜𝐶 are the ambient temperature axial and
flexural stiffness of the beam, respectively. The displacement and rotation of nodes
at the end sections were constrained by a controlled reference point located at the
support point. This can be achieved in ABAQUS by using the Multi-Point Constraint
(MPC) type Beam function. The lateral translation of the beam at top was
constrained in order to prevent any twisting and torsional buckling at high
temperatures.
Figure 3.26: Details of the axially restrained beam
Based on the results of section 3.3.1 of this chapter, one hour of the real fire exposure
time was scaled down to 1s in the simulation, which is about 19 times the natural
period of the lowest mode (Tn=0.052s). The damping ratio was 25% (the mass
proportional damping factor 𝜇 = 60) and the mass scaling factor f=1.
Figure 3.27 shows the mid-span deflection and the beam axial force-fire exposure
time relationships. The general trend is as expected. For the deflection-time
relationship, the initial beam deflection is mainly due to thermal bowing. As the
𝜔𝑚𝑖𝑛=119 rad/s
L/2=3000
𝜙 10 @ 100
𝜙 10 @ 200
3#6
3#6
3#6
3#6
C.L.
KA KR
MPC
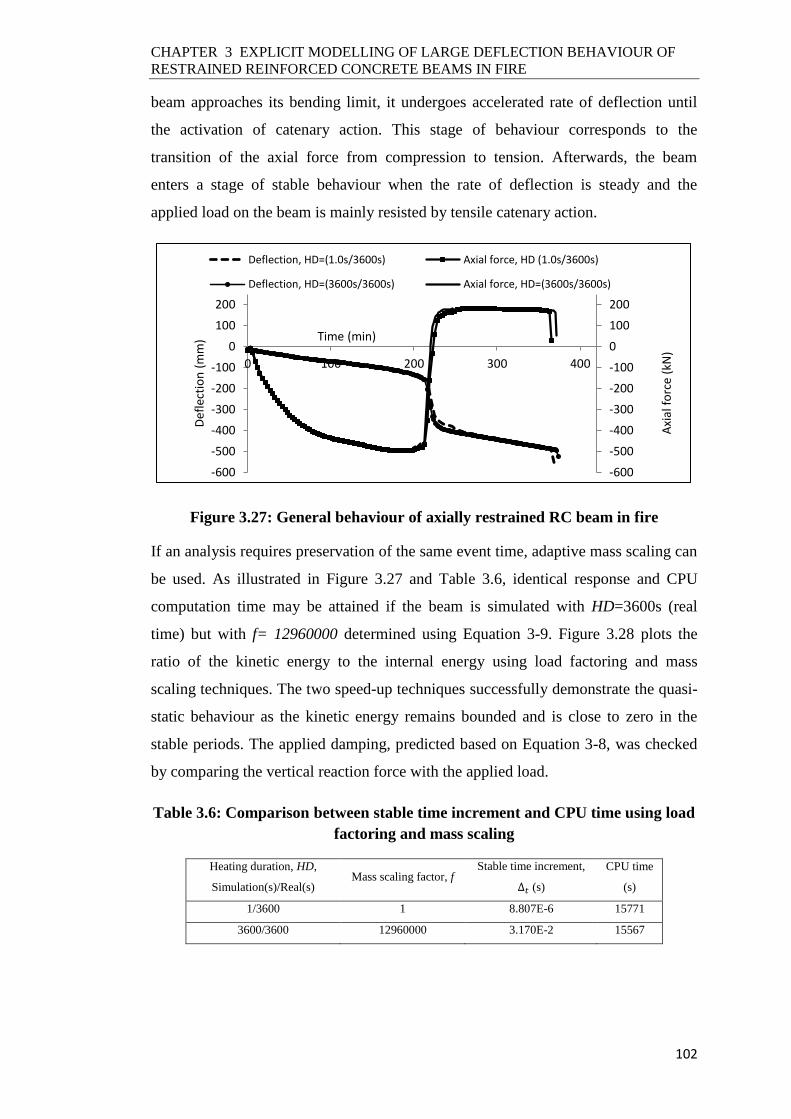
CHAPTER 3 EXPLICIT MODELLING OF LARGE DEFLECTION BEHAVIOUR OF
RESTRAINED REINFORCED CONCRETE BEAMS IN FIRE
102
beam approaches its bending limit, it undergoes accelerated rate of deflection until
the activation of catenary action. This stage of behaviour corresponds to the
transition of the axial force from compression to tension. Afterwards, the beam
enters a stage of stable behaviour when the rate of deflection is steady and the
applied load on the beam is mainly resisted by tensile catenary action.
Figure 3.27: General behaviour of axially restrained RC beam in fire
If an analysis requires preservation of the same event time, adaptive mass scaling can
be used. As illustrated in Figure 3.27 and Table 3.6, identical response and CPU
computation time may be attained if the beam is simulated with HD=3600s (real
time) but with f= 12960000 determined using Equation 3-9. Figure 3.28 plots the
ratio of the kinetic energy to the internal energy using load factoring and mass
scaling techniques. The two speed-up techniques successfully demonstrate the quasi-
static behaviour as the kinetic energy remains bounded and is close to zero in the
stable periods. The applied damping, predicted based on Equation 3-8, was checked
by comparing the vertical reaction force with the applied load.
Table 3.6: Comparison between stable time increment and CPU time using load
factoring and mass scaling
Heating duration, HD,
Simulation(s)/Real(s) Mass scaling factor, f
Stable time increment,
∆𝑡 (s)
CPU time
(s)
1/3600 1 8.807E-6 15771
3600/3600 12960000 3.170E-2 15567
-600
-500
-400
-300
-200
-100
0
100
200
-600
-500
-400
-300
-200
-100
0
100
200
0 100 200 300 400
Axi
al f
orc
e (k
N)
Def
lect
ion
(m
m) Time (min)
Deflection, HD=(1.0s/3600s) Axial force, HD (1.0s/3600s)
Deflection, HD=(3600s/3600s) Axial force, HD=(3600s/3600s)
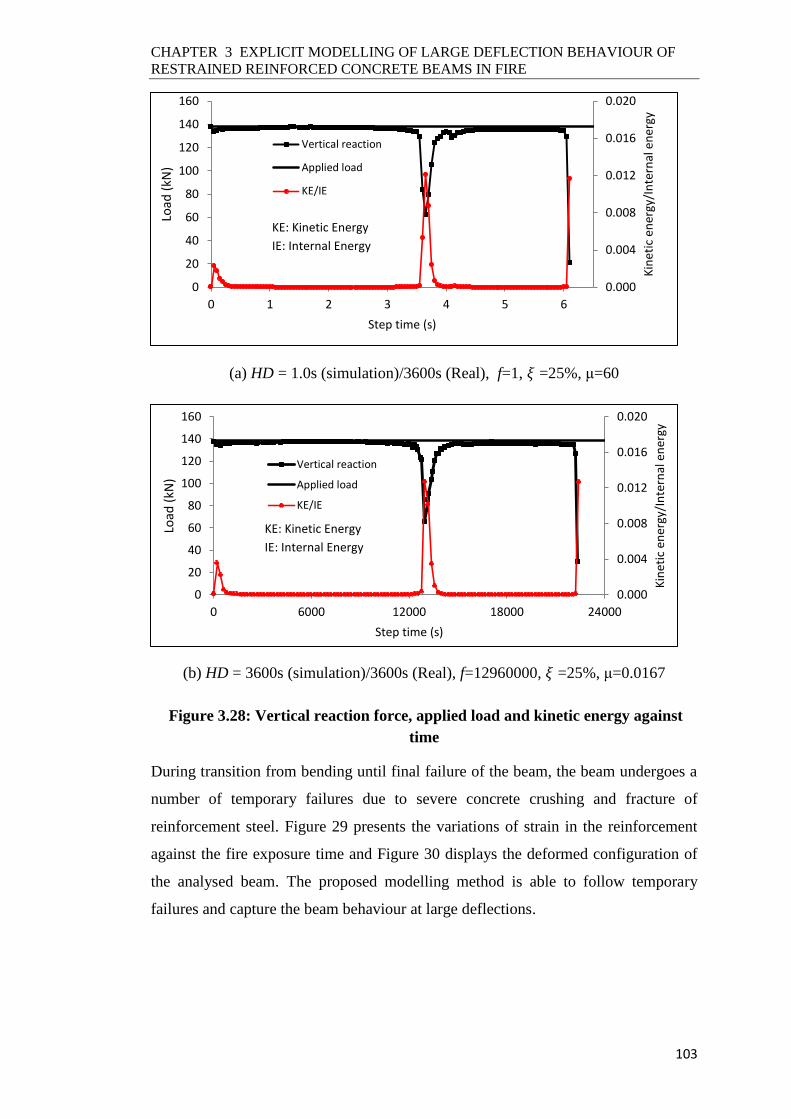
CHAPTER 3 EXPLICIT MODELLING OF LARGE DEFLECTION BEHAVIOUR OF
RESTRAINED REINFORCED CONCRETE BEAMS IN FIRE
103
(a) HD = 1.0s (simulation)/3600s (Real), f=1, 𝜉 =25%, μ=60
(b) HD = 3600s (simulation)/3600s (Real), f=12960000, 𝜉 =25%, μ=0.0167
Figure 3.28: Vertical reaction force, applied load and kinetic energy against
time
During transition from bending until final failure of the beam, the beam undergoes a
number of temporary failures due to severe concrete crushing and fracture of
reinforcement steel. Figure 29 presents the variations of strain in the reinforcement
against the fire exposure time and Figure 30 displays the deformed configuration of
the analysed beam. The proposed modelling method is able to follow temporary
failures and capture the beam behaviour at large deflections.
0.000
0.004
0.008
0.012
0.016
0.020
0
20
40
60
80
100
120
140
160
0 1 2 3 4 5 6
Kin
etic
en
ergy
/In
tern
al e
ner
gy
Load
(kN
)
Step time (s)
Vertical reaction
Applied load
KE/IE
KE: Kinetic Energy IE: Internal Energy
0.000
0.004
0.008
0.012
0.016
0.020
0
20
40
60
80
100
120
140
160
0 6000 12000 18000 24000
Kin
etic
en
ergy
/In
tern
al e
ner
gy
Load
(kN
)
Step time (s)
Vertical reaction
Applied load
KE/IE
KE: Kinetic Energy IE: Internal Energy
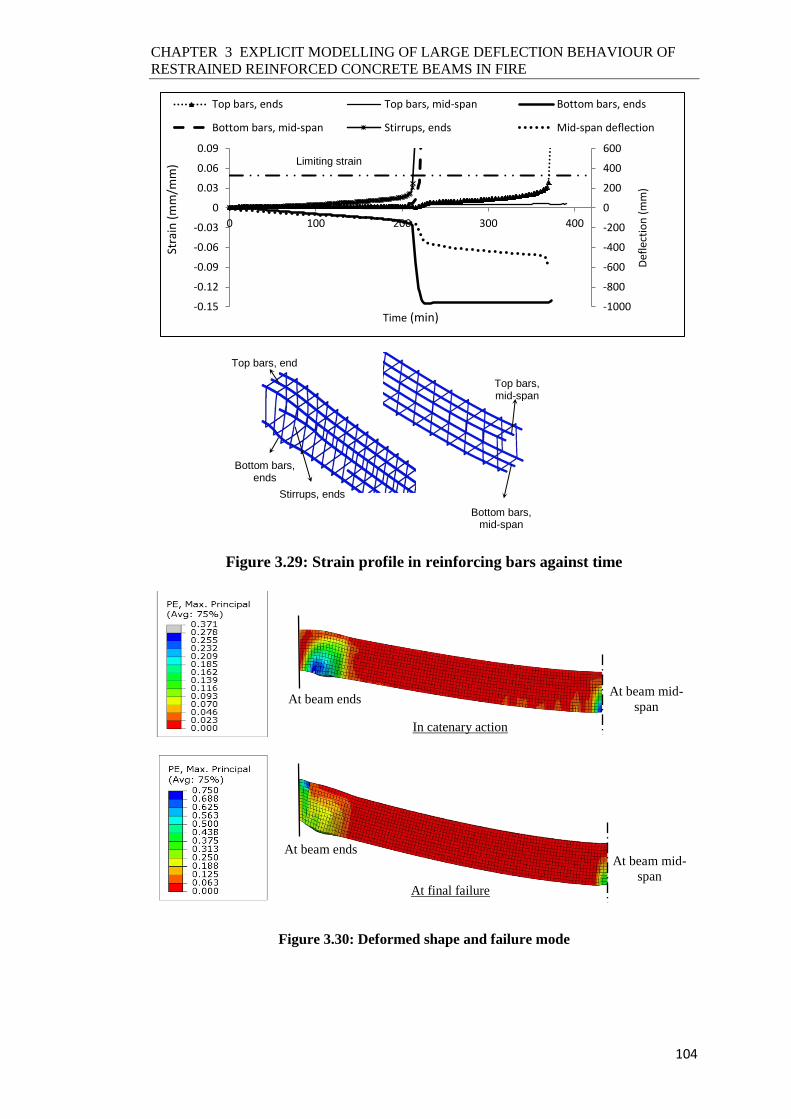
CHAPTER 3 EXPLICIT MODELLING OF LARGE DEFLECTION BEHAVIOUR OF
RESTRAINED REINFORCED CONCRETE BEAMS IN FIRE
104
Figure 3.29: Strain profile in reinforcing bars against time
Figure 3.30: Deformed shape and failure mode
-1000
-800
-600
-400
-200
0
200
400
600
-0.15
-0.12
-0.09
-0.06
-0.03
0
0.03
0.06
0.09
0 100 200 300 400
Def
lect
ion
(m
m)
Stra
in (
mm
/mm
)
Time (min)
Top bars, ends Top bars, mid-span Bottom bars, ends
Bottom bars, mid-span Stirrups, ends Mid-span deflection
Limiting strain
Top bars, end
Stirrups, ends
Bottom bars, ends
Bottom bars, mid-span
Top bars, mid-span
At final failure
At beam mid-
span
At beam mid-
span
At beam ends
At beam ends
In catenary action
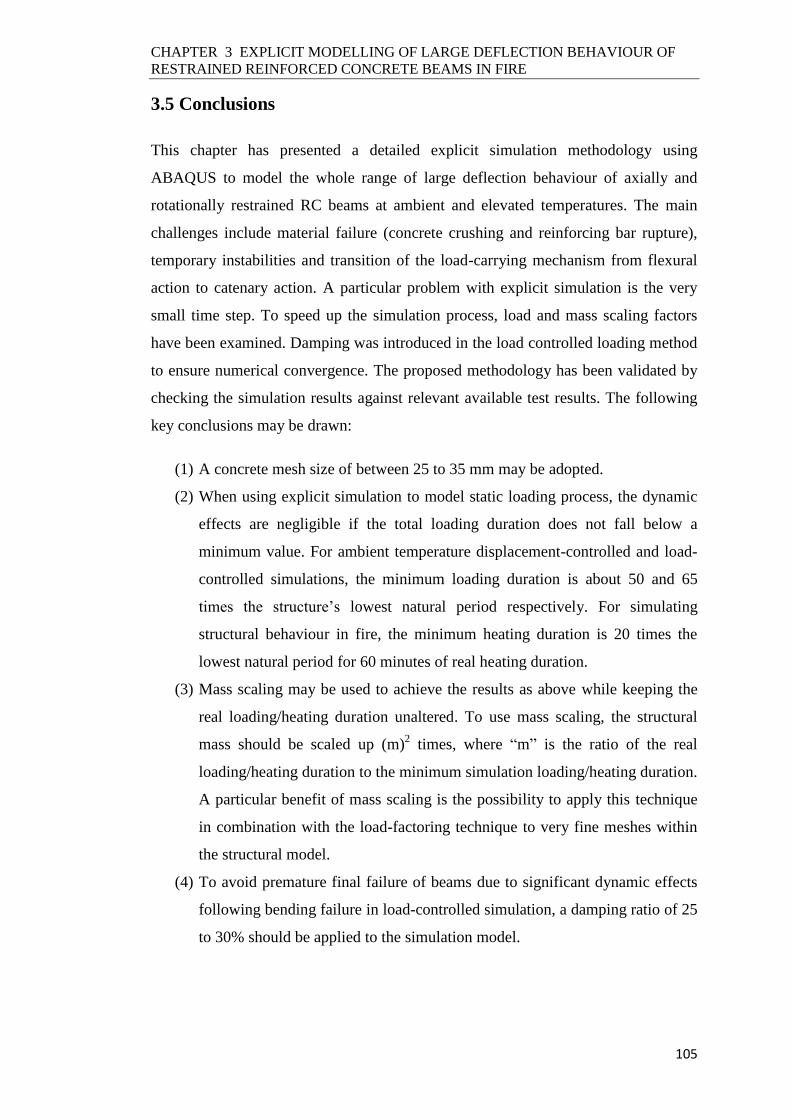
CHAPTER 3 EXPLICIT MODELLING OF LARGE DEFLECTION BEHAVIOUR OF
RESTRAINED REINFORCED CONCRETE BEAMS IN FIRE
105
3.5 Conclusions
This chapter has presented a detailed explicit simulation methodology using
ABAQUS to model the whole range of large deflection behaviour of axially and
rotationally restrained RC beams at ambient and elevated temperatures. The main
challenges include material failure (concrete crushing and reinforcing bar rupture),
temporary instabilities and transition of the load-carrying mechanism from flexural
action to catenary action. A particular problem with explicit simulation is the very
small time step. To speed up the simulation process, load and mass scaling factors
have been examined. Damping was introduced in the load controlled loading method
to ensure numerical convergence. The proposed methodology has been validated by
checking the simulation results against relevant available test results. The following
key conclusions may be drawn:
(1) A concrete mesh size of between 25 to 35 mm may be adopted.
(2) When using explicit simulation to model static loading process, the dynamic
effects are negligible if the total loading duration does not fall below a
minimum value. For ambient temperature displacement-controlled and load-
controlled simulations, the minimum loading duration is about 50 and 65
times the structure’s lowest natural period respectively. For simulating
structural behaviour in fire, the minimum heating duration is 20 times the
lowest natural period for 60 minutes of real heating duration.
(3) Mass scaling may be used to achieve the results as above while keeping the
real loading/heating duration unaltered. To use mass scaling, the structural
mass should be scaled up (m)2 times, where “m” is the ratio of the real
loading/heating duration to the minimum simulation loading/heating duration.
A particular benefit of mass scaling is the possibility to apply this technique
in combination with the load-factoring technique to very fine meshes within
the structural model.
(4) To avoid premature final failure of beams due to significant dynamic effects
following bending failure in load-controlled simulation, a damping ratio of 25
to 30% should be applied to the simulation model.

CHAPTER 4 BEHAVIOUR OF AXIALLY AND ROTATIONALLY RESTRAINED
REINFORCED CONCRETE BEAMS IN FIRE
106
CHAPTER 4
BEHAVIOUR OF AXIALLY AND ROTATIONALLY
RESTRAINED REINFORCED CONCRETE BEAMS IN
FIRE
4.1 Introduction
An important objective of the present research is to gain a thorough understanding of
the influence of boundary conditions on the structural behaviour and failure modes of
RC beams in fire. This chapter presents the results of an extensive numerical
parametric study to examine the effects of different levels of axial and rotational
restraints on the full-history fire response of RC beams, including catenary action at
large deflections. The parametric studies were conducted on beam-column
assemblies. Linear temperature-independent axial and rotational restraints were
provided to the beam ends by using the connected columns and additional springs.
The proposed numerical model in Chapter 3 was employed for the parametric study
in this chapter and the results of this chapter will be the basis of assumptions for the
simplified calculation method of this thesis to be presented in Chapter 5.
4.2 Simulation Methodology
A schematic arrangement of a beam-column sub-frame shown in Figure 4.1 was
adopted to investigate the behaviour of restrained RC beams in fire under different
levels of end axial and rotational restraints. Details of only one-half of the sub-frame
are shown for clarity. In this parametric study, because the focus is on behaviour of
the restrained beam, linear behaviour of the axial and rotational restraints was
assumed. In addition, their levels were kept constant throughout the whole fire
exposure period. The end restraints, exerted by the supporting columns, axial and
rotational springs, were defined in a relative manner as follows:
𝑘𝑎 =𝐾𝐴,𝑠𝑢𝑝+𝐾𝐴
(𝐸𝑐𝑚𝐴 𝐿⁄ )𝑏𝑒𝑎𝑚 4-1

CHAPTER 4 BEHAVIOUR OF AXIALLY AND ROTATIONALLY RESTRAINED
REINFORCED CONCRETE BEAMS IN FIRE
107
𝑘𝑟 =𝐾𝑅,𝑠𝑢𝑝+𝐾𝑅
(4𝐸𝑐𝑚𝐼 𝐿⁄ )𝑏𝑒𝑎𝑚 4-2
where ka, kr are non-dimensional relative axial and rotational stiffness parameters,
defined as the ratios of stiffness of the total axial and rotational restraints of the
adjacent structure, including the springs, to the ambient-temperature axial and
rotational stiffness of the beam under consideration, respectively. KA,sup and KR,sup are
the axial and rotational stiffness from the supporting columns, respectively. Ecm, I, A
and L are ambient-temperature elastic modulus of concrete, moment of inertia of the
beam section with respect to its geometric centre, beam cross-sectional area and
span, respectively. Calculations of KA,sup and KR,sup based on the sub-frame in Figure
4.1 are presented in Appendix A2.
In this study, the “axial connector element” in ABAQUS was used instead of the
spring element to model the axial and rotational springs as it can be easily operated
in ABAQUS CAE when the explicit solver is employed. To prevent stress
concentration and local failure of the column surface to which the springs are
attached, a rigid surface (Surface A in Figure 4.1) was introduced to the column and
this surface is at the same elevation position as the beam-column interface. The
location of the axial and rotational connector elements are at the geometric centre of
surface A. The nodes on this surface are coupled to a controlled reference point
(point O in Figure 4.1) using the Multi-Point Constraint (MPC) type function in
ABAQUS. This reference point is connected to a “Ground Point”. Meshes with an
element size of 30mm were used for the concrete beam-column sub-frame.
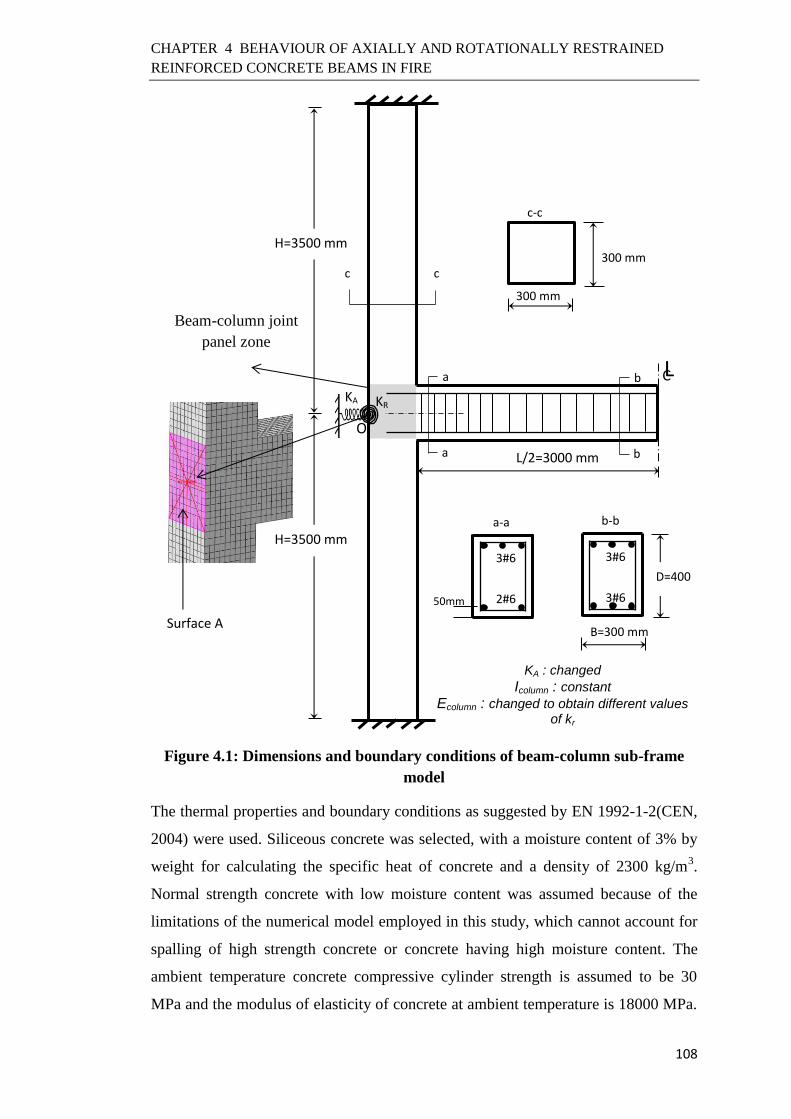
CHAPTER 4 BEHAVIOUR OF AXIALLY AND ROTATIONALLY RESTRAINED
REINFORCED CONCRETE BEAMS IN FIRE
108
Figure 4.1: Dimensions and boundary conditions of beam-column sub-frame
model
The thermal properties and boundary conditions as suggested by EN 1992-1-2(CEN,
2004) were used. Siliceous concrete was selected, with a moisture content of 3% by
weight for calculating the specific heat of concrete and a density of 2300 kg/m3.
Normal strength concrete with low moisture content was assumed because of the
limitations of the numerical model employed in this study, which cannot account for
spalling of high strength concrete or concrete having high moisture content. The
ambient temperature concrete compressive cylinder strength is assumed to be 30
MPa and the modulus of elasticity of concrete at ambient temperature is 18000 MPa.
Surface A
Beam-column joint
panel zone
2#6
3#6
50mm
a-a
B=300 mm
3#6
3#6
D=400
mm
b-b
C
L/2=3000 mm
mm
H=3500 mm
H=3500 mm
KA
a
a
b
b L
c c
c-c
300 mm
300 mm
O
KR
KA : changed
Icolumn : constant
Ecolumn : changed to obtain different values of kr

CHAPTER 4 BEHAVIOUR OF AXIALLY AND ROTATIONALLY RESTRAINED
REINFORCED CONCRETE BEAMS IN FIRE
109
The hot-rolled steel reinforcement bar yield strength at ambient temperature is
assumed to be 453 MPa (Grade 460), with the ultimate strain being 0.05, assuming
class A reinforcement as suggested by EN 1992-1-2 (CEN, 2004). In order to prevent
spurious fracture failure of reinforcement bars in compression, a higher value of
ultimate strain (0.25) was assumed for the bottom reinforcement bars within the zone
of a length of 1.5 times the beam depth measured from the column face.
The material behaviour of the column was assumed to be linear elastic and not
affected by temperature; however, the modulus of elasticity of the material was
varied to allow for a range of rotational stiffness ratios, defined in Equation 4.2, to be
investigated. In addition, the joint panel shown in Figure 4.1 was modelled with a
high elastic modulus value to prevent any local distortion of the concrete surrounding
the longitudinal steel bars in the beam-column joint; the elastic modulus of 18000
MPa (equal to the initial elastic modulus of the beam at ambient temperature) was
assumed irrespective of the value of the columns.
Transient modelling was carried out: the mechanical load on the beam was applied
first and kept constant and then the structural temperatures, imported from 3-D heat
transfer analysis, were increased The column was prevented from twisting and the
out-of-plane translation of the beam was not allowed so as to prevent lateral torsional
buckling. The beam was subjected to a uniformly distributed load of w=19.6 kN/m,
to give a load ratio (LR) of 35%, LR being defined as the ratio of total bending
moment in the beam (wL2/8) to the rotationally fix-ended beam’s bending moment
capacity at ambient temperature (sum of plastic bending resistance at the end and in
the span, sagging capacity=hogging capacity=126 kN.m, calculated without
consideration of compression reinforcement (Appendix A1)).
The beam length, cross-section dimensions and reinforcement details, shown in
Figure 4.1, were kept unchanged during the parametric study. All the top steel
reinforcement bars were continuous along the whole beam length without
curtailment.
In a performance-based approach for fire design, it is highly desirable to model a
structure taking into account realistic representation of the fire. This requires
assessing fire behaviour of the structure under different fire scenarios that depend on
the fuel load, ventilation conditions and properties of the wall lining in a

CHAPTER 4 BEHAVIOUR OF AXIALLY AND ROTATIONALLY RESTRAINED
REINFORCED CONCRETE BEAMS IN FIRE
110
compartment. To date, a number of models for describing fire time-temperature
curves have been developed and are specified in design codes and standards, such as
Eurocode 1 provisions (CEN, 2002). There are standard and design (parametric) fire
time-temperature curves. The standard fire curves, such as those specified in ISO 834
(1975) and ASTM E119 (2008), do not include a decay (cooling) phase so fire
temperatures continue to increase, irrespective of compartment characteristics.
However, more realistic design fire curves incorporate a decay phase during which
the temperature of the fire decreases back to the ambient temperature. Previous
experimental and numerical studies have shown that the type of fire scenario has a
significant influence on the thermal and structural behaviour of RC members in fire
(Kodur et al., 2009, Dwaikat and Kodur, 2009a, Gao et al., 2017). Different fire
curves can give different thermal gradients that develop within the member cross-
section, which in turn result in different thermally-induced defamations and stresses
in the member and different rates of degradation of material properties at elevated
temperatures. Additionally, in the cooling phase, steel reinforcing bars recover parts
of their stiffness and strength. All these influence fire resistance.
The analysed beams in this chapter were exposed to the ISO 834 standard fire only,
where the time-temperature curve includes only the heating phase. The cooling phase
of the fire was not considered. The reasons for this are because: (1) the main purpose
of the study in this chapter is to understand the relative performance of RC beams
under different levels of axial and rotational restraints at elevated temperatures, (2)
understanding of catenary action developed at very large beam deflections after
bending failure is still immature and (3) as mentioned in Chapter 3, the finite element
model used in this study is not applicable to design fires that have a cooling phase as
it cannot capture irreversibility of the load-induced thermal strain (LITS) in analyses
involving concrete in compression. Figure 4.2 shows the temperature histories of
various reinforcing steel bars, obtained from the heat transfer analysis.
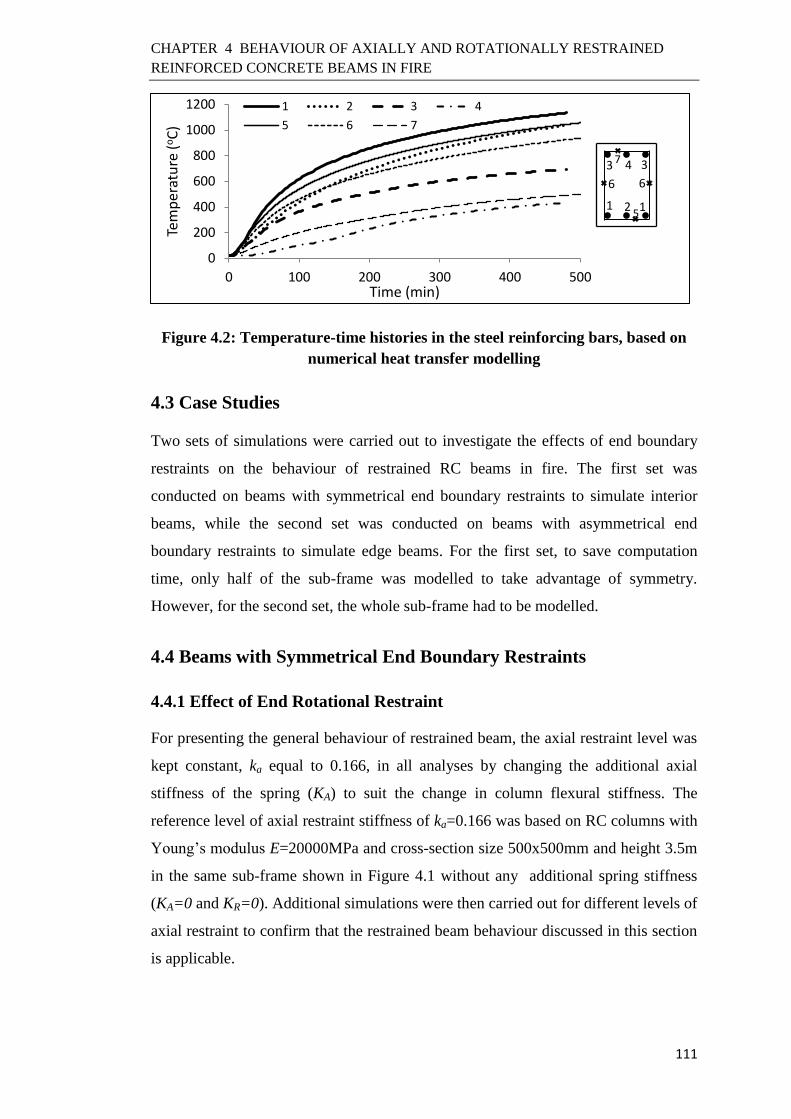
CHAPTER 4 BEHAVIOUR OF AXIALLY AND ROTATIONALLY RESTRAINED
REINFORCED CONCRETE BEAMS IN FIRE
111
Figure 4.2: Temperature-time histories in the steel reinforcing bars, based on
numerical heat transfer modelling
4.3 Case Studies
Two sets of simulations were carried out to investigate the effects of end boundary
restraints on the behaviour of restrained RC beams in fire. The first set was
conducted on beams with symmetrical end boundary restraints to simulate interior
beams, while the second set was conducted on beams with asymmetrical end
boundary restraints to simulate edge beams. For the first set, to save computation
time, only half of the sub-frame was modelled to take advantage of symmetry.
However, for the second set, the whole sub-frame had to be modelled.
4.4 Beams with Symmetrical End Boundary Restraints
4.4.1 Effect of End Rotational Restraint
For presenting the general behaviour of restrained beam, the axial restraint level was
kept constant, ka equal to 0.166, in all analyses by changing the additional axial
stiffness of the spring (KA) to suit the change in column flexural stiffness. The
reference level of axial restraint stiffness of ka=0.166 was based on RC columns with
Young’s modulus E=20000MPa and cross-section size 500x500mm and height 3.5m
in the same sub-frame shown in Figure 4.1 without any additional spring stiffness
(KA=0 and KR=0). Additional simulations were then carried out for different levels of
axial restraint to confirm that the restrained beam behaviour discussed in this section
is applicable.
0
200
400
600
800
1000
1200
0 100 200 300 400 500
Tem
per
atu
re (
oC
)
Time (min)
1 2 3 4
5 6 7
1 2
4
6
1
3 3
5
6
7

CHAPTER 4 BEHAVIOUR OF AXIALLY AND ROTATIONALLY RESTRAINED
REINFORCED CONCRETE BEAMS IN FIRE
112
The modulus of elasticity of the column material ranges from 25000 MPa to 63 MPa,
to reflect possible temperature effects of concrete in the range of ambient
temperature to about 1000oC.
In order to cover a range of possible end rotational restraints, different values of kr,
being 0.0064, 0.013, 0.022, 0.032, 0.045, 0.064, 0.125, 0.58, and 1.85, were
considered.
4.4.1.1 Results and Discussions
Figure 4.3 shows the overall global behaviour of the structural response of the
beams, presented for the beam mid-span deflection and beam axial restraining force
(tension positive)–fire exposure time relationships. All results show the same key
stages of global response as explained below. Before the start of fire, beams with low
rotational stiffness kr develop higher initial deflections. After fire exposure,
compressive forces are generated in the beams due to restrained thermal expansion.
The initial rate of increase of compression force depends on the axial restraint level.
This phase lasts until the combined bending moment and axial compression force
reach the capacity of the critical section, after which, the compression force in the
beam decreases. At the end of this process, the tension reinforcement bars in the
beam span fracture, as shown by the strain-time relationship in Figure 4.4. During
this stage, the beam deflection accelerates. As expected, beams with greater kr values
reach this stage later because the bending moment in the beam span is lower and the
rate of their deflection is lower.

CHAPTER 4 BEHAVIOUR OF AXIALLY AND ROTATIONALLY RESTRAINED
REINFORCED CONCRETE BEAMS IN FIRE
113
(a) Comparison of beam mid-span deflections-fire exposure time relationships
(b) Comparison of beam axial force-fire exposure time relaitonships
Figure 4.3: Effect of rotational restraint levels on beam behaviour (ka=0.166)
-800
-700
-600
-500
-400
-300
-200
-100
0
0 50 100 150 200 250 300 350 400 450
Def
lect
ion
(mm
)
Time (min)
kr=0.0064 kr=0.013 kr=0.022 kr=0.032 kr=0.045
kr=0.064 kr=0.125 kr=0.58 kr=1.85
-700
-600
-500
-400
-300
-200
-100
0
100
200
300
0 50 100 150 200 250 300 350 400 450
Axi
al f
orc
e (k
N)
Time (min)
kr=0.0064 kr=0.013 kr=0.022 kr=0.032 kr=0.045
kr=0.064 kr=0.125 kr=0.58 kr=1.85

CHAPTER 4 BEHAVIOUR OF AXIALLY AND ROTATIONALLY RESTRAINED
REINFORCED CONCRETE BEAMS IN FIRE
114
(a) Bottom corner bars (bars 1)
(b) Bottom middle bar (bar 2)
Figure 4.4: Strain-fire exposure time relationship of longitudinal reinforcing
bars at beam mid-span (ka=0.166)
One of the principal outputs of this research is the effects of restraints on fire
resistance times. In this research, two fire resistance times are assessed: beam
bending resistance time and beam ultimate resistance time. The bending resistance
-750
-600
-450
-300
-150
0
150
300
450
600
-0.08
-0.06
-0.05
-0.03
-0.02
0.00
0.02
0.03
0.05
0.06
0 50 100 150 200 250 300 350 400 450
Def
lect
ion
(mm
)
Stra
in (
mm
/mm
)
Time (min)
kr=0.0064 (S) kr=0.013 (S) kr=0.022 (S)kr=0.032 (S) kr=0.045 (S) kr=0.064 (S)kr=0.125 (S) kr=0.58 (S) kr=1.85 (S)kr=0.0064 (D) kr=0.013 (D) kr=0.022 (D)kr=0.032 (D) kr=0.045 (D) kr=0.064 (D)kr=0.125 (D) kr=0.58 (D) kr=1.85 (D)
Mid-span
Limiting strain=5%
S: Strain D: Deflection
-0.01
0.00
0.01
0.02
0.03
0.04
0.05
0.06
0 50 100 150 200 250 300 350 400 450
Stra
in m
m/m
m)
Time (min)
kr=0.0064 kr=0.013 kr=0.022kr=0.032 kr=0.045 kr=0.064kr=0.125 kr=0.58 kr=1.85
Mid-span
Limiting strain=5%

CHAPTER 4 BEHAVIOUR OF AXIALLY AND ROTATIONALLY RESTRAINED
REINFORCED CONCRETE BEAMS IN FIRE
115
time of the beam is the time when the compression force in the beam is decreased to
zero (i.e. the end of the flexural action), and the ultimate resistance time is when the
beam could not resist the applied load any longer. Figure 4.5 summarises how beam
bending resistance times and beam ultimate resistance times change with levels of
rotational restraint. It is expected that beams with higher rotational restraints, and
hence higher hogging moment resistance, should reach longer bending resistance
time, i.e. fire exposure time when the compression force in the beam decreases to
zero. However, this trend is not followed. This may be explained by the different
modes of bending behaviour of the beam, details of which are presented in section
4.4.1.2. Following bending failure, the beam tends to develop catenary action when
the axial compressive force begins to reverse to tension. The activation and
resistance of catenary action are highly affected by the rotational restraint stiffness,
but only for kr<0.064, indicated in Figure 4.5. The following two sections will
explain the effects of rotational restraint on beam bending resistance limit and beam
ultimate failure times.
Figure 4.5: Effect of rotational stiffness level on beam fire resistance (ka=0.166)
4.4.1.2 Effects of Rotational Restraint on Bending Resistance Limit Time
The results in Figure 4.5 show three phases of bending resistance time change with
increasing rotational stiffness: increasing initially, but then decreasing afterwards
before increasing slightly again. This trend reflects the three different possible modes
of bending failure of the beam: (I) beam bending failure governed by sagging
bending resistance at mid-span, (II) by combined fracture of top reinforcement at
ends and bottom reinforcement at mid-span, and (III) by concrete crushing at ends.
0
100
200
300
400
500
0 0.03 0.06 0.09 0.12 0.15 0.18 0.21 0.24 0.27 0.3
Fire
res
ista
nce
(m
in)
Rotational stiffness ratio, (kr)
Bending resistance
Ultimate resistance
Resistance from catenary action

CHAPTER 4 BEHAVIOUR OF AXIALLY AND ROTATIONALLY RESTRAINED
REINFORCED CONCRETE BEAMS IN FIRE
116
For beams with low rotational restraint levels, namely when kr ≤ 0.045, the sagging
bending moment reaches its limit value in the beam mid-span with no plastic hinge
formation at the beam ends, as shown by the typical example in Figure 4.6(a). When
the sagging bending capacity is attained, as indicated by first phase of rapid beam
deflection increase in Figure 4.3(a) and rapid reduction in beam compressive force in
Figure 4.3(b), the reinforcement strain increases rapidly to the fracture limit, as
shown in Figure 4.4. This causes the beam to temporarily lose static equilibrium, as
indicated by the jump in kinetic energy of the system shown in Figure 4.7. From here
onwards, the beam behaves as an axially and rotationally restrained one with a pin-
like joint at the mid-span.
Figure 4.6: Deformed shapes and failure modes (kr=0.022, ka=0.166)
Mid-span bending failure time=123 min
Beam bending resistance time=234 min
Total fire survival time=234 min
(b) At t = 234 min (final failure)
(a) At t = 123 min
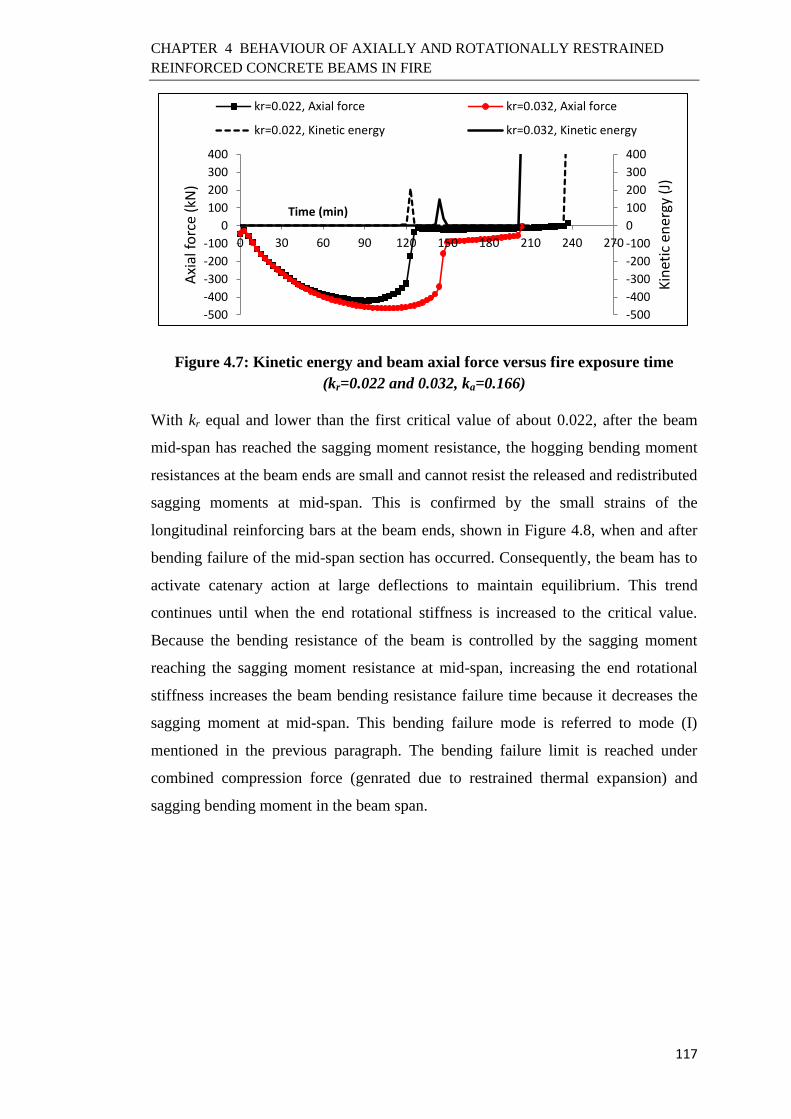
CHAPTER 4 BEHAVIOUR OF AXIALLY AND ROTATIONALLY RESTRAINED
REINFORCED CONCRETE BEAMS IN FIRE
117
Figure 4.7: Kinetic energy and beam axial force versus fire exposure time
(kr=0.022 and 0.032, ka=0.166)
With kr equal and lower than the first critical value of about 0.022, after the beam
mid-span has reached the sagging moment resistance, the hogging bending moment
resistances at the beam ends are small and cannot resist the released and redistributed
sagging moments at mid-span. This is confirmed by the small strains of the
longitudinal reinforcing bars at the beam ends, shown in Figure 4.8, when and after
bending failure of the mid-span section has occurred. Consequently, the beam has to
activate catenary action at large deflections to maintain equilibrium. This trend
continues until when the end rotational stiffness is increased to the critical value.
Because the bending resistance of the beam is controlled by the sagging moment
reaching the sagging moment resistance at mid-span, increasing the end rotational
stiffness increases the beam bending resistance failure time because it decreases the
sagging moment at mid-span. This bending failure mode is referred to mode (I)
mentioned in the previous paragraph. The bending failure limit is reached under
combined compression force (genrated due to restrained thermal expansion) and
sagging bending moment in the beam span.
-500
-400
-300
-200
-100
0
100
200
300
400
-500
-400
-300
-200
-100
0
100
200
300
400
0 30 60 90 120 150 180 210 240 270
Kin
etic
en
ergy
(J)
Axi
al f
orc
e (k
N)
Time (min)
kr=0.022, Axial force kr=0.032, Axial force
kr=0.022, Kinetic energy kr=0.032, Kinetic energy

CHAPTER 4 BEHAVIOUR OF AXIALLY AND ROTATIONALLY RESTRAINED
REINFORCED CONCRETE BEAMS IN FIRE
118
(a) Top corner bars (bars 3)
(b) Top middle bars (bar 4)
-0.01
0.00
0.01
0.02
0.03
0.04
0.05
0.06
0 50 100 150 200 250 300 350 400 450
Stra
in (
mm
/mm
)
Time (min)
kr=0.0064 kr=0.013 kr=0.022kr=0.032 kr=0.045 kr=0.064kr=0.125 kr=0.58 kr=1.85
Ends
Limiting strain=5%
-750
-600
-450
-300
-150
0
150
300
450
600
-0.08
-0.06
-0.05
-0.03
-0.02
0.00
0.02
0.03
0.05
0.06
0 50 100 150 200 250 300 350 400 450
Def
lect
ion
(mm
)
Stra
in (
mm
/mm
)
Time (min)
kr=0.0064 (S) kr=0.013 (S) kr=0.022 (S)
kr=0.032 (S) kr=0.045 (S) kr=0.064 (S)
kr=0.125 (S) kr=0.58 (S) kr=1.85 (S)
kr=0.0064 (D) kr=0.013 (D) kr=0.022 (D)
kr=0.032 (D) kr=0.045 (D) kr=0.064 (D)
kr=0.125 (D) kr=0.58 (D) kr=1.85 (D)
Ends
Limiting strain=5%
S: Strain D: Deflection
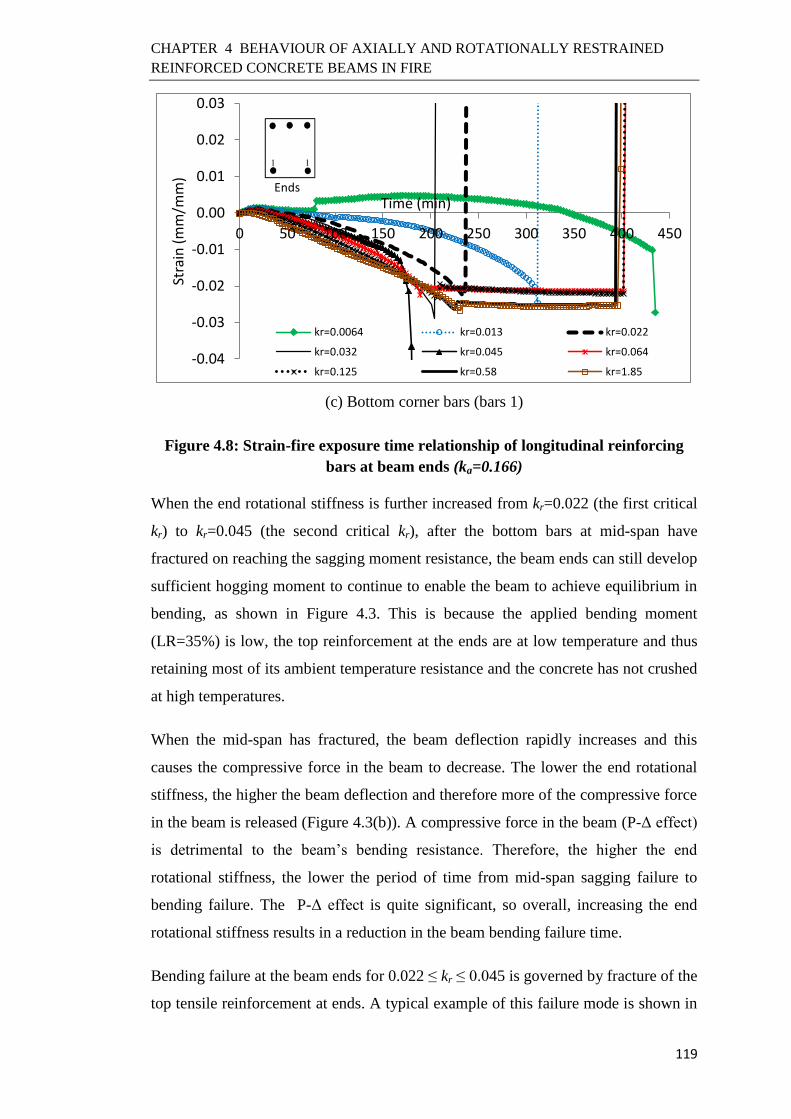
CHAPTER 4 BEHAVIOUR OF AXIALLY AND ROTATIONALLY RESTRAINED
REINFORCED CONCRETE BEAMS IN FIRE
119
(c) Bottom corner bars (bars 1)
Figure 4.8: Strain-fire exposure time relationship of longitudinal reinforcing
bars at beam ends (ka=0.166)
When the end rotational stiffness is further increased from kr=0.022 (the first critical
kr) to kr=0.045 (the second critical kr), after the bottom bars at mid-span have
fractured on reaching the sagging moment resistance, the beam ends can still develop
sufficient hogging moment to continue to enable the beam to achieve equilibrium in
bending, as shown in Figure 4.3. This is because the applied bending moment
(LR=35%) is low, the top reinforcement at the ends are at low temperature and thus
retaining most of its ambient temperature resistance and the concrete has not crushed
at high temperatures.
When the mid-span has fractured, the beam deflection rapidly increases and this
causes the compressive force in the beam to decrease. The lower the end rotational
stiffness, the higher the beam deflection and therefore more of the compressive force
in the beam is released (Figure 4.3(b)). A compressive force in the beam (P-Δ effect)
is detrimental to the beam’s bending resistance. Therefore, the higher the end
rotational stiffness, the lower the period of time from mid-span sagging failure to
bending failure. The P-Δ effect is quite significant, so overall, increasing the end
rotational stiffness results in a reduction in the beam bending failure time.
Bending failure at the beam ends for 0.022 ≤ kr ≤ 0.045 is governed by fracture of the
top tensile reinforcement at ends. A typical example of this failure mode is shown in
-0.04
-0.03
-0.02
-0.01
0.00
0.01
0.02
0.03
0 50 100 150 200 250 300 350 400 450
Stra
in (
mm
/mm
)
Time (min)
kr=0.0064 kr=0.013 kr=0.022
kr=0.032 kr=0.045 kr=0.064
kr=0.125 kr=0.58 kr=1.85
Ends

CHAPTER 4 BEHAVIOUR OF AXIALLY AND ROTATIONALLY RESTRAINED
REINFORCED CONCRETE BEAMS IN FIRE
120
Figure 4.6(b) for the case kr=0.022. Strains of the beam end tensile reinforcement
bars, plotted in Figure 4.8 with time, confirm coincidence of beam bending failure
time with tensile strain reaching the fracture value. This failure mode is typical of
tension-controlled failure, which generates when stresses of the top bars reach their
yield strength before compressive failure of the concrete in the compression region.
This is referred to as bending failure mode (II). kr = 0.045 marks the end of this
failure mode in this case. At this level of stiffness, fracture of the top reinforcement
at the beam ends occurs at about the same time as bending failure of the beam mid-
span. The bending limit is governed by beam failure at ends due to combined total
bending moment in the beam and a small amount of residual compression force.
When the end rotational stiffness of the beam increases further (kr ≥ 0.064), the
hogging moments at the beam ends are higher than the mid-span bending moment
relative to their resistances and bending failure of the beam is governed by
compressive failure of concrete in the hogging moment region, as displayed in Figure
4.9(a). Concrete crushing is confirmed by observing that the strains of the bottom
layers of concrete exposed to fire, plotted in Figure 4.10, have exceeded the strains
corresponding to peak and zero compression stresses according to the concrete
stress-strain relationships at elevated temperature presented in Appendix A.4 in
Figure A4.7. However, once compressive failure of concrete occurs, the hogging
moments are released and the beam mid-span does not have sufficient sagging
moment resistance to achieve bending equilibrium. Even though increasing the beam
end rotational stiffness attracts more compressive stress in concrete at the beam ends,
this is offset by the reduced P-Δ effect because a higher beam end rotational stiffness
reduces the beam deflection. For such beams, before the end sections reach
compressive crushing of concrete on the fire exposed face, the sagging bending
moments has not reached its resistance, as indicated by the tensile strain being less
than the steel yield strain, shown in Figure 4.4.
After concrete crushing, the compressive reinforcement (bottom bars) at the same
location loses concrete restraint and buckles (Figure 4.11(a)), as shown and indicated
by rapid increase in compressive strain of the buckled bars in Figure 4.11(b).

CHAPTER 4 BEHAVIOUR OF AXIALLY AND ROTATIONALLY RESTRAINED
REINFORCED CONCRETE BEAMS IN FIRE
121
Figure 4.9: Deformed shapes and failure modes (kr=0.064, ka=0.166)
Figure 4.10: Strain-fire exposure time for concrete near the beam ends
(kr=0.064, ka=0.166)
Beam bending resistance time=191 min
Total fire survival time=402 min
(a) At t = 190 min
(b) At t = 193 min
(c) At t = 402 min (final failure)
-600
-500
-400
-300
-200
-100
0
100
200
-0.24
-0.20
-0.16
-0.12
-0.08
-0.04
0.00
0.04
0.08
0 50 100 150 200 250 300 350 400 450
Axi
al f
orc
e (k
N)
Stra
in (
mm
/mm
) Time (min)
Strain, y=15 mm Strain, y=75 mm Strain, y=135 mm
Strain, y=195 mm Beam axial force
Section A-A
All dimensions in mm

CHAPTER 4 BEHAVIOUR OF AXIALLY AND ROTATIONALLY RESTRAINED
REINFORCED CONCRETE BEAMS IN FIRE
122
(a) Deformed reinforcement
(b) Strain-time relationships
Figure 4.11: Behaviour of reinforcing bars at beam ends (kr=0.064, ka=0.166)
Once concrete crushing near the beam ends happens, flexural action cannot be
sustained, as indicated by the sudden drop of axial compressive force in the beam to
zero in Figure 4.3(b). This is because the beam end moments and axial compressive
force are thereafter released so the crushed sections behave like pin joints and the
mid-span does not have sufficient bending resistance to maintain equilibrium of the
beam in bending at such high temperatures. This is demonstrated by the dynamic
behaviour shown in Figure 4.12 where the beam experiences a significant increase in
kinetic energy and a loss of the total vertical reaction force. As the mid-span is
unable to sustain any significant additional moments under the new bending load-
Bottom
bar, ends Stirrup, bottom, ends
Top bar, ends
Bottom bar, ends
Top bar, ends
-600
-500
-400
-300
-200
-100
0
100
200
300
-0.15
-0.125
-0.1
-0.075
-0.05
-0.025
0
0.025
0.05
0.075
0 50 100 150 200 250 300 350 400 450
Axi
al f
orc
e (k
N)
Stra
in (
mm
/mm
)
Time (min)
Bottom bar, ends
Stirrup, bottom
Top bar, ends
Beam axial force
Limiting strain = 0.05

CHAPTER 4 BEHAVIOUR OF AXIALLY AND ROTATIONALLY RESTRAINED
REINFORCED CONCRETE BEAMS IN FIRE
123
carrying configuration, bending failure at the mid-span region occurs immediately.
Catenary action has to be mobilised to reach static equilibrium of the beam. This
bending failure mode of the beam generated by compressive failure of the concrete at
the beam ends is referred to as “failure mode III” in the context of this research. For
this mode, the bending limit is governed by the end hogging bending moment, in
combination with a compression force due to restrained thermal expansion, reaching
the section capacity at the beam ends.
Figure 4.12: Vertical reaction force, applied load and kinetic energy/internal
energy against fire exposure time (kr=0.064, ka=0.166)
As a summary, the bending behaviour of axially restrained beams is complicated,
with the bending failure time being controlled by three failure modes. Due to the
compressive force induced by restrained thermal expansion, concrete crushing at the
beam ends prevents formation of a typical 3-plastic hinge mechanism in the beam.
This has important implications on calculating the bending limit time of axially and
rotationally restrained reinforced concrete beams. An analytical method will be
derived in Chapter 5.
4.4.1.3 Effects of End Rotational Restraint on Beam Ultimate Failure
Time
After completely releasing the compression force in the beam, the beam may
advance into catenary action stage when the axial force in the beam becomes tensile.
The transition into catenary action is accompanied by the strains of the top bars along
the beam length, whether they are initially in tension or compression in flexural
action, to become tension as shown in Figure 4.13. The duration of the catenary
0
0.005
0.01
0.015
0.02
0.025
0.03
0.035
0
20
40
60
80
100
120
140
0 50 100 150 200 250 300 350 400
Kin
etic
en
ergy
/In
tern
al
ener
gy
Load
(kN
)
Time (min)
Vertical reaction
Applied load
KE/IE
KE: Kinetic energy IE: Internal energy
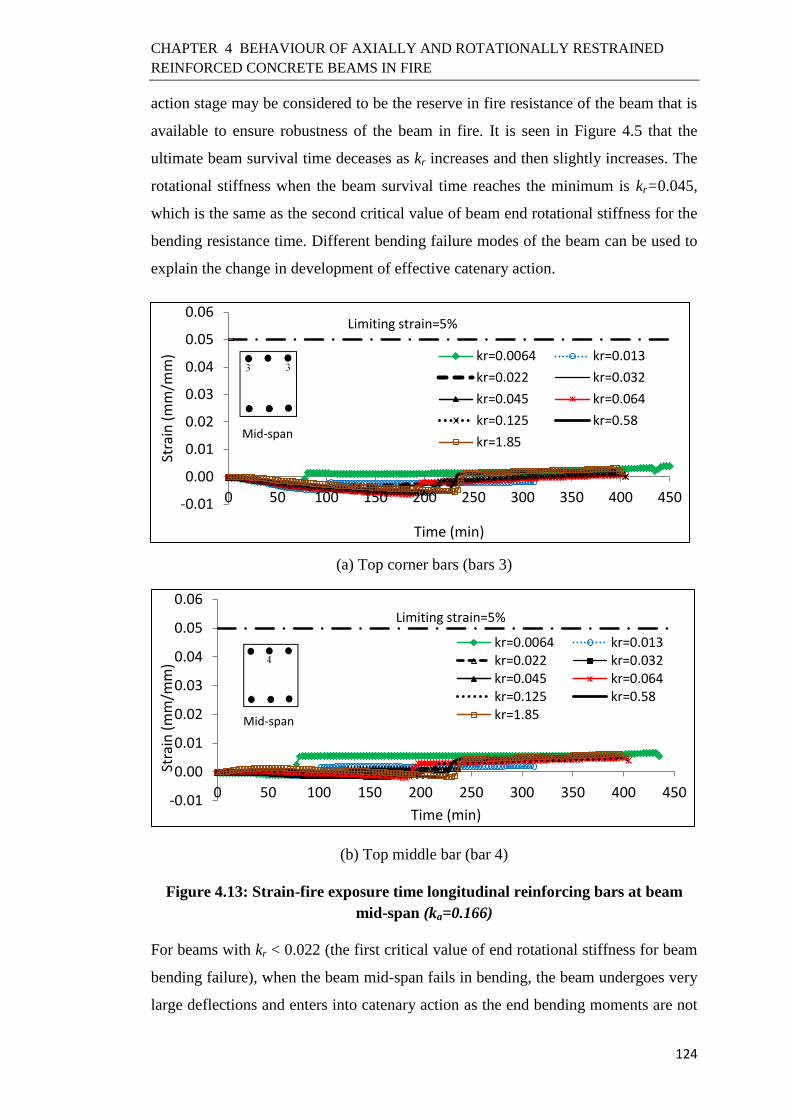
CHAPTER 4 BEHAVIOUR OF AXIALLY AND ROTATIONALLY RESTRAINED
REINFORCED CONCRETE BEAMS IN FIRE
124
action stage may be considered to be the reserve in fire resistance of the beam that is
available to ensure robustness of the beam in fire. It is seen in Figure 4.5 that the
ultimate beam survival time deceases as kr increases and then slightly increases. The
rotational stiffness when the beam survival time reaches the minimum is kr=0.045,
which is the same as the second critical value of beam end rotational stiffness for the
bending resistance time. Different bending failure modes of the beam can be used to
explain the change in development of effective catenary action.
(a) Top corner bars (bars 3)
(b) Top middle bar (bar 4)
Figure 4.13: Strain-fire exposure time longitudinal reinforcing bars at beam
mid-span (ka=0.166)
For beams with kr < 0.022 (the first critical value of end rotational stiffness for beam
bending failure), when the beam mid-span fails in bending, the beam undergoes very
large deflections and enters into catenary action as the end bending moments are not
-0.01
0.00
0.01
0.02
0.03
0.04
0.05
0.06
0 50 100 150 200 250 300 350 400 450
Stra
in (
mm
/mm
)
Time (min)
kr=0.0064 kr=0.013
kr=0.022 kr=0.032
kr=0.045 kr=0.064
kr=0.125 kr=0.58
kr=1.85Mid-span
Limiting strain=5%
-0.01
0.00
0.01
0.02
0.03
0.04
0.05
0.06
0 50 100 150 200 250 300 350 400 450
Stra
in (
mm
/mm
)
Time (min)
kr=0.0064 kr=0.013kr=0.022 kr=0.032kr=0.045 kr=0.064kr=0.125 kr=0.58kr=1.85Mid-span
Limiting strain=5%
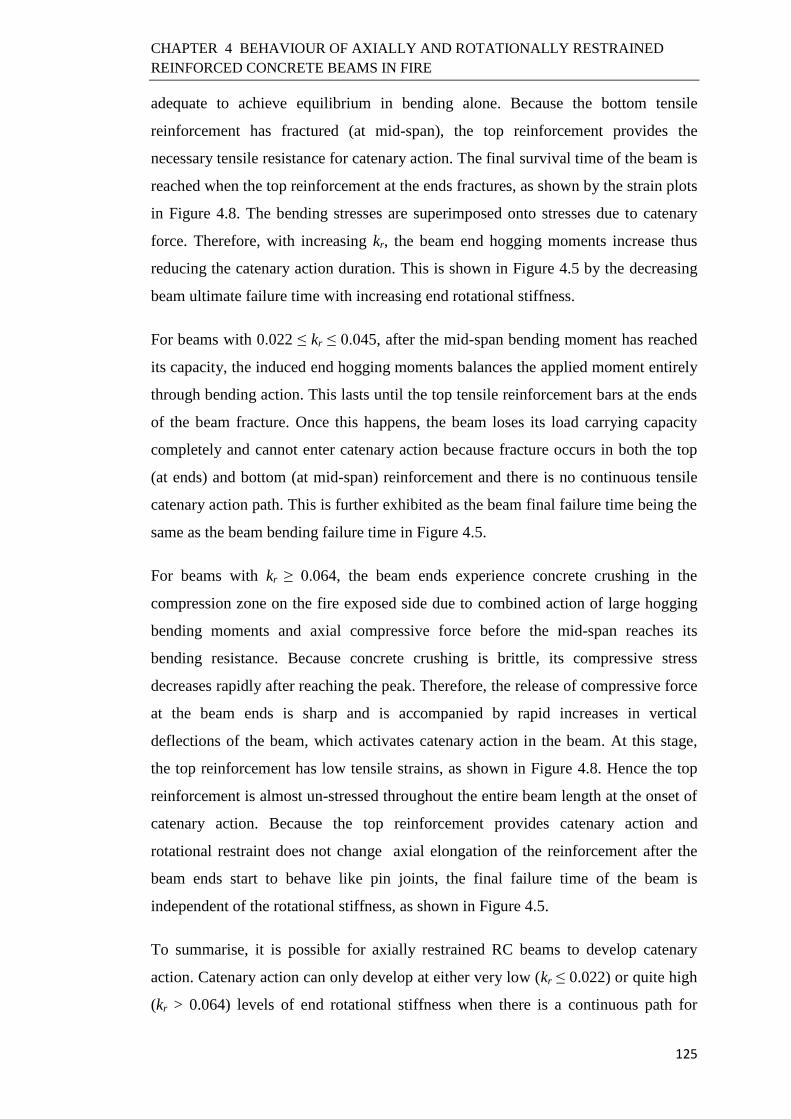
CHAPTER 4 BEHAVIOUR OF AXIALLY AND ROTATIONALLY RESTRAINED
REINFORCED CONCRETE BEAMS IN FIRE
125
adequate to achieve equilibrium in bending alone. Because the bottom tensile
reinforcement has fractured (at mid-span), the top reinforcement provides the
necessary tensile resistance for catenary action. The final survival time of the beam is
reached when the top reinforcement at the ends fractures, as shown by the strain plots
in Figure 4.8. The bending stresses are superimposed onto stresses due to catenary
force. Therefore, with increasing kr, the beam end hogging moments increase thus
reducing the catenary action duration. This is shown in Figure 4.5 by the decreasing
beam ultimate failure time with increasing end rotational stiffness.
For beams with 0.022 ≤ kr ≤ 0.045, after the mid-span bending moment has reached
its capacity, the induced end hogging moments balances the applied moment entirely
through bending action. This lasts until the top tensile reinforcement bars at the ends
of the beam fracture. Once this happens, the beam loses its load carrying capacity
completely and cannot enter catenary action because fracture occurs in both the top
(at ends) and bottom (at mid-span) reinforcement and there is no continuous tensile
catenary action path. This is further exhibited as the beam final failure time being the
same as the beam bending failure time in Figure 4.5.
For beams with kr ≥ 0.064, the beam ends experience concrete crushing in the
compression zone on the fire exposed side due to combined action of large hogging
bending moments and axial compressive force before the mid-span reaches its
bending resistance. Because concrete crushing is brittle, its compressive stress
decreases rapidly after reaching the peak. Therefore, the release of compressive force
at the beam ends is sharp and is accompanied by rapid increases in vertical
deflections of the beam, which activates catenary action in the beam. At this stage,
the top reinforcement has low tensile strains, as shown in Figure 4.8. Hence the top
reinforcement is almost un-stressed throughout the entire beam length at the onset of
catenary action. Because the top reinforcement provides catenary action and
rotational restraint does not change axial elongation of the reinforcement after the
beam ends start to behave like pin joints, the final failure time of the beam is
independent of the rotational stiffness, as shown in Figure 4.5.
To summarise, it is possible for axially restrained RC beams to develop catenary
action. Catenary action can only develop at either very low (kr ≤ 0.022) or quite high
(kr > 0.064) levels of end rotational stiffness when there is a continuous path for

CHAPTER 4 BEHAVIOUR OF AXIALLY AND ROTATIONALLY RESTRAINED
REINFORCED CONCRETE BEAMS IN FIRE
126
developing tensile stress in the reinforcement. An end rotational stiffness level of kr ≤
0.022 to the beam is very small. For example, the elastic modulus E of the supporting
columns (with cross-section size 300x300mm and height 3.5m) that produces
kr=0.022 was as low as 218 MPa. According to EN 1992 1-2 (CEN, 2004), the
temperature at which the elastic modulus of concrete degrades from 18000 MPa at
ambient-temperature to 218 MPa is about 850oC. And this temperature has to be
reached everywhere in the column. This is unlikely to occur in practice. Furthermore,
at this low level of rotational stiffness, the catenary action resistance is very sensitive
to the rotational stiffness. Therefore, in analytical modelling of restrained beam
behaviour to be presented in Chapter 5, and it is to be recommended in practice, that
the contribution of catenary action to fire resistance of beams with low kr should be
disregarded. Therefore, if the benefit of catenary action is to be exploited, this should
only be considered for beams with high kr values. Fortunately, this level of rotational
restraint stiffness can be easily reached in most reinforced RC structures. Finally,
because the bottom reinforcement at mid-span will always fracture, only the top
reinforcement can be utilised to provide tension during the catenary action stage. In
Chapter 5, which presents development of an analytical model, the catenary action
stage will only be considered for beams with high values of rotational stiffness.
4.4.2 Effects of Changing Axial Restraint Stiffness
The above study was carried out for the axial restraint level of ka=0.166. Numerical
simulations were carried out for two other levels of axial restraint stiffness
(ka=0.0275 and 0.4). A selection of the results are presented in Figures 4.14 to 4.17,
showing axial force-time relationships (Figures 4.14 and 4.15) and variations of
bending and final failure times of the beams against rotational restraint stiffness
(Figures 4.16 and 4.17). Comparison with the results in Figure 4.3(b) and Figure 4.5
for ka=0.166, it is clear that the general trends for different levels of axial restraint are
identical.
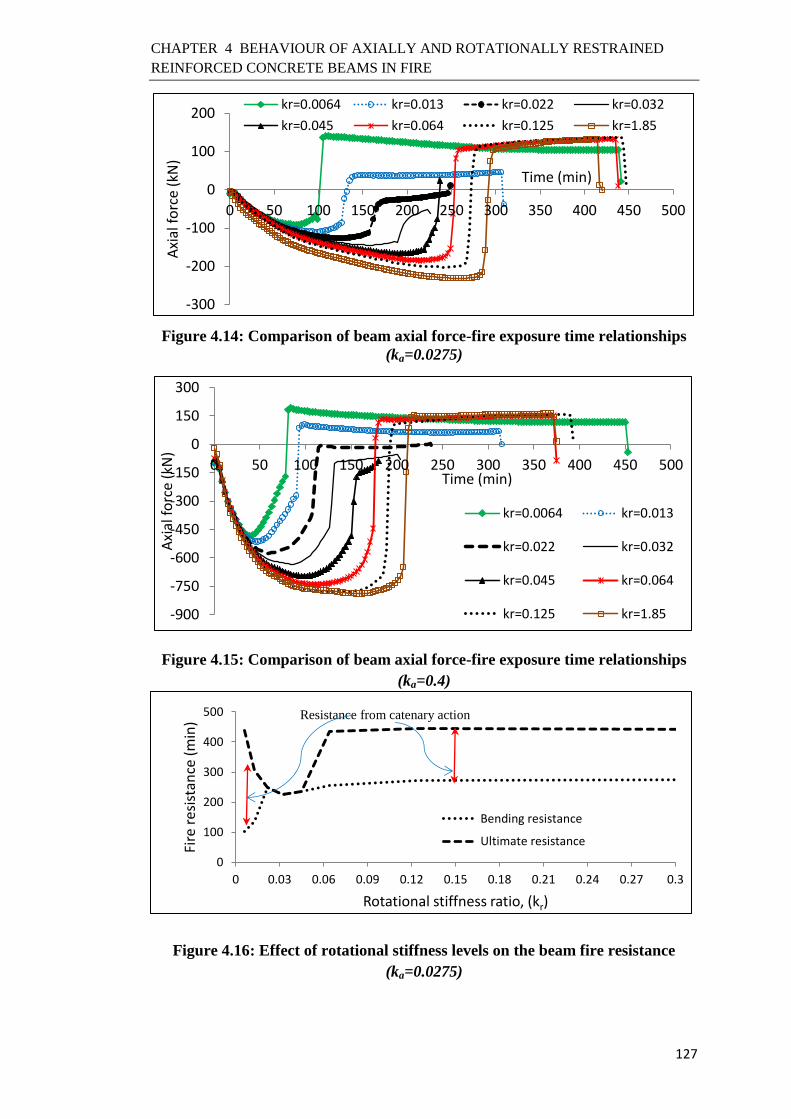
CHAPTER 4 BEHAVIOUR OF AXIALLY AND ROTATIONALLY RESTRAINED
REINFORCED CONCRETE BEAMS IN FIRE
127
Figure 4.14: Comparison of beam axial force-fire exposure time relationships
(ka=0.0275)
Figure 4.15: Comparison of beam axial force-fire exposure time relationships
(ka=0.4)
Figure 4.16: Effect of rotational stiffness levels on the beam fire resistance
(ka=0.0275)
-300
-200
-100
0
100
200
0 50 100 150 200 250 300 350 400 450 500
Axi
al f
orc
e (k
N)
Time (min)
kr=0.0064 kr=0.013 kr=0.022 kr=0.032
kr=0.045 kr=0.064 kr=0.125 kr=1.85
-900
-750
-600
-450
-300
-150
0
150
300
0 50 100 150 200 250 300 350 400 450 500
Axi
al f
orc
e (k
N)
Time (min)
kr=0.0064 kr=0.013
kr=0.022 kr=0.032
kr=0.045 kr=0.064
kr=0.125 kr=1.85
0
100
200
300
400
500
0 0.03 0.06 0.09 0.12 0.15 0.18 0.21 0.24 0.27 0.3
Fire
res
ista
nce
(m
in)
Rotational stiffness ratio, (kr)
Bending resistance
Ultimate resistance
Resistance from catenary action
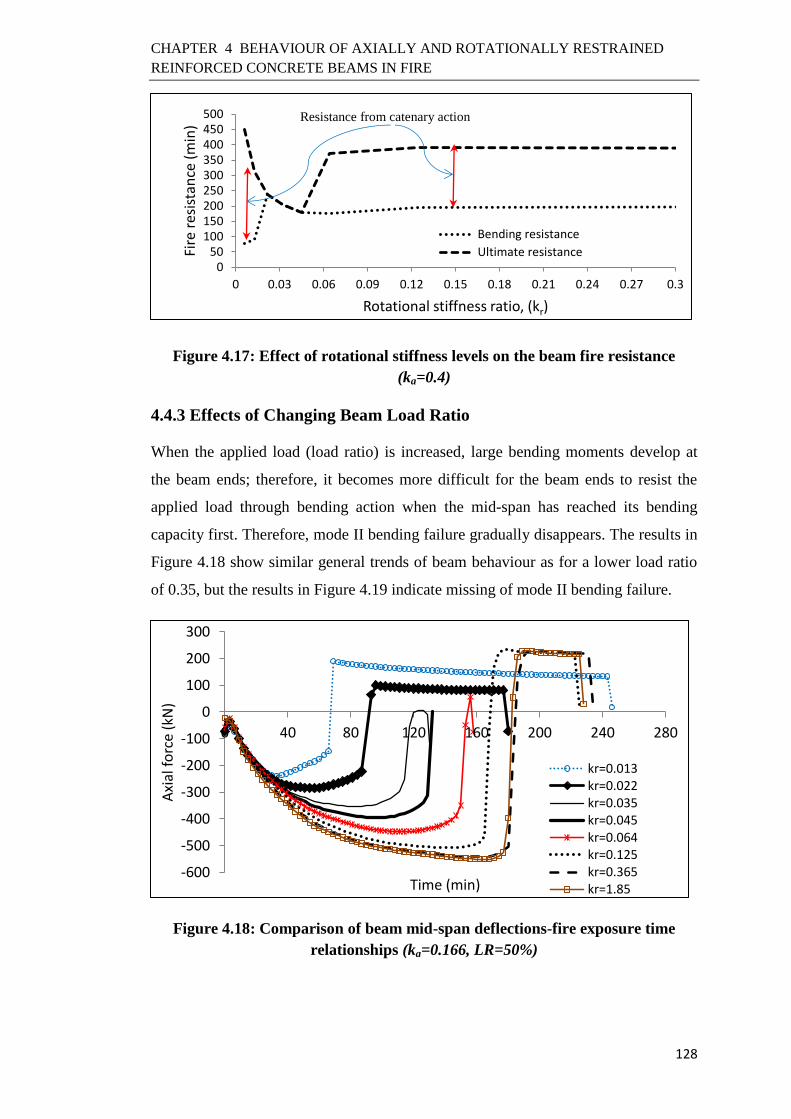
CHAPTER 4 BEHAVIOUR OF AXIALLY AND ROTATIONALLY RESTRAINED
REINFORCED CONCRETE BEAMS IN FIRE
128
Figure 4.17: Effect of rotational stiffness levels on the beam fire resistance
(ka=0.4)
4.4.3 Effects of Changing Beam Load Ratio
When the applied load (load ratio) is increased, large bending moments develop at
the beam ends; therefore, it becomes more difficult for the beam ends to resist the
applied load through bending action when the mid-span has reached its bending
capacity first. Therefore, mode II bending failure gradually disappears. The results in
Figure 4.18 show similar general trends of beam behaviour as for a lower load ratio
of 0.35, but the results in Figure 4.19 indicate missing of mode II bending failure.
Figure 4.18: Comparison of beam mid-span deflections-fire exposure time
relationships (ka=0.166, LR=50%)
-600
-500
-400
-300
-200
-100
0
100
200
300
0 40 80 120 160 200 240 280
Axi
al f
orc
e (k
N)
Time (min)
kr=0.013kr=0.022kr=0.035kr=0.045kr=0.064kr=0.125kr=0.365kr=1.85
050
100150200250300350400450500
0 0.03 0.06 0.09 0.12 0.15 0.18 0.21 0.24 0.27 0.3
Fire
res
ista
nce
(m
in)
Rotational stiffness ratio, (kr)
Bending resistance
Ultimate resistance
Resistance from catenary action
CHAPTER 4 BEHAVIOUR OF AXIALLY AND ROTATIONALLY RESTRAINED
REINFORCED CONCRETE BEAMS IN FIRE
129
Figure 4.19: Effect of rotational stiffness levels on the beam fire resistance
(ka=0.166, LR=50%)
4.4.4 Axially Unrestrained Beams
Although RC beams in realistic structures have axial restraint, the current fire
resistance design of RC beams assumes that there is no axial restraint and that at
failure, an RC beam can form a plastic hinge mechanism, as at ambient temperature.
Additional simulations have been carried out to examine whether the plastic hinge
mechanism is valid in fire. Figure 4.20 shows the variation of axially unrestrained
beam bending resistance time with increasing rotational stiffness level. From this
figure, it can be seen that the beam bending failure time initially increases with
increasing rotational stiffness kr from 0 to the first critical value of about 0.022, but
then remains almost constant with slight reduction at higher rotational stiffness.
Figure 4.20: Effect of rotational stiffness level on beam bending resistance
(ka=0)
0
50
100
150
200
250
300
0 0.05 0.1 0.15 0.2 0.25 0.3 0.35 0.4 0.45 0.5
Ben
din
g re
sist
ance
tim
e (m
in)
Rotational stiffness ratio, (kr)
0
50
100
150
200
250
300
0 0.05 0.1 0.15 0.2 0.25 0.3
Fire
res
ista
nce
(m
in)
Rotational stiffness ratio, (kr)
Bending resistance
Ultimate resistance
Resistance from catenary action
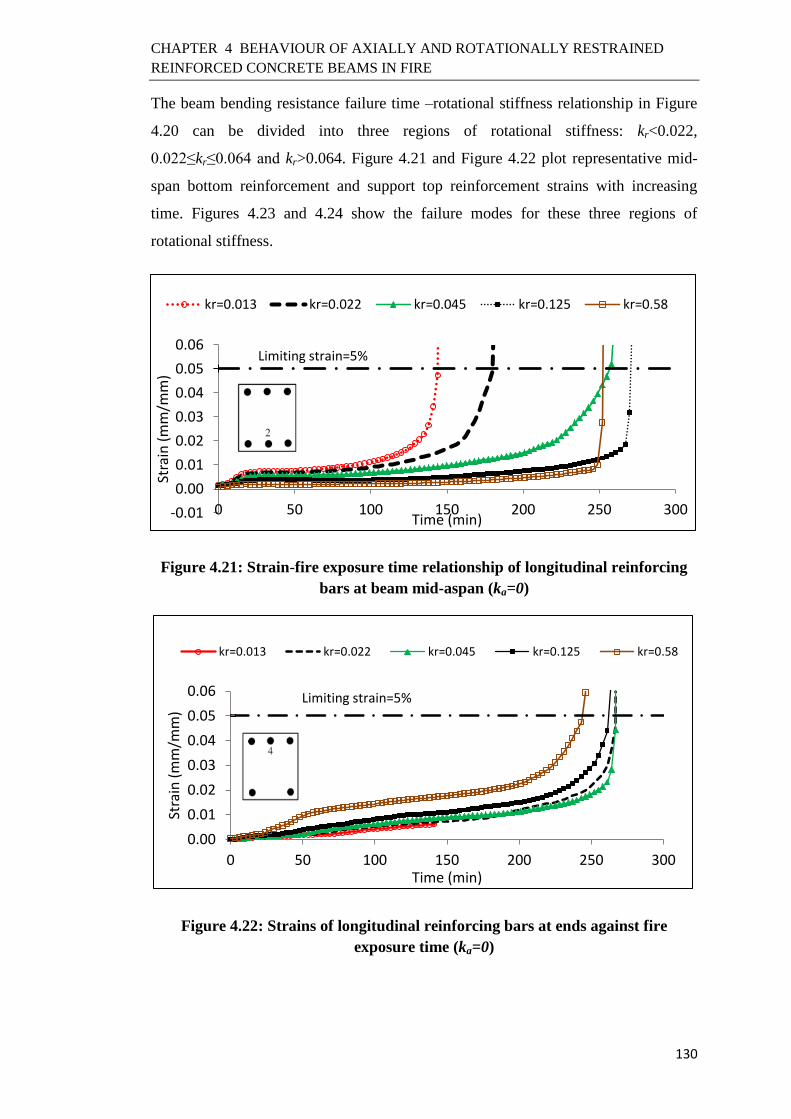
CHAPTER 4 BEHAVIOUR OF AXIALLY AND ROTATIONALLY RESTRAINED
REINFORCED CONCRETE BEAMS IN FIRE
130
The beam bending resistance failure time –rotational stiffness relationship in Figure
4.20 can be divided into three regions of rotational stiffness: kr<0.022,
0.022≤kr≤0.064 and kr>0.064. Figure 4.21 and Figure 4.22 plot representative mid-
span bottom reinforcement and support top reinforcement strains with increasing
time. Figures 4.23 and 4.24 show the failure modes for these three regions of
rotational stiffness.
Figure 4.21: Strain-fire exposure time relationship of longitudinal reinforcing
bars at beam mid-aspan (ka=0)
Figure 4.22: Strains of longitudinal reinforcing bars at ends against fire
exposure time (ka=0)
-0.01
0.00
0.01
0.02
0.03
0.04
0.05
0.06
0 50 100 150 200 250 300
Stra
in (
mm
/mm
)
Time (min)
kr=0.013 kr=0.022 kr=0.045 kr=0.125 kr=0.58
Limiting strain=5%
0.00
0.01
0.02
0.03
0.04
0.05
0.06
0 50 100 150 200 250 300
Stra
in (
mm
/mm
)
Time (min)
kr=0.013 kr=0.022 kr=0.045 kr=0.125 kr=0.58
Limiting strain=5%
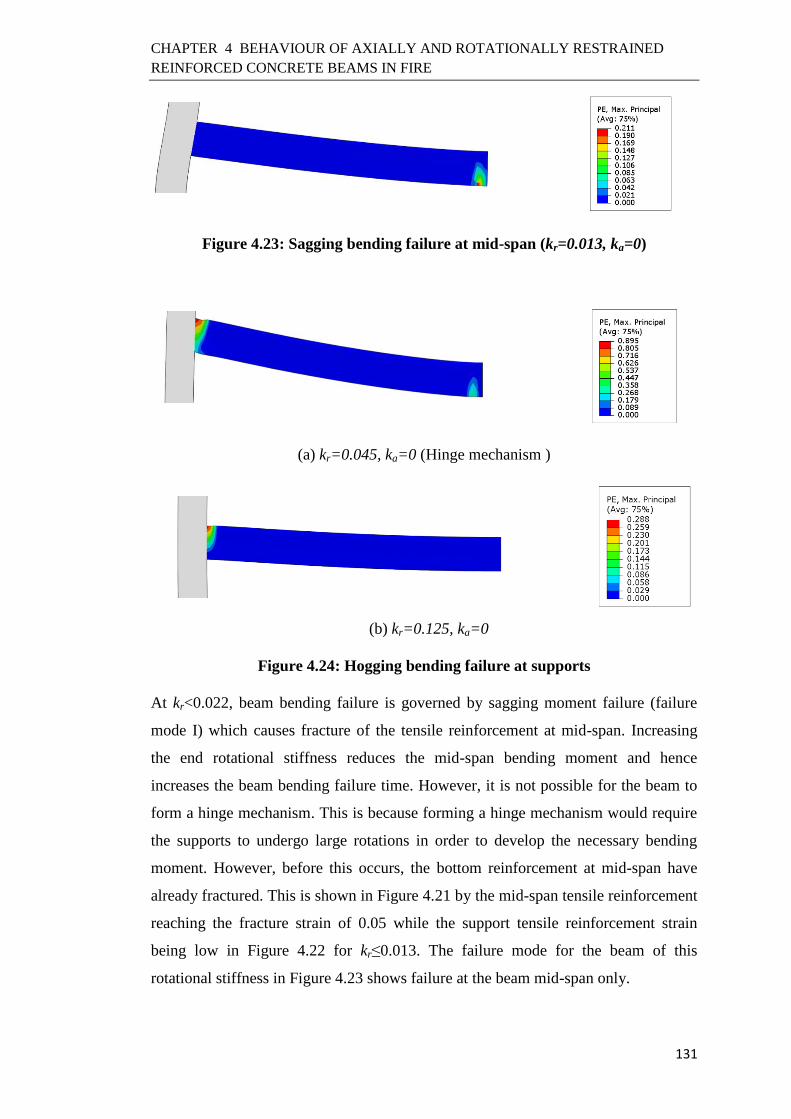
CHAPTER 4 BEHAVIOUR OF AXIALLY AND ROTATIONALLY RESTRAINED
REINFORCED CONCRETE BEAMS IN FIRE
131
Figure 4.23: Sagging bending failure at mid-span (kr=0.013, ka=0)
(a) kr=0.045, ka=0 (Hinge mechanism )
(b) kr=0.125, ka=0
Figure 4.24: Hogging bending failure at supports
At kr<0.022, beam bending failure is governed by sagging moment failure (failure
mode I) which causes fracture of the tensile reinforcement at mid-span. Increasing
the end rotational stiffness reduces the mid-span bending moment and hence
increases the beam bending failure time. However, it is not possible for the beam to
form a hinge mechanism. This is because forming a hinge mechanism would require
the supports to undergo large rotations in order to develop the necessary bending
moment. However, before this occurs, the bottom reinforcement at mid-span have
already fractured. This is shown in Figure 4.21 by the mid-span tensile reinforcement
reaching the fracture strain of 0.05 while the support tensile reinforcement strain
being low in Figure 4.22 for kr≤0.013. The failure mode for the beam of this
rotational stiffness in Figure 4.23 shows failure at the beam mid-span only.
CHAPTER 4 BEHAVIOUR OF AXIALLY AND ROTATIONALLY RESTRAINED
REINFORCED CONCRETE BEAMS IN FIRE
132
At 0.022≤kr≤0.064, the mid-span reaches its sagging moment resistance first.
However, because the rotational stiffness is high, the end hogging moment reaches a
high level. Further deformation of the beam after mid-span bending failure allows the
supports to develop hogging moment. The beam failed by bending failure mode (II)
governed by fracture of the mid-span and support reinforcement, as shown in Figure
4.21 and 4.22 by the reinforcement reaching the fracture strain of 0.05. This is
further confirmed by the failure mode, formation of a hinge mechanism, shown in
Figure 4.24(a). Because a complete hinge mechanism is formed, the beam bending
resistance time is independent of the support rotational stiffness.
At high rotational stiffness (kr>0.064), the support region fails due to reaching the
beam the hogging moment resistance. Except of kr=0.125 where yielding of the mid-
span tensile reinforcement and hogging moment failure coincide, the beam cannot
develop a plastic hinge mechanism. This is because the sagging moment at the beam
mid-span is low. For the beam sagging moment to develop its sagging moment
resistance would require the beam to undergo further large deflections. However,
tensile reinforcement at the beam support fractures before this is reached. This is
confirmed by the mid-span tensile reinforcement strain being less than the yield
strain of 0.02 at the time of fracture of the tensile reinforcement at supports, for
kr>0.125 in Figure 4.21. Figure 4.24(b) confirms this showing support failure only.
The higher the support rotational stiffness, the higher the support hogging moment,
hence the lower the bending failure time as shown in Figure 4.20.
In summary, even without axial restraint, a reinforced concrete beam with rotational
restraints at ends may not behave as expected at ambient temperature by forming a
three hinge mechanism at failure. At high support rotational stiffness, a plastic hinge
mechanism does not happen because the support tensile reinforcement fractures
before the mid-span sagging moment can develop its sagging moment capacity.
Nevertheless, the reduction in fire resistance time from a hinge mechanism is small.

CHAPTER 4 BEHAVIOUR OF AXIALLY AND ROTATIONALLY RESTRAINED
REINFORCED CONCRETE BEAMS IN FIRE
133
4.5 Beams with Asymmetrical End Boundary Restraints
The current parametric study was extended to investigate the behaviour of RC beams
with asymmetrical boundary restraints. The same beam-column sub-frame shown in
Figure 4.1 was employed. However, the whole structure, shown in Figure 4.25, was
modelled because of asymmetry of the boundary conditions. To simulate
asymmetrical restraints at the left and right ends of the structure, both the axial and
rotational restraints at the two ends (ka,R & kr,R and ka,L & kr,L) have different values. It
is assumed that the left end is more flexible (simulating connection to the edge of the
structure) than the right end (simulating connection to an internal bay of the
structure).
Dimensions of the sub-frame, beam reinforcement details, material properties and the
applied load were identical to those of the frame for symmetrical boundary
conditions.
Table 4.1 lists the parametric study cases, which were divided into three groups (G1,
G2 and G3). In all cases, the axial restraint stiffness level at the right hand is kept at
ka=0.166.
Figure 4.25: Definition of asymmetrical boundary restraints of beam-column
sub-frame model
KA,L
KR,L KR,R
KA,R
L R
ka,L
kr,L
ka,R = 0.166
(constant) kr,R

CHAPTER 4 BEHAVIOUR OF AXIALLY AND ROTATIONALLY RESTRAINED
REINFORCED CONCRETE BEAMS IN FIRE
134
Table 4.1: Parametric study cases and summary of results of beams with
asymmetrical boundary restraints
Group Beam ka,R kr,R ka,L kr,L
Bending
resistance
time (min)
Ultimate
failure
time
(min)
G1
S1 0.166 2 0 0.0075 101 101
S2 0.166 2 0 0.025 133 133
S3 0.166 2 0 0.05 161 161
S4 0.166 2 0 0.1 203 203
S5 0.166 2 0 0.25 227 227
S6 0.166 2 0 0.5 248 248
S7 0.166 2 0 2 255 255
G2
S8 0.166 0.0075 0 0.0075 114 114
S9 0.166 0.025 0 0.0075 149 149
S10 0.166 0.05 0 0.0075 176 176
S11 0.166 0.1 0 0.0075 167 167
S12 0.166 0.25 0 0.0075 147 147
S13 0.166 0.5 0 0.0075 133 133
S14 0.166 1 0 0.0075 104 104
S1 0.166 2 0 0.0075 101 101
G3
S1 0.166 2 0 0.0075 101 101
S15 0.166 2 0.005 0.0075 121 121
S16 0.166 2 0.01 0.0075 142 142
S17 0.166 2 0.02 0.0075 157 157
S18 0.166 2 0.04 0.0075 159 424
S19 0.166 2 0.08 0.0075 150 413
S20 0.166 2 0.166 0.0075 141 427
4.5.1 Results and Discussions
Figures 4.26 to 4.28 present the trends of beam bending and ultimate failure times as
a function of the variable support axial or rotational stiffness for: (i) Group G1:
variable rotational stiffness ratio at the left support kr,L, (ii) Group G2: variable
rotational stiffness ratio at the right support kr,R and (iii) Group G3: variable axial
stiffness ratio at the left support ka,L. Figures 4.26 and 4.27 show that the bending and
ultimate resistance times coincide. This indicates that catenary action cannot develop
in these beams. This is because these beams are axially not restrained at the left
support.
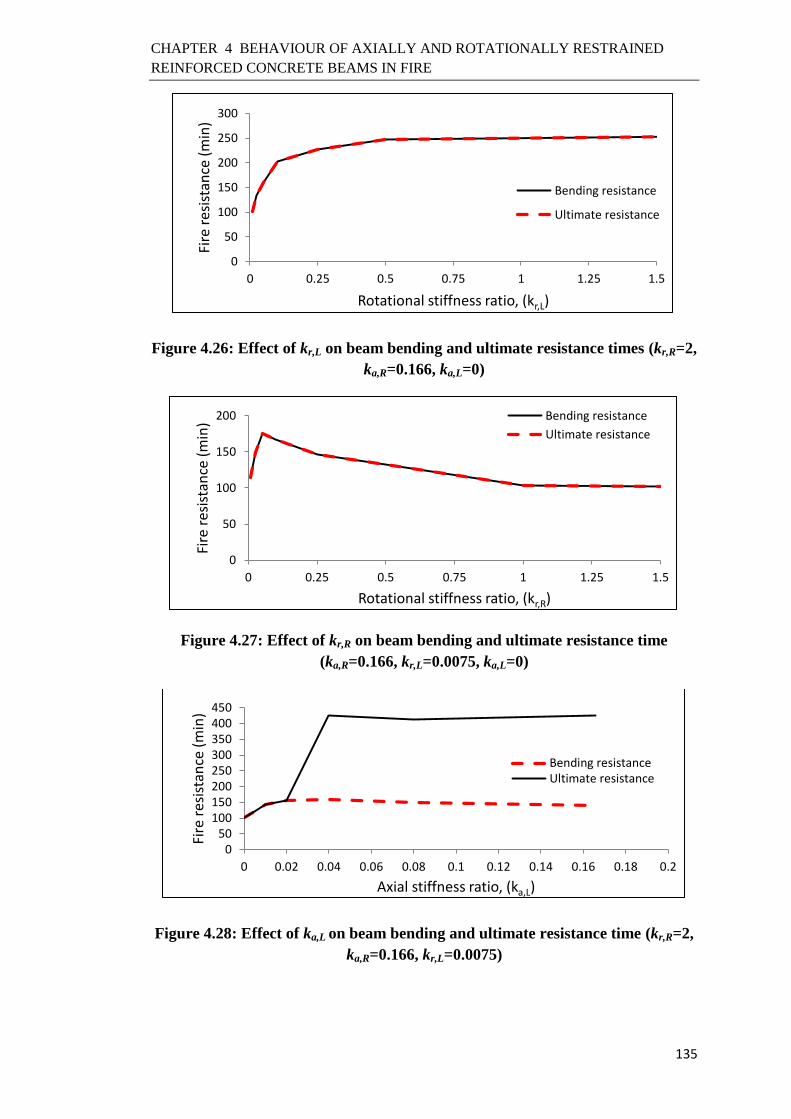
CHAPTER 4 BEHAVIOUR OF AXIALLY AND ROTATIONALLY RESTRAINED
REINFORCED CONCRETE BEAMS IN FIRE
135
Figure 4.26: Effect of kr,L on beam bending and ultimate resistance times (kr,R=2,
ka,R=0.166, ka,L=0)
Figure 4.27: Effect of kr,R on beam bending and ultimate resistance time
(ka,R=0.166, kr,L=0.0075, ka,L=0)
Figure 4.28: Effect of ka,L on beam bending and ultimate resistance time (kr,R=2,
ka,R=0.166, kr,L=0.0075)
0
50
100
150
200
250
300
0 0.25 0.5 0.75 1 1.25 1.5
Fire
res
ista
nce
(m
in)
Rotational stiffness ratio, (kr,L)
Bending resistance
Ultimate resistance
0
50
100
150
200
0 0.25 0.5 0.75 1 1.25 1.5
Fire
res
ista
nce
(m
in)
Rotational stiffness ratio, (kr,R)
Bending resistance
Ultimate resistance
050
100150200250300350400450
0 0.02 0.04 0.06 0.08 0.1 0.12 0.14 0.16 0.18 0.2
Fire
res
ista
nce
(m
in)
Axial stiffness ratio, (ka,L)
Bending resistanceUltimate resistance
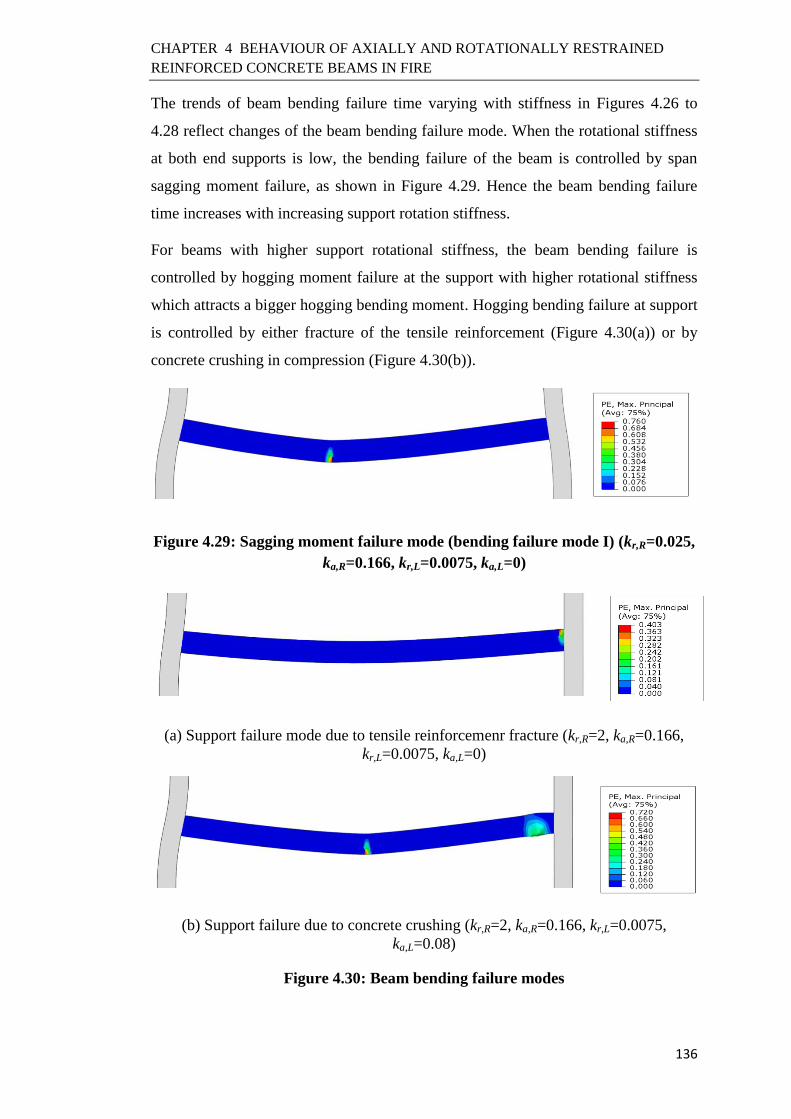
CHAPTER 4 BEHAVIOUR OF AXIALLY AND ROTATIONALLY RESTRAINED
REINFORCED CONCRETE BEAMS IN FIRE
136
The trends of beam bending failure time varying with stiffness in Figures 4.26 to
4.28 reflect changes of the beam bending failure mode. When the rotational stiffness
at both end supports is low, the bending failure of the beam is controlled by span
sagging moment failure, as shown in Figure 4.29. Hence the beam bending failure
time increases with increasing support rotation stiffness.
For beams with higher support rotational stiffness, the beam bending failure is
controlled by hogging moment failure at the support with higher rotational stiffness
which attracts a bigger hogging bending moment. Hogging bending failure at support
is controlled by either fracture of the tensile reinforcement (Figure 4.30(a)) or by
concrete crushing in compression (Figure 4.30(b)).
Figure 4.29: Sagging moment failure mode (bending failure mode I) (kr,R=0.025,
ka,R=0.166, kr,L=0.0075, ka,L=0)
(a) Support failure mode due to tensile reinforcemenr fracture (kr,R=2, ka,R=0.166,
kr,L=0.0075, ka,L=0)
(b) Support failure due to concrete crushing (kr,R=2, ka,R=0.166, kr,L=0.0075,
ka,L=0.08)
Figure 4.30: Beam bending failure modes
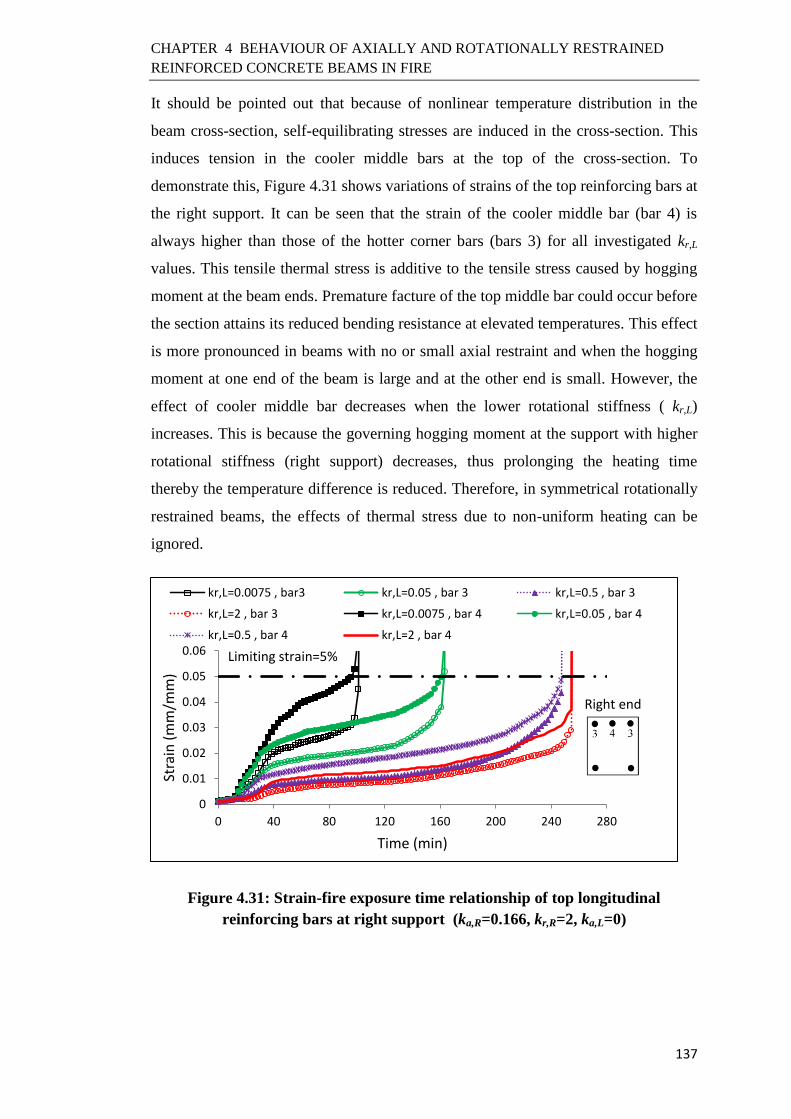
CHAPTER 4 BEHAVIOUR OF AXIALLY AND ROTATIONALLY RESTRAINED
REINFORCED CONCRETE BEAMS IN FIRE
137
It should be pointed out that because of nonlinear temperature distribution in the
beam cross-section, self-equilibrating stresses are induced in the cross-section. This
induces tension in the cooler middle bars at the top of the cross-section. To
demonstrate this, Figure 4.31 shows variations of strains of the top reinforcing bars at
the right support. It can be seen that the strain of the cooler middle bar (bar 4) is
always higher than those of the hotter corner bars (bars 3) for all investigated kr,L
values. This tensile thermal stress is additive to the tensile stress caused by hogging
moment at the beam ends. Premature facture of the top middle bar could occur before
the section attains its reduced bending resistance at elevated temperatures. This effect
is more pronounced in beams with no or small axial restraint and when the hogging
moment at one end of the beam is large and at the other end is small. However, the
effect of cooler middle bar decreases when the lower rotational stiffness ( kr,L)
increases. This is because the governing hogging moment at the support with higher
rotational stiffness (right support) decreases, thus prolonging the heating time
thereby the temperature difference is reduced. Therefore, in symmetrical rotationally
restrained beams, the effects of thermal stress due to non-uniform heating can be
ignored.
Figure 4.31: Strain-fire exposure time relationship of top longitudinal
reinforcing bars at right support (ka,R=0.166, kr,R=2, ka,L=0)
0
0.01
0.02
0.03
0.04
0.05
0.06
0 40 80 120 160 200 240 280
Stra
in (
mm
/mm
)
Time (min)
kr,L=0.0075 , bar3 kr,L=0.05 , bar 3 kr,L=0.5 , bar 3
kr,L=2 , bar 3 kr,L=0.0075 , bar 4 kr,L=0.05 , bar 4
kr,L=0.5 , bar 4 kr,L=2 , bar 4
Limiting strain=5%
Right end

CHAPTER 4 BEHAVIOUR OF AXIALLY AND ROTATIONALLY RESTRAINED
REINFORCED CONCRETE BEAMS IN FIRE
138
The possible adverse effects of self-equilibrating strains in the top reinforcement bars
at beam ends on beam bending resistance can be minimised by locating the top
tensile reinforcing far from the mid-width of the beam to the corners. To illustrate
this, simulations with three typical kr,L values of 0.0075, 0.05 and 0.5 were re-run but
with a different top reinforcement arrangement. The three top bars (detail 1) were
replaced with two corner bars (detail 2) as shown in Figure 4.32, but keeping the
total reinforcement area the same. Table 4.2 summaries the results for the two cases
and Figure 4.33 plots the maximum strain in the top bars at the right end of the beam.
Although the hogging bending moment capacity of detail 2 is less than that of detail
1 at elevated temperatures because all detail 2 bars have higher temperatures,
because there was no thermal stress in the top bars in detail 2, the beam bending
resistance for detail 2 is higher. As the lower rotational stiffness (left end) increases,
the thermal stress effect is reduced. Therefore, the bending resistance time for the
case kr,L=0.5 is lower for detail 2 reinforcement arrangement than for detail 1 because
the cross-section resistance of detail 2 reinforcement arrangement is lower as
mentioned above.
(a) Detail 1 (a) Detail 2
Figure 4.32: Reinforcement details 1 and 2
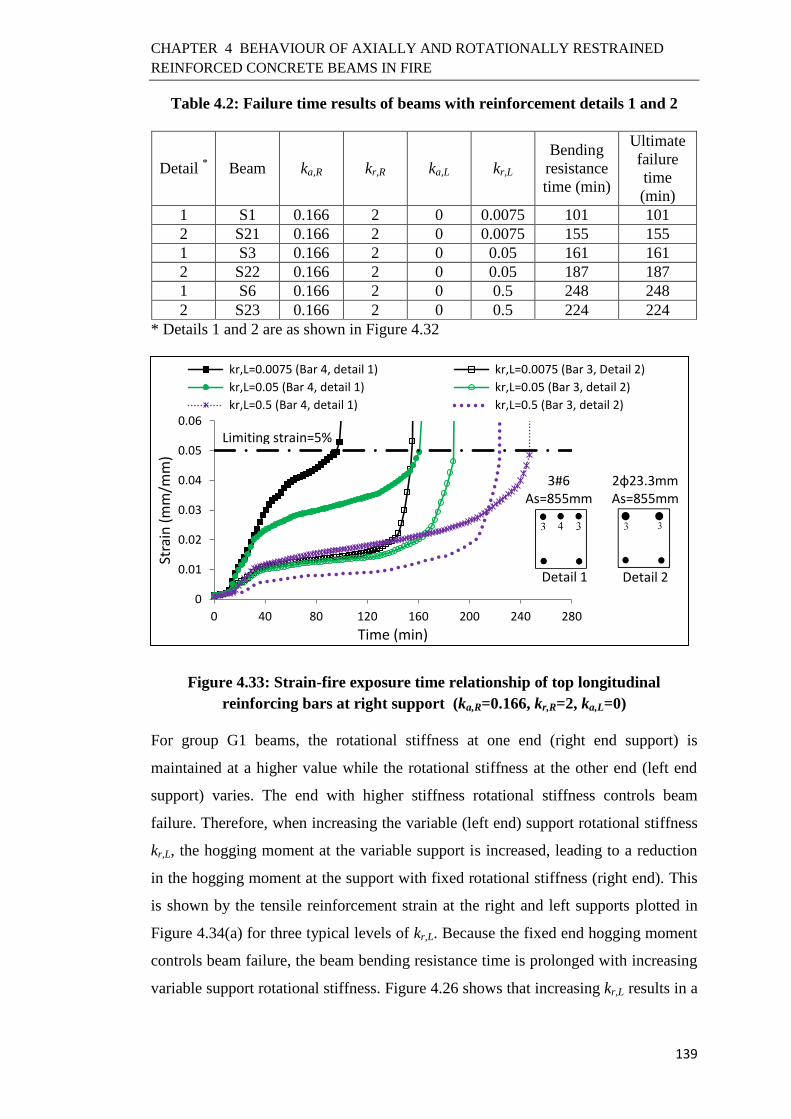
CHAPTER 4 BEHAVIOUR OF AXIALLY AND ROTATIONALLY RESTRAINED
REINFORCED CONCRETE BEAMS IN FIRE
139
Table 4.2: Failure time results of beams with reinforcement details 1 and 2
Detail * Beam ka,R kr,R ka,L kr,L
Bending
resistance
time (min)
Ultimate
failure
time
(min)
1 S1 0.166 2 0 0.0075 101 101
2 S21 0.166 2 0 0.0075 155 155
1 S3 0.166 2 0 0.05 161 161
2 S22 0.166 2 0 0.05 187 187
1 S6 0.166 2 0 0.5 248 248
2 S23 0.166 2 0 0.5 224 224
* Details 1 and 2 are as shown in Figure 4.32
Figure 4.33: Strain-fire exposure time relationship of top longitudinal
reinforcing bars at right support (ka,R=0.166, kr,R=2, ka,L=0)
For group G1 beams, the rotational stiffness at one end (right end support) is
maintained at a higher value while the rotational stiffness at the other end (left end
support) varies. The end with higher stiffness rotational stiffness controls beam
failure. Therefore, when increasing the variable (left end) support rotational stiffness
kr,L, the hogging moment at the variable support is increased, leading to a reduction
in the hogging moment at the support with fixed rotational stiffness (right end). This
is shown by the tensile reinforcement strain at the right and left supports plotted in
Figure 4.34(a) for three typical levels of kr,L. Because the fixed end hogging moment
controls beam failure, the beam bending resistance time is prolonged with increasing
variable support rotational stiffness. Figure 4.26 shows that increasing kr,L results in a
0
0.01
0.02
0.03
0.04
0.05
0.06
0 40 80 120 160 200 240 280
Stra
in (
mm
/mm
)
Time (min)
kr,L=0.0075 (Bar 4, detail 1) kr,L=0.0075 (Bar 3, Detail 2)
kr,L=0.05 (Bar 4, detail 1) kr,L=0.05 (Bar 3, detail 2)
kr,L=0.5 (Bar 4, detail 1) kr,L=0.5 (Bar 3, detail 2)
Limiting strain=5%
3#6 As=855mm
2φ23.3mm As=855mm
Detail 1 Detail 2
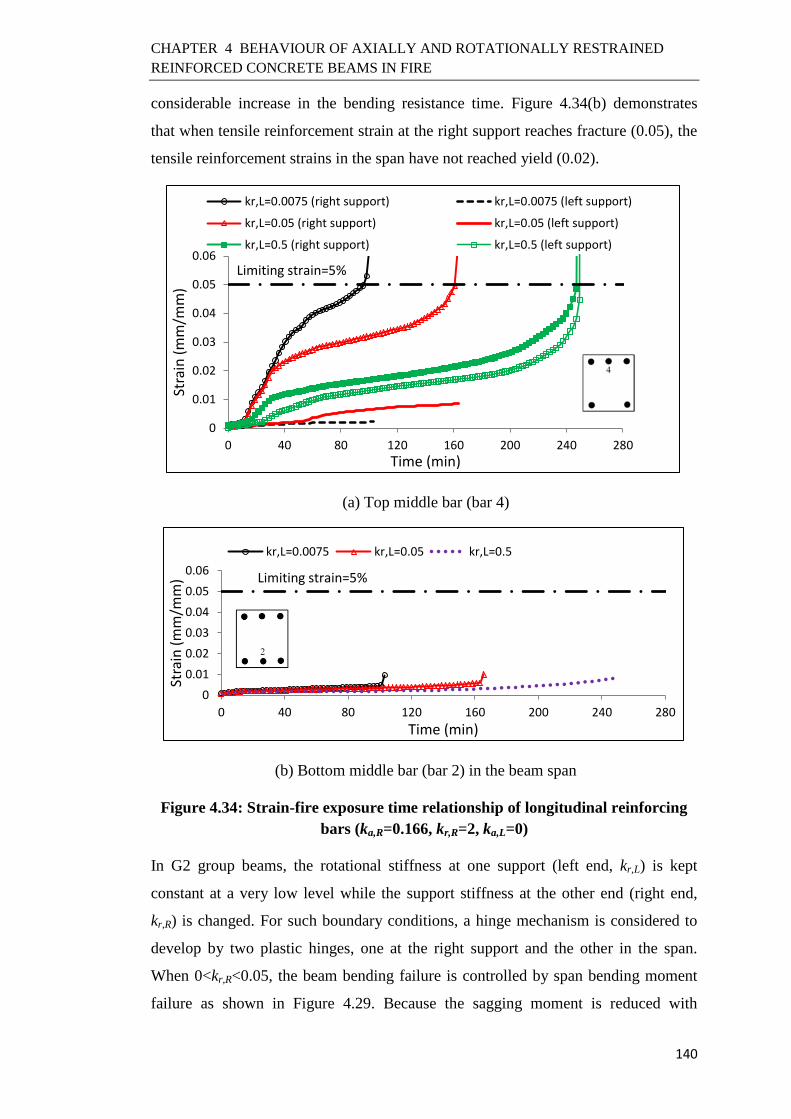
CHAPTER 4 BEHAVIOUR OF AXIALLY AND ROTATIONALLY RESTRAINED
REINFORCED CONCRETE BEAMS IN FIRE
140
considerable increase in the bending resistance time. Figure 4.34(b) demonstrates
that when tensile reinforcement strain at the right support reaches fracture (0.05), the
tensile reinforcement strains in the span have not reached yield (0.02).
(a) Top middle bar (bar 4)
(b) Bottom middle bar (bar 2) in the beam span
Figure 4.34: Strain-fire exposure time relationship of longitudinal reinforcing
bars (ka,R=0.166, kr,R=2, ka,L=0)
In G2 group beams, the rotational stiffness at one support (left end, kr,L) is kept
constant at a very low level while the support stiffness at the other end (right end,
kr,R) is changed. For such boundary conditions, a hinge mechanism is considered to
develop by two plastic hinges, one at the right support and the other in the span.
When 0<kr,R<0.05, the beam bending failure is controlled by span bending moment
failure as shown in Figure 4.29. Because the sagging moment is reduced with
0
0.01
0.02
0.03
0.04
0.05
0.06
0 40 80 120 160 200 240 280
Stra
in (
mm
/mm
)
Time (min)
kr,L=0.0075 (right support) kr,L=0.0075 (left support)
kr,L=0.05 (right support) kr,L=0.05 (left support)
kr,L=0.5 (right support) kr,L=0.5 (left support)
Limiting strain=5%
0
0.01
0.02
0.03
0.04
0.05
0.06
0 40 80 120 160 200 240 280
Stra
in (
mm
/mm
)
Time (min)
kr,L=0.0075 kr,L=0.05 kr,L=0.5
Limiting strain=5%

CHAPTER 4 BEHAVIOUR OF AXIALLY AND ROTATIONALLY RESTRAINED
REINFORCED CONCRETE BEAMS IN FIRE
141
increasing end rotational stiffness, an increase in kr,R results in higher bending failure
time. This trend is followed until the bending failure is attributed by formation of
plastic hinges at the right support and in the span when kr,R=0.05.
At kr,R>0.05, the variable end (right end) attracts high bending moment and therefore
governs beam bending failure. Therefore, increasing kr,R reduces the beam bending
failure time, as can be seen in Figure 4.27. The beam cannot develop a hinge
mechanism because with one support (left end) having a very low rotational stiffness,
the other support (right end) attracts a very high bending moment so the span sagging
moment is very low.
The bending failure time trend for group G3 beams is similar to that of group G1
beams: reaching the hogging moment resistance at the right support. However, the
presence of axial restraint in the beam introduces an axial compression force in the
beam. Therefore, the beam failure mode changes from reaching hogging moment
capacity due to tensile reinforcement fracture at the right support to concrete
compression failure at the right support (Figure 4.30(b)). This is shown by the
concrete strain plotted in Figure 4.35, which indicates that they have exceeded the
strains corresponding to peak and zero compression stresses according to the
concrete stress-strain relationships at elevated temperature presented in Appendix 4
in Figure A4.7. Increasing the axial restraint stiffness within its small amounts up to
ka,L=0.04 is beneficial to reduce the strain of the top tensile bars due to axial-flexural
interaction (Figure 4.36), thus decreasing the effect of self-straining strains on the
cooler middle bar and improving bending resistance of the beam. Increasing the axial
restraint stiffness further increases the compression force in the beam and thus
accelerates concrete crushing at ends, hence causing the beam to suffer a reduction in
bending failure time.
Only group G3 beams can develop catenary action because only these beams are
axially restrained.
In conclusion, for special cases when rotational stiffness at one end of the beam is
very high while at the other end is low and also the axial restraint is low, there is a
risk of premature hogging moment failure at the support having high rotational
stiffness. Tensile thermal stress in the cooler mid-bar at beam ends may cause

CHAPTER 4 BEHAVIOUR OF AXIALLY AND ROTATIONALLY RESTRAINED
REINFORCED CONCRETE BEAMS IN FIRE
142
premature rupture of middle bars. This effect may be reduced by positioning the top
bars close to the corners of the beam in the hogging moment regions.
Figure 4.35: Strain-fire exposure time for concrete near the beam right end
(ka,R=0.166, kr,R=2, ka,L=0.08, kr,L=0.0075)
Figure 4.36: Strain of longitudinal reinforcing bars at right end and beam axial
force against fire exposure time with different ka,L values (ka,R=0.166, kr,R=2,
kr,L=0.0075)
-525
-450
-375
-300
-225
-150
-75
0
75
150
225
300
-0.350
-0.300
-0.250
-0.200
-0.150
-0.100
-0.050
0.000
0.050
0.100
0.150
0.200
0 50 100 150 200 250 300 350 400 450
Axi
al f
orc
e (k
N)
Stra
in (
mm
/mm
) Time (min)
Strain, y=15 mmStrain, y=75 mmStrain, y=135 mmBeam axial force
-600
-500
-400
-300
-200
-100
0
100
200
300
400
500
600
-0.06
-0.05
-0.04
-0.03
-0.02
-0.01
0
0.01
0.02
0.03
0.04
0.05
0.06
0 50 100 150 200 250 300 350 400 450
Axi
al f
orc
e (k
N)
Stra
in (
mm
/mm
)
Time (min)
ka,L=0 (S) ka,L=0.01 (S) ka,L=0.04 (S) ka,L=0.166 (S)
ka,L=0 (AF) ka,L=0.01 (AF) ka,L=0.04 (AF) ka,L=0.166 (AF)
Limiting strain=5%
Right end (Strain) S: Strain
AF: Axial force
CHAPTER 4 BEHAVIOUR OF AXIALLY AND ROTATIONALLY RESTRAINED
REINFORCED CONCRETE BEAMS IN FIRE
143
4.6 Conclusions
This chapter has presented the numerical results, using ABAQUS, of a series of
analyses of RC beams in fire with different linear axial and rotational restraint levels,
with either symmetrical or asymmetrical restraint conditions, considering the large
deformation phase of structural response. Particular attention has been paid to the
bending failure modes generated under different boundary restraints and their effects
on beam bending resistance time and development of catenary action. The results of
this study indicate complicated beam bending behaviour and inability of the beam to
form the classical hinge mechanism. The following observations and conclusions can
be drawn from this numerical parametric study.
Beams with symmetrical restraint conditions:
As the rotational restraint stiffness at the beam ends increases, the beam may
experience three bending failure modes. At low level of rotational stiffness
(bending failure modes I and II), the beam bending failure occurs at mid-span
first, causing the bottom reinforcement at mid-span to fracture. After bending
failure of the mid-span, the applied load is resisted by the beam tensile
catenary force and/or end bending moments.
At very low level of rotational stiffness (bending failure modes I), because the
beam sagging moment at mid-span decreases at increasing rotational stiffness,
the bending failure time increases at increasing rotational stiffness. Since
catenary action is provided by tension in the top reinforcement and the top
reinforcement has not fractured, catenary action can develop in the beam.
Catenary action fully dominates the load resistance at zero end rotational
stiffness. With increasing rotational stiffness, the catenary action contribution
to the beam load resistance reduces, and meanwhile flexural action
contribution increases. However, the developed end bending moment due
flexural action contribution increases the tensile stress in the steel
reinforcement, causing earlier fracture of the top bars at the beam ends.
Hence, the beam final failure time decreases at increasing end rotational
stiffness. The above trend is followed until the applied load is entirely resisted
by the end bending moments.
CHAPTER 4 BEHAVIOUR OF AXIALLY AND ROTATIONALLY RESTRAINED
REINFORCED CONCRETE BEAMS IN FIRE
144
Further increasing in beam end rotational stiffness changes the status of
internal force in the beam from pure bending to axial compressive force-
bending. After bending failure of the mid-span and release of the axial
compressive force, because of higher end bending moments in beams with
higher rotational stiffness, equilibrium in bending is regained at a smaller
increase in beam defection. Therefore, the axial compressive force is not
totally released when equilibrium is achieved. The higher the rotational
stiffness, hence the lower the beam deflection, the higher the residual
compressive force. The residual compressive force has an adverse influence
on the beam resisting time because of the second-order moment at the beam
ends due to P-Δ effects. Since bending failure of the beam is controlled by
reaching the hogging moment resistance at the beam ends, the beam bending
resistance time decreases at increasing end rotational stiffness. The release of
a significant amount of compressive force in the beam leads the end sections
to encounter tension-controlled failure and fracture of the tensile
reinforcement in bending (bending failure mode II). Because the bottom
reinforcement at the beam mid-span has already fractured, the beam does not
have a continuous path of tensile force to develop catenary action. Hence, the
beam bending failure time and final failure time coincide, both decreasing
with increasing end rotational stiffness.
As the rotation stiffness increases further, compressive failure of concrete
exposed to fire in the hogging moment region may occur first before the mid-
span reaches its sagging moment resistance. After concrete crushing, the beam
does not have sufficient mid-span bending resistance to maintain equilibrium
in bending and transits to catenary action immediately. Once this failure mode
governs the beam bending failure (bending failure mode III), increasing the
beam end rotational stiffness further reduces the beam deflection, and hence
the P-Δ effect, thus delaying concrete crushing at the beam ends and providing
the beam with a small increase in bending failure time. Because the top
reinforcement at end is at low strain when concrete crushing takes place
(compression-controlled failure) and the beam is relieved from end hogging
moments, the beam can develop the longest period of catenary action. The

CHAPTER 4 BEHAVIOUR OF AXIALLY AND ROTATIONALLY RESTRAINED
REINFORCED CONCRETE BEAMS IN FIRE
145
beam behaves as one without rotational restraint, thus the beam final failure
time is unchanged with changing end rotational stiffness.
The aforementioned beam behaviour in bending and in catenary action holds
for different levels of axial restraint and different load ratios. The only change
is that mode (II) bending disappears when the load ratio is high. This is
because it is difficult for the beam ends to resist the high applied load after
failure of the beam mid-span.
The traditional approach for estimating fire resistance of beams in fire, which
ignores compressive force generated by restraint to thermal expansion and
hogging bending moment due to restrained thermal curvature, and assumes
that both the hogging and sagging bending moment resistances can be reached
together, may lead to overestimate of the bending resistance time of axially
restrained RC beams in fire. Crushing of concrete at the beam ends could
occur before the end hogging moments attains the bending resistance,
preventing the formation of a plastic hinge mechanism. A new design method
is needed to predict the fire resistance times of restrained RC beams under
bending. Such a method will be presented in Chapter 5.
For axially unrestrained beams, the beam bending failure is controlled by: (i)
sagging moment failure at low rotational stiffness, (ii) combined sagging and
hogging moment failures (three hinge mechanism) at medium rotational
stiffness and (iii) hogging moment failure before the span attains the sagging
moment resistance at higher rotational stiffness. Nevertheless, the reduction in
beam bending failure time under (iii) is small. Therefore, the three hinge
mechanism can still be applied.
If adequate axial restraints are provided, and typical reinforced concrete
structures are able to do so, tensile catenary action could reliably develop in
the beam at large deflections following bending failure. This may be used to
improve the beam survival time compared to the fire resistance under flexural
action. The applied load and tensile catenary forces are sustained by the top
reinforcing bars in catenary action. The beam in catenary action behaves as

CHAPTER 4 BEHAVIOUR OF AXIALLY AND ROTATIONALLY RESTRAINED
REINFORCED CONCRETE BEAMS IN FIRE
146
one with zero restraint rotational stiffness. In Chapter 5, an analytical method
will be developed to calculate the beam final survival time in catenary action.
When the rotational restraint stiffness is low, there is no a reliable continuous
path to transmit the tensile force in tensile catenary action due to fracture of
the top reinforcement at beam ends and the bottom reinforcement at beam
mid-span. Catenary action would only develop when the rotational restraint
stiffness is very small (approaching zero). Also at low levels of end rotational
stiffness, the extent of catenary action development is very sensitive to the
beam end rotational stiffness. It would be better to disregard catenary action
for such low levels of beam end rotational restraint stiffness.
Beams with asymmetric restraints:
The flexural behaviour of beams with asymmetrical end restraints is more
complicated than that with symmetrical ones. When the supports have high
rotational stiffness, a hinge mechanism cannot happen in most cases because
the support with a higher rotational stiffness attracts a very high bending
moment and fails while the span bending moment is very low. There is no
time for the span moment to increase to its plastic moment capacity.
When rotational stiffness at one support is very high and at the other support is
low, the hogging moment resistance at the support with the higher rotational
stiffness can be adversely affected by tensile thermal stresses developed in the
cooler mid reinforcement bar at the top of beam in the hogging region. To
reduce this effect, top bars in the hogging moment region of a beam should be
located to the corners.
Similar to the beams with symmetrical boundary restraints, effective catenary
action develops following bending failure only if bending failure is initiated
by compressive failure of concrete in the hogging moment.
The trends observed in these beams will be used to explain the frame
behaviour to be presented in Chapter 6. However, due to constraint of time, no
simplified method has been developed for beams with asymmetrical restraint
conditions.
CHAPTER 5 DEVELOPMENT OF A SIMPLIFIED METHOD FOR ANALYSIS OF
AXIALLY AND ROTATIONALLY RESTRAINED REINFORCED CONCRETE BEAMS
IN FIRE
147
CHAPTER 5
DEVELOPMENT OF A SIMPLIFIED METHOD FOR
ANALYSIS OF AXIALLY AND ROTATIONALLY
RESTRAINED REINFORCED CONCRETE BEAMS IN
FIRE
5.1Introduction
In Chapter 3, a 3D dynamic explicit finite element model in ABAQUS was
developed to analyse the highly complex response of RC structures in fire. After
validation of this model, a comprehensive study of the behaviour of axially and
rotationally restrained RC beams in fire was carried out and the results have been
presented in Chapter 4. This numerical parametric study investigated influences of
different degrees of axial and rotational restraints on full history behaviour of RC
beams in fire until failure, including catenary action at large deflections. However, it
would be very difficult to use the sophisticated numerical model for design purpose.
For possible consideration of large deflection behaviour of axially and rotationally
restrained RC beams in fire in practice, a more simplified method would be
necessary. This is the aim of the current chapter. This method will make assumptions
based on observations of the numerical results in Chapter 4. The calculation
procedure is based on sectional analysis and uses simple concepts of compatibility
and equilibrium conditions. Validation of the simplified method comes from
comparison against the numerical modelling results of Chapter 4 and the additional
numerical results of the effect of beam parameters which are presented in this chapter
5.2 Key Features of Restrained Beam Behaviour
The numerical study results in Chapter 4 have shown that the response of axially and
rotationally restrained RC beams in fire is complex. Figure 5.1 illustrates
development of axial force versus fire exposure time of a typical beam. In the initial
stages of fire, an axial compressive force develops due to restrained thermal
expansion. The ultimate value of the compressive force marks formation of a plastic
hinge at a critical section (either in the span or at the ends), after which unloading of
the compressive force occurs until failure of the beam in bending is reached. If the

CHAPTER 5 DEVELOPMENT OF A SIMPLIFIED METHOD FOR ANALYSIS OF
AXIALLY AND ROTATIONALLY RESTRAINED REINFORCED CONCRETE BEAMS
IN FIRE
148
beam is able to develop catenary action, featured by reversal of the axial force from
compression to tension, it could survive longer fire exposure beyond flexural
bending resistance.
Figure 5.1: Typical axial force-fire exposure time response of a restrained RC
beam in fire
The bending resistance time and ultimate resistance time are particularly important
quantities for design purpose. The numerical results in Chapter 4 have revealed the
bending resistance time/ultimate resistance time–relative rotational restraint stiffness
(kr) relationships as sketched in Figure 5.2(a). The typical beam axial force-fire
exposure time curves for different kr values are illustrated in Figure 5.2(b), in which
points tBR,A, tBR,B, tBR,C, tBR,D and tBR,E are bending resistance times and tUR,A, tUR,B, tUR,C,
tUR,D and tUR,E are ultimate resistance times at kr,A, kr,B, kr,C, kr,D and kr,E, respectively.
(a) Beam fire resistance–kr relationships
Ax
ial
Fo
rce
Tension
Compression
Time
Flexural action Catenary action
Ultimate
resistance time Bending
resistance time
Fir
e re
sist
ance
(ti
me)
Bending resistance time
Region 1 Region 3
Ultimate resistance time
Rotational stiffness ratio, kr
Region 2
kr,A
kr,B kr,C
kr,D
kr,E
Resistance from catenary action

CHAPTER 5 DEVELOPMENT OF A SIMPLIFIED METHOD FOR ANALYSIS OF
AXIALLY AND ROTATIONALLY RESTRAINED REINFORCED CONCRETE BEAMS
IN FIRE
149
(b) Beam axial force–fire exposure time relationships for different kr values
Figure 5.2: Effects of rotational stiffness kr on RC beam behaviour in fire
The bending resistance time-rotational stiffness relationship in Figure 5.2(a) can be
divided into three regions according to rotational stiffness, namely 1, 2 and 3,
separated by two rotational stiffness kr,B and kr,D.
When kr is very low (kr=kr,A in region 1), the beam bending resistance is controlled
by the maximum sagging moment at mid-span reaching the sagging moment
resistance. Afterwards, the rotational restraint at ends cannot develop sufficient
hogging moment resistance to resist the applied load in bending. When kr = kr,B, the
rotational stiffness is still low enough to cause the mid-span to attain its sagging
moment resistance first. But after bending failure of the mid-span and release of the
axial compressive force, the beam ends can develop sufficient moments to continue
to enable the beam to achieve equilibrium in bending. Therefore, kr,B corresponds to
the rotational stiffness level when almost all of the axial force is released (F≈0). As
the rotational stiffness increases further, a smaller amount of the axial force is
released, as shown in Figure 5.2(b) for kr,C in region 2. The remaining unreleased
compressive force has adverse influence on the beam bending resistance time due to
P-Δ effects. The bending resistance of beams in region 2 with kr,B≤kr≤kr,D is reached
by fracture of tensile reinforcement at the beam ends.
tBR,E
tBR,C,tUR,C tBR,D,tUR,D
tUR,A tUR,E tBR,A tBR,B,tUR,B
Axia
l fo
rce,
F
Tension
Compression
Fire exposure time, t kr,A
kr,B
kr,C
kr,D
kr,E

CHAPTER 5 DEVELOPMENT OF A SIMPLIFIED METHOD FOR ANALYSIS OF
AXIALLY AND ROTATIONALLY RESTRAINED REINFORCED CONCRETE BEAMS
IN FIRE
150
Further increase in kr (when kr>kr,D) causes compressive failure of the concrete
exposed to fire in the hogging moment region to occur first before the mid-span
reaches its sagging moment resistance. This requires determination of the lowest
rotational stiffness that leads the beam bending failure to be controlled by hogging
moment failure due to concrete crushing in compression. This critical rotational
stiffness in this analytical model is referred as kr,E (Figure 5.2(b)). After hogging
moment failure, the beam does not have sufficient mid-span bending resistance to
maintain equilibrium in bending. Hence, the bending resistance of beams that exhibit
this bending failure mode is governed by compressive failure of concrete at the beam
ends. This bending resistance could be lower than the resistance estimated based on
the traditional approach which assumes formation of a complete 3-plastic hinge
mechanism in the beam at failure.
Therefore, in order to develop a simplified method that may be adopted for design
purpose, it is necessary to quantify the critical rotational stiffness kr,B and kr,E, as well
as bending resistance time.
For catenary action development, when kr is very low (in region 1), tensile axial
force due to catenary action develops in the beam following bending failure of the
mid-span, as illustrates in Figure 5.2(b) for kr≤kr,A. The simulation results have
shown that the ultimate resistance time (catenary action resistance) is very sensitive
to kr for such low levels of beam end rotational restraint stiffness. Pure catenary
action would only develop when the rotational restraint stiffness is zero. When
kr,B≤kr≤kr,D, bending failure of the beam has a high potential to cause top bars at the
beam ends to fracture. Consequently, catenary action would not develop because
there will be no reliable continuous path to transmit the tensile catenary force in
catenary action. Therefore, within this region (regions 2), the ultimate resistance time
coincides with the bending resistance time. When kr≥kr,E in region 3, it was found
that the beam can develop effective catenary action. This is mainly because concrete
crushing occurs while the top bars at ends are at low strain and it releases the bars
from hogging bending stresses. Therefore, the contribution of catenary action to fire
resistance is only considered for kr≥kr,E.

CHAPTER 5 DEVELOPMENT OF A SIMPLIFIED METHOD FOR ANALYSIS OF
AXIALLY AND ROTATIONALLY RESTRAINED REINFORCED CONCRETE BEAMS
IN FIRE
151
The aim of this chapter is to describe the methodology for developing a simplified
model to predict fire response of axially and rotationally restrained RC beams in fire.
The entire histories of beam mid-span deflection-fire exposure time and axial force-
fire exposure time in flexural action and catenary action will be evaluated under
different axial and rotational restraint levels and different key design parameters.
5.3 Representative Beam Model
The representative RC beam for simplified analysis is illustrated in Figure 5.3. The
isolated restrained beam is intended to represent a part of a reinforced concrete
frame. The beam has length L and is prevented from vertical movement at x=0 and
x=L. The restraints provided by the neighbouring members are accounted for by
equivalent axial and rotational springs respectively with stiffness of KA and KR at
both ends. Because the focus of this research is on developing a simplified method
for the RC beam, the stiffness values of the springs are assumed to be linear elastic
and constant throughout the fire exposure. Since an incremental approach is taken in
this development, in realistic situations, the changing stiffness of the restraining
structural members reflecting the effects of fire exposure on their mechanical
properties can be incorporated by using the reduced stiffness of the restraining
members at the start of each time increment. The simplified model can be used for
placing the axial restraints at any location at the beam ends with x=0 and x=L. The
end restraint stiffness is defined by non-dimensional relative axial and rotational
stiffness ratios ka and kr, respectively as:
𝑘𝑎 =𝐾𝐴
(𝐸𝑐𝑚𝐴 𝐿⁄ ) (5-1)
𝑘𝑟 =𝐾𝑅
(4𝐸𝑐𝑚𝐼 𝐿⁄ ) (5-2)
where Ecm, I, A, and L are ambient-temperature elastic modulus of concrete, moment
of inertia of the RC beam cross-section with respect to its geometric centre, cross-
sectional area and beam span, respectively.
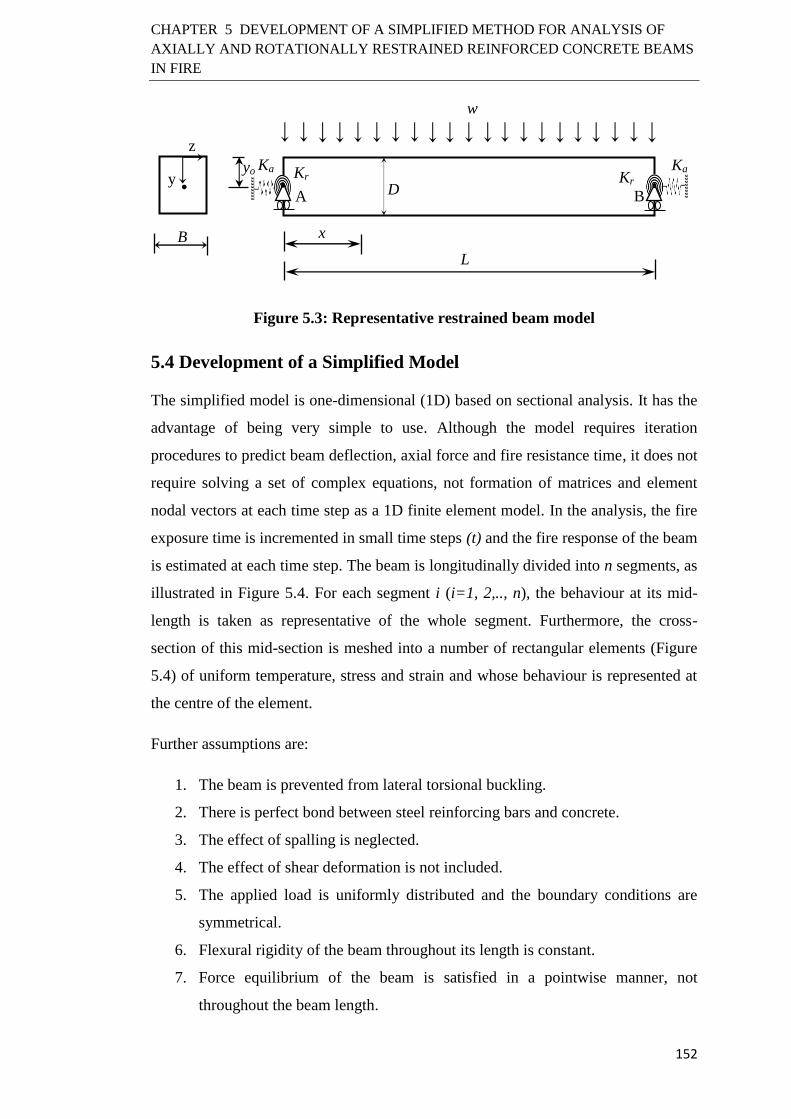
CHAPTER 5 DEVELOPMENT OF A SIMPLIFIED METHOD FOR ANALYSIS OF
AXIALLY AND ROTATIONALLY RESTRAINED REINFORCED CONCRETE BEAMS
IN FIRE
152
Figure 5.3: Representative restrained beam model
5.4 Development of a Simplified Model
The simplified model is one-dimensional (1D) based on sectional analysis. It has the
advantage of being very simple to use. Although the model requires iteration
procedures to predict beam deflection, axial force and fire resistance time, it does not
require solving a set of complex equations, not formation of matrices and element
nodal vectors at each time step as a 1D finite element model. In the analysis, the fire
exposure time is incremented in small time steps (t) and the fire response of the beam
is estimated at each time step. The beam is longitudinally divided into n segments, as
illustrated in Figure 5.4. For each segment i (i=1, 2,.., n), the behaviour at its mid-
length is taken as representative of the whole segment. Furthermore, the cross-
section of this mid-section is meshed into a number of rectangular elements (Figure
5.4) of uniform temperature, stress and strain and whose behaviour is represented at
the centre of the element.
Further assumptions are:
1. The beam is prevented from lateral torsional buckling.
2. There is perfect bond between steel reinforcing bars and concrete.
3. The effect of spalling is neglected.
4. The effect of shear deformation is not included.
5. The applied load is uniformly distributed and the boundary conditions are
symmetrical.
6. Flexural rigidity of the beam throughout its length is constant.
7. Force equilibrium of the beam is satisfied in a pointwise manner, not
throughout the beam length.
D
B
yo
w
Ka Kr Kr Ka
L
A B
x
z
y
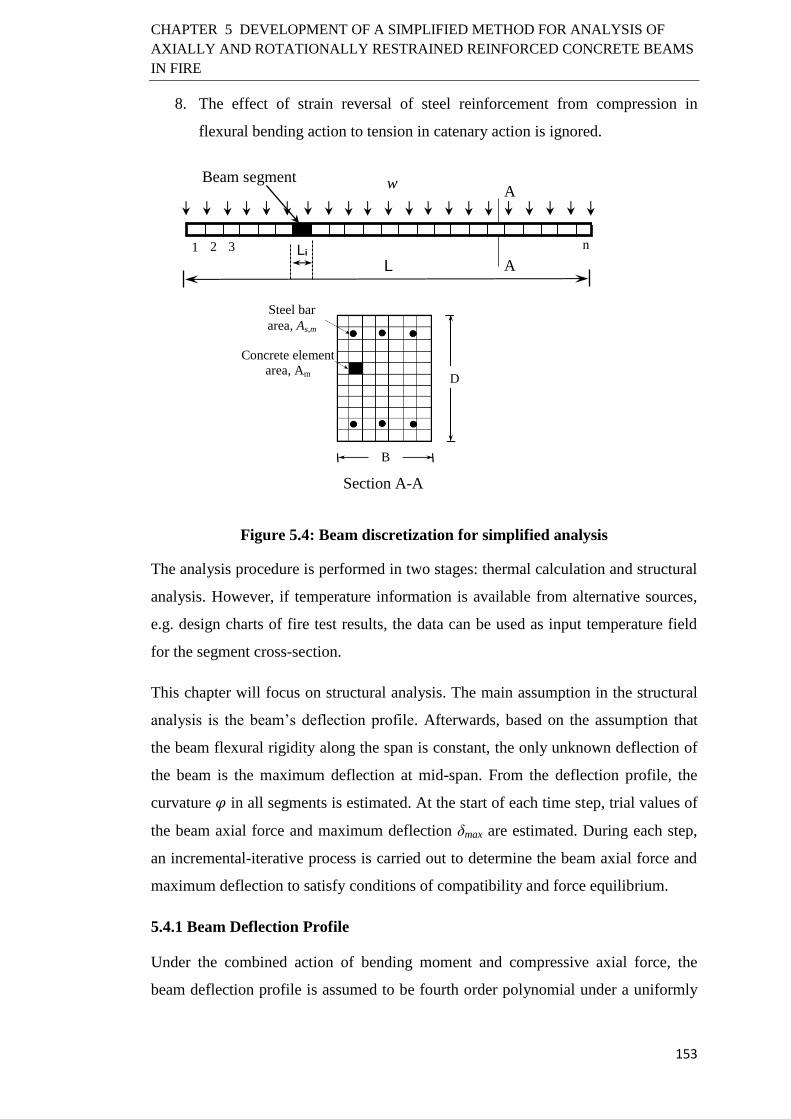
CHAPTER 5 DEVELOPMENT OF A SIMPLIFIED METHOD FOR ANALYSIS OF
AXIALLY AND ROTATIONALLY RESTRAINED REINFORCED CONCRETE BEAMS
IN FIRE
153
8. The effect of strain reversal of steel reinforcement from compression in
flexural bending action to tension in catenary action is ignored.
Figure 5.4: Beam discretization for simplified analysis
The analysis procedure is performed in two stages: thermal calculation and structural
analysis. However, if temperature information is available from alternative sources,
e.g. design charts of fire test results, the data can be used as input temperature field
for the segment cross-section.
This chapter will focus on structural analysis. The main assumption in the structural
analysis is the beam’s deflection profile. Afterwards, based on the assumption that
the beam flexural rigidity along the span is constant, the only unknown deflection of
the beam is the maximum deflection at mid-span. From the deflection profile, the
curvature 𝜑 in all segments is estimated. At the start of each time step, trial values of
the beam axial force and maximum deflection δmax are estimated. During each step,
an incremental-iterative process is carried out to determine the beam axial force and
maximum deflection to satisfy conditions of compatibility and force equilibrium.
5.4.1 Beam Deflection Profile
Under the combined action of bending moment and compressive axial force, the
beam deflection profile is assumed to be fourth order polynomial under a uniformly
A
A
Section A-A
Steel bar
area, As,m
Concrete element
area, Am
B
D
2 1 3
Li
L
w Beam segment
n

CHAPTER 5 DEVELOPMENT OF A SIMPLIFIED METHOD FOR ANALYSIS OF
AXIALLY AND ROTATIONALLY RESTRAINED REINFORCED CONCRETE BEAMS
IN FIRE
154
distributed load w. The beam deflection profile is dependent on the end rotational
restraint stiffness. If the maximum deflection at the beam mid-span is δmax and
assuming that the flexural rigidity along the beam length is constant, for beams with
zero end rotational restraint (kr=0), the deflection profile is as assumed to be:
𝛿 =16𝛿𝑚𝑎𝑥
5𝐿(𝑥4
𝐿3−
2𝑥3
𝐿2+ 𝑥)
{
𝛿|𝑥=0
𝑥=𝐿= 0
𝛿|𝑥=𝐿/2 = 𝛿𝑚𝑎𝑥
𝜑|𝑥=0𝑥=𝐿
=𝑑2𝛿
𝑑𝑥2|𝑥=0𝑥=𝐿
= 0
(5-3)
For beams with complete end rotational restraint (kr=∞):
𝛿 =16𝛿𝑚𝑎𝑥
𝐿4𝑥2(𝐿 − 𝑥)2
{
𝛿|𝑥=0𝑥=𝐿
= 0
𝛿|𝑥=𝐿/2 = 𝛿𝑚𝑎𝑥
𝜃|𝑥=0𝑥=𝐿
=𝑑𝛿
𝑑𝑥|𝑥=0𝑥=𝐿
= 0
(5-4)
The deflection profile of beams with flexible end rotational restraint is approximated
by interpolation between that of the same beam with zero rotational restraint and that
of the beam with complete rotational restraint. Based on the ABAQUS simulation
results, an exponential function of the beam deflection curve in terms of the
rotational stiffness ratio kr will be used. The beam’s deflection profile equation is
therefore
δ =c × δz + (1-c) × δt (5-5)
where
δz is deflection profile of the beam with zero rotational restraint,
δt is deflection profile of the beam with total rotational restraint,
c is a factor dependent on the rotational stiffness ratio defined as:
𝑐 = 𝑒−14𝑘𝑟 for 0≤ kr ≤0.1
𝑐 = 0.36𝑒−4𝑘𝑟 for kr ≥ 0.1 (5-6)
In the catenary action stage, it has been shown in the previous chapter that it is
reasonable to assume that the beam behaves as one with zero rotational restraint at
the ends. Therefore, Equation 5-3 for beams with kr=0 needs to be modified. Based
on the numerical simulation results of Chapter 4, a better approximation of the
deflected shape was found to consist of equal proportions of the following three
deflection profiles: (i) the deflection profile of the beam under uniformly distributed

CHAPTER 5 DEVELOPMENT OF A SIMPLIFIED METHOD FOR ANALYSIS OF
AXIALLY AND ROTATIONALLY RESTRAINED REINFORCED CONCRETE BEAMS
IN FIRE
155
load (UDL), (ii) the deflection profile of the beam under a concentrated point load
(CPL) at the mid-span, (iii) linear profile (LP). Deflection profiles (ii) and (iii) are:
𝛿𝐶𝑃𝐿 =𝛿𝑚𝑎𝑥
𝐿3(3𝐿2𝑥 − 4𝑥3)
{
𝛿|𝑥=0
𝑥=𝐿= 0
𝛿|𝑥=𝐿/2 = 𝛿𝑚𝑎𝑥
𝜑|𝑥=0𝑥=𝐿
=𝑑2𝛿
𝑑𝑥2|𝑥=0𝑥=𝐿
= 0
(5-7)
𝛿𝐿𝑃 = {
2𝛿𝑚𝑎𝑥
𝐿𝑥 for 0 ≤ 𝑥 ≤ 𝐿/2
2𝛿𝑚𝑎𝑥
𝐿(𝐿 − 𝑥) for 𝐿/2 ≤ 𝑥 ≤ 𝐿
{
𝛿|𝑥=0
𝑥=𝐿= 0
𝛿|𝑥=𝐿/2 = 𝛿𝑚𝑎𝑥
𝜑|𝑥=0𝑥=𝐿
=𝑑2𝛿
𝑑𝑥2|𝑥=0𝑥=𝐿
= 0
(5-8)
Thus, the assumed defection profile of the beam in catenary action is:
𝛿 =𝛿𝑈𝐷𝐿+𝛿𝐶𝑃𝐿+𝛿𝐿𝑃
3 (5-9)
To demonstrate suitability of the assumed deflection profiles, Figures 5.5 to 5.9
compare the ABAQUS simulation results of beam deflection profiles for combined
axial compression-bending behaviour, for different end rotational stiffness levels,
and Figures 5.10 and 5.11 for catenary action with the assumed deflection profiles.
The assumed deflection profiles were obtained by using the same maximum mid-
span deflections δmax as in the ABAQUS simulation results. These figures indicate
that the proposed deflection profiles are suitable at different fire exposure times.
Figure 5.5: Comparison of beam deflection profiles in flexural action
(kr=0.0064)
-250
-200
-150
-100
-50
0
0 1000 2000 3000 4000 5000 6000
Def
lect
ion
(mm
)
Length x (mm)
Deflection profile, t=0 ABAQUS, t=0Deflection profile, t=30min ABAQUS, t=30minDeflection profile, t=60min ABAQUS, t=60minDeflection profile, t=90min ABAQUS, t=90min
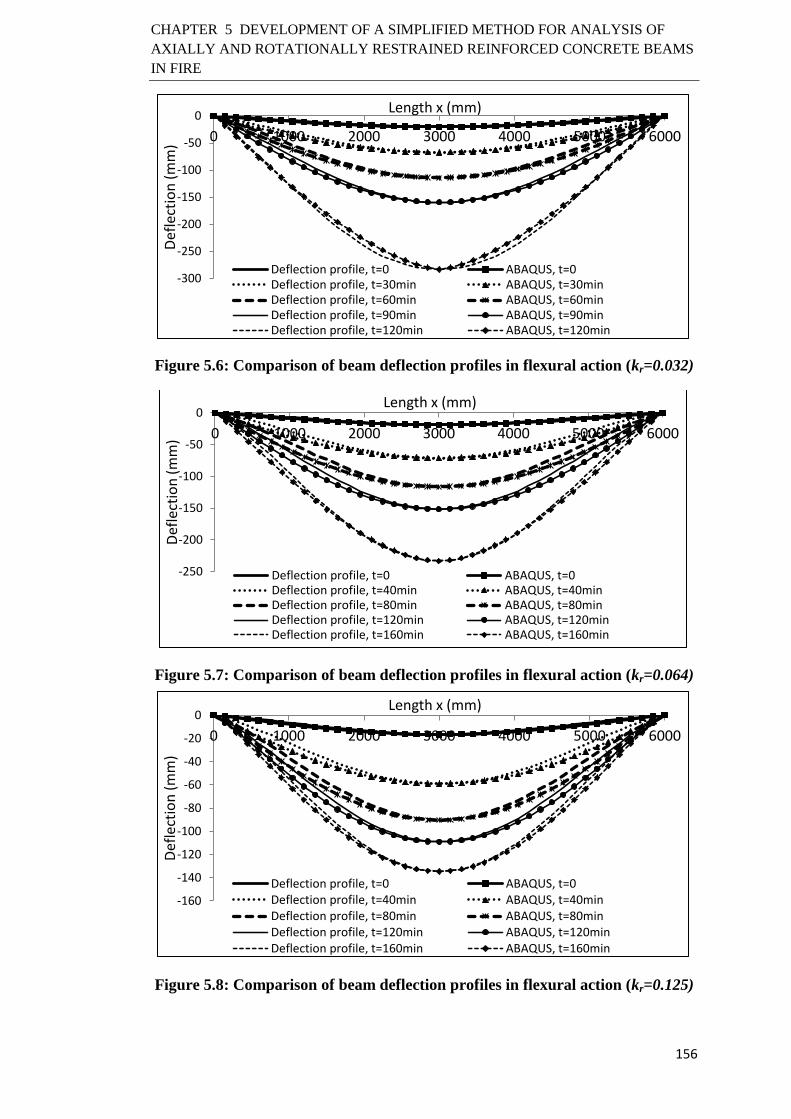
CHAPTER 5 DEVELOPMENT OF A SIMPLIFIED METHOD FOR ANALYSIS OF
AXIALLY AND ROTATIONALLY RESTRAINED REINFORCED CONCRETE BEAMS
IN FIRE
156
Figure 5.6: Comparison of beam deflection profiles in flexural action (kr=0.032)
Figure 5.7: Comparison of beam deflection profiles in flexural action (kr=0.064)
Figure 5.8: Comparison of beam deflection profiles in flexural action (kr=0.125)
-300
-250
-200
-150
-100
-50
0
0 1000 2000 3000 4000 5000 6000
Def
lect
ion
(mm
)
Length x (mm)
Deflection profile, t=0 ABAQUS, t=0Deflection profile, t=30min ABAQUS, t=30minDeflection profile, t=60min ABAQUS, t=60minDeflection profile, t=90min ABAQUS, t=90minDeflection profile, t=120min ABAQUS, t=120min
-250
-200
-150
-100
-50
0
0 1000 2000 3000 4000 5000 6000
Def
lect
ion
(mm
)
Length x (mm)
Deflection profile, t=0 ABAQUS, t=0Deflection profile, t=40min ABAQUS, t=40minDeflection profile, t=80min ABAQUS, t=80minDeflection profile, t=120min ABAQUS, t=120minDeflection profile, t=160min ABAQUS, t=160min
-160
-140
-120
-100
-80
-60
-40
-20
0
0 1000 2000 3000 4000 5000 6000
Def
lect
ion
(mm
)
Length x (mm)
Deflection profile, t=0 ABAQUS, t=0Deflection profile, t=40min ABAQUS, t=40minDeflection profile, t=80min ABAQUS, t=80minDeflection profile, t=120min ABAQUS, t=120minDeflection profile, t=160min ABAQUS, t=160min
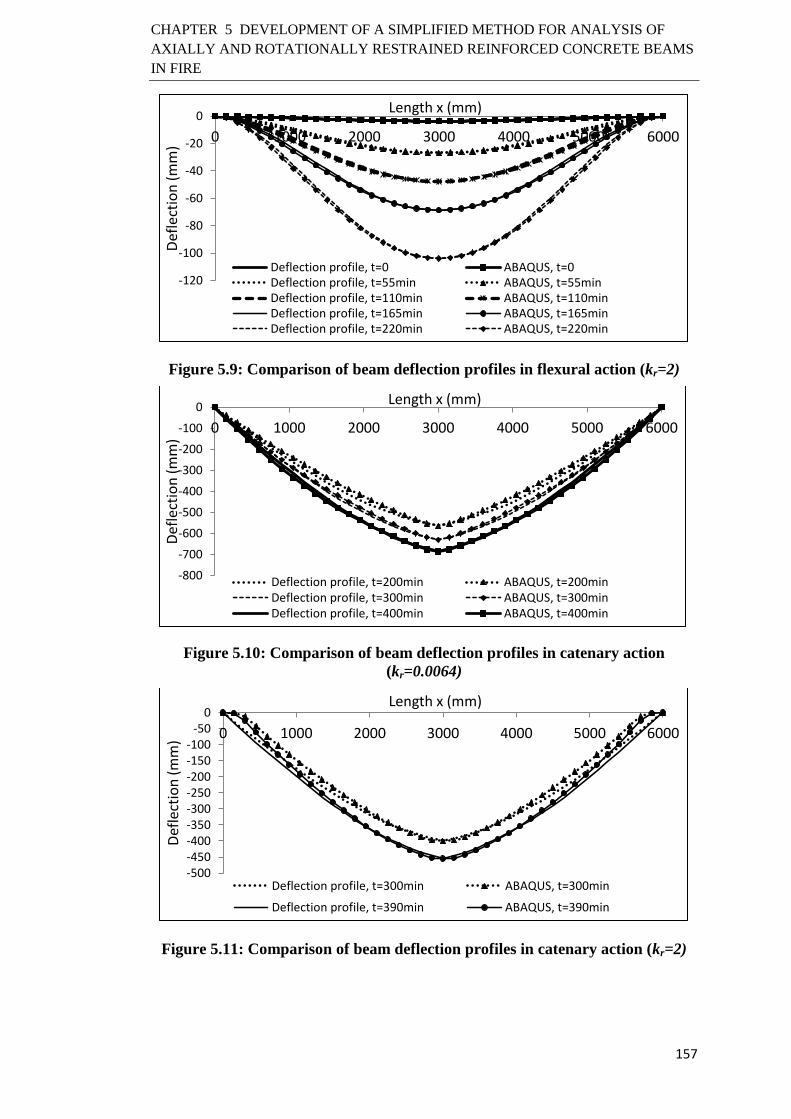
CHAPTER 5 DEVELOPMENT OF A SIMPLIFIED METHOD FOR ANALYSIS OF
AXIALLY AND ROTATIONALLY RESTRAINED REINFORCED CONCRETE BEAMS
IN FIRE
157
Figure 5.9: Comparison of beam deflection profiles in flexural action (kr=2)
Figure 5.10: Comparison of beam deflection profiles in catenary action
(kr=0.0064)
Figure 5.11: Comparison of beam deflection profiles in catenary action (kr=2)
-120
-100
-80
-60
-40
-20
0
0 1000 2000 3000 4000 5000 6000
Def
lect
ion
(mm
)
Length x (mm)
Deflection profile, t=0 ABAQUS, t=0Deflection profile, t=55min ABAQUS, t=55minDeflection profile, t=110min ABAQUS, t=110minDeflection profile, t=165min ABAQUS, t=165minDeflection profile, t=220min ABAQUS, t=220min
-800
-700
-600
-500
-400
-300
-200
-100
0
0 1000 2000 3000 4000 5000 6000
Def
lect
ion
(mm
)
Length x (mm)
Deflection profile, t=200min ABAQUS, t=200minDeflection profile, t=300min ABAQUS, t=300minDeflection profile, t=400min ABAQUS, t=400min
-500-450-400-350-300-250-200-150-100
-500
0 1000 2000 3000 4000 5000 6000
Def
lect
ion
(mm
)
Length x (mm)
Deflection profile, t=300min ABAQUS, t=300min
Deflection profile, t=390min ABAQUS, t=390min

CHAPTER 5 DEVELOPMENT OF A SIMPLIFIED METHOD FOR ANALYSIS OF
AXIALLY AND ROTATIONALLY RESTRAINED REINFORCED CONCRETE BEAMS
IN FIRE
158
5.4.2 Simplified Structural Analysis Procedure
The simplified structural analysis procedure at each time step is as follows:
1. The deflected shape of the beam is approximated by a deflection profile, as
described in section 5.4.1.
2. A mid-span deflection δmax is assumed.
3. From the assumed δmax, curvature in each segment 𝜑𝑖 and deflections (δ) at
the segment ends are calculated from the beam’s deflection profile.
4. The cross-section strains are calculated based on the plane section
assumption.
5. An axial force F is assumed.
6. At each segment I and based on the assumed fixed 𝜑𝑖, a reference strain εoi is
iterated until summation of the element forces in the cross-section (the
internal axial force (Fint,i)) is equal to the assumed F.
7. The reference strains εoi for all segments that fulfil Fint,i=F are then used to
check compatibility conditions as described in the following sections.
8. The assumed F is varied while the assumed δmax is kept uchanged and steps 6
an 7 are repeated for each new value of F until compatability conditions are
satisfied.
9. As soon as the compatability conditions are satisfied under the assumed δmax,
stresses in the concrete elements and steel bars at the beam mid-span and end
sections are used to check the equilibrium conditions described in the
following sections
10. Steps 2 to 9 are repeated until both compatability and equilibrium conditions
are satisfied.
11. The values of δmax and F that satisfy compatability and equilibrium
conditions are recorded as the beam mid-span deflection and axial force at
the specified time step
Based on plane section assumption, the total strain distribution in a beam section is
linear as shown in Figure 5.12. Based on the deflection profile, the total beam
curvature 𝜑𝑖 in each segment can be calculated using the following equation:
𝜑𝑖 =𝑑2𝛿
𝑑𝑥2|𝑥=𝑥𝑖 (5-10)

CHAPTER 5 DEVELOPMENT OF A SIMPLIFIED METHOD FOR ANALYSIS OF
AXIALLY AND ROTATIONALLY RESTRAINED REINFORCED CONCRETE BEAMS
IN FIRE
159
The vertical coordinae of the reference strain εo is yo, and this should be the same as
that of the axial restraint at the beam end sections (see Figure 5.3). This is important
when checking the compatibility conditions explained later in section 5.4.3. Then,
the total strain εtot in each element of the beam cross-section can be calculated as:
휀𝑡𝑜𝑡 = 휀𝑜 + 𝜑(𝑦𝑜 − 𝑦) (5-11)
where coordinate y is measured from the top most fibre to the element centre, as
shown in Figure 5.12. It should be pointed out that the curvature is only dependent
on the maximum beam deflection δmax.
Figure 5.12: Distribution of total strain in a beam cross-section
The mechanical strain of the element can be calculated by subtracting the thermal
strain from the total strain:
휀𝑚𝑒𝑐 = 휀𝑡𝑜𝑡 − 휀𝑡ℎ (5-12)
where εth is the unrestrained thermal strain determined from the knowledge of
thermal expansion and temperature of concrete and steel reinforcement. Once the
mechanical strain of the element is obtained, its stress is calculated by using the
temperature-dependent stress-strain relationships for concrete and steel
reinforcement.
z
y 𝜑
-
휀𝑜
휀𝑡𝑜𝑡 휀𝑡𝑜𝑡
+
-
𝜑
휀𝑜
y yo yo
(a) Cross-section (b) Strain diagram
(𝜑 ≤ 0)
(c) Strain diagram
(𝜑 ≥ 0)
D
B
+ Tension
- Compression
+
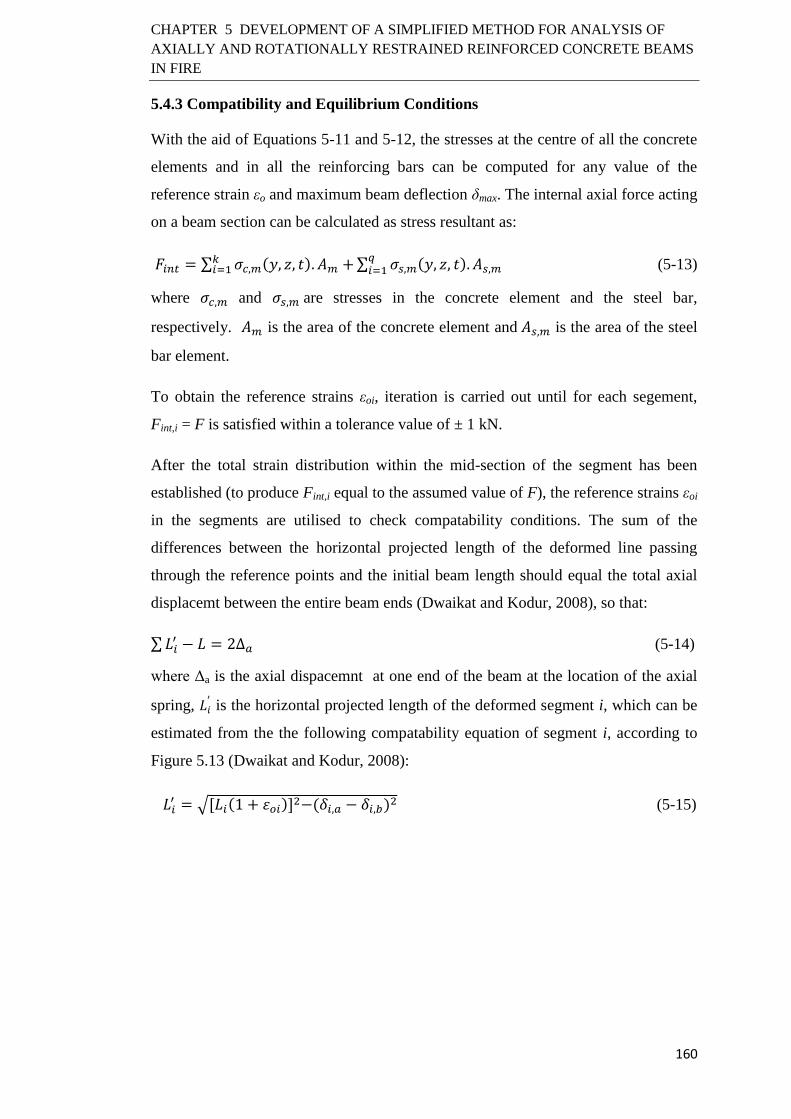
CHAPTER 5 DEVELOPMENT OF A SIMPLIFIED METHOD FOR ANALYSIS OF
AXIALLY AND ROTATIONALLY RESTRAINED REINFORCED CONCRETE BEAMS
IN FIRE
160
5.4.3 Compatibility and Equilibrium Conditions
With the aid of Equations 5-11 and 5-12, the stresses at the centre of all the concrete
elements and in all the reinforcing bars can be computed for any value of the
reference strain εo and maximum beam deflection δmax. The internal axial force acting
on a beam section can be calculated as stress resultant as:
𝐹𝑖𝑛𝑡 = ∑ 𝜎𝑐,𝑚(𝑦, 𝑧, 𝑡). 𝐴𝑚 +𝑘𝑖=1 ∑ 𝜎𝑠,𝑚(𝑦, 𝑧, 𝑡). 𝐴𝑠,𝑚
𝑞𝑖=1 (5-13)
where 𝜎𝑐,𝑚 and 𝜎𝑠,𝑚 are stresses in the concrete element and the steel bar,
respectively. 𝐴𝑚 is the area of the concrete element and 𝐴𝑠,𝑚 is the area of the steel
bar element.
To obtain the reference strains εoi, iteration is carried out until for each segement,
Fint,i = F is satisfied within a tolerance value of ± 1 kN.
After the total strain distribution within the mid-section of the segment has been
established (to produce Fint,i equal to the assumed value of F), the reference strains εoi
in the segments are utilised to check compatability conditions. The sum of the
differences between the horizontal projected length of the deformed line passing
through the reference points and the initial beam length should equal the total axial
displacemt between the entire beam ends (Dwaikat and Kodur, 2008), so that:
∑𝐿𝑖′ − 𝐿 = 2∆𝑎 (5-14)
where Δa is the axial dispacemnt at one end of the beam at the location of the axial
spring, 𝐿𝑖′ is the horizontal projected length of the deformed segment i, which can be
estimated from the the following compatability equation of segment i, according to
Figure 5.13 (Dwaikat and Kodur, 2008):
𝐿𝑖′ = √[𝐿𝑖(1 + 휀𝑜𝑖)]2−(𝛿𝑖,𝑎 − 𝛿𝑖,𝑏)2 (5-15)
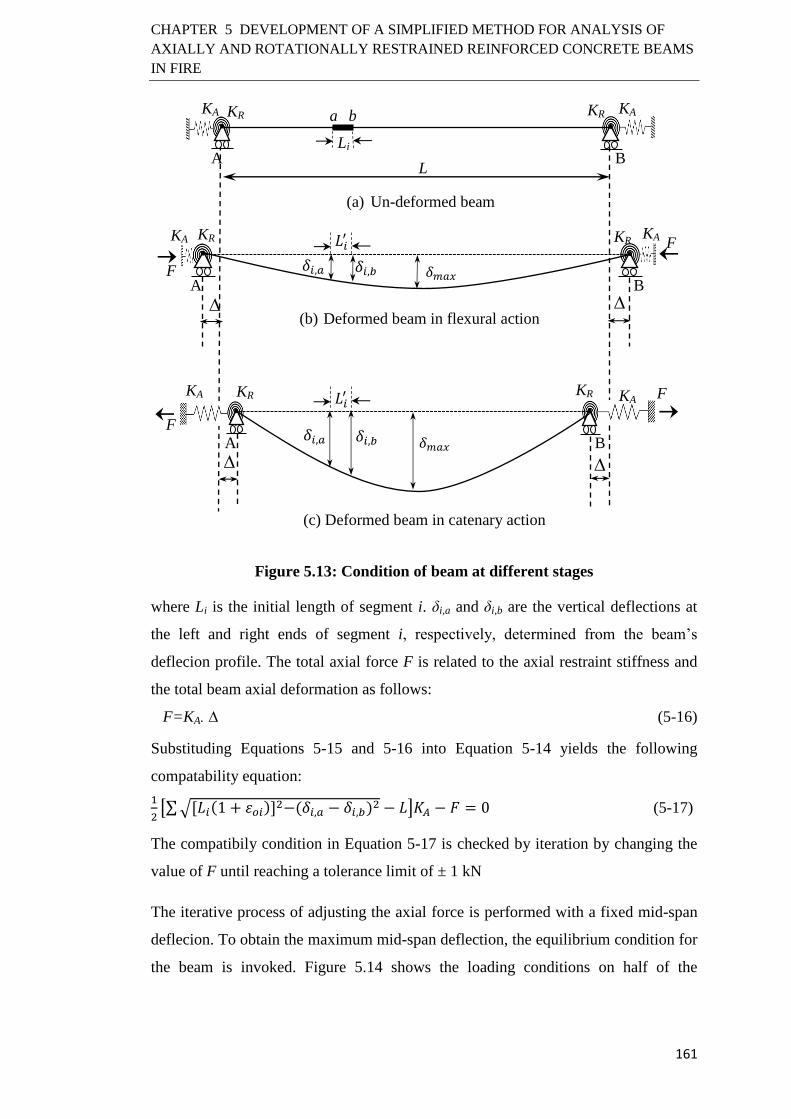
CHAPTER 5 DEVELOPMENT OF A SIMPLIFIED METHOD FOR ANALYSIS OF
AXIALLY AND ROTATIONALLY RESTRAINED REINFORCED CONCRETE BEAMS
IN FIRE
161
Figure 5.13: Condition of beam at different stages
where Li is the initial length of segment i. δi,a and δi,b are the vertical deflections at
the left and right ends of segment i, respectively, determined from the beam’s
deflecion profile. The total axial force F is related to the axial restraint stiffness and
the total beam axial deformation as follows:
F=KA. ∆ (5-16)
Substituding Equations 5-15 and 5-16 into Equation 5-14 yields the following
compatability equation:
1
2[∑√[𝐿𝑖(1 + 휀𝑜𝑖)]2−(𝛿𝑖,𝑎 − 𝛿𝑖,𝑏)2 − 𝐿]𝐾𝐴 − 𝐹 = 0 (5-17)
The compatibily condition in Equation 5-17 is checked by iteration by changing the
value of F until reaching a tolerance limit of ± 1 kN
The iterative process of adjusting the axial force is performed with a fixed mid-span
deflecion. To obtain the maximum mid-span deflection, the equilibrium condition for
the beam is invoked. Figure 5.14 shows the loading conditions on half of the
(a) Un-deformed beam
𝛿𝑚𝑎𝑥
𝛿𝑚𝑎𝑥
a
𝐿𝑖′
KA KR KA
L A B
∆
KA KR KR KA
A B
∆
∆
KA KR KR KA
A B
∆
KR
Li
𝐿𝑖′
𝛿𝑖,𝑏 𝛿𝑖,𝑎
b
𝛿𝑖,𝑏 𝛿𝑖,𝑎
F
F
F
F
(b) Deformed beam in flexural action
(c) Deformed beam in catenary action

CHAPTER 5 DEVELOPMENT OF A SIMPLIFIED METHOD FOR ANALYSIS OF
AXIALLY AND ROTATIONALLY RESTRAINED REINFORCED CONCRETE BEAMS
IN FIRE
162
deformed beam. The equilibrium equation is checked only at the mid-span and end
ponits of the beam as:
Figure 5.14: Loading condition on deformed half beam
𝐹. 𝛿𝑚𝑎𝑥 +𝑀𝑚 +𝑀𝐴 −𝑀𝑒 = 0 (5-18)
where the bending moments are taken about the vertical coordinate of the axial
restraint (yo) at the beam end A as:
(𝐹. 𝛿𝑚𝑎𝑥 +𝑀𝑚)|𝑥=𝐿2
= ∑ 𝜎𝑐,𝑚(𝑦, 𝑧, 𝑡). 𝐴𝑚. (𝛿𝑚𝑎𝑥 + 𝑦 − 𝑦𝑜)𝑘𝑖=1 +
∑ 𝜎𝑠,𝑚(𝑦, 𝑧, 𝑡). 𝐴𝑠,𝑚. (𝛿𝑚𝑎𝑥 + 𝑦 − 𝑦𝑜)𝑞𝑖=1 (5-19)
𝑀𝐴|𝑥=0 = ∑ 𝜎𝑐,𝑚(𝑦, 𝑧, 𝑡). 𝐴𝑚. (𝑦 − 𝑦𝑜) +𝑘𝑖=1
∑ 𝜎𝑠,𝑚(𝑦, 𝑧, 𝑡). 𝐴𝑠,𝑚. (𝑦 − 𝑦𝑜)𝑞𝑖=1 (5-20)
The external bending moment is:
𝑀𝑒 =𝑤𝐿2
8 (5-21)
F is the axial force in the beam
MA is the internal bending moment at the support
Mm is the internal bending moment at mid-span
δmax is the maximum deflection at mid-span
Ideally, the end section bending moment MA should be in equilibrium with the
bending moment in the rotational restraint at the beam ends. This would require
precise calculation of the end rotations, which would not be possible using the
proposed deflection profiles. As simplification, the following process is
implemented:
With complete end rotational restraint, the whole MA calculated using Equation 5-20
should be used in the equilibrium Equation 5-18 because there is no end rotation;
L/2
Me
Mm
MA
𝛿𝑚𝑎𝑥
F
F
A
VA

CHAPTER 5 DEVELOPMENT OF A SIMPLIFIED METHOD FOR ANALYSIS OF
AXIALLY AND ROTATIONALLY RESTRAINED REINFORCED CONCRETE BEAMS
IN FIRE
163
with no end rotational restraint, MA should be zero. For flexible rotational restraint,
the end bending moment is calculated as c.MA where the factor c is the same as
presented in Equation 5-6. Hence, equilibrium Equation 5-18 for flexible end
rotational restraint is rewritten as follows:
𝐹. 𝛿𝑚𝑎𝑥 +𝑀𝑚 + 𝑐.𝑀𝐴 −𝑀𝑒 = 0 (5-22)
The equilibrim condition in the simplified analysis is cocnsidered to be satisfied if
the difference between the internal and external bending moment is within a
tolerance of ± 0.02 Me. If the difference is grerater than this limit, the whole process
is repeated for a different δmax value.
The above solution procedure is programmed into Visual Basic integrated in Excel
spreadsheets.
5.5 Maximum Concrete Compressive Strain (εcmax,T)
Quantifying compressive failure of concrete under the combined action of bending
moment and axial compressive force is quite difficult due to non-uniform
temperature distribution in the beam cross-section. In literature, models predicting
the influence of temperature on the maximum concrete strain εcmax,T that causes the
concrete compressive zone to fail are very limited. El-Fitiany and Youssef (2014a)
conducted a parametric study on RC column members to evaluate εcmax,T
corresponding to the ultimate flexural capacity at high temperatures under different
axial compressive forces. It was suggested that reasonable results of εcmax,T, which
are higher than the strain value at peak compressive stress εc1,T , can be calculated
using the following expression:
휀𝑐𝑚𝑎𝑥,𝑇 = 𝑟(휀𝑐𝑢1,𝑇 − 휀𝑐1,𝑇) + 휀𝑐1,𝑇 (5-23)
where, r is a factor equal to 0.25, which locates εcmax,T in the softening branch of the
concrete stress-strain curve in compression and εcu1,T is the strain at zero stress
(complete concrete crushing). The same expression in Equation 5-23 is adopted in
this study to predict compressive failure of concrete at the beam ends. However, a
value of 0.2 is taken for the factor r instead of 0.25 because the values of εc1,T at
elevated temperatures used by El-Fitiany and Youssef (2014a) are lower than those

CHAPTER 5 DEVELOPMENT OF A SIMPLIFIED METHOD FOR ANALYSIS OF
AXIALLY AND ROTATIONALLY RESTRAINED REINFORCED CONCRETE BEAMS
IN FIRE
164
recommended by EN 1992 1-2 (CEN, 2004) for temperatures above 500oC.
Therefore, Equation 5-23 is rewritten as:
휀𝑐𝑚𝑎𝑥,𝑇 = 0.2(휀𝑐𝑢1,𝑇 − 휀𝑐1,𝑇) + 휀𝑐1,𝑇 (5-24)
5.6 Beam Bending Failure Modes
In flexural action under combined compression and bending, if equilibrium equation
5-22 is not converged anymore while iterations are being carried out to find δmax and
F, it indicates bending failure. According to the different bending failure modes
described in section 5.2 which are based on the numerical simulation results in
Chapter 4, the following two bending failure scenarios should be checked:
1- Mid-span reaching its sagging moment capacity first before formation of
plastic hinges at the beam ends (kr≤kr,D in Figure 5.2). This failure mode
occurs when none of the extreme concrete elements at the beam ends has
reached the maximum concrete compressive failure strain (εcmax,T) and the top
bars at the beam ends have not reached the yielding strain. If this scenario is
observed, an extra check is needed to explore whether the beam ends can
sustain a prolonged bending period with reduced compressive force after
reaching failure of the mid-span. Details on this load redistribution
mechanism will be presented in section 5.7.
2- Compressive failure of concrete at the beam ends is reached before reaching
the mid-span its sagging moment resistance (kr≥kr,E in Figure 5.2). This
failure scenario is considered to have occurred when strain of any of the
extreme concrete elements at the beam ends has reached εcmax,T.
3- The maximum tensile strain of the top bars at the beam ends exceeds the
limiting strain of steel. In Chapter 4, this condition was found to happen for
beams failed by hogging moment failure caused by fracture of the tensile
reinforcement before sagging bending failure at the beam mid-span occurs, as
observed in axially unrestrained beams with high rotational stiffness.
5.7 Beam Bending Resistance Time When kr≤ kr,D
The numerical study results in Chapter 4 have shown that a beam with kr≤kr,D may
still balance the applied load through flexural action by the end hogging moment

CHAPTER 5 DEVELOPMENT OF A SIMPLIFIED METHOD FOR ANALYSIS OF
AXIALLY AND ROTATIONALLY RESTRAINED REINFORCED CONCRETE BEAMS
IN FIRE
165
resistance when the mid-span has reached its sagging moment resistance. However,
this period of further bending resistance can only be achieved when the beam ends
can develop sufficient moments to balance the applied moment (kr≥kr,B) and the
reduced hogging moment resistance (MRd,fi,hog) is still higher than the applied moment
(MRd,fi,hog≥wL2/8). In this case, the compressive force in the beam is partially
released. To examine this condition, two critical parameters, kr,B and MRd,fi,hog need
to be quantified.
When the beam rotational stiffness is kr=kr,B, it has zero axial force (Figure 5.2).
Hence, the equilibrium equation for predicting kr,B is conservatively taken as follows:
𝑀𝐴 −𝑀𝑒 = 0 (5-25)
It should be pointed out that because the applied load is assumed to be entirely
resisted by the end sections, the MA value computed by Equation 5-20 is taken
without multiplying it by the factor c defined in Equation 5-6. However, the effect of
flexible end rotational restraint stiffness is taken into consideration when determining
the beam deflection and curvature. In realistic structures, MA may represent the
bending resistance of the surrounding structure.
The reduced section hogging moment resistance MRd,fi,hog with time cannot be
determined based on simple plastic analysis due to severe non-uniform distribution
of strength of concrete on the compression side which is directly exposed to fire. In
this analysis, it is determined by establishing moment-curvature (𝑀 − 𝜑)
relationships with zero axial force. Figure 5.15 shows a schematic 𝑀 − 𝜑 curve at a
given fire exposure time. The 𝑀 − 𝜑 curve is constructed by iterating the reference
strain εo at the mid-depth of the cross-section for any fixed value of curvature until
the resultant of internal axial force, calculated using Equation 5-13, is equal to zero.
The internal moment of the cross-section is calculated from stresses of the elements
using Equation 5-26. The maximum internal moment in the 𝑀 − 𝜑 curve defines the
hogging moment resistance at the given fire exposure time.
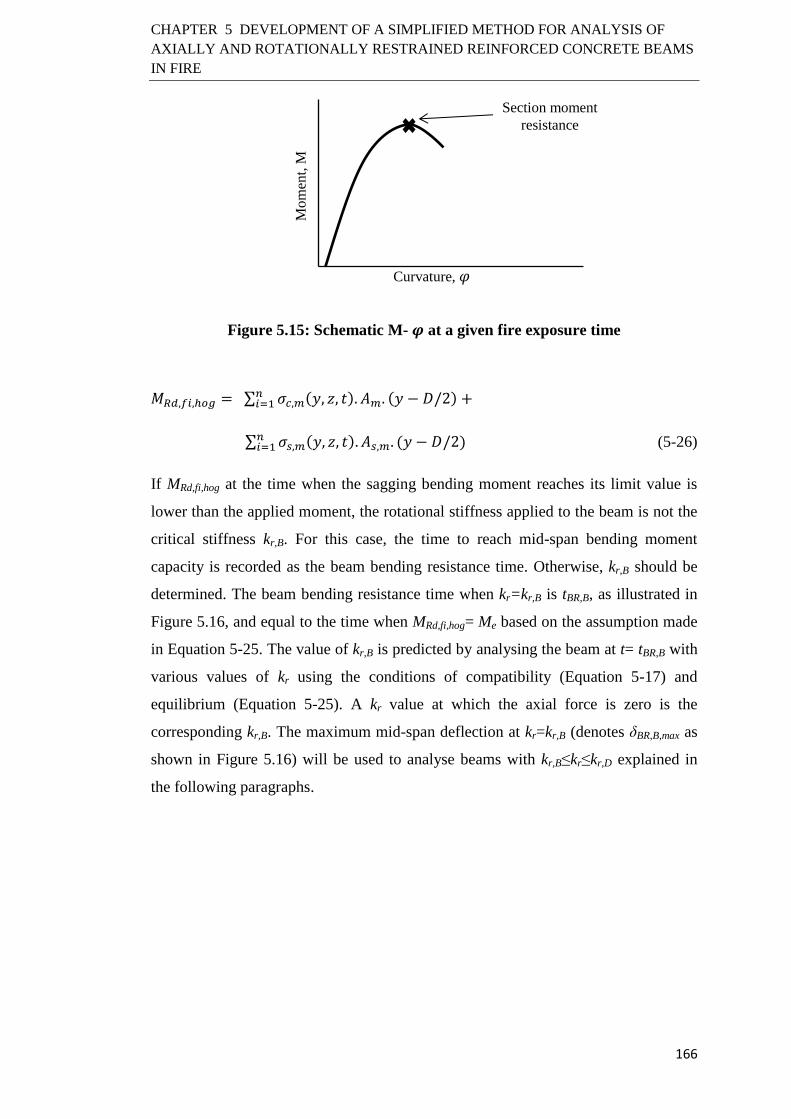
CHAPTER 5 DEVELOPMENT OF A SIMPLIFIED METHOD FOR ANALYSIS OF
AXIALLY AND ROTATIONALLY RESTRAINED REINFORCED CONCRETE BEAMS
IN FIRE
166
Figure 5.15: Schematic M- 𝝋 at a given fire exposure time
𝑀𝑅𝑑,𝑓𝑖,ℎ𝑜𝑔 = ∑ 𝜎𝑐,𝑚(𝑦, 𝑧, 𝑡). 𝐴𝑚. (𝑦 − 𝐷/2) +𝑛𝑖=1
∑ 𝜎𝑠,𝑚(𝑦, 𝑧, 𝑡). 𝐴𝑠,𝑚. (𝑦 − 𝐷/2)𝑛𝑖=1 (5-26)
If MRd,fi,hog at the time when the sagging bending moment reaches its limit value is
lower than the applied moment, the rotational stiffness applied to the beam is not the
critical stiffness kr,B. For this case, the time to reach mid-span bending moment
capacity is recorded as the beam bending resistance time. Otherwise, kr,B should be
determined. The beam bending resistance time when kr=kr,B is tBR,B, as illustrated in
Figure 5.16, and equal to the time when MRd,fi,hog= Me based on the assumption made
in Equation 5-25. The value of kr,B is predicted by analysing the beam at t= tBR,B with
various values of kr using the conditions of compatibility (Equation 5-17) and
equilibrium (Equation 5-25). A kr value at which the axial force is zero is the
corresponding kr,B. The maximum mid-span deflection at kr=kr,B (denotes δBR,B,max as
shown in Figure 5.16) will be used to analyse beams with kr,B≤kr≤kr,D explained in
the following paragraphs.
Section moment
resistance
Mo
men
t, M
Curvature, 𝜑
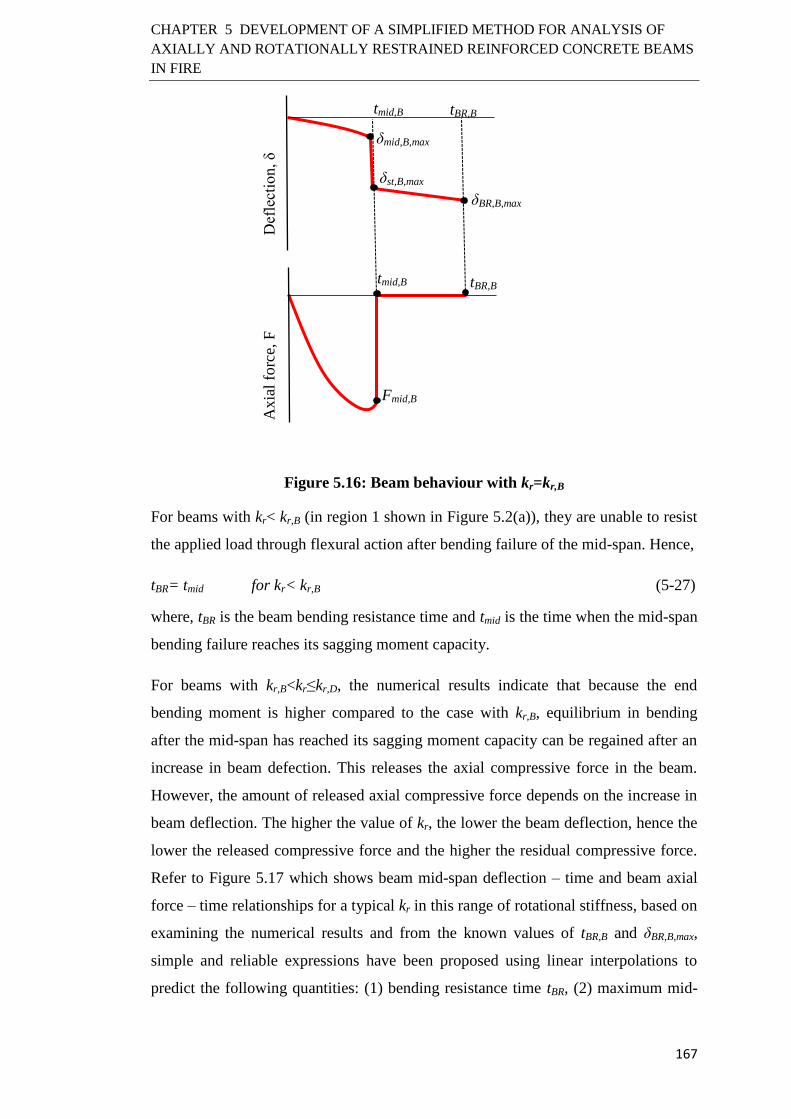
CHAPTER 5 DEVELOPMENT OF A SIMPLIFIED METHOD FOR ANALYSIS OF
AXIALLY AND ROTATIONALLY RESTRAINED REINFORCED CONCRETE BEAMS
IN FIRE
167
Figure 5.16: Beam behaviour with kr=kr,B
For beams with kr< kr,B (in region 1 shown in Figure 5.2(a)), they are unable to resist
the applied load through flexural action after bending failure of the mid-span. Hence,
tBR= tmid for kr< kr,B (5-27)
where, tBR is the beam bending resistance time and tmid is the time when the mid-span
bending failure reaches its sagging moment capacity.
For beams with kr,B<kr≤kr,D, the numerical results indicate that because the end
bending moment is higher compared to the case with kr,B, equilibrium in bending
after the mid-span has reached its sagging moment capacity can be regained after an
increase in beam defection. This releases the axial compressive force in the beam.
However, the amount of released axial compressive force depends on the increase in
beam deflection. The higher the value of kr, the lower the beam deflection, hence the
lower the released compressive force and the higher the residual compressive force.
Refer to Figure 5.17 which shows beam mid-span deflection – time and beam axial
force – time relationships for a typical kr in this range of rotational stiffness, based on
examining the numerical results and from the known values of tBR,B and δBR,B,max,
simple and reliable expressions have been proposed using linear interpolations to
predict the following quantities: (1) bending resistance time tBR, (2) maximum mid-
Axia
l fo
rce,
F
tmid,B
tmid,B tBR,B
Def
lect
ion, δ
δBR,B,max
δst,B,max
tBR,B
Fmid,B
δmid,B,max
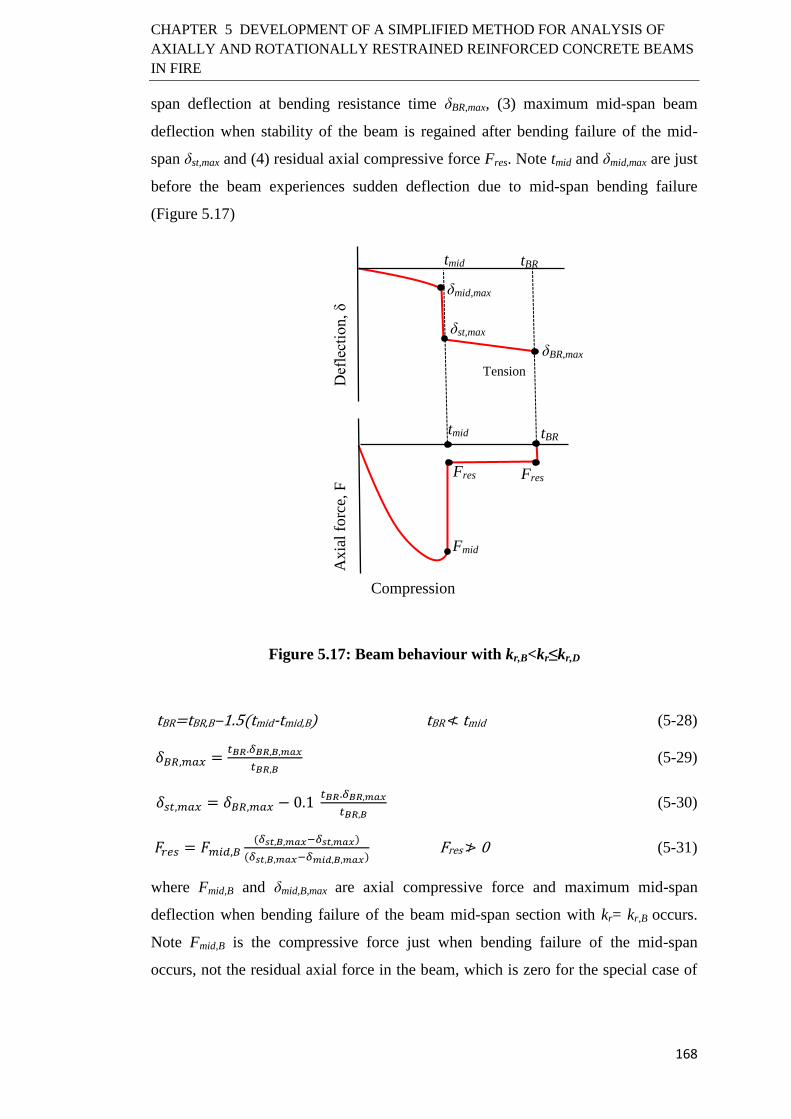
CHAPTER 5 DEVELOPMENT OF A SIMPLIFIED METHOD FOR ANALYSIS OF
AXIALLY AND ROTATIONALLY RESTRAINED REINFORCED CONCRETE BEAMS
IN FIRE
168
span deflection at bending resistance time δBR,max, (3) maximum mid-span beam
deflection when stability of the beam is regained after bending failure of the mid-
span δst,max and (4) residual axial compressive force Fres. Note tmid and δmid,max are just
before the beam experiences sudden deflection due to mid-span bending failure
(Figure 5.17)
Figure 5.17: Beam behaviour with kr,B<kr≤kr,D
tBR=tBR,B‒1.5(tmid-tmid,B) tBR ≮ tmid (5-28)
𝛿𝐵𝑅,𝑚𝑎𝑥 =𝑡𝐵𝑅.𝛿𝐵𝑅,𝐵,𝑚𝑎𝑥
𝑡𝐵𝑅,𝐵 (5-29)
𝛿𝑠𝑡,𝑚𝑎𝑥 = 𝛿𝐵𝑅,𝑚𝑎𝑥 − 0.1 𝑡𝐵𝑅.𝛿𝐵𝑅,𝑚𝑎𝑥
𝑡𝐵𝑅,𝐵 (5-30)
𝐹𝑟𝑒𝑠 = 𝐹𝑚𝑖𝑑,𝐵(𝛿𝑠𝑡,𝐵,𝑚𝑎𝑥−𝛿𝑠𝑡,𝑚𝑎𝑥)
(𝛿𝑠𝑡,𝐵,𝑚𝑎𝑥−𝛿𝑚𝑖𝑑,𝐵,𝑚𝑎𝑥) Fres ≯ 0 (5-31)
where Fmid,B and δmid,B,max are axial compressive force and maximum mid-span
deflection when bending failure of the beam mid-span section with kr= kr,B occurs.
Note Fmid,B is the compressive force just when bending failure of the mid-span
occurs, not the residual axial force in the beam, which is zero for the special case of
Compression
Axia
l fo
rce,
F
tmid
tmid tBR
Def
lect
ion, δ
Tension
δBR,max
δst,max
tBR
Fres Fres
Fmid
δmid,max
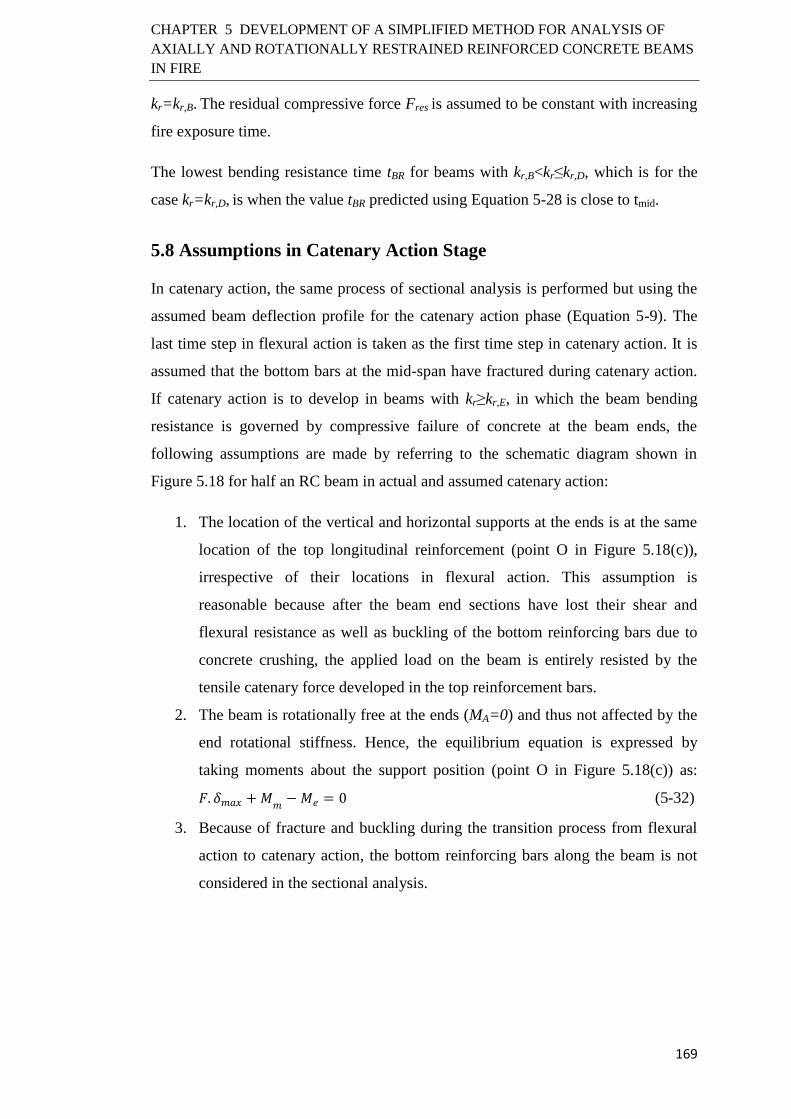
CHAPTER 5 DEVELOPMENT OF A SIMPLIFIED METHOD FOR ANALYSIS OF
AXIALLY AND ROTATIONALLY RESTRAINED REINFORCED CONCRETE BEAMS
IN FIRE
169
kr=kr,B. The residual compressive force Fres is assumed to be constant with increasing
fire exposure time.
The lowest bending resistance time tBR for beams with kr,B<kr≤kr,D, which is for the
case kr=kr,D, is when the value tBR predicted using Equation 5-28 is close to tmid.
5.8 Assumptions in Catenary Action Stage
In catenary action, the same process of sectional analysis is performed but using the
assumed beam deflection profile for the catenary action phase (Equation 5-9). The
last time step in flexural action is taken as the first time step in catenary action. It is
assumed that the bottom bars at the mid-span have fractured during catenary action.
If catenary action is to develop in beams with kr≥kr,E, in which the beam bending
resistance is governed by compressive failure of concrete at the beam ends, the
following assumptions are made by referring to the schematic diagram shown in
Figure 5.18 for half an RC beam in actual and assumed catenary action:
1. The location of the vertical and horizontal supports at the ends is at the same
location of the top longitudinal reinforcement (point O in Figure 5.18(c)),
irrespective of their locations in flexural action. This assumption is
reasonable because after the beam end sections have lost their shear and
flexural resistance as well as buckling of the bottom reinforcing bars due to
concrete crushing, the applied load on the beam is entirely resisted by the
tensile catenary force developed in the top reinforcement bars.
2. The beam is rotationally free at the ends (MA=0) and thus not affected by the
end rotational stiffness. Hence, the equilibrium equation is expressed by
taking moments about the support position (point O in Figure 5.18(c)) as:
𝐹. 𝛿𝑚𝑎𝑥 +𝑀𝑚−𝑀𝑒 = 0 (5-32)
3. Because of fracture and buckling during the transition process from flexural
action to catenary action, the bottom reinforcing bars along the beam is not
considered in the sectional analysis.

CHAPTER 5 DEVELOPMENT OF A SIMPLIFIED METHOD FOR ANALYSIS OF
AXIALLY AND ROTATIONALLY RESTRAINED REINFORCED CONCRETE BEAMS
IN FIRE
170
(a) Example of deformed shape of ABAQUS simulation in catenary action
(b) Actual beam in real catenary action
(c) Assumed beam in catenary action in the simplified model
Figure 5.18: Schematic diagram of a beam in catenary action with kr≥kr,E
5.9 Beam Ultimate Resistance Time (tUR) in Catenary Action
In the catenary action stage, the applied load is entirely sustained by the tensile force
developed in the top steel reinforcing bars. This stage ends once strain of the top
reinforcement exceeds its rupture limit, causing total collapse of the beam.
Numerical results in Chapter 4 have shown that large plastic deformation and bar
Top reinforcement
Bottom reinforcement
Buckled steel
bars
w
L/2
Crushed
concrete
Fractured
steel bars
F
Top reinforcement
Centre of
rotation
KA
w
L/2
F
O yo
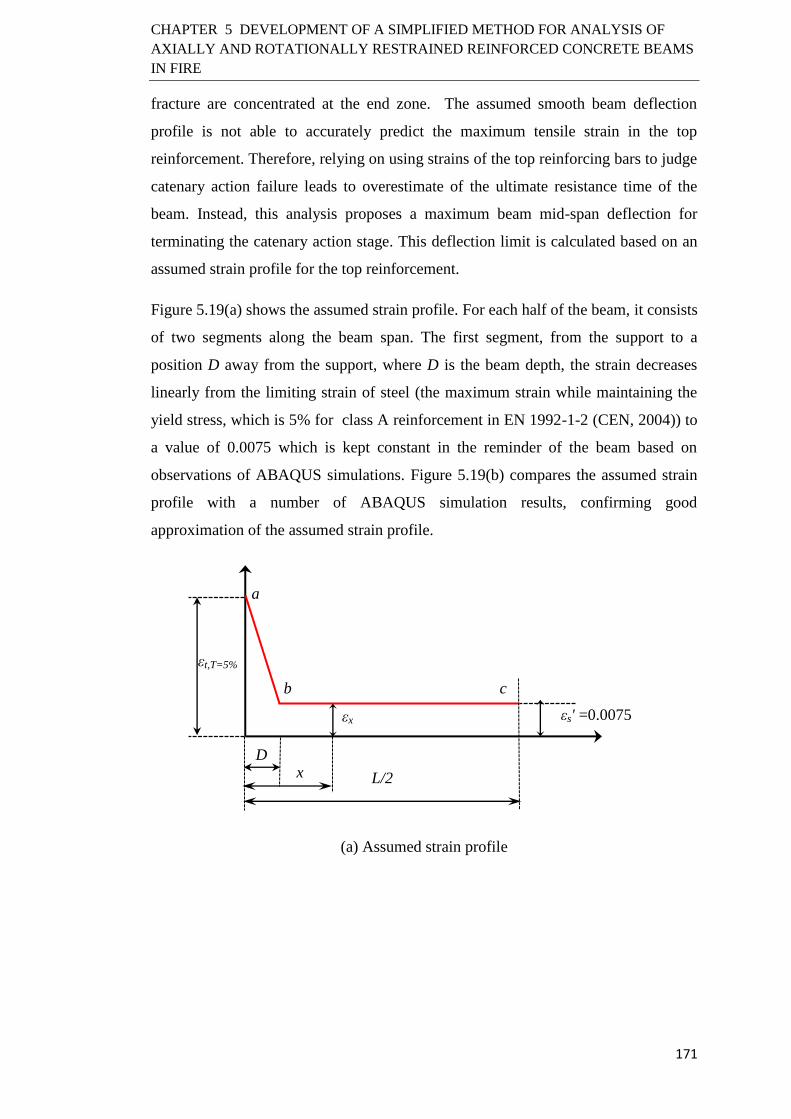
CHAPTER 5 DEVELOPMENT OF A SIMPLIFIED METHOD FOR ANALYSIS OF
AXIALLY AND ROTATIONALLY RESTRAINED REINFORCED CONCRETE BEAMS
IN FIRE
171
fracture are concentrated at the end zone. The assumed smooth beam deflection
profile is not able to accurately predict the maximum tensile strain in the top
reinforcement. Therefore, relying on using strains of the top reinforcing bars to judge
catenary action failure leads to overestimate of the ultimate resistance time of the
beam. Instead, this analysis proposes a maximum beam mid-span deflection for
terminating the catenary action stage. This deflection limit is calculated based on an
assumed strain profile for the top reinforcement.
Figure 5.19(a) shows the assumed strain profile. For each half of the beam, it consists
of two segments along the beam span. The first segment, from the support to a
position D away from the support, where D is the beam depth, the strain decreases
linearly from the limiting strain of steel (the maximum strain while maintaining the
yield stress, which is 5% for class A reinforcement in EN 1992-1-2 (CEN, 2004)) to
a value of 0.0075 which is kept constant in the reminder of the beam based on
observations of ABAQUS simulations. Figure 5.19(b) compares the assumed strain
profile with a number of ABAQUS simulation results, confirming good
approximation of the assumed strain profile.
(a) Assumed strain profile
b
L/2
εs' =0.0075
εt,T=5%
D
a
c
x
εx

CHAPTER 5 DEVELOPMENT OF A SIMPLIFIED METHOD FOR ANALYSIS OF
AXIALLY AND ROTATIONALLY RESTRAINED REINFORCED CONCRETE BEAMS
IN FIRE
172
(b) From ABAQUS simulations
Figure 5.19: Strain profiles of top reinforcing bars at ultimate beam resistance
time
Assuming a linear deflection shape of the top bars according to Figure 5.20, the
maximum mid-span deflection of the beam can be estimated from the compatibility
requirements of the top bars as:
𝛿𝑚𝑎𝑥 = √(𝐿
2+ ∆𝐿
2
)2
− (𝐿
2−
𝐹
𝐾𝐴)2
(5-33)
∆𝐿2
= ∫ 휀𝑥𝑑𝑥𝐿
20
=𝐿
2휀𝑠′ +
1
2. 𝐷. (휀𝑡,𝑇 − 휀𝑠
′) (5-34)
where ∆𝐿2
represents the increase in half-length of the top reinforcing bars and F is the
axial tensile force in the beam taken from the sectional analysis.
Figure 5.20: Compatibility condition for top reinforcing bars
0
0.01
0.02
0.03
0.04
0.05
0.06
0 0.1 0.2 0.3 0.4 0.5
Stra
in (
mm
/mm
)
× L (Length unit)
L=6m, kr=0.05, ka=0.05, LR=35%, ABAQUS
L=6m, kr=0.05, ka=0.166, LR=35%, ABAQUS
L=6m, kr=0.05, ka=0.25, LR=35%, ABAQUS
L=6m, kr=0.5, ka=0.166, LR=35%, ABAQUS
L=6m, kr=0.1, ka=0.166, LR=50%, ABAQUS
L=5m, kr=∞, ka=0.166, LR=40%, ABAQUS
L=6m, kr=∞, ka=0.166, LR=50%, ABAQUS
Assumed profile, L=6m
𝛿𝑚𝑎𝑥
w
Top reinforcement Centre of
rotation
Ka
L/2
O yo L/2+∆L/2
Fracture of
bottom bars

CHAPTER 5 DEVELOPMENT OF A SIMPLIFIED METHOD FOR ANALYSIS OF
AXIALLY AND ROTATIONALLY RESTRAINED REINFORCED CONCRETE BEAMS
IN FIRE
173
The mid-span deflection δmax using Equation 5-33 is predicted at different increased
time steps. Final failure of the beam in catenary action is said to occur when δmax
from the iterative method (sectional analysis) exceeds the one predicted using
Equation 5-33.
5.10 Limitation of applicability
The applicability of the proposed simplified model has the following limitations:
1. The model is only applicable if the flexural rigidity along the beam length is
constant.
2. The load-induced thermal strain (LITS) is not considered explicitly as a separate
component in the total concrete strain at elevated temperatures. Thus, the
concrete constitutive law defined in the current simplified model is limited to
those which consider the LITS implicitly. Moreover, the simplified model is
applicable for predicting fire response of RC beams subjected to a heating phase
only. It is not applicable to fire scenarios that have a cooling phase after the
heating phase of a fire. The reason is because the model does not account for the
permanent and irreversibility effects of the LITS in the cooling phase.
3. The proposed model is limited to RC beams made of normal strength concrete
with low moisture content u (u ≤ 3% by weight) because the model does not
account for fire-induced spalling. The model may not yield accurate results for
high strength concrete and concrete with high moisture content which are more
susceptible to spalling.
4. The model may not achieve accurate and conservative results of the ultimate
beam resistance time in catenary action when the limiting strain of steel
reinforcement is larger than 0.05.
5.11 Verification of the Simplified Model
Validity of the proposed simplified model is checked by comparing its predictions
against the numerical simulation results of Chapter 4 and additional results of a
parametric study performed, using the sub-frame in Chapter 4, to investigate the
influence of some key parameters on the beam behaviour. Table 5.1 summarises the
chosen simulation cases for the validation study. All the beams have the same (i)
cross-section dimensions with width B=300mm and depth D=400mm, (ii) siliceous

CHAPTER 5 DEVELOPMENT OF A SIMPLIFIED METHOD FOR ANALYSIS OF
AXIALLY AND ROTATIONALLY RESTRAINED REINFORCED CONCRETE BEAMS
IN FIRE
174
aggregate concrete with ambient temperature compressive cylinder strength of 30
MPa and steel reinforcement yield strength of 453 MPa and (iii) the axial spring
being located at the geometric centre of the beam cross-section at ends. The stress-
strain relationships and reduction factors for concrete under compression and steel
reinforcement at elevated temperatures were in accordance with EN 1992-1-2 (CEN,
2004), presented in Appendix 4. For concrete under tension, the same models as
described in section 3.3.1 in Chapter 3 were used.
Table 5.1: Selected parameter simulation cases for the validation study
Parameter LR
(%) kr * ka L/D
Top
bars
Bottom
bars L (m)
Rotational
stiffness ratio, kr
35 0.013 0.166 15 3#6 3#6 6
35 0.029 0.166 15 3#6 3#6 6
35 0.045 0.166 15 3#6 3#6 6
35 0.064 0.166 15 3#6 3#6 6
35 0.125 0.166 15 3#6 3#6 6
35 1.85 0.166 15 3#6 3#6 6
Load Ratio, LR
35 2 0.166 15 3#6 3#6 6
40 2 0.166 15 3#6 3#6 6
45 2 0.166 15 3#6 3#6 6
50 2 0.166 15 3#6 3#6 6
55 2 0.166 15 3#6 3#6 6
60 2 0.166 15 3#6 3#6 6
Axial stiffness
ratio, ka
35 2 0.015 15 3#6 3#6 6
35 2 0.05 15 3#6 3#6 6
35 2 0.1 15 3#6 3#6 6
35 2 0.166 15 3#6 3#6 6
35 2 0.4 15 3#6 3#6 6
Span-to-depth
ratio, L/D
50 2 0.166 10 3#6 3#6 4
50 2 0.166 12.5 3#6 3#6 5
50 2 0.166 15 3#6 3#6 6
50 2 0.166 17.5 3#6 3#6 7
Steel
reinforcement
50 2 0.166 15 3#5 3#6 6
50 2 0.166 15 3#6 3#6 6
50 2 0.166 15 3#7 3#6 6
50 2 0.166 15 3#8 3#6 6
50 2 0.166 15 3#6 3#5 6
50 2 0.166 15 3#6 3#6 6
50 2 0.166 15 3#6 3#7 6
50 2 0.166 15 3#6 3#8 6
* The relative stiffness of the rotational restraint is based on 6m beam length.

CHAPTER 5 DEVELOPMENT OF A SIMPLIFIED METHOD FOR ANALYSIS OF
AXIALLY AND ROTATIONALLY RESTRAINED REINFORCED CONCRETE BEAMS
IN FIRE
175
Only half of a beam is analysed in the simplified model due to symmetry in geometry
and loading. The mesh size of the beam segment and the cross-section discretisation
of the beam section are shown in Figure 5.21 and are kept the same for all beams.
Figure 5.21: Mesh density used in the simplified method for validation study
Figure 5.22 compares the simplified method calculation results with numerical
simulation results for beam deflection-fire exposure time and beam axial force-fire
exposure time relationships under different end rotational stiffness. Figure 5.23
compares beam bending resistance time – rotational stiffness and beam ultimate
resistance time – rotational stiffness relationships between simulation results and
simplified method calculation results. It can be seen that in all cases, the full range
behaviour of restrained RC beams in fire can be predicted by the proposed simplified
method. Overall, in flexural action, the proposed model tends to underestimate the
beam deflection and the results diverge more from the numerical results in beams
with low to moderate rotational stiffness levels. This can be attributed to the
assumptions made to approximate the beam’s deflection profile and the end moment
MA by interpolation between the cases of zero and complete end rotation restraint. As
regards to beams with kr,B≤kr≤kr,D, the values of kr,B, tBR,B, δBR,B,max and kr,E were
found to be 0.029, 198min, 535mm and 0.075, respectively. As shown in Figure 5.22
and 5.23, the analytical model produces conservative predictions of the additional
bending resistance provided by the beam ends after bending failure of the mid-span.
L
Li=1/30 L Li=1/60 L
L/4
Li=1/60 L
L/2 L/4 A
A
(a) Beam segment discretisation
10×16 Elements
Section A-A
(b) Cross-section discretisation

CHAPTER 5 DEVELOPMENT OF A SIMPLIFIED METHOD FOR ANALYSIS OF
AXIALLY AND ROTATIONALLY RESTRAINED REINFORCED CONCRETE BEAMS
IN FIRE
176
This is a direct result of the conservative way the value of tBR,B is estimated, in which
the applied load is assumed to be purely resisted by the beam end.
In general, prediction of the two key quantities needed for designing RC beams in
fire under the combined effect of the bending-compression, namely the fire-induced
axial force and the bending resistance time, agree well with the simulation results.
(a) Mid-span deflection-fire exposure time
(b) Axial force-fire exposure time
Figure 5.22: Comparison between simplified method results and ABAQUS
results for different end rotational stiffness ratios (kr)
-700
-600
-500
-400
-300
-200
-100
0
0 50 100 150 200 250 300 350 400 450
Def
lect
ion
(mm
)
Time (min)
kr=0.013, ABAQUS kr=0.013, simplified kr=0.029, ABAQUS
kr=0.029, simplified kr=0.045, ABAQUS kr=0.045, simplified
kr=0.064, ABAQUS kr=0.064, simplified kr=0.125, ABAQUS
kr=0.125, simplified kr=1.85, ABAQUS kr=1.85, simplified
LR=35% k
a=0.166
L=6m
-700
-600
-500
-400
-300
-200
-100
0
100
200
300
0 50 100 150 200 250 300 350 400 450
Axi
al f
orc
e (k
N)
Time (min)
kr=0.013, ABAQUSkr=0.013, simplifiedkr=0.029, ABAQUSkr=0.029, simplifiedkr=0.045, ABAQUSkr=0.045, simplifiedkr=0.064, ABAQUSkr=0.064, simplifiedkr=0.125, ABAQUSkr=0.125, simplifiedkr=2, ABAQUSkr=2, simplified
LR=35% k
a=0.166
L=6m

CHAPTER 5 DEVELOPMENT OF A SIMPLIFIED METHOD FOR ANALYSIS OF
AXIALLY AND ROTATIONALLY RESTRAINED REINFORCED CONCRETE BEAMS
IN FIRE
177
Figure 5.23: Comparison between simplified method results and ABAQUS
results for the effect of rotational stiffness on beam fire resistance
In catenary action, the comparisons indicate that the proposed model is able to
provide reliable predictions of the maximum catenary force, beam deflection and
ultimate resistance time. In the simplified model, only beams with kr≥kr,E are
considered to be able to develop catenary action. The numerical results show that the
beam with kr=0.064 develops catenary action. However, because the value of kr,E
predicted by the simplified method is 0.075, catenary action is not considered for the
beam with kr=0.064 using the simplified method. Values of the catenary force and
deflection obtained from the simplified method are higher than the simulation results.
This is mainly because of the number of simplifications adopted to assess the rather
complex behaviour of the beam in catenary action after fracture of the bottom
reinforcing bars at the mid-span and severe crushing of concrete at ends. For
instance, in the proposed model, the centre of rotation of the beam ends is assumed to
be at the top reinforcement level at the end sections. In the numerical simulations,
however, the centre of the plastic hinge, where rotation of the beam ends is
concentrated, is at a distance about ½ to ¾ of the beam depth from the end sections
(Figure 5.18(a)). However, further refinement would make the simplified method
much more complicated. In any case, the simplified method produces results which
are on the safe side, in terms of both beam bending resistance time and beam
ultimate resistance time.
Figures 5.24 to 5.28 compare the simplified calculation results with numerical
simulation results for beams with different (i) load ratios, (ii) axial restraints, (iii)
050
100150200250300350400450500
0 0.05 0.1 0.15 0.2 0.25 0.3
Fire
res
ista
nce
(m
in)
Rotational stiffness ratio, (kr)
Flexural action resistance (ABAQUS) Total resistance (ABAQUS)
Flexural action resistance (simplified) Total resistance (simplified)
LR=35% , ka=0.166 , L=6m

CHAPTER 5 DEVELOPMENT OF A SIMPLIFIED METHOD FOR ANALYSIS OF
AXIALLY AND ROTATIONALLY RESTRAINED REINFORCED CONCRETE BEAMS
IN FIRE
178
span-to-depth ratios and (iv) bottom and top reinforcement amounts. It is verified
that the proposed model in this chapter is capable of capturing the essential features
of the beam behaviour with satisfactory accuracy in all cases.
5.12 Effects of Changing Different Beam Parameters
The following paragraphs briefly present the effects of additional parameters used for
the validation study on the behaviour of RC beams in fire. The relative rotational
stiffness of the beam was assumed to be kr=2 in all cases. As a result, bending failure
mode in all cases was observed to be controlled by hogging moment failure due to
concrete crushing in compression at beam ends. Table 5.1 presents all the
investigated parameters.
Figure 5.24 shows the effects of load ratio on the fire response of beams. As
expected, the decrease in the load ratio increases bending resistance time of the
beam. In catenary action, the higher the load ratio, the higher the beam deflection and
the higher the tensile catenary force. At a higher load ratio, because strains in the top
bars at beam ends are already higher immediately after development of catenary
action and because of higher catenary force, the fire resistance provided by catenary
action (i.e. the increase from the bending resistance time to the ultimate resistance
time) is lower. The results in Figure 5.24 hence suggest that there is a higher scope
for the development of catenary action when the applied load ratio is at low to
moderate levels.
(a) Mid-span deflection-fire exposure time
-700
-600
-500
-400
-300
-200
-100
0
0 50 100 150 200 250 300 350 400
Def
lect
ion
(mm
)
Time (min)
LR=35%, ABAQUS LR=35%, simplified LR=40%, ABAQUS
LR=40%, simplified LR=45%, ABAQUS LR=45%, simplified
LR=50%, ABAQUS LR=50%, simplified LR=55%, ABAQUS
LR=55%, simplified LR=60%, ABAQUS LR=60%, simplified
kr=2
ka=0.166
L=6m

CHAPTER 5 DEVELOPMENT OF A SIMPLIFIED METHOD FOR ANALYSIS OF
AXIALLY AND ROTATIONALLY RESTRAINED REINFORCED CONCRETE BEAMS
IN FIRE
179
(b) Axial force-fire exposure time
Figure 5.24: Comparison between simplified method results and ABAQUS
results for different load ratios (LR)
Figure 5.25 shows the effects of the axial restraint levels. In flexural bending, the
higher the axial restraint (ka), the higher the maximum axial compressive force due to
restrained thermal expansion and the lower the bending resistance time. A reduction
in the bending resistance time with increasing ka is because of the higher
compressive force in the beam that causes concrete at beam ends to crush in
compression earlier. In catenary action, the beam with high axial restraint stiffness
has a higher tensile catenary force. Because the load ratio is the same, a smaller mid-
span deflection is required for a beam with higher ka to satisfy the equilibrium
between the external and internal moments. A beam with higher catenary force due
to higher ka has a lower ultimate resistance time. Further increase in ka above 0.166
does not cause a significant influence on the ultimate resistance time.
-700
-600
-500
-400
-300
-200
-100
0
100
200
300
400
0 50 100 150 200 250 300 350 400 450
Axi
al f
orc
e (k
N) Time (min)
LR=35%, ABAQUS LR=35%, simplified LR=40%, ABAQUS
LR=40%, simplified LR=45%, ABAQUS LR=45%, simplified
LR=50%, ABAQUS LR=50%, simplified LR=55%, ABAQUS
LR=55%, simplified LR=60%, ABAQUS LR=60%, simplified
kr=2
ka=0.166
L=6m
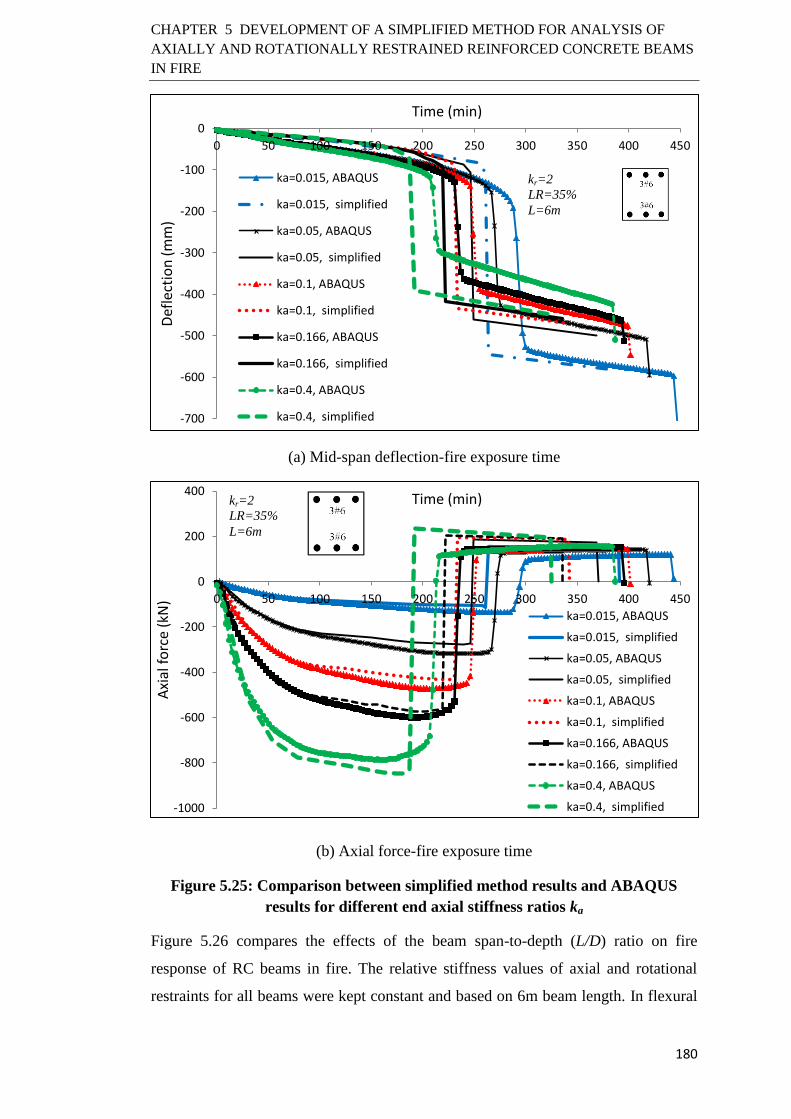
CHAPTER 5 DEVELOPMENT OF A SIMPLIFIED METHOD FOR ANALYSIS OF
AXIALLY AND ROTATIONALLY RESTRAINED REINFORCED CONCRETE BEAMS
IN FIRE
180
(a) Mid-span deflection-fire exposure time
(b) Axial force-fire exposure time
Figure 5.25: Comparison between simplified method results and ABAQUS
results for different end axial stiffness ratios ka
Figure 5.26 compares the effects of the beam span-to-depth (L/D) ratio on fire
response of RC beams in fire. The relative stiffness values of axial and rotational
restraints for all beams were kept constant and based on 6m beam length. In flexural
-700
-600
-500
-400
-300
-200
-100
0
0 50 100 150 200 250 300 350 400 450
Def
lect
ion
(mm
)
Time (min)
ka=0.015, ABAQUS
ka=0.015, simplified
ka=0.05, ABAQUS
ka=0.05, simplified
ka=0.1, ABAQUS
ka=0.1, simplified
ka=0.166, ABAQUS
ka=0.166, simplified
ka=0.4, ABAQUS
ka=0.4, simplified
kr=2
LR=35%
L=6m
-1000
-800
-600
-400
-200
0
200
400
0 50 100 150 200 250 300 350 400 450
Axi
al f
orc
e (k
N)
Time (min)
ka=0.015, ABAQUS
ka=0.015, simplified
ka=0.05, ABAQUS
ka=0.05, simplified
ka=0.1, ABAQUS
ka=0.1, simplified
ka=0.166, ABAQUS
ka=0.166, simplified
ka=0.4, ABAQUS
ka=0.4, simplified
kr=2
LR=35%
L=6m

CHAPTER 5 DEVELOPMENT OF A SIMPLIFIED METHOD FOR ANALYSIS OF
AXIALLY AND ROTATIONALLY RESTRAINED REINFORCED CONCRETE BEAMS
IN FIRE
181
action, because of larger rate of thermal expansion, longer beams have higher axial
compressive force. Although the applied load on the beam was adjusted to keep a
constant load ratio of 50%, longer beams have lower bending resistance times. The
reason for this is that identical boundary conditions were applied to the beam ends
irrespective of the span length. When the rotational stiffness is the same, longer
beams produce lager deflections and P-Δ effects, thus lowering bending resistance
time. In catenary action, since deflection of the beam with higher L/D ratio is larger
and the externally applied bending moment is the same for different L/D ratios,
smaller stresses develop in the top reinforcing bars to achieve force equilibrium.
Therefore, the catenary action phase is maintained to a longer fire exposure time for
beams with longer spans. Top bars at the ends of beams with L/D of 10 and 12.5
fractured immediately following bending failure of the beam, leaving no continuous
path of catenary force to develop. To conclude, there would be very limited scope for
the catenary action to develop in beams with low L/D ratios.
(a) Mid-span deflection-fire exposure time
-600
-500
-400
-300
-200
-100
0
0 50 100 150 200 250 300
Def
lect
ion
(mm
)
Time (min)
L/D=10, ABAQUS
L/D=10, simplified
L/D=12.5, ABAQUS
L/D=12.5, simplified
L/D=15, ABAQUS
L/D=15, simplified
L/D=17.5, ABAQUS
L/D=17.5, simplified
kr=2
ka=0.166
LR=50%
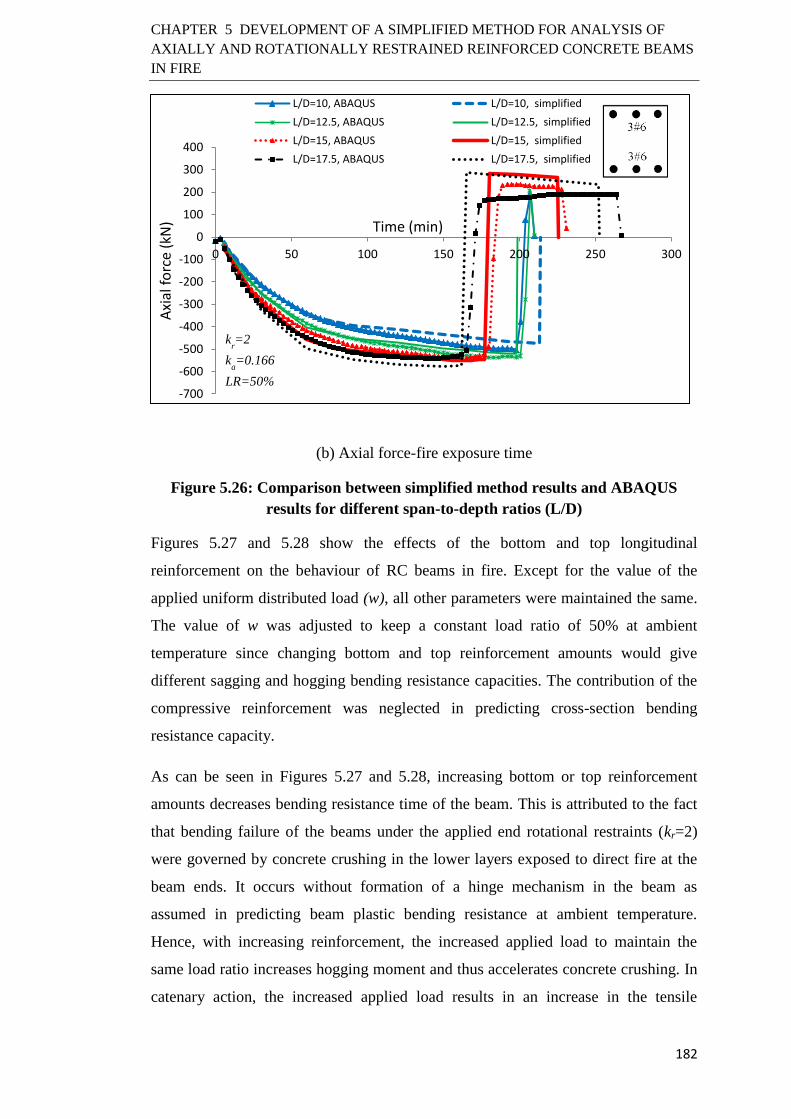
CHAPTER 5 DEVELOPMENT OF A SIMPLIFIED METHOD FOR ANALYSIS OF
AXIALLY AND ROTATIONALLY RESTRAINED REINFORCED CONCRETE BEAMS
IN FIRE
182
(b) Axial force-fire exposure time
Figure 5.26: Comparison between simplified method results and ABAQUS
results for different span-to-depth ratios (L/D)
Figures 5.27 and 5.28 show the effects of the bottom and top longitudinal
reinforcement on the behaviour of RC beams in fire. Except for the value of the
applied uniform distributed load (w), all other parameters were maintained the same.
The value of w was adjusted to keep a constant load ratio of 50% at ambient
temperature since changing bottom and top reinforcement amounts would give
different sagging and hogging bending resistance capacities. The contribution of the
compressive reinforcement was neglected in predicting cross-section bending
resistance capacity.
As can be seen in Figures 5.27 and 5.28, increasing bottom or top reinforcement
amounts decreases bending resistance time of the beam. This is attributed to the fact
that bending failure of the beams under the applied end rotational restraints (kr=2)
were governed by concrete crushing in the lower layers exposed to direct fire at the
beam ends. It occurs without formation of a hinge mechanism in the beam as
assumed in predicting beam plastic bending resistance at ambient temperature.
Hence, with increasing reinforcement, the increased applied load to maintain the
same load ratio increases hogging moment and thus accelerates concrete crushing. In
catenary action, the increased applied load results in an increase in the tensile
-700
-600
-500
-400
-300
-200
-100
0
100
200
300
400
0 50 100 150 200 250 300
Axi
al f
orc
e (k
N) Time (min)
L/D=10, ABAQUS L/D=10, simplified
L/D=12.5, ABAQUS L/D=12.5, simplified
L/D=15, ABAQUS L/D=15, simplified
L/D=17.5, ABAQUS L/D=17.5, simplified
kr=2
ka=0.166
LR=50%
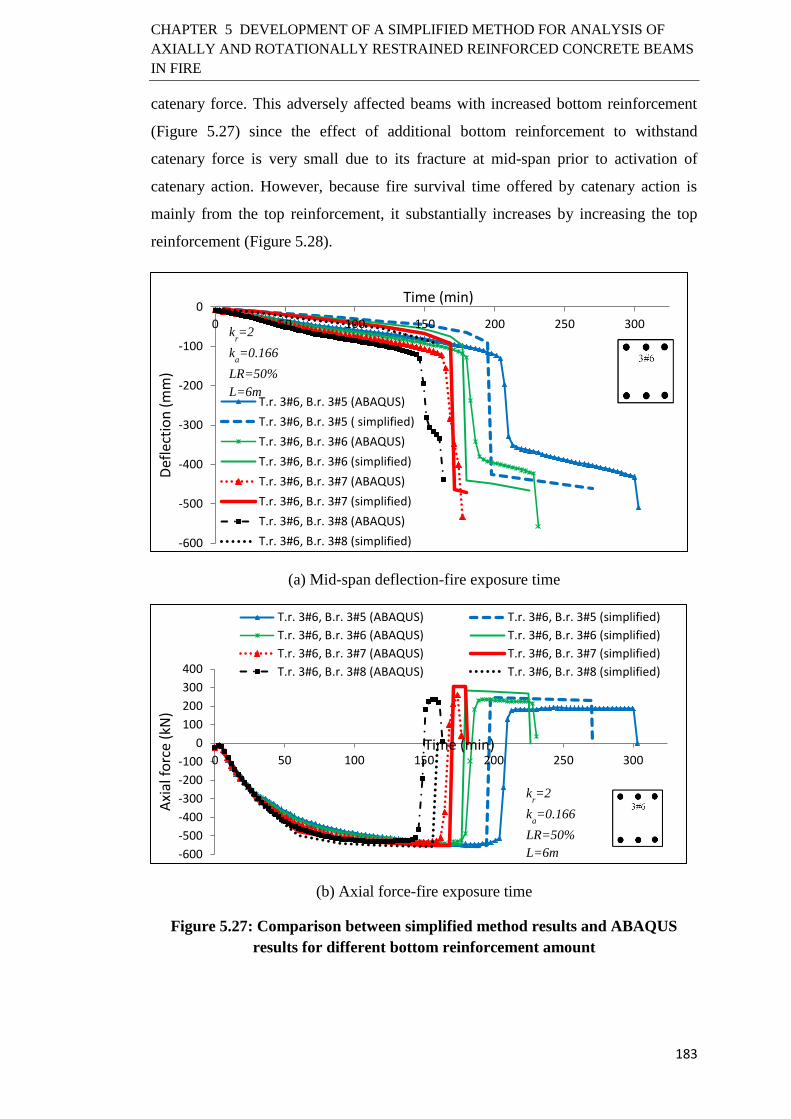
CHAPTER 5 DEVELOPMENT OF A SIMPLIFIED METHOD FOR ANALYSIS OF
AXIALLY AND ROTATIONALLY RESTRAINED REINFORCED CONCRETE BEAMS
IN FIRE
183
catenary force. This adversely affected beams with increased bottom reinforcement
(Figure 5.27) since the effect of additional bottom reinforcement to withstand
catenary force is very small due to its fracture at mid-span prior to activation of
catenary action. However, because fire survival time offered by catenary action is
mainly from the top reinforcement, it substantially increases by increasing the top
reinforcement (Figure 5.28).
(a) Mid-span deflection-fire exposure time
(b) Axial force-fire exposure time
Figure 5.27: Comparison between simplified method results and ABAQUS
results for different bottom reinforcement amount
-600
-500
-400
-300
-200
-100
0
0 50 100 150 200 250 300
Def
lect
ion
(mm
)
Time (min)
T.r. 3#6, B.r. 3#5 (ABAQUS)
T.r. 3#6, B.r. 3#5 ( simplified)
T.r. 3#6, B.r. 3#6 (ABAQUS)
T.r. 3#6, B.r. 3#6 (simplified)
T.r. 3#6, B.r. 3#7 (ABAQUS)
T.r. 3#6, B.r. 3#7 (simplified)
T.r. 3#6, B.r. 3#8 (ABAQUS)
T.r. 3#6, B.r. 3#8 (simplified)
kr=2
ka=0.166
LR=50% L=6m
-600
-500
-400
-300
-200
-100
0
100
200
300
400
0 50 100 150 200 250 300
Axi
al f
orc
e (k
N)
Time (min)
T.r. 3#6, B.r. 3#5 (ABAQUS) T.r. 3#6, B.r. 3#5 (simplified)
T.r. 3#6, B.r. 3#6 (ABAQUS) T.r. 3#6, B.r. 3#6 (simplified)
T.r. 3#6, B.r. 3#7 (ABAQUS) T.r. 3#6, B.r. 3#7 (simplified)
T.r. 3#6, B.r. 3#8 (ABAQUS) T.r. 3#6, B.r. 3#8 (simplified)
kr=2
ka=0.166
LR=50% L=6m

CHAPTER 5 DEVELOPMENT OF A SIMPLIFIED METHOD FOR ANALYSIS OF
AXIALLY AND ROTATIONALLY RESTRAINED REINFORCED CONCRETE BEAMS
IN FIRE
184
(a) Mid-span deflection-fire exposure time
(b) Axial force-fire exposure time
Figure 5.28: Comparison between simplified method results and ABAQUS
results for different top reinforcement amount
5.13 Conclusions
This chapter has presented a simplified calculation method aimed at capturing
structural behaviour of axially and rotationally restrained RC beams in fire,
considering the development of catenary action at large deflections. This method is
based on sectional analysis and uses the fundamental principles of equilibrium and
compatibility conditions.
The main assumption in the simplified analysis is the beam’s deflection profile. It
depends on the load-carrying mechanism action and end rotational restraint stiffness.
-600
-500
-400
-300
-200
-100
0
0 50 100 150 200 250 300 350
Def
lect
ion
(mm
)
Time (min)
T.r. 3#5, B.r. 3#6 (ABAQUS)
T.r. 3#5, B.r. 3#6 (simplified)
T.r. 3#6, B.r. 3#6 (ABAQUS)
T.r. 3#6, B.r. 3#6 (simplified)
T.r. 3#7, B.r. 3#6 (ABAQUS)
T.r. 3#7, B.r. 3#6 (simplified)
T.r. 3#8, B.r. 3#6 (ABAQUS)
T.r. 3#8, B.r. 3#6 (simplified)
kr=2
ka=0.166
LR=50% L=6m
-700
-600
-500
-400
-300
-200
-100
0
100
200
300
400
500
0 50 100 150 200 250 300 350
Axi
al f
orc
e (k
N)
Time (min) T.r. 3#5, B.r. 3#6 (ABAQUS)T.r. 3#5, B.r. 3#6 (simplified)T.r. 3#6, B.r. 3#6 (ABAQUS)T.r. 3#6, B.r. 3#6 (simplified)T.r. 3#7, B.r. 3#6 (ABAQUS)T.r. 3#7, B.r. 3#6 (simplified)T.r. 3#8, B.r. 3#6 (ABAQUS)T.r. 3#8, B.r. 3#6 (simplified)
kr=∞
ka=0.166
LR=50% L=6m

CHAPTER 5 DEVELOPMENT OF A SIMPLIFIED METHOD FOR ANALYSIS OF
AXIALLY AND ROTATIONALLY RESTRAINED REINFORCED CONCRETE BEAMS
IN FIRE
185
In flexural action, the fourth order polynomial deflection profiles that satisfy the end
boundary conditions of beams under uniformly distributed load may be assumed for
zero and fixed end rotational restraints. The deflection profile of beams with flexible
end rotational restraint is approximated by exponential interpolation between that of
the beam with zero rotational restraint and that of the beam with complete rotational
restraint. In catenary action, the average of the following three deflection profiles
was used: (i) the deflection profile of the beam under uniformly distributed load
(UDL), (ii) the deflection profile of the beam under a concentrated point load (CPL)
at the mid-span and (iii) linear profile.
This chapter provides simplified and reliable formulations for analysing the period of
further bending resistance of the beam by the end hogging moment resistance after
the mid-span has reached its sagging moment resistance. Whether further resistance
is achieved or not depends on the applied load and end hogging moment resistance.
Identification of the critical rotational stiffness (kr,B in Figure 5.2) at which this
further bending resistance is the highest is important for analysing the beam
behaviour in bending under different rotational stiffness levels.
The proposed model predicts quite accurately the beam bending failure governed by
crushing of concrete in compression. This is also useful for considering the
development of catenary action as the numerical results in Chapter 4 have revealed
that effective catenary action can develop following only this beam bending failure.
A simple and reliable approach was suggested in this chapter to predict the lowest
rotational stiffness level (kr,E in Figure 5.2) that leads this bending failure mode to be
reached.
In catenary action, the following assumptions are made in the proposed model:
The beam is rotationally free at the ends.
The location of the vertical and horizontal supports at the ends is at the same
location of the top longitudinal reinforcement.
The bottom reinforcing bars along the beam is not considered in the sectional
analysis.
A strain profile for the top reinforcement based on the maximum steel strain
of 0.05 is assumed to help to predict the ultimate resistance time of the beam

CHAPTER 5 DEVELOPMENT OF A SIMPLIFIED METHOD FOR ANALYSIS OF
AXIALLY AND ROTATIONALLY RESTRAINED REINFORCED CONCRETE BEAMS
IN FIRE
186
in catenary action, which is at the time when fracture of the top
reinforcement at beam ends is reached.
The proposed model in this chapter was validated against the numerical results of
Chapter 4. Additional results of numerical results were presented in this chapter to
provide more validation examples. The results of validation studies have confirmed
that the proposed model is generally applicable for predicting the full beam
deflection-fire exposure time and beam axial force-fire exposure time responses in
flexural bending action and in catenary action with good accuracy. Importantly, the
model is able to capture the bending resistance and ultimate resistance times with
satisfactory accuracy and reliability. This proposed calculation method can
potentially be applied, in design, to beams within RC frame systems provided
information on the end boundary restraints is available.
CHAPTER 6 PERFORMANCE OF REINFORCED CONCRETE FRAMES UNDER
FIRE CONDITIONS
187
CHAPTER 6
PERFORMANCE OF REINFORCED CONCRETE
FRAMES UNDER FIRE CONDITIONS
6.1 Introduction
Results of the numerical study on beam-column sub-frames presented in Chapter 4 of
this thesis have provided valuable insights into the fire response of restrained RC
beams. They have revealed considerable effects of boundary restraints on RC beam
behaviour and failure mechanisms. A beam undergoing large deflections in fire after
flexural bending failure may develop catenary action if axial restraints are present.
The focus of that study was only on the beam behaviour. In this chapter, the
numerical study, using the ABAQUS model developed in Chapter 3, is extended to
consider structural interactions between beams and columns within an RC frame
structure. Detailed investigations will be performed on two-story three-span planar
RC frames under different fire scenarios, loading levels and column cross-section
sizes.
6.2 Simulation Parameters
Figure 6.1 shows the RC frame structure used in the parametric study. The bases of
the columns on the ground floor are assumed to be totally fixed. Uniformly
distributed load (w) is applied to the beams. Additional loads from upper storeys are
represented by applying concentrated loads (P) at the top of the upper columns. The
clear height of all columns and the clear span of all beams are 3300 mm and 6000
mm respectively and were kept the same in all parametric study cases.

CHAPTER 6 PERFORMANCE OF REINFORCED CONCRETE FRAMES UNDER
FIRE CONDITIONS
188
Figure 6.1: Dimensions, loading and boundary conditions of the simulation
frame
All the beams have identical cross-sectional sizes and reinforcement layouts, and so
have the columns. Figure 6.2 shows the beam cross-section dimensions and
reinforcement detail. The beam and column dimensions and their transverse
reinforcement arrangements were chosen to avoid shear failure. The column
longitudinal reinforcement arrangement is presented in the following paragraphs.
The beam cross-section detail 1, shown in Figure 6.2(b), is the same as for RC beams
in Chapter 4 to facilitate direct comparison between individual beams and beams in
frames. In Chapter 4, it was shown that for beams with low axial restraint, when
rotational stiffness at one end of the beam is much higher than that at the other end,
tensile thermal stresses developed in the beam cross-section could cause premature
fracture of the cooler top middle bars at the beam end with higher rotational stiffness.
It was found that this detrimental effect may be minimised by positioning the top
bars close to the corners of the beam in hogging moment regions. Such top
reinforcement detailing, illustrated in Figure 6.2(c), was also investigated in some
cases for the edge bay in fire. In an edge bay, the rotational stiffness at the beam end
connected to an internal bay is much higher than that connected to an edge column.
Furthermore, a beam located in an edge bay normally has low axial restraint. The
reinforcement detail 2 in Figure 6.2(c) replaces the three top bars in detail 1 with two
corner bars, but keeping the total top reinforcement area and all other conditions the
same.
w
w w w
w w
3300 mm
3300 mm
6000 mm 6000 mm 6000 mm
C1 C2 C3 C4
C5 C6 C7 C8
B1 B2 B3
B4 B5 B6
P P P P

CHAPTER 6 PERFORMANCE OF REINFORCED CONCRETE FRAMES UNDER
FIRE CONDITIONS
189
(a) Transverse reinforcement in beams, columns and beam-column joints
Figure 6.2: Transvers reinforcement and beam cross-sectional details
Three fire scenarios were considered, namely fire scenarios 1, 2 and 3, as depicted in
Figure 6.3. Fire scenarios 1 and 2 represent situations where fire is confined to either
the edge or central bay on the ground floor, respectively. Fire scenario 3 represents a
fire taking place in the whole ground floor of the frame. Figure 6.3 also indicates the
beam and column faces exposed to fire in these different fire scenarios, based on
consideration of likely fire barriers provided by the adjacent compartment wall and
floor.
All dimensions in mm
1500
#3@75
#3@125
#3@75 400
400
2400
a
a
b
b
a
a #3@100 #3@150 #3@100
1500 3000
400
300
2#6
Section a-a
3#6 50
Section b-b
400
300
400
300
2#6
Section a-a
2ϕ23.3mm
As=855mm
3#6
Section b-b
50
2ϕ23.3mm
As=855mm
400
300
(b) Beam cross-section detail 1 (c) Beam cross-section detail 2
3#6
As=855mm 3#6
As=855mm
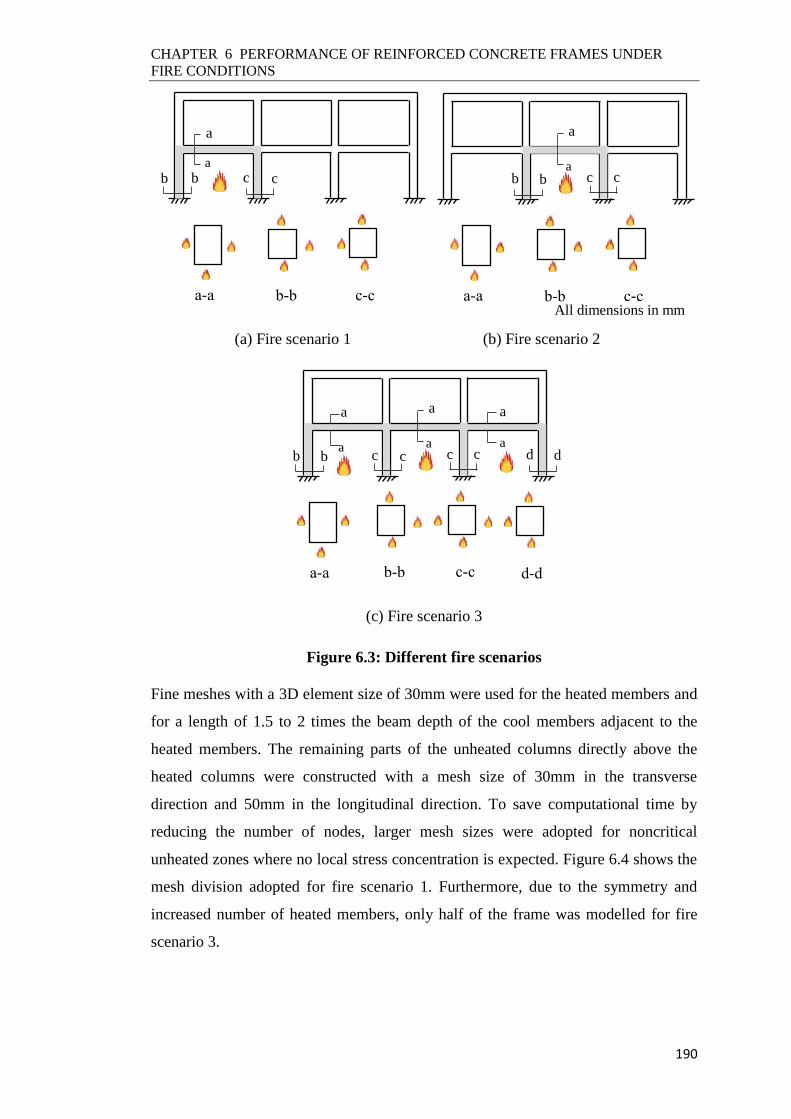
CHAPTER 6 PERFORMANCE OF REINFORCED CONCRETE FRAMES UNDER
FIRE CONDITIONS
190
All dimensions in mm
(a) Fire scenario 1 (b) Fire scenario 2
(c) Fire scenario 3
Figure 6.3: Different fire scenarios
Fine meshes with a 3D element size of 30mm were used for the heated members and
for a length of 1.5 to 2 times the beam depth of the cool members adjacent to the
heated members. The remaining parts of the unheated columns directly above the
heated columns were constructed with a mesh size of 30mm in the transverse
direction and 50mm in the longitudinal direction. To save computational time by
reducing the number of nodes, larger mesh sizes were adopted for noncritical
unheated zones where no local stress concentration is expected. Figure 6.4 shows the
mesh division adopted for fire scenario 1. Furthermore, due to the symmetry and
increased number of heated members, only half of the frame was modelled for fire
scenario 3.
c c b b a
a
a-a b-b c-c
b b c c a
a
a-a b-b c-c
a
a
a
a
c c c c a
a
a-a b-b d-d
b b d d
c-c
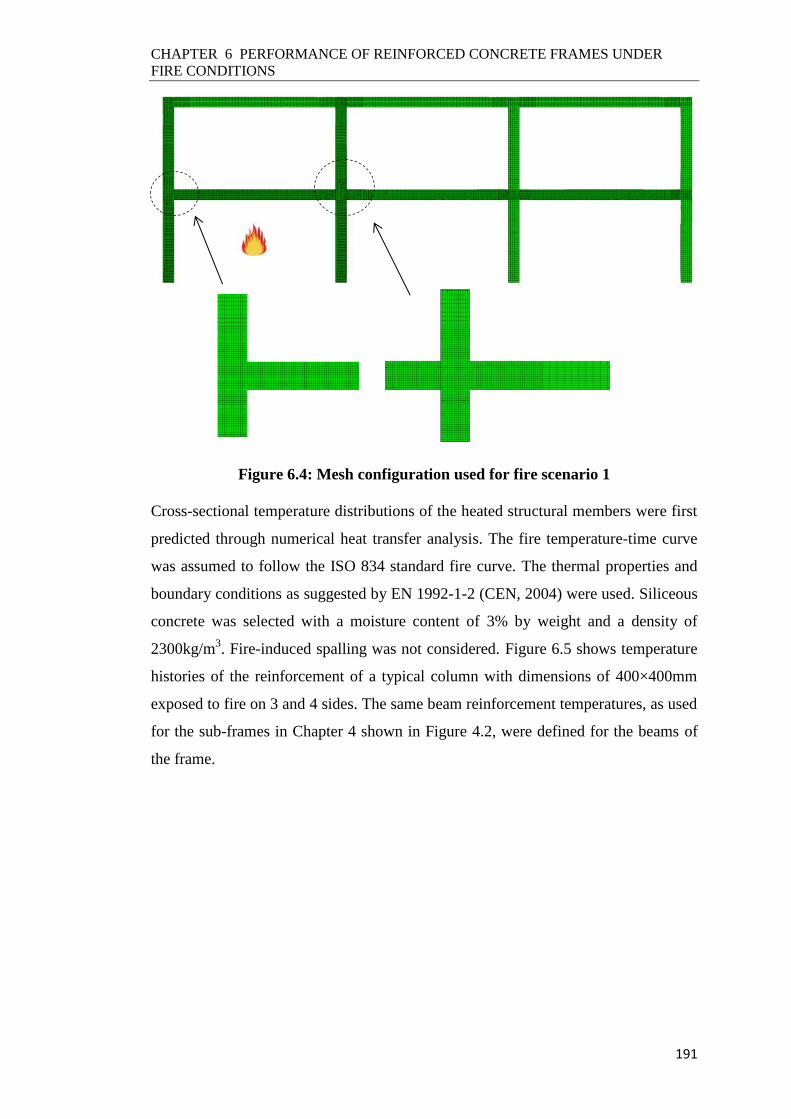
CHAPTER 6 PERFORMANCE OF REINFORCED CONCRETE FRAMES UNDER
FIRE CONDITIONS
191
Figure 6.4: Mesh configuration used for fire scenario 1
Cross-sectional temperature distributions of the heated structural members were first
predicted through numerical heat transfer analysis. The fire temperature-time curve
was assumed to follow the ISO 834 standard fire curve. The thermal properties and
boundary conditions as suggested by EN 1992-1-2 (CEN, 2004) were used. Siliceous
concrete was selected with a moisture content of 3% by weight and a density of
2300kg/m3. Fire-induced spalling was not considered. Figure 6.5 shows temperature
histories of the reinforcement of a typical column with dimensions of 400×400mm
exposed to fire on 3 and 4 sides. The same beam reinforcement temperatures, as used
for the sub-frames in Chapter 4 shown in Figure 4.2, were defined for the beams of
the frame.

CHAPTER 6 PERFORMANCE OF REINFORCED CONCRETE FRAMES UNDER
FIRE CONDITIONS
192
(a) Fire on 3 sides (b) Fire on 4 sides
Figure 6.5: Selective temperature-time histories of column reinforcement, based
on numerical heat transfer analysis (Column dimensions: 400×400mm)
The ambient temperature compressive cylinder strength and modulus of elasticity of
concrete were 30 MPa and 18000 MPa, respectively. The ambient temperature yield
strength and modulus of elasticity of hot-rolled steel reinforcement were 453 MPa
and 200 GPa, respectively. The stress-strain relationships and reduction factors for
concrete under compression and steel reinforcement at elevated temperatures were in
accordance with EN 1992-1-2 (CEN, 2004) presented in Appendix 4. For concrete
under tension, the same models as described in section 3.3.1 in Chapter 3 were used.
According to EN 1992-1-2 for class A reinforcement, the limiting strain (εt,T) at
yield strength and the ultimate strain (εu,T) of steel were assumed to be 5% and 10%,
respectively.
Transient modelling was carried out: the mechanical loads on the RC frame were
applied first and kept constant and then the structural temperatures were increased
until structural failure, as indicated by inability of the frame to maintain the applied
mechanical loads. In the structural analysis, out-of-plane displacements of the frame
0
200
400
600
800
1000
1200
0 75 150 225 300 375 450
Tem
per
atu
re (
oC
)
Time (min)
1 2 3 45 6 7 8
0
200
400
600
800
1000
1200
1400
0 75 150 225 300 375 450
Tem
per
atu
re (
oC
)
Time (min)
1 2 3
2
1
1
2 1
2
1 2 3 3 3
7
2
1
1
3 4
5
4 3 7 6 8

CHAPTER 6 PERFORMANCE OF REINFORCED CONCRETE FRAMES UNDER
FIRE CONDITIONS
193
at the beam-column joint panel zones were not allowed and lateral torsional buckling
of the beams was prevented. Based on the lowest natural period of the investigated
frames, a duration of 60min heating was scaled to 4s for explicit dynamic analysis.
6.3 Parametric Study Cases
For each fire scenario shown in Figure 6.3, the parametric study examined the
influence of changing column cross-section size and level of the applied load. Table
6.1 lists all the simulation cases, consisting of three column cross-section dimensions
of 300×300mm, 400×400mm and 500×500mm, two beam reinforcement details
(details 1 and 2 shown in Figure 6.2(b) and 6.2(c)) and two levels of loading (30%
load ratio (LR) and 50% load ratio on all beams and columns). Figure 6.6 shows the
column longitudinal reinforcement details for the three different cross-section sizes.
They were selected such that the same reinforcement ratio of 1.7% was maintained in
each of the three column cross-sections.
Table 6.1: Parametric study cases and summary of main results
Frame Fire
Case
Beam
cross-
section
detail
Beam
load
ratio
(%)
Column
load
ratio
(%)
Column
size
(mm)
Beam
bending
failure
time
(min)
Frame
failure
time
(min)
Frame
failure type
F1 1 1 30 30 300 -- 171 Column-led
F2 1 1 30 30 400 216 216 Beam-led
F3 1 1 30 30 500 254 254 Beam-led
F4 1 1 50 50 300 57 57 Beam-led
F5 1 2 50 50 300 -- 78 Column-led
F6 1 1 50 50 400 76 76 Beam-led
F7 1 2 50 50 400 -- 101 Column-led
F8 1 1 50 50 500 99 99 Beam-led
F9 1 2 50 50 500 -- 123 Column-led
F10 2 1 30 30 300 -- 204 Column-led
F11 2 1 30 30 400 259 362* Column-led
F12 2 1 30 30 500 231 384* Beam-led
F13 2 1 50 50 300 -- 94 Column-led
F14 2 1 50 50 400 -- 120 Column-led
F15 2 1 50 50 500 146 146 Beam-led
F16 3 1 30 30 300 -- 139 Column-led
F17 3 1 30 30 400 187 187 Beam-led
F18 3 1 30 30 500 229 229 Beam-led
F19 3 1 50 50 300 51 51 Beam-led
F20 3 1 50 50 400 73 73 Beam-led
F21 3 1 50 50 500 86 86 Beam-led
* Catenary action developed in the fire exposed beam
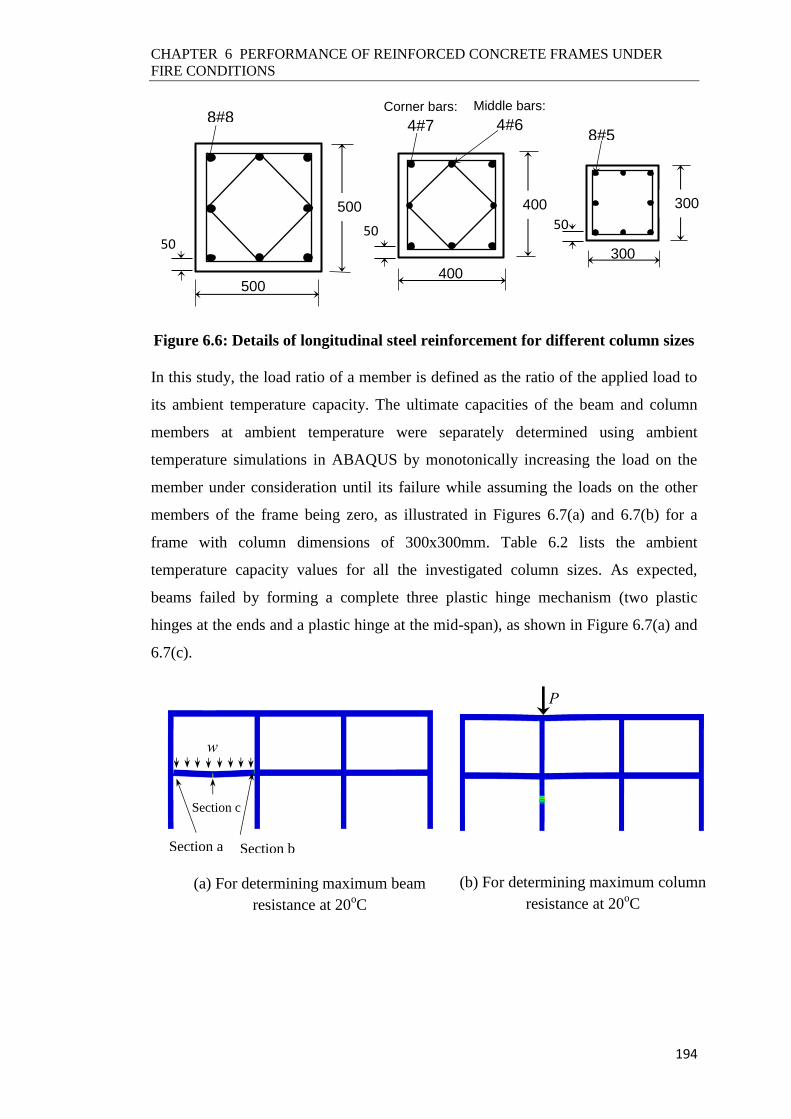
CHAPTER 6 PERFORMANCE OF REINFORCED CONCRETE FRAMES UNDER
FIRE CONDITIONS
194
Figure 6.6: Details of longitudinal steel reinforcement for different column sizes
In this study, the load ratio of a member is defined as the ratio of the applied load to
its ambient temperature capacity. The ultimate capacities of the beam and column
members at ambient temperature were separately determined using ambient
temperature simulations in ABAQUS by monotonically increasing the load on the
member under consideration until its failure while assuming the loads on the other
members of the frame being zero, as illustrated in Figures 6.7(a) and 6.7(b) for a
frame with column dimensions of 300x300mm. Table 6.2 lists the ambient
temperature capacity values for all the investigated column sizes. As expected,
beams failed by forming a complete three plastic hinge mechanism (two plastic
hinges at the ends and a plastic hinge at the mid-span), as shown in Figure 6.7(a) and
6.7(c).
500
500
50
8#8
400
400
50
Corner bars:
4#7
Middle bars:
4#6
300
300
50
8#5
(a) For determining maximum beam
resistance at 20oC
(b) For determining maximum column
resistance at 20oC
w
Section a Section b
Section c
P
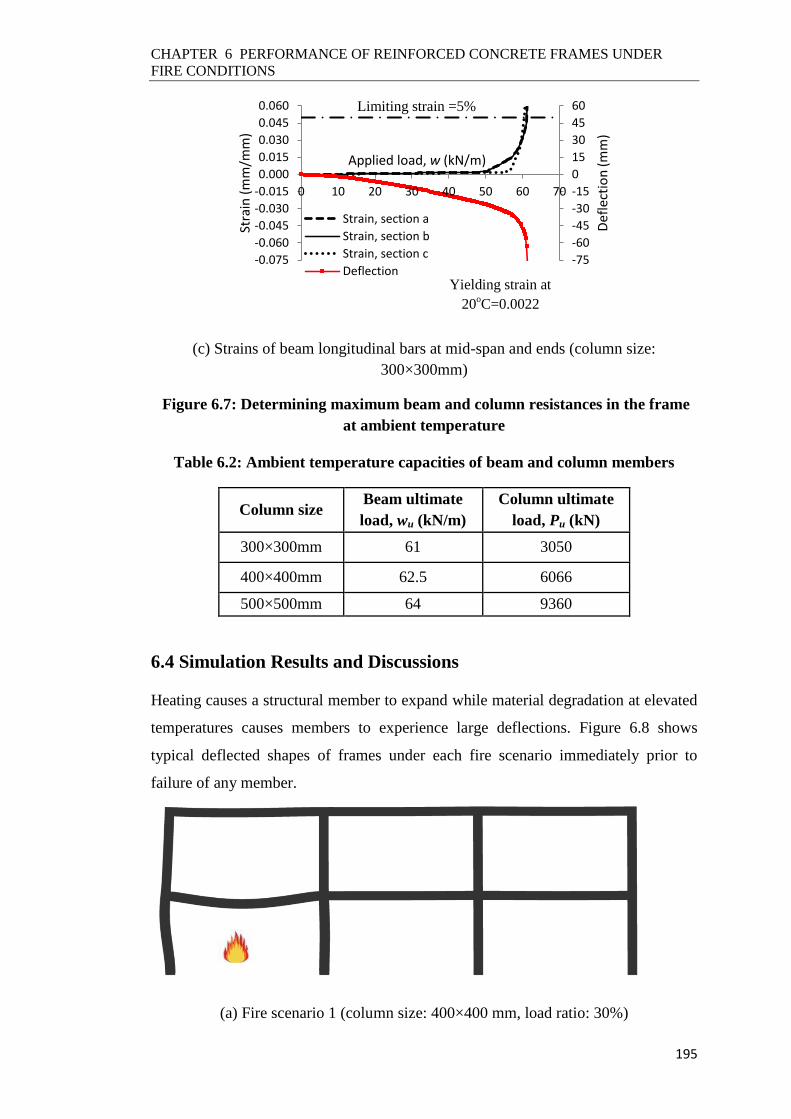
CHAPTER 6 PERFORMANCE OF REINFORCED CONCRETE FRAMES UNDER
FIRE CONDITIONS
195
(c) Strains of beam longitudinal bars at mid-span and ends (column size:
300×300mm)
Figure 6.7: Determining maximum beam and column resistances in the frame
at ambient temperature
Table 6.2: Ambient temperature capacities of beam and column members
Column size Beam ultimate
load, wu (kN/m)
Column ultimate
load, Pu (kN)
300×300mm 61 3050
400×400mm 62.5 6066
500×500mm 64 9360
6.4 Simulation Results and Discussions
Heating causes a structural member to expand while material degradation at elevated
temperatures causes members to experience large deflections. Figure 6.8 shows
typical deflected shapes of frames under each fire scenario immediately prior to
failure of any member.
(a) Fire scenario 1 (column size: 400×400 mm, load ratio: 30%)
-75
-60
-45
-30
-15
0
15
30
45
60
-0.075
-0.060
-0.045
-0.030
-0.015
0.000
0.015
0.030
0.045
0.060
0 10 20 30 40 50 60 70
Def
lect
ion
(mm
)
Stra
in (
mm
/mm
)
Applied load, w (kN/m)
Strain, section a
Strain, section b
Strain, section c
Deflection
Limiting strain =5%
Yielding strain at
20oC=0.0022
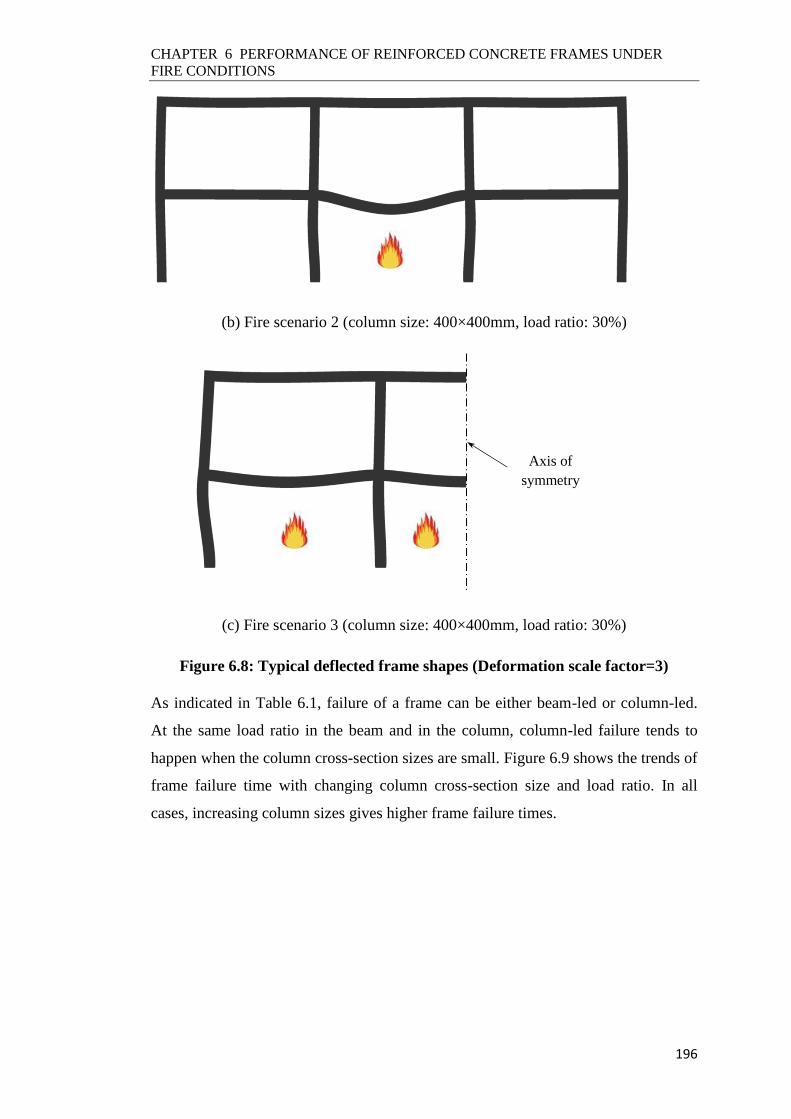
CHAPTER 6 PERFORMANCE OF REINFORCED CONCRETE FRAMES UNDER
FIRE CONDITIONS
196
(b) Fire scenario 2 (column size: 400×400mm, load ratio: 30%)
(c) Fire scenario 3 (column size: 400×400mm, load ratio: 30%)
Figure 6.8: Typical deflected frame shapes (Deformation scale factor=3)
As indicated in Table 6.1, failure of a frame can be either beam-led or column-led.
At the same load ratio in the beam and in the column, column-led failure tends to
happen when the column cross-section sizes are small. Figure 6.9 shows the trends of
frame failure time with changing column cross-section size and load ratio. In all
cases, increasing column sizes gives higher frame failure times.
Axis of
symmetry

CHAPTER 6 PERFORMANCE OF REINFORCED CONCRETE FRAMES UNDER
FIRE CONDITIONS
197
(a) Fire scenario 1
(b) Fire scenario 2
(c) Fire scenario 3
Figure 6.9: Effects of column size and load ratio on frame failure times
For fire scenario 1, thermal expansion of beam B1 is highly constrained at the end
connected to the internal bay (right end) due to additional restraints by the cool
structural members in the adjacent bays. Hence, lateral displacements of the middle
columns C2 and C6 remain very small throughout the fire exposure. On the contrary,
0
50
100
150
200
250
300
200 300 400 500 600
Fram
e f
ailu
re t
ime
(min
)
Column cross-section size (mm)
LR=30%
LR=50% (beam detail 1)
LR=50% (beam detail 2)
0
100
200
300
400
500
200 300 400 500 600
Fram
e f
ailu
re t
ime
(min
)
Column cross-section size (mm)
LR=30%
LR=50%
0
50
100
150
200
250
200 300 400 500 600
Fram
e f
ailu
re t
ime
(min
)
Column cross-section size (mm)
LR=30%
LR=50%
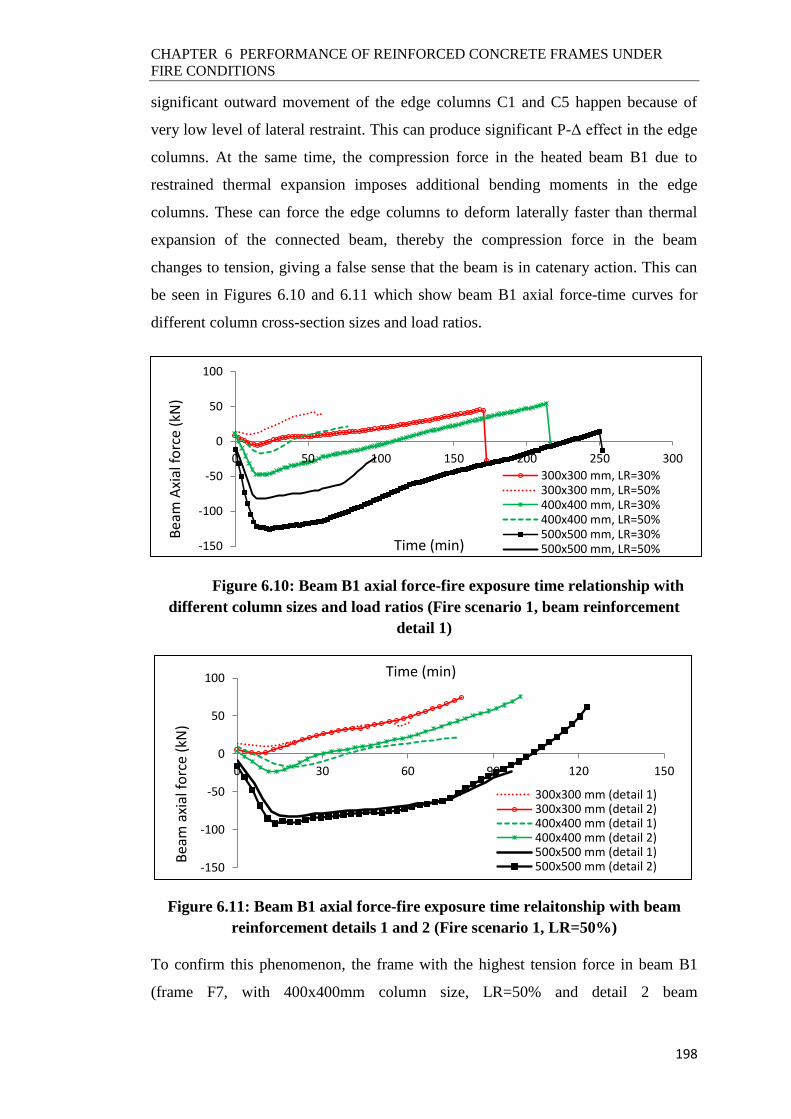
CHAPTER 6 PERFORMANCE OF REINFORCED CONCRETE FRAMES UNDER
FIRE CONDITIONS
198
significant outward movement of the edge columns C1 and C5 happen because of
very low level of lateral restraint. This can produce significant P-Δ effect in the edge
columns. At the same time, the compression force in the heated beam B1 due to
restrained thermal expansion imposes additional bending moments in the edge
columns. These can force the edge columns to deform laterally faster than thermal
expansion of the connected beam, thereby the compression force in the beam
changes to tension, giving a false sense that the beam is in catenary action. This can
be seen in Figures 6.10 and 6.11 which show beam B1 axial force-time curves for
different column cross-section sizes and load ratios.
Figure 6.10: Beam B1 axial force-fire exposure time relationship with
different column sizes and load ratios (Fire scenario 1, beam reinforcement
detail 1)
Figure 6.11: Beam B1 axial force-fire exposure time relaitonship with beam
reinforcement details 1 and 2 (Fire scenario 1, LR=50%)
To confirm this phenomenon, the frame with the highest tension force in beam B1
(frame F7, with 400x400mm column size, LR=50% and detail 2 beam
-150
-100
-50
0
50
100
0 50 100 150 200 250 300
Bea
m A
xial
fo
rce
(kN
)
Time (min)
300x300 mm, LR=30%300x300 mm, LR=50%400x400 mm, LR=30%400x400 mm, LR=50%500x500 mm, LR=30%500x500 mm, LR=50%
-150
-100
-50
0
50
100
0 30 60 90 120 150
Bea
m a
xial
fo
rce
(kN
)
Time (min)
300x300 mm (detail 1)300x300 mm (detail 2)400x400 mm (detail 1)400x400 mm (detail 2)500x500 mm (detail 1)500x500 mm (detail 2)
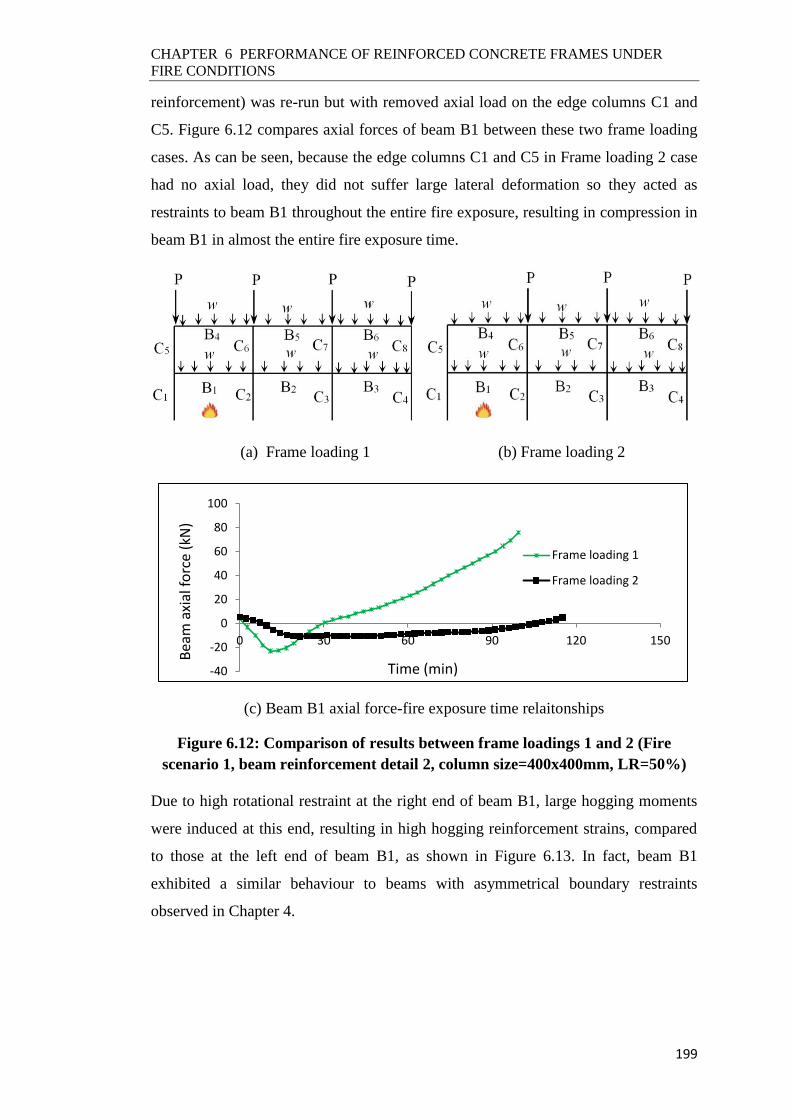
CHAPTER 6 PERFORMANCE OF REINFORCED CONCRETE FRAMES UNDER
FIRE CONDITIONS
199
reinforcement) was re-run but with removed axial load on the edge columns C1 and
C5. Figure 6.12 compares axial forces of beam B1 between these two frame loading
cases. As can be seen, because the edge columns C1 and C5 in Frame loading 2 case
had no axial load, they did not suffer large lateral deformation so they acted as
restraints to beam B1 throughout the entire fire exposure, resulting in compression in
beam B1 in almost the entire fire exposure time.
(a) Frame loading 1 (b) Frame loading 2
(c) Beam B1 axial force-fire exposure time relaitonships
Figure 6.12: Comparison of results between frame loadings 1 and 2 (Fire
scenario 1, beam reinforcement detail 2, column size=400x400mm, LR=50%)
Due to high rotational restraint at the right end of beam B1, large hogging moments
were induced at this end, resulting in high hogging reinforcement strains, compared
to those at the left end of beam B1, as shown in Figure 6.13. In fact, beam B1
exhibited a similar behaviour to beams with asymmetrical boundary restraints
observed in Chapter 4.
-40
-20
0
20
40
60
80
100
0 30 60 90 120 150
Bea
m a
xial
fo
rce
(kN
)
Time (min)
Frame loading 1
Frame loading 2
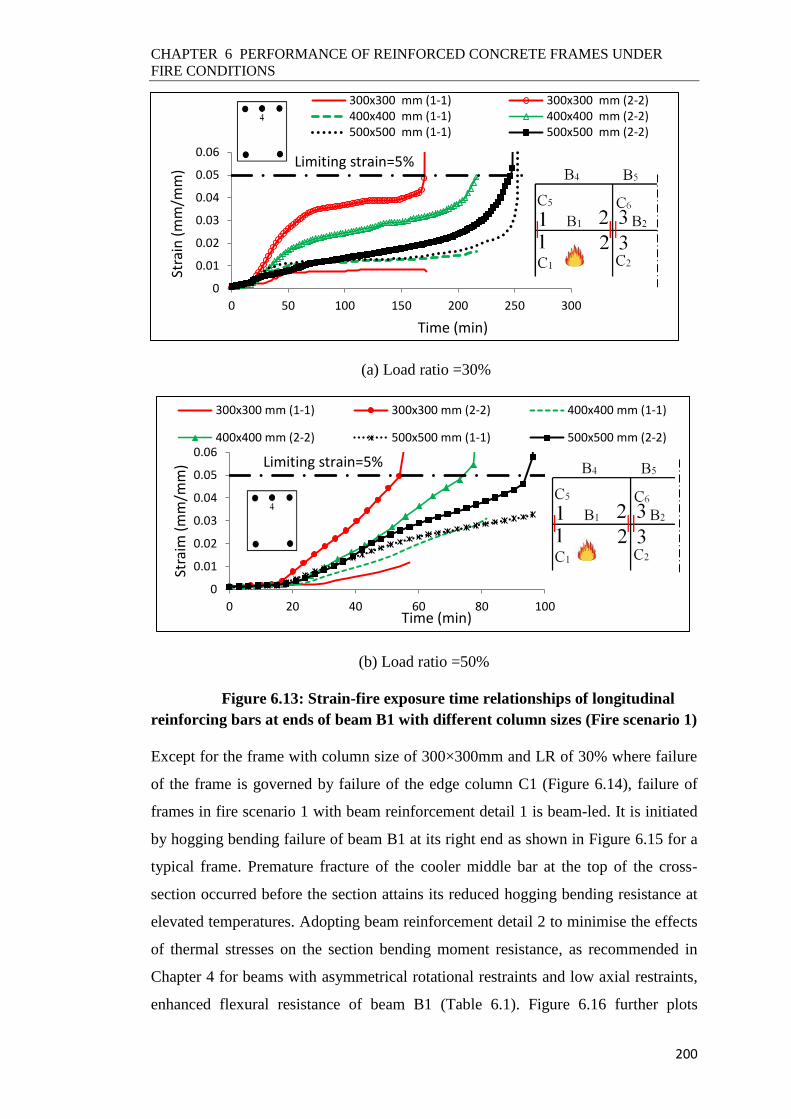
CHAPTER 6 PERFORMANCE OF REINFORCED CONCRETE FRAMES UNDER
FIRE CONDITIONS
200
(a) Load ratio =30%
(b) Load ratio =50%
Figure 6.13: Strain-fire exposure time relationships of longitudinal
reinforcing bars at ends of beam B1 with different column sizes (Fire scenario 1)
Except for the frame with column size of 300×300mm and LR of 30% where failure
of the frame is governed by failure of the edge column C1 (Figure 6.14), failure of
frames in fire scenario 1 with beam reinforcement detail 1 is beam-led. It is initiated
by hogging bending failure of beam B1 at its right end as shown in Figure 6.15 for a
typical frame. Premature fracture of the cooler middle bar at the top of the cross-
section occurred before the section attains its reduced hogging bending resistance at
elevated temperatures. Adopting beam reinforcement detail 2 to minimise the effects
of thermal stresses on the section bending moment resistance, as recommended in
Chapter 4 for beams with asymmetrical rotational restraints and low axial restraints,
enhanced flexural resistance of beam B1 (Table 6.1). Figure 6.16 further plots
0
0.01
0.02
0.03
0.04
0.05
0.06
0 50 100 150 200 250 300
Stra
in (
mm
/mm
)
Time (min)
300x300 mm (1-1) 300x300 mm (2-2)400x400 mm (1-1) 400x400 mm (2-2)500x500 mm (1-1) 500x500 mm (2-2)
Limiting strain=5%
0
0.01
0.02
0.03
0.04
0.05
0.06
0 20 40 60 80 100
Stra
im (
mm
/mm
)
Time (min)
300x300 mm (1-1) 300x300 mm (2-2) 400x400 mm (1-1)
400x400 mm (2-2) 500x500 mm (1-1) 500x500 mm (2-2)
Limiting strain=5%
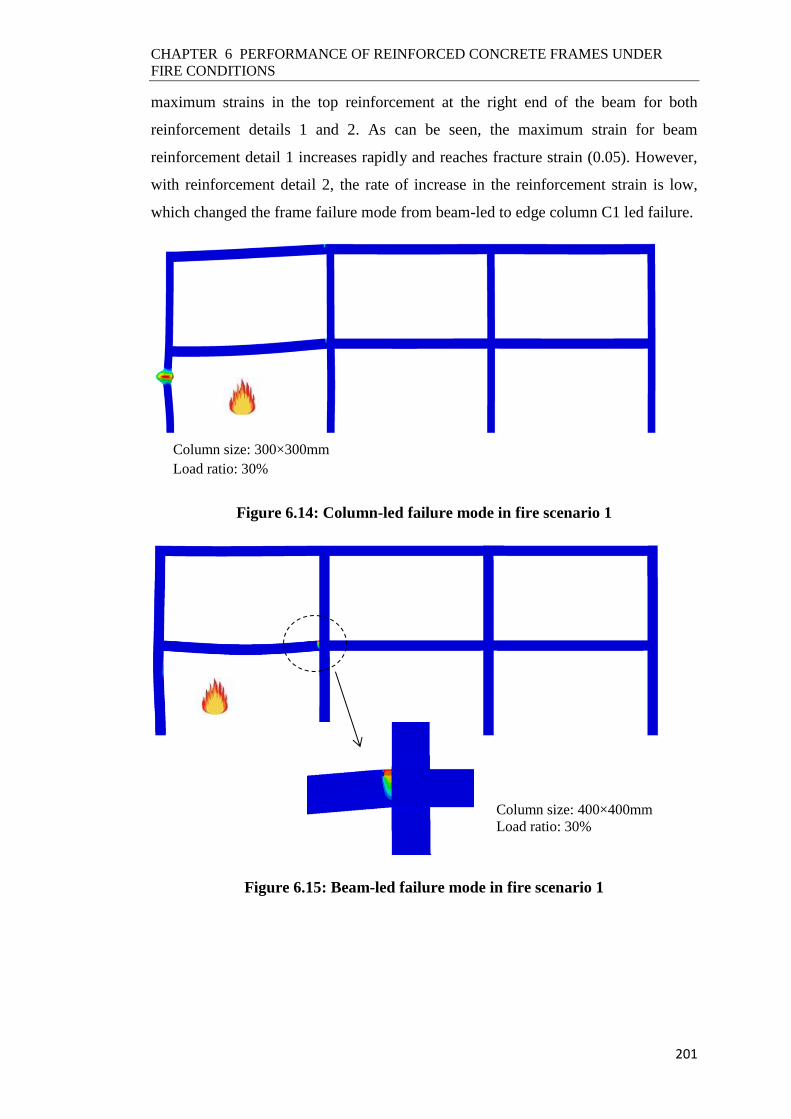
CHAPTER 6 PERFORMANCE OF REINFORCED CONCRETE FRAMES UNDER
FIRE CONDITIONS
201
maximum strains in the top reinforcement at the right end of the beam for both
reinforcement details 1 and 2. As can be seen, the maximum strain for beam
reinforcement detail 1 increases rapidly and reaches fracture strain (0.05). However,
with reinforcement detail 2, the rate of increase in the reinforcement strain is low,
which changed the frame failure mode from beam-led to edge column C1 led failure.
Figure 6.14: Column-led failure mode in fire scenario 1
Figure 6.15: Beam-led failure mode in fire scenario 1
Column size: 300×300mm
Load ratio: 30%
Column size: 400×400mm
Load ratio: 30%

CHAPTER 6 PERFORMANCE OF REINFORCED CONCRETE FRAMES UNDER
FIRE CONDITIONS
202
Figure 6.16: Strain-fire exposure time relationship of top longitudinal
reinforcing bars at right end of beam B1 (Fire scenario 1, LR=50%)
Increasing column size prolongs failure times of both beam-led and column-led
frame failure modes. For beam-led failure, increasing column size increases the
rotational restraint offered by the edge columns to the left end of beam B1.
Therefore, as indicated by the strain of the top bars at the beam ends in Figure 6.13,
the hogging bending moment is increased at the left end and decreased at the right
end which is less influenced by further increase in the rotational stiffness because of
being already at very stiff rotational restraint, thereby prolonging bending failure of
the beam. For column-led failure, while the axial load in the column is also increased
with increasing the column size to keep the same applied load ratio, the temperature
rise in the inner layers of a bigger concrete section is lower. Hence, a better
performance is observed for a bigger column size as the cooler inner layers
contribute more toward column capacity.
Because of high hogging moment developed at the right end of beam B1 that leads to
a reduction in the sagging moment, the beam cannot develop a hinge mechanism at
bending failure. This is confirmed by the maximum strains of the bottom
reinforcement in the beam span in Figure 6.17, which shows that the strains have not
reached the yielding strain (0.02). For enlarged column sections and lower load ratios
where the hogging moment at the critical right end of beam B1 is smaller, the results
in Figures 6.13 and 6.17 indicate a complete three plastic hinge mechanism has
formed in the beam at failure.
0
0.01
0.02
0.03
0.04
0.05
0.06
0 30 60 90 120 150
Stra
in (
mm
/mm
)
Time (min)
300x300 mm (Bar 4, detail 1) 300x300 mm (Bar 3, detail 2)
400x400 mm (Bar 4, detail 1) 400x400 mm (Bar 3, detail 2)
500x500 mm (Bar 4, detail 1) 500x500 mm (Bar 3, detail 2)
3#6 As=855mm
2φ23.3mm As=855mm
Detail 1 Detail 2
Limiting strain=5%
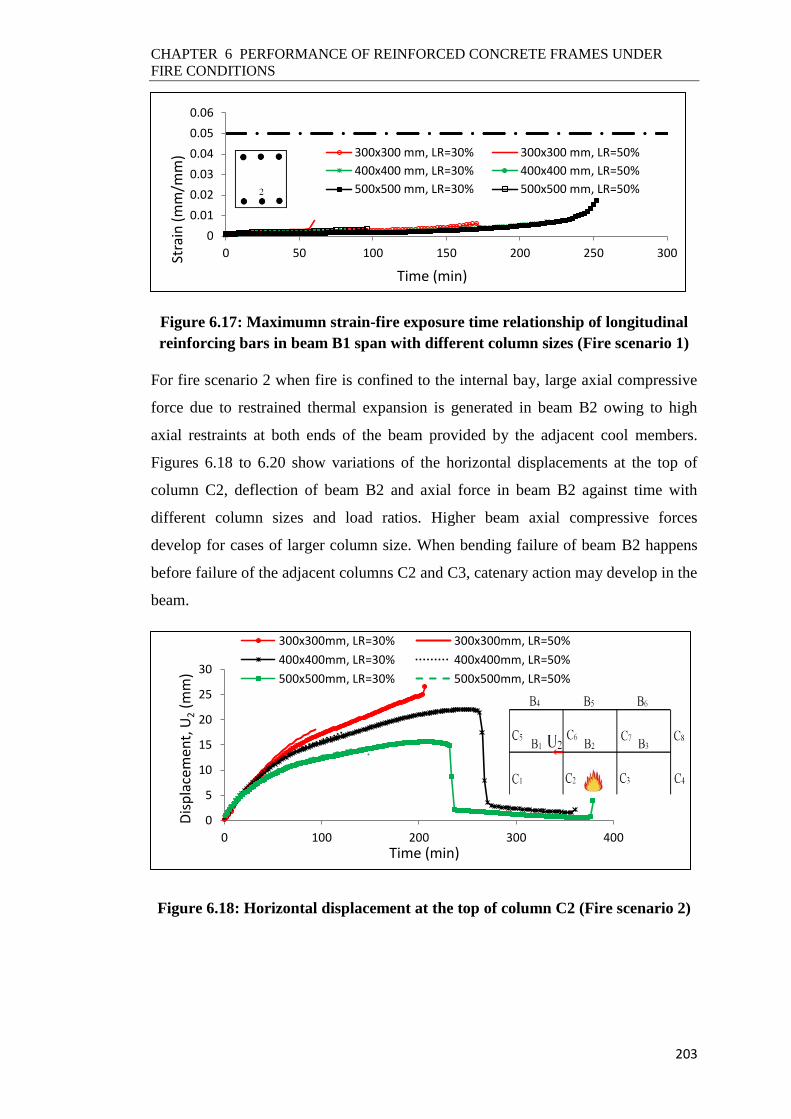
CHAPTER 6 PERFORMANCE OF REINFORCED CONCRETE FRAMES UNDER
FIRE CONDITIONS
203
Figure 6.17: Maximumn strain-fire exposure time relationship of longitudinal
reinforcing bars in beam B1 span with different column sizes (Fire scenario 1)
For fire scenario 2 when fire is confined to the internal bay, large axial compressive
force due to restrained thermal expansion is generated in beam B2 owing to high
axial restraints at both ends of the beam provided by the adjacent cool members.
Figures 6.18 to 6.20 show variations of the horizontal displacements at the top of
column C2, deflection of beam B2 and axial force in beam B2 against time with
different column sizes and load ratios. Higher beam axial compressive forces
develop for cases of larger column size. When bending failure of beam B2 happens
before failure of the adjacent columns C2 and C3, catenary action may develop in the
beam.
Figure 6.18: Horizontal displacement at the top of column C2 (Fire scenario 2)
0
0.01
0.02
0.03
0.04
0.05
0.06
0 50 100 150 200 250 300Stra
in (
mm
/mm
)
Time (min)
300x300 mm, LR=30% 300x300 mm, LR=50%
400x400 mm, LR=30% 400x400 mm, LR=50%
500x500 mm, LR=30% 500x500 mm, LR=50%
0
5
10
15
20
25
30
0 100 200 300 400
Dis
pla
cem
ent,
U2 (
mm
)
Time (min)
300x300mm, LR=30% 300x300mm, LR=50%
400x400mm, LR=30% 400x400mm, LR=50%
500x500mm, LR=30% 500x500mm, LR=50%

CHAPTER 6 PERFORMANCE OF REINFORCED CONCRETE FRAMES UNDER
FIRE CONDITIONS
204
Figure 6.19: Beam B2 deflection-fire exposure time relationship with different
column sizes and load ratios (Fire scenario 2)
Figure 6.20: Beam B2 axial force-fire exposure time relationship with
different column sizes and load ratios (Fire scenario 2)
Failure mechanism of the frame is strongly affected by the column size and loading
level owing to complex interactions between moments and axial forces in the beams
and columns. High rotational restraints are likely to be imposed to the ends of beam
B2 by the adjacent members. This can generate considerable hogging moment at the
beam ends due to restrained thermal curvature, which in turn increases the moment
in the adjoining heated columns C2 and C3 as well. Additional moments induce in
columns C2 and C3 under thermal expansion of the adjacent beam B2 (Figure 6.18).
Failure of frames with smaller column sizes is triggered by failure of columns C2
and C3 (Figure 6.21). It is reached while the heated beam B2 is at small deflections
in bending. For large column sizes, because of the improved fire resistance and
higher lateral restraint of the columns, bending failure of beam B2 happened first as
in frames F11, F12 and F15. It was initiated by hogging bending failure at beam
ends. The high axial compressive force in the beam led the hogging bending failure
-600
-500
-400
-300
-200
-100
0
0 100 200 300 400
Bea
m d
efle
ctio
n (m
m)
Time (min)
300x300mm, LR=30% 300x300mm, LR=50%
400x400mm, LR=30% 400x400mm, LR=50%
500x500mm, LR=30% 500x500mm, LR=50%
-500
-400
-300
-200
-100
0
100
200
300
0 100 200 300 400
Bea
m a
xial
fo
rce
(kN
)
Time (min)
300x300mm, LR=30% 300x300mm, LR=50%400x400mm, LR=30% 400x400mm, LR=50%500x500mm, LR=30% 500x500mm, LR=50%

CHAPTER 6 PERFORMANCE OF REINFORCED CONCRETE FRAMES UNDER
FIRE CONDITIONS
205
to be governed by concrete crushing of the lower layers directly exposed to fire as
illustrated in Figure 6.22. This is confirmed by excessive concrete compressive
strains at the beam ends plotted in Figure 6.23, which have exceeded the strains
corresponding to peak and zero compression stresses according to the concrete
stress-strain relationships at elevated temperature presented in Appendix 4 in Figure
A4.7. Increasing the column size increases the compression force in the beam, hence
causing the beam bending failure time to occur earlier before yielding of both the
tensile reinforcement at the ends and mid-span as shown in Figures 6.24 and 6.25.
Figure 6.21: Frame failure in fire scenario 2 (column-led failure)
Figure 6.22: Beam bending failure in fire scenario 2 and deformed shape
of frame in catenary action
Column size: 300×300mm
Load ratio: 30%
Column size: 400×400mm
Load ratio: 30%
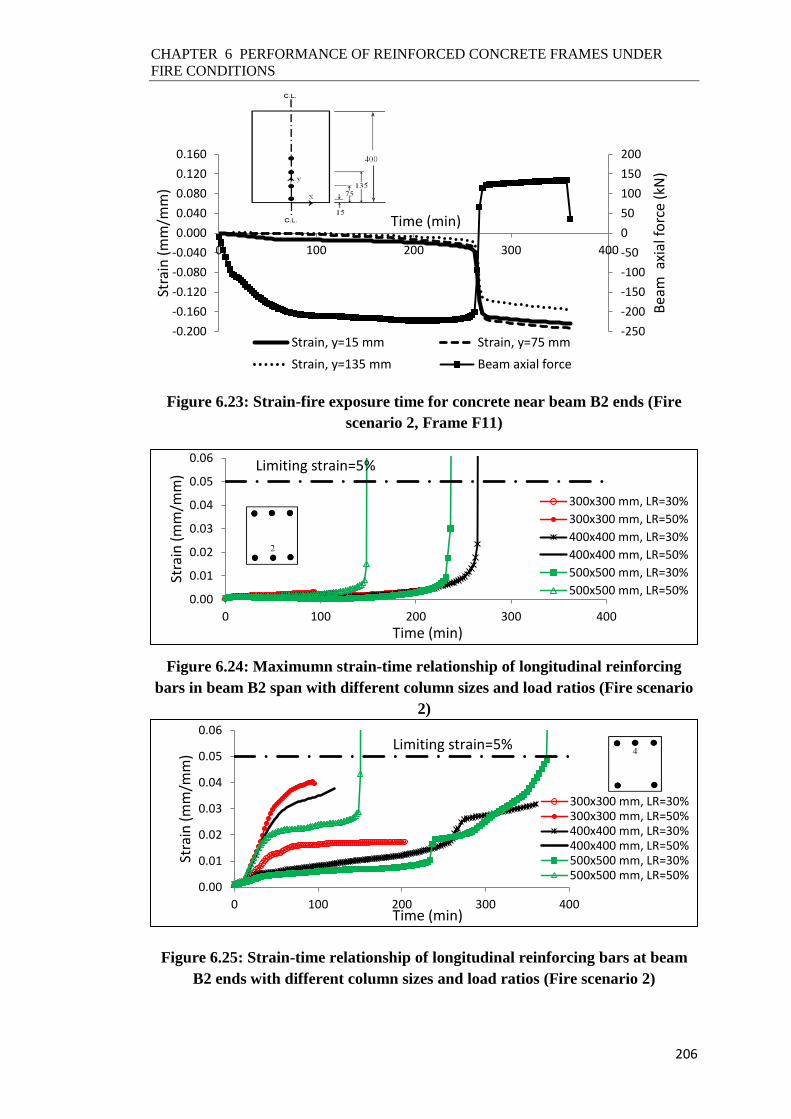
CHAPTER 6 PERFORMANCE OF REINFORCED CONCRETE FRAMES UNDER
FIRE CONDITIONS
206
Figure 6.23: Strain-fire exposure time for concrete near beam B2 ends (Fire
scenario 2, Frame F11)
Figure 6.24: Maximumn strain-time relationship of longitudinal reinforcing
bars in beam B2 span with different column sizes and load ratios (Fire scenario
2)
Figure 6.25: Strain-time relationship of longitudinal reinforcing bars at beam
B2 ends with different column sizes and load ratios (Fire scenario 2)
-250
-200
-150
-100
-50
0
50
100
150
200
-0.200
-0.160
-0.120
-0.080
-0.040
0.000
0.040
0.080
0.120
0.160
0 100 200 300 400
Bea
m a
xial
fo
rce
(kN
)
Stra
in (
mm
/mm
)
Time (min)
Strain, y=15 mm Strain, y=75 mm
Strain, y=135 mm Beam axial force
0.00
0.01
0.02
0.03
0.04
0.05
0.06
0 100 200 300 400
Stra
in (
mm
/mm
)
Time (min)
300x300 mm, LR=30%
300x300 mm, LR=50%
400x400 mm, LR=30%
400x400 mm, LR=50%
500x500 mm, LR=30%
500x500 mm, LR=50%
Limiting strain=5%
0.00
0.01
0.02
0.03
0.04
0.05
0.06
0 100 200 300 400
Stra
in (
mm
/mm
)
Time (min)
300x300 mm, LR=30%300x300 mm, LR=50%400x400 mm, LR=30%400x400 mm, LR=50%500x500 mm, LR=30%500x500 mm, LR=50%
Limiting strain=5%

CHAPTER 6 PERFORMANCE OF REINFORCED CONCRETE FRAMES UNDER
FIRE CONDITIONS
207
When beam bending failure precedes column failure, following concrete crushing at
the ends of beam B2, the compressive force in the beam drops rapidly and changes to
tension due to the development of catenary action. Sagging bending failure caused by
fracture of the bottom tensile reinforcement (Figure 6.24) occurs immediately in the
beam span after concrete crushing because of the additional moments transferred
from the beam ends. As demonstrated in Chapters 4 and 5, the likelihood of a beam
to go into catenary action at large deflections following this bending failure mode of
the beam is high. However, the development of catenary action depends also on
whether the applied load on the beam can be sustained in catenary action by the
beam reinforcement provided for bending resistance. The higher the applied load, the
higher the tensile catenary force develops, as revealed in section 5.12 in Chapter 5.
For example, when the load ratio is LR=50%, the current amount of the
reinforcement in beam B2 was not adequate to sustain the applied load by catenary
action. Tensile strength of the reinforcement, which is largely from the top bars after
fracture of the bottom bars at mid-span and due to significant strength degradation of
the hot bottom steel bars at elevated temperature, was not sufficient to sustain the
tensile catenary force. The top bars fractured immediately after bending failure of the
beam. This can be confirmed in Figure 6.25 by a sudden jump in the bar strain to the
fracture limit (0.05) for the frame with column size of 500x500 mm and load ratio of
50% (frame F15).
In catenary action for frames with LR=30% and column sizes of 400×400mm and
500×500mm, tensile catenary force returned columns C2 and C3 to almost their
initial positions after they had been pushed away by thermal expansion of beam B2
in the flexural action (Figure 6.18). In addition, bending moments from the
connected beam B2 are released in columns C2 and C3 in catenary action after
hogging moment failure at the beam B2 ends. This is beneficial to survival of the
columns through reducing load eccentricity in the columns, which led the frame to
survive for prolonged fire periods in catenary action. Final failure of the frame with
column section 400x400mm (frame F11) was controlled by failure of columns C2
and C3 (column-led) as shown in Figure 6.26. For the frame having enlarged column
sections of 500×500mm (frame F12), the failure was beam-led controlled by fracture
of the top bars at ends of beam B2 under tensile catenary forces as shown in Figure
6.27 and indicated by the strain plots in Figure 6.25.

CHAPTER 6 PERFORMANCE OF REINFORCED CONCRETE FRAMES UNDER
FIRE CONDITIONS
208
Figure 6.26: Column-led failure of frame F11 in catenary action
Figure 6.27: Column-led failure of frame F12 in catenary action
In fire scenario 3, the edge bays exhibit almost the same behaviour as in fire scenario
1. A significant reduction in rotational restraint from the edge columns to the left end
of beam B1 occurs at elevated temperatures. The reason is as explained previously
for fire scenario 1. A high level of rotational restraint is still imposed to the right end
of beam B1 although both the connected column C2 and beam B2 are heated. This is
because when beam B2 pushes columns C2 and C6 towards beam B1, as indicated in
Figure 6.28, additional moments generate in column C2 that follow the same
direction as the moment from the connected beam B2. Hence, rotations at the end of
Column size: 400×400mm
Load ratio: 30%
Fire scenario 2
Column size: 500×500mm
Load ratio: 30%
Fire scenario 2

CHAPTER 6 PERFORMANCE OF REINFORCED CONCRETE FRAMES UNDER
FIRE CONDITIONS
209
beam B2 and top column C2 together act against the rotation of the connected beam
B1. In a consequence, rotational restraint at the right end of beam B1 stiffens.
Therefore, with deterioration in the rotational restraint at the left end, more hogging
moments are attracted to the right end of beam B1. Figure 6.29 compares evolutions
of beam steel reinforcement strains with time at critical sections. As can be seen,
strains of the top bars at the right end of beam B1 are substantially higher than strains
at the left end.
Figure 6.28: Horizontal displacement of columns (Fire scenario 3,
LR=30%)
(a) Load ratio=30%
0
20
40
60
80
100
0 50 100 150 200 250
Dis
pla
cem
ent
(mm
)
Time (min)
300x300mm, U1 300x300mm, U2 400x400mm, U1
400x400mm, U2 500x500mm, U1 500x500mm, U2
0.00
0.01
0.02
0.03
0.04
0.05
0.06
0 50 100 150 200 250
Stra
in (
mm
/mm
)
Time (min)
300x300mm, (1-1)
300x300mm, (2-2)
300x300mm, (3-3)
400x400mm, (1-1)
400x400mm, (2-2)
400x400mm, (3-3)
500x500mm, (1-1)
500x500mm, (2-2)
500x500mm, (3-3)
Limiting strain=5%
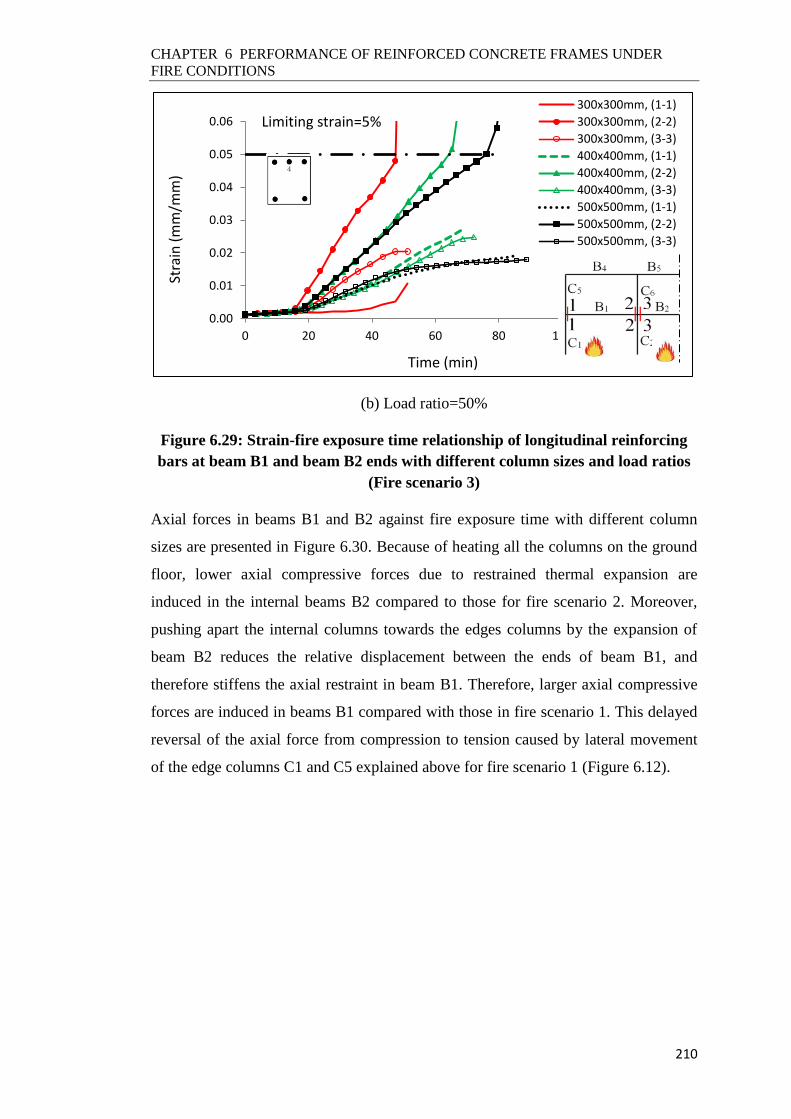
CHAPTER 6 PERFORMANCE OF REINFORCED CONCRETE FRAMES UNDER
FIRE CONDITIONS
210
(b) Load ratio=50%
Figure 6.29: Strain-fire exposure time relationship of longitudinal reinforcing
bars at beam B1 and beam B2 ends with different column sizes and load ratios
(Fire scenario 3)
Axial forces in beams B1 and B2 against fire exposure time with different column
sizes are presented in Figure 6.30. Because of heating all the columns on the ground
floor, lower axial compressive forces due to restrained thermal expansion are
induced in the internal beams B2 compared to those for fire scenario 2. Moreover,
pushing apart the internal columns towards the edges columns by the expansion of
beam B2 reduces the relative displacement between the ends of beam B1, and
therefore stiffens the axial restraint in beam B1. Therefore, larger axial compressive
forces are induced in beams B1 compared with those in fire scenario 1. This delayed
reversal of the axial force from compression to tension caused by lateral movement
of the edge columns C1 and C5 explained above for fire scenario 1 (Figure 6.12).
0.00
0.01
0.02
0.03
0.04
0.05
0.06
0 20 40 60 80 100
Stra
in (
mm
/mm
)
Time (min)
300x300mm, (1-1)
300x300mm, (2-2)
300x300mm, (3-3)
400x400mm, (1-1)
400x400mm, (2-2)
400x400mm, (3-3)
500x500mm, (1-1)
500x500mm, (2-2)
500x500mm, (3-3)
Limiting strain=5%

CHAPTER 6 PERFORMANCE OF REINFORCED CONCRETE FRAMES UNDER
FIRE CONDITIONS
211
(a) Load ratio=30%
(b) Load ratio=50%
Figure 6.30: Beam axial force-fire exposure time relationship with
different column sizes and load ratios (Fire scenario 3)
Failure of the frame with column size of 300×300mm and LR of 30% was column-
led. Although the edge column C1 carries higher moments, the frame failure was
triggered by failure of the internal column C2 (Figure 6.31). This may be due the
higher temperature rise in the internal column exposed to fire on four sides in fire
scenario 3 (Figure 6.3(c)). Failure of all other frames was beam-led and initiated by
hogging bending failure of beam B1 at its right end as shown in Figure 6.32 for a
typical frame. Similar to fire scenario 1, early fracture of the top middle bar at the
right end of beam B1 occurred due to the additional self-equilibrating stresses in the
beam cross-section. It was shown in fire scenario 1 and in the detailed investigations
of beam behaviour in Chapter 4 that this detrimental effect can be minimised by
locating the beam top longitudinal bars close to the cross-section corners (Figure
6.2(c)).
-300
-250
-200
-150
-100
-50
0
50
0 50 100 150 200 250B
eam
axi
al f
orc
e (k
N)
Time (min)
300x300 mm, Beam B1300x300 mm, Beam B2400x400 mm, Beam B1400x400 mm, Beam B2500x500 mm, Beam B1500x500 mm, Beam B2
-200
-150
-100
-50
0
50
0 20 40 60 80 100
Bea
m a
xial
fo
rce
(kN
)
Time (min)
300x300 mm, Beam B1 300x300 mm, Beam B2
400x400 mm, Beam B1 400x400 mm, Beam B2

CHAPTER 6 PERFORMANCE OF REINFORCED CONCRETE FRAMES UNDER
FIRE CONDITIONS
212
Figure 6.31: Frame failure in fire scenario 3 (column-led failure)
Figure 6.32: Frame failure in fire scenario 3 (beam-led failure)
As illustrated in Figure 6.33, bending failure of the beam is reached while the
maximum tensile strain in the sagging moment region is significantly lower than the
yielding strain (0.02). It indicates that the beam failure is attained without formation
of a plastic hinge mechanism.
Figure 6.33: Maximumn strain-time relationship of longitudinal reinforcing
bars in beam B1 span with different column sizes and load ratios (Fire scenario
3)
Column size: 300×300mm
Load ratio: 30%
Column size: 400×400mm
Load ratio: 30%
0.00
0.01
0.02
0.03
0.04
0.05
0.06
0 50 100 150 200 250Stra
in (
mm
/mm
)
Time (min)
300x300mm, LR=30% 300x300mm, LR=50%
400x400mm, LR=30% 400x400mm, LR=50%
500x500mm, LR=30% 500x500mm, LR=50%
Limiting strain=5%

CHAPTER 6 PERFORMANCE OF REINFORCED CONCRETE FRAMES UNDER
FIRE CONDITIONS
213
6.5 Conclusions
This chapter has presented the results of a limited numerical parametric study on a
two story RC frame under different fire scenarios. From the results of this study, the
following conclusions may be drawn:
1. If fire exposure involves edge columns, there would be very limited scope for
the development of catenary action due to the small amount of axial restraint
that the edge columns could offer to the fire exposed beam.
2. Structural failure of a frame with small column sizes is mainly controlled by
column failure.
3. Due to thermal expansion of the connected beam, additional bending
moments can generate in a column. It is necessary to include these bending
moments when evaluating the column fire resistance.
4. Design of beams in edge bays for fire resistance on the assumption that
rotational restraints at both ends are identical and a full plastic hinge
mechanism forms may lead to non-conservative results. At elevated
temperatures, the end that is connected to edge columns could experience
deterioration in the rotational restraint stiffness. This results in more
redistribution of the load to the continuous end which may not have been
designed for. If this action is to be considered in design, top bars in the
hogging moment region of a beam should be located to the corners to reduce
the effects of tensile thermal stresses.
5. Catenary action can develop in a beam of an RC frame only when fire
exposure is in an interior bay so that the fire exposed beam has a high degree
of axial restraint. Furthermore, catenary action happens only when the
applied load ratio is at a moderate level.

CHAPTER 7 CONCLUSIONS AND RECOMMENDATIONS FOR FUTURE STUDIES
214
CHAPTER 7
CONCLUSIONS AND RECOMMENDATIONS FOR
FUTURE STUDIES
7.1 Introduction
The aim of this project is to gain thorough understanding of structural interactions in
RC frames in fire. Particular attention has been paid to investigating the whole range
behaviour of axially and rotationally restrained RC beams in fire. The study consists
of the following parts: (i) development and validation of a 3D numerical simulation
model using ABAQUS/Explicit, (ii) a numerical study of fire response of RC beams
under different axial and rotational restraint levels, (iii) development of a simplified
method for the full history behaviour of RC beams in fire and (iv) a numerical
investigation of the interactions between RC beams and columns in RC frames in
fire. This chapter summaries the main conclusions of the work and provides
recommendations for future studies.
7.2 Explicit Finite Element Modelling Methodology
Modelling the whole range behaviour of a structure until complete structural collapse
at large deformations presents serious challenges due to severe material and
geometric nonlinearities and temporary instabilities caused by local material failures,
including concrete crushing and reinforcement fracture. To overcome these
modelling challenges, this study has used a dynamic explicit analysis implemented in
ABAQUS/Explicit. A particular problem with explicit simulation is the very small
time increments. To speed up the simulation process, load and mass scaling factors
have been examined. To verify the effectiveness of the proposed simulation model,
results of explicit simulations were compared against relevant available test results at
ambient and elevated temperatures. Based on the validation results, the following
main conclusions may be drawn:
1- To obtain quasi-static response when using explicit simulation, the dynamic
effects are negligible if the total loading duration does not fall below a

CHAPTER 7 CONCLUSIONS AND RECOMMENDATIONS FOR FUTURE STUDIES
215
minimum value. For ambient temperature displacement-controlled and load-
controlled simulations, the minimum loading duration is about 50 and 65
times the structure’s lowest natural period, respectively. For simulating
structural behaviour in fire, the minimum heating duration is 20 times the
lowest natural period for 60 minutes of real heating duration.
2- If an analysis requires preservation of the same real loading/heating duration
while achieving the results as above, adaptive mas scaling can be used. This
is achieved by scaling the structural mass up (m)2 times, where “m” is the
ratio of the real loading/heating duration to the minimum simulation
loading/heating duration.
3- A damping ratio of 25-30% should be introduced in the load controlled
loading method to avoid premature final structural failure of beams due to
significant dynamic effects following bending failure.
7.3 Behaviour of Restrained RC Beams in Fire
Using the validated numerical simulation model, this research then performed an
extensive study to investigate the effects of different axial and rotational restraints on
the behaviour of RC beams in fire, including catenary action at large deflections. The
results of this study indicate complicated beam bending behaviour and inability of
the beam to form the classical hinge mechanism. The following observations and
conclusions can be drawn from this study:
Beams with symmetrical restraint conditions:
As the rotational restraint stiffness at the beam ends increases, RC beams may
experience three bending failure modes: (I) beam bending failure governed by
sagging bending resistance at mid-span, (II) by combined fracture of top
reinforcement at ends and bottom reinforcement at mid-span and (III) by concrete
crushing at ends. These bending failure modes affect beam bending resistance time
and development of catenary action.
- At very low level of rotational stiffness, because the beam sagging moment at
mid-span decreases with increasing rotational stiffness, the bending failure
time of the beam increases with increasing rotational stiffness. Since catenary
action is provided by tension in the top reinforcing bars and these bars at

CHAPTER 7 CONCLUSIONS AND RECOMMENDATIONS FOR FUTURE STUDIES
216
beam ends are at low tensile strains, catenary action can develop in the beam.
However, at such low levels of end rotational restraints, the extent of catenary
action development is very sensitive to the beam end rotational stiffness and
it would be better to disregard catenary action at low levels of rotational
restraints.
- With further increase in the beam end rotational stiffness, after the bottom
bars at mid-span have fractured on reaching the sagging moment resistance
and release of the axial compressive force, equilibrium of the beam in bending
can be achieved again by the end hogging moments resisting the externally
applied moment. Compression plays an increasing role when the rotational
stiffness is increased: a beam with higher rotational stiffness has higher end
bending moments so equilibrium can be achieved at smaller beam defections,
thus a smaller amount of the axial compressive force in the beam is released.
The remaining unreleased higher compressive force has adverse influence on
the beam bending resistance time due to P-Δ effects. Since bending failure of
the beam is controlled by hogging moment failure at the beam ends (bending
failure mode II), the beam bending resistance time decreases with increasing
end rotational stiffness. The hogging moment failure is controlled by fracture
of tensile reinforcement. Thus, the beam does not have a continuous path of
tensile force to develop catenary action. Hence, the beam bending failure time
and final failure time coincide, both decreasing with increasing end rotational
stiffness.
- As the rotation stiffness increases further, crushing of concrete layers exposed
to fire in the hogging moment region occurs first before the mid-span reaches
its sagging moment resistance. Increasing the beam end rotational stiffness
reduces the beam deflection and hence the P-Δ effects, and meanwhile
increases the compressive stresses at beam ends due to increased hogging
moments. Therefore, these two opposing mechanisms ensure that the beam
bending resistance time remains almost constant. Bending failure at the mid-
span occurs immediately after bending failure at the beam ends occurs
because the beam does not have sufficient mid-span bending resistance to
maintain equilibrium in bending. Because the top reinforcement at ends is at
low strain when concrete crushing takes place (compression-controlled
failure) and the beam is relieved from end hogging moments, the beam can

CHAPTER 7 CONCLUSIONS AND RECOMMENDATIONS FOR FUTURE STUDIES
217
develop the longest period of catenary action. The beam behaves as one
without rotational restraint, thus the beam final failure time is unchanged with
changing end rotational stiffness.
- The aforementioned beam behaviour holds for different levels of axial
restraint and different load ratios. The only change is that the bending failure
mode II disappears when the load ratio is high. This is because it is difficult
for the beam ends to resist the high applied load after failure of the beam mid-
span.
- The traditional approach for estimating fire resistance of beams in fire, which
ignores compressive force generated by restraint to thermal expansion and
assumes that both the hogging and sagging bending moment resistances can
be reached together, may lead to overestimate of the bending resistance time
of axially restrained RC beams in fire.
Beams with asymmetrical restraint conditions:
The flexural behaviour of beams with asymmetrical end restraints is more
complicated than that with symmetrical ones. When the supports have high rotational
stiffness, a hinge mechanism may not happen in most cases because the support with
a higher rotational stiffness attracts a very high bending moment and fails while the
span bending moment is very low and has not reached its plastic moment capacity.
The hogging moment failure could be adversely affected by tensile thermal stresses
developed in the cooler mid reinforcing bars at the top of the beam in the hogging
region. To reduce this effect, top bars in the hogging region should be located close
to corner bars.
7.4 Development of a Simplified Method for Analysis of Axially and
Rotationally Restrained RC Beams in fire
Based on numerical simulation results in Chapter 4, a simplified calculation method
was proposed in this study to capture the whole history of structural behaviour of
axially and rotationally restrained RC beams in fire. The method is based on
sectional analysis and uses simple principles of equilibrium and compatibility
conditions.

CHAPTER 7 CONCLUSIONS AND RECOMMENDATIONS FOR FUTURE STUDIES
218
One important assumption in the simplified analysis is the beam’s deflection profile.
In flexural action, the deflection profiles of simply supported and fixed end beams
under uniformly distributed load may be assumed for zero and fixed end rotational
restraints, respectively. An exponential interpolation between the deflection profiles
with zero and complete rotational restraints is assumed for the deflection profile of
beams with flexible end rotational restraints. In catenary action, the average of the
following three deflection profiles is used: (i) the deflection profile of the beam
under uniformly distributed load (UDL), (ii) the deflection profile of the beam under
a concentrated point load (CPL) at the mid-span and (iii) linear profile.
Simple and reliable approaches were suggested to predict the two critical rotational
restraints kr,B and kr,E (in Figure 5.2). kr,B corresponds to the rotational stiffness level
that gives the highest period of further bending resistance of the beam by the end
hogging moment resistance after the mid-span has reached its sagging moment
resistance. kr,E is the lowest rotational stiffness that leads the beam bending failure to
be controlled by hogging moment failure due to concrete crushing in compression.
Determination of kr,B and kr,E helps to predict the trends of changing beam bending
resistance time with increasing end rotational stiffness.
In the simplified model, only beams with kr≥kr,E are considered to be able to develop
catenary action. In catenary action, the following assumptions are made in the
proposed model:
The beam is rotationally free at the ends.
The location of the vertical and horizontal supports at the beam ends is at the
same location of the top longitudinal reinforcement.
The bottom reinforcing bars along the beam is not considered in the sectional
analysis.
A strain profile for the top reinforcement based on the maximum steel strain
of 0.05 is assumed to help to predict the ultimate resistance time of the beam
in catenary action, which is the time when fracture of the top reinforcement
at beam ends occurs.
7.5 Behaviour of RC Frames in Fire
The validated numerical simulation model was used to investigate structural
interactions between beams and columns within an RC frame structure with different

CHAPTER 7 CONCLUSIONS AND RECOMMENDATIONS FOR FUTURE STUDIES
219
fire exposure scenarios. Structural failure of a frame with small column sizes is
mainly controlled by column failure. When fire exposure involves beams and
columns located in edge bays of a frame, due to thermal expansion of the connected
beam, additional bending moments can generate in the edge columns. Furthermore,
very large hogging moments may be induced at the beam end connected to the
internal bay. It is necessary to include these bending moments when designing beams
and columns under such fire conditions. Catenary action can develop in interior
beams of the frame when fire is in interior bays where the beams have high degrees
of axial restraint.
7.6 Recommendations for Future Studies
The following are some key recommendations for future research in this field:
1- The explicit numerical simulations conduced in this study have used solid
elements to model RC structural members in fire. Although solid elements
give more understanding of structural behaviour and accurate results, it
requires a substantial amount of computing time. For investigating global
behaviour of RC frames in fire, developing reduced finite element models
(macromodels) using fibre-beam elements and component-based method is
worthy of consideration.
2- The present finite element model is limited to RC structures subjected to
heating only. The model should be extended to enable both heating and
cooling phases to be modelled. This is achieved by modifying the concrete
constitutive law in order to predict irreversibility of the load-induced thermal
strain (LITS) occurring under compressive stress. Moreover, the model needs
modification to account for fire-induced spalling.
3- The present study has focused on behaviour of restrained RC beams in fire
under linear temperature-independent axial and rotational restraint stiffness.
Future studies should be performed using end boundary restraints offered by
adjacent restraining members in fire.
4- This study has ignored effects of large concrete cracks on temperature
distribution in RC member cross-sections. At large beam deflections in
catenary action, large cracks could alter insulation characteristics of concrete

CHAPTER 7 CONCLUSIONS AND RECOMMENDATIONS FOR FUTURE STUDIES
220
to steel reinforcement. This should be considered since applied load in
catenary action is mainly sustained by steel reinforcement.
5- The effects of the cooling phase and spalling in the evaluation of the fire
resistance should be investigated as they are key requirements in the
performance-based approach.
6- Deriving simplified calculation methods to predict the effects of beam axial
compressive force in flexural action and beam axial tensile force in catenary
action on adjacent structures.
7- The study on the RC frames in fire should be extended to 3D frames.
8- Experimental investigation on fire response of RC beams in catenary action is
necessary to give more confidence to the numerical simulation models and
assumptions made in the simplified calculation method proposed in this
research.

APPENDIX
221
APPENDIX
A1 Beam Cross-Section Bending Moment Capacity
Figure A4.1: Determination of beam cross-section bending moment capacity
𝐴𝑠 = 3 ×𝜋
4× (
6
8× 25.4)
2
= 855𝑚𝑚2
𝑎 =𝐴𝑠 𝑓𝑦
0.85 𝑓𝑐𝑚 𝐵 =
855 × 453
0.85 × 30 × 300= 50.63𝑚𝑚
𝑀𝑢 = 𝐴𝑠 𝑓𝑦 (𝑑 − 𝑎 2⁄ ) = 855 × 453 (350 − 50.63 2⁄ ) = 126𝑘𝑁.𝑚
A2 Calculation of Rotational and Lateral Stiffness of Supporting
Columns
A2.1 Rotational Stiffness KR,sup
Figure A4.2: Determination of rotational stiffness of supporting columns KR,sup
Section a-a Beam ends
3#6 3#6
Section b-b Beam mid-span
B=300mm , D=400mm ,
d=350mm
fcm=30MPa , fy=453MPa
b
b
a
a
L/2=3000
C.L.
Ec
Ec 3
4
+
3
4𝐻
1
4
1
4
1
4
H
H
1 3
4𝐻(𝐻 − 𝐷/2)
3
4𝐻
D
_ θ
Ej
Compression reinforcement is not considered
Sagging moment=hogging moment

APPENDIX
222
𝜃 =
14(𝐻 − 𝐷/2)
𝐸𝑐 𝐼+
14𝐷2
𝐸𝑗 𝐼−
12 34𝐻
(𝐻 − 𝐷 2⁄ )(𝐻 − 𝐷 2)⁄
𝐸𝑐 𝐼−
34𝐻
(𝐻 − 𝐷 2⁄ )(𝐷 2)⁄
𝐸𝑗 𝐼
−
12 (
34−
34𝐻
(𝐻 − 𝐷 2⁄ ))𝐷2
𝐸𝑗 𝐼
𝐾𝑅,𝑠𝑢𝑝 = [1
𝜃]
𝐻 = 3500 𝑚𝑚 , 𝐷 = 400 𝑚𝑚, 𝐸𝑗 = 18000 𝑀𝑃𝑎 , 𝐼 =300×3003
12, 𝐸𝑐: 𝑐ℎ𝑎𝑛𝑔𝑒𝑑
Ej is the elastic modulus of the joint panel
A2.2 Lateral Stiffness KA,sup
Figure A4.3: Determination of lateral stiffness of supporting columns KA,sup
𝛿 =
12
12(𝐻 − 𝐷 2⁄ )(𝐻 − 𝐷 2⁄ ) (
𝐻 − 𝐷 2⁄3 + 𝐷 2⁄ )
𝐸𝑐 𝐼+
12(𝐻 − 𝐷 2⁄ )
𝐷2
𝐷4
𝐸𝑗 𝐼
+
12 (
𝐻2 −
12 (𝐻 −
𝐷2))
𝐷2
𝐷6
𝐸𝑗 𝐼−
𝐻4
(𝐻 − 𝐷 2⁄ ) ((𝐻 − 𝐷 2⁄
2 + 𝐷 2⁄ )
𝐸𝑐 𝐼−
𝐻4
𝐷2
𝐷4
𝐸𝑗 𝐼
𝐾𝐴,𝑠𝑢𝑝 = [1
𝛿]
𝐻 = 3500 𝑚𝑚 , 𝐷 = 400 𝑚𝑚, 𝐸𝑗 = 18000 𝑀𝑃𝑎 , 𝐼 =300 × 3003
12, 𝐸𝑐: 𝑐ℎ𝑎𝑛𝑔𝑒𝑑
𝐻
2
-
1
2
𝐻
4
𝐻
4
𝐻
4
H
H
1
1
2(𝐻 − 𝐷/2)
1
2
D
+
δ
Ec
Ec
Ej

APPENDIX
223
A3 Values of the Stiffness and Gaps for the Horizontal Restraints
during the Tests by Yu and Tan (2013) and Yu and Tan (2014)
Table A3.1 Sub-assemblages (Yu, 2012)
Horizontal
restraints
Tension
stiffness
(kN/m)
Compression
stiffness
(kN/m)
Tension Gap
(mm)
Compression
Gap (mm)
S4
Top 100571.92 – 1.8 –
Bottom 49255.37 175277.46 3.5 – 2.1
S5
Top 160834.3 – 3.0 –
Bottom 82649.59 195634.09 4.1 – 2.4
S7
Top 108723.92 – 0.3 –
Bottom 72955.43 157282.14 2.0 – 3.8
Table A3.2 Frames (Yu, 2012)
Horizontal
restraints
Tension
stiffness
(kN/m)
Compression
stiffness (kN/m)
Tension
Gap
(mm)
Compression
Gap (mm)
F2
At beam
extension
ends
At RW
side 153678 23941 4.2 0.8
At AF
side 60055 57985 0.8 2.3
At the
top of
side
columns
At RW
side 67634 ---- 3.5 1.9
At AF
side 54114 ---- 1.7 0.3
F4
At beam
extension
ends
At RW
side 121661 ---- 1.7 4.0
At AF
side 168161 ---- 4.4 2.3
At the
top of
side
columns
At RW
side 104312 6853.49 5.3 1.0
At AF
side 32479 6853.49 1.1 1.0
Top of side
columns Top of side
columns
RW side
Beam
extension ends Beam
extension ends
AF side AF: A Frame RW: Reaction wall
C. L. Top
Bottom
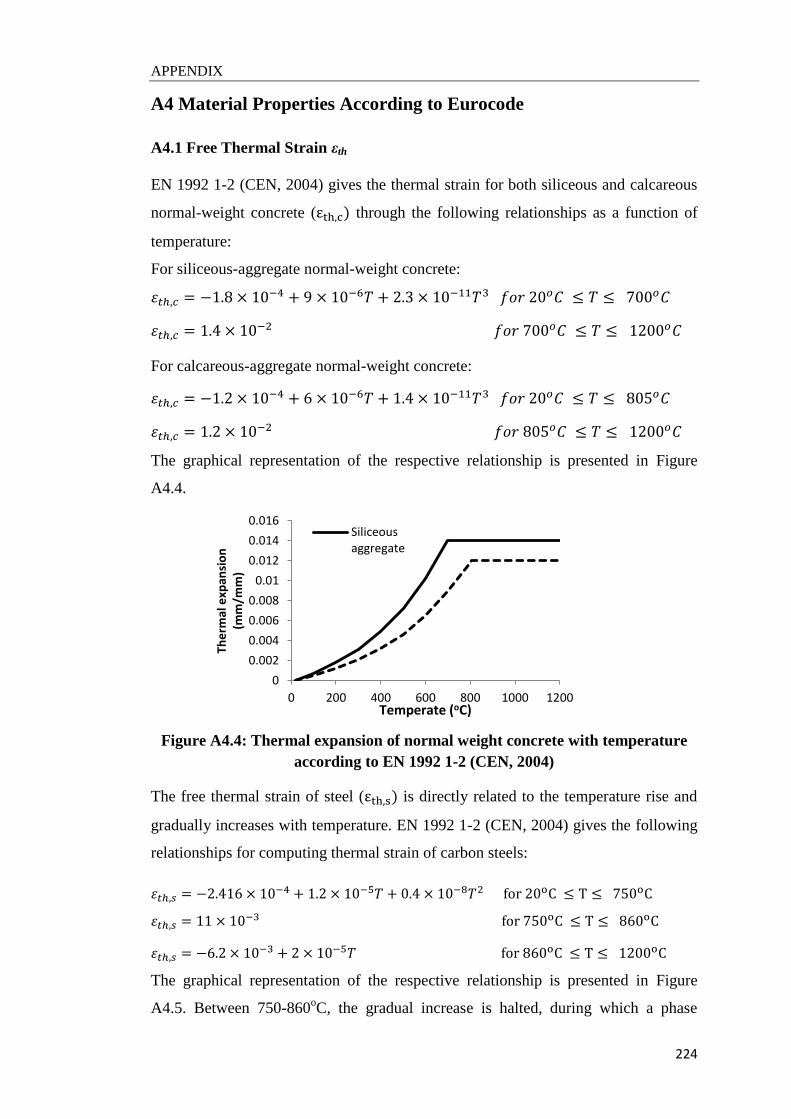
APPENDIX
224
A4 Material Properties According to Eurocode
A4.1 Free Thermal Strain εth
EN 1992 1-2 (CEN, 2004) gives the thermal strain for both siliceous and calcareous
normal-weight concrete (εth,c) through the following relationships as a function of
temperature:
For siliceous-aggregate normal-weight concrete:
휀𝑡ℎ,𝑐 = −1.8 × 10⁻⁴ + 9 × 10⁻⁶𝑇 + 2.3 × 10⁻¹¹𝑇3 𝑓𝑜𝑟 20𝑜𝐶 ≤ 𝑇 ≤ 700𝑜𝐶
휀𝑡ℎ,𝑐 = 1.4 × 10⁻² 𝑓𝑜𝑟 700𝑜𝐶 ≤ 𝑇 ≤ 1200𝑜𝐶
For calcareous-aggregate normal-weight concrete:
휀𝑡ℎ,𝑐 = −1.2 × 10⁻⁴ + 6 × 10⁻⁶𝑇 + 1.4 × 10⁻¹¹𝑇3 𝑓𝑜𝑟 20𝑜𝐶 ≤ 𝑇 ≤ 805𝑜𝐶
휀𝑡ℎ,𝑐 = 1.2 × 10⁻² 𝑓𝑜𝑟 805𝑜𝐶 ≤ 𝑇 ≤ 1200𝑜𝐶
The graphical representation of the respective relationship is presented in Figure
A4.4.
Figure A4.4: Thermal expansion of normal weight concrete with temperature
according to EN 1992 1-2 (CEN, 2004)
The free thermal strain of steel (εth,s) is directly related to the temperature rise and
gradually increases with temperature. EN 1992 1-2 (CEN, 2004) gives the following
relationships for computing thermal strain of carbon steels:
휀𝑡ℎ,𝑠 = −2.416 × 10⁻⁴ + 1.2 × 10⁻⁵𝑇 + 0.4 × 10⁻⁸𝑇2 for 20oC ≤ T ≤ 750oC
휀𝑡ℎ,𝑠 = 11 × 10−3 for 750oC ≤ T ≤ 860oC
휀𝑡ℎ,𝑠 = −6.2 × 10⁻³ + 2 × 10⁻⁵𝑇 for 860oC ≤ T ≤ 1200oC
The graphical representation of the respective relationship is presented in Figure
A4.5. Between 750-860oC, the gradual increase is halted, during which a phase
0
0.002
0.004
0.006
0.008
0.01
0.012
0.014
0.016
0 200 400 600 800 1000 1200
The
rmal
exp
ansi
on
(m
m/m
m)
Temperate (oC)
Siliceousaggregate
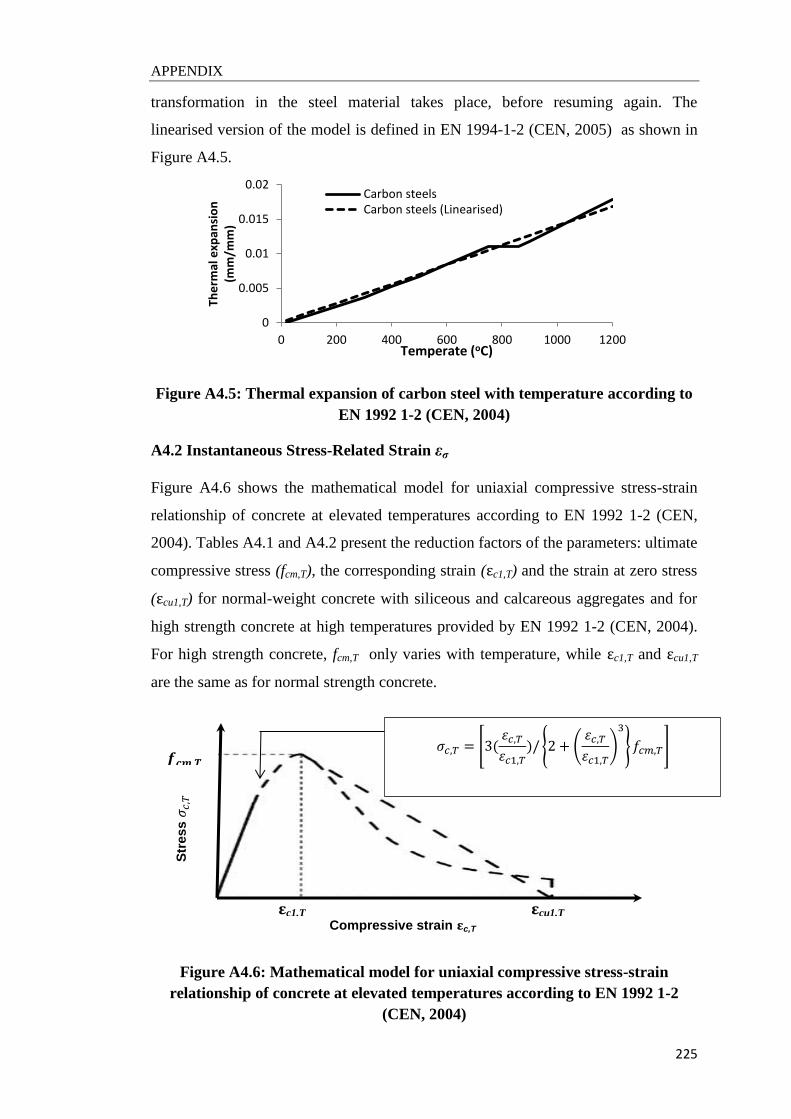
APPENDIX
225
transformation in the steel material takes place, before resuming again. The
linearised version of the model is defined in EN 1994-1-2 (CEN, 2005) as shown in
Figure A4.5.
Figure A4.5: Thermal expansion of carbon steel with temperature according to
EN 1992 1-2 (CEN, 2004)
A4.2 Instantaneous Stress-Related Strain εσ
Figure A4.6 shows the mathematical model for uniaxial compressive stress-strain
relationship of concrete at elevated temperatures according to EN 1992 1-2 (CEN,
2004). Tables A4.1 and A4.2 present the reduction factors of the parameters: ultimate
compressive stress (fcm,T), the corresponding strain (εc1,T) and the strain at zero stress
(εcu1,T) for normal-weight concrete with siliceous and calcareous aggregates and for
high strength concrete at high temperatures provided by EN 1992 1-2 (CEN, 2004).
For high strength concrete, fcm,T only varies with temperature, while εc1,T and εcu1,T
are the same as for normal strength concrete.
Figure A4.6: Mathematical model for uniaxial compressive stress-strain
relationship of concrete at elevated temperatures according to EN 1992 1-2
(CEN, 2004)
0
0.005
0.01
0.015
0.02
0 200 400 600 800 1000 1200
The
rmal
exp
ansi
on
(m
m/m
m)
Temperate (oC)
Carbon steelsCarbon steels (Linearised)
𝛆cu1,T 𝛆c1,T
𝒇𝒄𝒎,𝑻 𝜎𝑐,𝑇 = 3(
𝜀𝑐,𝑇𝜀𝑐1,𝑇
)/ 2 + (𝜀𝑐,𝑇𝜀𝑐1,𝑇
)
3
𝑓𝑐𝑚,𝑇
Compressive strain 𝛆c,T
Str
es
s 𝜎𝑐,𝑇

APPENDIX
226
Table A4.1: Parameters of stress-strain relationship of normal-weight concrete
at elevated temperatures according to EN 1992 1-2 (CEN, 2004)
Temperature
T (oC)
Siliceous aggregates Calcareous aggregates
𝑓𝑐𝑚,𝑇/𝑓𝑐𝑚 휀𝑐1,𝑇 εcu1,T 𝑓𝑐𝑚,𝑇/𝑓𝑐𝑚 εc1,T εcu1,T
20 1.00 0.0025 0.0200 1.00 0.0025 0.0200
100 1.00 0.0040 0.0225 1.00 0.0040 0.0225
200 0.95 0.0055 0.0250 0.97 0.0055 0.0250
300 0.85 0.0070 0.0275 0.91 0.0070 0.0275
400 0.75 0.0100 0.0300 0.85 0.0100 0.0300
500 0.60 0.0150 0.0325 0.74 0.0150 0.0325
600 0.45 0.0250 0.0350 0.60 0.0250 0.0350
700 0.30 0.0250 0.0375 0.43 0.0250 0.0375
800 0.15 0.0250 0.0400 0.27 0.0250 0.0400
900 0.08 0.0250 0.0425 0.15 0.0250 0.0425
1000 0.04 0.0250 0.0450 0.06 0.0250 0.0450
1100 0.01 0.0250 0.0475 0.02 0.0250 0.0475
1200 0.00 ----- ----- 0.00 ----- -----
Table A4.2: Strength reduction factors for high strength concrete at elevated
temperatures according to EN 1992 1-2 (CEN, 2004)
Figure A4.7 shows uniaxial compressive stress-strain relationship of concrete at
elevated temperatures for fcm=30MPa.
Temperature
T (oC)
𝑓𝑐𝑚,𝑇/𝑓𝑐𝑚
Class 1 Class 2 Class 3
20 1.00 1.00 1.00
50 1.00 1.00 1.00
100 0.90 0.75 0.75
200 0.90 0.75 0.70
250 0.90 0.75 0.675
300 0.85 0.75 0.65
400 0.75 0.75 0.45
500 0.60 0.60 0.30
600 0.45 0.45 0.25
700 0.30 0.30 0.20
800 0.15 0.15 0.15
900 0.08 0.113 0.08
1000 0.04 0.075 0.04
1100 0.01 0.038 0.01
1200 0.00 0.00 0.00
Class 1 for concrete C55/67 and C60/75
Class 2 for concrete C70/85 and C80/95
Class 3 for concrete C90/105
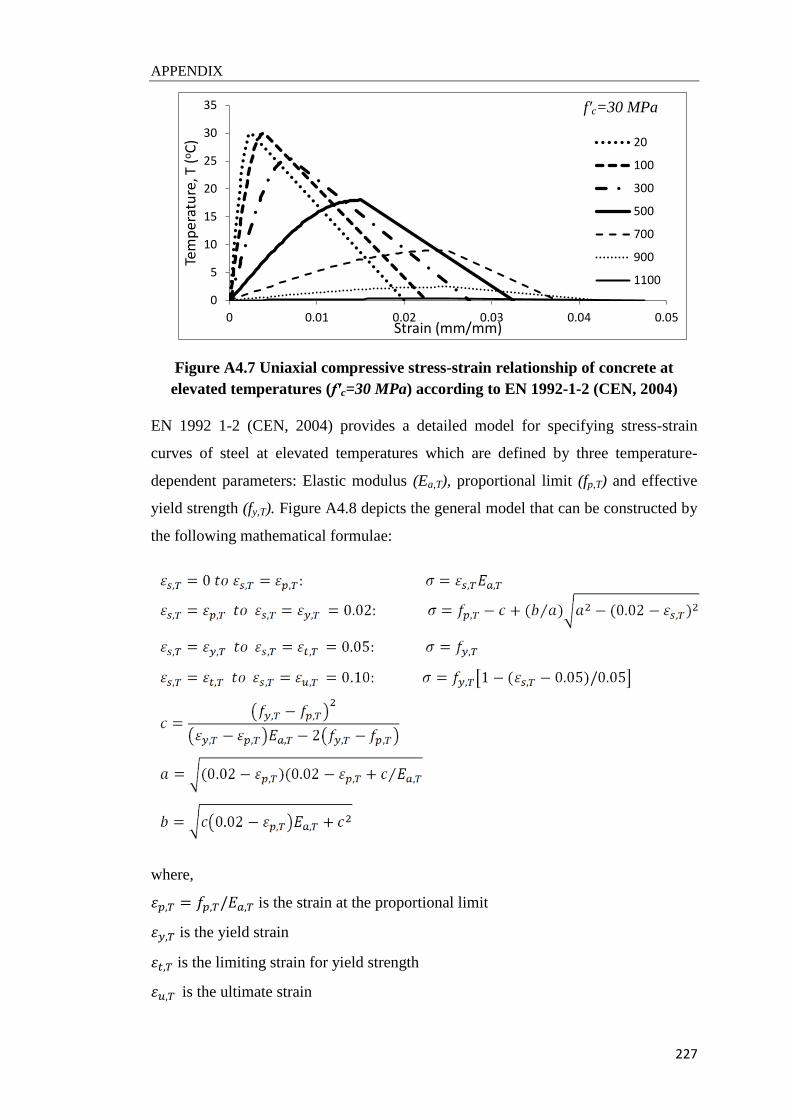
APPENDIX
227
Figure A4.7 Uniaxial compressive stress-strain relationship of concrete at
elevated temperatures (f′c=30 MPa) according to EN 1992-1-2 (CEN, 2004)
EN 1992 1-2 (CEN, 2004) provides a detailed model for specifying stress-strain
curves of steel at elevated temperatures which are defined by three temperature-
dependent parameters: Elastic modulus (Ea,T), proportional limit (fp,T) and effective
yield strength (fy,T). Figure A4.8 depicts the general model that can be constructed by
the following mathematical formulae:
where,
휀𝑝,𝑇 = 𝑓𝑝,𝑇/𝐸𝑎,𝑇 is the strain at the proportional limit
휀𝑦,𝑇 is the yield strain
휀𝑡,𝑇 is the limiting strain for yield strength
휀𝑢,𝑇 is the ultimate strain
0
5
10
15
20
25
30
35
0 0.01 0.02 0.03 0.04 0.05
Tem
per
atu
re, T
(oC
)
Strain (mm/mm)
20
100
300
500
700
900
1100
f′c=30 MPa
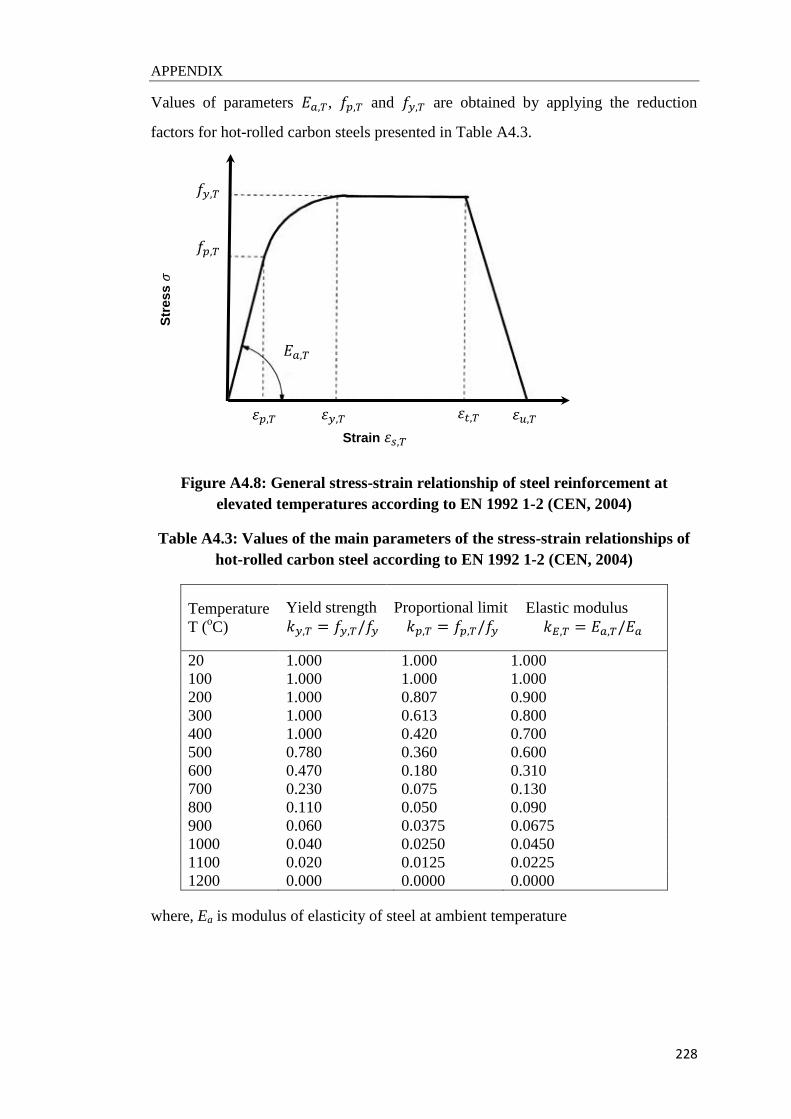
APPENDIX
228
Values of parameters 𝐸𝑎,𝑇, 𝑓𝑝,𝑇 and 𝑓𝑦,𝑇 are obtained by applying the reduction
factors for hot-rolled carbon steels presented in Table A4.3.
Figure A4.8: General stress-strain relationship of steel reinforcement at
elevated temperatures according to EN 1992 1-2 (CEN, 2004)
Table A4.3: Values of the main parameters of the stress-strain relationships of
hot-rolled carbon steel according to EN 1992 1-2 (CEN, 2004)
Temperature
T (oC)
Yield strength
𝑘𝑦,𝑇 = 𝑓𝑦,𝑇/𝑓𝑦
Proportional limit
𝑘𝑝,𝑇 = 𝑓𝑝,𝑇/𝑓𝑦
Elastic modulus
𝑘𝐸,𝑇 = 𝐸𝑎,𝑇/𝐸𝑎
20 1.000 1.000 1.000
100 1.000 1.000 1.000
200 1.000 0.807 0.900
300 1.000 0.613 0.800
400 1.000 0.420 0.700
500 0.780 0.360 0.600
600 0.470 0.180 0.310
700 0.230 0.075 0.130
800 0.110 0.050 0.090
900 0.060 0.0375 0.0675
1000 0.040 0.0250 0.0450
1100 0.020 0.0125 0.0225
1200 0.000 0.0000 0.0000
where, Ea is modulus of elasticity of steel at ambient temperature
𝜀𝑢,𝑇 𝜀𝑝,𝑇 𝜀𝑦,𝑇
𝑓𝑦,𝑇
𝑓𝑝,𝑇
𝜀𝑡,𝑇
𝐸𝑎,𝑇
Strain 𝜀𝑠,𝑇
Str
es
s 𝜎

APPENDIX
229
A4.3 Specific Heat
The specific heat of concrete cp provided in EN 1992-1-2 (CEN, 2004), which is
valid for both types of normal-weight concrete siliceous and calcareous aggregate
concrete (in J/kg K) is as follows:
𝑐𝑝 = 900 𝑓𝑜𝑟 20𝑜𝐶 ≤ 𝑇 ≤ 100𝑜𝐶
𝑐𝑝 = 900 + (𝑇 − 100) 𝑓𝑜𝑟 100𝑜𝐶 ≤ 𝑇 ≤ 200𝑜𝐶
𝑐𝑝 = 1000 + (𝑇 − 200)/2 𝑓𝑜𝑟 200𝑜𝐶 ≤ 𝑇 ≤ 400𝑜𝐶
𝑐𝑝 = 1100 𝑓𝑜𝑟 400𝑜𝐶 ≤ 𝑇 ≤ 1200𝑜𝐶
EN 1992-1-2 (CEN, 2004) considers the effect of moisture in concrete explicitly
through adding a peak cp,peak to the above equations at 115𝑜𝐶 and then decaying 𝑐𝑝
linearly to 1000 kJ/kg K at 200𝑜. Table A4.4 gives cp,peak values for different
moisture contents (linear interpolation between them is permitted), and Figure A4.9
plots the evolution of specific heat with temperature.
Table A4.4: Values of cp,peak for different moisture contents given by EN 1992-1-
2 (CEN, 2004)
Moisture content u (%) cp,peak (J/kgK)
0 900
1.5 1470
3.0 2020
10.0 5600
Figure A4.9: Variation of the specific heat capacity of concrete with
temperature according to EN 1994-1-2 (CEN, 2004)
0.6
0.8
1
1.2
1.4
1.6
1.8
2
2.2
0 200 400 600 800 1000 1200
Spe
cifi
c h
eat
cap
acit
y (k
J/kg
.K)
Temperate (oC)
u=0%
u=3%
u=1.5%

APPENDIX
230
A4.4 Density
Th empirical model given in EN 1994-1-2 (CEN, 2005) that describes the density of
concrete 𝜌𝑐,𝑇 as a function of temperature is used as follows:
𝜌𝑐,𝑇 = 𝜌𝑐,20 𝑓𝑜𝑟 20𝑜𝐶 ≤ 𝑇 ≤ 115𝑜𝐶
𝜌𝑐,𝑇 = 𝜌𝑐,20[1 − 0.02(𝑇 − 115)/85] 𝑓𝑜𝑟 115𝑜𝐶 ≤ 𝑇 ≤ 200𝑜𝐶
𝜌𝑐,𝑇 = 𝜌𝑐,20[0.98 − 0.03(𝑇 − 200)/200] 𝑓𝑜𝑟 200𝑜𝐶 ≤ 𝑇 ≤ 400𝑜𝐶
𝜌𝑐,𝑇 = 𝜌𝑐,20[0.95 − 0.07(𝑇 − 400)/800] 𝑓𝑜𝑟 400𝑜𝐶 ≤ 𝑇 ≤ 1200𝑜𝐶
where, 𝜌𝑐,20 is concrete density at ambient temperature taken to be 2300 kg/m3
A4.5 Thermal Conductivity
The conductivity values (W/mK) lie between the following upper and lower limits,
which are graphically shown in Figure A4.10
upper limit: 𝜆𝑐 = 2 − 0.2451 (𝑇
100) + 0.0107(
𝑇
100)2
lower limit: 𝜆𝑐 = 1.36 − 0.136 (𝑇
100) + 0.0057(
𝑇
100)2
Figure A4.10 Thermal conductivity of concrete as a function of temperature
according to EN 1994-1-2 (CEN, 2004)
0
0.2
0.4
0.6
0.8
1
1.2
1.4
1.6
1.8
2
2.2
0 200 400 600 800 1000 1200
The
rmal
co
nd
uct
ivit
y (W
/mK
)
Temperate (oC)
Upper limit
Lower limit

REFERENCES
231
REFERENCES
ABAQUS 2013. ABAQUS analysis user’s manual, version 6.13-1, ABAQUS Inc.
ALI, F., NADJAI, A. & CHOI, S. 2010. Numerical and experimental investigation of the
behavior of high strength concrete columns in fire. Engineering Structures, 32,
1236-1243.
ASTM E119 2008. Standard methods of fire test of building construction and materials.
American society of testing and materials, west Conshohocken, PA.
BAILEY, C. 2002. Holistic behaviour of concrete buildings in fire. Proceedings of the ICE -
Structures and Buildings, 152, 199-212.
BAO, Y., LEW, H. & KUNNATH, S. 2014. Modeling of Reinforced Concrete Assemblies
under Column-Removal Scenario. Journal of Structural Engineering, 140,
04013026.
BAŽANT, Z. & CHERN, J. 1987. Stress‐Induced Thermal and Shrinkage Strains in
Concrete. Journal of Engineering Mechanics, 113, 1493-1511.
BEITEL, J. & IWANKIW, N. 2002. Analysis of Needs and Existing Capabilities for Full-
Scale Fire Resistance Testing. NIST GCR 02-843.
BIONDINI, F. & NERO, A. 2011. Cellular Finite Beam Element for Nonlinear Analysis of
Concrete Structures under Fire. Journal of Structural Engineering, 137, 543-558.
BRATINA, S., PLANINC, I., SAJE, M. & TURK, G. 2003. Non-linear fire-resistance
analysis of reinforced concrete beams. Structural engineering and mechanics, 16,
695-712.
BRE 2003. Building Research Establishment. Client report: results an observations from
full-scale fire test at BRE Cardington.
BUCHANAN, A. H. 2002. Structural design for fire safety, John Wiley & Sons Ltd.,
Chichester, England.
CAPUA, D. D. & MARI, A. R. 2007. Nonlinear analysis of reinforced concrete cross-
sections exposed to fire. Fire Safety Journal, 42, 139-149.
REFERENCES
232
CEB 1991. Comite Euro-International du Beton (CEB). CEB-FIP model code 1990 design
code, Thomas Telford, London, UK.
CEN 2002. BS EN 1991-1-2: Eurocode 1: Actions on structures: Part 1-2: General actions –
Actions on structures exposed to fire. British Standards Institution.
CEN 2004. BS EN 1992-1-2: Eurocode 2: Design of concrete structures: Part 1-1: General
rules-structural fire design. British Standards Institution.
CEN 2005. BS EN 1994-1-2: Design of composite steel and concrete structures: Part 1-2:
General rules-Structural fire design . British Standards Institution.
CHOI, E. G. & SHIN, Y. S. 2011. The structural behavior and simplified thermal analysis of
normal-strength and high-strength concrete beams under fire. Engineering
Structures, 33, 1123-1132.
CHOI, H. & KIM, J. 2011. Progressive collapse-resisting capacity of RC beam-column sub-
assemblage. Magazine of Concrete Research, 63(4), 297-310.
DOTREPPE, J. C. & FRANSSEN, J. M. 1985. The use of numerical models for the fire
analysis of reinforced concrete and composite structures. Engineering Analysis, 2,
67-74.
DWAIKAT, M. 2009. Flexural response of reinforced concrete beams exposed to fire. PhD
thesis, Miscigan State University.
DWAIKAT, M. & KODUR, V. 2009a. Response of Restrained Concrete Beams under
Design Fire Exposure. Journal of Structural Engineering, 135, 1408-1417.
DWAIKAT, M. B. & KODUR, V. K. R. 2008. A numerical approach for modeling the fire
induced restraint effects in reinforced concrete beams. Fire Safety Journal, 43, 291-
307.
DWAIKAT, M. B. & KODUR, V. K. R. 2009b. Hydrothermal model for predicting fire-
induced spalling in concrete structural systems. Fire Safety Journal, 44, 425-434.
EL-FITIANY, S. F. & YOUSSEF, M. A. 2014a. Interaction diagrams for fire-exposed
reinforced concrete sections. Engineering Structures, 70, 246-259.
EL-FITIANY, S. F. & YOUSSEF, M. A. 2014b. Simplified Method to Analyze Continuous
Reinforced Concrete Beams during Fire Exposure. ACI Structural Journal, 111(1),
145-156.

REFERENCES
233
ELLINGWOOD, B. & LIN, T. 1991. Flexure and Shear Behavior of Concrete Beams during
Fires. Journal of Structural Engineering, 117, 440-458.
ELLOBODY, E. & BAILEY, C. G. 2009. Modelling of unbonded post-tensioned concrete
slabs under fire conditions. Fire Safety Journal, 44, 159-167.
ELLOBODY, E. A. M. & BAILEY, C. G. 2008. Modelling of bonded post-tensioned
concrete slabs in fire. Proceedings of the Institution of Civil Engineers - Structures
and Buildings, 161, 311-323.
ERVINE, A., GILLIE, M., STRATFORD, T. J. & PANKAJ, P. 2012. Thermal Propagation
through Tensile Cracks in Reinforced Concrete. Journal of Materials in Civil
Engineering, 24, 516-522.
GAO, W.-Y., DAI, J.-G. & TENG, J.-G. 2017. Fire resistance of RC beams under design fire
exposure. Magazine of Concrete Research, 69, 402-423.
GAO, W. Y., DAI, J.-G., TENG, J. G. & CHEN, G. M. 2013. Finite element modeling of
reinforced concrete beams exposed to fire. Engineering Structures, 52, 488-501.
GERNAY, T. 2012. Effect of Transient Creep Strain Model on the Behavior of Concrete
Columns Subjected to Heating and Cooling. Fire Technology, 48, 313-329.
GERNAY, T. & FRANSSEN, J. M. 2012. A formulation of the Eurocode 2 concrete model
at elevated temperature that includes an explicit term for transient creep. Fire Safety
Journal, 51, 1-9.
GUO, Z. & SHI, X. 2011. Chapter 10 - Behavior of Statically Indeterminate Structures at
Elevated Temperatures. Experiment and Calculation of Reinforced Concrete at
Elevated Temperatures. Boston: Butterworth-Heinemann.
HERTZ, K. D. 2003. Limits of spalling of fire-exposed concrete. Fire Safety Journal, 38,
103-116.
HOU, J. & SONG, L. 2016. Progressive Collapse Resistance of RC Frames under a Side
Column Removal Scenario: The Mechanism Explained. International Journal of
Concrete Structures and Materials, 10, 237-247.
HUANG, Z. 2010. Modelling of reinforced concrete structures in fire. Proceedings of the
ICE - Engineering and Computational Mechanics,163, 43-53.
REFERENCES
234
HUANG, Z., BURGESS, I. & PLANK, R. 2009. Three-Dimensional Analysis of Reinforced
Concrete Beam-Column Structures in Fire. Journal of Structural Engineering, 135,
1201-1212.
ISO 834-1975. 1975 Fire resistance tests - elements of building construction. International
Organization for Standardization.
KANG, S.-W. & HONG, S.-G. 2004. Analytical method for the behaviour of a reinforced
concrete flexural member at elevated temperatures. Fire and Materials, 28, 227-235.
KHOURY, G. A. 2000. Effect of fire on concrete and concrete structures. Progress in
Structural Engineering and Materials, 2, 429-447.
KIM, J. & YU, J. 2012. Analysis of reinforced concrete frames subjected to column loss.
Magazine of Concrete Research, 64, 21-33.
KODUR, V. & DWAIKAT, M. 2012. Fire-induced spalling in reinforced concrete beams.
Proceedings of the Institution of Civil Engineers - Structures and Buildings, 165,
347-359.
KODUR, V., DWAIKAT, M. & RAUT, N. 2009. Macroscopic FE model for tracing the fire
response of reinforced concrete structures. Engineering Structures, 31, 2368-2379.
KODUR, V. K. R. & AGRAWAL, A. 2016. An approach for evaluating residual
capacity of reinforced concrete beams exposed to fire. Engineering
Structures, 110, 293-306.
KODUR, V. K. R. & DWAIKAT, M. 2007. Performance-based Fire Safety Design of
Reinforced Concrete Beams. Journal of Fire Protection Engineering, 17, 293-320.
KODUR, V. K. R. & DWAIKAT, M. 2008. A numerical model for predicting the fire
resistance of reinforced concrete beams. Cement and Concrete Composites, 30, 431-
443.
KODUR, V. K. R. & DWAIKAT, M. B. 2011. Design equation for predicting fire resistance
of reinforced concrete beams. Engineering Structures, 33, 602-614.
LEW, YIHAI BAO, SANTIAGO PUJOL & METE, A. S. 2014. Experimental Study of
Reinforced Concrete Assemblies under Column Removal Scenario. ACI Structural
Journal, 111(4), 881-892.
REFERENCES
235
LI, S., SHAN, S., ZHAI, C. & XIE, L. 2016. Experimental and numerical study on
progressive collapse process of RC frames with full-height infill walls. Engineering
Failure Analysis, 59, 57-68.
LIN T.D, GUSTAFEROO A. H & ABRAMS M. S 1981. Fire Endurance of Continuous
Reinforced Concrete Beams. R&D Bulletin RD072.01B, Portland Cement
Association, IL, USA.
LUE TAERWE 2007. From Member Design to Global Structural Behaviour. Internaltion
workshop, Fire Design of Concrete Structures-From Materials Modelling to
Structural Performance, University of Coimbra-Portugal-November.
MAEKAWA, K., A. PIMANMAS & H. OKAMURA 2003. Nonlinear mechanics of
reinforced concrete. Spon Press Taylor & Francis Group.
NEVES, I. C., RODRIGUES, J. P. C. & LOUREIRO, A. D. P. 1996. Mechanical Properties
of Reinforcing and Prestressing Steels after Heating. Journal of Materials in Civil
Engineering, 8, 189-194.
ORTON, J. O. JIRSA & BAYRAK, O. 2009. Carbon Fiber-Reinforced Polymer for
Continuity in Existing Reinforced Concrete Buildings Vulnerable to Collapse. ACI
Structural Journal, 106(5), 608-616.
OŽBOLT, J., BOŠNJAK, J., PERIŠKIĆ, G. & SHARMA, A. 2014. 3D numerical analysis
of reinforced concrete beams exposed to elevated temperature. Engineering
Structures, 58, 166-174.
PHAM, A. T., TAN, K. H. & YU, J. 2017. Numerical investigations on static and dynamic
responses of reinforced concrete sub-assemblages under progressive collapse.
Engineering Structures, 149, 2-20.
PURKISS, J. A. 2007. Fire safety engineering design of structures. Elsevier Press.
QIAN, K., LI, B. & MA, J.-X. 2015. Load-Carrying Mechanism to Resist Progressive
Collapse of RC Buildings. Journal of Structural Engineering, 141(2): 04014107-1.
RAOUFFARD, M. M. & NISHIYAMA, M. 2015. Fire Resistance of Reinforced Concrete
Frames Subjected to Service Load: Part 1. Experimental Study. Journal of Advanced
Concrete Technology, 13, 554-563.
REGAN, P. 1975. Catenary action in damage concrete structures. ACI Special Publication,
48, 191-224.

REFERENCES
236
RIVA, P. & FRANSSEN, J. M. 2008. Non-linear and plastic analysis of RC beams subjected
to fire. Structural Concrete, 9, 31-43.
SADEK, F., MAIN, J. A., LEW, H. S. & BAO, Y. 2011. Testing and Analysis of Steel and
Concrete Beam-Column Assemblies under a Column Removal Scenario. Journal of
Structural Engineering, 137, 881-892.
SALEM & MAEKAWA, K. 2004. Pre- and Postyield Finite Element Method Simulation of
Bond of Ribbed Reinforcing Bars. Journal of Structural Engineering, 130, 671-680.
SHI, X. & GUO, Z. 1997. Experimental investigation of behavior of reinforced concrete
continuous beams at elevated temperature. China Civil Engineering Journal, 30, 26-
34.
SHI, X., TAN, T.-H., TAN, K.-H. & GUO, Z. 2004. Influence of Concrete Cover on Fire
Resistance of Reinforced Concrete Flexural Members. Journal of Structural
Engineering, 130, 1225-1232.
STEVENS, S. M. UZUMERI, COLLINS, M. P. & WILL, G. T. 1991. Constitutive Model
for Reinforced Concrete Finite Element Analysis. ACI Structural Journal, 88(1), 49-
59.
STINGER, S. M. & ORTON, S. L. 2013. Experimental Evaluation of Disproportionate
Collapse Resistance in Reinforced Concrete Frames. ACI Structural Journal, 110(3),
521-530.
TORELLI, G., GILLIE, M., MANDAL, P. & TRAN, V.-X. 2017. A multiaxial load-induced
thermal strain constitutive model for concrete. International Journal of Solids and
Structures, 108, 115-125.
TORELLI, G., MANDAL, P., GILLIE, M. & TRAN, V.-X. 2016. Concrete strains under
transient thermal conditions: A state-of-the-art review. Engineering Structures, 127,
172-188.
USMANI, A. S., ROTTER, J. M., LAMONT, S., SANAD, A. M. & GILLIE, M. 2001.
Fundamental principles of structural behaviour under thermal effects. Fire Safety
Journal, 36, 721-744.
WANG, Y. C., BURGESS, I. W., WALD, F. & GILLIE, M. 2013. Performance-based fire
engineering of structures. London, Taylor & Francis Group.
REFERENCES
237
WU, B. & LU, J. Z. 2009. A numerical study of the behaviour of restrained RC beams at
elevated temperatures. Fire Safety Journal, 44, 522-531.
XU, Q., HAN, C., WANG, Y. C., LI, X., CHEN, L. & LIU, Q. 2015. Experimental and
numerical investigations of fire resistance of continuous high strength steel
reinforced concrete T-beams. Fire Safety Journal, 78, 142-154.
YOUSSEF, M. A. & MOFTAH, M. 2007. General stress–strain relationship for concrete at
elevated temperatures. Engineering Structures, 29, 2618-2634.
YU, J. 2012. Structural behaviour of reinforced concrete frames subjected to progressive
collapse. PhD thesis, Nanyang Technological University.
YU, J. & TAN, K. 2013. Structural Behavior of RC Beam-Column Subassemblages under a
Middle Column Removal Scenario. Journal of Structural Engineering, 139, 233-
250.
YU, J. & TAN, K. 2014. Special Detailing Techniques to Improve Structural Resistance
against Progressive Collapse. Journal of Structural Engineering, 140, 04013077.
ZHA, X. X. 2003. Three-dimensional non-linear analysis of reinforced concrete members in
fire. Building and Environment, 38, 297-307.
ZHAOHUI, H. & ANDREW, P. 1997. Nonlinear Finite Element Analysis of Planar
Reinforced Concrete Members Subjected to Fires. ACI Structural Journal, 94(3),
272-281.
Related Documents