WHOLE GENOME BASED CHARACTERIZATION OF INDIGENOUS CHICKEN POPULATIONS IN ETHIOPIA THESIS SUBMITTED TO THE DEPARTMENT OF MICROBIAL, CELLULAR AND MOLECULAR BIOLOGY IN PARTIAL FULFILMENT OF THE REQUIREMENTS FOR THE AWARD OF THE DEGREE OF DOCTOR OF PHILOSOPHY IN APPLIED GENETICS BY: ADEBABAY KEBEDE BELEW November, 2018 Addis Ababa University Addis Ababa, Ethiopia

Welcome message from author
This document is posted to help you gain knowledge. Please leave a comment to let me know what you think about it! Share it to your friends and learn new things together.
Transcript

WHOLE GENOME BASED CHARACTERIZATION OF
INDIGENOUS CHICKEN POPULATIONS IN ETHIOPIA
THESIS SUBMITTED TO THE DEPARTMENT OF
MICROBIAL, CELLULAR AND MOLECULAR BIOLOGY
IN PARTIAL FULFILMENT OF THE REQUIREMENTS
FOR THE AWARD OF THE DEGREE OF
DOCTOR OF PHILOSOPHY IN APPLIED GENETICS
BY:
ADEBABAY KEBEDE BELEW
November, 2018
Addis Ababa University
Addis Ababa, Ethiopia

ii
Addis Ababa University
School of Graduate studies
This is to certify that the dissertation prepared by Adebabay Kebede Belew entitled: “WHOLE
GENOME BASED CHARACTERIZATION OF INDIGENOUS CHICKEN
POPULATIONS IN ETHIOPIA submitted in fulfilment of the requirements for the Degree
of Doctor of Philosophy in Applied Genetics” complies with the regulations of the University
and meets the accepted standards with respect to originality and quality.
Advisors and supervisors:
Dr. Kassahun Tesfaye __________________ _______________________
University supervisor Signature Date
Gurja Belay (PhD) __________________ _______________________
University supervisor Signature Date
Prof. Olivier Hanotte ___________________ _______________________
Project suprevisor Signature Date
Tadelle Dessie (PhD) ___________________ _______________________
Project supervisor Signature Date
________________________________________
Chair of Department or Graduate Program Coordinator

iii
DECLARATION
I, Adebabay Kebede Belew, hereby declare that this dissertation and its entirety is my own original
work and no part of this has been previously presented or submitted for examination anywhere
else. All assistance towards the synthesis of this thesis and entire references of others contained
herein have been duly acknowledged.
“The chicken that digs for food will not sleep hungry”. ~Bayombe Proverb
December, 2018

iv
DEDICATION
This thesis is dedicated to the memory of my late mother Mrs. Alaminie Tarekegn Mersha and
father Sergeant Kebede Belew Mengesha.

v
ACKNOWLEDGEMENTS
First and for most, my heartfelt thank is to the almighty GOD and his mother HAIL VIRGIN
MADAM MARY, my mother of perpetual help, for keeping me to this very special day and
smoothing the rugged road to my achievement.
Several people worth my acknowledgment for contributing to my success in one way or another.
My special tribute goes to my supervisors, Dr. Kassahun Tesfaye, Dr. Gurja Belay, Prof. Olivier
Hanotte and Dr. Tadelle Dessie for their continuous mentoring, encouragement and close follow
up during my study. Dr. Kassahun and Dr. Gurja, I can’t forget your valuable advice and
continuous support since my admission to AAU. Prof. Olivier and Dr. Tadelle, I have no special
words for your unforgettable deeds when I was hopeless to secure the budget for my Ph.D. study.
You really dragged me out from my interwoven academic problems and lifted me up to this level.
Dr. Biru Yitaferu, your role for my success is unforgettable as the director general of Amhara
Regional Institute. Among others, I can underline your honest understanding of my problems
which I thank you a lot. My wife, Senait Mekit, I well know that you shouldered a big
responsibility in managing the family in my absence. My beloved kids, Petros, Tsion, Aaron, and
Aleph Adebabay, I was away from you and didn’t contribute a lot as a father in those study years
for the best of the family. May God grow you in wisdom and richly bless you. My dear brother
Ayalew Kebede, I won’t forget your contribution for my development in life. My appreciation also
extends to my sister in law, Zufan Yirga and my wonderful nieces Kalkidan, Liya and Bethlehem
Ayalew for their kindness and hospitality during my stay as a member of the family.

vi
My utmost appreciation also goes to Bioscience for Eastern and Central Africa (BeCA) which
gave me the platform and good exposure for molecular laboratory Analysis. This study was
supported by the BecA-ILRI Hub through the Africa Biosciences Challenge Fund (ABCF)
program. The ABCF Program is funded by the Australian Department for Foreign Affairs and
Trade (DFAT) through the BecA-CSIRO partnership; the Syngenta Foundation for Sustainable
Agriculture (SFSA); the Bill & Melinda Gates Foundation (BMGF); the UK Department for
International Development (DFID) and; the Swedish International Development. Part of the cost
were also funded by the Bill and Melinda Gates Foundation and with UK aid from the UK
Government’s Department for International Development (Grant Agreement OPP1127286) under
the auspices of the Centre for Tropical Livestock Genetics and Health (CTLGH), established
jointly by the University of Edinburgh, SRUC (Scotland’s Rural College), and the International
Livestock Research Institute. The findings and conclusions contained within are those of the
authors and do not necessarily reflect positions or policies of the Bill & Melinda Gates Foundation
nor the UK Government. Whole blood sampling costs and logistics were covered by African
Chicken Genetic Gain project - International Livestock Research Institute. My acknowledgment
is also extended to Amhara Agricultural Research Institute and Addis Ababa University for the
overall support during the study.
Dr. Roger Pelle, Valerian Aloo, and Dr. Ekaya wellington and other staffs of BecA also deserve
my heartfelt appreciation. I am also very grateful to Dr. Dereje Beyene for his spicy encouragement
and advice during my study. Michael Temesgen, Dr. Temesgen Jemberie, Eshetu Zerihun,
Netsanet Zergaw, Fasil Getachew, Tesfahun Alemayehu, Kelem Mamo, Ayda Tegenu, Wubalem
Dejene, Kumilachew Geremew, Lidia Abebe, Mekonnen Girma, Haymanot Addisu, I all thank

vii
you for your mega help and hospitality during my stay as a graduate fellow of ACGG-ILRI-Addis.
Kidist Teferedegn of Addis Ababa University and Yalem Tsehay Tibebu of Amhara Regional
Agricultural Research Institute also deserves my duly acknowledgment for their support in
facilitating recommendation letters from the respective organizations. I am also indebted to Dr.
Getinet Assefa and Dr. Wondmenh Esatu of the Ethiopian Institute of Agricultural Research
(EIAR) and they deserve my appreciation. My gratitude also extends to staffs of CTLGH Nairobi
particularly Eric Anyona and Elvira Omondi for their support during my stay in Nairobi. Staffs of
Andassa Livestock Research Centre also worth much of my respect for their kind help. Dr.
Likawent Yiheyis, Dr. Yeshwas Ferede, Dr. Agegnehu Shibabaw, Dr. Getnet Mekuriaw, Dr.
Mengistie Taye, Muhammed Adem, Agraw Amane, Gebresilassie Gebru, Maria Lozano, Dejenie
Sahlu, Mengistu Asmamaw, Endashaw Terefe thanks a lot for your companion and encouragement
during the course of my study. Tadesse Asirat, Dr. Degefie Tibebe, your support in the skills of
basics of GIS has helped me a lot. My special thanks also go to Dr. Almas Gheyas, Dr. Lawal
Raman Akinyanju, Adriana Vallejio, Abdulfatai Tijjani, Ahmed Aljumily, Abulgasim Ahbara, Akil
Alshawi, and Ibrahim Akinci for their mentoring in my stay at the University of Nottingham for
the basic exposure to Bioinformatics. Rosalie, Camille, and Brian Hanotte, the fascinating family
of Olivier Hanotte, you made my stay in Nottingham very pleasant because of your warm welcome
and adorable hospitality. Many other people and institutions which I didn’t mention here have
played a great role in my success in one way or another. Many thanks all!
I cannot conclude my acknowledgment without thanking people working at different levels in
agricultural offices of sampling districts for their kind cooperation for the data collection process.
Farmers were also very helpful to me during the sampling process, thanks a lot.

viii
TABLE OF CONTENTS
LIST OF FIGURES .................................................................................................................................... xii
LIST OF TABLES ...................................................................................................................................... xiv
LIST OF ACRONYMS AND ABBREVIATIONS ...................................................................................... II
GENERAL ABSTRACT ............................................................................................................................. VI
CHAPTER 1. INTRODUCTION ................................................................................................................. 9
1.1. Background and Justification ........................................................................................................ 9
1.2. Statement of the problem ............................................................................................................ 11
1.3. Research Questions and Hypotheses ........................................................................................... 12
1.4. Objectives of the study ................................................................................................................ 13
CHAPTER 2. LITERATURE REVIEW .................................................................................................... 14
2.1. Origin and history of chicken domestication .............................................................................. 14
2.2. Chicken production systems in Ethiopia ..................................................................................... 15
2.3. Description of indigenous chickens in Ethiopia.......................................................................... 18
2.4. Phenotypic and genotypic characterization of indigenous chicken populations from Ethiopia .. 20
2.4.1. Localization of phenotypic and genotypic studies across socio-physical factors ............... 20
2.4.2. Morphological diversity and its relationship with socio-physical factors ........................... 21
2.4.3. Morphometric diversity and its relationship with socio-physical factors ........................... 27
2.4.4. Genetic diversity ................................................................................................................. 29
2.4.5. Limitations of previous studies ........................................................................................... 31
2.5. Overview of the chicken genome ................................................................................................ 32
2.6. Estimators of genetic diversity between and within chicken populations .................................. 34
2.6.1. Allelic variability ................................................................................................................ 34
2.6.2. Hardy-Weinberg equilibrium .............................................................................................. 35
2.6.3. Linkage disequilibrium ....................................................................................................... 36
2.6.4. Average heterozygosity and inbreeding .............................................................................. 36
2.6.5. Genetic differentiation ........................................................................................................ 37
2.6.6. Determining genetic relationships between populations ................................................... 38
2.7. Molecular markers for assessing chicken genetic diversity ........................................................ 39
2.7.1. Restriction Fragment Length Polymorphism (RFLP) ......................................................... 39
2.7.2. Random Amplification of Polymorphic DNA (RAPD) ...................................................... 40

ix
2.7.3. Microsatellites ..................................................................................................................... 41
2.7.4. Amplified Fragment Length Polymorphism (AFLP) .......................................................... 42
2.7.5. Single Nucleotide Polymorphism (SNPs) ........................................................................... 43
2.7.6. Mitochondrial DNA ............................................................................................................ 45
2.8. The Major Histocompatibility (MHC) gene in chicken .............................................................. 45
2.9. Approaches for detecting signatures of selection........................................................................ 47
CHAPTER 3. DIVERSITY OF LEI0258 MICROSATELLITE IN ETHIOPIAN INDIGENOUS
CHICKEN POPULATIONS ...................................................................................................................... 44
3.1. Introduction ................................................................................................................................. 46
3.2. Materials and methods ................................................................................................................ 49
3.2.1. Whole blood sample collection ........................................................................................... 49
3.2.2. DNA isolation ..................................................................................................................... 52
3.2.3. MHC genotyping................................................................................................................. 53
3.2.4. Data management and analysis ........................................................................................... 55
3.3. Results ......................................................................................................................................... 58
3.3.1. LEI0258 locus diversity by sampling site and Major Agro-ecological Zones (MAEZ) ..... 58
3.3.2. Population clustering by sampling site and MAEZ ............................................................ 62
3.3.3. Allelic sequence polymorphisms and relationships ............................................................ 71
3.4. Discussion ................................................................................................................................... 74
3.4.1. Fragment length based genetic variation in the MHC region ............................................. 74
3.4.2. Allelic sequence polymorphisms and relationships ............................................................ 77
3.5. Conclusion .................................................................................................................................. 79
CHAPTER 4. WHOLE GENOME DIVERSITY OF INDIGENOUS CHICKEN POPULATIONS IN
ETHIOPIA .................................................................................................................................................. 80
4.1. Introduction ................................................................................................................................. 81
4.2. Materials and methods ................................................................................................................ 83
4.2.1. Whole blood sample collection ........................................................................................... 83
4.2.2. DNA isolation ..................................................................................................................... 84
4.2.3. DNA quality checking (QC) and library Preparation ......................................................... 85
4.2.4. Library QC and sequencing ................................................................................................ 86
4.2.5. Mapping and variant calling ............................................................................................... 86
4.2.6. Population structure and genome wide nucleotide diversity ............................................... 89

x
4.2.7. Functional annotation and enrichment analysis of non-synonymous genes ....................... 89
4.3. Results ......................................................................................................................................... 91
4.3.1. Sequencing and variant calling ................................................................................................. 91
4.3.2. Population structure and genomic diversity ........................................................................ 98
4.3.3. Coding and non-coding variants ....................................................................................... 102
4.3.4. SNPs within evolutionary conserved elements ................................................................. 106
4.3.5. Allele frequency spectrum of SNPs in different annotation categories ............................ 106
4.3.6. Functional annotation and enrichment Analyses .............................................................. 108
4.4. Discussion ................................................................................................................................. 112
4.4.1. Genomic diversity of indigenous chicken populations ..................................................... 112
4.4.2. Functional annotation of genes in indigenous chicken populations .................................. 115
4.5. Conclusions ............................................................................................................................... 119
CHAPTER 5. EFFECT OF SIGNATURE OF SELECTION ON THE GENOME LANDSCAPE OF
IMPROVED HORRO AND INDIGENOUS CHICKEN IN ETHIOPIA ................................................ 120
5.1. Introduction ............................................................................................................................... 121
5.2. Materials and methods .............................................................................................................. 123
5.2.1. Experimental population description and breeding scheme for Improved Horro breed ... 123
5.2.2. Sampling strategy, DNA extraction and sequencing ........................................................ 124
5.2.3. Library QC and sequencing .............................................................................................. 124
5.2.4. Mapping and variant calling ............................................................................................. 125
5.2.5. Selective sweep detection ................................................................................................. 127
5.2.6. Gene ontology and pathway analyses ............................................................................... 130
5.3. Results ....................................................................................................................................... 131
5.3.1. Consequences of pooled hetrozygosity (Hp) variants detected ........................................ 139
5.3.2. Genome-wide selective sweep detection using Hp ........................................................... 131
5.3.3. Common selected Hp sweep regions across populations .................................................. 142
5.3.4. Fst variants detected .......................................................................................................... 142
5.3.5. Genome-wide selective sweep detection using Fst ........................................................... 144
5.3.6. Commonly selected Fst sweep regions across populations ............................................... 150
5.4. Discussion ................................................................................................................................. 147
5.4.1. Candidate of signals of selection using Hp method .......................................................... 154
5.4.2. Candidate of selection signals based on Fst method ......................................................... 157
xi
5.5. Conclusions ............................................................................................................................... 161
CHAPTER 6. SUMMARY, CONCLUSION AND RECOMMENDATIONS ........................................ 162
6.1. Implications for indigenous chicken improvement ........................................................................ 162
6.2. Conclusions and recommendation ............................................................................................ 166
REFERENCES ......................................................................................................................................... 168
APPENDICES .......................................................................................................................................... 192

xii
LIST OF FIGURES
Figure 1. Geographic localization of the phenotypic (red circles), genotypic (yellow circles) and combined
phenotypic- genotypic studies (blue circles) against the agro-ecological zones of Ethiopia. ... 30
Figure 2. Schematic location of LEI0258 marker in the chicken MHC map (Fulton, 2006)...................... 47
Figure 3. Agro-ecological map of Ethiopia with sampling site (MOA, 2000). .......................................... 51
Figure 4. Image of Genomic DNA on 1% agarose gel run at 7/cm for 60 minutes. ................................... 52
Figure 5. Electrophoretic pattern of alleles on 2% agarose gel run at 7/cm for 60 minutes in indigenous
chicken populations of Ethiopia. 1 kb ladder DNA was used as a reference. ........................... 54
Figure 6. Principal component analysis of alleles frequencies by sampling site. ....................................... 66
Figure 7. Principal Component Analysis of alleles frequencies across MAEZ. ......................................... 67
Figure 8. Relationships between populations for LEI0258 microsatellite polymorphism .......................... 68
Figure 9. Results of Analysis of Molecular Variance across populations. ................................................. 69
Figure 10. Results of Analysis of Molecular Variance across MAEZ. ....................................................... 69
Figure 11. Relationship between geographic and genetic distances ........................................................... 70
Figure 12. the optimum delta k according to Evanno et al., (2005). ........................................................... 70
Figure 13. Structure bar plots showing the gene pool of the chicken populations. .................................... 70
Figure 14. Network tree of allele sequences ............................................................................................... 73
Figure 15. Haplotypes relationship tree of alleles by the Maximum Likelihood method ........................... 73
Figure 16. Agro-ecological map of Ethiopia with sampling sites (MOA, 2000). ....................................... 84
Figure 17. Overview of data analysis pipe line using BWA, Picard and GATK. ....................................... 88
Figure 18. Average percentage of homozygous and heterozygous SNPs (%) in Ethiopian indigenous
chicken populations. ................................................................................................................. 94
Figure 19. Chromosome-wise SNP distribution plot across the Ethiopian indigenous chicken genome. .. 96
Figure 20. Mean SNPs density across 1 kb window for chicken chromosomes based on ~21million SNPs.
.................................................................................................................................................. 97
Figure 21. Rate of nucleotide substitution across Ethiopian indigenous chicken population genome ....... 97
Figure 22. Principal component analysis plot of non-filtered (20,867,451) (left) and LD pruned SNPs
(right). ....................................................................................................................................... 99
Figure 23. Cross validation errors of different k values used for admixture analysis ............................... 100
Figure 24. The admixture plots for Ethiopian indigenous chicken populations (K=4). ............................ 101
Figure 25. Non-synonymous number of SNPs/Kb across chromosomes ................................................. 103
Figure 26. Exonic variant summary in each annotation category based on ANOVAR (%) ..................... 105

xiii
Figure 27. VEP based SIFT analysis for Amino acid altering (non-synonymous and stop gain/loss) SNPs
(%)........................................................................................................................................... 105
Figure 28. AAF spectrum different variants (left); AAF spectrum of synonymous, nonsynonymous and stop
gain/loss SNPs. ....................................................................................................................... 107
Figure 29. AAF spectrum of synonymous, non-synonymous and stop gain/loss SNPs. .......................... 107
Figure 30. PCA plot of Improved Horro and other indigenous chicken populations (left) and suitability map
of other indigenous chicken populations (right) of Ethiopia. ................................................. 131
Figure 31. SNP count of Improved Horro (N=30) before and after filtering ............................................ 132
Figure 32. Frequency of ZHp values and Manhattan plot in improved Horro (N=30) ............................. 132
Figure 33. SNP count of Local Horro (N=6) before and after filtering .................................................... 133
Figure 34. Frequency of ZHp values for and Manhattan plot in Local Horro (N=6) ............................... 134
Figure 35. SNP count of Jarso (N=14) before and after filtering .............................................................. 135
Figure 36. Frequency of ZHp values for and Manhattan plot in Jarso (N=14). ........................................ 135
Figure 37. SNP count of Hugub (N=10) before and after filtering ........................................................... 136
Figure 38. Frequency of ZHp values for and Manhattan plot in Hugub (N=10) ...................................... 137
Figure 39. SNP count of Arabo (N=10) before and after filtering ............................................................ 138
Figure 40. Frequency of ZHp values for and Manhattan plot in Arabo (N=10) ....................................... 138
Figure 41. Histogram and Manhattan plot showing the distribution of Fst values for Improved Horro Vs
Local Horro chicken populations. ........................................................................................... 145
Figure 42. Histogram and Manhattan plot showing the distribution of Fst values for Improved Horro Vs
Jarso chicken populations. ...................................................................................................... 146
Figure 43. Histogram and manhattan plot showing the distribution of Fst values for Improved Horro Vs
Hugub chicken populations. .................................................................................................... 146
Figure 44. Histogram and Manhattan plot for Ethiopian Improved Horro and Arabo chicken showing the
pairwise comparison of selection pressure. ............................................................................. 147

xiv
LIST OF TABLES
Table 1: Key demographic and production parameters in poultry production systems .............................. 18
Table 2. Descriptive statistics for morphometric traits of indigenous chicken ........................................... 28
Table 3. Reported genetic parameter values on indigenous chicken across studies ................................... 29
Table 4. Genome statistics for the chicken reference genome (Gallus Gallus 5.0) assembly. .................... 33
Table 5. An overview of common approaches for detecting signatures of selection. ................................. 43
Table 6. Sampling sites ............................................................................................................................... 50
Table 7. Diversity indices of LEI0258 microsatellite locus in indigenous chicken populations across
sampling sites .............................................................................................................................................. 64
Table 8. Diversity indices of LEI0258 microsatellite locus in indigenous chicken populations across MAEZ.
.................................................................................................................................................................... 65
Table 9. Summary results on sequencing and mapping of reads ................................................................ 93
Table 10. Variant statistics within chicken populations from Ethiopia ...................................................... 95
Table 11. Summary of annotation of SNPs and their alternative allele frequency (AAF) in Ethiopian chicken
populations ................................................................................................................................................ 104
Table 12. GO terms enriched for non-synonymous deleterious variants in 27 chicken populations based on
SIFT prediction ......................................................................................................................................... 109
Table 13. GO terms enriched for non-synonymous deleterious variants in 10 chicken populations based on
SIFT prediction ......................................................................................................................................... 110
Table 14. Go terms enriched for non-synonymous deleterious variants with allele frequency greater than
0.9 in 27 chicken populations based on SIFT prediction .......................................................................... 111
Table 15. Summary of variant and Hp statistics in improved Horro and other Ethiopian indigenous chicken
populations ................................................................................................................................................ 140
Table 16. Summary of all Hp consequences ............................................................................................ 141
Table 17. Sift Prediction of Hp variants ................................................................................................... 141
Table 18. Functional annotation of genes in Improved Horro and other indigenous chicken populations of
Ethiopia ..................................................................................................................................................... 143
Table 19. Fst variant Statistics .................................................................................................................. 148
Table 20. Fst all consequences .................................................................................................................. 149
Table 21. Number of FST variants based on SIFT prediction .................................................................... 150
Table 22. Functional annotation of genes in Improved versus other indigenous chicken populations .... 151
Table 23. Functional annotation of commonly selected genes based on Fst ............................................ 153

II
LIST OF ACRONYMS AND ABBREVIATIONS
AA Amino Acid
AAF Alternate Allele Frequency
AATI Agilent Formerly Advanced Analytical
AEZ Agro-Ecological Zone
AF Allele Frequency
AFLP Amplified Fragment Length Polymorphism
AMOVA Analysis of Molecular Variance
ANOVA Analysis of Variance
AR Allelic Richness
BAM Binary Alignment Map
bp Base pair
BQSR Base Quality Score Recalibration
BWA Burrows Wheeler Aligner
CLUMPAK CLUstering Markov Packager Across K
cM Centi Morgan
CP Crude Protein
DAVID Database for Annotation, Visualization, and Integrated Discovery
dbsnp Data base Single Nucleotide Polimorphism
DNA Deoxyribose Nucleic Acid
DnaSP DNA Sequence Polymorphism
DZARC Debre Zeit Agricultural Research Center

III
He Expected heterozygosity
FAO Food and Agricultural Organization of the United Nations
gerp Genomic Evolutionary Rate Profiling
gDNA Genomic DNA
GGA Gallus gallus (chicken) Autosome
GO Gene Ontology
gVCF Genomic Variant Format
HWE Hardy-Weinberg Equilibrium
IBS Identity By Decent
IC Ethiopian indigenous chicken
Kb Kilo base (1000 bases)
Kcal Kilo Calorie
Kg Kilo gram
ME Metabolizable energy
KEGG Kyoto Encyclopedia of Genes and Genomes
LD Linkage Disequilibrium
LSM Least Square Means
LTR Long Terminal Repeats
MAEZ Major Agro-ecological Zones
M Molar
masl Meter above sea level
MCMC Markov Chain Monte Carlo
MEGA Molecular Evolutionary Genetics Analysis

IV
MHC Major Histocompatibility Complex
MNA Mean Number of alleles
MOA Ministry of Agriculture
NCBI National Center of Biotechnology Information
ncRNA Non-coding Ribonucleic Acid
NGS Next Generation Sequencing
NJ Neighbor joining
oC Degree centigrade
Ho Observed heterozygosity
PA Private Allele
PCA Principal Components Analysis
PCR Polymerase Chain Reaction
PIC Polymorphic Information Content
QC Quality control
QTL Quantitative Trait Loci
RFLP Restriction Fragment Length Polymorphism
RAPD Random Amplification of Polymorphic DNA
RNA Ribonucleic Acid
SAM Sequence Alignment MAP
SIFT Sorting Intolerant from Tolerant
SMART Simple Molecular Architecture Research tools
SNP Single Nucleotide Polymorphism
UPGMA Unweighted Pair-Group Method with Arithmetic mean

V
USA United States of America
UTR Untranslated Region
UV Ultra-violate Light
μl Micro litre
VCF Variant Calling Format
VEP Variant Effect Predictor
VQSR Variant Quality Score Recalibration

VI
GENERAL ABSTRACT
WHOLE GENOME BASED CHARACTERIZATION OF INDIGENOUS CHICKEN
POPULATIONS IN ETHIOPIA
Adebabay Kebede
Addis Ababa University, 2018
Indigenous chicken are locally adapted to environmental challenges and provide subsistence to
millions of farmers in Africa. Their productivity remains low compared to exotic chicken strains.
Efforts are being made to combine the local adaptation of indigenous chicken with productivity
traits of exotic chicken. Understanding the link between diversity and adaptability is opening the
door to marker-assisted breed improvement programs. Selective breeding for genetic improvement
is expected to leave distinctive selection signatures within genomes. The identification of selection
signatures can help to elucidate the mechanisms of selection and accelerate genetic improvement.
Ethiopia has several chicken ecotypes which evolved in different agro-ecologies. This study aims
to characterize the genomic diversity of indigenous chicken populations from Ethiopia. The first
part of this study addresses the characterization of the LEI0258 microsatellite loci in the MHC
region with previous study supporting links of the locus with infectious diseases
resistance/susceptibility in commercial chicken. Here, we report diversity of LEI0258 in 236
chicken from 24 Ethiopian indigenous chicken populations from different agro-ecological zones
using gel electrophoresis and sequencing.

VII
The number of alleles, allele frequency, and heterozygosity levels were used to measure diversity
within populations whilst the Wright’s fixation indices were used to analyze the level of population
structuring. Twenty-nine LEI0258 allele sizes were observed using capillary electrophoresis.
Allele sizes ranged from 185 to 569 bp with no significant difference in allele frequencies between
populations (P < 0.01). Allele frequencies were in Hardy and Weinberg Equilibrium in all
population except in improved Horro and Dara chicken (P < 0.05). Excluding the tandemly
repeated motif, the number of monomorphic and polymorphic sites are 412 and 35, respectively.
Number of point mutation and indels are 33 and 17, respectively. The number of R12
CTTTCCTTCTTT repeats ranged from 2 to 18, while R13 was found monomorphic with a single
motif CTATGTCTTCTTT. Sequences relationships reveal two distinct groups of alleles. The high
diversity at microsatellite LEI0258 at Ethiopian indigenous village chicken populations supports
the importance of the MHC region in relation to the disease challenges diversity faced by
smallholder poultry production within and across Ethiopian agro-ecologies. We recommend that
breed improvement programs ensure the maintenance of this diversity by selecting breeding stock
as diverse as possible at the LEI0258 locus. The part of the thesis reports the genomic diversity of
Ethiopian indigenous chicken through discovery and characterization of 21 million SNPs (72%
novel) from 27 indigenous chicken populations (n = 260 birds) using whole genome sequencing.
In each population, around 10 to 12 million SNPs are present, of which, 40-47% are a heterozygote.
The mean SNP density across all population is 21 (±5) per kb, although it is much lower on the
sex chromosomes (W = 0.4, Z = 11). Principal component and admixture analyses suggest the
presence of four ancestral gene pools across the populations. Over 46% of the SNPs are located
within genes, of which exonic and intronic SNPs account for 1.59% and 43.94%, respectively;
while 31% of the exonic SNPs are non-synonymous. A large proportion of SNPs has low

VIII
alternative allele frequency (AAF < 10%), although this proportion is higher for potentially
harmful categories like missense and stop gain/loss (> 60%) than neutral ones (40-45%). Genes
with deleterious missense variants are included within several important biological pathways like
innate immunity. Our results confirm the existence of significant genomic diversity in indigenous
chicken populations of Ethiopia, with most of the variants previously undescribed in commercial
breeds. The last part of the thesis assesses the footprints of candidate signatures of positive
selection from whole genome autosomal sequences, comprising 14,857,039 SNPs, in Improved
Horro, Local Horro, Hugub, Arabo and Jarso chicken populations of Ethiopia. We identified
selection signals in 20 Kb windows size with 10 Kb sliding steps based on estimators of pooled
heterozygosity (Hp and F-statistics (Fst) within and between those populations. Selective sweep
analysis using Hp and Fst methods identified genomic regions associated with production and
reproduction traits. A total of 595 candidate genes showed high evidence of positive selection in
indigenous chicken populations. These genes were related to traits such as growth and egg
production. Gene ontology analysis displayed several biological processes and KEGG pathways
involved in oestrogen biosynthetic and nervous system development processes, calcium signaling
and biosynthesis of unsaturated fatty acids. The regions identified in this study are expected to
provide a genome landmark to enhance the ongoing breed improvement operations in improved
Horro and other four chicken populations. In general, this study revealed the huge genomic
diversity and taped the genomic regions under strong selection in indigenous chicken populations
of Ethiopia
Keywords: Chicken, Diversity, Ethiopia, Genomic, Indigenous, Population

9
CHAPTER 1. INTRODUCTION
1.1. Background and Justification
In the last 50 years, the world human population was increasing dramatically and its growth is
projected to reach 9.73 billion by 2050 and 11.2 billion by 2100 which makes the greater confront
for agriculture to meet the growing food demand (FAO, 2017). More than a billion people around
the world live in extreme poverty. Moreover, as of 2009 there have been marked increases in
hunger, and the Food and Agriculture Organization of the United Nations(FAO) estimated that
1.02 billion people are undernourished (FAO, 2010) and most of these people are found in sub-
Saharan Africa. 30% or more of children under 5 years of age are malnourished in many parts of
this region. Similarly, Cicia et al. (2003) indicated that the profound changes that have taken place
in agriculture in the past 50 years in both developed and developing countries have caused severe
and undesirable impacts on the environment.
Particularly, Ethiopia is known to have an estimated human population of over 82.64 million,
growing at a rate of 2.4% per annum at which 85% the population relies on agriculture (45% of
GDP and 85% of export earnings) (CSA, 2012) including livestock production. Livestock
production is an integral part of the country's agricultural production system and has a profound
contribution to the national effort to ensure food self-sufficiency both at the national and household
level (Dessie, 2011). In particular, chicken production is playing a fundamental role in its
considerable potential to improve the livelihoods of rapidly increasing populations of Ethiopia
since long time ago. Numerous indigenous chicken populations are reported to adapt to different

10
circumstances of various regions of the country. These chickens are being kept mainly by
smallholders under backyard poultry farming mainly as a livelihood source of income.
Padhi et al. (2016) mentioned that commercial chicken production is world widely increasing
because of its better efficiency, leaving indigenous breeds to hardly compete with. However, under
normal circumstance, it is usually suggested that rare or endangered breeds are often highly
adapted and their performances should be measured comparatively, within their own
environmental conditions than comparing with other breeds under improved or modified
conditions or under intensive management (Dessie, 2011). In other words, examining these breeds
with respect to the products for which they were selected and valued in the conditions under which
they evolved very meaningful. Azage et al. (2006) have in their remark stated that many occasions
where growth rate, prolificacy, or milk production have been measured and used as criteria to point
up the inferiority of purebred indigenous stock over that of exotic imported breeds or their crosses.
Needless to say, indigenous breeds are known to possess occasionally unique alleles pertinent to
their adaptation (diseases resistance and climate) and breeding goals (quality egg and meat)
(Zanetti, 2009). Moreover, they have also enormous use for scientific, cultural and economic use
that urges us to conserve and improve for the use of the future (Koehler-Rollefson, 2014). Many
scholars also advocate that utilization of indigenous genotypes by improving their competitiveness
under the socioeconomic circumstances of their production environments is one of the practical
options to ensure the conservation of genetic diversity.
Despite these beneficial roles, indigenous chicken genetic resources are not getting greater

11
attention for further improvement in the country. For instance, regardless of breed type, FAO
(2007) reported that chicken population and an average number of chickens per household in
Ethiopia have declined by 64% and 37% over the last 50 and 20 years, respectively. In Ethiopia,
the Growth and Transformation Plan (GTP) of the government, has put ambitious targets to double
the chicken meat production from the total meat production by 2030 as part of a broader and
integrated livestock productivity improvement program (MOFED, 2010). However, due to the
limited fundamental information on the genetic diversity of nationally acquired chicken
populations, the absence of well-managed conservation genetics programmes and the uncontrolled
genetic introgression between indigenous as well as exotic breeds are seriously threatening the
future of many indigenous chicken populations of the country.
1.2. Statement of the problem
Genetic diversity is seriously suffering from genetic erosion in several fields of genetic resources
especially in farm Animal genetic resources (Zanetti, 2009). This is especially true for the chicken
industry where very few genotypes provide the breeding basis for the industrialized production
(Romanov and Weigend, 2001). Weigend and Romanov (2002) stated that chicken genetic
resources are considered to be one of the most endangered. In this regard, since the start of
commercial chicken breeding in the middle of the 20th century, chicken genetic diversity has
become partitioned among relatively few highly specialized lines. As a consequence, many dual-
purpose breeds, resulting from centuries of domestication and breeding, are now at the risk of
being lost (Hillel et al., 2003).

12
In a similar way, the issue of chicken genetic resources conservation is also a hotspot topic for
Ethiopia, a country facing with major agricultural productivity challenges. For instance, according
to IBC (2004), only limited research and development activities on phenotypic and genetic
characterization have been conducted on chicken breeds of Ethiopia to conserve, reveal and exploit
its genetic potential. As a result, little is known about the genetic diversity, structure, and degree
of admixture within and between indigenous chicken populations in Ethiopia. Most
breeds/populations may disappear before they have been recognized and exploited for breeding
improvement goals. Specifically, in spite of the presence of various reports on the potential of
indigenous chicken populations in Ethiopia, there are few studies, e.g. Hassen et al. (2009),
Alemayehu et al. (2003), Mwacharo et al. (2007),Wragg et al. (2012) and Desta et al. (2014),
which have reported the diversity of Ethiopian chicken using microsatellites, and SNP markers
with no studies so far reporting the analysis of full genome sequences data.
Hence, taking all this facts and figures, understanding the level of genetic diversity at genome level
within and among chicken populations is of paramount importance in identifying potential chicken
populations for genetic improvement programs.
1.3. Research Questions and Hypotheses
I. Research Questions
The following research questions are addressed in this study:
• Is there any difference in genetic diversity among chicken populations of Ethiopia?
• How is the diversity partitioned within and among chicken populations?
• What is the genetic relationship between the target indigenous chicken populations?

13
• What are the regions and genes under strong selection pressures in Improved Horro and
other indigenous chicken populations of Ethiopia?
II. Research Hypotheses
The following major hypotheses are tested:
• Due to the local preference of chicken genotypes among communities in Ethiopia, low
genetic diversity within the population and high genetic variation between populations are
expected.
• Chicken populations will show geographic structuring primarily induced by rare long-
distance dispersal, followed by mutation and limited gene flow.
• Due to exchange at the local market, genetic distances between chicken populations will
follow geographic distances.
1.4. Objectives of the study
The principal objectives of this study are the following:
The principal objectives of this study are the following:
1. To analyse the genetic diversity and population structure of Ethiopian indigenous chicken
populations.
2. To analyse the genetic relationship between indigenous chicken populations.
3. To determine the genomic regions under strong positive selection pressure in indigenous
chicken populations.

14
CHAPTER 2. LITERATURE REVIEW
2.1. Origin and history of chicken domestication
Chicken population makes up a large majority (around 30 billion) of avian breeds globally (Jensen,
2005). Chicken domestic genetic resources comprise a wide range of breeds and populations
including native, also called indigenous, population, breeds and/or ecotypes, fancy breeds, middle-
level food producers, industrial stocks and specialized lines (Weigend and Romanov, 2001). Some
archaeological and molecular evidences ascertain that the domesticated chicken (Gallus gallus)
populations evolved in Asia from a common ancestor, the red jungle fowl Gallus gallus
(Kanginakudru et al., 2008; Nguyen‐Phuc and Berres, 2018; Sawai et al., 2010; Storey et al.,
2012). Molecular and archaeological findings also support more multiple maternal origins (Liu et
al., 2006) with possible contributions from other junglefowl species (Boichard et al., 2012;
Eriksson et al., 2008; Gifford-Gonzalez and Hanotte, 2011; Mwacharo et al., 2013). For instance,
the yellow skin locus present in several domestic chicken breeds is believed to most likely originate
from the grey jungle fowl Gallus sonneratii (Eriksson et al., 2008).
The time and the geographic center (s) of domestic chicken remain (Liu et al., 2006) uncertain.
Some evidences confirm that the history of fowl domestication dates back to about 2000 B.C.
(Kanginakudru et al., 2008; Sawai et al., 2010; Yap et al., 2010). But, more recent archaeological
evidences showed that a much earlier domestication might have occurred around 6000 BC
(Gifford-Gonzalez and Hanotte, 2011). Olusij (2010) indicated that the evolutionary history of the
domestic fowl occurs in phases starting from the evolution of the genus Gallus, the emergence of

15
the domestic fowl from its progenitors followed by the appearance of the current breeds, varieties,
strains, and lines. During the course of domestication, the chicken has been considerably changed
and diversified by natural and artificial selections (Al-Nasser et al., 2007). For instance, the
ancestor of the domestic chicken, the red jungle fowl, lays 10 to 15 eggs per year in the wild,
whereas commercial laying hens are capable of producing more than 300 eggs per year (Weigend
and Romanov, 2001) following human selection and the global emergence of the chicken meat
and egg industries (Siegel et al., 2006; Toro et al., 2014). Mwacharo et al. (2013) indicated that
the history of introduction and dispersal of village chickens across the African continent is a
subject of intense argument and speculation among scholars. Socio-cultural, linguistic,
archaeological and historic data all suggest the introduction of chickens to Africa is through
multiple maritime and/or terrestrial routes over time. Dessie (Alemayhu, 2003) also suggested that
chicken could have been introduced into Africa through the Isthmus Suez, the Horn of Africa and
through direct sea trading between Asia and Eastern Africa. So far, no molecular genetics study
has attempted to understand the genetic diversity and origin of African indigenous chickens at the
continental level (Gifford-Gonzalez and Hanotte, 2011).
2.2. Chicken production systems in Ethiopia
The poultry sector in Ethiopia can be characterized into three major production systems(large-
scale commercial, small-scale commercial and scavenging) based on some parameters such as
breed, flock size, housing, feeding, health, technology and biosecurity (Tadesse, 2015). The most
dominant type of poultry production system in Ethiopia is the scavenging production system
inherently characterized by low productivity (Alemayhu, 2003; Halima et al., 2007). In this
system, birds rely on what they are able to pick in the homestead with little or no supplementation

16
with food leftover waste and a small amount of grains. This system is characterized by a low input,
minimal level of biosecurity, high off-take rates and high levels of mortality (Desalew et al., 2013).
Here, there are little or no inputs for housing, feeding or health care. It does not involve investments
beyond the cost of the foundation stock, a few handfuls of local grains, and possibly simple night
shades, mostly night time housing in the family dwellings. Over 80-97% are indigenous and raised
in small flocks (4-10 hens) and produce a maximum of 40 eggs/hen/year and to achieve a market
live-weight of less than 1.5 kg at 6 months (Dessie et al., 2011). Still, under this situation,
indigenous chicken populations represent an important resource from which improved lines can
also be developed. Here, evidences are emanating from well designed, selective breeding programs
of indigenous populations showing that significant productivity improvement can be achieved,
while maintaining a reasonable level of adaptation, even under scavenging conditions.
For instance, this was manifested by the works on the improvement of Horro chicken populations
in Debre Zeit Agricultural Research Centre (Dessie et al., 2011). Progress reports showed that
survival has improved from less than 50% in the base generation to 98% in generation 6. Similarly,
body weight at 16 weeks has increased substantially from 550g to 880g, while egg production per
annum has got tripled from 24 to 72. These evidences pinpoint the potential of indigenous chicken
populations for productivity improvement. However, these genetic resources are generally under
exploited and under leveraged due to lack of effective capacity for local testing, multiplication,
and delivery to farmers, followed by continuous genetic improvement. In fact, genetic
improvements have been attempted by the government and several development agencies by rather
crossbreeding programs of exotic commercial cocks with indigenous chickens than within breed
improvement. Selection programs targeting to genetically improve, multiply and distribute

17
improved indigenous chickens to the farmers are still largely to come. In Ethiopia, much of the
chicken improvement efforts have focussed on delivering exotic and more often inappropriate
birds to the smallholders’ context. For instance, chicken genetic improvement programs in the
previous decades focused on the use of White Leghorns, Rhode Island Red, Brown Leghorns, New
Hampshire, Cornish, Australoup, Light Sussex and Fayoumi breeds all demanding high input and
intensive management (Dana, 2011). These high-yielding breeds are not a sustainable option for
improving village poultry so long as the production conditions are not suitable to such genotypes
none adapted to the low nutrition input, high disease incidence and weather patterns of a country
like Ethiopia. Many scholars advise that breeding programs should be oriented in such a way that
it can address the underlying socioeconomic and production circumstances of village chicken
production systems.
The second poultry production system in Ethiopia is the small-scale commercial one. In this
system, modest flock sizes usually ranging from 20 to 1000 exotic birds are kept for operating on
a more commercial basis. Most small-scale poultry farms are located around Debre Zeit town in
Oromia region and Addis Ababa. This production system is characterized by a medium level of
feed, water and veterinary service inputs and minimal to low biosecurity.
The third type of poultry production system is a large-scale commercial system. This intensive
production system involves keeping to 10,000 birds or even more under indoor conditions with a
medium to high biosecurity level (Desalew et al., 2013). This system heavily depends on imported
exotic breeds that require intensive inputs such as feed, housing, health, and modern management
system. It is estimated that this sector accounts for nearly 2% of the national poultry population in

18
Ethiopia. This system is characterized by a higher level of productivity where poultry production
is entirely market-oriented to meet the large poultry demand in major cities. The existence of
somehow better biosecurity practices has reduced chick mortality rates to merely 5%. Key
demographic and production parameters in poultry production systems are presented in Table 1.
Table 1: Key demographic and production parameters in poultry production systems
Parameters Indigenous Crossbred (layers) Crossbred (Broilers)
Overall mortality rate before marketing 50 5 -
Mortality rate young stock - - 7
Mortality rate grower - - 52
Adult mortality percentage per year 20 3
Egg production per hen per year(number) 42 308 NA
Kg total feed/kg egg produced/Kg/live
weight
NA 2.7 kg/kg of egg 1.8 kg/kg of live weight
No. of animals sold per breeding female
per year
1.61 NA NA
Average weight at slaughter(kg) 1.5 2.4 2.3
Dressing percentage at slaughter (%) 65 6.4 65.2
Source: Livestock Master Plan, 2015
2.3. Description of indigenous chickens in Ethiopia
Indigenous chickens in Ethiopia are found in every corner of the country. They are not exhaustively
but are closely related to the jungle fowl. Chicken populations in Ethiopia are non-descriptive
which vary in plumage color, comb type, body weight, and body conformation. Under Ethiopian
Chicken description context, no chicken was reported as a distinct breed despite some naming of
distinct ecotypes. Living in different agro-ecologies they are often also referred as ecotypes. In
most of the native flocks, broodiness (maternal instinct) is pronounced. They are characterized by
slow growth, late maturity and low production performances (Desalew et al., 2013). The
productivity of local scavenging chicken is low with high mortality of chicks. Duration of brooding
time of a hen is wider with many cycles per year. Moreover, the low productivity of indigenous

19
stocks partially is attributed to the low management standard of the traditional production systems.
Provision of vaccination, improved feeding, clean water, and nighttime enclosure relatively
improves the production performance of indigenous chickens (Habte et al., 2013).
By and large, studies conducted on indigenous chickens to evaluate their performance usually
ignore their unique physiological and behavioral characteristics and their socio-cultural values
(Alemayhu, 2003). Due to their high genetic diversity, there is also remarkable variation in the
performance of indigenous chickens within and among breeds. This variation is an important
genetic attribute of the indigenous chicken, whereby selection can act to improve their
performance (Ibid). About sixty million birds (n = 60,505,327) are available in Ethiopia for
consumption, sale, breeding and socio-cultural values (CSA, 2016). Smallholder farmers keep
birds for its low capital requirement, flexible production systems, and low production risk, taste,
flavor and leanness (FAO, 2010; Halima et al., 2007). Under Ethiopian context, chickens are
considered as the only type of livestock that many poor people can maintain relatively risk-free
compared to another type of livestock enterprises (Dessie et al., 2011). It is providing a
considerable potential to improve the livelihoods of many pro-poor communities of the country.
However, low productive chicken genotypes dominate smallholder production systems, mainly
owing to the absence of sound long-term chicken genetic improvement, multiplication and delivery
systems (Dana, 2011; Padhi, 2016).
Improving chicken productivity is the first step to get out of poverty by improving family nutrition
and socio-economic status (Dessie et al., 2011). Numerous productivity evaluation elucidates that
indigenous chickens have remarkable performance than their improved counterparts under low to

20
medium input systems. Although indigenous chickens are known to have a number of adaptive
traits in hot and humid tropics such as the necked neck, minimum and frizzle feathers, black bones
and meats, the potential value of indigenous breeds remain under-estimated (Alemayhu, 2003;
Dana, 2011; Fathi et al., 2017, 2013). Even though indigenous chickens are not fat growers and
poor layers of small-sized eggs(about 45g), they are ideal mothers, good brooder, and excellent
scavengers, sturdy and believed to possess better natural immunity against common poultry
diseases (Alemayhu, 2003). Berthouly et al. (2008) advise the need to explore and properly
manage indigenous chicken genetic resources as they represent both a heritage and a reservoir of
genetic diversity. Chicken meat offers an attractive lower-carbon alternative to beef. However,
chicken consumption is currently low in Ethiopia compared with other countries which are planned
to boost to 30% by 2030 aimed to increase the chicken population by 70 million (CRGE, 2011).
2.4. Phenotypic and genotypic characterization of indigenous chicken populations
from Ethiopia
2.4.1. Localization of phenotypic and genotypic studies across socio-physical factors
A combined analysis of a dataset of 28 phenotypic and 7 genotypic publications on Ethiopian
indigenous chicken across socio-physical (religion, elevation, and agro-ecology) shows the
different morphological and morphometric attributes of indigenous chicken (Table S 3, Table S 4,
Table S 5). Different factors may affect the production characteristic of indigenous chicken and
their phenotypes. For instance, religion may be expected to influence on cultural trait preferences
of smallholders in regards to chicken phenotypes. Similarly, elevation and agro-ecology as a proxy
of the natural selective forces may have shaped the morphology of the birds at major agro-

21
ecological zones. Geographic localization across Ethiopia of the various studies examined here is
shown in Figure 1.
In term of socio-cultural environment, most of the studies (n = 20) reports the Christian Orthodox
faith as the dominant religion in the geographic region of the chicken population reported here,
followed by the Muslim one (n = 13), with few studies examining chicken population in Protestant
(n = 4) and traditional (n = 3) faith areas (Table S 3). Elevation wise, most of the studies
concentrate (n = 25) in elevations ranging from 1800-2400 (Table S 4). A sizable number of (n =
15) phenotypic studies were also carried out in elevations ranging from 1800-2400 masl. There
are no studies in elevations less 500 and above 3200 masl. The different studies have variably
distributed across agro-ecologies which most of them concentrated in Tepid to cool moist mid
highlands (n = 9) and Tepid to cool sub-humid mid highlands (n = 8) (Table S 5). Tepid to cool
sub-moist mid highlands (n = 1) and Hot to warm per humid lowlands (n = 1) are least represented.
2.4.2. Morphological diversity and its relationship with socio-physical factors
Various studies reported plumage coloration and pattern, earlobe, shank and skin color variants in
flocks of IC of Ethiopia but with inconsistency in color definition between them (Table S 6; Table
S 7). Colour is an important feature for most living organisms, having great significance in the
wild by affecting the survival and reproductive success of the species. For instance, carotenoid-
based ornaments (skin or feathers) in wild birds are considered to be signal of an individual's
nutritional status or health, reflecting its foraging efficiency or immune status and are therefore
implied to affect sexual attractiveness (Blas et al., 2006; Castaneda et al., 2005). On top of its
advantage in terms of genetic variation, a diversity of colors may serve as a camouflage from

22
predator attack and in turn boost productivity where a free-range scavenging system is
predominant. Apart from other methods, genetic variations in chicken can be described using traits
based on pigmentation variants and comb varieties (Dana et al., 2010). Accordingly, different
scholars consider color diversity of chicken as an important parameter in phenotypic diversity
studies. Early color variants were mostly selected for utility reasons or religious practices (Sheppy,
2011). In Ethiopia, chicken plumage has greater economic significance and influences the local
breeding strategies (Dana et al., 2010). Among others, the most critical color variant considered
by farmers is plumage color which is given attention in local market preference and breeding
objectives. To this end, a high diversity of Ethiopian IC plumage has been noted in the different
phenotypic studies (Table S 10).
The most dominant plumage color variants are red (39.26%), black (39.14%) and white with two
or more mixture of the dominant colors reported by different scholars (n = 14; Table S 7). In terms
of its relationship with religion, plumage coloration is not significantly different across the
dominant religion category (P < 0.05; Table S 18). Its relationship was not also significantly to
vary across elevation category for all plumages except brown coloration (P < 0.05). Apart from
the red and black dominant plumages, a diverse spectrum of plumages in variable proportion are
reported. Red plumage is the commonest in Tepid to cool sub-humid mid-highlands (SH2;
39.26%) followed by Hot to warm humid lowlands (H1; 24.76%) agro-ecological zones (Table S
28). In contrast, there is no report of red plumage chicken in cold to very cold sub-humid sub-afro
alpine to afro-alpine (SH3) agro-ecology. Similarly, black plumage chicken reported
predominating in SH2 (39.14%) and H1 (21.93%), respectively. Apart from the red and black

23
dominant plumages, a diverse spectrum of plumages in variable proportion are reported. Only red,
and zagolima plumages significantly vary across agro-ecologies (P < 0.05).
Earlobe color is a naturally and artificially selected trait in chicken. In breeding operations, it has
been selected as a breed characteristic as a head furnishing trait. White/red earlobe color is a
polygenic and sex-linked trait (Luo et al., 2018; Nie et al., 2016). Variable earlobe color variants
proportion are also reported from different studies in Ethiopia (Table S 11). Chickens with black
(56.46%) and red (41.81%) earlobe variants are the commonest among other comb types. This
variant does not vary significantly (P < 0.05) across dominant religion demography and elevation
for all earlobe color types (Table S 20). Variable earlobe colour variants proportion are also
reported across the agro-ecological zones. The highest number of chickens with red earlobe
variants (41.81%) is found in (Tepid to cool sub moist mid highlands (SM2) agro-ecological zone
(Table S 11). While, chicken with black earlobe variants are the commonest in Tepid to cool moist
mid highlands (M2; 56.46%) and it reaches 40.14% in Tepid to cool sub-moist mid highlands
(SM2). Unlike chicken with black earlobe colour, chicken with white earlobe colours are found
across a wide spectrum of agro-ecological zones. Except for brownish and multi-colour variants,
other reported colors vary significantly (P < 0.05) in terms of distribution across the respective
agro-ecologic zones. Earlobe colour has no significant variation across agro-ecologies for
indigenous chickens (P < 0.05, Table S 20)
According to Jin et al. (2014), in chicken, skin pigmentation such as shank color is related to the
levels of carotenoids and melanin. Yellow shanks are the commonest (50.98%) followed by white
shank (25.59%) and black (10.59 %) shank color variants in Ethiopian IC (Table S 12). The rest

24
of the reported shank color variants show the least occurrence across the different reported study
sites. To this end, the least occurred shank color across studies is the mottled type (0.14%). Shank
color is not significantly variable (P < 0.05) across dominant religion demography and elevation
category (Table S 22). White shank color variants significantly vary across agro-ecologies unlike
yellow and black shank color variants (P < 0.05, Table S 29). The presence of feathered shank
gene (Pti/pti) in indigenous chicken is also minimal (Table S 17). A variety of skin variants are
also documented in different spatiotemporal studies. In this respect, white (48.87%) and yellow
(30.86%) skin color variants are the most abundant phenotype across various socio-geographic
factors (Table S 12). In contrast, there is little black (0.35%) and green (0.20%) skin color variants
in M2 agro-ecology. There was no significant difference in the skin color of indigenous chicken
across dominant religion, elevation and agro-ecologies (P < 0.05; Table S 23; Table S 32).
Like other coloration variants, eye color variants vary according to the carotenoid pigmentation
and blood supply in the eye (Crawford, 1990). Under the context of Ethiopian IC, Eye color
variants were only considered in few studies (n = 6, Table S 6; Table S 13). The most prominent
eye color variants across these 6 studies are red (36.95%), black (23.80%), while, the least eye
color variant is pearl (0.6%). The most prominent eye color variants across these 6 studies are red
(36.95%), black (23.80%), while, the least eye color variant is pearl (0.6%). Eye color variants
have no any relationship between the different dominant religion demographies and elevation
categories (Table S 21). Unlike other plumage and earlobe color variants, eye color variants are
only found in a few agro-ecological zones, with a single variant observed for hot to warm humid
lowlands (H1) and hot to warm sub-moist lowlands (SM1) agro-ecological zones. Only blue black

25
and dark brown eye color variants are shown to significantly vary across agro-ecologies (P < 0.05,
Table S 30).
Feather distribution is reported in Table S 16. The dominant feather distribution is Normal
(84.88%) with the least proportion for shank and feet feather distribution (0.6%). Feather
distribution is not significant across dominant religion demography, elevation category (Table S
24). The dominant feather morphology is indicated in Table S 16 comprising a major proportion
for normal distribution (89.82 %). Feather morphology doesn’t have significant variability across
dominant religion demography and elevation category (Table S 25). Normal and crest type of
feather distribution significantly vary across the variable agro-ecologic zones (Table S 34). Neck
feather color variant was also only reported in a couple of studies (n = 2; Table 6 with a
predominance of brown (25.18%) followed by white color variants (20.73%). Neck feather variant
types do not vary significantly (P < 0.05) across dominant religion demography. Neck feather has
also no significant variation (P < 0.05) with elevation category except for white neck feather type
coloration (Table S 26) while white (48.87%) and yellow (30.86%) skin color variants are most
widespread across study sites. None of the neck feather color variants are reported to significantly
vary across agro-ecologies (P < 0.05, Table S 31).
Indigenous chicken (IC) feather genotypes reported in Ethiopia include normal feathered, crested
head, frizzle, naked neck, and feathered shank (Table S 16). The naked neck (Na) gene is an
autosomal, incompletely dominant gene described as one of the major genes in local chickens of
the tropics that has desirable effects on heat tolerance and adult fitness (Fathi et al., 2013).
However, to the scope of this review, little proportion of naked neck (2.75%) genes have been

26
reported and distribute mainly in SH2 (66.57%) and H1 (24.78%) agro-ecology. This might be due
to little availability of naked neck chicken (dominant genes) in Ethiopia or due to a single available
study by Teketel (1986) as cited by Dana (2010) to exactly define the size and geographic
distribution of these chicken. Moreover, this may be due to the fact that naked neck chicken is less
preferred and have less aesthetic value to normal feathered and another type of chicken as they are
considered ugly. Similarly, shank and feet (0.6%), as well as muff and beard (0.6%) feathered
chicken, are available in extremely low frequency (Table S 16). About 97.73% of IC in Ethiopia
reported having no shank feather. Another prominent phenotype in chicken is crest which is
characterized by a tuft of elongated feathers atop the head. It shows an autosomal incompletely
dominant mode of inheritance and is associated with a cerebral hernia (Wang et al., 2012). The
crested head genotype is considered to be a superior egg producer (Ngeno et al., 2014). This gene
is also rare in the flocks of Ethiopian IC (4.33%). Fewer proportion of crested birds have been
reported and there is no work in birds with mutant phenotypes of the crest, necked nake, feathered
shank, and frizzle adaptive genotypes in Ethiopia. The other genotype of Ethiopian IC chicken
reported in various studies is frizzle (F) phenotype which is believed to be caused by a single
autosomal incomplete dominant gene in which heterozygous individuals show less severe
phenotypes than homozygous individuals (Ng et al., 2012). The rare abundance of frizzled (1.85
%) IC was also evidenced. The proportion of female chicken with a spur (43.65%) is also indicated
in Table S 17. Normal feathered and crested chicken occurrence significantly vary across agro-
ecologies (P < 0.05, Table S 24).
Comb type is a trait that shows considerable variability among domestic chicken (Shen et al.,
2016). This variability was also ascertained in Ethiopian IC chicken (Table S 15). The dominant

27
comb types are single (42%), rose (31%) and pea (21%), while other comb types make the rest
(7%). The remaining proportion include Walnut (2.42%), V-shape (2.18%), strawberry (0.34%),
Cashion (0.38%), duplex (0.69%), buttercup (0.01%) and unclassified comb types (0.03%). Single
comb type variants show a significant difference (P < 0.05) across dominant religion demography
and elevation category, while, no variation is found for the rest comb type variants (Table S 19).
The higher number of these comb type variants predominate in Tepid to cool sub-humid mid-
highlands (SH2) followed by Hot to warm humid lowlands (H1) agro-ecology (Table S 33). Only
single, rose and duplex comb types significantly vary across agro-ecological zones in contrast to
the consistent occurrence for the range of other comb types (P < 0.05).
Body shape variants are presented in Table Table S 17 with a high predominance of blocky
(59.43%) body shape type. Body shape does not significantly vary (P < 0.05) with the dominant
religion demography except for blocky body shape (Table S 27).
2.4.3. Morphometric diversity and its relationship with socio-physical factors
Body weight is an important attribute in poultry production as it forms the basis for not only
assessing growth and feed efficiency but also making economic and management decisions
(Dahloum et al., 2016). The body weight of IC chicken ranges from 0.84-1.97 Kg (Table 2). The
annual egg production per hen is 47-75 with the lowest (47 ± 5.07) and highest (75 ± 5.07). On
top of body weight and egg number, body length and shank length are intensively studied traits
involving a higher number of chicken individuals and chicken populations. Various quantitative
traits measurements have been also reported in previous studies of Ethiopian IC (Table 2). On top
of body weight and egg number, the overall least significant means and their test of significance

28
is indicated for shank length and other phenotypic traits (Table S 35; Table S 36). Analyses of
variance of these traits across dominant religion category shows only wingspan, body length, shank
circumference, and body height to significantly vary (P < 0.05; Table S 35). Only wattle length
was significantly different across elevation category (P < 0.05; Table S 35). Body length,
wingspan, comb length, keel bone length, neck length, and back length found significantly
different (P < 0.05) across agro-ecologies (Table S 36).
Our review of phenotypic studies in Ethiopia shows that pelvic width, drum length, tarsus length,
tarsus color, thigh circumference, breast width, jaw width wing, and wing length, which are often
considered in other country studies not for Ethiopia.
Table 2. Descriptive statistics for morphometric traits of indigenous chicken
Variable Minimum Maximum Mean Std. deviation
Body weight (Kg) 0.840 1.98 1.26 0.23
No. of eggs/hen/year 47 76 61 11
Body length (cm) 17.75 40.38 33.04 5.68
Wing span (cm) 7.35 77.87 35.17 21.95
Neck length (cm) 10.10 18.93 14.18 3.25
Comb height (cm) 0.58 3.10 1.78 0.76
Comb length (cm) 1.85 5.88 3.37 1.25
Wattle length(cm) 0.59 3.69 2.04 0.97
Shank length(cm) 6.24 12.20 8.47 1.37
Shank circumference (mm) 0.53 3.92 2.01 1.45
Keel bone length (cm) 7.62 16.55 10.32 2.18
Chest circumference (cm) 23.89 30.47 26.26 1.79
Back length (cm) 16.51 21.84 18.97 1.73
Beak length (cm) 1.19 2.70 2.16 0.44
Spur length (cm0 0.08 0.66 0.33 0.23

29
2.4.4. Genetic diversity
Few genetic studies have been undertaken in IC chicken populations of Ethiopia (Table S 2).
Among genetic diversity estimators He (n = 2), Ho (n = 8), MNA (n = 6), PIC (n = 3) and FIS (n
= 5) are most studied in diversity studies in indigenous chicken populations of Ethiopia. However,
considering the diversity and wide land size of the country, the studies are not representative in
terms of sample size and physical coverage. Meta-analysis of results from combined studies
indicate the range values for MNA (4.20-6.29), ENA (2.5-6.35), PA (2-3.75), He (0.12-0.63),
allele/locus (4.7-5.10), Ho (0.27-0.93), FIS (0.02-0.17) and IBS (0.01-0.02) (Table 3). Only the
effective number of alleles vary significantly across the different dominant religious demography
(P < 0.05; Table S 37). Significant variation was observed between genetic parameters and
elevation (P < 0.05; Table S 37). Also, mean number of alleles, polymorphic information content,
coefficient of inbreeding and alleles per locus show a significant variation with agro-ecologies (P
< 0.05; Table S 38).
Table 3. Reported genetic parameter values on indigenous chicken across studies
Variable Minimum Maximum Mean Std. deviation
Mean number of alleles/population 4.20 6.29 5.29 0.57
Allelic richness 4.82 4.95 4.89 0.09
Effective number of alleles 2.53 6.35 4.96 1.65
Alleles/locus 4.70 5.10 4.90 0.19
Private alleles 2.00 3.75 2.96 0.65
Observed heterozygosity 0.27 2.44 0.77 0.55
Expected heterozygosity 0.12 0.63 0.49 0.16
Coefficient of inbreeding 0.02 0.17 0.08 0.04
Mean PIC/population 0.47 0.72 0.59 0.09
Mean number of identity by state 0.01 0.02 0.02 0.00

30
Figure 1. Geographic localization of the phenotypic (red circles), genotypic (yellow circles) and
combined phenotypic- genotypic studies (blue circles) against the agro-ecological zones of
Ethiopia.
See Table S 1. for sampling sites villages.
A1 = Hot to warm arid lowland plains; A2 = Tepid to cool arid mid highlands; SA1 = Hot to warm semi-
arid lowlands; SA2 = Tepid to cool semi-arid mid highlands; SM1 = Hot to warm sub- moist lowlands;
SM2 = Tepid to cool sub-moist mid highlands; SM3 = Cold to very cold sub-moist sub-afro-alpine to afro-
alpine; M1 = Hot to warm moist lowlands; M2 = Tepid to cool moist mid highlands; M3 = Cold to very
cold moist sub-afro alpine to afro-alpine; SH1 = Hot to warm sub-humid lowlands; SH2 = Tepid to cool
sub-humid mid highlands; SH3 = Cold to very cold sub-humid sub afro-alpine to afro-alpine; H1 = Hot to
warm humid lowlands; H2 = Tepid to cool humid mid highlands; H3 = Cold to very cold humid sub-afro
alpine to afro-alpine; Ph1 = Hot to warm per humid lowlands; Ph2 = Tepid to cool per humid mid highlands
(MOA, 2000).

31
2.4.5. Limitations of previous studies
Over all, in the process of reviewing the different phenotypic and molecular studies throughout
Ethiopia, huge inconsistencies and less standardization of previous works in describing and
addressing different qualitative variants across studies have been noted. For instance, different
scholars provided various context of color variant descriptions (Table S 7. Besides, the various
studies didn’t consider the socio-physical environment in studying the different morphological and
molecular diversities. Various scholars have suggested different ecotypes here and there despite
little evidence of variation in phenotypic and genetic diversity. To the scope of this review,
phenotypic studies that considered effective population size in Ethiopian ICs are not available.
Lack of focus in targeting traits having significant socio-cultural and economical importance
before designing of their diversity study was also another limitation of previous works. In this
regard, the entire phenotypic studies only followed potentiality of chicken production.
Besides, Ethiopian phenotypic studies lack to mention measurement devices and if all
measurements were taken by the same individual to avoid individual induced systematic errors.
Studies that run PCA and develop a prediction equation for body weight are not reported in this
review. No phenotypic studies also attempt to determine the phenotypic diversity indices and
quality of distribution of the traits using the Simpson’s diversity index and quality of distribution.
Dendo-grams through the squared Euclidean distance of hierarchal cluster analysis were not
obtained in any kind of phenotypic studies in indigenous chicken populations of Ethiopia based on
various physical factors.

32
2.5. Overview of the chicken genome
The chicken is the first sequenced animal agricultural species with the first of the chicken genome
released in 2004 (Burt, 2007, 2004; Jensen, 2005; Tixier-Boichard et al., 2011). Chickens are being
widely used as a model organism to study human diseases like muscular dystrophy, immunological
diseases and thyroid insufficiency to find and investigate candidate genes affecting such traits
(Boichard et al., 2012; Cogburn et al., 2007; Jensen, 2005). The chicken genome contains 15% of
repetitive DNA sequences comprised of short tandem repeats and several families of long
interspersed elements (Soattin et al., 2009; Treangen and Salzberg, 2012; Wicker et al., 2004). It
comprises 39 pairs of chromosomes including eight pairs of macro-chromosomes, one pair of sex
chromosomes (Z and W) and 30 pairs of microchromosomes (Burt, 2007; Rao et al., 2007). The
size of the chicken genome (Gallus_gallus-5.0; GCA_000002315.3) is estimated to be 1.28 × 10⁹
(1,285,637,921) base pairs (
Table 4). The chicken genome contains 24,838 genes distributed over 39 pairs of chromosomes
plus 34,811,469 LTR elements; 20,000 DNA transposons, 140,000 simple repeats, 571 ncRNA
genes and 4,000 satellites (https://www.ensembl.org/Gallus_gallus/Info/Annotation). The chicken
genome was also confirmed to possess about 2.8 million genetic polymorphisms (Fulton, 2009)
and 5 SNPs per kb unlike the human genome (1 SNPs per Kb) (The 1000 Genomes Project
Consortium et al., 2015). Simultaneously with the release of the 2004 chicken genome sequence,
the Beijing Genome Institute identified and released the 2.8 million single nucleotide
polymorphisms (SNP) to the public domain.
Single nucleotide polymorphisms are single nucleotide variants within the DNA sequence. They
were identified by comparing the Jungle Fowl genome sequence with partial sequence information

33
(0.3×) from 4 different chickens: 1 Silkie (Chinese breed), 2 commercial broilers (meat type), and
1 inbred laboratory White Leghorn (egg-layer type). These SNP have formed the basis for all the
large SNP genotyping platforms developed to date. The second build was released in 2006 that
corrected some of the deficiencies found in the first version. However, even this second build had
multiple deficiencies. It was missing many of the gene-rich micro chromosomes. Chromosome 16
contains the major histocompatibility complex (cluster of immune function genes) and was very
poorly covered. The Z chromosome is known to be incomplete and to have a considerable number
of errors in gene order (Fulton, 2012). A third build of the genome (Gallus_gallus-5.0;
GCA_000002315.3) has brought an increase of N50 contig and scaffold size to 252 Kb (460%)
and 12.4 Mb, respectively (Warren et al., 2016). Gallus Gallus 5.0 shows an increase of 4679
annotated genes (2768 noncoding and 1911 protein-coding) over those in Gallus Gallus 4.0
(Warren et al., 2016). A third build of the chicken genome has been produced but has not yet been
released for public access.
Table 4. Genome statistics for the chicken reference genome (Gallus Gallus 5.0) assembly.
Statistics
Assembly Gallus_gallus-5.0, INSDC
Assembly GCA_000002315.3, Dec 2015
Base Pairs 1,285,637,921
Golden Path Length 1,230,258,557
Database version Ensembl 92.5
Gene counts
Coding genes 18,346
Noncoding genes 6,492
Small non-coding genes 1,705
Long non-coding genes 4,643
Miscellaneous non-coding genes 144
Pseudogenes 43
Gene transcripts 38,118
Data available from Ensemble genome data base.
(http://www.ensembl.org/Gallus_gallus/Info/Annotation).

34
2.6. Estimators of genetic diversity between and within chicken populations
Genetic diversity is a result of variations in DNA sequences among organisms due to mutations
resulting from the substitution of single nucleotides (SNPs), insertion or deletion of DNA
fragments, and duplication or inversion of DNA fragments (Fulton, 2009). It allows farmers to
select stocks or develop new breeds in response to changing conditions to ensure food security
(Toro et al., 2014). Besides, genetic diversity is important as an enormous number of livestock
diversity is disappearing globally for a number of reasons to develop conservation and
improvement strategies (Barker, 2001; Boettcher et al., 2010; Ruane, 1999; Simianer, 2005). A
number of estimators of genetic diversity have been reported by different scholars.
2.6.1. Allelic variability
Allelic variability (number of alleles segregating in the population) is one of the estimators used
to measure genetic diversity with key relevance in genetic conservation programmes (Barker,
2001; Simianer, 2005; Toro et al., 2014). The mean number of alleles (MNA) observed over a
range of loci for different populations are a reasonable indicator of genetic variation provided that
the populations are at mutational-drift equilibrium and that the sample size is almost equal for each
population (Allendorf et al., 2010). Breeds with a low MNA have a low genetic variation which
might be due to factors like-genetic isolation, historical population bottlenecks or founder effects
and a high MNA implies great allelic diversity which could have been influenced by cross-
breeding or admixture. The other estimators of allelic variability are the effective number of alleles
(ENA) and allelic richness (Ar) (Allendorf et al., 2010). These parameters are used when the

35
sample sizes are not the same for each population under subject. ENA denotes the number of
equally frequent alleles it would take to achieve a given level of gene diversity. It allows to
compare populations where the number and distribution of alleles differ drastically. Ar is a
measure of the number of alleles per locus but allows comparisons to be made between samples
of different sizes by using the rarefaction technique or a Bayesian simulation approach to
standardize populations to a uniform sample size.
2.6.2. Hardy-Weinberg equilibrium
The other fundamental parameter used to measure genetic diversity between and within
populations is Hardy–Weinberg Equilibrium (HWE) (Zhou et al., 2009). A population is said to
be in HWE when gene and genotype frequencies remain constant from generation to generation
without the factors (e.g. selection, migration, and mutation) which can cause changes in these
frequencies and in turn non-random union of gametes. Deviation from HWE in a population
indicates possible inbreeding, population stratification and sometimes problems with the
genotyping (Sha and Zhang, 2011). Allendorf et al. (2010) mentioned that the data required to test
HWE in a natural population are gene and genotype frequencies and the size of the sample
population at each locus. The χ2-test remains the most popular option (Salanti et al., 2005; Shriner,
2011) and tests of HWE are commonly performed using a simple x2 goodness-of-fit test that
compares expected and observed numbers of heterozygotes and homozygotes (Allendorf et al.,
2010; Allendorf and Luikart, 2007; Wigginton et al., 2005).

36
2.6.3. Linkage disequilibrium
Another estimator of genetic variation is Linkage disequilibrium (LD) which is described as the
non-random association between different loci which may arise from admixture of populations
with different gene frequencies; chance in small populations (e.g. endangered breeds); selection
favouring one combination of alleles over another; the close association between markers in the
same linkage group (Lee et al., 2012). LD between densely spaced, polymorphic genetic markers
in different species contains information about historical events of recombination in a population
(Hayes, 2003; Khanyile, 2015). Most measures of LD, such as r2 and related measures, quantify
the association between a pair of loci. The degree of linkage disequilibrium can be estimated
directly from the genotypic frequencies in a sample of individuals taken from the population
(Hayes, 2003).
2.6.4. Average heterozygosity and inbreeding
The average expected heterozygosity (He) also called Nei’s gene diversity; defined by Nei (1986)
at n loci within a population; is the best general measure of genetic diversity within a population
(Allendorf and Luikart, 2007). Individual breed average heterozygosity is estimated by summing
heterozygosity at each locus and averaging these values over all loci (Hedrick and Kalinowski,
2000). It is often calculated based on the square root of the frequency of the null (recessive) allele
as follows: He=1-∑ pni i2, where pi is the frequency of the ith allele (Allendorf et al., 2010; Allendorf
and Luikart, 2007). The observed heterozygosity (HO) is defined as the percentage of loci
heterozygous per individual or the number of individuals heterozygous per locus. High
heterozygosity values for a breed may be due to long-term natural selection for adaptation, to the

37
mixed nature of the breeds or to historic mixing of strains of different populations. A low level of
heterozygosity may be due to isolation with the subsequent loss of unexploited genetic potential.
In genetics, inbreeding is defined as the mating of closest relatives (Allendorf and Luikart, 2007).
The inbreeding coefficient (f) is the probability that the two alleles at a locus within an individual
are identical by descent as they are derived from the same allele in a common ancestor in a previous
generation. It is recommended that inbreeding coefficients should only be estimated for breeds
which show significant deviation from the HWE (Curie-Cohen, 1981; Vieira et al., 2013). A large
value reflects the existence of a small number of heterozygote genotypes and an excess of
homozygote genotypes. A small value indicates the occurrence of heterozygote genotypes at a
higher proportion than the homozygote genotypes.
2.6.5. Genetic differentiation
When a population is divided into subpopulations, there is less heterozygosity than there would be
if the population was undivided (Kanginakudru et al., 2008). There are different types of
approaches enumerated to quantify the distribution of genetic diversity within and between
livestock populations. But, the two commonly used approaches to quantify the distribution of
genetic diversity within and between populations include : Wright’s F statistics (fixation indices)
and AMOVA (Analysis of molecular variance). Computations of Wright's fixation indices (FIT,
FST, and FIs) are pivotal and most widely used for studying the genetic differentiation of
populations (Nei, 1986). The fixation index ranges from 0 (indicating no differentiation between
the overall population and its subpopulations) to a theoretical maximum of 1. In other words, 0

38
indicates identical allele frequencies in a pair of populations (no differentiation) and 1.0 indicates
alternate fixation for a single unique allele (the absence of any shared alleles) in each population.
In practice, however, the observed fixation index is much less than 1 even in highly differentiated
populations (Bird et al., 2011). The most commonly used programs for performing AMOVA are
Arlequin, GDA, and GenAlEx (Excoffier and Smouse, 1992).
2.6.6. Determining genetic relationships between populations
Phylogenetic analysis is the means of inferring or estimating evolutionary relationships among
breeds or populations and categorize cattle populations (Brinkman and Leipe, 2002). The
evolutionary history inferred from the phylogenetic analysis is usually depicted as branching,
treelike diagrams that represent an estimated pedigree of the inherited relationships among
molecules, organisms, or both. The commonly used methods of clustering fall into two general
categories: hierarchical and non-hierarchical. Hierarchical procedures are the most commonly used
in animal diversity studies called phylogenetic analysis. The genetic distance measures are used to
construct the dendrograms, also called phylogenetic trees. The two most commonly used methods
for constructing the trees are unweighted pair group method (UPGMA) and the neighbor-joining
method (NJ) (Backeljau et al., 1996). UPGMA trees give an indication of the time of separation
(divergence) of breeds. The higher the branch length the longer is the separation period between
breeds (Brinkman and Leipe, 2002).

39
2.7. Molecular markers for assessing chicken genetic diversity
Molecular (genetic) markers are defined as any stable and inherited variation that can be detected
by a suitable technique to subsequently detect the presence of a specific genotype or phenotype
other than itself (Fulton, 2009). The development of these markers has been created new
opportunities for the selection and genetic improvement of livestock. Practically, DNA based
polymorphisms are being used for marker-assisted selection strategies, parentage testing, species
identification, and population genetic studies (Naqvi, 2007). These polymorphisms also provide
the foundation for genetic linkage maps, which are being used to identify loci for economically
important variation and speed up the rate of improvement in production traits (Zhang et al., 2015).
The use of molecular and bio-chemical markers to predict the total genetic merit of livestock to
redesign animal breeding and management programs were also appraised (Toro et al., 2009).
Molecular markers are playing a role in estimating the diversity (Bruford et al., 2003; Gibson et
al., 2006; Teneva, 2009; Weigend and Romanov, 2002), distinctiveness, population structure of
animals (Gholizadeh and Mianji, 2007) and aid in the genetic management of small populations,
to avoid excessive inbreeding (Zanetti, 2009). Among others, the most pronounced DNA-based
molecular techniques that are used to evaluate DNA polymorphism in chickens improvement
programs are reviewed as follows:
2.7.1. Restriction Fragment Length Polymorphism
Restriction Fragment Length Polymorphism (RFLP) is the most broadly used hybridization-based
molecular marker (Tazeb, 2018). RFLPs are inherited as naturally occurring Mendelian characters
and have their DNA rearrangements due to evolutionary processes, point mutations within the

40
restriction enzyme recognition site, mutations within the fragments, and unequal crossing over.
The advantage of RFLPs is that they are co-dominant markers and are very reliable in linkage
analysis and breeding. The limitations of the RFLP marker are that a large amount of DNA is
required for restriction digestion and Southern blotting. The RFLP is relatively expensive and
hazardous due to the requirement of a radioactive isotope. The assay is time-consuming and labor-
intensive and only one out of several markers may be polymorphic, which is highly inconvenient
especially for crosses between closely-related species which precluded its widespread adoption
within the poultry breeding industry (Fulton, 2012). Their inability to detect single base changes
restricts their use in detecting point mutations occurring within the regions at which they are
detecting polymorphism.
2.7.2. Random Amplification of Polymorphic DNA
Another method for detecting polymorphic markers is the random amplified polymorphic DNA
(RAPD) assay. This assay, which is based on the polymerase chain reaction (PCR), uses short
oligonucleotide primers of arbitrary sequence to amplify discrete regions of the genome (Kumar
and Gurusubramanian, 2011; Tingey and de, 1993). This marker was developed by William and
his co-workers in 1990, which employs single primer usually with 10 nucleotide bases as oligo-
nucleotide primers and a GC content of at least 50% to amplify discrete fragments of DNA in low
stringency of polymerase chain reaction (Smiths et al., 1996). RAPD is a quick, rapid, and
inexpensive method of studying the DNA polymorphisms within and between populations based
on the amplification of random DNA segments with single primers of an arbitrary nucleotide
sequence. This dominant marker has also been widely used in poultry research (Shivashankar,
2014). The RAPD markers were used to detect polymorphism among five breeds of chicken i.e.

41
White Leghorn and Rhodes Island Red (selected for part period egg production and egg mass
respectively), Red Cornish and White Plymouth Rock (selected for early body weights) and
Kadaknath (native breed) (Sharma et al., 2001). It was also used to evaluate genetic diversity and
relatedness within and among four breeds of chickens and two turkey populations (Smiths et al.,
1996). Among the PCR based DNA marker, RAPDs are cost-effective, most versatile and
relatively easy to perform. The technique requires no prior knowledge of DNA sequence and
utilizes minor quantities of DNA material, therefore, can be applied to even rare plant species. The
main limitations encountered with the use of RAPD markers are repeatability of banding patterns
and dominant inheritance. The ambiguity of the resulting fingerprint patterns and the fact that
heterozygotes cannot be distinguished from homozygotes due to its dominant inheritance
mechanism is another limitation of RAPD (Rege and Okeyo, 2006). In addition, how the genetic
variation observed is generated is not fully understood, making reconstruction of evolutionary
histories from RAPD data difficult.
2.7.3. Microsatellites
Microsatellites are also known as simple sequence repeats SSRs (Bruford et al., 2003); short
tandem repeats (STRs) or simple sequence length polymorphisms SSLPs are the smallest class of
simple repetitive DNA sequences. They are co-dominant, highly polymorphic, and multi-allelic.
They are well-dispersed throughout the genome and are presumed to be selectively neutral.
Microsatellite polymorphism refers to the differences in allele sizes due to variation in the number
of repeats of base sequences that are detected by gel electrophoresis (Rege et al., 2006). They are
known to be universal in prokaryote and eukaryote genomes and are present both in coding and

42
non-coding regions. Genetic diversity measures using the highly polymorphic variable number of
tandem repeat loci yield reliable and accurate information for the study of genetic relationships
between chicken populations (Weigend and Romanov, 2002). In addition, microsatellites are easy
to identify and have low mutation rates (Zhang et al., 2002). Many microsatellites have recently
become available and being exploited in chickens, and have been mapped in reference (Gholizadeh
and Mianji, 2007). Based upon sites in which the same short sequence is repeated multiple times,
they present a high mutation rate and codominant nature, making them appropriate for the study
of both within- and between-breed genetic diversity (Toro et al., 2009).
2.7.4. Amplified Fragment Length Polymorphism
Amplified Fragment Length Polymorphism (AFLP) are based on the detection of restriction
fragments by PCR amplification. Genomic DNA is restricted with two different restriction
endonucleases and then a subset of these are amplified using a modified PCR and visualized using
radioactivity, silver staining or fluorescent dyes for use with an automated sequencer (Rege and
Okeyo, 2006). Advantages of the AFLP are that no prior sequence information of the genome is
required. A large number of polymorphic bands are produced and the technique is highly
reproducible and standardized kits are available (Duim et al., 2000). According to the narrations
of Toro et al. (2009), the AFLPs are dominant bi-allelic markers that provide an easy way to carry
out a genome-wide screening of variation. AFLPs are reliable informative multi-locus probes and
provide high levels of resolution that allows delineation of complex genetic structures (Rege and
Okeyo, 2006). They have the disadvantage of a reduced power to analyze within-breed diversity
due to the dominant mode of inheritance but could be very useful in analyzing between-breed
variation.
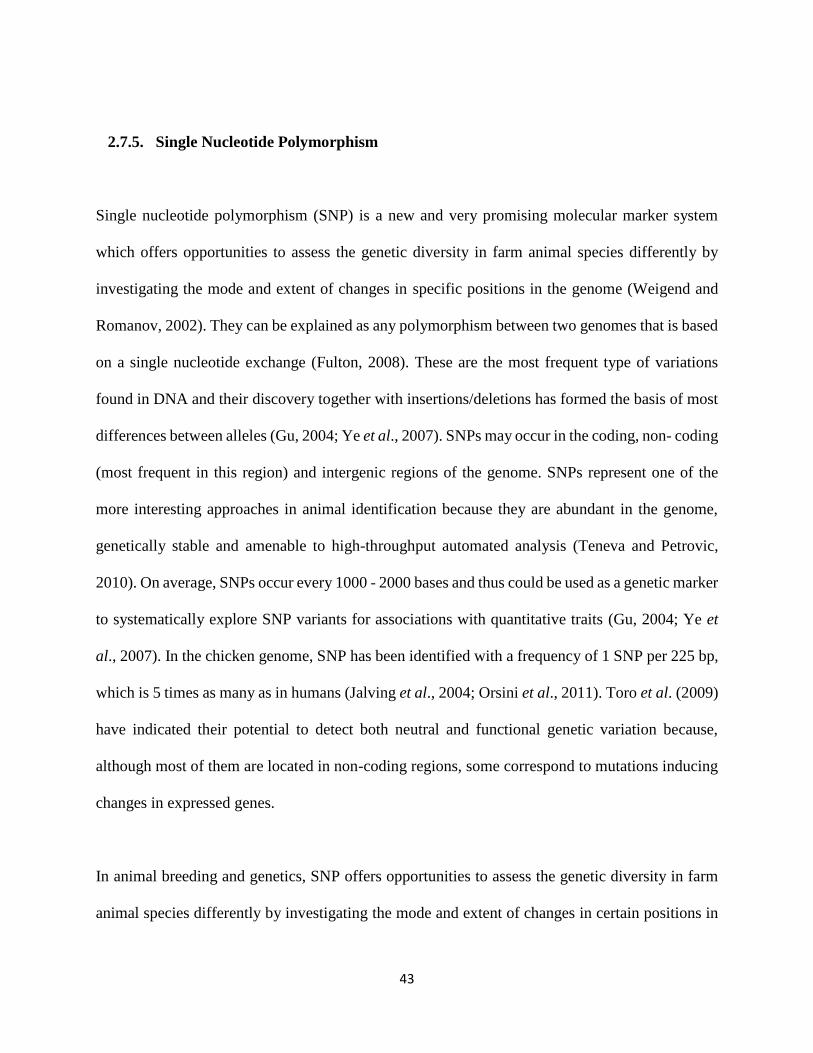
43
2.7.5. Single Nucleotide Polymorphism
Single nucleotide polymorphism (SNP) is a new and very promising molecular marker system
which offers opportunities to assess the genetic diversity in farm animal species differently by
investigating the mode and extent of changes in specific positions in the genome (Weigend and
Romanov, 2002). They can be explained as any polymorphism between two genomes that is based
on a single nucleotide exchange (Fulton, 2008). These are the most frequent type of variations
found in DNA and their discovery together with insertions/deletions has formed the basis of most
differences between alleles (Gu, 2004; Ye et al., 2007). SNPs may occur in the coding, non- coding
(most frequent in this region) and intergenic regions of the genome. SNPs represent one of the
more interesting approaches in animal identification because they are abundant in the genome,
genetically stable and amenable to high-throughput automated analysis (Teneva and Petrovic,
2010). On average, SNPs occur every 1000 - 2000 bases and thus could be used as a genetic marker
to systematically explore SNP variants for associations with quantitative traits (Gu, 2004; Ye et
al., 2007). In the chicken genome, SNP has been identified with a frequency of 1 SNP per 225 bp,
which is 5 times as many as in humans (Jalving et al., 2004; Orsini et al., 2011). Toro et al. (2009)
have indicated their potential to detect both neutral and functional genetic variation because,
although most of them are located in non-coding regions, some correspond to mutations inducing
changes in expressed genes.
In animal breeding and genetics, SNP offers opportunities to assess the genetic diversity in farm
animal species differently by investigating the mode and extent of changes in certain positions in

44
the genome (Weigend and Romanov, 2002) and for association mapping of genes controlling
complex traits and provide the highest map resolution. SNPs offer several advantages over other
types of DNA marker systems and are rapidly becoming the markers of choice for many
applications in genome analysis due to their abundance (especially important in linkage
disequilibrium-based mapping approaches) and also because high throughput genotyping methods
are being developed for their analysis. The additional advantage offered by this approach lies in
the phylogenetic information gathered through sequence variation analysis that allows drawing
inferences on allele and population history that cannot be gathered with any of the other marker
systems available. SNPs are also evolutionarily stable (i.e. do not change much from generation to
generation) making them easier to follow in population studies (Rege and Okeyo, 2006).
Groenen et al. (2011) have affirmed that a high success rate of the SNPs on the Illumina chicken
60k bead chip. Johansson and Nelson, (2015) have used the 60k SNPs to characterize the genetic
diversity and map loci associated with a trait that are segregating in both Swedish local chicken
breeds. Kranis et al. (2013) also developed a very high-density 600k SNP genotyping array for
chicken commercial lines. With regard to the mapping of genes of interest in indigenous chickens,
so far a single work has been done by Wragg et al. (2012) who used 15 randomly selected 5 chicken
Ethiopian populations (in Gondar, Konso, Gumuz, Sheka, and Guduro) together with other breeds.
They mapped phenotypic traits (skin and egg color) using genome-wide association study and
revealed the possibility of fine mapping of non-pedigree chicken populations to characterize
Mendelian traits at the molecular level using association analysis. Wragg and his colleagues also
recommended that at least 90-110 kb SNPs are required for effective genome-wide associations

45
study in village chickens. Their study considered a few numbers of samples (three chickens from
each population) and it used a 50 K SNP chips.
2.7.6. Mitochondrial DNA
Mitochondria are sub-cellular organelles containing an extra chromosomal genome that is separate
and distinct from the nuclear genome. Mitochondrial DNA is maternally inherited, does not
undergo recombination, is a valuable molecule in investigating phylogenetic relationships among
populations, subspecies, and species, and can be used to evaluate the maternal genetic constitution
for a specific population (Shen et al., 2002). Shen and his colleagues in their study have made the
first attempt to estimate the level of mtDNA diversity in the Chunky broiler and to compare it with
some other chicken breeds used for egg production. They have presented new molecular evidence
from the entire mitochondrial cytochrome b gene for the Chunky broiler and three other egg-
chicken breeds.
2.8. The Major Histocompatibility (MHC) gene in chicken
The Major Histocompatibility Complex (MHC) is a highly conserved gene comprising a cluster
of over 80 genes (92 kb) spanning on chromosome 16 (Chazara et al., 2011) characterized by high
polymorphism and a tight linkage into a single supergene complex (Baelmans et al., 2005;
Jarosinski et al., 2010; Miller et al., 2004), which have sought the attention of researchers for their
association with disease resistance or susceptibility (Banat et al., 2013; Chazara et al., 2013, 2011;
Gao et al., 2015; Hoque et al., 2011; Owen et al., 2008; Walker et al., 2011; Weigend and
Romanov, 2001). Particularly, the chicken MHC on GGA16 has long been known as a gene region

46
contributing significantly genetic resistance to infectious diseases (Hosomichi et al., 2010, 2009;
Miller and Taylor, 2016; Warren et al., 2017). It comprising loci encoding receptors which bind
amino acid fragments from foreign pathogens on the surfaces of various immune and non-immune
cells (Baelmans et al., 2005; Chen et al., 2012; Fulton et al., 2016; Jarosinski et al., 2010; Ncube
et al., 2014; Nguyen-Phuc et al., 2016; Nikbakht and Esmailnejad, 2015; Zheng et al., 1999).
LEI0258 is a highly polymorphic microsatellite locus located within the BF region of MHC-B on
chromosome 16 and has been reported to have a direct association with chicken performance
(Chazara et al., 2011; Figure 2). These include antibody responses to vaccination against
Newcastle Disease Virus (NDV), Marek’s disease, corona virus and coccidiosis (Baelmans et al.,
2005; Briles et al., 1977; Nikbakht and Esmailnejad, 2015; Hateren et al., 2013). Its association
with body weight, survival, embryonic mortality, fertilization rate, hatchability, egg production
and resistance to worms has also been documented in many studies (Wang et al., 2014). Given the
high level of polymorphism, LEI0258 marker genotypes have been suggested as good indicator of
MHC-B haplotypes and it has become an important genetic marker used in chicken breed
improvement program (Nguyen-Phuc et al., 2016). This has been confirmed by Chazara et al.
(2013) who have ascertained that the LEI0258 marker genotypes an excellent predictor of the
heterozygosity at the MHC locus. LEI0258 is described as atypical variable number tandem repeat
(VNTR) which is composed of 12 bp (CTTTCCTTCTTT) and 13 bp (CTATGTCTTCTTT)
conserved sequences which are flanked on both sides by indels and SNPs (Fulton et al., 2006). In
an association study of MHC haplotypes with Marek’s disease, Cole found 96.5% resistant of the
birds with B-21 haplotypes were resistant to viral infection while of the birds with the B-19
haplotypes suffered 100% incidence of mortality. Polymorphisms are high at LEI0258. Fulton et

47
al. (2006) observed allele size diversity ranging from 182 bp -552 bp. Lwelamira et al. (2008)
genotyped two chicken ecotypes from Tanzania and they identified 22 and 23 alleles at LEI0258,
respectively. They further report that allele 206 bp had a significant positive correlation (P < 0.001)
with the elevated antibody responses against NDV vaccine, whereas the allele 307 bp was
positively correlated with body weight trait.
Figure 2. Schematic location of the LEI0258 marker in the chicken MHC map (Fulton, 2006).
BF = MHC class 1; BG = MHC class 4; BL = MHC class 2; NOR = nucleolar organizer region; Y
= MHC-Y complex; B = MHC-B complex; and BLA = MHC class 2 α gene (Izadi et al., 2011).
2.9. Approaches for detecting signatures of selection
The identification of regions that have undergone selection is one of the principal goals of
theoretical and applied and evolutionary genetics (Gouveia et al., 2014). Such studies can also
provide information about the evolutionary processes involved in shaping genomes, as well as
physical and functional information about genes/genomic regions (Ibid). Artificial selection is the
primary factor in the domestication and breeding history of livestock species. In the genomic era,
selection refers to any nonrandom, differential propagation of an allele as a consequence of its
phenotypic effect (Vitti et al., 2013). Selection may act in a directional manner, in which an allele

48
is favored and so propagated (positive selection) or disfavored (negative selection, also called
purifying selection) (Ibid). Positive selection leaves a more conspicuous footprint on the genome
that can be detected using a number of different approaches (Jacobs et al., 2016; Pavlidis and
Alachiotis, 2017; Ronen et al., n.d.; Wollstein and Stephan, 2015). The detection of “signature of
selection” is now possible on a genome-wide scale in many plant and animal species and can be
performed in a population-specific manner due to a wealth of per population genotype data that is
available (Cadzow et al., 2014). Identification of the genomic signatures of recent selection may
help uncover casual polymorphisms controlling traits relevant to recent decades of selective
breeding in livestock (Fu et al., 2016) and can contribute to further shaping economically
important traits (Ma et al., 2018).
The tools used to detect evidence of selection are dependent on the nature of selective signature
being investigated, which itself depends on the time scale over which selection occurred (Fu et al.,
2016; Roosen et al., 2016; Tarekegn, 2016; Williams, n.d.). The Fst statistic has been a popular
choice for investigation selection by utilizing differences in allelic frequency between populations
to infer selective pressure in one population relative to the other and allowing detection of potential
selection occurring in the range of 50,000 to 75,000 years prior for human populations (Ibid). A
locus that shows significantly highest Fst statistics compared with other loci provides evidence of
positive selection (Nielsen, 2005). Tajima’s D is also another method suitable for detecting
evidence of positive selection in human populations occurring within the past 250,000 years or
approximately 10,000 generations and operates by identifying an excess of low to low intermediate
frequency variants. Another commonly used measure is Fay and Wu’s H (Fay and Wu,2000)
which is useful for detecting evidence of more recent positive selection (80,000 years or
approximately 3000 generations), particularly for intermediate-high frequency variants and thus

49
complements Tajima’s D and other methods (Baxevanis and Ouellette, 2001). Analysis of
haplotypes provides another mechanism for identifying evidence of selection, with a number of
methods utilizing the Extended Haplotype Homozygosity (EHH) concept. One of the more popular
of these approaches is the Integrated haplotype Homozygosity Score (iHS) methodology, which
provides a standard measure of the decay in EHH around a point (e.g., a SNP) from derived allele
relative to the central allele (Voight et al., 2006). Regions of slowly decaying haplotype
Homozygosity in the derived allele (longer than expected haplotypes, relative to the ancestral
allele) are thus indicative of selection at that locus (Cadzow et al., 2014). Rubin et al. (2012), and
Elferink et al., (2012) have investigated selection signatures in a large number of chicken breeds
using Z-transformed pooled Heterozygosity (ZHp) scores. This statistic estimates local
heterozygosity depression in chromosomal regions and has been appropriately applied for
detecting alleles that have swept to fixation or near fixation for long-term directional selection or
during domestication (Fu et al., 2016; Rubin et al., 2010). Both the Fst statistic and Tajima’s D
can be calculated using standard genotype data obtained from heterozygous populations must be
phased prior to calculation of iHS (Cadzow et al., 2014).

43
Table 5. An overview of common approaches for detecting signatures of selection.
Methods Intuition Representative tests
Gene-based Synonymous substitutions are selectively neutral. If the rate of
nonsynonymous substitution differs significantly, it is suggestive
of selection
dN/ds(w); McDonald-Kreitman test (MKRT)
Frequency-based In a selective sweep, a genetic variant reaches high prevalence
together with nearby linked variants (high frequency derived
alleles). From this homogeneous background, new alleles arise but
are initially at low frequency (Surplus of rare alleles).
Ewens-Watterson test; Tajima D and derivatives; Fay
and Wu’s H
Linkage
disequilibrium
based
Selective sweeps bring a genetic region to high prevalence in a
population, including the casual variant and its neighbors. The
associations between these alleles define haplotype, which persists
in the population until recombination breaks these
Long-range haplotype (LRH) test; Long range
haplotype similarity test; Integrated haplotype score
(His); Cross-population extended haplotype
homozygosity (XP-EHH); Linkage disequilibrium
decay; Identity by descent (IBD) analyses.
Population
differentiation
Selection acting on an allele in one population but not in another
creates a marked difference in the frequency of that allele between
the two populations. This effect of differentiation stands out against
the differentiation between the two populations with respect to
neutral (i.e., non-selected) alleles.
Leontin-Krakauer test (LKT); Locus specific branch
length (LSBL); hapFLK
Source: Vitti et al., 2013

44
CHAPTER 3. DIVERSITY OF LEI0258 MICROSATELLITE IN
ETHIOPIAN INDIGENOUS CHICKEN POPULATIONS
Abstract
Indigenous chicken are locally adapted to environmental challenges and provide subsistence to
millions of farmers in Africa. However, their productivity remains low compared to exotic chicken
strains. Efforts are being made to combine the local adaptation of indigenous chickens with
productivity traits of exotic chickens. Understanding the link between genetic diversity and
environmental challenges is opening the door to marker-assisted breed improvement programs for
sustainable chicken production at smallholder farmer level. Genetic variation at LEI0258
microsatellite found within the MHC region has been linked to infectious diseases
resistance/susceptibility in commercial breeds. Here, we report diversity of LEI0258 in 236
chicken from 24 Ethiopian indigenous chicken populations from different agro-ecological zones
using gel electrophoresis and sequencing. The MHC polymorphism was ascertained through
genotyping the LEI0258 microsatellite locus by PCR-based fragment analysis followed by Sanger
sequencing. The number of alleles, allele frequency, and heterozygosity levels were used to
measure diversity within populations whilst the Wright’s fixation indices were used to analyze the
level of population structuring. Twenty nine LEI0258 allele sizes were observed using capillary
electrophoresis. Allele sizes ranged from 185 to 569 bp with no significant difference in allele
frequencies between populations (P < 0.01). Allele frequencies were in Hardy and Weinberg
Equilibrium in all population except in Dara chicken (P > 0.05). Excluding the tandemly repeated
motif, we identified 412 monomorphic and 35 polymorphic sites. The number of point mutation

45
and indels are 33 and 17, respectively. The number of R12 CTTTCCTTCTTT repeats ranged from
2 to 18, while R13 CTATGTCTTCTTT was found invariant in all populations. Sequences
relationships reveal two distinct groups of alleles. The high diversity at microsatellite LEI0258 at
Ethiopian indigenous village chicken populations supports the importance of the MHC region in
relation to the disease challenges diversity faced by smallholder poultry production within and
across Ethiopian agro-ecologies. We recommend that breed improvement programs ensure the
maintenance of this diversity by selecting breeding stock as diverse as possible at the LEI0258
locus.
Keywords: Chicken, Genetic Diversity, Ethiopia, LEI0258 microsatellite, MHC

46
3.1. Introduction
High evolutionary pressures occurred in chicken during the course of domestication and
subsequent natural and human selection (Downing et al., 2009). Among others, infectious diseases
exert strong selective pressures by affecting genes associated with innate and adaptive disease
resistance and susceptibility. According to Salomonson et al. (2014), many of the genes involved
in immunity are part of multigene families. In some families, each gene is conserved for a specific
function dedicated to a particular outcome, in others allelic polymorphism and copy number
variation allow rapid evolution in response to new environmental challenges, and other families
comprise both kinds of genes (Miller et al., 2004). The Major Histocompatibility Complex (MHC)
is one of these multigene family comprising loci encoding receptors which bind amino acid
fragments from foreign pathogens on the surfaces of various immune and non-immune cells
(Baelmans et al., 2005; Chen et al., 2012; Fulton et al., 2006; Fulton et al., 2016; Jarosinski et al.,
2010; Ncube et al., 2014; Nguyen-Phuc et al., 2016; Nikbakht et al., 2013). MHC is a cluster of
over 80 genes (92 kb) spanning chromosome 16 (Chazara et al., 2013, 2011; Lima-Rosa et al.,
2005; Miller et al., 2004; Nikbakht and Esmailnejad, 2015; Walker et al., 2011) characterized by
high polymorphism and a tight linkage into a single supergene complex (Miller et al., 2004), which
have sought the attention of researchers for their association with disease resistance or
susceptibility.
LEI0258 is a highly polymorphic microsatellite locus located within the BF region of MHC-B on
chromosome 16 (Kannak et al., 2017; Miller et al., 2004). It has been reported to have a direct
association with chicken performance and diseases tolerance (Nikbakht and Esmailnejad, 2015).

47
It includes allelic variation in antibody responses to vaccination against Newcastle Disease Virus
(NDV) (Baelmans et al., 2005; Nikbakht et al., 2013), Marek’s disease (Fulton et al., 2016; Wang
et al., 2014), corona virus (Hateren et al., 2013) and coccidiosis. Also, its association with body
weight, survival, embryonic mortality, fertilization rate, hatchability, egg production and
resistance to worms has also been documented in many studies (Owen et al., 2008). Given its high
level of polymorphism and linkage disequilibrium association with the MHC-B locus, LEI0258
marker genotypes has been suggested indicator of MHC-B haplotypes, and it has become an
important genetic marker used in chicken breed improvement programs (Banat, 2013; Gao et al.,
2015; Hoque et al., 2011; Weigend et al., 2001). This has been confirmed by Chazara (2013) who
have ascertained that the LEI0258 marker genotypes an excellent predictor of the heterozygosity
at the MHC loci.
LEI0258 is described as an atypical variable number tandem repeat (VNTR) locus which is
composed of 12 bp (CTTTCCTTCTTT) and 13 bp (CTATGTCTTCTTT) conserved repeat
sequences which are flanked on both sides by indels and SNPs (Fulton et al., 2006). In an
association study of MHC haplotypes with Marek’s disease, Bumstead (1998) found that 96.5%
of the birds with B-21 haplotypes were resistant to viral infection while of the birds with the B-19
haplotypes suffered 100% incidence of mortality. Polymorphisms are high at LEI0258. Fulton et
al. (2006) observed allele size diversity ranging from 182 bp -552 bp. Lwelamira (2008) genotyped
two chicken ecotypes from Tanzania and they identified 22 and 23 alleles at LEI0258. They further
report that allele of 206 bp length had a significant positive correlation (P < 0.001) with elevated
antibody responses against NDV vaccine, whereas the allele 307 bp was positively correlated with
body weight traits.

48
Indigenous chicken (IC) (Gallus gallus domesticus) are widely distributed in the diverse agro-
ecological zones of Ethiopia. Accordingly, they represent ecotypes which may possess unique
combinations of alleles in a given gene (Ngeno et al., 2015). Relatively, few works have been
done so far on the genetic characterization at molecular level Ethiopian indigenous chicken. In
particular, no studies have attempted so far to characterize the immune system of Ethiopian
chicken. We report here the characterization and diversity of the MHC-linked LEI0258
microsatellite marker in 236 indigenous chickens from 24 distinct populations sampled across
Ethiopia.

49
3.2. Materials and methods
3.2.1. Whole blood sample collection
Blood samples were collected from 24 chicken populations in Ethiopia (Figure 3). Samples
included 80 cocks and 156 hens. Except for Tsion Teguaz and Meseret populations, two villages
per population were sampled (8-10 chicken from each village). One or two chicken were sampled
per household. Photographs and weight of each bird were taken. The average weight of sampled
chicken was 1.26 Kg with age ranges of 5 to 36 months. Sampling included chicken from different
agro-ecological zones with an altitudes ranges of 730 -3500 meters (Table 6). From the wing vein
of each chicken, 50 - 250 µl of whole blood was drawn with syringes using cryo-tubes filled with
1.5 ml absolute ethanol (100%) following the guidelines available at
https://www.sheffield.ac.uk/nbaf-s/protocols_list.

50
Table 6. Sampling sites
No. Sampling site Sample size Agro-ecology Elevation( meteres absl)
1 Adane 10 Tepid to cool moist mid highlands 2455
2 Alfa Midir 10 Cold to very cold moist sub-afro-alpine to afro-alpine 3404
3 Amesha Shinkuri 10 Tepid to cool moist mid highlands 2464
4 Arabo 10 Tepid to cool moist mid highlands 1521
5 Ashuda 10 Hot to warm sub-moist lowlands 2028
6 Batambe 8 Tepid to cool moist mid highlands 2511
7 Bekele Girisa 10 Tepid to cool sub-humid mid highlands 1643
8 Dikuli 10 Hot to warm sub-moist lowlands 2093
9 Gafera 10 Tepid to cool moist mid highlands 2515
10 Gesses 10 Hot to warm sub-moist lowlands 1192
11 Gijet 10 Hot to warm sub moist lowlands 2050
12 Hadush Adi 10 Hot to warm sub moist lowlands 1494
13 Hugub 10 Hot to warm arid mid highlands 737
14 Kefis 10 Hot to warm moist lowlands 1061
15 Kido 10 Hot to warm sub-moist lowlands 1304
16 Kumato 10 Hot to warm sub-humid lowlands 1728
17 Loya 10 Tepid to cool humid mid highlands 1896
18 Meseret 10 Hot to warm sub moist lowlands 2291
19 Metkilimat 10 Hot to warm sub moist lowlands 1751
20 Mihiquan 9 Tepid to cool sub-moist mid highlands 1316
21 Negasi Amba 10 Cold to very cold moist sub-afro-alpine to afro-alpine 3060
22 Shubi Gemo 10 Tepid to cool sub-humid mid highlands 1555
23 Surta 9 Tepid to cool moist mid-highlands 2529
24 Tsion Teguaz 10 Hot to warm sub moist lowlands 1931
absl = above sea level

51
Figure 3. Agro-ecological map of Ethiopia with sampling site (MOA, 2000).
WB = Water body; A1 = Tepid to cool arid mid highlands; Hot to warm semi-arid lowlands; H1 = Hot to
warm humid lowlands; H2 = Tepid to cool humid mid highlands; H3 = Cold to very cold humid sub afro-
alpine to afro-alpine; M1 = Hot to warm moist lowlands; M2 = Tepid to cool moist mid highlands; M3 =
Cold to very cold moist sub-afro alpine to afro-alpine; SA1 = Hot to warm semi-arid lowlands; SA2 = Tepid
to cool semi-arid mid highlands; SH1 = Hot to warm sub-humid lowlands; SH2 = Tepid to cool sub-humid
mid highlands; SH3 = Cold to very cold sub-humid sub-afro-alpine to afro-alpine; SM1 = Hot to warm sub-
moist lowlands; SM2 = Tepid to cool sub-moist mid-highlands; SM3 = Cold to very cold sub moist sub
afro-alpine to afro-alpine; PH1 = Hot to warm per humid lowlands; PH2 = Tepid to cool per-humid mid
highlands.

52
3.2.2. DNA isolation
Total DNA was extracted from chicken whole blood at the BecA-ILRI Hub, Nairobi, Kenya
facility (http://hub.africabiosciences.org/) using the Qiagen DNeasy blood and tissue kit protocol
(Lwelamira et al., 2008). To evaluate the DNA concentration a Thermo Scientific NanoDrop
spectrophotometer 2000c was used. The integrity of DNA was confirmed by agarose gel
electrophoresis whereby 20 ng/µl genomic DNA samples were loaded with 1 µl loading dye (6X)
on 1% agarose gel containing 2.5 µl gel red at a voltage of 7/cm for 60 minutes, 3 µl of lambda
DNA of size of 48,500 bp and at concentration of 20 ng/µl was used as size marker and the gel
was then examined using UV light using a GelDoc-It2 Imager to check the DNA quality and
quantity. The total amount of DNA was normalized to 20 ng/µl using milliQ water for polymerase
chain reaction (PCR) and genotyping.
Figure 4. Image of Genomic DNA on 1% agarose gel run at 7/cm for 60 minutes.

53
3.2.3. MHC genotyping
PCR amplification
PCR amplification was carried out using a thermo-cycler PCR machine ABI PCR 9700 (Applied
Biosystems). The primer sequences (GenBank accession number Z83781) for PCR amplification
of LEI0258 were: forward 5’-CACGCAGCAGAACTTGGTAAGG -3’ (length = 22 bp; GC
content 47.6%; Tm = 71.5 ̊C) and reverse-5’-AGCTGTGCTCAGTCCTCAGTGC-3’ (length = 22
bp; GC content 46.2%; annealing temperature 69.9 ̊C). The optimal PCR conditions were as
described in (Gupta et al., n.d.; Han et al., 2013; Izadi et al., 2011; Nikbakht et al., 2013) either in
a total volume of 10 µl, including 2 µl of template genomic DNA (20 ng), 5 µl of non-dyed Taq
DNA Polymerase (1000 U) (Shangai, China), 0.3 µl of PET-labelled forward primer (3 µM), 0.3
µl of reverse primer (3 µM) and 2.4 µl of milliQ water, or a total reaction volume of 50 µl including
3 µl of 20 ng template genomic DNA, 25 µl of Dyed Bioneer Master mix (2x), 3 µl of forward
primer (3 µM), 3 µl of reverse primer (3 µM) and 16 µl of milliQ water. The PCR conditions were
set with an initial denaturation at 94 ̊C for 3 minutes; 30 cycles of 94 ̊C for 45 seconds; annealing
temperature of 63 ̊C for 1 minute; extension of 72 ̊C for 1 minute; final extension at 72 ̊C for 20
minutes and final hold at 15 ̊C. 2 µl volume of PCR product were loaded on a 2% agarose gel
containing 2.5 µl of gel red and separated by electrophoresis at a voltage of 7/cm for 60 minutes.
A 1 Kb ladder DNA from Bioneer was used as a reference to the size of the amplicons (Figure 5).
The gel was exposed to UV light using GelDoc-It2 Imager, to reveal the amplified fragments and
their size.

54
Figure 5. Electrophoretic pattern of alleles on 2% agarose gel run at 7/cm for 60 minutes
in indigenous chicken populations of Ethiopia. 1 kb ladder DNA was used as a reference.
Capillary electrophoresis and sequencing
The forward primer sequence was labeled with the ABI fluorescent dye PET. 1 µl PCR product
was added to a mixture of 12 µl GeneScan 500 LIZ® Size Standard and 1,000 µl of HIDI
formamide and denatured at 95 ̊C for 3 minutes and separated by capillary electrophoresis using
an ABI3730 DNA genetic analyzer (Applied Biosystems, Foster City, CA) using GeneScan-500
Internal LIZ Size Standards based on size of amplicons. The fragment (allele) sizes generated were
scored with Gene Mapper Software Ver 4.1 (Applied Biosystems, Foster City, CA, USA) and
exported to Microsoft excel for preparation of input files for statistical analyses. To confirm
polymorphisms from genotypes by capillary electrophoresis, homozygous and heterozygous,
alleles were selected for sequencing. The same primer sequences used for genotyping by capillary
12,218 bp- 6018 bp-
3,054 bp- 2,036 bp- 1,636 bp-
1,018 bp-
517 bp-
12,218 bp- 6,018 bp-
3,054 bp- 2,036 bp- 1,636 bp- 1,018 bp-
517 bp-
L 1 2 3 4 5 6 7 8 9 10 11 12
L 13 14 15 16 17 18 19 20 21 22 23 24

55
electrophoresis were employed except that they were now tailed with T7 (20 base pair) and SP6
(17 bp) tail sequences for the forward and reverse primers, respectively. Homozygote DNA
fragments were purified using GeneJet PCR purification Kit (Thermo Fisher Scientific; cat. No.
K0701) and heterozygote DNA fragments were purified using the Qiagen Gel Extraction Kit and
sent for sequencing to BIONEER sequencing platform in Korea. Alleles were sequenced on an
ABI 3730XL DNA Analyzer using T-7 and SP6 sequencing primers.
3.2.4. Data management and analysis
3.2.4.1. Population genetic diversity analysis
The genotypic data were subjected to various within and among populations genetic diversity
analysis. These included: calculation of the total number of alleles, allelic frequency, and their
distribution among the entire populations, polymorphic information content (PIC) for each
population, Shannon's Information Index using GenAlEx software package version 6.5. The same
package (Peakall and Smouse, 2012) was used to compute abundance of alleles (number of rare
alleles and common alleles), partitioning of total genetic variation into within and among pre-
grouped populations through Analysis of Molecular Variance (AMOVA) and Wright’s F-statistics
(within population inbreeding [FIS], total inbreeding [FIT], among population genetic
differentiation [FST]). FIS was calculated using the formula: 𝐹 = 1 − 𝐻𝑜
𝐻𝑒 while the pairwise Fst
values are calculated from Ho and He (FST = (He-Ho)/He). Between populations comparison of
the allele frequencies was performed by the chi-square test. Observed heterozygosity (Ho),
expected (He) heterozygosity was estimated using the formula: 𝐻𝑒 = 1 −∑ (p2i +q2
i) where p is

56
the allelic frequency of the allele one at a given locus and q is the frequency of the alternate allele
at the same locus. The deviation of each population from Hardy-Weinberg Equilibrium (HWE)
was also tested using GenAlEx software package. Correlation between sampling site geographic
distances and genetic distances between indigenous chicken populations was also done using the
Mantel test (XLSTAT, 2018). Number of homozygote and heterozygote genotypes were calculated
using power marker analysis (Liu et al., 2002).
3.2.4.2. Population differentiation and statistical Analysis
Population differentiation and the genetic structure were examined by sampling sites and Major
Agro-Ecological Zones (MAEZ) on the basis of available allelic frequency using principal
component analysis (PCA) calculated with the XLSTAT software (XLSTAT, 2018). Pairwise Fst
among all pairs of populations were computed using the Weir and Cockerham statistics (Peakall
and Smouse, 2012). Analysis of the population structure was done using STRUCTURE software
version 2.3.4 using an initial length of 50,000 burn-in periods followed by 150,000 MCMC
(Markov Chain Monte Carlo). Individuals were grouped into a predefined number of population
clusters (K) ranging from 2 to 10. For each value of K, 20 independent runs were performed using
the admixture and allelic frequency correlated models. Pairwise comparisons of the 20 runs were
carried using the algorithm implemented in CLUMPAK server (CLUstering Markov Packager
Across K) (http://hpc.ilri.cgiar.org/beca/bioinfo/clc.html). The best K was calculated following the
equation proposed by Evanno et al. (2005).

57
3.2.4.3. Sequence read data management and analysis
In addition, high-quality sequence reads with base call accuracy higher than 95% were assembled
and resolved for conflicts using Qiagen’s CLC work bench version 7. The resulting consensus
sequences of chicken populations were aligned using the ClustalW program integrated into the
MEGA (Molecular Evolutionary Genetics Analysis) software version 7 (Kumar et al., 2016). For
this, a reference homologous sequences of the LEI0258 marker with SNP position was
downloaded from the National Centre for Biotechnology Information (NCBI). The positioning of
SNPs and Indels were done using the DnaSP 4.0 software package (Librado and Rozas, 2009). To
determine the haplotype relationship of 13 new and 8 already NCBI described allele sequences,
the median-joining network was done using Network 5.0.0.3. Based on the network only 10
haplotypes were identified and a tree was inferred by using the Maximum Likelihood method
based on the Tamura-Nei model. Evolutionary analyses were conducted in MEGA7 (Kumar et al.,
2016).

58
3.3. Results
3.3.1. LEI0258 locus diversity by sampling site and Major Agro-ecological Zones (MAEZ)
The microsatellite marker, LEI0258, has been used before as a proxy of the diversity of the MHC-
B locus polymorphic in indigenous chickens. Here, we identified 29 LEI0258 alleles (100
genotypes; 64 heterozygotes and 36 homozygotes) from the studies of 24 populations. The
effective number of alleles per population ranges from 4.0 (Hugub) to 11.76 (Arabo). Observed
heterozygosity values range from 50% (Shubi Gemo) to 100% (Amesha Shinkuri, Meseret,
Gesses, Arabo, Hadush Adi). Size and frequency of the alleles are presented in Table 7 and Table
8.
Across populations, the highest allele frequency and gene diversity are 16.31% and 91.9%,
respectively, while it is 15.73% and 92.62% across MAEZ. Two private heterozygote alleles, size
of 315 bp and 385 bp, were present in the Surta populations. Heterozygote private allele size of
185 bp, 411 bp, 277 bp, and 465 bp were found at Meseret, Ashuda, Loya and Hadush Adi
populations at lower frequencies of 10%, 10%, 5%, 5%, respectively. The most frequent allele
across population is alleles 315 bp (n = 77) followed by allele 197 bp (n = 57; Table S 39). An
average of 2.06 Shannon index is obtained. The overall mean heterozygosity among the entire
populations is 82.1%.
Allele 363 was present in all populations and in all agro-ecological zones examined except in A1
and M1 agro-ecologies. The percentage of polymorphic loci is 91.38% and 92.16% for populations
across sampling sites and MAEZ. Another private allele size 185 bp was only possessed by

59
Meseret populations under SM2 (Tepid to cool sub-moist mid-highlands) agro-ecological zone. Other
alleles were shared by some but not all populations. For instance, 209 bp and 460 bp was possessed
by populations that prevail in Tepid to cool arid mid highlands (A1) and SA1 (Hot to warm semi-arid
lowlands) for the former and Hot to warm moist lowlands (M1) for the later. Allele size 315 bp is
only possessed by populations of all agro-ecologies.

60
Table 7. Allele frequencies (%) of LEI0258 in indigenous Ethiopian chicken population.
Allele/n B S A G A M H K GE KI TT AR AS DI BG SG KU LO HA MI GI MET AL NA P
8 9 10 10 10 10 10 10 10 10 10 10 10 10 10 10 10 10 10 9 10 10 10 10
185 0 0 0 0 0 5 0 0 0 0 0 0 0 0 0 0 0 0 0 0 0 0 0 0 1
197 31 17 0 15 5 0 0 10 35 15 0 15 10 10 15 5 5 10 15 6 10 20 25 20 20
209 0 0 5 0 5 5 10 0 0 0 0 5 0 0 0 5 0 5 5 0 0 0 0 0 8
221 6 0 5 0 25 5 5 0 0 0 0 0 0 0 0 0 10 0 0 0 0 0 0 0 6
245 0 0 0 0 0 5 0 0 0 0 0 0 0 0 10 0 0 0 0 0 0 0 0 0 2
253 6 0 10 5 0 5 0 5 10 10 20 5 5 10 5 10 0 10 5 11 20 15 15 0 19
263 0 0 15 5 5 5 25 0 15 5 0 15 5 10 0 0 10 5 15 6 5 10 5 25 18
277 0 0 0 0 0 0 0 0 0 0 0 0 0 0 0 0 0 5 0 0 0 0 0 0 1
289 6 0 5 10 0 0 0 0 10 25 5 5 15 15 0 0 5 10 5 6 10 5 10 0 16
300 0 0 5 0 0 0 0 10 5 0 10 5 0 0 15 35 0 5 10 6 0 0 0 0 10
302 0 0 0 0 0 0 0 5 0 0 0 0 0 0 5 0 10 0 0 0 0 0 0 0 3
312 0 17 0 10 15 15 0 5 5 0 25 5 10 15 10 15 0 0 0 17 15 5 5 10 17
315 31 17 20 30 15 25 10 10 5 10 20 5 25 20 15 5 20 15 15 11 25 15 25 5 24
325 0 0 0 0 0 0 0 5 0 0 0 5 0 0 0 0 0 0 0 6 0 0 0 0 3
327 0 6 0 0 0 0 0 0 0 10 5 0 0 15 0 0 0 10 0 6 10 0 0 0 7
340 0 0 0 0 25 0 5 20 0 5 0 5 0 0 0 0 0 0 5 0 0 0 0 35 7
351 0 0 0 0 0 0 40 10 5 5 0 0 0 0 5 0 0 0 0 11 0 0 0 0 6
363 6 22 25 5 0 15 0 20 5 10 10 10 5 5 5 10 20 10 10 11 0 5 5 0 20
375 13 0 10 20 0 0 0 0 0 0 0 5 0 0 10 0 15 5 5 0 0 10 10 5 11
385 0 0 0 0 0 5 0 0 0 0 0 5 10 0 0 5 0 10 0 6 0 0 0 0 6
397 0 0 0 0 0 5 0 0 0 0 0 0 0 0 0 0 0 0 5 0 0 5 0 0 3
411 0 0 0 0 0 0 0 0 0 0 0 0 10 0 0 0 0 0 0 0 0 0 0 0 1
426 0 11 0 0 0 0 0 0 5 5 0 0 0 0 0 0 0 0 0 0 0 0 0 0 3
450 0 0 0 0 0 0 0 0 0 0 0 0 0 0 5 0 0 0 0 0 0 5 0 0 2
460 0 0 0 0 5 0 5 0 0 0 0 5 0 0 0 0 5 0 0 0 0 5 0 0 5
465 0 0 0 0 0 0 0 0 0 0 0 0 0 0 0 0 0 0 5 0 0 0 0 0 1
472 0 0 0 0 0 0 0 0 0 0 0 5 5 0 0 0 0 0 0 0 0 0 0 0 2
485 0 0 0 0 0 5 0 0 0 0 5 0 0 0 0 0 0 0 0 0 5 0 0 0 3
569 0 11 0 0 0 0 0 0 0 0 0 0 0 0 0 10 0 0 0 0 0 0 0 0 2
BA = Batambe; SU = Surta; AS = Amesha Shinkuri; GA = Gafera; AD = 025-Adane; ME = Meseret; HU = Hugub; KE = Kefis; GE = Gesses; KI = Kido; TT =
Tsion Teguaz; AR = Arabo; AS = Ashuda; DI = Dikuli; BG = Bekele Girisa; SG = Shumbi Gemo; KU = Kumato; LO = Loya; HA = Hadushi Adi; MI = Mihiquan;
GI = Gijet; MET = Metkilimat; AL = Alifa Midir; NA = Negasi Amba; P = No. of populations sharing the allele

61
Table 8. Allele frequencies (%) of LEI0258 in indigenous chicken grouped by MAEZ.
Allele/n A1 M1 M2 M3 SA2 SH1 SH2 SM2 P
N 10 10 13 11 10 12 15 13
185 0 0 0 0 0 0 0 4 1
197 0 5 15 23 5 13 3 12 7
209 10 5 0 0 5 0 0 0 3
221 5 25 0 0 0 0 0 0 2
245 0 0 0 0 0 0 3 4 2
253 0 0 4 14 10 8 0 12 5
263 25 5 4 9 0 8 3 8 7
289 0 0 8 9 0 13 7 4 5
300 0 0 4 0 35 0 7 0 3
302 0 0 0 0 0 0 3 0 1
312 0 15 0 9 15 0 7 8 5
315 10 15 12 23 5 17 20 8 8
325 0 0 4 0 0 0 0. 0 1
327 0 0 0 0 0 13 7 4 3
340 5 25 12 0 0 0 0 4 4
351 40 0 0 0 0 4 3 0 3
363 0 0 8 5 10 13 3 4 6
375 0 0 8 9 0 4 13 8 5
385 0 0 4 0 5 0 3 0 3
397 0 0 0 0 0 0 0 8 1
411 0 0 0 0 0 0 10 0 1
426 0 0 12 0 0 8 0 0 2
450 0 0 0 0 0 0 3 4 2
460 5 5 0 0 0 0 0 0 2
465 0 0 0 0 0 0 0 4 1
472 0 0 4 0 0 0 3 0 2
485 0 0 4 0 0 0 0 4 2
525 0 0 0 0 0 0 0 4 1
569 0 0 0 0 10 0 0 0 1
A1 = Tepid to cool arid mid highlands; M1 = Hot to warm moist lowlands; M2 = Tepid to cool moist mid
highlands; M3 = Cold to very cold moist sub-afro alpine to afro-alpine; SA2 = Tepid to cool semi-arid mid
highlands; SH1 = Hot to warm sub-humid lowlands; SH2 = Tepid to cool sub-humid mid highlands; SM2
= Tepid to cool sub-moist mid-highlands; P = N of population sharing the allele.

62
3.3.2. Population clustering by sampling site and MAEZ
The genetic structure of all populations were examined by sampling sites and MAEZ on the basis
of all available allelic frequencies using principal component analysis (PCA)(XLSTAT, 2018;
Figure 11). The first two components axes accounted for 21.54% and 17.53% of the variation,
respectively, for sampling site and 35.66% and 23.60%, respectively for MAEZ. Accordingly, the
PCA of allelic frequency covariates by sampling sites, shows two distinct groups of the indigenous
Ethiopian chicken populations separated longitudinally (Figure 6). This grouping seems to follow
the direction of the rift valley geographically. Within these two groups, the chicken populations
did not cluster in relation to their geographic origins. The PCA by MAEZ does not show any
distinct genetic cluster for the indigenous chicken populations of Ethiopia (Figure 7). According
to Evanno et al.(2005), the best clustering of the 24 chicken populations was found at K = 2 (Figure
12) both at predetermined population and agro-ecological zone level (Figure 13).
The highest mean genetic distance (d = 0.94) was between Alfa Midir and Batambe followed by
the former and Gafera (d = 0.90) populations (Table S 40; Table S 44). The average Fst for the
entire population was 0.028. The pairwise Fst calculation shows the highest value (Fst = 0.12)
between Hugub and Surta populations. In terms of analysis of genetic distance by MAEZ, the
highest genetic distance is observed between Tepid to cool semi-arid mid highlands and hot to
warm arid lowland plains (Table S 41). The Analysis of Molecular Variance shows the presence
of 89% within individual variation across populations. The among-population variation and among
individual variation was reported as 3% and 8%, respectively. Similarly, alleles, in tepid to cool
sub-moist mid highlands are genetically distinct from alleles in Tepid to cool moist mid highlands

63
(M2), Cold to very cold moist sub-afro alpine to afro-alpine (M3), Hot to warm sub-humid lowlands
(SH1), Hot to warm sub-humid lowlands (SH2) agro-ecologies. The fixation coefficient of the sub-
population within the total population (FST), inbreeding/fixation/ coefficient of an individual in a
subpopulation (FIS) and total inbreeding /heterozygosity deficit/ coefficient of an individual within
the total population (FIT) in the locus are 0.03, 0.08 and 0.11, respectively. Pairwise population Fst
are also indicated in Table S 42 with the highest value (0.12) for Hugub to Banja and Shubi Gemo
to Hugub populations. The highest pairwise Fst (0.12) is also found between SA2 and A1 agro-
ecologies (Table S 43). Structure analysis (K = 2) supports two different gene pools (Figure 12;
Figure 13).
From the entire populations, only Kumato populations meet the assumption of Hardy Weinberg
Equilibrium (HWE). Unrooted neighbor-joining tree topology indicated a clear IC subgrouping
into two distinct clusters (Figure 8). Even though the reported rate of gene flow (Nm) was
minimum (8.6), high rate of admixture was noted among the predetermined populations. The
mantel correlation test across population genetic and geographic distance shows no correlation
(Figure 11).

64
Table 9. Diversity indices of LEI0258 microsatellite locus in Ethiopian indigenous chicken populations across sampling sites.
Pop N Na Ne I Ho He uHe F HWE (prob) PAL
Batambe 8 7.000 4.414 1.680 0.750 0.773 0.825 0.030 0.21
Surta 9 7.000 6.231 1.879 0.667 0.840 0.889 0.206 0.20 315, 385
Amesha_Shinkuri 10 9.000 6.452 2.013 1.000 0.845 0.889 -0.183 0.89
Gafera 10 8.000 5.556 1.878 0.800 0.820 0.863 0.024 0.2
025_Adane 10 8.000 5.556 1.861 0.700 0.820 0.863 0.146 0.08
Meseret 10 12.000 7.692 2.264 1.000 0.870 0.916 -0.149 0.68 185
Hugub 10 7.000 4.000 1.623 0.700 0.750 0.789 0.067 0.09
Kefis 10 10.000 7.692 2.164 0.700 0.870 0.916 0.195 0.32
Gesses 10 10.000 5.556 2.011 1.000 0.820 0.863 -0.220 0.93
Kido 10 10.000 7.407 2.151 0.800 0.865 0.911 0.075 0.15
Tsion_Teguaz 10 8.000 5.882 1.900 0.800 0.830 0.874 0.036 0.35
Arabo 10 15.000 11.765 2.597 1.000 0.915 0.963 -0.093 0.71
Ashuda 10 10.000 7.407 2.151 0.800 0.865 0.911 0.075 0.42
Dikuli 10 8.000 7.143 2.016 0.800 0.860 0.905 0.070 0.31
Bekele_Girisa 10 11.000 9.091 2.293 0.900 0.890 0.937 -0.011 0.47
Shubi_Gemo 10 9.000 5.405 1.942 0.500 0.815 0.858 0.387 0.24
Kumato 10 9.000 7.143 2.068 0.800 0.860 0.905 0.070 0.02* 277
Loya 10 12.000 10.526 2.415 0.900 0.905 0.953 0.006 0.57
Hadush_Adi 10 12.000 9.524 2.363 1.000 0.895 0.942 -0.117 0.49 263
Mihiquan 9 12.000 10.125 2.399 0.889 0.901 0.954 0.014 0.33
Gijet 10 8.000 6.250 1.943 0.700 0.840 0.884 0.167 0.39
Metkilimat 10 11.000 8.333 2.250 0.900 0.880 0.926 -0.023 0.37
Alfa_Midir 10 8.000 5.714 1.888 0.800 0.825 0.868 0.030 0.23
Negassi_Amba 10 6.000 4.167 1.566 0.800 0.760 0.800 -0.053 0.83
Mean 9.458 7.043 2.055 0.821 0.846 0.892 0.031
SE 0.438 0.416 0.053 0.026 0.009 0.009 0.027
PAL = Private allele; He = Unbiased Expected Heterozygosity/ Nei’s Gene diversity = (2N / (2N-1)) * He; I = Shannon's Information Index = -1* Sum (pi * Ln
(pi)); *significantly deviate from HWE (P < 0.05)

65
Table 10. Diversity indices of LEI0258 microsatellite locus in indigenous Ethiopian chicken populations across MAEZ.
Pop N Na Ne I Ho He uHe F HWE PAL
A1 10 7.000 4.000 1.623 0.700 0.750 0.789 0.067 0.09
M1 10 8.000 5.556 1.861 0.700 0.820 0.863 0.146 0.08
M2 13 14.000 10.903 2.505 0.846 0.908 0.945 0.068 0.53 127,253,315
M3 11 8.000 6.368 1.958 0.818 0.843 0.883 0.029 0.24
SA2 10 9.000 5.405 1.942 0.500 0.815 0.858 0.387 0.24 569
SH1 12 10.000 8.727 2.224 0.917 0.885 0.924 -0.035 0.22
SH2 15 16.000 10.465 2.563 0.867 0.904 0.936 0.042 0.36 315
SM2 13 17.000 14.083 2.738 1.000 0.929 0.966 -0.076 0.32 375
PAL = Private allele; He = Unbiased Expected Heterozygosity/ Nei’s Gene diversity = (2N / (2N-1)) * He; I = Shannon's Information
Index = -1* Sum (pi * Ln (pi)); *significantly deviate from HWE (P < 0.05)

66
Figure 6. Principal component analysis of alleles frequencies by sampling site.
Batambe_M2
Surta_M2 Amesha Shinkuri_SM2
Gafera_SH2
025_Adane_M1
Meseret_SM2
Hugub_A1
Kefis_M2
Gesses_SH1
Kido_SH1
Tsion Teguaz_M2
Arabo_M2
Ashuda_SH2Dikuli_SH2
Bekele Girisa_SH2
Shubi_Gemo_SA2
Kumato_SH1
Loya_SH1
Hadush_SM2
Mihiquan_SM2
Gijet_SM2
Metkilimat_SM2
Alfa Midir_M3Negasi Amba_M2
-0.3
-0.2
-0.1
0
0.1
0.2
0.3
-0.2 -0.1 0 0.1 0.2 0.3 0.4
PC
A 2
(17.5
3 %
)
PCA 1 (21.54 %)
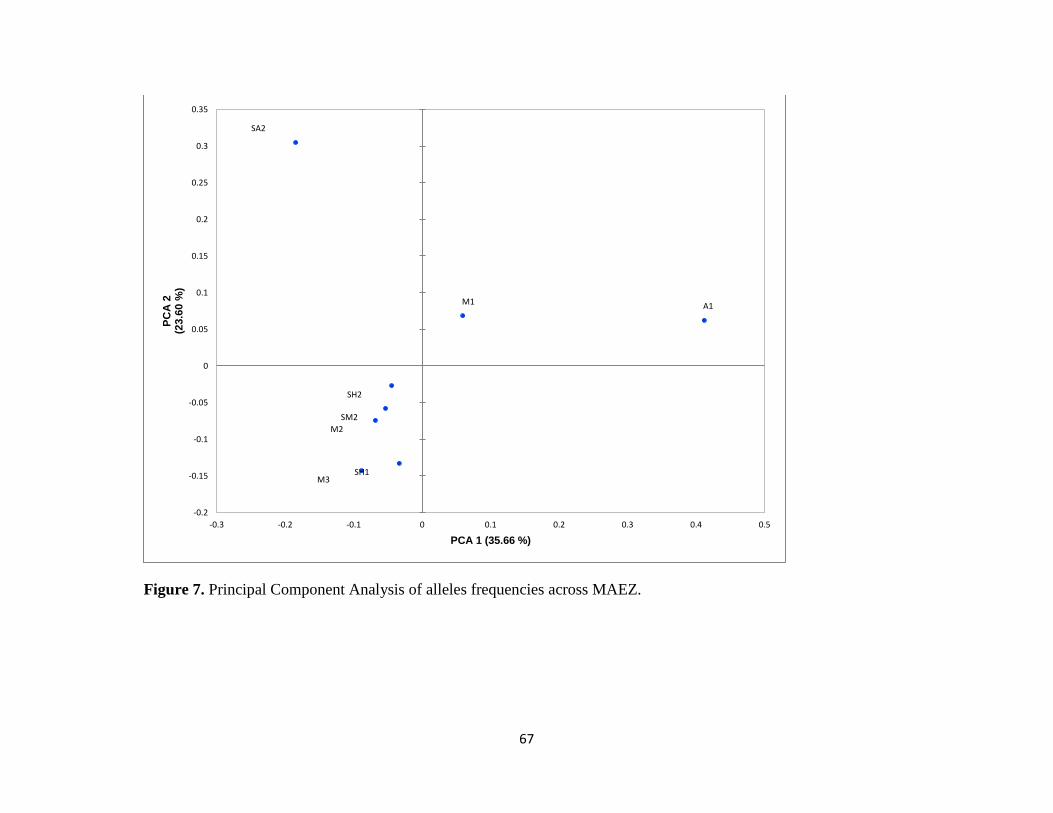
67
Figure 7. Principal Component Analysis of alleles frequencies across MAEZ.
A1M1
M2
M3
SA2
SH1
SH2
SM2
-0.2
-0.15
-0.1
-0.05
0
0.05
0.1
0.15
0.2
0.25
0.3
0.35
-0.3 -0.2 -0.1 0 0.1 0.2 0.3 0.4 0.5
PC
A 2
(23
.60
%)
PCA 1 (35.66 %)

68
Figure 8. Relationships between populations for LEI0258 microsatellite polymorphism.

69
Figure 9. Results of Analysis of Molecular Variance across populations.
Figure 10. Results of Analysis of Molecular Variance across MAEZ.
Among Pops5%
Among Indiv12%
Within Indiv83%
Percentages of Molecular Variance
Among Pops3%
Among Indiv8%
Within Indiv89%
Percentages of Molecular Variance

70
Figure 11. Relationship between geographic and genetic distances.
Figure 12. the optimum delta k according to Evanno et al., (2005).
Figure 13. Structure bar plots showing the gene pool of the chicken populations.
0
100
200
300
400
500
600
700
800
900
1000
0 0.02 0.04 0.06 0.08 0.1 0.12 0.14
Geo
gra
ph
ic d
ista
nc
e
Genetic distance

71
3.3.3. Allelic sequence polymorphisms and relationships
Sequence information including repeat regions and flanking regions are presented at Table 1 for a
subset of homozygote LEI0258 genotypes. Based on the blastn information from the National
Center for Biotechnology Information (NCBI) confirmed the presence of 13 new alleles from the
21 alleles sequenced (submitted and given accession numbers; Appendix 1). Identical alleles are
also indicated in Table 1. Variable Number of Tandem Repeats (VNTR) R12 was observed 2 to
17 times and for R13 (CTATGTCTTCTTT’) we only observe one repeat.
The 23 to 30 position downstream of the repeat region was sequenced as “ATTTTGAG”, whilst,
3 alleles sequences were found to have different repeats than respective reference sequences. 24
and 1 SNP substitutions were found at positions 39 and 46, respectively. 12 insertion SNPs and 2
deletions were noted on the upstream polymorphism positions of -30 to -29 positions. Besides, 2
nucleotide substitutions were reported at -61 upstream polymorphism, while, 3 substitution at -28
position. The consensus sequence size deviation from fragment size ranged from 1 to 115 bp.
Further polymorphisms were also observed in different positions of the repeat structure other than
the positions considered hereunder. B10, B11.1, B13, B72 haplotypes were obtained from the
allelic sequence. The invariable (monomorphic sites) and variable (polymorphic) sites found were
412 and 35, respectively. A total of 26 singleton sites and 5 parsimony informative sites were
observed from the package of DNA sequence polymorphism while the total number of mutation
sites and indel events were 33 and 17, respectively. The number of indel haplotypes and indel
diversity were 5 and 0.00465). Haplotype diversity (Hd) was 0.82. The haplotype-based
phylogenic analysis using Neighbor-Joining (NJ) showed that indigenous chicken populations are
mainly clustered into two gene pools comprising different subpopulations as obtained from the
structure analysis of allele sizes from capillary electrophoresis.

72
Table 1. Overall polymorphisms identified within the LEI0258 alleles in indigenous chicken populations of Ethiopia.
𝑎Chicken NCBI Acc. No. Fragment length
(bp, by genotyping)
Consensus
size (bp, by
sequencing)
Upstream R13 R12 Downstream Acc. No. Haplotype
Δ TT G TT C ATTTGAG △ T T
-61 -30 to -29 -28 -19-18 5 23-30 33 39 46
Batambe_4H MG495227 197 193 ∘ ∘ ∘ ∘ 1 2 ∘ Δ ∘ Δ Δ DQ239495 B11
Surta_7H* MG495249 315/426 486 ∘ △ △ ∘ 1 13 ∘ ∘ ∘ Δ ∘ DQ239562 BW4
Hugub_H2* MG495230 351/460 236 ∘ △ ∘ ∘ 1 4 ∘ ∘ ∘ Δ ∘ KF535086
Hugub_H9* MG495244 351 345 ∘ ∘ ∘ ∘ 1 15 ∘ ∘ ∘ Δ ∘ DQ239508 B14
Gafera_8C* MG495239 315 309 ∘ ∘ ∘ ∘ 1 12 ∘ ∘ ∘ Δ ∘ KF534941
Tsion_9C* MG495231 315/327 250 ∘ ∘ ∘ ∘ 1 7 ∘ ∘ ∘ Δ ∘ KF534930
Adane_9C* MG495245 312/340 357 ∘ ∘ ∘ ∘ 1 16 ∘ ∘ ∘ Δ ∘ DQ239506 B130
Ngasiamba_4H MG495243 340 333 ∘ ∘ ∘ ∘ 1 14 ∘ ∘ ∘ Δ ∘ KF534946
Ashuda_1C MG495232 289 283 ∘ △ △ △ 1 10 ∘ ∘ ∘ Δ ∘ KF535091
Ashuda_9C* MG495240 315 309 ∘ ∘ ∘ ∘ 1 12 ∘ ∘ ∘ Δ ∘ DQ239494 B10
Ashuda_10H* MG495236 289 295 ∘ △ ∘ ∘ 1 11 ∘ ∘ ∘ Δ ∘ DQ239550 B72
Dikuli_4H* MG495237 315/411 307 ∘ △ △ △ 1 12 ∘ ∘ ∘ Δ ∘ DQ239550 B72
Kefis_12C MG495233 289 283 ∘ △ △ △ 1 10 ∘ ∘ ∘ Δ ∘ KF535091
Dikuli_7H MG495241 321 321 ∘ ∘ ∘ ∘ 1 13 ∘ ∘ ∘ Δ ∘ KF534945
Bekelegirisa_1H* MG495246 300/302 379 ∘ △ △ △ 1 18 ∘ ∘ ∘ Δ ∘ KF535100
Bekelegirisa_8H* MG495234 312/315 295 ∘ △ △ △ 1 11 ∘ ∘ ∘ Δ ∘ KF534937
Shubigemo_1H* MG495235 300 295 ∘ △ △ △ 1 11 ∘ ∘ ∘ Δ ∘ DQ239496 B11.1
Kumato_2C MG495248 197/460 357 ∘ △ △ △ 1 16 ∘ ∘ ∘ Δ ∘ KF535100
Kumato_5H MG495248 302 379 ∘ △ △ △ 1 18 ∘ ∘ ∘ Δ ∘ KF535100
Meseret_156b MG495229 312/315 333 ∘ ∘ ∘ ∘ 1 4 ∘ Δ ∘ Δ ∘ KF534926
Gijet_49H* MG495238 253 295 ∘ △ ∘ △ 1 12 ∘ ∘ ∘ Δ ∘ DQ239550 B72
𝑎The codes of chicken populations; 𝑏Δ Defined deletion compared with the reference sequence. ∘is consistent with the reference sequence; * unique alleles

73
Figure 14. Network tree of allele sequences.
Figure 15. Haplotypes relationship tree of alleles by the Maximum Likelihood method.
The haplotype tree was inferred by using the Maximum Likelihood method based on the Tamura-Nei model. The tree
with the highest log likelihood (-985.1747) is shown. The percentage of trees in which the associated taxa clustered
together is shown next to the branches. Initial tree(s) for the heuristic search were obtained automatically by applying
Neighbor-Join and BioNJ algorithms to a matrix of pairwise distances estimated using the Maximum Composite
Likelihood (MCL) approach and then selecting the topology with superior log-likelihood value. A discrete Gamma
distribution was used to model evolutionary rate differences among sites (2 categories (+G, parameter = 0.0500)). The
tree is drawn to scale, with branch lengths measured in the number of substitutions per site. The analysis involved 10
nucleotide sequences. Codon positions included were 1st+2nd+3rd+Noncoding. There were a total of 444 positions
in the final dataset.

74
3.4. Discussion
3.4.1. Fragment length based genetic variation in the MHC region
In this study, we report polymorphism at the MHC-B microsatellite marker, LEI0258, in
indigenous chicken village chicken populations from Ethiopia. From the 29 allele size reported
here, 22 are novel alleles (Fulton et al., 2006; J. E. Fulton et al., 2016; Gupta et al., n.d.; Izadi et
al., 2011; Keambou et al., 2014; Lwelamira et al., 2008; Ncube et al., 2014; Nikbakht et al., 2013).
The number of alleles reported was higher than the numbers reported by different authors in
previous works on indigenous chicken populations (Han et al., 2013; Nikbakht et al., 2013). The
allele size ranges from 185 and 569 bp with alleles frequencies ranging from 2.5% to 38 % across
populations. The maximum allele size reported in this study is larger than the one characterized in
other studies (e.g Han et al. 2013). Allele sizes of 197, 253, 263, 312, 315 and 340 bp were found
in all 24 populations.
The high diversity at the marker may be a direct consequence of the diversity of disease challenges
facing Ethiopian chicken within and across different agro-ecologies, with polymorphism at the
locus maintained by balancing selection with high LEI0258 diversity increasing the diversity of
antigens being presented to T-cells (Chazara et al., 2013).
Overall, 50% of the alleles in this study are only found in only two or three of the populations out
of the 24 considered. With the exception of alleles, 197, 312, 315 and 351 bp, the remaining of
the alleles occurred at a lower frequency (< 0.20). The low-frequency abundance of LEI0258

75
alleles might be attributed to a new mutation arising in a population and therefore available only
in a few individuals. It might also be due to its susceptibility to disease and other selection
pressures resulting unfit to survive the production challenge the chicken is facing in the variable
environments where they were sampled. High frequency of allele 315 at Batambe population
could imply a fitness or survival advantage to the individual carrying it resulting in it being selected
for and occurring at higher frequencies (31%). This, however, needs to be further study in absence
of any information regarding the possible association between disease resistance/susceptibility and
the allele.
We did not identify here those alleles which previously have been shown to be a positive
correlation with NDV (206 bp) and body weight (307 bp) ((Fulton et al., 2006; Fulton et al., 2016
and Lwelamira et al. 2008) For the later it may not be surprising considering the small size of
Ethiopian village chicken compared to their commercial counterparts; while the former is suggest
that allele (206 bp) may not be of relevance to NDV resistance/susceptibility in Ethiopian village
chicken. Several LEI0258 alleles were shared among the predetermined populations implying that
they have been subjected to either directional selection or due to recombination effect (Miller et
al., 2004; Nikbakht et al., 2013; Salomonsen et al., 2014). Alleles 206 and 307 bp, reported in
Tanzanian chicken to associate with Newcastle disease antibody response and body weight,
respectively, were not reported in Ethiopian chicken in this study (Lwelamira et al., 2008).
The mean observed heterozygosity (82.1%) found in this study are far more than the expected level
(50%) indicating a higher genetic variation in indigenous chicken populations of Ethiopia. In other
words, a heterozygous population has a better degree of resisting/tolerating multiple disease
infections that challenge chicken populations. The genetic differentiation/ fixation coefficient of

76
the subpopulation within the total population (FST), inbreeding/fixation coefficient of an individual
in a subpopulation (FIS) and total inbreeding coefficient/fixation coefficient of an individual within
the total population /heterozygosity deficit/among chicken ecotypes (FIT) of the overall
populations in the locus are 0.08, 0.03 and 0.11, respectively. The Weir and Cockerham Fst (Fst <
0.05) value indicating low sub-structuring of Ethiopian indigenous chicken. Besides, the structure
gene pool bar plot showed two different gene pools. From the entire populations, Kumato
populations are found to be significantly different from the test of the Hardy Weinberg Equilibrium
(HWE). The possible accountable factors that cause this deviation from HWE might be possible
introgression with exotic chicken as they are very close to the exotic poultry multiplication centre.
The other possible reasons might be due to a continuous exposure to disease and parasite
challenges (viral/ bacterial infections) that indigenous chicken are exposed to the occurrence of
natural selection at MHC locus to combat these challenges. Besides, our sampling might have
target related birds.
The highest mean genetic distance (d = 0.94) was between Alfa Midir and Batambe followed by
the former and Gafera (d = 0.90) populations. Overall, the genetic distances found in this study are
small indicating that these populations are more related and have a common ancestor. Considering
this result it looks that the genetic diversity pattern fragments these populations west to east from
North to South geography line. This could be attributed to their proxy of entry history of chicken
introduction to Ethiopia/ Africa. The average Fst for the entire population was 0.028 ascertaining
that 2.8% of the total genetic variation corresponded to the differences among populations, whilst
97.2% was explained by differences among individuals. The smallest genetic differentiation

77
between some populations is justified by minimal selective breeding, uncontrolled mating and
movement of a live chicken.
3.4.2. Allelic sequence polymorphisms and relationships
A subset of allele sequencing result ascertained the presence of single nucleotide polymorphisms
(SNPs) in LEI0258. The two main VNTR were the R13 and R12. R13 with a 13 bp repeat unit,
“CTATGTCTTCTTT’ was found with a frequency of only once similar to Wang et al. (2014) and
inconsistent with other studies with more frequencies (Chazara et al., 2013; Nikbakht et al., 2013).
The 23 to 30 position downstream of the repeat region was sequenced as “ATTTTGAG”. They
agree with the sequences obtained by Fulton et al. (2016), Han et al. (2013), and Izad et al. (2011).
Twenty-four and one SNP substitutions were found at positions 39 and 46, respectively. The
number of R12 motifs (CTTTCCTTCTTT) in the individual sequences ranged from 2 to 18, whilst,
only one R13 motif was found. 12 insertion SNPs and 2 deletions were noted on the upstream
polymorphism positions of -30 to -29 positions. Besides, 2 nucleotide substitution were reported
at -61 upstream polymorphism, while, 3 substitution at -28 position. 6 allele sequences were found
to have different repeats than respective reference sequences (ATTTTGAG). Results of allele size
from both fragment length and consensus sequences did not exactly much which might be because
of the difference in environmental factors, technological approaches, and precisions. The size
deviation ranged from 1 to 115 unlike what was reported by Han et al. (2013) who found size
differences of 1 to 69 range. The comparison between the fragment sizes and consensus sizes (bp)
across population consistently showed higher values for the later except for the Dara population.
This result was not consistent with the works of Fulton (2016) and Han et al., (2013). Further

78
polymorphisms were also observed in different positions of the repeat structure other than the
positions considered hereunder. Only a few haplotypes (B10, B11.1, B13, B72), were found when
compared with the haplotypes reported by Fulton et al. (2016) and Chazara et al (2013). In
contrast, none of these haplotypes were reported in the report of Wang et al. (2014) for Chines
chicken and Ngeno et al. (2015) for Kenyan indigenous chicken.
The SNP based phylogenic analysis using Neighbor-Joining (NJ) showed that indigenous chicken
populations are mainly clustered into two gene pools comprising different subpopulations as
obtained from the structure analysis of allele sizes from capillary electrophoresis. From
phylogenetic analysis, clear separation of ecotypes was not noted indicating genetic admixture
between populations.

79
3.5. Conclusion
Very high diversity was found in Ethiopian indigenous chicken populations at LEI0258, this
diversity is observed within all population. Our results support the importance of MHC diversity
in response to the disease challenges faced by smallholder poultry production in Ethiopia.
Breeding improvement programs will need to maximize this diversity through balancing selection
that maintains polymorphisms and increases within-population diversity. This very high diversity
report for Ethiopian indigenous chicken populations on LEI0258 locus will provide a framework
for the existing and future chicken breed improvement interventions. Besides, we can infer that
the genotyping of the tandem repeat microsatellite marker LEI0258 is a suitable method for MHC
typing of indigenous Ethiopian chicken populations considering the high level of polymorphism
observed at the locus within and across indigenous populations. Polymorphisms from the
sequencing result, also support the genome diversity of indigenous Ethiopian village chicken
populations. As a way forward, studying the relationship of these polymorphisms and the disease
resistance/susceptibility haplotypes in Ethiopian chicken populations should be undertaken.

80
CHAPTER 4. WHOLE GENOME DIVERSITY OF INDIGENOUS
CHICKEN POPULATIONS IN ETHIOPIA
Abstract
Selective breeding for genetic improvement is expected to leave distinctive selection signatures
within genomes. The identification of selection signatures can help to elucidate the mechanisms
of selection and accelerate genetic improvement. Ethiopia has several chicken breeds which have
evolved in different agro-ecologies. Here, we assess the footprints of candidate signatures of
positive selection from whole genome autosomal sequences comprising 14,857,039 SNPs
genotyped in Improved Horro, Local Horro, Hugub, Arabo and Jarso chicken populations of
Ethiopia. We identified selection signals in 20 kb windows, with sliding steps of 10 kb based on
estimators of pooled heterozygosity (Hp) and F-statistics (Fst). Selective sweep analysis using Hp
and Fst identified genomic regions associated with production and reproduction. A total of 595
candidate genes showed high evidence of positive selection in indigenous chicken populations,
including genes were related to traits such as growth and egg production. Gene ontology analysis
displayed several biological processes and KEGG pathways involved in oestrogen biosynthetic
and nervous system developmentt processes and calcium signaling and biosynthesis of unsaturated
fatty acids. The regions identified in this study are expected to provide genome landmarks to
enhance the ongoing breed improvement operations in improved Horro and for the other four
chicken populations.
Keywords: Indigenous, Chicken, Improved Horro, Signature of selection, SNP

81
4.1. Introduction
Indigenous chicken makes a profound contribution to the rural economies in Ethiopia by playing
a major role for the rural poor and marginalized people as a subsidiary income and consumption.
Genetic diversity represents the total genetic variation among populations and several measures of
diversity have been developed over years (Barrandeguy and García, 2014). Sufficient genetic
variation in livestock populations is necessary both for adaptation to future changes in climate and
consumer demand and for continual genetic improvement of economically important traits (Aslam
et al., 2012; Eggen, 2012; Schmid et al., 2015). To understand phenotypic variation in farm
animals such as in poultry, it is essential to define all potential genomic variation within a genome
(Schmid et al., 2015). Evolution of chickens and programs for their artificial selection rely on the
availability of sufficient levels of genetic variation. In response to the global shift in environmental
conditions and market demands for chicken products, the diversity of village chicken is needed for
future improvements programs (Muchadeyi et al., 2008).
Different techniques are involved to study genetic variations., DNA variation known as SNPs, the
most abundant sources of genome variation, have become increasingly markers of choice in
genomics studies (Alderborn, 2000; Gheyas et al., 2015) with genome annotation, the link
between biological or functional information and genome sequences an important gain in our
understanding of how genomic variations influence phenotypes (Fulton, 2012). Previous studies
on Ethiopian chicken failed to comprehensively characterize the chicken genomic diversity in
Ethiopia. Only a few Ethiopian indigenous chicken populations have been characterized using
molecular markers. These are Tillili (Alemayhu, 2003; Mogesse, 2007), Jarso, Horo, Chefie, Tepi
(Tadelle et al., 2003), Gellila, Debre Ellias, Melo Hamusit, Farta (Mogesse, 2007), Sheka, Konso,

82
and Mandura ((Desta et al., 2014) chicken populations. With regard to the mapping of genes of
interest in indigenous Ethiopian chickens, so far a single work has been published (Wragg et al.,
2012). Wragg et al. (2012) studied randomly selected 15 birds from 5 Ethiopian chicken
populations (in Gondar, Konso, Gumuz, sheka, and Guduro). Together with other breeds, the study
mapped phenotypic traits (e.g. skin and egg color) using genome-wide association approaches. It
illustrates for the first time the possibility and power to use indigenous outbreed chicken
population for the fine genome mapping of Mendelian traits. Wragg and his colleagues also
recommend including, a minimum of 90-110 kb SNPs for effective genome-wide associations
study in village chickens.
The presence of genomic diversity in domestic chicken is of great importance and a prerequisite
for rapid and accurate genetic improvement of selected breeds in various environments, as well as
to facilitate rapid adaptation to potential changes in breeding goals (Nielsen, 2005). Hanotte et al.
(2010), suggested that it is time to tap Africa’s livestock genomes to better understand and exploit
the genetic diversity of Africa’s individual livestock breeds before they fade away. Understanding
which factors shape levels of genetic diversity within genomes forms a central question in
evolutionary genomics and is of importance for the possibility to infer episodes of adaptive
evolution from signs of reduced diversity. There is an on-going debate on the relative role of
mutation and selection in governing such diversity levels (Mugal et al., 2013). This study aims at
characterizing genomic diversity through the discovery of genomic variants in 27 indigenous
chicken populations of Ethiopia as a milestone for further works on management and conservation
of chicken genetic resources, studying the genetic mechanism underlying local chicken adaptation.

83
4.2. Materials and methods
4.2.1. Whole blood sample collection
Blood samples were collected from 27 chicken populations in Ethiopia (Figure 16). Samples
included 103 cocks and 157 hens. Except the improved Horro, Meseret, Tsion Teguaz, Jarso and
local Horro populations, 10 chicken from each village were sampled. One or two chicken were
sampled per household. Improved Horro was sampled from a breeding stock of 8th generation
under selection at Debre Zeit Agricultural Research Centre and used as a reference population.
Unlike other populations, Jarso and Local Horro sequences were obtained and included from the
previous studies. Photographs and weight of each bird were taken. The average weight of sampled
chicken was 1.26 kg with age ranges of 5 to 36 months. Sampling considered different agro-
ecological zones, altitudes ranging from 729-3500 meters, marketing points, and chicken
phenotypic characteristics. From the wing vein of each chicken, 50 - 250 µl of whole blood were
drawn with syringes using cryotubes filled with 1.5 ml absolute ethanol (100%) following the
guidelines available at https://www.sheffield.ac.uk/nbaf-s/protocols_list.

84
Figure 16. Agro-ecological map of Ethiopia with sampling sites (MOA, 2000).
WB = Water body; A1 = Tepid to cool arid mid highlands; Hot to warm semi-arid lowlands; H1 = Hot to
warm humid lowlands; H2 = Tepid to cool humid mid highlands; H3 = Cold to very cold humid sub afro-
alpine to afro-alpine; M1 = Hot to warm moist lowlands; M2 = Tepid to cool moist mid highlands; M3 =
Cold to very cold moist sub-afro alpine to afro-alpine; SA1= Hot to warm semi-arid lowlands; SA2 = Tepid
to cool semi-arid mid highlands; SH1 = Hot to warm sub-humid lowlands; SH2 = Tepid to cool sub-humid
mid highlands; SH3 = Cold to very cold sub-humid sub-afro-alpine to afro-alpine; SM1 = Hot to warm sub-
moist lowlands; SM2 = Tepid to cool sub-moist mid-highlands; SM3 = Cold to very cold sub moist sub
afro-alpine to afro-alpine; PH1 = Hot to warm per humid lowlands; PH2 = Tepid to cool per-humid mid
highlands.
4.2.2. DNA isolation
Total DNA was extracted from chicken whole blood at the BecA-ILRI Hub, Nairobi, Kenya
facility (http://hub.africabiosciences.org/) using the Qiagen DNeasy blood and tissue kit protocol
(Lwelamira et al., 2008). To evaluate the DNA concentration a Thermo Scientific NanoDrop
spectrophotometer 2000c was used. The integrity of DNA was confirmed by agarose gel
electrophoresis whereby 20 ng/µl genomic DNA samples were loaded with 1 µl loading dye (6X)

85
on a 1% agarose gel containing 2.5 µl gel red at a voltage of 7/cm for 60 minutes, 3 µl of lambda
DNA of size of 48,500 bp and a concentration of 20 ng/µl was used as size marker and the gel was
then examined using UV light using GelDoc-It2 Imager to check the extracted DNA quality and
quantity. The genomic DNA from (n = 284) was normalized to a final volume of 100 µl and final
concentration of 50 ng/µl and sent to Edinburgh Genomics, UK, for whole genome sequencing.
4.2.3. DNA quality checking (QC) and library Preparation
The QC, library prep, and sequencing were performed at the Edinburgh Genomics facility.
Genomic DNA (gDNA) samples were evaluated for quantity and quality using an AATI (Agilent
Formerly Advanced Analytical) Fragment Analyzer and the DNF-487 Standard Sensitivity
Genomic DNA Analysis Kit. The AATI ProSize 2.0 software was used to provide a quantification
value and a quality (integrity) score for each individual gDNA sample. Genomic DNA samples
having a quality score of > 7 and with high molecular weight were used. Based on the
quantification results, gDNA samples were normalized to the concentration and volume required
for the Illumina SeqLab TruSeq Nano library preparation method using the Hamilton MicroLab
STAR. Next Generation sequencing libraries were prepared using Illumina SeqLab specific
TruSeq Nano High Throughput library preparation kits in conjunction with the Hamilton
MicroLab STAR and Clarity LIMS X Edition. The normalized gDNA samples were then sheared
to a 450 bp mean insert size using a Covaris LE220 Focused-ultrasonicator. The inserts were
ligated with blunt ended, Atailed, size selected, TruSeq adapters and enriched using 8 cycles of
PCR amplification.

86
4.2.4. Library QC and sequencing
The libraries were evaluated for mean peak size and quantity using the Caliper GX Touch with a
HT DNA 1k/12K/HI SENS LabChip and HT DNA HI SENS Reagent Kit. Those libraries were
then normalized to 5 nM using the GX data and the actual concentration was established using a
Roche LightCycler 480 and a Kapa Illumina Library Quantification kit and Standards. The
normalized libraries were denatured and pooled in eights for clustering and sequencing using a
Hamilton MicroLab STAR with Genologics Clarity LIMS X Edition. Libraries were clustered onto
HiSeqX Flow cell v2.5 on cBot2s and the clustered flow cell is transferred to a HiSeqX for
sequencing using a HiSeqX Ten Reagent kit v2.5. The samples were sequenced at a genome
coverage of ~5-90X (mean = 36.1X). Demultiplexing is performed using bcl2fastq (2.17.1.14),
allowing 1 mismatch when assigning reads to barcodes.
Adapters (Read1: AGATCGGAAGAGCACACGTCTGAACTCCAGTCA, Read2:
AGATCGGAAGAGCGTCGTGTAGGGAAAGAGTGT) are trimmed during the demultiplexing
process.
4.2.5. Mapping and variant calling
The pipelines for mapping and variant calling included: mapping reads against reference genome
using BWA-mem, sorting BAM file, removing duplicated reads with PICARD, Base Quality Score
Recalibration (BQSR) with GATK, calling variants using GATK, Variant Quality Score
Recalibration (VQSR) for variant filtration with GATK, and finally selection of only bi-allelic
SNPs which passed the VQSR step.

87
Mapping with BWA-mem
High quality paired-end reads (FASTAQ format) were aligned to the chicken (Gallus gallus)
reference genome sequence (Gallus_gallus-5.0 or galGal5)
(https://www.ncbi.nlm.nih.gov/genome/?term=Galus+galus+5), using Burrows-Wheeler Aligner
software package (http://sourceforge.net/projects/bio-bwa/files/) with the command ‘mem -t 8 -k
32 -M -R’ ( where –t = no. of threads; -k = min seed length; -M = Mark shorter split hits as
secondary (for Picard compatibility) which permits high-quality queries for longer sequences as it
is fast and accurate (Li and Durbin, 2010); and -R for defining read groups. The alignment output
generated were stored in the SAM format and then converted to BAM formats using PICARD
tools. Duplicated reads originating from a single fragment of DNA during sample preparation
(such as library construction using PCR) were marked and removed using PICARD’s
MarkDuplicates command (https://broadinstitute.github.io/picard/command-line-
overview.html#MarkDuplicates).
Base quality score recalibration
BQSR is a data pre-processing step that detects systematic errors made by sequencers in estimating
the quality score of each base call. Base quality score is an important parameter for variant calling
as it expresses confidence that the base has been called correctly. Unfortunately, the scores
produced by the machines are subject to various sources of systematic technical errors, leading to
over- or under-estimated scores. The BQSR step applies a machine learning algorithm to model
these errors empirically and adjust the quality scores accordingly by considering a number of

88
covariates such as sequencing context of the base, position in read or sequencing cycle
(https://gatkforums.broadinstitute.org/gatk/discussion/44/base-quality-score-recalibration-bqsr).
Variant calling
Variant calling from each sample was performed in the gVCF mode for cohort analysis using
GATK’s HaplotypeCaller (Figure 2). Joint genotyping of samples from each population were done
using GATK’s GenotypeGVCF tool for downstream analysis. Variant Quality Score Recalibration
(VQSR) were also performed to increase sensitivity (identifying the real variants) and specificity
(identifying false positives) using GATK followed by a selection of only bi-allelic SNPs that
passed the VQSR step. For the VQSR step, we used 1M validated SNPs and 15 SNPs from dbSNP
for recalibration purpose.
Figure 17. Overview of data analysis pipeline using BWA, PICARD, and GATK.

89
4.2.6. Population structure and genome-wide nucleotide diversity
Population structure and relationships between samples were established using Principal
Component Analysis (PCA) using smartpca program in eigenstrat version 6.0 (Patterson et al.,
2006; Price et al., 2006). PCA was performed using all SNPs from 27 populations (n = 20,867,451
SNPs). The top three principal components (PCs) provided the clearest separation of the data and
were used to construct the PCA plot. Apart from the PCA, the genetic structure of each population
was also assessed unsupervised, using ADMIXTURE version 1.3.0 (Alexander et al., 2009).
Global admixture analyses were run for K = 2 to K = 10 assumed numbers of ancestors using
651,417 LD pruned SNPs. The optimal K value was determined based on the lowest cross-
validation error. The following criteria was used for LD-pruning: “indep-pairwise 50 10 0.3”, “bp-
space 1000”, “maf 0.1” and “geno 0.1”. This command targets for removal each SNP that has an
r2 value of greater than 0.1 with any other SNP within a 50-SNP sliding window (advanced by 10
SNPs each time) and Minor allelic frequencies of 0.1. The average genome nucleotide diversity
(π) for each population was determined using VCFtools version 0.1.13 in 20 kb windows over a
10 kb sliding step (Danecek et al., 2011). Structure and admixture plots where plotted using R-
software package version 3.4.3.
4.2.7. Functional annotation and enrichment analysis of non-synonymous genes
To predict their functional consequence, SNPs were annotated against the Ensembl chicken gene
database (release 92) using the software package ANNOVAR (Wang et al., 2010). The effects of
non-synonymous SNPs on protein function were predicted based on evolutionary conservation
using the Sorting Intolerant from Tolerant (SIFT) prediction algorithm which depends on the
degree of conservation at individual amino acid (AA) positions (Sim et al., 2012). Using multiple

90
alignments of homologous but distantly related peptide sequences, SIFT calculates normalized
probabilities (SIFT score) of observing all possible AA residues at a position (Gheyas et al., 2015;
Ng, 2003). If the SIFT score is greater or equal to 0.05 the variant is considered evolutionary
tolerant (TOL), whereas variants with a score less than 0.05 are regarded as intolerant (INTOL)
and potentially deleterious (Choi and Chan, 2015; Kumar et al., 2009; Sim et al., 2012). The SNPs
were further checked for their overlap with 1.1 million conserved elements (CE) obtained from the
Roslin Institute (Eory et al., unpublished data; personal communication). These CEs were
generated from multiple alignments of sequence data from 48 bird species and 1 anole lizard
species using Genomic Evolutionary Rate Profiling (gerp++) (Davydov et al., 2010).
The proportion of homozygous SNPs were calculated using the “stat” option of the VCFtools
version 0.1.113 (Danecek et al., 2011). To establish the biological significance of a list of genes
carrying potential functional SNPs, the DAVID Bioinformatics Resources 6.8 (DAVID; Huang et
al. 2009a, 2009b) was used. This allowed performing enrichment analysis of the Gene Ontology
(GO) and the Kyoto Encyclopaedia of Genes and Genomes (KEGG) pathways (KOBAS version
3.0, http://kobas.cbi.pku.edu.cn/). For both analyses, the Fisher exact P-value < 0.05 default
threshold were considered.

91
4.3. Results
4.3.1. Sequencing and variant calling
The average number of paired sequence reads generated from an individual sample in each
population ranged between to about 202 million (Hadush Adi) and 475 million (Surta), resulting
in average genome coverage of about 22X to 44X. On average 88% of the bases were covered by
at least 5 reads and > 90% were covered with at least 10 reads (Table 11). More than 98% of read
pairs in all samples were mapped to the Galgal 5.0 reference genome. The mean sequence depth
of the entire chicken population sampled is about 39X (Figure 18).
Variant calling and filtration resulted in the detection of about 21 million SNPs (n = 20,867,451)
combining the 27 population. The number of SNPs detected within individual population ranges
from 10 to 12 million. The mean SNP density reported is 21 SNPs ± 5 per kb or 1 SNP for every
48 bases. 28.12 % (n = 5,868,599) of the SNPs were already reported in dbSNP (build 147), which
currently contains ~21 million SNPs (n = 20,867,451 SNPs) for chicken; while the rest of the SNPs
(n = 14,998,852) are novel. Much lower SNP density is found in sex chromosomes than autosomes.
The genome landscape plot for the genes for individual chromosome (1 kb window) is given in
Figure S 2. The white ridges as evidenced by samtools view with no density coverage of SNPs are
the gaps because of mapping issues in the reference genome (GC repeat regions) (Figure S 3).
Widespread variations are noted in SNP density across chromosomes (Figure 20). The lowest SNP
density was reported for chromosome W and the highest SNP density was reported for
chromosome 26 followed by chromosome 6. Chromosome-wise SNP distribution plots across the
Ethiopian indigenous chicken genome are depicted in Figure 19. The peak number of non-

92
synonymous SNPs were observed in chromosome 16. Except for Jarso, about 11% to 15% of the
SNP are novel in each chicken population (Table 12). The private allele peak is owned by the Jarso
chicken (n = 280448) and the lowest by the Batambe chicken (n = 34532). Alternate allele
frequency ranges from 0.35 for Loya to 0.39 for Local Horro and Hugub chicken populations.
About 18 - 19% of the SNPs overlap conserved elements. The population with a relatively highest
putatively functional variant is Kumato followed by Local Horro chicken. The proportion of
heterozygote SNPs is 55.21 % for the overall chicken population (n = 284). Bekele Girrisa chicken
population has the highest average heterozygous SNPs (60%) followed by Kumato chicken (59%).
The lowest average heterozygous SNPs is reported in Hugub chicken population (about 40%). The
mean genome nucleotide diversity (π) for the entire chicken population is 0.02 ± 0.001. The
average transition to transversion ratio is 2.35. The highest number of nucleotide substitutions was
recorded for C > T and G > A (4 X 10⁶; Figure 21).

93
Table 11. Summary results on sequencing and mapping of reads.
Sample N MR (%) MD (X) 5_b (%) 10_b (%) 20_b (%) 40_b (%)
Batambie 436294418 99.06 40.33 87.04 78.69 73.73 60.20
Surta 475115042 98.72 41.51
Amesha 427316335 99.21 39.02
Hugub 360343162 99.48 35.67 90.11 88.02 81.85 40.17
Kefis 461097537 99.41 44.42 90.41 88.35 82.11 43.33
Gafera 43.45
Tsion 244270731 99.29 22.04 75.64 64.63 47.75 9.31
Adanie 376903935 99.27 35.89 90.03 87.96 81.94 40.23
Arabo 309414324 99.02 31.30 89.54 85.79 72.33 24.10
Alfamidir 342600741 97.29 89.39 83.64 74.18 34.84
Negasiamba 362919193 98.96 35.52
Ashuda 436640467 99.07 39.76
Dikuli 418411806 99.16 36.93
Gesses 373183155 99.44 35.66 90.16 88.14 82.14 40.35
Kido 357193268 82.92 37.30
Improved Horro 351003978 99.46 32.51
Meseret 433954119 99.30 39.24
Bekelegirisa 383898518 98.95 36.38
Shubigemo 421492594 99.27 39.09
Jarso 368646704 99.75 25.96 88.76 85.68 74.00 7.86
Local Horro 387105936 99.74 28.68 88.78 86.10 76.57 9.90
Kumato 404282348 99.45 38.13
Loya 461026931 99.41 42.61
Hadush Adi 201579979 98.29 39.68 87.47 79.22 57.72 41.98
Mihiquan 335214296 99.45 34.37
Gijet 439628764 99.40 43.08 90.23 88.28 82.73 45.19
Metkilimat 339764180 99.36 33.99
N = Average number of reads; MR: Total number of reads mapped to the Galgal 5.0 reference genome; MD: The
mean sequence depth or the genome sequence coverage; 5_b: Percentage of the genome with bases covered by at least
5 reads; 10_b: Percentage of the genome with bases covered by at least 10 reads; 20_b: Percentage of the genome with
bases covered by at least 20 reads; 40_b: Percentage of the genome with bases covered by at least 40 reads

94
Avg Hom = Average Homozygosity; Avg Het =Average Heterozygosity
Figure 18. The average percentage of homozygous and heterozygous SNPs (%) in Ethiopian
indigenous chicken populations.
0
10
20
30
40
50
60
70
Ad
anie
Ne
gass
i Am
ba
Kef
is
Loca
l_H
orr
o
Mes
ere
t
Shu
bi_
Gem
o
Surt
a
Imp
rove
d_H
orr
o
Bat
amb
e
Ge
sse
s
Gije
t
Tsio
nte
guaz
h
Had
ush
-Ad
i
Loya
Bek
ele
giri
sa
Am
esh
a Sh
inku
ri
Hu
gub
Ash
ud
a
Ku
mat
o
Mih
iqu
an
Ara
bo
Met
kilim
at
Jars
o
Gaf
era
Alf
amid
ir
Kid
o
Dik
uli
Per
cen
tage
Populations
Avg Hom (%) Avg Het (%)

95
Table 12. Variant statistics within chicken populations from Ethiopia
Population N nSNPs Known (%) * Novel (%) PA µAAF TS/TV PI CE (%) PFV (%) **
Batambie 8 11278325 88 12 34532 0.384574 2.44 0.003646 2117632 (18.78) 8176 (0.07)
Surta 9 11769723 87 13 40052 0.371836 2.44 0.003757 2209322 (18.77) 8791(0.07)
Amesha Shinkuri 10 12037555 86 14 45467 0.366294 2.43 0.003718 2258138 (18.76) 9100(0.08)
Hugub 10 10873408 90 10 75551 0.390987 2.44 0.003442 2037719 (18.74) 7843(0.07)
Kefis 10 11606161 87 13 76463 0.374837 2.43 0.003609 2172148 (18.72) 8623(0.07)
Gafera 10 11938205 86 14 47192 0.36822 2.44 0.003663 2237236 (18.74) 9051(0.08)
Tsion 10 11646405 87 13 91269 0.377861 2.43 0.003488 2181362 (18.73) 8644(0.08)
Adanie 10 12254914 85 15 166779 0.363589 2.43 0.003662 2293708 (18.72) 9130(0.07)
Arabo 10 12025464 86 14 116991 0.36956 2.43 0.003491 2249348 (17.70) 9181(0.08)
Alfamidir 10 11302647 87 13 79002 0.382912 2.43 0.00326 2119442 (18.75) 8445(0.07)
Negasiamba 10 11366554 87 13 71076 0.381866 2.43 0.00336 2128289 (18.72) 8385(0.07)
Ashuda 10 11430789 87 13 49469 0.377795 2.43 0.003541 2140547 (18.73) 8637(0.08)
Dikuli 10 12009063 86 14 52605 0.360253 2.43 0.003695 2254716 (18.78) 9105(0.08)
Gesses 9 11313583 87 13 47730 0.383376 2.44 0.003444 2121533 (18.75) 8411(0.07)
Kido 9 11369167 86 14 146190 0.384662 2.42 0.003504 2116126 (18.61) 8502(0.07)
Improved Horro 30 11154784 88 12 48121 0.386675 2.44 0.003436 2092166 (18.76) 8043(0.07)
Meseret 10 12239534 86 14 121862 0.358991 2.43 0.003801 2292807 (18.73) 9405(0.08)
Bekelegirisa 10 12449396 86 14 96851 0.356569 2.43 0.003866 2334214 (18.75) 9637(0.08)
Shubigemo 10 11982320 87 13 91797 0.361542 2.44 0.003797 2253098 (18.80) 9027(0.08)
Jarso 14 12218592 100 0 280448 0.354585 2.45 0.003338 2296595 (18.80) 9442(0.08)
Local Horro 6 10602823 89 11 58140 0.392005 2.46 0.003577 1990141 (18.77) 7470(0.07)
Kumato 10 12595174 85 15 83208 0.353946 2.43 0.003949 2362678(18.76) 9843(0.08)
Loya 10 12300789 85 15 113533 0.351472 2.43 0.003882 2304034(18.73) 9593(0.08)
Hadush Adi 9 11542439 87 13 99497 0.375424 2.44 0.003741 2169976 (18.80) 8508(0.07)
Mihiquan 10 12442251 85 15 161855 0.354912 2.44 0.003865 2333135 (18.75) 9622(0.08)
Gijet 9 11751551 87 13 76662 0.368866 2.45 0.003745 2208579 (18.79) 8837(0.08)
Metkilimat 10 12203356 86 14 97841 0.361624 2.43 0.003782 2289221 (18.76) 9411(0.08)
N = Number of samples analyzed; nSNPs = total Number of SNPs obtained; *Check already reported SNPs in dbsnp; PI = Nucleotide diversity;**PFV = putatively functional
variants (Del, stopgain/loss, splicing, and High Impact); PA = Private SNPs for each population; µAAF = Average Alternate allele frequency; CE = Conserved Element; %PFV is
based on the total SNPs detected from each population.

96
Figure 19. Chromosome-wise SNP distribution plot across the Ethiopian indigenous chicken
genome.
The X-axis denotes the chromosome size, and the Y-axis indicates the chromosome number. If no
SNPs are found in a block, we used a white color. Therefore, the deeper the color, the higher the
number of SNPs. The window size used to count the SNPs was 1 kb.

97
Figure 20. Mean SNPs density across 1 kb window for chicken chromosomes based on ~21million
SNPs.
Figure 21. The rate of nucleotide substitution across Ethiopian indigenous chicken population
genome.
0
5
10
15
20
25
30ch
r1
chr2
chr3
chr4
chr5
chr6
chr7
chr8
chr9
chr1
0
chr1
1
chr1
2
chr1
3
chr1
4
chr1
5
chr1
6
chr1
7
chr1
8
chr1
9
chr2
0
chr2
1
chr2
2
chr2
3
chr2
4
chr2
5
chr2
6
chr2
7
chr2
8
chr3
0
chr3
1
chr3
2
chr3
3
chrL
GE6
4
chrM
T
chrW
chrZ
SNP density per kb
Chromosomes Mean + SD SNP density
Macro (Chr1-5) 21 ± 4
Intermediate (Chr 6–10) 22 ± 4
Micro (Chr 11–28, Chr30-32, Chr MT, Chr LGE64) 19 ± 6
(Chr W) 0.4
Chr Z 11
All autosomes 20 ± 5

98
4.3.2. Population structure and genomic diversity
PCA plots show the presence of six potential clusters of populations, with PC1 and PC2 jointly
explaining 41.4% of the total genetic variance (Figure 22). PC1 (25.95%) separates Improved
Horro from the rest of non-improved chicken populations. Jarso and Hugub populations were
separated from Improved Horro and other populations by PC2 (15.45%). The remaining of the
populations are placed quite close to each other in the PCA plot, although they could be separated
into three more clusters. Admixture analysis suggested four gene pool groupings as the lowest
cross-validation error was observed for K = 4 (Figure 23). LD pruned principal component analysis
(left) and optimum admixture 2 < K < 4 plot (right) for Ethiopian indigenous chicken population
are indicated in Figure S 1. Admixture analysis after pruning also clustered Improved Horro, Jarso,
hugub populations in gene pool one with a certain level of admixture from gene pool two (Figure
24). Both PC and Admixture plots illustrate clustering of Improved Horro, Arabo, Jarso, and
Hugub populations independently, leaving the rest of the populations altogether. In other words,
the majority of the population share quite a lot of SNPs and are closely clustered. PCA analysis
plots prior to LD pruning are also presented in Figure 22.
.

99
Figure 22. Principal component analysis plot of non-filtered (n = 20,867,451 SNPs) (left) and LD pruned SNPs (n = 651,417)
(right).

100
Figure 23. Cross-validation errors of different k values used for admixture analysis

101
.
Figure 24. The admixture plots for Ethiopian indigenous chicken populations (K = 4).

102
4.3.3. Coding and non-coding variants
Annotation of 21 million SNPs against ENSEMBL gene annotation database shows that 46.36%
of SNPs are located within genes (intronic + exonic + UTRs + splicing) and the rest are found
outside genes (intergenic and up/downstream). However, only 1.6% (n = 331,968) of the SNPs
are in protein-coding regions (i.e. exon) (Table 13). SNPs in exonic regions were further
classified into synonymous (65.14%; variants which do not alter the amino-acid sequence in
proteins), non-synonymous (34.38%; variants that change amino-acid sequence in a protein) and
stop gain or loss (0.98%; variants that leads to gain or loss of stop codon) polymorphisms
(Figure 26). The synonymous and non-synonymous (AA-altering) number of SNPs are
190,041(0.48%) and 100,293 (0.98%), respectively. Whereas, the other AA altering variant,
number of stop gain/loss accounts for about 0.36% (n = 1,209). Even though non-synonymous
SNPs change amino acid sequence within a protein, the effects are not always harmful or radical
on protein function. Using SIFT, 21.9% of the non-synonymous variants (n = 44, 553) were
predicted as ‘intolerant’ (INTOL) having a radical effect, 64.94% (135,917) were predicted
‘tolerant’ (TOL), whereas the prediction for other variants had low confidence level (Figure 27).
The average percentage of homozygous and heterozygous SNPs (%) in Ethiopian indigenous
chicken populations.

103
Table 12 shows the number and percentage of putatively functional SNPs that are present in high
frequency and were detected from 27 populations.
Apart from the amino-acid altering variants, other potentially functional categories reported in this
study are splicing variants (0.006%), variants in 3′ and 5′ UTR regions with possible roles of
regulating protein translation (0.82%); those within 1 kb up- or downstream of transcription start
or end sites (3.06%) with possible roles on transcriptional regulation; and finally, the SNPs
belonging to the non-coding RNA (ncRNAs) (2.61%) (Table 13). Nonsynonymous number of
SNPs/Kb across chromosomes are presented in Figure 25.
Figure 25. Non-synonymous number of SNPs/Kb across chromosomes.
0
0.2
0.4
0.6
0.8
1
1.2
1.4
1.6
1.8
2
1 2 3 4 5 6 7 8 9
10
11
12
13
14
15
16
17
18
19
20
21
22
23
24
25
26
27
28
30
31
32
33
LGE6
4 W Z
No
nsy
no
nym
ou
s SN
PS/
Kb
Chromosomes

104
Table 13. Summary of annotation of SNPs and their alternative allele frequency (AAF) in Ethiopian chicken populations.
Annotation category Number (%) Mean
AAF(SD)
No. detected from >10
populations with mean AAF >
0.9 (%)
No. detected from > 27
populations with mean
AAF > 0.9 (%)
No. of private
SNPs with AAF >
0.9 (%)
Intergenic 10,556,684 (50.59) 0.26 (0.26) 435444 (2.087) 282933 (0.014) 9883 (0.0005)
Intronic 9,169,275 (43.94) 0.26 (0.26) 366476 (1.76) 234965 (0.011) 5377 (0.0003)
Upstream/downstream 638532 (3.06) 0.25 (0.26) 24616 (0.12) 14257 (0.0007) 505 (0.00002)
Exonic 331968 (1.59) 0.24 (0.26) 14954 (0.07) 9606 (0.0005) 482 (0.00002)
-Nonsynonymous 100293 (0.48) 0.21(0.25) 4015 (0.02) 2580 (0.0001) 154 (0.000007)
-Nonsynonymous deleterious 24728 (0.11) 0.14 (0.18) 329 (0.002) 152 (0.000007) 25 (0.000001)
-Nonsyonymous tolerated 75565 (0.36) 0.23 (0.27) 2428 (0.012) 2428 (0.0001) 129 (0.000006)
-Stop-gain/loss 1269 (0.006) 0.18 (0.22) 22 (0.0001) 11 (0.0000005 1 (0.00000005)
Synonymous 190041(0.91) 0.26 (0.27) 9417 (0.045) 6055 (0.0003) 278 (0.00001)
UTR3'/UTR5' 171,175 (0.82 0.24 (0.25) 6550 (0.031) 4067 (0.0002) 89 (0.000004)
ncRNA 544429 (2.61) 0.25 (0.25) 19187 (0.092) 12357 (0.0003) 584 (0.00003)
Splicing 1269 (0.006) 0.24 (0.26) 48 (0.0002) 22 (0.000001) 2 (0.0000001)
Conserved elements 3859925 (18.5) 0.26 (0.00) 158053 (0.76) 102316 (0.005) 2252 (0.00011)
Upstream: a variant that is located in the 1-kb region upstream of the gene start site; stop gain: a non-synonymous (ns) SNP that leads to the creation of a stop
codon at the variant site; stop loss: a non-synonymous SNP that leads to the elimination of a stop codon at the variant site; splicing: a variant within 2 bp of a splice
junction; downstream: a variant that is located in the 1-kb region downstream of the gene end site.

105
Figure 26. Exonic variant summary in each annotation category based on ANOVAR (%)
Figure 27. VEP based SIFT analysis for Amino acid altering (non-synonymous and stop gain/loss)
SNPs (%).
65.14
34.38
0.48Synonymous
Nonsynonymous
Stop gain/loss
4.35
9.42
21.29
64.94
deleterious_low_confidence tolerated_low_confidence
deleterious tolerated

106
4.3.4. SNPs within evolutionarily conserved elements
The 21 million SNPs were annotated against 1.1 million conserved elements (CEs) across 48 birds
plus lizard sequences (Eory et al., unpublished data; personal communication). These CEs covers
about 2.1% of the chicken genome (total length of CEs is 186,488,363 bases). The total number
of SNPs that overlapped with CEs are 3,859,925 (18% of the 21 million SNPs), of which 2,619,665
are reported in dbsnp, while the remaining are novel.
4.3.5. Allele frequency spectrum of SNPs in different annotation categories
The frequency spectrum of non-reference or alternative alleles (AAF) of variants from different
annotation categories were compared (Figure 28; Figure 29). The allele frequency distribution of
different annotation categories showed that the largest proportion of variants fell within the AAF
frequency bin of ≤ 10%. However, the proportion of low-frequency variants was higher for
potentially harmful variants like deleterious missense and stop gain/loss (> 60%) compared to
variant belonging to the neutral categories (e.g. intergenic, intronic, and synonymous; < 40%).
Polymorphisms that are potentially functional or deleterious but are present at high frequency (e.g.
AAF > 0.9) may be under selection. Table 4 shows the number and percentage of putatively
functional SNPs present in high frequency and were detected from 27 populations.

107
Figure 28. AAF spectrum different variants (left); AAF spectrum of synonymous, nonsynonymous
and stop gain/loss SNPs.
Figure 29. AAF spectrum of synonymous, non-synonymous and stop gain/loss SNPs.
0
10
20
30
40
50
60
0.1 0.2 0.3 0.4 0.5 0.6 0.7 0.8 0.9 1
Per
cen
tage
Allelic frequency
Synonymous Non-synonymous stop gain/loss

108
4.3.6. Functional annotation and enrichment Analyses
One thousand four hundred twenty-five functionally annotated SNPs identified in the entire dataset
(27 populations) were checked for their functions and biological pathways (Table S 45). GO term
enrichment analysis shows significant (P ≤ 0.05). GO terms related to innate antibacterial and
antifungal immunity response (IPR000157; Toll/interleukin-1 receptor homology (TIR) domain,
IPR007110); Immunoglobulin-like fold and energy biosynthetic ((GO: 0016887; ATPase) activity,
(GO: 0006183; GTP biosynthetic process), (GO: 0006228; UTP biosynthetic process), GO:
0006241; CTP biosynthetic process)). Similarly, 385 non-synonymous deleterious genes (352
reported) detected in 10 populations (Table S 46) where functionally annotated and GO term
enrichment analysis gave genes responsible mainly for DNA repair and binding (GO:0042162,
GO:0006281 ), ATP binding (GO:0005524) and WD40 repeat domains (IPR017986, IPR015943,
IPR001680) (Table 15). Annotation of non-synonymous deleterious SNPs with AAF > 0.9 from
27 populations (Table S 47) and their functional characterization has confirmed genes attributed
to methyltransferase, protein autophosphorylation, a class of nuclear body called promyelocytic
leukemia (PML) (Table 16).

109
Table 14. GO terms enriched for non-synonymous deleterious variants in 27 chicken populations based on SIFT prediction.
Category Term Pathway ID Count P-value
GO term biological function Microtubule-based movement GO:0007018 6 0.004910801
cytoskeleton-dependent intracellular transport GO:0030705 3 0.026430039
GTP biosynthetic process GO:0006183 3 0.017017792
UTP biosynthetic process GO:0006228 3 0.017017792
CTP biosynthetic process GO:0006241 3 0.017017792
Cilium morphogenesis GO:0060271 4 0.035292561
Homophilic cell adhesion via plasma membrane adhesion molecules GO:0007156 7 0.020793417
GO term molecular function ATPase activity GO:0016887 9 9.95E-04
Microtubule motor activity GO:0003777 6 0.002723165
Serine-type endopeptidase inhibitor activity GO:0004867 5 0.02212991
4 iron, 4 sulfur cluster binding GO:0051539 4 0.02383427
INTERPRO Toll/interleukin-1 receptor homology (TIR) domain IPR000157 6 2.09E-04
Interleukin-1 receptor family IPR015621 3 0.012953862
Immunoglobulin-like fold IPR013783 22 0.001598181
Immunoglobulin-like domain IPR007110 17 0.002214937
Immunoglobulin subtype IPR003599 13 0.012352987
Kinesin, motor region, conserved site IPR019821 4 0.04201322
Serpin domain (SERine Proteinase Inhibitors) IPR023796 4 0.018536739
Serpin family IPR000215 4 0.020916244
Nucleoside diphosphate kinase IPR001564 3 0.016977895
C-type lectin fold IPR016187 7 0.006188548
Sushi/SCR/CCP IPR000436 4 0.045649524
SMART TIR SM00255 5 0.001657044
IG SM00409 13 0.020118713
SERPIN SM00093 4 0.022489789
NDK SM00562 3 0.019548392
CCP SM00032 4 0.054729557
Summary of Go functions, pathways and processes showing functions related to health involved in innate antibacterial and antifungal immunity response and
biosynthetic activity. ID = identifier, GO = gene ontology; SMART = Simple Molecular Architecture Research tools.

110
Table 15. GO terms enriched for non-synonymous deleterious variants in 10 chicken populations based on SIFT prediction.
Category Term Pathway ID Count PValue
INTERPRO WD40-repeat-containing domain IPR017986 9 0.016272
GOTERM molecular function Telomeric DNA binding GO:0042162 3 0.021679
INTERPRO WD40 repeat IPR001680 8 0.02589
GOTERM molecular function oxidoreductase activity GO:0016491 5 0.025893
GOTERM cellular component lysosome GO:0005764 5 0.02709
INTERPRO WD40/YVTN repeat-like-containing domain IPR015943 9 0.028383
GOTERM Biological function DNA recombination GO:0006310 3 0.028499
GOTERM cellular component lamellipodium GO:0030027 5 0.030521
GOTERM_BP_DIRECT peptidyl-serine phosphorylation GO:0018105 5 0.031163
GOTERM cellular component external side of plasma membrane GO:0009897 5 0.034197
GOTERM cellular component centriole GO:0005814 4 0.035157
GOTERM cellular component neuronal cell body GO:0043025 5 0.03812
GOTERM Biological function DNA repair GO:0006281 5 0.038616
GOTERM Biological function positive regulation of cholesterol homeostasis GO:2000189 2 0.041447
GOTERM molecular function alpha-1,3-mannosyltransferase activity GO:0000033 2 0.042633
INTERPRO Sialidases IPR011040 2 0.044212
GOTERM molecular function ATP binding GO:0005524 21 0.045558

111
Table 16. Go terms enriched for non-synonymous deleterious variants with allele frequency greater than 0.9 in 27 chicken populations
based on SIFT prediction.
Category Term Pathway ID Count P-value
GOTERM Molecular Function Methyltransferase activity GO:0008168 3 0.008812026
GOTERM Biological Process Protein Autophosphorylation GO:0046777 4 0.018881257
GOTERM Cellular Component PML body GO:0016605 3 0.036055331
GOTERM Biological Process Replicative senescence GO:0090399 2 0.036791597
GOTERM Biological Process Positive regulation of DNA damage response, signal
transduction by p53 class mediator
GO:0043517 2 0.048757466
Summary of Go functions, pathways and processes showing functions related to health involved in innate antibacterial and antifungal immunity response and
biosynthetic activity. ID = identifier, GO = gene ontology

112
4.4. Discussion
4.4.1. Genomic diversity of indigenous chicken populations
Single nucleotide polymorphisms (SNPs) and other mutations may disrupt the RNA structure by
interfering with the molecular function and hence cause a phenotypic effect (Sabarinathan et al.,
2013). In this study, we performed whole-genome sequencing for SNPs and used the identified
SNPs to characterize genetic diversity in indigenous chicken populations of Ethiopia. About 21
million (n = 20,867,451) high quality SNPs were discovered in 27 populations (n = 284 birds).
The 21 million SNPs discovered in this study were higher than the number of SNPs discovered in
a previous study by Gheyas (2015) who reported 15 million SNPs. The number of SNPs detected
in individual populations ranges from 10 to 12 million, which is higher than what was reported by
Lawal (2018) who reported 5.8 million to 6.7 million SNPs for domestic chicken including two
(Local horro and Jarso) Ethiopian populations. Widespread variations have been noted in chicken
SNP density across chromosomes due to the variation in the nature of each chromosome and
assembly. The mean SNP density reported in this study is 21 SNPs per kb (± 5) or 1 SNP per every
48 bases is higher than the figure reported by Gheyas et al (2015) who reported 15 SNPs/kb. From
the total SNPs, about 28.12% (5,868,599) of the SNPs are already reported in dbSNP (build 147)
which currently contains ~21 million SNPs (n=21,303,759) for chicken; while the rest of the SNPs
(n=14,998,852) are novel. In terms of the mean density per Kb discovered and the novel SNPs,
this study reported comparatively in concordance with the previous study by Gheya et al., (2015)
who reported 16 ± 10.01 SNPs/Kb. In contrast to the findings of Gheyas et al. (2015), macro
chromosomes where found to have a higher number of SNP density despite high recombination
rate and in turn high SNP polymorphism in micro chromosomes (Burt, 2005). Even though the

113
high gene-density of the smaller chromosomes would make them susceptible to hitchhiking effects
that could erode genetic variation, these effects appear to be offset by the far higher recombination
rate of the microchromosomes (Aslam et al., 2012).
Much lower SNP density is found in sex chromosomes than autosomes as the high number of
repetitive sequences mainly in W chromosome, whereas, the highest SNP density was reported for
Chromosome 26 followed by chromosome 6 in spite of their lowest chromosomes size unlike what
is reported by Gheyas et al. (2015). The high density of SNPs were obtained for chromosome Z in
the current reference genome (11 SNPs/kb) compared to an average of ~3 SNPs/kb reported by
Kranis et al. (2013). This specific finding is in line with the statement of Wong et al. (2004) who
stated that SNP density is independent of chromosome size. The second lowest SNPs/Kb detected
from Chr31 could be mainly because of the partial representation of this chromosome in the current
reference genome (Kranis et al., 2013). Our result, also is not in line with the findings of previous
studies which reported reduced genetic variations (much lower number of SNPs) on ChrZ than on
autosomes for a multitude of potential reasons like low male effective population size due to
skewed reproductive success among males leading to male effective population size, selective
sweep due to selection on sex-linked characters combined with lower recombination rates
(Sundstrom, 2004). Despite, lower chromosome length, chromosome 16 was also found to have a
higher number of SNPs (21 ± 5) though this chromosome is an exception to the characteristic of
high recombination polymorphism rates in micro-chromosomes. This may be due to the presence
of highly variable MHC genes Whereas, the W chromosome is the sex-limiting chromosome in
chicken and its reduced genetic variability is the result of selection and the complete lack of

114
recombination outside the pseudo autosomal region (Berlin and Ellegren, 2004; Moghadam et al.,
2012; Wright et al., 2016; Xu et al., 2018).
The peak number of non-synonymous SNPs were observed in chromosome 16. Even though non-
synonymous SNPs change amino acid sequence within a protein, the effects are not always harmful
or radical on protein function. Much higher SNP density in Chr16 (probably because it contains
highly variable MHC regions) and also in smaller chromosomes (chr25-33). A smaller
chromosome may be gene rich and hence you see greater SNP density. About 18 to 19% of the
SNPs overlapped the conserved elements. The population with a relatively highest putatively
functional variant is Kumato followed by local Horro chicken population. The proportion of SNPs
that were found heterozygous 55.21% for the overall chicken population (n = 284) is higher than
the average heterozygous SNPs recommended (50%). The mean genome nucleotide diversity (π)
of the entire chicken population is 0.02 ± 0.001 reported in this study lies in the range reported by
Lawal (2018). The lowest average heterozygous SNPs is reported for Hugub chicken populations
(about 40%). The local habitat of this specific population is Hot to warm semi-arid lowlands. The
lowest heterozygous SNPs could be attributed to the fact that as the area is extremely hot and low
density of the chicken population (narrow breeding base). The average transition to transversion
ratio of detected SNPs is 2.35 (Aslam et al., 2012). The expected Ti/Tv ratio of true novel variants
can vary across the genome attributed to a variability in the CpG and GC content of the genome.
For instance, in the case of exomes, an increased presence of methylated cytosine in CpG
dinucleotides in exonic regions leads to an increased Ti/Tv ratio due to an easy deamination and
transition of a methylated cytosine to a thymine. It is also observed that GC content is higher in
birds and mammals than in invertebrates. Observed Ti/Tv ratio in this study is lower than the

115
findings from Alsam et al. (2012) (2.45). This finding is in contrast to the fact that birds have
higher TS/TV ratio for owning smaller genome size and a higher GC percentage in bird genomes.
Principal component and admixture analyses suggest the presence of four ancestral gene pools
across the populations. The close proximity of majority of the populations often reflected their
geographic proximity. The clustering of these population follows the geographical pattern where
they are sampled from.
4.4.2. Functional annotation of genes in indigenous chicken populations
The functional information of these variants can help in the prediction of phenotypes or genetic
merit with higher accuracy and selection of individuals can be done accordingly. Annotation of
21M SNPs against ENSEMBL gene annotation database shows that 46.36% of SNPs are located
within genes (intronic + exonic + UTRs + splicing) and the rest are available outside genes
(intergenic and up/downstream), while, only 1.6% (n=331,968) of the SNPs are in protein-coding
regions (i.e. exonic). However, the study by Wong et al. (2014) showed that only ~37% of the
variants fell within genes with only 1.2% fell within the coding regions. Non-coding RNAs are an
important class of genes, responsible for the regulation of many key cellular functions (Cao, 2014;
Frías-Lasserre and Villagra, 2017; Gardner et al., 2015). The highest number and percentage of
putatively functional SNPs that are present in high frequency and were detected from 27
populations shows that these genes are adaptive.
SNPs in a coding region can be synonymous (do not result in a change in amino acid; selectively
neutral) and non-synonymous. The synonymous and non-synonymous (AA-altering) number of

116
SNPs are 190,041(0.48%) and 100293 (0.98%), respectively. Whereas, the other AA altering
variant, number of stop gain/loss accounts for about 0.36% (n=1,209). Even though non-
synonymous SNPs change amino acid sequence within a protein, the effects are not always harmful
or radical on protein function. Using SIFT, 21.9% of the non-synonymous variants (n = 44, 553)
were predicted as ‘intolerant’ (INTOL) having a radical effect, 64.94% (135,917) were predicted
‘tolerant’ (TOL), whereas the prediction for other variants had low confidence level (Figure 11).
Much higher SNP density in Chr16 (probably because it contains highly variable MHC regions)
and also in smaller chromosomes (chr25-33). A smaller chromosome may be gene rich and hence
may have greater SNP density. Apart from the amino-acid altering variants, other potentially
functional categories are also reported in this study, such as splicing variants (0.006%); variants
in 3′and 5′ UTR with possible roles of regulating protein translation (0.82%); those within 1 kb
up- or downstream of transcription start or end sites (3.06%) with possible roles on transcriptional
regulation; and finally, the SNPs belonging to ncRNAs (2.61%).
Genomic regions conserved across distantly related species are assumed to be under purifying
selection, and hence variants within these regions are likely to be harmful (Gheyas et al., 2015).
Hence, SNPs overlapping evolutionarily conserved elements were checked as these may have
potential functional effects. The 21 million SNPs were annotated against 1.1 million conserved
elements (CEs) across 48 birds plus a lizard. These CEs covers about 2.1% of the chicken genome
(total length of CEs is 186,488,363 bases).
The allele frequency distribution of different annotation categories showed that the largest
proportion of variants fell within the AAF bin of ≤ 10%. However, the proportion was higher for

117
potentially harmful variants like deleterious missense and stopgain/loss (> 60%) compared to
neutral categories like intergenic, intronic, and synonymous (< 40%). This is expected as
potentially detrimental SNPs are expected to be mostly low frequency. However, contrary to our
expectation, we did not find any variation in the AAF pattern of SNPs within the CE category with
potentially neutral variants. SNPs that are potentially function or deleterious but are present in
high frequency (e.g. AAF > 0.9) is expected to have greater impact and may be under selection.
Seven hundred ninety-five reported functionally annotated genes found from the entire 27
population were extracted and checked for their functions and biological pathways with the highest
stringency. GO terms related to innate antibacterial and antifungal immunity response
(IPR000157; Toll/interleukin-1 receptor homology (TIR) domain, IPR007110); Immunoglobulin-
like fold and energy biosynthetic ((GO: 0016887; ATPase) activity, (GO: 0006183; GTP
biosynthetic process), (GO: 0006228; UTP biosynthetic process), GO: 0006241; CTP biosynthetic
process)). Toll proteins or Toll-like receptors (TLRs) and the Interleukin-1 receptor (IL-1R)
superfamily are both involved in innate antibacterial antifungal, anti-Protozoan and anti-viral
immunity in chicken, insects and in mammals (Blasius and Beutler, 2010; Cohen, 2014; Liao et
al., 2010; Liu and Zhao, 2007; Ma et al., 2007). Interleukin-1 receptor family participates in the
regulation of immune responses, inflammatory reactions, and hematopoiesis (Armant, 2002;
Beutler, 2004; Mukherjee et al., 2016; Takeda and Akira, 2001; Vasselon, 2002). Protein protease
inhibitors constitute a very important mechanism for regulating proteolytic activity. Annotation
of non-synonymous deleterious SNPs with AAF > 0.9 and their functional characterization has
confirmed genes attributed to Methyltransferase, Protein auto-phosphorylation, a class of nuclear
body called promyelocytic leukemia (PML) which react against SP100 auto-antibodies during

118
viral infections; and a cell aging process associated with the dismantling of a cell as a response to
telomere shortening and/or cellular aging and genes that controls positive regulation of DNA
damage response, signal transduction by p53 class mediator. The VPS36 gene which is also known
to have a plausible function in comb characters have been discovered as non-synonymous variant
in the 27 indigenous chicken populations of Ethiopia (Shen et al., 2016b). Similarly, the MX1 gene
responsible for morbidity, early mortality, viral shedding, and cytokine responses have been found
in nonsynonymous variants of the 27 population. It is an interferon-induced gene which inhibits
the proliferation of single-stranded RNA viruses (Fulton et al., 2014; Mishra et al., 2011; Schusser
et al., 2011; Selvaramesh et al., 2018; Wang et al., 2012). The gene Chicken Aggrecan Core
Protein (ACAN) which has an association with Tibia Dyschondroplasia is also found harboring
non-synonymous deleterious variants in 10 populations (Fan et al., 2013; Stattin, 2009).

119
4.5. Conclusions
This study confirms the existence of significant genomic diversity in indigenous chicken
populations of Ethiopia, with most of the variants previously undescribed in commercial breeds.
On top of this, a sizable number of novel SNPs has been found in this study which was not reported
in previous similar works.

120
CHAPTER 5. EFFECT OF SIGNATURE OF SELECTION ON THE
GENOME LANDSCAPE OF IMPROVED HORRO AND
INDIGENOUS CHICKEN IN ETHIOPIA
Abstract
Selective breeding for genetic improvement is expected to leave distinctive selection signatures
within genomes. The identification of selection signatures can help to elucidate the mechanisms
of selection and accelerate genetic improvement. Ethiopia has several chicken ecotypes which
have evolved in different agro-ecologies. Here, we assess the footprints of candidate signatures of
positive selection from whole genome autosomal sequences comprising 14,857,039 SNPs
genotyped in Improved Horro, Local Horro, Hugub, Arabo and Jarso chicken populations of
Ethiopia. We identified selection signals in 20 kb windows, with sliding steps of 10 kb based on
estimators of pooled heterozygosity (Hp) and F-statistics (Fst). Selective sweep analysis using Hp
and Fst identified genomic regions associated with production and reproduction. A total of 595
candidate genes showed high evidence of positive selection in indigenous chicken populations,
including genes were related to traits such as growth and egg production. Gene ontology analysis
displayed several biological processes and KEGG pathways involved in oestrogen biosynthetic
and nervous system development processes and calcium signaling and biosynthesis of unsaturated
fatty acids. The regions identified in this study are expected to provide genome landmarks to
enhance the ongoing breed improvement operations in improved Horro and for the other four
chicken populations.
Keywords: Indigenous, Chicken, Improved Horro, Signature of selection, SNP

121
5.1. Introduction
The genetic make-up of populations is the result of a long-term process of adaptation to specific
environments, ecosystems and of artificial selection. Selective breeding for genetic improvement
is expected to leave distinctive selection signatures within genomes. The identification of a
signature of selection can help to elucidate the mechanisms of selection and accelerate genetic
improvement by well understanding molecular pathways underlying phenotypic traits and
breeding goals (Elferink et al., 2012). Selection leads to specific changes in the patterns of
variation among selected loci and in neutral loci linked to them (Guo et al., 2016). These genomic
footprints of selection are termed as signatures of selection and usually used as to identify loci that
have been subjected to selection. Various statistical approaches, either the allelic frequency
spectrum or the properties of haplotype segregation in populations are being used for detecting
selection signatures at genome-wide scale (Qanbari et al., 2015). Among others, pooled
heterozygosity (Hp) statistic is a variability indicator based on allele counts across sliding
windows. The other commonly used statistic is the fixation index (Fst), which measures the genetic
differentiation based on variations in allelic frequencies among populations (Qanbari and
Simianer, 2014). The loci in the tails of the empirical distribution of Fst are the candidate targets
of selection (Akey, 2002). The evolution of new functions and adaptation to new environments
occurs by positive selection, whereby beneficial mutations increase in frequency and eventually
become fixed in a population (Tang et al., 2007). Local environmental adaptation and artificial
selection can change the allele frequencies at specific loci, leading to a higher level of population
differentiation (Fst) (Yang et al., 2014). Adaptation or positive natural selection leaves an imprint
on the pattern of genetic variation found in a population near the site of selection (Xue et al., 2009).

122
Local breeds make up most of the world’s poultry genetic diversity and are still very important in
developing countries where they represent up to 95 percent of the total poultry population. These
local breeds, which are well-adapted to extensive husbandry systems and suitable for resource-
poor poultry farmers endowed with very limited means, should be thoroughly studied as a basis
for enhancing their use and conservation (Besbes et al., n.d.). To understand phenotypic variation
in farm animals and in poultry, in particular, it is essential to define all potential genomic variation
within a genome (Schmid et al., 2015). Discovery of genes with large effects on economically
important traits has for many years been of interest to breeders (Wolc et al., 2014). In this study,
we used Hp and Fst statistics to detect the signature of selection in improved and other indigenous
chicken populations.
Recent advances in sequencing technologies have helped in the detection of candidate genome
regions playing crucial roles in the evolution of production and reproduction traits in chicken. In
this regard, various genes responsible for growth and egg production has been found. This study
aims to elucidate the effect of on-station improvement on the signature of positive selection in an
indigenous chicken, the Improved Horro, compared to non-improved indigenous chicken (Local
Horro, Hugub, Arabo, and Jarso).

123
5.2. Materials and methods
5.2.1. Experimental population description and breeding scheme for Improved Horro
A breeding program has been established in 2008 to improve the productivity of Horro chicken,
an indigenous population in the western highlands of Ethiopia. The breed improvement was
established with the aim of making Horro chickens more productive in terms of egg number and
body weight through selective breeding while maintaining genetic diversity. Breeding objectives
are growth rate and egg production with a target of gaining 1500 gm and 200 eggs/hen/year,
respectively. The population was established from 3000 eggs purchased from two village market
sheds in Horro. The pedigree descended from 26 cocks and 260 hens were hatched and raised at
the poultry research farm of Debre Zeit Agricultural Research Centre (DZARC) (Dana, 2011). The
base population had a wide range of morphological and genetic diversity.
At each generation, 50 males and 300 females were selected to produce the next generation,
representing selected proportions of approximately 10-20% in the males and 50-60% in the
females. Collected eggs were artificially incubated. All hatched chicks were checked for
deformity, vaccinated (against Marek’s disease at the hatchery, Newcastle diseases at Day 1 and
21, Gumboro at day 7, Fowl pox in week 10 and Fowl Typhoid in week 14) , wing tagged, weighed
and randomly assigned to pens of concrete floor filled with bedding material. Birds in all age
classes were provided ad libitum access to feed in the form of starter, pullet and layer ration and
water. More specifically, the chicks were feed ad libitum with a standard chick (0-8 weeks: 20%
CP and 2950 Kcal/kg of ME), grower (8-20 weeks: 18% CP and 2750 Kcal/kg of ME) and layer
(21-onwards: 16% CP and 2750 Kcal/kg of ME) diet formulated at the centre. The chickens were

124
reared in a single deep litter house until 18 weeks of age under a standard housing space, with
natural lighting after 8 weeks of age. Body weight and cumulative egg production were recorded
on weekly basis. Males and females were selected on their body weight at 16 weeks (BW16) as
well as for the later on their cumulative egg production 24 weeks after the start of laying (EN24).
From week 18 onwards, the selected males and all females were transferred to the layer house and
kept in floor pens with 1 cock and 10 hens per pen. Pens were fitted with trap nests to facilitate
full pedigree recording. Eggs were collected from selected hens for 10-12 days and incubated in
three hatches to produce the next generation (Woldegiorgiss, 2015).
5.2.2. Sampling strategy, DNA extraction, and sequencing
Blood samples were collected from 27 chicken populations in Ethiopia (Figure 16). Samples
included 103 cocks and 157 hens. Except the improved Horro, Meseret, Tsion Teguaz, Jarso and
local Horro populations, 10 chicken from each village were sampled. One or two chicken were
sampled per household. Improved Horro was sampled from a breeding stock of 8th generation
under selection at Debre Zeit Agricultural Research Centre and used as a reference population.
Unlike other populations, Jarso and Local Horro sequences were obtained and included from the
previous studies. Photographs and weight of each bird were taken. The average weight of sampled
chicken was 1.26 kg with age ranges of 5 to 36 months. Sampling considered different agro-
ecological zones, altitudes ranging from 729-3500 meters, marketing points, and chicken
phenotypic characteristics. From the wing vein of each chicken, 50 - 250 µl of whole blood were
drawn with syringes using cryotubes filled with 1.5 ml absolute ethanol (100%) following the
guidelines available at https://www.sheffield.ac.uk/nbaf-s/protocols_list.

125
Total DNA was extracted from chicken whole blood at the BecA-ILRI Hub, Nairobi, Kenya
facility (http://hub.africabiosciences.org/) using the Qiagen DNeasy blood and tissue kit protocol
(Lwelamira et al., 2008). To evaluate the DNA concentration a Thermo Scientific NanoDrop
spectrophotometer 2000c was used. The integrity of DNA was confirmed by agarose gel
electrophoresis whereby 20 ng/µl genomic DNA samples were loaded with 1 µl loading dye (6X)
on a 1% agarose gel containing 2.5 µl gel red at a voltage of 7/cm for 60 minutes, 3 µl of lambda
DNA of size of 48,500 bp and a concentration of 20 ng/µl was used as size marker and the gel was
then examined using UV light using GelDoc-It2 Imager to check the extracted DNA quality and
quantity. The genomic DNA from (n = 284) was normalized to a final volume of 100 µl and final
concentration of 50 ng/µl and sent to Edinburgh Genomics, UK, for whole genome sequencing.
5.2.3. Library QC and sequencing
The libraries were evaluated for mean peak size and quantity using the Caliper GX Touch with a
HT DNA 1k/12K/HI SENS LabChip and HT DNA HI SENS Reagent Kit. Those libraries were
then normalized to 5 nM using the GX data and the actual concentration was established using a
Roche LightCycler 480 and a Kapa Illumina Library Quantification kit and Standards. The
normalized libraries were denatured and pooled in eights for clustering and sequencing using a
Hamilton MicroLab STAR with Genologics Clarity LIMS X Edition. Libraries were clustered onto
HiSeqX Flow cell v2.5 on cBot2s and the clustered flow cell is transferred to a HiSeqX for
sequencing using a HiSeqX Ten Reagent kit v2.5. The samples were sequenced at a genome
coverage of ~5-90X (mean = 36.1X). Demultiplexing is performed using bcl2fastq (2.17.1.14),
allowing 1 mismatch when assigning reads to barcodes.
Adapters (Read1: AGATCGGAAGAGCACACGTCTGAACTCCAGTCA, Read2:

126
AGATCGGAAGAGCGTCGTGTAGGGAAAGAGTGT) are trimmed during the demultiplexing
process.
5.2.4. Mapping and variant calling
The pipelines for mapping and variant calling included: mapping reads against reference genome
using BWA-mem, sorting BAM file, removing duplicated reads with PICARD, Base Quality Score
Recalibration (BQSR) with GATK, calling variants using GATK, Variant Quality Score
Recalibration (VQSR) for variant filtration with GATK, and finally selection of only bi-allelic
SNPs which passed the VQSR step.
Mapping with BWA-mem
High quality paired-end reads (FASTAQ format) were aligned to the chicken (Gallus gallus)
reference genome sequence (Gallus_gallus-5.0 or galGal5)
(https://www.ncbi.nlm.nih.gov/genome/?term=Galus+galus+5), using Burrows-Wheeler Aligner
software package (http://sourceforge.net/projects/bio-bwa/files/) with the command ‘mem -t 8 -k
32 -M -R’ ( where –t = no. of threads; -k = min seed length; -M = Mark shorter split hits as
secondary (for Picard compatibility) which permits high-quality queries for longer sequences as it
is fast and accurate (Li and Durbin, 2010); and -R for defining read groups. The alignment output
generated were stored in the SAM format and then converted to BAM formats using PICARD
tools. Duplicated reads originating from a single fragment of DNA during sample preparation
(such as library construction using PCR) were marked and removed using PICARD’s
MarkDuplicates command (https://broadinstitute.github.io/picard/command-line-
overview.html#MarkDuplicates).

127
Base quality score recalibration (BQSR)
BQSR is a data pre-processing step that detects systematic errors made by sequencers in estimating
the quality score of each base call. Base quality score is an important parameter for variant calling
as it expresses confidence that the base has been called correctly. Unfortunately, the scores
produced by the machines are subject to various sources of systematic technical errors, leading to
over- or under-estimated scores. The BQSR step applies a machine learning algorithm to model
these errors empirically and adjust the quality scores accordingly by considering a number of
covariates such as sequencing context of the base, position in read or sequencing cycle
(https://gatkforums.broadinstitute.org/gatk/discussion/44/base-quality-score-recalibration-bqsr).
Variant calling
Variant calling from each sample was performed in the gVCF mode for cohort analysis using
GATK’s HaplotypeCaller (Figure 2). Joint genotyping of samples from each population were done
using GATK’s GenotypeGVCF tool for downstream analysis. Variant Quality Score Recalibration
(VQSR) were also performed to increase sensitivity (identifying the real variants) and specificity
(identifying false positives) using GATK followed by a selection of only bi-allelic SNPs that
passed the VQSR step. For the VQSR step, we used 1M validated SNPs and 15 SNPs from dbSNP
for recalibration purpose.

128
5.2.5. Selective sweep detection
A total of 14, 857, 039 recalibrated autosomal SNPs were generated from 70 chicken samples (5
populations) and used for downstream analysis of signatures of selection. For each indigenous
population we also produce environmental suitability maps for indigenous chicken populations
based on the following environmental variables: Minimum temperature of the coldest month,
precipitation seasonality, precipitation of the wettest quarter, precipitation of the driest quarter, %
of cultivated land, % of grass/scrub/woodland, proportion of crop rainfed or irrigated and carbon
content (g/kg).
Selection sweep detection was carried out using Hp and Fst statistics using VCFtools version
0.1.13 in an overlapping window bin size of 20 kb and a step size of 10 kb. These statistics involves
comparing the average number of nucleotide differences from pair wise DNA sequences and the
number of segregating sites. Using the pool heterozygosity (Hp) method (Rubin et al., 2010), the
levels of heterozygosity were measured for the autosomal genome (chromosomes 1-28 and 30-33)
at a window of 20 kb and 10 kb step size.
The pooled heterozygosity (Hp) values were calculated using the following equation:
Hp = 2 ∑ nMAJ ∑ nMIN
(∑ nMAJ + ∑ nMIN) Equ(1)
Where ∑ nMAJ and ∑ nMIN) are the sums of major and minor allele frequencies respectively for all
the SNPs within each the 20-kb window. At each detected SNP position, we counted the number

129
of reads corresponding to the most and least frequently observed allele (nMAJ and nMIN,
respectively) for each population. The values of Hp calculated for each window size were then
subsequently Z-transformed using the equation:
ZHp =Hp − x̅(Hp)
σ(Hp)= Equ(2)
Where �̅� the mean and σ is is the standard deviation of the Hp value. Windows with a large number
of heterozygote SNPs show values above zero, they may reflect balancing selection signature.
Only windows with at least 20 SNPs were extracted and set for analysis. Following this criterion,
1117, 1152, 1029, 1444 and 911 windows with SNPs < 20 were excluded for Improved Horro,
Local Horro, Arabo, Hugub and Jarso populations. Respectively. From the remaining windows, a
genome-wide significant threshold score of Z (Hp) ≤ - 4.0 was considered (Rubin et al., 2010).
Population differentiation values (Fst) which compare differences in allele frequencies between
population were calculated for each SNP as described in Akey et al. (2002). Fst was calculated
from the allele frequencies (not the allele counts) using the standard equation:
Fst = Pi total − Pi within Equ (3)
Where, Pi within = P(i) population 1+ P(i ) population 2
2 and Pi = 1 − fA2 − fT2 − fC2 − fG2
with fN being the frequency of nucleotide N (A, T, C or G), Pi total is the total Pi for which allele
frequencies in both populations are averaged. The Fst values were Z-transformed as follows:

130
ZFst =Fst − μFst
σFst
Where, μ is the mean and σ is the standard deviation of the Fst.
Putatively selected regions were selected based on windows within the 1% level low and high ZFst
values.
5.2.6. Gene ontology and pathway analyses
To establish the biological significance of the genes found within each candidate selected region,
the genes putatively under selection were submitted to DAVID Bioinformatics Resources 6.8
(https://david.ncifcrf.gov/) for enrichment analysis of the Gene Ontology (GO) and the Kyoto
Encyclopaedia of Genes and Genomes (KEGG) pathways (KOBAS version 3.0,
http://kobas.cbi.pku.edu.cn/). All chicken genes annotated in Ensembl were included. The two
analyses restricted over-represented genes to the Fisher exact P-value < 0.05 default threshold.

131
5.3. Results
5.3.1. Principal component analysis
The genetic structure of the populations was examined on the basis of all SNPs using principal
component analysis (PCA) (Figure 30). The first two components account for 19.27% and 7.1% of
the variation respectively. They separate clearly the five populations.
Figure 30. PCA plot of Improved Horro (left) and other indigenous chicken populations and suitability maps for
the four indigenous chicken populations (right).
5.3.2. Genome-wide selective sweep detection using Hp
In Improved Horro chicken population, from the total number of 91,996 windows 90,877 windows
with 20 and above SNPs were analyzed (Table S 48). The mean Hp value is 0.33 ± 0.058, while
the minimum and maximum ZHp is -5.71 and 2.88, respectively, with 417 windows below the
genome-wide threshold of ≤ - 4 (Table S 48). The proportion of windows with significant ZHp in

132
Improved Horro is 0.46% (417*100)/90878). These windows define 417 candidate sweep regions
including 125 annotated genes (Table S 49). Chromosomes 1 to 15, chromosome 17, chromosome
20 and Chromosome 24 show significant window ≤ -4 (Figure 32). Across the genome, the
strongest peak is located on chromosome 1 and 12 (Chr1: 189490000 to 189510000 bp; Chr12:
190890000-190930000 bp regions) with a ZHp score of -5.71 for the chromosome 1, including the
Thyroid Hormone Stimulating Receptor (THSR) gene (Table 20).
3.
Figure 31. SNP count of Improved Horro (n = 30) before and after filtering.
Figure 32. The frequency of ZHp values and Manhattan plot in Improved Horro (n = 30).

133
In Local Horro chicken population, from a total of 91905 windows, 90753 windows with 20 and
above the number of SNPs were analyzed of which 311 windows (0.34%) passed the genome-
wide significant threshold of ≤ -4 (ZHp) (Table S 50). These define 311 candidate sweep regions
including 83 genes (Table S 51). Chromosomes 1 to 15, chromosome 17, chromosome 20 and
chromosome 24 show significant peaks (Figure 34). Across the genome, the strongest peaks are
located on chromosome 2, 3 and 5 (11 sweep regions) with a Z (Hp) score of -5.8. Similarly to the
Improved Horro the TSHR (Chromosome 5: 40858950- 40811286) and Angiotensin II Receptor
Type 1 (AGTR1) (Chromosome 5: 12430615 to 12398415) genes are found with significant
windows regions (Table S 50).
Figure 33. SNP count of Local Horro chicken (n = 6) before and after filtering.

134
Figure 34. The frequency of ZHp values for and Manhattan plot in Local Horro chicken (n = 6).
In Jarso chicken population, from a total number of 91966 windows, 91055 windows with 20 and
above the number of SNPs were analyzed (Table S 52) of which, 31 windows (0.034%) passed the
genome-wide significant threshold of < - 4 windows (ZHp). Chromosomes 1 to 9 and chromosome
13 have significant peaks. Thirteen annotated genes are found in these windows (Table S 53).
Across the Jarso genome, the strongest peak is located on chromosome 13 (position 520,000 to
550000 bp) with a ZHp score of -4.68 (Figure 36).

135
Figure 35. Average SNP count of Jarso (n = 14) before and after filtering
Figure 36. The frequency of ZHp values for and Manhattan plot in Jarso chicken (n = 14).
In Hugub chicken population, from the total number of 92006 windows, 90560 windows with 20
and above number or SNPs were analyzed (Table S 54) of which, 242 windows (0.12%) passed
the genome-wide significant threshold of ≤ -4 (ZHp) (Table S 55). The mean Hp value for the

136
window across the genome is 0.33 ± 0.063. Whereas the minimum and maximum Z-transformed
pooled heterozygosity value are -5.12 and 2.72, respectively. These significant regions include 78
annotated genes (Table S 56). Chromosomes 1 to 9 and chromosome 13 show significant peaks ≤
- 4 (Figure 38). Across the genome, the strongest peaks are observed on chromosome 3 (50630000-
50650000; 7020000-7040000; 7930000 - 7960000; 18930000-18950000 bp) with a ZHp score of
-5.12. A gene of particular biological interest on chromosome 3 (position: 26395277 to 26573746)
is the Protein Kinase C Epsilon (PRKCE).
Figure 37. Average SNP count of Hugub (n = 10) before and after filtering.

137
Figure 38. The frequency of ZHp values for and Manhattan plot in Hugub chicken (n = 10).
In Arabo chicken population, from the total number of 92250 windows, 91221 windows with 20
and above number SNPs were analyzed (Table S 57). The mean Hp value is 0.30 ± 0.061, while
the Z transformed minimum and maximum Hp value are - 4.896 and 3.02, respectively. Fifty
windows (0.055%) passed the genome-wide significant threshold of ≤ - 4 (ZHp) (Table S 57).
These windows defined 50 candidate sweep regions with 14 annotated genes (Table S 58).
Chromosomes 1 to 9 and Chromosome 13 show significant peaks. Across the Arabo chicken
genome, the strongest peak is located on chromosome 3 (82480000-82500000bp) (Figure 40) with
a ZHp score of - 4.896 and 14 genes Tudor domain containing (TDRD), Diaphanous-Related
Formin 3 (DIAPH3), Ankyrin Repeat And KH Domain Containing 1 (ANKHD1), Steroid
Receptor RNA Activator 1 (SRA1), Phosphodiesterase 1C (PDE1C), Echinoderm microtubule-
associated protein like 4 (EML4), Regulating synaptic membrane exocytosis 1 (RIMS1), Deleted
in Liver Cancer 1 (DLC1), Thyroid stimulating Receptor (TSHR) and Bone morphogenetic protein
receptor type 2 (BMPR2). GO enrichment analysis in Arabo chicken indicates enrichment in
Caveola cellular component functions (Table 20).

138
Figure 39. Average SNP count of Arabo chicken (n = 10) before and after filtering.
Figure 40. The frequency of ZHp values for and Manhattan plot in Arabo chicken (n = 10).

139
5.3.3. Consequences of pooled heterozygosity (Hp) variants detected
The different variant consequences are reported in Table 17. From the ZHp variants (ZHp < -4),
the highest Hp variant is reported for Improved Horro compared to the other indigenous chicken
population of Ethiopia Table 18. The number of novel variants ranges from 4.6% (Jarso) to 7.4%
(Improved Horro). The lowest mean Hp is reported for Jarso (0.29 ± 0.062) chicken population. A
difference was not noted in terms of missense variants between Improved and Local Horro chicken
population using Hp method, while with no difference in mean and max Hp (Table 18). The
minimum missense variant is reported for Jarso population. SIFT prediction of Hp variants also
shows the tolerated and non-tolerated deleterious Hp variants in the candidates of selection
signature regions (Table 19).

140
Table 17. Summary of variant and Hp statistics in Improved Horro and other Ethiopian indigenous chicken populations.
Population Improved Horro (n/%) Local Horro Arabo Hugub Jarso
Sample size 30 6 10 10 14
Single nucleotide variant 33677 26322 4358 20,281 2637
Novel variants 2482 (7.4) 1323 (5.0) 255 (5.9) 1202 (5.9) 121 (4.6)
Existing variants 31195 (92.6) 24999 (95.0) 4103 (94.1) 19,079 (94.1) 2516 (95.4)
Overlapped genes 345 235 36 235 45
Overlapped transcripts 871 569 104 462 96
Windows number 91,994 91,905 92250 92004 91966
Windows with more than 20 SNPs 90,877 90,753 91221 90560 91055
µHp 0.33 ± 0.06 0.33 ± 0.06 0.30 ± 0.07 0.33 ± 0.06 0.29 ± 0.06
minZHp -5.71 -5.8 -4.9 -5.12 -4.68
Max ZHp 2.88 2.88 3.02 2.72 3.34

141
Table 18. Summary of all Hp consequences.
Population Improved Horro Local Horro Arabo Hugub Jarso
Missense 304 304 24 213 20
Splice region variant 328 244 9 95 35
Synonymous 1077 1000 64 513 108
5UTR 162 177 2 105 2
3UTR 1801 737 5 309 314
Non-coding transcript exon 1034 556 33 299 109
Intron Variant 121102 77,505 21,622 40,194 8,386
Non-coding transcript 10696 7,846 2,165 5,536 1,499
Upstream 8882 5,736 185 4,654 559
Downstream 11127 5,637 93 5,482 1,738
Intergenic 12671 11,567 2,105 9,788 1,169
Splice donor/acceptor 1(1) 0(3)
Stop gain/lost 0(2) 4(1) 2(0)
Micro RNA 1
Upstream: a variant that is located in the 1-kb region upstream of the gene start site; stop gain: a non-synonymous (ns) SNP that leads to the creation of a stop
codon at the variant site; stop loss: a non-synonymous SNP that leads to the elimination of a stop codon at the variant site; splicing: a variant within 2 bp of a splice
junction; downstream: a variant that is located in the 1-kb region downstream of the gene end site; upstream/downstream: a variant that is located in the downstream
and upstream regions of two genes.
Table 19. Sift prediction of Hp variants.
Population
Deleterious
low confidence Deleterious Tolerated low confidence Tolerated
Improved Horro (n = 30) 2 31 17 82
Local Horro (n = 6) 1 23 6 176
Arabo (n = 10) 7 2 14
Hugub (n = 10) 4 14 19 97
Jarso (n = 14) 12 6

142
5.3.4. Common selected Hp sweep regions and functional annotation of genes across
populations
The genome of the considered chicken populations was checked for overlapping sweep regions.
Sixty-four windows were merged and checked for duplicate/overlapped regions (Table S 67). 145
duplicate values were obtained from the regions across populations. Finally, 64 regions were found
in overlapping regions between chicken populations. From these regions, 31 genes were obtained
for further functional annotation (Table S 68). Enriched functions for commonly selected regions
include calcium signaling and other biological processes (Table 20).

143
Table 20. Functional annotation of genes in Improved Horro and other indigenous chicken populations of Ethiopia.
Improved Horro (n = 30)
Category Term ID N P < 0.05
GOTERM cellular component Voltage-gated calcium channel complex GO:0005891 3 0.004713343
KEGG_PATHWAY MAPK signaling pathway gga04010 6 0.005301658
KEGG_PATHWAY Calcium signaling pathway gga04020 5 0.010739355
GOTERM Molecular function Low voltage-gated calcium channel activity GO:0008332 2 0.017132492
INTERPRO C2 calcium-dependent membrane targeting IPR000008 4 0.02099244
INTERPRO Laminin G domain IPR001791 3 0.023680002
GOTERM cellular component Cytoplasmic, membrane-bounded vesicle GO:0016023 3 0.027615941
GOTERM Biological Process Regulation of nucleic acid-templated transcription GO:1903506 2 0.034513351
GOTERM Molecular function Methylated histone binding GO:0035064 2 0.045049799
GOTERM Biological Process Calcium ion import GO:0070509 2 0.048945698
Local Horro (n = 6)
GOTERM Biological Process Nervous system development GO0007399 3 0.028538
Hugub (n = 10)
Go term molecular function direct Heparin-binding GO:0008201 3 0.040196
Jarso (n = 14)
GOTERM Biological Process Adult locomotory behavior GO:0008344 2 0.019311
GOTERM Molecular function DNA binding GO:0003677 3 0.032634
GOTERM Biological Process Nervous system development GO:0007399 2 0.038322
Arabo (n = 10)
Go term cellular component Caveola GO:0005901 2 0.017181377

144
5.3.5. Fst variants detected
For ZHp candidate signature of selection regions, the highest genetic differentiation is observed
between the Improved Horro and Hugub chicken populations (0.55 ± 0.06; Table S 63) and the
lowest is between Improved Horro and Local Horro (0.08 ± 0.02; Table S 59). Interestingly, the
highest number of missense Fst variant is found between Improved Horro and Local Horro
implying that the ongoing selection process in Improved Horro may be fixing in the later is mainly
targeting amino acid-altering putatively functional variants involving non-tolerable deleterious
variants (Table 23).
5.3.6. Genome-wide selective sweep detection using Fst
Pair wise Fst results between Improved Horro and other indigenous chicken populations of
Ethiopia namely Local Horro, Jarso, Hugub, and Arabo chicken populations are given below.
From the total pair wise Fst windows (91,989) between Improved and Local Horro 90,572
windows with greater than 20 SNPs, the top 1% windows (906) were considered as significant
windows for downstream analysis (Table S 59). The minimum and maximum Fst values were 0.04
and 0.15, respectively. The significant genetic differentiation based on Fst values was mainly
concentrated in the majority of the chromosomes Table 24). Detection of selection at the genome
level using the Fst outlier method yield 311 candidate genes showing high evidence of positive
selection from these significant regions (Table S 60). Between the highly differentiated regions of
these populations, an interesting gene called Ral GTPase activating protein catalytic alpha subunit
1 (RALGAPA1) has been found.

145
Figure 41. Histogram and Manhattan plot showing the distribution of Fst values for Improved Horro Vs Local Horro
chicken populations.
The number of windows in Improved Horro and Jarso population is 92,123 windows. Windows
with greater than 20 SNPs is 91, 395. The top 1% significant windows where 914 windows (Table
S 61) and from these windows 272 genes (Table S 62) were extracted for further functional
annotation using Database for Annotation, Visualization and Integrated Discovery (DAVID).

146
Figure 42. Histogram and Manhattan plot showing the distribution of Fst values for Improved
Horro Vs Jarso chicken populations.
The total number of Windows Fst for Improved Horro and Hugub populations is 92, 017. From
this windows, 91,167 number of windows have greater than 20 SNPs. 1% these windows yield
911 windows (Table S 63), which encompasses 26 candidate genes under the regions of selection
pressure (Table S 64).
Figure 43. Histogram and Manhattan plot showing the distribution of Fst values for Improved
Horro Vs Hugub chicken populations.
The total number of windows for Improved Horro and Arabo population is 92,118. 91300 windows
have greater than 20 SNPs. From these windows a total of 913 windows (Table S 65) have 1%
significant windows and 26 genes were fetched from these regions (Table S 66).

147
Figure 44. Histogram and Manhattan plot for Ethiopian Improved Horro and Arabo chicken
showing the pairwise comparison of selection pressure.
5.3.7. Consequences of Fst variants detected
The highest Fst variant statistic were obtained (n = 157,323) between Improved Horro and Local
Horro followed by Improved Horro and Jarso (n = 135,913) (Table 21. The highest proportion of
novel Fst variants are between Improved Horro and Jarso (14.6%) followed by Improved Horro
and Arabo (13.2%). The highest mean Fst (0.09 ± 0.02) is between IH and LH but the maximum
genetic differentiation was between IH and HUG (Fst = 0.82). In terms of Fst variant
consequences, the highest missense variant is obtained between IH and LH followed by IH VS
HU (Table 22). The number of Fst variants based on SIFT prediction is indicated in Table 23. The
highest deleterious variants are found between IH and LH (n = 180) followed by IH and AR (n =
127).

148
Table 21. Fst variant Statistics.
Population IH VS LH (n/%) IH VS AR (n / %) IH VS JAR (n / %) IH VS HU (n / %)
SNV 157,323 124,268 135913 108,541
Novel variants 19,232 (12.2) 16,450 (13.2) 19,855 (14.6) 13,850 (12.8)
Exiting variants 138,091 (87.8) 107,818 (86.8) 116,058 (85.4) 94,691 (87.2)
Overlapped genes 907 716 777 582
Overlapped transcripts 1,956 1,482 1,746 1,406
Fst windows > 20 SNPs 90572 91300 91395 91167
Significant windows (P < 0.01) 906 913 914 912
Min Fst 0.06 0.40 0.46 0.48
Mean Fst 0.09 ± 0.02 0.48 ± 0.08 0.53 ± 0.06 0.55 ± 0.06
Max 0.18 0.8 0.76 0.82
SNV = Single nucleotide variant; IH = Improved Horro; AR = Arabo; JAR = Jarso; HU = Hugub; n = number

149
Table 22. Fst all consequences.
Population IH VS LH IH VS AR IH VS JAR IH VS HUG
Missense 3,185 1,473 1,797 2,375
Splice region 1,592 881 776 640
Synonymous 7,115 4,454 4,281 3,429
5UTR 1,478 1,719 1,788 666
3UTR 8,859 6,999 8,084 4,638
Noncoding Transcript Exon 4,802 4,617 5,652 4,135
Intron 43,352 41,695 50,499 36,617
Non-coding transcript 59,335 38,960 46,593 56,160
Upstream gene 66,220 44,935 44,749 29,015
Downstream gene 59,689 42,489 45,497 27,076
Intergenic 43,352 41,695 50,499 36,617
Splice donor/acceptor 10(9) 21(4) 20(19) 10(5)
Stop gain/lost 10(2) 5(4) 12(7) 5(1)
Micro RNA 3 1 1
Start lost / regained 5(4) 4
IH = Improved Horro; LH = local Horro; JR = Jarso; Hu = Hugub; 5UTR = 5 prime untranslated region; 3UTR = 3 prime untranslated region
Upstream: a variant that is located in the 1-kb region upstream of the gene start site; stop gain: a non-synonymous (ns) SNP that leads to the creation of a stop
codon at the variant site; stop loss: a non-synonymous SNP that leads to the elimination of a stop codon at the variant site; splicing: a variant within 2 bp of a splice
junction; downstream: a variant that is located in the 1-kb region downstream of the gene end site; upstream/downstream: a variant that is located in the downstream
and upstream regions of two genes.

150
Table 23. Number of FST variants based on SIFT prediction.
Population Deleterious Low
confidence
Deleteriou
s
Tolerated Low
confidence
Tolerate
d
Improved Horro VS Local
Horro 33 180 82 646
Improved Horro VS Arabo 23 124 43 390
Improved Horro VS Jarso 29 127 89 532
Improved Horro VS Hugub 13 85 36 354
5.3.8. Commonly selected Fst sweep regions and annotation of genes across populations
The genome of the considered chicken populations was checked overlapping sweep regions. 3644
regions were merged and checked for duplicate/overlapped regions.1652 duplicate values were
obtained from the regions across populations. Finally, 667 windows (Table S 69) were found
overlapping. From these regions, 190 genes were obtained for further functional (Table S 70). It
was evident that these selection signals mainly concentrated in macro and microchromosome such
as chromosomes 1 to 10.

151
Table 24. Functional annotation of genes in Improved versus other indigenous chicken populations.
Category Term ID N P < 0.05
Improved versus Local Horro
GOTERM Biological Process Late endosome to vacuole transport GO:0045324 2 0.023434
INTERPRO Ankyrin repeat-containing domain IPR020683 6 0.025137
GOTERM Biological process Cell-cell adhesion GO:0098609 3 0.04263
GOTERM Cellular component postsynaptic membrane GO:0045211 4 0.04394
GOTERM Biological process Cellular response to fatty acid GO:0071398 2 0.046323
GOTERM Biological Process Positive regulation of CREB transcription factor activity GO:0032793 2 0.046323
GOTERM Biological process Protein transport GO:0015031 4 0.047637
Improved Horro versus Jarso
GOTERM Cellular component Cell cortex GO:0005938 4 0.016022
GOTERM Cellular component Cleavage furrow GO:0032154 3 0.016867
GOTERM Cellular component Ruffle membrane GO:0032587 3 0.036196
INTERPRO Haemoglobin, beta IPR002337 2 0.037098
INTERPRO Ion transport domain IPR005821 4 0.038218
GOTERM Molecular function GTPase activator activity GO:0005096 5 0.040684
INTERPRO Potentiating neddylation domain IPR005176 2 0.046158
INTERPRO Defective-in-cullin neddylation protein IPR014764 2 0.046158
INTERPRO Cullin, conserved site IPR016157 2 0.046158
GOTERM molecular function Protein kinase activity GO:0004672 4 0.046783
GOTERM molecular function Ubiquitin-like protein binding GO:0032182 2 0.04715
Improved Horro Versus Hugub
GOTERM Biological process hematopoietic progenitor cell differentiation GO:0002244 4 0.004749
INTERPRO Cadherin-like IPR015919 4 0.016567
GOTERM cellular component ciliary rootlet GO:0035253 2 0.032998
GOTERM Biological process Homophilic cell adhesion via plasma membrane adhesion molecules GO:0007156 4 0.036298
GOTERM Biological process Apoptotic process GO:0006915 4 0.040854

152
Category Term ID N P < 0.05
GOTERM cellular component Extracellular space GO:0005615 10 0.055477
KEGG_PATHWAY Gap junction gga04540 3 0.079866
INTERPRO Pleckstrin homology-like domain IPR011993 6 0.084988
GOTERM cellular component Interstitial matrix GO:0005614 2 0.0958
Improved Horro and Arabo
INTERPRO Armadillo-type fold IPR016024 8 0.017504
PIR_SUPERFAMILY fatty acid desaturase/sphingolipid desaturase PIRSF015921 2 0.019163
KEGG_PATHWAY Biosynthesis of unsaturated fatty acids gga01040 3 0.020228
INTERPRO Zinc finger, FYVE/PHD-type IPR011011 5 0.020317
INTERPRO Fatty acid/sphingolipid desaturase IPR012171 2 0.02156
INTERPRO FAM122 IPR026716 2 0.02156
INTERPRO Tetraspanin, EC2 domain IPR008952 3 0.023362
GOTERM_BP_DIRECT Estrogen biosynthetic process GO:0006703 2 0.031684
GOTERM_BP_DIRECT Positive regulation of axon regeneration GO:0048680 2 0.042023
INTERPRO Diaphanous autoregulatory IPR014767 2 0.04266
INTERPRO Zinc finger, N-recognin IPR003126 2 0.04266
SMART ZnF_UBR1 SM00396 2 0.04589

153
Table 25. Functional annotation of commonly selected genes based on Fst
Category Term ID N P<0.01
INTERPRO Fatty acid/sphingolipid desaturase IPR012171 2 0.014103
KEGG_PATHWAY Fatty acid metabolism gga01212 3 0.031962
INTERPRO Cullin protein, neddylation domain, conserved site IPR019559 2 0.041723
GOTERM Biological process Positive regulation of G1/S transition of the mitotic cell cycle GO:1900087 2 0.045811
INTERPRO Cullin homology IPR016158 2 0.048508
INTERPRO Fatty acid desaturase, type 1 IPR005804 2 0.048508

154
5.4. Discussion
5.4.1. Candidate of signals of selection using Hp method
The selective sweep can have a dramatic impact on the level of population subdivision, particularly
when the sweep has not yet spread to all populations within a species (Nielsen et al., 2011). The
size of a selective sweep may depend on factors such as the local recombination rate, whether the
selected variant ever reached complete fixation, the number of generations it took before fixation
and any population admixture at a time point after the sweep initially occurred (Rubin et al., 2010).
Across the Improved Horro genome, the strongest peak is located on chromosome 1 and 12
(189490000 to 189510000 bp) with a Z Hp score of -5.71 including Thyroid Stimulating Hormone
Receptor (TSHR) and other variable genes. The TSHR gene (Chromosome 5: 40811286-40858950
bp) which is a previously reported locus with a pivotal role in metabolic regulation and
reproduction process (Rubin et al., 2010), is reported in Improved Horro chicken population. It is
regarded as one of the most striking selective sweeps found in all domestic chicken. The
established selective sweeps around the TSHR gene in domestic chicken is identified in the five
chicken populations and this was considered as a proof of principle demonstrated that the
identification of selection signals using Hp methods is reliable. Besides, the previously reported
gene General Transcription Factor IIA Subunit 1 (GTF2A1) (Chromosome5: 40868271- 40894704
bp) known to be involved in the production of eggs in birds is also under strong selection pressure
in this population ( Lawal et al., 2018; Yuan et al., 2015).
Another interesting phenomenon is the presence of Myozenin 1 (MYOZ1) gene is also found to
be under the pressure of the ongoing selection program. Myoz1 gene under the candidate

155
signatures of selection which plays a crucial role in signal transduction and muscle fiber type
differentiation. The Myoz1 gene is a potential candidate for affecting carcass and meat quality
traits in animals (Luo et al., 2018). Among other numerous genes in this study, the previously
reported ovostatin (OVST) gene which is associated with the formation of eggshells by regulating
eggshell matrix protein secretion is also under strong selection (Cordeiro and Hincke, 2016).
Angiotensin II Type 1 Receptor (AGTR1) (Chromosome 9: 12398415- 12430615 bp) gene is the
other gene available in the selective sweeps of this specific population. This gene is also reported
heavily involved in Ascites in commercial broilers (Krishnamoorthy et al., 2014). Ascites refers
to abnormal accumulation fluid in the abdominal (peritoneal) cavity and it is a disease of modern
days in the poultry industry (Qanbari et al., 2015b; Wideman et al., 2013). In humans, AGTR1
(Chromosome 9: 12398415- 12430615 bp) is a strong candidate for the pulmonary arterial
hypertension (Burks, 2011; Chung et al., 2014; Crossley and Altimiras, 2012). The Immunoglobin
Superfamily Member 21 (IGSF21) (Chromosome 21: 23092- 65640 bp) which promotes
differentiation of inhibitory synapses via binding to neurexin2α is also under selection pressure
(Tanabe et al., 2017). Coordinated development of excitatory and inhibitory synapses is essential
for higher brain function, and impairment in this development is associated with neuropsychiatric
disorders. The most selected chromosome in Improved Horro is chromosome 1. Genes of interest
that contain statistically significant include the DnaJ heat shock protein family (Hsp40) member
C12 (DNAJC12) (Chromosome 6: 6666081- 6675111 bp) in Improved Horro chicken population.
The DNAJC12 gene plays a pivotal role in the negative regulation of neuron apoptotic process
(Fleming et al., 2017).

156
On top of TSHR, GTF2A1, AGTR1, and many other genes, the Beta-Carotene Dioxygenase 2
(BCDO2) (Chromosome24: 6130965 -6110301) gene is the only gene uniquely available in the
candidate signature of selection in Local Horro. This gene is known to express in the skin where
it encodes an enzyme that cleaves colorful carotenoids into colorless apocarotenoids, and
polymorphisms in the BCDO2 gene have well-known effects on skin pigmentation in birds
(Eriksson et al., 2008). To this end, it looks that the ongoing Improved Horro selection and
improvement operation is working against this specific gene as it is not found in the selection
signature regions of Improved Horro.
Unlike other populations, Jarso chicken populations have a fewer number of variants under strong
selection of signature. In addition to the common genes TSHR and GTF2A1, many other genes
are under strong selection signature. These include: Amyloid beta Precursor Protein (APP),
Ankyrin Repeat And KH Domain Containing 1 (ANKHD1), Glycerol Kinase 5 (GK5), Heat shock
factor protein 2 (HSF2), Steroid Receptor RNA Activator 1 (SRA1), tachykinin receptor 3
(TACR3), Transcription factor Dp-2 (TFDP2), and T-SNARE Domain Containing 1 (TSNARE1)
are also the genes under strong selection of signature in Jarso chicken populations.
Hugub chicken was also having the OVST gene together with TSHR and GTF2A1 genes. Protein
kinase C epsilon (PRKCE) (Chromosome 3: 26395277-26573746) gene is also another gene of
interest in Hugub chicken population. In humans, PRKCE is considered as a stress response gene
involved in cardiac tissue (Fleming et al., 2017) however its impact is less defined in chicken.
Considering the hot arid environment of the home habitat of the population the later function
makes much more sense to justify the findings of this study. Enrichment of go term functions

157
shows leucine-rich regions involved in Heparin binding in Hugub populations. According to
Munoz and Linhardt (2004), Heparin is a major anticoagulant with activity mediated primarily
through its interaction with antithrombin (AT).
Apart from, the TSHR (Chromosome 5: 40811286- 40858950 bp), and GTF2A1 (Chromosome 5:
40868271- 40894704) Arabo population also possess many other genes as candidate signatures of
selection. Ankyrin Repeat And KH Domain Containing 1 (ANKHD1), bone morphogenetic
protein receptor type 2 (BMPR2), Diaphanous-Related Formin 3 (DIAPH3), DLC1, echinoderm
microtubule-associated protein like 4 (EML4), Phosphodiesterase 1C (PDE1C), regulating
synaptic membrane exocytosis 1 (RIMS1), Steroid Receptor RNA Activator 1 (SRA1), and Tudor
domain-containing protein 3 (TDRD3) are also the annotated genes under strong signature of
selection in Arabo chicken populations. Functional annotation of signature of selection regions
also shows various functions like Caveola cellular component functions. Caveolae are spherical
invaginations of the plasma membrane and associated vesicles that are found at high surface
densities in most cells, endothelia included (Thomson, 2002). Caveolae are known to involve in
many cellular functions such as endocytosis, signal transduction, mechanotransduction,
potocytosis, and cholesterol trafficking.
5.4.2. Candidate of selection signals based on Fst method
Signal transducer and activator of transcription 5b (STAT5b), the gene responsible for bone
allocation and fecundity trait is found between Improved and Local Horro (Fu et al., 2016). Signal
transducer and activator of transcription 5b (STAT5b) gene is found candidate gene and it is

158
associated with body weight and reproductive traits of Jinghai Yellow chicken (Luo et al., 2018;
Zhou et al., 2005).
The only gene found in significant regions between these two populations is a gene called AGTR1
(Angiotensin II (Ang II)) which is an important regulator of cardiovascular function in adult
vertebrates and have roles in thermoregulation (Crossley et al., 2010). This gene is known to
heavily involve in Ascites in commercial broilers (Krishnamoorthy et al., 2014). The other gene
is roundabout guidance receptor 2 (ROBO2) (96895939- 97053385 bp) gene which belongs to the
immunoglobulin superfamily and plays functions associated in axon guidance and cell migration
and are involved in SLIT/ROBO signaling (Wang et al., 2014). The ROBO2 gene has a strong
effect on the antibody response to the NDV in chickens (Luo et al., 2013). The RALGAPA1
(36275772-36390043 bp) gene which is known to play a pivotal role in reproductive traits and
broodiness is also under strong selection in Improved Horro and Local Horro chicken populations
(Shen et al., 2012).
A gene called unconventional myosin-VI; MYO6 (80736607-80807004 bp) which serve in
intracellular movements are also found between the high confidence selection regions of Improved
Horro and Jarso chicken populations. Myosin 6 is a reverse-direction motor protein that moves
towards the minus-end of actin filaments. The gene of interest is Ankyrin 2 (ANK2) (57097275-
57432432 bp) which was reported by Fan et al. (2013) previously which Ankyrins play key roles
in activities such as cell motility, activation, proliferation, contact and the maintenance of
specialized membrane domains. Like the ROBO2 gene, the ROBO1 gene is known to have a
strong effect on the antibody response to the NDV in chicken (Luo et al., 2013). Another

159
interesting gene in these populations is Interleukin-15 (IL-15) are T-cell growth factors potentially
capable of enhancing cell-mediated immunity in vivo and plays a critical role in immune system
function (Lillehoj et al., 2001). It is related cytokines that stimulate the activity and proliferation
of T cells in mammals. Three functional genes Hippocalcin like 4 (HPCAL4; involved in the
calcium-dependent regulation of rhodopsin phosphorylation), TRITI, and MYCL (MYCL proto-
oncogene, bHLH transcription factor; implicated in lung cancer) which are reported in Horro and
Jarso chicken populations by Lawal et al. (2018) is not found in the candidate of selection region
between these populations which probably could be the variation in analysis method. The
functional annotation analysis shows that the genes that displayed evidence of positive selection
are mainly involved in protein transport and other biological processes. Integrin alpha-8/beta-1
(ITGA8) functions in the genesis of kidney and probably of other organs by regulating the
recruitment of mesenchymal cells into epithelial structures
(https://www.uniprot.org/uniprot/P26009).
On top of Syntaxin Binding Protein 6 (STXBP6), TBC1 Domain Family Member 30 (TBC1D30),
TBC1, Domain Family Member 7 (TBC1D7) genes, candidate Fst signals between IH and Hugub
population, also evidences the presence of stress-related genes, Hypocretin (orexin) neuropeptide
(HCRT) (Fleming et al., 2015). Syntaxin-binding protein 6 (STXBP6) in chromosome 5, the gene
responsible for bone allocation and fecundity trait is not found between Improved and Hugub
chicken populations (Fu et al., 2016). Chicken interleukin-21 (IL21) is costimulatory for T cells
and blocks maturation of dendritic cells. In mammals and chicken, interleukin-21 (IL-21) is an
immunomodulatory cytokine with pleiotropic effects on the proliferation, differentiation and
effector functions of T, B, NK and dendritic cells (Rothwell et al., 2012)Among many other genes,

160
Toll-like receptor 2 family member B (TLR2B) gene is under strong selection pressure in
Improved Horro and Hugub chicken populations. Toll-like receptors (TLRs) are a group of highly
conserved molecules that initiate innate immune responses to pathogens by recognizing structural
motifs (Kannaki et al., 2010). In response to pathogen-associated molecular patterns, TLRs induce
the production of reactive oxygen and nitrogen intermediates, inflammatory cytokines and up-
regulate the expression of co-stimulatory molecules, subsequently initiating adaptive immunity
(Ibid).
Among other genes, the Insulin-like Growth Factor 1 Receptor (IGF1R) and Insulin-like Growth
factor 2 mRNA-Binding Protein 3 (IGF2BP3) genes, which are necessary for formal growth
(Rubin et al., 2010; Stainton et al., 2015; Yang et al., 2014), is found between Improved Horro
and Arabo chicken populations. Between these populations, the myosin-binding protein C,
cardiac-type (MYBPC3) and GATA binding protein 3 (GATA3) genes are under strong pressure
of selection. MYBPC3 gene is known as an accessory protein of vertebrate striated muscle thick
filaments that modulate cardiac muscle contraction (Carrier et al., 2015). Haploinsufficiency for
the transcription factor GATA3 leads to hearing the loss in humans. It is expressed throughout the
auditory sensory epithelium (SE) (Alvarado, 2009; Alvarado et al., 2009). Integrin alpha-8/beta-1
(ITGA8) functions in the genesis of kidney and probably of other organs by regulating the
recruitment of mesenchymal cells into epithelial structures. Candidate Fst signals between IH and
Arabo population also evidences the presence of stress-related genes, Hypocretin (orexin)
neuropeptide (HCRT) (Fleming et al., 2017) in the candidate signature of the selection region. The
previously reported genes, TBC1 domain family member 7 (TBC1D7) and TBC1 domain family

161
member 30 (TBC1D30) genes which are associated with hypothermia and stress are found in this
population (Fleming et al., 2017).
5.5. Conclusions
Since most of the candidate genes identified in the present study are novel and have probably been
under recent selection, they should be of great interest for future research. Neural crest Hypothesis
Domestication (FGFR-I) and Gonadotrophin-releasing hormone I (GnRH-I) genes are not in the
candidates of signature of selection in Improved Horro and other indigenous chicken populations
of Ethiopia. Much of the positive selection signals here, is related to immune-defense functions
than to productivity and production. Future works should emphasize to map candidate genes
responsible for egg and meat production. Besides, chores in the on-going improved Horro program
should be based on genome-wide association studies and emphasize towards egg and weight
production traits. In other words, the phenotypic records for body weight and egg production
should be evaluated against the genomic regions of Improved Horo to exactly target genes for
further selection. Besides, using the current data it is also important to check if the regions under
the current selection pressure overlap to the Quantitative Trait Loci (QTLs) available on the online
animal QTL data base.

162
CHAPTER 6. SUMMARY, CONCLUSION AND RECOMMENDATIONS
6.1. Implications for indigenous chicken improvement
Characterization of farm animal genetic resources is a prerequisite for any improvement,
conservation and sustainable utilization of these resources (Al-Qamashoui et al., 2014). According
to Kristensen et al. (2015), genetic improvement of animals is dependent on the existence of
genetic variation existing between species, between breeds, within species and among animals
within breeds. The genetic diversity comprised in farm animal species and breed is an important
resource in livestock systems (Oldenbroek, 2007). However, as species and breeds are adapted to
certain environments through centuries of natural and artificial selection, it may be difficult to
restore genetic variation that may still be desired, but that has been lost by breed replacements in
certain regions or environments (Kristensen et al., 2015). These days, global climate change is
increasing the magnitude of environmental stressors, such as temperature, pathogens, and drought
that limit the survivability and sustainability of livestock production (Fleming et al., 2017). This
scenario has demanded the poultry industry to heavily depend upon robust animals that are able to
cope with multiple environmental stressors. In this regard, indigenous chickens are endowed with
high genetic variation and high local adaptation caliber which forms the basis of selective breeding
and genetic improvement strategies through prioritizing and making informed decisions (Desta,
2015; Lawal et al., 2018).
Besides, to meet the future food demand and ensure plane of family nutrition in low input poultry
systems, it is important to improve the productivity of indigenous chickens (Al-Qamashoui et al.,
2014). Chicken is a major protein source and intensively selected for economically important traits

163
by humans (Desta, 2015). However, for a multitude of facts within the different species used for
food production, only a few breeds are developed towards high-output breed fitting in high input
systems leaving aside enormous breeds from the food producing livestock systems and exposing
to high danger of extinction (Oldenbroek, 2007). Indigenous chicken is endowed with a multitude
of important traits with a high reputation for hardiness and resistance to diseases which needs to
be better characterized for better utilization and conservation (Ngeno et al., 2014). Years of natural
selection, under scavenging conditions, has made them robust and resistant to various diseases,
especially to those caused by bacteria, and protozoa and other internal and external parasites; they
have better survival than the commercial hybrid strains under village production conditions
(Besbes et al., n.d.). The village chicken is very alert and has long shanks to run away from
predators and multiple colors to serve as camouflage against aerial predators. Indigenous chickens
appear to have an inherent scavenging and nesting habit.
Although, purebred selection in indigenous chicken (IC) population require more time to improve
performance than crossbreeding and breed substitution, nevertheless, it can be tailored to fit the
needs of local farmers and the prevailing environmental conditions (Ngeno et al., 2015). Besbes
et al. (n.d.) also highlight the existence of a considerable scope for improving the performance of
local breeds by identifying alternative breeding goals and capitalize on the breeds’ specific
attributes. Chicken breeding programs should not solely focus on the importation of non-adapted
improved chicken and should pay attention to the improvement of IC through selective breeding,
as it is more rewarding for the low input and tropical systems than the former. For instance,
selection within Ethiopian IC population, called Horro has been implemented successfully in
Ethiopia and has resulted in better egg production, compared to unimproved village chicken

164
(Woldegiorgiss, 2015; Wondmeneh et al., 2016). Ethiopian Horro IC has increased egg production
by 123.5% (75 eggs) by week 45 and age at first egg reduced to 148 from 203 days by generation
five in five generations of selection for egg numbers.
To date, few and non-exhaustive studies have been carried out to characterize and unravel the
genomic potential of indigenous chicken in Ethiopia using the state of the art technologies.
Understanding the phenotypic and genomic diversity is a prerequisite for proper utilization and
improvement of indigenous chicken in Ethiopia. Understanding the functional basis of the genetic
variants that underlie these traits, however, remains a formidable endeavour particularly for
complex traits. Nonetheless, molecular phenotyping of an organism from sequenced data is doable
with the advances in bioinformatics analysis and unparalleled surveys of genome-wide genetic
variants (Khoo, 2017). The aim of this study was therefore to undertake genome characterization
of indigenous chicken in Ethiopia. The findings in this thesis provide knowledge on the genomic
diversity, and regions under positive selection pressure adapted to different agro-ecological
environments in different geographically distributed indigenous chicken in Ethiopia.
In chapter 1, we have tried to emphasize the pinning problems that justify this work and gives
backgrounds and objectives. The second chapter comprehensively revises basic concepts of
chicken phenotypic and genome diversity and the molecular methods to tap these variations. In
line with the previous studies (Alemayhu, 2003; Bekerie, 2015; Desta et al., 2013; Hassen et al.,
2009; Lawal et al., 2018; Mwacharo et al., 2013, 2007; Wragg et al., 2012), this review evidences
the high phenomic and genomic diversity of IC chicken in Ethiopia. Here has been built on high
diversity of IC chicken in terms of both phenotypic and molecular traits and their relationship

165
across physical factors to explore the variations in the physical features and the useful attributes
of different populations of indigenous chicken. The 3rd chapter highlights and discusses the
findings on the genomic variability of LEI0258 microsatellite locus and its implication on breed
improvement operations. The work discussed in this chapter is also the first of its kind in
addressing the LEI0258 diversity and signatures of selection in Improved Horro and indigenous
chicken populations of Ethiopia. High LEI0258 polymorphism is also revealed in indigenous
chicken populations of Ethiopia. In chapter 5, the SNP based characterization of IC chicken
genomic variants were illustrated. As evidenced in this study, Ethiopian IC are diverse which will
grant a greater advantage in developing sustainable breed improvement strategies through
selection. This could be exemplified by the fact that abought 21 million SNPs have been obtained
in IC populations of Ethiopia which out excels 3.6 to 5 million SNPs reported by Gheyas et al.
(2015). This genetic divergence could be due to limited gene flow, ecological variability, variation
in demographic history, route and time of introduction, and the populations might be descended
from different ancestral origins and they have been under different management histories (Desta
et al., 2014). The putative signatures of positive selection under strong selection pressure in
Improved Horro and indigenous chicken populations of Ethiopia where also mapped and discussed
in chapter 5. Here, since most of the candidate genes identified in the present study are novel and
have probably been under recent selection, they should be of great interest for future research.
Johnsson et al (2018) has identified the genes Trafficking Kinesin Protein 1 (TRAK1), Oxysterol
Binding Protein-Like 8 (OSBPL8), YEATS Domain Containing 4 (YEATS4), Centrosomal
Protein 55 (CEP55), and Phosphatidylinositol-5-phosphate 4-kinase type-2 beta (PIP4K2B) as
strong candidates for growth loci in the chicken using linkage mapping approach to map growth
traits in an advanced intercross of wild red jungle fowl and domestic white leghorn layer chickens.

166
Of which only the gene, CEP55, has been found in our list of genes as non-synonymous deleterious
variants across 27 populations. Our informed analysis of a previously reported gene, Neural crest
Hypothesis Domestication (FGFR-I) and Gonadotrophin-releasing hormone I (GnRH-I) doesn’t
ascertain its presence in the candidates of signature of selection in Improved Horro and other
indigenous chicken populations of Ethiopia. In A similar fasion, the vasoactive intestinal poly-
peptide receptor-1 (VIPR-1) and dopamine D2 receptor (DRD2) genes reported by Xu et al (2011)
as having an association to chicken egg number at 300 days of age is reported.
6.2. Conclusions and recommendation
In general, genomic regions have ascertained high diversity and selection regions under strong
selection pressure in indigenous chicken populations of Ethiopia. Besides, unlike previous
molecular findings, this study has clustered the Ethiopian IC gene pool into 4. Due to the localized
preference of chicken genotype among the tribal community in Ethiopia, low genetic diversity
within the population and high genetic variation between populations have been confirmed.
Chicken populations show geographic structuring. Based on the findings of this study the
following recommendations worth emphasis.
• Future works should emphasize to map candidate genes responsible for egg and meat
production.
• Chicken improvement programs ahead should consider the 4 gene pools revealed in this study.
• Various characterization studies have been done here and there on a piecemeal basis. Hence,
concerted efforts should gear towards Genetic improvement programs through selection.

167
• Using the current data it is also important to check if the regions under the current selection
pressure overlap to the Quantitative Trait Loci (QTLs) available on the online animal QTL
data base.
• Sequence data management of this finding was based on Gal gal 5.0 version and thus future
works should also consider re-analysis based on the upcoming version Gal gal 6.0 which is
not yet publicized for use.

168
REFERENCES
Akey, J.M., 2002. Interrogating a High-Density SNP Map for Signatures of Natural Selection. Genome
Res. 12, 1805–1814. https://doi.org/10.1101/gr.631202
Alderborn, A., 2000. Determination of Single-Nucleotide Polymorphisms by Real-time Pyrophosphate
DNA Sequencing. Genome Res. 10, 1249–1258. https://doi.org/10.1101/gr.10.8.1249
Alemayhu, T.D., 2003. Phenotypic and genetic characterization of local chicken ecotypes in Ethiopia, 1.
Aufl. ed, Schriften zur Internationalen Agrarentwicklung. Köster, Berlin.
Alexander, D.H., Novembre, J., Lange, K., 2009. Fast model-based estimation of ancestry in unrelated
individuals. Genome Res. 19, 1655–1664. https://doi.org/10.1101/gr.094052.109
Allendorf, F.W., Hohenlohe, P.A., Luikart, G., 2010. Genomics and the future of conservation genetics.
Nat. Rev. Genet. 11, 697–709. https://doi.org/10.1038/nrg2844
Allendorf, F.W., Luikart, G., 2007. Conservation and the genetics of populations. Blackwell Pub, Malden,
MA.
Al-Nasser, A., Al-Khalaifa, H., Al-Saffar, A., Khalil, F., Albahouh, M., Ragheb, G., Al-Haddad, A.,
Mashaly, M., 2007. Overview of chicken taxonomy and domestication. Worlds Poult. Sci. J. 63,
285. https://doi.org/10.1017/S004393390700147X
Al-Qamashoui, B., Schlecht, E., Simianer, H., Weigend, S., 2014. Towards conservation of Omani local
chicken: management, performance and genetic diversity, 1. Aufl. ed. Cuvillier, Göttingen.
Alvarado, D., 2009. Genomic Approaches for Pathway Identification in Regenerating Sensory Epithelia of
the Inner Ear. https://doi.org/10.7936/k7dr2shj
Alvarado, D.M., Veile, R., Speck, J., Warchol, M., Lovett, M., 2009. Downstream targets of GATA3 in the
vestibular sensory organs of the inner ear. Dev. Dyn. 238, 3093–3102.
https://doi.org/10.1002/dvdy.22149
Armant, M.A., 2002. Toll-like receptors: a family of pattern-recognition receptors in mammals 6.
Aslam, M.L., Bastiaansen, J.W., Elferink, M.G., Megens, H.-J., Crooijmans, R.P., Blomberg, L., Fleischer,
R.C., Van Tassell, C.P., Sonstegard, T.S., Schroeder, S.G., Groenen, M.A., Long, J.A., 2012.
Whole genome SNP discovery and analysis of genetic diversity in Turkey (Meleagris gallopavo).
BMC Genomics 13, 391. https://doi.org/10.1186/1471-2164-13-391
Backeljau, T., De Bruyn, L., De Wolf, H., Jordaens, K., Van Dongen, S., Winnepennincks, B., 1996.
Multiple UPGMA and Neighbor-joining Trees and the Performance of Some Computer Packages.
Mol. Biol. Evol. 13, 309–313. https://doi.org/10.1093/oxfordjournals.molbev.a025590

169
Baelmans, R., Parmentier, H.K., Nieuwland, M.G.B., Dorny, P., Demey, F., 2005. Serological Screening
for MHC (B)-Polymorphism in Indigenous Chickens. Trop. Anim. Health Prod. 37, 93–102.
https://doi.org/10.1023/B:TROP.0000048511.60096.7a
Banat, G.R., Tkalcic, S., Dzielawa, J.A., Jackwood, M.W., Saggese, M.D., Yates, L., Kopulos, R., Briles,
W.E., Collisson, E.W., 2013. Association of the chicken MHC B haplotypes with resistance to
avian coronavirus. Dev. Comp. Immunol. 39, 430–437. https://doi.org/10.1016/j.dci.2012.10.006
Barker, J.S.F., 2001. Conservation and management of genetic diversity: A domestic animal perspective 8.
Baumung, R., Simianer, H., Hoffmann, I., 2004. Genetic diversity studies in farm animals - a survey. J.
Anim. Breed. Genet. 121, 361–373. https://doi.org/10.1111/j.1439-0388.2004.00479.x
Baxevanis, A., Ouellette, B.F.F., 2001. Bioinformatics: A Practical Guide to the Analysis of Genes and
Proteins, Second Edition 495.
Bekerie, E.M., 2015. A dissertation submitted to the College of Veterinary Medicine and Agriculture of
Addis Ababa University in partial fulfillment of the requirements for the degree of Doctor of
Philosophy in Animal Production 127.
Berlin, S., Ellegren, H., 2004. Chicken W: A genetically uniform chromosome in a highly variable genome.
Proc. Natl. Acad. Sci. 101, 15967–15969. https://doi.org/10.1073/pnas.0405126101
Berthouly, C., Bed’Hom, B., Tixier-Boichard, M., Chen, C.F., Lee, Y.P., Laloë, D., Legros, H., Verrier, E.,
Rognon, X., 2008. Using molecular markers and multivariate methods to study the genetic diversity
of local European and Asian chicken breeds. Anim. Genet. 39, 121–129.
https://doi.org/10.1111/j.1365-2052.2008.01703.x
Besbes, B., Tixier-Boichard, M., Hoffmann, I., Jain, G.L., n.d. Future trends for poultry genetic resources
25.
Beutler, B., 2004. Innate immunity: an overview. Mol. Immunol. 40, 845–859.
https://doi.org/10.1016/j.molimm.2003.10.005
Bird, C., Karl, S., Mouse, P., Toonen, R., 2011. Detecting and measuring genetic differentiation, in:
Schubart, C. (Ed.), Phylogeography and Population Genetics in Crustacea. CRC Press, pp. 31–55.
https://doi.org/10.1201/b11113-4
Blas, J., Perez-Rodriguez, L., Bortolotti, G.R., Vinuela, J., Marchant, T.A., 2006. Testosterone increases
the bioavailability of carotenoids: Insights into the honesty of sexual signaling. Proc. Natl. Acad.
Sci. 103, 18633–18637. https://doi.org/10.1073/pnas.0609189103
Blasius, A.L., Beutler, B., 2010. Intracellular Toll-like Receptors. Immunity 32, 305–315.
https://doi.org/10.1016/j.immuni.2010.03.012
Boettcher, P.J., Tixier-Boichard, M., Toro, M.A., Simianer, H., Eding, H., Gandini, G., Joost, S., Garcia,
D., Colli, L., Ajmone-Marsan, P., and the GLOBALDIV Consortium, 2010. Objectives, criteria,

170
and methods for using molecular genetic data in priority setting for the conservation of animal
genetic resources. Anim. Genet. 41, 64–77. https://doi.org/10.1111/j.1365-2052.2010.02050.x
Boichard, D., Guillaume, F., Baur, A., Croiseau, P., Rossignol, M.N., Boscher, M.Y., Druet, T., Genestout,
L., Colleau, J.J., Journaux, L., Ducrocq, V., Fritz, S., 2012. Genomic selection in French dairy
cattle. Anim. Prod. Sci. 52, 115. https://doi.org/10.1071/AN11119
Briles, W., Stone, H., Cole, R., 1977. Marek’s disease: effects of B histocompatibility alloalleles in resistant
and susceptible chicken lines. Science 195, 193–195. https://doi.org/10.1126/science.831269
Brinkman, F.S.L., Leipe, D.D., 2002. Phylogenetic Analysis, in Bioinformatics. Wiley-Blackwell, pp. 323–
358. https://doi.org/10.1002/0471223921.ch14
Bruford, M.W., Bradley, D.G., Luikart, G., 2003. DNA markers reveal the complexity of livestock
domestication. Nat. Rev. Genet. 4, 900–910. https://doi.org/10.1038/nrg1203
Bumstead, N., 1998. Genomic mapping of resistance to Marek’s disease. Avian Pathol. 27, S78–S81.
https://doi.org/10.1080/03079459808419296
Burks, J.R., 2011. Sequence Analysis of the Angiotensin II Type 1 Receptor (AGTR1) Gene for Mutations
Contributing to Pulmonary Hypertension in the Chicken (Gallus gallus) 12, 12.
Burt, D.W., 2007. Emergence of the Chicken as a Model Organism: Implications for Agriculture and
Biology. Poult. Sci. 86, 1460–1471. https://doi.org/10.1093/ps/86.7.1460
Burt, D.W., 2004. The chicken genome and the developmental biologist. Mech. Dev. 121, 1129–1135.
https://doi.org/10.1016/j.mod.2004.04.020
Cadzow, M., Boocock, J., Nguyen, H.T., Wilcox, P., Merriman, T.R., Black, M.A., 2014. A bioinformatics
workflow for detecting signatures of selection in genomic data. Front. Genet. 5.
https://doi.org/10.3389/fgene.2014.00293
Cao, J., 2014. The functional role of long non-coding RNAs and epigenetics. Biol. Proced. Online 16, 11.
https://doi.org/10.1186/1480-9222-16-11
Carrier, L., Mearini, G., Stathopoulou, K., Cuello, F., 2015. Cardiac myosin-binding protein C (MYBPC3)
in cardiac pathophysiology. Gene 573, 188–197. https://doi.org/10.1016/j.gene.2015.09.008
Castaneda, M.P., Hirschler, E.M., Sams, A.R., 2005. Skin pigmentation evaluation in broilers fed natural
and synthetic pigments. Poult. Sci. 84, 143–147. https://doi.org/10.1093/ps/84.1.143
Chazara, O., Chang, C.-S., Bruneau, N., Benabdeljelil, K., Fotsa, J.-C., Kayang, B.B., Loukou, N.E., Osei-
Amponsah, R., Yapi-Gnaore, V., Youssao, I.A.K., Chen, C.-F., Pinard-van der Laan, M.-H., Tixier-
Boichard, M., Bed’Hom, B., 2013. Diversity and evolution of the highly polymorphic tandem
repeat LEI0258 in the chicken MHC-B region. Immunogenetics 65, 447–459.
https://doi.org/10.1007/s00251-013-0697-6

171
Chazara, O., Juul-Madsen, H., Chang, C.-S., Tixier-Boichard, M., Bed’hom, B., 2011. Correlation in
chicken between the marker LEI0258 alleles and Major Histocompatibility Complex sequences.
BMC Proc. 5, S29. https://doi.org/10.1186/1753-6561-5-S4-S29
Chen, F., Pan, L., Chao, W., Dai, Y., Yu, W., 2012. Character of chicken polymorphic major
histocompatibility complex class II alleles of 3 Chinese local breeds. Poult. Sci. 91, 1097–1104.
https://doi.org/10.3382/ps.2011-02007
Choi, Y., Chan, A.P., 2015. PROVEAN web server: a tool to predict the functional effect of amino acid
substitutions and indels. Bioinformatics 31, 2745–2747.
https://doi.org/10.1093/bioinformatics/btv195
Chung, L., Farber, H.W., Benza, R., Miller, D.P., Parsons, L., Hassoun, P.M., McGoon, M., Nicolls, M.R.,
Zamanian, R.T., 2014. Unique Predictors of Mortality in Patients With Pulmonary Arterial
Hypertension Associated With Systemic Sclerosis in the REVEAL Registry. Chest 146, 1494–
1504. https://doi.org/10.1378/chest.13-3014
Cicia, G., D’Ercole, E., Marino, D., 2003. Costs and benefits of preserving farm animal genetic resources
from extinction: CVM and Bio-economic model for valuing a conservation program for the Italian
Pentro horse. Ecol. Econ. 45, 445–459. https://doi.org/10.1016/S0921-8009 (03)00096-X
Cogburn, L.A., Porter, T.E., Duclos, M.J., Simon, J., Burgess, S.C., Zhu, J.J., Cheng, H.H., Dodgson, J.B.,
Burnside, J., 2007. Functional Genomics of the Chicken--A Model Organism. Poult. Sci. 86, 2059–
2094. https://doi.org/10.1093/ps/86.10.2059
Cohen, P., 2014. The TLR and IL-1 signalling network at a glance. J. Cell Sci. 127, 2383–2390.
https://doi.org/10.1242/jcs.149831
Cordeiro, C.M.M., Hincke, M.T., 2016. Quantitative proteomics analysis of eggshell membrane proteins
during chick embryonic development. J. Proteomics 130, 11–25.
https://doi.org/10.1016/j.jprot.2015.08.014
Crossley, D.A., Altimiras, J., 2012. Effect of selection for commercially productive traits on the plasticity
of cardiovascular regulation in chicken breeds during embryonic development. Poult. Sci. 91,
2628–2636. https://doi.org/10.3382/ps.2012-02344
Crossley, D.A., Jonker, S.S., Hicks, J.W., Thornburg, K.L., 2010. Maturation of the angiotensin II
cardiovascular response in the embryonic White Leghorn chicken (Gallus gallus). J. Comp.
Physiol. B 180, 1057–1065. https://doi.org/10.1007/s00360-010-0473-y
Curie-Cohen, M., 1981. Estimates of inbreeding in a natural population: a comparison of sampling
properties 20.

172
Dahloum, L., Moula, N., Halbouche, M., Mignon-Grasteau, S., 2016. Phenotypic characterization of the
indigenous chickens <i>(Gallus gallus)</i> in the northwest of Algeria. Arch. Anim.
Breed. 59, 79–90. https://doi.org/10.5194/aab-59-79-2016
Dana, N., 2011. Breeding programs for indigenous chicken in Ethiopia: analysis of diversity in production
systems and chicken populations. Wageningen University, Wageningen.
Dana, N., Dessie, T., van der Waaij, L.H., van Arendonk, J.A.M., 2010. Morphological features of
indigenous chicken populations of Ethiopia. Anim. Genet. Resour. Génétiques Anim. Genéticos
Anim. 46, 11–23. https://doi.org/10.1017/S2078633610000652
Danecek, P., Auton, A., Abecasis, G., Albers, C.A., Banks, E., DePristo, M.A., Handsaker, R.E., Lunter,
G., Marth, G.T., Sherry, S.T., McVean, G., Durbin, R., 1000 Genomes Project Analysis Group,
2011. The variant call format and VCFtools. Bioinformatics 27, 2156–2158.
https://doi.org/10.1093/bioinformatics/btr330
Davydov, E.V., Goode, D.L., Sirota, M., Cooper, G.M., Sidow, A., Batzoglou, S., 2010. Identifying a High
Fraction of the Human Genome to be under Selective Constraint Using GERP++. PLoS Comput.
Biol. 6, e1001025. https://doi.org/10.1371/journal.pcbi.1001025
Desalew, T., Harpal, S., Ashenafi, M.W.E., Tadelle, D., 2013. Study on productive performances and egg
quality traits of exotic chickens under village production system in East Shewa, Ethiopia. Afr. J.
Agric. Res. 8, 1123–1128. https://doi.org/10.5897/AJAR2013.6987
Dessie, T., 2011. Why chicken research for development? 4.
Dessie, T., Esatu, W., Waaij, L.V., Zegeye, F., Gizaw, S., Mwai, O., van Arendonk, J., 2013. Village
chicken production in the central and western highlands of Ethiopia: Characteristics and strategies
for improvement 52.
Dessie, T., Taye, T., Dana, N., Ayalew, W., Hanotte, O., 2011. Current state of knowledge on phenotypic
characteristics of indigenous chickens in the tropics. Worlds Poult. Sci. J. 67, 507–516.
https://doi.org/10.1017/S0043933911000559
Desta, T.T., 2015. Phenomic and genomic landscape of Ethiopian village chickens (Ph.D.). University of
Nottingham.
Desta, T.T., Dessie, T., Bettridge, J., Lynch, S.E., Melese, K., Collins, M., Christley, R.M., Wigley, P.,
Kaiser, P., Terfa, Z., Mwacharo, J.M., Hanotte, O., 2013. Signature of artificial selection and
ecological landscape on morphological structures of Ethiopian village chickens. Anim. Genet.
Resour. Génétiques Anim. Genéticos Anim. 52, 17–29.
https://doi.org/10.1017/S2078633613000064

173
Downing, T., Lynn, D.J., Connell, S., Lloyd, A.T., Bhuiyan, A.F.H., Silva, P., Naqvi, A.N., Sanfo, R., Sow,
R.-S., Podisi, B., Bradley, D.G., 2009. Contrasting evolution of diversity at two disease-associated
chicken genes 13.
Duim, B., Ang, C.W., van Belkum, A., Rigter, A., van Leeuwen, N.W.J., Endtz, H.P., Wagenaar, J.A.,
2000. Amplified Fragment Length Polymorphism Analysis of Campylobacter jejuni Strains
Isolated from Chickens and from Patients with Gastroenteritis or Guillain-Barre or Miller Fisher
Syndrome. Appl. Environ. Microbiol. 66, 3917–3923. https://doi.org/10.1128/AEM.66.9.3917-
3923.2000
Eggen, A., 2012. The development and application of genomic selection as a new breeding paradigm. Anim.
Front. 2, 10–15. https://doi.org/10.2527/af.2011-0027
Elferink, M.G., Megens, H.-J., Vereijken, A., Hu, X., Crooijmans, R.P.M.A., Groenen, M.A.M., 2012.
Signatures of Selection in the Genomes of Commercial and Non-Commercial Chicken Breeds.
PLoS ONE 7, e32720. https://doi.org/10.1371/journal.pone.0032720
Eriksson, J., Larson, G., Gunnarsson, U., Bed’hom, B., Tixier-Boichard, M., Strömstedt, L., Wright, D.,
Jungerius, A., Vereijken, A., Randi, E., Jensen, P., Andersson, L., 2008. Identification of the
Yellow Skin Gene Reveals a Hybrid Origin of the Domestic Chicken. PLoS Genet. 4, e1000010.
https://doi.org/10.1371/journal.pgen.1000010
Evanno, G., Regnaut, S., Goudet, J., 2005. Detecting the number of clusters of individuals using the
software structure: a simulation study. Mol. Ecol. 14, 2611–2620. https://doi.org/10.1111/j.1365-
294X.2005.02553.x
Excoffier, L., Smouse, P.E., 1992. Analysis of Molecular Variance Inferred From Metric Distances Among
DNA Haplotypes: Application to Human Mitochondrial DNA Restriction Data 13.
Fan, W.-L., Ng, C.S., Chen, C.-F., Lu, M.-Y.J., Chen, Y.-H., Liu, C.-J., Wu, S.-M., Chen, C.-K., Chen, J.-
J., Mao, C.-T., Lai, Y.-T., Lo, W.-S., Chang, W.-H., Li, W.-H., 2013. Genome-Wide Patterns of
Genetic Variation in Two Domestic Chickens. Genome Biol. Evol. 5, 1376–1392.
https://doi.org/10.1093/gbe/evt097
FAO (Ed.), 2010. Breeding strategies for sustainable management of animal genetic resources, FAO animal
production and health guidelines. Food and Agriculture Organization of the United Nations, Rome.
FAO (Ed.), 2007. The state of the world’s animal genetic resources for food and agriculture. Rome.
FAO. 2017. The future of food and agriculture – Trends and challenges. Rome.
Fathi, M.M., Al-Homidan, I., Abou-Emera, O.K., Al-Moshawah, A., 2017. Characterisation of Saudi native
chicken breeds: a case study of morphological and productive traits. Worlds Poult. Sci. J. 73, 916–
927. https://doi.org/10.1017/S0043933917000563

174
Fathi, M.M., Galal, A., El-Safty, S., Mahrous, M., 2013. Naked neck and frizzle genes for improving
chickens raised under high ambient temperature: I. Growth performance and egg production.
Worlds Poult. Sci. J. 69, 813–832. https://doi.org/10.1017/S0043933913000834
Fleming, D.S., Koltes, J.E., Fritz-Waters, E.R., Reecy, J.M., Lamont, S.J., 2015. SNP Discovery and
Genomic Architecture of Highly Inbred Leghorn and Fayoumi Chicken Breeds Using Whole
Genome Resequencing 3.
Fleming, D.S., Weigend, S., Simianer, H., Weigend, A., Rothschild, M., Schmidt, C., Ashwell, C., Persia,
M., Reecy, J., Lamont, S.J., 2017. Genomic Comparison of Indigenous African and Northern
European Chickens Reveals Putative Mechanisms of Stress Tolerance Related to Environmental
Selection Pressure. G3amp58 GenesGenomesGenetics 7, 1525–1537.
https://doi.org/10.1534/g3.117.041228
Frías-Lasserre, D., Villagra, C.A., 2017. The Importance of ncRNAs as Epigenetic Mechanisms in
Phenotypic Variation and Organic Evolution. Front. Microbiol. 8.
https://doi.org/10.3389/fmicb.2017.02483
Fu, W., Lee, W.R., Abasht, B., 2016. Detection of genomic signatures of recent selection in commercial
broiler chickens. BMC Genet. 17. https://doi.org/10.1186/s12863-016-0430-1
Fulton, J.E., 2012. Genomic selection for poultry breeding1. Anim. Front. 2, 30–36.
https://doi.org/10.2527/af.2011-0028
Fulton, J.E., 2009. USDA animal genomics program: the view from the chicken coop. BMC Genomics 10,
S1. https://doi.org/10.1186/1471-2164-10-S2-S1
Fulton, J.E., 2008. Molecular genetics in a modern poultry breeding organization. Worlds Poult. Sci. J. 64,
171–176. https://doi.org/10.1017/S0043933907001778
Fulton, J.E., Arango, J., Ali, R.A., Bohorquez, E.B., Lund, A.R., Ashwell, C.M., Settar, P., O’Sullivan,
N.P., Koci, M.D., 2014. Genetic Variation within the Mx Gene of Commercially Selected Chicken
Lines Reveals Multiple Haplotypes, Recombination and a Protein under Selection Pressure. PLoS
ONE 9, e108054. https://doi.org/10.1371/journal.pone.0108054
Fulton, J.E., Juul-Madsen, H.R., Ashwell, C.M., McCarron, A.M., Arthur, J.A., O’Sullivan, N.P., Taylor,
R.L., 2006. Molecular genotype identification of the Gallus gallus major histocompatibility
complex. Immunogenetics 58, 407–421. https://doi.org/10.1007/s00251-006-0119-0
Fulton, J. E., Lund, A.R., McCarron, A.M., Pinegar, K.N., Korver, D.R., Classen, H.L., Aggrey, S.,
Utterbach, C., Anthony, N.B., Berres, M.E., 2016. MHC variability in heritage breeds of chickens.
Poult. Sci. 95, 393–399. https://doi.org/10.3382/ps/pev363
Fulton, Janet E., McCarron, A.M., Lund, A.R., Pinegar, K.N., Wolc, A., Chazara, O., Bed’Hom, B., Berres,
M., Miller, M.M., 2016. A high-density SNP panel reveals extensive diversity, frequent

175
recombination and multiple recombination hotspots within the chicken major histocompatibility
complex B region between BG2 and CD1A1. Genet. Sel. Evol. 48. https://doi.org/10.1186/s12711-
015-0181-x
Gao, X.G., Pu, H.S., He, C.B., Bao, X.B., Liu, W.D., 2015. Genetic variations in the UTR of genes related
to molting in Eriocheir sinensis. Genet. Mol. Res. 14, 12472–12478.
https://doi.org/10.4238/2015.October.16.14
Gardner, P.P., Fasold, M., Burge, S.W., Ninova, M., Hertel, J., Kehr, S., Steeves, T.E., Griffiths-Jones, S.,
Stadler, P.F., 2015. Conservation and Losses of Non-Coding RNAs in Avian Genomes. PLOS ONE
10, e0121797. https://doi.org/10.1371/journal.pone.0121797
Gheyas, A.A., Boschiero, C., Eory, L., Ralph, H., Kuo, R., Woolliams, J.A., Burt, D.W., 2015. Functional
classification of 15 million SNPs detected from diverse chicken populations. DNA Res. 22, 205–
217. https://doi.org/10.1093/dnares/dsv005
Gholizadeh, M., Mianji, G.R., 2007. Use of Microsatellite Markers in Poultry Research 9.
Gibson, J., Morton, N.E., Collins, A., 2006. Extended tracts of homozygosity in outbred human populations.
Hum. Mol. Genet. 15, 789–795. https://doi.org/10.1093/hmg/ddi493
Gifford-Gonzalez, D., Hanotte, O., 2011. Domesticating Animals in Africa: Implications of Genetic and
Archaeological Findings. J. World Prehistory 24, 1–23. https://doi.org/10.1007/s10963-010-9042-2
Gouveia, J.J. de S., Silva, M.V.G.B. da, Paiva, S.R., Oliveira, S.M.P. de, 2014. Identification of selection
signatures in livestock species. Genet. Mol. Biol. 37, 330–342. https://doi.org/10.1590/S1415-
47572014000300004
Government of Ethiopia, 2011, Ethiopia’s Climate-Resilient Green Economy, Green economy strategy.
Addis Ababa, Ethiopia.
Groenen, M.A., Megens, H.-J., Zare, Y., Warren, W.C., Hillier, L.W., Crooijmans, R.P., Vereijken, A.,
Okimoto, R., Muir, W.M., Cheng, H.H., 2011. The development and characterization of a 60K SNP
chip for chicken. BMC Genomics 12. https://doi.org/10.1186/1471-2164-12-274
Gu, Z., 2004. The single nucleotide polymorphisms of the chicken myostatin gene are associated with
skeletal muscle and adipose growth. Sci. China Ser. C 47, 25. https://doi.org/10.1360/02yc0201
Guo, X., Fang, Q., Ma, C., Zhou, B., Wan, Y., Jiang, R., 2016. Whole-genome resequencing of
Xishuangbanna fighting chicken to identify signatures of selection. Genet. Sel. Evol. 48.
https://doi.org/10.1186/s12711-016-0239-4
Gupta, A., Singh, M.K., Shukla, P.K., Shukla, S.K., Sharma, D., n.d. Polymorphism at LEI0258
microsatellite locus in guinea fowl and chicken breeds 4.
Habte, M., Ameha, N., Demeke, S., 2013. Production performance of local and exotic breeds of chicken at
rural household level in Nole Kabba Woreda, Western Wollega, Ethiopia 8.

176
Halima, H., Neser, F.W.C., Van Marle-Koster, E., De Kock, A., 2007a. Village-based indigenous chicken
production system in north-west Ethiopia. Trop. Anim. Health Prod. 39, 189–197.
https://doi.org/10.1007/s11250-007-9004-6
Han, B., Lian, L., Qu, L., Zheng, J., Yang, N., 2013. Abundant polymorphisms at the microsatellite locus
LEI0258 in indigenous chickens. Poult. Sci. 92, 3113–3119. https://doi.org/10.3382/ps.2013-
03416
Hanotte, O., Dessie, T., Kemp, S., 2010. Time to Tap Africa’s Livestock Genomes. Science 328, 1640–
1641. https://doi.org/10.1126/science.1186254
Hassen, H., Neser, F.W.C., de Kock, A., van Marle-Köster, E., 2009. Study on the genetic diversity of
native chickens in northwest Ethiopia using microsatellite markers 7.
Hayes, B.J., 2003. Novel Multilocus Measure of Linkage Disequilibrium to Estimate Past Effective
Population Size. Genome Res. 13, 635–643. https://doi.org/10.1101/gr.387103
Hedrick, P.W., Kalinowski, S.T., 2000. Inbreeding Depression in Conservation Biology. Annu. Rev. Ecol.
Syst. 31, 139–162. https://doi.org/10.1146/annurev.ecolsys.31.1.139
Hillel, J., Groenen, M.A.M., Tixier-Boichard, M., Korol, A.B., David, L., Kirzhner, V.M., Burke, T., Barre-
Dirie, A., Crooijmans, R.P.M.A., Elo, K., Feldman, M.W., Freidlin, P.J., Maki-Tanila, A.,
Oortwijn, M., Thomson, P., Vignal, A., Wimmers, K., Weigend, S., 2003. Biodiversity of 52
chicken populations assessed by microsatellite typing of DNA pools. Genet. Sel. Evol. 35, 533–
557. https://doi.org/10.1051/gse:2003038
Hoque, M.R., Lee, S.H., Jung, K.C., Kang, B.S., Park, M.N., Lim, H.K., Choi, K.D., Lee, J.H., 2011.
Discrimination of Korean Native Chicken Populations Using SNPs from mtDNA and MHC
Polymorphisms. Asian-Australas. J. Anim. Sci. 24, 1637–1643.
https://doi.org/10.5713/ajas.2011.11144
Hosomichi, K., Miller, M.M., Goto, R.M., Wang, Y., Suzuki, S., Kulski, J.K., Nishibori, M., Inoko, H.,
Hanzawa, K., 2009. Contribution of Mutation, Recombination, and Gene Conversion to Chicken
Mhc-B Haplotype Diversity, 1, 2 18.
Hosomichi, K., Miller, M.M., Goto, R.M., Wang, Y., Suzuki, S., Kulski, J.K., Nishibori, M., Inoko, H.,
Hanzawa, K., Shiina, T., 2010. Contribution of mutation, recombination, and gene conversion to
chicken Mhc-B haplotype diversity. J. Immunol. 184, 5415–5415.
https://doi.org/10.4049/jimmunol.1090026
https://www.sheffield.ac.uk/nbaf-s/protocols_list.
Huang, D.W., Sherman, B.T., Lempicki, R.A., 2008. Systematic and integrative analysis of large gene lists
using DAVID bioinformatics resources. Nat. Protoc. 4, 44.

177
Izadi, F., Ritland, C., Cheng, K.M., 2011. Genetic diversity of the major histocompatibility complex region
in commercial and noncommercial chicken flocks using the LEI0258 microsatellite marker. Poult.
Sci. 90, 2711–2717. https://doi.org/10.3382/ps.2011-01721
Jacobs, G.S., Sluckin, T.J., Kivisild, T., 2016. Refining the Use of Linkage Disequilibrium as a Robust
Signature of Selective Sweeps. Genetics 203, 1807–1825.
https://doi.org/10.1534/genetics.115.185900
Jalving, R., vant Slot, R., van Oost, B.A., 2004. Chicken single nucleotide polymorphism identification and
selection for genetic mapping. Poult. Sci. 83, 1925–1931. https://doi.org/10.1093/ps/83.12.1925
Jarosinski, K.W., Hunt, H.D., Osterrieder, N., 2010. Down-regulation of MHC class I by the Marek’s
disease virus (MDV) UL49.5 gene product mildly affects virulence in a haplotype-specific fashion.
Virology 405, 457–463. https://doi.org/10.1016/j.virol.2010.06.041
Jensen, P., 2005. Genomics: The chicken genome sequence. Heredity 94, 567–568.
https://doi.org/10.1038/sj.hdy.6800665
Jin, S., Park, H.B., Seo, D.W., Cahyadi, M., Choi, N.R., Heo, K.N., Jo, C., Lee, J.H., 2014. Association of
MC1R genotypes with shank color traits in Korean native chicken. Livest. Sci. 170, 1–7.
https://doi.org/10.1016/j.livsci.2014.10.001
Johansson, A.M., Nelson, R.M., 2015. Characterization of genetic diversity and gene mapping in two
Swedish local chicken breeds. Front. Genet. 6. https://doi.org/10.3389/fgene.2015.00044
Johnsson, M., Henriksen, R., Höglund, A., Fogelholm, J., Jensen, P., Wright, D., 2018. Genetical genomics
of growth in a chicken model. BMC Genomics 19. https://doi.org/10.1186/s12864-018-4441-3
Kanginakudru, S., Metta, M., Jakati, R., Nagaraju, J., 2008. Genetic evidence from Indian red jungle fowl
corroborates multiple domestication of modern day chicken. BMC Evol. Biol. 8, 174.
https://doi.org/10.1186/1471-2148-8-174
Kannak, T.R., Reddy, M.R., Raja ravindra, K.S., Chatterjee, R.N., 2017. Genetic diversity analysis of the
major histocompatibility complex (MHC) region in Indian native chicken breeds and pureline
chickensusing the LEI0258 microsatellite marker. Indian J. Anim. Res.
https://doi.org/10.18805/ijar.v0iOF.6989
Kannaki, T.R., Reddy, M.R., Shanmugam, M., Verma, P.C., Sharma, R.P., 2010. Chicken toll-like receptors
and their role in immunity. Worlds Poult. Sci. J. 66, 727–738.
https://doi.org/10.1017/S0043933910000693
Keambou, T.C., Hako, B.A., Ommeh, S., Bembide, C., Ngono, E.P., Manjeli, Y., Wamonje, F., . N.,
Wanjala, B., Wamalwa, M., Cho, C.Y., Skilton, R.A., Djikeng, A., 2014. Genetic Diversity of the
Cameroon Indigenous Chicken Ecotypes. Int. J. Poult. Sci. 13, 279–291.
https://doi.org/10.3923/ijps.2014.279.291

178
Khanyile, K.S., 2015. Genome-wide single nucleotides polymorphism (SNP) data 103.
Khoo, C.-K., 2017. Chicken genome variations and selection : from sequences to consequences (Ph.D.).
University of Edinburgh.
Koehler-Rollefson, I., 2014. Access and Benefit-sharing of Animal Genetic Resources 50.
Kranis, A., Gheyas, A.A., Boschiero, C., Turner, F., Yu, L., Smith, S., Talbot, R., Pirani, A., Brew, F.,
Kaiser, P., Hocking, P.M., Fife, M., Salmon, N., Fulton, J., Strom, T.M., Haberer, G., Weigend, S.,
Preisinger, R., Gholami, M., Qanbari, S., Simianer, H., Watson, K.A., Woolliams, J.A., Burt, D.W.,
2013. Development of a high density 600K SNP genotyping array for chicken. BMC Genomics 14,
59. https://doi.org/10.1186/1471-2164-14-59
Krishnamoorthy, S., Smith, C.D., Al-Rubaye, A.A., Erf, G.F., Wideman, R.F., Anthony, N.B., Rhoads,
D.D., 2014. A quantitative trait locus for ascites on chromosome 9 in broiler chicken lines. Poult.
Sci. 93, 307–317. https://doi.org/10.3382/ps.2013-03359
Kristensen, T.N., Hoffmann, A.A., Pertoldi, C., Stronen, A.V., 2015. What can livestock breeders learn
from conservation genetics and vice versa? Front. Genet. 6.
https://doi.org/10.3389/fgene.2015.00038
Kumar, N.S., Gurusubramanian, G., 2011. Random amplified polymorphic DNA (RAPD) markers and its
applications 9.
Kumar, P., Henikoff, S., Ng, P.C., 2009. Predicting the effects of coding non-synonymous variants on
protein function using the SIFT algorithm. Nat. Protoc. 4, 1073–1081.
https://doi.org/10.1038/nprot.2009.86
Kumar, S., Stecher, G., Tamura, K., 2016. MEGA7: Molecular Evolutionary Genetics Analysis Version
7.0 for Bigger Datasets. Mol. Biol. Evol. 33, 1870–1874. https://doi.org/10.1093/molbev/msw054
Lawal, R.A., Al-Atiyat, R.M., Aljumaah, R.S., Silva, P., Mwacharo, J.M., Hanotte, O., 2018. Whole-
Genome Resequencing of Red Junglefowl and Indigenous Village Chicken Reveal New Insights
on the Genome Dynamics of the Species. Front. Genet. 9.
https://doi.org/10.3389/fgene.2018.00264
Lee, J., Lee, K.-T., Ahn, S., Lee, S., Lim, D., Kim, Y.-J., Cho, E.-S., Kim, K.-S., Dadi, H., Kim, T.-H.,
2012. Genetic characterization of Northeast Asian cattle based on sequence polymorphisms in the
complete mitochondrial genome. Open J. Anim. Sci. 02, 217–223.
https://doi.org/10.4236/ojas.2012.24030
Li, H., Durbin, R., 2010. Fast and accurate long-read alignment with Burrows–Wheeler transform.
Bioinformatics 26, 589–595. https://doi.org/10.1093/bioinformatics/btp698

179
Liao, W.-L., Chen, R.-H., Lin, H.-J., Liu, Y.-H., Chen, W.-C., Tsai, Y., Wan, L., Tsai, F.-J., 2010. Toll-
like receptor gene polymorphisms are associated with susceptibility to graves’ ophthalmopathy in
Taiwan males. BMC Med. Genet. 11. https://doi.org/10.1186/1471-2350-11-154
Librado, P., Rozas, J., 2009. DnaSP v5: a software for comprehensive analysis of DNA polymorphism data.
Bioinformatics 25, 1451–1452. https://doi.org/10.1093/bioinformatics/btp187
Lillehoj, H.S., Min, W., Choi, K.D., Babu, U.S., Burnside, J., Miyamoto, T., Rosenthal, B.M., Lillehoj,
E.P., 2001. Molecular, cellular, and functional characterization of chicken cytokines homologous
to mammalian IL-15 and IL-2. Vet. Immunol. Immunopathol. 82, 229–244.
https://doi.org/10.1016/S0165-2427 (01)00360-9
Lima-Rosa, C.A. da V., Canal, C.W., Fallavena, P.R.V., Freitas, L.B. de, Salzano, F.M., 2005. LEI0258
microsatellite variability and its relationship to B-F haplotypes in Brazilian (blue-egg Caipira)
chickens. Genet. Mol. Biol. 28, 386–389. https://doi.org/10.1590/S1415-47572005000300008
LMP [Livestock Master Plan], 2015. Animal breeding and genetics in the Ethiopian livestock master plan.
Ethiopian livestock master plan brief 4.
Liu, G., Zhao, Y., 2007. Toll-like receptors and immune regulation: their direct and indirect modulation on
regulatory CD4 + CD25 + T cells: Toll-like receptor modulation on regulatory CD4 + CD25 + T
cells. Immunology 122, 149–156. https://doi.org/10.1111/j.1365-2567.2007.02651.x
Liu, W., Miller, M., Lamont, S., 2002. Association of MHC class I and class II gene polymorphisms with
vaccine or challenge response to Salmonella enteritidis in young chicks. Immunogenetics 54, 582–
590. https://doi.org/10.1007/s00251-002-0495-z
Liu, Y.-P., Wu, G.-S., Yao, Y.-G., Miao, Y.-W., Luikart, G., Baig, M., Beja-Pereira, A., Ding, Z.-L.,
Palanichamy, M.G., Zhang, Y. P., 2006. Multiple maternal origins of chickens: Out of the Asian
jungles. Mol. Phylogenet. Evol. 38, 12-19. https://doi.org/10.1016/j.ympev.2005.09.014
Luo, B., Ye, M., Xu, H., Ma, E., Ye, F., Cui, C., Zhu, Q., Zhao, X., Yin, H., Diyan, L., Qiu, M., Yang, C.,
Zhang, Z., Wang, Y., 2018. Expression analysis, single-nucleotide polymorphisms of the Myoz1
gene and their association with carcase and meat quality traits in chickens. Ital. J. Anim. Sci. 1–9.
https://doi.org/10.1080/1828051X.2018.1448307
Luo, C., Qu, H., Ma, J., Wang, J., Li, C., Yang, C., Hu, X., Li, N., Shu, D., 2013. Genome-wide association
study of antibody response to Newcastle disease virus in chicken. BMC Genet. 14, 42.
https://doi.org/10.1186/1471-2156-14-42
Luo, W., Xu, J., Li, Z., Xu, H., Lin, S., Wang, J., Ouyang, H., Nie, Q., Zhang, X., 2018. Genome-Wide
Association Study and Transcriptome Analysis Provide New Insights into the White/Red Earlobe
Color Formation in Chicken. Cell. Physiol. Biochem. 46, 1768–1778.
https://doi.org/10.1159/000489361

180
Lwelamira, J., Kifaro, G.C., Gwakisa, P.S., Msoffe, P.L.M., 2008. Association of LEI0258 microsatellite
alleles with antibody response against Newcastle disease virus vaccine and body weight in two
Tanzania chicken ecotypes 7.
Ma, X., Liu, Y., Gowen, B.B., Graviss, E.A., Clark, A.G., Musser, J.M., 2007. Full-Exon Resequencing
Reveals Toll-Like Receptor Variants Contribute to Human Susceptibility to Tuberculosis Disease.
PLoS ONE 2, e1318. https://doi.org/10.1371/journal.pone.0001318
Ma, Y., Gu, L., Yang, L., Sun, C., Xie, S., Fang, C., Gong, Y., Li, S., 2018. Identifying artificial selection
signals in the chicken genome. PLOS ONE 13, e0196215.
https://doi.org/10.1371/journal.pone.0196215
Miller, M., Bacon, L., Hala, K., Hunt, H., Ewald, S., Kaufman, J., Zoorob, R., Briles, W.E., 2004.
Nomenclature for the chicken major histocompatibility (B and Y ) complex. Immunogenetics 56.
https://doi.org/10.1007/s00251-004-0682-1
Miller, M.M., Taylor, R.L., 2016. Brief review of the chicken Major Histocompatibility Complex: the
genes, their distribution on chromosome 16, and their contributions to disease resistance. Poult.
Sci. 95, 375–392. https://doi.org/10.3382/ps/pev379
Mishra, C., Das, D., Kumar, P., Khanna, K., Singh, A.P., Dayal, S., Bhattacharya, T.K., Bhushan, B.,
Sharma, A., 2011. Nucleotide sequencing and pcr-sscp of mx1 gene in chicken. Indian J. Anim.
Res. 45, 7.
MOA [Minstry of Agriculture]. 2000. Agro-ecological zones of Ethiopia. Natural resource management
and regulatory department. Addis Ababa, Ethiopia.
Mogesse, H.H., 2007. Phenotypic and genetic characterization of indigenous chicken populations in
Northwest Ethiopia. 186.
Moghadam, H.K., Pointer, M.A., Wright, A.E., Berlin, S., Mank, J.E., 2012. W chromosome expression
responds to female-specific selection. Proc. Natl. Acad. Sci. 109, 8207–8211.
https://doi.org/10.1073/pnas.1202721109
Muchadeyi, F.C., Eding, H., Simianer, H., Wollny, C.B.A., Groeneveld, E., Weigend, S., 2008.
Mitochondrial DNA D-loop sequences suggest a Southeast Asian and Indian origin of Zimbabwean
village chickens. Anim. Genet. 39, 615–622. https://doi.org/10.1111/j.1365-2052.2008.01785.x
Mugal, C.F., Nabholz, B., Ellegren, H., 2013. Genome-wide analysis in chicken reveals that local levels of
genetic diversity are mainly governed by the rate of recombination. BMC Genomics 14, 86.
https://doi.org/10.1186/1471-2164-14-86
Mukherjee, S., Karmakar, S., Babu, S.P.S., 2016. TLR2 and TLR4 mediated host immune responses in
major infectious diseases: a review. Braz. J. Infect. Dis. 20, 193–204.
https://doi.org/10.1016/j.bjid.2015.10.011

181
Mwacharo, J.M., Bjørnstad, G., Han, J.L., Hanotte, O., 2013a. The History of African Village Chickens:
an Archaeological and Molecular Perspective. Afr. Archaeol. Rev. 30, 97–114.
https://doi.org/10.1007/s10437-013-9128-1
Mwacharo, J.M., Nomura, K., Hanada, H., Han, J.L., Amano, T., Hanotte, O., 2013. Reconstructing the
origin and dispersal patterns of village chickens across East Africa: insights from autosomal
markers. Mol. Ecol. 22, 2683–2697. https://doi.org/10.1111/mec.12294
Mwacharo, J.M., Nomura, K., Hanada, H., Jianlin, H., Hanotte, O., Amano, T., 2007. Genetic relationships
among Kenyan and other East African indigenous chickens: Genetic relationships among Kenyan
chickens. Anim. Genet. 38, 485–490. https://doi.org/10.1111/j.1365-2052.2007.01641.x
Naqvi, A.N., 2007. Application of Molecular Genetic Technologies in Livestock Production: Potentials for
Developing Countries 13.
Ncube, K.T., Jooste, P.J., Soma, P., Dzomba, E.F., Muchadeyi, F.C., 2014. Polymorphism of the Major
Histocompatibility Complex and Genetic Structure of Southern African Village Chicken
Populations. Int. J. Poult. Sci. 13, 357–363. https://doi.org/10.3923/ijps.2014.357.363
Nei, M., 1986. Definition and Estimation of Fixation Indices. Evolution 40, 643.
https://doi.org/10.2307/2408586
Ng, C.S., Wu, P., Foley, J., Foley, A., McDonald, M.-L., Juan, W.-T., Huang, C.-J., Lai, Y.-T., Lo, W.-S.,
Chen, C.-F., Leal, S.M., Zhang, H., Widelitz, R.B., Patel, P.I., Li, W.-H., Chuong, C.-M., 2012.
The Chicken Frizzle Feather Is Due to an α-Keratin (KRT75) Mutation That Causes a Defective
Rachis. PLoS Genet. 8, e1002748. https://doi.org/10.1371/journal.pgen.1002748
Ng, P.C., 2003. SIFT: predicting amino acid changes that affect protein function. Nucleic Acids Res. 31,
3812–3814. https://doi.org/10.1093/nar/gkg509
Ngeno, K., van der Waaij, E.H., Megens, H.J., Kahi, A.K., van Arendonk, J.A.M., Crooijmans, R.P.M.A.,
2015. Genetic diversity of different indigenous chicken ecotypes using highly polymorphic MHC-
linked and non-MHC microsatellite markers. Anim. Genet. Resour. Génétiques Anim. Genéticos
Anim. 56, 1–7. https://doi.org/10.1017/S2078633614000484
Ngeno, K., Vander Waaij, E.H., Kahi, A.K., 2014. Indigenous chicken genetic resources in Kenya: their
unique attributes and conservation options for improved use. Worlds Poult. Sci. J. 70, 173–184.
https://doi.org/10.1017/S0043933914000154
Nguyen‐Phuc, H., Berres, M.E., 2018. Genetic structure in Red Junglefowl (Gallus gallus) populations:
Strong spatial patterns in the wild ancestors of domestic chickens in a core distribution range. Ecol.
Evol. 8, 6575–6588. https://doi.org/10.1002/ece3.4139

182
Nguyen-Phuc, H., Fulton, J.E., Berres, M.E., 2016. Genetic variation of major histocompatibility complex
(MHC) in wild Red Junglefowl (Gallus gallus). Poult. Sci. 95, 400–411.
https://doi.org/10.3382/ps/pev364
Nie, C., Zhang, Z., Zheng, J., Sun, H., Ning, Z., Xu, G., Yang, N., Qu, L., 2016. Genome-wide association
study revealed genomic regions related to white/red earlobe color trait in the Rhode Island Red
chickens. BMC Genet. 17. https://doi.org/10.1186/s12863-016-0422-1
Nielsen, R., 2005. Molecular Signatures of Natural Selection. Annu. Rev. Genet. 39, 197–218.
https://doi.org/10.1146/annurev.genet.39.073003.112420
Nielsen, R., Paul, J.S., Albrechtsen, A., Song, Y.S., 2011. Genotype and SNP calling from next-generation
sequencing data. Nat. Rev. Genet. 12, 443–451. https://doi.org/10.1038/nrg2986
Nikbakht, G., Esmailnejad, A., 2015. Chicken major histocompatibility complex polymorphism and its
association with production traits. Immunogenetics 67, 247–252. https://doi.org/10.1007/s00251-
015-0832-7
Nikbakht, G., Esmailnejad, A., Barjesteh, N., 2013. LEI0258 Microsatellite Variability in Khorasan,
Marandi, and Arian Chickens. Biochem. Genet. 51, 341–349. https://doi.org/10.1007/s10528-013-
9567-z
Oldenbroek, K. (Ed.), 2007. Utilisation and conservation of farm animal genetic resources. Wageningen
Academic Publishers, The Netherlands. https://doi.org/10.3920/978-90-8686-592-5
Olusiji, B., 2010. Genetic characterization of southeast and southwest nigerian indigenous chickens using
mitochondrial dna (d-loop region) 66.
Orsini, L., Jansen, M., Souche, E.L., Geldof, S., De Meester, L., 2011. Single nucleotide polymorphism
discovery from expressed sequence tags in the waterflea Daphnia magna. BMC Genomics 12.
https://doi.org/10.1186/1471-2164-12-309
Owen, J.P., Delany, M.E., Mullens, B.A., 2008. MHC haplotype involvement in avian resistance to an
ectoparasite. Immunogenetics 60, 621–631. https://doi.org/10.1007/s00251-008-0314-2
Padhi, M.K., 2016. Importance of Indigenous Breeds of Chicken for Rural Economy and Their
Improvements for Higher Production Performance. Scientifica 2016, 1–9.
https://doi.org/10.1155/2016/2604685
Patterson, N., Price, A.L., Reich, D., 2006. Population Structure and Eigenanalysis. PLoS Genet. 2, e190.
https://doi.org/10.1371/journal.pgen.0020190
Pavlidis, P., Alachiotis, N., 2017. A survey of methods and tools to detect recent and strong positive
selection. J. Biol. Res.-Thessalon. 24. https://doi.org/10.1186/s40709-017-0064-0

183
Peakall, R., Smouse, P.E., 2012. GenAlEx 6.5: genetic analysis in Excel. Population genetic software for
teaching and research--an update. Bioinformatics 28, 2537–2539.
https://doi.org/10.1093/bioinformatics/bts460
Philipsson J., Zonabend E., Bett, R.C. and Okeyo A.M. 2011. Global perspectives on animal genetic
resources for sustainable agriculture and food production in the tropics In: Animal Genetics
Training Resource, version 3, 2011. Ojango, J.M., Malmfors, B. and Okeyo, A.M. (Eds).
International Livestock Research Institute, Nairobi, Kenya, and Swedish University of Agricultural
Sciences, Uppsala, Sweden.
Price, A.L., Patterson, N.J., Plenge, R.M., Weinblatt, M.E., Shadick, N.A., Reich, D., 2006. Principal
components analysis corrects for stratification in genome-wide association studies. Nat. Genet. 38,
904–909. https://doi.org/10.1038/ng1847
Qanbari, S., Seidel, M., Strom, T.-M., Mayer, K.F.X., Preisinger, R., Simianer, H., 2015. Parallel Selection
Revealed by Population Sequencing in Chicken. Genome Biol. Evol. 7, 3299–3306.
https://doi.org/10.1093/gbe/evv222
Qanbari, S., Simianer, H., 2014. Mapping signatures of positive selection in the genome of livestock. Livest.
Sci. 166, 133–143. https://doi.org/10.1016/j.livsci.2014.05.003
Rao, Y., Shen, X., Xia, M., Luo, C., Nie, Q., Zhang, D., Zhang, X., 2007. SNP mapping of QTL affecting
growth and fatness on chicken GGA1. Genet. Sel. Evol. 39, 569–582.
https://doi.org/10.1051/gse:2007022
R Core Team (2013). R: A language and environment for statistical computing. R Foundation for Statistical
Computing, Vienna, Austria. URL http://www.R-project.org/.
Rege, J.E.O., Okeyo, A.M., 2006. Improving our knowledge of tropical indigenous animal genetic
resources 28.
Reynaud, C.A., Anquez, V., Dahan, A., Weill, J.C., 1985. A single rearrangement event generates most of
the chicken immunoglobulin light chain diversity. Cell 40, 283–291. https://doi.org/10.1016/0092-
8674 (85)90142-4
Romanov, M.N., Weigend, S., 2001. Analysis of Genetic Relationships between Various Populations of
Domestic and Jungle Fowl Using Microsatellite Markers. Poult. Sci. 80, 1057–1063.
https://doi.org/10.1093/ps/80.8.1057
Ronen, R., Udpa, N., Halperin, E., Bafna, V., n.d. Learning Natural Selection from the Site Frequency
Spectrum 26.
Roosen, J., Andersson, G., Curik, I., Solkner, J., Lenstra, J.A. 4au., Kantanen, J., Bruford, M.W. 4au.,
Tixier-Boichard, M., Buys, N., Baret, P.V. 4au., Marsan, P.A., Joost, S., 2016. Advances in Farm
Animal Genomic Resources. Frontiers Media SA, S.L.

184
Rothwell, L., Hu, T., Wu, Z., Kaiser, P., 2012. Chicken interleukin-21 is costimulatory for T cells and
blocks maturation of dendritic cells. Dev. Comp. Immunol. 36, 475–482.
https://doi.org/10.1016/j.dci.2011.08.013
Ruane, J., 1999. A critical review of the value of genetic distance studies in conservation of animal genetic
resources. J. Anim. Breed. Genet. 116, 317–323. https://doi.org/10.1046/j.1439-
0388.1999.00205.x
Rubin, C.-J., Megens, H.-J., Barrio, A.M., Maqbool, K., Sayyab, S., Schwochow, D., Wang, C., Carlborg,
O., Jern, P., Jorgensen, C.B., Archibald, A.L., Fredholm, M., Groenen, M.A.M., Andersson, L.,
2012. Strong signatures of selection in the domestic pig genome. Proc. Natl. Acad. Sci. 109, 19529–
19536. https://doi.org/10.1073/pnas.1217149109
Rubin, C.-J., Zody, M.C., Eriksson, J., Meadows, J.R.S., Sherwood, E., Webster, M.T., Jiang, L., Ingman,
M., Sharpe, T., Ka, S., Hallböök, F., Besnier, F., Carlborg, Ö., Bed’hom, B., Tixier-Boichard, M.,
Jensen, P., Siegel, P., Lindblad-Toh, K., Andersson, L., 2010. Whole-genome resequencing reveals
loci under selection during chicken domestication. Nature 464, 587–591.
https://doi.org/10.1038/nature08832
Sabarinathan, R., Tafer, H., Seemann, S.E., Hofacker, I.L., Stadler, P.F., Gorodkin, J., 2013. The RNAsnp
web server: predicting SNP effects on local RNA secondary structure. Nucleic Acids Res. 41,
W475–W479. https://doi.org/10.1093/nar/gkt291
Salanti, G., Amountza, G., Ntzani, E.E., Ioannidis, J.P.A., 2005. Hardy–Weinberg equilibrium in genetic
association studies: an empirical evaluation of reporting, deviations and power. Eur. J. Hum. Genet.
13, 840–848. https://doi.org/10.1038/sj.ejhg.5201410
Salomonsen, J., Chattaway, J.A., Chan, A.C.Y., Parker, A., Huguet, S., Marston, D.A., Rogers, S.L., Wu,
Z., Smith, A.L., Staines, K., Butter, C., Riegert, P., Vainio, O., Nielsen, L., Kaspers, B., Griffin,
D.K., Yang, F., Zoorob, R., Guillemot, F., Auffray, C., Beck, S., Skjødt, K., Kaufman, J., 2014.
Sequence of a Complete Chicken BG Haplotype Shows Dynamic Expansion and Contraction of
Two Gene Lineages with Particular Expression Patterns. PLoS Genet. 10, e1004417.
https://doi.org/10.1371/journal.pgen.1004417
Sawai, H., Kim, H.L., Kuno, K., Suzuki, S., Gotoh, H., Takada, M., Takahata, N., Satta, Y.,
Akishinonomiya, F., 2010. The Origin and Genetic Variation of Domestic Chickens with Special
Reference to Junglefowls Gallus g. gallus and G. varius. PLoS ONE 5, e10639.
https://doi.org/10.1371/journal.pone.0010639
Schmid, M., Smith, J., Burt, D.W., Aken, B.L., Antin, P.B., Archibald, A.L., et al., 2015. Third Report on
Chicken Genes and Chromosomes 2015. Cytogenet. Genome Res. 145, 78–179.
https://doi.org/10.1159/000430927

185
Schusser, B., Reuter, A., von der Malsburg, A., Penski, N., Weigend, S., Kaspers, B., Staeheli, P., Hartle,
S., 2011. Mx Is Dispensable for Interferon-Mediated Resistance of Chicken Cells against Influenza
A Virus. J. Virol. 85, 8307–8315. https://doi.org/10.1128/JVI.00535-11
Selvaramesh, A.S., Kumar, P., Mishra, C., Bhattacharya, T.K., Bhushan, B., Tiwari, A.K., Saxena, V.K.,
Sharma, A., 2018. Molecular Characterization of Mx1 Gene in Native Indian Breeds of Chicken.
Anim. Biotechnol. 1–5. https://doi.org/10.1080/10495398.2018.1439845
Sequence and comparative analysis of the chicken genome provide unique perspectives on vertebrate
evolution, 2004. . Nature 432, 695–716. https://doi.org/10.1038/nature03154
Sha, Q., Zhang, S., 2011. A test of Hardy-Weinberg equilibrium in structured populations. Genet.
Epidemiol. 35, 671–678. https://doi.org/10.1002/gepi.20617
Sharma, D., Appa Rao, K.B.C., Singh, R.V., Totey, S.M., 2001. Genetic diversity among chicken breeds
estimated through randomly amplified polymorphic DNA. Anim. Biotechnol. 12, 111–120.
https://doi.org/10.1081/ABIO-100108337
Shen, M., Qu, L., Ma, M., Dou, T., Lu, J., Guo, J., Hu, Y., Yi, G., Yuan, J., Sun, C., Wang, K., Yang, N.,
2016. Genome-Wide Association Studies for Comb Traits in Chickens. PLOS ONE 11, e0159081.
https://doi.org/10.1371/journal.pone.0159081
Shen, X., Uppsala universitet, Institutionen för cell- och molekylärbiologi, 2012. Novel Statistical Methods
in Quantitative Genetics Modeling Genetic Variance for Quantitative Trait Loci Mapping and
Genomic Evaluation. Acta Universitatis Upsaliensis Universitetsbiblioteket [distributör, Uppsala.
Shen, X.-J., Ito, S., Mizutani, M., Yamamoto, Y., 2002. Phylogenetic Analysis in Chicken Breeds Inferred
From Complete Cytochrome b Gene Information. Biochem. Genet. 13.
Sheppy, A., 2011. The colour of domestication and the designer chicken. Opt. Laser Technol. 43, 295–301.
https://doi.org/10.1016/j.optlastec.2009.02.003
Shivashankar, M., 2014. Random Amplified Polymorphic DNA (RAPD) Markers in Anticancer Drug
Plants 11.
Shriner, D., 2011. Approximate and exact tests of Hardy-Weinberg equilibrium using uncertain genotypes.
Genet. Epidemiol. 35, 632–637. https://doi.org/10.1002/gepi.20612
Siegel, P.B., Dodgson, J.B., Andersson, L., 2006. Progress from Chicken Genetics to the Chicken Genome.
Poult. Sci. 85, 2050–2060. https://doi.org/10.1093/ps/85.12.2050
Sim, N.-L., Kumar, P., Hu, J., Henikoff, S., Schneider, G., Ng, P.C., 2012. SIFT web server: predicting
effects of amino acid substitutions on proteins. Nucleic Acids Res. 40, W452–W457.
https://doi.org/10.1093/nar/gks539
Simianer, H., 2005. Decision making in livestock conservation. Ecol. Econ. 53, 559–572.
https://doi.org/10.1016/j.ecolecon.2004.11.016

186
Smiths, E.J., Jones, C.P., Bartlett, J., Nestor, K.E., 1996. Use of Randomly Amplified Polymorphic DNA
Markers for the Genetic Analysis of Relatedness and Diversity in Chickens and Turkeys. Poult.
Sci. 75, 579–584. https://doi.org/10.3382/ps.0750579
Soattin, M., Barcaccia, G., Dalvit, C., Cassandro, M., Bittante, G., 2009. Genomic DNA fingerprinting of
indigenous chicken breeds with molecular markers designed on interspersed repeats. Hereditas 146,
183–197. https://doi.org/10.1111/j.1601-5223.2009.02106.x
Stainton, J.J., Haley, C.S., Charlesworth, B., Kranis, A., Watson, K., Wiener, P., 2015. Detecting signatures
of selection in nine distinct lines of broiler chickens. Anim. Genet. 46, 37–49.
https://doi.org/10.1111/age.12252
Stattin, E.-L., 2009. Clinical and genetic studies of three inherited skeletal disorders. Umeå Universitet,
Umeå.
Storey, A.A., Athens, J.S., Bryant, D., Carson, M., Emery, K., deFrance, S., Higham, C., Huynen, L., Intoh,
M., Jones, S., Kirch, P.V., Ladefoged, T., McCoy, P., Morales-Muñiz, A., Quiroz, D., Reitz, E.,
Robins, J., Walter, R., Matisoo-Smith, E., 2012. Investigating the Global Dispersal of Chickens in
Prehistory Using Ancient Mitochondrial DNA Signatures. PLoS ONE 7, e39171.
https://doi.org/10.1371/journal.pone.0039171
Sundstrom, H., 2004. Reduced Variation on the Chicken Z Chromosome. Genetics 167, 377–385.
https://doi.org/10.1534/genetics.167.1.377
Tadesse, A., 2015. Household poultry production and health management practices in two agro-ecological
zones of central Tigray, Ethiopia. J. Biol. 15.
Takeda, K., Akira, S., 2001. Roles of Toll-like receptors in innate immune responses. Genes Cells 6, 733–
742. https://doi.org/10.1046/j.1365-2443.2001.00458.x
Takele T. Desta, Wragg, D., Bettridge, J., Lynch, S.E., Kassech Melese, Collins, M., Tadelle Dessie,
Zelalem G. Terfa, Wigley, P., Kaiser, P., Christley, R.M., Mwacharo, J.M., Hanotte, O., 2014.
Analysis of genome-wide single nucleotide polymorphisms unlocks the genetic structure of non-
descript Ethiopian village chickens. https://doi.org/10.13140/2.1.2506.2408
Tanabe, Y., Naito, Y., Vasuta, C., Lee, A.K., Soumounou, Y., Linhoff, M.W., Takahashi, H., 2017. IgSF21
promotes differentiation of inhibitory synapses via binding to neurexin2α. Nat. Commun. 8.
https://doi.org/10.1038/s41467-017-00333-w
Tang, K., Thornton, K.R., Stoneking, M., 2007. A New Approach for Using Genome Scans to Detect
Recent Positive Selection in the Human Genome. PLoS Biol. 5, e171.
https://doi.org/10.1371/journal.pbio.0050171

187
Tarekegn, G.M., 2016. Molecular characterization of Ethiopian indigenous goat populations: genetic
diversity and structure, demographic dynamics and assessment of the kisspeptin gene
polymorphism 219.
Tazeb, A., 2018. Molecular Marker Techniques and Their Novel Applications in Crop Improvement: a
Review Article 16.
Tegegne, A.; Gebremedhin, B.; Hoekstra, D. 2006. Input supply system and services for market-oriented
livestock production in Ethiopia. IN: Proceedings of the 14th Annual Conference of the Ethiopian
Society of Animal Production (ESAP), held in Addis Ababa, Ethiopia, September 5-7, 2006. Part
I: plenary session. ESAP Proceedings. p. 1-19. Addis Ababa (Ethiopia): ESAP.
Teneva, A., 2009. Molecular markers in animal genome analysis 18.
Teneva, A., Petrovic, M.P., 2010. Application of molecular markers in livestock improvement. Biotechnol.
Anim. Husb. 26, 135–154. https://doi.org/10.2298/BAH1004135T
The 1000 Genomes Project Consortium,., 2015. A global reference for human genetic variation. Nature
526, 68–74. https://doi.org/10.1038/nature15393
Tingey, S.V., de, J.P., 1993. Cenetic Analysis with Random Amplified Polymorphic DNA Markers 4.
Tixier-Boichard, M., Bed’hom, B., Rognon, X., 2011. Chicken domestication: From archeology to
genomics. C. R. Biol. 334, 197–204. https://doi.org/10.1016/j.crvi.2010.12.012
Toro, M.A., Fernández, J., Caballero, A., 2009. Molecular characterization of breeds and its use in
conservation. Livest. Sci. 120, 174–195. https://doi.org/10.1016/j.livsci.2008.07.003
Toro, M.A., Villanueva, B., Fernández, J., 2014. Genomics applied to management strategies in
conservation programmes. Livest. Sci. 166, 48–53. https://doi.org/10.1016/j.livsci.2014.04.020
Treangen, T.J., Salzberg, S.L., 2012. Repetitive DNA and next-generation sequencing: computational
challenges and solutions. Nat. Rev. Genet. 13, 36–46. https://doi.org/10.1038/nrg3117
Hateren, A., Carter, R., Bailey, A., Kontouli, N., Williams, A.P., Kaufman, J., Elliott, T., 2013. A
Mechanistic Basis for the Co-evolution of Chicken Tapasin and Major Histocompatibility Complex
Class I (MHC I) Proteins. J. Biol. Chem. 288, 32797–32808.
https://doi.org/10.1074/jbc.M113.474031
Vasselon, T., 2002. Toll Receptors: a Central Element in Innate Immune Responses. Infect. Immun. 70,
1033–1041. https://doi.org/10.1128/IAI.70.3.1033-1041.2002
Vieira, F.G., Fumagalli, M., Albrechtsen, A., Nielsen, R., 2013. Estimating inbreeding coefficients from
NGS data: Impact on genotype calling and allele frequency estimation. Genome Res. 23, 1852–
1861. https://doi.org/10.1101/gr.157388.113
Vitti, J.J., Grossman, S.R., Sabeti, P.C., 2013. Detecting Natural Selection in Genomic Data. Annu. Rev.
Genet. 47, 97–120. https://doi.org/10.1146/annurev-genet-111212-133526

188
Voight, B.F., Kudaravalli, S., Wen, X., Pritchard, J.K., 2006. A Map of Recent Positive Selection in the
Human Genome. PLoS Biol. 4, e72. https://doi.org/10.1371/journal.pbio.0040072
Walker, B.A., Hunt, L.G., Sowa, A.K., Skjodt, K., Gobel, T.W., Lehner, P.J., Kaufman, J., 2011. The
dominantly expressed class I molecule of the chicken MHC is explained by coevolution with the
polymorphic peptide transporter (TAP) genes. Proc. Natl. Acad. Sci. 108, 8396–8401.
https://doi.org/10.1073/pnas.1019496108
Wang, K., Li, M., Hakonarson, H., 2010. ANNOVAR: functional annotation of genetic variants from high-
throughput sequencing data. Nucleic Acids Res. 38, e164–e164.
https://doi.org/10.1093/nar/gkq603
Wang, Y., Brahmakshatriya, V., Lupiani, B., Reddy, S., Okimoto, R., Li, X., Chiang, H., Zhou, H., 2012.
Associations of chicken Mx1 polymorphism with antiviral responses in avian influenza virus
infected embryos and broilers. Poult. Sci. 91, 3019–3024. https://doi.org/10.3382/ps.2012-02471
Wang, Yanqiang, Gao, Y., Imsland, F., Gu, X., Feng, C., Liu, R., Song, C., Tixier-Boichard, M., Gourichon,
D., Li, Q., Chen, K., Li, H., Andersson, L., Hu, X., Li, N., 2012. The Crest Phenotype in Chicken
Is Associated with Ectopic Expression of HOXC8 in Cranial Skin. PLoS ONE 7, e34012.
https://doi.org/10.1371/journal.pone.0034012
Wang, Y., Wang, J., Li, B.H., Qu, H., Luo, C.L., Shu, D.M., 2014. An association between genetic variation
in the roundabout, axon guidance receptor, homolog 2 gene and immunity traits in chickens. Poult.
Sci. 93, 31–38. https://doi.org/10.3382/ps.2013-03512
Wang, Ye, Qiu, M., Yang, J., Zhao, X., Wang, Yan, Zhu, Q., Liu, Y., 2014. Sequence variations of the
MHC class I gene exon 2 and exon 3 between infected and uninfected chickens challenged with
Marek’s disease virus. Infect. Genet. Evol. 21, 103–109.
https://doi.org/10.1016/j.meegid.2013.10.020
Warren, W.C., Hillier, L.W., Tomlinson, C., Minx, P., Kremitzki, M., Graves, T., Markovic, C., Bouk, N.,
Pruitt, K.D., Thibaud-Nissen, F., Schneider, V., Mansour, T.A., Brown, C.T., Zimin, A., Hawken,
R., Abrahamsen, M., Pyrkosz, A.B., Morisson, M., Fillon, V., Vignal, A., Chow, W., Howe, K.,
Fulton, J.E., Miller, M.M., Lovell, P., Mello, C.V., Wirthlin, M., Mason, A.S., Kuo, R., Burt, D.W.,
Dodgson, J.B., Cheng, H.H., 2017. A New Chicken Genome Assembly Provides Insight into Avian
Genome Structure. G3amp58 GenesGenomesGenetics 7, 109–117.
https://doi.org/10.1534/g3.116.035923
Warren, W.C., Hillier, L.W., Tomlinson, C., Minx, P., Kremitzki, M., Graves, T., Markovic, C., Bouk, N.,
Pruitt, K.D., Thibaud-Nissen, F., Schneider, V., Mansour, T.A., Brown, C.T., Zimin, A., Hawken,
R., Abrahamsen, M., Pyrkosz, A.B., Morisson, M., Fillon, V., Vignal, A., Chow, W., Howe, K.,
Fulton, J.E., Miller, M.M., Lovell, P., Mello, C. V., Wirthlin, M., Mason, A.S., Kuo, R., Burt, D.W.,

189
Dodgson, J.B., Cheng, H.H., 2016. A New Chicken Genome Assembly Provides Insight into Avian
Genome Structure. G3 Genes Genomes Genetics 7, 109–117.
https://doi.org/10.1534/g3.116.035923
Weigend, S., Matthes, S., Solkner, J., Lamont, S.J., 2001. Resistance to Marek’s Disease Virus in White
Leghorn Chickens: Effects of Avian Leukosis Virus Infection Genotype, Reciprocal Mating, and
Major Histocompatibility Complex. Poult. Sci. 80, 1064–1072.
https://doi.org/10.1093/ps/80.8.1064
Weigend, S., Romanov, M.N., 2002. The World Watch List for Domestic Animal Diversity in the context
of conservation and utilisation of poultry biodiversity. Worlds Poult. Sci. J. 58, 411–430.
https://doi.org/10.1079/WPS20020031
Weigend, S., Romanov, M.N., 2001. Current strategies for the assessment and evaluation of genetic
diversity in chicken resources. Worlds Poult. Sci. J. 57, 275–288.
https://doi.org/10.1079/WPS20010020
Wicker, T., Robertson, J.S., Schulze, S.R., Feltus, F.A., Magrini, V., Morrison, J.A., Mardis, E.R., Wilson,
R.K., Peterson, D.G., Paterson, A.H., Ivarie, R., 2004. The repetitive landscape of the chicken
genome 11.
Wideman, R.F., Rhoads, D.D., Erf, G.F., Anthony, N.B., 2013. Pulmonary arterial hypertension (ascites
syndrome) in broilers: A review. Poult. Sci. 92, 64–83. https://doi.org/10.3382/ps.2012-02745
Wigginton, J.E., Cutler, D.J., Abecasis, G.R., 2005. A Note on Exact Tests of Hardy-Weinberg Equilibrium.
Am. J. Hum. Genet. 76, 887–893. https://doi.org/10.1086/429864
Williams, J.L., 2005. The use of marker-assisted selection in animal breeding and biotechnology 14.
Wolc, A., Arango, J., Jankowski, T., Dunn, I., Settar, P., Fulton, J.E., O’Sullivan, N.P., Preisinger, R.,
Fernando, R.L., Garrick, D.J., Dekkers, J.C.M., 2014. Genome-wide association study for egg
production and quality in layer chickens. J. Anim. Breed. Genet. 131, 173–182.
https://doi.org/10.1111/jbg.12086
Woldegiorgiss, W.E., 2015. Genetic improvement in indigenous chicken of Ethiopia. Wagningen
University, Wageningen.
Wollstein, A., Stephan, W., 2015. Inferring positive selection in humans from genomic data. Investig.
Genet. 6, 5. https://doi.org/10.1186/s13323-015-0023-1
Wondmeneh, E., Van der Waaij, E.H., Udo, H.M.J., Tadelle, D., Van Arendonk, J.A.M., 2016. Comparison
of different poultry breeds under station and on-farm conditions in Ethiopia. Livest. Sci. 183, 72–
77. https://doi.org/10.1016/j.livsci.2015.11.019

190
Wong, D., Lee, W., Humburg, P., Makino, S., Lau, E., Naranbhai, V., Fairfax, B.P., Chan, K., Plant, K.,
Knight, J.C., 2014. Genomic mapping of the MHC transactivator CIITA using an integrated ChIP-
seq and genetical genomics approach 15.
Wragg, D., Mwacharo, J.M., Alcalde, J.A., Hocking, P.M., Hanotte, O., 2012. Analysis of genome-wide
structure, diversity and fine mapping of Mendelian traits in traditional and village chickens.
Heredity 109, 6–18. https://doi.org/10.1038/hdy.2012.9
Wright, A.E., Dean, R., Zimmer, F., Mank, J.E., 2016. How to make a sex chromosome. Nat. Commun. 7,
12087. https://doi.org/10.1038/ncomms12087
XLSTAT, 2018. Data analysis and statistical solutions for Microsoft excel. Addinsoft, Paris, France (2018).
3.5
Xu, H.P., Zeng, H., Zhang, D.X., Jia, X.L., Luo, C.L., Fang, M.X., Nie, Q.H., Zhang, X.Q., 2011.
Polymorphisms associated with egg number at 300 days of age in chickens. Genet. Mol. Res. 10,
2279–2289. https://doi.org/10.4238/2011.October.3.5
Xu, L., Sin, S.Y.W., Grayson, P., Janes, D.E., Edwards, S.V., Sackton, T.B., 2018. Evolutionary dynamics
of sex chromosomes of palaeognathous birds. https://doi.org/10.1101/295089
Xue, Y., Zhang, X., Huang, N., Daly, A., Gillson, C.J., MacArthur, D.G., Yngvadottir, B., Nica, A.C.,
Woodwark, C., Chen, Y., Conrad, D.F., Ayub, Q., Mehdi, S.Q., Li, P., Tyler-Smith, C., 2009.
Population Differentiation as an Indicator of Recent Positive Selection in Humans: An Empirical
Evaluation. Genetics 183, 1065–1077. https://doi.org/10.1534/genetics.109.107722
Yang, S., Li, X., Li, K., Fan, B., Tang, Z., 2014. A genome-wide scan for signatures of selection in Chinese
indigenous and commercial pig breeds. BMC Genet. 15, 7. https://doi.org/10.1186/1471-2156-15-
7
Yap, F.C., Yan, Y.J., Loon, K.T., Zhen, J.L.N., Kamau, N.W., Kumaran, J.V., 2010. Phylogenetic Analysis
of Different Breeds of Domestic Chickens in Selected Area of Peninsular Malaysia Inferred from
Partial Cytochrome b Gene Information and RAPD Markers. Anim. Biotechnol. 21, 226–240.
https://doi.org/10.1080/10495398.2010.506334
Ye, X., Brown, S.R., Nones, K., Coutinho, L.L., Dekkers, J.C.M., Lamont, S.J., 2007. Associations of
myostatin gene polymorphisms with performance and mortality traits in broiler chickens. Genet.
Sel. Evol. 39, 73–89. https://doi.org/10.1051/gse:2006029
Yuan, J., Sun, C., Dou, T., Yi, G., Qu, LuJiang, Qu, Liang, Wang, K., Yang, N., 2015. Identification of
Promising Mutants Associated with Egg Production Traits Revealed by Genome-Wide Association
Study. PLOS ONE 10, e0140615. https://doi.org/10.1371/journal.pone.0140615
Zanetti, E., 2009. Genetic, phenotypic and proteomic characterisation of local chicken breeds 107.

191
Zhang, J., Liu, T., Feng, R., Liu, C., Chi, S., 2015. Genetic Map Construction and Quantitative Trait Locus
(QTL) Detection of Six Economic Traits Using an F2 Population of the Hybrid from Saccharina
longissima and Saccharina japonica. PLOS ONE 10, e0128588.
https://doi.org/10.1371/journal.pone.0128588
Zhang, X., Leung, F., Chan, D., Yang, G., Wu, C., 2002. Genetic diversity of Chinese native chicken breeds
based on protein polymorphism, randomly amplified polymorphic DNA, and microsatellite
polymorphism. Poult. Sci. 81, 1463–1472. https://doi.org/10.1093/ps/81.10.1463
Zheng, D., O’Keefe, G., Li, L., Johnson, L.W., Ewald, S.J., 1999. A PCR method for typing B-LbetaII
family (class II MHC) alleles in broiler chickens. Anim. Genet. 30, 109–119.
https://doi.org/10.1046/j.1365-2052.1999.00460.x
Zhou, H., Mitchell, A.D., McMurtry, J.P., Ashwell, C.M., Lamont, S.J., 2005. Insulin-like growth factor-I
gene polymorphism associations with growth, body composition, skeleton integrity, and metabolic
traits in chickens. Poult. Sci. 84, 212–219. https://doi.org/10.1093/ps/84.2.212
Zhou, J.J., Lange, K., Papp, J.C., Sinsheimer, J.S., 2009. A heterozygote–homozygote test of Hardy–
Weinberg equilibrium. Eur. J. Hum. Genet. 17, 1495–1500. https://doi.org/10.1038/ejhg.2009.57

192
APPENDICES
SUPPLEMENTARY TABLES AND FIGURES (provided as an electronic file format)
Chapter 2
Table S 1. List of sampling sites of the reported study.
Table S 2. Phenotypic and/or genotypic studies investigated.
Table S 3. Studies in relation to dominant religion.
Table S 4. Studies in relation to altitude.
Table S 5. List of studies across agro-ecologies.
Table S 6. List of qualitative traits considered.
Table S 7. Plumage colour descriptions as reported in various studies.
Table S 8. List of quantitative traits considered.
Table S 9. List of genotypic parameters considered.
Table S 10. Average plumage colour variants (%) of indigenous chicken (n = 9491).
Table S 11. Earlobe color variants of indigenous chicken (n = 9624).
Table S 12. Shank (n = 9014) and skin (n = 6313) color variants of indigenous chicken.
Table S 13. Eye color variants of indigenous chicken populations across (n = 3248).
Table S 14. Neck feather color variants of indigenous chicken (n = 1235).
Table S 15. Comb type variants in indigenous chicken (n = 1071).
Table S 16. Feather distribution (N = 12624) and morphology (N = 11455) variants of indigenous
chicken.

193
Table S 17. Shank feather (N = 1231), hen spur (N =1480) and body shaper (n = 2123) variants of
indigenous chicken.
Table S 18. Significance test and LS means of plumage across dominant religion and elevation
Table S 19. Significance test and LS means of comb types across dominant religion and elevation.
Table S 20. Significance test and LS means of Earlobe color across dominant religion and elevation.
Table S 21. Significance test and LS means of eye color across dominant religion and elevation.
Table S 22. Significance test and LS means of shank color across dominant religion and elevation.
Table S 23. Significance test and LS means of skin color across dominant religion and elevation.
Table S 24. Significance test and LS means of feather distribution across dominant religion and
elevation.
Table S 25. Significance test and LS means of feather morphology across dominant religion and
elevation.
Table S 26. Significance test and LS means of neck feather across dominant religion and elevation.
Table S 27. Significance test and LS means of body shape across dominant religion and elevation.
Table S 28. Significance test and LS means of plumage colour variants (%) AEZ (n = 9850).
Table S 29. Significance test and LS means of shank color variants across AEZ.
Table S 30. Significance test and LS means of eye colour variants across AEZ.
Table S 31. Significance test and LS means of neck feather color variants across AEZ.
Table S 32. Significance test and LS means of skin color variants across AEZ.
Table S 33. Significance test and LS means of comb type variants across AEZ
Table S 34. Significance test and LS means of feather distribution variants across AEZ.
Table S 35. Significance test and LS means of morphometric traits of chicken across dominant
religion.

194
Table S 36. Significance test and LS means of morphometric traits of chicken across AEZ.
Table S 37. Significant test and LS means of genetic parameters across religion.
Table S 38. Significance test and LS means of genetic parameter estimate variation across AEZ.
Chapter 3
Table S 39. Overall allele frequency (%) of LEI0258 in indigenous chicken by allele size.
Table S 40. Pairwise population matrix of Nei Unbiased Genetic Distance across populations.
Table S 41. Pairwise population matrix of Nei Unbiased Genetic Distance across MAEZ.
Table S 42. Pairwise population FST values.
Table S 43. Pairwise Population FST values by MAEZ.
Table S 44. Pairwise genetic distance between Ethiopian chickens based on microsatellite
LEI0258 sequences.
Appendix 1. Raw sequences of LEI0258 alleles in indigenous chicken of Ethiopia.
Chapter 4
Figure S 1. The admixture plots for Ethiopian indigenous chicken populations (6 < K < 10).
Figure S 2. SNP density for individual chromosomes across the genome.
Figure S 3. Magnified view and sequence information of unmapped regions extracted using
samtools view from the SNP density plot of the 1 Kb genome coverage.
Table S 45. List of genes in nonsynonymous deleterious variants in 27 populations.
Table S 46. List of genes harboring non-synonymous deleterious variants in 10 chicken
populations.

195
Table S 47. Non-synonymous deleterious variants with allele frequency greater than 0.9 in 27
chicken populations.
Chapter 5
Table S 48. Hp values within the threshold level (Hp ≤ -4) in Improved Horro (n = 30).
Table S 49. List of genes for Improved Horro based on Hp methods.
Table S 50. Hp values within the threshold level (Hp ≤ -4) in Local Horro (n = 6).
Table S 51. List of candidate genes in Local Horro (n = 6).
Table S 52. Hp values for threshold windows in Jarso chicken populations.
Table S 53. List of candidate genes in Jarso chicken.
Table S 54. Hp values within the threshold level (Hp ≤ -4) in Jarso (n = 14).
Table S 55. Hp values within the threshold level (P ≤ -4) Hugub (n = 10).
Table S 56. List of candidate genes in Hugub (n = 10).
Table S 57. Hp values within the threshold level (Hp ≤ -4) in Arabo chicken (n = 10).
Table S 58. List of candidate genes in Arabo chicken (n = 10).
Table S 59. Top Fst values (1%) in Improved with local Horro chicken.
Table S 60. List of candidate genes in Improved Horro and Local Horro.
Table S 61. Top pairwise Fst values (1%) in Improved Horro and Jarso chickens.
Table S 62. List of candidate genes in Improved Horro Vs Jarso chickens.
Table S 63. Top pairwise Fst values (1%) in Improved Horro and Hugub chickens.
Table S 64. List of candidate genes in Improved Horro and Hugub chickens.
Table S 65. Top pairwise Fst values (1%) in Improved Horro and Arabo chickens.

196
Table S 66. List of candidate genes in |Improved Horro and Arabo chickens.
Table S 67. Overlapping Hp regions across populations.
Table S 68. List of Ensemble Hp genes under selection across all populations.
Table S 69. Overlapping Fst windows across populations.
Table S 70. List of candidate genes using Fst from overlapping regions across populations.
ወስበሐት ለእግዚአብሄር ወለወላዲቱ ድንግል ወለ መስቀሉ ክቡር!!!

191
APPENDICES
SUPPLMENTARY TABLES AND FIGURES
Chapter 2
Table S 1. List of sampling sites of the reported study
ID Sites ID Sites ID Sites ID sites ID Sites
1 Alefa 24 Dawo 47 Gondar 70 Kombolcha 93 Seden Sodo
2 Tach Armachiho 25 Dawro 48 Gondar Zuria 71 Konso 94 Selti
3 Ada’a 26 Debre Elias 49 Gorogutu 72 Kembata Tembaro 95 Shalla
4 Adami tulu 27 Debrebirhan 50 Guangua 73 Loka abaya 96 Sheka
5 Adwa 28 Dejen 51 Guba 74 Lume 97 Sheko
6 Alaba 29 Dembiya 52 Guraferda 75 Machakel 98 Sidama
7 Amaro 30 Dera 53 Guragie 76 Mandura 99 Siraro shalla
8 Arbaminch Zuria 31 Dibate 54 Hadero Tunto 77 Mao-Komo 100 South bench
9 Arbegona 32 Dirashe 55 Hadiya 78 Mecha 101 South Omo
10 Assossa 33 Dodota 56 Halaba 79 Mehal Amiba 102 Tanqua Abergellie
11 Awabel 34 Duna 57 Haramaya 80 Melo Hamusit 103 Tembein
12 Benchi Maji 35 Endamehoni 58 Hawzein 81 Menz gera 104 Tenta
13 Beresa watershed 36 Enebise Sar Midir 59 Hitossa 82 Mereb lehe 105 Tepi
14 Bishoftu 37 Farta 60 Horro 83 Meta 106 Tillili
15 Boloso Sore 38 Fogera 61 Humbo 84 Moretinajiru 107 Tiyo
16 Boset 39 Gamogofa 62 Jamma 85 Muhor Na aklil 108 Wensho
17 Bure 40 Gantaafeshum 63 Jarso 86 Nole Kaba 109 Wogera
18 Burji 41 Gasay 64 Jimma 87 North Bench 110 Wolaita
19 Chefe 42 Gedeo 65 Kamash 88 North Mekelle 111 Wonbera
20 Cheliya 43 Gelila 66 Kefa 89 Ofla 112 Worabe
21 Chena 44 Gidan 67 Kersa 90 Pawe 113 Yem
22 Dale 45 Gimbo 68 Kewot 91 Quara 114 Ziqualla
23 Damot Gale 46 Goma 69 Kimbibit 92 Raya-azebo 115 Zombati

192
Table S 2. Phenotypic and/or genotypic studies investigated.
No. Phenotypic Populations (N=89) Genotypic Populations (N=32)
1 Aklilu et al., 2013 2 Alemayehu et al., 2003 5
2 Alemayehu et al., 2003 5 Mwacharo et al., 2007 2
3 Bekele, 2015 3 Hassen et al., 2009 9
4 Bekerie et al., 2015 4 Goraga et al., 2011 5
5 Bogale, 2011 1 Wragg et al., 2012 5
6 Dana et al., 2010 5 Bekerie et al., 2015 4
7 Desta et al., 2013 2 Desta et al., 2015 2
10 Duguma, 2006 3
11 Getachew et al., 2016 3
12 Getu et al., 2014a 3
13 Getu et al., 2014b 3
14 Hailu et al., 2013 3
15 Halima et al., 2007 9
16 Kibret, 2008 1
17 Lemlem and Tesfaye, 2010 2
20 Melesse and Negesse, 2011 19
21 Moges et al., 2010 3
22 Moges, 2014 1
23 Muhiye, 2007 3
24 Negassa et al., 2014 3
25 Nigussie et al., 2013 3
26 Yisma, 2015 3
27 Yitbarek and Zewudu, 2013 1
28 Zewdu et al., 2013 4
N = Number of populations

193
Table S 3. Studies in relation to dominant religion.
No. Dominant religion Phenotypic studies N Genotypic studies N
1 Muslim Aklilu, 2013; Alemayehu et al., 2015; Bekerie,
2015; Bogale, 2011; Desta, 2013; Duguma,
2006; Halima et al., 2007; Nagussie, 2013;
Negassa et al., 2014.
9 Alemayhu, 2003; Bekerie, 2015; Goraga et al., 2012;
Desta et al., 2014.
4
2 Protestant Dana, 2010; Bekele et al., 2015; Muhiye, 2007;
Melesse and Negesse, 2011
4 Alemayhu, 2003; Dana, 2010; Goraga et al., 2012;
Wragg et al., 2012.
4
3 Traditional Alemayehu, 2015; Dana, 2010; Halima et al.,
2007.
3 - -
4 Orthodox Aklilu, 2013; Alemayhu, 2003; Bekerie, 2015;
Dana, 2010; Desta et al., 2013; Moges et al.,
2010; Getu et al., 2014a, 2014b; Hailu, et al.,
2013; Halima et al., 2007; Kibret, 2008; Moges,
2014; Lemlem and Tesfaye, 2010; Negassa et
al., 2014; Yitbarek and Zewudu; Zewdu, 2013
16 Alemayhu, 2003; Bekerie, 2015; Dana, 2010; Goraga
et al., 2012; Hassen et al., 2009; Mwacharo et al.,
2007; Desta et al., 2014; Wragg et al., 2012
8
N = number of studies
Table S 4. Studies in relation to altitude.
Elevation (masl) Phenotypic studies N Genotypic studies N
500 - 1800 Alemayhu, 2003; Bekele et al., 2015; Bogale, 2011; Dana et al.,
2010; Duguma, 2006; Getachew et al., 2016; Halima et al.,
2007; Nigussie, 2013; Yitbarek and Zewudu, 2013; Yisma,
2015; Zewdu et al., 2013.
10 Alemayhu, 2003; Hassen et al., 2009; Wragg et al.,
2012.
4
1800 - 2400 Aklilu, 2013; Alemayhu, 2003; Bekerie, 2015; Bikila, 2013;
Dana, 2010; Duguma, 2006; Getachew et al., 2016; Getu et al.,
2014b; Hailu et al., 2013; Halima, 2007; Kibret, 2008; Lemlem
and Tesfaye, 2010; Mogess et al., 2014; Negassa et al., 2014;
Nigussie, 2013; Yisma, 2015.
18 Alemayhu, 2003; Goraga et al., 2012a; Hassen et al.,
2009; Mwacharo et al., 2007; Desta et al., 2014;
Wragg et al., 2012.
6
2400 - 3200 Aklilu, 2013; Bekerie, 2015; Dana et al., 2010; Duguma et al.,
2006; Getu et al., 2014b; Halima, 2007; Mogess, 2014;
Nigussie, 2013; Dessie et al., 2013; Yisma, 2015.
10 Alemayhu, 2003; Bekerie, 2015; Mwacharo et al.,
2007; Desta et al., 2014; Wragg et al., 2012.
5
N = number of studies

194
Table S 5. List of studies across agro – ecologies.
Symbol Major agro-ecology Phenotypic studies N Genotypic studies N
SM1 Hot to warm sub-moist
lowlands
Dana et al., 2010; Moges, 2014; Nigussie, 2013. 3 No data -
SM2 Tepid to cool sub-moist mid
highlands
Nigussie, 2013. 1
Dana, 2011a; Goraga et al., 2012; Mwacharo et
al., 2007.
3
SM3 Cold to very cold sub-moist
sub-afro-alpine to afro alpine
Aklilu, 2013; Getu et al., 2014a; Hailu et al.,
2013.
3 - -
M1 Hot to warm moist lowlands Aklilu, 2013; Alemayhu, 2003; Duguma, 2006;
Getachew et al., 2016; Kibret, 2008; Negassa et
al., 2014; Zewdu et al., 2013.
7
Dana, 2011a; Hassen et al., 2009. 2
M2 Tepid to cool moist mid
highlands
Alemayhu, 2003; Bekerie, 2015; Dana et al.,
2010; Duguma, 2006; Getachew et al., 2016;
Getu et al., 2014a; Moges, 2014; Yitbarek and
Zewdu., 2013; Yisma, 2015.
9 Hassen et al., 2009; Wragg et al., 2012. 2
SH1 Hot to warm sub-humid
lowlands
Halima et al., 2007. 1 Hassen et al., 2009. 1
SH2 Tepid to cool sub-humid mid
highlands
Aklilu, 2013; Alemayhu, 2003; Bekerie, 2015;
Bogale, 2011; Dana et al., 2010; Duguma, 2006;
Melesse and Negesse, 2011; Zewdu et al., 2013.
8 Bekerie, 2015; Desta, 2015.
2
H1 Hot to warm humid lowlands Bekele et al., 2015; Nigussie, 2013. 2 Wragg et al., 2012. 1
H2 Tepid to cool humid mid
highlands
Melesse and Negesse, 2010; Negassa et al.,
2014.
2 Alemayhu, 2003; Mwacharo et al., 2007. 2
Ph1 Hot to warm per humid
lowlands
Melesse and Negesse, 2011. 1 -
N = Number of studies

195
Table S 6. List of qualitative traits considered.
No. Qualitative traits N Studies
1 Plumage colour 14 Aklilu, 2013; Bekele et al., 2015; Bekerie, 2015; Dana, 2011a; Duguma, 2006; Getachew et al., 2016; Getu et al.,
2014a, 2014b; Halima et al., 2007; Kibret, 2008; Melesse and Negesse, 2011; Negassa et al., 2014; Nigussie, 2013;
Yisma, 2015.
2 Comb type 15 Aklilu, 2013; Bekele et al., 2015; Bekerie, 2015; Dana, 2011a; Desta et al., 2013; Duguma, 2006; Getu et al., 2014a,
2014b; Halima et al., 2007; Kibret, 2008; Melesse and Negesse, 2011; Nigussie, 2013; Yisma, 2015, Getachew et
al., 2016; Negassa et al., 2014.
3 Earlobe colour 13 Aklilu, 2013; Bekele et al., 2015; Bekerie, 2015; Dana, 2011a; Desta et al., 2013; Duguma, 2006; Getu et al., 2014a,
2014b; Kibret, 2008; Melesse and Negesse, 2011; Negassa et al., 2014; Nigussie, 2013; Yisma, 2015.
4 Eye colour 6 Aklilu, 2013; Duguma, 2006; Getu et al., 2014a, 2014b; Negassa et al., 2014; Yisma, 2015.
5 Shank colour 12 Aklilu, 2013; Bekele et al., 2015; Bekerie, 2015; Dana, 2011a; Desta et al., 2013; Duguma, 2006; Getu et al., 2014b;
Halima et al., 2007; Kibret, 2008; Melesse and Negesse, 2011; Negassa et al., 2014; Yisma, 2015.
6 Skin colour 9 Aklilu, 2013; Bekele et al., 2015; Dana, 2011a; Duguma, 2006; Getu et al., 2014; Kibret, 2008; Negassa et al., 2014;
Nigussie, 2013; Yisma, 2015.
7 Shank feather 4 Bekele et al., 2015; Bekerie, 2015; Kibret, 2008; Mogesse, 2007.
8 Hen spur 3 Bekele et al., 2015; Kibret, 2008; Nigussie, 2013.
9 Body shape 4 Dana, 2011a; Getu et al., 2014a, 2014b; Kibret, 2008.
10 Head shape 8 Aklilu, 2013; Alemayhu, 2003a; Bekerie, 2015; Getu et al., 2014b; Melesse and Negesse, 2011; Negassa et al., 2014;
Nigussie, 2013; Yisma, 2015.
11 Neck feather colour 2 Dana, 2011; Negassa et al., 2014.
12 Feather morphology 5 Bekele et al., 2015; Dana, 2011a; Kibret, 2008; Melesse and Negesse, 2011; Nigussie, 2013.
13 Feather colour 2 Dana, 2011a; Negassa et al., 2014.
14 Feather distribution 2 Melesse and Negesse, 2011a; Negassa et al., 2014.
N = number of studies

196
Table S 7. Plumage colour descriptions as reported in various studies.
Local colour naming Description Source
Gebisma Wheaten strips on black background Dana et al., 2010
Greyish mixture Getu et al., 2014a, 2014b; Halima et al., 2007)
Red brownish with black Bekerie, 2015)
Reddish grey Duguma, 2006)
Greyish with varying mixture Bekerie, 2015; Nigussie et al., 2015
Mixtures of white and black with varying shades of multicolours Melesse and Negesse, 2011
Tikur gebsat Black with wheaten or red strips Nigussie et al., 2015
Teterima Black or red speckles on white background Dana et al., 2010
Black with white tips Getu et al., 2014a, 2014b; Halima et al., 2007
Black with white or red spots Nigussie et al., 2015
Black red teterima White black and red trips Getu et al., 2014a, 2014b
Red teterima White with red tips Getu et al., 2014a, 2014b
Key teterima Red with white or black spots Nigussie et al., 2015
Netch teterima White with black or red spots Nigussie et al., 2015
Kokima Red brownish Getu et al., 2014a, 2014b
Greyish strips on brown background Nigussie et al., 2015
Greyish plumage, white or greyish strips on brown or reddish background Dana et al., 2010; Melesse and Negesse, 2011
Kokima/Giracha Grey Duguma, 2006
Zigrima Black and white spotted feather Dana et al., 2010; Nigussie et al., 2015
Black and white spotted feathers on red background (Melesse and Negesse, 2011
Kuarichama White with red strips Nigussie et al., 2015
Wosera Mixture of white and red with varying shades of multi-colours Melesse and Negesse, 2011
Zagolima White or red speckles on black background Melesse and Negesse, 2011
Seran White with red striped Halima et al., 2007
Key dama Red brown Duguma, 2006; Halima et al., 2007
Libework White with golden breast colour Nigussie et al., 2015

197
Table S 8. List of quantitative traits considered.
No. Traits N Studies
1 Body weight
15
Lemlem and Tesfaye, 2010; Aklilu, 2013; Bekele et al., 2015; Bekerie, 2015; Dana,
2011a; Duguma, 2006; Getachew et al., 2015; Getu et al., 2014a, 2014b; Halima et al.,
2007; Kibret, 2008; Melesse and Negesse, 2011; Negassa et al., 2014; Nigussie, 2013;
Yisma, 2015.
2 Egg/hen/year 15 Lemlem and Tesfaye, 2010; Aklilu, 2013; Bekele et al., 2015; Bekerie, 2015; Dana,
2011a; Duguma, 2006; Getachew et al., 2015; Getu et al., 2014a, 2014b; Halima et al.,
2007; Kibret, 2008; Melesse and Negesse, 2011; Negassa et al., 2014; Nigussie, 2013;
Yisma, 2015.
3 Body length 8 Bekele et al., 2015; Bekerie, 2015; Getu et al., 2014a, 2014c; Kibret, 2008; Negassa et
al., 2014; Nigussie, 2013; Yisma, 2015.
4 Wing span 8 Bekele et al., 2015; Getu et al., 2014a, 2014c; Kibret, 2008; Mogesse, 2007; Negassa et
al., 2014; Nigussie, 2013; Yisma, 2015.
5 Back length 4 Aklilu, 2013; Bekele et al., 2015; Nigussie, 2013; Yisma, 2015.
6 Beak length 3 Getu et al., 2014a, 2014b; Negassa et al., 2014.
7 Chest
circumference
4 Aklilu, 2013; Getachew et al., 2016; Nigussie, 2013; Yisma, 2015.
8 Comb height 7 Bekele et al., 2015; Getu et al., 2014a, 2014b; Kibret, 2008; Negassa et al., 2014;
Nigussie, 2013; Yisma, 2015.
9 Comb length 7 Bekele et al., 2015; Getu et al., 2014a, 2014b; Kibret, 2008, 2008; Negassa et al., 2014;
Nigussie, 2013; Yisma, 2015.
10 Keel bone length 7 Aklilu, 2013; Bekele et al., 2015; Getu et al., 2014a, 2014c; Negassa et al., 2014;
Nigussie, 2013; Yisma, 2015.
11 Neck length 2 Bekele et al., 2015; Yisma, 2015.
12 Shank
circumference
4 Getachew et al., 2016; Getu et al., 2014a; Halimaet al., 2007; Negassa et al., 2014.
13 Shank length 10 Bekele et al., 2015; Bekerie, 2015; Dana et al., 2010a; Getu et al., 2014a, 2014c; Halima
et al., 2007; Melesse and Negesse, 2011; Negassa et al., 2014; Nigussie, 2013.
14 Spur length 7 Getu et al., 2014a, 2014c; Kibret, 2008.
15 Wattle length 3 Bekele et al., 2015; Bekerie, 2015; Nigussie, 2013.
N = number of studies

198
Table S 9. List of genotypic parameters considered.
No. Parameter N Studies
1 Mean number of alleles 4 Alemayhu, 2003; Bekerie, 2015; Halima et al., 2007; Mwacharo
et al., 2007)
2 Effective number of alleles 1 Mwacharo et al., 2007.
3 Alleles per locus 2 Goraga et al., 2012; Wragg et al., 2012.
4 Private Alleles 3 Goraga et al., 2012; Mwacharo et al., 2007; Wragg et al., 2012.
5 Observed Heterozygosity 6 Alemayhu, 2003; Bekerie, 2015; Goraga et al., 2012; Halima et
al., 2007; Mwacharo et al., 2007; Wragg et al., 2012.
6 Expected heterozygosity 7 Alemayhu, 2003; Bekerie, 2015; Goraga et al., 2012; Halima et
al., 2007; Mwacharo et al., 2007; Desta et al., 2014; Wragg et al.,
2012.
7 Coefficient of Inbreeding 4 Goraga et al., 2012; Mwacharo et al., 2007; Desta et al., 2014;
Wragg et al., 2012.
8 Polymorphic Information Content 3 Alemayhu, 2003; Bekerie, 2015; Halima et al., 2007.
9 Identity By Descent 2 Desta et al., 2014; Wragg et al., 2012.
N = number of studies

199
Table S 10. Average plumage colour variants (%) of indigenous chicken (N=9491).
Plumage NP N % Sources
Red 52 2378 27.8 Aklilu, 2013; Bekele et al., 2015; Bekerie, 2015; Dana et al., 2010; Getachew et al., 2016;
Getu et al., 2014a, 2014b; Halima et al., 2007; Melesse and Negesse, 2011; Negassa et al.,
2014; Nigussie et al., 2015; Yisma, 2015
Black 53 1506 15.28 Aklilu, 2013; Bekele et al., 2015; Bekerie, 2015; Dana et al., 2010; Getachew et al., 2016;
Getu et al., 2014a, 2014b; Halima et al., 2007; Melesse and Negesse, 201; Negassa et al., 2014;
Nigussie et al., 2015; Yisma, 2011
White 49 1392 14.13 Aklilu, 2013; Bekele et al., 2015; Bekerie, 2015; Dana et al., 2010; Getachew et al., 2016;
Getu et al., 2014a, 2014b; Halima et al., 2007; Melesse and Negesse, 2011; Negassa et al.,
2014; Yisma, 2015
Gebsima 51 1156 11.74 Aklilu, 2013; Bekele et al., 2015; Bekerie, 2015; Dana et al., 2010; Getachew et al., 2016;
Getu et al., 2014a, 2014b; Halima et al., 2007; Kibret, 2008; Melesse and Negesse, 2011;
Nigussie et al., 2015)
Teterima 34 516 5.24 Aklilu, 2013; Bekele et al., 2015; Bekerie, 2015; Dana et al., 2010; Getachew et al., 2016;
Getu et al., 2014a, 2014b; Halima et al., 2007; Kibret, 2008; Melesse and Negesse, 2011;
Nigussie et al., 2015
Kokima 32 497 5.05 Bekele et al., 2015; Dana et al., 2010; Getu et al., 2014; Kibret, 2008; Melesse and Negesse,
2011; Nigussie et al., 2015) Grey 13 147 1.49 Aklilu, 2013; Bekele et al., 2015; Dana et al., 2010; Nigussie et al., 2015
Wosera 18 300 3.05 Halima et al., 2007; Melesse and Negesse, 2011; Negassa et al., 2014
Seran 16 71 0.72 Halima et al., 2007; Kibret, 2008; Nigussie et al., 2015; Yisma, 2015
Zigirima 71 176 1.79 Bekele et al., 2015; Dana et al., 2010; Halima et al., 2007; Melesse and Negesse, 2011;
Nigussie et al., 2015
Zagolima 2 62 0.6 Halima et al., 2007; Melesse and Negesse, 2011
Anbesima 8 63 0.64 Getu et al., 2014; Halima et al., 2007; Kibret, 2008; Nigussie et al., 2015; Yisma, 2015
Aserima 3 46 0.47 Yisma, 2015
Brownish 52 886 8.99 Bekele et al., 2015; Bekerie, 2015; Dana et al., 2010; Getachew et al., 2016; Halima et al.,
2007; Negassa et al., 2014; Nigussie, 2013; Nigussie et al., 2015)
Libework 13 193 1.96 Bekele et al., 2015; Bekerie, 2015; Dana et al., 2010; Getachew et al., 2016; Getu et al.,
2014b; Halima et al., 2007; Negassa et al., 2014; Nigussie et al., 2015
Multicolor 26 102 1.04 Dana et al., 2010; Getu et al., 2014; Halima et al., 2007; Negassa et al., 2014; Nigussie et al.,
2015)
N = number of chicken sampled; NP = Number of populations considered by investigated studies.

200
Table S 11. Earlobe colour variants of indigenous chicken (N=9624).
Earlobe color NP N % Sources
Red 52 4402 45.74 Aklilu, 2013; Bekele et al., 2015; Bekerie, 2015; Dana et al., 2010;
Melesse and Negesse, 2011; Nigussie et al., 2015
Black 6 147 1.53 Bekerie, 2015; Getu et al., 2014; Nigussie et al., 2015
White 47 3434 35.68
Aklilu, 2013; Bekele et al., 2015; Bekerie, 2015; Dana et al., 2010; Desta
et al., 2013; Kibret, 2008; Negassa et al., 2014; Nigussie et al., 2015;
Yisma, 2015
Yellow 35 9.8 0.10 Aklilu, 2013; Bekele et al., 2015; Bekerie, 2015; Dana et al., 2010; Desta
et al., 2013; Melesse and Negesse, 2011; Nigussie et al., 2015
White and red 7 559 5.81 Bekele et al., 2015; Kibret, 2008; Nigussie et al., 2015
Red and white 11 581 6.04 Aklilu, 2013; Bekerie, 2015; Desta et al., 2013
Purl 2 32 0.33 Getu et al., 2014
Green 3 41 0.43 Yisma, 2015
Grey 3 75 0.78 Yisma, 2015
Orange 3 55 0.57 Desta et al., 2013
Pink 2 119 1.24 Desta et al., 2013
Pink and yellow 1 6 0.06 Desta et al., 2013
Pink and white 2 138 1.43 Desta et al., 2013
Dark brown 1 1 0.01 Desta et al., 2013
Unclassified 3 24 0.25 Negassa et al., 2014
N = number of chicken sampled; NP = Number of populations considered by investigated studies.

201
Table S 12. Shank (N=9014) and skin (N= 6313) colour variants of indigenous chicken.
Shank color NP N % Sources
Yellow 57 4993 55.39
Bekele et al., 2015; Bekerie, 2015; Dana et al., 2010; Desta et al., 2013; Getu et
al., 2014; Halima et al., 2007; Kibret, 2008; Melesse and Negesse, 2011; Negassa
et al., 2014
White 58 2506 27.80
Bekele et al., 2015; Bekerie, 2015; Dana et al., 2010; Desta et al., 2013; Getu et
al., 2014; Halima et al., 2007; Kibret, 2008; Melesse and Negesse, 2011; Negassa
et al., 2014
Black 55 10.59 0.12 Bekele et al., 2015; Bekerie, 2015; Dana et al., 2010a; Desta et al., 2013; Getu et
al., 2014b; Halima et al., 2007; Melesse and Negesse, 2011; Negassa et al., 2014
Brown 4 42 0.47 Bekerie, 2015
Bluish black 3 35 0.39 Aklilu, 2013; Kibret, 2008
Grey blue 17 530 5.88 Bekele et al., 2015; Negassa et al., 2014
Green 28 290 3.22 Aklilu, 2013; Desta et al., 2013; Getu et al., 2014; Halima et al., 2007; Melesse
and Negesse, 2011; Negassa et al., 2014
Green blue 7 15 0.17 Aklilu, 2013
Slated blue 2 41 0.45 Desta et al., 2013
Red 9 217 2.41 Bekele et al., 2015; Getu et al., 2014
Pale 3 320 3.55 Duguma, 2006
Mottled 2 14 0.16 Desta et al., 2013
Skin colour NP N % Sources
Black 3 19 0.30 Duguma, 2006; Aklilu et al., 2013; Negassa et al., 2014; Agide, 2015; Bekele et al., 2015
Blue black 6 320 5.07 Kibret, 2008; Aklilu et al., 2013; Negassa et al., 2014
Green 2 726 11.50 Kibret, 2008; Agide, 2015; Negassa et al., 2014; Aklilu et al., 2013; Bekele et al., 2015
Red 9 774 12.27 Duguma, 2006; Aklilu et al., 2013; Negassa et al., 2014;Agide, 2015; Bekele et al., 2015
White 26 2709 42.92 Kibret, 2008; Agide, 2015; Negassa et al., 2014; Aklilu et al., 2013; Bekele et al., 2015
Yellow 23 1661 26.31 Kibret, 2008; Dana et al., 2010; Aklilu et al., 2013; Negassa et al., 2014; Bekele et al., 2015; Agide, 2015
Pink 3 104 1.65 Bekele et al., 2015
N = Number of chicken sampled; NP = Number of populations considered by investigated studies.

202
Table S 13. Eye colour variants of indigenous chicken populations across (N = 3248).
Eye color NP N % Sources
Orange 6 388 11.95 Aklilu, 2013; Getu et al., 2014a, 2014b
Black 8 773 23.80 Duguma, 2007; Getu et al., 2014b; Negassa et al., 2014
Pearl 4 19 0.58 Aklilu, 2013; Getu et al., 2014
Red 11 1200 36.95 Aklilu, 2013; Getu et al., 2014a, 2014b; Yisma, 2015
Brown 5 438 13.49 Aklilu, 2013; Yisma, 2015
Blue black 3 367 11.30 Negassa et al., 2014
Dark brown 3 63 1.94 Negassa et al., 2014
N = Number of chicken sampled; NP = Number of populations considered by investigated studies.
Table S 14. Neck feather colour variants of indigenous chicken (N = 1235).
Neck feather color NP N % Sources
White 7 256 20.73 Dana et al., 2010; Negassa et al., 2014
Black 7 139 11.26 Dana et al., 2010; Negassa et al., 2014
Red 7 210 17.00 Dana et al., 2010; Negassa et al., 2014
Gebsima 5 22 1.78 Desta et al., 2013
Teterima 5 18 1.46 Desta et al., 2013
Brown 8 311 25.18 Dana et al., 2010; Negassa et al., 2014
Kokima 5 4 0.32 Desta et al., 2013
Grey 7 32 2.59 Dana et al., 2010; Negassa et al., 2014
Zigirima 5 47 3.81 Desta et al., 2013
Gold 5 129 10.45 Desta et al., 2013
Multiple 5 37 3.00 Desta et al., 2013
Reddish brown 3 30 2.43 Desta et al., 2013
N=number of chicken sampled; NP=Number of populations considered by investigated studies.

203
Table S 15. Comb type variants in indigenous chicken (N=1071).
Comb type NP N % Sources
Single 11 4279 42.07 Bekele et al., 2015; Bekerie, 2015; Dana et al., 2010; Desta et al.,
2013; Getachew et al., 2016; Getu et al., 2014a, 2014b; Halima et
al., 2007; Kibret, 2008; Melesse and Negesse, 2011; Negassa et al.,
2014; Nigussie et al., 2015; Yisma, 2015)
Rose 59 3132 30.79 Bekele et al., 2015; Bekerie, 2015; Dana et al., 2010; Desta et al.,
2013; Getachew et al., 2016; Getu et al., 2014a, 2014b; Halima et
al., 2007; Kibret, 2008; Melesse and Negesse, 2011; Negassa et al.,
2014; Nigussie et al., 2015; Yisma, 2015
Pea 60 2136 21.00 Bekele et al., 2015; Bekerie, 2015; Dana et al., 2010; Desta et al.,
2013; Getachew et al., 2016; Getu et al., 2014a, 2014b; Halima et
al., 2007; Kibret, 2008; Melesse and Negesse, 2011; Negassa et al.,
2014; Nigussie et al., 2015; Yisma, 2015
Strawberry 9 35 0.34 Bekele et al., 2015; Bekerie, 2015; Desta et al., 2013; Getachew et
al., 2016; Nigussie et al., 2015
Walnut 9 246 2.42 Dana et al., 2010; Desta et al., 2013; Getachew et al., 2016; Getu et
al., 2014; Halima et al., 2007; Melesse and Negesse, 2011; Negassa et
al., 2014; Nigussie, 2013; Nigussie et al., 2015
Cushion 2 39 0.38 Aklilu, 2013
V-shape 8 222 2.18 Desta et al., 2013; Halima et al., 2007; Nigussie, 2013; Nigussie et
al., 2015
Duplex 27 70 0.69 Dana et al., 2010; Desta et al., 2013; Getu et al., 2014a, 2014b;
Melesse and Negesse, 2011
Butter cup 3 9 0.09 Desta et al., 2013; Getachew et al., 2016
Unclassified 2 3 0.03 Desta et al., 2013
N=number of chicken sampled; NP=Number of populations considered by investigated studies.

204
Table S 16. Feather distribution (N=12624) and motrphology (N=11455) variants of indigenous
chicken.
Feather distribution NP N % Sources
Normal 37 10715 84.88 Bekele et al., 2015; Dana et al., 2010; Kibret, 2008;
Melesse and Negesse, 2011; Nigussie et al., 2015
Necked Neck 19 347 2.75 Bekele et al., 2015; Dana et al., 2010; Kibret, 2008;
Melesse and Negesse, 2011; Nigussie et al., 2015
Crest 6 547 4.33 Bekele et al., 2015; Dana et al., 2010; Kibret, 2008;
Melesse and Negesse, 2011; Nigussie et al., 2015
Shank and feet 9 76 0.60 Melesse and Negesse, 2011
Muff and beard 12 82 0.65 Melesse and Negesse, 2011
Silky 9 623 4.94 Melesse and Negesse, 2011
Frizzle 6 234 1.85 Melesse and Negesse, 2011
Feather morphology NP N % References
Normal 25 5492 89.82 Kibret, 2008; Nigussie et al, 2010; Abera and Tegegne,
2011; Nigussie et al., 2015
Frizzel 9 29 0.47 Abera and Teggne, 2011
Silky 8 5934 9.71 Dana et al., 2010; Abera and Tegegne, 2011
N = number of chicken sampled; NP = Number of populations considered by investigated studies.
Table S 17. Shank feather (N=1231), hen spur (N=1480) and body shaper (N=2123) variants of
indigenous chicken.
Shank feather NP N % Sources
Present 8 28 2.27 Bekele et al., 2015; Bekerie, 2015; Halima et al., 2007
Absent 16 1203 97.73
Hen spur NP N %
Present 7 646 43.65 Bekele et al., 2015; Kibret, 2008; Nigussie et al., 2015
Absent 7 834 56.35
Body shape NP N % Sources
Triangular 12 435 20.50 Dana et al., 2010 ; Getu et al., 2014b; Getu et al., 2014C
Blocky 12 1262 59.42 Kibret, 2008, Dana et al., 2010 ; Getu et al., 2014b; Getu et al., 2014C
Wedge 12 426 20.09 Kibret, 2008, Dana et al., 2010 ; Getu et al., 2014b; Getu et al., 2014C
N = Number of chicken sampled; NP = Number of populations considered by investigated studies.

205
Table S 18. Significance test and LS means of plumage colour across dominant religion and elevation
Religion Red Black White Green Teterima Kokima Green Wesera Seran Zig
Anb AS Br LI MC
Muslim 43a 32a 29a 23a 14a 28a 20a 34a 5a 9a 9a 15a 30a 3a 4a
Protestant 96a 48a 29a 38a 19a 23a 5a 3a 5a 3a 9a 15a 33a 14a 3a
Orthodox 32a 17a 27a 16a 17a 10a 8a 23a 5a 11a 9a 15a 25a 21a 5a
Traditional 37a 10a 41a 17a 5a 4a 9a 15a 35a 14a
Elevation Red Brown White Green Teterima Kokima Green Wesera Seran Zig Za A AS BR LI MC
500-1500 45a 25ab 25a 21a 14a 15a 7a 19a 6a 8a 2a 17a 33a 16a 5a
1501-2400 66a 35a 28a 28a 14a 19a 11a 17a 5a 9a 7a 6a 21a 17a 4a
2401-3200 27a 13b 31a 11a 29a 10a 6a 18a 0.6a 8a 4a 3a 43a 14a 2a
Za = Zagolima; A = Anbesima; AS = Aserima; Br = Brown; LI = Libework; MC = Multicolour. Values with different letter superscripts across columns are
significantly different (P < 0.05).
Table S 19. Significance test and LS means of comb types across dominant religion and elevation.
Religion Single Rose Pea Strawberry Walnut V-shape Duplex
Orthodox 42.40b 64.96a 36.28a 3.06a 11.27a 6.22a 22.64a
Protestant 122.48a 44.29a 27.76a 4.04a 7.79a 6.05a 11.47a
Traditional 8.79b 6.80a 43.85a 3.76a 2.80a 6.05a 36.94a
Muslim 57.00b 39.89a 53.03a 3.76a 5.46a 0.07a 3.18a
Elevation Single Rose Pea Strawberry Walnut V-shape Duplex
500-1500 53.40ab 45.66a 32.53a 2.98a 9.16a 8.48a 8.11a
1501-2400 88.26a 51.28a 35.52a 3.50a 8.13a 1.75a 17.57a
2401-3200 28.10b 60.08a 48.04a 4.30a 9.86a 8.48a 29.46a
Values with different letter superscripts across columns are significantly different (P < 0.05).

206
Table S 20. Significance test and LS means of Earlobe colour across dominant religion and elevation.
Dominant Religion Black White Red Yellow White and Red Red and white Green Grey Orange others
Muslim 61.95a 61.42a 71.99a 38.39a 90.82a 72.75a 13.67a 15.67a 18.39a 11.84a
Protestant 30.13a 87.61a 79.62a 30.78a 93.36a 55.81a 13.67a 15.67a 18.39a 8.58a
Traditional 30.13a 144.55a 89.23a 26.88a 90.82a 55.81a 13.67a 15.67a 18.39a 8.58a
Orthodox 6.35a 63.37a 92.77a 17.67a 65.21a 43.15a 13.67a 15.67a 18.39a 6.15a
Elevation Black White Red Yellow White and Red red and white Green Grey Orange others
500-1800 1.48a 61.83a 70.05a 21.98a 72.18a 39.23a 16.75a 21.40a 6.97a 8a
1800-2400 45.74a 84.44a 92.34a 33.34a 69.01a 56.28a 12.37a 13.25a 35.99a 8a
2400-3200 1.43a 59.27a 86.29a 11.38a 122.50a 64.60a 12.37a 13.25a 9.68a 8a
Values with different letter superscripts across columns are significantly different (P < 0.05).
Table S 21. Significance test and LS means of eye colour across dominant religion and elevation.
Dominant religion Orange Black pearl Red Brown blue black
Muslim 144.62a 126.14a 6.21a 76.53a 2.93a 97.09 a
Orthodox 39.96a 87.54a 4.28a 119.04a 113.65a 130.10 a
Elevation Orange Black pearl Red Brown blue black Dark brown
500-1800 5.95a 59.87a 1.99a 131.32a 146.75a 122.33a 21a
1800-2400 78.86a 73.57a 5.61a 105.95a 78.11a 122.33a 21a
2400-3200 124.18a 188.65a 6.41a 87.38a 32.64a 122.33a 21a
Values with different letter superscripts across columns are significantly different (P < 0.05).

207
Table S 22. Significance test and LS means of shank colour across dominant religion and elevation.
Dominant religion Yellow White Black Brown Bluish black Grey blue Green Red Pale Grey blue
Muslim 86.90a 42.46a 14.65a 12.26a 8.82a 67.90a 18.22a 31.56a 182.35a 11.25a
Orthodox 86.38a 42.23a 17.91a 8.05a 21.79a 73.99a 11.61a 39.55a 69.23a 4.92a
Protestant 97.98a 51.67a 23.63a 10.30a 8.68a 57.49a 6.43a 0.77a 117.68a 4.55a
Traditional 48.25a 11.81a 12.89a 11.45a 8.68a 73.99a 1.20a 19.48a 117.68a 7.64a
Elevation Yellow White Black brown bluish black Grey blue Green Red Pale Grey blue
500-1800 65.88a 34.49a 15.31a 13.74a 2.95a 72.22a 7.74a 13.7a 41.6a 0.06a
1800-2400 97.40a 51.47a 22.57a 7.43a 19.82a 65.03a 14.07a 10.4a 139.4a 9.68a
2400-3200 93.05a 34.33a 14.21a 13.74a 2.95a 68.44a 4.57a 74.3a 114.3a 5.11a
Values with different letter superscripts across columns are significantly different (P < 0.05).

208
Table S 23. Significance test and LS means of skin colour across dominant religion and elevation.
Dominant religion Yellow White Black Bluish black Pink Red
Muslim 101.56a 53.73a 6.34a 55.18a 34.67a 177.31a
Traditional 59.38a 153.00a 6.34a 37.13a 34.67a 106.36a
Protestant 54.25a 146.20a 6.34a 37.13a 34.67a 106.36a
Orthodox 66.14a 95.25a 6.34a 23.74a 34.67a 53.75a
Elevation Yellow White Black Bluish black Pink Red
500-1800 69.62a 113.11a 0.28a 7.51a 14.05a 27.81a
1800-2400 77.53a 81.39a 11.53a 59.85a 50.87a 95.59a
2400-3200 47.66a 125.64a 5.77a 7.51a 32.89a 162.00a
Values with different letter superscripts across columns are significantly different (P < 0.05).
Table S 24. Significance test and LS means of feather distribution across dominant religion and
elevation.
Dominant religion Normal Naked Neck Crest Shank and feet Muff and beard
Protestant 225.31a 17.80a 17.31a 10.04a 7.60a
Traditional 218.25a 11.15a 19.67a 12.05a 10.48a
Muslim 238.38a 29.65a 13.72a 7.32a 7.45a
Orthodox 170.13a 17.22a 86.37a 4.84a 3.91a
Elevation Normal Naked Neck Crest Shank and feet Muff and beard
500-1800 208.42a 9.19a 55.74a 12.70a 6.67a
1800-2400 215.42a 22.59a 20.44a 6.46a 6.67a
2400-3200 180.00a 16.11a 97.11a 9.47a 6.67a
Values with different letter superscripts across columns are significantly different (P < 0.05).
Table S 25. Significance test and LS means of feather morphology across dominant religion and
elevation.
Dominant religion Normal Silky Frizzle
Muslim 290.00a 174.28a 27.99a
Protestant 231.08a 54.24a 34.57a
Traditional 115.31a 174.28a 27.99a
Orthodox 184.20a 56.41a 25.92a
Elevation Normal Silky Frizzle
500-1800 197.14a 106.82a 31.52a
1801-2400 231.07a 48.77a 31.28a
2401-3200 186.94a 101.61a 31.40a
Values with different letter superscripts across columns are significantly different (P < 0.05).

209
Table S 26. Significance test and LS means of neck feather across dominant religion and elevation.
Dominant religion White Black Red Gebsima Teterima Brown kok Grey Zigirima Reddish brown
Orthodox 41.16a 13.05a 30.51a 5.66a 3.36a 35.69a 0.78a 5.40a 11.76a 13.14a
Muslim 23.50a 40.50a 65.00a 2.52a 3.82a 53.50a 0.13a 9.51a 8.76a 5.79a
Protestant 21.32a 6.93a 35.47a 5.34a 3.34a 35.47a 0.22a 0.30a 7.12a 9.67a
Traditional 42.63a 6.16a 22.49a 2.52a 3.82a 25.95a 0.13a 0.66a 8.76a 9.67a
Elevation White Black Red Gebsima
Brown kokima Grey
Reddish brown
500-1800 28.42b 6.67a 31.14a 3.78a 32.29a 0.10a 0.39a 10a
1800-2400 24.86b 28.89a 51.06a 4.70a 50.06a 0.76a 7.83a 10a
2400-3200 71.05a 4.62a 17.30a 5.09a 13.84a 0.20a 3.79a 10a
Values with different letter superscripts across columns are significantly different (P < 0.05).

210
Table S 27. Significance test and LS means of body shape across dominant religion and elevation.
Dominant religion Blocky Triangular Wedge
Orthodox 76.04a 40.12a 36.94a
Protestant 191.25a 29.25a 4.50a
Traditional 189.00a 18.00a 18.00a
Elevation Blocky Triangular Wedge
500-1800 193.50a 23.6a 7.9a
1800-2400 48.57b 47.0a 40.0a
2400-3200 79.67ab 36.0a 42.7a
Values with different letter superscripts across columns are significantly different (P < 0.05).
Table S 28. Significance test and LS means of plumage colour variants (%) AEZ (N=9850).
Plumage AEZ N LSM P-value
Red (n=2738) H1 678 84.72a 0.001
H2 65 99.78a
M1 169 31.70bc
M2 174 33.43bc
PH1 98 97.73a
SH1 70 14.01c
SH2 1075 72.23a
SM1 99 24.80bc
SM2 300 70.43ab
SM3 10 20.88bc
Black (n=1505) H1 330 41.30a 0.07
H2 39 43.86a
M1 97 17.82a
M2 114 18.92a
PH1 50 49.59a
SH1 45 14.60a
SH2 589 38.49a
SM1 40 9.93a
SM2 118 29.20a
SM3 83 27.50a
White (n=1392) H1 165 20.64a 0.05
H2 15 34.76a
M1 121 21.26a
M2 262 32.57a
SH1 36 27.29a
SH2 481 12.80a
SM1 92 28.71a
SM2 29 29.94a

211
Plumage AEZ N LSM P-value
SM3 191 22.51a
Gebsima (n=1156) H1 174 21.72a 0.10
H2 17 23.00a
M2 99 11.57a
PH1 42 13.65a
SH1 52 41.76a
SH2 520 10.46a
SH3 12 36.76a
SM1 13 7.475a
SM2 191 42.72a
SM3 36 19.54a
Teterima (n=516) H1 103 18.99a 0.05
M1 59 13.13a
M2 105 12.24a
SH1 24 16.44a
SH3 1 8.11a
SM1 50 13.74a
SM3 174 12.45a
Kokima (n=497) H1 217 27.14a 0.12
M1 4 14.32a
M2 38 12.39a
PH1 43 43.21a
SH2 167 16.15a
SM1 6 9.50a
SM2 14 12.42a
SM3 8 8.01a
Grey (n=147) H1 11 6.84a 0.67
M1 52 6.84a
M2 8 13.74a
SH1 35 7.89a
SH2 39 10.53a
SM1 2 9.79a
Wosera (n=300) H1 12 19.04a 0.55
H2 49 24.50a
M1 48 24.02a
PH1 27 27.26 a
SH1 11 18.19a
SH2 98 15.71a
SM2 55 27.02a
Seran (n=71) M1 9 4.16a 0.27 M2 18 5.30a
SH1 1 4.23a
SM1 13 4.48a
SM2 7 4.42a

212
Plumage AEZ N LSM P-value
SM3 23 9.35a
Zigirima (n=176) H1 44 7.89a 0.44
M1 13 9.38a
PH1 2 1.74a
SH1 41 15.69a
SH2 72 8.94a
SM2 4 8.31a
Zagolima (n=62) PH1 42 41.76a 0.0001
SH1 20 21.61a
Anbesima (n=63) M1 2 8.01a 0.37
M2 29 11.01a
SH1 12 9.01a
SM1 4 9.63a
SM2 3 7.76 a
SM3 13 6.01a
Aserima (n=46) M2 14 15.20a
0.99 SM3 32 15.78a
a
Brownish (n=886) H1 113 31.78a 0.31
H2 12 20.11a
M1 129 22.57a
M2 85 23.46a
SH1 95 24.64a
SH2 318 42.41a
SM1 42 10.52a
SM2 92 24.04a
Libework (n=193) M1 11 13.06a 0.11
M2 49 17.77a
SH1 26 14.85a
SM1 21 16.08a
SM2 25 13.29a
SM3 61 14.65a
Multicolor (n=102) H1 3 3.40a 0.67
H2 3 3.54a
M1 8 2.36a
M2 51 6.74a
SH1 2 2.85a
SH2 6 3.89a
SM1 8 2.06a
SM2 21 5.83a
AEZ = Agro ecologic Zone; N = Number of chicken reported with a given plumage in a given agro-ecology; Values
with P < 0.05 are significantly different.

213
Table S 29. Significance test and LS means of shank colour variants across AEZ.
Shank color AEZ N LSM P-value
Yellow (n=4993) H1 812 101.47a 0.49
H2 233 77.83a
M1 578 64.20a
M2 520 65.02a
PH1 95 94.95a
SH1 49 24.70a
SH2 1752 109.52a
SH3 25 24.56a
SM1 379 94.67a
SM2 324 108.00a
SM3 226 113.00a
White (n=2506) H1 432 54.03ab 0.001
H2 74 36.88ab
M1 244 24.43ab
M2 238 29.81ab
PH1 96 96.30a
SH1 13 4.306b
SH2 929 54.66ab
SH3 4 4.000b
SM1 100 25.03ab
SM2 217 108.50a
SM3 159 79.50ab
Black (n=1036) H1 114 22.76a 0.13
H2 120 40.07a
M1 84 9.36a
M2 172 21.49a
PH1 28 28.35a
SH1 12 6.01a
SH2 313 18.39a
SH3 5 5.44a
SM1 31 7.73a
SM2 77 25.67a
SM3 80 40.00a
Brown (n=42) M2 20 20.30a 0.11 SH2 22 7.21a
Bluish black (n=35) M1 29 14.50a 0.78
SH2 6 6.00a
Grey blue (n= 268) H1 199 35.74a 0.52
0.0001 H2 262 5.55a
M1 8 25.08a M2 2 1.61a
PH1 5 5.423a

214
Shank color AEZ N LSM P-value
SH2 54 8.96 a
Green (n=290) H1 20 10.22b 0.0001
H2 64 64.00a
M1 42 6.93b
M2 46 9.22b
SH1 6 3.09b
SH2 18 3.05b
SH3 8 8.00b
SM1 5 2.50b
SM2 62 62.00a
SM3 19 9.500b
Green blue (n=32) H1 15
H2 11
M1 5
SH2 1
Slated blue (n=41) M1 37
SH2 4
Red (n=217) H1 4 1.33c 0.0001
M1 33 33.07b
M2 10 3.34c
SH1 36 36.02b
SH2 134 133.90a
Pale (n=320) M1 146
SH1 59
SH2 115
Mottled (n=14) M1 13
SH2 1
AEZ=Agro ecologic Zone; N= Number of chicken reported with a given shank colour in a given agro-ecology; Values
with different letter superscripts across columns are significantly different (P<0.05).

215
Table S 30. Significance test and LS means of eye colour variants across AEZ.
Eye color AEZ N LSM P-value
Orange (n=388) M1 158 95.72a
0.19
M2 15 19.90a
SH2 195 129.79a
SM3 20 49.56a
Black (n=773) H2 46 46.00a 0.35
M1 284 126.87a
51.797 a
M2 14 51.80a
SH1 105 105.00a
SH2 257 176.81
86.746 a
SM2 67 86.75a
Pearl (n=19) M1 6 5.16a 0.71
M2 7 4.10a
SH2 6 5.37a
Red (n=1200) M1 53 90.36a 0.35
M2 499 124.75a
SH2 20 109.05a
SM2 300 64.52a
SM3 328 136.35a
Brown (n=438) M1 1 58.73a 0.35
M2 154 104.20a
SH2 1 44.30a
SM3 282 123.20a
Blue black (n=367) H2 139 139.00a 0.02 M1 119 121.22b
SM2 109 117.89b
Dark brown (n=63) H2 15 22.00a 0.01 M1 24 22.00a
SM2 24 15.00b
AEZ=Agro ecologic Zone; N= Number of chicken reported with a given plumage in a given agro-ecology. Values
with different letter superscripts across columns are significantly different (P < 0.05).

216
Table S 31. Significance test and LS means of neck feather colour variants across AEZ.
Neck feather color AEZ N LSM P-value
White (n=256) H1 43 21.32a 0.28
H2 24 24.00a
M1 19 19.00 a
M2 43 42.63a
SH2 28 28.42a
SM1 71 71.05a
SM2 28 28.00 a
Black (n=139) H1 14
H2 33
M1 43
M2 6
SM1 5
SM2 38
Red (n=210) H1 38 35.47 a 0.14
H2 50 50.00 a
M1 59 59.00 a
M2 22 22.49 a
SH2 24 24.22 a
SM1 17 17.30 a
Gebsima (n=22) H1 9 4.62a 0.76
M2 3 2.84a
SH2 5 4.97a
SM1 5 4.97a
Teterima (n=18) H1 7 3.47a 0.14
M2 4 3.78a
SH2 1 0.63a
SM1 6 6.30a
Brown (N=311) H1 71 35.47a 0.23
H2 69 69.00a
M1 58 58.00a
M2 26 25.95a
SH2 24 24.22a
SM1 14 13.84a
SM2 49 49.00a
Kokima (n=4) H1 1
M2 1
SH2 1
SM1 1
Grey (n=32) H1 1
H2 11
M1 10
M2 1

217
Neck feather color AEZ N LSM P-value
SH2 1
SM2 8
Zigirima (n=47) H1 15 7.73a 0.09 M2 9 9.27a
SH2 19 18.54a
SM1 4 4.12a
Gold (n=129) H1 31 15.48a 0.16
M2 31 30.96a
SH2 34 34.40a
SM1 33 32.68a
Multiple (n=37) H1 31 4.59a 0.29
M2 2 2.04a
SH2 2 1.53a
SM1 2 2.04a
Reddish brown (n=30) H2 13
M1 11
SM2 6
AEZ=Agro ecologic Zone; N= Number of chicken reported with a given plumage in a given agro-ecology; Values
with different letter superscripts across columns are significantly different (P<0.05).
Table S 32. Significance test and LS means of skin colour variants across AEZ.
Skin color AEZ N LSM P-value
Yellow (N=1657) H1 257 64.25a 0.66
H2 125 125.00a
M1 208 69.33a
M2 344 68.81a
SH2 196 65.43a
SM1 204 101.88a
SM2 253 84.33a
SM3 70 23.33a
White (N=2624) H1 603 120.60a 0.57
H2 28 28.00a
M1 226 56.48a
M2 423 84.60a
SH2 303 100.88a
SM1 262 130.63a
SM2 380 126.67a
SM3 399 133.00a
Black (N=19) M2 19
Bluish black (n=190) H2 20 20.00a 0.73
M1 121 40.33a

218
Skin color AEZ N LSM P-value
SH2 2 2.00a
SM2 47 47.00a
Pink (n=104) H1 47
SM3 57
Red (n=764) H1 88 87.99a 0.07
M1 192 192.06a
M2 117 29.25a
SH2 203 203.03a
SM3 164 82.00a
Green (n=11; 0.20%) M2 11
AEZ = Agro ecologic Zone; N = Number of chicken reported with a given skin colour in a given agro-ecology; Values
with different letter superscripts across columns are significantly different (P < 0.05).
Table S 33. Significance test and LS means of comb type variants across AEZ
Comb type AEZ N LSM P-value
Single (n=4279) H1 1199 133.29ab 0.00
H2 203 67.76ab
M1 434 47.22ab
M2 313 28.00b
PH1 190 39.15b
SH1 141 189.59a
SH2 1325 28.20b
SH3 7 88.35ab
SM1 39 7.00b
SM2 242 9.75b
SM3 186 40.33b
Rose (n=3132) H1 175 25.26a 0.03
H2 200 66.56ab
M1 262 31.21a
M2 441 2.00a
PH1 57 61.59ab
SH1 51 56.55a
SH2 882 20.63a
SM1 193 62.27ab
SM1 519 48.25a
SM3 352 86.42a
Pea (n=2136) H1 322 35.73a 0.90
H2 62 20.67a
M1 373 33.9a
M2 17 25.51a
PH1 23 23.16a
SH1 158 31.6a

219
Comb type AEZ N LSM P-value
SH2 686 45.72a
SM1 198 49.50a
SM3 297 20.83a
Strawberry (n=35) H1 12 4.00a 0.59
M1 7 3.50a
M2 4 4.00a
SM1 3 8.00a
SH2 8 3.00 a
SM2 1 1.00a
Walnut (n=246) H1 43 21.50a 0.24
H2 17 8.53a
M1 21 4.20a
M2 13 6.50a
SH1 2 1.00a
SH2 34 6.88a
SM1 9 4.50a
SM2 77 15.30a
SM3 30 30.00a
Cushion (n=39) M1 19
SH2 5
V-shape (n=222) H2 1 1.00a 0.43
M1 15 3.75a
SH3 8 7.00a
SM1 15 8.00a
Duplex (n=70) H1 18 9.00b 0.03
M1 13 6.50b
M2 82 27.32 ab
SH1 12 6.00 b
SH2 36 11.87b
SM3 61 61.00a
Butter cup (n=9) M1 3
SH2 6
Unclassified (n=3) M1 1
SM3 2
AEZ = Agro ecologic Zone; N = Number of chicken reported with a given comb type in a given agro-ecology; Values
with different letter superscripts across columns are significantly different (P < 0.05).

220
Table S 34. Significance test and LS means of feather distribution variants across AEZ.
Feather distribution AEZ N LSM P-value
Normal (n=10715) H1 2925 205.90ab 0.001 H2 523 249.98a
M1 150 100.00b
M2 333 218.25ab
PH1 513 254.91a
SH2 4806 239.01a
SM1 1090 158.67ab
SM2 375 135.00ab
Necked Neck (n=347) H1 86 12.34 0.59 H2 8 8.41
M2 7 6.75
PH1 15 15.43
SH2 231 25.67
Crest (n=547) H1 39 19.43b 0.0001
H2 22 22.04b
PH1 15 15.43b
SH2 137 17.06b
SM1 229 114.50a
SM2 105 105.00a
Shank and feet (n=76) H1 15 15.37a 0.71 H2 10 9.57a
PH1 2 2.32a
SH2 49 8.12a
Muff and beard (n=82) PH1 2 2.32a
0.46 SH2 36 7.13a
H1 44 7.69a
Silky (n = 623) H1 194 96.86a 0.28 M2 110 109.69a
PH1 9 9.31a
SH2 219 54.86a
SM1 91 91.13a
Frizzle (n = 234) PH1 34 22.33a 0.52 SH2 200 32.09a
Body shape AEZ LSM P-value
Blocky H1 191.25a 0.06
M1 11.00a
M2 99.23a
SH2 202.50a
SM1 198.00 a
SM2 30.00a
SM3 4.95a

221
Triangle H1 29.25a 0.21
M1 9.00a
M2 37.01a
SH2 18.00a
SM1 9.00a
SM2 72.75a
SM3 49.50a
Wedge H1 4.50ab 0.02
M1 80.00ab
M2 14.49ab
SH2 4.50ab
SM1 18.00ab
SM2 47.25ab
SM3 95.55ab
AEZ=Agro ecologic Zone; N= Number of chicken reported with a given feather morphology in a given agro-ecology;
Values with different letter superscripts across columns are significantly different (P < 0.05).

222
Table S 35. Significance test and LS means of morphometric traits of chicken across dominant religion.
Dominant religion BW EN BDL WS NL CH CL WL SL SC KBL CC BAL BKL SPL
Protestant 1.66a 59.48a 35.71a 48.43a 14.82a 1.63a 3.64a 2.12a 8.79a 2.34ab 10.74a 26.579a 20.43a 2.11a 0.33a
Muslim 1.53a 56.62a 27.97bc 28.37a 10.28a 1.66a 3.72a 1.72a 8.57a 3.75a 10.87a 27.966a 19.62 ab 1.89a 0.33a
Orthodox 1.47a 52.59a 33.39ab 30.78a 8.79a 1.89a 3.14a 2.10a 8.31a 1.35b 9.95a 25.61a 17.94b 2.26a 0.33a
Traditional 1.47a 59.48a 13.39c 19.86b 12.35a 2.12a 2.84 a 1.16a 6.44a 2.33ab 9.54a 26.579a 18.03ab 2.11a 0.33a
P-value 0.77 0.73 0.00 0.002 0.78 0.79 0.61 0.68 0.16 0.04 0.70 0.432 0.02 0.83 1.00
Elevation(m) BW EN BDL WS NL CH CL WL SL SC KBL CC BAL BKL SPL
500-1800 1.31a 59.98a 33.75a 37.52a 16.46a 1.77a 3.42a 2.24a 8.36b 2.50a 9.81a 25.71a 19.50a 1.99a 0.33a
1800-2400 1.37a 54.04a 31.07a 29.97a 12.50a 1.88a 3.31a 1.98a 8.23ab 1.89a 10.41a 26.49a 18.54a 2.31a 0.33a
2400-3200 1.36a 43.16a 34.98a 37.83a 9.71a 1.64a 3.33a 1.93ab 8.72b 0.58a 11.76a 27.12a 18.18a 2.41a 0.33a
P-value 0.14 0.24 0.41 0.71 0.05 0.93 0.99 0.02 0.00 0.17 0.29 0.52 0.56 0.62 1.00
Values with different superscripts across columns are significantly different (P < 0.05).

223
Table S 36. Significance test and LS means of morphometric traits of chicken across AEZ.
Traits AEZ Minimum Maximum Mean SD LS means SE P-value
Body weight H1 1.21 1.61 1.34 0.153 1.35a 0.11 0.82
H2 1.24 1.24 1.24 0.153 1.04a 0.17
M1 0.95 1.52 1.22 0.220 1.22a 0.10
M2 0.84 1.54 1.27 0.195 1.28a 0.07
SH1 1.18 1.40 1.29 0.111 1.29a 0.17
SH2 0.98 1.54 1.25 0.222 1.25a 0.08
SM1 0.90 1.98 1.35 0.323 1.35a 0.09
SM2 1.05 1.58 1.20 0.195 1.19a 0.11
SM3 1.18 1.22 1.20 0.015 1.20a 0.14
No. of eggs/hen/year H2 62.95 62.95 62.95 0.00 62.95a 8.24 0.08
M1 53.00 76.00 63.00 9.63 63.00a 4.76
M2 47.51 61.30 53.81 5.07 53.81a 4.12
SH1 75.00 75.00 75.00 5.07 75.00a 8.24
SH2 72.00 75.60 73.57 1.51 73.57a 4.76
SM1 54.90 75.96 65.43 10.53 65.43a 5.83
SM2 55.98 58.77 57.38 1.40 55.98a 8.24
SM3 47.35 49.13 48.24 0.89 48.24a 5.83
Body length H1 17.73 38.80 29.91 9.59 36.32a 3.19 0.03
H2 18.67 23.35 21.77 2.20 35.23a 4.12
M1 18.92 34.40 22.19 4.50 35.15a 2.38
M2 17.58 37.51 27.40 8.38 29.91a 2.52
PH1 18.00 35.35 26.68 8.68 27.40a 5.04
SH2 18.28 37.57 24.19 6.69 26.68a 2.38
SM1 34.60 35.85 35.23 0.63 24.19a 5.04
SM2 33.75 36.80 35.15 1.26 22.19a 4.12
SM3 35.15 37.28 36.32 0.88 21.77a 4.12
Wing span H1 59.50 61.83 60.86 0.99 60.86ab 9.24 0.01
H2 7.42 7.76 7.59 0.17 7.59b 11.32
M1 7.64 66.77 25.83 18.94 25.83ab 5.34
M2 35.50 46.15 39.56 3.98 39.56ab 8.00
PH1 38.49 38.49 38.49 3.98 38.49ab 16.01
SH1 14.09 14.85 14.47 0.38 14.47b 11.32
SH2 73.92 73.92 73.92 0.38 73.9152a 16.01
SM1 13.84 69.90 50.76 26.12 50.76ab 9.24
SM2 35.75 43.80 38.95 3.49 38.95ab 9.24
SM3 38.05 40.59 39.16 1.06 39.16ab 9.24
Shank length H1 8.60 9.45 9.00 0.34 9.33a 0.44 0.06
H2 6.98 9.02 7.67 0.95 9.00a 0.57
M1 6.95 9.94 8.84 0.75 9.00a 0.31
M2 6.36 11.23 8.67 1.58 8.84a 0.38

224
Traits AEZ Minimum Maximum Mean SD LS means SE P-value
PH1 7.03 7.03 7.03 1.58 8.67a 0.99
SH1 9.15 9.50 9.33 0.18 8.16a 0.70
SH2 7.80 10.27 9.00 0.69 7.94a 0.35
SM1 7.40 9.42 8.16 0.77 7.67a 0.50
SM2 7.65 8.35 7.94 0.30 7.03a 0.57
SM3 6.26 8.40 7.03 0.97 7.03a 0.57
Comb height H1 1.48 1.61 1.56 0.06 2.38a 0.32 0.47
M1 1.58 1.68 1.63 0.05 1.56a 0.39
M2 1.89 2.05 1.96 0.06 1.63a 0.32
PH1 1.50 1.50 1.50 0.06 1.96a 0.56
SH2 1.47 1.47 1.47 0.06 1.50a 0.56
SM1 1.06 1.41 1.23 0.18 1.47a 0.39
SM2 1.30 2.95 2.38 0.77 1.23a 0.32
SM3 1.19 2.75 1.90 0.64 1.90a 0.32
Comb length H1 3.57 3.93 3.80 0.17 3.80a 0.23 0.02
H2 3.65 3.96 3.80 0.16 3.80a 0.28
M1 3.41 4.09 3.77 0.28 3.77a 0.23
M2 2.15 3.12 2.67 0.40 2.67a 0.23
PH1 2.72 2.72 2.72 0.40 2.72a 0.40
SH2 4.13 4.13 4.13 0.40 4.13a 0.40
SM1 3.48 3.85 3.67 0.19 3.67a 0.28
SM2 2.75 3.64 3.18 0.36 3.18a 0.23
SM3 2.30 3.28 2.92 0.44 2.92a 0.23
Wattle length H1 2.01 2.34 2.19 0.14 2.19a 0.28 0.42
H2 2.09 2.12 2.10 0.01 2.10a 0.34
M1 1.85 2.05 1.94 0.08 1.94a 0.28
M2 0.92 2.60 1.62 0.66 1.62a 0.24
PH1 2.27 2.27 2.27 0.66 2.27a 0.49
SH2 1.35 2.16 1.73 0.34 1.73a 0.24
SM1 1.80 1.96 1.88 0.08 1.88a 0.34
SM2 1.84 3.50 2.56 0.69 2.56a 0.28
SM3 1.92 2.25 2.07 0.14 2.07a 0.28
Keel bone length H1 10.92 11.07 11.00 0.06 11.0ab 0.85 0.03
H2 9.17 9.36 9.26 0.10 9.26ab 1.05
M1 9.35 13.82 11.58 2.24 11.58ab 1.05
M2 7.80 8.84 8.36 0.43 8.36b 0.85
PH1 9.41 9.41 9.41 0.43 9.41ab 1.48
SH2 15.00 15.00 15.00 0.43 15.00 a 1.48
SM1 12.70 13.05 12.88 0.18 12.88ab 1.05
SM2 8.05 12.75 9.93 2.03 9.93ab 0.85
SM3 8.44 9.75 8.90 0.60 8.90ab 0.85
Shank circumference H2 3.64 3.71 3.68 0.04 3.68a 0.87 0.1

225
Traits AEZ Minimum Maximum Mean SD LS means SE P-value
M1 0.65 3.77 1.97 1.46 1.97a 0.46
M2 3.45 4.08 3.71 0.27 3.71a 0.71
PH1 3.18 3.18 3.18 0.27 3.18a 1.23
SH1 0.72 0.75 0.73 0.02 0.73a 0.87
SM1 0.62 0.62 0.62 0.02 0.61a 1.23
Neck length H1 16.66 18.03 17.17 0.61 17.17a 0.47 0.04
M2 11.73 11.73 11.73 0.61 11.73b 0.81
SM3 10.28 11.58 10.93 0.65 10.93b 0.57
Chest circumference M1 25.39 28.04 26.57 1.10 26.57a 0.82 0.31
M2 25.48 28.81 27.14 1.67 27.14a 1.00
SH2 29.15 29.15 29.15 1.67 29.15a 1.42
SM1 25.85 26.60 26.23 0.38 26.23a 1.00
SM2 25.85 25.85 25.85 0.38 25.85a 1.42
SM3 24.03 25.11 24.57 0.54 24.57a 1.00
Back length H1 20.02 20.90 20.55 0.38 20.55a 0.28 0.01
M1 19.79 19.79 19.79 0.38 19.79ab 0.49
M2 17.63 17.63 17.63 0.38 17.63ab 0.49
SH2 20.55 20.55 20.55 0.38 20.55a 0.49
SM1 18.10 18.85 18.48 0.38 18.48ab 0.35
SM2 18.25 18.25 18.25 0.38 18.25ab 0.49
SM3 16.56 17.27 16.91 0.36 16.91 b 0.35
Beak length H2 1.87 1.92 1.90 0.02 1.90 0.97 0.39
M1 1.93 1.93 1.93 0.02 1.93 1.37
M2 1.45 4.70 3.08 1.63 3.08 0.97
PH1 3.51 3.51 3.51 1.63 3.51 1.37
SM2 4.60 5.40 5.00 0.40 5.00 0.97
SM3 4.80 4.80 4.80 0.40 4.80 1.37
Spur length M1 0.80 2.90 2.14 0.95 2.14 0.89 0.69
M2 0.17 3.62 1.51 1.51 1.51 0.89
PH1 0.57 0.57 0.57 1.51 0.57 1.54
NS = Number of sample birds; Values with different letter superscripts across columns are significantly different (P
< 0.05).

226
Table S 37. Significant test and LS means of genetic parameters across religion
Religion MNA ENA APL PA OH EH FIS PIC IBS
Traditional 5.01a 10.62b 4.68a 2.81a 0.53a 0.62a 0.08a 0.65a 0.73a
Orthodox 5.39a 3.39 a 5.00a 2.75a 0.90a 0.44a 0.08a 0.63a 0.73a
Muslim 4.90a 10.62b 4.79a 3.19a 0.48a 0.55a 0.07a 0.53a 0.74a
Protestant 5.29a 5.10a 4.66a 3.56a 0.58a 0.57a 0.06a 0.52a 0.73a
P-value 0.70 0.01 0.77 0.81 0.40 0.29 0.94 0.32 0.99
Elevation MNA ENA APL PA OH EH FIS PIC IBS
1 5.25a 5.05a 4.84a 3.53a 0.87a 0.47a 0.09a 0.63a 0.00a
2 5.45a 5.78a 4.96a 2.74a 0.88a 0.45a 0.06a 0.62a 0.00a
3 5.13a 3.75a 4.90a 2.41a 0.50a 0.55a 0.07a 0.51a 0.00a
P-value 0.68 0.58 0.93 0.210 0.29 0.42 0.48 0.11 1.00
Table S 38. Significance test and LS means of genetic parameter estimate variation across AEZ
Parameters AEZ Min Max Mean SD LS means SE P-value
Mean number of alleles H1 5.00 5.00 5.00 0.00 5.00a 0.23 0.04
H2 5.20 5.30 5.25 0.05 5.25a 0.36
M1 4.85 4.85 4.85 0.00 4.85a 0.36
M2 4.20 6.29 5.60 0.75 5.60a 0.16
SH1 6.15 6.15 6.15 0.75 6.15a 0.50
SH2 4.60 5.50 4.86 0.37 4.86a 0.17
SM2 5.27 5.43 5.30 0.06 5.30a 0.23
Observed Homozygosity H1 0.27 0.55 0.38 0.14 0.38a 0.07 0.07
H2 0.45 0.55 0.50 0.05 0.50a 0.11
M1 0.57 0.93 0.75 0.18 0.75a 0.11
M2 0.27 0.84 0.60 0.19 0.60a 0.05
SH1 0.79 0.79 0.79 0.19 0.79a 0.16
SH2 0.27 0.63 0.49 0.12 0.49a 0.05
SM2 0.49 0.75 0.58 0.09 0.58a 0.07
Expected heterozygosity H1 0.59 0.59 0.59 0.00 0.59a 0.04 0.19
H2 0.54 0.55 0.55 0.01 0.55a 0.06
M1 0.54 0.61 0.58 0.04 0.58a 0.06
M2 0.32 0.61 0.57 0.09 0.57a 0.03
SH1 0.32 0.32 0.32 0.09 0.32a 0.09
SH2 0.33 0.63 0.56 0.09 0.56a 0.03
SM2 0.33 0.62 0.53 0.10 0.53a 0.04
Polymorphic information content H1 0.47 0.47 0.47 0.00 0.47a 0.02 0.0001
H2 0.47 0.47 0.47 0.00 0.47a 0.04

227
Parameters AEZ Min Max Mean SD LS means SE P-value
M1 0.67 0.67 0.67 0.00 0.67a 0.04
M2 0.49 0.71 0.64 0.08 0.64a 0.02
SH1 0.72 0.72 0.72 0.08 0.72a 0.05
SH2 0.52 0.54 0.54 0.01 0.54a 0.02
SM2 0.68 0.68 0.68 0.00 0.68a 0.02
Coefficient of inbreeding H1 0.07 0.08 0.07 0.01 0.07ab 0.02 0.03
H2 0.17 0.17 0.17 0.01 0.17a 0.02
M1 0.08 0.08 0.08 0.01 0.08ab 0.02
M2 0.06 0.09 0.07 0.01 0.07ab 0.02
SH2 0.02 0.08 0.05 0.02 0.05b 0.01
SM2 0.05 0.11 0.08 0.02 0.08ab 0.01
Effective number of alleles H1 5.35 6.10 5.73 0.38 5.73a 1.33 0.68
H2 2.53 2.53 2.53 0.38 2.53a 1.88
M1 6.10 6.10 6.10 0.38 6.1a 1.88
SH2 5.65 5.65 5.65 0.38 5.65a 1.88
SM2 2.67 6.35 4.51 1.84 4.5a 1.33
Alleles per locus M2 5.00 5.00 5.00 1.84 5.00ab 0.05 0.04
SH2 4.70 4.70 4.70 0.00 4.70b 0.04
SM2 5.00 5.10 5.05 0.05 5.05a 0.04
Private alleles H2 3.00 3.00 3.00 0.05 3.00a 0.87 0.94
M2 3.35 3.35 3.35 0.05 3.35a 0.87
SH2 2.45 3.60 3.03 0.58 3.03a 0.61
SM2 2.00 3.75 2.77 0.73 2.77a 0.50
Identity buy state H1 0.74 0.74 0.74 0.00 0.74a 0.01 0.55
M2 0.73 0.74 0.74 0.00 0.74a 0.01
SH2 0.72 0.74 0.73 0.01 0.73a 0.01
N = No. of sampled birds; Values with P < 0.05 are significant difference.

228
Chapter 3
Table S 39. Overall allele frequency (%) of LEI0258 in indigenous chicken by allele size.
Allele Count Frequency Standard deviation
185 1 0.002 0.002
197 57 0.121 0.015
209 9 0.019 0.006
221 11 0.023 0.008
245 3 0.006 0.002
253 36 0.076 0.012
263 37 0.078 0.012
289 1 0.002 0.002
300 29 0.061 0.012
302 21 0.045 0.010
312 4 0.009 0.005
315 39 0.083 0.014
325 77 0.163 0.018
327 3 0.006 0.004
340 12 0.025 0.008
351 20 0.042 0.010
363 15 0.032 0.010
375 42 0.089 0.014
385 21 0.045 0.009
397 8 0.017 0.007
411 3 0.006 0.004
426 2 0.004 0.003
450 4 0.009 0.004
460 2 0.004 0.003
465 5 0.012 0.005
472 1 0.002 0.002
485 2 0.004 0.003
525 3 0.006 0.004
569 4 0.009 0.006

229
Table S 40. Pairwise population matrix of Nei Unbiased Genetic Distance across populations.
Pop BA SU AS GA AD EN HU KE GE KI TT AR AS DI BG SG KU LO HA MI GI ME AL NA
BA 1.00
SU 0.62 1.00
ASH 0.55 0.56 1.00
GA 0.88 0.60 0.66 1.00
AD 0.39 0.34 0.31 0.39 1.00
EN 0.78 0.62 0.67 0.81 0.58 1.00
HU 0.14 0.08 0.33 0.20 0.28 0.29 1.00
KE 0.46 0.60 0.56 0.41 0.51 0.42 0.33 1.00
GE 0.70 0.54 0.37 0.54 0.22 0.37 0.29 0.44 1.00
KI 0.61 0.51 0.52 0.58 0.24 0.40 0.24 0.49 0.71 1.00
TT 0.43 0.61 0.57 0.60 0.39 0.66 0.10 0.49 0.33 0.45 1.00
AR 0.59 0.55 0.65 0.59 0.38 0.46 0.36 0.59 0.79 0.61 0.42 1.00
AS 0.71 0.59 0.57 0.79 0.38 0.78 0.20 0.40 0.53 0.67 0.64 0.58 1.00
DI 0.63 0.63 0.58 0.74 0.39 0.70 0.24 0.39 0.60 0.78 0.76 0.60 0.80 1.00
BG 0.71 0.59 0.50 0.73 0.32 0.62 0.21 0.59 0.59 0.41 0.62 0.57 0.55 0.54 1.00
SG 0.21 0.44 0.38 0.26 0.19 0.28 0.05 0.50 0.33 0.21 0.63 0.44 0.30 0.33 0.65 1.00
KU 0.67 0.57 0.87 0.74 0.41 0.69 0.28 0.52 0.36 0.47 0.41 0.60 0.56 0.52 0.54 0.20 1.00
LO 0.70 0.56 0.72 0.71 0.25 0.63 0.21 0.49 0.59 0.77 0.59 0.70 0.75 0.78 0.59 0.43 0.63 1.00
HA 0.73 0.56 0.76 0.71 0.38 0.65 0.37 0.62 0.75 0.63 0.47 0.85 0.63 0.64 0.67 0.48 0.68 0.75 1.00
MI 0.46 0.66 0.61 0.58 0.35 0.59 0.44 0.64 0.54 0.60 0.84 0.64 0.67 0.78 0.64 0.58 0.47 0.69 0.57 1.00
GI 0.67 0.55 0.52 0.75 0.40 0.76 0.19 0.36 0.55 0.66 0.85 0.49 0.78 0.92 0.58 0.35 0.43 0.73 0.58 0.75 1.00
ME 0.83 0.56 0.62 0.82 0.32 0.65 0.25 0.44 0.80 0.65 0.56 0.77 0.67 0.71 0.70 0.30 0.62 0.73 0.80 0.61 0.76 1.00
AL 0.94 0.61 0.61 0.90 0.34 0.75 0.18 0.46 0.77 0.72 0.59 0.68 0.78 0.77 0.72 0.29 0.62 0.78 0.77 0.61 0.82 0.93 1.00
NA 0.36 0.30 0.27 0.37 0.64 0.29 0.35 0.57 0.55 0.36 0.17 0.67 0.31 0.38 0.32 0.13 0.29 0.28 0.60 0.31 0.31 0.49 0.41 1.00
BA = Batambe; SU = Surta; ASH = Amesha Shinkuri; GA = Gafera; AD = 025-Adane; ME= Meseret; HU= Hugub; KE = Kefis; GE = Gesses; KI = Kido; TT =
Tsion Teguaz; AR = Arabo; AS = Ashuda; DI = Dikuli; BG = Bekele Girisa; SG = Shumbi Gemo; KU = Kumato; LO = Loya; HA = Hadushi Adi; MI = Mihiquan;
GI = Gijet; ME = Metkilimat; AL = Alifa Midir; NA = Negasi Amba.

230
Table S 41. Pairwise population matrix of Nei Unbiased Genetic Distance across MAEZ.
MEZ A1 M1 M2 M3 SA2 SH1 SH2 SM2
A1 0.000
M1 1.040 0.000
M2 1.299 0.356 0.000
M3 1.239 0.687 0.000 0.000
SA2 2.851 1.382 0.798 0.860 0.000
SH1 1.054 1.378 0.024 0.008 1.146 0.000
SH2 1.373 0.735 0.109 0.041 0.985 0.146 0.000
SM2 1.362 0.490 0.000 0.000 0.669 0.000 0.000 0.000
A1 = Hot to warm arid lowland plains; M1 = Hot to warm moist lowlands; M2 = Tepid to cool moist mid highlands;
M3 = Cold to very cold moist sub-afro-alpine to afro-alpine; SA2 = Tepid to cool semi-arid mid highlands; SH1 =
Hot to warm sub-humid lowlands; SH2 = Tepid to cool sub humid mid highlands; SM2 = Tepid to cool sub-moist mid
highlands.

231
Table S 42. Pairwise population FST values.
PO BA SU AS GA AD EN HU KE GE KI TT AR AS DI BG SG KU LO HA MI GI ME AL NA
BA 0 SU 0.04 0
ASH 0.05 0.04 0
GA 0.02 0.04 0.03 0
AD 0.07 0.06 0.06 0.06 0
EN 0.05 0.03 0.02 0.03 0.04 0
HU 0.12 0.11 0.08 0.10 0.09 0.08 0
KE 0.06 0.03 0.04 0.05 0.04 0.04 0.07 0
GE 0.04 0.05 0.06 0.05 0.08 0.06 0.09 0.05 0
KI 0.04 0.04 0.04 0.04 0.07 0.05 0.08 0.04 0.03 0
TT 0.07 0.04 0.04 0.04 0.06 0.02 0.11 0.04 0.07 0.05 0
AR 0.04 0.03 0.02 0.03 0.05 0.03 0.06 0.02 0.02 0.02 0.04 0
AS 0.03 0.03 0.04 0.02 0.05 0.02 0.09 0.04 0.04 0.03 0.03 0.03 0
DI 0.04 0.03 0.04 0.02 0.05 0.03 0.09 0.05 0.04 0.02 0.02 0.03 0.02 0
BG 0.03 0.03 0.04 0.02 0.06 0.03 0.08 0.03 0.04 0.04 0.03 0.02 0.03 0.03 0
SG 0.09 0.06 0.06 0.08 0.08 0.05 0.12 0.05 0.07 0.07 0.04 0.04 0.06 0.06 0.03 0
KU 0.04 0.04 0.01 0.02 0.05 0.03 0.08 0.04 0.06 0.04 0.05 0.03 0.03 0.04 0.03 0.07 0
LO 0.03 0.03 0.02 0.03 0.06 0.02 0.08 0.03 0.03 0.02 0.03 0.01 0.02 0.02 0.02 0.05 0.02 0
HA 0.03 0.03 0.02 0.03 0.05 0.03 0.07 0.02 0.02 0.02 0.04 0.01 0.02 0.03 0.02 0.04 0.02 0.01 0
MI 0.05 0.03 0.03 0.03 0.05 0.02 0.06 0.02 0.04 0.03 0.01 0.02 0.02 0.02 0.02 0.04 0.03 0.02 0.02 0
GI 0.04 0.04 0.04 0.02 0.06 0.03 0.10 0.05 0.04 0.03 0.01 0.04 0.02 0.01 0.03 0.06 0.05 0.02 0.03 0.02 0
ME 0.02 0.04 0.03 0.02 0.06 0.03 0.08 0.04 0.02 0.03 0.04 0.01 0.02 0.02 0.02 0.06 0.03 0.02 0.01 0.02 0.02 0
AL 0.01 0.04 0.04 0.01 0.07 0.04 0.10 0.05 0.02 0.03 0.04 0.03 0.02 0.02 0.02 0.07 0.03 0.02 0.02 0.03 0.02 0.01 0
NA 0.09 0.08 0.08 0.08 0.05 0.08 0.10 0.05 0.06 0.07 0.10 0.04 0.08 0.07 0.07 0.11 0.08 0.07 0.04 0.07 0.08 0.06 0.07 0
BA = Batambe; SU = Surta; ASH = Amesha Shinkuri; GA = Gafera; AD = 025-Adane; ME= Meseret; HU= Hugub; KE = Kefis; GE = Gesses; KI = Kido; TT =
Tsion Teguaz; AR = Arabo; AS = Ashuda; DI = Dikuli; BG = Bekele Girisa; SG = Shumbi Gemo; KU = Kumato; LO = Loya; HA = Hadushi Adi; MI = Mihiquan;
GI = Gijet; ME = Metkilimat; AL = Alifa Midir; NA = Negasi Amba.

232
Table S 43. Pairwise Population FST values by MAEZ.
MAEZ A1 M1 M2 M3 SA2 SH1 SH2 SM2
A1 0.000 M1 0.090 0.000 M2 0.079 0.042 0.000 M3 0.090 0.059 0.018 0.000 SA2 0.117 0.083 0.055 0.066 0.000 SH1 0.081 0.071 0.024 0.023 0.068 0.000 SH2 0.092 0.060 0.029 0.025 0.068 0.030 0.000 SM2 0.081 0.047 0.015 0.013 0.052 0.016 0.018 0.000
A1 = Hot to warm arid lowland plains; M1 = Hot to warm moist lowlands; M2 = Tepid to cool moist mid highlands;
M3 = Cold to very cold moist sub-afro-alpine to afro-alpine; SA2 = Tepid to cool semi-arid mid highlands; SH1 =
Hot to warm sub-humid lowlands; SH2 = Tepid to cool sub humid mid highlands; SM2 = Tepid to cool sub-moist mid
highlands.

233
Table S 44. Pair wise genetic distance between Ethiopian chickens based on microsatellite LEI0258 sequences.
1 3 4 5 6 7 8 9 10 11 12 13 14 15 17 18 19 20 21 22 23 Chickens
0 23.8 49.2 26.4 48.7 48.7 48.7 48.7 48.7 48.7 48.7 25.9 25.9 25.9 25.9 26.9 25.9 48.7 48.7 48.7 51.3 Batanbe_4H 1
0 48.4 21.7 51.2 51.2 51.2 51.2 51.2 51.2 51.2 22.6 22.6 22.6 22.6 23.5 22.6 51.2 51.2 51.2 51.6 Meseret_156b 3
0 46.2 50.4 50.4 49.6 50.0 50.0 50.4 50.4 48.3 48.3 48.3 48.3 48.3 48.3 50.4 50.4 50.4 60.2 Hugub_H2 4
0 53.6 53.6 51.6 51.6 54.0 54.0 54.0 20.8 20.8 21.2 21.2 22.0 21.2 54.4 54.4 54.4 54.4 Tsion_9C 5
0 0 15.2 14.8 17.3 16.6 16.6 51.6 51.6 53.4 51.9 53.7 53.7 19.4 19.4 19.4 51.6 Ashuda_1C 6
0 15.2 14.8 17.3 16.6 16.6 51.6 51.6 53.4 51.9 53.7 53.7 19.4 19.4 19.4 51.6 Kefis_12C 7
0 0.3 14.9 14.6 14.6 52.9 52.9 52.5 53.9 52.5 54.2 19.0 19.0 19.0 51.9 BekeleGirisa_8H 8
0 15.3 14.2 14.2 52.9 52.9 52.5 53.9 52.5 54.2 18.6 18.6 18.6 52.2 ShubiGemo_1H 9
0 1.0 1.0 54.1 54.1 53.1 53.1 54.7 53.4 18.6 18.6 18.6 53.1 Ashuda_10H 10
0 0 54.1 54.1 53.1 52.8 54.4 53.1 17.9 17.9 17.9 53.1 Dikuli_4H 11
0.0 54.1 54.1 53.1 52.8 54.4 53.1 17.9 17.9 17.9 53.1 Gijet_49H 12
0 0 13.6 14.9 17.2 17.8 55.7 55.7 55.7 51.8 Gafera_8C 13
0 13.6 14.9 17.2 17.8 55.7 55.7 55.7 51.8 Ashuda_9C 14
0 13.1 15.3 15.9 57.0 56.7 56.7 52.0 Dikuli_7H 15
0 12.9 13.8 55.9 56.2 56.2 53.5 NgasiAmba_4H 17
0 12.8 58.0 58.0 58.0 55.1 Hugub_H9 18
0 57.7 57.7 57.7 54.9 Adane_9C 19
0 0.3 0.3 55.4 BekeleGirisa_H1 20
0 0 55.2 Kumato_2C 21
0 55.2 Kumato_5H 22
0 Surta_7H 23

234
Appendix 1. Raw sequences of LEI0258 alleles in indigenous chicken of Ethiopia.
R13: ATGTCTTCTTTCT
R12: TTCCTTCTTTCT
>Batambe_4H (Accession No. MG495227)
CACGCAGCAGAACTTGGTAAGGGAATTCCCTCCCTGGGTTTGTTCTCTTGTTTTTCTCTTTTGGAGGGGGATTTTTTCTATGTCTTCTTTCTTTCCTT
CTTTCTTTCCTTCTTTCTTTTCTTCTTTCTTTCCTTGGCCAAAAAAATCACCTCAAAATGAGCCTGAATGTTTGCACTGAGGACTGAGCACAGCT
>Meseret_156b (Accession No. MG495229)
CACGCAGCAGAACTTGGTAAGGGAATTCCCTCCCTGGGTTTGTTCTCTTGTTTTTCTCTTTTGGAGGGGGATTTTTTCTATGTCTTCTTTCTTTCCTT
CTTTCTTTCCTTCTTTCTTTCCTTCTTTCTTTCCTTCTTTCTTTCCTTCTTTCTTTCCTTGGCCAAAAAAATCACCTCAAAATGAGCCTGAATGTTTGC
ACTGAGGACTGAGCACAGCT
>Hugub_H2 (Accession No. MG495230)
CACGCAGCAGAACTTGGTAAGGGAATTGCCTCCGGGGGTTTGGTCTCGCGGCTTATCTTTTGGAGGGGGATTTTTTCTATGTCTTCTTTCTTTCCT
TTTTTCTTTCCTTGTTTCTTTCCTTCTTTCTTTCCTTCTTTCTTTCCTTCTTTCTTTCCTTCTTTCTTTCCTTGGATTTTGAGCCAAAAATATCACCTCA
AAATGAGCCTGAATGTTTGCACTGAGGACTGAGCACAGCT
>Tsion_9C (Accession No. MG495231)
CACGCAGCAGAACTTGGTAAGGGAATTCCCTCCCTGGGTTTGTTCTCTTGTTTTTCTCTTTTGGAGGGGGATTTTTTCTATGTCTTCTTTCTTTCCTT
CTTTCTTTCCTTCTTTCTTTCCTTCTTTCTTTCCTTCTTTCTTTCCTTCTTTCTTTCCTTCTTTCTTTCCTTCTTTCTTTCCTTGGATTTTGAGCCAAAAA
ATATCACCTCAAAATGAGCCTGAATGTTTGCACTGAGGACTGAGCACAGCT
>Ashuda_1C ((Accession No. MG495232)
CACGCAGCAGAACTTGGTAAGGGAATTCCCTCCCTGGGTTTGTTCTCATTTTTCTCTTTTGGAGGGGGATTTTTTCTATGTCTTCTTTCTTTCCTTCT
TTCTTTCCTTCTTTCTTTCCTTCTTTCTTTCCTTCTTTCTTTCCTTCTTTCTTTCCTTCTTTCTTTCCTTCTTTCTTTCCTTCTTTCTTTCCTTCTTTCTTT
CCTTCTTTCTTTCCTTGGATTTTGAGCCAAAAAAATCACCTCAAAATGAGCCTGAATGTTTGCACTGAGGACTGAGCACAGCT
>Kefis_12C (Accession No. MG495233)
CACGCAGCAGAACTTGGTAAGGGAATTCCCTCCCTGGGTTTGTTCTCATTTTTCTCTTTTGGAGGGGGATTTTTTCTATGTCTTCTTTCTTTCCTTCT
TTCTTTCCTTCTTTCTTTCCTTCTTTCTTTCCTTCTTTCTTTCCTTCTTTCTTTCCTTCTTTCTTTCCTTCTTTCTTTCCTTCTTTCTTTCCTTCTTTCTTT
CCTTCTTTCTTTCCTTGGATTTTGAGCCAAAAAAATCACCTCAAAATGAGCCTGAATGTTTGCACTGAGGACTGAGCACAGCT

235
>BekeleGirisa_8H (Accession No. MG495234)
CACGCAGCAGAACTTGGTAAGGGAATTCCCTCCCTGGGTTTGTTCTCGTTTTTCTCTTTTGGAGGGGGATTTTTTCTATGTCTTCTTTCTTTCCTTCT
TTCTTTCCTTCTTTCTTTCCTTCTTTCTTTCCTTCTTTCTTTCCTTCTTTCTTTCCTTCTTTCTTTCCTTCTTTCTTTCCTTCTTTCTTTCCTTCTTTCTTT
CCTTCTTTCTTTCCTTCTTTCTTTCCTTGGATTTTGAGCCAAAAAAATCACCTCAAAATGAGCCTGAATGTTTGCACTGAGGACTGAGCACAGCT
>ShubiGemo_1H (Accession No. MG495235)
CACGCAGCAGAACTTGGTAAGGGAATTCCCTCCCTGGGTTTGTTCTCATTTTTCTCTTTTGGAGGGGGATTTTTTCTATGTCTTCTTTCTTTCCTTCT
TTCTTTCCTTCTTTCTTTCCTTCTTTCTTTCCTTCTTTCTTTCCTTCTTTCTTTCCTTCTTTCTTTCCTTCTTTCTTTCCTTCTTTCTTTCCTTCTTTCTTT
CCTTCTTTCTTTCCTTCTTTCTTTCCTTGGATTTTGAGCCAAAAAAATCACCTCAAAATGAGCCTGAATGTTTGCACTGAGGACTGAGCACAGCT
>Ashuda_10H (Accession No. MG495236)
CACGCAGCAGAACTTGGTAAGGGAATTCCCTCCCTGGGTTTGTTCTCGTTTTTCTCTTTTGGAGGGGGATTTTTTGTATGTCTTCTTTCTTTCCTTC
TTTCTTTCCTTCTTTCTTTCCTTCTTTCTTTCCTTCTTTCTTTCCTTCTTTCTTTCCTTCTTTCTTTCCTTCTTTCTTTCCTTCTTTCTTTCCTTCTTTCTTT
CCTTCTTTCTTTCCTTCTTTCTTTCCTTCTTTCTTTCCTTGGATTTTGAGCCAAAAAAATCACCACAAAATGAGCCTGAATGTTTGCACTGAGGACT
GAGCACAGCT
>Dikuli_4H (Accession No. MG495237)
CACGCAGCAGAACTTGGTAAGGGAATTCCCTCCCTGGGTTTGTTCTCATTTTTCTCTTTTGGAGGGGGATTTTTTCTATGTCTTCTTTCTTTCCTTCT
TTCTTTCCTTCTTTCTTTCCTTCTTTCTTTCCTTCTTTCTTTCCTTCTTTCTTTCCTTCTTTCTTTCCTTCTTTCTTTCCTTCTTTCTTTCCTTCTTTCTTT
CCTTCTTTCTTTCCTTCTTTCTTTCCTTCTTTCTTTCCTTGGATTTTGAGCCAAAAAAATCACCTCAAAATGAGCCTGAATGTTTGCACTGAGGACT
GAGCACAGCT
>Gijet_49H (Accession No. MG495238)
CACGCAGCAGAACTTGGTAAGGGAATTCCCTCCCTGGGTTTGTTCTCATTTTTCTCTTTTGGAGGGGGATTTTTTCTATGTCTTCTTTCTTTCCTTCT
TTCTTTCCTTCTTTCTTTCCTTCTTTCTTTCCTTCTTTCTTTCCTTCTTTCTTTCCTTCTTTCTTTCCTTCTTTCTTTCCTTCTTTCTTTCCTTCTTTCTTT
CCTTCTTTCTTTCCTTCTTTCTTTCCTTCTTTCTTTCCTTGGATTTTGAGCCAAAAAAATCACCTCAAAATGAGCCTGAATGTTTGCACTGAGGACT
GAGCACAGCT
>Gafera_8C (Accession No. MG495239)
CACGCAGCAGAACTTGGTAAGGGAATTCCCTCCCTGGGTTTGTTCTCTTGTTTTTCTCTTTTGGAGGGGGATTTTTTCTATGTCTTCTTTCTTTCCTT
CTTTCTTTCCTTCTTTCTTTCCTTCTTTCTTTCCTTCTTTCTTTCCTTCTTTCTTTCCTTCTTTCTTTCCTTCTTTCTTTCCTTCTTTCTTTCCTTCTTTCT
TTCCTTCTTTCTTTCCTTCTTTCTTTCCTTCTTTCTTTCCTTGGATTTTGAGCCAAAAATATCACCTCAAAATGAGCCTGAATGTTTGCACTGAGGAC
TGAGCACAGCT
>Ashuda_9C (Accession No. MG495240)
CACGCAGCAGAACTTGGTAAGGGAATTCCCTCCCTGGGTTTGTTCTCTTGTTTTTCTCTTTTGGAGGGGGATTTTTTCTATGTCTTCTTTCTTTCCTT
CTTTCTTTCCTTCTTTCTTTCCTTCTTTCTTTCCTTCTTTCTTTCCTTCTTTCTTTCCTTCTTTCTTTCCTTCTTTCTTTCCTTCTTTCTTTCCTTCTTTCT
TTCCTTCTTTCTTTCCTTCTTTCTTTCCTTCTTTCTTTCCTTGGATTTTGAGCCAAAAATATCACCTCAAAATGAGCCTGAATGTTTGCACTGAGGAC
TGAGCACAGCT
>Dikuli_7H (Accession No. MG495241)
CACGCAGCAGAACTTGGTAAGGGAATTCCCTCCCTGGGTTTGTTCTCTTGTTTTTCTCTTTTGGAGGGGGATTTTTTCTATGTCTTCTTTCTTTCCTT
CTTTCTTTCCTTCTTTCTTTCCTTCTTTCTTTCCTTCTTTCTTTCCTTCTTTCTTTCCTTCTTTCTTTCCTTCTTTCTTTCCTTCTTTCTTTCCTTCTTTCT
TTCCTTCTTTCTTTCCTTCTTTCTTTCCTTCTTTCTTTCCTTCTTTCTTTCCTTGGATTTTGAGCCAAAAAAATCACCACAAAATGAGCCTGAATGTT
TGCACTGAGGACTGAGCACAGCT
>NegasiAmba_4H (Accession No. MG495243)

236
CACGCAGCAGAACTTGGTAAGGGAATTCCCTCCCTGGGTTTGTTCTCTTGTTTTTCTCTTTTGGAGGGGGATTTTTTCTATGTCTTCTTTCTTTCCTT
CTTTCTTTCCTTCTTTCTTTCCTTCTTTCTTTCCTTCTTTCTTTCCTTCTTTCTTTCCTTCTTTCTTTCCTTCTTTCTTTCCTTCTTTCTTTCCTTCTTTCT
TTCCTTCTTTCTTTCCTTCTTTCTTTCCTTCTTTCTTTCCTTCTTTCTTTCCTTCTTTCTTTCCTTGGATTTTGAGCCAAAAATATCACCTCAAAATGA
GCCTGAATGTTTGCACTGAGGACTGAGCACAGCT
>Hugub_H9 (Accession No. MG495244)
CACGCAGCAGAACTTGGTAAGGGAATTCCCTCCCTGGGTTTGTTCTCTTGTTTTTCTCTTTTGGAAGGGAATTTTTTCTATGTCTTCTTTCTTTCCTT
CTTTCTTTCCTTCTTTCTTTCCTTCTTTCTTTCCTTCTTTCTTTCCTTCTTTCTTTCCTTCTTTCTTTCCTTCTTTCTTTCCTTCTTTCTTTCCTTCTTTCT
TTCCTTCTTTCTTTCCTTCTTTCTTTCCTTCTTTCTTTCCTTCTTTCTTTCCTTCTTTCTTTCCTTCTTTCTTTCCTTGAATTTTGAGCCAAAAATATCA
CCTCAAAATGAGCCTGAATGTTTGCACTGAGGACTGAGCACAGCT
>Adane_9C (Accession No. MG495245)
CACGCAGCAGAACTTGGTAAGGGAATTCCCTCCCTGGGTTTGTTCTCTTGTTTTTCTCTTTTGGAGGGGGATTTTTTCTATGTCTTCTTTCTTTCCTT
CTTTCTTTCCTTCTTTCTTTCCTTCTTTCTTTCCTTCTTTCTTTCCTTCTTTCTTTCCTTCTTTCTTTCCTTCTTTCTTTCCTTCTTTCTTTCCTTCTTTCT
TTCCTTCTTTCTTTCCTTCTTTCTTTCCTTCTTTCTTTCCTTCTTTCTTTCCTTCTTTCTTTCCTTCTTTCTTTCCTTCTTTCTTTCCTTGGATTTTGAGCC
AAAAATATCACCTCAAAATGAGCCTGAATGTTTGCACTGAGGACTGAGCACAGCT
>BekeleGirisa_H1 (Accession No. MG495246)
CACGCAGCAGAACTTGGTAAGGGAATTCCCTCCCTGGGTTTGTTCTCATTTTTCTCTTTTGGAGGGGGATTTTTTCTATGTCTTCTTTCTTTCCTTCT
TTCTTTCCTTCTTTCTTTCCTTCTTTCTTTCCTTCTTTCTTTCCTTCTTTCTTTCCTTCTTTCTTTCCTTCTTTCTTTCCTTCTTTCTTTCCTTCTTTCTTT
CCTTCTTTCTTTCCTTCTTTCTTTCCTTCTTTCTTTCCTTCTTTCTTTCCTTCTTTCTTTCCTTCTTTCTTTCCTTCTTTCTTTCCTTCTTTCTTTCCTTCT
TTCTTTCCTTGAATTTTGAGCCAAAAAAATCACCTCAAAATGAGCCTGAATGTTTGCACTGAGGACTGAGCACAGCT
>Kumato_2C (Accession No. MG495247)
CACGCAGCAGAACTTGGTAAGGGAATTCCCTCCCTGGGTTTGTTCTCATTTTTCTCTTTTGGAGGGGGATTTTTTCTATGTCTTCTTTCTTTCCTTCT
TTCTTTCCTTCTTTCTTTCCTTCTTTCTTTCCTTCTTTCTTTCCTTCTTTCTTTCCTTCTTTCTTTCCTTCTTTCTTTCCTTCTTTCTTTCCTTCTTTCTTT
CCTTCTTTCTTTCCTTCTTTCTTTCCTTCTTTCTTTCCTTCTTTCTTTCCTTCTTTCTTTCCTTCTTTCTTTCCTTCTTTCTTTCCTTCTTTCTTTCCTTCT
TTCTTTCCTTGGATTTTGAGCCAAAAAAATCACCTCAAAATGAGCCTGAATGTTTGCACTGAGGACTGAGCACAGCT
>Kumato_5H (Accession No. MG495248)
CACGCAGCAGAACTTGGTAAGGGAATTCCCTCCCTGGGTTTGTTCTCATTTTTCTCTTTTGGAGGGGGATTTTTTCTATGTCTTCTTTCTTTCCTTCT
TTCTTTCCTTCTTTCTTTCCTTCTTTCTTTCCTTCTTTCTTTCCTTCTTTCTTTCCTTCTTTCTTTCCTTCTTTCTTTCCTTCTTTCTTTCCTTCTTTCTTT
CCTTCTTTCTTTCCTTCTTTCTTTCCTTCTTTCTTTCCTTCTTTCTTTCCTTCTTTCTTTCCTTCTTTCTTTCCTTCTTTCTTTCCTTCTTTCTTTCCTTCT
TTCTTTCCTTGGATTTTGAGCCAAAAAAATCACCTCAAAATGAGCCTGAATGTTTGCACTGAGGACTGAGCACAGCT
>Surta_7H (Accession No. MG495249)
CACGCAGCAGAACTTGGTAAGGGAATTCCCTCCCTGGGAGCGTTCTTGGGTAAGGGAATGGAGGGCGCGGTTTTGTTTTCCTTCTTTCTTTCCTTG
GATGGGGCCTTCTTTCATGTCTTCTTTCTTTCCTTCTTTCTTTCCTTCTTTCTTTCCTTCTTTCTTTCCTTCTTTCTTTCCTTCTTTCTTTCCTTCTTTCT
TTCCTTCTTTCTTTCCTTCTTTCTTTCCTTGTTTTTTCACCTCTTTATCCCTTTTTTACTCCCCGTATATTGATCGCAAAAAAGACTGATAAAATGAT
CCAGAATGTTTGCAAAAAGGATTGACCACAATTTATACTGCCACAAAAAAAAATTTCTTTCCTTCTTTCTTTCCTTCTTTCTTTCCTTCTTTCTTTC
CTTATTTCTTTCCTTCTTTCTTTCCTTGGATTTTGAGCCAAAAATATCACCTCAAAATGAGCCTGAATGTTTGCACTGAGGACTGAGCACAGCT

237
Chapter 4
Figure S 1. The admixture plots for Ethiopian indigenous chicken populations (6 < K < 10).

238

239

240

241

242

243

244
Figure S 2. SNP density for individual chromosomes across the genome
Chromosome positions (Mb) are presented on the x-axis and on the y-axis heterozygosity is given as the density of heterozygous SNPs corrected for the number of bases covered within a window size of
300 Kb.

245
chr11:2800000
2800001 2800011 2800021 2800031 2800041 2800051 2800061
NNNNNNNNNNNNNNNNNNNNNNNNNNNNNNNNNNNNNNNNNNNNNNNNNNNNNNNNNNNNNNNNNNNNNNNNN
NNNNNNN
Figure S 3. Magnified view and sequence information of unmapped regions extracted using samtools view from the SNP density plot of the 1 Kb genome
coverage.

246
Table S 45. List of genes in nonsynonymous deleterious variants in 27 populations.
Gene stable ID Gene start (bp) Gene end (bp) Gene name
ENSGALG00000000071 189094840 189101813 DDIAS
ENSGALG00000000081 205312 210738 IL4I1
ENSGALG00000000104 1080122 1086604 CRY4
ENSGALG00000000109 9950627 9953475 AFMID
ENSGALG00000000123 134466 137899 ENSGALG00000000168 981821 998840 ADORA1
ENSGALG00000000243 1782741 1787570 RDM1
ENSGALG00000000264 47377290 47399491 ENSGALG00000000329 1288997 1307914 AHCYL1
ENSGALG00000000396 2503689 2516378 METTL2A
ENSGALG00000000399 2677578 2680770 DUSP28
ENSGALG00000000477 1508360 1510438 ENSGALG00000000504 1529164 1533184 ETV7
ENSGALG00000000507 18986242 18989246 CPNE7
ENSGALG00000000516 19022589 19054970 FANCA
ENSGALG00000000521 19057727 19063586 SPIRE2
ENSGALG00000000584 375289 387140 ENSGALG00000000611 1775328 1779751 PPP1R15B
ENSGALG00000000625 3126090 3162020 MAPT
ENSGALG00000000637 554292 560757 ZBTB48
ENSGALG00000000638 19158556 19163523 UTP4
ENSGALG00000000652 604020 610916 ACOT7
ENSGALG00000000699 19283823 19315488 WWP2
ENSGALG00000000720 1432743 1440630 ENSGALG00000000722 900940 906771 ENSGALG00000000761 193483508 193498274 TSKU
ENSGALG00000000803 1957157 1958826 ENSGALG00000000845 194108535 194189490 UVRAG
ENSGALG00000000908 20121097 20141797 ADAT1
ENSGALG00000001025 10048762 10063018 GOLGA1
ENSGALG00000001028 527581 580075 RNF43
ENSGALG00000001049 657606 667042 ENSGALG00000001062 502768 516984 GGT7
ENSGALG00000001076 776890 785744 LIMK1
ENSGALG00000001084 2286962 2297493 ATP8B3
ENSGALG00000001091 2605227 2608015 C1orf116
ENSGALG00000001111 1085143 1257267 ENSGALG00000001158 10285736 10327040 UIMC1
ENSGALG00000001175 2686743 2697121 C4BPA
ENSGALG00000001181 1075877 1112534 KCNJ5
ENSGALG00000001206 8366752 8370140 ENSGALG00000001235 2618283 2624077 ANKRD24
ENSGALG00000001252 2632685 2637600 CREB3L3
ENSGALG00000001267 2637819 2646108 MAP2K2

247
Gene stable ID Gene start (bp) Gene end (bp) Gene name
ENSGALG00000001332 663124 682263 RBL1
ENSGALG00000001412 2464702 2487049 SEMA7A
ENSGALG00000001446 8882615 8908331 GSN
ENSGALG00000001449 2519526 2529895 STRA6
ENSGALG00000001479 3177600 3181452 CYB5D2
ENSGALG00000001504 3284914 3291217 DDX20
ENSGALG00000001565 8801959 8828360 C5
ENSGALG00000001583 8783105 8792615 TRAF1
ENSGALG00000001586 2570401 2574557 NEIL1
ENSGALG00000001632 3387552 3388959 MIS12
ENSGALG00000001658 4534537 4536944 RPL19
ENSGALG00000001691 2335818 2343146 INTS11
ENSGALG00000001696 1187620 1202062 SAG
ENSGALG00000001697 815561 836748 ENSGALG00000001723 4307425 4310801 ENSGALG00000001749 1642902 1659177 ACSBG2
ENSGALG00000001765 68485992 68502940 CAAP1
ENSGALG00000001800 1559956 1567028 ENSGALG00000001828 4089023 4097513 SH2B2
ENSGALG00000001857 2472220 2486139 C1QTNF12
ENSGALG00000001866 14407361 14411064 MCHR2
ENSGALG00000001895 4684399 4691245 ENSGALG00000001912 3621009 3642966 ENSGALG00000001936 1309264 1343370 MYO7B
ENSGALG00000002008 4517732 4531542 RNF157
ENSGALG00000002083 2149947 2153763 ENSGALG00000002098 3867936 3937207 GRIK3
ENSGALG00000002106 1330224 1344472 CLCC1
ENSGALG00000002111 13364535 13374948 ENSGALG00000002112 4028838 4033940 CSF3R
ENSGALG00000002138 1447839 1450278 HYAL2
ENSGALG00000002143 1431681 1447736 ANKLE2
ENSGALG00000002144 4072417 4093864 THRAP3
ENSGALG00000002175 1456284 1483196 KIF14
ENSGALG00000002179 4661984 4675773 FBF1
ENSGALG00000002199 2863974 2878026 KLHL17
ENSGALG00000002201 13315606 13335789 PPL
ENSGALG00000002253 1780053 1810653 HEMK1
ENSGALG00000002266 2853372 2902314 OGDHL
ENSGALG00000002276 13277094 13283352 EME2
ENSGALG00000002325 13259080 13261144 IGFALS
ENSGALG00000002403 2638997 2708090 ULK1
ENSGALG00000002447 2590011 2698188 CTNNA1
ENSGALG00000002453 2927136 2938279 ABCA7
ENSGALG00000002463 4879162 4882722 SUMF2
ENSGALG00000002470 22543083 22545995 CYP27A1
ENSGALG00000002489 8195255 8199280 PPP1R26

248
Gene stable ID Gene start (bp) Gene end (bp) Gene name
ENSGALG00000002504 3508644 3516114 TROVE2
ENSGALG00000002551 13130172 13153006 CFAP70
ENSGALG00000002561 4080350 4082578 ENSGALG00000002563 4446782 4454984 TPM4
ENSGALG00000002570 1936311 1938756 ENSGALG00000002587 4944774 4972405 CRCP
ENSGALG00000002591 2957605 2959977 POLR2E
ENSGALG00000002597 13126748 13129142 MSS51
ENSGALG00000002622 1930227 1934679 FCHSD1
ENSGALG00000002638 5116741 5157334 ENSGALG00000002663 10472558 10508150 ATR
ENSGALG00000002678 2637608 2655172 CSPG4
ENSGALG00000002679 3736274 3781857 GLT1D1
ENSGALG00000002692 4177681 4185200 ENSGALG00000002710 5253421 5283874 IPMK
ENSGALG00000002802 4361060 4364487 PACSIN1
ENSGALG00000002820 3732186 3735823 DFFA
ENSGALG00000002831 8853753 8918179 SH3PXD2B
ENSGALG00000002843 5340639 5344241 RILP
ENSGALG00000002845 6694536 7131100 CTNNA3
ENSGALG00000002849 5041127 5044158 DCXR
ENSGALG00000002853 2041059 2091973 CFDP1
ENSGALG00000002855 7501369 7519642 SARDH
ENSGALG00000002860 4573764 4579315 MLN
ENSGALG00000002877 5050116 5059719 LRRC45
ENSGALG00000002931 4258298 4259712 REG4
ENSGALG00000002932 5120226 5122254 NME2
ENSGALG00000002945 3328395 3380261 TMEM266
ENSGALG00000002955 7446665 7466142 ADAMTSL2
ENSGALG00000002971 10206726 10259504 NSD1
ENSGALG00000002980 8157125 8275706 RTKN2
ENSGALG00000003024 3671339 3676081 ARMC6
ENSGALG00000003031 5414295 5420886 SMYD4
ENSGALG00000003047 3676512 3687043 SUGP2
ENSGALG00000003058 3693225 3701042 ENSGALG00000003105 6179731 6229305 ANKFN1
ENSGALG00000003126 3073321 3558739 ERBB4
ENSGALG00000003181 7348592 7351670 SURF2
ENSGALG00000003194 4955473 4970589 ATP6V0A2
ENSGALG00000003197 7341076 7344697 RPL7A
ENSGALG00000003285 10365016 10375987 CDHR2
ENSGALG00000003294 6696138 6712562 ATAD5
ENSGALG00000003337 5166291 5170582 EIF3I
ENSGALG00000003400 976634 979055 AIMP2
ENSGALG00000003403 5186133 5220676 ZNF385C
ENSGALG00000003412 7265700 7284064 ENSGALG00000003419 5099849 5123800 MPHOSPH9

249
Gene stable ID Gene start (bp) Gene end (bp) Gene name
ENSGALG00000003435 4946918 4950939 PGC
ENSGALG00000003476 6829425 6861860 ERN1
ENSGALG00000003499 4037999 4047856 MAST3
ENSGALG00000003540 6970209 6982733 CEP95
ENSGALG00000003563 5279493 5284301 YARS
ENSGALG00000003569 1309031 1318031 TMEM130
ENSGALG00000003572 4085166 4125847 ENSGALG00000003574 3756709 3784646 LPCAT2
ENSGALG00000003589 5643262 5647788 VTN
ENSGALG00000003661 6964407 6992177 SETX
ENSGALG00000003665 5732371 5736475 PIGS
ENSGALG00000003693 5359116 5470470 MACF1
ENSGALG00000003731 4331470 4369323 FBXO42
ENSGALG00000003742 4229272 4253848 CPAMD8
ENSGALG00000003774 4411149 4423378 ATP13A2
ENSGALG00000003777 2201059 2481132 NELL1
ENSGALG00000003815 5165779 5186674 RPN2
ENSGALG00000003833 5721919 5794586 CACNA1E
ENSGALG00000003849 5621877 5662732 TRPM1
ENSGALG00000003860 1738814 1777456 MID2
ENSGALG00000003863 5458325 5469803 P2RX7
ENSGALG00000003922 4838538 4857184 TOP2A
ENSGALG00000003937 12017387 12033276 GEMIN5
ENSGALG00000004017 6089879 6099342 TOR1AIP2
ENSGALG00000004028 5308806 5314214 ENSGALG00000004037 10593818 10608366 DNA2
ENSGALG00000004052 6289263 6319401 GPR107
ENSGALG00000004087 6291473 6524226 THSD4
ENSGALG00000004102 5253737 5257097 C1orf158
ENSGALG00000004104 2565759 2592534 INTS1
ENSGALG00000004110 5370082 5373738 TOMM34
ENSGALG00000004162 7872473 7878562 SLC16A6
ENSGALG00000004167 10819703 10821527 SRGN
ENSGALG00000004169 1310797 1346333 ENSGALG00000004216 6258254 6262709 TOR3A
ENSGALG00000004228 5873857 5902664 USP40
ENSGALG00000004251 1253552 1260151 ARR3
ENSGALG00000004260 1517982 1524901 PKP3
ENSGALG00000004262 6240247 6244176 TMIGD1
ENSGALG00000004267 1511993 1516792 SIGIRR
ENSGALG00000004280 1498469 1507574 ANO9
ENSGALG00000004286 11020202 11048579 COL13A1
ENSGALG00000004294 7259782 7315837 CGNL1
ENSGALG00000004297 3033149 3099125 DNAH1
ENSGALG00000004336 1242567 1251009 INPPL1
ENSGALG00000004360 13024860 13028805 ENSGALG00000004365 5736958 5749931 WDR66

250
Gene stable ID Gene start (bp) Gene end (bp) Gene name
ENSGALG00000004368 3384941 3387376 GNA12
ENSGALG00000004375 7949456 7976331 VPS35
ENSGALG00000004390 22789995 22948814 AP3B1
ENSGALG00000004424 6631529 6642933 SEC16B
ENSGALG00000004428 7973018 7976373 ENSGALG00000004475 1210009 1212138 ENSGALG00000004496 13051554 13056671 TNIP1
ENSGALG00000004502 9210257 9213583 KIF19
ENSGALG00000004509 6584989 6587790 UBB
ENSGALG00000004515 5949198 5981021 KNTC1
ENSGALG00000004529 5981277 5986395 VPS29
ENSGALG00000004538 7096736 7113948 TNN
ENSGALG00000004542 5956857 5997973 ZMYND8
ENSGALG00000004591 7408662 7414693 SERPINC1
ENSGALG00000004594 13146841 13150694 CD74
ENSGALG00000004611 4163980 4187079 FBXL18
ENSGALG00000004621 6385508 6529830 PREX1
ENSGALG00000004627 7557778 7561205 ENSGALG00000004637 6652849 6660676 ENSGALG00000004660 6686185 6699711 TRPV3
ENSGALG00000004669 6702366 6708308 ASPA
ENSGALG00000004670 3281636 3298041 ATRIP
ENSGALG00000004683 9736236 9752383 TPD52L2
ENSGALG00000004711 4401977 4407450 ENSGALG00000004742 1874383 1876926 BMP15
ENSGALG00000004750 3454111 3467101 NOL8
ENSGALG00000004767 5648047 5666048 ODF2
ENSGALG00000004798 4691169 4749364 MPRIP
ENSGALG00000004820 6935447 6938641 FAM57A
ENSGALG00000004825 1894128 1902643 HDAC8
ENSGALG00000004837 6899289 6906498 CCNDBP1
ENSGALG00000004848 6406970 6414976 YBX1
ENSGALG00000004859 6906827 6918959 ZNFX1
ENSGALG00000004888 4926676 4933844 RAI1
ENSGALG00000004921 4271288 4287004 SLC6A1
ENSGALG00000004953 5030233 5038727 DRG2
ENSGALG00000004965 5511456 5519318 SLC27A4
ENSGALG00000004978 5047798 5064630 MYO15A
ENSGALG00000005005 5104842 5107494 MIEF2
ENSGALG00000005006 11258200 11281700 UBA2
ENSGALG00000005012 5054111 5063325 ENSGALG00000005014 2066138 2068061 AIPL1
ENSGALG00000005028 5109957 5121859 TOP3A
ENSGALG00000005031 2071935 2082734 DRP2
ENSGALG00000005043 6711180 6730689 ENSGALG00000005046 5132126 5136038 SHMT1
ENSGALG00000005077 2154809 2178532 F8

251
Gene stable ID Gene start (bp) Gene end (bp) Gene name
ENSGALG00000005083 5163796 5192508 SLC5A10
ENSGALG00000005093 7209131 7215496 ENSGALG00000005102 7546069 7840288 CDH4
ENSGALG00000005118 8396685 8397791 FAM124B
ENSGALG00000005122 6773611 6789221 MYO1H
ENSGALG00000005138 6792641 6799711 KCTD10
ENSGALG00000005146 11444091 11445695 PDP2
ENSGALG00000005188 998427 1065818 MINDY4
ENSGALG00000005253 5617810 5620433 ENSGALG00000005279 7494633 7541587 BRIP1
ENSGALG00000005286 6425974 6434135 TRIM42
ENSGALG00000005315 6017339 6019278 RPUSD1
ENSGALG00000005336 2373286 2387260 GUK1
ENSGALG00000005349 6029103 6043043 ENSGALG00000005361 14154543 14161749 ENSGALG00000005426 31717648 31775857 FREM1
ENSGALG00000005434 31707297 31708392 CER1
ENSGALG00000005435 15636273 15670143 ENSGALG00000005450 8379726 8395484 CCDC66
ENSGALG00000005467 15966703 15974642 HSD17B2
ENSGALG00000005468 8618892 8649089 SYNRG
ENSGALG00000005476 3598940 3705027 PTH1R
ENSGALG00000005499 8553006 8591010 IL17RD
ENSGALG00000005517 3971607 3992312 KIF9
ENSGALG00000005519 16594013 16673810 TLL2
ENSGALG00000005527 8610054 8639123 APPL1
ENSGALG00000005535 13151075 13168747 TCOF1
ENSGALG00000005572 6193969 6197292 NOXO1
ENSGALG00000005594 9057635 9058939 OMG
ENSGALG00000005595 7194104 7204732 HPS4
ENSGALG00000005599 16785354 16790215 ENSGALG00000005609 8519646 8532665 OGFR
ENSGALG00000005618 8778424 8796646 CTR9
ENSGALG00000005621 13192090 13212308 CAMK2A
ENSGALG00000005634 7229327 7230473 CRYBA4
ENSGALG00000005654 7577645 7595931 PITPNB
ENSGALG00000005655 5184138 5190382 TSPEAR
ENSGALG00000005661 4362962 4364776 ENSGALG00000005672 13218281 13226254 SLC6A7
ENSGALG00000005687 16983558 16994562 CUEDC2
ENSGALG00000005707 9325242 9327381 IFT20
ENSGALG00000005747 2451344 2452399 ENSGALG00000005757 17821801 17827332 IRF8
ENSGALG00000005769 9313714 9322206 WEE1
ENSGALG00000005770 13295985 13313953 HMGXB3
ENSGALG00000005789 9059020 9068014 UQCRC1
ENSGALG00000005797 9022635 9065766 COL20A1

252
Gene stable ID Gene start (bp) Gene end (bp) Gene name
ENSGALG00000005801 9071546 9090148 CHRNA4
ENSGALG00000005826 4698534 4734741 DLEC1
ENSGALG00000005845 18186088 18218511 SLC7A5
ENSGALG00000005857 17636489 17657686 ENSGALG00000005869 9103875 9122950 COPG1
ENSGALG00000005889 13985788 14013189 CCDC18
ENSGALG00000005914 17786239 17817301 WASHC2C
ENSGALG00000005947 4841182 4853799 MYD88
ENSGALG00000005968 8025665 8042567 MMP11
ENSGALG00000005977 14285091 14295767 BTBD8
ENSGALG00000005986 10199239 10319919 TUB
ENSGALG00000005999 9681793 9708956 ABTB1
ENSGALG00000006025 4992188 5013715 XIRP1
ENSGALG00000006038 14391623 14498728 TGFBR3
ENSGALG00000006044 4874387 4875766 ENSGALG00000006052 5312695 5336291 WDR48
ENSGALG00000006078 6919383 6928668 PALB2
ENSGALG00000006095 18197465 18217445 FRMPD2
ENSGALG00000006099 18584503 18617687 ZFPM1
ENSGALG00000006119 11660424 11665477 SAXO2
ENSGALG00000006140 6966453 6978215 GGA2
ENSGALG00000006152 9988019 9990550 ENSGALG00000006182 10008305 10014862 NSFL1C
ENSGALG00000006188 15173264 15196009 KYAT3
ENSGALG00000006208 11990010 12080323 OTOG
ENSGALG00000006229 1267434 1272776 ENSGALG00000006239 18721562 18726300 ENSGALG00000006273 10252718 10259735 MYLK2
ENSGALG00000006352 19330373 19331756 CH25H
ENSGALG00000006357 10801221 10810412 XPC
ENSGALG00000006376 12084067 12101401 TMC3
ENSGALG00000006378 19343210 19348438 LIPA
ENSGALG00000006392 4703951 4711851 RNF168
ENSGALG00000006417 15802894 15826139 SEC24A
ENSGALG00000006436 4624346 4626196 AQP12A
ENSGALG00000006445 12413427 12483133 ARNT2
ENSGALG00000006459 11270120 11281464 CCDC174
ENSGALG00000006521 13575719 13609829 TRPM5
ENSGALG00000006526 11332373 11363615 PLXNB1
ENSGALG00000006539 4383100 4389373 C9H21orf2
ENSGALG00000006540 20039179 20040556 DD1CR
ENSGALG00000006542 9522054 9589349 ESYT2
ENSGALG00000006543 4375703 4380667 PFKL
ENSGALG00000006558 9595575 9615165 ENSGALG00000006560 8824964 8995709 SEMA3A
ENSGALG00000006597 4107760 4112433 ENSGALG00000006607 8479513 8485340 GUCD1

253
Gene stable ID Gene start (bp) Gene end (bp) Gene name
ENSGALG00000006608 14113198 14118876 ENSGALG00000006612 10358970 10373491 ASXL1
ENSGALG00000006631 12837819 12854365 TICRR
ENSGALG00000006632 3662350 3680002 CEP63
ENSGALG00000006639 20405524 20418860 CEP55
ENSGALG00000006651 11497919 11499883 OGG1
ENSGALG00000006652 9958497 10244031 DIP2C
ENSGALG00000006679 10519797 10524406 BPIFB4
ENSGALG00000006693 10526109 10530923 ENSGALG00000006700 6195950 6208354 PROSER2
ENSGALG00000006724 3082800 3338435 ENSGALG00000006755 4178788 4187152 USP2
ENSGALG00000006776 11553069 11555613 KLHDC8B
ENSGALG00000006783 11508788 11558301 PLOD2
ENSGALG00000006791 10603545 10615064 TTI1
ENSGALG00000006802 11573714 11594922 LAMB2
ENSGALG00000006804 16057748 16074923 ODF2L
ENSGALG00000006819 13624751 13893408 AGBL1
ENSGALG00000006821 5224423 5232217 TNMD
ENSGALG00000006834 12454619 12470944 CPB1
ENSGALG00000006876 10729767 10733859 CTSA
ENSGALG00000006910 11655848 11667410 IMPDH2
ENSGALG00000006911 8539866 8565249 TMC5
ENSGALG00000006963 9573525 9581879 ENDOV
ENSGALG00000006976 12679286 12696726 ENSGALG00000007001 4083114 4088567 TLR4
ENSGALG00000007003 4069259 4077367 ENSGALG00000007007 21518224 21579102 ENSGALG00000007014 22240272 22243704 ENSGALG00000007048 16877090 16897766 SYNM
ENSGALG00000007070 8795233 8824633 OTOA
ENSGALG00000007080 17126956 17144545 ENSGALG00000007098 15350861 15434281 KIF21A
ENSGALG00000007125 13135663 13572700 PARD3
ENSGALG00000007168 11946151 11967925 ENSGALG00000007169 14127254 14169164 EPC1
ENSGALG00000007438 5484062 5488400 ENSGALG00000007525 17067826 17075764 ENSGALG00000007531 22287005 22296037 ZFYVE27
ENSGALG00000007537 17085279 17109145 INCENP
ENSGALG00000007572 22321784 22335727 MMS19
ENSGALG00000007579 16147118 16204934 APBB1IP
ENSGALG00000007643 18467490 18482742 DIS3L
ENSGALG00000007645 22530257 22534464 ENSGALG00000007661 10420643 10427959 MYCBPAP
ENSGALG00000007673 10471029 10475321 LRRC59
ENSGALG00000007676 10476723 10481875 EME1

254
Gene stable ID Gene start (bp) Gene end (bp) Gene name
ENSGALG00000007710 12285790 12294879 ENSGALG00000007711 18528211 18534374 RPL4
ENSGALG00000007713 10504470 10508384 CD300LG
ENSGALG00000007766 16938374 17272982 KIAA1217
ENSGALG00000007777 9564789 9679908 SLC39A10
ENSGALG00000007815 5747940 5753666 ANKK1
ENSGALG00000007835 2071841 2105903 PUS10
ENSGALG00000007862 16927115 16996501 CNTN3
ENSGALG00000007864 17452004 17513814 ARMC3
ENSGALG00000007892 17711127 17743785 SPAG6
ENSGALG00000007907 10875974 10885281 CCDC157
ENSGALG00000007917 14926773 14978515 LAMB4
ENSGALG00000007970 19107954 19156499 PIAS1
ENSGALG00000007974 10782998 10794894 NUP85
ENSGALG00000008034 10931921 10957831 CASKIN2
ENSGALG00000008077 19355200 19358789 PAQR5
ENSGALG00000008109 14151339 14182335 CDHR3
ENSGALG00000008120 19501916 19520583 TLE3
ENSGALG00000008150 11256379 11267964 RASAL1
ENSGALG00000008155 11227663 11233652 KCTD18
ENSGALG00000008160 23400232 23499498 CNNM2
ENSGALG00000008172 3029721 3040592 ERLEC1
ENSGALG00000008176 3040531 3073125 ASB3
ENSGALG00000008180 19759094 19785369 SPG11
ENSGALG00000008185 11249381 11285636 AOX1
ENSGALG00000008256 19933508 19950517 BLM
ENSGALG00000008257 3200895 3221901 MERTK
ENSGALG00000008263 17898685 18121966 CNTN4
ENSGALG00000008266 14111920 14151756 COL4A6
ENSGALG00000008275 20020799 20022277 ENSGALG00000008283 15737984 15742734 CYP2AB1
ENSGALG00000008312 12676726 12723229 GSAP
ENSGALG00000008359 3328455 3330821 CD93
ENSGALG00000008368 19335198 19369470 RAD18
ENSGALG00000008370 11515225 11532948 TRAK2
ENSGALG00000008416 3831127 3921447 CFAP61
ENSGALG00000008475 2456073 2482710 ARRDC1
ENSGALG00000008503 15914297 15916640 ALG3
ENSGALG00000008516 12407009 12420281 CPO
ENSGALG00000008529 12432880 12443438 FASTKD2
ENSGALG00000008537 16012725 16023253 EPHB3
ENSGALG00000008544 16328932 16398413 SLC8A1
ENSGALG00000008609 4399060 4424446 PTK7
ENSGALG00000008615 24709933 24791051 LTK
ENSGALG00000008618 16559396 16566077 UPF3B
ENSGALG00000008624 24855680 24884673 RPAP1
ENSGALG00000008638 19525053 19554688 MMR1L3

255
Gene stable ID Gene start (bp) Gene end (bp) Gene name
ENSGALG00000008645 16598334 16606619 NKRF
ENSGALG00000008646 16205261 16216585 ENSGALG00000008692 25038945 25096118 ENSGALG00000008725 5571728 5637205 KIF16B
ENSGALG00000008744 16272609 16420707 MCF2L2
ENSGALG00000008776 22165912 22185499 HYAL6
ENSGALG00000008780 16611056 16617553 CTBS
ENSGALG00000008786 13740109 13819369 NBEAL1
ENSGALG00000008791 20613975 20640410 NMT2
ENSGALG00000008803 13841905 13846428 ENSGALG00000008810 15354761 15359822 FAM161A
ENSGALG00000008815 15330848 15337331 LRRN4
ENSGALG00000008819 2026955 2051551 LRSAM1
ENSGALG00000008885 14004793 14133988 PDE1A
ENSGALG00000008888 16915775 17249012 ENSGALG00000008914 27468288 27513634 NRAP
ENSGALG00000008937 8953571 8983004 PPP1R21
ENSGALG00000008942 8915296 8942633 FOXN2
ENSGALG00000008946 27592399 27623494 NHLRC2
ENSGALG00000008962 8658316 8685996 MSH2
ENSGALG00000008974 19041884 19071668 USP33
ENSGALG00000008980 27760066 27774032 VWA2
ENSGALG00000008999 27778781 27799753 AFAP1L2
ENSGALG00000009001 14833295 14861223 CWC22
ENSGALG00000009004 21380802 21410300 ZNF804B
ENSGALG00000009017 21695262 21701570 STEAP2
ENSGALG00000009026 21710551 21734535 ENSGALG00000009032 19675023 19681422 PIF1
ENSGALG00000009119 16761868 16770284 THUMPD2
ENSGALG00000009134 24474948 24550085 CTTNBP2
ENSGALG00000009145 25824681 25835329 ENSGALG00000009205 14117925 14203370 ENSGALG00000009250 15889941 15901595 HNRNPA3
ENSGALG00000009266 20484771 20491761 FGA
ENSGALG00000009301 16865856 16875595 CHRNA1
ENSGALG00000009315 26297611 26324915 PAPLN
ENSGALG00000009345 26454626 26467002 ENSGALG00000009365 22521894 22535678 CYP51A1
ENSGALG00000009369 30049291 30054581 PRDX3
ENSGALG00000009415 27718429 27835276 SMOC1
ENSGALG00000009435 26361986 26387951 PPP1R3A
ENSGALG00000009441 18069988 18080140 TAF1A
ENSGALG00000009458 20403471 20563585 ENSGALG00000009466 30394469 30410543 SEC23IP
ENSGALG00000009468 20640065 20645598 ENSGALG00000009483 18659507 18713332 MARK1
ENSGALG00000009485 27299899 27307305

256
Gene stable ID Gene start (bp) Gene end (bp) Gene name
ENSGALG00000009491 28406954 28747300 RAD51B
ENSGALG00000009496 23475697 23491768 NAF1
ENSGALG00000009507 28813891 28865737 PLEKHH1
ENSGALG00000009523 28757424 28995706 CNTN1
ENSGALG00000009556 29649659 29708429 PRICKLE1
ENSGALG00000009594 22539912 22550592 RARRES1
ENSGALG00000009598 18846482 18883499 EPRS
ENSGALG00000009601 30342085 30485295 NELL2
ENSGALG00000009611 29490434 29523553 EIF2AK4
ENSGALG00000009645 19997179 20358337 ESRRG
ENSGALG00000009669 22593316 22706455 RSRC1
ENSGALG00000009714 25756022 25763028 CBR4
ENSGALG00000009723 30438360 30554506 FMN1
ENSGALG00000009792 29559149 29561899 ENSGALG00000009817 32206472 32209601 ZNF770
ENSGALG00000009837 22052274 22074536 DTL
ENSGALG00000009844 32283463 32288278 ACTC1
ENSGALG00000009855 29945818 29988757 TBC1D9
ENSGALG00000009877 22357077 22527887 ENSGALG00000009885 34415870 34428812 HELB
ENSGALG00000009902 19691444 19711677 CFAP57
ENSGALG00000009904 35101235 35103693 IL22
ENSGALG00000009905 35112854 35137000 MDM1
ENSGALG00000009981 25557990 25574700 PREPL
ENSGALG00000009983 34519335 34601731 NUBPL
ENSGALG00000009995 34843920 35050252 AKAP6
ENSGALG00000010005 26625940 26701895 EPAS1
ENSGALG00000010022 32220976 32236070 PRMT9
ENSGALG00000010047 27857774 27873604 SLC4A1AP
ENSGALG00000010053 19988821 20225336 PTPRF
ENSGALG00000010081 33497816 33524132 SH3D19
ENSGALG00000010090 33605469 33679767 FAM160A1
ENSGALG00000010108 34283512 34287993 C4orf33
ENSGALG00000010116 29464746 29583035 DNAH8
ENSGALG00000010118 37030439 37188796 MIPOL1
ENSGALG00000010133 20869028 20884084 PTCH2
ENSGALG00000010154 37633590 37642338 GEMIN2
ENSGALG00000010193 37713774 37731357 ZNF410
ENSGALG00000010197 37740605 37748157 COQ6
ENSGALG00000010202 37750948 37767273 ENTPD5
ENSGALG00000010203 20988109 20994448 ENSGALG00000010207 34656454 34689429 LARP1B
ENSGALG00000010224 37799941 37807895 GLIPR1L
ENSGALG00000010226 21101144 21106303 MUTYH
ENSGALG00000010230 21118192 21176057 TESK2
ENSGALG00000010242 4871480 4874774 ENSGALG00000010258 37973837 38033648 LTBP2

257
Gene stable ID Gene start (bp) Gene end (bp) Gene name
ENSGALG00000010268 34869460 34877868 PARM1
ENSGALG00000010276 21260097 21277121 GPBP1L1
ENSGALG00000010304 38176680 38194379 MLH3
ENSGALG00000010313 21323722 21490422 ENSGALG00000010316 35018318 35181390 FRAS1
ENSGALG00000010323 38322143 38331207 BATF
ENSGALG00000010324 35192841 35208343 MRPL1
ENSGALG00000010325 39561955 39685625 PPP1R12A
ENSGALG00000010349 30993718 30997091 POLR1C
ENSGALG00000010360 21671551 21675013 NSUN4
ENSGALG00000010391 35737241 35779227 MMRN1
ENSGALG00000010392 35907697 35913582 ENSGALG00000010440 21871550 21892367 MKNK1
ENSGALG00000010468 39289421 39292849 ISM2
ENSGALG00000010478 21991222 22008702 STIL
ENSGALG00000010572 40811286 40858950 TSHR
ENSGALG00000010577 38977102 39011532 ENSGALG00000010601 39525695 39537283 UFSP2
ENSGALG00000010607 43079009 43113022 SPATA7
ENSGALG00000010609 33619026 33624917 NDUFAF7
ENSGALG00000010611 39613075 39632176 CFAP97
ENSGALG00000010627 24470877 24475138 PRPF38A
ENSGALG00000010630 33860673 33913598 AHCTF1
ENSGALG00000010636 39762374 39778389 PRIMPOL
ENSGALG00000010641 33936002 33945995 SCCPDH
ENSGALG00000010668 40162296 40247894 WWC2
ENSGALG00000010677 43865707 43890463 NRDE2
ENSGALG00000010691 34848623 34865195 ENSGALG00000010703 44254119 44275768 DGLUCY
ENSGALG00000010749 25215563 25220131 TCEANC2
ENSGALG00000010763 44582962 44610633 TRIP11
ENSGALG00000010774 25250767 25301654 SSBP3
ENSGALG00000010927 45986045 45995778 DMP1
ENSGALG00000010933 19477509 19493971 ENSGALG00000010934 27404833 27470245 ENSGALG00000010935 39870775 39980929 PTPRQ
ENSGALG00000010939 40029520 40056169 LIN7A
ENSGALG00000010943 19691055 19747676 SCN1A
ENSGALG00000010949 31184795 31200167 GPNMB
ENSGALG00000010956 19751570 19782350 TTC21B
ENSGALG00000010969 45611921 45622004 SPIA4
ENSGALG00000010995 27910149 27935026 ITGB3BP
ENSGALG00000011000 38573516 38605829 TARBP1
ENSGALG00000011058 28434800 28465001 LEPR
ENSGALG00000011076 46084881 46114497 SYNE3
ENSGALG00000011078 46127455 46159442 PTPN13
ENSGALG00000011149 21941750 21977517 PLA2R1

258
Gene stable ID Gene start (bp) Gene end (bp) Gene name
ENSGALG00000011178 46716267 46721036 ENOPH1
ENSGALG00000011180 40904572 40967021 FAM120B
ENSGALG00000011186 41248476 41263775 ERMARD
ENSGALG00000011235 34327646 34349885 GALNT15
ENSGALG00000011269 43925156 43947733 EPYC
ENSGALG00000011277 44602930 44615820 PLEKHG7
ENSGALG00000011298 37655934 37978166 RARB
ENSGALG00000011304 38055640 38075203 NGLY1
ENSGALG00000011332 22332671 22343840 ANKZF1
ENSGALG00000011342 45374215 45438791 FGD6
ENSGALG00000011386 22592086 22597668 BCS1L
ENSGALG00000011391 49969802 49986553 AMN
ENSGALG00000011413 26796821 26810573 ENSGALG00000011446 50222277 50231944 TNFAIP2
ENSGALG00000011459 45924074 45955569 ENSGALG00000011492 23625446 23667655 XRCC5
ENSGALG00000011499 50249539 50270243 SCARB2
ENSGALG00000011531 46718811 46744193 APAF1
ENSGALG00000011557 47186191 47253542 UHRF1BP1L
ENSGALG00000011565 50651466 50702881 TDRD9
ENSGALG00000011615 45598072 45610154 ENSGALG00000011621 45625353 45679661 IGF2R
ENSGALG00000011643 47672512 47732097 UTP20
ENSGALG00000011683 51915873 51947769 CENPC
ENSGALG00000011687 51898823 51911235 ENSGALG00000011696 52195852 52255454 JAG2
ENSGALG00000011708 27324149 27507722 MYLK
ENSGALG00000011742 48069970 48074563 ART4
ENSGALG00000011744 27566419 28008798 KALRN
ENSGALG00000011849 54073440 54076485 IL2
ENSGALG00000011866 49224852 49228486 RRP7A
ENSGALG00000011961 54501619 54521075 TNIP3
ENSGALG00000011966 49768544 49787684 RANGAP1
ENSGALG00000011970 49788795 49792401 CHADL
ENSGALG00000011990 55086276 55109473 USP53
ENSGALG00000011994 55168618 55260528 SYNPO2
ENSGALG00000012005 54717088 54736656 LRRC9
ENSGALG00000012010 55453742 55481442 ENSGALG00000012023 55232337 55241595 DACT1
ENSGALG00000012025 55274097 55338508 TA3
ENSGALG00000012044 57097275 57432432 ANK2
ENSGALG00000012072 28389233 28403654 ENSGALG00000012074 57505958 57539448 ALPK1
ENSGALG00000012076 57543611 57548315 TIFA
ENSGALG00000012089 55450095 55492082 C14orf37
ENSGALG00000012095 55629271 55635045 CCDC198
ENSGALG00000012100 28481649 28499392 CFAP221

259
Gene stable ID Gene start (bp) Gene end (bp) Gene name
ENSGALG00000012101 55699101 55709296 AP5M1
ENSGALG00000012103 5540164 5584404 CCDC73
ENSGALG00000012118 56011682 56040330 TMEM260
ENSGALG00000012129 29030066 29062387 CCDC93
ENSGALG00000012147 29074922 29083226 DDX18
ENSGALG00000012155 58394125 58445817 EGF
ENSGALG00000012177 29971539 29999038 NCKAP5
ENSGALG00000012196 58526506 58553506 MCUB
ENSGALG00000012245 60334644 60342396 ADH5
ENSGALG00000012260 30797938 30815468 LCT
ENSGALG00000012263 57806860 57827533 NEMF
ENSGALG00000012293 51105368 51109027 C22orf23
ENSGALG00000012317 47035043 47108957 ADGB
ENSGALG00000012321 57934324 57991948 MAP4K5
ENSGALG00000012361 58040392 58064238 NIN
ENSGALG00000012362 31073812 31346787 THSD7B
ENSGALG00000012377 31413137 31428256 HNMT
ENSGALG00000012407 32016417 32446623 LRP1B
ENSGALG00000012412 48792857 48928383 MTHFD1L
ENSGALG00000012422 51220223 51226301 ENSGALG00000012472 51492000 51505358 IL2RB
ENSGALG00000012484 35331804 35359923 RIF1
ENSGALG00000012488 51546120 51553306 TST
ENSGALG00000012593 40166144 40179451 SLC28A3
ENSGALG00000012689 60597695 60709367 KIF13A
ENSGALG00000012720 62240247 62268129 NUP153
ENSGALG00000012731 62416160 62431263 TBC1D7
ENSGALG00000012768 63420678 63425726 GCM2
ENSGALG00000012860 1327076 1332053 HSD11B1L
ENSGALG00000012866 67896375 67905857 SERPINB6L
ENSGALG00000012903 68591175 68684088 PIGN
ENSGALG00000012932 59021804 59039816 FGD4
ENSGALG00000012984 1185316 1196659 ENSGALG00000012987 60351125 60361329 CCDC77
ENSGALG00000013005 78491436 78497046 SNRNP48
ENSGALG00000013006 78498575 78505697 ROPN1L
ENSGALG00000013034 61754952 61846994 CECR2
ENSGALG00000013035 78614461 78623745 SBK2
ENSGALG00000013058 62161773 62170124 ENSGALG00000013060 79496841 79702592 ADCY2
ENSGALG00000013079 80294941 80381834 ENSGALG00000013090 22249905 22254300 LOXL4
ENSGALG00000013117 64035202 64232501 PIK3C2G
ENSGALG00000013131 83841416 83847040 C18orf21
ENSGALG00000013169 11854602 11862668 IL20RB
ENSGALG00000013174 65371068 65390497 RECQL
ENSGALG00000013177 65432216 65472333 BCAT1

260
Gene stable ID Gene start (bp) Gene end (bp) Gene name
ENSGALG00000013218 66846831 66850139 C3AR1
ENSGALG00000013232 1490889 1495432 RHBG
ENSGALG00000013253 1402697 1413677 INSRR
ENSGALG00000013268 89063802 89211727 ENSGALG00000013294 9208018 9221830 CYP19A1
ENSGALG00000013400 89230899 89237386 PDCD6
ENSGALG00000013402 89281165 89346954 AHRR
ENSGALG00000013468 61707202 61720669 TLR3
ENSGALG00000013495 4726168 4730946 GSDMA
ENSGALG00000013503 61727991 61741835 FAM149A
ENSGALG00000013548 16662049 16666243 GZMA
ENSGALG00000013600 63214032 63216773 ENSGALG00000013624 90472344 90506067 FAM65B
ENSGALG00000013627 63439358 63479725 SLC7A2
ENSGALG00000013661 63627699 63673835 MICU3
ENSGALG00000013697 92127902 92139467 CNDP1
ENSGALG00000013720 92301222 92334345 FBXO15
ENSGALG00000013727 51934949 51998398 SYNJ2
ENSGALG00000013738 6691790 6711192 OPTN
ENSGALG00000013745 93915972 93996632 RTTN
ENSGALG00000013804 65542342 65548565 SRD5A3
ENSGALG00000013822 54155137 54192103 TXLNB
ENSGALG00000013853 97433438 97456386 AFG3L2
ENSGALG00000013879 3565948 3577370 TIA1
ENSGALG00000013893 7620168 7625810 MNS1
ENSGALG00000013962 55939197 56007426 HBS1L
ENSGALG00000014071 67751004 67983940 ENSGALG00000014083 68025368 68044088 INTS13
ENSGALG00000014192 67190626 67220017 ATP10D
ENSGALG00000014200 67270708 67291796 ENSGALG00000014217 68026814 68043002 GUF1
ENSGALG00000014227 70416011 70422094 UPK3A
ENSGALG00000014261 69068033 69072673 UCHL1
ENSGALG00000014267 69357333 69363626 RBM47
ENSGALG00000014298 69760276 69796593 RFC1
ENSGALG00000014455 77027981 77029234 LPAR5
ENSGALG00000014603 77379603 77388708 C1S
ENSGALG00000014615 99747385 99848774 LAMA1
ENSGALG00000014642 51274317 51349988 CHD1Z
ENSGALG00000014664 57880857 57984258 ENSGALG00000014684 57003242 57017676 ERAP1
ENSGALG00000014736 77862437 77876315 KEL
ENSGALG00000014762 100238641 100256976 ENSGALG00000014765 20588770 20606823 TRIM23
ENSGALG00000014799 101479110 101500299 METTL4
ENSGALG00000014848 60999895 61164573 TRDN
ENSGALG00000014865 13709871 13717629

261
Gene stable ID Gene start (bp) Gene end (bp) Gene name
ENSGALG00000014892 63018384 63155719 CEP85L
ENSGALG00000014923 24570223 24702341 ARHGEF28
ENSGALG00000014924 79422423 79478850 POLQ
ENSGALG00000014953 63973179 63984264 RWDD1
ENSGALG00000014982 103124812 103156745 RBBP8
ENSGALG00000014989 23387606 23392488 S100Z
ENSGALG00000015001 65864380 65965590 ENSGALG00000015002 25266850 25313351 MRPS27
ENSGALG00000015029 79678051 79740966 EVC2
ENSGALG00000015056 103493136 103529171 ENSGALG00000015086 103586107 103657016 OSBPL1A
ENSGALG00000015109 34585926 34650856 TJP2
ENSGALG00000015142 106423071 106443930 DSG2
ENSGALG00000015157 106612010 106661036 ENSGALG00000015167 37397609 37448829 PRUNE2
ENSGALG00000015183 106851537 106876449 ENSGALG00000015191 83409648 83412396 ENSGALG00000015196 107248918 107350660 ASXL3
ENSGALG00000015204 83574965 83598582 ATG3
ENSGALG00000015218 83652332 83662208 SLC19A2
ENSGALG00000015230 83683837 83773394 NME7
ENSGALG00000015249 84135950 84154902 TTF2
ENSGALG00000015276 67163349 67182833 ENSGALG00000015294 84937803 84959755 ADGRG7
ENSGALG00000015340 111439673 111462441 TGS1
ENSGALG00000015343 68272709 68292629 RTN4IP1
ENSGALG00000015348 86503359 86619306 ALCAM
ENSGALG00000015395 88706603 88713873 CD200L
ENSGALG00000015461 91922427 91932287 ENSGALG00000015473 92237349 92247857 ADPRH
ENSGALG00000015474 92260427 92282945 CD80
ENSGALG00000015511 96489993 96603886 ROBO1
ENSGALG00000015513 72689670 72775816 MMS22L
ENSGALG00000015589 63936017 64052808 MSH3
ENSGALG00000015626 82573360 82637134 RGS12
ENSGALG00000015635 82710300 82783954 HTT
ENSGALG00000015652 82846661 82870981 MFSD10
ENSGALG00000015675 98044140 98077756 ENSGALG00000015677 66156522 66193789 SUSD1
ENSGALG00000015709 84469256 84488069 TACC3
ENSGALG00000015802 103950360 103953450 N6AMT1
ENSGALG00000015810 76741929 76754201 ENSGALG00000015836 77740723 77786312 CEP162
ENSGALG00000015854 78202202 78210827 PGM3
ENSGALG00000015878 79685822 79697524 LCA5
ENSGALG00000015887 104901269 104945059 URB1
ENSGALG00000015902 86469040 86474132 CD8B

262
Gene stable ID Gene start (bp) Gene end (bp) Gene name
ENSGALG00000016062 107931746 107940716 PSMG1
ENSGALG00000016065 107943223 107993948 BRWD1
ENSGALG00000016105 91217010 91267485 DYSF
ENSGALG00000016142 108921073 108942022 MX1
ENSGALG00000016148 109107584 109141826 C2CD2
ENSGALG00000016157 109193368 109234694 UMODL1
ENSGALG00000016221 111056475 111115975 EFHC2
ENSGALG00000016224 111259525 111332024 MAOA
ENSGALG00000016254 112898627 112924531 OTC
ENSGALG00000016258 113045418 113063987 ENSGALG00000016263 85768055 85882423 ENSGALG00000016278 86965136 87048983 PRIM2
ENSGALG00000016279 87070833 87079598 RAB23
ENSGALG00000016281 114486908 115483002 DMD
ENSGALG00000016297 87914790 87948320 HCRTR2
ENSGALG00000016314 88598880 88636560 ELOVL5
ENSGALG00000016316 88656612 88663923 GCM1
ENSGALG00000016370 93135658 93174800 TPO
ENSGALG00000016392 94094085 94102761 RPS7
ENSGALG00000016400 95406461 95415464 RSAD2
ENSGALG00000016455 97786521 97842913 GREB1
ENSGALG00000016468 100637696 100646358 ENSGALG00000016475 101790655 101806609 ENSGALG00000016491 102659050 102693303 APOB
ENSGALG00000016492 102734234 102741569 TDRD15
ENSGALG00000016498 104544323 104575302 MFSD2B
ENSGALG00000016506 104782783 104798907 ZNF512
ENSGALG00000016536 105396910 105421148 HADHA
ENSGALG00000016556 105439100 105446401 ENSGALG00000016557 121963490 121989828 BMX
ENSGALG00000016564 105498872 105511445 PTK2B
ENSGALG00000016569 122344605 122359048 FANCB
ENSGALG00000016620 106136554 106139941 PNOC
ENSGALG00000016639 106684652 106726136 ENSGALG00000016664 107812743 107816159 NEIL2
ENSGALG00000016681 128680925 128885733 DHRSX
ENSGALG00000016684 109234225 109245385 RHAG
ENSGALG00000016692 109266889 109273908 CENPQ
ENSGALG00000016723 110542296 110545583 ENSGALG00000016766 132634324 132687827 REV1
ENSGALG00000016785 133946557 133969773 IL1RL1
ENSGALG00000016788 134001612 134014941 IL18RAP
ENSGALG00000016809 136466224 136492266 EDAR
ENSGALG00000016813 136898933 136901779 CHAMP1
ENSGALG00000016815 136915096 136936956 UPF3A
ENSGALG00000016854 140176223 140179854 LIG4
ENSGALG00000016865 142848690 142895582 TPP2

263
Gene stable ID Gene start (bp) Gene end (bp) Gene name
ENSGALG00000016893 145871889 145950703 UGGT2
ENSGALG00000016902 147664506 148027057 GPC5
ENSGALG00000016911 153499603 153525605 RNF219
ENSGALG00000016920 154868242 154908783 LMO7
ENSGALG00000016943 165561980 165586181 OLFM4
ENSGALG00000016980 167776863 167806722 COG3
ENSGALG00000016988 168099691 168119251 RUBCNL
ENSGALG00000016994 168671611 168672512 NUDT15
ENSGALG00000017023 170371770 170391240 NEK5
ENSGALG00000017024 170393901 170406389 NEK3
ENSGALG00000017026 170416091 170435074 VPS36
ENSGALG00000017044 171798604 171935943 TRPC4
ENSGALG00000017073 174560560 174597292 BRCA2
ENSGALG00000017086 175631550 175648871 ENSGALG00000017148 179310484 179327166 CENPJ
ENSGALG00000017185 182611334 182628423 TMEM123
ENSGALG00000017190 182813467 182848535 CEP126
ENSGALG00000017220 185871724 185874291 TAF1D
ENSGALG00000017234 187658853 187720624 FOLH1
ENSGALG00000017248 189111245 189150763 RAB30
ENSGALG00000017250 189208361 189209550 ENSGALG00000017308 195912297 195938222 CHRDL2
ENSGALG00000017309 195882069 195901578 RNF169
ENSGALG00000017314 195778483 195812181 C2CD3
ENSGALG00000017326 195423605 195462321 ENSGALG00000017378 22270053 22279635 CRTAC1
ENSGALG00000017414 5081253 5096768 JUP
ENSGALG00000017485 69963233 69968568 TLR1A
ENSGALG00000017493 194226590 194228925 ENSGALG00000019003 49905486 49937351 PRAG1
ENSGALG00000019030 194659669 194660631 ENSGALG00000019145 130465409 130466062 ENSGALG00000019240 80801522 80803077 ENSGALG00000019262 68393868 68394452 ENSGALG00000019322 49510784 49512391 TNFRSF13C
ENSGALG00000019325 49197217 49205179 ENSGALG00000019509 94402654 94510729 CCDC102B
ENSGALG00000019543 76489687 76496184 OTULIN
ENSGALG00000019768 10433382 10468658 ACSF2
ENSGALG00000019932 67118718 67150851 ENSGALG00000020032 34909552 34914562 ENSGALG00000020049 29168132 29175249 KCNK16
ENSGALG00000020084 7870260 7906818 CAPN13
ENSGALG00000020108 86646003 86652740 ENSGALG00000020316 2848848 2864846 IL13RA2
ENSGALG00000020340 58155311 58158447 TMX1
ENSGALG00000020388 45685172 45688958

264
Gene stable ID Gene start (bp) Gene end (bp) Gene name
ENSGALG00000020402 43659562 43715163 EFCAB11
ENSGALG00000020523 67114959 67119131 TOPORS
ENSGALG00000020561 16555609 16594096 ENSGALG00000020703 20231963 20298979 GRB14
ENSGALG00000020737 18682039 18685720 KLHL23
ENSGALG00000020788 15144369 15196130 ENSGALG00000020813 13705897 13741849 CCDC50
ENSGALG00000020836 12480858 12488246 FAM237A
ENSGALG00000020884 11667153 11694964 ENSGALG00000020982 10511917 10517297 ENSGALG00000021020 17836424 17838772 CGNRHRL
ENSGALG00000021135 13042626 13046863 HAPLN3
ENSGALG00000021171 12303445 12346719 ENSGALG00000021198 3082764 3089843 ENSGALG00000021301 13341134 13346015 ENSGALG00000021304 11028678 11040410 ENSGALG00000021355 9016408 9024018 ENSGALG00000021395 7999197 8020520 ENSGALG00000021442 1199475 1217413 CARMIL2
ENSGALG00000021525 2531907 2533175 ENSGALG00000021647 1518381 1532850 NRTN
ENSGALG00000021656 3747288 3759758 PTPN22
ENSGALG00000021883 4347929 4350919 ENSGALG00000022166 22682686 22692059 PNKD
ENSGALG00000022702 194820512 194824114 CHRNA10
ENSGALG00000022850 104926401 104932042 TMEM214
ENSGALG00000022875 98303218 98307540 ENSGALG00000022882 91704833 91707742 ZADH2
ENSGALG00000022901 87198999 87201427 ENSGALG00000023015 58158548 58178806 TMEM244
ENSGALG00000023338 9721862 9729512 CBX2
ENSGALG00000023497 23703644 23710582 MINDY4B
ENSGALG00000023506 16420760 16425137 ENSGALG00000023683 4970847 4979332 TCTN2
ENSGALG00000023689 6346895 6367468 ASS1
ENSGALG00000023740 12156905 12158534 HBZ
ENSGALG00000023843 3476861 3485053 FRMD7
ENSGALG00000023847 5070342 5078795 ENSGALG00000023886 1803327 1832501 ZNF804A
ENSGALG00000023898 1307477 1370931 PLEKHG4
ENSGALG00000023906 2669898 2671690 RNF223
ENSGALG00000023924 3190157 3190495 ENSGALG00000023950 2657652 2663698 CR1L
ENSGALG00000023953 2634610 2641479 ENSGALG00000024039 1632455 1636009 ENSGALG00000024056 11977809 11983312 CHST3
ENSGALG00000024490 69891819 69904924

265
Gene stable ID Gene start (bp) Gene end (bp) Gene name
ENSGALG00000025764 5102761 5107413 FKBP10
ENSGALG00000025971 105661748 105672793 KCNK3
ENSGALG00000025996 33407191 33426169 ENSGALG00000026015 10715164 10719635 ENSGALG00000026019 11469738 11497205 ASCC1
ENSGALG00000026038 14838941 14841124 ENSGALG00000026151 1217950 1251928 CEP250
ENSGALG00000026152 2254875 2264684 GBP
ENSGALG00000026189 10204919 10208415 ENSGALG00000026241 2909715 2914206 GRIN3B
ENSGALG00000026299 88660356 88667176 ENSGALG00000026315 5799336 5801907 RAB34
ENSGALG00000026322 49045426 49051770 ARMT1
ENSGALG00000026328 4662820 4707653 MIEN1
ENSGALG00000026392 5925697 5928564 PIPOX
ENSGALG00000026395 52896075 52980564 ENSGALG00000026422 28369889 28385093 ENSGALG00000026431 5910507 5916770 SEZ6
ENSGALG00000026491 9118692 9123791 TMEM17
ENSGALG00000026850 4877060 4879564 TICAM1
ENSGALG00000026957 23090874 23099929 SEMA4G
ENSGALG00000027083 28871534 28873444 ENSGALG00000027122 54262171 54293903 APPL2
ENSGALG00000027176 2795017 2803822 ENSGALG00000027183 1251267 1255402 ENSGALG00000027316 1168958 1170234 CRNN
ENSGALG00000027389 20155100 20189099 RGS7BP
ENSGALG00000027444 12591371 12598630 ENSGALG00000027484 11480791 11484789 C20orf85
ENSGALG00000027506 22315127 22320358 DNAJB2
ENSGALG00000027526 4887092 4897385 COL9A2
ENSGALG00000027579 105648428 105695763 MRPS6
ENSGALG00000027635 13284132 13287411 NME3
ENSGALG00000027695 3131564 3134816 PCBP4
ENSGALG00000027702 5349153 5385670 SCN11A
ENSGALG00000027704 13862869 14132878 ENSGALG00000027712 1331123 1334664 SLAMF8
ENSGALG00000027714 63371447 63454155 ATG10
ENSGALG00000027805 2279143 2280927 ENSGALG00000027885 70320126 70322177 C4orf19
ENSGALG00000027922 10941215 10949135 ETAA1
ENSGALG00000027983 15004028 15017912 TNK2
ENSGALG00000028016 49189519 49197004 ENSGALG00000028023 10114261 10120033 LRRC74B
ENSGALG00000028032 106882967 107143719 MSRA
ENSGALG00000028069 23246190 23256408 WNT16
ENSGALG00000028083 170470417 170471628 THSD1

266
Gene stable ID Gene start (bp) Gene end (bp) Gene name
ENSGALG00000028138 107205765 107228525 ENSGALG00000028153 22043498 22045110 ENSGALG00000028167 9220720 9231568 RBM18
ENSGALG00000028172 13160827 13181241 WDR90
ENSGALG00000028207 20762518 20774873 ENSGALG00000028238 23565911 23569213 ENSGALG00000028262 4970553 4972635 ENSGALG00000028294 15906717 15914012 VWA5B2
ENSGALG00000028298 32755529 32886954 ENSGALG00000028302 17160590 17161925 UQCRQ
ENSGALG00000028308 4872138 4879191 TNS4
ENSGALG00000028341 2684354 2687041 ENSGALG00000028357 19456900 19489987 MMR1L2
ENSGALG00000028367 219651 222858 ENSGALG00000028439 2684815 2703227 FAM35A
ENSGALG00000028457 30640415 30649263 MAP3K19
ENSGALG00000028473 8946359 8952613 ENSGALG00000028506 1691893 1710105 NHSL2
ENSGALG00000028512 22415677 22485273 ENSGALG00000028561 19787107 19841142 SZT2
ENSGALG00000028565 1828640 1876670 PCDHGC3
ENSGALG00000028620 9090918 9092123 ENSGALG00000028622 1382998 1391936 PEAR1
ENSGALG00000028629 185798254 185812845 TM4SF1a
ENSGALG00000028666 54867978 54879976 ENSGALG00000028759 35028709 35060292 LYPD6B
ENSGALG00000028815 6257931 6267229 ENSGALG00000028830 9946953 9949387 ENSGALG00000028849 30864013 30895009 SCAF11
ENSGALG00000028886 45498838 45519267 ENSGALG00000028897 48678797 48722693 ENSGALG00000028960 195852602 195857112 NEU3
ENSGALG00000028975 1976126 1980330 ENSGALG00000029000 3231438 3234557 HYAL3
ENSGALG00000029015 3552405 3555683 TM6SF2
ENSGALG00000029118 81574893 81580647 TRMT10B
ENSGALG00000029151 2537062 2540128 ISLR2
ENSGALG00000029197 454235 690429 KIRREL3
ENSGALG00000029287 126413795 126551270 ENSGALG00000029298 83605465 83640498 F5
ENSGALG00000029308 69135540 69146688 ENSGALG00000029321 83586479 83614083 ENSGALG00000029360 7756823 7779971 ENSGALG00000029381 78333 81467 TAP2
ENSGALG00000029390 5097210 5099714 C15H12ORF65
ENSGALG00000029454 25432899 25445807 ENSGALG00000029503 1234497 1237927 AES

267
Gene stable ID Gene start (bp) Gene end (bp) Gene name
ENSGALG00000029532 35249909 35251574 ENSGALG00000029599 9635 25890 ACVR1B
ENSGALG00000029618 368166 371658 AGBL2
ENSGALG00000029621 3167398 3189955 SEMA3F
ENSGALG00000029635 4042828 4052619 ENSGALG00000029652 503169 547399 OPHN1
ENSGALG00000029702 358398 367796 FNBP4
ENSGALG00000029714 20102968 20112060 UNC45A
ENSGALG00000029824 54863006 54871746 ENSGALG00000030005 65206 68264 IGSF1L3
ENSGALG00000030012 5120164 5122823 EMILIN3
ENSGALG00000030024 32905460 32969236 USP15
ENSGALG00000030027 4208870 4217491 MCAM
ENSGALG00000030030 132121027 132231350 RSPO2
ENSGALG00000030055 1143254 1161618 RIPOR1
ENSGALG00000030084 43265788 43285281 EXOSC7
ENSGALG00000030097 2153100 2156682 RCC1
ENSGALG00000030139 5197792 5205005 ENSGALG00000030160 555417 567680 DRC7
ENSGALG00000030169 6496192 6513565 ENSGALG00000030270 14372 17201 CD1C
ENSGALG00000030316 5329605 5330854 ENSGALG00000030324 7556518 7647412 KIAA1324L
ENSGALG00000030383 19227573 19298741 SPATA16
ENSGALG00000030405 2035813 2036205 ENSGALG00000030506 77815472 77816407 ENSGALG00000030511 6663741 6668938 SLC19A1
ENSGALG00000030552 41370014 41376467 ENSGALG00000030587 30388737 30402788 ENSGALG00000030602 90146901 90170368 ADAM33
ENSGALG00000030710 72501 90584 L3MBTL1
ENSGALG00000030718 13229154 13233433 ENSGALG00000030719 45979330 45995515 CLMN
ENSGALG00000030789 10044964 10074000 ENSGALG00000030802 125013467 125134159 SHROOM2
ENSGALG00000030844 7494480 7523025 DMTF1
ENSGALG00000030886 999174 1001420 PTGDS
ENSGALG00000030900 2551275 2558427 NCMAP
ENSGALG00000030925 32083864 32152185 LHPP
ENSGALG00000030930 35855432 35856382 ENSGALG00000030941 1138597 1146644 KIAA1324
ENSGALG00000031021 91845292 91911288 ERICH1
ENSGALG00000031119 6099444 6113592 ENSGALG00000031149 2653656 2657098 ENSGALG00000031182 58868218 58927474 FANCM
ENSGALG00000031186 49551210 49586894 MEI1
ENSGALG00000031219 75794168 75800647

268
Gene stable ID Gene start (bp) Gene end (bp) Gene name
ENSGALG00000031240 6251280 6259972 ACAD10
ENSGALG00000031276 240801 267480 ENSGALG00000031281 105012037 105020075 GTF3C2
ENSGALG00000031393 10838850 10841240 ENSGALG00000031416 13288569 13313056 UBN1
ENSGALG00000031511 5289267 5303607 HIP1R
ENSGALG00000031534 8297642 8403485 ARID5B
ENSGALG00000031560 79232533 79256355 USF3
ENSGALG00000031588 36056215 36063675 ENSGALG00000031752 1397978 1403745 ENSGALG00000031807 5095662 5099405 ENSGALG00000031812 2863361 2867426 TDRKH
ENSGALG00000031814 71639774 71703468 ENSGALG00000031820 4715737 4719058 ENSGALG00000031841 12490400 12514687 SLX4
ENSGALG00000031866 884635 889464 ENSGALG00000031895 9107305 9148769 SDK2
ENSGALG00000031906 1336572 1360690 FAM83C
ENSGALG00000032082 22722141 22725926 FAM133B
ENSGALG00000032092 98696183 98754996 PPP4R1
ENSGALG00000032143 17142610 17163354 CRISPLD2
ENSGALG00000032149 4232184 4238046 OSBPL7
ENSGALG00000032155 1543195 1557476 ENSGALG00000032184 841145 846278 CSPG5
ENSGALG00000032231 58543 72898 C4
ENSGALG00000032372 7394751 7414352 CYB5R2
ENSGALG00000032386 33015814 33091642 DCLK2
ENSGALG00000032398 2613832 2645512 ASPM
ENSGALG00000032410 18767309 18788285 CBFA2T3
ENSGALG00000032588 4384127 4390002 ARPC1B
ENSGALG00000032599 77089837 77115522 ZNF384
ENSGALG00000032610 5381307 5386131 NAGLU
ENSGALG00000032718 128127251 128157395 NIPAL2
ENSGALG00000032732 138812399 138834988 WASHC5
ENSGALG00000032753 105390311 105396066 GAREM2
ENSGALG00000032780 40680767 40717054 TTC13
ENSGALG00000032916 7892569 7905427 ENSGALG00000032957 29428817 29433345 NOCT
ENSGALG00000033001 4414437 4415527 ATP5J2
ENSGALG00000033002 2442374 2449919 SLC7A3
ENSGALG00000033060 23929924 23930989 ENSGALG00000033068 391022 394724 TLR21
ENSGALG00000033106 42864751 42878912 ENSGALG00000033138 6458891 6470750 ZMYND12
ENSGALG00000033162 4729921 4735633 PSMD3
ENSGALG00000033179 56104804 56137792 TGFBR1
ENSGALG00000033198 8830407 8858028 MYO5C

269
Gene stable ID Gene start (bp) Gene end (bp) Gene name
ENSGALG00000033199 105330816 105350209 ENSGALG00000033212 49564706 49571912 HSP90AA1
ENSGALG00000033254 129000072 129034245 SPAG1
ENSGALG00000033277 2954266 2960956 PPM1M
ENSGALG00000033328 4097552 4162312 PACS2
ENSGALG00000033461 31378969 31387982 ENSGALG00000033497 4844452 4882773 FOXP4
ENSGALG00000033553 9203782 9222107 ENSGALG00000033557 19950725 19956592 CTSH
ENSGALG00000033562 11085271 11086071 ENSGALG00000033671 171352433 171447282 FREM2
ENSGALG00000033759 28266953 28296420 RAVER2
ENSGALG00000033769 38032888 38034822 BBS10
ENSGALG00000033807 11501308 11503836 TYSND1
ENSGALG00000033953 1864533 1871303 SHROOM4
ENSGALG00000033956 10021724 10056809 SFXN1
ENSGALG00000033971 1214734 1216748 ENSGALG00000033992 35784910 35786718 ENSGALG00000034013 32198043 32203583 ENSGALG00000034044 20052965 20087739 TBC1D12
ENSGALG00000034107 3220329 3225445 TRIM63
ENSGALG00000034119 55990571 56094186 COL15A1
ENSGALG00000034140 106123198 106130102 ZNF395
ENSGALG00000034225 500596 519834 DEAF1
ENSGALG00000034261 159555153 159555479 ENSGALG00000034264 36155770 36201407 ENSGALG00000034288 1141736 1142441 ENSGALG00000034313 26292678 26293813 ENSGALG00000034347 280212 292746 KIF21B
ENSGALG00000034374 57047012 57078983 STX7
ENSGALG00000034383 2116749 2123560 TRMT2B
ENSGALG00000034396 105312337 105323532 TMEM50B
ENSGALG00000034414 7821296 7832434 SLU7
ENSGALG00000034493 46064049 46088568 DCLK3
ENSGALG00000034504 50835752 50841816 ENSGALG00000034518 51172152 51174975 ENSGALG00000034675 117198086 117205612 XKR9
ENSGALG00000034761 4930777 4946186 FHAD1
ENSGALG00000034822 540362 550469 ENSGALG00000034826 2407922 2408746 CXorf65
ENSGALG00000034932 108844363 108894770 BACE2
ENSGALG00000035017 2673198 2693403 ENSGALG00000035047 4395017 4398275 ENSGALG00000035075 81925 86753 TAP1
ENSGALG00000035115 12456914 12459658 ENSGALG00000035136 66338169 66379299 C9orf84
ENSGALG00000035228 78962706 79001440

270
Gene stable ID Gene start (bp) Gene end (bp) Gene name
ENSGALG00000035246 955760 959693 ENSGALG00000035384 103261771 103315035 TMEM241
ENSGALG00000035397 142082573 142086949 NDRG1
ENSGALG00000035447 7336587 7340177 ENSGALG00000035453 48198262 48204933 RP9
ENSGALG00000035465 19927084 19932226 WDR76
ENSGALG00000035492 46514678 46813840 ELMO1
ENSGALG00000035595 2279372 2289972 SLC14A1
ENSGALG00000035605 18632759 18667992 ENSGALG00000035625 97142592 97198921 CEP192
ENSGALG00000035675 4940548 4957050 ENSGALG00000035696 110033196 110055218 RRP1B
ENSGALG00000035721 1796430 1803097 C2
ENSGALG00000035743 16970803 16992524 ATP2C2
ENSGALG00000035761 22663994 22676382 ENSGALG00000035762 2772675 2774216 PRSS57
ENSGALG00000035799 323770 336679 SHISA9
ENSGALG00000035814 1399403 1409506 ENSGALG00000035827 13179584 13219022 ENSGALG00000035856 1283095 1284656 CD48
ENSGALG00000035918 6912250 6917437 ENSGALG00000035945 1257270 1260719 ENSGALG00000035949 42421229 42481002 ACAD11
ENSGALG00000036067 56261726 56276820 RBFA
ENSGALG00000036086 2525471 2528124 TAGLN2
ENSGALG00000036093 357269 366141 PTPN7
ENSGALG00000036108 2080809 2096566 ENSGALG00000036214 245686 252851 PARK7
ENSGALG00000036238 49145298 49176552 LUC7L2
ENSGALG00000036240 48974017 48992482 ENSGALG00000036263 2405099 2411772 UBA7
ENSGALG00000036309 43050041 43132629 LARS2
ENSGALG00000036346 2018796 2022986 AMH
ENSGALG00000036484 3561216 3574042 NCAN
ENSGALG00000036516 108608380 108614937 ENSGALG00000036583 11936299 11948564 ENSGALG00000036629 1851537 1852461 ENSGALG00000036689 32803127 32814128 ENSGALG00000036771 785527 788793 ENSGALG00000036783 4275996 4289784 ENSGALG00000036789 17407355 17789217 ADGRL2
ENSGALG00000036805 311493 328512 SPTB
ENSGALG00000036840 3429551 3431477 ENSGALG00000036892 558497 582785 BUB1B
ENSGALG00000036894 910977 933990 ABCA2
ENSGALG00000036965 5973062 5996551 PTPA
ENSGALG00000037018 9862750 9870989 USP36

271
Gene stable ID Gene start (bp) Gene end (bp) Gene name
ENSGALG00000037052 5170433 5172814 TMEM234
ENSGALG00000037076 105352798 105389904 GART
ENSGALG00000037163 6953116 6954713 ENSGALG00000037241 656092 672722 KCNAB2
ENSGALG00000037256 3440629 3442213 GTPBP3
ENSGALG00000037301 36448667 36651282 ACVR1
ENSGALG00000037314 7009557 7026631 RPH3AL
ENSGALG00000037332 49474814 49502263 ENSGALG00000037407 407251 416312 FAM118B
ENSGALG00000037410 284344 322060 HEPH
ENSGALG00000037414 105324804 105326122 DNAJC28
ENSGALG00000037435 9732868 9752834 ENSGALG00000037439 134017093 134048686 SLC9A4
ENSGALG00000037453 118052590 118075361 TERF1
ENSGALG00000037464 41292667 41355829 WDR27
ENSGALG00000037526 3396001 3398518 ENSGALG00000037625 259255 381102 ENSGALG00000037644 123703762 123734221 CNGB3
ENSGALG00000037675 136894050 137014125 COL14A1
ENSGALG00000037781 34885417 34890567 GSR
ENSGALG00000037816 11250381 11266775 ENSGALG00000037819 190601433 190603690 ENSGALG00000037851 16816438 16818397 KK34
ENSGALG00000037860 2848252 2874073 TET3
ENSGALG00000037939 578267 583409 ADGRG1
ENSGALG00000037950 815996 845140 ENSGALG00000037951 78465927 78476335 HSD3B1
ENSGALG00000038078 4273090 4285753 ENSGALG00000038097 387616 395692 EI24
ENSGALG00000038109 4083525 4087730 MRPL45
ENSGALG00000038140 25162884 25180520 ENSGALG00000038145 799227 818934 DPP7
ENSGALG00000038146 371053 377550 ENSGALG00000038175 148983003 148988533 NAPRT
ENSGALG00000038209 169039 173420 TRIM39.1
ENSGALG00000038269 251816 252922 ENSGALG00000038311 6633230 6662722 COL18A1
ENSGALG00000038426 937592 940719 CPLX4
ENSGALG00000038541 29471 33286 VPS37C
ENSGALG00000038584 1125790 1160045 ENSGALG00000038612 9384943 9430089 COL4A3
ENSGALG00000038621 6325381 6354370 ENSGALG00000038657 554078 559967 ZNF777
ENSGALG00000038710 71890196 71896378 MANSC1
ENSGALG00000038728 350677 356238 ENSGALG00000038740 46121 50542 AMY2A
ENSGALG00000038771 49400755 49460118 TECRL

272
Gene stable ID Gene start (bp) Gene end (bp) Gene name
ENSGALG00000038801 1630552 1633524 ATP5B
ENSGALG00000038865 316485 332935 PRMT7
ENSGALG00000038954 11299573 11303669 LSM11
ENSGALG00000038972 4439972 4462470 ENSGALG00000038984 5470595 5477143 ENSGALG00000039001 80974887 81050425 FILIP1
ENSGALG00000039080 18956776 19014765 CD44
ENSGALG00000039139 55221387 55442502 TNS3
ENSGALG00000039155 5082235 5112652 ZHX3
ENSGALG00000039219 11545754 11563815 ADAMTS14
ENSGALG00000039224 141492463 141505508 HHLA1
ENSGALG00000039268 7994663 7995025 ENSGALG00000039322 3813929 3819587 DDR2
ENSGALG00000039349 39594353 39768545 DISC1
ENSGALG00000039384 10048504 10057685 ENSGALG00000039385 11621217 11622487 ENSGALG00000039391 72832 80536 ZC3H12B
ENSGALG00000039479 53322790 53335591 ENSGALG00000039499 123211702 123231013 LRRCC1
ENSGALG00000039509 141875709 142000765 TG
ENSGALG00000039535 4759613 4802966 D2HGDH
ENSGALG00000039554 405695 418007 ENSGALG00000039590 138070329 138078402 ENSGALG00000039611 2593226 2601741 ENSGALG00000039643 25563 27209 TMEM79
ENSGALG00000039652 8425824 8435377 ARHGEF37
ENSGALG00000039659 9891183 9921006 ENSGALG00000039707 4390621 4391652 ENSGALG00000039716 5309931 5318833 RNF19B
ENSGALG00000039727 530264 535057 ENSGALG00000039751 185732435 185751184 PANX1
ENSGALG00000039887 2504446 2506092 ENSGALG00000039901 149440993 149468746 PUF60
ENSGALG00000039903 9938851 9946439 VSIG10
ENSGALG00000040041 963583 965332 SLC35A4
ENSGALG00000040070 12282289 12286205 PDIA2
ENSGALG00000040084 58055706 58065788 MRS2
ENSGALG00000040114 22901214 23034777 PTPRZ1
ENSGALG00000040156 44306591 44389396 CCDC88C
ENSGALG00000040279 2382455 2393033 RHCE
ENSGALG00000040321 170260135 170261034 ENSGALG00000040395 6714135 6715477 SPATA22
ENSGALG00000040432 6835515 6861392 ENSGALG00000040436 16272211 16303104 GAD2
ENSGALG00000040644 1003902 1006332 C8G
ENSGALG00000040663 6810990 6812834 RSC1A1
ENSGALG00000040709 132024486 132091229 VWA3B

273
Gene stable ID Gene start (bp) Gene end (bp) Gene name
ENSGALG00000040718 15609115 15610799 ENSGALG00000040754 918081 919817 CYP1C1
ENSGALG00000040880 11004406 11017978 EDN3
ENSGALG00000040891 20027818 20125211 RSU1
ENSGALG00000040896 4968055 5062966 FASN
ENSGALG00000040908 328871 345898 HIP1
ENSGALG00000040923 7127033 7190412 AK8
ENSGALG00000040942 6162198 6186080 EFCAB5
ENSGALG00000040949 90715399 90844210 ENSGALG00000040995 35383942 35421288 ENSGALG00000041013 22734389 22773379 TNS1
ENSGALG00000041089 9474822 9588748 ENSGALG00000041153 6153440 6155856 FAM109A
ENSGALG00000041179 128662474 128890608 VPS13B
ENSGALG00000041181 13910194 13915248 ENSGALG00000041229 753930 754904 ENSGALG00000041233 139401611 139404620 FAM84B
ENSGALG00000041249 246787 247800 ENSGALG00000041251 20329726 20343807 HDAC10
ENSGALG00000041343 41475923 41504741 ENSGALG00000041372 44156261 44201027 ENSGALG00000041392 13180214 13211601 ENSGALG00000041428 797572 814175 NEK4
ENSGALG00000041436 27623103 27657436 ENSGALG00000041547 7012349 7015424 ENSGALG00000041556 1679275 1709692 GPATCH8
ENSGALG00000041659 9810013 9813059 SLC2A4RG
ENSGALG00000041671 1204673 1205708 ENSGALG00000041722 94035 139377 STX1A
ENSGALG00000041834 4713252 4725845 AEBP1
ENSGALG00000041854 76488439 76523293 FAM184B
ENSGALG00000041897 3463002 3466176 YJEFN3
ENSGALG00000041977 17396691 17432723 ENSGALG00000042001 35288232 35306393 ENSGALG00000042009 6718330 6730623 HMMR
ENSGALG00000042062 81985622 81988717 HMX1
ENSGALG00000042136 108086835 108304491 PKHD1
ENSGALG00000042153 3228730 3241731 APC2
ENSGALG00000042184 4544396 4552069 ALDH4A1
ENSGALG00000042199 10778501 10801878 SLC12A5
ENSGALG00000042275 1208698 1214238 ENSGALG00000042388 58293669 58629545 LAMA2
ENSGALG00000042419 51527734 51536411 KCTD17
ENSGALG00000042460 5430750 5434416 FPGS
ENSGALG00000042469 108253971 108338935 PRKDC
ENSGALG00000042471 3482204 3498520 IL2RA
ENSGALG00000042481 65431282 65669969 FARS2

274
Gene stable ID Gene start (bp) Gene end (bp) Gene name
ENSGALG00000042485 2114444 2148315 PHACTR4
ENSGALG00000042597 8641682 8647707 ENSGALG00000042647 510007 519341 CNGB1
ENSGALG00000042705 5476398 5479857 KCNK15
ENSGALG00000042761 4886188 4888849 MUL1
ENSGALG00000042769 1349102 1350281 ENSGALG00000042801 4606606 4609137 ENSGALG00000042839 8687069 8718924 FAM214A
ENSGALG00000042851 74475027 74593998 PPARGC1A
ENSGALG00000042871 22380435 22411706 SLIT1
ENSGALG00000042906 41879957 41881417 ENSGALG00000042928 18941610 18947439 ENSGALG00000043014 5548475 5552552 ENSGALG00000043053 6661769 6666141 DAO
ENSGALG00000043088 245053 250144 ENSGALG00000043223 3498587 3653964 COL26A1
ENSGALG00000043245 26430953 26433431 ENSGALG00000043357 6939266 6946547 ANKRD13A
ENSGALG00000043379 41319152 41322432 ENSGALG00000043389 8380486 8416166 PPARGC1B
ENSGALG00000043390 103416843 103491928 ENSGALG00000043400 1411893 1416397 BCDIN3D
ENSGALG00000043401 25526958 25541830 ENSGALG00000043570 115613450 115669550 SGK3
ENSGALG00000043584 83179142 83351003 COL19A1
ENSGALG00000043669 47198237 47232926 ENSGALG00000043672 640217 687795 STAB1
ENSGALG00000043688 8592131 8600567 ENSGALG00000043703 763219 769060 ENSGALG00000043826 5164861 5184130 ANXA11
ENSGALG00000043828 1546320 1555575 HEXA
ENSGALG00000043852 68467127 68471014 ENSGALG00000043904 17864463 17882839 SH3RF2
ENSGALG00000043909 17836546 17840466 ENSGALG00000044007 8570011 8573489 ENSGALG00000044019 17371299 17405300 ENSGALG00000044053 4264395 4269225 NLRX1
ENSGALG00000044141 46639207 46643200 THAP9
ENSGALG00000044187 5793270 5946808 LMF1
ENSGALG00000044229 9816466 9817324 ENSGALG00000044298 5790040 5791347 ENSGALG00000044299 5210085 5219869 ENSGALG00000044307 25393984 25411658 ENSGALG00000044330 360973 378769 ENSGALG00000044362 35975250 35980111 PP2D1
ENSGALG00000044406 4622928 4626326 PPP1R1B
ENSGALG00000044431 10037277 10037804 NPB

275
Gene stable ID Gene start (bp) Gene end (bp) Gene name
ENSGALG00000044433 4033907 4040176 MRPS15
ENSGALG00000044510 92226911 92240484 C18orf63
ENSGALG00000044567 2275195 2286110 ENSGALG00000044573 167810540 167829768 ENSGALG00000044576 8589162 8592265 ENSGALG00000044606 106703338 106726193 MEP1B
ENSGALG00000044618 17798993 17805421 ENSGALG00000044620 90177250 90228176 ENSGALG00000044661 1271207 1272845 ENSGALG00000044706 1217284 1222463 ENSGALG00000044730 3709840 3744844 ENSGALG00000044774 102133638 102134382 ENSGALG00000044940 5342425 5343714 GCNT3
ENSGALG00000044979 15262989 15270491 ENSGALG00000044997 6766480 6771143 SH2D5
ENSGALG00000045028 68528430 68534092 LRRC19
ENSGALG00000045029 21256994 21258283 ENSGALG00000045035 931381 933117 ENSGALG00000045067 6080671 6118332 ENSGALG00000045092 78821219 78829951 CCDC112
ENSGALG00000045125 12927568 12929496 GP5
ENSGALG00000045155 25504621 25513779 ENSGALG00000045168 59380189 59387463 ENSGALG00000045173 83783694 83796470 ENSGALG00000045179 2559893 2563120 ENSGALG00000045204 154444261 154449459 FBXL3
ENSGALG00000045212 1507914 1513516 PLCD3
ENSGALG00000045218 7100719 7141338 MYO18B
ENSGALG00000045232 7026294 7051788 SYCP2
ENSGALG00000045286 23842908 23854232 ENSGALG00000045310 1531397 1539853 ENSGALG00000045350 16715725 16741025 ENSGALG00000045365 194646692 194647502 OR51E1
ENSGALG00000045410 89236876 89239329 FASTKD5
ENSGALG00000045414 179330679 179371572 ENSGALG00000045466 6816418 6817036 ENSGALG00000045488 5633210 5642890 RGSL1
ENSGALG00000045584 11011877 11019401 ENSGALG00000045605 171199227 171200360 ENSGALG00000045611 28163 31040 GLMP
ENSGALG00000045671 13872559 13884307 ENSGALG00000045706 778866 781827 ENSGALG00000045776 12942659 12944948 CPN2
ENSGALG00000045792 28669035 28683746 WDR78
ENSGALG00000045816 250513 259541 ROBO3
ENSGALG00000045935 2672496 2676279 ENSGALG00000045961 10166408 10170608 NRSN2

276
Gene stable ID Gene start (bp) Gene end (bp) Gene name
ENSGALG00000045983 22161538 22193169 ENSGALG00000046062 11048079 11049623 ENSGALG00000046069 2446126 2450103 ENSGALG00000046130 3737835 3740420 ENSGALG00000046180 27739027 27755635 TDRD1
ENSGALG00000046187 55786716 55800554 PARP12
ENSGALG00000046258 126387618 126404515 ENSGALG00000046262 9719205 9743172 CCDC60
ENSGALG00000046263 10195351 10196257 MXD3
ENSGALG00000046282 49560738 49561602 ENSGALG00000046384 4226296 4229044 LRRC46
ENSGALG00000046461 12939315 12941006 LRRC15
ENSGALG00000046580 29472036 29493604 ENSGALG00000046598 39027631 39028922 ENSGALG00000046616 16844159 16908817 ENSGALG00000046637 88479684 88487279 ENSGALG00000046646 1177769 1182943 ENSGALG00000046649 5173725 5176544 DCDC2B
Table S 46. List of genes harbouring non-synonymous deleterious variants in 10 chicken
populations
Gene stable ID Gene start (bp) Gene end (bp) Gene name
ENSGALG00000000123 134466 137899 ENSGALG00000000243 1782741 1787570 RDM1
ENSGALG00000000365 1169897 1172573 NKX2-6
ENSGALG00000000430 551866 586908 SPPL2B
ENSGALG00000000498 2830975 2847223 ACE
ENSGALG00000000545 1715950 1719075 REN
ENSGALG00000000584 375289 387140 ENSGALG00000000616 313618 317551 ELF3
ENSGALG00000001049 657606 667042 ENSGALG00000001084 2286962 2297493 ATP8B3
ENSGALG00000001091 2605227 2608015 C1orf116
ENSGALG00000001378 3165104 3165577 C1orf74
ENSGALG00000001416 7992487 8008603 ADRA1B
ENSGALG00000001429 7946299 7979505 TTC1
ENSGALG00000001504 3284914 3291217 DDX20
ENSGALG00000001617 3300492 3382167 CAMKK1
ENSGALG00000001618 3560689 3587092 OGFOD3
ENSGALG00000001633 1636348 1640580 DUSP26
ENSGALG00000001653 3574708 3578036 MANEAL
ENSGALG00000001729 2176061 2184164 CD276
ENSGALG00000001800 1559956 1567028 ENSGALG00000001828 4089023 4097513 SH2B2
ENSGALG00000001936 1309264 1343370 MYO7B
ENSGALG00000002008 4517732 4531542 RNF157
ENSGALG00000002111 13364535 13374948 ENSGALG00000002222 2877635 2910779 NOC2L
ENSGALG00000002346 4239190 4252716 CLSPN

277
Gene stable ID Gene start (bp) Gene end (bp) Gene name
ENSGALG00000002417 22255213 22258170 ENSGALG00000002549 3620501 3624059 RGS1
ENSGALG00000002744 6330204 6628545 PCDH15
ENSGALG00000002800 10271683 10289497 GRK7
ENSGALG00000002899 4478299 4515607 AACS
ENSGALG00000002922 4177695 4256719 NOTCH2
ENSGALG00000002968 2222383 2241992 ZNF341
ENSGALG00000003029 4315183 4317951 PLPP6
ENSGALG00000003146 4884285 4896278 CCDC92
ENSGALG00000003243 2636975 2674730 RAD54L2
ENSGALG00000003345 5282575 5292696 ENSGALG00000003547 10979414 10990078 SKP2
ENSGALG00000003559 3889665 3899937 ACTR5
ENSGALG00000003863 5458325 5469803 P2RX7
ENSGALG00000004009 5880111 5882167 DHRS13
ENSGALG00000004017 6089879 6099342 TOR1AIP2
ENSGALG00000004028 5308806 5314214 ENSGALG00000004134 12848118 12869490 GLRA1
ENSGALG00000004333 8021312 8048227 ABCA5
ENSGALG00000004365 5736958 5749931 WDR66
ENSGALG00000004393 1358530 1371111 ENSGALG00000004496 13051554 13056671 TNIP1
ENSGALG00000004504 4030124 4041511 RADIL
ENSGALG00000004515 5949198 5981021 KNTC1
ENSGALG00000004545 8304412 8398284 WDR72
ENSGALG00000004711 4401977 4407450 ENSGALG00000005028 5109957 5121859 TOP3A
ENSGALG00000005037 7068141 7090477 TEX14
ENSGALG00000005046 5132126 5136038 SHMT1
ENSGALG00000005077 2154809 2178532 F8
ENSGALG00000005083 5163796 5192508 SLC5A10
ENSGALG00000005162 11044213 11058808 RNPC3
ENSGALG00000005295 7659287 7972906 BCAS3
ENSGALG00000005535 13151075 13168747 TCOF1
ENSGALG00000005558 6182947 6193181 TBL3
ENSGALG00000005638 2403107 2407572 IL2RG
ENSGALG00000005644 4075462 4084282 MYO1G
ENSGALG00000005766 17521316 17535317 PKD2L1
ENSGALG00000005893 17763903 17784063 ZFAND4
ENSGALG00000005903 9533204 9542338 NRIP3
ENSGALG00000005999 9681793 9708956 ABTB1
ENSGALG00000006072 5408222 5438676 ENSGALG00000006091 14585997 14605147 HFM1
ENSGALG00000006231 12312605 12454486 SERGEF
ENSGALG00000006270 7019086 7028500 SCNN1G
ENSGALG00000006388 12108394 12149216 IL16
ENSGALG00000006417 15802894 15826139 SEC24A
ENSGALG00000006469 2848179 2865777 ATP12A
ENSGALG00000006617 32571769 32577739 BCCIP
ENSGALG00000006631 12837819 12854365 TICRR
ENSGALG00000006679 10519797 10524406 BPIFB4
ENSGALG00000006714 3427461 3430996 CCDC61
ENSGALG00000006725 13047888 13091063 ACAN

278
Gene stable ID Gene start (bp) Gene end (bp) Gene name
ENSGALG00000006755 4178788 4187152 USP2
ENSGALG00000006776 11553069 11555613 KLHDC8B
ENSGALG00000006829 8372762 8430577 SMG1
ENSGALG00000006876 10729767 10733859 CTSA
ENSGALG00000006911 8539866 8565249 TMC5
ENSGALG00000006919 8696586 8712050 POF1B
ENSGALG00000007144 5115506 5186106 SIK3
ENSGALG00000007448 11080495 11081385 SPRY3
ENSGALG00000007466 11210631 11219813 EDNRB2
ENSGALG00000007476 11229010 11246791 VAMP7
ENSGALG00000007550 17116982 17174722 TPCN2
ENSGALG00000007559 16097994 16120120 PDSS1
ENSGALG00000007645 22530257 22534464 ENSGALG00000007647 16304157 16397870 MYO3A
ENSGALG00000007676 10476723 10481875 EME1
ENSGALG00000007677 16726645 16729910 THNSL1
ENSGALG00000007700 17890386 17910730 CTTN
ENSGALG00000007837 23063011 23067024 KAZALD1
ENSGALG00000008155 11227663 11233652 KCTD18
ENSGALG00000008168 1044881 1060889 ANKRD16
ENSGALG00000008185 11249381 11285636 AOX1
ENSGALG00000008193 13046276 13318877 RELN
ENSGALG00000008218 23152839 23167347 DDB2
ENSGALG00000008479 12077100 12162229 PLEKHM3
ENSGALG00000008503 15914297 15916640 ALG3
ENSGALG00000008627 15903435 15979942 TTBK1
ENSGALG00000008784 16618438 16636096 SPATA1
ENSGALG00000008859 1957160 1961688 WDR31
ENSGALG00000008861 1948741 1954284 BSPRY
ENSGALG00000008881 1861276 1913128 RGS3
ENSGALG00000008946 27592399 27623494 NHLRC2
ENSGALG00000009032 19675023 19681422 PIF1
ENSGALG00000009224 15744817 15747320 TTC30B
ENSGALG00000009230 20091761 20162392 TMEM131L
ENSGALG00000009269 26068174 26082465 PTGR2
ENSGALG00000009315 26297611 26324915 PAPLN
ENSGALG00000009373 21053776 21061372 CTSO
ENSGALG00000009388 17813559 17842946 SUSD4
ENSGALG00000009415 27718429 27835276 SMOC1
ENSGALG00000009482 22957794 22975908 HEPACAM2
ENSGALG00000009494 28446182 28454715 THAP5
ENSGALG00000009621 4191291 4195531 ACTB
ENSGALG00000009689 23875666 23895602 PON2
ENSGALG00000009859 33794056 33841926 TBC1D30
ENSGALG00000009905 35112854 35137000 MDM1
ENSGALG00000009911 23119921 23148269 BICRAL
ENSGALG00000010078 29377291 29456632 GLP1R
ENSGALG00000010091 20435484 20440428 ATP6V0B
ENSGALG00000010130 34390208 34408877 INTS10
ENSGALG00000010218 22895278 22903708 ENSGALG00000010316 35018318 35181390 FRAS1
ENSGALG00000010323 38322143 38331207 BATF
ENSGALG00000010326 38339289 38363624 FLVCR2

279
Gene stable ID Gene start (bp) Gene end (bp) Gene name
ENSGALG00000010391 35737241 35779227 MMRN1
ENSGALG00000010440 21871550 21892367 MKNK1
ENSGALG00000010507 2411319 2419611 FCRL4
ENSGALG00000010743 25193186 25198474 LRRC42
ENSGALG00000010863 29836832 29840103 TWISTNB
ENSGALG00000011068 20140771 20213740 COBLL1
ENSGALG00000011145 33598483 33600756 TRIL
ENSGALG00000011252 22249638 22253369 ENSGALG00000011262 35587263 35752218 KCNH8
ENSGALG00000011289 37318200 37327078 NKIRAS1
ENSGALG00000011322 38560047 38575577 ENSGALG00000011371 22575074 22586232 STK36
ENSGALG00000011570 1700996 1705561 ILF2
ENSGALG00000011593 25443913 25448325 TMEM177
ENSGALG00000011717 47884753 47909098 ENSGALG00000012177 29971539 29999038 NCKAP5
ENSGALG00000012207 30610000 30632948 CCNT2
ENSGALG00000012211 58569546 58695921 PDLIM5
ENSGALG00000012259 30784867 30798568 UBXN4
ENSGALG00000012290 51089596 51098755 SOX10
ENSGALG00000012355 30835173 30873167 DARS
ENSGALG00000012857 56889138 56945866 DENND2A
ENSGALG00000012885 68102902 68190463 BCL2
ENSGALG00000012984 1185316 1196659 ENSGALG00000013085 62813644 62962492 PTPRO
ENSGALG00000013149 85073411 85199421 MOCOS
ENSGALG00000013168 65318628 65322354 IAPP
ENSGALG00000013180 85992259 86016056 SLC6A18
ENSGALG00000013183 86021205 86050671 TERT
ENSGALG00000013247 190389807 190403692 CCDC83
ENSGALG00000013571 61766265 61782543 ENSGALG00000013573 90006995 90008669 ALG2
ENSGALG00000013964 66571723 66587002 SPATA18
ENSGALG00000014041 67608354 67618608 ENSGALG00000014115 66884633 66910624 SLAIN2
ENSGALG00000014126 68381261 68385975 ENSGALG00000014643 2258114 2277397 ENSGALG00000014918 63859412 63892453 RFX6
ENSGALG00000014924 79422423 79478850 POLQ
ENSGALG00000015030 103346605 103372094 NPC1
ENSGALG00000015097 32917400 32946020 ENSGALG00000015259 110285815 110358845 RB1CC1
ENSGALG00000015307 84985337 85117095 ABI3BP
ENSGALG00000015374 53526993 53532383 RBP4
ENSGALG00000015630 62158975 62431421 EDIL3
ENSGALG00000015687 83332108 83333493 ENSGALG00000015923 81803398 81811037 MTO1
ENSGALG00000016042 106660194 106677742 CHAF1B
ENSGALG00000016127 108027675 108053510 SH3BGR
ENSGALG00000016138 108236302 108412621 DSCAM
ENSGALG00000016174 83383540 83449168 LMBRD1
ENSGALG00000016358 118434845 118464479 PTCHD1
ENSGALG00000016509 104821709 104855287 IFT172

280
Gene stable ID Gene start (bp) Gene end (bp) Gene name
ENSGALG00000016556 105439100 105446401 ENSGALG00000016576 122934649 122963767 OFD1
ENSGALG00000016639 106684652 106726136 ENSGALG00000016648 128514145 128528599 ENSGALG00000016692 109266889 109273908 CENPQ
ENSGALG00000016922 155063078 155069210 COMMD6
ENSGALG00000017015 169902418 169946212 RNASEH2B
ENSGALG00000017038 171237604 171257844 PROSER1
ENSGALG00000017148 179310484 179327166 CENPJ
ENSGALG00000017184 182581300 182585639 MMP7
ENSGALG00000017493 194226590 194228925 ENSGALG00000019178 109072306 109103187 PRDM15
ENSGALG00000019211 91823350 91832861 MAEL
ENSGALG00000019543 76489687 76496184 OTULIN
ENSGALG00000019554 67906620 67915397 ENSGALG00000019756 27814585 27819688 MLANA
ENSGALG00000020032 34909552 34914562 ENSGALG00000020210 39752033 39762452 CENPU
ENSGALG00000020454 26192258 26194122 C5H14ORF169
ENSGALG00000020899 16538881 16556264 ENSGALG00000020905 11280496 11328347 KSR2
ENSGALG00000021025 10210849 10215330 ENSGALG00000021362 9226556 9229211 GPRC5C
ENSGALG00000021696 301097 305124 ENSGALG00000022751 144542279 144543954 ENSGALG00000022882 91704833 91707742 ZADH2
ENSGALG00000023120 52137022 52139535 SULT1B1
ENSGALG00000023708 4845916 4849134 UBXN10
ENSGALG00000023843 3476861 3485053 FRMD7
ENSGALG00000024051 2612501 2631106 SETDB1
ENSGALG00000024298 3256975 3261306 ADAMTSL5
ENSGALG00000026080 3414370 3416416 OMD
ENSGALG00000026152 2254875 2264684 GBP
ENSGALG00000026384 3250482 3255046 PCSK4
ENSGALG00000026431 5910507 5916770 SEZ6
ENSGALG00000026948 3524231 3543372 ADD2
ENSGALG00000027476 579684 584242 PLEKHG5
ENSGALG00000027700 1801816 1808119 FLAD1
ENSGALG00000027809 4053373 4054788 FAM196B
ENSGALG00000028262 4970553 4972635 ENSGALG00000028302 17160590 17161925 UQCRQ
ENSGALG00000028367 219651 222858 ENSGALG00000028457 30640415 30649263 MAP3K19
ENSGALG00000028520 15591701 15594391 CST3
ENSGALG00000028536 16906936 16909098 MPEG1
ENSGALG00000028620 9090918 9092123 ENSGALG00000028675 81671863 81767102 ENSGALG00000028849 30864013 30895009 SCAF11
ENSGALG00000028960 195852602 195857112 NEU3
ENSGALG00000029027 13113263 13120464 SEPT12
ENSGALG00000029040 194664785 194665750 ENSGALG00000029440 7983437 8000891 ENSGALG00000029896 16565634 16667942

281
Gene stable ID Gene start (bp) Gene end (bp) Gene name
ENSGALG00000029935 84680635 84765600 EPB41L4B
ENSGALG00000030270 14372 17201 CD1C
ENSGALG00000030985 2722336 2748121 MYH7B
ENSGALG00000031119 6099444 6113592 ENSGALG00000031142 985790 998134 ACAA2
ENSGALG00000031160 50410218 50412820 ENSGALG00000031262 85886610 85913057 ENSGALG00000031737 14760117 14805890 ENSGALG00000031812 2863361 2867426 TDRKH
ENSGALG00000031906 1336572 1360690 FAM83C
ENSGALG00000031997 46310717 46320326 SFRP4
ENSGALG00000032156 20305696 20329063 TUBGCP6
ENSGALG00000032231 58543 72898 C4
ENSGALG00000032348 21405 22499 LTB4R
ENSGALG00000032372 7394751 7414352 CYB5R2
ENSGALG00000032419 559645 600269 STARD8
ENSGALG00000032642 770602 836615 SMARCC1
ENSGALG00000032943 293237 295905 ESAM
ENSGALG00000032999 30401258 30403162 ENSGALG00000033089 126865549 126908440 ENSGALG00000033199 105330816 105350209 ENSGALG00000033203 104988818 104992131 TRIM54
ENSGALG00000033254 129000072 129034245 SPAG1
ENSGALG00000033497 4844452 4882773 FOXP4
ENSGALG00000033587 48193459 48195214 ENSGALG00000033887 61679420 61699251 IL17RA
ENSGALG00000033953 1864533 1871303 SHROOM4
ENSGALG00000034094 18338330 18340228 SP5
ENSGALG00000034124 401009 426665 NLRPL
ENSGALG00000034347 280212 292746 KIF21B
ENSGALG00000034436 7248755 7254132 CEL
ENSGALG00000034493 46064049 46088568 DCLK3
ENSGALG00000034756 2588773 2595216 ENSGALG00000034760 33379224 33417837 ENSGALG00000034932 108844363 108894770 BACE2
ENSGALG00000035075 81925 86753 TAP1
ENSGALG00000035281 15342791 15398782 WAC
ENSGALG00000035625 97142592 97198921 CEP192
ENSGALG00000035774 17837266 17884273 PPFIA1
ENSGALG00000035814 1399403 1409506 ENSGALG00000035918 6912250 6917437 ENSGALG00000035945 1257270 1260719 ENSGALG00000036171 41876496 41879009 ENSGALG00000036240 48974017 48992482 ENSGALG00000036356 2591447 2633020 YEATS2
ENSGALG00000036731 11210312 11216535 GAS2L1
ENSGALG00000036867 50804456 50812317 CBX6
ENSGALG00000037031 2952855 2958096 ENSGALG00000037426 1086973 1234604 DYM
ENSGALG00000037526 3396001 3398518 ENSGALG00000037625 259255 381102 ENSGALG00000037642 2437835 2441728 SLC23A1
ENSGALG00000037735 56578 58190 CENPA

282
Gene stable ID Gene start (bp) Gene end (bp) Gene name
ENSGALG00000037819 190601433 190603690 ENSGALG00000037852 3807434 3813304 HSD17B7
ENSGALG00000038041 26093813 26248608 PHF14
ENSGALG00000038393 90602 93633 DMB2
ENSGALG00000038748 2399479 2404284 ENSGALG00000038884 12712422 12731398 SRL
ENSGALG00000039155 5082235 5112652 ZHX3
ENSGALG00000039193 2702980 2766080 AGRN
ENSGALG00000039212 3468756 3469830 ENSGALG00000039322 3813929 3819587 DDR2
ENSGALG00000039349 39594353 39768545 DISC1
ENSGALG00000039708 899308 900931 ENSGALG00000040157 6005683 6016988 CHTF18
ENSGALG00000040528 4009890 4027865 AP5Z1
ENSGALG00000040651 16697772 16838212 IGF1R
ENSGALG00000040864 3211486 3215691 WDR77
ENSGALG00000041013 22734389 22773379 TNS1
ENSGALG00000041179 128662474 128890608 VPS13B
ENSGALG00000041285 4510613 4536085 MAP2K3
ENSGALG00000041331 22344799 22356949 RRP12
ENSGALG00000041373 70658678 70767342 ARAP2
ENSGALG00000041437 1118722 1134255 FAM155B
ENSGALG00000041473 7069408 7109615 DDX31
ENSGALG00000041722 94035 139377 STX1A
ENSGALG00000041763 717732 720817 ADPRM
ENSGALG00000041808 17729748 17800632 ANO1
ENSGALG00000041845 230728 236886 ZNF692
ENSGALG00000042136 108086835 108304491 PKHD1
ENSGALG00000042624 222695 233308 CEP85
ENSGALG00000043198 22259564 22269563 ENSGALG00000043265 148783909 148939588 ZC3H3
ENSGALG00000043363 11946755 11997989 KIAA0556
ENSGALG00000043379 41319152 41322432 ENSGALG00000043390 103416843 103491928 ENSGALG00000043416 2343395 2349349 TARS2
ENSGALG00000043448 81244337 81342994 ABLIM2
ENSGALG00000043476 456388 463442 ARF5
ENSGALG00000043831 31006925 31012835 LRRC73
ENSGALG00000043910 1350804 1351751 OR5AS1
ENSGALG00000043935 46064419 46096688 AFF1
ENSGALG00000044042 5085190 5087144 ENSGALG00000044087 1292210 1304961 KCTD19
ENSGALG00000044298 5790040 5791347 ENSGALG00000044343 345292 369940 ENSGALG00000044425 194506121 194507731 ENSGALG00000044478 41740334 41838759 LRRIQ1
ENSGALG00000044510 92226911 92240484 C18orf63
ENSGALG00000044606 106703338 106726193 MEP1B
ENSGALG00000044620 90177250 90228176 ENSGALG00000045006 18546133 18549204 LCTL
ENSGALG00000045045 20073802 20074905 ENSGALG00000045078 17445394 17453766 ENSGALG00000045312 2658470 2664070 SEMA6C

283
Gene stable ID Gene start (bp) Gene end (bp) Gene name
ENSGALG00000045534 2551707 2558281 ENSGALG00000045611 28163 31040 GLMP
ENSGALG00000046133 2696196 2701876 ENSGALG00000046235 148970847 148980300 ENSGALG00000046347 396088 398716 FOXRED1
ENSGALG00000046598 39027631 39028922 ENSGALG00000046656 1781465 1784284 PMVK
Table S 47. Non-synonymous deleterious variants with allele frequency greater than 0.9 in 27
chicken populations.
Gene stable ID Gene start (bp) Gene end (bp) Gene name
ENSGALG00000000625 3126090 3162020 MAPT
ENSGALG00000000720 1432743 1440630 ENSGALG00000001206 8366752 8370140 ENSGALG00000001235 2618283 2624077 ANKRD24
ENSGALG00000001749 1642902 1659177 ACSBG2
ENSGALG00000001857 2472220 2486139 C1QTNF12
ENSGALG00000001895 4684399 4691245 ENSGALG00000002098 3867936 3937207 GRIK3
ENSGALG00000002403 2638997 2708090 ULK1
ENSGALG00000002447 2590011 2698188 CTNNA1
ENSGALG00000002638 5116741 5157334 ENSGALG00000002663 10472558 10508150 ATR
ENSGALG00000002679 3736274 3781857 GLT1D1
ENSGALG00000002849 5041127 5044158 DCXR
ENSGALG00000002945 3328395 3380261 TMEM266
ENSGALG00000003285 10365016 10375987 CDHR2
ENSGALG00000003572 4085166 4125847 ENSGALG00000003589 5643262 5647788 VTN
ENSGALG00000003833 5721919 5794586 CACNA1E
ENSGALG00000004104 2565759 2592534 INTS1
ENSGALG00000004360 13024860 13028805 ENSGALG00000004365 5736958 5749931 WDR66
ENSGALG00000004683 9736236 9752383 TPD52L2
ENSGALG00000004798 4691169 4749364 MPRIP
ENSGALG00000004921 4271288 4287004 SLC6A1
ENSGALG00000005014 2066138 2068061 AIPL1
ENSGALG00000005028 5109957 5121859 TOP3A
ENSGALG00000005118 8396685 8397791 FAM124B
ENSGALG00000005253 5617810 5620433 ENSGALG00000005621 13192090 13212308 CAMK2A
ENSGALG00000005634 7229327 7230473 CRYBA4
ENSGALG00000005801 9071546 9090148 CHRNA4
ENSGALG00000006560 8824964 8995709 SEMA3A
ENSGALG00000006631 12837819 12854365 TICRR
ENSGALG00000007169 14127254 14169164 EPC1
ENSGALG00000007970 19107954 19156499 PIAS1
ENSGALG00000008077 19355200 19358789 PAQR5
ENSGALG00000008109 14151339 14182335 CDHR3
ENSGALG00000008120 19501916 19520583 TLE3
ENSGALG00000008180 19759094 19785369 SPG11

284
Gene stable ID Gene start (bp) Gene end (bp) Gene name
ENSGALG00000008537 16012725 16023253 EPHB3
ENSGALG00000008544 16328932 16398413 SLC8A1
ENSGALG00000008624 24855680 24884673 RPAP1
ENSGALG00000008645 16598334 16606619 NKRF
ENSGALG00000008692 25038945 25096118 ENSGALG00000008725 5571728 5637205 KIF16B
ENSGALG00000008819 2026955 2051551 LRSAM1
ENSGALG00000008885 14004793 14133988 PDE1A
ENSGALG00000009205 14117925 14203370 ENSGALG00000009844 32283463 32288278 ACTC1
ENSGALG00000010022 32220976 32236070 PRMT9
ENSGALG00000010108 34283512 34287993 C4orf33
ENSGALG00000010193 37713774 37731357 ZNF410
ENSGALG00000010276 21260097 21277121 GPBP1L1
ENSGALG00000010360 21671551 21675013 NSUN4
ENSGALG00000010572 40811286 40858950 TSHR
ENSGALG00000011149 21941750 21977517 PLA2R1
ENSGALG00000011235 34327646 34349885 GALNT15
ENSGALG00000011304 38055640 38075203 NGLY1
ENSGALG00000011687 51898823 51911235 ENSGALG00000012005 54717088 54736656 LRRC9
ENSGALG00000012072 28389233 28403654 ENSGALG00000012100 28481649 28499392 CFAP221
ENSGALG00000012155 58394125 58445817 EGF
ENSGALG00000012177 29971539 29999038 NCKAP5
ENSGALG00000012196 58526506 58553506 MCUB
ENSGALG00000012484 35331804 35359923 RIF1
ENSGALG00000012593 40166144 40179451 SLC28A3
ENSGALG00000013006 78498575 78505697 ROPN1L
ENSGALG00000013090 22249905 22254300 LOXL4
ENSGALG00000013268 89063802 89211727 ENSGALG00000013548 16662049 16666243 GZMA
ENSGALG00000014664 57880857 57984258 ENSGALG00000014765 20588770 20606823 TRIM23
ENSGALG00000014923 24570223 24702341 ARHGEF28
ENSGALG00000015002 25266850 25313351 MRPS27
ENSGALG00000015167 37397609 37448829 PRUNE2
ENSGALG00000015340 111439673 111462441 TGS1
ENSGALG00000016105 91217010 91267485 DYSF
ENSGALG00000016221 111056475 111115975 EFHC2
ENSGALG00000016279 87070833 87079598 RAB23
ENSGALG00000016314 88598880 88636560 ELOVL5
ENSGALG00000016815 136915096 136936956 UPF3A
ENSGALG00000016943 165561980 165586181 OLFM4
ENSGALG00000019030 194659669 194660631 ENSGALG00000019768 10433382 10468658 ACSF2
ENSGALG00000021198 3082764 3089843 ENSGALG00000023886 1803327 1832501 ZNF804A
ENSGALG00000025971 105661748 105672793 KCNK3
ENSGALG00000026015 10715164 10719635 ENSGALG00000027704 13862869 14132878 ENSGALG00000028238 23565911 23569213 ENSGALG00000028298 32755529 32886954

285
Gene stable ID Gene start (bp) Gene end (bp) Gene name
ENSGALG00000029000 3231438 3234557 HYAL3
ENSGALG00000029308 69135540 69146688 ENSGALG00000029599 9635 25890 ACVR1B
ENSGALG00000030024 32905460 32969236 USP15
ENSGALG00000030169 6496192 6513565 ENSGALG00000030844 7494480 7523025 DMTF1
ENSGALG00000031752 1397978 1403745 ENSGALG00000031814 71639774 71703468 ENSGALG00000032599 77089837 77115522 ZNF384
ENSGALG00000033068 391022 394724 TLR21
ENSGALG00000033199 105330816 105350209 ENSGALG00000033328 4097552 4162312 PACS2
ENSGALG00000033497 4844452 4882773 FOXP4
ENSGALG00000033557 19950725 19956592 CTSH
ENSGALG00000033807 11501308 11503836 TYSND1
ENSGALG00000035384 103261771 103315035 TMEM241
ENSGALG00000035453 48198262 48204933 RP9
ENSGALG00000035625 97142592 97198921 CEP192
ENSGALG00000036516 108608380 108614937 ENSGALG00000037163 6953116 6954713 ENSGALG00000037301 36448667 36651282 ACVR1
ENSGALG00000037407 407251 416312 FAM118B
ENSGALG00000037410 284344 322060 HEPH
ENSGALG00000037414 105324804 105326122 DNAJC28
ENSGALG00000037644 123703762 123734221 CNGB3
ENSGALG00000038426 937592 940719 CPLX4
ENSGALG00000038972 4439972 4462470 ENSGALG00000039322 3813929 3819587 DDR2
ENSGALG00000039707 4390621 4391652 ENSGALG00000039716 5309931 5318833 RNF19B
ENSGALG00000039727 530264 535057 ENSGALG00000039901 149440993 149468746 PUF60
ENSGALG00000041181 13910194 13915248 ENSGALG00000041233 139401611 139404620 FAM84B
ENSGALG00000041977 17396691 17432723 ENSGALG00000042001 35288232 35306393 ENSGALG00000042485 2114444 2148315 PHACTR4
ENSGALG00000042705 5476398 5479857 KCNK15
ENSGALG00000043703 763219 769060 ENSGALG00000044141 46639207 46643200 THAP9
ENSGALG00000045173 83783694 83796470 ENSGALG00000045204 154444261 154449459 FBXL3
ENSGALG00000045218 7100719 7141338 MYO18B
ENSGALG00000045232 7026294 7051788 SYCP2
ENSGALG00000045350 16715725 16741025 ENSGALG00000045365 194646692 194647502 OR51E1
ENSGALG00000045414 179330679 179371572 ENSGALG00000045466 6816418 6817036 ENSGALG00000045706 778866 781827 ENSGALG00000045935 2672496 2676279

286
Chapter 5
Table S 48. Hp values within the threshold level (Hp ≤ -4) in Improved Horro (N=30).
Chr Start Stop Hp uZHp µSNP
1 189490000 189510000 0.0000 -5.71 82
1 190890000 190910000 0.0000 -5.71 49
1 190900000 190920000 0.0000 -5.71 82
1 190910000 190930000 0.0000 -5.71 100
1 32500000 32520000 0.0005 -5.70 72
1 32490000 32510000 0.0006 -5.70 103
1 190920000 190940000 0.0009 -5.69 78
1 190880000 190900000 0.0015 -5.68 44
1 32450000 32470000 0.0026 -5.67 52
1 189480000 189500000 0.0029 -5.66 92
1 181220000 181240000 0.0030 -5.66 88
1 190980000 191000000 0.0032 -5.65 41
1 32560000 32580000 0.0045 -5.63 54
1 32480000 32500000 0.0067 -5.59 84
1 32550000 32570000 0.0069 -5.59 94
1 160960000 160980000 0.0087 -5.56 42
1 190960000 190980000 0.0090 -5.56 96
1 32530000 32550000 0.0109 -5.52 97
1 190990000 191010000 0.0120 -5.50 66
1 190950000 190970000 0.0127 -5.49 94
1 32520000 32540000 0.0132 -5.48 90
1 190870000 190890000 0.0136 -5.48 68
1 32510000 32530000 0.0139 -5.47 62
1 32540000 32560000 0.0147 -5.46 92
1 32460000 32480000 0.0150 -5.45 44
1 190930000 190950000 0.0172 -5.41 46
1 190970000 190990000 0.0191 -5.38 45
1 189470000 189490000 0.0212 -5.35 109
1 32470000 32490000 0.0220 -5.33 48
1 32630000 32650000 0.0259 -5.26 118
1 146760000 146780000 0.0261 -5.26 63
1 32790000 32810000 0.0265 -5.25 108
1 32800000 32820000 0.0265 -5.25 150
1 181850000 181870000 0.0268 -5.25 97
1 32660000 32680000 0.0271 -5.24 145
1 32810000 32830000 0.0273 -5.24 147
1 32620000 32640000 0.0275 -5.24 159
1 32670000 32690000 0.0280 -5.23 115
1 160950000 160970000 0.0284 -5.22 52
1 32640000 32660000 0.0296 -5.20 60
1 32650000 32670000 0.0319 -5.16 113
1 146810000 146830000 0.0320 -5.16 40
1 32610000 32630000 0.0324 -5.15 95

287
Chr Start Stop Hp uZHp µSNP
1 181790000 181810000 0.0324 -5.15 95
1 146770000 146790000 0.0328 -5.15 33
1 146780000 146800000 0.0328 -5.15 42
1 181780000 181800000 0.0328 -5.15 60
1 181840000 181860000 0.0328 -5.15 109
1 174520000 174540000 0.0336 -5.13 155
1 32580000 32600000 0.0343 -5.12 21
1 55850000 55870000 0.0344 -5.12 175
1 190940000 190960000 0.0346 -5.12 55
1 32780000 32800000 0.0355 -5.10 108
1 142900000 142920000 0.0355 -5.10 186
1 146990000 147010000 0.0360 -5.09 30
1 146820000 146840000 0.0364 -5.08 81
1 55860000 55880000 0.0368 -5.08 97
1 181800000 181820000 0.0370 -5.07 122
1 43200000 43220000 0.0372 -5.07 66
1 32590000 32610000 0.0384 -5.05 23
1 189460000 189480000 0.0392 -5.04 120
1 161780000 161800000 0.0400 -5.02 62
1 181770000 181790000 0.0403 -5.02 85
1 146790000 146810000 0.0425 -4.98 69
1 55840000 55860000 0.0442 -4.95 171
1 146830000 146850000 0.0459 -4.92 83
1 146800000 146820000 0.0471 -4.90 47
1 160940000 160960000 0.0476 -4.89 28
1 181230000 181250000 0.0478 -4.89 85
1 32600000 32620000 0.0482 -4.88 27
1 179110000 179130000 0.0498 -4.85 144
1 129550000 129570000 0.0508 -4.84 159
1 76430000 76450000 0.0510 -4.83 79
1 162220000 162240000 0.0520 -4.82 96
1 179100000 179120000 0.0563 -4.74 185
1 146840000 146860000 0.0566 -4.74 48
1 76420000 76440000 0.0590 -4.70 98
1 162170000 162190000 0.0592 -4.69 24
1 111450000 111470000 0.0656 -4.58 54
1 103890000 103910000 0.0673 -4.55 206
1 55830000 55850000 0.0689 -4.53 189
1 162510000 162530000 0.0694 -4.52 144
1 111440000 111460000 0.0699 -4.51 63
1 32440000 32460000 0.0699 -4.51 74
1 111430000 111450000 0.0703 -4.50 79
1 174510000 174530000 0.0711 -4.49 219
1 76440000 76460000 0.0713 -4.48 27
1 67310000 67330000 0.0770 -4.39 91
1 190860000 190880000 0.0788 -4.36 80
1 181310000 181330000 0.0791 -4.35 66

288
Chr Start Stop Hp uZHp µSNP
1 67160000 67180000 0.0795 -4.34 273
1 9400000 9420000 0.0795 -4.34 45
1 162500000 162520000 0.0800 -4.33 166
1 179090000 179110000 0.0804 -4.33 172
1 129560000 129580000 0.0808 -4.32 113
1 43210000 43230000 0.0810 -4.32 69
1 161770000 161790000 0.0822 -4.30 66
1 55530000 55550000 0.0828 -4.29 124
1 103880000 103900000 0.0829 -4.29 182
1 81720000 81740000 0.0838 -4.27 195
1 119500000 119520000 0.0843 -4.26 85
1 77090000 77110000 0.0844 -4.26 145
1 179070000 179090000 0.0849 -4.25 122
1 146980000 147000000 0.0852 -4.25 83
1 81710000 81730000 0.0856 -4.24 144
1 181240000 181260000 0.0857 -4.24 84
1 32680000 32700000 0.0868 -4.22 96
1 142910000 142930000 0.0882 -4.19 242
1 162520000 162540000 0.0884 -4.19 100
1 61360000 61380000 0.0892 -4.18 266
1 59230000 59250000 0.0896 -4.17 78
1 61370000 61390000 0.0899 -4.16 200
1 32820000 32840000 0.0923 -4.12 100
1 177150000 177170000 0.0932 -4.11 117
1 55520000 55540000 0.0934 -4.10 150
1 77080000 77100000 0.0948 -4.08 138
1 55510000 55530000 0.0954 -4.07 153
1 107330000 107350000 0.0960 -4.06 122
1 9390000 9410000 0.0961 -4.06 92
1 147040000 147060000 0.0971 -4.04 112
1 181250000 181270000 0.0974 -4.04 101
1 162490000 162510000 0.0976 -4.03 104
1 179080000 179100000 0.0977 -4.03 146
1 35320000 35340000 0.0987 -4.01 57
1 146920000 146940000 0.0993 -4.00 125
2 147310000 147330000 0.0004 -5.70 93
2 147300000 147320000 0.0033 -5.65 111
2 147290000 147310000 0.0048 -5.63 90
2 140520000 140540000 0.0077 -5.58 86
2 147280000 147300000 0.0126 -5.49 87
2 147270000 147290000 0.0131 -5.48 101
2 140510000 140530000 0.0273 -5.24 112
2 147260000 147280000 0.0285 -5.22 112
2 141430000 141450000 0.0382 -5.05 148
2 141410000 141430000 0.0413 -5.00 241
2 141420000 141440000 0.0435 -4.96 185
2 141400000 141420000 0.0460 -4.92 254

289
Chr Start Stop Hp uZHp µSNP
2 8010000 8030000 0.0498 -4.85 188
2 141440000 141460000 0.0520 -4.82 154
2 140500000 140520000 0.0594 -4.69 187
2 21260000 21280000 0.0631 -4.63 186
2 8020000 8040000 0.0637 -4.62 198
2 60950000 60970000 0.0668 -4.56 93
2 147490000 147510000 0.0674 -4.55 202
2 140530000 140550000 0.0682 -4.54 155
2 147720000 147740000 0.0721 -4.47 183
2 140410000 140430000 0.0729 -4.46 150
2 147730000 147750000 0.0742 -4.43 175
2 147570000 147590000 0.0789 -4.35 167
2 147700000 147720000 0.0792 -4.35 165
2 142810000 142830000 0.0803 -4.33 39
2 147220000 147240000 0.0804 -4.33 162
2 147230000 147250000 0.0830 -4.28 154
2 147500000 147520000 0.0841 -4.26 210
2 147510000 147530000 0.0849 -4.25 246
2 147580000 147600000 0.0859 -4.23 109
2 111900000 111920000 0.0868 -4.22 192
2 147520000 147540000 0.0872 -4.21 242
2 142890000 142910000 0.0879 -4.20 47
2 147320000 147340000 0.0885 -4.19 93
2 8030000 8050000 0.0901 -4.16 221
2 73650000 73670000 0.0902 -4.16 69
2 147480000 147500000 0.0903 -4.16 193
2 11690000 11710000 0.0923 -4.12 118
2 73570000 73590000 0.0923 -4.12 180
2 111910000 111930000 0.0924 -4.12 165
2 147530000 147550000 0.0929 -4.11 186
2 73590000 73610000 0.0929 -4.11 130
2 140400000 140420000 0.0942 -4.09 142
2 147210000 147230000 0.0945 -4.09 115
2 73560000 73580000 0.0948 -4.08 134
2 21250000 21270000 0.0956 -4.07 194
2 111890000 111910000 0.0961 -4.06 188
2 4520000 4540000 0.0965 -4.05 81
2 111860000 111880000 0.0965 -4.05 119
2 111840000 111860000 0.0975 -4.03 157
2 82700000 82720000 0.0981 -4.02 68
2 73580000 73600000 0.0989 -4.01 161
3 36690000 36710000 0.0266 -5.25 73
3 36680000 36700000 0.0297 -5.20 74
3 78560000 78580000 0.0328 -5.15 108
3 57540000 57560000 0.0371 -5.07 38
3 20940000 20960000 0.0466 -4.91 286
3 51900000 51920000 0.0508 -4.84 207

290
Chr Start Stop Hp uZHp µSNP
3 51890000 51910000 0.0512 -4.83 151
3 57530000 57550000 0.0512 -4.83 83
3 57560000 57580000 0.0634 -4.62 208
3 51910000 51930000 0.0640 -4.61 234
3 57520000 57540000 0.0647 -4.60 128
3 57550000 57570000 0.0682 -4.54 100
3 69840000 69860000 0.0765 -4.39 59
3 69060000 69080000 0.0767 -4.39 159
3 69820000 69840000 0.0770 -4.39 74
3 69850000 69870000 0.0790 -4.35 113
3 61520000 61540000 0.0847 -4.25 132
3 82470000 82490000 0.0886 -4.19 297
3 61510000 61530000 0.0923 -4.12 209
3 50290000 50310000 0.0933 -4.11 190
3 20970000 20990000 0.0963 -4.05 246
3 111060000 111080000 0.0992 -4.01 43
4 39500000 39520000 0.0023 -5.67 265
4 39490000 39510000 0.0032 -5.65 186
4 64960000 64980000 0.0108 -5.52 135
4 39410000 39430000 0.0122 -5.50 193
4 39400000 39420000 0.0122 -5.50 182
4 7970000 7990000 0.0215 -5.34 106
4 7960000 7980000 0.0295 -5.20 107
4 7980000 8000000 0.0328 -5.15 64
4 28840000 28860000 0.0335 -5.13 90
4 64950000 64970000 0.0342 -5.12 110
4 39420000 39440000 0.0368 -5.08 185
4 39440000 39460000 0.0380 -5.06 130
4 39480000 39500000 0.0383 -5.05 164
4 39720000 39740000 0.0391 -5.04 179
4 39730000 39750000 0.0400 -5.02 241
4 39430000 39450000 0.0410 -5.00 167
4 39690000 39710000 0.0422 -4.98 105
4 7990000 8010000 0.0476 -4.89 43
4 39390000 39410000 0.0488 -4.87 206
4 63140000 63160000 0.0511 -4.83 40
4 78120000 78140000 0.0526 -4.81 106
4 78110000 78130000 0.0528 -4.80 54
4 7950000 7970000 0.0557 -4.75 82
4 8000000 8020000 0.0624 -4.64 77
4 39450000 39470000 0.0659 -4.58 164
4 53740000 53760000 0.0667 -4.56 220
4 26340000 26360000 0.0679 -4.54 180
4 39470000 39490000 0.0707 -4.49 180
4 78100000 78120000 0.0726 -4.46 121
4 26350000 26370000 0.0738 -4.44 226
4 28470000 28490000 0.0748 -4.42 21

291
Chr Start Stop Hp uZHp µSNP
4 38110000 38130000 0.0752 -4.42 118
4 39460000 39480000 0.0768 -4.39 192
4 27940000 27960000 0.0788 -4.35 45
4 39740000 39760000 0.0809 -4.32 195
4 8010000 8030000 0.0830 -4.28 96
4 39300000 39320000 0.0844 -4.26 183
4 28830000 28850000 0.0857 -4.24 84
4 78130000 78150000 0.0861 -4.23 136
4 37880000 37900000 0.0864 -4.23 255
4 27860000 27880000 0.0866 -4.22 97
4 39310000 39330000 0.0869 -4.22 119
4 78090000 78110000 0.0873 -4.21 177
4 26370000 26390000 0.0882 -4.19 89
4 39680000 39700000 0.0883 -4.19 225
4 37810000 37830000 0.0890 -4.18 110
4 39320000 39340000 0.0908 -4.15 135
4 26360000 26380000 0.0916 -4.14 167
4 27970000 27990000 0.0934 -4.10 38
4 27930000 27950000 0.0936 -4.10 85
4 26330000 26350000 0.0936 -4.10 171
4 27960000 27980000 0.0941 -4.09 32
4 7450000 7470000 0.0946 -4.08 149
4 71900000 71920000 0.0950 -4.08 132
4 7940000 7960000 0.0960 -4.06 86
4 78020000 78040000 0.0975 -4.03 244
4 53010000 53030000 0.0982 -4.02 227
5 40840000 40860000 0.0007 -5.70 152
5 2000000 2020000 0.0305 -5.19 98
5 2010000 2030000 0.0328 -5.15 50
5 2100000 2120000 0.0331 -5.14 101
5 2110000 2130000 0.0337 -5.13 73
5 2090000 2110000 0.0344 -5.12 100
5 40830000 40850000 0.0346 -5.12 163
5 2180000 2200000 0.0356 -5.10 46
5 2200000 2220000 0.0362 -5.09 57
5 2190000 2210000 0.0364 -5.08 71
5 2020000 2040000 0.0378 -5.06 147
5 2210000 2230000 0.0383 -5.05 41
5 2060000 2080000 0.0393 -5.03 99
5 2170000 2190000 0.0398 -5.03 23
5 2070000 2090000 0.0402 -5.02 100
5 2080000 2100000 0.0410 -5.01 94
5 2050000 2070000 0.0428 -4.97 99
5 2030000 2050000 0.0431 -4.97 158
5 22480000 22500000 0.0456 -4.93 30
5 2040000 2060000 0.0457 -4.92 94
5 2320000 2340000 0.0459 -4.92 61

292
Chr Start Stop Hp uZHp µSNP
5 2120000 2140000 0.0481 -4.88 69
5 2280000 2300000 0.0482 -4.88 60
5 2160000 2180000 0.0521 -4.81 33
5 2290000 2310000 0.0522 -4.81 59
5 2270000 2290000 0.0530 -4.80 52
5 41880000 41900000 0.0538 -4.79 135
5 2150000 2170000 0.0545 -4.77 40
5 2130000 2150000 0.0563 -4.74 50
5 2240000 2260000 0.0571 -4.73 47
5 2140000 2160000 0.0581 -4.71 23
5 22490000 22510000 0.0590 -4.70 23
5 1990000 2010000 0.0591 -4.69 157
5 2260000 2280000 0.0594 -4.69 37
5 2250000 2270000 0.0596 -4.68 39
5 5390000 5410000 0.0600 -4.68 267
5 2300000 2320000 0.0612 -4.66 76
5 40850000 40870000 0.0616 -4.65 178
5 2310000 2330000 0.0620 -4.64 89
5 2220000 2240000 0.0625 -4.64 47
5 22400000 22420000 0.0671 -4.56 47
5 2230000 2250000 0.0679 -4.54 45
5 22370000 22390000 0.0683 -4.54 32
5 22690000 22710000 0.0686 -4.53 149
5 22410000 22430000 0.0717 -4.48 51
5 12700000 12720000 0.0789 -4.35 181
5 41890000 41910000 0.0803 -4.33 117
5 12690000 12710000 0.0805 -4.33 265
5 26440000 26460000 0.0827 -4.29 196
5 14950000 14970000 0.0878 -4.20 21
5 41870000 41890000 0.0911 -4.14 122
5 7480000 7500000 0.0969 -4.04 311
5 12680000 12700000 0.0991 -4.01 301
5 41710000 41730000 0.0994 -4.00 68
6 15650000 15670000 0.0364 -5.08 79
6 16000000 16020000 0.0418 -4.99 185
6 15670000 15690000 0.0450 -4.94 97
6 15660000 15680000 0.0483 -4.88 74
6 16010000 16030000 0.0581 -4.71 208
6 6680000 6700000 0.0826 -4.29 577
6 6670000 6690000 0.0876 -4.20 530
6 15990000 16010000 0.0934 -4.10 90
6 6650000 6670000 0.0963 -4.05 402
7 31490000 31510000 0.0776 -4.38 110
7 31240000 31260000 0.0796 -4.34 200
7 31480000 31500000 0.0834 -4.28 52
8 15250000 15270000 0.0184 -5.39 149
8 15260000 15280000 0.0187 -5.39 76

293
Chr Start Stop Hp uZHp µSNP
8 15270000 15290000 0.0274 -5.24 36
8 15240000 15260000 0.0275 -5.24 202
8 15230000 15250000 0.0288 -5.21 197
8 15460000 15480000 0.0296 -5.20 103
8 15450000 15470000 0.0368 -5.08 128
8 15470000 15490000 0.0406 -5.01 99
8 15440000 15460000 0.0419 -4.99 165
8 15490000 15510000 0.0451 -4.93 132
8 15500000 15520000 0.0461 -4.92 118
8 15430000 15450000 0.0478 -4.89 177
8 15480000 15500000 0.0481 -4.88 127
8 8830000 8850000 0.0481 -4.88 229
8 8820000 8840000 0.0583 -4.71 209
8 8990000 9010000 0.0602 -4.68 44
8 9160000 9180000 0.0639 -4.61 123
8 9730000 9750000 0.0684 -4.53 71
8 8810000 8830000 0.0738 -4.44 126
8 13100000 13120000 0.0742 -4.43 57
8 8800000 8820000 0.0748 -4.42 27
8 9680000 9700000 0.0776 -4.38 47
8 16200000 16220000 0.0783 -4.36 305
8 9720000 9740000 0.0810 -4.32 67
8 15510000 15530000 0.0815 -4.31 112
8 9170000 9190000 0.0828 -4.29 87
8 9800000 9820000 0.0836 -4.27 69
8 19380000 19400000 0.0838 -4.27 119
8 230000 250000 0.0855 -4.24 35
8 16210000 16230000 0.0890 -4.18 216
8 9200000 9220000 0.0901 -4.16 92
8 9000000 9020000 0.0907 -4.15 28
8 8980000 9000000 0.0910 -4.15 164
8 9520000 9540000 0.0913 -4.14 89
8 9740000 9760000 0.0918 -4.13 74
8 9790000 9810000 0.0930 -4.11 59
8 15980000 16000000 0.0934 -4.10 150
8 9130000 9150000 0.0942 -4.09 75
8 9150000 9170000 0.0982 -4.02 113
8 16220000 16240000 0.0982 -4.02 205
8 15220000 15240000 0.0992 -4.00 192
9 10180000 10200000 0.0005 -5.70 61
9 10150000 10170000 0.0033 -5.65 71
9 10190000 10210000 0.0104 -5.53 54
9 10170000 10190000 0.0169 -5.42 84
9 10160000 10180000 0.0184 -5.39 88
9 12400000 12420000 0.0252 -5.28 30
9 14250000 14270000 0.0380 -5.06 116
9 14260000 14280000 0.0492 -4.86 128

294
Chr Start Stop Hp uZHp µSNP
9 10200000 10220000 0.0907 -4.15 126
9 12410000 12430000 0.0914 -4.14 133
9 10410000 10430000 0.0981 -4.02 87
11 1610000 1630000 0.0249 -5.28 196
11 13520000 13540000 0.0691 -4.52 60
11 13530000 13550000 0.0905 -4.15 77
12 7730000 7750000 0.0000 -5.71 61
12 7740000 7760000 0.0162 -5.43 45
12 7720000 7740000 0.0666 -4.57 116
12 7750000 7770000 0.0812 -4.31 114
13 1650000 1670000 0.0773 -4.38 29
13 1660000 1680000 0.0808 -4.32 32
14 5300000 5320000 0.0148 -5.46 76
14 14780000 14800000 0.0287 -5.22 71
14 8380000 8400000 0.0530 -4.80 184
14 14770000 14790000 0.0636 -4.62 75
18 90000 110000 0.0659 -4.58 25
18 10290000 10310000 0.0702 -4.50 76
18 10280000 10300000 0.0761 -4.40 157
18 10270000 10290000 0.0802 -4.33 169
18 80000 100000 0.0932 -4.11 28
21 60000 80000 0.0413 -5.00 30
21 70000 90000 0.0415 -5.00 33
21 80000 100000 0.0451 -4.93 26
21 10000 30000 0.0506 -4.84 25
21 130000 150000 0.0697 -4.51 41
21 120000 140000 0.0722 -4.47 36
21 90000 110000 0.0759 -4.41 27
21 1590000 1610000 0.0795 -4.34 141
21 180000 200000 0.0799 -4.34 36
21 1600000 1620000 0.0844 -4.26 143
22 1670000 1690000 0.0888 -4.18 44
23 4930000 4950000 0.0731 -4.45 189
23 4980000 5000000 0.0852 -4.25 188
23 5290000 5310000 0.0875 -4.21 156
23 60000 80000 0.0883 -4.19 63
23 50000 70000 0.0907 -4.15 63
23 40000 60000 0.0918 -4.13 75
23 130000 150000 0.0962 -4.06 52
23 110000 130000 0.0986 -4.02 25
27 5460000 5480000 0.0404 -5.01 21
27 5470000 5490000 0.0682 -4.54 25
27 5620000 5640000 0.0683 -4.54 25
27 5480000 5500000 0.0805 -4.33 25
27 5540000 5560000 0.0905 -4.15 27

295
Table S 49. List of genes for Improved Horro based on Hp methods.
Chr Gene stable ID Gene start (bp) Gene end (bp) Gene name Gene type
1 ENSGALG00000044624 59245579 59246586 protein coding
1 ENSGALG00000026901 76447763 76447872 gga-mir-6606 miRNA
1 ENSGALG00000027781 103899869 103900014 RF02271 Misc RNA
1 ENSGALG00000038995 181192418 181414573 GRIA4 protein coding
1 ENSGALG00000012791 55806774 56041222 TBXAS1 protein coding
1 ENSGALG00000013273 67167377 67170581 SPX protein coding
1 ENSGALG00000032599 77089837 77115522 ZNF384 protein coding
1 ENSGALG00000012760 55504144 55518514 protein coding
1 ENSGALG00000012761 55547853 55561586 DRAM1 protein coding
1 ENSGALG00000009945 35315781 35347355 CPM protein coding
1 ENSGALG00000014457 77069090 77083835 ING4 protein coding
1 ENSGALG00000017139 179051034 179094239 protein coding
1 ENSGALG00000045031 59237872 59238879 protein coding
1 ENSGALG00000011930 76345584 76430119 OVST protein coding
1 ENSGALG00000044524 59241726 59242732 protein coding
1 ENSGALG00000016900 146527090 147094328 GPC6 protein coding
1 ENSGALG00000016936 162193513 162295112 TDRD3 protein coding
1 ENSGALG00000044959 59249433 59250440 protein coding
1 ENSGALG00000017071 174502627 174526844 protein coding
1 ENSGALG00000027868 177160927 177162801 AMER2 protein coding
1 ENSGALG00000016937 162382843 162527048 DIAPH3 protein coding
1 ENSGALG00000043421 179104456 179142555 protein coding
1 ENSGALG00000045907 160634644 161043700 lincRNA
1 ENSGALG00000033721 160954713 161173427 lincRNA
1 ENSGALG00000030557 161681381 161818838 lincRNA
1 ENSGALG00000042343 177157394 177159079 lincRNA
1 ENSGALG00000033716 181770866 181805885 lincRNA
1 ENSGALG00000038179 32268154 32452343 lincRNA
1 ENSGALG00000042870 32603425 32604254 lincRNA
1 ENSGALG00000040898 76458738 76463188 lincRNA
2 ENSGALG00000012941 73245203 73614065 CDH12 protein coding
2 ENSGALG00000005710 4515467 4582669 CTDSPL protein coding
2 ENSGALG00000006372 8000159 8085723 RBM33 protein coding
2 ENSGALG00000039533 141406000 141466443 EFR3A protein coding
2 ENSGALG00000037014 147222471 147418330 TSNARE1 protein coding
3 ENSGALG00000029012 111042233 111235595 protein coding
3 ENSGALG00000015864 78537400 78582981 IBTK protein coding
3 ENSGALG00000015410 69051906 69078558 BVES protein coding
3 ENSGALG00000013710 51880188 51917321 SNX9 protein coding
3 ENSGALG00000015944 82215093 82512310 RIMS1 protein coding
3 ENSGALG00000010778 36525270 36778774 CHRM3 protein coding
3 ENSGALG00000031196 57534342 57538397 lincRNA
3 ENSGALG00000041356 61528901 61657319 lincRNA

296
Chr Gene stable ID Gene start (bp) Gene end (bp) Gene name Gene type
4 ENSGALG00000013715 64904550 64998990 DLC1 protein coding
4 ENSGALG00000014931 78013279 78074717 RAB28 protein coding
4 ENSGALG00000020210 39752033 39762452 CENPU protein coding
4 ENSGALG00000010596 39448857 39482459 TACR3 protein coding
4 ENSGALG00000039411 37840437 37922607 COL25A1 protein coding
4 ENSGALG00000010628 39713691 39752253 ACSL1 protein coding
4 ENSGALG00000037073 39299620 39301401 lincRNA
5 ENSGALG00000009345 26454626 26467002 protein coding
5 ENSGALG00000005353 7450883 7488646 FAR1 protein coding
5 ENSGALG00000038950 14921862 14996500 protein coding
5 ENSGALG00000003908 2161580 2188356 SLC6A5 protein coding
5 ENSGALG00000010576 40868271 40894704 GTF2A1 protein coding
5 ENSGALG00000003999 1910717 1996488 NAV2 protein coding
5 ENSGALG00000003777 2201059 2481132 NELL1 protein coding
5 ENSGALG00000003965 2002977 2006676 DBX1 protein coding
5 ENSGALG00000003958 2086559 2141355 PRMT3 protein coding
5 ENSGALG00000006368 12685002 12717134 PTPN5 protein coding
5 ENSGALG00000010572 40811286 40858950 TSHR protein coding
5 ENSGALG00000009338 26425311 26448293 ZFYVE1 protein coding
5 ENSGALG00000008053 22282853 22433771 protein coding
6 ENSGALG00000002769 6666081 6675111 DNAJC12 protein coding
6 ENSGALG00000005207 15971180 16002247 SYNPO2L protein coding
6 ENSGALG00000002845 6694536 7131100 CTNNA3 protein coding
6 ENSGALG00000005226 16010360 16025442 MYOZ1 protein coding
6 ENSGALG00000005088 15570960 15678544 CAMK2G protein coding
6 ENSGALG00000002761 6640858 6662304 SIRT1 protein coding
7 ENSGALG00000012362 31073812 31346787 THSD7B protein coding
8 ENSGALG00000006261 15967856 15987226 SELENOF protein coding
8 ENSGALG00000008658 16222861 16250213 ZNHIT6 protein coding
8 ENSGALG00000006284 15997170 16014128 SH3GLB1 protein coding
8 ENSGALG00000005065 9797493 9862645 PLA2G4A protein coding
8 ENSGALG00000006864 16125706 16215909 COL24A1 protein coding
8 ENSGALG00000006237 15219523 15269342 PKN2 protein coding
8 ENSGALG00000033708 9019159 9019789 lincRNA
8 ENSGALG00000043258 9537043 9545093 lincRNA
9 ENSGALG00000002897 10142631 10150156 SLC16A14 protein coding
9 ENSGALG00000036543 10205227 10208808 ZBTB38 protein coding
9 ENSGALG00000038512 12398415 12430615 AGTR1 protein coding
9 ENSGALG00000002850 10213881 10256070 RASA2 protein coding
9 ENSGALG00000002729 10392753 10431361 GK5 protein coding
9 ENSGALG00000034946 10189098 10190468 lincRNA
11 ENSGALG00000002407 1604963 1708650 HYDIN protein coding
12 ENSGALG00000005400 7323310 7733469 protein coding
13 ENSGALG00000040453 1649170 1650955 SRA1 protein coding
13 ENSGALG00000001132 1651000 1654407 protein coding

297
Chr Gene stable ID Gene start (bp) Gene end (bp) Gene name Gene type
13 ENSGALG00000001099 1544222 1650955 ANKHD1 protein coding
14 ENSGALG00000002119 14717931 14809857 VPS35L protein coding
14 ENSGALG00000005215 5264613 5339317 CACNA1H protein coding
14 ENSGALG00000006829 8372762 8430577 SMG1 protein coding
18 ENSGALG00000034134 79958 84622 ZNF302 protein coding
18 ENSGALG00000007522 10231908 10275081 ABCC3 protein coding
18 ENSGALG00000007623 10279329 10388753 CACNA1G protein coding
21 ENSGALG00000043128 117333 138142 ARHGEF10L protein coding
21 ENSGALG00000029212 174319 183170 PADI2 protein coding
21 ENSGALG00000031684 141487 148632 RCC2 protein coding
21 ENSGALG00000041401 183587 196195 MRPS16 protein coding
21 ENSGALG00000037479 23092 65640 IGSF21 protein coding
21 ENSGALG00000033340 197834 205169 SLC45A1 protein coding
21 ENSGALG00000042772 66618 76987 lincRNA
23 ENSGALG00000018302 4947355 4947443 gga-mir-30c-1 miRNA
23 ENSGALG00000039716 5309931 5318833 RNF19B protein coding
23 ENSGALG00000018301 4946132 4946227 gga-mir-30e miRNA
23 ENSGALG00000040519 4980932 4982596 PEF1 protein coding
23 ENSGALG00000026836 4983358 4985730 protein coding
23 ENSGALG00000037136 117566 147202 RPS6KA1L protein coding
23 ENSGALG00000003189 4927211 4955061 NFYC protein coding
23 ENSGALG00000029316 33777 89058 protein coding
23 ENSGALG00000003567 5294114 5304982 FNDC5 protein coding
23 ENSGALG00000036040 149854 155064 lincRNA
23 ENSGALG00000031251 5305277 5306769 lincRNA
27 ENSGALG00000002804 5549486 5564038 RND2 protein coding
27 ENSGALG00000034345 5473594 5474209 COA3 protein coding
27 ENSGALG00000046412 5494647 5500006 protein coding
27 ENSGALG00000043285 5473787 5477716 CNTD1 protein coding
27 ENSGALG00000033522 5499722 5504356 protein coding
27 ENSGALG00000002973 5478574 5483356 BECN1 protein coding
27 ENSGALG00000002937 5483514 5490234 PSME3 protein coding
27 ENSGALG00000035580 5615996 5621784 MPP2 protein coding
27 ENSGALG00000032191 5462100 5472837 WNK4 protein coding
27 ENSGALG00000002818 5538068 5543804 VAT1 protein coding
27 ENSGALG00000034991 5627940 5629042 lincRNA
27 ENSGALG00000041872 5628317 5635317 lincRNA
lincRNA = Long intergenic noncoding RNAs

298
Table S 50. Hp values within the threshold level (Hp ≤ -4) in Local Horro (N = 6).
Chr Window Start Window End Hp SNP Count ZHp
1 111090000 111110000 0.002 270 -5.76
1 111080000 111100000 0.003 249 -5.75
1 111100000 111120000 0.003 239 -5.74
1 119510000 119530000 0.005 101 -5.72
1 111110000 111130000 0.008 205 -5.66
1 119500000 119520000 0.010 67 -5.63
1 127510000 127530000 0.010 33 -5.63
1 190950000 190970000 0.011 102 -5.60
1 127540000 127560000 0.013 62 -5.57
1 111200000 111220000 0.016 21 -5.53
1 127530000 127550000 0.016 41 -5.52
1 127550000 127570000 0.019 52 -5.47
1 190940000 190960000 0.023 51 -5.41
1 111120000 111140000 0.024 184 -5.38
1 127520000 127540000 0.024 27 -5.38
1 83890000 83910000 0.034 43 -5.21
1 32530000 32550000 0.040 103 -5.11
1 190930000 190950000 0.042 43 -5.08
1 32620000 32640000 0.045 141 -5.01
1 111130000 111150000 0.048 101 -4.96
1 119520000 119540000 0.049 117 -4.96
1 32520000 32540000 0.050 97 -4.93
1 32630000 32650000 0.053 110 -4.88
1 127150000 127170000 0.053 67 -4.88
1 67240000 67260000 0.054 147 -4.86
1 111260000 111280000 0.056 141 -4.82
1 127160000 127180000 0.064 40 -4.68
1 127170000 127190000 0.066 39 -4.65
1 127340000 127360000 0.067 65 -4.64
1 85120000 85140000 0.067 191 -4.63
1 127820000 127840000 0.070 48 -4.58
1 32610000 32630000 0.072 81 -4.55
1 32640000 32660000 0.076 57 -4.48
1 127810000 127830000 0.076 84 -4.48
1 32540000 32560000 0.077 102 -4.47
1 127330000 127350000 0.077 58 -4.46
1 127180000 127200000 0.080 44 -4.41
1 111250000 111270000 0.081 158 -4.40
1 91680000 91700000 0.081 169 -4.39
1 111180000 111200000 0.081 102 -4.39
1 127190000 127210000 0.083 52 -4.36
1 32480000 32500000 0.083 88 -4.35
1 111210000 111230000 0.084 68 -4.34
1 32510000 32530000 0.086 67 -4.32
1 127560000 127580000 0.086 48 -4.30

299
Chr Window Start Window End Hp SNP Count ZHp
1 90920000 90940000 0.087 200 -4.30
1 32470000 32490000 0.087 77 -4.29
1 32450000 32470000 0.087 66 -4.29
1 90930000 90950000 0.088 207 -4.28
1 103840000 103860000 0.088 200 -4.27
1 25510000 25530000 0.089 71 -4.25
1 127350000 127370000 0.090 69 -4.24
1 127320000 127340000 0.090 51 -4.23
1 55520000 55540000 0.091 126 -4.23
1 83900000 83920000 0.091 127 -4.22
1 190960000 190980000 0.092 123 -4.21
1 55220000 55240000 0.092 117 -4.20
1 127310000 127330000 0.092 48 -4.20
1 127390000 127410000 0.094 89 -4.16
1 111070000 111090000 0.096 258 -4.14
1 111190000 111210000 0.096 33 -4.14
1 67200000 67220000 0.096 102 -4.13
1 85820000 85840000 0.098 225 -4.09
1 103880000 103900000 0.099 159 -4.08
1 119470000 119490000 0.101 142 -4.05
1 83880000 83900000 0.101 106 -4.04
1 32440000 32460000 0.102 88 -4.03
1 83870000 83890000 0.102 179 -4.03
1 116130000 116150000 0.102 120 -4.02
1 111220000 111240000 0.103 187 -4.02
1 55860000 55880000 0.104 73 -4.00
2 116370000 116390000 0.000 162 -5.80
2 116360000 116380000 0.000 145 -5.80
2 140530000 140550000 0.004 80 -5.73
2 140500000 140520000 0.005 133 -5.71
2 140520000 140540000 0.006 83 -5.70
2 140510000 140530000 0.007 99 -5.68
2 116380000 116400000 0.015 111 -5.54
2 147260000 147280000 0.020 101 -5.46
2 140490000 140510000 0.021 139 -5.43
2 140460000 140480000 0.035 94 -5.20
2 4520000 4540000 0.038 26 -5.15
2 140480000 140500000 0.062 119 -4.72
2 116100000 116120000 0.064 99 -4.70
2 60600000 60620000 0.068 109 -4.62
2 147250000 147270000 0.068 118 -4.62
2 140470000 140490000 0.070 87 -4.58
2 116070000 116090000 0.076 148 -4.49
2 116350000 116370000 0.078 148 -4.45
2 74040000 74060000 0.078 51 -4.44
2 9160000 9180000 0.078 108 -4.44
2 116260000 116280000 0.080 52 -4.41

300
Chr Window Start Window End Hp SNP Count ZHp
2 26380000 26400000 0.081 149 -4.40
2 30300000 30320000 0.082 187 -4.38
2 9150000 9170000 0.083 69 -4.36
2 4480000 4500000 0.085 168 -4.32
2 141580000 141600000 0.088 115 -4.27
2 116080000 116100000 0.092 164 -4.21
2 4530000 4550000 0.095 124 -4.16
2 9170000 9190000 0.095 102 -4.16
2 74030000 74050000 0.095 30 -4.15
2 73980000 74000000 0.095 25 -4.15
2 4380000 4400000 0.097 211 -4.12
2 73970000 73990000 0.097 26 -4.11
2 32780000 32800000 0.098 223 -4.09
2 40240000 40260000 0.099 215 -4.08
2 122420000 122440000 0.100 264 -4.07
2 31730000 31750000 0.100 237 -4.07
2 122430000 122450000 0.102 279 -4.03
2 26410000 26430000 0.102 137 -4.02
2 60650000 60670000 0.103 136 -4.01
3 77950000 77970000 0.000 96 -5.80
3 103610000 103630000 0.000 72 -5.80
3 103570000 103590000 0.000 52 -5.80
3 103020000 103040000 0.000 51 -5.80
3 103160000 103180000 0.000 51 -5.80
3 103460000 103480000 0.000 27 -5.80
3 77940000 77960000 0.002 106 -5.77
3 103600000 103620000 0.002 74 -5.76
3 103070000 103090000 0.003 63 -5.76
3 103470000 103490000 0.003 58 -5.75
3 77990000 78010000 0.003 107 -5.75
3 77930000 77950000 0.003 97 -5.74
3 103150000 103170000 0.004 95 -5.74
3 103490000 103510000 0.004 95 -5.74
3 103480000 103500000 0.004 87 -5.73
3 103050000 103070000 0.004 85 -5.73
3 77960000 77980000 0.004 84 -5.73
3 103510000 103530000 0.004 41 -5.73
3 103120000 103140000 0.005 72 -5.72
3 103060000 103080000 0.005 71 -5.72
3 103560000 103580000 0.006 60 -5.71
3 103520000 103540000 0.006 83 -5.70
3 103500000 103520000 0.006 54 -5.69
3 103040000 103060000 0.006 128 -5.69
3 103030000 103050000 0.007 102 -5.69
3 103100000 103120000 0.007 67 -5.67
3 103110000 103130000 0.008 84 -5.66
3 103550000 103570000 0.009 70 -5.64

301
Chr Window Start Window End Hp SNP Count ZHp
3 103010000 103030000 0.009 35 -5.64
3 77980000 78000000 0.010 99 -5.63
3 103080000 103100000 0.010 66 -5.63
3 103140000 103160000 0.010 98 -5.62
3 103090000 103110000 0.010 65 -5.62
3 103580000 103600000 0.011 31 -5.62
3 103450000 103470000 0.012 28 -5.60
3 103130000 103150000 0.013 65 -5.58
3 103540000 103560000 0.013 65 -5.58
3 103530000 103550000 0.014 72 -5.56
3 103590000 103610000 0.014 35 -5.55
3 77970000 77990000 0.016 85 -5.53
3 103170000 103190000 0.019 26 -5.47
3 103620000 103640000 0.027 43 -5.34
3 103630000 103650000 0.037 48 -5.15
3 103650000 103670000 0.056 66 -4.82
3 103640000 103660000 0.057 40 -4.82
3 74030000 74050000 0.064 111 -4.69
3 74000000 74020000 0.073 115 -4.54
3 74020000 74040000 0.075 118 -4.50
3 72820000 72840000 0.075 247 -4.50
3 74010000 74030000 0.077 121 -4.47
3 103440000 103460000 0.079 73 -4.43
3 102690000 102710000 0.079 168 -4.43
3 59780000 59800000 0.080 28 -4.41
3 72810000 72830000 0.084 213 -4.35
3 50640000 50660000 0.084 100 -4.34
3 103430000 103450000 0.087 148 -4.29
3 102760000 102780000 0.088 119 -4.27
3 102700000 102720000 0.089 173 -4.25
3 91600000 91620000 0.089 103 -4.25
3 90940000 90960000 0.090 46 -4.24
3 84960000 84980000 0.092 93 -4.20
3 102670000 102690000 0.093 118 -4.19
3 102750000 102770000 0.095 174 -4.16
3 83350000 83370000 0.095 197 -4.15
3 73490000 73510000 0.095 148 -4.15
3 102680000 102700000 0.095 113 -4.15
3 50650000 50670000 0.096 168 -4.13
3 51660000 51680000 0.098 92 -4.10
3 77770000 77790000 0.098 166 -4.10
3 78100000 78120000 0.100 242 -4.07
3 77760000 77780000 0.100 253 -4.07
3 102640000 102660000 0.100 154 -4.07
3 55040000 55060000 0.101 191 -4.05
3 103420000 103440000 0.101 133 -4.05
3 91610000 91630000 0.101 161 -4.05

302
Chr Window Start Window End Hp SNP Count ZHp
3 73990000 74010000 0.104 105 -4.00
4 78120000 78140000 0.005 92 -5.71
4 7970000 7990000 0.010 69 -5.63
4 7980000 8000000 0.011 45 -5.61
4 39420000 39440000 0.020 157 -5.45
4 78110000 78130000 0.038 52 -5.15
4 7960000 7980000 0.040 66 -5.11
4 78130000 78150000 0.056 142 -4.83
4 39410000 39430000 0.064 190 -4.68
4 39430000 39450000 0.067 179 -4.63
4 39380000 39400000 0.069 222 -4.60
4 78160000 78180000 0.087 90 -4.30
4 78090000 78110000 0.089 181 -4.26
4 39490000 39510000 0.090 236 -4.23
4 78100000 78120000 0.092 134 -4.20
4 39480000 39500000 0.092 180 -4.20
4 78150000 78170000 0.093 142 -4.19
4 76850000 76870000 0.093 192 -4.18
4 78020000 78040000 0.094 181 -4.17
4 78170000 78190000 0.096 74 -4.13
4 39500000 39520000 0.097 344 -4.11
4 78140000 78160000 0.098 181 -4.10
5 27220000 27240000 0.000 214 -5.80
5 27240000 27260000 0.000 202 -5.80
5 27230000 27250000 0.000 194 -5.80
5 40840000 40860000 0.001 165 -5.78
5 27270000 27290000 0.001 135 -5.78
5 17790000 17810000 0.002 78 -5.76
5 27250000 27270000 0.004 129 -5.73
5 27260000 27280000 0.004 119 -5.73
5 40850000 40870000 0.004 156 -5.73
5 27210000 27230000 0.005 220 -5.71
5 22530000 22550000 0.009 39 -5.65
5 22540000 22560000 0.009 36 -5.64
5 17780000 17800000 0.010 100 -5.63
5 27200000 27220000 0.015 178 -5.54
5 40860000 40880000 0.021 112 -5.44
5 40830000 40850000 0.024 177 -5.38
5 22480000 22500000 0.037 22 -5.16
5 11380000 11400000 0.040 62 -5.12
5 11370000 11390000 0.043 80 -5.06
5 27850000 27870000 0.043 217 -5.06
5 27280000 27300000 0.057 107 -4.80
5 27840000 27860000 0.058 139 -4.79
5 25050000 25070000 0.058 199 -4.79
5 47670000 47690000 0.062 193 -4.73
5 11420000 11440000 0.069 72 -4.60

303
Chr Window Start Window End Hp SNP Count ZHp
5 35730000 35750000 0.076 150 -4.49
5 22520000 22540000 0.076 21 -4.48
5 41020000 41040000 0.077 158 -4.46
5 11410000 11430000 0.079 61 -4.44
5 22470000 22490000 0.080 28 -4.41
5 22490000 22510000 0.080 22 -4.41
5 26750000 26770000 0.081 262 -4.39
5 41880000 41900000 0.084 123 -4.35
5 41050000 41070000 0.085 133 -4.32
5 26770000 26790000 0.087 278 -4.29
5 25080000 25100000 0.092 153 -4.20
5 27820000 27840000 0.095 93 -4.15
5 26760000 26780000 0.098 249 -4.10
5 7940000 7960000 0.099 197 -4.09
5 26780000 26800000 0.100 289 -4.07
5 27810000 27830000 0.100 132 -4.06
5 18420000 18440000 0.101 273 -4.05
5 47680000 47700000 0.104 193 -4.00
6 14980000 15000000 0.041 79 -5.08
6 14990000 15010000 0.063 94 -4.70
6 15000000 15020000 0.075 124 -4.50
6 14970000 14990000 0.095 95 -4.15
7 19920000 19940000 0.060 57 -4.77
7 20480000 20500000 0.070 126 -4.58
7 20490000 20510000 0.071 114 -4.57
7 17040000 17060000 0.073 263 -4.53
7 19910000 19930000 0.079 71 -4.42
7 8590000 8610000 0.097 60 -4.11
7 20510000 20530000 0.098 122 -4.09
7 20500000 20520000 0.100 99 -4.06
7 8580000 8600000 0.104 76 -4.00
8 13100000 13120000 0.042 47 -5.08
8 8830000 8850000 0.044 221 -5.05
8 8820000 8840000 0.046 201 -5.00
8 9160000 9180000 0.048 119 -4.97
8 8810000 8830000 0.058 114 -4.79
8 8990000 9010000 0.062 44 -4.72
8 9150000 9170000 0.064 106 -4.69
8 9140000 9160000 0.070 92 -4.59
8 9520000 9540000 0.077 79 -4.46
8 9170000 9190000 0.079 81 -4.43
8 9200000 9220000 0.080 86 -4.41
8 9130000 9150000 0.081 71 -4.40
8 9000000 9020000 0.083 23 -4.36
8 9190000 9210000 0.088 63 -4.27
8 12910000 12930000 0.088 97 -4.26
8 1770000 1790000 0.097 187 -4.11

304
Chr Window Start Window End Hp SNP Count ZHp
9 12410000 12430000 0.005 102 -5.72
9 12400000 12420000 0.006 28 -5.70
9 10160000 10180000 0.012 68 -5.59
9 12380000 12400000 0.013 117 -5.58
9 10270000 10290000 0.016 128 -5.53
9 10170000 10190000 0.020 67 -5.46
9 10280000 10300000 0.020 108 -5.46
9 10150000 10170000 0.028 71 -5.32
9 12390000 12410000 0.033 40 -5.23
9 10260000 10280000 0.049 187 -4.95
9 10180000 10200000 0.056 66 -4.82
9 11160000 11180000 0.077 155 -4.46
9 5510000 5530000 0.080 102 -4.41
9 10220000 10240000 0.084 180 -4.34
9 10250000 10270000 0.087 173 -4.28
9 10410000 10430000 0.093 58 -4.19
9 12370000 12390000 0.098 152 -4.10
9 10230000 10250000 0.100 229 -4.07
10 18100000 18120000 0.103 157 -4.01
11 1610000 1630000 0.009 143 -5.64
12 10520000 10540000 0.054 184 -4.87
13 1650000 1670000 0.080 24 -4.41
13 16720000 16740000 0.090 67 -4.24
14 5300000 5320000 0.027 85 -5.33
14 14780000 14800000 0.092 68 -4.20
15 6770000 6790000 0.097 112 -4.11
17 950000 970000 0.094 95 -4.17
20 8170000 8190000 0.093 121 -4.19
20 8080000 8100000 0.093 209 -4.18
24 6110000 6130000 0.053 168 -4.88
24 6120000 6140000 0.103 137 -4.02
Chr = Chromosome

305
Table S 51. List of candidate genes in Local Horro (N=6).
Chr. Gene stable ID Gene end (bp) Gene start (bp) Gene name Gene type
1 ENSGALG00000027781 103900014 103899869 RF02271 misc_RNA
1 ENSGALG00000014030 67232162 67216258
protein coding
1 ENSGALG00000042479 67209545 67209491 gga-mir-7451 miRNA
1 ENSGALG00000032836 111277522 111228641 MAOB protein coding
1 ENSGALG00000014031 67242703 67235341 ETFRF1 protein coding
1 ENSGALG00000016224 111332024 111259525 MAOA protein coding
1 ENSGALG00000012791 56041222 55806774 TBXAS1 protein coding
1 ENSGALG00000014011 67215800 67203135 LRMP protein coding
1 ENSGALG00000016221. 111115975 111056475 EFHC2 protein coding
1 ENSGALG00000015446 91748448 91662967 POU2F1 protein coding
1 ENSGALG00000030943 67263388 67241669 KRAS protein coding
1 ENSGALG00000039376 83934219 83908116 DPT protein coding
1 ENSGALG00000016288 116671490 116055337 IL1RAPL1 protein coding
1 ENSGALG00000016222 111204533 111184729 NDP protein coding
1 ENSGALG00000038090 25570813 25413945
lincRNA
1 ENSGALG00000038179 32452343 32268154
lincRNA
1 ENSGALG00000030019 127858054 127725469
lincRNA
1 ENSGALG00000029967 127826062 127825392
lincRNA
2 ENSGALG00000005710 4582669 4515467 CTDSPL protein coding
2 ENSGALG00000034561 116395434 116286317
protein coding
2 ENSGALG00000012689 60709367 60597695 KIF13A protein coding
2 ENSGALG00000037626 141705820 141521126 KCNQ3 protein coding
2 ENSGALG00000010718 26546888 26317033 THSD7A protein coding
2 ENSGALG00000030054 9397176 8821485 PTPRN2 protein coding
2 ENSGALG00000037014 147418330 147222471 TSNARE1 protein coding
2 ENSGALG00000011007 31771000 31704354 OSBPL3 protein coding
2 ENSGALG00000042354 116131725 116026798 PREX2 protein coding
2 ENSGALG00000005694 4396355 4374027 GARS protein coding
3 ENSGALG00000015846 77987344 77916880 SNAP91 protein coding
3 ENSGALG00000026500 103172181 103172072 gga-mir-6678 miRNA
3 ENSGALG00000016491 102693303 102659050 APOB protein coding
3 ENSGALG00000036005 50738444 50653163 TIAM2 protein coding
3 ENSGALG00000013869 55055817 55035015 IL20RA protein coding
3 ENSGALG00000043584 83351003 83179142 COL19A1 protein coding
3 ENSGALG00000015836 77786312 77740723 CEP162 protein coding
3 ENSGALG00000013689 51700024 51679654 TMEM242 protein coding
3 ENSGALG00000015847 78001876 78000086 PRSS35 protein coding
3 ENSGALG00000015517 72823589 72784599
protein coding
3 ENSGALG00000029200 72871521 72819230
protein coding
3 ENSGALG00000015849 78198472 78041071 ME1 protein coding
3 ENSGALG00000037938 90940562 90939896
lincRNA
4 ENSGALG00000014931 78074717 78013279 RAB28 protein coding
4 ENSGALG00000010596 39482459 39448857 TACR3 protein coding
4 ENSGALG00000014485 76951561 76744861 LDB2 protein coding
5 ENSGALG00000005438 7948685 7919891 PARVA protein coding
5 ENSGALG00000008692 25096118 25038945
protein coding
5 ENSGALG00000009415 27835276 27718429 SMOC1 protein coding
5 ENSGALG00000000296 27283175 27201732 PCNX1 protein coding
5 ENSGALG00000009368 26906126 26680031 RGS6 protein coding
5 ENSGALG00000010576 40894704 40868271 GTF2A1 protein coding
5 ENSGALG00000041808 17800632 17729748 ANO1 protein coding

306
Chr. Gene stable ID Gene end (bp) Gene start (bp) Gene name Gene type
5 ENSGALG00000010572 40858950 40811286 TSHR protein coding
5 ENSGALG00000010001 35767270 35742881 EGLN3 protein coding
6 ENSGALG00000005035 15068657 14982062 KAT6B protein coding
6 ENSGALG00000005019 14975346 14955839 DUPD1 protein coding
7 ENSGALG00000011009 19968241 19912741 SCN2A protein coding
7 ENSGALG00000010971 19910444 19815163 CSRNP3 protein coding
7 ENSGALG00000009325 17116055 17030281 OLA1 protein coding
8 ENSGALG00000033708 9019789 9019159
lincRNA
8 ENSGALG00000043258 9545093 9537043
lincRNA
9 ENSGALG00000002897 10150156 10142631 SLC16A14 protein coding
9 ENSGALG00000038512 12430615 12398415 AGTR1 protein coding
9 ENSGALG00000002850 10256070 10213881 RASA2 protein coding
9 ENSGALG00000002729 10431361 10392753 GK5 protein coding
9 ENSGALG00000021117 10269197 10262779 RNF7 protein coding
9 ENSGALG00000002800 10289497 10271683 GRK7 protein coding
9 ENSGALG00000005521 5526782 5502475 PER2 protein coding
9 ENSGALG00000034946 10190468 10189098
lincRNA
10 ENSGALG00000007495 18109320 18094354 SLC24A1 protein coding
10 ENSGALG00000041403 18150025 18113901 DENND4A protein coding
11 ENSGALG00000002407 1708650 1604963 HYDIN protein coding
12 ENSGALG00000034289 10520263 10499369 SLC41A3 protein coding
13 ENSGALG00000017462 16736631 16678225 FNIP1 protein coding
13 ENSGALG00000040453 1650955 1649170 SRA1 protein coding
13 ENSGALG00000001132 1654407 1651000
protein coding
13 ENSGALG00000001099 1650955 1544222 ANKHD1 protein coding
13 ENSGALG00000044678 16746031 16739994
protein coding
14 ENSGALG00000002119 14809857 14717931 VPS35L protein coding
14 ENSGALG00000005215 5339317 5264613 CACNA1H protein coding
15 ENSGALG00000005122 6789221 6773611 MYO1H protein coding
17 ENSGALG00000031482 953061 950257 Pou5f3 protein coding
17 ENSGALG00000042635 971844 953350 NPDC1 protein coding
24 ENSGALG00000007868 6130965 6110301 BCO2 protein coding
Chr = Chromosome

307
Table S 52. Hp values for threshold windows in Jarso chicken populations.
Chr Window Start Window end Hp SNP(N) Genomic Position ZHp
1 103000000 1.03E+08 0.039 112 103000000 -4.06
2 66020000 66040000 0.026 185 262000000 -4.26
2 78570000 78590000 0.034 69 275000000 -4.14
2 147000000 1.47E+08 0.039 105 343000000 -4.06
3 61490000 61510000 0.027 138 407000000 -4.25
4 39450000 39470000 0.004 98 497000000 -4.63
4 39460000 39480000 0.006 90 497000000 -4.6
5 40840000 40860000 0.002 169 589000000 -4.65
5 40850000 40870000 0.003 159 589000000 -4.64
5 40860000 40880000 0.008 112 589000000 -4.56
5 47580000 47600000 0.009 45 596000000 -4.53
5 40830000 40850000 0.01 177 589000000 -4.52
5 41880000 41900000 0.022 129 590000000 -4.32
5 41870000 41890000 0.027 117 590000000 -4.25
6 18320000 18340000 0.04 155 627000000 -4.05
7 8370000 8390000 0.014 96 652000000 -4.46
7 8400000 8420000 0.021 48 652000000 -4.35
7 8580000 8600000 0.037 68 652000000 -4.09
7 8360000 8380000 0.037 60 652000000 -4.08
8 9160000 9180000 0.032 127 690000000 -4.17
8 8830000 8850000 0.032 231 689000000 -4.16
9 10340000 10360000 0.002 145 721000000 -4.65
9 10410000 10430000 0.004 36 721000000 -4.62
9 10350000 10370000 0.006 140 721000000 -4.59
9 10360000 10380000 0.008 101 721000000 -4.55
9 10370000 10390000 0.015 141 721000000 -4.44
9 10380000 10400000 0.035 135 721000000 -4.11
9 10330000 10350000 0.042 126 721000000 -4.01
13 520000 540000 0 36 796000000 -4.68
13 530000 550000 0 36 796000000 -4.68
13 1650000 1670000 0.041 26 797000000 -4.02
Chr = Chromosome

308
Table S 53. List of candidate genes in Jarso chicken
Gene stable ID Gene start (bp) Gene end (bp) Chr Gene name Gene type
ENSGALG00000015770 102609866 102809834 1 APP protein coding
ENSGALG00000040453 1649170 1650955 13 SRA1 protein coding
ENSGALG00000001132 1651000 1654407 13 protein coding
ENSGALG00000001099 1544222 1650955 13 ANKHD1 protein coding
ENSGALG00000035925 78567875 78573368 2 protein coding
ENSGALG00000037014 147222471 147418330 2 TSNARE1 protein coding
ENSGALG00000038420 61487557 61508738 3 HSF2 protein coding
ENSGALG00000010596 39448857 39482459 4 TACR3 protein coding
ENSGALG00000010576 40868271 40894704 5 GTF2A1 protein coding
ENSGALG00000010572 40811286 40858950 5 TSHR protein coding
ENSGALG00000002729 10392753 10431361 9 GK5 protein coding
ENSGALG00000025759 10338213 10382351 9 TFDP2 protein coding
ENSGALG00000030000 10355033 10369237 9 lincRNA
Chr = Chromosome
Table S 54. Hp values within the threshold level (Hp ≤ -4) in Jarso (N=14).
Chr Window start Window end Hp SNP(N) Genomic Position ZHp
1 81690000 81710000 0.011 64 81710000 -4.95
1 175400000 175420000 0.011 160 175420000 -4.94
1 77480000 77500000 0.014 130 77500000 -4.90
1 77470000 77490000 0.016 140 77490000 -4.87
1 81700000 81720000 0.020 99 81720000 -4.80
1 81710000 81730000 0.028 101 81730000 -4.67
1 168990000 169010000 0.038 82 169010000 -4.52
1 175080000 175100000 0.042 106 175100000 -4.45
1 175390000 175410000 0.045 158 175410000 -4.41
1 76430000 76450000 0.046 76 76450000 -4.39
1 66940000 66960000 0.053 150 66960000 -4.28
1 58790000 58810000 0.057 179 58810000 -4.23
1 66950000 66970000 0.058 147 66970000 -4.21
1 80270000 80290000 0.062 67 80290000 -4.14
1 31890000 31910000 0.062 59 31910000 -4.14
1 119520000 119540000 0.066 158 119540000 -4.08
1 58780000 58800000 0.067 170 58800000 -4.07
1 109570000 109590000 0.067 252 109590000 -4.06
1 119530000 119550000 0.071 79 119550000 -4.01
2 122490000 122510000 0.004 214 318712544 -5.06
2 122480000 122500000 0.004 220 318702544 -5.05
2 122470000 122490000 0.005 150 318692544 -5.05
2 119160000 119180000 0.005 39 315382544 -5.04
2 132740000 132760000 0.008 47 328962544 -4.99
2 122460000 122480000 0.017 161 318682544 -4.85
2 119170000 119190000 0.019 64 315392544 -4.83
2 119180000 119200000 0.019 73 315402544 -4.82
2 68440000 68460000 0.027 44 264662544 -4.70

309
Chr Window start Window end Hp SNP(N) Genomic Position ZHp
2 122450000 122470000 0.031 177 318672544 -4.64
2 119190000 119210000 0.032 79 315412544 -4.61
2 147260000 147280000 0.035 116 343482544 -4.57
2 61630000 61650000 0.036 138 257852544 -4.56
2 120590000 120610000 0.036 35 316812544 -4.55
2 68430000 68450000 0.040 132 264652544 -4.49
2 120580000 120600000 0.050 55 316802544 -4.34
2 120650000 120670000 0.050 146 316872544 -4.33
2 120660000 120680000 0.051 132 316882544 -4.32
2 21820000 21840000 0.061 260 218042544 -4.16
2 132730000 132750000 0.063 60 328952544 -4.13
2 86680000 86700000 0.064 77 282902544 -4.11
2 86690000 86710000 0.067 107 282912544 -4.07
2 21210000 21230000 0.067 171 217432544 -4.06
2 63590000 63610000 0.069 111 259812544 -4.03
2 58680000 58700000 0.071 160 254902544 -4.00
2 120640000 120660000 0.071 123 316862544 -4.00
3 50630000 50650000 0.000 43 396413279 -5.12
3 50650000 50670000 0.002 131 396433279 -5.09
3 50640000 50660000 0.002 80 396423279 -5.08
3 26390000 26410000 0.003 159 372173279 -5.07
3 26400000 26420000 0.017 156 372183279 -4.85
3 60660000 60680000 0.048 130 406443279 -4.37
3 85790000 85810000 0.053 42 431573279 -4.28
3 85800000 85820000 0.057 80 431583279 -4.22
3 26310000 26330000 0.057 95 372093279 -4.22
3 103430000 103450000 0.057 156 449213279 -4.22
3 26410000 26430000 0.058 158 372193279 -4.21
3 26230000 26250000 0.061 256 372013279 -4.16
3 26300000 26320000 0.062 105 372083279 -4.15
3 26240000 26260000 0.063 191 372023279 -4.13
3 85760000 85780000 0.063 52 431543279 -4.13
3 85780000 85800000 0.064 35 431563279 -4.12
3 26470000 26490000 0.064 81 372253279 -4.11
3 103420000 103440000 0.066 141 449203279 -4.09
3 26290000 26310000 0.067 88 372073279 -4.07
3 85810000 85830000 0.067 98 431593279 -4.07
3 89550000 89570000 0.069 49 435333279 -4.04
3 60880000 60900000 0.071 95 406663279 -4.01
4 7020000 7040000 0.000 79 464105401 -5.12
4 7930000 7950000 0.000 29 465015401 -5.12
4 7940000 7960000 0.000 56 465025401 -5.12
4 7980000 8000000 0.000 42 465065401 -5.12
4 76360000 76380000 0.002 94 533445401 -5.09
4 78490000 78510000 0.003 79 535575401 -5.08
4 76370000 76390000 0.006 67 533455401 -5.03
4 7970000 7990000 0.008 66 465055401 -5.00

310
Chr Window start Window end Hp SNP(N) Genomic Position ZHp
4 7950000 7970000 0.008 51 465035401 -5.00
4 78480000 78500000 0.011 61 535565401 -4.94
4 78470000 78490000 0.012 101 535555401 -4.93
4 19930000 19950000 0.013 132 477015401 -4.92
4 76350000 76370000 0.014 120 533435401 -4.90
4 7960000 7980000 0.016 55 465045401 -4.86
4 7030000 7050000 0.018 113 464115401 -4.83
4 28650000 28670000 0.019 107 485735401 -4.81
4 28640000 28660000 0.020 119 485725401 -4.81
4 28630000 28650000 0.023 128 485715401 -4.76
4 19940000 19960000 0.024 62 477025401 -4.74
4 28620000 28640000 0.031 132 485705401 -4.63
4 28470000 28490000 0.036 22 485555401 -4.56
4 78460000 78480000 0.036 95 535545401 -4.55
4 78370000 78390000 0.038 60 535455401 -4.53
4 6620000 6640000 0.041 67 463705401 -4.48
4 78360000 78380000 0.042 51 535445401 -4.46
4 78390000 78410000 0.043 90 535475401 -4.44
4 78400000 78420000 0.043 63 535485401 -4.44
4 78380000 78400000 0.044 88 535465401 -4.42
4 78110000 78130000 0.045 57 535195401 -4.42
4 27840000 27860000 0.047 65 484925401 -4.39
4 6690000 6710000 0.047 138 463775401 -4.39
4 11360000 11380000 0.051 134 468445401 -4.32
4 78500000 78520000 0.051 145 535585401 -4.32
4 78120000 78140000 0.052 114 535205401 -4.30
4 78180000 78200000 0.053 81 535265401 -4.29
4 28610000 28630000 0.055 96 485695401 -4.26
4 19960000 19980000 0.057 34 477045401 -4.22
4 7260000 7280000 0.058 108 464345401 -4.22
4 6700000 6720000 0.058 154 463785401 -4.21
4 27800000 27820000 0.058 40 484885401 -4.21
4 28460000 28480000 0.058 35 485545401 -4.21
4 19920000 19940000 0.062 100 477005401 -4.15
4 19880000 19900000 0.063 23 476965401 -4.13
4 78170000 78190000 0.064 82 535255401 -4.12
4 29870000 29890000 0.065 154 486955401 -4.10
4 45960000 45980000 0.065 200 503045401 -4.10
4 27790000 27810000 0.067 45 484875401 -4.08
4 21600000 21620000 0.067 197 478685401 -4.07
4 27810000 27830000 0.067 42 484895401 -4.07
4 39450000 39470000 0.067 170 496535401 -4.06
4 21670000 21690000 0.069 159 478755401 -4.04
4 28660000 28680000 0.069 94 485745401 -4.04
5 18930000 18950000 0.000 67 567298057 -5.12
5 40840000 40860000 0.001 169 589208057 -5.11
5 40850000 40870000 0.004 159 589218057 -5.06

311
Chr Window start Window end Hp SNP(N) Genomic Position ZHp
5 21380000 21400000 0.008 72 569748057 -4.99
5 40830000 40850000 0.009 179 589198057 -4.98
5 40860000 40880000 0.011 113 589228057 -4.95
5 18810000 18830000 0.015 94 567178057 -4.89
5 55440000 55460000 0.020 218 603808057 -4.80
5 41880000 41900000 0.047 134 590248057 -4.38
5 18820000 18840000 0.049 130 567188057 -4.35
5 41020000 41040000 0.050 185 589388057 -4.33
5 41660000 41680000 0.051 127 590028057 -4.32
5 27450000 27470000 0.054 163 575818057 -4.28
5 41870000 41890000 0.057 119 590238057 -4.22
5 41650000 41670000 0.058 203 590018057 -4.20
5 27460000 27480000 0.060 183 575828057 -4.17
5 37400000 37420000 0.061 216 585768057 -4.16
5 55430000 55450000 0.067 196 603798057 -4.08
5 21510000 21530000 0.067 59 569878057 -4.07
5 41050000 41070000 0.067 138 589418057 -4.07
5 41030000 41050000 0.067 173 589398057 -4.06
5 27150000 27170000 0.069 215 575518057 -4.04
6 34450000 34470000 0.026 177 642643359 -4.71
6 14980000 15000000 0.053 90 623173359 -4.29
6 18320000 18340000 0.068 235 626513359 -4.06
6 18340000 18360000 0.071 65 626533359 -4.00
7 34990000 35010000 0.005 127 678650375 -5.04
7 34980000 35000000 0.034 154 678640375 -4.58
7 35000000 35020000 0.056 135 678660375 -4.24
7 28200000 28220000 0.058 118 671860375 -4.20
7 25840000 25860000 0.066 116 669500375 -4.09
8 15230000 15250000 0.002 128 695837311 -5.08
8 23110000 23130000 0.003 110 703717311 -5.08
8 23120000 23140000 0.003 138 703727311 -5.07
8 15240000 15260000 0.005 148 695847311 -5.04
8 23130000 23150000 0.005 95 703737311 -5.04
8 23140000 23160000 0.008 76 703747311 -5.00
8 0 20000 0.011 26 680607311 -4.94
8 10000 30000 0.016 32 680617311 -4.88
8 8830000 8850000 0.017 213 689437311 -4.85
8 9160000 9180000 0.023 116 689767311 -4.76
8 280000 300000 0.024 21 680887311 -4.75
8 8820000 8840000 0.025 199 689427311 -4.72
8 9190000 9210000 0.026 56 689797311 -4.70
8 9050000 9070000 0.029 131 689657311 -4.66
8 9170000 9190000 0.030 80 689777311 -4.65
8 9520000 9540000 0.031 87 690127311 -4.64
8 9060000 9080000 0.031 128 689667311 -4.64
8 8800000 8820000 0.032 28 689407311 -4.62
8 9200000 9220000 0.032 92 689807311 -4.62

312
Chr Window start Window end Hp SNP(N) Genomic Position ZHp
8 15250000 15270000 0.035 146 695857311 -4.57
8 9720000 9740000 0.035 56 690327311 -4.57
8 8810000 8830000 0.035 123 689417311 -4.57
8 9070000 9090000 0.035 92 689677311 -4.57
8 9510000 9530000 0.036 139 690117311 -4.55
8 9140000 9160000 0.037 96 689747311 -4.54
8 9150000 9170000 0.039 106 689757311 -4.51
8 9680000 9700000 0.039 35 690287311 -4.50
8 9730000 9750000 0.042 63 690337311 -4.46
8 23010000 23030000 0.042 105 703617311 -4.46
8 8990000 9010000 0.042 44 689597311 -4.46
8 9500000 9520000 0.044 130 690107311 -4.43
8 9130000 9150000 0.046 76 689737311 -4.39
8 9000000 9020000 0.047 29 689607311 -4.38
8 9690000 9710000 0.051 44 690297311 -4.32
8 9120000 9140000 0.051 93 689727311 -4.31
8 9420000 9440000 0.053 77 690027311 -4.29
8 9110000 9130000 0.055 130 689717311 -4.26
8 9670000 9690000 0.056 35 690277311 -4.25
8 9180000 9200000 0.057 41 689787311 -4.23
8 8890000 8910000 0.058 264 689497311 -4.22
8 9410000 9430000 0.058 113 690017311 -4.20
8 8900000 8920000 0.061 253 689507311 -4.16
8 11670000 11690000 0.062 84 692277311 -4.14
8 15220000 15240000 0.062 127 695827311 -4.14
8 9040000 9060000 0.064 123 689647311 -4.12
8 8840000 8860000 0.065 194 689447311 -4.10
8 8860000 8880000 0.065 228 689467311 -4.10
8 9710000 9730000 0.067 52 690317311 -4.07
8 9080000 9100000 0.067 88 689687311 -4.07
8 8960000 8980000 0.067 209 689567311 -4.07
8 9430000 9450000 0.068 88 690037311 -4.05
8 8850000 8870000 0.069 208 689457311 -4.04
8 8910000 8930000 0.069 284 689517311 -4.03
8 9340000 9360000 0.069 135 689947311 -4.03
8 15270000 15290000 0.070 37 695877311 -4.02
8 15290000 15310000 0.071 112 695897311 -4.01
8 230000 250000 0.071 34 680837311 -4.01
9 10230000 10250000 0.006 155 720800324 -5.03
9 10240000 10260000 0.007 124 720810324 -5.00
9 10280000 10300000 0.008 104 720850324 -5.00
9 10270000 10290000 0.027 134 720840324 -4.70
9 10290000 10310000 0.033 100 720860324 -4.59
9 10220000 10240000 0.036 170 720790324 -4.56
9 10250000 10270000 0.037 124 720820324 -4.53
9 10260000 10280000 0.042 181 720830324 -4.46
9 10410000 10430000 0.056 63 720980324 -4.25

313
Chr Window start Window end Hp SNP(N) Genomic Position ZHp
9 12040000 12060000 0.058 166 722610324 -4.21
9 10210000 10230000 0.060 220 720780324 -4.17
9 16460000 16480000 0.064 199 727030324 -4.12
9 16450000 16470000 0.065 208 727020324 -4.10
9 16440000 16460000 0.066 205 727010324 -4.09
9 7870000 7890000 0.070 77 718440324 -4.02
10 12450000 12470000 0.029 123 747111890 -4.67
10 14600000 14620000 0.041 151 749261890 -4.48
10 13740000 13760000 0.061 158 748401890 -4.16
10 12460000 12480000 0.063 116 747121890 -4.14
11 5880000 5900000 0.065 77 760977232 -4.09
11 4680000 4700000 0.069 128 759777232 -4.03
12 4400000 4420000 0.014 97 779716025 -4.89
12 7730000 7750000 0.016 64 783046025 -4.88
12 3410000 3430000 0.045 261 778726025 -4.41
12 3420000 3440000 0.046 192 778736025 -4.40
12 7520000 7540000 0.051 114 782836025 -4.31
12 7530000 7550000 0.060 99 782846025 -4.18
13 4470000 4490000 0.005 103 799734179 -5.04
13 1660000 1680000 0.022 22 796924179 -4.77
13 1650000 1670000 0.039 25 796914179 -4.50
13 4460000 4480000 0.058 153 799724179 -4.21
23 5560000 5580000 0.063 23 905933666 -4.13
23 5600000 5620000 0.067 26 905973666 -4.07
23 5720000 5740000 0.070 29 906093666 -4.02
24 960000 980000 0.065 148 907120194 -4.10
Chr = Chromosomes

314
Table S 55. Hp values within the threshold level (P ≤ -4) Hugub (N=10).
Chr Window start Window end Hp SNP (N) Genomic Position ZHp
1 81690000 81710000 0.010878 64 81710000 -4.95
1 175400000 175420000 0.011187 160 175420000 -4.94
1 77480000 77500000 0.01375 130 77500000 -4.9
1 77470000 77490000 0.015591 140 77490000 -4.87
1 81700000 81720000 0.019998 99 81720000 -4.8
1 81710000 81730000 0.028301 101 81730000 -4.67
1 168990000 169010000 0.038263 82 169010000 -4.52
1 175080000 175100000 0.042455 106 175100000 -4.45
1 175390000 175410000 0.045135 158 175410000 -4.41
1 76430000 76450000 0.046247 76 76450000 -4.39
1 66940000 66960000 0.053172 150 66960000 -4.28
1 58790000 58810000 0.056939 179 58810000 -4.23
1 66950000 66970000 0.058072 147 66970000 -4.21
1 80270000 80290000 0.06212 67 80290000 -4.14
1 31890000 31910000 0.062333 59 31910000 -4.14
1 119520000 119540000 0.066018 158 119540000 -4.08
1 58780000 58800000 0.067003 170 58800000 -4.07
1 109570000 109590000 0.067402 252 109590000 -4.06
1 119530000 119550000 0.070723 79 119550000 -4.01
2 122490000 122510000 0.003731 214 318712544 -5.06
2 122480000 122500000 0.004083 220 318702544 -5.05
2 122470000 122490000 0.004656 150 318692544 -5.05
2 119160000 119180000 0.005115 39 315382544 -5.04
2 132740000 132760000 0.008474 47 328962544 -4.99
2 122460000 122480000 0.01724 161 318682544 -4.85
2 119170000 119190000 0.018574 64 315392544 -4.83
2 119180000 119200000 0.018994 73 315402544 -4.82
2 68440000 68460000 0.026901 44 264662544 -4.7
2 122450000 122470000 0.030591 177 318672544 -4.64
2 119190000 119210000 0.03237 79 315412544 -4.61
2 147260000 147280000 0.03472 116 343482544 -4.57
2 61630000 61650000 0.035576 138 257852544 -4.56
2 120590000 120610000 0.036453 35 316812544 -4.55
2 68430000 68450000 0.040072 132 264652544 -4.49
2 120580000 120600000 0.049613 55 316802544 -4.34
2 120650000 120670000 0.05005 146 316872544 -4.33
2 120660000 120680000 0.050907 132 316882544 -4.32
2 21820000 21840000 0.061068 260 218042544 -4.16
2 132730000 132750000 0.062888 60 328952544 -4.13
2 86680000 86700000 0.06404 77 282902544 -4.11
2 86690000 86710000 0.066767 107 282912544 -4.07
2 21210000 21230000 0.067169 171 217432544 -4.06
2 63590000 63610000 0.069475 111 259812544 -4.03
2 58680000 58700000 0.071031 160 254902544 -4

315
Chr Window start Window end Hp SNP (N) Genomic Position ZHp
2 120640000 120660000 0.071247 123 316862544 -4
3 50630000 50650000 0 43 396413279 -5.12
3 50650000 50670000 0.001526 131 396433279 -5.09
3 50640000 50660000 0.002497 80 396423279 -5.08
3 26390000 26410000 0.00314 159 372173279 -5.07
3 26400000 26420000 0.017158 156 372183279 -4.85
3 60660000 60680000 0.048019 130 406443279 -4.37
3 85790000 85810000 0.053263 42 431573279 -4.28
3 85800000 85820000 0.057024 80 431583279 -4.22
3 26310000 26330000 0.05721 95 372093279 -4.22
3 103430000 103450000 0.057235 156 449213279 -4.22
3 26410000 26430000 0.057724 158 372193279 -4.21
3 26230000 26250000 0.061279 256 372013279 -4.16
3 26300000 26320000 0.061774 105 372083279 -4.15
3 26240000 26260000 0.062814 191 372023279 -4.13
3 85760000 85780000 0.063247 52 431543279 -4.13
3 85780000 85800000 0.063555 35 431563279 -4.12
3 26470000 26490000 0.064444 81 372253279 -4.11
3 103420000 103440000 0.065767 141 449203279 -4.09
3 26290000 26310000 0.066916 88 372073279 -4.07
3 85810000 85830000 0.06698 98 431593279 -4.07
3 89550000 89570000 0.068878 49 435333279 -4.04
3 60880000 60900000 0.07097 95 406663279 -4.01
4 7020000 7040000 0 79 464105401 -5.12
4 7930000 7950000 0 29 465015401 -5.12
4 7940000 7960000 0 56 465025401 -5.12
4 7980000 8000000 0 42 465065401 -5.12
4 76360000 76380000 0.002125 94 533445401 -5.09
4 78490000 78510000 0.002528 79 535575401 -5.08
4 76370000 76390000 0.005952 67 533455401 -5.03
4 7970000 7990000 0.007547 66 465055401 -5
4 7950000 7970000 0.007812 51 465035401 -5
4 78480000 78500000 0.01141 61 535565401 -4.94
4 78470000 78490000 0.011811 101 535555401 -4.93
4 19930000 19950000 0.012796 132 477015401 -4.92
4 76350000 76370000 0.014066 120 533435401 -4.9
4 7960000 7980000 0.01623 55 465045401 -4.86
4 7030000 7050000 0.018411 113 464115401 -4.83
4 28650000 28670000 0.019434 107 485735401 -4.81
4 28640000 28660000 0.019965 119 485725401 -4.81
4 28630000 28650000 0.023163 128 485715401 -4.76
4 19940000 19960000 0.023901 62 477025401 -4.74
4 28620000 28640000 0.031312 132 485705401 -4.63
4 28470000 28490000 0.035703 22 485555401 -4.56
4 78460000 78480000 0.036163 95 535545401 -4.55

316
Chr Window start Window end Hp SNP (N) Genomic Position ZHp
4 78370000 78390000 0.037599 60 535455401 -4.53
4 6620000 6640000 0.040918 67 463705401 -4.48
4 78360000 78380000 0.042207 51 535445401 -4.46
4 78390000 78410000 0.043457 90 535475401 -4.44
4 78400000 78420000 0.043457 63 535485401 -4.44
4 78380000 78400000 0.044422 88 535465401 -4.42
4 78110000 78130000 0.044574 57 535195401 -4.42
4 27840000 27860000 0.046555 65 484925401 -4.39
4 6690000 6710000 0.046682 138 463775401 -4.39
4 11360000 11380000 0.050874 134 468445401 -4.32
4 78500000 78520000 0.05104 145 535585401 -4.32
4 78120000 78140000 0.052077 114 535205401 -4.3
4 78180000 78200000 0.052846 81 535265401 -4.29
4 28610000 28630000 0.054668 96 485695401 -4.26
4 19960000 19980000 0.057093 34 477045401 -4.22
4 7260000 7280000 0.057503 108 464345401 -4.22
4 6700000 6720000 0.057956 154 463785401 -4.21
4 27800000 27820000 0.0582 40 484885401 -4.21
4 28460000 28480000 0.0582 35 485545401 -4.21
4 19920000 19940000 0.061952 100 477005401 -4.15
4 19880000 19900000 0.063091 23 476965401 -4.13
4 78170000 78190000 0.063685 82 535255401 -4.12
4 29870000 29890000 0.064646 154 486955401 -4.1
4 45960000 45980000 0.065222 200 503045401 -4.1
4 27790000 27810000 0.066516 45 484875401 -4.07
4 21600000 21620000 0.066653 197 478685401 -4.07
4 27810000 27830000 0.066664 42 484895401 -4.07
4 39450000 39470000 0.067204 170 496535401 -4.06
4 21670000 21690000 0.068544 159 478755401 -4.04
4 28660000 28680000 0.068736 94 485745401 -4.04
5 18930000 18950000 0 67 567298057 -5.12
5 40840000 40860000 0.000592 169 589208057 -5.11
5 40850000 40870000 0.003766 159 589218057 -5.06
5 21380000 21400000 0.008299 72 569748057 -4.99
5 40830000 40850000 0.008899 179 589198057 -4.98
5 40860000 40880000 0.010563 113 589228057 -4.95
5 18810000 18830000 0.014783 94 567178057 -4.89
5 55440000 55460000 0.020429 218 603808057 -4.8
5 41880000 41900000 0.047331 134 590248057 -4.38
5 18820000 18840000 0.04875 130 567188057 -4.35
5 41020000 41040000 0.050033 185 589388057 -4.33
5 41660000 41680000 0.050618 127 590028057 -4.32
5 27450000 27470000 0.05369 163 575818057 -4.28
5 41870000 41890000 0.057093 119 590238057 -4.22
5 41650000 41670000 0.058293 203 590018057 -4.2

317
Chr Window start Window end Hp SNP (N) Genomic Position ZHp
5 27460000 27480000 0.060355 183 575828057 -4.17
5 37400000 37420000 0.061415 216 585768057 -4.16
5 55430000 55450000 0.066506 196 603798057 -4.08
5 21510000 21530000 0.067077 59 569878057 -4.07
5 41050000 41070000 0.067146 138 589418057 -4.07
5 41030000 41050000 0.067496 173 589398057 -4.06
5 27150000 27170000 0.068631 215 575518057 -4.04
6 34450000 34470000 0.026201 177 642643359 -4.71
6 14980000 15000000 0.052962 90 623173359 -4.29
6 18320000 18340000 0.067748 235 626513359 -4.06
6 18340000 18360000 0.07112 65 626533359 -4
7 34990000 35010000 0.004713 127 678650375 -5.04
7 34980000 35000000 0.03445 154 678640375 -4.58
7 35000000 35020000 0.056109 135 678660375 -4.24
7 28200000 28220000 0.058359 118 671860375 -4.2
7 25840000 25860000 0.065784 116 669500375 -4.09
8 15230000 15250000 0.002341 128 695837311 -5.08
8 23110000 23130000 0.002724 110 703717311 -5.08
8 23120000 23140000 0.002894 138 703727311 -5.07
8 15240000 15260000 0.004719 148 695847311 -5.04
8 23130000 23150000 0.005249 95 703737311 -5.04
8 23140000 23160000 0.007864 76 703747311 -5
8 0 20000 0.011472 26 680607311 -4.94
8 10000 30000 0.015503 32 680617311 -4.88
8 8830000 8850000 0.01722 213 689437311 -4.85
8 9160000 9180000 0.023005 116 689767311 -4.76
8 280000 300000 0.023526 21 680887311 -4.75
8 8820000 8840000 0.0253 199 689427311 -4.72
8 9190000 9210000 0.026427 56 689797311 -4.7
8 9050000 9070000 0.029328 131 689657311 -4.66
8 9170000 9190000 0.02955 80 689777311 -4.65
8 9520000 9540000 0.030553 87 690127311 -4.64
8 9060000 9080000 0.030762 128 689667311 -4.64
8 8800000 8820000 0.031626 28 689407311 -4.62
8 9200000 9220000 0.032077 92 689807311 -4.62
8 15250000 15270000 0.034982 146 695857311 -4.57
8 9720000 9740000 0.035077 56 690327311 -4.57
8 8810000 8830000 0.035133 123 689417311 -4.57
8 9070000 9090000 0.035226 92 689677311 -4.57
8 9510000 9530000 0.036018 139 690117311 -4.55
8 9140000 9160000 0.036797 96 689747311 -4.54
8 9150000 9170000 0.038838 106 689757311 -4.51
8 9680000 9700000 0.0392 35 690287311 -4.5
8 9730000 9750000 0.041939 63 690337311 -4.46
8 23010000 23030000 0.041939 105 703617311 -4.46

318
Chr Window start Window end Hp SNP (N) Genomic Position ZHp
8 8990000 9010000 0.04225 44 689597311 -4.46
8 9500000 9520000 0.04362 130 690107311 -4.43
8 9130000 9150000 0.046247 76 689737311 -4.39
8 9000000 9020000 0.047111 29 689607311 -4.38
8 9690000 9710000 0.050907 44 690297311 -4.32
8 9120000 9140000 0.0513 93 689727311 -4.31
8 9420000 9440000 0.053058 77 690027311 -4.29
8 9110000 9130000 0.054577 130 689717311 -4.26
8 9670000 9690000 0.05551 35 690277311 -4.25
8 9180000 9200000 0.056823 41 689787311 -4.23
8 8890000 8910000 0.057575 264 689497311 -4.22
8 9410000 9430000 0.058366 113 690017311 -4.2
8 8900000 8920000 0.061274 253 689507311 -4.16
8 11670000 11690000 0.062219 84 692277311 -4.14
8 15220000 15240000 0.062483 127 695827311 -4.14
8 9040000 9060000 0.063685 123 689647311 -4.12
8 8840000 8860000 0.064765 194 689447311 -4.1
8 8860000 8880000 0.064854 228 689467311 -4.1
8 9710000 9730000 0.066834 52 690317311 -4.07
8 9080000 9100000 0.066916 88 689687311 -4.07
8 8960000 8980000 0.066971 209 689567311 -4.07
8 9430000 9450000 0.067973 88 690037311 -4.05
8 8850000 8870000 0.068622 208 689457311 -4.04
8 8910000 8930000 0.069251 284 689517311 -4.03
8 9340000 9360000 0.069271 135 689947311 -4.03
8 15270000 15290000 0.07031 37 695877311 -4.02
8 15290000 15310000 0.070534 112 695897311 -4.01
8 230000 250000 0.070826 34 680837311 -4.01
9 10230000 10250000 0.00579 155 720800324 -5.03
9 10240000 10260000 0.007243 124 720810324 -5
9 10280000 10300000 0.007663 104 720850324 -5
9 10270000 10290000 0.026505 134 720840324 -4.7
9 10290000 10310000 0.033422 100 720860324 -4.59
9 10220000 10240000 0.035806 170 720790324 -4.56
9 10250000 10270000 0.037244 124 720820324 -4.53
9 10260000 10280000 0.042165 181 720830324 -4.46
9 10410000 10430000 0.05551 63 720980324 -4.25
9 12040000 12060000 0.05786 166 722610324 -4.21
9 10210000 10230000 0.060334 220 720780324 -4.17
9 16460000 16480000 0.063786 199 727030324 -4.12
9 16450000 16470000 0.064714 208 727020324 -4.1
9 16440000 16460000 0.065506 205 727010324 -4.09
9 7870000 7890000 0.070083 77 718440324 -4.02
10 12450000 12470000 0.02884 123 747111890 -4.67
10 14600000 14620000 0.040852 151 749261890 -4.48

319
Chr Window start Window end Hp SNP (N) Genomic Position ZHp
10 13740000 13760000 0.061288 158 748401890 -4.16
10 12460000 12480000 0.062565 116 747121890 -4.14
11 5880000 5900000 0.065252 77 760977232 -4.09
11 4680000 4700000 0.069292 128 759777232 -4.03
12 4400000 4420000 0.014329 97 779716025 -4.89
12 7730000 7750000 0.015503 64 783046025 -4.88
12 3410000 3430000 0.045286 261 778726025 -4.41
12 3420000 3440000 0.045776 192 778736025 -4.4
12 7520000 7540000 0.051247 114 782836025 -4.31
12 7530000 7550000 0.059718 99 782846025 -4.18
13 4470000 4490000 0.004843 103 799734179 -5.04
13 1660000 1680000 0.022469 22 796924179 -4.77
13 1650000 1670000 0.0392 25 796914179 -4.5
13 4460000 4480000 0.057708 153 799724179 -4.21
23 5560000 5580000 0.063091 23 905933666 -4.13
23 5600000 5620000 0.066834 26 905973666 -4.07
23 5720000 5740000 0.069792 29 906093666 -4.02
24 960000 980000 0.064655 148 907120194 -4.1
N=Count
Table S 56. List of candidate genes in Hugub (N=10).
Chre Gene stable ID Gene start (bp) Gene end (bp) Gene
name
Gene type
1 ENSGALG00000026901 76447763 76447872 gga-mir-
6606
miRNA 1 ENSGALG00000016187 109577831 109599269 WDR4 protein coding
1 ENSGALG00000013244 66927420 66999781 ABCC9 protein coding
1 ENSGALG00000011930 76345584 76430119 OVST protein coding
1 ENSGALG00000014685 77485688 77486689 protein coding
1 ENSGALG00000014687 77496575 77530024 EPHA1 protein coding
1 ENSGALG00000026781 175088272 175096275 ALOX5AP protein coding
1 ENSGALG00000017002 168999957 169111965 FNDC3A protein coding
1 ENSGALG00000017084 175340869 175397791 UBL3 protein coding
2 ENSGALG00000012889 68401769 68441726 ZCCHC2 protein coding
2 ENSGALG00000037014 147222471 147418330 TSNARE1 protein coding
2 ENSGALG00000042621 119132532 119162556 HNF4G protein coding
2 ENSGALG00000033849 63594678 63599141 lincRNA
3 ENSGALG00000034313 26292678 26293813 protein coding
3 ENSGALG00000016263 85768055 85882423 protein coding
3 ENSGALG00000036005 50653163 50738444 TIAM2 protein coding
3 ENSGALG00000010000 26395277 26573746 PRKCE protein coding
3 ENSGALG00000009990 26149684 26271666 SRBD1 protein coding
4 ENSGALG00000014421 76375272 76448502 LCORL protein coding
4 ENSGALG00000009826 29873452 29888948 CLGN protein coding
4 ENSGALG00000007530 11353982 11360783 protein coding
4 ENSGALG00000025899 11370765 11378924 protein coding
4 ENSGALG00000010921 45959958 45974346 PKD2 protein coding
4 ENSGALG00000006851 6599257 7006957 protein coding
4 ENSGALG00000010596 39448857 39482459 TACR3 protein coding
4 ENSGALG00000010926 45974555 45977750 SPP1 protein coding

320
Chre Gene stable ID Gene start (bp) Gene end (bp) Gene
name
Gene type
4 ENSGALG00000009813 29867280 29870882 SCOC protein coding
4 ENSGALG00000009405 21570620 21658066 GRIA2 protein coding
4 ENSGALG00000035886 27788185 27825157 lincRNA
5 ENSGALG00000010576 40868271 40894704 GTF2A1 protein coding
5 ENSGALG00000012085 55426088 55436007 protein coding
5 ENSGALG00000046577 18799853 18820890 protein coding
5 ENSGALG00000035537 27443274 27450430 SYNJ2BP protein coding
5 ENSGALG00000012089 55450095 55492082 C14orf37 protein coding
5 ENSGALG00000010572 40811286 40858950 TSHR protein coding
5 ENSGALG00000009387 27443194 27531009 protein coding
5 ENSGALG00000043759 37413460 37415830 lincRNA
6 ENSGALG00000005035 14982062 15068657 KAT6B protein coding
7 ENSGALG00000012049 28191739 28205266 ZNF148 protein coding
7 ENSGALG00000012462 34961029 35028577 KIF5C protein coding
8 ENSGALG00000044067 9703686 9705755 protein coding
8 ENSGALG00000036909 22774073 23612126 AGBL4 protein coding
8 ENSGALG00000020884 11667153 11694964 protein coding
8 ENSGALG00000010505 23084517 23113939 BEND5 protein coding
8 ENSGALG00000006237 15219523 15269342 PKN2 protein coding
8 ENSGALG00000033708 9019159 9019789 lincRNA
8 ENSGALG00000043258 9537043 9545093 lincRNA
9 ENSGALG00000002764 10307410 10329985 ATP1B3 protein coding
9 ENSGALG00000002850 10213881 10256070 RASA2 protein coding
9 ENSGALG00000008785 16440040 16455955 MCCC1 protein coding
9 ENSGALG00000002729 10392753 10431361 GK5 protein coding
9 ENSGALG00000021117 10262779 10269197 RNF7 protein coding
9 ENSGALG00000002800 10271683 10289497 GRK7 protein coding
9 ENSGALG00000030944 7888137 7948484 PAX3 protein coding
9 ENSGALG00000008807 16461899 16479137 DCUN1D1 protein coding
10 ENSGALG00000006445 12413427 12483133 ARNT2 protein coding
10 ENSGALG00000006819 13624751 13893408 AGBL1 protein coding
10 ENSGALG00000006949 14615742 14681032 CHD2 protein coding
12 ENSGALG00000004932 4379082 4468625 ATG7 protein coding
12 ENSGALG00000026080 3414370 3416416 OMD protein coding
12 ENSGALG00000026736 3424659 3435067 OGN protein coding
12 ENSGALG00000005400 7323310 7733469 protein coding
12 ENSGALG00000004687 3334370 3451194 CENPP protein coding
13 ENSGALG00000040453 1649170 1650955 SRA1 protein coding
13 ENSGALG00000001132 1651000 1654407 protein coding
13 ENSGALG00000001099 1544222 1650955 ANKHD1 protein coding
13 ENSGALG00000001916 4204850 4675881 SLIT3 protein coding
23 ENSGALG00000003986 5598141 5600060 PITHD1 protein coding
23 ENSGALG00000004112 5614065 5618727 FUCA1 protein coding
23 ENSGALG00000004002 5602159 5605993 LYPLA2 protein coding
23 ENSGALG00000004057 5610015 5613638 HMGCL protein coding
23 ENSGALG00000036294 5563597 5574294 CAP1 protein coding
23 ENSGALG00000004047 5607021 5609856 GALE protein coding
23 ENSGALG00000004120 5619783 5620838 CNR2 protein coding
23 ENSGALG00000003879 5554873 5562608 MFSD2A protein coding
23 ENSGALG00000003936 5575818 5580472 PPT1 protein coding
23 ENSGALG00000004249 5719948 5741312 GRHL3 protein coding
24 ENSGALG00000038377 975734 983980 lincRNA

321
Table S 57. Hp values within the threshold level (Hp ≤ -4) in Arabo chicken (N=10).
Chr Window start Window end Hp N Genomic Position ZHp
1 162410000 162430000 0.03737 168 162430000 -4.32188
1 162400000 162420000 0.040291 134 162420000 -4.27448
1 162220000 162240000 0.041219 76 162240000 -4.25942
1 101630000 101650000 0.041329 213 101650000 -4.25763
1 101640000 101660000 0.042484 172 101660000 -4.23888
1 32520000 32540000 0.05016 101 32540000 -4.11433
1 32530000 32550000 0.050264 107 32550000 -4.11264
1 162420000 162440000 0.054595 162 162440000 -4.04235
1 162430000 162450000 0.056946 150 162450000 -4.00421
2 61240000 61260000 0.020616 72 257462544 -4.59374
2 48510000 48530000 0.039636 141 244732544 -4.2851
2 61230000 61250000 0.052137 56 257452544 -4.08225
3 82480000 82500000 0.002008 199 428263279 -4.89571
3 82470000 82490000 0.003072 195 428253279 -4.87844
3 82490000 82510000 0.004393 159 428273279 -4.85701
3 23770000 23790000 0.017788 117 369553279 -4.63965
3 82460000 82480000 0.034854 186 428243279 -4.3627
3 23760000 23780000 0.047645 129 369543279 -4.15514
4 39500000 39520000 0.004007 274 496585401 -4.86328
4 39490000 39510000 0.006012 199 496575401 -4.83074
4 28650000 28670000 0.026427 112 485735401 -4.49945
4 27850000 27870000 0.027608 50 484935401 -4.48029
4 28640000 28660000 0.02805 123 485725401 -4.47311
4 28630000 28650000 0.030527 129 485715401 -4.43292
4 28620000 28640000 0.031518 128 485705401 -4.41683
4 27860000 27880000 0.036541 94 484945401 -4.33533
4 64960000 64980000 0.041636 167 522045401 -4.25265
4 27840000 27860000 0.042793 64 484925401 -4.23387
4 75200000 75220000 0.047442 109 532285401 -4.15843
4 27800000 27820000 0.051714 32 484885401 -4.08911
4 28610000 28630000 0.052973 101 485695401 -4.06868
4 27810000 27830000 0.053058 33 484895401 -4.0673
4 78130000 78150000 0.053058 165 535215401 -4.0673
4 27870000 27890000 0.05551 126 484955401 -4.0275
5 40840000 40860000 0.002323 172 589208057 -4.8906
5 21380000 21400000 0.00944 74 569748057 -4.77511
5 22540000 22560000 0.014888 40 570908057 -4.68671
5 11480000 11500000 0.024406 61 559848057 -4.53224
5 40830000 40850000 0.038263 205 589198057 -4.30738
5 22530000 22550000 0.038529 46 570898057 -4.30306
5 22480000 22500000 0.047216 31 570848057 -4.16209
5 41880000 41900000 0.049805 135 590248057 -4.12009
5 22490000 22510000 0.056632 24 570858057 -4.0093

322
Chr Window start Window end Hp N Genomic Position ZHp
6 7440000 7460000 0.017721 151 615633359 -4.64073
7 21020000 21040000 0.003221 93 664680375 -4.87603
7 21030000 21050000 0.019965 119 664690375 -4.60432
7 21010000 21030000 0.031448 97 664670375 -4.41797
7 21070000 21090000 0.0409 79 664730375 -4.26459
7 11870000 11890000 0.051039 121 655530375 -4.10006
13 1650000 1670000 0.042293 35 796914179 -4.24198
Chr = Chromosome; N= count
Table S 58. List of candidate genes in Arabo chicken (N=10).
Chr Gene stable ID Gene start (bp) Gene end (bp) Gene name Gene type
1 ENSGALG00000016936 1.62E+08 1.62E+08 TDRD3 protein coding
1 ENSGALG00000016937 1.62E+08 1.63E+08 DIAPH3 protein coding
2 ENSGALG00000039935 48353052 48628045 PDE1C protein coding
3 ENSGALG00000009915 23653116 23805917 EML4 protein coding
3 ENSGALG00000015944 82215093 82512310 RIMS1 protein coding
4 ENSGALG00000035886 27788185 27825157 lincRNA
4 ENSGALG00000013715 64904550 64998990 DLC1 protein coding
5 ENSGALG00000040491 11466672 11559343 lincRNA
5 ENSGALG00000010572 40811286 40858950 TSHR protein coding
7 ENSGALG00000008459 11874180 11969327 BMPR2 protein coding
7 ENSGALG00000038543 21044195 21149299 protein coding
13 ENSGALG00000001099 1544222 1650955 ANKHD1 protein coding
13 ENSGALG00000040453 1649170 1650955 SRA1 protein coding
13 ENSGALG00000001132 1651000 1654407 protein coding
Chr = Chromosome
Table S 59. Top Fst values (1%) in Improved with local Horro chicken.
Chr Window start Window end SNP(N) Weighted Fst Mean Fst ZFst
1 117420001 117440000 94 0.18 0.14 8.39
1 116210001 116230000 127 0.17 0.11 7.91
1 116220001 116240000 42 0.16 0.08 7.35
1 116710001 116730000 214 0.15 0.11 7.16

323
Chr Window start Window end SNP(N) Weighted Fst Mean Fst ZFst
1 117930001 117950000 206 0.15 0.09 6.86
1 115450001 115470000 244 0.15 0.07 6.86
1 116200001 116220000 217 0.15 0.06 6.85
1 117920001 117940000 266 0.15 0.09 6.81
1 116250001 116270000 181 0.15 0.10 6.79
1 116720001 116740000 190 0.14 0.09 6.69
1 115460001 115480000 167 0.14 0.08 6.62
1 105540001 105560000 201 0.14 0.10 6.48
1 70450001 70470000 328 0.14 0.08 6.41
1 118080001 118100000 307 0.13 0.07 6.28
1 70460001 70480000 428 0.13 0.08 6.22
1 70440001 70460000 133 0.13 0.07 6.17
1 105550001 105570000 215 0.13 0.08 6.12
1 118120001 118140000 403 0.13 0.09 6.08
1 116150001 116170000 123 0.13 0.06 6.06
1 116700001 116720000 213 0.13 0.10 6.06
1 116260001 116280000 141 0.13 0.08 6.05
1 70520001 70540000 396 0.13 0.06 6.05
1 117410001 117430000 213 0.12 0.09 5.89
1 70470001 70490000 513 0.12 0.07 5.89
1 116240001 116260000 209 0.12 0.05 5.88
1 96900001 96920000 118 0.12 0.08 5.87
1 114560001 114580000 234 0.12 0.07 5.84
1 117650001 117670000 328 0.12 0.06 5.61
1 105560001 105580000 228 0.12 0.06 5.57
1 117610001 117630000 280 0.11 0.06 5.56
1 70510001 70530000 465 0.11 0.04 5.55
1 115440001 115460000 274 0.11 0.04 5.51
1 70500001 70520000 463 0.11 0.05 5.49
1 117640001 117660000 319 0.11 0.05 5.46
1 96890001 96910000 75 0.11 0.06 5.45
1 117620001 117640000 282 0.11 0.06 5.36
1 77960001 77980000 263 0.11 0.06 5.29
1 70490001 70510000 468 0.11 0.04 5.28
1 116690001 116710000 187 0.11 0.08 5.26
1 108330001 108350000 244 0.11 0.06 5.26
1 105530001 105550000 271 0.11 0.07 5.21
1 108320001 108340000 354 0.11 0.04 5.21
1 116190001 116210000 254 0.11 0.03 5.20
1 70480001 70500000 535 0.11 0.05 5.20
1 105460001 105480000 342 0.11 0.06 5.17
1 105490001 105510000 308 0.11 0.07 5.17
1 84710001 84730000 208 0.10 0.06 5.13
1 118090001 118110000 380 0.10 0.05 5.12
1 117630001 117650000 308 0.10 0.05 5.11

324
Chr Window start Window end SNP(N) Weighted Fst Mean Fst ZFst
1 78260001 78280000 184 0.10 0.05 5.11
1 118640001 118660000 205 0.10 0.06 5.10
1 107060001 107080000 203 0.10 0.05 5.09
1 109580001 109600000 290 0.10 0.08 5.09
1 77950001 77970000 247 0.10 0.06 5.07
1 108190001 108210000 400 0.10 0.05 5.07
1 107050001 107070000 249 0.10 0.06 5.05
1 116280001 116300000 157 0.10 0.05 5.05
1 77970001 77990000 182 0.10 0.06 5.04
1 116120001 116140000 132 0.10 0.07 5.03
1 118110001 118130000 400 0.10 0.06 4.99
1 116270001 116290000 156 0.10 0.04 4.98
1 116660001 116680000 153 0.10 0.06 4.98
1 114550001 114570000 256 0.10 0.06 4.96
1 108960001 108980000 264 0.10 0.06 4.92
1 113430001 113450000 354 0.10 0.01 4.91
1 77570001 77590000 226 0.10 0.05 4.91
1 113500001 113520000 271 0.10 0.01 4.91
1 108200001 108220000 403 0.10 0.05 4.90
1 115830001 115850000 54 0.10 0.07 4.89
1 109590001 109610000 282 0.10 0.06 4.89
1 108180001 108200000 332 0.10 0.05 4.87
1 117030001 117050000 111 0.10 0.09 4.86
1 77580001 77600000 177 0.10 0.06 4.85
1 105450001 105470000 373 0.10 0.06 4.85
1 105480001 105500000 392 0.10 0.06 4.85
1 70610001 70630000 209 0.10 0.04 4.83
1 108210001 108230000 384 0.10 0.05 4.81
1 117020001 117040000 121 0.10 0.09 4.81
1 113410001 113430000 442 0.10 0.02 4.79
1 116290001 116310000 169 0.10 0.06 4.77
1 105500001 105520000 341 0.10 0.06 4.75
1 108160001 108180000 326 0.10 0.05 4.75
1 116180001 116200000 197 0.09 0.03 4.73
1 118650001 118670000 268 0.09 0.06 4.71
1 108170001 108190000 305 0.09 0.05 4.71
1 113440001 113460000 411 0.09 0.01 4.71
1 116140001 116160000 156 0.09 0.04 4.70
1 117040001 117060000 42 0.09 0.08 4.64
1 117850001 117870000 219 0.09 0.07 4.64
1 105470001 105490000 368 0.09 0.06 4.64
1 114590001 114610000 260 0.09 0.05 4.63
1 117600001 117620000 280 0.09 0.05 4.63
1 113400001 113420000 497 0.09 0.04 4.63
1 118070001 118090000 232 0.09 0.05 4.62

325
Chr Window start Window end SNP(N) Weighted Fst Mean Fst ZFst
1 70530001 70550000 304 0.09 0.06 4.61
1 78270001 78290000 129 0.09 0.03 4.59
1 77920001 77940000 174 0.09 0.03 4.57
1 114400001 114420000 289 0.09 0.05 4.56
1 118240001 118260000 298 0.09 0.06 4.55
1 115820001 115840000 188 0.09 0.07 4.54
1 108220001 108240000 313 0.09 0.05 4.54
1 108290001 108310000 281 0.09 0.03 4.54
1 78250001 78270000 217 0.09 0.04 4.53
1 107580001 107600000 107 0.09 0.05 4.53
1 116580001 116600000 130 0.09 0.05 4.52
1 115470001 115490000 195 0.09 0.06 4.52
1 108790001 108810000 240 0.09 0.03 4.52
1 78290001 78310000 294 0.09 0.05 4.50
1 113950001 113970000 233 0.09 0.06 4.49
1 69880001 69900000 111 0.09 0.06 4.47
1 108870001 108890000 221 0.09 0.04 4.46
1 112470001 112490000 173 0.09 0.05 4.45
1 114670001 114690000 306 0.09 0.05 4.45
1 108970001 108990000 264 0.09 0.05 4.45
1 115920001 115940000 156 0.09 0.05 4.44
1 115770001 115790000 262 0.09 0.05 4.44
1 89960001 89980000 188 0.09 0.06 4.43
1 117500001 117520000 81 0.09 0.07 4.43
1 108880001 108900000 178 0.09 0.04 4.42
1 77910001 77930000 204 0.09 0.03 4.40
1 116160001 116180000 151 0.09 0.03 4.40
1 116130001 116150000 190 0.09 0.05 4.38
1 116570001 116590000 123 0.09 0.05 4.37
1 108340001 108360000 202 0.09 0.06 4.37
1 77990001 78010000 190 0.09 0.05 4.37
1 105430001 105450000 237 0.09 0.06 4.37
1 105510001 105530000 400 0.09 0.05 4.36
1 108310001 108330000 332 0.09 0.03 4.35
1 114410001 114430000 274 0.09 0.04 4.34
1 113460001 113480000 237 0.08 0.01 4.33
1 113490001 113510000 223 0.08 0.01 4.33
1 113250001 113270000 290 0.08 0.06 4.33
1 78280001 78300000 227 0.08 0.03 4.32
1 96910001 96930000 144 0.08 0.05 4.31
1 105440001 105460000 340 0.08 0.06 4.31
1 118250001 118270000 336 0.08 0.05 4.31
1 77890001 77910000 279 0.08 0.04 4.30
1 96880001 96900000 34 0.08 0.04 4.30
1 77980001 78000000 135 0.08 0.04 4.29

326
Chr Window start Window end SNP(N) Weighted Fst Mean Fst ZFst
1 100980001 101000000 124 0.08 0.06 4.29
1 113420001 113440000 364 0.08 0.00 4.27
1 113940001 113960000 214 0.08 0.06 4.27
1 105370001 105390000 308 0.08 0.04 4.26
1 117820001 117840000 230 0.08 0.04 4.25
1 77940001 77960000 216 0.08 0.04 4.25
1 113390001 113410000 454 0.08 0.03 4.25
1 87430001 87450000 217 0.08 0.06 4.24
1 117660001 117680000 342 0.08 0.04 4.23
1 70340001 70360000 335 0.08 0.06 4.22
1 108990001 109010000 262 0.08 0.04 4.22
1 113510001 113530000 273 0.08 0.00 4.22
1 114580001 114600000 254 0.08 0.05 4.21
1 84700001 84720000 171 0.08 0.04 4.21
1 114390001 114410000 323 0.08 0.05 4.20
1 115780001 115800000 328 0.08 0.05 4.20
1 77900001 77920000 224 0.08 0.03 4.20
1 113610001 113630000 303 0.08 0.01 4.19
1 96950001 96970000 166 0.08 0.06 4.19
1 108540001 108560000 161 0.08 0.04 4.18
1 113600001 113620000 220 0.08 0.01 4.18
1 105360001 105380000 309 0.08 0.04 4.18
1 108530001 108550000 226 0.08 0.03 4.17
1 106430001 106450000 142 0.08 0.06 4.16
1 700001 720000 253 0.08 0.04 4.15
1 84450001 84470000 233 0.08 0.06 4.15
1 114660001 114680000 318 0.08 0.04 4.13
1 113620001 113640000 326 0.08 0.01 4.11
1 70200001 70220000 287 0.08 0.05 4.11
1 1210001 1230000 184 0.08 0.04 4.11
1 77560001 77580000 244 0.08 0.04 4.11
1 77880001 77900000 250 0.08 0.04 4.11
1 115790001 115810000 264 0.08 0.05 4.09
1 114570001 114590000 215 0.08 0.05 4.09
1 108950001 108970000 274 0.08 0.04 4.08
1 108860001 108880000 254 0.08 0.04 4.08
1 108780001 108800000 242 0.08 0.02 4.08
1 69820001 69840000 212 0.08 0.04 4.07
1 115430001 115450000 283 0.08 0.04 4.07
1 118130001 118150000 352 0.08 0.05 4.06
1 107830001 107850000 71 0.08 0.08 4.06
1 115810001 115830000 291 0.08 0.06 4.05
1 105520001 105540000 332 0.08 0.05 4.04
1 89930001 89950000 229 0.08 0.04 4.04
1 87290001 87310000 220 0.08 0.06 4.04

327
Chr Window start Window end SNP(N) Weighted Fst Mean Fst ZFst
1 109500001 109520000 350 0.08 0.05 4.02
1 107570001 107590000 114 0.08 0.02 4.01
1 117830001 117850000 235 0.08 0.04 4.01
1 107040001 107060000 200 0.08 0.04 3.99
1 107590001 107610000 79 0.08 0.03 3.99
1 55860001 55880000 76 0.08 0.06 3.98
1 113380001 113400000 329 0.08 0.02 3.98
1 108520001 108540000 229 0.08 0.04 3.98
1 116070001 116090000 155 0.08 0.06 3.98
1 69930001 69950000 304 0.08 0.04 3.98
1 116730001 116750000 127 0.08 0.04 3.97
1 70210001 70230000 229 0.08 0.04 3.96
1 105330001 105350000 282 0.08 0.04 3.96
1 113960001 113980000 161 0.08 0.05 3.95
1 108510001 108530000 188 0.08 0.03 3.95
1 118630001 118650000 163 0.08 0.04 3.95
1 87440001 87460000 222 0.08 0.05 3.95
1 113680001 113700000 307 0.08 0.01 3.94
1 116680001 116700000 191 0.08 0.04 3.94
1 114430001 114450000 301 0.08 0.04 3.93
1 116300001 116320000 173 0.08 0.04 3.93
1 69920001 69940000 288 0.07 0.05 3.93
1 117840001 117860000 191 0.07 0.05 3.93
1 86870001 86890000 228 0.07 0.05 3.92
1 107070001 107090000 86 0.07 0.04 3.92
1 108980001 109000000 277 0.07 0.04 3.92
1 115930001 115950000 158 0.07 0.04 3.89
1 112660001 112680000 241 0.07 0.04 3.89
1 84460001 84480000 222 0.07 0.05 3.89
1 70410001 70430000 374 0.07 0.03 3.89
1 107490001 107510000 141 0.07 0.07 3.88
1 113450001 113470000 345 0.07 0.00 3.88
1 116670001 116690000 179 0.07 0.03 3.87
1 86880001 86900000 213 0.07 0.05 3.86
1 89530001 89550000 42 0.07 0.05 3.86
1 70350001 70370000 324 0.07 0.05 3.84
1 70190001 70210000 299 0.07 0.04 3.84
1 77800001 77820000 292 0.07 0.04 3.84
1 107530001 107550000 170 0.07 0.04 3.83
1 112840001 112860000 235 0.07 0.03 3.83
1 930001 950000 234 0.07 0.05 3.83
1 84530001 84550000 174 0.07 0.07 3.82
1 114420001 114440000 271 0.07 0.04 3.81
1 107620001 107640000 207 0.07 0.03 3.81
1 77930001 77950000 183 0.07 0.02 3.80

328
Chr Window start Window end SNP(N) Weighted Fst Mean Fst ZFst
1 116080001 116100000 154 0.07 0.06 3.79
1 113470001 113490000 236 0.07 0.01 3.79
1 114380001 114400000 372 0.07 0.04 3.78
1 89950001 89970000 165 0.07 0.04 3.78
1 114980001 115000000 406 0.07 0.05 3.77
1 117910001 117930000 295 0.07 0.05 3.77
1 70680001 70700000 183 0.07 0.05 3.76
1 78220001 78240000 103 0.07 0.04 3.75
1 118280001 118300000 411 0.07 0.04 3.75
1 112480001 112500000 250 0.07 0.04 3.75
1 2140001 2160000 129 0.07 0.06 3.75
1 114360001 114380000 400 0.07 0.03 3.75
1 118660001 118680000 310 0.07 0.05 3.74
1 117070001 117090000 53 0.07 0.06 3.74
1 105380001 105400000 266 0.07 0.03 3.74
1 107540001 107560000 206 0.07 0.03 3.74
1 108800001 108820000 221 0.07 0.03 3.73
1 116430001 116450000 161 0.07 0.05 3.71
1 104840001 104860000 282 0.07 0.03 3.70
1 115760001 115780000 217 0.07 0.04 3.69
1 84520001 84540000 213 0.07 0.06 3.69
1 78300001 78320000 293 0.07 0.03 3.68
1 113310001 113330000 309 0.07 0.01 3.68
1 77590001 77610000 185 0.07 0.04 3.68
1 78000001 78020000 190 0.07 0.04 3.67
1 107500001 107520000 101 0.07 0.06 3.67
1 77550001 77570000 319 0.07 0.04 3.67
1 112150001 112170000 354 0.07 0.04 3.67
1 84720001 84740000 235 0.07 0.04 3.66
1 115890001 115910000 229 0.07 0.04 3.66
1 114370001 114390000 374 0.07 0.04 3.66
1 108300001 108320000 255 0.07 0.03 3.65
1 115800001 115820000 256 0.07 0.05 3.65
1 107820001 107840000 165 0.07 0.05 3.64
1 86970001 86990000 173 0.07 0.03 3.64
1 113370001 113390000 223 0.07 0.02 3.63
1 107630001 107650000 188 0.07 0.02 3.62
1 116510001 116530000 233 0.07 0.04 3.62
1 107610001 107630000 250 0.07 0.03 3.61
1 117860001 117880000 238 0.07 0.05 3.61
1 169430001 169450000 222 0.07 0.03 3.60
1 176980001 177000000 114 0.07 0.04 3.60
1 118290001 118310000 394 0.07 0.04 3.59
1 116540001 116560000 137 0.07 0.04 3.59
1 106200001 106220000 158 0.07 0.03 3.59

329
Chr Window start Window end SNP(N) Weighted Fst Mean Fst ZFst
1 89920001 89940000 208 0.07 0.04 3.59
1 55850001 55870000 138 0.07 0.05 3.58
1 116230001 116250000 98 0.07 0.01 3.57
1 70420001 70440000 355 0.07 0.03 3.57
1 89940001 89960000 208 0.07 0.03 3.56
1 107090001 107110000 223 0.07 0.04 3.56
1 107550001 107570000 161 0.07 0.02 3.56
1 112830001 112850000 274 0.07 0.02 3.55
1 115100001 115120000 173 0.07 0.05 3.54
1 113630001 113650000 232 0.07 -0.01 3.53
1 115840001 115860000 116 0.07 0.04 3.53
1 112670001 112690000 223 0.07 0.04 3.53
1 116170001 116190000 151 0.07 0.02 3.53
1 116520001 116540000 182 0.07 0.04 3.52
1 113670001 113690000 273 0.07 0.01 3.52
1 113260001 113280000 348 0.07 0.05 3.52
1 107600001 107620000 181 0.06 0.02 3.51
1 108380001 108400000 261 0.06 0.04 3.51
1 118270001 118290000 430 0.06 0.04 3.51
1 115480001 115500000 257 0.06 0.05 3.51
1 105420001 105440000 216 0.06 0.04 3.51
1 117590001 117610000 252 0.06 0.03 3.50
1 92860001 92880000 217 0.06 0.06 3.50
1 70220001 70240000 206 0.06 0.04 3.50
1 109490001 109510000 325 0.06 0.05 3.49
1 101030001 101050000 31 0.06 0.06 3.49
1 82880001 82900000 110 0.06 0.05 3.49
1 108370001 108390000 236 0.06 0.04 3.48
1 107480001 107500000 171 0.06 0.06 3.48
1 78080001 78100000 127 0.06 0.01 3.47
1 77450001 77470000 264 0.06 0.04 3.47
1 70600001 70620000 199 0.06 0.04 3.47
2 129250001 129270000 261 0.14 0.08 6.56
2 129240001 129260000 267 0.14 0.09 6.49
2 144690001 144710000 180 0.13 0.12 6.31
2 132390001 132410000 139 0.13 0.13 6.26
2 130020001 130040000 293 0.13 0.08 6.08
2 129180001 129200000 388 0.12 0.08 5.96
2 132400001 132420000 147 0.12 0.11 5.92
2 130380001 130400000 149 0.12 0.08 5.68
2 144700001 144720000 245 0.12 0.09 5.63
2 145380001 145400000 231 0.12 0.07 5.60
2 144670001 144690000 165 0.12 0.10 5.60
2 135910001 135930000 215 0.11 0.09 5.49
2 130390001 130410000 187 0.11 0.08 5.45

330
Chr Window start Window end SNP(N) Weighted Fst Mean Fst ZFst
2 134130001 134150000 102 0.11 0.07 5.38
2 144680001 144700000 151 0.11 0.10 5.31
2 145390001 145410000 234 0.11 0.06 5.29
2 129730001 129750000 278 0.11 0.06 5.25
2 42340001 42360000 233 0.11 0.08 5.24
2 129710001 129730000 276 0.11 0.06 5.21
2 144230001 144250000 86 0.11 0.08 5.16
2 129280001 129300000 304 0.10 0.06 5.15
2 144210001 144230000 112 0.10 0.06 5.12
2 147500001 147520000 169 0.10 0.09 5.12
2 131090001 131110000 236 0.10 0.07 5.07
2 144660001 144680000 191 0.10 0.08 5.06
2 132230001 132250000 172 0.10 0.10 5.05
2 132440001 132460000 205 0.10 0.07 5.04
2 129170001 129190000 410 0.10 0.05 5.03
2 130230001 130250000 286 0.10 0.07 5.02
2 23780001 23800000 204 0.10 0.07 5.00
2 147070001 147090000 97 0.10 0.10 4.99
2 147020001 147040000 114 0.10 0.10 4.99
2 134120001 134140000 112 0.10 0.06 4.99
2 147010001 147030000 135 0.10 0.10 4.98
2 147000001 147020000 121 0.10 0.10 4.97
2 144220001 144240000 78 0.10 0.05 4.96
2 147050001 147070000 114 0.10 0.10 4.96
2 144170001 144190000 63 0.10 0.08 4.96
2 147060001 147080000 94 0.10 0.10 4.95
2 146990001 147010000 80 0.10 0.10 4.95
2 132380001 132400000 183 0.10 0.09 4.93
2 146980001 147000000 67 0.10 0.10 4.93
2 42350001 42370000 268 0.10 0.07 4.92
2 147080001 147100000 81 0.10 0.10 4.92
2 134150001 134170000 101 0.10 0.06 4.91
2 129720001 129740000 301 0.10 0.06 4.90
2 144200001 144220000 132 0.10 0.06 4.90
2 129190001 129210000 328 0.10 0.07 4.90
2 144180001 144200000 120 0.10 0.07 4.90
2 130010001 130030000 266 0.10 0.05 4.90
2 147040001 147060000 107 0.10 0.10 4.89
2 147030001 147050000 85 0.10 0.10 4.86
2 147510001 147530000 205 0.10 0.08 4.84
2 129290001 129310000 351 0.10 0.06 4.84
2 144160001 144180000 25 0.10 0.04 4.82
2 144190001 144210000 129 0.10 0.07 4.79
2 144240001 144260000 102 0.10 0.08 4.79
2 132480001 132500000 350 0.10 0.07 4.79

331
Chr Window start Window end SNP(N) Weighted Fst Mean Fst ZFst
2 129230001 129250000 306 0.10 0.06 4.78
2 131490001 131510000 321 0.09 0.09 4.71
2 134200001 134220000 110 0.09 0.07 4.71
2 132120001 132140000 219 0.09 0.04 4.70
2 130060001 130080000 214 0.09 0.06 4.67
2 134140001 134160000 87 0.09 0.05 4.66
2 129480001 129500000 265 0.09 0.06 4.66
2 132430001 132450000 194 0.09 0.08 4.62
2 130240001 130260000 149 0.09 0.05 4.62
2 130030001 130050000 351 0.09 0.06 4.62
2 132450001 132470000 279 0.09 0.06 4.59
2 129260001 129280000 357 0.09 0.04 4.59
2 145370001 145390000 179 0.09 0.05 4.59
2 146970001 146990000 88 0.09 0.09 4.56
2 129150001 129170000 191 0.09 0.06 4.55
2 23770001 23790000 199 0.09 0.06 4.55
2 147490001 147510000 152 0.09 0.07 4.54
2 20120001 20140000 174 0.09 0.08 4.53
2 129310001 129330000 123 0.09 0.05 4.51
2 20110001 20130000 160 0.09 0.07 4.50
2 146190001 146210000 272 0.09 0.06 4.49
2 132220001 132240000 198 0.09 0.08 4.49
2 129700001 129720000 223 0.09 0.04 4.48
2 129210001 129230000 305 0.09 0.05 4.47
2 144150001 144170000 58 0.09 0.03 4.44
2 132410001 132430000 175 0.09 0.07 4.44
2 131980001 132000000 333 0.09 0.06 4.43
2 129220001 129240000 357 0.09 0.05 4.42
2 131600001 131620000 449 0.09 0.06 4.39
2 144340001 144360000 95 0.09 0.03 4.38
2 129470001 129490000 220 0.09 0.04 4.38
2 42330001 42350000 172 0.09 0.06 4.37
2 129300001 129320000 306 0.09 0.05 4.34
2 130050001 130070000 255 0.09 0.05 4.34
2 130200001 130220000 300 0.08 0.06 4.33
2 128920001 128940000 191 0.08 0.05 4.33
2 129110001 129130000 244 0.08 0.05 4.32
2 130860001 130880000 223 0.08 0.04 4.31
2 132590001 132610000 502 0.08 0.06 4.30
2 132130001 132150000 250 0.08 0.05 4.27
2 135920001 135940000 213 0.08 0.08 4.27
2 132470001 132490000 300 0.08 0.05 4.27
2 134210001 134230000 106 0.08 0.06 4.26
2 130210001 130230000 337 0.08 0.06 4.25
2 129550001 129570000 228 0.08 0.06 4.23

332
Chr Window start Window end SNP(N) Weighted Fst Mean Fst ZFst
2 141470001 141490000 209 0.08 0.05 4.22
2 146960001 146980000 82 0.08 0.08 4.22
2 129270001 129290000 377 0.08 0.04 4.21
2 144350001 144370000 105 0.08 0.05 4.21
2 129740001 129760000 275 0.08 0.05 4.19
2 132290001 132310000 290 0.08 0.06 4.19
2 132490001 132510000 317 0.08 0.06 4.18
2 129040001 129060000 339 0.08 0.04 4.18
2 132210001 132230000 149 0.08 0.07 4.16
2 143150001 143170000 84 0.08 0.06 4.15
2 147590001 147610000 82 0.08 0.06 4.13
2 133920001 133940000 110 0.08 0.05 4.12
2 141460001 141480000 107 0.08 0.06 4.12
2 134190001 134210000 123 0.08 0.05 4.10
2 132000001 132020000 347 0.08 0.06 4.10
2 146200001 146220000 248 0.08 0.05 4.09
2 132600001 132620000 467 0.08 0.06 4.09
2 130180001 130200000 324 0.08 0.05 4.08
2 130220001 130240000 311 0.08 0.06 4.08
2 131080001 131100000 228 0.08 0.06 4.08
2 128930001 128950000 234 0.08 0.05 4.08
2 132460001 132480000 276 0.08 0.04 4.08
2 129440001 129460000 315 0.08 0.05 4.07
2 144090001 144110000 110 0.08 0.03 4.06
2 129200001 129220000 283 0.08 0.05 4.06
2 131210001 131230000 199 0.08 0.04 4.06
2 129430001 129450000 349 0.08 0.04 4.04
2 131200001 131220000 199 0.08 0.03 4.03
2 133790001 133810000 120 0.08 0.06 4.02
2 132300001 132320000 334 0.08 0.05 4.01
2 132370001 132390000 221 0.08 0.07 4.00
2 130590001 130610000 311 0.08 0.05 4.00
2 131910001 131930000 253 0.08 0.07 4.00
2 130980001 131000000 199 0.08 0.04 3.98
2 134500001 134520000 155 0.08 0.07 3.98
2 132060001 132080000 270 0.08 0.05 3.96
2 129160001 129180000 375 0.08 0.04 3.96
2 129380001 129400000 309 0.08 0.04 3.95
2 131970001 131990000 300 0.08 0.04 3.95
2 130570001 130590000 321 0.08 0.06 3.94
2 132070001 132090000 317 0.08 0.05 3.94
2 23790001 23810000 238 0.08 0.02 3.93
2 144100001 144120000 119 0.07 0.02 3.92
2 129030001 129050000 368 0.07 0.05 3.92
2 132010001 132030000 347 0.07 0.05 3.92

333
Chr Window start Window end SNP(N) Weighted Fst Mean Fst ZFst
2 131900001 131920000 281 0.07 0.06 3.88
2 131840001 131860000 224 0.07 0.04 3.88
2 130190001 130210000 255 0.07 0.04 3.88
2 130340001 130360000 222 0.07 0.03 3.86
2 131220001 131240000 260 0.07 0.05 3.85
2 130450001 130470000 237 0.07 0.06 3.85
2 129510001 129530000 329 0.07 0.05 3.84
2 129100001 129120000 231 0.07 0.04 3.84
2 131280001 131300000 190 0.07 0.05 3.84
2 131990001 132010000 334 0.07 0.05 3.83
2 145400001 145420000 305 0.07 0.03 3.82
2 134160001 134180000 75 0.07 0.05 3.80
2 147520001 147540000 218 0.07 0.05 3.80
2 132780001 132800000 223 0.07 0.05 3.80
2 129330001 129350000 152 0.07 0.03 3.79
2 134490001 134510000 134 0.07 0.06 3.78
2 20100001 20120000 150 0.07 0.05 3.78
2 22660001 22680000 266 0.07 0.03 3.78
2 132420001 132440000 215 0.07 0.06 3.78
2 129140001 129160000 140 0.07 0.04 3.78
2 129890001 129910000 369 0.07 0.05 3.77
2 130640001 130660000 278 0.07 0.05 3.77
2 131930001 131950000 236 0.07 0.05 3.77
2 133530001 133550000 86 0.07 0.05 3.76
2 131500001 131520000 294 0.07 0.06 3.76
2 129660001 129680000 358 0.07 0.05 3.75
2 71900001 71920000 77 0.07 0.05 3.75
2 133800001 133820000 148 0.07 0.05 3.75
2 130460001 130480000 257 0.07 0.05 3.75
2 134220001 134240000 93 0.07 0.05 3.74
2 129560001 129580000 289 0.07 0.05 3.73
2 130840001 130860000 239 0.07 0.04 3.73
2 132140001 132160000 273 0.07 0.06 3.73
2 130600001 130620000 380 0.07 0.05 3.73
2 132110001 132130000 134 0.07 0.02 3.73
2 131540001 131560000 420 0.07 0.05 3.73
2 129880001 129900000 309 0.07 0.05 3.72
2 144270001 144290000 114 0.07 0.06 3.72
2 132150001 132170000 250 0.07 0.06 3.72
2 131530001 131550000 382 0.07 0.05 3.72
2 133540001 133560000 84 0.07 0.05 3.72
2 144000001 144020000 150 0.07 0.07 3.71
2 134250001 134270000 95 0.07 0.03 3.71
2 130250001 130270000 143 0.07 0.04 3.71
2 127440001 127460000 209 0.07 0.06 3.71

334
Chr Window start Window end SNP(N) Weighted Fst Mean Fst ZFst
2 127450001 127470000 239 0.07 0.07 3.70
2 130630001 130650000 335 0.07 0.05 3.70
2 131140001 131160000 212 0.07 0.03 3.70
2 128960001 128980000 247 0.07 0.04 3.69
2 129420001 129440000 340 0.07 0.04 3.68
2 133930001 133950000 98 0.07 0.04 3.68
2 146950001 146970000 88 0.07 0.06 3.67
2 146490001 146510000 226 0.07 0.08 3.67
2 131590001 131610000 464 0.07 0.05 3.66
2 132090001 132110000 68 0.07 0.02 3.66
2 130580001 130600000 288 0.07 0.05 3.65
2 131130001 131150000 224 0.07 0.03 3.64
2 146180001 146200000 272 0.07 0.05 3.64
2 129490001 129510000 249 0.07 0.04 3.64
2 129500001 129520000 279 0.07 0.04 3.64
2 144060001 144080000 170 0.07 0.03 3.64
2 131460001 131480000 291 0.07 0.06 3.63
2 144010001 144030000 108 0.07 0.06 3.63
2 132160001 132180000 210 0.07 0.04 3.62
2 130930001 130950000 250 0.07 0.02 3.62
2 135900001 135920000 260 0.07 0.05 3.62
2 129670001 129690000 341 0.07 0.04 3.61
2 129390001 129410000 352 0.07 0.03 3.61
2 129450001 129470000 340 0.07 0.04 3.61
2 132080001 132100000 217 0.07 0.03 3.60
2 129910001 129930000 473 0.07 0.05 3.60
2 143140001 143160000 116 0.07 0.04 3.60
2 144040001 144060000 115 0.07 0.05 3.59
2 144050001 144070000 169 0.07 0.04 3.59
2 136090001 136110000 245 0.07 0.05 3.59
2 129120001 129140000 318 0.07 0.04 3.59
2 131960001 131980000 293 0.07 0.04 3.58
2 132750001 132770000 209 0.07 0.05 3.57
2 131870001 131890000 320 0.07 0.04 3.57
2 131830001 131850000 273 0.07 0.04 3.56
2 143990001 144010000 81 0.07 0.06 3.55
2 132280001 132300000 292 0.07 0.05 3.54
2 131480001 131500000 362 0.07 0.06 3.54
2 132310001 132330000 329 0.07 0.04 3.54
2 130370001 130390000 166 0.07 0.02 3.53
2 124030001 124050000 183 0.07 0.05 3.53
2 137440001 137460000 199 0.06 0.05 3.52
2 144070001 144090000 108 0.06 0.02 3.52
2 134650001 134670000 83 0.06 0.05 3.52
2 129620001 129640000 277 0.06 0.05 3.51

335
Chr Window start Window end SNP(N) Weighted Fst Mean Fst ZFst
2 131880001 131900000 236 0.06 0.04 3.51
2 131520001 131540000 352 0.06 0.04 3.49
2 133910001 133930000 120 0.06 0.04 3.48
2 129130001 129150000 304 0.06 0.03 3.48
2 142520001 142540000 275 0.06 0.03 3.47
2 134730001 134750000 58 0.06 0.06 3.47
2 129540001 129560000 186 0.06 0.04 3.47
2 130870001 130890000 263 0.06 0.02 3.47
2 129070001 129090000 253 0.06 0.05 3.47
2 71790001 71810000 121 0.06 0.05 3.47
3 49430001 49450000 183 0.15 0.15 7.12
3 49440001 49460000 144 0.15 0.15 7.10
3 49420001 49440000 169 0.14 0.13 6.40
3 31350001 31370000 211 0.13 0.10 6.25
3 31340001 31360000 210 0.13 0.09 6.14
3 104560001 104580000 170 0.11 0.08 5.53
3 51430001 51450000 101 0.11 0.07 5.52
3 31730001 31750000 253 0.11 0.04 5.29
3 104550001 104570000 224 0.11 0.09 5.25
3 31330001 31350000 205 0.10 0.06 5.08
3 31660001 31680000 80 0.10 0.06 5.03
3 31290001 31310000 187 0.10 0.05 4.92
3 30970001 30990000 170 0.10 0.08 4.84
3 103840001 103860000 112 0.10 0.08 4.83
3 103830001 103850000 139 0.10 0.08 4.81
3 31360001 31380000 230 0.10 0.06 4.78
3 49450001 49470000 152 0.09 0.11 4.67
3 31300001 31320000 137 0.09 0.04 4.65
3 103850001 103870000 160 0.09 0.06 4.63
3 31720001 31740000 282 0.09 0.05 4.59
3 104540001 104560000 369 0.09 0.07 4.52
3 103820001 103840000 151 0.09 0.07 4.52
3 31280001 31300000 242 0.09 0.05 4.48
3 104570001 104590000 229 0.09 0.06 4.45
3 31650001 31670000 158 0.09 0.05 4.45
3 34250001 34270000 159 0.09 0.08 4.43
3 40200001 40220000 276 0.09 0.08 4.37
3 31670001 31690000 113 0.09 0.04 4.36
3 31320001 31340000 224 0.09 0.05 4.34
3 30980001 31000000 211 0.08 0.06 4.32
3 103800001 103820000 102 0.08 0.05 4.25
3 104580001 104600000 284 0.08 0.05 4.25
3 31270001 31290000 268 0.08 0.04 4.16
3 31590001 31610000 243 0.08 0.05 4.12
3 36430001 36450000 92 0.08 0.06 4.10

336
Chr Window start Window end SNP(N) Weighted Fst Mean Fst ZFst
3 34240001 34260000 195 0.08 0.06 4.06
3 104530001 104550000 491 0.08 0.06 4.02
3 103790001 103810000 112 0.08 0.05 4.00
3 104590001 104610000 223 0.08 0.05 3.99
3 69050001 69070000 172 0.08 0.02 3.98
3 104520001 104540000 476 0.08 0.05 3.96
3 94450001 94470000 98 0.08 0.08 3.96
3 49410001 49430000 131 0.08 0.07 3.95
3 68960001 68980000 161 0.07 0.05 3.92
3 31710001 31730000 311 0.07 0.04 3.87
3 51270001 51290000 174 0.07 0.03 3.87
3 104740001 104760000 266 0.07 0.05 3.87
3 31600001 31620000 141 0.07 0.04 3.86
3 31430001 31450000 299 0.07 0.04 3.86
3 68770001 68790000 96 0.07 0.05 3.84
3 38700001 38720000 235 0.07 0.06 3.83
3 31250001 31270000 261 0.07 0.04 3.82
3 31260001 31280000 268 0.07 0.03 3.78
3 31420001 31440000 334 0.07 0.04 3.77
3 68970001 68990000 272 0.07 0.05 3.77
3 30750001 30770000 139 0.07 0.05 3.71
3 31580001 31600000 349 0.07 0.04 3.70
3 68350001 68370000 237 0.07 0.05 3.64
3 30740001 30760000 103 0.07 0.04 3.63
3 68400001 68420000 264 0.07 0.05 3.63
3 104610001 104630000 151 0.07 0.01 3.62
3 104510001 104530000 326 0.07 0.04 3.60
3 28500001 28520000 218 0.07 0.04 3.59
3 66480001 66500000 291 0.07 0.05 3.58
3 31150001 31170000 247 0.07 0.04 3.58
3 51440001 51460000 153 0.07 0.05 3.57
3 51610001 51630000 60 0.07 0.06 3.55
3 68340001 68360000 213 0.07 0.05 3.55
3 34230001 34250000 167 0.07 0.04 3.53
3 103810001 103830000 107 0.06 0.04 3.48
3 36380001 36400000 111 0.06 0.05 3.48
3 68980001 69000000 308 0.06 0.05 3.47
4 88340001 88360000 32 0.10 0.10 4.77
4 88330001 88350000 92 0.09 0.09 4.72
4 63150001 63170000 29 0.09 0.09 4.69
4 52680001 52700000 96 0.09 0.06 4.68
4 45650001 45670000 335 0.09 0.06 4.67
4 52690001 52710000 110 0.09 0.04 4.57
4 88320001 88340000 157 0.09 0.09 4.48
4 45660001 45680000 436 0.08 0.06 4.30

337
Chr Window start Window end SNP(N) Weighted Fst Mean Fst ZFst
4 58820001 58840000 125 0.08 0.05 4.26
4 52670001 52690000 141 0.08 0.06 4.19
4 58830001 58850000 135 0.08 0.03 3.98
4 63160001 63180000 146 0.07 0.06 3.87
4 88270001 88290000 171 0.07 0.06 3.75
4 45540001 45560000 122 0.07 0.05 3.61
4 52660001 52680000 134 0.07 0.03 3.52
4 58810001 58830000 207 0.06 0.04 3.47
5 32440001 32460000 178 0.15 0.14 7.03
5 32430001 32450000 141 0.15 0.13 6.90
5 32450001 32470000 167 0.14 0.12 6.42
5 29440001 29460000 214 0.11 0.07 5.55
5 29420001 29440000 185 0.11 0.06 5.39
5 29450001 29470000 219 0.10 0.06 5.04
5 29430001 29450000 205 0.10 0.06 4.93
5 34670001 34690000 203 0.10 0.06 4.81
5 32420001 32440000 129 0.10 0.06 4.81
5 36370001 36390000 220 0.09 0.05 4.64
5 29410001 29430000 192 0.09 0.05 4.57
5 33590001 33610000 55 0.09 0.06 4.54
5 34680001 34700000 255 0.09 0.05 4.36
5 36340001 36360000 193 0.09 0.06 4.34
5 32020001 32040000 36 0.08 0.08 4.23
5 36350001 36370000 236 0.08 0.05 4.05
5 34480001 34500000 295 0.08 0.06 4.04
5 34470001 34490000 236 0.08 0.06 4.01
5 35850001 35870000 148 0.08 0.06 3.93
5 33570001 33590000 121 0.07 0.04 3.93
5 29050001 29070000 137 0.07 0.05 3.90
5 36360001 36380000 213 0.07 0.04 3.83
5 37290001 37310000 200 0.07 0.02 3.83
5 33500001 33520000 142 0.07 0.06 3.81
5 33580001 33600000 53 0.07 0.04 3.80
5 37160001 37180000 209 0.07 0.04 3.79
5 34400001 34420000 292 0.07 0.05 3.77
5 32460001 32480000 113 0.07 0.04 3.69
5 29310001 29330000 350 0.07 0.04 3.65
5 33600001 33620000 77 0.07 0.04 3.59
5 31990001 32010000 107 0.07 0.06 3.57
5 34450001 34470000 286 0.06 0.05 3.50
5 29320001 29340000 288 0.06 0.03 3.49
5 42870001 42890000 206 0.06 0.02 3.49
5 33920001 33940000 214 0.06 0.05 3.47
5 31240001 31260000 104 0.06 0.05 3.46
6 23770001 23790000 168 0.07 0.05 3.53

338
Chr Window start Window end SNP(N) Weighted Fst Mean Fst ZFst
7 6590001 6610000 94 0.17 0.13 7.73
7 6580001 6600000 147 0.13 0.08 6.03
7 6620001 6640000 217 0.13 0.09 5.98
7 9640001 9660000 242 0.12 0.08 5.95
7 10740001 10760000 117 0.12 0.11 5.73
7 6630001 6650000 188 0.12 0.07 5.69
7 6540001 6560000 210 0.12 0.08 5.69
7 6550001 6570000 235 0.12 0.08 5.68
7 9670001 9690000 149 0.12 0.08 5.61
7 6740001 6760000 29 0.11 0.07 5.50
7 10160001 10180000 300 0.11 0.08 5.26
7 6730001 6750000 21 0.10 0.05 5.13
7 25250001 25270000 155 0.10 0.08 5.08
7 31490001 31510000 108 0.10 0.11 5.07
7 8830001 8850000 40 0.10 0.09 4.93
7 6530001 6550000 93 0.10 0.05 4.75
7 9650001 9670000 254 0.09 0.04 4.70
7 31480001 31500000 50 0.09 0.10 4.59
7 25240001 25260000 111 0.09 0.07 4.53
7 10730001 10750000 221 0.09 0.06 4.51
7 10150001 10170000 322 0.09 0.07 4.41
7 9990001 10010000 245 0.09 0.07 4.39
7 9660001 9680000 220 0.09 0.04 4.35
7 25190001 25210000 117 0.09 0.08 4.34
7 25260001 25280000 138 0.08 0.05 4.29
7 6560001 6580000 188 0.08 0.05 4.27
7 10080001 10100000 307 0.08 0.06 4.26
7 6610001 6630000 191 0.08 0.05 4.20
7 11300001 11320000 372 0.08 0.06 4.18
7 6690001 6710000 43 0.08 0.04 4.18
7 5020001 5040000 160 0.08 0.06 4.18
7 13350001 13370000 226 0.08 0.05 4.18
7 9680001 9700000 329 0.08 0.05 4.04
7 6720001 6740000 23 0.08 0.03 4.04
7 9980001 10000000 288 0.08 0.07 3.95
7 13360001 13380000 214 0.08 0.05 3.94
7 25200001 25220000 169 0.07 0.06 3.91
7 25180001 25200000 64 0.07 0.07 3.89
7 11310001 11330000 325 0.07 0.05 3.87
7 25940001 25960000 217 0.07 0.04 3.80
7 9910001 9930000 164 0.07 0.06 3.80
7 6520001 6540000 116 0.07 0.04 3.79
7 6710001 6730000 28 0.07 0.03 3.76
7 13340001 13360000 213 0.07 0.04 3.71
7 5960001 5980000 279 0.07 0.04 3.69

339
Chr Window start Window end SNP(N) Weighted Fst Mean Fst ZFst
7 5140001 5160000 337 0.07 0.05 3.67
7 9950001 9970000 298 0.07 0.05 3.66
7 10450001 10470000 208 0.07 0.04 3.66
7 4680001 4700000 255 0.07 0.04 3.66
7 10700001 10720000 302 0.07 0.05 3.66
7 6440001 6460000 222 0.07 0.04 3.65
7 10090001 10110000 356 0.07 0.05 3.61
7 25950001 25970000 109 0.07 0.05 3.61
7 9870001 9890000 280 0.07 0.05 3.59
7 9360001 9380000 171 0.07 0.03 3.59
7 10170001 10190000 310 0.07 0.05 3.57
7 4670001 4690000 200 0.07 0.04 3.56
7 25270001 25290000 154 0.07 0.04 3.53
7 9860001 9880000 259 0.06 0.05 3.51
7 9940001 9960000 298 0.06 0.05 3.51
7 10140001 10160000 338 0.06 0.05 3.48
7 9740001 9760000 87 0.06 0.02 3.46
8 1950001 1970000 175 0.16 0.11 7.44
8 1960001 1980000 140 0.15 0.11 7.15
8 1940001 1960000 138 0.15 0.11 7.09
8 1970001 1990000 93 0.12 0.08 5.62
8 26770001 26790000 52 0.11 0.10 5.21
8 26760001 26780000 60 0.10 0.08 4.79
8 26750001 26770000 118 0.09 0.08 4.59
8 26780001 26800000 159 0.09 0.07 4.50
8 1860001 1880000 189 0.09 0.06 4.50
8 21510001 21530000 213 0.09 0.05 4.35
8 21520001 21540000 191 0.08 0.05 4.26
8 26740001 26760000 204 0.08 0.07 4.20
8 1590001 1610000 25 0.08 0.07 4.16
8 23180001 23200000 259 0.07 0.05 3.87
8 23170001 23190000 251 0.07 0.05 3.83
8 23200001 23220000 193 0.07 0.05 3.82
8 23390001 23410000 165 0.07 0.06 3.61
8 23190001 23210000 203 0.06 0.04 3.50
9 9410001 9430000 209 0.16 0.11 7.30
9 12320001 12340000 171 0.15 0.14 6.87
9 12310001 12330000 201 0.14 0.12 6.74
9 12420001 12440000 120 0.14 0.11 6.45
9 9400001 9420000 287 0.12 0.07 5.79
9 12330001 12350000 184 0.12 0.09 5.59
9 12780001 12800000 262 0.11 0.08 5.53
9 12770001 12790000 109 0.11 0.07 5.40
9 12360001 12380000 135 0.11 0.07 5.17
9 11750001 11770000 349 0.11 0.09 5.16

340
Chr Window start Window end SNP(N) Weighted Fst Mean Fst ZFst
9 11740001 11760000 311 0.10 0.09 5.15
9 11720001 11740000 303 0.10 0.09 5.10
9 12340001 12360000 261 0.10 0.07 5.10
9 12430001 12450000 178 0.10 0.09 5.09
9 12110001 12130000 184 0.10 0.06 5.04
9 11730001 11750000 271 0.10 0.09 5.04
9 11710001 11730000 371 0.10 0.08 4.81
9 9180001 9200000 177 0.10 0.07 4.81
9 12350001 12370000 194 0.10 0.07 4.79
9 11690001 11710000 305 0.09 0.08 4.66
9 6770001 6790000 216 0.09 0.08 4.63
9 12100001 12120000 171 0.09 0.07 4.58
9 12410001 12430000 71 0.09 0.09 4.54
9 12370001 12390000 224 0.09 0.06 4.49
9 11700001 11720000 358 0.09 0.08 4.47
9 12390001 12410000 50 0.09 0.08 4.44
9 11680001 11700000 255 0.09 0.09 4.40
9 10340001 10360000 243 0.09 0.04 4.38
9 9420001 9440000 209 0.08 0.04 4.29
9 12790001 12810000 280 0.08 0.06 4.29
9 10680001 10700000 273 0.08 0.07 4.23
9 6440001 6460000 233 0.08 0.05 4.22
9 12010001 12030000 175 0.08 0.07 4.21
9 9170001 9190000 126 0.08 0.05 4.20
9 12380001 12400000 187 0.08 0.06 4.06
9 9320001 9340000 203 0.08 0.07 4.03
9 6450001 6470000 274 0.08 0.05 4.02
9 6910001 6930000 99 0.08 0.05 3.97
9 11760001 11780000 277 0.08 0.08 3.95
9 4020001 4040000 213 0.07 0.07 3.92
9 10690001 10710000 268 0.07 0.05 3.85
9 9190001 9210000 247 0.07 0.06 3.84
9 9330001 9350000 199 0.07 0.07 3.84
9 8050001 8070000 265 0.07 0.04 3.75
9 9590001 9610000 268 0.07 0.05 3.72
9 9580001 9600000 274 0.07 0.04 3.69
9 6780001 6800000 273 0.07 0.06 3.68
9 9360001 9380000 290 0.07 0.05 3.66
9 8820001 8840000 200 0.07 0.06 3.65
9 6490001 6510000 144 0.07 0.04 3.65
9 9270001 9290000 355 0.07 0.05 3.64
9 4030001 4050000 221 0.07 0.05 3.64
9 9830001 9850000 231 0.07 0.05 3.63
9 9800001 9820000 148 0.07 0.07 3.63
9 8810001 8830000 193 0.07 0.06 3.58

341
Chr Window start Window end SNP(N) Weighted Fst Mean Fst ZFst
9 6800001 6820000 285 0.07 0.05 3.57
9 13800001 13820000 293 0.07 0.05 3.56
9 9280001 9300000 342 0.07 0.05 3.54
9 24030001 24050000 98 0.07 0.06 3.54
9 9300001 9320000 238 0.06 0.05 3.52
9 6760001 6780000 172 0.06 0.06 3.51
9 8040001 8060000 242 0.06 0.03 3.50
9 6400001 6420000 138 0.06 0.04 3.50
9 24040001 24060000 82 0.06 0.05 3.47
10 16110001 16130000 125 0.07 0.03 3.82
10 15560001 15580000 133 0.07 0.07 3.77
11 13540001 13560000 71 0.12 0.11 5.67
11 13530001 13550000 30 0.12 0.11 5.67
11 1550001 1570000 353 0.10 0.04 5.00
11 13550001 13570000 99 0.10 0.09 4.91
11 1540001 1560000 373 0.07 0.01 3.61
11 1020001 1040000 365 0.07 0.03 3.60
11 1560001 1580000 231 0.07 0.03 3.55
12 15700001 15720000 230 0.09 0.05 4.44
12 9640001 9660000 157 0.09 0.08 4.38
12 15710001 15730000 251 0.09 0.04 4.34
12 15690001 15710000 192 0.07 0.03 3.81
12 9630001 9650000 190 0.07 0.06 3.76
13 17640001 17660000 109 0.07 0.07 3.93
13 17650001 17670000 75 0.07 0.07 3.92
13 17670001 17690000 120 0.07 0.07 3.90
13 17660001 17680000 90 0.07 0.07 3.85
13 17680001 17700000 142 0.07 0.07 3.78
13 2100001 2120000 113 0.07 0.05 3.72
13 17630001 17650000 139 0.07 0.06 3.61
15 11010001 11030000 264 0.07 0.04 3.70
17 4620001 4640000 225 0.07 0.04 3.54
22 1660001 1680000 98 0.12 0.09 5.77
22 520001 540000 27 0.12 0.06 5.59
22 510001 530000 28 0.11 0.07 5.29
22 1650001 1670000 147 0.10 0.07 5.09
22 940001 960000 24 0.10 0.06 4.79
22 780001 800000 36 0.09 0.04 4.42
22 950001 970000 24 0.08 0.06 4.27
22 580001 600000 25 0.08 0.05 4.26
22 1250001 1270000 55 0.07 0.04 3.60
22 1830001 1850000 72 0.07 0.04 3.59
23 4930001 4950000 189 0.07 0.05 3.81
24 6040001 6060000 147 0.13 0.07 6.03
24 6050001 6070000 104 0.11 0.09 5.43

342
Chr Window start Window end SNP(N) Weighted Fst Mean Fst ZFst
24 4550001 4570000 242 0.11 0.07 5.39
24 6030001 6050000 188 0.11 0.07 5.33
24 6210001 6230000 148 0.11 0.07 5.18
24 5820001 5840000 212 0.10 0.09 5.11
24 5810001 5830000 259 0.10 0.07 4.88
24 5800001 5820000 286 0.09 0.05 4.73
24 4560001 4580000 197 0.09 0.05 4.43
24 5790001 5810000 269 0.09 0.06 4.41
24 5770001 5790000 124 0.09 0.07 4.38
24 5860001 5880000 182 0.09 0.06 4.35
24 5110001 5130000 160 0.08 0.06 4.14
24 6200001 6220000 148 0.08 0.06 4.08
24 6060001 6080000 92 0.08 0.05 3.97
24 5050001 5070000 150 0.07 0.05 3.83
24 6220001 6240000 184 0.07 0.02 3.75
24 5830001 5850000 187 0.07 0.07 3.74
24 5850001 5870000 135 0.07 0.06 3.72
24 5120001 5140000 176 0.07 0.05 3.72
24 5780001 5800000 203 0.07 0.05 3.67
24 5760001 5780000 146 0.07 0.07 3.61
24 4540001 4560000 287 0.07 0.04 3.52
24 4630001 4650000 214 0.06 0.03 3.51
27 5480001 5500000 25 0.09 0.10 4.65
27 5540001 5560000 28 0.08 0.10 4.30
27 5470001 5490000 25 0.08 0.06 4.25
27 5530001 5550000 28 0.07 0.09 3.74
28 3730001 3750000 148 0.11 0.08 5.24
28 4800001 4820000 24 0.10 0.09 4.89
28 3720001 3740000 87 0.09 0.08 4.62
28 4790001 4810000 32 0.09 0.08 4.61
28 3740001 3760000 215 0.09 0.06 4.47
28 3840001 3860000 124 0.08 0.06 4.15
28 3600001 3620000 224 0.08 0.06 4.14
28 2820001 2840000 258 0.08 0.05 4.10
28 4780001 4800000 30 0.08 0.06 4.02
28 2830001 2850000 209 0.08 0.04 4.00
28 4810001 4830000 27 0.08 0.06 3.98
28 3710001 3730000 96 0.08 0.06 3.96
28 4860001 4880000 32 0.07 0.05 3.90
28 3610001 3630000 203 0.07 0.05 3.80
28 3630001 3650000 201 0.07 0.05 3.70
28 2700001 2720000 206 0.07 0.04 3.68
28 4920001 4940000 23 0.07 0.04 3.67
28 4850001 4870000 32 0.07 0.04 3.62
28 3620001 3640000 245 0.07 0.04 3.57

343
Chr Window start Window end SNP(N) Weighted Fst Mean Fst ZFst
28 4870001 4890000 27 0.06 0.05 3.50
28 3850001 3870000 153 0.06 0.04 3.48
Chr = Chromosome; N= count

344
Table S 60. List of candidate genes in Improved Horro and Local Horro.
Chr Gene stable ID Gene start (bp) Gene end (bp) Gene name Gene type
1 ENSGALG00000016185 109473644 109505549 SLC37A1 protein
coding 1 ENSGALG00000026573 113257661 113257760
miRNA
1 ENSGALG00000042604 117839213 117843292 ARX protein
coding 1 ENSGALG00000016055 107539724 107541289 KCNJ15 protein
coding 1 ENSGALG00000025698 101037458 101037610 RF00002 rRNA
1 ENSGALG00000036114 704038 711778 SMO protein
coding 1 ENSGALG00000045818 105394214 105399695
protein
coding 1 ENSGALG00000016268 113403070 113433885
protein
coding 1 ENSGALG00000016058 107579587 107693888 ERG protein
coding 1 ENSGALG00000045430 113452551 113458229
protein
coding 1 ENSGALG00000019261 69904874 69982240 ARHGAP8 protein
coding 1 ENSGALG00000016286 115794507 115795376 CXorf21 protein
coding 1 ENSGALG00000044858 115843688 115847698
protein
coding 1 ENSGALG00000030506 77815472 77816407
protein
coding 1 ENSGALG00000016285 115734786 115768467
protein
coding 1 ENSGALG00000015495 92852810 92868421 POU1F1 protein
coding 1 ENSGALG00000016323 118089639 118139548 PDK3 protein
coding 1 ENSGALG00000012791 55806774 56041222 TBXAS1 protein
coding 1 ENSGALG00000015355 87434456 87455171 CD47 protein
coding 1 ENSGALG00000014213 69763115 69848437 PRR5 protein
coding 1 ENSGALG00000014689 77586269 77592786 FAM131B protein
coding 1 ENSGALG00000016251 112766328 112855804
protein
coding 1 ENSGALG00000033692 113630516 113665856
protein
coding 1 ENSGALG00000016345 118238433 118307972 KLHL15 protein
coding 1 ENSGALG00000016144 108944327 108958350 TMPRSS2 protein
coding 1 ENSGALG00000042515 113494211 113499362
protein
coding 1 ENSGALG00000045035 931381 933117
protein
coding 1 ENSGALG00000042121 118079947 118080147
protein
coding 1 ENSGALG00000016318 118051229 118071937 PCYT1B protein
coding 1 ENSGALG00000006489 2002525 2187486 CHCHD3 protein
coding 1 ENSGALG00000016281 114486908 115483002 DMD protein
coding 1 ENSGALG00000022813 109599316 109606438 NDUFV3 protein
coding 1 ENSGALG00000016187 109577831 109599269 WDR4 protein
coding 1 ENSGALG00000015496 92870771 92882303 CHMP2B protein
coding 1 ENSGALG00000029670 105440356 105461262 CRYZL1 protein
coding 1 ENSGALG00000036677 105492244 105575073 ITSN1 protein
coding 1 ENSGALG00000015258 84531130 84573579 DCBLD2 protein
coding 1 ENSGALG00000014234 70660407 70756330 ATXN10 protein
coding 1 ENSGALG00000045979 101040149 101040594
protein
coding 1 ENSGALG00000039711 101041201 101041500
protein
coding 1 ENSGALG00000032978 1213840 1214346 UCN3 protein
coding 1 ENSGALG00000016312 117847142 118037119 POLA1 protein
coding 1 ENSGALG00000015353 87305099 87349328 BBX protein
coding 1 ENSGALG00000038169 101040919 101041077
protein
coding 1 ENSGALG00000014232 70491928 70505475 RIBC2 protein
coding

345
Chr Gene stable ID Gene start (bp) Gene end (bp) Gene name Gene type
1 ENSGALG00000033199 105330816 105350209
protein
coding 1 ENSGALG00000015271 84737375 84814326
protein
coding 1 ENSGALG00000022819 108164030 108196164 PCP4 protein
coding 1 ENSGALG00000040609 78216893 78220222
protein
coding 1 ENSGALG00000034932 108844363 108894770 BACE2 protein
coding 1 ENSGALG00000014746 77904803 77933908
protein
coding 1 ENSGALG00000016236 112079778 112151195
protein
coding 1 ENSGALG00000031890 78318610 78343166 YBX3 protein
coding 1 ENSGALG00000016138 108236302 108412621 DSCAM protein
coding 1 ENSGALG00000037076 105352798 105389904 GART protein
coding 1 ENSGALG00000016265 113222082 113251614 LANCL3 protein
coding 1 ENSGALG00000014233 70545573 70627591 FBLN1 protein
coding 1 ENSGALG00000016266 113283937 113314035 PRRG1 protein
coding 1 ENSGALG00000038649 105433842 105439140 DONSON protein
coding 1 ENSGALG00000035096 105406560 105430638
protein
coding 1 ENSGALG00000027198 113937248 113961367 TMEM47 protein
coding 1 ENSGALG00000014754 78077450 78225862
protein
coding 1 ENSGALG00000014227 70416011 70422094 UPK3A protein
coding 1 ENSGALG00000044332 89540456 89541604
protein
coding 1 ENSGALG00000036140 925136 930918
protein
coding 1 ENSGALG00000016052 107063968 107080263 VPS26C protein
coding 1 ENSGALG00000040488 113326215 113331457
protein
coding 1 ENSGALG00000016287 115909469 115911505 NR0B1 protein
coding 1 ENSGALG00000014749 77978178 78032477 EPHB6 protein
coding 1 ENSGALG00000016050 107001974 107060482 TTC3 protein
coding 1 ENSGALG00000014228 70455565 70491589 SMC1B protein
coding 1 ENSGALG00000008036 933552 945389 TMEM209 protein
coding 1 ENSGALG00000016288 116055337 116671490 IL1RAPL1 protein
coding 1 ENSGALG00000044129 117435791 117441378
protein
coding 1 ENSGALG00000015519 96895939 97053385 ROBO2 protein
coding 1 ENSGALG00000023942 947930 951486
protein
coding 1 ENSGALG00000017106 176737697 177046618 ATP8A2 protein
coding 1 ENSGALG00000046179 70310954 70375330
lincRNA
1 ENSGALG00000046340 77450263 77461548
lincRNA
1 ENSGALG00000032654 78268586 78290816
lincRNA
1 ENSGALG00000033000 101034873 101074782
lincRNA
1 ENSGALG00000043418 105578706 105580665
lincRNA
1 ENSGALG00000031795 112688883 112696578
lincRNA
1 ENSGALG00000041297 113387301 113390563
lincRNA
1 ENSGALG00000038250 115098166 115101343
lincRNA
1 ENSGALG00000035313 116733214 116733791
lincRNA
2 ENSGALG00000033254 129000072 129034245 SPAG1 protein
coding 2 ENSGALG00000041043 131615461 131620601 ABRA protein
coding 2 ENSGALG00000027894 127449716 127449795
miRNA
2 ENSGALG00000040325 132351058 132385978 EMC2 protein
coding 2 ENSGALG00000037997 128915167 128970668 RGS22 protein
coding 2 ENSGALG00000029983 131784819 131949415 ANGPT1 protein
coding

346
Chr Gene stable ID Gene start (bp) Gene end (bp) Gene name Gene type
2 ENSGALG00000025532 131521313 131521398 gga-mir-
1813-1
miRNA
2 ENSGALG00000038022 144646756 144875068 COL22A1 protein
coding 2 ENSGALG00000039011 130564107 130592497 DPYS protein
coding 2 ENSGALG00000031387 129241561 129267480 YWHAZ protein
coding 2 ENSGALG00000033438 144239804 144239910
miRNA
2 ENSGALG00000034618 130034484 130057124 DCAF13 protein
coding 2 ENSGALG00000040921 129686126 129700944 RRM2B protein
coding 2 ENSGALG00000041200 129336386 129343185 ZNF706 protein
coding 2 ENSGALG00000030030 132121027 132231350 RSPO2 protein
coding 2 ENSGALG00000038772 129040782 129061227 RNF19A protein
coding 2 ENSGALG00000041445 129153464 129170102
protein
coding 2 ENSGALG00000031578 133691901 134258240 CSMD3 protein
coding 2 ENSGALG00000030322 42336011 42350205
protein
coding 2 ENSGALG00000041553 132477229 132478179 TMEM74 protein
coding 2 ENSGALG00000039533 141406000 141466443 EFR3A protein
coding 2 ENSGALG00000043415 42357024 42375913
protein
coding 2 ENSGALG00000030280 129199347 129213966 PABPC1 protein
coding 2 ENSGALG00000040879 132583137 132607011 NUDCD1 protein
coding 2 ENSGALG00000039013 135959509 136122463 EXT1 protein
coding 2 ENSGALG00000033630 130599464 130659121 LRP12 protein
coding 2 ENSGALG00000030128 141470034 141488999
protein
coding 2 ENSGALG00000031282 129708232 129786771 UBR5 protein
coding 2 ENSGALG00000036618 132606889 132612643 ENY2 protein
coding 2 ENSGALG00000034099 129894934 129916432 ATP6V1C1 protein
coding 2 ENSGALG00000040256 130153028 130517067 RIMS2 protein
coding 2 ENSGALG00000009686 23744767 23815855
protein
coding 2 ENSGALG00000033351 130013430 130018289 CTHRC1 protein
coding 2 ENSGALG00000035761 22663994 22676382
protein
coding 2 ENSGALG00000040079 130901436 131209122 ZFPM2 protein
coding 2 ENSGALG00000039831 144356967 144479127 FAM135B protein
coding 2 ENSGALG00000037687 129435468 129485773 GRHL2 protein
coding 2 ENSGALG00000040891 20027818 20125211 RSU1 protein
coding 2 ENSGALG00000039882 130019558 130034422 SLC25A32 protein
coding 2 ENSGALG00000042182 131549781 131579894 OXR1 protein
coding 2 ENSGALG00000032518 129501286 129543306 NCALD protein
coding 2 ENSGALG00000032504 131588439 131609614
protein
coding 2 ENSGALG00000039843 128974062 128976455
lincRNA
2 ENSGALG00000037317 129214619 129215026
lincRNA
2 ENSGALG00000039449 130862553 130864296
lincRNA
2 ENSGALG00000043785 131145205 131154767
lincRNA
2 ENSGALG00000030036 133259610 133653226
lincRNA
2 ENSGALG00000044971 134267681 134321609
lincRNA
3 ENSGALG00000016500 104621983 104668401 FKBP1B protein
coding 3 ENSGALG00000010435 31145552 31183812 RASGRP3 protein
coding 3 ENSGALG00000010541 31572475 31748573 BIRC6 protein
coding 3 ENSGALG00000039575 66496131 66511020 AMD1 protein
coding 3 ENSGALG00000010341 30965058 30992748 XPO5 protein
coding

347
Chr Gene stable ID Gene start (bp) Gene end (bp) Gene name Gene type
3 ENSGALG00000010448 31210825 31393401 LTBP1 protein
coding 3 ENSGALG00000013683 51335816 51624319 ARID1B protein
coding 3 ENSGALG00000010349 30993718 30997091 POLR1C protein
coding 3 ENSGALG00000037872 104447300 104516627 ATAD2B protein
coding 3 ENSGALG00000015387 68405534 68477842 ATG5 protein
coding 3 ENSGALG00000016497 104524268 104541302 UBXN2A protein
coding 3 ENSGALG00000015405 68876701 69004270 PREP protein
coding 3 ENSGALG00000031427 36312761 36477609 FMN2 protein
coding 3 ENSGALG00000013505 49318532 49488810
protein
coding 3 ENSGALG00000011098 40214428 40230986 TAF5L protein
coding 3 ENSGALG00000015410 69051906 69078558 BVES protein
coding 3 ENSGALG00000016498 104544323 104575302 MFSD2B protein
coding 3 ENSGALG00000015345 68326420 68390064
protein
coding 3 ENSGALG00000019867 104581179 104588806 WDCP protein
coding 3 ENSGALG00000016499 104597130 104611882
protein
coding 3 ENSGALG00000010538 31444899 31547261 TTC27 protein
coding 3 ENSGALG00000010290 30739147 30759022 VEGFA protein
coding 3 ENSGALG00000041037 30997145 31002240 YIPF3 protein
coding 3 ENSGALG00000029553 28447222 28667979
lincRNA
3 ENSGALG00000036544 28450739 28526039
lincRNA
4 ENSGALG00000043675 45520827 45620890 ANTXR2 protein
coding 4 ENSGALG00000015966 88306184 88383710
protein
coding 4 ENSGALG00000012216 58732964 58968719 BMPR1B protein
coding 4 ENSGALG00000013590 63176150 63184079
protein
coding 5 ENSGALG00000044423 34491589 34492617
protein
coding 5 ENSGALG00000010088 36275772 36390043 RALGAPA1 protein
coding 5 ENSGALG00000027121 34499921 34500032
miRNA
5 ENSGALG00000043908 29050505 29056371
protein
coding 5 ENSGALG00000009946 34359921 34412246 HECTD1 protein
coding 5 ENSGALG00000010118 37030439 37188796 MIPOL1 protein
coding 5 ENSGALG00000009587 29066545 29333320 GPHN protein
coding 5 ENSGALG00000009847 32441311 32495180 STXBP6 protein
coding 5 ENSGALG00000039118 31240857 31409344 MEIS2 protein
coding 5 ENSGALG00000031586 34471731 34492378
protein
coding 5 ENSGALG00000020438 31996234 32173952 DPH6 protein
coding 5 ENSGALG00000009900 33848550 33962481 PRKD1 protein
coding 5 ENSGALG00000014537 29410988 29430989 BMF protein
coding 6 ENSGALG00000008281 23723779 23800324 NEURL1 protein
coding 6 ENSGALG00000008265 23612168 23824013
protein
coding 7 ENSGALG00000025571 6580437 6580522 gga-mir-
1845
miRNA
7 ENSGALG00000037678 9698247 9701468
protein
coding 7 ENSGALG00000007958 10009681 10029718 GTF3C3 protein
coding 7 ENSGALG00000020876 11289758 11332344 AOX2 protein
coding 7 ENSGALG00000004394 6693921 6709659 PCBP3 protein
coding 7 ENSGALG00000004302 6535126 6575704 NDUFA10 protein
coding 7 ENSGALG00000007841 9683028 9794746 DNAH7 protein
coding 7 ENSGALG00000042117 4668050 4670981
protein
coding

348
Chr Gene stable ID Gene start (bp) Gene end (bp) Gene name Gene type
7 ENSGALG00000021031 5036416 5041363 ACKR3 protein
coding 7 ENSGALG00000003980 5085191 5163120 IQCA1 protein
coding 7 ENSGALG00000007777 9564789 9679908 SLC39A10 protein
coding 7 ENSGALG00000003862 4682652 4717918
protein
coding 7 ENSGALG00000005974 6723053 6744124 COL6A1 protein
coding 7 ENSGALG00000023742 6580483 6603208 AHR2 protein
coding 7 ENSGALG00000011630 25930783 26109391 GLI2 protein
coding 7 ENSGALG00000007996 10074592 10185212 ANKRD44 protein
coding 7 ENSGALG00000004272 5973865 5983496 ASB1 protein
coding 7 ENSGALG00000007944 9831319 9937960 HECW2 protein
coding 7 ENSGALG00000038311 6633230 6662722 COL18A1 protein
coding 7 ENSGALG00000004322 6604479 6617381 AHR1B protein
coding 7 ENSGALG00000043345 8756092 8880668
lincRNA
7 ENSGALG00000033329 9273897 9443440
lincRNA
7 ENSGALG00000035909 9641479 9643660
lincRNA
8 ENSGALG00000045609 26758266 26759747
protein
coding 8 ENSGALG00000011413 26796821 26810573
protein
coding 8 ENSGALG00000036909 22774073 23612126 AGBL4 protein
coding 8 ENSGALG00000010335 21504570 21529508
protein
coding 8 ENSGALG00000011394 26763424 26794681 CYP2J23 protein
coding 8 ENSGALG00000010889 26728370 26751231 HOOK1 protein
coding 8 ENSGALG00000002182 1592876 1687096 NR5A2 protein
coding 9 ENSGALG00000002963 9846033 9924167 PID1 protein
coding 9 ENSGALG00000040598 12336436 12336545 gga-mir-
6611
miRNA
9 ENSGALG00000038612 9384943 9430089 COL4A3 protein
coding 9 ENSGALG00000006241 24033681 24037038
protein
coding 9 ENSGALG00000038512 12398415 12430615 AGTR1 protein
coding 9 ENSGALG00000038446 12791624 12817886 XXYLT1 protein
coding 9 ENSGALG00000006843 12448872 12485514 NCBP2 protein
coding 9 ENSGALG00000004957 9276974 9300051 RHBDD1 protein
coding 9 ENSGALG00000035535 24044046 24059098 GYG1 protein
coding 9 ENSGALG00000025759 10338213 10382351 TFDP2 protein
coding 9 ENSGALG00000003079 9434454 9456535 MFF protein
coding 9 ENSGALG00000007040 12721876 12778586 ACAP2 protein
coding 9 ENSGALG00000005217 8038070 8049501 MOGAT1 protein
coding 9 ENSGALG00000043175 9308914 9310262
protein
coding 9 ENSGALG00000004946 9318986 9370173
protein
coding 9 ENSGALG00000040089 24002562 24031230 HPS3 protein
coding 9 ENSGALG00000034507 10685168 10685803 CHST2 protein
coding 9 ENSGALG00000004966 8727389 8844775 NYAP2 protein
coding 9 ENSGALG00000005283 6763875 6794340 SLC25A36 protein
coding 9 ENSGALG00000045497 6794703 6804886
protein
coding 9 ENSGALG00000002974 9572308 9638300 SPHKAP protein
coding 9 ENSGALG00000029102 6796763 6897692 PXYLP1 protein
coding 9 ENSGALG00000041879 9200204 9244990
lincRNA
9 ENSGALG00000040423 9836593 9841383
lincRNA
9 ENSGALG00000030000 10355033 10369237
lincRNA

349
Chr Gene stable ID Gene start (bp) Gene end (bp) Gene name Gene type
9 ENSGALG00000032040 10685845 10687118
lincRNA
9 ENSGALG00000043388 10702824 10777782
lincRNA
9 ENSGALG00000034521 12099991 12132543
lincRNA
11 ENSGALG00000001647 1010935 1031465 PSKH1 protein
coding 11 ENSGALG00000035368 1036239 1037901 CTRL protein
coding 11 ENSGALG00000002356 1571363 1573654 CMTR2 protein
coding 11 ENSGALG00000026903 1547073 1551636 CALB2 protein
coding 11 ENSGALG00000044146 1554680 1560904 PNP protein
coding 11 ENSGALG00000001702 1039643 1046923 EXOC3L1 protein
coding 11 ENSGALG00000002321 1534043 1544632 GOT2 protein
coding 12 ENSGALG00000032736 9622177 9678239 MGLL protein
coding 12 ENSGALG00000007741 15680951 15722117 MDFIC2 protein
coding 13 ENSGALG00000007404 17642827 17649925 YIPF5 protein
coding 13 ENSGALG00000012322 17658234 17692276 KCTD16 protein
coding 13 ENSGALG00000037523 17650088 17655423
lincRNA
15 ENSGALG00000008051 10983392 11057802 MTMR3 protein
coding 22 ENSGALG00000043405 531919 545332 BNIP3L protein
coding 22 ENSGALG00000001608 1798072 1927838 UNC5D protein
coding 22 ENSGALG00000000235 551092 584895 PPP2R2A protein
coding 22 ENSGALG00000036854 1250416 1257995 R3HCC1 protein
coding 22 ENSGALG00000000409 1264837 1273235 CHMP7 protein
coding 22 ENSGALG00000000314 952291 957139 NEFL protein
coding 22 ENSGALG00000000317 961851 965751 NEFM protein
coding 23 ENSGALG00000018302 4947355 4947443 gga-mir-
30c-1
miRNA
23 ENSGALG00000018301 4946132 4946227 gga-mir-30e miRNA
23 ENSGALG00000003189 4927211 4955061 NFYC protein
coding 24 ENSGALG00000007017 4561032 4564457 RBM7 protein
coding 24 ENSGALG00000032467 6200315 6206582 C11orf52 protein
coding 24 ENSGALG00000040842 6209231 6210762 HSPB2 protein
coding 24 ENSGALG00000007144 5115506 5186106 SIK3 protein
coding 24 ENSGALG00000007945 6212347 6216461 CRYAB protein
coding 24 ENSGALG00000007950 6217278 6218903 C11orf1 protein
coding 24 ENSGALG00000007967 6220268 6224769 FDXACB1 protein
coding 24 ENSGALG00000007833 5765420 5775028
protein
coding 24 ENSGALG00000021174 6226906 6251930
protein
coding 24 ENSGALG00000007114 5110448 5112102 APOA1 protein
coding 24 ENSGALG00000035980 4564832 4570788 REXO2 protein
coding 24 ENSGALG00000007839 5780707 5862536 NCAM1 protein
coding 24 ENSGALG00000037459 4559838 4560959
lincRNA
24 ENSGALG00000034862 6036961 6038353
lincRNA
27 ENSGALG00000002804 5549486 5564038 RND2 protein
coding 27 ENSGALG00000034345 5473594 5474209 COA3 protein
coding 27 ENSGALG00000046412 5494647 5500006
protein
coding 27 ENSGALG00000043285 5473787 5477716 CNTD1 protein
coding 27 ENSGALG00000033522 5499722 5504356
protein
coding 27 ENSGALG00000002973 5478574 5483356 BECN1 protein
coding 27 ENSGALG00000002937 5483514 5490234 PSME3 protein
coding

350
Chr Gene stable ID Gene start (bp) Gene end (bp) Gene name Gene type
27 ENSGALG00000032191 5462100 5472837 WNK4 protein
coding 27 ENSGALG00000044770 5532343 5534366
protein
coding 27 ENSGALG00000002818 5538068 5543804 VAT1 protein
coding 28 ENSGALG00000021722 3623171 3623258 gga-mir-9-1 miRNA
28 ENSGALG00000025492 3621530 3621611 gga-mir-
1565
miRNA
28 ENSGALG00000025443 3620263 3620333 gga-mir-
1621
miRNA
28 ENSGALG00000033270 3867485 3873055 KLHL26 protein
coding 28 ENSGALG00000034592 4813319 4843107
protein
coding 28 ENSGALG00000025809 3646007 3649991 TMEM161A protein
coding 28 ENSGALG00000044632 4869939 4874272
protein
coding 28 ENSGALG00000034271 4846978 4859149 UHRF1 protein
coding 28 ENSGALG00000003153 3739329 3744161 COPE protein
coding 28 ENSGALG00000001962 2817697 2846212 PTBP1 protein
coding 28 ENSGALG00000001342 2711394 2723081 HCN2 protein
coding 28 ENSGALG00000026850 4877060 4879564 TICAM1 protein
coding 28 ENSGALG00000003304 3825550 3857837 CRTC1 protein
coding 28 ENSGALG00000038529 2848507 2852387 PLPPR3 protein
coding 28 ENSGALG00000004168 4883400 4886316 FEM1A protein
coding 28 ENSGALG00000003130 3733488 3739178 DDX49 protein
coding 28 ENSGALG00000025766 3596017 3600340
protein
coding 28 ENSGALG00000004200 4925539 4944851 DPP9 protein
coding 28 ENSGALG00000037558 3608217 3609544
protein
coding 28 ENSGALG00000003160 3746346 3756801 CERS1 protein
coding 28 ENSGALG00000001328 2698084 2709095 BSG protein
coding 28 ENSGALG00000003161 3758227 3760332 GDF3 protein
coding 28 ENSGALG00000043371 3758353 3758688
protein
coding 28 ENSGALG00000003074 3704908 3725461 HOMER3 protein
coding 28 ENSGALG00000038755 3618921 3643301
lincRNA
28 ENSGALG00000043409 3727817 3728983
lincRNA
28 ENSGALG00000032462 4882319 4883273
lincRNA
28 ENSGALG00000038462 4914645 4923495 lincRNA
Chr = Chromosome; N= count

351
Table S 61. Top pairwise Fst values (1%) in Improved Horro and Jarso chickens.
Chr Window start Window end SNP (N) Weighted Fst Mean Fst ZFst
1 19420001 19440000 162 0.72 0.54 5.61
1 191090001 191110000 34 0.69 0.27 5.33
1 19410001 19430000 128 0.69 0.43 5.32
1 146780001 146800000 85 0.68 0.40 5.29
1 146770001 146790000 74 0.68 0.35 5.29
1 19430001 19450000 108 0.68 0.56 5.26
1 191130001 191150000 165 0.68 0.50 5.22
1 124200001 124220000 251 0.68 0.50 5.21
1 146790001 146810000 135 0.67 0.38 5.18
1 101180001 101200000 167 0.67 0.66 5.18
1 146810001 146830000 96 0.67 0.31 5.17
1 191100001 191120000 29 0.67 0.53 5.14
1 146760001 146780000 87 0.67 0.41 5.11
1 151690001 151710000 207 0.66 0.41 5.08
1 151680001 151700000 182 0.66 0.36 5.04
1 146800001 146820000 119 0.66 0.30 5.04
1 191140001 191160000 80 0.66 0.55 5.01
1 149050001 149070000 175 0.65 0.52 4.94
1 191120001 191140000 149 0.65 0.44 4.91
1 101150001 101170000 166 0.63 0.52 4.79
1 146820001 146840000 153 0.63 0.29 4.73
1 146990001 147010000 91 0.62 0.42 4.64
1 117150001 117170000 113 0.62 0.54 4.62
1 101160001 101180000 188 0.62 0.52 4.62
1 190870001 190890000 153 0.62 0.42 4.61
1 101190001 101210000 180 0.61 0.51 4.59
1 117140001 117160000 90 0.61 0.44 4.58
1 191110001 191130000 66 0.61 0.45 4.55
1 101170001 101190000 175 0.61 0.57 4.54
1 147080001 147100000 144 0.61 0.33 4.54
1 190880001 190900000 122 0.61 0.40 4.54
1 147110001 147130000 185 0.61 0.33 4.53
1 147090001 147110000 179 0.60 0.36 4.45
1 147100001 147120000 209 0.60 0.36 4.45
1 147990001 148010000 166 0.60 0.44 4.40
1 5240001 5260000 141 0.58 0.29 4.27
1 117130001 117150000 62 0.58 0.34 4.27
1 5210001 5230000 164 0.58 0.35 4.24
1 147960001 147980000 253 0.58 0.44 4.24
1 152810001 152830000 46 0.58 0.41 4.23
1 5220001 5240000 139 0.58 0.33 4.22
1 147980001 148000000 240 0.58 0.34 4.20
1 5230001 5250000 124 0.58 0.29 4.20

352
Chr Window start Window end SNP (N) Weighted Fst Mean Fst ZFst
1 35320001 35340000 262 0.57 0.40 4.19
1 147070001 147090000 175 0.57 0.36 4.16
1 194260001 194280000 79 0.57 0.30 4.14
1 100540001 100560000 221 0.57 0.40 4.12
1 146980001 147000000 155 0.57 0.40 4.10
1 5250001 5270000 179 0.56 0.29 4.09
1 181790001 181810000 200 0.56 0.35 4.06
1 147060001 147080000 207 0.56 0.38 4.06
1 146830001 146850000 157 0.56 0.27 4.04
1 19330001 19350000 114 0.56 0.33 4.04
1 151670001 151690000 154 0.56 0.24 4.04
1 147010001 147030000 180 0.56 0.31 4.02
1 191080001 191100000 128 0.56 0.16 4.01
1 181800001 181820000 294 0.56 0.36 4.01
1 147950001 147970000 147 0.56 0.40 4.01
1 147020001 147040000 200 0.56 0.34 4.00
1 100530001 100550000 240 0.55 0.39 3.98
1 147000001 147020000 92 0.55 0.24 3.97
1 181840001 181860000 289 0.55 0.30 3.96
1 19310001 19330000 129 0.55 0.36 3.96
1 146890001 146910000 120 0.55 0.30 3.95
1 190890001 190910000 145 0.55 0.32 3.92
1 190910001 190930000 219 0.55 0.25 3.92
1 147030001 147050000 196 0.55 0.31 3.92
1 5390001 5410000 179 0.55 0.27 3.91
1 148000001 148020000 171 0.55 0.41 3.91
1 146140001 146160000 222 0.55 0.34 3.91
1 147040001 147060000 184 0.55 0.29 3.91
1 147050001 147070000 184 0.55 0.30 3.91
1 117160001 117180000 93 0.55 0.48 3.89
1 146900001 146920000 183 0.54 0.30 3.87
1 117120001 117140000 54 0.54 0.43 3.86
1 146750001 146770000 73 0.54 0.30 3.86
1 194570001 194590000 292 0.54 0.37 3.85
1 147970001 147990000 314 0.54 0.35 3.85
1 100520001 100540000 292 0.54 0.38 3.85
1 120600001 120620000 403 0.54 0.33 3.84
1 146920001 146940000 195 0.54 0.29 3.82
1 194590001 194610000 271 0.54 0.38 3.82
1 19340001 19360000 76 0.54 0.32 3.82
1 194600001 194620000 356 0.54 0.41 3.81
1 5200001 5220000 176 0.54 0.32 3.81
1 64110001 64130000 243 0.54 0.28 3.80
1 190860001 190880000 181 0.53 0.38 3.78
1 148750001 148770000 69 0.53 0.34 3.78

353
Chr Window start Window end SNP (N) Weighted Fst Mean Fst ZFst
1 147940001 147960000 201 0.53 0.35 3.78
1 5260001 5280000 163 0.53 0.25 3.76
1 151750001 151770000 191 0.53 0.39 3.76
1 152580001 152600000 206 0.53 0.26 3.76
1 146130001 146150000 233 0.53 0.28 3.76
1 181480001 181500000 223 0.53 0.31 3.74
1 146110001 146130000 203 0.53 0.32 3.74
1 64120001 64140000 200 0.53 0.33 3.72
1 147120001 147140000 159 0.53 0.25 3.72
1 96580001 96600000 149 0.53 0.30 3.71
1 146970001 146990000 150 0.53 0.34 3.70
1 151660001 151680000 161 0.53 0.22 3.69
1 100510001 100530000 252 0.52 0.39 3.69
1 149040001 149060000 183 0.52 0.39 3.69
1 19320001 19340000 114 0.52 0.32 3.68
1 181490001 181510000 255 0.52 0.35 3.67
1 63520001 63540000 136 0.52 0.31 3.67
1 146910001 146930000 213 0.52 0.30 3.67
1 89460001 89480000 91 0.52 0.38 3.66
1 5160001 5180000 148 0.52 0.34 3.65
1 17890001 17910000 131 0.52 0.32 3.64
1 190900001 190920000 200 0.52 0.25 3.63
1 175710001 175730000 374 0.52 0.31 3.62
1 61330001 61350000 321 0.52 0.31 3.62
1 19540001 19560000 147 0.52 0.34 3.60
1 151540001 151560000 114 0.52 0.31 3.60
1 148160001 148180000 108 0.52 0.41 3.60
1 137500001 137520000 418 0.52 0.23 3.60
1 147930001 147950000 249 0.51 0.35 3.57
1 151630001 151650000 95 0.51 0.30 3.56
1 175720001 175740000 447 0.51 0.29 3.56
1 154530001 154550000 220 0.51 0.30 3.55
1 39050001 39070000 257 0.51 0.33 3.55
1 182720001 182740000 223 0.51 0.29 3.54
1 152590001 152610000 259 0.51 0.20 3.53
1 190920001 190940000 183 0.51 0.20 3.53
1 120590001 120610000 276 0.51 0.33 3.53
1 151620001 151640000 83 0.51 0.30 3.53
1 194580001 194600000 253 0.51 0.33 3.52
1 5150001 5170000 194 0.51 0.36 3.50
1 19700001 19720000 163 0.51 0.34 3.50
1 5190001 5210000 161 0.51 0.29 3.50
1 124190001 124210000 379 0.50 0.35 3.49
1 151700001 151720000 217 0.50 0.34 3.47
1 146840001 146860000 118 0.50 0.31 3.47

354
Chr Window start Window end SNP (N) Weighted Fst Mean Fst ZFst
1 35330001 35350000 270 0.50 0.29 3.46
1 146120001 146140000 171 0.50 0.23 3.45
1 19620001 19640000 184 0.50 0.29 3.45
1 159870001 159890000 207 0.50 0.34 3.45
1 61340001 61360000 287 0.50 0.27 3.44
1 137510001 137530000 368 0.50 0.26 3.44
1 64100001 64120000 263 0.50 0.22 3.44
1 146100001 146120000 357 0.50 0.29 3.43
1 100550001 100570000 290 0.50 0.35 3.43
1 124210001 124230000 309 0.50 0.32 3.42
1 19460001 19480000 141 0.50 0.32 3.40
1 175640001 175660000 385 0.50 0.31 3.40
1 148010001 148030000 198 0.50 0.36 3.39
1 5180001 5200000 125 0.49 0.29 3.38
1 151610001 151630000 80 0.49 0.29 3.38
1 175760001 175780000 296 0.49 0.31 3.37
1 140930001 140950000 123 0.49 0.34 3.36
1 140590001 140610000 272 0.49 0.30 3.36
1 151740001 151760000 254 0.49 0.39 3.35
1 181850001 181870000 286 0.49 0.26 3.34
1 148250001 148270000 147 0.49 0.38 3.34
1 111860001 111880000 156 0.49 0.30 3.34
1 152600001 152620000 282 0.49 0.23 3.34
1 142930001 142950000 302 0.49 0.29 3.33
1 61320001 61340000 329 0.49 0.29 3.33
1 146880001 146900000 75 0.49 0.31 3.32
1 137450001 137470000 358 0.49 0.33 3.32
1 152820001 152840000 69 0.49 0.34 3.32
1 171270001 171290000 256 0.49 0.27 3.30
1 19400001 19420000 118 0.49 0.20 3.30
1 148260001 148280000 147 0.48 0.37 3.29
1 19570001 19590000 145 0.48 0.30 3.28
1 181310001 181330000 204 0.48 0.30 3.27
1 146150001 146170000 256 0.48 0.31 3.26
1 140940001 140960000 104 0.48 0.33 3.24
1 148640001 148660000 91 0.48 0.31 3.24
1 39040001 39060000 272 0.48 0.30 3.24
1 5380001 5400000 180 0.48 0.24 3.23
1 194380001 194400000 267 0.48 0.23 3.23
1 148630001 148650000 103 0.48 0.33 3.23
1 137390001 137410000 444 0.48 0.30 3.22
1 45640001 45660000 283 0.48 0.27 3.22
1 194250001 194270000 37 0.48 0.25 3.22
1 175770001 175790000 301 0.48 0.30 3.22
1 27200001 27220000 253 0.48 0.30 3.21

355
Chr Window start Window end SNP (N) Weighted Fst Mean Fst ZFst
1 5170001 5190000 120 0.48 0.28 3.20
1 145560001 145580000 239 0.48 0.31 3.20
1 1610001 1630000 293 0.48 0.26 3.19
1 175650001 175670000 386 0.48 0.30 3.19
1 145440001 145460000 416 0.48 0.27 3.19
1 1620001 1640000 153 0.48 0.27 3.19
1 82330001 82350000 280 0.47 0.26 3.18
1 63530001 63550000 106 0.47 0.26 3.18
1 96590001 96610000 195 0.47 0.25 3.17
1 148730001 148750000 93 0.47 0.31 3.16
1 111830001 111850000 208 0.47 0.21 3.16
1 27190001 27210000 265 0.47 0.27 3.14
1 151550001 151570000 171 0.47 0.31 3.14
1 143690001 143710000 322 0.47 0.29 3.14
1 146850001 146870000 162 0.47 0.31 3.14
1 149360001 149380000 106 0.47 0.28 3.14
1 19380001 19400000 77 0.47 0.21 3.14
1 63510001 63530000 141 0.47 0.32 3.14
1 111840001 111860000 149 0.47 0.22 3.13
1 55830001 55850000 252 0.47 0.28 3.12
1 191180001 191200000 157 0.47 0.42 3.11
1 78270001 78290000 189 0.47 0.25 3.10
1 64090001 64110000 225 0.47 0.20 3.10
1 137490001 137510000 406 0.47 0.19 3.09
1 177250001 177270000 267 0.47 0.28 3.09
1 149060001 149080000 158 0.47 0.33 3.09
1 148680001 148700000 74 0.46 0.24 3.08
1 159080001 159100000 150 0.46 0.30 3.08
1 19450001 19470000 139 0.46 0.31 3.08
1 159070001 159090000 181 0.46 0.31 3.08
1 84400001 84420000 405 0.46 0.29 3.07
1 19690001 19710000 167 0.46 0.22 3.07
1 137440001 137460000 329 0.46 0.31 3.06
2 142890001 142910000 61 0.73 0.28 5.76
2 142910001 142930000 186 0.71 0.35 5.57
2 61580001 61600000 144 0.71 0.52 5.54
2 142900001 142920000 142 0.70 0.28 5.49
2 142810001 142830000 59 0.70 0.42 5.46
2 143610001 143630000 210 0.68 0.34 5.23
2 143320001 143340000 61 0.68 0.46 5.20
2 142920001 142940000 184 0.64 0.31 4.82
2 143570001 143590000 187 0.64 0.32 4.80
2 133300001 133320000 167 0.63 0.46 4.78
2 143600001 143620000 205 0.62 0.28 4.67
2 133330001 133350000 129 0.61 0.48 4.51

356
Chr Window start Window end SNP (N) Weighted Fst Mean Fst ZFst
2 133290001 133310000 185 0.60 0.36 4.45
2 21240001 21260000 148 0.59 0.48 4.39
2 142800001 142820000 189 0.59 0.32 4.39
2 21990001 22010000 260 0.59 0.33 4.33
2 143580001 143600000 126 0.59 0.29 4.32
2 143560001 143580000 188 0.59 0.25 4.31
2 133070001 133090000 181 0.58 0.38 4.26
2 133320001 133340000 149 0.58 0.42 4.20
2 139700001 139720000 232 0.57 0.27 4.18
2 50210001 50230000 87 0.57 0.37 4.17
2 132910001 132930000 183 0.57 0.42 4.10
2 50200001 50220000 105 0.56 0.35 4.08
2 21250001 21270000 171 0.56 0.46 4.06
2 21260001 21280000 137 0.56 0.44 4.06
2 57870001 57890000 293 0.56 0.33 4.05
2 54810001 54830000 246 0.56 0.42 4.01
2 143590001 143610000 136 0.55 0.24 3.98
2 82270001 82290000 158 0.55 0.40 3.97
2 142270001 142290000 256 0.55 0.39 3.96
2 49690001 49710000 64 0.55 0.34 3.91
2 142260001 142280000 314 0.55 0.36 3.91
2 143620001 143640000 196 0.55 0.23 3.91
2 132920001 132940000 199 0.54 0.41 3.88
2 61570001 61590000 323 0.54 0.30 3.86
2 143330001 143350000 102 0.54 0.38 3.85
2 142320001 142340000 242 0.54 0.36 3.82
2 131340001 131360000 132 0.54 0.30 3.80
2 82260001 82280000 161 0.54 0.37 3.80
2 146070001 146090000 170 0.54 0.36 3.79
2 133310001 133330000 173 0.53 0.35 3.78
2 146060001 146080000 191 0.53 0.34 3.78
2 82280001 82300000 143 0.53 0.35 3.73
2 82250001 82270000 151 0.53 0.37 3.73
2 142460001 142480000 364 0.53 0.33 3.73
2 15940001 15960000 452 0.53 0.27 3.72
2 133270001 133290000 195 0.53 0.36 3.71
2 142940001 142960000 149 0.53 0.36 3.71
2 57860001 57880000 259 0.53 0.35 3.70
2 15340001 15360000 316 0.53 0.33 3.70
2 133280001 133300000 222 0.52 0.31 3.69
2 62480001 62500000 317 0.52 0.32 3.67
2 62490001 62510000 253 0.52 0.35 3.66
2 142540001 142560000 332 0.52 0.29 3.65
2 145990001 146010000 290 0.52 0.31 3.65
2 144380001 144400000 118 0.52 0.43 3.63

357
Chr Window start Window end SNP (N) Weighted Fst Mean Fst ZFst
2 57720001 57740000 169 0.52 0.31 3.63
2 147310001 147330000 133 0.52 0.26 3.63
2 15330001 15350000 363 0.52 0.31 3.61
2 142330001 142350000 214 0.52 0.32 3.61
2 57730001 57750000 155 0.52 0.37 3.61
2 21980001 22000000 291 0.52 0.28 3.61
2 143190001 143210000 217 0.52 0.36 3.61
2 62390001 62410000 247 0.52 0.34 3.61
2 15950001 15970000 306 0.52 0.25 3.59
2 82240001 82260000 131 0.51 0.32 3.58
2 145980001 146000000 341 0.51 0.29 3.58
2 62380001 62400000 296 0.51 0.35 3.57
2 8010001 8030000 306 0.51 0.33 3.56
2 57790001 57810000 223 0.51 0.39 3.55
2 141780001 141800000 290 0.51 0.30 3.55
2 145970001 145990000 376 0.51 0.29 3.53
2 145960001 145980000 233 0.51 0.31 3.53
2 143360001 143380000 103 0.51 0.33 3.52
2 8020001 8040000 325 0.51 0.36 3.52
2 143340001 143360000 109 0.51 0.40 3.52
2 50220001 50240000 153 0.51 0.35 3.52
2 143350001 143370000 111 0.50 0.36 3.48
2 133080001 133100000 221 0.50 0.35 3.44
2 142280001 142300000 274 0.50 0.37 3.43
2 49680001 49700000 106 0.50 0.34 3.43
2 133040001 133060000 116 0.50 0.33 3.42
2 38420001 38440000 230 0.49 0.37 3.39
2 111910001 111930000 244 0.49 0.31 3.37
2 11690001 11710000 92 0.49 0.23 3.36
2 144370001 144390000 121 0.49 0.43 3.36
2 146180001 146200000 356 0.49 0.31 3.35
2 147320001 147340000 138 0.49 0.36 3.34
2 146990001 147010000 169 0.49 0.29 3.33
2 125510001 125530000 238 0.49 0.32 3.31
2 142470001 142490000 307 0.49 0.27 3.29
2 62430001 62450000 300 0.48 0.29 3.28
2 147000001 147020000 219 0.48 0.32 3.28
2 143640001 143660000 221 0.48 0.28 3.28
2 50050001 50070000 142 0.48 0.33 3.25
2 21270001 21290000 171 0.48 0.35 3.25
2 49890001 49910000 70 0.48 0.34 3.25
2 78330001 78350000 293 0.48 0.29 3.24
2 142450001 142470000 355 0.48 0.30 3.24
2 143200001 143220000 193 0.48 0.36 3.23
2 82800001 82820000 172 0.48 0.36 3.22

358
Chr Window start Window end SNP (N) Weighted Fst Mean Fst ZFst
2 62440001 62460000 295 0.48 0.28 3.21
2 61870001 61890000 320 0.48 0.32 3.20
2 142210001 142230000 213 0.48 0.31 3.20
2 15930001 15950000 416 0.48 0.27 3.19
2 145940001 145960000 359 0.47 0.25 3.17
2 21230001 21250000 120 0.47 0.33 3.17
2 23010001 23030000 250 0.47 0.23 3.16
2 104450001 104470000 409 0.47 0.29 3.15
2 111900001 111920000 279 0.47 0.34 3.15
2 82790001 82810000 165 0.47 0.38 3.14
2 82820001 82840000 154 0.47 0.36 3.14
2 50230001 50250000 208 0.47 0.29 3.13
2 62360001 62380000 340 0.47 0.30 3.13
2 146170001 146190000 361 0.47 0.28 3.12
2 143630001 143650000 220 0.47 0.22 3.11
2 104460001 104480000 395 0.47 0.29 3.11
2 82350001 82370000 155 0.47 0.31 3.11
2 50020001 50040000 157 0.47 0.40 3.10
2 57880001 57900000 280 0.47 0.25 3.09
2 55020001 55040000 190 0.46 0.20 3.08
2 50080001 50100000 177 0.46 0.33 3.08
2 145930001 145950000 480 0.46 0.26 3.07
2 82810001 82830000 177 0.46 0.34 3.07
2 132990001 133010000 172 0.46 0.31 3.07
2 145620001 145640000 308 0.46 0.30 3.07
2 142290001 142310000 217 0.46 0.34 3.07
3 80060001 80080000 192 0.71 0.48 5.57
3 80070001 80090000 199 0.70 0.51 5.48
3 37940001 37960000 280 0.68 0.36 5.29
3 90980001 91000000 104 0.68 0.50 5.26
3 37950001 37970000 276 0.67 0.37 5.11
3 80080001 80100000 174 0.66 0.45 5.01
3 90520001 90540000 72 0.65 0.48 4.93
3 37910001 37930000 432 0.65 0.39 4.91
3 37920001 37940000 378 0.64 0.38 4.88
3 80050001 80070000 232 0.63 0.37 4.76
3 80590001 80610000 300 0.63 0.33 4.72
3 37930001 37950000 289 0.63 0.35 4.71
3 92220001 92240000 224 0.62 0.45 4.64
3 98130001 98150000 171 0.60 0.36 4.48
3 80020001 80040000 223 0.59 0.36 4.35
3 80600001 80620000 232 0.59 0.30 4.32
3 80010001 80030000 221 0.58 0.28 4.29
3 51270001 51290000 279 0.58 0.28 4.28
3 11320001 11340000 215 0.58 0.33 4.28

359
Chr Window start Window end SNP (N) Weighted Fst Mean Fst ZFst
3 80040001 80060000 253 0.58 0.31 4.23
3 80030001 80050000 254 0.58 0.33 4.22
3 92230001 92250000 256 0.58 0.41 4.21
3 72010001 72030000 245 0.58 0.43 4.21
3 80090001 80110000 122 0.58 0.35 4.19
3 80810001 80830000 330 0.57 0.32 4.18
3 63980001 64000000 288 0.57 0.35 4.16
3 91460001 91480000 62 0.57 0.41 4.14
3 35180001 35200000 305 0.57 0.35 4.12
3 51480001 51500000 282 0.57 0.36 4.10
3 53590001 53610000 124 0.56 0.32 4.08
3 50770001 50790000 278 0.56 0.32 4.06
3 79800001 79820000 300 0.56 0.30 4.05
3 80000001 80020000 263 0.56 0.28 4.04
3 38370001 38390000 103 0.56 0.42 4.04
3 84140001 84160000 156 0.56 0.49 4.00
3 45970001 45990000 317 0.56 0.38 4.00
3 80450001 80470000 89 0.55 0.26 3.96
3 63990001 64010000 258 0.55 0.29 3.96
3 80840001 80860000 243 0.55 0.36 3.95
3 90990001 91010000 104 0.55 0.33 3.93
3 35170001 35190000 295 0.55 0.34 3.92
3 84150001 84170000 152 0.55 0.44 3.89
3 37390001 37410000 143 0.54 0.34 3.88
3 51470001 51490000 231 0.54 0.37 3.86
3 90970001 90990000 126 0.54 0.38 3.85
3 53610001 53630000 131 0.54 0.28 3.83
3 85600001 85620000 63 0.54 0.33 3.82
3 51280001 51300000 266 0.54 0.27 3.82
3 93710001 93730000 78 0.54 0.35 3.80
3 84040001 84060000 153 0.54 0.25 3.80
3 37350001 37370000 117 0.54 0.22 3.79
3 65840001 65860000 280 0.53 0.33 3.78
3 80750001 80770000 356 0.53 0.28 3.78
3 90510001 90530000 128 0.53 0.40 3.77
3 53600001 53620000 117 0.53 0.30 3.77
3 92190001 92210000 302 0.53 0.34 3.76
3 84160001 84180000 146 0.53 0.40 3.73
3 80770001 80790000 409 0.53 0.23 3.72
3 80760001 80780000 329 0.53 0.26 3.72
3 37340001 37360000 113 0.53 0.23 3.71
3 80740001 80760000 370 0.52 0.28 3.68
3 50810001 50830000 198 0.52 0.32 3.65
3 80800001 80820000 379 0.52 0.26 3.64
3 49960001 49980000 187 0.52 0.30 3.63

360
Chr Window start Window end SNP (N) Weighted Fst Mean Fst ZFst
3 98140001 98160000 149 0.52 0.27 3.62
3 84050001 84070000 153 0.52 0.30 3.60
3 8100001 8120000 257 0.52 0.27 3.60
3 37380001 37400000 139 0.52 0.28 3.60
3 78560001 78580000 356 0.52 0.26 3.60
3 84130001 84150000 109 0.51 0.44 3.58
3 90810001 90830000 188 0.51 0.41 3.58
3 80420001 80440000 367 0.51 0.20 3.57
3 53620001 53640000 138 0.51 0.24 3.56
3 90360001 90380000 217 0.51 0.40 3.55
3 63970001 63990000 296 0.51 0.35 3.54
3 50760001 50780000 439 0.51 0.35 3.54
3 50780001 50800000 210 0.51 0.28 3.53
3 65850001 65870000 198 0.51 0.29 3.51
3 80780001 80800000 446 0.51 0.25 3.51
3 8090001 8110000 328 0.51 0.29 3.50
3 50000001 50020000 240 0.51 0.32 3.50
3 89680001 89700000 209 0.51 0.39 3.49
3 49970001 49990000 175 0.51 0.29 3.49
3 80440001 80460000 209 0.50 0.18 3.47
3 92390001 92410000 273 0.50 0.31 3.47
3 37900001 37920000 480 0.50 0.29 3.46
3 65880001 65900000 221 0.50 0.38 3.46
3 50010001 50030000 176 0.50 0.34 3.45
3 72000001 72020000 248 0.50 0.33 3.44
3 80870001 80890000 323 0.50 0.30 3.43
3 80850001 80870000 310 0.50 0.31 3.42
3 62650001 62670000 245 0.50 0.38 3.42
3 80820001 80840000 347 0.50 0.29 3.42
3 88840001 88860000 266 0.50 0.32 3.39
3 89840001 89860000 237 0.50 0.35 3.39
3 92200001 92220000 283 0.50 0.30 3.39
3 37960001 37980000 280 0.49 0.28 3.39
3 63960001 63980000 207 0.49 0.36 3.39
3 52390001 52410000 354 0.49 0.23 3.38
3 3070001 3090000 147 0.49 0.24 3.37
3 87890001 87910000 288 0.49 0.36 3.37
3 11330001 11350000 340 0.49 0.28 3.37
3 79810001 79830000 317 0.49 0.28 3.36
3 98150001 98170000 155 0.49 0.30 3.36
3 65860001 65880000 242 0.49 0.34 3.35
3 8030001 8050000 356 0.49 0.27 3.35
3 50800001 50820000 214 0.49 0.26 3.34
3 62550001 62570000 189 0.49 0.44 3.34
3 3060001 3080000 96 0.49 0.26 3.34

361
Chr Window start Window end SNP (N) Weighted Fst Mean Fst ZFst
3 84300001 84320000 159 0.49 0.42 3.33
3 80790001 80810000 401 0.49 0.28 3.32
3 51260001 51280000 275 0.49 0.22 3.32
3 79730001 79750000 340 0.49 0.25 3.32
3 62660001 62680000 209 0.49 0.40 3.32
3 84170001 84190000 139 0.49 0.33 3.31
3 79990001 80010000 300 0.49 0.26 3.30
3 90950001 90970000 31 0.49 0.43 3.30
3 80580001 80600000 316 0.48 0.27 3.28
3 80430001 80450000 314 0.48 0.17 3.27
3 68790001 68810000 176 0.48 0.29 3.27
3 79680001 79700000 339 0.48 0.26 3.26
3 50060001 50080000 112 0.48 0.45 3.26
3 80460001 80480000 140 0.48 0.29 3.25
3 98120001 98140000 199 0.48 0.31 3.25
3 41190001 41210000 370 0.48 0.28 3.25
3 92210001 92230000 241 0.48 0.33 3.24
3 79790001 79810000 300 0.48 0.29 3.24
3 80880001 80900000 319 0.48 0.29 3.24
3 51490001 51510000 283 0.48 0.24 3.22
3 64070001 64090000 154 0.48 0.32 3.20
3 90350001 90370000 243 0.48 0.36 3.19
3 90530001 90550000 124 0.47 0.35 3.18
3 49990001 50010000 230 0.47 0.27 3.18
3 3090001 3110000 193 0.47 0.23 3.17
3 89330001 89350000 251 0.47 0.36 3.17
3 65910001 65930000 371 0.47 0.32 3.17
3 52370001 52390000 362 0.47 0.26 3.17
3 53580001 53600000 148 0.47 0.27 3.17
3 79670001 79690000 424 0.47 0.26 3.16
3 90500001 90520000 177 0.47 0.35 3.16
3 53640001 53660000 123 0.47 0.18 3.16
3 80410001 80430000 392 0.47 0.19 3.16
3 50750001 50770000 590 0.47 0.33 3.16
3 49980001 50000000 178 0.47 0.27 3.16
3 91380001 91400000 171 0.47 0.33 3.16
3 90960001 90980000 89 0.47 0.33 3.15
3 50820001 50840000 282 0.47 0.32 3.15
3 27050001 27070000 278 0.47 0.28 3.14
3 65870001 65890000 252 0.47 0.34 3.14
3 94240001 94260000 178 0.47 0.32 3.14
3 98160001 98180000 205 0.47 0.31 3.13
3 52380001 52400000 383 0.47 0.21 3.12
3 79960001 79980000 303 0.47 0.30 3.12
3 80660001 80680000 336 0.47 0.27 3.12

362
Chr Window start Window end SNP (N) Weighted Fst Mean Fst ZFst
3 84310001 84330000 152 0.47 0.37 3.11
3 89690001 89710000 192 0.47 0.37 3.11
3 79950001 79970000 276 0.47 0.31 3.11
3 90620001 90640000 219 0.47 0.24 3.11
3 65890001 65910000 288 0.47 0.32 3.10
3 50050001 50070000 97 0.47 0.42 3.10
3 92240001 92260000 366 0.47 0.33 3.09
3 94690001 94710000 174 0.47 0.24 3.09
3 64530001 64550000 194 0.47 0.33 3.09
3 79420001 79440000 358 0.46 0.21 3.09
3 92400001 92420000 296 0.46 0.31 3.09
3 80830001 80850000 326 0.46 0.25 3.07
3 33110001 33130000 314 0.46 0.31 3.06
4 27910001 27930000 87 0.75 0.64 5.94
4 27890001 27910000 61 0.74 0.59 5.89
4 27880001 27900000 108 0.74 0.60 5.87
4 27900001 27920000 31 0.73 0.51 5.80
4 28010001 28030000 36 0.73 0.70 5.78
4 27870001 27890000 109 0.73 0.45 5.77
4 28000001 28020000 26 0.73 0.71 5.76
4 27990001 28010000 24 0.73 0.62 5.72
4 39730001 39750000 422 0.72 0.43 5.69
4 39720001 39740000 372 0.72 0.44 5.60
4 27920001 27940000 106 0.71 0.60 5.56
4 28020001 28040000 42 0.71 0.61 5.55
4 26340001 26360000 277 0.70 0.30 5.49
4 28030001 28050000 84 0.70 0.58 5.47
4 28040001 28060000 120 0.70 0.59 5.44
4 27980001 28000000 22 0.70 0.57 5.43
4 26350001 26370000 332 0.70 0.30 5.42
4 27860001 27880000 83 0.70 0.26 5.42
4 28050001 28070000 118 0.69 0.60 5.34
4 28230001 28250000 141 0.67 0.43 5.18
4 26360001 26380000 271 0.67 0.28 5.14
4 26300001 26320000 135 0.67 0.35 5.10
4 28060001 28080000 123 0.66 0.52 5.09
4 28700001 28720000 145 0.66 0.50 5.07
4 26280001 26300000 147 0.66 0.34 5.06
4 28670001 28690000 132 0.66 0.49 5.02
4 26310001 26330000 155 0.66 0.28 5.02
4 26330001 26350000 241 0.65 0.25 4.98
4 41780001 41800000 141 0.65 0.38 4.97
4 39700001 39720000 215 0.65 0.41 4.96
4 39710001 39730000 299 0.65 0.43 4.95
4 28710001 28730000 120 0.65 0.48 4.90

363
Chr Window start Window end SNP (N) Weighted Fst Mean Fst ZFst
4 28220001 28240000 166 0.65 0.53 4.90
4 26290001 26310000 120 0.64 0.35 4.85
4 41790001 41810000 70 0.64 0.35 4.80
4 28120001 28140000 97 0.63 0.41 4.75
4 41770001 41790000 171 0.63 0.32 4.74
4 28680001 28700000 148 0.62 0.47 4.68
4 39170001 39190000 173 0.62 0.46 4.64
4 27830001 27850000 52 0.62 0.51 4.64
4 28660001 28680000 95 0.62 0.35 4.64
4 28160001 28180000 22 0.62 0.51 4.59
4 28750001 28770000 216 0.61 0.43 4.58
4 28740001 28760000 119 0.61 0.34 4.58
4 28690001 28710000 149 0.61 0.43 4.58
4 28760001 28780000 179 0.61 0.41 4.55
4 28170001 28190000 79 0.61 0.49 4.54
4 28110001 28130000 118 0.61 0.39 4.54
4 28190001 28210000 134 0.61 0.43 4.53
4 28180001 28200000 123 0.61 0.45 4.53
4 41830001 41850000 112 0.61 0.45 4.52
4 27840001 27860000 51 0.61 0.31 4.52
4 28070001 28090000 129 0.61 0.37 4.51
4 28090001 28110000 153 0.61 0.36 4.50
4 41800001 41820000 62 0.60 0.32 4.49
4 39740001 39760000 402 0.60 0.31 4.48
4 27820001 27840000 46 0.60 0.44 4.47
4 28770001 28790000 106 0.60 0.35 4.46
4 28080001 28100000 160 0.60 0.38 4.45
4 28200001 28220000 143 0.60 0.47 4.44
4 28210001 28230000 164 0.60 0.50 4.43
4 28130001 28150000 50 0.60 0.35 4.41
4 41820001 41840000 109 0.60 0.37 4.40
4 27850001 27870000 54 0.59 0.15 4.39
4 26170001 26190000 231 0.59 0.28 4.36
4 41850001 41870000 101 0.59 0.41 4.36
4 41840001 41860000 97 0.59 0.41 4.34
4 37810001 37830000 167 0.59 0.36 4.30
4 26320001 26340000 208 0.59 0.20 4.30
4 39620001 39640000 375 0.59 0.52 4.29
4 39690001 39710000 179 0.59 0.25 4.29
4 27660001 27680000 128 0.58 0.53 4.28
4 26270001 26290000 175 0.58 0.24 4.27
4 41810001 41830000 100 0.58 0.30 4.26
4 27930001 27950000 69 0.58 0.44 4.24
4 39610001 39630000 346 0.58 0.50 4.23
4 27040001 27060000 100 0.58 0.32 4.21

364
Chr Window start Window end SNP (N) Weighted Fst Mean Fst ZFst
4 28100001 28120000 128 0.57 0.30 4.18
4 42060001 42080000 44 0.57 0.47 4.17
4 28510001 28530000 65 0.57 0.33 4.13
4 27030001 27050000 144 0.57 0.34 4.12
4 26140001 26160000 193 0.57 0.22 4.12
4 87460001 87480000 280 0.57 0.34 4.12
4 27670001 27690000 70 0.57 0.48 4.12
4 28590001 28610000 122 0.57 0.41 4.11
4 28500001 28520000 75 0.56 0.37 4.07
4 27650001 27670000 118 0.56 0.48 4.06
4 28520001 28540000 75 0.56 0.31 4.05
4 27950001 27970000 21 0.56 0.45 4.04
4 28730001 28750000 111 0.56 0.22 4.03
4 28490001 28510000 55 0.55 0.36 3.96
4 28240001 28260000 126 0.55 0.20 3.96
4 28720001 28740000 127 0.55 0.29 3.95
4 27970001 27990000 26 0.55 0.42 3.95
4 41900001 41920000 141 0.55 0.41 3.94
4 41910001 41930000 128 0.55 0.41 3.94
4 28530001 28550000 86 0.55 0.28 3.94
4 26380001 26400000 189 0.55 0.24 3.93
4 27810001 27830000 34 0.55 0.28 3.91
4 26160001 26180000 225 0.55 0.22 3.90
4 28800001 28820000 217 0.54 0.27 3.89
4 27680001 27700000 82 0.54 0.46 3.88
4 26040001 26060000 189 0.54 0.26 3.86
4 87470001 87490000 207 0.54 0.37 3.86
4 37870001 37890000 339 0.54 0.35 3.85
4 26390001 26410000 199 0.54 0.26 3.82
4 27730001 27750000 24 0.54 0.42 3.81
4 28600001 28620000 122 0.54 0.32 3.80
4 41860001 41880000 129 0.53 0.31 3.78
4 39660001 39680000 324 0.53 0.30 3.78
4 27710001 27730000 60 0.53 0.40 3.77
4 39400001 39420000 462 0.53 0.37 3.77
4 28810001 28830000 162 0.53 0.22 3.74
4 28370001 28390000 77 0.53 0.26 3.74
4 26180001 26200000 203 0.53 0.22 3.72
4 37670001 37690000 310 0.53 0.25 3.72
4 28410001 28430000 76 0.53 0.22 3.71
4 27740001 27760000 25 0.53 0.31 3.71
4 27690001 27710000 112 0.53 0.45 3.69
4 39390001 39410000 484 0.53 0.37 3.69
4 26150001 26170000 199 0.52 0.20 3.68
4 27700001 27720000 95 0.52 0.44 3.68

365
Chr Window start Window end SNP (N) Weighted Fst Mean Fst ZFst
4 39210001 39230000 286 0.52 0.35 3.68
4 25260001 25280000 216 0.52 0.33 3.67
4 27940001 27960000 37 0.52 0.41 3.64
4 27590001 27610000 102 0.52 0.42 3.64
4 27720001 27740000 32 0.52 0.35 3.63
4 28340001 28360000 127 0.52 0.27 3.62
4 39600001 39620000 301 0.52 0.41 3.61
4 27600001 27620000 81 0.52 0.43 3.61
4 87480001 87500000 256 0.52 0.40 3.60
4 28380001 28400000 101 0.51 0.23 3.58
4 28780001 28800000 138 0.51 0.22 3.57
4 27020001 27040000 144 0.51 0.30 3.57
4 26370001 26390000 159 0.51 0.16 3.57
4 37660001 37680000 384 0.51 0.26 3.55
4 28350001 28370000 108 0.51 0.27 3.53
4 27800001 27820000 37 0.51 0.23 3.53
4 28430001 28450000 77 0.51 0.30 3.52
4 28790001 28810000 185 0.51 0.23 3.52
4 28400001 28420000 88 0.51 0.23 3.51
4 28540001 28560000 91 0.51 0.22 3.50
4 27540001 27560000 106 0.51 0.39 3.50
4 26450001 26470000 137 0.50 0.26 3.49
4 27760001 27780000 39 0.50 0.25 3.47
4 41890001 41910000 120 0.50 0.30 3.47
4 27490001 27510000 97 0.50 0.31 3.47
4 28420001 28440000 81 0.50 0.27 3.46
4 39670001 39690000 346 0.50 0.23 3.43
4 49170001 49190000 368 0.50 0.35 3.43
4 39590001 39610000 353 0.50 0.40 3.41
4 27790001 27810000 42 0.50 0.25 3.41
4 27750001 27770000 34 0.50 0.25 3.41
4 26130001 26150000 160 0.50 0.18 3.40
4 42070001 42090000 62 0.49 0.36 3.39
4 27610001 27630000 71 0.49 0.37 3.38
4 25270001 25290000 277 0.49 0.30 3.38
4 39160001 39180000 228 0.49 0.35 3.36
4 16450001 16470000 254 0.49 0.30 3.35
4 39380001 39400000 482 0.49 0.34 3.35
4 27960001 27980000 27 0.49 0.38 3.34
4 27400001 27420000 72 0.49 0.24 3.33
4 25190001 25210000 259 0.49 0.30 3.33
4 26080001 26100000 194 0.49 0.25 3.33
4 27410001 27430000 90 0.49 0.25 3.32
4 27530001 27550000 84 0.49 0.36 3.31
4 87580001 87600000 113 0.49 0.39 3.30

366
Chr Window start Window end SNP (N) Weighted Fst Mean Fst ZFst
4 26210001 26230000 168 0.49 0.14 3.30
4 41920001 41940000 85 0.49 0.32 3.29
4 37720001 37740000 401 0.49 0.32 3.29
4 27620001 27640000 81 0.49 0.35 3.29
4 39630001 39650000 336 0.48 0.37 3.27
4 26050001 26070000 212 0.48 0.21 3.27
4 26030001 26050000 165 0.48 0.28 3.26
4 87450001 87470000 316 0.48 0.25 3.26
4 28920001 28940000 185 0.48 0.32 3.26
4 25180001 25200000 215 0.48 0.27 3.26
4 26440001 26460000 182 0.48 0.21 3.26
4 26460001 26480000 133 0.48 0.24 3.24
4 27550001 27570000 115 0.48 0.34 3.24
4 27780001 27800000 29 0.48 0.26 3.24
4 28360001 28380000 88 0.48 0.25 3.24
4 7580001 7600000 184 0.48 0.31 3.23
4 25230001 25250000 229 0.48 0.28 3.23
4 37700001 37720000 394 0.48 0.27 3.23
4 7570001 7590000 138 0.48 0.23 3.22
4 37730001 37750000 349 0.48 0.29 3.21
4 26520001 26540000 144 0.48 0.24 3.21
4 27770001 27790000 25 0.48 0.23 3.20
4 39990001 40010000 328 0.48 0.24 3.20
4 28460001 28480000 45 0.48 0.24 3.20
4 26560001 26580000 150 0.48 0.29 3.20
4 27010001 27030000 152 0.48 0.23 3.20
4 37680001 37700000 359 0.48 0.23 3.19
4 39200001 39220000 244 0.48 0.32 3.19
4 57310001 57330000 246 0.47 0.30 3.19
4 26620001 26640000 84 0.47 0.17 3.18
4 16460001 16480000 200 0.47 0.34 3.17
4 26200001 26220000 164 0.47 0.13 3.17
4 26430001 26450000 182 0.47 0.20 3.16
4 28390001 28410000 112 0.47 0.20 3.16
4 53630001 53650000 73 0.47 0.27 3.16
4 26220001 26240000 137 0.47 0.18 3.15
4 28440001 28460000 61 0.47 0.24 3.15
4 27270001 27290000 90 0.47 0.19 3.15
4 37880001 37900000 318 0.47 0.28 3.15
4 37690001 37710000 387 0.47 0.24 3.14
4 14270001 14290000 305 0.47 0.19 3.13
4 27480001 27500000 133 0.47 0.29 3.13
4 27580001 27600000 96 0.47 0.31 3.13
4 53610001 53630000 341 0.47 0.26 3.12
4 30260001 30280000 172 0.47 0.31 3.11

367
Chr Window start Window end SNP (N) Weighted Fst Mean Fst ZFst
4 37710001 37730000 383 0.47 0.28 3.11
4 87540001 87560000 333 0.47 0.34 3.11
4 27520001 27540000 95 0.47 0.30 3.11
4 28610001 28630000 145 0.46 0.19 3.08
4 28580001 28600000 123 0.46 0.26 3.07
4 39410001 39430000 400 0.46 0.32 3.07
5 26450001 26470000 316 0.57 0.30 4.18
5 9450001 9470000 313 0.55 0.35 3.92
5 26460001 26480000 323 0.55 0.28 3.91
5 40550001 40570000 158 0.55 0.39 3.90
5 26310001 26330000 194 0.55 0.37 3.90
5 5550001 5570000 375 0.53 0.33 3.71
5 26170001 26190000 264 0.53 0.33 3.70
5 26640001 26660000 255 0.53 0.27 3.70
5 1900001 1920000 236 0.52 0.30 3.65
5 26320001 26340000 226 0.52 0.38 3.60
5 12680001 12700000 372 0.51 0.27 3.58
5 25870001 25890000 171 0.51 0.28 3.56
5 7150001 7170000 324 0.51 0.26 3.51
5 40560001 40580000 212 0.51 0.30 3.51
5 520001 540000 407 0.51 0.28 3.50
5 9440001 9460000 341 0.50 0.32 3.49
5 5560001 5580000 391 0.50 0.35 3.47
5 12690001 12710000 336 0.50 0.23 3.47
5 41200001 41220000 152 0.50 0.44 3.42
5 5540001 5560000 323 0.49 0.28 3.39
5 21830001 21850000 227 0.49 0.30 3.37
5 41210001 41230000 127 0.49 0.44 3.32
5 40580001 40600000 135 0.49 0.37 3.31
5 16790001 16810000 254 0.49 0.30 3.31
5 6990001 7010000 305 0.49 0.28 3.30
5 16730001 16750000 207 0.48 0.34 3.29
5 15570001 15590000 352 0.48 0.24 3.28
5 5380001 5400000 264 0.48 0.29 3.27
5 25880001 25900000 145 0.48 0.25 3.25
5 26180001 26200000 287 0.48 0.27 3.23
5 5390001 5410000 300 0.48 0.21 3.19
5 6980001 7000000 306 0.47 0.27 3.14
5 40480001 40500000 210 0.47 0.34 3.13
5 1830001 1850000 394 0.47 0.32 3.09
5 1890001 1910000 275 0.46 0.30 3.08
6 13810001 13830000 98 0.66 0.37 5.02
6 27660001 27680000 339 0.62 0.38 4.65
6 27670001 27690000 240 0.55 0.25 3.94
6 13820001 13840000 108 0.53 0.32 3.74

368
Chr Window start Window end SNP (N) Weighted Fst Mean Fst ZFst
6 13800001 13820000 85 0.53 0.24 3.70
6 16560001 16580000 125 0.53 0.29 3.69
6 25850001 25870000 348 0.52 0.27 3.60
6 13830001 13850000 133 0.51 0.33 3.52
6 16550001 16570000 155 0.49 0.22 3.29
6 5760001 5780000 440 0.48 0.27 3.25
6 25840001 25860000 372 0.48 0.24 3.20
6 12870001 12890000 116 0.47 0.39 3.17
6 13840001 13860000 146 0.47 0.33 3.15
6 13160001 13180000 475 0.47 0.32 3.12
6 13340001 13360000 104 0.46 0.22 3.07
7 32520001 32540000 225 0.76 0.44 6.01
7 32530001 32550000 224 0.74 0.46 5.89
7 32540001 32560000 215 0.70 0.39 5.42
7 32550001 32570000 164 0.68 0.32 5.20
7 32560001 32580000 230 0.57 0.30 4.17
7 32510001 32530000 189 0.56 0.30 4.01
7 29650001 29670000 341 0.54 0.39 3.86
7 32570001 32590000 350 0.54 0.30 3.80
7 29440001 29460000 332 0.53 0.37 3.76
7 29430001 29450000 173 0.53 0.43 3.75
7 29450001 29470000 350 0.50 0.36 3.42
7 6600001 6620000 123 0.49 0.38 3.36
7 2630001 2650000 330 0.49 0.33 3.36
7 29600001 29620000 360 0.49 0.26 3.33
7 10600001 10620000 237 0.49 0.30 3.30
7 28160001 28180000 281 0.49 0.29 3.30
7 2620001 2640000 279 0.48 0.32 3.28
7 29420001 29440000 94 0.48 0.30 3.25
7 31690001 31710000 323 0.48 0.29 3.24
7 32450001 32470000 324 0.48 0.26 3.21
7 14150001 14170000 343 0.47 0.27 3.18
7 32580001 32600000 352 0.47 0.25 3.17
7 2590001 2610000 184 0.47 0.34 3.16
7 29610001 29630000 377 0.47 0.24 3.15
7 2560001 2580000 254 0.47 0.28 3.09
8 15490001 15510000 154 0.76 0.48 6.06
8 15500001 15520000 148 0.73 0.47 5.74
8 15510001 15530000 121 0.66 0.41 5.03
8 15480001 15500000 135 0.66 0.28 5.03
8 15530001 15550000 173 0.63 0.41 4.71
8 15520001 15540000 150 0.62 0.39 4.68
8 15450001 15470000 143 0.61 0.31 4.52
8 15540001 15560000 160 0.60 0.40 4.44
8 15440001 15460000 198 0.59 0.34 4.38

369
Chr Window start Window end SNP (N) Weighted Fst Mean Fst ZFst
8 15460001 15480000 109 0.56 0.21 4.01
8 1100001 1120000 218 0.54 0.41 3.84
8 16170001 16190000 344 0.53 0.29 3.70
8 15430001 15450000 208 0.52 0.28 3.62
8 16160001 16180000 287 0.51 0.27 3.51
8 16180001 16200000 363 0.50 0.29 3.43
8 1090001 1110000 268 0.49 0.38 3.34
8 1060001 1080000 212 0.48 0.31 3.26
8 3560001 3580000 472 0.48 0.33 3.23
8 21170001 21190000 337 0.48 0.27 3.22
8 15550001 15570000 169 0.47 0.30 3.17
9 10340001 10360000 245 0.60 0.37 4.44
9 4500001 4520000 376 0.58 0.33 4.22
9 10350001 10370000 208 0.56 0.40 4.05
9 13800001 13820000 415 0.56 0.32 4.03
9 4520001 4540000 193 0.52 0.25 3.61
9 4510001 4530000 306 0.52 0.26 3.60
9 9570001 9590000 174 0.51 0.38 3.58
9 10330001 10350000 210 0.51 0.23 3.55
9 4490001 4510000 410 0.50 0.30 3.48
9 13790001 13810000 370 0.50 0.28 3.39
9 6580001 6600000 194 0.49 0.30 3.38
9 6500001 6520000 238 0.48 0.32 3.27
9 7810001 7830000 207 0.47 0.29 3.18
9 9490001 9510000 168 0.46 0.29 3.07
9 7800001 7820000 191 0.46 0.32 3.07
11 13520001 13540000 185 0.56 0.45 4.08
11 13530001 13550000 199 0.54 0.40 3.80
11 19060001 19080000 245 0.52 0.33 3.62
11 19050001 19070000 286 0.51 0.31 3.52
11 19070001 19090000 221 0.51 0.35 3.50
11 4480001 4500000 203 0.47 0.20 3.16
11 4490001 4510000 182 0.47 0.21 3.14
12 3710001 3730000 218 0.60 0.45 4.48
12 3720001 3740000 235 0.59 0.41 4.35
12 3700001 3720000 98 0.57 0.47 4.18
12 3690001 3710000 113 0.57 0.44 4.17
12 3730001 3750000 173 0.54 0.38 3.82
12 3740001 3760000 127 0.49 0.28 3.37
12 180001 200000 104 0.46 0.26 3.08
13 1760001 1780000 74 0.67 0.50 5.12
13 2200001 2220000 200 0.63 0.38 4.70
13 2210001 2230000 189 0.62 0.34 4.61
13 1750001 1770000 116 0.58 0.40 4.23
13 2150001 2170000 256 0.57 0.32 4.15

370
Chr Window start Window end SNP (N) Weighted Fst Mean Fst ZFst
13 2280001 2300000 293 0.55 0.29 3.92
13 2310001 2330000 315 0.51 0.25 3.54
13 2270001 2290000 271 0.50 0.27 3.44
13 1990001 2010000 364 0.50 0.25 3.40
13 2320001 2340000 245 0.50 0.28 3.39
13 1970001 1990000 393 0.49 0.23 3.31
13 2000001 2020000 382 0.48 0.24 3.28
13 17750001 17770000 292 0.48 0.30 3.27
14 12270001 12290000 318 0.64 0.32 4.85
14 4590001 4610000 279 0.62 0.40 4.64
14 12260001 12280000 203 0.60 0.28 4.42
14 14900001 14920000 183 0.58 0.33 4.27
14 14890001 14910000 200 0.57 0.32 4.12
14 12400001 12420000 352 0.54 0.31 3.83
14 14910001 14930000 236 0.53 0.31 3.73
14 4580001 4600000 266 0.51 0.31 3.51
14 5300001 5320000 232 0.50 0.27 3.49
14 12690001 12710000 340 0.50 0.21 3.43
14 12700001 12720000 291 0.50 0.22 3.39
14 14880001 14900000 263 0.49 0.31 3.34
14 12390001 12410000 322 0.48 0.23 3.23
14 10690001 10710000 166 0.47 0.26 3.16
14 14400001 14420000 435 0.47 0.25 3.10
15 730001 750000 137 0.55 0.34 3.89
15 720001 740000 116 0.52 0.33 3.60
15 790001 810000 111 0.51 0.29 3.51
15 800001 820000 116 0.50 0.30 3.47
15 820001 840000 88 0.49 0.26 3.29
15 760001 780000 212 0.48 0.25 3.26
15 810001 830000 102 0.48 0.26 3.25
17 2130001 2150000 286 0.49 0.22 3.34
20 4800001 4820000 388 0.56 0.36 4.05
20 12180001 12200000 368 0.52 0.32 3.59
20 4790001 4810000 348 0.50 0.29 3.41
20 4810001 4830000 321 0.47 0.25 3.14
20 13370001 13390000 132 0.47 0.31 3.12
21 1590001 1610000 227 0.51 0.29 3.56
21 1600001 1620000 207 0.49 0.27 3.36
22 4410001 4430000 373 0.49 0.36 3.37
22 3510001 3530000 42 0.47 0.34 3.15
23 20001 40000 82 0.64 0.35 4.81
23 90001 110000 59 0.63 0.41 4.73
23 100001 120000 47 0.60 0.26 4.47
23 30001 50000 88 0.60 0.32 4.43
23 50001 70000 72 0.59 0.23 4.36

371
Chr Window start Window end SNP (N) Weighted Fst Mean Fst ZFst
23 80001 100000 78 0.59 0.31 4.33
23 10001 30000 52 0.59 0.32 4.33
23 110001 130000 40 0.57 0.18 4.15
23 60001 80000 100 0.57 0.15 4.10
23 40001 60000 83 0.54 0.25 3.85
23 120001 140000 31 0.53 0.15 3.77
23 70001 90000 106 0.50 0.13 3.41
24 5470001 5490000 346 0.60 0.34 4.42
24 5460001 5480000 363 0.52 0.31 3.66
24 5820001 5840000 329 0.49 0.27 3.30
24 350001 370000 243 0.49 0.28 3.30
24 5830001 5850000 323 0.47 0.25 3.19
24 5770001 5790000 195 0.47 0.27 3.14
27 5390001 5410000 21 0.55 0.24 3.92
28 870001 890000 269 0.53 0.33 3.70
28 860001 880000 247 0.52 0.32 3.67
Chr = Chromosome; N= count

372
Table S 62. List of candidate genes in Improved Horro Vs Jarso chickens.
Chr Gene stable ID Gene start (bp) Gene end (bp) Gene name Gene type
1 ENSGALG00000018250 148023499 148023596 gga-mir-20a miRNA
1 ENSGALG00000018248 148023263 148023340 gga-mir-92-1 miRNA
1 ENSGALG00000018253 148023974 148024058 gga-mir-17 miRNA
1 ENSGALG00000018252 148023819 148023911 gga-mir-18a miRNA
1 ENSGALG00000018249 148023376 148023462 gga-mir-19b miRNA
1 ENSGALG00000018251 148023685 148023765 gga-mir-19a miRNA
1 ENSGALG00000038995 181192418 181414573 GRIA4 protein coding
1 ENSGALG00000016529 120520180 120619365 CDKL5 protein coding
1 ENSGALG00000039029 191156148 191157083 TAS2R4 protein coding
1 ENSGALG00000012791 55806774 56041222 TBXAS1 protein coding
1 ENSGALG00000017040 171268903 171314194 protein coding
1 ENSGALG00000029145 137385524 137404222 DCUN1D2 protein coding
1 ENSGALG00000008477 1421469 1841500 EXOC4 protein coding
1 ENSGALG00000017086 175631550 175648871 protein coding
1 ENSGALG00000025906 145569379 145570098 HS6ST3 protein coding
1 ENSGALG00000009945 35315781 35347355 CPM protein coding
1 ENSGALG00000032499 194257667 194259937 protein coding
1 ENSGALG00000043980 194618171 194619163 protein coding
1 ENSGALG00000015511 96489993 96603886 ROBO1 protein coding
1 ENSGALG00000017336 194386026 194399905 protein coding
1 ENSGALG00000038154 182684536 182765393 YAP1 protein coding
1 ENSGALG00000016896 146127088 146275409 ABCC4 protein coding
1 ENSGALG00000045637 194611460 194612407 protein coding
1 ENSGALG00000045274 194599548 194600495 protein coding
1 ENSGALG00000030885 194583674 194584633 OR51M1L protein coding
1 ENSGALG00000046372 137439551 137445352 protein coding
1 ENSGALG00000030474 194589743 194590690 OR52R1 protein coding
1 ENSGALG00000037697 137487513 137505777 LAMP1 protein coding
1 ENSGALG00000016868 143513191 143715709 NALCN protein coding
1 ENSGALG00000028273 194567561 194575005 HBBA protein coding
1 ENSGALG00000035375 194255739 194257541 protein coding
1 ENSGALG00000016900 146527090 147094328 GPC6 protein coding
1 ENSGALG00000016830 137511432 137545754 CUL4A protein coding
1 ENSGALG00000009480 27184787 27262852 DOCK4 protein coding
1 ENSGALG00000017333 194262382 194288323 LCMT2 protein coding
1 ENSGALG00000017347 194562710 194576539 HBBR protein coding
1 ENSGALG00000045957 1632719 1633541 protein coding
1 ENSGALG00000031642 194378828 194384235 ILK protein coding
1 ENSGALG00000017898 117176547 117176682 RF00003 snRNA
1 ENSGALG00000016902 147664506 148027057 GPC5 protein coding

373
Chr Gene stable ID Gene start (bp) Gene end (bp) Gene name Gene type
1 ENSGALG00000016908 159096610 159285693 PCDH9 protein coding
1 ENSGALG00000016828 137458314 137486611 GRTP1 protein coding
1 ENSGALG00000017089 175782740 175796556 SLC46A3 protein coding
1 ENSGALG00000016602 124175179 124319202 ARHGAP6 protein coding
1 ENSGALG00000042400 111777485 111982403 CASK protein coding
1 ENSGALG00000013117 64035202 64232501 PIK3C2G protein coding
1 ENSGALG00000042216 145564574 145566571 lincRNA
1 ENSGALG00000031514 146892901 146893485 lincRNA
1 ENSGALG00000038284 148027203 148029069 lincRNA
1 ENSGALG00000038439 148235079 148427563 lincRNA
1 ENSGALG00000032591 148901423 149090982 lincRNA
1 ENSGALG00000033716 181770866 181805885 lincRNA
1 ENSGALG00000035278 39036722 39056354 lincRNA
1 ENSGALG00000032654 78268586 78290816 lincRNA
2 ENSGALG00000007507 15950427 15966138 MASTL protein coding
2 ENSGALG00000007519 15968850 15995960 ACBD5 protein coding
2 ENSGALG00000012732 62437754 62509972 PHACTR1 protein coding
2 ENSGALG00000009500 22978146 23047300 VPS50 protein coding
2 ENSGALG00000031741 145815693 145960326 PTK2 protein coding
2 ENSGALG00000012730 62337049 62400206 GFOD1 protein coding
2 ENSGALG00000006372 8000159 8085723 RBM33 protein coding
2 ENSGALG00000031758 50150482 50280221 SUGCT protein coding
2 ENSGALG00000031170 54881741 55053473 ADCY1 protein coding
2 ENSGALG00000009062 21877225 22125099 CDK14 protein coding
2 ENSGALG00000034971 146149257 146178507 SLC45A4 protein coding
2 ENSGALG00000031713 49640512 49897096 POU6F2 protein coding
2 ENSGALG00000012731 62416160 62431263 TBC1D7 protein coding
2 ENSGALG00000042548 141751641 141782032 LRRC6 protein coding
2 ENSGALG00000007492 15927463 15947552 YME1L1 protein coding
2 ENSGALG00000035281 15342791 15398782 WAC protein coding
2 ENSGALG00000037773 142197114 142221622 ST3GAL1 protein coding
2 ENSGALG00000037014 147222471 147418330 TSNARE1 protein coding
2 ENSGALG00000044996 141791891 141797962 TMEM71 protein coding
2 ENSGALG00000042766 145515969 145738890 TRAPPC9 protein coding
2 ENSGALG00000031893 50015463 50043388 RALA protein coding
2 ENSGALG00000015122 104463654 104519187 TAF4B protein coding
2 ENSGALG00000043243 50062031 50120197 CDK13 protein coding
2 ENSGALG00000039831 144356967 144479127 FAM135B protein coding
2 ENSGALG00000031519 143191899 143269024 KHDRBS3 protein coding
2 ENSGALG00000035941 133011859 133260252 lincRNA
2 ENSGALG00000030036 133259610 133653226 lincRNA
2 ENSGALG00000044807 82245741 82251690 lincRNA
3 ENSGALG00000032937 91386688 91473055 DLGAP2 protein coding

374
Chr Gene stable ID Gene start (bp) Gene end (bp) Gene name Gene type
3 ENSGALG00000025589 92233115 92233218 RF00026 snRNA
3 ENSGALG00000016329 88826113 88881081 AGPAT5 protein coding
3 ENSGALG00000008757 11329418 11335309 CNRIP1 protein coding
3 ENSGALG00000008195 3072065 3091482 NPHP1 protein coding
3 ENSGALG00000035230 90162525 90533217 CSMD1 protein coding
3 ENSGALG00000014955 63986937 63988707 protein coding
3 ENSGALG00000028314 80041150 80041257 miRNA
3 ENSGALG00000013747 52365943 52372134 TAGAP protein coding
3 ENSGALG00000008756 11341790 11356873 PLEK protein coding
3 ENSGALG00000031763 37886878 37905405 EDARADD protein coding
3 ENSGALG00000023882 3067765 3070648 MALL protein coding
3 ENSGALG00000028539 63993333 64012992 TRAPPC3L protein coding
3 ENSGALG00000016296 87894493 87908044 GFRAL protein coding
3 ENSGALG00000013683 51335816 51624319 ARID1B protein coding
3 ENSGALG00000013659 50785550 50822797 NOX3 protein coding
3 ENSGALG00000040000 37916515 37937367 ERO1B protein coding
3 ENSGALG00000046008 52380917 52389464 protein coding
3 ENSGALG00000014950 63962962 63969961 SOT3A1L protein coding
3 ENSGALG00000038162 64002722 64010618 FAM26E protein coding
3 ENSGALG00000044523 8027458 8047827 protein coding
3 ENSGALG00000008233 3107192 3126953 BUB1 protein coding
3 ENSGALG00000013751 52394230 52396956 protein coding
3 ENSGALG00000009052 8095587 8106253 LBH protein coding
3 ENSGALG00000015864 78537400 78582981 IBTK protein coding
3 ENSGALG00000008176 3040531 3073125 ASB3 protein coding
3 ENSGALG00000010020 27010043 27167686 TTC7A protein coding
3 ENSGALG00000015898 80736607 80807004 MYO6 protein coding
3 ENSGALG00000015001 65864380 65965590 protein coding
3 ENSGALG00000015889 79785429 79884137 PHIP protein coding
3 ENSGALG00000015901 80846328 80912598 SENP6 protein coding
3 ENSGALG00000015880 79746415 79770440 HMGN3 protein coding
3 ENSGALG00000011663 45927228 45991940 FNDC1 protein coding
3 ENSGALG00000014953 63973179 63984264 RWDD1 protein coding
3 ENSGALG00000008198 3091987 3106203 TPCN3 protein coding
3 ENSGALG00000010843 37942007 37967000 GPR137B protein coding
3 ENSGALG00000040702 79329300 79439703 BCKDHB protein coding
3 ENSGALG00000010812 37306402 37666241 RYR2 protein coding
3 ENSGALG00000044806 37972758 37973736 protein coding
3 ENSGALG00000014964 64078495 64198524 NT5DC1 protein coding
3 ENSGALG00000016362 92246030 92274846 SH3YL1 protein coding
3 ENSGALG00000013647 50738394 50765171 TFB1M protein coding
3 ENSGALG00000034081 35081760 35226507 AKT3 protein coding
3 ENSGALG00000015878 79685822 79697524 LCA5 protein coding

375
Chr Gene stable ID Gene start (bp) Gene end (bp) Gene name Gene type
3 ENSGALG00000014878 62648643 62791218 MAN1A1 protein coding
3 ENSGALG00000015897 80679194 80732860 IMPG1 protein coding
3 ENSGALG00000034684 33116938 33125450 lincRNA
3 ENSGALG00000036733 38389716 38390740 lincRNA
3 ENSGALG00000036112 50058811 50161705 lincRNA
3 ENSGALG00000036541 64483871 64693281 lincRNA
3 ENSGALG00000041312 80383288 80482931 lincRNA
3 ENSGALG00000046621 84306206 84498020 lincRNA
4 ENSGALG00000038140 25162884 25180520 protein coding
4 ENSGALG00000010611 39613075 39632176 CFAP97 protein coding
4 ENSGALG00000009639 25181859 25200923 protein coding
4 ENSGALG00000020210 39752033 39762452 CENPU protein coding
4 ENSGALG00000009870 30233254 30265397 IL15 protein coding
4 ENSGALG00000010614 39636713 39639533 SLC25A4 protein coding
4 ENSGALG00000039411 37840437 37922607 COL25A1 protein coding
4 ENSGALG00000012044 57097275 57432432 ANK2 protein coding
4 ENSGALG00000010628 39713691 39752253 ACSL1 protein coding
4 ENSGALG00000008517 16449974 16457382 MCTS1 protein coding
4 ENSGALG00000008404 14268127 14292407 protein coding
4 ENSGALG00000008559 16458726 16479086 CUL4B protein coding
4 ENSGALG00000031591 16479446 16482772 lincRNA
4 ENSGALG00000029613 27043314 27051634 lincRNA
4 ENSGALG00000032527 27396660 27628525 lincRNA
4 ENSGALG00000031625 27600624 27601331 lincRNA
4 ENSGALG00000035886 27788185 27825157 lincRNA
4 ENSGALG00000036104 28160838 28173463 lincRNA
4 ENSGALG00000034709 28904779 28987118 lincRNA
4 ENSGALG00000033902 39639654 39646229 lincRNA
4 ENSGALG00000042431 39652919 39669988 lincRNA
5 ENSGALG00000007178 16777263 16794363 FADS2 protein coding
5 ENSGALG00000027255 40155940 40505519 NRXN3 protein coding
5 ENSGALG00000026386 26193022 26193130 gga-mir-6587 miRNA
5 ENSGALG00000025793 1896796 1896969 RF02271 misc_RNA
5 ENSGALG00000026686 40498715 40498826 miRNA
5 ENSGALG00000011695 6907801 6997396 HIPK3 protein coding
5 ENSGALG00000009345 26454626 26467002 protein coding
5 ENSGALG00000005840 9422736 9478597 DENND5A protein coding
5 ENSGALG00000020485 16740019 16749937 protein coding
5 ENSGALG00000032584 21810345 21834715 ALX4 protein coding
5 ENSGALG00000003999 1910717 1996488 NAV2 protein coding
5 ENSGALG00000026005 40594965 40606615 DIO2 protein coding
5 ENSGALG00000040761 520312 526176 DRD4 protein coding
5 ENSGALG00000037020 533877 538465 SCT protein coding

376
Chr Gene stable ID Gene start (bp) Gene end (bp) Gene name Gene type
5 ENSGALG00000007203 16802946 16816245 RAB3IL1 protein coding
5 ENSGALG00000006368 12685002 12717134 PTPN5 protein coding
5 ENSGALG00000012103 5540164 5584404 CCDC73 protein coding
5 ENSGALG00000023243 26166529 26171162 protein coding
5 ENSGALG00000009292 26171455 26176330 protein coding
5 ENSGALG00000020454 26192258 26194122 C5H14ORF169 protein coding
5 ENSGALG00000009315 26297611 26324915 PAPLN protein coding
5 ENSGALG00000011685 6997540 7041138 CSTF3 protein coding
5 ENSGALG00000009352 26488837 26646463 DPF3 protein coding
5 ENSGALG00000041460 16801352 16802718 lincRNA
5 ENSGALG00000042882 21829440 21830894 lincRNA
5 ENSGALG00000041420 25881336 25883509 lincRNA
5 ENSGALG00000034752 26199697 26200631 lincRNA
5 ENSGALG00000033973 26652505 26660856 lincRNA
6 ENSGALG00000008555 25836094 25887995 MXI1 protein coding
6 ENSGALG00000023925 16567737 16581736 CYP2C45 protein coding
6 ENSGALG00000046543 27677917 27680388 protein coding
6 ENSGALG00000008949 27679147 27680421 ADRB1 protein coding
6 ENSGALG00000020899 16538881 16556264 protein coding
6 ENSGALG00000004980 13362771 13800472 KCNMA1 protein coding
6 ENSGALG00000005462 16560253 16564764 ZP4 protein coding
6 ENSGALG00000004947 13158194 13188974 POLR3A protein coding
6 ENSGALG00000034133 13321781 13363451 lincRNA
7 ENSGALG00000012045 28138613 28160700 SLC12A8 protein coding
7 ENSGALG00000012156 29342320 29524384 DPP10 protein coding
7 ENSGALG00000039730 2562997 2593595 protein coding
7 ENSGALG00000041563 2614780 2681771 protein coding
7 ENSGALG00000023742 6580483 6603208 AHR2 protein coding
7 ENSGALG00000008896 14159350 14200241 PPP1R1C protein coding
7 ENSGALG00000004322 6604479 6617381 AHR1B protein coding
7 ENSGALG00000045127 28175773 28181470 lincRNA
8 ENSGALG00000042744 3575631 3578451 RGS2 protein coding
8 ENSGALG00000006864 16125706 16215909 COL24A1 protein coding
8 ENSGALG00000039327 992070 1140063 VAV3 protein coding
8 ENSGALG00000010230 21118192 21176057 TESK2 protein coding
9 ENSGALG00000006488 4479194 4530082 RYK protein coding
9 ENSGALG00000005256 7630571 7841500 EPHA4 protein coding
9 ENSGALG00000025759 10338213 10382351 TFDP2 protein coding
9 ENSGALG00000003052 9475461 9510946 AGFG1 protein coding
9 ENSGALG00000032053 6576886 6663551 SPSB4 protein coding
9 ENSGALG00000002974 9572308 9638300 SPHKAP protein coding
9 ENSGALG00000030000 10355033 10369237 lincRNA
11 ENSGALG00000000059 19086513 19089789 protein coding

377
Chr Gene stable ID Gene start (bp) Gene end (bp) Gene name Gene type
11 ENSGALG00000025712 19089858 19093054 DEF8 protein coding
11 ENSGALG00000000129 19064511 19086448 TCF25 protein coding
11 ENSGALG00000000516 19022589 19054970 FANCA protein coding
11 ENSGALG00000000521 19057727 19063586 SPIRE2 protein coding
12 ENSGALG00000034572 133147 204669 POC1A protein coding
12 ENSGALG00000030908 3752214 4001595 ATP2B2 protein coding
12 ENSGALG00000043361 116859 196969 lincRNA
13 ENSGALG00000038029 1741593 1756665 protein coding
13 ENSGALG00000041692 1763965 1767318 protein coding
13 ENSGALG00000040751 1773042 1775759 protein coding
13 ENSGALG00000035257 1725583 1768857 lincRNA
13 ENSGALG00000034005 1969580 1974487 lincRNA
14 ENSGALG00000002350 14899419 14963460 DNAH3 protein coding
14 ENSGALG00000038884 12712422 12731398 SRL protein coding
14 ENSGALG00000036819 12286477 12288978 ARHGDIG protein coding
14 ENSGALG00000042322 12387144 12392905 NAA60 protein coding
14 ENSGALG00000029817 4588547 4676355 protein coding
14 ENSGALG00000040648 12289815 12294043 RGS11 protein coding
14 ENSGALG00000039779 12396961 12399421 NUDT16L1 protein coding
14 ENSGALG00000002267 14864772 14882612 DCUN1D3 protein coding
14 ENSGALG00000001866 14407361 14411064 MCHR2 protein coding
14 ENSGALG00000005215 5264613 5339317 CACNA1H protein coding
14 ENSGALG00000002273 14882642 14893170 LYRM1 protein coding
14 ENSGALG00000040070 12282289 12286205 PDIA2 protein coding
14 ENSGALG00000029402 12212172 12280905 AXIN1 protein coding
14 ENSGALG00000007779 12641712 12700251 ADCY9 protein coding
14 ENSGALG00000037492 12399639 12448114 MGRN1 protein coding
14 ENSGALG00000045141 12274279 12275343 protein coding
15 ENSGALG00000025197 749632 749731 gga-mir-1673 miRNA
15 ENSGALG00000001688 742948 780197 SEPT5 protein coding
15 ENSGALG00000025533 762734 762804 gga-mir-1729 miRNA
15 ENSGALG00000001652 711033 740520 SEPT2L protein coding
17 ENSGALG00000008736 2080863 2196807 PNPLA7 protein coding
20 ENSGALG00000007709 12178522 12199808 RTFDC1 protein coding
20 ENSGALG00000007717 12185922 12192543 GCNT7 protein coding
20 ENSGALG00000007912 13326260 13374406 ATP9A protein coding
20 ENSGALG00000034664 13375980 13380558 lincRNA
22 ENSGALG00000026948 3524231 3543372 ADD2 protein coding
22 ENSGALG00000046059 3521490 3523034 lincRNA
23 ENSGALG00000037136 117566 147202 RPS6KA1L protein coding
23 ENSGALG00000039883 24815 28245 PIGV protein coding
23 ENSGALG00000029316 33777 89058 protein coding
24 ENSGALG00000007438 5484062 5488400 protein coding

378
Chr Gene stable ID Gene start (bp) Gene end (bp) Gene name Gene type
24 ENSGALG00000035419 323205 352144 CDON protein coding
24 ENSGALG00000007833 5765420 5775028 protein coding
24 ENSGALG00000007430 5475477 5483503 ARCN1 protein coding
24 ENSGALG00000007839 5780707 5862536 NCAM1 protein coding
24 ENSGALG00000040155 5460918 5470400 ZW10 protein coding
24 ENSGALG00000007418 5457626 5460103 CD3D protein coding
27 ENSGALG00000003162 5398850 5404671 RETREG3 protein coding
27 ENSGALG00000030003 5405581 5413027 protein coding
27 ENSGALG00000003199 5390278 5394159 MLX protein coding
27 ENSGALG00000019741 5394153 5396864 PSMC3IP protein coding
28 ENSGALG00000000629 875633 876795 protein coding
28 ENSGALG00000000621 863498 872099 KANK3 protein coding
28 ENSGALG00000026161 883272 885709 protein coding
28 ENSGALG00000043928 867852 869483 protein coding
28 ENSGALG00000037408 885913 888150 ADMP protein coding
28 ENSGALG00000024398 874867 875414 RPS28 protein coding
28 ENSGALG00000021688 877655 881866 CD320 protein coding
Chr = Chromosome; N = count; LincRNA = Long intergenic noncoding RNAs
Table S 63. Top pairwise Fst values (1%) in Improved Horro and Hugub chickens.
Chr Window start Window end SNP (N) Weighted Fst Mean Fst ZFst
1 181310001 181330000 157 0.70 0.47 5.46
1 35320001 35340000 266 0.68 0.43 5.30
1 147080001 147100000 158 0.66 0.45 5.08
1 126310001 126330000 134 0.66 0.55 5.04
1 147090001 147110000 183 0.65 0.42 4.96
1 146790001 146810000 104 0.64 0.49 4.89
1 146760001 146780000 102 0.64 0.43 4.88
1 59250001 59270000 76 0.64 0.52 4.87
1 146780001 146800000 84 0.64 0.43 4.86
1 151690001 151710000 148 0.63 0.47 4.82
1 151680001 151700000 114 0.63 0.47 4.78
1 33410001 33430000 307 0.63 0.33 4.77
1 146800001 146820000 103 0.62 0.39 4.65
1 126320001 126340000 130 0.61 0.53 4.63
1 146770001 146790000 96 0.61 0.34 4.61
1 152810001 152830000 55 0.61 0.39 4.58
1 181320001 181340000 172 0.61 0.38 4.55
1 19310001 19330000 125 0.61 0.43 4.54
1 159520001 159540000 107 0.60 0.47 4.52
1 43210001 43230000 134 0.60 0.46 4.51

379
Chr Window start Window end SNP (N) Weighted Fst Mean Fst ZFst
1 146990001 147010000 92 0.60 0.43 4.47
1 126300001 126320000 135 0.59 0.50 4.43
1 19300001 19320000 175 0.59 0.41 4.36
1 146810001 146830000 108 0.59 0.33 4.35
1 103250001 103270000 129 0.58 0.40 4.29
1 35330001 35350000 233 0.58 0.40 4.24
1 150310001 150330000 35 0.57 0.45 4.23
1 196010001 196030000 227 0.57 0.40 4.19
1 33400001 33420000 324 0.57 0.36 4.19
1 43200001 43220000 128 0.57 0.40 4.16
1 179030001 179050000 260 0.57 0.38 4.15
1 147050001 147070000 211 0.56 0.37 4.12
1 147100001 147120000 208 0.56 0.37 4.10
1 147040001 147060000 189 0.56 0.33 4.10
1 147020001 147040000 205 0.56 0.38 4.10
1 181840001 181860000 200 0.56 0.42 4.09
1 146920001 146940000 189 0.56 0.31 4.08
1 147010001 147030000 179 0.56 0.36 4.08
1 19380001 19400000 66 0.56 0.34 4.07
1 189490001 189510000 255 0.56 0.32 4.07
1 159110001 159130000 100 0.56 0.36 4.06
1 59230001 59250000 101 0.56 0.29 4.05
1 159530001 159550000 97 0.55 0.37 4.03
1 61340001 61360000 211 0.55 0.32 4.02
1 146980001 147000000 157 0.55 0.41 4.01
1 152790001 152810000 63 0.55 0.37 3.99
1 151630001 151650000 74 0.55 0.37 3.98
1 100530001 100550000 185 0.55 0.48 3.96
1 146910001 146930000 210 0.55 0.32 3.96
1 100540001 100560000 174 0.55 0.47 3.96
1 151620001 151640000 68 0.54 0.35 3.94
1 151670001 151690000 92 0.54 0.35 3.93
1 181850001 181870000 195 0.54 0.38 3.93
1 147030001 147050000 200 0.54 0.35 3.90
1 126240001 126260000 96 0.54 0.47 3.90
1 146130001 146150000 278 0.54 0.27 3.89
1 100520001 100540000 236 0.54 0.45 3.88
1 153460001 153480000 330 0.54 0.41 3.88
1 33850001 33870000 287 0.54 0.33 3.88
1 33880001 33900000 257 0.54 0.34 3.87
1 147110001 147130000 190 0.54 0.42 3.86
1 152800001 152820000 32 0.54 0.33 3.86

380
Chr Window start Window end SNP (N) Weighted Fst Mean Fst ZFst
1 196020001 196040000 244 0.54 0.38 3.86
1 126330001 126350000 116 0.54 0.48 3.85
1 103240001 103260000 113 0.53 0.40 3.82
1 146750001 146770000 66 0.53 0.41 3.80
1 33860001 33880000 287 0.53 0.35 3.77
1 181800001 181820000 248 0.53 0.39 3.76
1 181790001 181810000 169 0.53 0.38 3.76
1 189480001 189500000 247 0.52 0.25 3.74
1 196000001 196020000 281 0.52 0.35 3.74
1 39100001 39120000 276 0.52 0.37 3.73
1 33870001 33890000 299 0.52 0.34 3.73
1 146970001 146990000 152 0.52 0.35 3.71
1 153450001 153470000 353 0.52 0.39 3.71
1 146140001 146160000 270 0.52 0.30 3.70
1 177170001 177190000 152 0.52 0.29 3.70
1 39040001 39060000 270 0.52 0.35 3.70
1 151540001 151560000 99 0.52 0.34 3.69
1 126150001 126170000 185 0.52 0.38 3.69
1 179040001 179060000 252 0.52 0.33 3.69
1 39050001 39070000 255 0.52 0.33 3.68
1 146820001 146840000 176 0.52 0.31 3.68
1 126160001 126180000 196 0.52 0.36 3.67
1 33840001 33860000 303 0.52 0.32 3.67
1 147070001 147090000 196 0.52 0.36 3.66
1 152820001 152840000 86 0.52 0.33 3.66
1 100510001 100530000 230 0.52 0.42 3.65
1 147060001 147080000 242 0.52 0.37 3.65
1 147000001 147020000 89 0.51 0.32 3.62
1 177300001 177320000 328 0.51 0.32 3.60
1 132710001 132730000 244 0.51 0.38 3.60
1 151750001 151770000 160 0.51 0.45 3.59
1 146900001 146920000 195 0.51 0.30 3.58
1 159510001 159530000 66 0.51 0.35 3.58
1 146840001 146860000 114 0.51 0.38 3.56
1 159080001 159100000 113 0.50 0.31 3.55
1 19420001 19440000 158 0.50 0.41 3.54
1 5390001 5410000 176 0.50 0.26 3.53
1 151610001 151630000 66 0.50 0.33 3.53
1 19320001 19340000 105 0.50 0.37 3.53
1 126250001 126270000 109 0.50 0.42 3.52
1 178670001 178690000 350 0.50 0.32 3.52
1 19350001 19370000 90 0.50 0.28 3.48

381
Chr Window start Window end SNP (N) Weighted Fst Mean Fst ZFst
1 147120001 147140000 162 0.50 0.41 3.48
1 19410001 19430000 123 0.50 0.36 3.47
1 85100001 85120000 125 0.50 0.25 3.47
1 126290001 126310000 133 0.50 0.42 3.45
1 142920001 142940000 298 0.50 0.28 3.45
1 151700001 151720000 183 0.49 0.36 3.45
1 36360001 36380000 384 0.49 0.32 3.44
1 146830001 146850000 164 0.49 0.33 3.43
1 178920001 178940000 288 0.49 0.23 3.42
1 146960001 146980000 144 0.49 0.20 3.42
1 179050001 179070000 229 0.49 0.30 3.40
1 177310001 177330000 333 0.49 0.31 3.40
1 177160001 177180000 151 0.49 0.23 3.38
1 19360001 19380000 112 0.49 0.25 3.38
1 19370001 19390000 76 0.49 0.28 3.37
1 151660001 151680000 87 0.49 0.33 3.36
1 142930001 142950000 292 0.49 0.28 3.36
1 150300001 150320000 76 0.49 0.36 3.35
1 177180001 177200000 163 0.49 0.32 3.35
1 5210001 5230000 174 0.49 0.34 3.35
1 82330001 82350000 243 0.48 0.33 3.34
1 78800001 78820000 362 0.48 0.33 3.34
1 179020001 179040000 263 0.48 0.26 3.34
1 190910001 190930000 96 0.48 0.40 3.33
1 39110001 39130000 265 0.48 0.28 3.33
1 28470001 28490000 401 0.48 0.30 3.32
1 153440001 153460000 275 0.48 0.37 3.32
1 177330001 177350000 405 0.48 0.34 3.29
1 140930001 140950000 115 0.48 0.36 3.29
1 177560001 177580000 236 0.48 0.33 3.28
1 5220001 5240000 132 0.48 0.33 3.27
1 126260001 126280000 105 0.48 0.39 3.27
1 67450001 67470000 443 0.48 0.27 3.26
1 177550001 177570000 277 0.48 0.34 3.26
2 73570001 73590000 184 0.82 0.61 6.63
2 73580001 73600000 168 0.81 0.60 6.59
2 21240001 21260000 140 0.80 0.58 6.47
2 73560001 73580000 135 0.78 0.50 6.28
2 139700001 139720000 119 0.76 0.60 6.09
2 73590001 73610000 142 0.75 0.53 5.96
2 21250001 21270000 165 0.75 0.51 5.93
2 149180001 149200000 705 0.74 0.64 5.91

382
Chr Window start Window end SNP (N) Weighted Fst Mean Fst ZFst
2 149170001 149190000 715 0.73 0.63 5.80
2 21260001 21280000 137 0.72 0.52 5.68
2 149190001 149210000 677 0.72 0.61 5.66
2 73520001 73540000 79 0.71 0.51 5.61
2 73530001 73550000 112 0.71 0.48 5.59
2 21230001 21250000 110 0.71 0.46 5.58
2 70870001 70890000 250 0.71 0.56 5.53
2 149200001 149220000 659 0.70 0.59 5.45
2 149160001 149180000 567 0.70 0.57 5.45
2 149210001 149230000 462 0.69 0.57 5.35
2 70880001 70900000 174 0.69 0.52 5.33
2 21270001 21290000 168 0.69 0.51 5.33
2 21990001 22010000 214 0.68 0.48 5.29
2 141780001 141800000 256 0.67 0.37 5.20
2 73550001 73570000 106 0.67 0.33 5.18
2 149220001 149240000 223 0.67 0.52 5.17
2 70860001 70880000 225 0.67 0.51 5.15
2 21980001 22000000 232 0.67 0.46 5.15
2 73650001 73670000 76 0.67 0.54 5.14
2 73540001 73560000 115 0.66 0.35 5.12
2 147720001 147740000 189 0.66 0.37 5.09
2 21970001 21990000 231 0.66 0.46 5.07
2 73600001 73620000 120 0.65 0.43 4.99
2 73660001 73680000 80 0.65 0.53 4.94
2 149150001 149170000 278 0.65 0.47 4.94
2 21950001 21970000 190 0.64 0.48 4.90
2 111910001 111930000 213 0.63 0.38 4.80
2 70850001 70870000 216 0.63 0.43 4.78
2 21220001 21240000 192 0.63 0.46 4.78
2 147710001 147730000 171 0.63 0.42 4.77
2 21960001 21980000 189 0.63 0.46 4.75
2 21820001 21840000 319 0.63 0.43 4.74
2 147730001 147750000 190 0.62 0.30 4.69
2 73610001 73630000 106 0.62 0.38 4.68
2 73640001 73660000 95 0.61 0.42 4.63
2 21830001 21850000 309 0.61 0.41 4.56
2 141790001 141810000 283 0.61 0.28 4.55
2 146070001 146090000 153 0.61 0.44 4.55
2 111900001 111920000 257 0.60 0.42 4.51
2 73670001 73690000 90 0.60 0.45 4.51
2 146060001 146080000 170 0.60 0.42 4.50
2 147700001 147720000 171 0.59 0.40 4.43

383
Chr Window start Window end SNP (N) Weighted Fst Mean Fst ZFst
2 21210001 21230000 212 0.59 0.43 4.36
2 139710001 139730000 165 0.59 0.42 4.36
2 141820001 141840000 242 0.58 0.25 4.32
2 147310001 147330000 129 0.58 0.53 4.28
2 141770001 141790000 331 0.58 0.28 4.26
2 141740001 141760000 297 0.57 0.33 4.21
2 22610001 22630000 317 0.56 0.36 4.12
2 21280001 21300000 240 0.56 0.42 4.09
2 141810001 141830000 423 0.56 0.20 4.07
2 81210001 81230000 154 0.55 0.30 4.02
2 81220001 81240000 188 0.55 0.29 3.99
2 73620001 73640000 118 0.55 0.29 3.96
2 141750001 141770000 337 0.55 0.32 3.95
2 70840001 70860000 254 0.54 0.39 3.92
2 20090001 20110000 195 0.54 0.36 3.91
2 149230001 149250000 107 0.54 0.37 3.89
2 141800001 141820000 444 0.54 0.18 3.86
2 142260001 142280000 314 0.53 0.37 3.83
2 147350001 147370000 163 0.53 0.48 3.83
2 147300001 147320000 140 0.53 0.45 3.77
2 83410001 83430000 211 0.53 0.38 3.77
2 81200001 81220000 196 0.53 0.28 3.76
2 111890001 111910000 250 0.52 0.40 3.72
2 147390001 147410000 241 0.52 0.42 3.71
2 142270001 142290000 231 0.52 0.37 3.70
2 141730001 141750000 390 0.52 0.28 3.69
2 21810001 21830000 295 0.52 0.38 3.69
2 73630001 73650000 122 0.52 0.29 3.68
2 147360001 147380000 220 0.52 0.45 3.67
2 70890001 70910000 115 0.52 0.36 3.67
2 142910001 142930000 154 0.52 0.30 3.65
2 23010001 23030000 206 0.51 0.33 3.63
2 83420001 83440000 238 0.51 0.25 3.61
2 147400001 147420000 199 0.51 0.41 3.61
2 139690001 139710000 114 0.51 0.39 3.60
2 21880001 21900000 315 0.51 0.38 3.58
2 147340001 147360000 144 0.51 0.44 3.55
2 141830001 141850000 194 0.50 0.23 3.54
2 21940001 21960000 245 0.50 0.38 3.54
2 147690001 147710000 226 0.50 0.36 3.51
2 146180001 146200000 358 0.50 0.35 3.50
2 146880001 146900000 91 0.50 0.43 3.50

384
Chr Window start Window end SNP (N) Weighted Fst Mean Fst ZFst
2 62440001 62460000 302 0.50 0.33 3.50
2 20080001 20100000 254 0.50 0.38 3.46
2 71050001 71070000 137 0.50 0.38 3.45
2 147380001 147400000 263 0.49 0.37 3.45
2 22000001 22020000 291 0.49 0.34 3.45
2 147210001 147230000 109 0.49 0.48 3.44
2 83800001 83820000 360 0.49 0.27 3.44
2 110950001 110970000 316 0.49 0.31 3.43
2 147370001 147390000 259 0.49 0.39 3.43
2 62450001 62470000 274 0.49 0.33 3.40
2 141760001 141780000 394 0.49 0.26 3.39
2 110940001 110960000 309 0.48 0.34 3.31
2 147290001 147310000 124 0.48 0.40 3.29
2 70950001 70970000 163 0.48 0.32 3.29
2 61580001 61600000 211 0.48 0.28 3.29
2 148500001 148520000 279 0.48 0.24 3.28
2 141840001 141860000 263 0.48 0.26 3.28
2 22100001 22120000 191 0.48 0.34 3.27
2 81230001 81250000 180 0.48 0.28 3.27
3 90980001 91000000 98 0.79 0.58 6.32
3 90520001 90540000 67 0.75 0.55 5.96
3 90990001 91010000 88 0.70 0.47 5.50
3 89840001 89860000 206 0.68 0.54 5.31
3 89330001 89350000 247 0.68 0.46 5.30
3 90810001 90830000 184 0.67 0.54 5.15
3 89680001 89700000 204 0.65 0.48 4.96
3 90510001 90530000 125 0.64 0.48 4.88
3 89850001 89870000 197 0.64 0.45 4.87
3 86440001 86460000 136 0.64 0.43 4.87
3 89690001 89710000 186 0.64 0.49 4.85
3 90970001 90990000 123 0.63 0.44 4.80
3 89340001 89360000 231 0.63 0.42 4.74
3 91010001 91030000 95 0.62 0.40 4.73
3 90950001 90970000 21 0.62 0.55 4.69
3 91020001 91040000 94 0.61 0.41 4.59
3 90060001 90080000 138 0.61 0.39 4.57
3 35300001 35320000 330 0.60 0.43 4.51
3 86430001 86450000 244 0.60 0.38 4.45
3 90500001 90520000 171 0.59 0.44 4.44
3 86450001 86470000 67 0.59 0.32 4.41
3 92220001 92240000 226 0.59 0.40 4.37
3 90620001 90640000 186 0.59 0.34 4.34

385
Chr Window start Window end SNP (N) Weighted Fst Mean Fst ZFst
3 86460001 86480000 97 0.58 0.32 4.32
3 86470001 86490000 111 0.58 0.30 4.30
3 88320001 88340000 72 0.58 0.45 4.24
3 86480001 86500000 144 0.58 0.34 4.24
3 91000001 91020000 92 0.57 0.35 4.17
3 86390001 86410000 187 0.57 0.30 4.17
3 91050001 91070000 94 0.57 0.47 4.16
3 86270001 86290000 129 0.57 0.27 4.16
3 90360001 90380000 194 0.57 0.48 4.15
3 90800001 90820000 162 0.57 0.47 4.15
3 88840001 88860000 269 0.57 0.45 4.15
3 90960001 90980000 85 0.57 0.39 4.15
3 90530001 90550000 120 0.56 0.41 4.13
3 90630001 90650000 205 0.56 0.33 4.11
3 81240001 81260000 237 0.56 0.36 4.10
3 86380001 86400000 151 0.56 0.29 4.09
3 92190001 92210000 266 0.56 0.40 4.07
3 89320001 89340000 211 0.56 0.37 4.05
3 35290001 35310000 277 0.56 0.37 4.05
3 35310001 35330000 373 0.55 0.40 4.04
3 53590001 53610000 122 0.55 0.31 4.00
3 86300001 86320000 195 0.55 0.29 3.98
3 90820001 90840000 181 0.55 0.45 3.96
3 91040001 91060000 107 0.55 0.45 3.96
3 86370001 86390000 107 0.55 0.36 3.96
3 89670001 89690000 179 0.55 0.40 3.95
3 86280001 86300000 130 0.55 0.26 3.95
3 61470001 61490000 317 0.54 0.27 3.94
3 86530001 86550000 182 0.54 0.42 3.93
3 33110001 33130000 278 0.54 0.40 3.91
3 92200001 92220000 274 0.54 0.35 3.90
3 86200001 86220000 149 0.54 0.39 3.90
3 90050001 90070000 143 0.54 0.36 3.90
3 86310001 86330000 210 0.54 0.24 3.87
3 88180001 88200000 159 0.53 0.31 3.83
3 86210001 86230000 181 0.53 0.37 3.83
3 86360001 86380000 93 0.53 0.35 3.82
3 86490001 86510000 160 0.53 0.35 3.79
3 90350001 90370000 223 0.53 0.42 3.78
3 86220001 86240000 207 0.53 0.31 3.78
3 92210001 92230000 263 0.53 0.33 3.77
3 86420001 86440000 229 0.53 0.27 3.76

386
Chr Window start Window end SNP (N) Weighted Fst Mean Fst ZFst
3 90690001 90710000 121 0.52 0.43 3.74
3 86520001 86540000 189 0.52 0.43 3.72
3 86540001 86560000 176 0.52 0.38 3.71
3 91030001 91050000 88 0.52 0.37 3.70
3 50060001 50080000 110 0.52 0.49 3.69
3 53600001 53620000 113 0.52 0.30 3.69
3 90640001 90660000 164 0.52 0.31 3.68
3 53610001 53630000 122 0.52 0.29 3.67
3 79800001 79820000 280 0.52 0.35 3.66
3 33100001 33120000 231 0.51 0.35 3.64
3 86230001 86250000 303 0.51 0.26 3.63
3 91340001 91360000 278 0.51 0.36 3.63
3 35280001 35300000 229 0.51 0.36 3.62
3 86550001 86570000 150 0.51 0.35 3.60
3 81160001 81180000 227 0.51 0.37 3.60
3 86400001 86420000 187 0.51 0.24 3.57
3 81250001 81270000 225 0.50 0.31 3.52
3 86240001 86260000 277 0.50 0.22 3.48
3 90210001 90230000 132 0.50 0.37 3.46
3 91060001 91080000 104 0.50 0.28 3.45
3 78560001 78580000 290 0.50 0.31 3.45
3 87340001 87360000 189 0.50 0.33 3.45
3 88850001 88870000 283 0.49 0.41 3.44
3 86350001 86370000 122 0.49 0.22 3.43
3 91460001 91480000 61 0.49 0.38 3.43
3 43680001 43700000 253 0.49 0.28 3.43
3 91330001 91350000 348 0.49 0.34 3.42
3 87350001 87370000 265 0.49 0.34 3.42
3 90840001 90860000 159 0.49 0.41 3.40
3 104600001 104620000 254 0.49 0.37 3.40
3 12210001 12230000 76 0.49 0.34 3.37
3 90610001 90630000 143 0.49 0.32 3.37
3 90370001 90390000 183 0.49 0.41 3.36
3 10720001 10740000 219 0.49 0.31 3.36
3 90830001 90850000 154 0.49 0.41 3.35
3 81290001 81310000 185 0.48 0.36 3.33
3 91380001 91400000 159 0.48 0.37 3.31
3 86560001 86580000 133 0.48 0.24 3.30
3 27560001 27580000 221 0.48 0.36 3.30
3 10690001 10710000 130 0.48 0.33 3.29
3 81260001 81280000 239 0.48 0.28 3.28
3 84880001 84900000 48 0.48 0.42 3.28

387
Chr Window start Window end SNP (N) Weighted Fst Mean Fst ZFst
3 89040001 89060000 226 0.48 0.30 3.28
3 81280001 81300000 218 0.48 0.35 3.28
3 84870001 84890000 119 0.48 0.43 3.27
4 27880001 27900000 133 0.78 0.53 6.26
4 27890001 27910000 77 0.78 0.50 6.25
4 27870001 27890000 124 0.75 0.45 5.95
4 28010001 28030000 56 0.74 0.51 5.88
4 27990001 28010000 42 0.73 0.42 5.82
4 27910001 27930000 123 0.73 0.48 5.79
4 28020001 28040000 57 0.73 0.50 5.78
4 27980001 28000000 31 0.72 0.48 5.71
4 28700001 28720000 147 0.72 0.51 5.68
4 28710001 28730000 114 0.71 0.52 5.55
4 28000001 28020000 49 0.71 0.43 5.53
4 27920001 27940000 133 0.71 0.50 5.53
4 28670001 28690000 138 0.70 0.50 5.49
4 27900001 27920000 52 0.70 0.33 5.47
4 28230001 28250000 127 0.70 0.51 5.44
4 28220001 28240000 160 0.68 0.60 5.27
4 28030001 28050000 93 0.68 0.52 5.24
4 27840001 27860000 64 0.67 0.29 5.22
4 27830001 27850000 96 0.67 0.34 5.22
4 28490001 28510000 68 0.67 0.36 5.22
4 28500001 28520000 92 0.67 0.36 5.22
4 28680001 28700000 161 0.67 0.46 5.19
4 27660001 27680000 127 0.67 0.61 5.19
4 20010001 20030000 31 0.67 0.46 5.15
4 27860001 27880000 90 0.67 0.30 5.14
4 28690001 28710000 164 0.67 0.43 5.14
4 28660001 28680000 102 0.66 0.35 5.08
4 20160001 20180000 36 0.66 0.45 5.07
4 28750001 28770000 211 0.66 0.45 5.04
4 28740001 28760000 116 0.65 0.34 4.99
4 28760001 28780000 174 0.65 0.43 4.99
4 27650001 27670000 116 0.65 0.56 4.99
4 27670001 27690000 64 0.65 0.57 4.98
4 28770001 28790000 103 0.65 0.39 4.94
4 27490001 27510000 89 0.64 0.44 4.92
4 28510001 28530000 69 0.64 0.36 4.91
4 27820001 27840000 96 0.64 0.28 4.89
4 25710001 25730000 345 0.64 0.34 4.87
4 28040001 28060000 133 0.64 0.50 4.87
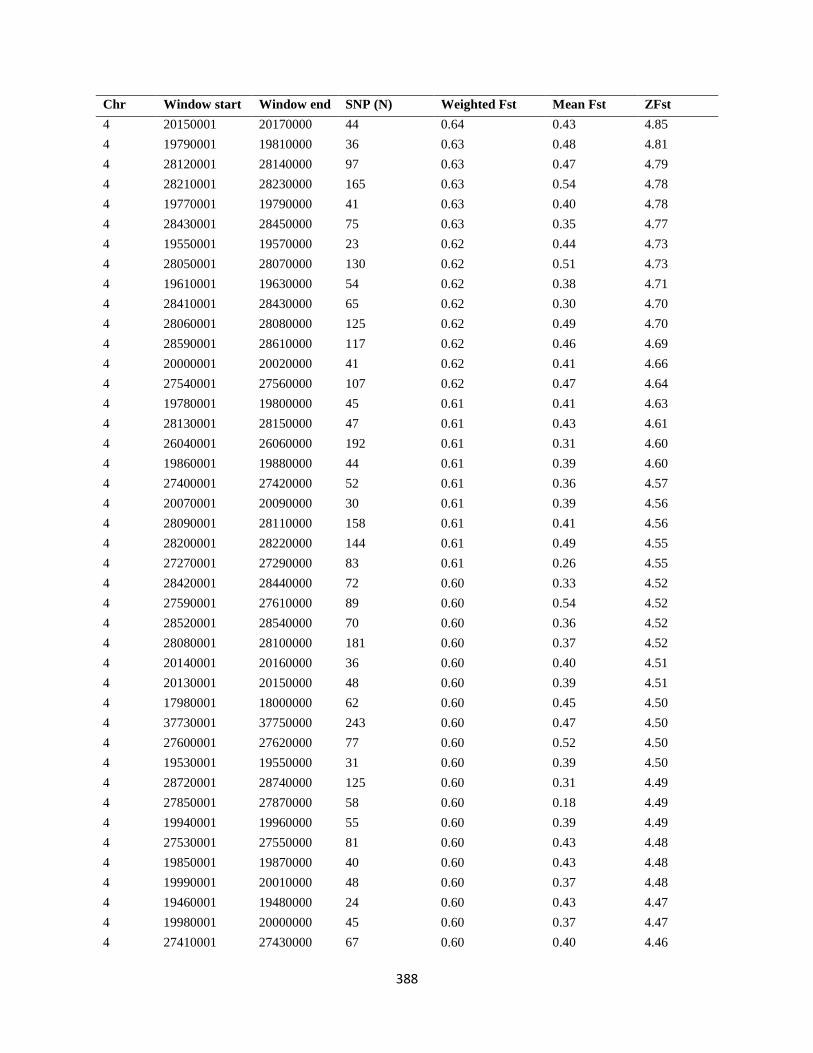
388
Chr Window start Window end SNP (N) Weighted Fst Mean Fst ZFst
4 20150001 20170000 44 0.64 0.43 4.85
4 19790001 19810000 36 0.63 0.48 4.81
4 28120001 28140000 97 0.63 0.47 4.79
4 28210001 28230000 165 0.63 0.54 4.78
4 19770001 19790000 41 0.63 0.40 4.78
4 28430001 28450000 75 0.63 0.35 4.77
4 19550001 19570000 23 0.62 0.44 4.73
4 28050001 28070000 130 0.62 0.51 4.73
4 19610001 19630000 54 0.62 0.38 4.71
4 28410001 28430000 65 0.62 0.30 4.70
4 28060001 28080000 125 0.62 0.49 4.70
4 28590001 28610000 117 0.62 0.46 4.69
4 20000001 20020000 41 0.62 0.41 4.66
4 27540001 27560000 107 0.62 0.47 4.64
4 19780001 19800000 45 0.61 0.41 4.63
4 28130001 28150000 47 0.61 0.43 4.61
4 26040001 26060000 192 0.61 0.31 4.60
4 19860001 19880000 44 0.61 0.39 4.60
4 27400001 27420000 52 0.61 0.36 4.57
4 20070001 20090000 30 0.61 0.39 4.56
4 28090001 28110000 158 0.61 0.41 4.56
4 28200001 28220000 144 0.61 0.49 4.55
4 27270001 27290000 83 0.61 0.26 4.55
4 28420001 28440000 72 0.60 0.33 4.52
4 27590001 27610000 89 0.60 0.54 4.52
4 28520001 28540000 70 0.60 0.36 4.52
4 28080001 28100000 181 0.60 0.37 4.52
4 20140001 20160000 36 0.60 0.40 4.51
4 20130001 20150000 48 0.60 0.39 4.51
4 17980001 18000000 62 0.60 0.45 4.50
4 37730001 37750000 243 0.60 0.47 4.50
4 27600001 27620000 77 0.60 0.52 4.50
4 19530001 19550000 31 0.60 0.39 4.50
4 28720001 28740000 125 0.60 0.31 4.49
4 27850001 27870000 58 0.60 0.18 4.49
4 19940001 19960000 55 0.60 0.39 4.49
4 27530001 27550000 81 0.60 0.43 4.48
4 19850001 19870000 40 0.60 0.43 4.48
4 19990001 20010000 48 0.60 0.37 4.48
4 19460001 19480000 24 0.60 0.43 4.47
4 19980001 20000000 45 0.60 0.37 4.47
4 27410001 27430000 67 0.60 0.40 4.46

389
Chr Window start Window end SNP (N) Weighted Fst Mean Fst ZFst
4 19670001 19690000 53 0.60 0.44 4.45
4 19680001 19700000 63 0.60 0.40 4.45
4 27480001 27500000 125 0.60 0.40 4.45
4 37720001 37740000 314 0.60 0.43 4.44
4 20020001 20040000 28 0.60 0.39 4.44
4 28170001 28190000 83 0.59 0.49 4.44
4 19350001 19370000 27 0.59 0.39 4.44
4 28180001 28200000 127 0.59 0.46 4.43
4 28530001 28550000 72 0.59 0.34 4.42
4 28160001 28180000 24 0.59 0.49 4.41
4 19410001 19430000 36 0.59 0.34 4.41
4 17970001 17990000 64 0.59 0.47 4.41
4 28190001 28210000 135 0.59 0.45 4.40
4 28460001 28480000 48 0.59 0.26 4.40
4 19820001 19840000 45 0.59 0.36 4.40
4 19440001 19460000 30 0.59 0.42 4.40
4 28400001 28420000 74 0.59 0.31 4.37
4 19700001 19720000 21 0.59 0.36 4.37
4 28600001 28620000 116 0.59 0.36 4.37
4 28440001 28460000 61 0.59 0.27 4.37
4 20060001 20080000 45 0.59 0.41 4.36
4 19520001 19540000 47 0.59 0.41 4.36
4 19560001 19580000 38 0.59 0.39 4.35
4 19800001 19820000 42 0.59 0.38 4.35
4 28730001 28750000 110 0.59 0.21 4.35
4 20310001 20330000 55 0.59 0.38 4.35
4 27040001 27060000 93 0.59 0.36 4.35
4 26490001 26510000 143 0.58 0.34 4.34
4 28110001 28130000 119 0.58 0.40 4.33
4 20170001 20190000 25 0.58 0.38 4.33
4 27720001 27740000 30 0.58 0.44 4.33
4 20220001 20240000 40 0.58 0.35 4.33
4 19970001 19990000 38 0.58 0.35 4.32
4 19470001 19490000 47 0.58 0.38 4.31
4 27930001 27950000 90 0.58 0.37 4.31
4 19640001 19660000 48 0.58 0.32 4.31
4 19960001 19980000 49 0.58 0.37 4.30
4 27550001 27570000 113 0.58 0.42 4.30
4 16450001 16470000 259 0.58 0.39 4.30
4 20230001 20250000 38 0.58 0.36 4.29
4 41830001 41850000 107 0.58 0.45 4.28
4 19620001 19640000 61 0.58 0.34 4.27

390
Chr Window start Window end SNP (N) Weighted Fst Mean Fst ZFst
4 28920001 28940000 185 0.58 0.36 4.26
4 25720001 25740000 331 0.58 0.28 4.26
4 7420001 7440000 136 0.58 0.52 4.26
4 27680001 27700000 74 0.58 0.50 4.26
4 20100001 20120000 55 0.58 0.41 4.26
4 27610001 27630000 69 0.58 0.45 4.25
4 19690001 19710000 52 0.58 0.34 4.25
4 26120001 26140000 139 0.58 0.31 4.25
4 16460001 16480000 233 0.58 0.46 4.24
4 27970001 27990000 40 0.58 0.34 4.24
4 19650001 19670000 56 0.57 0.33 4.24
4 19870001 19890000 44 0.57 0.37 4.24
4 20120001 20140000 51 0.57 0.35 4.23
4 19950001 19970000 61 0.57 0.38 4.23
4 27810001 27830000 51 0.57 0.25 4.23
4 27620001 27640000 81 0.57 0.40 4.22
4 28070001 28090000 145 0.57 0.34 4.21
4 26050001 26070000 213 0.57 0.27 4.20
4 27030001 27050000 138 0.57 0.37 4.19
4 19810001 19830000 49 0.57 0.35 4.19
4 26030001 26050000 184 0.57 0.30 4.18
4 25680001 25700000 372 0.57 0.31 4.18
4 20300001 20320000 41 0.57 0.41 4.18
4 26500001 26520000 128 0.57 0.31 4.18
4 39730001 39750000 377 0.57 0.42 4.17
4 27280001 27300000 121 0.57 0.34 4.16
4 20110001 20130000 50 0.57 0.40 4.16
4 25730001 25750000 304 0.57 0.28 4.15
4 75370001 75390000 175 0.57 0.38 4.15
4 7410001 7430000 147 0.56 0.51 4.14
4 27260001 27280000 91 0.56 0.31 4.14
4 20080001 20100000 34 0.56 0.38 4.13
4 27580001 27600000 84 0.56 0.42 4.13
4 7720001 7740000 257 0.56 0.24 4.12
4 25670001 25690000 422 0.56 0.29 4.12
4 27750001 27770000 31 0.56 0.29 4.10
4 20210001 20230000 47 0.56 0.32 4.10
4 20180001 20200000 24 0.56 0.36 4.10
4 39720001 39740000 331 0.56 0.42 4.10
4 19840001 19860000 34 0.56 0.39 4.10
4 27520001 27540000 79 0.56 0.41 4.09
4 20290001 20310000 31 0.56 0.40 4.09

391
Chr Window start Window end SNP (N) Weighted Fst Mean Fst ZFst
4 20090001 20110000 50 0.56 0.36 4.08
4 19480001 19500000 51 0.56 0.30 4.07
4 28370001 28390000 87 0.56 0.27 4.07
4 41840001 41860000 95 0.56 0.40 4.07
4 27690001 27710000 108 0.56 0.49 4.07
4 39700001 39720000 192 0.56 0.43 4.06
4 19830001 19850000 36 0.56 0.35 4.06
4 20320001 20340000 54 0.56 0.30 4.06
4 27390001 27410000 86 0.56 0.39 4.06
4 19580001 19600000 62 0.56 0.35 4.06
4 27630001 27650000 78 0.56 0.35 4.05
4 19570001 19590000 56 0.55 0.35 4.04
4 26070001 26090000 250 0.55 0.32 4.03
4 26080001 26100000 201 0.55 0.28 4.03
4 19660001 19680000 50 0.55 0.36 4.03
4 25700001 25720000 328 0.55 0.22 4.02
4 28540001 28560000 78 0.55 0.25 4.01
4 7580001 7600000 141 0.55 0.41 4.01
4 28380001 28400000 90 0.55 0.28 4.00
4 25740001 25760000 358 0.55 0.32 3.99
4 27640001 27660000 71 0.55 0.34 3.99
4 19400001 19420000 40 0.55 0.30 3.99
4 28800001 28820000 241 0.55 0.26 3.99
4 27730001 27750000 23 0.55 0.45 3.99
4 41820001 41840000 98 0.55 0.38 3.99
4 27710001 27730000 57 0.55 0.45 3.99
4 7430001 7450000 151 0.55 0.49 3.98
4 27760001 27780000 44 0.55 0.26 3.97
4 6620001 6640000 102 0.55 0.47 3.97
4 28780001 28800000 142 0.55 0.23 3.97
4 41850001 41870000 93 0.55 0.42 3.97
4 27700001 27720000 92 0.55 0.49 3.96
4 27790001 27810000 55 0.55 0.23 3.95
4 54030001 54050000 206 0.55 0.33 3.95
4 28450001 28470000 60 0.55 0.25 3.94
4 26110001 26130000 206 0.55 0.29 3.94
4 19600001 19620000 48 0.54 0.31 3.94
4 20050001 20070000 52 0.54 0.38 3.93
4 19510001 19530000 50 0.54 0.35 3.93
4 28360001 28380000 95 0.54 0.29 3.93
4 28350001 28370000 102 0.54 0.34 3.93
4 26700001 26720000 133 0.54 0.30 3.92

392
Chr Window start Window end SNP (N) Weighted Fst Mean Fst ZFst
4 20030001 20050000 24 0.54 0.40 3.91
4 26060001 26080000 266 0.54 0.31 3.91
4 28100001 28120000 128 0.54 0.33 3.91
4 27800001 27820000 47 0.54 0.21 3.90
4 27780001 27800000 44 0.54 0.22 3.89
4 27740001 27760000 23 0.54 0.34 3.89
4 39710001 39730000 268 0.54 0.44 3.89
4 26690001 26710000 135 0.54 0.32 3.88
4 19590001 19610000 51 0.54 0.34 3.87
4 26020001 26040000 194 0.54 0.25 3.87
4 20200001 20220000 34 0.54 0.29 3.87
4 20240001 20260000 45 0.54 0.31 3.86
4 42060001 42080000 45 0.54 0.45 3.85
4 26480001 26500000 144 0.54 0.31 3.85
4 28910001 28930000 133 0.54 0.35 3.85
4 28810001 28830000 197 0.54 0.20 3.84
4 17960001 17980000 84 0.53 0.38 3.83
4 28240001 28260000 120 0.53 0.28 3.82
4 53580001 53600000 198 0.53 0.34 3.82
4 19360001 19380000 43 0.53 0.31 3.82
4 19500001 19520000 49 0.53 0.31 3.81
4 40530001 40550000 286 0.53 0.42 3.80
4 27940001 27960000 48 0.53 0.35 3.79
4 28390001 28410000 89 0.53 0.28 3.77
4 19420001 19440000 30 0.53 0.29 3.77
4 37710001 37730000 300 0.53 0.34 3.77
4 19930001 19950000 57 0.53 0.30 3.77
4 7080001 7100000 125 0.53 0.44 3.76
4 27950001 27970000 29 0.53 0.32 3.76
4 27370001 27390000 126 0.52 0.41 3.73
4 17800001 17820000 111 0.52 0.37 3.72
4 19630001 19650000 52 0.52 0.28 3.72
4 19880001 19900000 55 0.52 0.32 3.71
4 27770001 27790000 43 0.52 0.18 3.70
4 27510001 27530000 92 0.52 0.41 3.68
4 40200001 40220000 233 0.52 0.44 3.66
4 37810001 37830000 145 0.52 0.35 3.66
4 27560001 27580000 104 0.52 0.31 3.65
4 25770001 25790000 269 0.52 0.36 3.65
4 28340001 28360000 118 0.51 0.33 3.65
4 7400001 7420000 166 0.51 0.46 3.64
4 28790001 28810000 195 0.51 0.22 3.62

393
Chr Window start Window end SNP (N) Weighted Fst Mean Fst ZFst
4 40210001 40230000 233 0.51 0.39 3.62
4 27420001 27440000 135 0.51 0.38 3.61
4 26710001 26730000 137 0.51 0.27 3.61
4 39740001 39760000 382 0.51 0.39 3.61
4 7570001 7590000 102 0.51 0.32 3.61
4 19380001 19400000 40 0.51 0.31 3.60
4 19490001 19510000 52 0.51 0.27 3.60
4 7440001 7460000 117 0.51 0.46 3.60
4 20400001 20420000 95 0.51 0.39 3.59
4 25780001 25800000 248 0.51 0.38 3.58
4 20040001 20060000 35 0.51 0.33 3.58
4 6610001 6630000 102 0.51 0.38 3.57
4 20270001 20290000 57 0.51 0.31 3.56
4 26460001 26480000 133 0.51 0.27 3.56
4 26720001 26740000 154 0.51 0.27 3.56
4 5860001 5880000 315 0.51 0.38 3.55
4 19390001 19410000 42 0.51 0.29 3.55
4 26090001 26110000 201 0.50 0.24 3.54
4 20260001 20280000 52 0.50 0.30 3.53
4 26450001 26470000 160 0.50 0.25 3.53
4 20650001 20670000 162 0.50 0.32 3.52
4 20280001 20300000 37 0.50 0.33 3.52
4 26430001 26450000 207 0.50 0.20 3.51
4 28580001 28600000 121 0.50 0.28 3.51
4 21670001 21690000 177 0.50 0.38 3.51
4 20390001 20410000 115 0.50 0.37 3.50
4 26440001 26460000 216 0.50 0.20 3.50
4 19430001 19450000 30 0.50 0.31 3.50
4 25940001 25960000 287 0.50 0.33 3.49
4 7070001 7090000 217 0.50 0.36 3.48
4 27360001 27380000 130 0.50 0.33 3.48
4 20610001 20630000 170 0.50 0.31 3.47
4 27290001 27310000 118 0.50 0.33 3.47
4 27570001 27590000 91 0.50 0.28 3.47
4 28610001 28630000 146 0.50 0.20 3.46
4 40520001 40540000 221 0.50 0.37 3.46
4 19910001 19930000 36 0.50 0.35 3.46
4 49170001 49190000 311 0.50 0.41 3.45
4 26470001 26490000 128 0.49 0.26 3.45
4 26010001 26030000 194 0.49 0.20 3.44
4 27250001 27270000 121 0.49 0.31 3.44
4 27120001 27140000 93 0.49 0.36 3.44
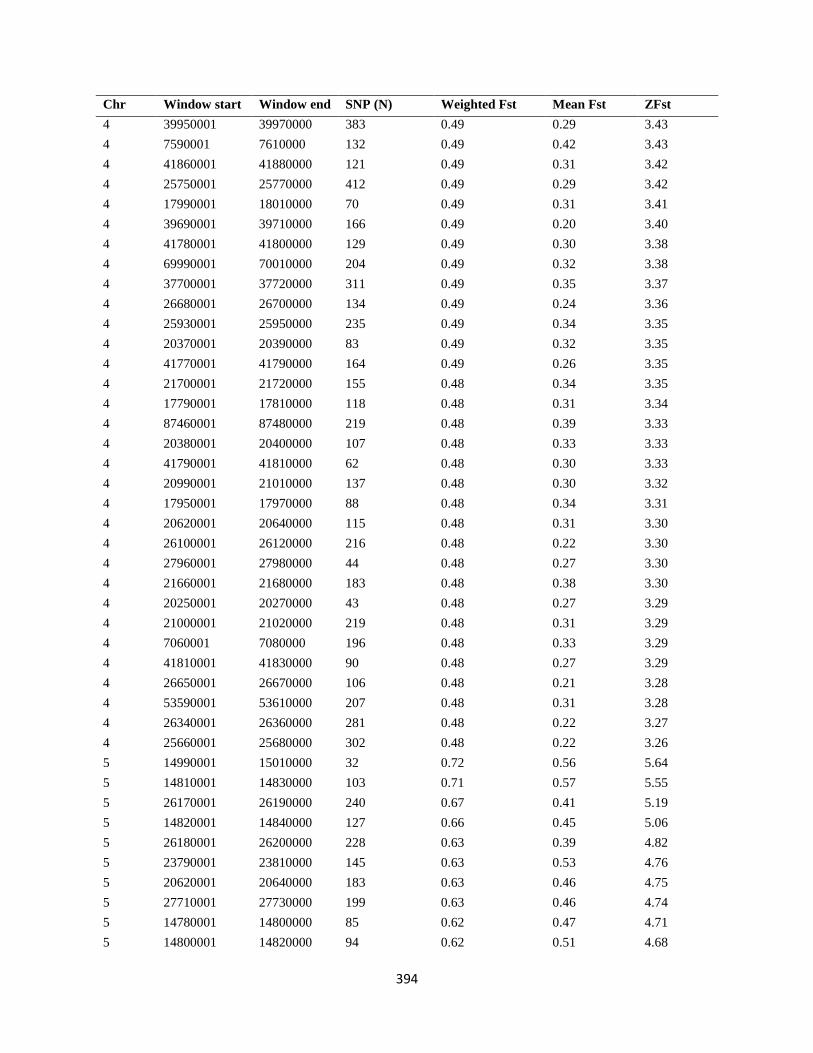
394
Chr Window start Window end SNP (N) Weighted Fst Mean Fst ZFst
4 39950001 39970000 383 0.49 0.29 3.43
4 7590001 7610000 132 0.49 0.42 3.43
4 41860001 41880000 121 0.49 0.31 3.42
4 25750001 25770000 412 0.49 0.29 3.42
4 17990001 18010000 70 0.49 0.31 3.41
4 39690001 39710000 166 0.49 0.20 3.40
4 41780001 41800000 129 0.49 0.30 3.38
4 69990001 70010000 204 0.49 0.32 3.38
4 37700001 37720000 311 0.49 0.35 3.37
4 26680001 26700000 134 0.49 0.24 3.36
4 25930001 25950000 235 0.49 0.34 3.35
4 20370001 20390000 83 0.49 0.32 3.35
4 41770001 41790000 164 0.49 0.26 3.35
4 21700001 21720000 155 0.48 0.34 3.35
4 17790001 17810000 118 0.48 0.31 3.34
4 87460001 87480000 219 0.48 0.39 3.33
4 20380001 20400000 107 0.48 0.33 3.33
4 41790001 41810000 62 0.48 0.30 3.33
4 20990001 21010000 137 0.48 0.30 3.32
4 17950001 17970000 88 0.48 0.34 3.31
4 20620001 20640000 115 0.48 0.31 3.30
4 26100001 26120000 216 0.48 0.22 3.30
4 27960001 27980000 44 0.48 0.27 3.30
4 21660001 21680000 183 0.48 0.38 3.30
4 20250001 20270000 43 0.48 0.27 3.29
4 21000001 21020000 219 0.48 0.31 3.29
4 7060001 7080000 196 0.48 0.33 3.29
4 41810001 41830000 90 0.48 0.27 3.29
4 26650001 26670000 106 0.48 0.21 3.28
4 53590001 53610000 207 0.48 0.31 3.28
4 26340001 26360000 281 0.48 0.22 3.27
4 25660001 25680000 302 0.48 0.22 3.26
5 14990001 15010000 32 0.72 0.56 5.64
5 14810001 14830000 103 0.71 0.57 5.55
5 26170001 26190000 240 0.67 0.41 5.19
5 14820001 14840000 127 0.66 0.45 5.06
5 26180001 26200000 228 0.63 0.39 4.82
5 23790001 23810000 145 0.63 0.53 4.76
5 20620001 20640000 183 0.63 0.46 4.75
5 27710001 27730000 199 0.63 0.46 4.74
5 14780001 14800000 85 0.62 0.47 4.71
5 14800001 14820000 94 0.62 0.51 4.68

395
Chr Window start Window end SNP (N) Weighted Fst Mean Fst ZFst
5 14790001 14810000 85 0.62 0.51 4.67
5 14770001 14790000 44 0.62 0.45 4.65
5 14950001 14970000 43 0.61 0.43 4.60
5 14980001 15000000 80 0.61 0.38 4.59
5 15210001 15230000 318 0.60 0.38 4.45
5 15340001 15360000 270 0.59 0.38 4.36
5 26450001 26470000 257 0.59 0.38 4.35
5 15200001 15220000 312 0.58 0.39 4.31
5 14960001 14980000 72 0.58 0.39 4.29
5 26160001 26180000 284 0.58 0.34 4.29
5 15330001 15350000 331 0.57 0.35 4.20
5 32860001 32880000 35 0.57 0.46 4.18
5 4810001 4830000 163 0.56 0.40 4.11
5 28010001 28030000 316 0.56 0.43 4.11
5 32730001 32750000 45 0.56 0.43 4.10
5 23780001 23800000 189 0.56 0.42 4.10
5 28000001 28020000 277 0.56 0.40 4.08
5 27720001 27740000 219 0.56 0.36 4.07
5 32810001 32830000 53 0.56 0.44 4.05
5 15190001 15210000 286 0.56 0.36 4.05
5 27150001 27170000 173 0.55 0.45 4.04
5 32870001 32890000 36 0.55 0.47 3.96
5 32600001 32620000 98 0.54 0.42 3.93
5 32800001 32820000 41 0.54 0.34 3.91
5 15430001 15450000 330 0.54 0.38 3.89
5 26460001 26480000 306 0.54 0.30 3.87
5 15180001 15200000 234 0.54 0.34 3.87
5 15320001 15340000 338 0.54 0.32 3.85
5 32720001 32740000 101 0.54 0.40 3.85
5 15350001 15370000 321 0.53 0.33 3.82
5 27160001 27180000 179 0.53 0.42 3.82
5 20610001 20630000 155 0.53 0.39 3.82
5 32820001 32840000 58 0.53 0.42 3.80
5 49220001 49240000 128 0.53 0.38 3.80
5 24030001 24050000 138 0.53 0.36 3.77
5 26120001 26140000 196 0.53 0.36 3.76
5 15420001 15440000 367 0.52 0.37 3.74
5 23800001 23820000 161 0.52 0.44 3.73
5 32690001 32710000 101 0.52 0.35 3.71
5 32670001 32690000 105 0.52 0.37 3.71
5 1900001 1920000 231 0.52 0.31 3.71
5 32660001 32680000 101 0.52 0.42 3.70

396
Chr Window start Window end SNP (N) Weighted Fst Mean Fst ZFst
5 15290001 15310000 286 0.52 0.33 3.70
5 26640001 26660000 207 0.52 0.36 3.69
5 15280001 15300000 239 0.52 0.26 3.69
5 18570001 18590000 170 0.52 0.28 3.69
5 32710001 32730000 126 0.52 0.37 3.68
5 15360001 15380000 337 0.52 0.33 3.66
5 15270001 15290000 233 0.52 0.24 3.66
5 21120001 21140000 170 0.52 0.42 3.66
5 25910001 25930000 265 0.52 0.31 3.66
5 30810001 30830000 193 0.52 0.27 3.65
5 26190001 26210000 269 0.51 0.31 3.64
5 18560001 18580000 126 0.51 0.31 3.64
5 32680001 32700000 111 0.51 0.30 3.62
5 26350001 26370000 185 0.51 0.33 3.61
5 32850001 32870000 33 0.51 0.42 3.60
5 32740001 32760000 45 0.51 0.37 3.59
5 32790001 32810000 44 0.51 0.35 3.59
5 32700001 32720000 94 0.51 0.36 3.59
5 1830001 1850000 371 0.51 0.35 3.58
5 23820001 23840000 265 0.51 0.43 3.57
5 23810001 23830000 212 0.51 0.45 3.57
5 15170001 15190000 306 0.51 0.35 3.55
5 32590001 32610000 122 0.50 0.42 3.54
5 25900001 25920000 240 0.50 0.34 3.52
5 32630001 32650000 109 0.50 0.35 3.50
5 15310001 15330000 228 0.50 0.31 3.48
5 25930001 25950000 317 0.50 0.29 3.48
5 5540001 5560000 325 0.50 0.29 3.47
5 27500001 27520000 133 0.50 0.35 3.47
5 20630001 20650000 215 0.50 0.37 3.47
5 15260001 15280000 268 0.50 0.30 3.46
5 32830001 32850000 39 0.50 0.39 3.46
5 4820001 4840000 161 0.50 0.39 3.45
5 32620001 32640000 104 0.50 0.34 3.45
5 14890001 14910000 134 0.50 0.36 3.45
5 5550001 5570000 369 0.49 0.33 3.44
5 20720001 20740000 135 0.49 0.42 3.44
5 15440001 15460000 299 0.49 0.33 3.44
5 14840001 14860000 276 0.49 0.33 3.43
5 15220001 15240000 386 0.49 0.31 3.42
5 21780001 21800000 198 0.49 0.38 3.42
5 32650001 32670000 93 0.49 0.38 3.42

397
Chr Window start Window end SNP (N) Weighted Fst Mean Fst ZFst
5 14970001 14990000 81 0.49 0.31 3.42
5 32610001 32630000 84 0.49 0.34 3.41
5 1840001 1860000 350 0.49 0.34 3.41
5 32780001 32800000 47 0.49 0.34 3.41
5 32840001 32860000 30 0.49 0.42 3.40
5 14830001 14850000 223 0.49 0.32 3.40
5 10460001 10480000 242 0.49 0.37 3.38
5 24000001 24020000 160 0.49 0.34 3.37
5 19810001 19830000 56 0.49 0.39 3.37
5 30760001 30780000 222 0.49 0.35 3.36
5 25870001 25890000 125 0.49 0.35 3.36
5 14220001 14240000 367 0.49 0.34 3.36
5 46300001 46320000 257 0.49 0.29 3.36
5 24990001 25010000 258 0.49 0.33 3.35
5 25920001 25940000 334 0.49 0.28 3.35
5 31930001 31950000 73 0.48 0.38 3.35
5 1890001 1910000 299 0.48 0.30 3.34
5 21110001 21130000 253 0.48 0.41 3.33
5 32580001 32600000 117 0.48 0.41 3.32
5 57120001 57140000 269 0.48 0.32 3.31
5 1790001 1810000 158 0.48 0.34 3.30
5 12890001 12910000 185 0.48 0.33 3.28
5 23770001 23790000 223 0.48 0.31 3.27
5 25580001 25600000 395 0.48 0.35 3.26
6 27660001 27680000 341 0.64 0.42 4.84
6 30720001 30740000 413 0.57 0.34 4.15
6 35110001 35130000 137 0.57 0.38 4.15
6 27670001 27690000 242 0.57 0.30 4.14
6 30710001 30730000 338 0.55 0.32 4.01
6 30850001 30870000 244 0.53 0.36 3.83
6 30730001 30750000 385 0.53 0.34 3.81
6 28970001 28990000 203 0.53 0.35 3.77
6 32830001 32850000 296 0.52 0.36 3.74
6 28980001 29000000 241 0.52 0.34 3.74
6 30700001 30720000 333 0.52 0.31 3.73
6 32840001 32860000 286 0.52 0.34 3.69
6 8560001 8580000 333 0.49 0.34 3.44
6 30690001 30710000 369 0.48 0.30 3.34
6 8550001 8570000 319 0.48 0.33 3.27
7 29440001 29460000 217 0.60 0.60 4.50
7 29430001 29450000 142 0.59 0.56 4.35
7 34990001 35010000 262 0.57 0.31 4.24

398
Chr Window start Window end SNP (N) Weighted Fst Mean Fst ZFst
7 29450001 29470000 242 0.54 0.55 3.87
7 35000001 35020000 265 0.53 0.29 3.76
7 29420001 29440000 86 0.52 0.36 3.69
7 34980001 35000000 274 0.52 0.28 3.69
7 31240001 31260000 272 0.49 0.33 3.35
7 19470001 19490000 291 0.48 0.32 3.32
8 16010001 16030000 150 0.65 0.44 4.98
8 16000001 16020000 146 0.63 0.45 4.83
8 16220001 16240000 276 0.61 0.33 4.57
8 15490001 15510000 141 0.58 0.40 4.26
8 12910001 12930000 122 0.57 0.44 4.22
8 15990001 16010000 167 0.57 0.43 4.15
8 15500001 15520000 136 0.55 0.38 4.02
8 16020001 16040000 166 0.55 0.41 3.95
8 15460001 15480000 119 0.55 0.40 3.95
8 16210001 16230000 254 0.54 0.21 3.92
8 15540001 15560000 191 0.54 0.34 3.86
8 8980001 9000000 59 0.52 0.44 3.69
8 15900001 15920000 307 0.52 0.34 3.69
8 15450001 15470000 170 0.52 0.38 3.65
8 17320001 17340000 159 0.51 0.37 3.59
8 17330001 17350000 208 0.50 0.36 3.47
8 17000001 17020000 213 0.49 0.32 3.39
8 13080001 13100000 42 0.49 0.41 3.39
8 15530001 15550000 182 0.49 0.30 3.36
8 19380001 19400000 230 0.48 0.36 3.33
8 13100001 13120000 27 0.48 0.43 3.28
9 13800001 13820000 357 0.63 0.34 4.74
9 13810001 13830000 353 0.52 0.30 3.67
9 6950001 6970000 136 0.51 0.35 3.65
9 13790001 13810000 327 0.50 0.31 3.47
9 18020001 18040000 303 0.48 0.30 3.34
9 9490001 9510000 181 0.48 0.36 3.29
9 6960001 6980000 170 0.48 0.33 3.27
10 12450001 12470000 112 0.68 0.58 5.31
10 12460001 12480000 117 0.66 0.49 5.10
10 12470001 12490000 138 0.64 0.47 4.92
10 12440001 12460000 131 0.60 0.45 4.48
10 12480001 12500000 175 0.60 0.42 4.48
10 17180001 17200000 144 0.57 0.37 4.17
10 11290001 11310000 218 0.52 0.33 3.72
10 17170001 17190000 151 0.51 0.37 3.57

399
Chr Window start Window end SNP (N) Weighted Fst Mean Fst ZFst
10 11300001 11320000 216 0.50 0.34 3.49
10 1680001 1700000 246 0.48 0.32 3.33
10 17190001 17210000 165 0.48 0.30 3.29
11 19050001 19070000 268 0.67 0.46 5.23
11 19060001 19080000 253 0.65 0.43 5.00
11 19070001 19090000 236 0.63 0.44 4.81
11 11030001 11050000 161 0.53 0.41 3.77
11 19040001 19060000 266 0.52 0.36 3.67
11 7040001 7060000 136 0.51 0.35 3.64
11 4660001 4680000 253 0.51 0.33 3.63
11 7050001 7070000 245 0.50 0.33 3.51
11 1610001 1630000 246 0.49 0.29 3.45
11 12990001 13010000 214 0.49 0.36 3.41
11 13520001 13540000 189 0.49 0.40 3.38
11 19080001 19100000 224 0.49 0.37 3.36
11 4650001 4670000 255 0.49 0.30 3.36
11 4670001 4690000 235 0.49 0.32 3.35
12 3860001 3880000 213 0.58 0.43 4.32
12 1210001 1230000 155 0.55 0.40 3.97
12 3710001 3730000 211 0.55 0.45 3.96
12 3850001 3870000 175 0.54 0.42 3.93
12 3980001 4000000 144 0.54 0.36 3.89
12 3720001 3740000 233 0.54 0.42 3.86
12 3970001 3990000 160 0.52 0.36 3.67
12 3690001 3710000 112 0.51 0.42 3.58
12 3960001 3980000 230 0.51 0.35 3.56
12 3700001 3720000 95 0.50 0.44 3.50
12 3870001 3890000 245 0.50 0.33 3.45
12 3950001 3970000 227 0.49 0.32 3.42
12 3990001 4010000 149 0.49 0.30 3.37
12 3680001 3700000 193 0.48 0.41 3.31
12 1200001 1220000 205 0.48 0.30 3.26
13 2150001 2170000 210 0.59 0.43 4.40
13 2270001 2290000 207 0.57 0.35 4.17
13 2280001 2300000 225 0.55 0.35 4.03
14 14780001 14800000 69 0.60 0.50 4.49
14 14770001 14790000 69 0.55 0.43 3.99
14 15550001 15570000 43 0.55 0.34 3.94
14 15560001 15580000 33 0.54 0.28 3.89
14 4590001 4610000 308 0.52 0.41 3.72
14 15540001 15560000 33 0.51 0.28 3.64
14 14760001 14780000 76 0.50 0.37 3.52

400
Chr Window start Window end SNP (N) Weighted Fst Mean Fst ZFst
23 90001 110000 60 0.55 0.38 3.98
23 4930001 4950000 253 0.48 0.29 3.34
23 100001 120000 41 0.48 0.27 3.32
24 6040001 6060000 203 0.53 0.38 3.83
24 3370001 3390000 203 0.48 0.27 3.29
24 6060001 6080000 157 0.48 0.36 3.29
25 2830001 2850000 55 0.55 0.49 3.99
25 2820001 2840000 75 0.52 0.45 3.74
27 5280001 5300000 153 0.48 0.36 3.30
Chr = Chromosome; N= count
Table S 64. List of candidate genes in Improved Horro and Hugub chickens.
Chr Gene stable ID Gene start (bp) Gene end (bp) Gene name Gene type
1 ENSGALG00000044624 59245579 59246586 protein coding
1 ENSGALG00000017135 178883375 178933935 CRYL1 protein coding
1 ENSGALG00000017119 177513346 177560920 TNFRSF19 protein coding
1 ENSGALG00000035126 150329998 150330064 miRNA
1 ENSGALG00000038995 181192418 181414573 GRIA4 protein coding
1 ENSGALG00000016767 132714633 132747517 protein coding
1 ENSGALG00000009945 35315781 35347355 CPM protein coding
1 ENSGALG00000009815 33395407 33407028 TMEM5 protein coding
1 ENSGALG00000016896 146127088 146275409 ABCC4 protein coding
1 ENSGALG00000017139 179051034 179094239 protein coding
1 ENSGALG00000045031 59237872 59238879 protein coding
1 ENSGALG00000044524 59241726 59242732 protein coding
1 ENSGALG00000016900 146527090 147094328 GPC6 protein coding
1 ENSGALG00000010177 36351342 36388496 ZFC3H1 protein coding
1 ENSGALG00000039209 33881874 33923658 WIF1 protein coding
1 ENSGALG00000022696 196006397 196006681 KCNE3 protein coding
1 ENSGALG00000015307 84985337 85117095 ABI3BP protein coding
1 ENSGALG00000017304 196014618 196048973 PGM2L1 protein coding
1 ENSGALG00000016908 159096610 159285693 PCDH9 protein coding
1 ENSGALG00000044959 59249433 59250440 protein coding
1 ENSGALG00000025192 132720340 132720457 RF00619 snRNA
1 ENSGALG00000046239 59253286 59254293 protein coding
1 ENSGALG00000009859 33794056 33841926 TBC1D30 protein coding
1 ENSGALG00000045433 59257140 59258147 protein coding
1 ENSGALG00000027868 177160927 177162801 AMER2 protein coding
1 ENSGALG00000031225 178671358 178682347 protein coding
1 ENSGALG00000032339 150234073 150532403 lincRNA
1 ENSGALG00000040093 159526738 159744910 lincRNA

401
Chr Gene stable ID Gene start (bp) Gene end (bp) Gene name Gene type
1 ENSGALG00000033716 181770866 181805885 lincRNA
1 ENSGALG00000035278 39036722 39056354 lincRNA
1 ENSGALG00000034873 126246316 126340432 lincRNA
2 ENSGALG00000025664 70897916 70898018 RF00026 snRNA
2 ENSGALG00000012732 62437754 62509972 PHACTR1 protein coding
2 ENSGALG00000009500 22978146 23047300 VPS50 protein coding
2 ENSGALG00000031869 110919658 110976941 protein coding
2 ENSGALG00000012941 73245203 73614065 CDH12 protein coding
2 ENSGALG00000039585 148501300 148505443 protein coding
2 ENSGALG00000013129 83790809 83833193 RPRD1A protein coding
2 ENSGALG00000009062 21877225 22125099 CDK14 protein coding
2 ENSGALG00000042548 141751641 141782032 LRRC6 protein coding
2 ENSGALG00000031917 22587398 22642927 ANKIB1 protein coding
2 ENSGALG00000037014 147222471 147418330 TSNARE1 protein coding
2 ENSGALG00000044996 141791891 141797962 TMEM71 protein coding
2 ENSGALG00000013124 83340744 83708432 FHOD3 protein coding
2 ENSGALG00000034333 149152445 149152741 protein coding
2 ENSGALG00000039346 149228059 149229441 protein coding
2 ENSGALG00000033205 141806556 141854403 PHF20L1 protein coding
2 ENSGALG00000013100 81116137 81255419 GRB10 protein coding
2 ENSGALG00000040891 20027818 20125211 RSU1 protein coding
2 ENSGALG00000031547 70841747 71110837 lincRNA
3 ENSGALG00000032937 91386688 91473055 DLGAP2 protein coding
3 ENSGALG00000025589 92233115 92233218 RF00026 snRNA
3 ENSGALG00000016329 88826113 88881081 AGPAT5 protein coding
3 ENSGALG00000010039 27486112 27649822 BRE protein coding
3 ENSGALG00000035230 90162525 90533217 CSMD1 protein coding
3 ENSGALG00000016276 86406473 86714063 KHDRBS2 protein coding
3 ENSGALG00000014868 61471807 61486414 SERINC1 protein coding
3 ENSGALG00000015864 78537400 78582981 IBTK protein coding
3 ENSGALG00000010713 35235950 35336239 SDCCAG8 protein coding
3 ENSGALG00000015889 79785429 79884137 PHIP protein coding
3 ENSGALG00000016300 88190798 88234696 TINAG protein coding
3 ENSGALG00000016289 87201225 87461978 DST protein coding
3 ENSGALG00000032069 90034820 90054328 protein coding
3 ENSGALG00000015908 81088530 81188721 COL12A1 protein coding
3 ENSGALG00000039606 91341696 91348290 CLN8 protein coding
3 ENSGALG00000016499 104597130 104611882 protein coding
3 ENSGALG00000038420 61487557 61508738 HSF2 protein coding
3 ENSGALG00000034684 33116938 33125450 lincRNA
3 ENSGALG00000036112 50058811 50161705 lincRNA
3 ENSGALG00000044759 81233001 81242848 lincRNA
4 ENSGALG00000009361 20960961 21000658 GUCY1B1 protein coding

402
Chr Gene stable ID Gene start (bp) Gene end (bp) Gene name Gene type
4 ENSGALG00000010668 40162296 40247894 WWC2 protein coding
4 ENSGALG00000034621 75273238 75452467 KCNIP4 protein coding
4 ENSGALG00000027439 20654247 20654356 miRNA
4 ENSGALG00000042586 19460437 19460523 miRNA
4 ENSGALG00000032953 19548868 19548950 miRNA
4 ENSGALG00000025212 21010293 21010422 RF00548 snRNA
4 ENSGALG00000011844 54036328 54041083 IL21 protein coding
4 ENSGALG00000030791 5837514 5995090 DIAPH2 protein coding
4 ENSGALG00000009085 17775905 17808725 MTMR1 protein coding
4 ENSGALG00000020210 39752033 39762452 CENPU protein coding
4 ENSGALG00000009192 19424229 19426802 SLITRK2 protein coding
4 ENSGALG00000009692 25668584 25740316 SH3RF1 protein coding
4 ENSGALG00000009207 19996054 20033183 TRIM2 protein coding
4 ENSGALG00000006851 6599257 7006957 protein coding
4 ENSGALG00000009212 20040123 20078631 MND1 protein coding
4 ENSGALG00000009241 20227180 20230889 SFRP2 protein coding
4 ENSGALG00000009230 20091761 20162392 TMEM131L protein coding
4 ENSGALG00000009714 25756022 25763028 CBR4 protein coding
4 ENSGALG00000030065 40334424 40645412 TENM3 protein coding
4 ENSGALG00000010628 39713691 39752253 ACSL1 protein coding
4 ENSGALG00000009719 27095819 27127946 PCDH10 protein coding
4 ENSGALG00000008517 16449974 16457382 MCTS1 protein coding
4 ENSGALG00000008559 16458726 16479086 CUL4B protein coding
4 ENSGALG00000041717 69980272 70000045 KLF3 protein coding
4 ENSGALG00000034722 20184996 20199647 TLR2B protein coding
4 ENSGALG00000042912 5862686 5863323 lincRNA
4 ENSGALG00000031591 16479446 16482772 lincRNA
4 ENSGALG00000040514 18009035 18012307 lincRNA
4 ENSGALG00000033107 19392907 19563891 lincRNA
4 ENSGALG00000033380 19504112 19511619 lincRNA
4 ENSGALG00000041824 19541886 19542585 lincRNA
4 ENSGALG00000039736 19819071 19857159 lincRNA
4 ENSGALG00000039492 19873184 19873825 lincRNA
4 ENSGALG00000032689 26689975 26702258 lincRNA
4 ENSGALG00000029613 27043314 27051634 lincRNA
4 ENSGALG00000032527 27396660 27628525 lincRNA
4 ENSGALG00000031625 27600624 27601331 lincRNA
4 ENSGALG00000035886 27788185 27825157 lincRNA
4 ENSGALG00000036104 28160838 28173463 lincRNA
4 ENSGALG00000034709 28904779 28987118 lincRNA
4 ENSGALG00000045271 39895978 39956315 lincRNA
5 ENSGALG00000011609 18540733 18648374 protein coding
5 ENSGALG00000031542 21728195 21799637 EXT2 protein coding

403
Chr Gene stable ID Gene start (bp) Gene end (bp) Gene name Gene type
5 ENSGALG00000009320 26365084 26386235 PSEN1 protein coding
5 ENSGALG00000008653 24995617 25023029 protein coding
5 ENSGALG00000030172 25001804 25002247 protein coding
5 ENSGALG00000026386 26193022 26193130 gga-mir-6587 miRNA
5 ENSGALG00000025793 1896796 1896969 RF02271 misc_RNA
5 ENSGALG00000009415 27718429 27835276 SMOC1 protein coding
5 ENSGALG00000009850 32870788 32999065 NOVA1 protein coding
5 ENSGALG00000040897 46303329 46303499 TUNAR protein coding
5 ENSGALG00000009345 26454626 26467002 protein coding
5 ENSGALG00000038950 14921862 14996500 protein coding
5 ENSGALG00000006830 15151804 15252302 CHID1 protein coding
5 ENSGALG00000012228 56898267 57232790 MDGA2 protein coding
5 ENSGALG00000028203 30752050 30805661 SPRED1 protein coding
5 ENSGALG00000029399 1855519 1880037 protein coding
5 ENSGALG00000008403 23771783 23893510 PHF21A protein coding
5 ENSGALG00000003999 1910717 1996488 NAV2 protein coding
5 ENSGALG00000008991 25575504 25598610 VPS39 protein coding
5 ENSGALG00000009282 26124345 26142266 ELMSAN1 protein coding
5 ENSGALG00000028568 26150108 26163720 DNAL1 protein coding
5 ENSGALG00000009431 27987462 28003889 PLEKHD1 protein coding
5 ENSGALG00000012103 5540164 5584404 CCDC73 protein coding
5 ENSGALG00000023243 26166529 26171162 protein coding
5 ENSGALG00000017933 32749704 32749858 RF00003 snRNA
5 ENSGALG00000009292 26171455 26176330 protein coding
5 ENSGALG00000009387 27443194 27531009 protein coding
5 ENSGALG00000020454 26192258 26194122 C5H14ORF169 protein coding
5 ENSGALG00000006837 15271751 15336034 TSPAN4 protein coding
5 ENSGALG00000009438 28008500 28025729 SLC39A9 protein coding
5 ENSGALG00000009176 25903704 25937422 TTBK2 protein coding
5 ENSGALG00000009300 26200817 26293922 NUMB protein coding
5 ENSGALG00000039066 15451610 15451999 protein coding
5 ENSGALG00000017384 28025971 28032991 ERH protein coding
5 ENSGALG00000009352 26488837 26646463 DPF3 protein coding
5 ENSGALG00000006035 10434605 10509846 PDE3B protein coding
5 ENSGALG00000035105 26349956 26350342 protein coding
5 ENSGALG00000022531 24001629 24002515 protein coding
5 ENSGALG00000006717 14871236 14911577 protein coding
5 ENSGALG00000009400 27618375 27715349 SLC8A3 protein coding
5 ENSGALG00000031456 24977292 24994712 protein coding
5 ENSGALG00000031737 14760117 14805890 protein coding
5 ENSGALG00000038303 1854102 1858309 lincRNA
5 ENSGALG00000041420 25881336 25883509 lincRNA
5 ENSGALG00000034752 26199697 26200631 lincRNA

404
Chr Gene stable ID Gene start (bp) Gene end (bp) Gene name Gene type
5 ENSGALG00000033973 26652505 26660856 lincRNA
5 ENSGALG00000032603 32617627 32740415 lincRNA
5 ENSGALG00000030088 32824916 32826865 lincRNA
6 ENSGALG00000025862 8546459 8560943 TMEM26 protein coding
6 ENSGALG00000009254 28990063 29007399 ENO4 protein coding
6 ENSGALG00000046543 27677917 27680388 protein coding
6 ENSGALG00000008949 27679147 27680421 ADRB1 protein coding
6 ENSGALG00000035013 30680913 30714244 WDR11 protein coding
6 ENSGALG00000010493 35098018 35309850 INPP5A protein coding
7 ENSGALG00000012156 29342320 29524384 DPP10 protein coding
7 ENSGALG00000012462 34961029 35028577 KIF5C protein coding
7 ENSGALG00000012362 31073812 31346787 THSD7B protein coding
7 ENSGALG00000010933 19477509 19493971 protein coding
8 ENSGALG00000008658 16222861 16250213 ZNHIT6 protein coding
8 ENSGALG00000006284 15997170 16014128 SH3GLB1 protein coding
8 ENSGALG00000006864 16125706 16215909 COL24A1 protein coding
8 ENSGALG00000028423 15897943 15967214 HS2ST1 protein coding
8 ENSGALG00000006322 16020120 16033702 protein coding
9 ENSGALG00000039182 17991354 18078753 TBL1XR1 protein coding
9 ENSGALG00000003052 9475461 9510946 AGFG1 protein coding
10 ENSGALG00000006041 11295144 11301592 BNC1 protein coding
10 ENSGALG00000006445 12413427 12483133 ARNT2 protein coding
10 ENSGALG00000038688 17119378 17280787 ADAMTS17 protein coding
11 ENSGALG00000000059 19086513 19089789 protein coding
11 ENSGALG00000025712 19089858 19093054 DEF8 protein coding
11 ENSGALG00000000129 19064511 19086448 TCF25 protein coding
11 ENSGALG00000005319 12984674 13144905 CDH8 protein coding
11 ENSGALG00000000516 19022589 19054970 FANCA protein coding
11 ENSGALG00000004949 11034188 11075126 KIAA0355 protein coding
11 ENSGALG00000004943 11030199 11043197 SS18L2 protein coding
11 ENSGALG00000000521 19057727 19063586 SPIRE2 protein coding
11 ENSGALG00000000540 19097873 19105088 GAS8 protein coding
11 ENSGALG00000000528 19093979 19155591 DBNDD1 protein coding
11 ENSGALG00000002407 1604963 1708650 HYDIN protein coding
12 ENSGALG00000046270 1156711 1252102 protein coding
12 ENSGALG00000030908 3752214 4001595 ATP2B2 protein coding
14 ENSGALG00000002119 14717931 14809857 VPS35L protein coding
14 ENSGALG00000029817 4588547 4676355 protein coding
14 ENSGALG00000042581 15534743 15562301 lincRNA
23 ENSGALG00000018302 4947355 4947443 gga-mir-30c-1 miRNA
23 ENSGALG00000018301 4946132 4946227 gga-mir-30e miRNA
23 ENSGALG00000037136 117566 147202 RPS6KA1L protein coding
23 ENSGALG00000003189 4927211 4955061 NFYC protein coding

405
Chr Gene stable ID Gene start (bp) Gene end (bp) Gene name Gene type
25 ENSGALG00000028478 2848558 2856046 protein coding
25 ENSGALG00000040687 2829873 2845968 SNX27 protein coding
25 ENSGALG00000032955 2816337 2828064 TUFT1 protein coding
27 ENSGALG00000003282 5296817 5306850 STAT5B protein coding
27 ENSGALG00000011485 5280330 5281387 HCRT protein coding
27 ENSGALG00000003345 5282575 5292696 protein coding
27 ENSGALG00000003333 5292832 5299192 GHDC protein coding
Chr = Chromosome
Table S 65. Top pairwise Fst values (1%) in Improved Horro and Arabo chickens.
Chromosome Window start Window end SNP (N) Weighted Fst Mean Fst ZFst
1 59250001 59270000 73 0.68 0.57 6.48
1 59230001 59250000 58 0.66 0.52 6.28
1 147080001 147100000 143 0.62 0.49 5.86
1 150950001 150970000 37 0.61 0.44 5.66
1 150960001 150980000 65 0.61 0.49 5.65
1 150970001 150990000 103 0.60 0.49 5.61
1 150940001 150960000 79 0.59 0.47 5.42
1 150980001 151000000 67 0.58 0.43 5.39
1 162450001 162470000 181 0.58 0.29 5.31
1 181220001 181240000 200 0.56 0.30 5.17
1 162440001 162460000 154 0.56 0.33 5.14
1 19420001 19440000 158 0.56 0.44 5.11
1 19220001 19240000 131 0.56 0.39 5.09
1 149980001 150000000 84 0.56 0.47 5.08
1 147070001 147090000 171 0.56 0.38 5.07
1 149960001 149980000 80 0.55 0.47 5.06
1 19230001 19250000 85 0.55 0.42 5.05
1 149970001 149990000 77 0.55 0.47 5.04
1 142920001 142940000 261 0.55 0.30 5.02

406
Chromosome Window start Window end SNP (N) Weighted Fst Mean Fst ZFst
1 150910001 150930000 112 0.54 0.45 4.91
1 142930001 142950000 270 0.54 0.28 4.87
1 181840001 181860000 285 0.54 0.33 4.86
1 179030001 179050000 332 0.54 0.38 4.86
1 150920001 150940000 111 0.53 0.46 4.83
1 151610001 151630000 59 0.53 0.42 4.82
1 147090001 147110000 178 0.53 0.31 4.78
1 19300001 19320000 172 0.53 0.37 4.78
1 19190001 19210000 124 0.53 0.44 4.77
1 147060001 147080000 199 0.53 0.33 4.75
1 19430001 19450000 105 0.53 0.45 4.74
1 19380001 19400000 68 0.53 0.30 4.73
1 150930001 150950000 96 0.52 0.44 4.72
1 19410001 19430000 127 0.52 0.35 4.71
1 19310001 19330000 120 0.52 0.37 4.70
1 181230001 181250000 171 0.52 0.30 4.68
1 137510001 137530000 318 0.52 0.29 4.66
1 181240001 181260000 154 0.52 0.33 4.64
1 149950001 149970000 69 0.51 0.44 4.61
1 162400001 162420000 209 0.50 0.28 4.47
1 181800001 181820000 292 0.50 0.35 4.46
1 147050001 147070000 191 0.50 0.31 4.45
1 181790001 181810000 198 0.50 0.32 4.39
1 162410001 162430000 232 0.49 0.29 4.39
1 158930001 158950000 106 0.49 0.41 4.39
1 142910001 142930000 287 0.49 0.23 4.37

407
Chromosome Window start Window end SNP (N) Weighted Fst Mean Fst ZFst
1 181260001 181280000 310 0.49 0.27 4.35
1 150800001 150820000 163 0.49 0.39 4.33
1 179040001 179060000 354 0.49 0.33 4.32
1 150290001 150310000 104 0.49 0.39 4.31
1 181250001 181270000 219 0.49 0.28 4.30
1 142940001 142960000 251 0.49 0.26 4.29
1 47220001 47240000 127 0.49 0.31 4.29
1 59220001 59240000 240 0.49 0.33 4.29
1 177500001 177520000 307 0.49 0.29 4.28
1 19330001 19350000 105 0.48 0.31 4.25
1 19370001 19390000 78 0.48 0.28 4.25
1 137450001 137470000 292 0.48 0.36 4.21
1 162430001 162450000 197 0.48 0.27 4.19
1 180990001 181010000 229 0.48 0.36 4.18
1 56710001 56730000 393 0.47 0.38 4.15
1 137500001 137520000 366 0.47 0.25 4.14
1 181850001 181870000 291 0.47 0.27 4.14
1 151600001 151620000 130 0.47 0.39 4.11
1 181310001 181330000 210 0.47 0.31 4.10
1 19340001 19360000 71 0.47 0.31 4.09
1 158940001 158960000 119 0.47 0.37 4.07
1 150870001 150890000 119 0.46 0.40 4.02
1 154530001 154550000 235 0.46 0.27 4.01
1 162420001 162440000 230 0.46 0.22 4.00
1 150270001 150290000 108 0.46 0.39 3.98
1 19200001 19220000 147 0.46 0.33 3.98

408
Chromosome Window start Window end SNP (N) Weighted Fst Mean Fst ZFst
1 150280001 150300000 104 0.46 0.37 3.98
1 156410001 156430000 319 0.46 0.29 3.95
1 177550001 177570000 248 0.45 0.32 3.93
1 151560001 151580000 163 0.45 0.35 3.91
1 179050001 179070000 286 0.45 0.30 3.91
1 56740001 56760000 462 0.45 0.38 3.90
1 151550001 151570000 162 0.45 0.34 3.90
1 177330001 177350000 333 0.45 0.33 3.90
1 177170001 177190000 140 0.45 0.25 3.90
1 181780001 181800000 147 0.45 0.28 3.90
1 110320001 110340000 52 0.45 0.24 3.86
1 19240001 19260000 74 0.45 0.36 3.85
1 19320001 19340000 102 0.45 0.29 3.85
1 19170001 19190000 131 0.45 0.39 3.84
1 59260001 59280000 235 0.45 0.34 3.83
1 179020001 179040000 331 0.45 0.27 3.83
1 56750001 56770000 499 0.44 0.39 3.82
1 151690001 151710000 200 0.44 0.32 3.81
1 4410001 4430000 146 0.44 0.25 3.80
1 177540001 177560000 281 0.44 0.30 3.79
1 19460001 19480000 112 0.44 0.34 3.77
1 151620001 151640000 69 0.44 0.30 3.76
1 151590001 151610000 180 0.44 0.35 3.76
1 150790001 150810000 141 0.44 0.34 3.75
1 153300001 153320000 244 0.44 0.30 3.75
1 177490001 177510000 310 0.44 0.27 3.74

409
Chromosome Window start Window end SNP (N) Weighted Fst Mean Fst ZFst
1 150810001 150830000 134 0.44 0.32 3.73
1 151010001 151030000 140 0.44 0.25 3.71
1 150300001 150320000 94 0.43 0.34 3.70
1 181770001 181790000 247 0.43 0.27 3.70
1 151540001 151560000 108 0.43 0.32 3.69
1 137440001 137460000 318 0.43 0.30 3.69
1 159520001 159540000 97 0.43 0.37 3.68
1 150990001 151010000 109 0.43 0.23 3.68
1 151680001 151700000 184 0.43 0.27 3.67
1 177320001 177340000 293 0.43 0.32 3.64
1 177180001 177200000 165 0.43 0.27 3.63
1 179060001 179080000 302 0.43 0.30 3.62
1 179100001 179120000 261 0.43 0.31 3.61
1 179070001 179090000 246 0.43 0.29 3.61
1 151000001 151020000 155 0.43 0.24 3.61
1 19360001 19380000 112 0.42 0.22 3.58
1 137360001 137380000 306 0.42 0.23 3.58
1 162460001 162480000 214 0.42 0.22 3.55
1 187440001 187460000 331 0.42 0.28 3.55
1 187430001 187450000 310 0.42 0.28 3.55
1 151630001 151650000 85 0.42 0.29 3.54
1 181000001 181020000 316 0.42 0.30 3.54
1 47250001 47270000 521 0.42 0.29 3.51
1 19180001 19200000 103 0.42 0.35 3.51
1 181210001 181230000 249 0.42 0.28 3.51
1 177340001 177360000 337 0.42 0.30 3.49

410
Chromosome Window start Window end SNP (N) Weighted Fst Mean Fst ZFst
1 141630001 141650000 40 0.42 0.37 3.49
1 19450001 19470000 127 0.42 0.32 3.49
1 56680001 56700000 303 0.41 0.33 3.47
1 56730001 56750000 446 0.41 0.35 3.46
1 19250001 19270000 131 0.41 0.31 3.45
1 56720001 56740000 380 0.41 0.35 3.44
1 143080001 143100000 315 0.41 0.23 3.44
1 69660001 69680000 330 0.41 0.28 3.43
1 151700001 151720000 227 0.41 0.31 3.43
1 84410001 84430000 404 0.41 0.29 3.42
1 141640001 141660000 21 0.41 0.34 3.40
1 182720001 182740000 200 0.41 0.36 3.39
1 137520001 137540000 307 0.41 0.23 3.38
1 179110001 179130000 249 0.41 0.31 3.38
1 177160001 177180000 162 0.41 0.17 3.37
2 149180001 149200000 721 0.70 0.60 6.72
2 21260001 21280000 159 0.70 0.49 6.71
2 149170001 149190000 743 0.69 0.59 6.61
2 149190001 149210000 681 0.67 0.58 6.43
2 21240001 21260000 183 0.67 0.44 6.34
2 21250001 21270000 214 0.66 0.43 6.24
2 149200001 149220000 674 0.65 0.55 6.15
2 149160001 149180000 610 0.65 0.55 6.12
2 149210001 149230000 494 0.64 0.53 6.07
2 149220001 149240000 238 0.64 0.52 5.99
2 21270001 21290000 178 0.63 0.45 5.93

411
Chromosome Window start Window end SNP (N) Weighted Fst Mean Fst ZFst
2 36650001 36670000 181 0.63 0.46 5.90
2 149150001 149170000 310 0.59 0.45 5.51
2 36640001 36660000 150 0.59 0.44 5.42
2 21980001 22000000 208 0.57 0.45 5.28
2 125510001 125530000 187 0.56 0.45 5.18
2 21880001 21900000 225 0.56 0.48 5.09
2 21990001 22010000 200 0.56 0.41 5.08
2 36660001 36680000 161 0.55 0.32 4.97
2 21230001 21250000 123 0.54 0.37 4.94
2 21970001 21990000 202 0.54 0.45 4.90
2 21820001 21840000 305 0.53 0.39 4.84
2 21870001 21890000 192 0.52 0.40 4.70
2 21830001 21850000 294 0.52 0.37 4.69
2 22140001 22160000 204 0.52 0.42 4.66
2 21960001 21980000 166 0.52 0.43 4.65
2 22150001 22170000 192 0.52 0.37 4.64
2 146070001 146090000 183 0.51 0.33 4.55
2 142470001 142490000 236 0.51 0.35 4.54
2 142320001 142340000 224 0.51 0.29 4.52
2 146060001 146080000 206 0.51 0.32 4.51
2 142910001 142930000 173 0.50 0.26 4.46
2 142290001 142310000 172 0.50 0.33 4.41
2 24060001 24080000 217 0.50 0.37 4.40
2 142460001 142480000 292 0.49 0.35 4.29
2 31300001 31320000 221 0.48 0.32 4.27
2 49890001 49910000 56 0.48 0.29 4.26

412
Chromosome Window start Window end SNP (N) Weighted Fst Mean Fst ZFst
2 142330001 142350000 202 0.48 0.29 4.24
2 143190001 143210000 224 0.48 0.32 4.21
2 17460001 17480000 339 0.48 0.30 4.19
2 142280001 142300000 226 0.47 0.32 4.16
2 109720001 109740000 171 0.47 0.39 4.13
2 22080001 22100000 244 0.47 0.37 4.13
2 21220001 21240000 206 0.47 0.36 4.11
2 49880001 49900000 85 0.47 0.27 4.10
2 21430001 21450000 196 0.47 0.33 4.08
2 21950001 21970000 172 0.47 0.39 4.07
2 109730001 109750000 173 0.47 0.38 4.07
2 145960001 145980000 225 0.46 0.33 4.04
2 24070001 24090000 210 0.46 0.33 4.02
2 142270001 142290000 218 0.46 0.34 4.01
2 21280001 21300000 242 0.46 0.37 4.01
2 132120001 132140000 234 0.46 0.28 3.99
2 23010001 23030000 234 0.46 0.27 3.99
2 146050001 146070000 201 0.46 0.26 3.96
2 49960001 49980000 202 0.46 0.21 3.95
2 125500001 125520000 247 0.46 0.31 3.95
2 21890001 21910000 235 0.46 0.37 3.95
2 49870001 49890000 151 0.46 0.27 3.95
2 142260001 142280000 287 0.46 0.32 3.94
2 21810001 21830000 298 0.46 0.31 3.94
2 50200001 50220000 98 0.45 0.32 3.92
2 36670001 36690000 137 0.45 0.24 3.92

413
Chromosome Window start Window end SNP (N) Weighted Fst Mean Fst ZFst
2 17470001 17490000 278 0.45 0.29 3.92
2 149230001 149250000 109 0.45 0.33 3.91
2 20470001 20490000 309 0.45 0.28 3.91
2 146550001 146570000 250 0.45 0.33 3.90
2 145970001 145990000 364 0.45 0.30 3.88
2 49970001 49990000 263 0.45 0.25 3.87
2 51260001 51280000 63 0.45 0.42 3.87
2 24090001 24110000 235 0.45 0.30 3.84
2 49910001 49930000 145 0.45 0.21 3.83
2 146140001 146160000 387 0.45 0.25 3.83
2 49860001 49880000 206 0.45 0.29 3.83
2 24250001 24270000 329 0.45 0.30 3.82
2 51250001 51270000 65 0.44 0.41 3.81
2 49900001 49920000 97 0.44 0.21 3.81
2 36680001 36700000 115 0.44 0.30 3.80
2 104080001 104100000 216 0.44 0.31 3.79
2 142540001 142560000 306 0.44 0.27 3.78
2 143180001 143200000 233 0.44 0.28 3.78
2 20760001 20780000 152 0.44 0.24 3.76
2 125520001 125540000 230 0.44 0.30 3.76
2 22610001 22630000 330 0.44 0.29 3.76
2 22090001 22110000 240 0.44 0.31 3.76
2 142510001 142530000 339 0.44 0.26 3.73
2 21420001 21440000 175 0.44 0.28 3.73
2 49850001 49870000 182 0.44 0.32 3.73
2 36630001 36650000 131 0.43 0.27 3.71

414
Chromosome Window start Window end SNP (N) Weighted Fst Mean Fst ZFst
2 21210001 21230000 227 0.43 0.34 3.70
2 49980001 50000000 225 0.43 0.25 3.68
2 142800001 142820000 168 0.43 0.22 3.67
2 21650001 21670000 343 0.43 0.32 3.66
2 49840001 49860000 104 0.43 0.35 3.66
2 23510001 23530000 464 0.43 0.21 3.66
2 24240001 24260000 292 0.43 0.27 3.66
2 147350001 147370000 126 0.43 0.34 3.65
2 49990001 50010000 176 0.43 0.30 3.64
2 144850001 144870000 226 0.43 0.29 3.63
2 20460001 20480000 302 0.42 0.27 3.59
2 23280001 23300000 342 0.42 0.30 3.59
2 145940001 145960000 437 0.42 0.22 3.58
2 147360001 147380000 183 0.42 0.35 3.57
2 21840001 21860000 313 0.42 0.30 3.57
2 145980001 146000000 338 0.42 0.27 3.56
2 57720001 57740000 165 0.42 0.33 3.55
2 104090001 104110000 235 0.42 0.32 3.54
2 23370001 23390000 278 0.42 0.29 3.54
2 30810001 30830000 266 0.42 0.25 3.53
2 143160001 143180000 128 0.42 0.30 3.52
2 50630001 50650000 98 0.42 0.32 3.52
2 147380001 147400000 262 0.42 0.29 3.51
2 146040001 146060000 328 0.42 0.27 3.50
2 143170001 143190000 228 0.42 0.29 3.50
2 55120001 55140000 199 0.42 0.29 3.49

415
Chromosome Window start Window end SNP (N) Weighted Fst Mean Fst ZFst
2 21720001 21740000 249 0.42 0.30 3.49
2 24100001 24120000 222 0.42 0.26 3.49
2 50210001 50230000 80 0.42 0.31 3.49
2 81890001 81910000 86 0.42 0.30 3.49
2 49800001 49820000 171 0.42 0.21 3.49
2 23500001 23520000 463 0.41 0.22 3.48
2 144860001 144880000 223 0.41 0.27 3.48
2 142210001 142230000 220 0.41 0.24 3.47
2 24080001 24100000 231 0.41 0.26 3.47
2 20090001 20110000 168 0.41 0.29 3.46
2 144520001 144540000 204 0.41 0.28 3.46
2 146540001 146560000 295 0.41 0.32 3.46
2 20080001 20100000 204 0.41 0.35 3.46
2 94310001 94330000 120 0.41 0.33 3.45
2 145990001 146010000 294 0.41 0.26 3.44
2 142900001 142920000 133 0.41 0.18 3.44
2 24050001 24070000 261 0.41 0.29 3.44
2 142200001 142220000 227 0.41 0.23 3.42
2 36560001 36580000 66 0.41 0.31 3.41
2 57730001 57750000 143 0.41 0.34 3.41
2 81620001 81640000 138 0.41 0.24 3.41
2 142920001 142940000 176 0.41 0.20 3.41
2 147390001 147410000 250 0.41 0.27 3.41
2 21170001 21190000 243 0.41 0.30 3.40
2 49920001 49940000 145 0.41 0.15 3.40
2 83420001 83440000 133 0.41 0.31 3.40

416
Chromosome Window start Window end SNP (N) Weighted Fst Mean Fst ZFst
2 36590001 36610000 97 0.41 0.29 3.40
2 142790001 142810000 245 0.41 0.25 3.40
2 24260001 24280000 414 0.41 0.28 3.39
2 23020001 23040000 347 0.41 0.25 3.39
2 149140001 149160000 67 0.41 0.20 3.39
2 142480001 142500000 265 0.41 0.26 3.38
2 49950001 49970000 179 0.41 0.16 3.38
2 78330001 78350000 247 0.41 0.29 3.38
2 36600001 36620000 79 0.40 0.29 3.37
3 90980001 91000000 120 0.57 0.39 5.19
3 90810001 90830000 209 0.56 0.37 5.13
3 84140001 84160000 145 0.50 0.48 4.44
3 84040001 84060000 101 0.50 0.33 4.40
3 83780001 83800000 74 0.49 0.34 4.35
3 84150001 84170000 122 0.49 0.47 4.32
3 84160001 84180000 103 0.49 0.48 4.31
3 84050001 84070000 110 0.48 0.38 4.26
3 90990001 91010000 119 0.48 0.30 4.24
3 83630001 83650000 99 0.47 0.29 4.14
3 79870001 79890000 206 0.46 0.30 4.02
3 84130001 84150000 101 0.46 0.42 3.98
3 96500001 96520000 235 0.45 0.31 3.91
3 83620001 83640000 101 0.45 0.28 3.89
3 78560001 78580000 319 0.44 0.25 3.81
3 5970001 5990000 230 0.44 0.27 3.80
3 37910001 37930000 426 0.44 0.29 3.79

417
Chromosome Window start Window end SNP (N) Weighted Fst Mean Fst ZFst
3 84170001 84190000 94 0.44 0.40 3.74
3 90820001 90840000 205 0.44 0.29 3.74
3 12410001 12430000 197 0.44 0.18 3.72
3 83770001 83790000 118 0.43 0.34 3.65
3 90800001 90820000 190 0.43 0.32 3.63
3 90620001 90640000 233 0.42 0.24 3.59
3 4700001 4720000 294 0.42 0.23 3.58
3 35260001 35280000 319 0.42 0.30 3.57
3 37920001 37940000 366 0.42 0.27 3.56
3 89680001 89700000 254 0.42 0.29 3.52
3 72010001 72030000 292 0.42 0.31 3.51
3 12640001 12660000 257 0.42 0.30 3.49
3 104620001 104640000 360 0.41 0.24 3.48
3 79860001 79880000 267 0.41 0.27 3.46
3 84030001 84050000 74 0.41 0.23 3.45
3 79800001 79820000 253 0.41 0.29 3.44
3 90970001 90990000 145 0.41 0.29 3.44
3 35250001 35270000 324 0.41 0.29 3.41
3 82370001 82390000 206 0.41 0.22 3.41
3 86440001 86460000 144 0.41 0.27 3.38
3 90950001 90970000 32 0.41 0.34 3.37
4 27910001 27930000 87 0.80 0.68 7.80
4 27890001 27910000 62 0.79 0.62 7.74
4 27880001 27900000 110 0.79 0.63 7.71
4 27900001 27920000 28 0.78 0.57 7.64
4 27870001 27890000 109 0.78 0.47 7.61

418
Chromosome Window start Window end SNP (N) Weighted Fst Mean Fst ZFst
4 28010001 28030000 38 0.78 0.71 7.61
4 28000001 28020000 30 0.76 0.66 7.45
4 27920001 27940000 110 0.76 0.64 7.43
4 27990001 28010000 26 0.76 0.61 7.40
4 28020001 28040000 43 0.76 0.63 7.36
4 27980001 28000000 21 0.75 0.64 7.28
4 28030001 28050000 84 0.75 0.62 7.25
4 27860001 27880000 83 0.74 0.27 7.22
4 28700001 28720000 146 0.71 0.53 6.81
4 28670001 28690000 127 0.70 0.54 6.74
4 26040001 26060000 107 0.70 0.57 6.67
4 28710001 28730000 117 0.69 0.51 6.61
4 28230001 28250000 131 0.68 0.53 6.51
4 28040001 28060000 118 0.68 0.57 6.46
4 28680001 28700000 149 0.67 0.49 6.36
4 27830001 27850000 52 0.66 0.54 6.31
4 28220001 28240000 164 0.66 0.58 6.31
4 28690001 28710000 156 0.66 0.46 6.30
4 28660001 28680000 90 0.66 0.40 6.27
4 26070001 26090000 177 0.65 0.46 6.16
4 27840001 27860000 51 0.65 0.33 6.16
4 27930001 27950000 77 0.65 0.46 6.09
4 26060001 26080000 206 0.64 0.42 6.07
4 27820001 27840000 47 0.64 0.48 6.02
4 28770001 28790000 108 0.64 0.36 6.01
4 27850001 27870000 54 0.64 0.15 6.00

419
Chromosome Window start Window end SNP (N) Weighted Fst Mean Fst ZFst
4 28750001 28770000 218 0.63 0.43 5.97
4 26050001 26070000 134 0.63 0.42 5.96
4 28760001 28780000 178 0.63 0.42 5.96
4 28740001 28760000 120 0.63 0.34 5.91
4 27970001 27990000 25 0.62 0.49 5.81
4 28210001 28230000 165 0.61 0.54 5.74
4 26030001 26050000 131 0.61 0.42 5.72
4 28590001 28610000 124 0.60 0.43 5.63
4 27950001 27970000 22 0.60 0.46 5.60
4 28090001 28110000 173 0.60 0.42 5.59
4 28720001 28740000 129 0.59 0.31 5.50
4 28120001 28140000 95 0.59 0.48 5.49
4 28920001 28940000 200 0.59 0.33 5.48
4 28200001 28220000 145 0.59 0.50 5.46
4 26120001 26140000 108 0.59 0.36 5.44
4 28520001 28540000 67 0.59 0.36 5.43
4 28530001 28550000 72 0.59 0.35 5.41
4 28130001 28150000 48 0.58 0.47 5.38
4 28080001 28100000 189 0.58 0.38 5.37
4 27940001 27960000 44 0.58 0.39 5.37
4 28180001 28200000 123 0.58 0.49 5.32
4 28730001 28750000 110 0.58 0.22 5.32
4 28170001 28190000 78 0.58 0.51 5.31
4 28510001 28530000 59 0.58 0.37 5.31
4 27410001 27430000 93 0.57 0.41 5.28
4 28600001 28620000 123 0.57 0.33 5.27

420
Chromosome Window start Window end SNP (N) Weighted Fst Mean Fst ZFst
4 28190001 28210000 134 0.57 0.47 5.26
4 28160001 28180000 21 0.56 0.53 5.16
4 27810001 27830000 35 0.56 0.31 5.16
4 28050001 28070000 115 0.56 0.51 5.15
4 27330001 27350000 174 0.56 0.40 5.11
4 28810001 28830000 172 0.56 0.22 5.08
4 28800001 28820000 221 0.55 0.27 5.06
4 26080001 26100000 127 0.55 0.39 5.04
4 28540001 28560000 81 0.55 0.27 5.02
4 26110001 26130000 151 0.55 0.36 4.99
4 28780001 28800000 140 0.55 0.24 4.97
4 26410001 26430000 152 0.54 0.28 4.92
4 27960001 27980000 25 0.54 0.44 4.91
4 39730001 39750000 399 0.54 0.39 4.88
4 26020001 26040000 135 0.54 0.31 4.87
4 27800001 27820000 38 0.54 0.24 4.86
4 28110001 28130000 118 0.54 0.40 4.86
4 27760001 27780000 37 0.53 0.29 4.83
4 27790001 27810000 37 0.53 0.29 4.81
4 27750001 27770000 30 0.53 0.28 4.81
4 26010001 26030000 106 0.53 0.23 4.80
4 28060001 28080000 123 0.53 0.43 4.80
4 27400001 27420000 66 0.53 0.34 4.80
4 27720001 27740000 34 0.53 0.36 4.76
4 28500001 28520000 71 0.53 0.38 4.75
4 28930001 28950000 210 0.52 0.32 4.73

421
Chromosome Window start Window end SNP (N) Weighted Fst Mean Fst ZFst
4 39720001 39740000 338 0.52 0.38 4.70
4 27020001 27040000 149 0.52 0.30 4.68
4 27260001 27280000 130 0.52 0.28 4.68
4 28910001 28930000 148 0.52 0.29 4.66
4 27320001 27340000 118 0.52 0.37 4.65
4 31170001 31190000 207 0.52 0.38 4.64
4 27030001 27050000 149 0.52 0.32 4.63
4 27780001 27800000 23 0.51 0.36 4.61
4 26420001 26440000 148 0.51 0.27 4.61
4 26090001 26110000 136 0.51 0.31 4.60
4 28240001 28260000 117 0.51 0.35 4.58
4 27770001 27790000 25 0.51 0.28 4.55
4 28100001 28120000 138 0.51 0.35 4.55
4 28790001 28810000 186 0.51 0.23 4.54
4 28490001 28510000 54 0.51 0.36 4.54
4 31180001 31200000 248 0.51 0.37 4.53
4 27610001 27630000 78 0.51 0.39 4.53
4 26100001 26120000 153 0.51 0.28 4.53
4 27040001 27060000 110 0.51 0.28 4.53
4 27590001 27610000 119 0.50 0.36 4.50
4 27340001 27360000 163 0.50 0.37 4.50
4 27360001 27380000 133 0.50 0.38 4.50
4 20310001 20330000 49 0.50 0.35 4.49
4 26430001 26450000 165 0.50 0.25 4.49
4 27600001 27620000 95 0.50 0.37 4.48
4 28370001 28390000 77 0.50 0.29 4.47

422
Chromosome Window start Window end SNP (N) Weighted Fst Mean Fst ZFst
4 28580001 28600000 125 0.50 0.29 4.46
4 49170001 49190000 347 0.50 0.32 4.45
4 25940001 25960000 229 0.50 0.37 4.42
4 25960001 25980000 207 0.50 0.33 4.42
4 28070001 28090000 148 0.50 0.31 4.40
4 25990001 26010000 98 0.50 0.32 4.40
4 25780001 25800000 314 0.50 0.26 4.39
4 25970001 25990000 172 0.49 0.33 4.39
4 19450001 19470000 24 0.49 0.35 4.38
4 20290001 20310000 31 0.49 0.37 4.37
4 20300001 20320000 39 0.49 0.35 4.37
4 26480001 26500000 146 0.49 0.29 4.35
4 28410001 28430000 70 0.49 0.25 4.34
4 25790001 25810000 302 0.49 0.25 4.34
4 28610001 28630000 145 0.49 0.20 4.31
4 27390001 27410000 68 0.49 0.29 4.30
4 27700001 27720000 94 0.49 0.44 4.29
4 28380001 28400000 103 0.49 0.30 4.28
4 27010001 27030000 181 0.48 0.21 4.27
4 19790001 19810000 41 0.48 0.35 4.27
4 27580001 27600000 108 0.48 0.36 4.27
4 27420001 27440000 167 0.48 0.36 4.26
4 25800001 25820000 316 0.48 0.25 4.26
4 27730001 27750000 24 0.48 0.38 4.25
4 27370001 27390000 88 0.48 0.33 4.25
4 26440001 26460000 159 0.48 0.25 4.24

423
Chromosome Window start Window end SNP (N) Weighted Fst Mean Fst ZFst
4 27710001 27730000 60 0.48 0.37 4.24
4 26490001 26510000 153 0.48 0.28 4.23
4 19850001 19870000 41 0.48 0.35 4.22
4 17960001 17980000 95 0.48 0.30 4.22
4 28420001 28440000 80 0.48 0.30 4.21
4 39740001 39760000 384 0.48 0.36 4.21
4 26810001 26830000 132 0.48 0.28 4.19
4 20320001 20340000 52 0.47 0.26 4.16
4 25770001 25790000 335 0.47 0.28 4.16
4 19610001 19630000 51 0.47 0.33 4.16
4 27690001 27710000 109 0.47 0.43 4.16
4 27350001 27370000 127 0.47 0.35 4.15
4 28350001 28370000 96 0.47 0.34 4.12
4 25950001 25970000 205 0.47 0.32 4.10
4 28430001 28450000 76 0.47 0.32 4.10
4 27740001 27760000 22 0.47 0.30 4.10
4 27250001 27270000 152 0.47 0.28 4.09
4 27460001 27480000 129 0.47 0.32 4.08
4 28360001 28380000 85 0.47 0.30 4.08
4 17970001 17990000 71 0.47 0.33 4.06
4 19550001 19570000 32 0.47 0.31 4.05
4 28400001 28420000 80 0.46 0.28 4.04
4 17980001 18000000 73 0.46 0.29 4.03
4 27510001 27530000 121 0.46 0.34 4.03
4 19860001 19880000 46 0.46 0.31 4.02
4 27170001 27190000 134 0.46 0.32 4.01

424
Chromosome Window start Window end SNP (N) Weighted Fst Mean Fst ZFst
4 20280001 20300000 39 0.46 0.25 3.99
4 28820001 28840000 118 0.46 0.17 3.99
4 20270001 20290000 57 0.46 0.24 3.98
4 5060001 5080000 353 0.46 0.26 3.97
4 2240001 2260000 402 0.46 0.35 3.97
4 25930001 25950000 210 0.46 0.33 3.94
4 25840001 25860000 247 0.45 0.27 3.93
4 27450001 27470000 129 0.45 0.32 3.93
4 25980001 26000000 146 0.45 0.31 3.92
4 19530001 19550000 33 0.45 0.29 3.92
4 19840001 19860000 38 0.45 0.31 3.91
4 20260001 20280000 47 0.45 0.26 3.90
4 19780001 19800000 55 0.45 0.29 3.87
4 19460001 19480000 35 0.45 0.30 3.87
4 19440001 19460000 36 0.45 0.33 3.87
4 27620001 27640000 84 0.45 0.36 3.87
4 28630001 28650000 155 0.45 0.16 3.86
4 19670001 19690000 57 0.45 0.33 3.86
4 19520001 19540000 52 0.45 0.30 3.85
4 19700001 19720000 25 0.45 0.29 3.85
4 27180001 27200000 187 0.45 0.27 3.84
4 28280001 28300000 149 0.45 0.28 3.83
4 49180001 49200000 323 0.44 0.29 3.82
4 83500001 83520000 326 0.44 0.30 3.81
4 25850001 25870000 254 0.44 0.22 3.79
4 27470001 27490000 104 0.44 0.29 3.79

425
Chromosome Window start Window end SNP (N) Weighted Fst Mean Fst ZFst
4 27520001 27540000 87 0.44 0.34 3.77
4 19560001 19580000 48 0.44 0.28 3.76
4 28620001 28640000 162 0.44 0.16 3.76
4 2230001 2250000 333 0.44 0.31 3.75
4 27060001 27080000 192 0.44 0.23 3.75
4 28340001 28360000 113 0.44 0.31 3.74
4 28390001 28410000 110 0.44 0.29 3.74
4 26500001 26520000 137 0.44 0.25 3.71
4 26560001 26580000 122 0.44 0.28 3.71
4 19580001 19600000 67 0.43 0.28 3.70
4 28650001 28670000 117 0.43 0.16 3.70
4 25880001 25900000 241 0.43 0.20 3.69
4 19940001 19960000 66 0.43 0.28 3.69
4 28460001 28480000 45 0.43 0.22 3.68
4 25910001 25930000 244 0.43 0.26 3.68
4 19830001 19850000 42 0.43 0.26 3.68
4 26000001 26020000 64 0.43 0.11 3.67
4 26800001 26820000 136 0.43 0.24 3.67
4 26780001 26800000 96 0.43 0.23 3.67
4 83490001 83510000 446 0.43 0.29 3.67
4 26700001 26720000 169 0.43 0.22 3.66
4 27120001 27140000 132 0.43 0.29 3.66
4 27160001 27180000 119 0.43 0.32 3.65
4 26690001 26710000 151 0.43 0.23 3.65
4 19770001 19790000 50 0.43 0.27 3.65
4 26720001 26740000 148 0.43 0.25 3.63

426
Chromosome Window start Window end SNP (N) Weighted Fst Mean Fst ZFst
4 83540001 83560000 234 0.43 0.32 3.63
4 28440001 28460000 60 0.43 0.24 3.63
4 19820001 19840000 53 0.43 0.25 3.62
4 19410001 19430000 41 0.43 0.25 3.62
4 27070001 27090000 199 0.43 0.24 3.62
4 26400001 26420000 153 0.43 0.16 3.62
4 19680001 19700000 76 0.43 0.28 3.62
4 26770001 26790000 129 0.43 0.22 3.61
4 2250001 2270000 431 0.43 0.32 3.61
4 26820001 26840000 149 0.43 0.25 3.61
4 19470001 19490000 58 0.42 0.27 3.60
4 26470001 26490000 121 0.42 0.23 3.59
4 19570001 19590000 68 0.42 0.27 3.59
4 26130001 26150000 134 0.42 0.10 3.58
4 28840001 28860000 109 0.42 0.27 3.58
4 28290001 28310000 169 0.42 0.28 3.58
4 28640001 28660000 152 0.42 0.15 3.58
4 83530001 83550000 250 0.42 0.28 3.55
4 17950001 17970000 104 0.42 0.24 3.55
4 19660001 19680000 62 0.42 0.26 3.54
4 19620001 19640000 68 0.42 0.25 3.51
4 27110001 27130000 149 0.42 0.27 3.51
4 19950001 19970000 67 0.42 0.27 3.50
4 82350001 82370000 365 0.42 0.27 3.50
4 27500001 27520000 84 0.42 0.30 3.49
4 19600001 19620000 47 0.42 0.26 3.49

427
Chromosome Window start Window end SNP (N) Weighted Fst Mean Fst ZFst
4 27560001 27580000 111 0.41 0.32 3.48
4 26840001 26860000 177 0.41 0.24 3.48
4 19690001 19710000 67 0.41 0.26 3.48
4 19540001 19560000 22 0.41 0.24 3.47
4 20650001 20670000 169 0.41 0.26 3.47
4 26710001 26730000 152 0.41 0.23 3.47
4 29000001 29020000 278 0.41 0.22 3.47
4 27570001 27590000 100 0.41 0.32 3.46
4 28550001 28570000 106 0.41 0.16 3.46
4 4100001 4120000 259 0.41 0.25 3.46
4 19590001 19610000 52 0.41 0.26 3.44
4 25900001 25920000 140 0.41 0.28 3.44
4 19870001 19890000 56 0.41 0.27 3.44
4 26680001 26700000 118 0.41 0.20 3.43
4 27440001 27460000 154 0.41 0.22 3.43
4 25870001 25890000 261 0.41 0.20 3.43
4 28560001 28580000 136 0.41 0.16 3.42
4 27550001 27570000 119 0.41 0.32 3.42
4 20560001 20580000 151 0.41 0.21 3.41
4 28450001 28470000 62 0.41 0.21 3.41
4 25830001 25850000 270 0.41 0.24 3.41
4 26880001 26900000 139 0.41 0.23 3.41
4 39750001 39770000 339 0.41 0.32 3.41
4 29010001 29030000 265 0.41 0.22 3.41
4 19510001 19530000 59 0.41 0.25 3.39
4 26870001 26890000 154 0.41 0.22 3.39

428
Chromosome Window start Window end SNP (N) Weighted Fst Mean Fst ZFst
4 5070001 5090000 382 0.41 0.22 3.38
4 19800001 19820000 49 0.41 0.27 3.37
4 27220001 27240000 196 0.41 0.23 3.37
5 23340001 23360000 167 0.64 0.50 5.99
5 23350001 23370000 173 0.63 0.55 5.91
5 26450001 26470000 191 0.62 0.45 5.75
5 15310001 15330000 196 0.61 0.37 5.74
5 15320001 15340000 299 0.60 0.40 5.63
5 15330001 15350000 311 0.59 0.37 5.51
5 15300001 15320000 245 0.58 0.28 5.39
5 15340001 15360000 259 0.58 0.34 5.37
5 25910001 25930000 219 0.58 0.35 5.37
5 15290001 15310000 253 0.58 0.28 5.33
5 19810001 19830000 60 0.58 0.41 5.30
5 23690001 23710000 164 0.57 0.48 5.29
5 25930001 25950000 254 0.57 0.32 5.29
5 16790001 16810000 315 0.57 0.25 5.28
5 25920001 25940000 238 0.57 0.34 5.26
5 23330001 23350000 113 0.57 0.42 5.22
5 26170001 26190000 245 0.57 0.41 5.21
5 26460001 26480000 251 0.56 0.37 5.18
5 23320001 23340000 111 0.56 0.39 5.11
5 25940001 25960000 201 0.56 0.30 5.08
5 25900001 25920000 239 0.56 0.32 5.08
5 23310001 23330000 203 0.55 0.32 5.07
5 15420001 15440000 383 0.55 0.31 5.02

429
Chromosome Window start Window end SNP (N) Weighted Fst Mean Fst ZFst
5 16780001 16800000 412 0.55 0.26 4.97
5 19800001 19820000 111 0.54 0.38 4.94
5 16800001 16820000 249 0.54 0.27 4.94
5 15430001 15450000 356 0.54 0.32 4.91
5 25890001 25910000 174 0.54 0.28 4.91
5 23360001 23380000 180 0.54 0.47 4.88
5 23610001 23630000 270 0.54 0.37 4.87
5 16930001 16950000 404 0.54 0.27 4.85
5 16920001 16940000 403 0.54 0.29 4.85
5 26180001 26200000 254 0.54 0.37 4.84
5 15240001 15260000 305 0.53 0.32 4.82
5 25430001 25450000 264 0.53 0.35 4.81
5 23300001 23320000 275 0.53 0.29 4.78
5 21780001 21800000 207 0.53 0.35 4.76
5 23820001 23840000 226 0.53 0.42 4.76
5 25440001 25460000 363 0.53 0.35 4.76
5 23620001 23640000 269 0.53 0.33 4.74
5 23420001 23440000 186 0.53 0.40 4.74
5 5550001 5570000 351 0.53 0.35 4.73
5 15580001 15600000 380 0.53 0.30 4.73
5 22960001 22980000 125 0.52 0.41 4.72
5 21050001 21070000 160 0.52 0.41 4.71
5 16770001 16790000 378 0.52 0.25 4.69
5 23410001 23430000 215 0.52 0.37 4.67
5 23390001 23410000 140 0.52 0.33 4.67
5 15570001 15590000 369 0.52 0.27 4.65

430
Chromosome Window start Window end SNP (N) Weighted Fst Mean Fst ZFst
5 22950001 22970000 108 0.52 0.44 4.65
5 25880001 25900000 130 0.52 0.27 4.64
5 2320001 2340000 53 0.52 0.45 4.62
5 24000001 24020000 172 0.52 0.34 4.62
5 2310001 2330000 96 0.51 0.46 4.61
5 21820001 21840000 326 0.51 0.28 4.61
5 14090001 14110000 362 0.51 0.30 4.60
5 23680001 23700000 184 0.51 0.35 4.58
5 5540001 5560000 279 0.51 0.34 4.57
5 21000001 21020000 84 0.51 0.39 4.56
5 15410001 15430000 282 0.51 0.26 4.56
5 16910001 16930000 319 0.51 0.29 4.55
5 23400001 23420000 148 0.51 0.33 4.54
5 21810001 21830000 358 0.51 0.30 4.52
5 21120001 21140000 173 0.51 0.41 4.52
5 23700001 23720000 174 0.50 0.41 4.50
5 2300001 2320000 84 0.50 0.43 4.50
5 21790001 21810000 255 0.50 0.32 4.48
5 26160001 26180000 289 0.50 0.31 4.48
5 15350001 15370000 326 0.50 0.27 4.47
5 23170001 23190000 314 0.50 0.34 4.46
5 15520001 15540000 456 0.50 0.28 4.45
5 15560001 15580000 313 0.50 0.28 4.45
5 23600001 23620000 132 0.50 0.34 4.45
5 2290001 2310000 63 0.50 0.42 4.44
5 25870001 25890000 130 0.50 0.32 4.44

431
Chromosome Window start Window end SNP (N) Weighted Fst Mean Fst ZFst
5 16830001 16850000 431 0.50 0.30 4.43
5 15460001 15480000 306 0.50 0.27 4.42
5 16310001 16330000 218 0.50 0.31 4.42
5 26120001 26140000 195 0.50 0.38 4.42
5 15370001 15390000 350 0.50 0.28 4.39
5 5560001 5580000 364 0.49 0.35 4.38
5 27710001 27730000 241 0.49 0.34 4.37
5 15280001 15300000 235 0.49 0.20 4.37
5 16760001 16780000 378 0.49 0.22 4.36
5 15230001 15250000 352 0.49 0.30 4.34
5 26310001 26330000 193 0.49 0.33 4.33
5 14080001 14100000 406 0.49 0.28 4.31
5 15190001 15210000 342 0.49 0.23 4.29
5 15850001 15870000 225 0.49 0.27 4.29
5 2280001 2300000 63 0.49 0.41 4.28
5 15360001 15380000 363 0.49 0.27 4.28
5 15590001 15610000 361 0.49 0.27 4.28
5 15550001 15570000 373 0.48 0.27 4.27
5 23790001 23810000 146 0.48 0.43 4.27
5 15470001 15490000 318 0.48 0.26 4.26
5 21010001 21030000 127 0.48 0.34 4.26
5 23810001 23830000 195 0.48 0.38 4.24
5 25850001 25870000 250 0.48 0.28 4.24
5 15510001 15530000 452 0.48 0.25 4.24
5 15480001 15500000 344 0.48 0.25 4.22
5 15450001 15470000 264 0.48 0.21 4.22

432
Chromosome Window start Window end SNP (N) Weighted Fst Mean Fst ZFst
5 15250001 15270000 332 0.48 0.27 4.21
5 25760001 25780000 182 0.48 0.27 4.19
5 22940001 22960000 106 0.48 0.37 4.19
5 15200001 15220000 327 0.48 0.29 4.19
5 24010001 24030000 224 0.48 0.30 4.17
5 25960001 25980000 223 0.47 0.25 4.16
5 21110001 21130000 255 0.47 0.40 4.15
5 23560001 23580000 320 0.47 0.29 4.14
5 16560001 16580000 415 0.47 0.28 4.13
5 16820001 16840000 482 0.47 0.29 4.12
5 23590001 23610000 128 0.47 0.32 4.12
5 15440001 15460000 290 0.47 0.22 4.12
5 20620001 20640000 183 0.47 0.37 4.12
5 16840001 16860000 208 0.47 0.26 4.11
5 22350001 22370000 161 0.47 0.32 4.10
5 22970001 22990000 246 0.47 0.30 4.08
5 15490001 15510000 364 0.47 0.25 4.07
5 15380001 15400000 312 0.47 0.26 4.07
5 22930001 22950000 97 0.46 0.28 4.05
5 44470001 44490000 203 0.46 0.33 4.04
5 16730001 16750000 219 0.46 0.28 4.03
5 21830001 21850000 244 0.46 0.27 4.02
5 16320001 16340000 297 0.46 0.28 4.01
5 25860001 25880000 160 0.46 0.27 4.01
5 15540001 15560000 416 0.46 0.25 4.00
5 26040001 26060000 335 0.46 0.31 4.00

433
Chromosome Window start Window end SNP (N) Weighted Fst Mean Fst ZFst
5 20030001 20050000 162 0.46 0.38 3.99
5 16810001 16830000 411 0.46 0.27 3.99
5 16740001 16760000 382 0.46 0.27 3.99
5 27720001 27740000 253 0.46 0.26 3.98
5 16940001 16960000 377 0.46 0.24 3.98
5 19790001 19810000 109 0.46 0.33 3.97
5 16960001 16980000 254 0.46 0.25 3.97
5 15530001 15550000 428 0.46 0.25 3.96
5 21800001 21820000 268 0.46 0.29 3.96
5 15220001 15240000 371 0.45 0.27 3.94
5 2260001 2280000 62 0.45 0.28 3.93
5 18500001 18520000 296 0.45 0.28 3.93
5 16900001 16920000 195 0.45 0.23 3.91
5 2130001 2150000 60 0.45 0.33 3.91
5 27150001 27170000 286 0.45 0.26 3.91
5 26190001 26210000 292 0.45 0.31 3.91
5 2140001 2160000 75 0.45 0.19 3.91
5 25750001 25770000 206 0.45 0.32 3.90
5 26320001 26340000 217 0.45 0.35 3.89
5 2270001 2290000 69 0.45 0.32 3.88
5 15600001 15620000 391 0.45 0.24 3.88
5 25780001 25800000 233 0.45 0.27 3.88
5 15400001 15420000 267 0.45 0.23 3.87
5 23290001 23310000 310 0.45 0.24 3.86
5 15210001 15230000 314 0.45 0.25 3.86
5 23650001 23670000 212 0.45 0.34 3.86

434
Chromosome Window start Window end SNP (N) Weighted Fst Mean Fst ZFst
5 16750001 16770000 422 0.45 0.23 3.85
5 23430001 23450000 232 0.45 0.30 3.84
5 2240001 2260000 57 0.45 0.34 3.84
5 16550001 16570000 385 0.45 0.25 3.84
5 2250001 2270000 54 0.45 0.32 3.83
5 25840001 25860000 288 0.44 0.27 3.82
5 15180001 15200000 312 0.44 0.18 3.81
5 15390001 15410000 318 0.44 0.25 3.79
5 24030001 24050000 160 0.44 0.31 3.79
5 16330001 16350000 274 0.44 0.29 3.77
5 16300001 16320000 237 0.44 0.26 3.77
5 25970001 25990000 229 0.44 0.29 3.77
5 15500001 15520000 400 0.44 0.22 3.75
5 15260001 15280000 301 0.44 0.23 3.74
5 21080001 21100000 264 0.44 0.34 3.74
5 35130001 35150000 167 0.44 0.33 3.74
5 15610001 15630000 404 0.44 0.25 3.73
5 2230001 2250000 63 0.44 0.31 3.72
5 5530001 5550000 152 0.44 0.30 3.72
5 21060001 21080000 182 0.44 0.33 3.71
5 14070001 14090000 463 0.43 0.25 3.70
5 22340001 22360000 166 0.43 0.29 3.70
5 21770001 21790000 201 0.43 0.35 3.69
5 16970001 16990000 283 0.43 0.26 3.68
5 2150001 2170000 103 0.43 0.21 3.68
5 25770001 25790000 214 0.43 0.23 3.68

435
Chromosome Window start Window end SNP (N) Weighted Fst Mean Fst ZFst
5 10460001 10480000 262 0.43 0.32 3.67
5 22800001 22820000 240 0.43 0.28 3.66
5 14990001 15010000 62 0.43 0.20 3.66
5 15700001 15720000 310 0.43 0.25 3.66
5 5390001 5410000 296 0.43 0.23 3.65
5 16540001 16560000 450 0.43 0.24 3.64
5 22790001 22810000 208 0.43 0.26 3.63
5 21760001 21780000 291 0.43 0.32 3.63
5 25240001 25260000 187 0.43 0.30 3.63
5 45110001 45130000 329 0.43 0.33 3.63
5 19760001 19780000 180 0.43 0.35 3.62
5 26440001 26460000 142 0.43 0.15 3.61
5 23570001 23590000 291 0.43 0.24 3.60
5 21890001 21910000 234 0.42 0.25 3.59
5 27160001 27180000 256 0.42 0.27 3.57
5 18690001 18710000 356 0.42 0.23 3.57
5 27210001 27230000 267 0.42 0.28 3.56
5 23670001 23690000 185 0.42 0.27 3.56
5 27500001 27520000 159 0.42 0.29 3.56
5 21920001 21940000 266 0.42 0.27 3.56
5 21100001 21120000 310 0.42 0.35 3.55
5 2120001 2140000 74 0.42 0.33 3.55
5 23580001 23600000 249 0.42 0.27 3.55
5 23830001 23850000 279 0.42 0.29 3.55
5 25950001 25970000 237 0.42 0.20 3.55
5 27140001 27160000 296 0.42 0.27 3.54

436
Chromosome Window start Window end SNP (N) Weighted Fst Mean Fst ZFst
5 2160001 2180000 59 0.42 0.25 3.53
5 25450001 25470000 335 0.42 0.31 3.53
5 21020001 21040000 186 0.42 0.29 3.53
5 14100001 14120000 389 0.42 0.27 3.52
5 37410001 37430000 233 0.42 0.30 3.52
5 18570001 18590000 206 0.42 0.22 3.52
5 19770001 19790000 155 0.42 0.34 3.52
5 16460001 16480000 247 0.42 0.31 3.52
5 16530001 16550000 484 0.42 0.25 3.51
5 21880001 21900000 289 0.42 0.25 3.51
5 23510001 23530000 173 0.42 0.27 3.51
5 18510001 18530000 265 0.42 0.27 3.51
5 25150001 25170000 291 0.42 0.23 3.50
5 16270001 16290000 325 0.42 0.21 3.49
5 22140001 22160000 373 0.42 0.24 3.49
5 14150001 14170000 292 0.42 0.24 3.49
5 15270001 15290000 273 0.41 0.17 3.48
5 21040001 21060000 143 0.41 0.32 3.48
5 26150001 26170000 248 0.41 0.25 3.48
5 35430001 35450000 163 0.41 0.26 3.46
5 2190001 2210000 93 0.41 0.33 3.45
5 18560001 18580000 175 0.41 0.22 3.45
5 23660001 23680000 191 0.41 0.31 3.44
5 2040001 2060000 123 0.41 0.31 3.44
5 16570001 16590000 424 0.41 0.23 3.44
5 23780001 23800000 177 0.41 0.35 3.44

437
Chromosome Window start Window end SNP (N) Weighted Fst Mean Fst ZFst
5 2100001 2120000 119 0.41 0.36 3.43
5 25250001 25270000 214 0.41 0.30 3.42
5 45120001 45140000 326 0.41 0.31 3.42
5 22860001 22880000 161 0.41 0.33 3.42
5 28000001 28020000 327 0.41 0.27 3.42
5 2110001 2130000 82 0.41 0.35 3.41
5 44460001 44480000 249 0.41 0.28 3.41
5 15170001 15190000 309 0.41 0.23 3.41
5 25790001 25810000 269 0.41 0.35 3.41
5 23550001 23570000 338 0.41 0.25 3.41
5 21900001 21920000 289 0.41 0.23 3.41
5 2220001 2240000 66 0.41 0.30 3.40
5 26130001 26150000 184 0.41 0.32 3.40
5 2090001 2110000 118 0.41 0.35 3.40
5 22850001 22870000 98 0.41 0.28 3.40
5 13980001 14000000 175 0.41 0.17 3.39
5 2200001 2220000 82 0.41 0.30 3.39
5 5570001 5590000 349 0.41 0.27 3.39
5 22200001 22220000 316 0.41 0.21 3.38
5 23160001 23180000 325 0.41 0.29 3.37
5 26280001 26300000 119 0.41 0.30 3.37
7 31730001 31750000 307 0.45 0.20 3.89
8 15490001 15510000 114 0.71 0.60 6.79
8 15480001 15500000 127 0.64 0.44 5.98
8 15500001 15520000 130 0.61 0.49 5.73
8 15430001 15450000 230 0.54 0.28 4.93

438
Chromosome Window start Window end SNP (N) Weighted Fst Mean Fst ZFst
8 15440001 15460000 221 0.50 0.27 4.42
8 15510001 15530000 142 0.49 0.34 4.36
8 15530001 15550000 187 0.48 0.33 4.24
8 15540001 15560000 178 0.47 0.32 4.13
8 22420001 22440000 208 0.47 0.31 4.09
8 15520001 15540000 168 0.46 0.31 4.01
8 15450001 15470000 183 0.45 0.25 3.89
8 22560001 22580000 205 0.45 0.30 3.85
8 22550001 22570000 190 0.42 0.28 3.60
8 15420001 15440000 223 0.42 0.22 3.57
8 15460001 15480000 169 0.41 0.22 3.45
9 13800001 13820000 348 0.44 0.31 3.73
10 12450001 12470000 165 0.63 0.40 5.93
10 12460001 12480000 164 0.59 0.35 5.47
10 12440001 12460000 160 0.57 0.37 5.18
10 12480001 12500000 208 0.56 0.39 5.13
10 12470001 12490000 182 0.55 0.37 5.06
10 12420001 12440000 290 0.50 0.29 4.45
10 16750001 16770000 252 0.49 0.31 4.30
10 12410001 12430000 249 0.48 0.26 4.26
10 12430001 12450000 237 0.48 0.27 4.17
10 16740001 16760000 255 0.43 0.28 3.60
10 2610001 2630000 347 0.42 0.24 3.56
10 2620001 2640000 293 0.42 0.24 3.53
10 610001 630000 102 0.42 0.26 3.53
10 600001 620000 115 0.42 0.27 3.49

439
Chromosome Window start Window end SNP (N) Weighted Fst Mean Fst ZFst
11 19050001 19070000 272 0.59 0.39 5.47
11 19060001 19080000 242 0.53 0.39 4.75
11 13520001 13540000 175 0.52 0.45 4.70
11 19070001 19090000 229 0.51 0.36 4.52
11 19040001 19060000 278 0.47 0.32 4.08
11 13530001 13550000 151 0.43 0.40 3.70
11 13510001 13530000 150 0.43 0.36 3.69
11 4650001 4670000 272 0.42 0.25 3.49
11 12980001 13000000 149 0.41 0.34 3.40
12 3860001 3880000 213 0.54 0.40 4.90
12 3850001 3870000 172 0.49 0.38 4.37
12 3870001 3890000 245 0.48 0.31 4.17
12 3880001 3900000 238 0.43 0.26 3.63
13 520001 540000 22 0.47 0.45 4.09
13 530001 550000 22 0.47 0.45 4.09
13 13690001 13710000 188 0.41 0.26 3.44
14 3850001 3870000 203 0.49 0.30 4.35
14 3540001 3560000 162 0.48 0.33 4.19
14 3860001 3880000 180 0.44 0.30 3.75
14 3550001 3570000 194 0.43 0.31 3.66
14 3530001 3550000 115 0.42 0.29 3.54
14 3880001 3900000 217 0.41 0.31 3.44
14 3890001 3910000 286 0.41 0.29 3.39
15 7270001 7290000 318 0.51 0.26 4.54
15 7280001 7300000 288 0.48 0.26 4.18
15 7250001 7270000 391 0.41 0.20 3.45

440
Chromosome Window start Window end SNP (N) Weighted Fst Mean Fst ZFst
15 7260001 7280000 401 0.41 0.18 3.39
17 2670001 2690000 309 0.45 0.29 3.84
17 1070001 1090000 105 0.43 0.34 3.60
20 4720001 4740000 297 0.42 0.24 3.57
20 4710001 4730000 368 0.42 0.24 3.54
23 4540001 4560000 340 0.42 0.25 3.52
27 5280001 5300000 168 0.45 0.25 3.85
27 5270001 5290000 207 0.43 0.23 3.69
27 4090001 4110000 114 0.43 0.29 3.63
27 5370001 5390000 98 0.43 0.27 3.60
N = count
Table S 66. List of candidate genes in |Improved Horro and Arabo chickens.
Chromosome Gene start (bp) Gene end (bp) Gene stable ID Gene type Gene name
1 59245579 59246586 ENSGALG00000044624 protein coding
1 180999373 180999454 ENSGALG00000025213 miRNA gga-mir-1709
1 177513346 177560920 ENSGALG00000017119 protein coding TNFRSF19
1 56693093 56705912 ENSGALG00000012847 protein coding
1 181192418 181414573 ENSGALG00000038995 protein coding GRIA4
1 56754302 56787545 ENSGALG00000035108 protein coding KDM7A
1 56680591 56689353 ENSGALG00000034511 protein coding
1 137351599 137382930 ENSGALG00000016824 protein coding TMCO3
1 182684536 182765393 ENSGALG00000038154 protein coding YAP1
1 4402132 4591692 ENSGALG00000029270 protein coding GATA3
1 179051034 179094239 ENSGALG00000017139 protein coding
1 59237872 59238879 ENSGALG00000045031 protein coding
1 59241726 59242732 ENSGALG00000044524 protein coding
1 137439551 137445352 ENSGALG00000046372 protein coding
1 137487513 137505777 ENSGALG00000037697 protein coding LAMP1
1 146527090 147094328 ENSGALG00000016900 protein coding GPC6
1 47186191 47253542 ENSGALG00000011557 protein coding UHRF1BP1L
1 137511432 137545754 ENSGALG00000016830 protein coding CUL4A
1 47268108 47299064 ENSGALG00000011569 protein coding SCYL2
1 47183349 47267032 ENSGALG00000040976 protein coding ACTR6
1 110323165 110332874 ENSGALG00000045726 protein coding

441
Chromosome Gene start (bp) Gene end (bp) Gene stable ID Gene type Gene name
1 110334367 110341333 ENSGALG00000019171 protein coding C1H21ORF33
1 177503653 177503754 ENSGALG00000025608 snRNA RF00026
1 137458314 137486611 ENSGALG00000016828 protein coding GRTP1
1 59249433 59250440 ENSGALG00000044959 protein coding
1 59253286 59254293 ENSGALG00000046239 protein coding
1 59257140 59258147 ENSGALG00000045433 protein coding
1 59164015 59224210 ENSGALG00000012934 protein coding
1 177160927 177162801 ENSGALG00000027868 protein coding AMER2
1 177430969 177493253 ENSGALG00000017118 protein coding MIPEP
1 162382843 162527048 ENSGALG00000016937 protein coding DIAPH3
1 179104456 179142555 ENSGALG00000043421 protein coding
1 150234073 150532403 ENSGALG00000032339 lincRNA
1 153246824 153303855 ENSGALG00000036877 lincRNA
1 159526738 159744910 ENSGALG00000040093 lincRNA
1 177505128 177506167 ENSGALG00000035746 lincRNA
1 181770866 181805885 ENSGALG00000033716 lincRNA
2 23387591 23424059 ENSGALG00000035994 protein coding
2 20364201 20463104 ENSGALG00000008747 protein coding ITGA8
2 104089460 104089532 ENSGALG00000025572 miRNA gga-mir-1597
2 24156138 24250062 ENSGALG00000009728 protein coding SLC25A13
2 144646756 144875068 ENSGALG00000038022 protein coding COL22A1
2 22978146 23047300 ENSGALG00000009500 protein coding VPS50
2 145815693 145960326 ENSGALG00000031741 protein coding PTK2
2 132121027 132231350 ENSGALG00000030030 protein coding RSPO2
2 21669403 21678883 ENSGALG00000009006 protein coding
2 50150482 50280221 ENSGALG00000031758 protein coding SUGCT
2 21710551 21734535 ENSGALG00000009026 protein coding
2 31211304 31319341 ENSGALG00000010961 protein coding IGF2BP3
2 21877225 22125099 ENSGALG00000009062 protein coding CDK14
2 146149257 146178507 ENSGALG00000034971 protein coding SLC45A4
2 17452004 17513814 ENSGALG00000007864 protein coding ARMC3
2 49640512 49897096 ENSGALG00000031713 protein coding POU6F2
2 49979496 49987966 ENSGALG00000043636 protein coding YAE1D1
2 21736604 21737002 ENSGALG00000032592 protein coding FAM237B
2 22162541 22164687 ENSGALG00000009064 protein coding FZD1
2 22587398 22642927 ENSGALG00000031917 protein coding ANKIB1
2 149141562 149141858 ENSGALG00000036414 protein coding
2 49987976 50001040 ENSGALG00000037112 protein coding
2 142197114 142221622 ENSGALG00000037773 protein coding ST3GAL1
2 149145028 149145324 ENSGALG00000029325 protein coding
2 147222471 147418330 ENSGALG00000037014 protein coding TSNARE1
2 83340744 83708432 ENSGALG00000013124 protein coding FHOD3
2 149148660 149148956 ENSGALG00000030191 protein coding

442
Chromosome Gene start (bp) Gene end (bp) Gene stable ID Gene type Gene name
2 23985830 24151767 ENSGALG00000009722 protein coding DYNC1I1
2 149152445 149152741 ENSGALG00000034333 protein coding
2 149228059 149229441 ENSGALG00000039346 protein coding
2 30714422 30862920 ENSGALG00000034024 protein coding RAPGEF5
2 20027818 20125211 ENSGALG00000040891 protein coding RSU1
2 103906763 104138860 ENSGALG00000015112 protein coding ZNF521
2 143191899 143269024 ENSGALG00000031519 protein coding KHDRBS3
2 20693000 20781828 ENSGALG00000008912 protein coding ABCB1
3 104621983 104668401 ENSGALG00000016500 protein coding FKBP1B
3 12273168 12439182 ENSGALG00000009158 protein coding CDC42BPA
3 79870059 79870168 ENSGALG00000025861 miRNA gga-mir-6670
3 37916515 37937367 ENSGALG00000040000 protein coding ERO1B
3 86406473 86714063 ENSGALG00000016276 protein coding KHDRBS2
3 83576272 83636038 ENSGALG00000030872 protein coding
3 78537400 78582981 ENSGALG00000015864 protein coding IBTK
3 35235950 35336239 ENSGALG00000010713 protein coding SDCCAG8
3 79785429 79884137 ENSGALG00000015889 protein coding PHIP
3 83723661 83990345 ENSGALG00000016176 protein coding
3 82215093 82512310 ENSGALG00000015944 protein coding RIMS1
3 96512108 96596917 ENSGALG00000016419 protein coding ASAP2
3 12614967 12687678 ENSGALG00000009057 protein coding TASP1
3 5940896 6020972 ENSGALG00000035400 lincRNA
4 83480038 83562645 ENSGALG00000015692 protein coding POLN
4 20654247 20654356 ENSGALG00000027439 miRNA
4 31172411 31172583 ENSGALG00000028077 misc_RNA RF02271
4 19460437 19460523 ENSGALG00000042586 miRNA
4 19548868 19548950 ENSGALG00000032953 miRNA
4 2209876 2231355 ENSGALG00000005425 protein coding OGT
4 39752033 39762452 ENSGALG00000020210 protein coding CENPU
4 2232118 2260037 ENSGALG00000005464 protein coding
4 19424229 19426802 ENSGALG00000009192 protein coding SLITRK2
4 5049715 5062317 ENSGALG00000006513 protein coding F9
4 2262230 2272389 ENSGALG00000005475 protein coding RHOGL
4 5064752 5112915 ENSGALG00000006562 protein coding MCF2
4 4097689 4105863 ENSGALG00000006108 protein coding FAM122B
4 4107645 4121192 ENSGALG00000006127 protein coding FAM122A
4 39762374 39778389 ENSGALG00000010636 protein coding PRIMPOL
4 39713691 39752253 ENSGALG00000010628 protein coding ACSL1
4 27095819 27127946 ENSGALG00000009719 protein coding PCDH10
4 20559675 20561135 ENSGALG00000009276 protein coding LRAT
4 31100895 31177614 ENSGALG00000009948 protein coding HHIP
4 19392907 19563891 ENSGALG00000033107 lincRNA
4 19504112 19511619 ENSGALG00000033380 lincRNA

443
Chromosome Gene start (bp) Gene end (bp) Gene stable ID Gene type Gene name
4 19541886 19542585 ENSGALG00000041824 lincRNA
4 19819071 19857159 ENSGALG00000039736 lincRNA
4 19873184 19873825 ENSGALG00000039492 lincRNA
4 25900254 25900939 ENSGALG00000030400 lincRNA
4 26689975 26702258 ENSGALG00000032689 lincRNA
4 27043314 27051634 ENSGALG00000029613 lincRNA
4 27396660 27628525 ENSGALG00000032527 lincRNA
4 27600624 27601331 ENSGALG00000031625 lincRNA
4 27788185 27825157 ENSGALG00000035886 lincRNA
4 28160838 28173463 ENSGALG00000036104 lincRNA
4 28904779 28987118 ENSGALG00000034709 lincRNA
5 18540733 18648374 ENSGALG00000011609 protein coding
5 16916541 17001110 ENSGALG00000007374 protein coding YPEL4
5 25739631 25793114 ENSGALG00000041014 protein coding
5 16823643 16830832 ENSGALG00000007217 protein coding BEST1
5 25964150 26042047 ENSGALG00000009249 protein coding UBR1
5 23667294 23667403 ENSGALG00000025785 miRNA gga-mir-6706
5 21728195 21799637 ENSGALG00000031542 protein coding EXT2
5 16777263 16794363 ENSGALG00000007178 protein coding FADS2
5 14053799 14092907 ENSGALG00000006583 protein coding LSP1
5 23428174 23428284 ENSGALG00000024631 snoRNA RF00573
5 5522441 5536835 ENSGALG00000012109 protein coding EIF3M
5 16919059 16920630 ENSGALG00000026207 protein coding CNTF
5 26193022 26193130 ENSGALG00000026386 miRNA gga-mir-6587
5 23698675 23739368 ENSGALG00000008393 protein coding CREB3L1
5 27718429 27835276 ENSGALG00000009415 protein coding SMOC1
5 16906936 16909098 ENSGALG00000028536 protein coding MPEG1
5 18698547 18709078 ENSGALG00000035867 protein coding ELF5
5 16921133 16935600 ENSGALG00000007287 protein coding
5 26454626 26467002 ENSGALG00000009345 protein coding
5 45129564 45133553 ENSGALG00000017387 protein coding TMEM251
5 14921862 14996500 ENSGALG00000038950 protein coding
5 27201732 27283175 ENSGALG00000000296 protein coding PCNX1
5 2161580 2188356 ENSGALG00000003908 protein coding SLC6A5
5 15151804 15252302 ENSGALG00000006830 protein coding CHID1
5 44480201 44495004 ENSGALG00000010738 protein coding TC2N
5 16740019 16749937 ENSGALG00000020485 protein coding
5 16375981 16504146 ENSGALG00000029533 protein coding LRP5
5 23347084 23385831 ENSGALG00000032181 protein coding LRP4
5 16520186 16571864 ENSGALG00000007037 protein coding PPP6R3
5 25967888 25978284 ENSGALG00000009185 protein coding ROM1
5 25840267 25867905 ENSGALG00000009156 protein coding CDAN1
5 21810345 21834715 ENSGALG00000032584 protein coding ALX4

444
Chromosome Gene start (bp) Gene end (bp) Gene stable ID Gene type Gene name
5 16323167 16343974 ENSGALG00000020488 protein coding
5 15714417 15737602 ENSGALG00000006868 protein coding
5 14163587 14184836 ENSGALG00000006647 protein coding DUSP8
5 23771783 23893510 ENSGALG00000008403 protein coding PHF21A
5 26043044 26063006 ENSGALG00000009260 protein coding TMEM62
5 45136789 45147580 ENSGALG00000010842 protein coding UBR7
5 14094429 14098832 ENSGALG00000006591 protein coding TNNI2
5 25199152 25289469 ENSGALG00000008940 protein coding SPTBN5
5 23170347 23190317 ENSGALG00000008231 protein coding PACSIN3
5 2201059 2481132 ENSGALG00000003777 protein coding NELL1
5 18522566 18531083 ENSGALG00000031889 protein coding
5 22795462 22803111 ENSGALG00000008089 protein coding KBTBD4
5 35109226 35715442 ENSGALG00000029022 protein coding NPAS3
5 25432899 25445807 ENSGALG00000029454 protein coding
5 16977551 16978970 ENSGALG00000007341 protein coding MED19
5 16941486 16967936 ENSGALG00000007330 protein coding CTNND1
5 22862958 22872275 ENSGALG00000008100 protein coding RAPSN
5 13998219 14009090 ENSGALG00000006561 protein coding MRPL23
5 26124345 26142266 ENSGALG00000009282 protein coding ELMSAN1
5 2086559 2141355 ENSGALG00000003958 protein coding PRMT3
5 26150108 26163720 ENSGALG00000028568 protein coding DNAL1
5 14108059 14112076 ENSGALG00000006602 protein coding SYT8
5 16802946 16816245 ENSGALG00000007203 protein coding RAB3IL1
5 27987462 28003889 ENSGALG00000009431 protein coding PLEKHD1
5 18493194 18514858 ENSGALG00000014573 protein coding NAT10
5 23508006 23633040 ENSGALG00000008358 protein coding AMBRA1
5 22127305 22175544 ENSGALG00000036901 protein coding TSPAN18
5 25462299 25472633 ENSGALG00000028402 protein coding
5 23399012 23435075 ENSGALG00000008325 protein coding CKAP5
5 22351047 22362930 ENSGALG00000037220 protein coding ASTL
5 5540164 5584404 ENSGALG00000012103 protein coding CCDC73
5 16974079 16974902 ENSGALG00000031031 protein coding SELENOH
5 26166529 26171162 ENSGALG00000023243 protein coding
5 22949194 22970222 ENSGALG00000008127 protein coding SPI1
5 22802580 22805146 ENSGALG00000008091 protein coding PTPMT1
5 23648664 23650689 ENSGALG00000008367 protein coding MDK
5 26171455 26176330 ENSGALG00000009292 protein coding
5 25868235 25869978 ENSGALG00000030785 protein coding
5 23651663 23689170 ENSGALG00000008380 protein coding DGKZ
5 22981961 23039476 ENSGALG00000008148 protein coding MYBPC3
5 27443194 27531009 ENSGALG00000009387 protein coding
5 26425311 26448293 ENSGALG00000009338 protein coding ZFYVE1
5 26192258 26194122 ENSGALG00000020454 protein coding C5H14ORF169

445
Chromosome Gene start (bp) Gene end (bp) Gene stable ID Gene type Gene name
5 15271751 15336034 ENSGALG00000006837 protein coding TSPAN4
5 15851602 15855876 ENSGALG00000044313 protein coding
5 15676801 15708216 ENSGALG00000006856 protein coding CD151
5 26297611 26324915 ENSGALG00000009315 protein coding PAPLN
5 22197736 22220666 ENSGALG00000008047 protein coding
5 28008500 28025729 ENSGALG00000009438 protein coding SLC39A9
5 22872406 22883540 ENSGALG00000008108 protein coding PSMC3
5 25903704 25937422 ENSGALG00000009176 protein coding TTBK2
5 16911791 16917496 ENSGALG00000010835 protein coding DTX4
5 44965411 45115958 ENSGALG00000034898 protein coding ITPK1
5 23204929 23293797 ENSGALG00000008255 protein coding C11orf49
5 26200817 26293922 ENSGALG00000009300 protein coding NUMB
5 14113198 14118876 ENSGALG00000006608 protein coding
5 15451610 15451999 ENSGALG00000039066 protein coding
5 16975014 16977341 ENSGALG00000007350 protein coding
5 16832240 16836802 ENSGALG00000007220 protein coding FTH1
5 22282853 22433771 ENSGALG00000008053 protein coding
5 15859631 15880399 ENSGALG00000006873 protein coding PHRF1
5 22804759 22852407 ENSGALG00000008097 protein coding CELF1
5 23152839 23167347 ENSGALG00000008218 protein coding DDB2
5 10434605 10509846 ENSGALG00000006035 protein coding PDE3B
5 16980166 16989643 ENSGALG00000007362 protein coding ZDHHC5
5 23437157 23447162 ENSGALG00000008332 protein coding F2
5 24001629 24002515 ENSGALG00000022531 protein coding
5 27618375 27715349 ENSGALG00000009400 protein coding SLC8A3
5 22788881 22795997 ENSGALG00000008084 protein coding NDUFS3
5 16761007 16770528 ENSGALG00000007127 protein coding
5 16579760 16583124 ENSGALG00000032015 lincRNA
5 16801352 16802718 ENSGALG00000041460 lincRNA
5 16838668 16841925 ENSGALG00000029566 lincRNA
5 16943053 16944982 ENSGALG00000042699 lincRNA
5 16967524 16972137 ENSGALG00000030338 lincRNA
5 21829440 21830894 ENSGALG00000042882 lincRNA
5 23692085 23693892 ENSGALG00000040527 lincRNA
5 23696085 23698539 ENSGALG00000032779 lincRNA
5 25807073 25817072 ENSGALG00000041098 lincRNA
5 25881336 25883509 ENSGALG00000041420 lincRNA
5 26199697 26200631 ENSGALG00000034752 lincRNA
5 26295526 26296764 ENSGALG00000038025 lincRNA
5 37413460 37415830 ENSGALG00000043759 lincRNA
7 31731614 31814126 ENSGALG00000012382 protein coding
8 22275804 22536305 ENSGALG00000027655 protein coding TRABD2B
10 2614900 2619795 ENSGALG00000001664 protein coding PTPN9

446
Chromosome Gene start (bp) Gene end (bp) Gene stable ID Gene type Gene name
10 2623651 2623758 ENSGALG00000026164 miRNA gga-mir-6575
10 2590070 2610361 ENSGALG00000001644 protein coding SIN3A
10 2621478 2630245 ENSGALG00000029537 protein coding SNUPN
10 2630790 2634200 ENSGALG00000033110 protein coding SNX33
10 623939 624280 ENSGALG00000039318 protein coding
10 12413427 12483133 ENSGALG00000006445 protein coding ARNT2
10 599661 601066 ENSGALG00000040159 protein coding
10 621068 621409 ENSGALG00000029250 protein coding
10 2637608 2655172 ENSGALG00000002678 protein coding CSPG4
10 16697772 16838212 ENSGALG00000040651 protein coding IGF1R
11 19086513 19089789 ENSGALG00000000059 protein coding
11 19089858 19093054 ENSGALG00000025712 protein coding DEF8
11 19064511 19086448 ENSGALG00000000129 protein coding TCF25
11 12984674 13144905 ENSGALG00000005319 protein coding CDH8
11 19022589 19054970 ENSGALG00000000516 protein coding FANCA
11 19057727 19063586 ENSGALG00000000521 protein coding SPIRE2
12 3752214 4001595 ENSGALG00000030908 protein coding ATP2B2
13 13664069 13829628 ENSGALG00000032974 protein coding ADAMTS2
14 3893187 3904532 ENSGALG00000004436 protein coding CYP3A4
14 3530847 3889914 ENSGALG00000004420 protein coding SDK1
17 2601746 2859437 ENSGALG00000008456 protein coding CACNA1B
17 1071811 1124231 ENSGALG00000030263 protein coding RABL6
27 5352969 5381707 ENSGALG00000003256 protein coding ATP6V0A1
27 4095356 4096663 ENSGALG00000037179 protein coding
27 4097144 4106102 ENSGALG00000040658 protein coding
27 5260325 5272254 ENSGALG00000003359 protein coding RAB5C
27 5296817 5306850 ENSGALG00000003282 protein coding STAT5B
27 5271010 5279941 ENSGALG00000003354 protein coding KCNH4
27 5381307 5386131 ENSGALG00000032610 protein coding NAGLU
27 5280330 5281387 ENSGALG00000011485 protein coding HCRT
27 5384974 5386409 ENSGALG00000027429 protein coding HSD17B1
27 5282575 5292696 ENSGALG00000003345 protein coding
27 5386659 5389962 ENSGALG00000028866 protein coding COASY
27 5292832 5299192 ENSGALG00000003333 protein coding GHDC
Table S 67. Overlapping Hp regions across populations.
Chromosome Window start Window end
1 32520000 32540000
1 32530000 32550000
1 162220000 1.62E+08
1 119520000 1.2E+08

447
Chromosome Window start Window end
1 32440000 32700000
1 32780000 32840000
1 103880000 1.04E+08
1 119500000 1.2E+08
2 147260000 1.47E+08
2 4520000 4540000
2 140500000 1.41E+08
2 9150000 9170000
2 9170000 9190000
2 74030000 74050000
3 82470000 82490000
3 103420000 1.03E+08
3 78100000 78120000
4 27810000 27830000
4 27840000 27860000
4 27850000 27870000
4 27860000 27880000
4 28610000 28630000
4 39490000 39510000
4 39500000 39520000
4 78130000 78150000
4 19920000 19980000
4 39450000 39470000
4 78110000 78140000
4 78170000 78200000
4 7940000 8030000
4 78020000 78040000
4 78090000 78150000
5 21380000 21400000
5 22480000 22500000
5 22490000 22510000
5 22530000 22550000
5 22540000 22560000
5 40830000 40850000
5 40840000 40860000
5 41880000 41900000
5 41020000 41070000
5 41870000 41900000
5 40850000 40870000
5 40860000 40880000
6 14980000 15000000
6 18320000 18360000

448
Chromosome Window start Window end
7 8580000 8600000
8 230000 250000
8 8800000 8880000
8 8990000 9020000
8 15220000 15310000
8 9130000 9190000
8 9200000 9220000
8 9520000 9540000
8 13100000 13120000
8 9160000 9180000
8 8830000 8850000
9 10410000 10430000
9 10150000 10220000
9 12400000 12430000
11 1610000 1630000
13 1650000 1670000
14 5300000 5320000
18 10270000 10310000
Table S 68. List of Ensemble Hp genes under selection across all populations.
Chr Gene stable ID Gene start (bp) Gene end (bp) Gene name Gene type
1 ENSGALG00000027781 103899869 103900014 RF02271 misc_RNA
1 ENSGALG00000016936 162193513 162295112 TDRD3 protein coding
1 ENSGALG00000038179 32268154 32452343 lincRNA 1 ENSGALG00000042870 32603425 32604254 lincRNA 2 ENSGALG00000005710 4515467 4582669 CTDSPL protein coding
2 ENSGALG00000030054 8821485 9397176 PTPRN2 protein coding
2 ENSGALG00000037014 147222471 147418330 TSNARE1 protein coding
3 ENSGALG00000015944 82215093 82512310 RIMS1 protein coding
3 ENSGALG00000015849 78041071 78198472 ME1 protein coding
4 ENSGALG00000014931 78013279 78074717 RAB28 protein coding
4 ENSGALG00000010596 39448857 39482459 TACR3 protein coding
4 ENSGALG00000035886 27788185 27825157 lincRNA 5 ENSGALG00000010576 40868271 40894704 GTF2A1 protein coding
5 ENSGALG00000010572 40811286 40858950 TSHR protein coding
6 ENSGALG00000005035 14982062 15068657 KAT6B protein coding
8 ENSGALG00000006237 15219523 15269342 PKN2 protein coding
8 ENSGALG00000033708 9019159 9019789 lincRNA 8 ENSGALG00000043258 9537043 9545093 lincRNA 9 ENSGALG00000002897 10142631 10150156 SLC16A14 protein coding
9 ENSGALG00000036543 10205227 10208808 ZBTB38 protein coding
9 ENSGALG00000038512 12398415 12430615 AGTR1 protein coding
9 ENSGALG00000002850 10213881 10256070 RASA2 protein coding

449
9 ENSGALG00000002729 10392753 10431361 GK5 protein coding
9 ENSGALG00000034946 10189098 10190468 lincRNA 11 ENSGALG00000002407 1604963 1708650 HYDIN protein coding
13 ENSGALG00000040453 1649170 1650955 SRA1 protein coding
13 ENSGALG00000001132 1651000 1654407 protein coding
13 ENSGALG00000001099 1544222 1650955 ANKHD1 protein coding
14 ENSGALG00000005215 5264613 5339317 CACNA1H protein coding
18 ENSGALG00000007522 10231908 10275081 ABCC3 protein coding
18 ENSGALG00000007623 10279329 10388753 CACNA1G protein coding

450
Table S 69. Overlapping Fst windows across populations.
Chromosome Window start Window end
1 59230001 59250000
1 151610001 151630000
1 19380001 19400000
1 151620001 151640000
1 19340001 19360000
1 59250001 59270000
1 19370001 19390000
1 151630001 151650000
1 150300001 150320000
1 159520001 159540000
1 19320001 19340000
1 19430001 19450000
1 19330001 19350000
1 151540001 151560000
1 19460001 19480000
1 19360001 19380000
1 19310001 19330000
1 19410001 19430000
1 19450001 19470000
1 177170001 177190000
1 147080001 147100000
1 4410001 4430000
1 19420001 19440000
1 151550001 151570000
1 177160001 177180000
1 177180001 177200000
1 147070001 147090000
1 19300001 19320000
1 147090001 147110000
1 151680001 151700000
1 147050001 147070000
1 181790001 181810000
1 147060001 147080000
1 151690001 151710000
1 182720001 182740000
1 181310001 181330000
1 151700001 151720000
1 154530001 154550000
1 177550001 177570000
1 142940001 142960000

451
Chromosome Window start Window end
1 142920001 142940000
1 142930001 142950000
1 181840001 181860000
1 179050001 179070000
1 142910001 142930000
1 181850001 181870000
1 181800001 181820000
1 137450001 137470000
1 137510001 137530000
1 137440001 137460000
1 179020001 179040000
1 179030001 179050000
1 177330001 177350000
1 179040001 179060000
1 137500001 137520000
1 146780001 146800000
1 146770001 146790000
1 146790001 146810000
1 146810001 146830000
1 146760001 146780000
1 146800001 146820000
1 146820001 146840000
1 146990001 147010000
1 147110001 147130000
1 147100001 147120000
1 5210001 5230000
1 152810001 152830000
1 5220001 5240000
1 35320001 35340000
1 100540001 100560000
1 146980001 147000000
1 146830001 146850000
1 151670001 151690000
1 147010001 147030000
1 147020001 147040000
1 100530001 100550000
1 147000001 147020000
1 190910001 190930000
1 147030001 147050000
1 5390001 5410000
1 146140001 146160000
1 147040001 147060000

452
Chromosome Window start Window end
1 146900001 146920000
1 146750001 146770000
1 100520001 100540000
1 146920001 146940000
1 151750001 151770000
1 146130001 146150000
1 147120001 147140000
1 146970001 146990000
1 151660001 151680000
1 100510001 100530000
1 146910001 146930000
1 19540001 19560000
1 39050001 39070000
1 19700001 19720000
1 146840001 146860000
1 35330001 35350000
1 19620001 19640000
1 61340001 61360000
1 140930001 140950000
1 146880001 146900000
1 152820001 152840000
1 19400001 19420000
1 19570001 19590000
1 39040001 39060000
1 5380001 5400000
1 1610001 1630000
1 82330001 82350000
1 78270001 78290000
1 159080001 159100000
1 19690001 19710000
1 1210001 1230000
1 2140001 2160000
1 19350001 19370000
1 36360001 36380000
1 146960001 146980000
2 49890001 49910000
2 51260001 51280000
2 50210001 50230000
2 50200001 50220000
2 149230001 149250000
2 21230001 21250000
2 147350001 147370000

453
Chromosome Window start Window end
2 142900001 142920000
2 83420001 83440000
2 57730001 57750000
2 21260001 21280000
2 57720001 57740000
2 21960001 21980000
2 142800001 142820000
2 20090001 20110000
2 142290001 142310000
2 21950001 21970000
2 49990001 50010000
2 21270001 21290000
2 21240001 21260000
2 146070001 146090000
2 147360001 147380000
2 125510001 125530000
2 21990001 22010000
2 21970001 21990000
2 142330001 142350000
2 49960001 49980000
2 22140001 22160000
2 20080001 20100000
2 146060001 146080000
2 21220001 21240000
2 21980001 22000000
2 21250001 21270000
2 142270001 142290000
2 142210001 142230000
2 31300001 31320000
2 142320001 142340000
2 143190001 143210000
2 21880001 21900000
2 145960001 145980000
2 49980001 50000000
2 142280001 142300000
2 21210001 21230000
2 132120001 132140000
2 23010001 23030000
2 21890001 21910000
2 142470001 142490000
2 149220001 149240000
2 21280001 21300000

454
Chromosome Window start Window end
2 21170001 21190000
2 78330001 78350000
2 147390001 147410000
2 147380001 147400000
2 49970001 49990000
2 30810001 30830000
2 142260001 142280000
2 142460001 142480000
2 21830001 21850000
2 145990001 146010000
2 21810001 21830000
2 21820001 21840000
2 142540001 142560000
2 149150001 149170000
2 22610001 22630000
2 145980001 146000000
2 145970001 145990000
2 145940001 145960000
2 23510001 23530000
2 149210001 149230000
2 149160001 149180000
2 149200001 149220000
2 149190001 149210000
2 149180001 149200000
2 149170001 149190000
2 61580001 61600000
2 139700001 139720000
2 15340001 15360000
2 147310001 147330000
2 15330001 15350000
2 141780001 141800000
2 111910001 111930000
2 11690001 11710000
2 146180001 146200000
2 50050001 50070000
2 62440001 62460000
2 111900001 111920000
2 82350001 82370000
2 23780001 23800000
2 23770001 23790000
2 20120001 20140000
2 20110001 20130000

455
Chromosome Window start Window end
2 23790001 23810000
2 20100001 20120000
3 90950001 90970000
3 84170001 84190000
3 84040001 84060000
3 84130001 84150000
3 84160001 84180000
3 84050001 84070000
3 90990001 91010000
3 90980001 91000000
3 84150001 84170000
3 86440001 86460000
3 84140001 84160000
3 90970001 90990000
3 90800001 90820000
3 12410001 12430000
3 90820001 90840000
3 90810001 90830000
3 90620001 90640000
3 79800001 79820000
3 89680001 89700000
3 72010001 72030000
3 78560001 78580000
3 37920001 37940000
3 37910001 37930000
3 90520001 90540000
3 92220001 92240000
3 51270001 51290000
3 91460001 91480000
3 53590001 53610000
3 53610001 53630000
3 90510001 90530000
3 53600001 53620000
3 92190001 92210000
3 90360001 90380000
3 88840001 88860000
3 89840001 89860000
3 92200001 92220000
3 50060001 50080000
3 92210001 92230000
3 90350001 90370000
3 90530001 90550000

456
Chromosome Window start Window end
3 89330001 89350000
3 53580001 53600000
3 90500001 90520000
3 91380001 91400000
3 90960001 90980000
3 89690001 89710000
3 33110001 33130000
3 31730001 31750000
3 40200001 40220000
3 28500001 28520000
3 88320001 88340000
3 27560001 27580000
3 10690001 10710000
4 27980001 28000000
4 28160001 28180000
4 27950001 27970000
4 27740001 27760000
4 27780001 27800000
4 27730001 27750000
4 27970001 27990000
4 27960001 27980000
4 27770001 27790000
4 27990001 28010000
4 27900001 27920000
4 28000001 28020000
4 27750001 27770000
4 20290001 20310000
4 19550001 19570000
4 19530001 19550000
4 27720001 27740000
4 27810001 27830000
4 19440001 19460000
4 27760001 27780000
4 27790001 27810000
4 28010001 28030000
4 27800001 27820000
4 19840001 19860000
4 20300001 20320000
4 20280001 20300000
4 19790001 19810000
4 19850001 19870000
4 19830001 19850000

457
Chromosome Window start Window end
4 28020001 28040000
4 27940001 27960000
4 28460001 28480000
4 19860001 19880000
4 27820001 27840000
4 20260001 20280000
4 19600001 19620000
4 28130001 28150000
4 19560001 19580000
4 20310001 20330000
4 19800001 19820000
4 19770001 19790000
4 27840001 27860000
4 19610001 19630000
4 27830001 27850000
4 20320001 20340000
4 19520001 19540000
4 19590001 19610000
4 19820001 19840000
4 27850001 27870000
4 28490001 28510000
4 19780001 19800000
4 19870001 19890000
4 20270001 20290000
4 19670001 19690000
4 19470001 19490000
4 28510001 28530000
4 19510001 19530000
4 27710001 27730000
4 28440001 28460000
4 27890001 27910000
4 19660001 19680000
4 28450001 28470000
4 27400001 27420000
4 19940001 19960000
4 28520001 28540000
4 19580001 19600000
4 19950001 19970000
4 27390001 27410000
4 28410001 28430000
4 17970001 17990000
4 28530001 28550000

458
Chromosome Window start Window end
4 17980001 18000000
4 28430001 28450000
4 19680001 19700000
4 27930001 27950000
4 28370001 28390000
4 28170001 28190000
4 27610001 27630000
4 28420001 28440000
4 28400001 28420000
4 28540001 28560000
4 27860001 27880000
4 28030001 28050000
4 27620001 27640000
4 27500001 27520000
4 28360001 28380000
4 27910001 27930000
4 27520001 27540000
4 27370001 27390000
4 28660001 28680000
4 27410001 27430000
4 27700001 27720000
4 28120001 28140000
4 27600001 27620000
4 17960001 17980000
4 28350001 28370000
4 26780001 26800000
4 27570001 27590000
4 28380001 28400000
4 17950001 17970000
4 26010001 26030000
4 26040001 26060000
4 28770001 28790000
4 26120001 26140000
4 27580001 27600000
4 27870001 27890000
4 27690001 27710000
4 27880001 27900000
4 27920001 27940000
4 28730001 28750000
4 27040001 27060000
4 28390001 28410000
4 28340001 28360000

459
Chromosome Window start Window end
4 28050001 28070000
4 28710001 28730000
4 28240001 28260000
4 28040001 28060000
4 28110001 28130000
4 26680001 26700000
4 27590001 27610000
4 27160001 27180000
4 27550001 27570000
4 28740001 28760000
4 27510001 27530000
4 26470001 26490000
4 26560001 26580000
4 28180001 28200000
4 28600001 28620000
4 28060001 28080000
4 28590001 28610000
4 28580001 28600000
4 28670001 28690000
4 26080001 26100000
4 28720001 28740000
4 26770001 26790000
4 27260001 27280000
4 28230001 28250000
4 26030001 26050000
4 27120001 27140000
4 27360001 27380000
4 26050001 26070000
4 28190001 28210000
4 26130001 26150000
4 26020001 26040000
4 26090001 26110000
4 26500001 26520000
4 28100001 28120000
4 28780001 28800000
4 25900001 25920000
4 28200001 28220000
4 28610001 28630000
4 28700001 28720000
4 26480001 26500000
4 28910001 28930000
4 28070001 28090000

460
Chromosome Window start Window end
4 26720001 26740000
4 28680001 28700000
4 27020001 27040000
4 27030001 27050000
4 26110001 26130000
4 26690001 26710000
4 27250001 27270000
4 26710001 26730000
4 26100001 26120000
4 26490001 26510000
4 28690001 28710000
4 26440001 26460000
4 28220001 28240000
4 28210001 28230000
4 26430001 26450000
4 27420001 27440000
4 26700001 26720000
4 20650001 20670000
4 28810001 28830000
4 25970001 25990000
4 28090001 28110000
4 26070001 26090000
4 28760001 28780000
4 27010001 27030000
4 28790001 28810000
4 28080001 28100000
4 28920001 28940000
4 25950001 25970000
4 26060001 26080000
4 25960001 25980000
4 25930001 25950000
4 28750001 28770000
4 28800001 28820000
4 25940001 25960000
4 25880001 25900000
4 25910001 25930000
4 25840001 25860000
4 25850001 25870000
4 25870001 25890000
4 25790001 25810000
4 25780001 25800000
4 2230001 2250000

461
Chromosome Window start Window end
4 25770001 25790000
4 39720001 39740000
4 49170001 49190000
4 39740001 39760000
4 39730001 39750000
4 2240001 2260000
4 2250001 2270000
4 26340001 26360000
4 26350001 26370000
4 26280001 26300000
4 26310001 26330000
4 41780001 41800000
4 39700001 39720000
4 39710001 39730000
4 41790001 41810000
4 41770001 41790000
4 41830001 41850000
4 41820001 41840000
4 26170001 26190000
4 41850001 41870000
4 41840001 41860000
4 37810001 37830000
4 26320001 26340000
4 39690001 39710000
4 27660001 27680000
4 41810001 41830000
4 42060001 42080000
4 87460001 87480000
4 27670001 27690000
4 27650001 27670000
4 26160001 26180000
4 27680001 27700000
4 41860001 41880000
4 26180001 26200000
4 26150001 26170000
4 25260001 25280000
4 27540001 27560000
4 26450001 26470000
4 27490001 27510000
4 25270001 25290000
4 16450001 16470000
4 25190001 25210000

462
Chromosome Window start Window end
4 27530001 27550000
4 37720001 37740000
4 25180001 25200000
4 26460001 26480000
4 7580001 7600000
4 37700001 37720000
4 7570001 7590000
4 37730001 37750000
4 16460001 16480000
4 27270001 27290000
4 27480001 27500000
4 37710001 37730000
4 19810001 19830000
4 6620001 6640000
4 20030001 20050000
4 6610001 6630000
4 5860001 5880000
4 20610001 20630000
4 25750001 25770000
4 20620001 20640000
4 21000001 21020000
5 2320001 2340000
5 2130001 2150000
5 14990001 15010000
5 2280001 2300000
5 2270001 2290000
5 2200001 2220000
5 2310001 2330000
5 2150001 2170000
5 2100001 2120000
5 23390001 23410000
5 5530001 5550000
5 24030001 24050000
5 24000001 24020000
5 21120001 21140000
5 18560001 18580000
5 25240001 25260000
5 23810001 23830000
5 15310001 15330000
5 18570001 18590000
5 21780001 21800000
5 25250001 25270000

463
Chromosome Window start Window end
5 16730001 16750000
5 23820001 23840000
5 15280001 15300000
5 25920001 25940000
5 15290001 15310000
5 21110001 21130000
5 10460001 10480000
5 15450001 15470000
5 15270001 15290000
5 5540001 5560000
5 27150001 27170000
5 15440001 15460000
5 26190001 26210000
5 14150001 14170000
5 15320001 15340000
5 15260001 15280000
5 15460001 15480000
5 15170001 15190000
5 15700001 15720000
5 15180001 15200000
5 15560001 15580000
5 23170001 23190000
5 15210001 15230000
5 16790001 16810000
5 15350001 15370000
5 15200001 15220000
5 15190001 15210000
5 15480001 15500000
5 5550001 5570000
5 15430001 15450000
5 15360001 15380000
5 5560001 5580000
5 15490001 15510000
5 15570001 15590000
5 15220001 15240000
5 15550001 15570000
5 16740001 16760000
5 15420001 15440000
5 16550001 16570000
5 15500001 15520000
5 16560001 16580000
5 15540001 15560000

464
Chromosome Window start Window end
5 16750001 16770000
5 15530001 15550000
5 15510001 15530000
5 15520001 15540000
5 26640001 26660000
5 1900001 1920000
5 520001 540000
5 12690001 12710000
5 1830001 1850000
5 1890001 1910000
5 32450001 32470000
5 29440001 29460000
5 29420001 29440000
5 29450001 29470000
5 29430001 29450000
5 31240001 31260000
5 14780001 14800000
5 14770001 14790000
5 4810001 4830000
5 32830001 32850000
5 14890001 14910000
5 32840001 32860000
5 32580001 32600000
6 13810001 13830000
6 13800001 13820000
6 5760001 5780000
6 13340001 13360000
7 2620001 2640000
7 6580001 6600000
7 9640001 9660000
7 11300001 11320000
7 6440001 6460000
7 9360001 9380000
7 4670001 4690000
8 1970001 1990000
8 1590001 1610000
9 10340001 10360000
9 4490001 4510000
9 13790001 13810000
9 9490001 9510000
9 12420001 12440000
9 12430001 12450000

465
Chromosome Window start Window end
9 12390001 12410000
10 12440001 12460000
10 12460001 12480000
10 12450001 12470000
10 12470001 12490000
10 12480001 12500000
11 13530001 13550000
11 13520001 13540000
11 19070001 19090000
11 19060001 19080000
11 19050001 19070000
11 4650001 4670000
11 19040001 19060000
12 3850001 3870000
12 3860001 3880000
12 3880001 3900000
12 3870001 3890000
12 3710001 3730000
12 3720001 3740000
12 3700001 3720000
12 3690001 3710000
12 3730001 3750000
12 3740001 3760000
14 4590001 4610000
20 4800001 4820000
20 4790001 4810000
23 4540001 4560000
23 90001 110000
23 100001 120000
23 4930001 4950000
24 5470001 5490000
24 5820001 5840000
24 5830001 5850000
24 5770001 5790000
24 6040001 6060000
24 6060001 6080000
25 2830001 2850000
25 2820001 2840000
27 5280001 5300000

466
Table S 70. List of candidate genes using Fst from overlapping regions across populations.
Chr Gene stable ID Gene start (bp) Gene end (bp) Gene name Gene type
1 ENSGALG00000044624 59245579 59246586 protein coding
1 ENSGALG00000017119 177513346 177560920 TNFRSF19 protein coding
1 ENSGALG00000038995 181192418 181414573 GRIA4 protein coding
1 ENSGALG00000008477 1421469 1841500 EXOC4 protein coding
1 ENSGALG00000009945 35315781 35347355 CPM protein coding
1 ENSGALG00000006489 2002525 2187486 CHCHD3 protein coding
1 ENSGALG00000038154 182684536 182765393 YAP1 protein coding
1 ENSGALG00000016896 146127088 146275409 ABCC4 protein coding
1 ENSGALG00000032978 1213840 1214346 UCN3 protein coding
1 ENSGALG00000029270 4402132 4591692 GATA3 protein coding
1 ENSGALG00000017139 179051034 179094239 protein coding
1 ENSGALG00000045031 59237872 59238879 protein coding
1 ENSGALG00000044524 59241726 59242732 protein coding
1 ENSGALG00000046372 137439551 137445352 protein coding
1 ENSGALG00000037697 137487513 137505777 LAMP1 protein coding
1 ENSGALG00000016900 146527090 147094328 GPC6 protein coding
1 ENSGALG00000016830 137511432 137545754 CUL4A protein coding
1 ENSGALG00000010177 36351342 36388496 ZFC3H1 protein coding
1 ENSGALG00000016908 159096610 159285693 PCDH9 protein coding
1 ENSGALG00000016828 137458314 137486611 GRTP1 protein coding
1 ENSGALG00000044959 59249433 59250440 protein coding
1 ENSGALG00000046239 59253286 59254293 protein coding
1 ENSGALG00000045433 59257140 59258147 protein coding
1 ENSGALG00000027868 177160927 177162801 AMER2 protein coding
1 ENSGALG00000031514 146892901 146893485 lincRNA
1 ENSGALG00000032339 150234073 150532403 lincRNA
1 ENSGALG00000040093 159526738 159744910 lincRNA
1 ENSGALG00000033716 181770866 181805885 lincRNA
1 ENSGALG00000035278 39036722 39056354 lincRNA
1 ENSGALG00000032654 78268586 78290816 lincRNA
2 ENSGALG00000012732 62437754 62509972 PHACTR1 protein coding
2 ENSGALG00000009500 22978146 23047300 VPS50 protein coding
2 ENSGALG00000031741 145815693 145960326 PTK2 protein coding
2 ENSGALG00000030030 132121027 132231350 RSPO2 protein coding
2 ENSGALG00000031758 50150482 50280221 SUGCT protein coding
2 ENSGALG00000010961 31211304 31319341 IGF2BP3 protein coding
2 ENSGALG00000009062 21877225 22125099 CDK14 protein coding
2 ENSGALG00000031713 49640512 49897096 POU6F2 protein coding
2 ENSGALG00000043636 49979496 49987966 YAE1D1 protein coding
2 ENSGALG00000042548 141751641 141782032 LRRC6 protein coding
2 ENSGALG00000031917 22587398 22642927 ANKIB1 protein coding
2 ENSGALG00000035281 15342791 15398782 WAC protein coding
2 ENSGALG00000037112 49987976 50001040 protein coding
2 ENSGALG00000037773 142197114 142221622 ST3GAL1 protein coding
2 ENSGALG00000037014 147222471 147418330 TSNARE1 protein coding
2 ENSGALG00000044996 141791891 141797962 TMEM71 protein coding

467
Chr Gene stable ID Gene start (bp) Gene end (bp) Gene name Gene type
2 ENSGALG00000013124 83340744 83708432 FHOD3 protein coding
2 ENSGALG00000034333 149152445 149152741 protein coding
2 ENSGALG00000039346 149228059 149229441 protein coding
2 ENSGALG00000009686 23744767 23815855 protein coding
2 ENSGALG00000034024 30714422 30862920 RAPGEF5 protein coding
2 ENSGALG00000043243 50062031 50120197 CDK13 protein coding
2 ENSGALG00000040891 20027818 20125211 RSU1 protein coding
2 ENSGALG00000031519 143191899 143269024 KHDRBS3 protein coding
3 ENSGALG00000032937 91386688 91473055 DLGAP2 protein coding
3 ENSGALG00000025589 92233115 92233218 RF00026 snRNA
3 ENSGALG00000009158 12273168 12439182 CDC42BPA protein coding
3 ENSGALG00000016329 88826113 88881081 AGPAT5 protein coding
3 ENSGALG00000010541 31572475 31748573 BIRC6 protein coding
3 ENSGALG00000010039 27486112 27649822 BRE protein coding
3 ENSGALG00000035230 90162525 90533217 CSMD1 protein coding
3 ENSGALG00000040000 37916515 37937367 ERO1B protein coding
3 ENSGALG00000016276 86406473 86714063 KHDRBS2 protein coding
3 ENSGALG00000015864 78537400 78582981 IBTK protein coding
3 ENSGALG00000015889 79785429 79884137 PHIP protein coding
3 ENSGALG00000011098 40214428 40230986 TAF5L protein coding
3 ENSGALG00000029553 28447222 28667979 lincRNA
3 ENSGALG00000036544 28450739 28526039 lincRNA
3 ENSGALG00000034684 33116938 33125450 lincRNA
3 ENSGALG00000036112 50058811 50161705 lincRNA
4 ENSGALG00000009361 20960961 21000658 GUCY1B1 protein coding
4 ENSGALG00000027439 20654247 20654356 miRNA
4 ENSGALG00000038140 25162884 25180520 protein coding
4 ENSGALG00000032953 19548868 19548950 miRNA
4 ENSGALG00000005425 2209876 2231355 OGT protein coding
4 ENSGALG00000025212 21010293 21010422 RF00548 snRNA
4 ENSGALG00000009639 25181859 25200923 protein coding
4 ENSGALG00000030791 5837514 5995090 DIAPH2 protein coding
4 ENSGALG00000020210 39752033 39762452 CENPU protein coding
4 ENSGALG00000005464 2232118 2260037 protein coding
4 ENSGALG00000009207 19996054 20033183 TRIM2 protein coding
4 ENSGALG00000005475 2262230 2272389 RHOGL protein coding
4 ENSGALG00000006851 6599257 7006957 protein coding
4 ENSGALG00000009212 20040123 20078631 MND1 protein coding
4 ENSGALG00000009714 25756022 25763028 CBR4 protein coding
4 ENSGALG00000010628 39713691 39752253 ACSL1 protein coding
4 ENSGALG00000009719 27095819 27127946 PCDH10 protein coding
4 ENSGALG00000008517 16449974 16457382 MCTS1 protein coding
4 ENSGALG00000008559 16458726 16479086 CUL4B protein coding
4 ENSGALG00000042912 5862686 5863323 lincRNA
4 ENSGALG00000031591 16479446 16482772 lincRNA
4 ENSGALG00000033107 19392907 19563891 lincRNA
4 ENSGALG00000033380 19504112 19511619 lincRNA

468
Chr Gene stable ID Gene start (bp) Gene end (bp) Gene name Gene type
4 ENSGALG00000041824 19541886 19542585 lincRNA
4 ENSGALG00000039736 19819071 19857159 lincRNA
4 ENSGALG00000039492 19873184 19873825 lincRNA
4 ENSGALG00000030400 25900254 25900939 lincRNA
4 ENSGALG00000032689 26689975 26702258 lincRNA
4 ENSGALG00000029613 27043314 27051634 lincRNA
4 ENSGALG00000032527 27396660 27628525 lincRNA
4 ENSGALG00000031625 27600624 27601331 lincRNA
4 ENSGALG00000035886 27788185 27825157 lincRNA
4 ENSGALG00000036104 28160838 28173463 lincRNA
4 ENSGALG00000034709 28904779 28987118 lincRNA
5 ENSGALG00000011609 18540733 18648374 protein coding
5 ENSGALG00000031542 21728195 21799637 EXT2 protein coding
5 ENSGALG00000007178 16777263 16794363 FADS2 protein coding
5 ENSGALG00000012109 5522441 5536835 EIF3M protein coding
5 ENSGALG00000026386 26193022 26193130 gga-mir-6587 miRNA
5 ENSGALG00000025793 1896796 1896969 RF02271 misc_RNA
5 ENSGALG00000038950 14921862 14996500 protein coding
5 ENSGALG00000003908 2161580 2188356 SLC6A5 protein coding
5 ENSGALG00000006830 15151804 15252302 CHID1 protein coding
5 ENSGALG00000020485 16740019 16749937 protein coding
5 ENSGALG00000007037 16520186 16571864 PPP6R3 protein coding
5 ENSGALG00000006868 15714417 15737602 protein coding
5 ENSGALG00000006647 14163587 14184836 DUSP8 protein coding
5 ENSGALG00000008403 23771783 23893510 PHF21A protein coding
5 ENSGALG00000003999 1910717 1996488 NAV2 protein coding
5 ENSGALG00000008940 25199152 25289469 SPTBN5 protein coding
5 ENSGALG00000008231 23170347 23190317 PACSIN3 protein coding
5 ENSGALG00000003777 2201059 2481132 NELL1 protein coding
5 ENSGALG00000009847 32441311 32495180 STXBP6 protein coding
5 ENSGALG00000040761 520312 526176 DRD4 protein coding
5 ENSGALG00000003958 2086559 2141355 PRMT3 protein coding
5 ENSGALG00000037020 533877 538465 SCT protein coding
5 ENSGALG00000007203 16802946 16816245 RAB3IL1 protein coding
5 ENSGALG00000006368 12685002 12717134 PTPN5 protein coding
5 ENSGALG00000008325 23399012 23435075 CKAP5 protein coding
5 ENSGALG00000012103 5540164 5584404 CCDC73 protein coding
5 ENSGALG00000039118 31240857 31409344 MEIS2 protein coding
5 ENSGALG00000020454 26192258 26194122 C5H14ORF169 protein coding
5 ENSGALG00000006837 15271751 15336034 TSPAN4 protein coding
5 ENSGALG00000006856 15676801 15708216 CD151 protein coding
5 ENSGALG00000009176 25903704 25937422 TTBK2 protein coding
5 ENSGALG00000009300 26200817 26293922 NUMB protein coding
5 ENSGALG00000039066 15451610 15451999 protein coding
5 ENSGALG00000009352 26488837 26646463 DPF3 protein coding
5 ENSGALG00000006035 10434605 10509846 PDE3B protein coding
5 ENSGALG00000022531 24001629 24002515 protein coding

469
Chr Gene stable ID Gene start (bp) Gene end (bp) Gene name Gene type
5 ENSGALG00000006717 14871236 14911577 protein coding
5 ENSGALG00000007127 16761007 16770528 protein coding
5 ENSGALG00000014537 29410988 29430989 BMF protein coding
5 ENSGALG00000031737 14760117 14805890 protein coding
5 ENSGALG00000032015 16579760 16583124 lincRNA
5 ENSGALG00000041460 16801352 16802718 lincRNA
5 ENSGALG00000034752 26199697 26200631 lincRNA
5 ENSGALG00000033973 26652505 26660856 lincRNA
6 ENSGALG00000004980 13362771 13800472 KCNMA1 protein coding
6 ENSGALG00000034133 13321781 13363451 lincRNA
7 ENSGALG00000025571 6580437 6580522 gga-mir-1845 miRNA
7 ENSGALG00000020876 11289758 11332344 AOX2 protein coding
7 ENSGALG00000042117 4668050 4670981 protein coding
7 ENSGALG00000007777 9564789 9679908 SLC39A10 protein coding
7 ENSGALG00000003862 4682652 4717918 protein coding
7 ENSGALG00000041563 2614780 2681771 protein coding
7 ENSGALG00000023742 6580483 6603208 AHR2 protein coding
7 ENSGALG00000033329 9273897 9443440 lincRNA
7 ENSGALG00000035909 9641479 9643660 lincRNA
8 ENSGALG00000002182 1592876 1687096 NR5A2 protein coding
9 ENSGALG00000006488 4479194 4530082 RYK protein coding
9 ENSGALG00000038512 12398415 12430615 AGTR1 protein coding
9 ENSGALG00000006843 12448872 12485514 NCBP2 protein coding
9 ENSGALG00000025759 10338213 10382351 TFDP2 protein coding
9 ENSGALG00000003052 9475461 9510946 AGFG1 protein coding
9 ENSGALG00000030000 10355033 10369237 lincRNA
10 ENSGALG00000006445 12413427 12483133 ARNT2 protein coding
11 ENSGALG00000000059 19086513 19089789 protein coding
11 ENSGALG00000025712 19089858 19093054 DEF8 protein coding
11 ENSGALG00000000129 19064511 19086448 TCF25 protein coding
11 ENSGALG00000000516 19022589 19054970 FANCA protein coding
11 ENSGALG00000000521 19057727 19063586 SPIRE2 protein coding
12 ENSGALG00000030908 3752214 4001595 ATP2B2 protein coding
14 ENSGALG00000029817 4588547 4676355 protein coding
23 ENSGALG00000018302 4947355 4947443 gga-mir-30c-1 miRNA
23 ENSGALG00000018301 4946132 4946227 gga-mir-30e miRNA
23 ENSGALG00000037136 117566 147202 RPS6KA1L protein coding
23 ENSGALG00000003189 4927211 4955061 NFYC protein coding
24 ENSGALG00000007438 5484062 5488400 protein coding
24 ENSGALG00000007833 5765420 5775028 protein coding
24 ENSGALG00000007430 5475477 5483503 ARCN1 protein coding
24 ENSGALG00000007839 5780707 5862536 NCAM1 protein coding
24 ENSGALG00000040155 5460918 5470400 ZW10 protein coding
25 ENSGALG00000028478 2848558 2856046 protein coding
25 ENSGALG00000040687 2829873 2845968 SNX27 protein coding
25 ENSGALG00000032955 2816337 2828064 TUFT1 protein coding
27 ENSGALG00000003282 5296817 5306850 STAT5B protein coding

470
Chr Gene stable ID Gene start (bp) Gene end (bp) Gene name Gene type
27 ENSGALG00000011485 5280330 5281387 HCRT protein coding
27 ENSGALG00000003345 5282575 5292696 protein coding
27 ENSGALG00000003333 5292832 5299192 GHDC protein coding
Chr = Chromosome
ወስብሃት ለእግዚአብሄር ወለወላዲቱ ድንግል ወለመስቀሉ ክቡር!!! አሜን!!!
Related Documents