WHO/BS/09.2124 ENGLISH ONLY EXPERT COMMITTEE ON BIOLOGICAL STANDARDIZATION Geneva, 19 to 23 October 2009 An International Collaborative Study to Value Assign the 6th International Standard for Unfractionated Heparin and the US Pharmacopeial Heparin Reference Standard for Assay Lot F Elaine Gray 1,3 , John Hogwood 1 , Peter Rigsby 1 , Barbara Mulloy 1 , Anita Y. Szajek 2 , Michael R. Ambrose 2 , Fabian Jameison 2 , Walter Hauck 2 and Tina S. Morris 2 1 National Institute for Biological Standards and Control, Blanche Lane, South Mimms, Potters Bar, Herts EN6 3QG, UK 2 United States Pharmacopeial Convention, 12601 Twinbrook Parkway, Rockville, MD 20852, USA 3 Principal Investigator © World Health Organization 2009 All rights reserved. Publications of the World Health Organization can be obtained from WHO Press, World Health Organization, 20 Avenue Appia, 1211 Geneva 27, Switzerland (tel.: +41 22 791 3264; fax: +41 22 791 4857; e- mail: [email protected] ). Requests for permission to reproduce or translate WHO publications – whether for sale or for noncommercial distribution – should be addressed to WHO Press, at the above address (fax: +41 22 791 4806; e-mail: [email protected]). The designations employed and the presentation of the material in this publication do not imply the expression of any opinion whatsoever on the part of the World Health Organization concerning the legal status of any country, territory, city or area or of its authorities, or concerning the delimitation of its frontiers or boundaries. Dotted lines on maps represent approximate border lines for which there may not yet be full agreement. The mention of specific companies or of certain manufacturers’ products does not imply that they are endorsed or recommended by the World Health Organization in preference to others of a similar nature that are not mentioned. Errors and omissions excepted, the names of proprietary products are distinguished by initial capital letters. All reasonable precautions have been taken by the World Health Organization to verify the information contained in this publication. However, the published material is being distributed without warranty of any kind, either expressed or implied. The responsibility for the interpretation and use of the material lies with the reader. In no event shall the World Health Organization be liable for damages arising from its use. The named authors [or editors as appropriate] alone are responsible for the views expressed in this publication.

Welcome message from author
This document is posted to help you gain knowledge. Please leave a comment to let me know what you think about it! Share it to your friends and learn new things together.
Transcript

WHO/BS/09.2124
ENGLISH ONLY
EXPERT COMMITTEE ON BIOLOGICAL STANDARDIZATION
Geneva, 19 to 23 October 2009
An International Collaborative Study to Value Assign
the 6th International Standard for Unfractionated Heparin and
the US Pharmacopeial Heparin Reference Standard for Assay Lot F
Elaine Gray
1,3, John Hogwood
1, Peter Rigsby
1, Barbara Mulloy
1, Anita Y. Szajek
2,
Michael R. Ambrose2, Fabian Jameison
2, Walter Hauck
2 and Tina S. Morris
2
1National Institute for Biological Standards and Control,
Blanche Lane, South Mimms, Potters Bar, Herts EN6 3QG, UK
2United States Pharmacopeial Convention,
12601 Twinbrook Parkway, Rockville, MD 20852, USA
3Principal Investigator
© World Health Organization 2009
All rights reserved. Publications of the World Health Organization can be obtained from WHO Press, World Health Organization, 20 Avenue Appia, 1211 Geneva 27, Switzerland (tel.: +41 22 791 3264; fax: +41 22 791 4857; e-mail: [email protected]). Requests for permission to reproduce or translate WHO publications – whether for sale or for noncommercial distribution – should be addressed to WHO Press, at the above address (fax: +41 22 791 4806; e-mail: [email protected]).
The designations employed and the presentation of the material in this publication do not imply the expression of any opinion whatsoever on the part of the World Health Organization concerning the legal status of any country, territory, city or area or of its authorities, or concerning the delimitation of its frontiers or boundaries. Dotted lines on maps represent approximate border lines for which there may not yet be full agreement. The mention of specific companies or of certain manufacturers’ products does not imply that they are endorsed or recommended by the World Health Organization in preference to others of a similar nature that are not mentioned. Errors and omissions excepted, the names of proprietary products are distinguished by initial capital letters. All reasonable precautions have been taken by the World Health Organization to verify the information contained in this publication. However, the published material is being distributed without warranty of any kind, either expressed or implied. The responsibility for the interpretation and use of the material lies with the reader. In no event shall the World Health Organization be liable for damages arising from its use. The named authors [or editors as appropriate] alone are responsible for the views expressed in this publication.

WHO/BS/09.2124
Page 2
Summary Thirty-three laboratories from 18 countries contributed data obtained from 12 different assay
methods to value assign the 6th International Standard for Unfractionated Heparin against the 5th
International Standard for Unfractionated heparin, 97/578. Six candidates were included in the
study. Candidate W, 07/328, gave the lowest range of intra-laboratory variation (%GCV: 2.2 – 6.4)
for the different assay methods and the lowest inter-laboratory variation by all methods
(%GCV = 3.6). Candidate W, 07/328, is therefore recommended to be the WHO 6th International
Standard for Unfractionated Heparin with an assigned value of 2145 IU/ampoule by all methods.
This collaborative study also served to harmonise the International Unit and the United States
Pharmacopoeia (USP) unit for unfractionated heparin. A new (USP) Heparin Sodium reference
standard (RS) Lot F for assay has been selected and value assigned by sub-group analysis of data
obtained using the proposed new USP monograph potency method (anti-factor IIa antithrombin
dependent assay; aIIa:AT). Nine participants carried out this assay. Candidate X, 07/330, gave low
intra- and inter-laboratory variation for the USP anti-IIa chromogenic assay and it also gave the best
agreement of potency estimates by the three present and future USP monograph methods. Candidate X, 07/330, was accepted by the USP as the USP heparin standard for assay, Lot F, with
an assigned value of 2144 USP unit/ampoule.
As both the 6th International Standard for Unfractionated Heparin and the USP heparin standard for
assay, Lot F, are traceable and value assigned against the 5th International Standard for
Unfractionated Heparin, the long-standing disparity between the USP unit and the International Unit
for Unfractionated Heparin is resolved.
Introduction The 5th International Standard for Unfractionated Heparin, 97/578 was established in 1998 (1) and
it was calibrated against the 4th International Standard. This standard has been widely used for
calibration of clinical products and controls for diagnostic kits for heparin. Due to the depletion of
stock, a replacement for 97/578 is now required. The programme for the replacement of the WHO
IS for Unfractionated Heparin was endorsed by the WHO Expert Committee on Biological
Standardisation in October 2006 and was introduced to the SSC/ISTH Subcommittee on Control
of Anticoagulation at the 53rd SSC meeting in July 2007 (Geneva).
For the last 30 years or more, there has been a 7–13% disparity between the United States
Pharmacopoeia (USP) unit and the International Unit (IU) for unfractionated heparin (1). It is
therefore desirable to harmonize these two units for the measurement of heparin. The need to
replace the 5th International Standard for Unfractionated Heparin and to establish the USP heparin
standard for assay, presents an ideal opportunity for harmonization. The USP is currently
undertaking a revision of the Heparin Sodium anticoagulant potency monograph assay, with the
intention to establish a new USP heparin standard for assay that will enable the harmonization of
the USP unit and the IU for unfractionated heparin. This harmonization will require the calibration
of the new USP heparin standard for assay, Lot F, against the current International Standard (IS)
for Unfractionated Heparin and as the new USP potency assay, the anti-factor IIa chromogenic
assay using purified antithrombin (aIIa:AT) will also be implemented at the same time, the
potency of Lot F would be value assigned using this new aIIa:AT potency assay.
Because of the recent contaminated heparin events, heparin manufacturers have been encouraged
by regulatory authorities to replace clotting assays that can be influenced by contaminants and
process related impurities to methods that are specific for heparin, for example, anti-IIa and anti-

WHO/BS/09.2124
Page 3
Xa assays using purified antithrombin, for measurement of heparin potency. This study also
allowed us to examine the robustness of these chromogenic methods.
This report describes two important findings of this collaborative study that involved 6
candidates:
1. The analysis of data and conclusions that lead to the value assignment of the proposed
6th International Standard for Unfractionated Heparin
2. Information on the calibration of the USP heparin standard for assay, Lot F and the
performance of anti-IIa and anti-Xa chromogenic assays
Candidates The coding of the candidates is as indicated in Table 1. Candidates T, W, X, Y and Z are all
typical clinical heparin Active Pharmaceutical Ingredients (APIs) from different European and
North American manufacturers. Candidate V is not a routine API and has been manufactured for
research studies only. Preliminary investigations including specific activity, molecular weight
profiles and NMR spectroscopy were carried out at NIBSC. Specific activities of the candidates
were measured against the 5th IS, using antithrombin dependent anti-IIa and anti-Xa assays, on
candidates weighed out at ambient temperature and humidity. With the exception of candidate V,
which has a specific activity close to 300 IU/mg by both anti-IIa and anti-Xa assays, all other
candidates have specific activities between 170 – 230 IU/mg. The higher specific activity
exhibited by candidate V could be due to the higher proportions of high molecular weight
material in this sample (Figure 1). With the exception of 08/254, candidate T, all the other
candidates were filled and freeze-dried at NIBSC in accordance with the conditions normally
used for international biological standards (2). Table 1 shows the fill characteristics of the
candidates. The excipient for all the candidates was sterile water.
The CV of the fills showed that all the candidates were filled with acceptable precision.
Homogeneity of the fill by functional activity was also investigated by assay of ampoules
sampled across the fill. For each candidate filled at NIBSC, 4 ampoules (2 independent assay
per ampoule) at every 5000 ampoules filled were assayed by the Activated Partial
Thromboplastin Time (APTT) against the 5th IS and results were compared by analysis of
variance. Table 2 shows that the variabilities by functional assay for candidates V, W, X, Y and Z
were all low with GCV below 3% and analysis of variance showed that there were no significant
differences between the activities of the ampoules across the fill.
Molecular weight determination of the candidates was carried out according to Mulloy et al. (3).
The profiles and measurements are shown in Figure 1 and in Table 3. Candidate V is noticeably
different from the others, having the highest values for peak molecular weight (Mp), number
average molecular weight (Mn) and weight average molecular weight (Mw). The other candidates
fall within a relatively narrow range, similar to that of the 5th International Standard for
Unfractionated Heparin.
1H NMR spectra at 500 MHz were recorded for each of the candidates in accordance with McEwen
et al. (4) and spectra of the candidates are shown in Figures 2 - 7. The NMR spectra confirmed that
the candidates are all free of oversulphated chondroitin sulphate, a contaminant which has been
found in some recent heparin batches. A small signal in the spectrum of sample W at 2.18 ppm can
be seen, but a spiking experiment showed that this does not originate from oversulphated
chondroitin sulphate (data not shown) .
WHO/BS/09.2124
Page 4
Participants Thirty-six laboratories from 18 countries (1 Australia, 4 Austria, 1 Bosnia, 1 Brazil, 1 Canada, 1
China, 2 Denmark, 4 France, 5 Germany, 1 India, 2 Italy, 1 Japan, 1 The Netherlands, 1
Portugal, 3 Spain, 3 Switzerland, 1 UK, 3 USA) agreed to take part in the study. Thirty-three
laboratories returned results, each of which is referred to in this report by an arbitrarily assigned
number, not necessarily representing the order of listing in Appendix 1. Lab 20 (Austria) withdrew
from the study, while results from Lab 4 and 14 were not received in time for analysis.
Assay methods All the methods used by the participants are listed in Appendix 2. In total, 12 different methods
were used in the study:
• Anti-IIa chromogenic assay, purified antithrombin (AT), n = 18
• Anti-Xa chromogenic assay, purified AT, n = 23
• Anti-IIa chromogenic assay, human plasma, n =1
• Anti-Xa chromogenic assay, human plasma, n = 3
• Anti-Xa clotting assay, n = 1
• US Pharmacopoeial assay (USP), clot-based sheep plasma assay n = 9
• European Pharmacopoeial assay (EP), clot-based sheep plasma assay n = 12
• Japanese Pharmacopoeial assay (JP), n = 1
• Chinese Pharmacopoeial assay (CP), n = 1
• Human plasma APTT, n = 12
• Thrombin Time (TT), n = 2
• Prothrombinase induced clotting time (PiCT), n = 1
Some laboratories requested assay protocols for anti-IIa and anti-Xa chromogenic assay using
purified antithrombin. NIBSC provided these laboratories with methods for both of these assays
(Appendix 3).
Study design The detail of the study protocol is shown in Appendix 4. Each laboratory was asked to perform
their chosen methods. Where a laboratory performed more than one assay method, each method is
treated as if performed by different laboratories.
Participants were requested to perform four independent assays for each method, an independent
assay being defined as one with a completely fresh set of ampoules and dilutions. To allow for day
to day variation, the participants were asked to carry out the four assays, for each method, on four
separate days. For those laboratories that performed two or more methods, an assay for each
method could be carried out on the same or different days, from one set of reconstituted solutions,
but making fresh dilutions for each method.
Participants were asked to assay concurrently a series of at least three, preferably four dilutions of
each of the five coded samples. The assay order of the materials (including replicates) was to be
varied to give a balanced order overall. Some examples of different assay order schemes were given
in the protocol for participants to choose from.

WHO/BS/09.2124
Page 5
Raw assay data were to be returned together with a summary of their estimates for the potency of
materials T, V, W, X, Y and Z using S, the 5th IS for Unfractionated Heparin, as the standard.
Statistical analysis An independent statistical analysis of raw data was performed at NIBSC. Potencies were
calculated relative to the 5th International Standard for Unfractionated Heparin, 97/578 (Study
code: S), for each candidate sample using a parallel-line or slope-ratio model (5). All data were
plotted and the assay validity was assessed both visually and by analysis of variance. When
doses did not appear to lie on the linear section of the dose-response curve they were excluded
from analysis. All assays that showed no significant deviations from the model at the 1% level
have been included in this report. Where non-parallelism was found to be significant at the 5%
level in parallel-line models (0.01<p<0.05) the results are included and highlighted. This is also
the case when the intercept difference was found to be significant at the 5% level in slope-ratio
models (0.01<p<0.05). In a small number of cases the results reported by the laboratory have
been used directly and these are indicated below. All mean potencies given in this report are
unweighted geometric mean potencies. Variability between assays and laboratories has been
expressed using geometric coefficients of variation (%GCV) (6). Grubbs’ Test (7) was applied to
the log transformed laboratory mean estimates in order to detect any significant outliers (p<0.05)
and analysis of variance (with Tukey’s test) was used to make comparisons between assay
methods.
Due to the late submission of results by Lab 4 and Lab 14, their data obtained by the European
Pharmacopoeia method and APTT method respectively could not be analysed and was therefore
excluded from the overall potency estimates. For comparison purpose, the potency estimates
from Lab 4 and 14 are shown in Appendix 5.
Anti-IIa chromogenic assays using purified AT A parallel-line model comparing untransformed assay response to log concentration was used in
all laboratories except laboratory 05 where a log transformation appeared to be more suitable.
Anti-Xa chromogenic assays using purified AT A slope-ratio model comparing log transformed assay response to concentration was used for
almost all laboratories. For laboratory 10 a parallel-line model comparing untransformed assay
response to log concentration appeared to be more suitable. For laboratory 36 the assay
responses were transformed to percentages relative to the estimated upper and lower limits of the
dose-response curve and a weighted regression of logit response on log dose was used to
calculate potency estimates.
USP assays No further analysis was carried out as the USP sheep plasma assay is based on a single point
estimate. The results reported by the laboratories are shown and used for overall potency
estimates.
EP assays A parallel-line model comparing log transformed assay response to log concentration was used
in all laboratories. For laboratory 17 deviations from parallelism were compared to deviations
from linearity when assessing the validity of the model due to the low level of residual error
observed.

WHO/BS/09.2124
Page 6
APTT assays A slope-ratio model comparing log transformed assay response to concentration was used for
almost all laboratories. For laboratory 10 a parallel-line model comparing untransformed assay
response to log concentration appeared to be more suitable. For laboratories 34a and 34b, neither
model appeared to provide a good fit and the reported estimates (calculated using a third order
polynomial calibration curve) are shown.
Anti-Xa chromogenic assay using plasma, Thrombin Time and other methods For laboratories 18 (Japanese Pharmacopoeial method), 30 (anti-Xa assay, using plasma as
source of antithrombin) and 34 (Thrombin Time), the reported estimates are shown as neither
model appeared to fit the data (labs 30 and 34) or only single dilutions of each test sample were
reported (lab 18). In laboratory 34 (anti-Xa Clotting) the untransformed responses were used.
Results
Assay data The 33 participants contributed data from a total of 690 assays; with 642 assays analysed by NIBSC.
For 48 assays, no further analysis was carried out and the potency estimates reported for each of
these assays were used to calculate the overall potency estimates and the intra- and inter-laboratory
variability. Table 4 shows the breakdown of the number of assays per assay method.
Assay validity The assumptions of linearity and parallelism of the log dose-transformed/untransformed response
lines of samples T, V, W, X, Y, Z and S held in 79 % of the assays analysed. In some of the assays,
certain candidates were found to be non-linear and/or non-parallel to S and the potency estimates for
these samples were not included in the overall potency estimation. Tables 6 - 11 show the validity
and potency estimates of all the assays. Some of the invalidities may have been due to inadequate
replication in the assay design, as well as from real deviations from the model assumptions. There
was no evidence of any overall non-parallelism when the 6 candidates were compared with the 5th
IS, however, candidate V did yield the highest number of assays that were non-parallel or had
significantly different intercepts and this was especially true for the EP sheep plasma assay (Table
5).
Potencies relative to the 5th International Standard for Unfractionated Heparin,
97/578 The individual assay potency estimates of candidates T, V, W, X, Y and Z taken relative to sample
S (5th IS for Unfractionated Heparin) by different methods are shown in Tables 6 - 11. Detailed
values of the individual laboratory mean potencies and overall mean potencies of samples T, V, W,
X, Y and Z relative to sample S, the 5th IS for Unfractionated Heparin for each method are listed in
Tables 12 – 18. As there was an insufficient number of data sets returned for the anti-IIa
chromogenic assay using human plasma, the anti-Xa clotting assay, Japanese Pharmacopoeial assay,
Chinese Pharmacopoeial assay and Prothrombinase induced Clotting Time, overall mean potency
estimates were not calculated for these methods and the laboratories’ mean potencies for each
candidate are classified as “other methods” and shown in Table 19. A summary of the potency
estimates by the different methods is also presented in Table 21. The data are also shown in
histogram forms in Figures 7 - 12. Only 9 outliers were identified by Grubb’s test. These were
excluded from the overall mean potency estimates as indicated in Tables 12 -19 and Figures 1 – 6.
Although the Japanese Pharmacopoeial assay produced 5 outliers, only one laboratory carried out
this assay method. It was not possible to conclude whether the problem is related to this method or

WHO/BS/09.2124
Page 7
with the laboratory’s performance. There was no correlation between assay methods and outliers
identified. The histograms (Fig 7 – 12) illustrate good agreement between both the laboratories
and the assay methods for candidates T, W, X, Y and Z. Analysis of variance on the log potencies
to compare methods shows no significant differences for W (p=0.832) and X (p=0.999). Sample
Y shows significant differences (p=0.036) due to the US Pharmacopoeial assay results being
significantly higher than those for anti-IIa and anti-Xa chromogenic assays using purified AT
(p<0.05 in Tukey’s test). Sample T shows significant differences (p=0.008) due to the anti-IIa
chromogenic assays using purified AT results being significantly lower than the USP results
(p<0.05 in Tukey’s test). Sample V shows significant differences (p<0.001) due to the anti-IIa
chromogenic assays using purified AT results being significantly higher than all other methods
and the anti-Xa chromogenic assays using purified AT results being significantly higher than the
APTT, the European Pharmacopoeial and the US Pharmacopoeial assays results (p<0.05 in
Tukey’s test). Sample Z shows significant differences (p<0.001) due to the anti-IIa chromogenic
assays using purified AT results being significantly higher than the APTT, European
Pharmacopoeial assay and US Pharmacopoeial assay results and the anti-Xa chromogenic assays
using purified AT results being significantly higher than the APTT results (p<0.05 in Tukey’s
test).
Table 21 shows the overall potency estimates by all methods relative to the 5th IS for
Unfractionated Heparin, together with the respective 95% confidence limits for all the candidates.
Figure 13 shows the potency estimates by each assay method expressed as the % of the overall
mean potency estimates for each candidate. It is clear that with the exception of the potency
estimates for candidate V which varied with different methods (PiCT = 82.6% to anti-IIa AT =
123.7%), potency estimates by the different types of assays for the other candidates were close to
the overall mean potency estimates for that candidate; the maximum difference being 6% for
sample X by the Chinese Pharmacopoeial assay and sample T by the Prothrombinase induced
Clotting Time. Potency estimates for candidate W, followed by sample X when assayed against the
5th IS, were the least influenced by the method type.
Intra-laboratory variability: all methods The variability within each laboratory, expressed as geometric coefficients of variation (% GCV's)
for each sample, is given in Tables 12 - 19. Table 20 summarises the %GCV showing the number
under 5%, 7% and 10%. In general, the laboratories were able to perform their chosen methods with
good precision and reproducibility with more than half of the GCVs less than 5% and only a small
percentage of laboratory potency estimates gave over 10%. The clot-based assays, especially the
pharmacopoeial assays, gave lower ranges of intra-laboratory %GCVs than the chromogenic assays.
This may be because the pharmacopoeial assays are well-established methods and the laboratories
are more experienced at carrying out these assays. Nonetheless, the chromogenic assays performed
well and only a few participants produced GCVs over 10%.
Inter-laboratory variability: all methods Variability between laboratories of the potency estimates of samples T, V, W, X, Y and Z relative to
sample S, the 5th IS for Unfractionated Heparin, is shown in Tables 12 – 18 for anti-IIa
chromogenic assay with AT, anti-Xa chromogenic assay with AT, European Pharmacopoeial assay,
US Pharmacopoeial assay, APTT, Anti-Xa chromogenic assay with plasma and Thrombin Time
and is also summarised as % GCV's in Table 19. Inter-laboratory variability is not given for
Thrombin Time as only two laboratories carried out this method and for anti-IIa chromogenic assay
with plasma, anti-Xa clotting assay, Chinese Pharmacopoeial assay, Japanese Pharmacopoeial assay
and Prothrombinase induced Clotting Time as these assays were carried out by one laboratory only.

WHO/BS/09.2124
Page 8
Variability between laboratories ranged from 0.1 to 18.0% and was consistently higher for
sample V and consistently lower for sample W. The clot based methods (European Pharmacopoeial
assay, US Pharmacopoeial assay and the APTT) tended to give lower inter-laboratory variability,
but the variability found with the chromogenic assays was acceptable, with the majority of the inter-
laboratory GCVs being less than 10%. Pooling the different assay methods (Table 22), the
variability between laboratories is the highest for sample V (GCV = 20.7%) and the lowest for
candidate W (GCV = 3.6%). The variability for samples T, X, Y and Z was also relatively low,
with respective GCVs of 6.6, 4.8, 5.7 and 5.5%.
Comparison of the candidates as putative standards Potencies of candidates were recalculated relative to each other, assuming each sample has an
assigned unitage equivalent to the overall mean potency by all methods, relative to sample S, shown
in Table 22. The overall mean potencies, 95% confidence limits and inter-laboratory variation
expressed as % geometric coefficient of variation (%GCV) for each candidate relative to each other
are shown in Tables 23 – 28 and the potency estimates are summarised in Table 29. These were
similar to those relative to the 5th IS for Unfractionated Heparin, which is not surprising since the
assumed assigned potencies of each sample were calculated relative to the 5th IS for Unfractionated
Heparin.
Variability between laboratories of the potency estimates of Candidates T, V, W, X, Y and Z
relative to each other, for all assay methods, is summarized as % GCVs in Table 30. High
variability was observed when Candidate V was used as the putative standard and as the test
sample against all the other putative standards. Amongst the other candidates, the differences in
inter-laboratory variation were marginal. Generally, variability between laboratories was lowest
when Candidates W or X were used as the putative standard and they could be considered as the
potential replacement international standard.
Sub-group analysis to select and value assign USP RS Lot F Sub-group analyses were carried out to assess the performance of the USP aIIa:AT, USP aXa:AT
and the USP sheep plasma clot based assays and to select and value assign the USP heparin
standard for assay.
Three different USP assay methods related to potency were carried out by the participants: a. the
current sheep plasma clot based assay, b. the current aXa:AT assay and c. the new (to be
implemented in October, 2009) aIIa:AT assay. Appendix 2b lists the laboratories by number and
the USP assay methods that they have performed. For anti-IIa and anti-Xa chromogenic assays,
laboratories 02, 19 and 25 declared that they have performed the USP anti-Xa and the proposed
anti-IIa chromogenic assays. The remainder of the laboratories used protocols provided by
NIBSC. The NIBSC protocols were simplified versions of the USP methods, with the reagents
and assay conditions as described in the USP assay methods (Appendix 3). In total,
9 laboratories carried out the USP anti-IIa, anti-Xa and sheep plasma clot-based assays. For
information, the laboratories that carried out antithrombin dependent anti-IIa and anti-Xa assays
based on commercial kits, in-house or European Pharmacopeoial Low Molecular Mass
Monograph methods are listed in Appendix 2c.
Due to the nature of the USP sheep plasma clot based assay, it was not possible to analyse the raw
data and the laboratory’s own potency estimates were used for comparison. Only statistically valid
USP aIIa:AT assays were used for estimation of potency for the USP RS Lot F.

WHO/BS/09.2124
Page 9
Intra-laboratory variation: USP sheep plasma clot based, aIIa:AT and aXa:AT
assays Tables 31, 32 and 34 show the intra-laboratory variation, expressed as %GCVs for the USP sheep
plasma clot based, aIIa:AT, aXa:AT assays respectively. Tables 36 and 37 summarise the %GCV
showing the number under 5%, 7% and 10% for the all the antithrombin dependent anti-IIa and
anti-Xa assays. The intra-laboratory variation was low for the USP sheep plasma clot based assay,
GCVs ranging from 0 – 11.5%. The higher %GCVs were found with results from 1 laboratory (Lab
19); the GCVs for the other participants using this method were below 5% indicating that the
laboratories were able to carry out this assay with good precision. The intra-laboratory variation for
the USP aIIa:AT method was also reasonably low, GCV ranging from 1.4 – 29.1%, with the higher
GCVs coming from 2 laboratories (Lab 03 and 19) and the majority of the GCVs being < 7%.
These results were in line with data from other antithrombin dependent anti-IIa chromogenic assays
(Tables 33, 36). The antithrombin dependent anti-Xa assays showed similar reproducibility to the
anti-IIa assay; for both the USP aXa:AT and other chromogenic assays, the majority of the GCVs
were below 7% (Tables 34, 35, 37). These results indicate that the majority of the laboratories
carrying out these chromogenic assays were able to perform these methods with good precision and
reproducibility. There was no obvious correlation between the degree of intra-laboratory variation
and the different candidates. The sheep plasma clot based assay did give lower ranges of intra-
laboratory variation and this may be because this pharmacopoeial assay has been in use for more
than 30 years so that some laboratories are more experienced at carrying out this assay than the new
chromogenic assays.
Inter-laboratory variation: USP sheep plasma clot based, aIIa:AT and aXa:AT
assays Variability between laboratories of the potency estimates of candidates T, V, W, X, Y and Z relative
to sample S, the 5th IS for Unfractionated Heparin, is shown in Table 38. For both the USP aIIa:AT
and aXa:AT methods, it is clear that the variability between laboratories is the highest for candidate
V, the lowest for candidate W, with candidate X having GCVs close to those obtained for candidate
W. The higher inter-laboratory variation exhibited by V could be explained by the molecular
weight differences between V and the 5th IS. It is also important to note that the inter-laboratory
variation for both the USP antithrombin dependent anti-IIa and anti-Xa assays are not too different
to those obtained by the sheep plasma clot based assay.
Potency estimates by USP sheep plasma clot based, aIIa:AT and aXa:AT assays
relative to the 5th IS for unfractionated heparin The individual laboratory potency estimates of candidates T, V, W, X, Y and Z taken relative to
sample S (5th IS for Unfractionated Heparin) by the USP sheep plasma clot based, aIIa:AT,
aXa:AT and all methods are shown in Tables 39 – 41. A summary of the potency estimates by the
different methods is also presented in Table 42. Analysis of variance of log potency estimates
indicated that there were no significant differences between the potencies obtained using the USP
anti-IIa and anti-Xa chromogenic methods and other chromogenic assays for any of the candidates
(p>0.05).
Stability study Preliminary accelerated degradation study, of all the candidates, monitored using both anti-IIa and
anti-Xa chromogenic assays, showed no sign of change after 9 months storage at temperatures of -
150, -70, -20, +4, +20, +37, +45 and +56°C. Continual real time degradation study of the –20°C
against ampoules stored at –70°C and further accelerated degradation study at elevated temperature
will be carried out to monitor the stability of the replacement standard.

WHO/BS/09.2124
Page 10
Discussion The main aims of this collaborative study were to select from the six candidate materials, firstly a
replacement for the 5th International Standard for Unfractionated heparin and secondly a new USP
heparin standard for assay. It also provided an opportunity to examine performance of the anti-IIa
and anti-Xa chromogenic assays.
Selection of the proposed 6th International Standard for Unfractionated
Heparin
Intra-laboratory (between assay) variability for all 6 candidate materials was good when assayed
against the 5th IS, with the majority of the %GCVs well under 10% and more than half of the
%GCVs being 5% or less (Tables 12 - 19). This indicates that the participants of the study were able
to perform their choice of assay with precision. The clot based assays (European Pharmacopoeial
assay, US Pharmacopoeial assay and APTT) generally gave lower between assay %GCVs and the
chromogenic methods gave slightly higher. The higher %GCVs for anti-IIa chromogenic assay
with AT came mostly from Lab 03 and Lab 19 (Table 12), while the higher GCV for anti-Xa
chromogenic assay with AT were from Lab 16 and Lab 36 (Table 13). Taking into account that the
higher variability was from 4 laboratories only, the %GCVs for other laboratories were excellent for
these two chromogenic assays indicating that the majority of the participants were able to perform
these chromogenic assays reproducibly. There were no other obvious correlations between
performance and parameters such as methods or reagents.
With the exception of candidate V, the inter-laboratory variations were excellent for all the other
candidates when assayed against the 5th International Standard for Unfractionated Heparin (Tables
12 – 19, 21, 22); the %GCVs were under 11% by any of the assay methods used, with at least half
under 4% (range 0.1 – 10.7%). Of all the candidates, W gave marginally lower variability than the
other samples (Tables 21, 22). These data suggest good reproducibility of results by the various
methods amongst the different laboratories. The higher variability (range 5.9 – 18.0%) obtained
with candidate V could be due to the differences between the molecular weight profile of the 5th
International Standard and sample V, with sample V having a higher proportion of high molecular
weight material than the 5th International Standard and the other candidates in the study (data not
shown). The inter-laboratory variation when all methods were taken into account indicated that W
gave the lowest and V gave the highest %GCV (W, GCV = 3.6%; V, GCV = 20.7%). The other
candidates only gave marginally higher %GCVs than sample W (6.6, 4.8, 5.7 and 5.5 for T, X, Y
and Z respectively).
In terms of assay methods, there were no significant differences amongst the potency estimates
obtained using the different methods for candidates W and X against the 5th International Standard
for Unfractionated Heparin. The best agreement was obtained for candidate W where the potency
estimates by various methods were between 96.7 to 101.5 % of the overall mean potency estimate
by all methods (Fig. 14). Potency estimates for candidate T by anti-IIa chromogenic assay using
purified AT were significantly lower than the US Pharmacopoeial assay results. For sample V,
potency estimates were significantly higher by anti-IIa chromogenic assay with purified AT than
results from all other methods and potencies by anti-Xa chromogenic assay with purified AT were
significantly higher than the data from the APTT and the European Pharmacopoeial assay. For
sample Y, the US Pharmacopoeial assay was significantly higher than both the anti-IIa and anti-
Xa chromogenic assay using purified AT. For sample Z, the anti-IIa chromogenic assays using
purified AT results were significantly higher than the APTT, European Pharmacopoeial assay
and US Pharmacopoeial assay results, with the anti-Xa chromogenic assays using purified AT
results being significantly higher than the APTT results. Although not all the assay methods
gave complete agreement of potency estimates for all the candidates, with the exception of
WHO/BS/09.2124
Page 11
sample V (range of potency estimates by different assay methods = 82.6 – 123.7 of the overall mean
potency), the overall differences between potency estimates obtained with the various methods were
not large and were probably found to be statistically significant because of the good precision of the
assays. This is confirmed by the close agreement in the potency estimates of the different
preparations (except V) by all assay methods, with all except four of the average percentages of
combined potency estimates for each method within 5% of the overall combined potency estimates
from all assay methods (Fig 14).
When each candidate was used as the putative standard, candidate V gave the highest inter-
laboratory variation (GCV range 17.8 – 24.8 %). Although high %GCVs were obtained when V
was assayed against W and X, these two candidates gave low GCVs for all the other samples (GCV
range 4.0 – 6.0%, Table 30). Since candidate W also gave the lowest range of intra- and inter-
laboratory variation when assayed against the 5th IS, W would be the best candidate to go forward
as the 6th IS for Unfractionated Heparin.
Selection of the USP heparin standard for assay As 9 laboratories carried out the USP aIIa:AT, there were sufficient data to carry out sub-group
analysis and obtain estimation of potency by this proposed USP monograph potency method for
heparin sodium. Comparison of log potency estimates obtained using the USP sheep plasma, USP
aIIa:AT and USP aXa:AT assays by one-way analysis of variance (ANOVA) and Tukey’s test
showed that there were no significant differences amongst the potency estimates for candidates W
(p = 0.277), X (p = 0.979) and Z (p = 0.06). Candidate T shows significant differences due to the
USP aIIa:AT assay results being significantly lower than the USP sheep plasma assay results
(p<0.05 in Tukey’s test). Candidate V shows significant differences (p<0.001) due to the USP
aIIa:AT and aXa:AT results being significantly higher than the USP sheep plasma assay data.
Candidate Y shows significant differences due to the USP aIIa;AT assay results being
significantly lower than the USP sheep plasma assay results (p<0.05).
Potency estimates for candidates W and X when assayed against the 5th IS, were the least
influenced by the method type (Figures 14, 15). Table 43 also shows that candidates W and X gave
an anti-Xa to anti-IIa ratio of 1.01 and that both candidates are within the USP specification for anti-
Xa to anti-IIa ratio of 0.9 – 1.1 for Heparin Sodium. Figure 15 illustrates the potency estimates by
the different USP methods expressed as the % of the overall mean potency estimates obtained by all
methods employed in the study. It is clear that for candidate X, the three USP methods gave
excellent agreement in potency estimates. So in considering continuity and traceability of the
international unit and that Lot F will be the RS that unites the international and USP units, candidate
X would be a good choice.
Conclusions and Recommendation • Although the clot based assays gave lower intra- and inter- laboratory variation, the
performance of the anti-IIa and anti-Xa chromogenic assay was good. Some laboratories
performed better than others with intra-laboratory GCV of less than 1%. In general, the
intra-laboratory GCVs were around or less than 5%. Good laboratory agreement was
also obtained by the anti-IIa and anti-Xa chromogenic assays for all candidates except V.
However sample V is very different in physico-chemical characteristics to the current
International Standard and to the other candidates in the study and poor laboratory
agreement was also obtained for V when other assay methods were used. This illustrates
the importance of assaying “like against like” in obtaining good agreement between
laboratories.

WHO/BS/09.2124
Page 12
• Currently there are insufficient data to assess and compare the stability of these
candidates. However, all the physical parameters such as moisture and oxygen content
are within the specifications set out in the WHO guidelines for the preparation of
international standards and reference materials. Stability data on preparations with
similar characteristics e.g. the 5th International Standard for Unfractionated Heparin and
the 2nd International Standard for Low Molecular Weight Heparin have shown no loss of
measurable activity after more than 10 years storage at -20°C. So these preparations are
expected to be very stable over the lifetime of reference material.
• All candidates except V performed well in the study, with the majority of the intra- and
inter- laboratory GCVs below 10%. Overall, candidate W gave the lowest range of intra-
and inter-laboratory variation whether as a test sample or as the putative standard. It is
therefore recommended that Candidate W, 07/328, to be the 6th International Standard
for Unfractionated Heparin with an assigned value of 2145 IU/ampoule obtained from all
assay methods against the 5th International Standard for Unfractionated Heparin, 97/578.
• The sub-group analysis presented in this report shows that both candidates W and X are
also suitable materials for the next USP heparin standard for assay, Lot F. Both
candidates gave comparably low intra- and inter-laboratory variation for the USP anti-IIa
chromogenic assay, but candidate X is marginally better than candidate W in that it gave
the best agreement of potency estimates by the three present and future USP monograph
methods (figure 15). The molecular weight distribution of candidate X is similar to that
of other typical clinical APIs in the study. The 1H NMR spectrum also indicates that
candidate X is a clean heparin with no detectable over-sulphated chondroitin sulphate and
extremely low levels of other process related impurities such as dermatan sulphate,
acetate or ethanol.
• It was therefore recommended that candidate X, 07/330, be the USP heparin
standard for assay, Lot F, with a value of 2144 USP unit/ampoule as assigned by
USP proposed aIIa:AT assays. The USP considered the recommendation and agreed
with this proposal, and candidate X has been established as the USP heparin standard
for assay Lot F.
• As the calibration of both the proposed 6th IS and USP heparin standard for assay,
Lot F was against the 5th IS, the USP unit and the International Unit for
Unfractionated Heparin are now harmonized.
• A consequence of this harmonization is a discontinuous change in the USP unit. The
effects of this change on users are being monitored by the USP. The US FDA is aware of
this change as well.
Responses from the participants and Scientific and Standardization
Committee (SSC) of the international Society on Thrombosis and
Haemostasis All submitted responses from participants agreed with the recommendations for the proposed 6th
International Standard for Unfractionated heparin. There was a comment from a participant with
regards to the classifications of the method used by their laboratory and the error has been corrected
in this current report. This error has no impact on the recommended replacement IS and its value
assignment. One of the SSC experts required clarification of the rationale for the use of slope ratio
and parallel line analysis and abbreviations used in the report. These comments have also been
considered and amended as required. At the SSC Annual Business Meeting (the 55th SSC
Meeting in Boston, 15 July 2009), the SSC endorsed the proposal that Candidate W, 07/328, be the
6th International Standard for Unfractionated Heparin.

WHO/BS/09.2124
Page 13
Proposal and recommendation to the ECBS • Candidate W, 07/328, be the 6
th International Standard for
Unfractionated heparin : 2145 IU/ampoule
The proposed Instruction for Use for the proposed 6th International Standard for Unfractionated
Heparin, 07/328 is illustrated in Appendix 6.
References (1) Gray E, Walker AD, Mulloy B, Barrowcliffe TW. A collaborative study to establish the 5th
International Standard for Unfractionated Heparin. Thromb Haemost. 2000 Dec;84(6):1017-
22.
(2) Campbell PJ. Procedures used for the production of biological standards and reference
preparations. J Biol Standardisation. 1974, 2, 259-267
(3) Mulloy B, Gray E, Barrowcliffe TW. Characterisation of unfractionated heparin samples:
Comparison of samples from the last 50 years Thromb Haemostas 2000 84:1052-1056.
(4) McEwen I, Mulloy B, Hellwig E, Kozerski L, Beyer T, Holzgrabe U, Rodomonte A,
Wanko R, Spieser J-M. Determination of oversulphated chondroitin sulphate and
dermatan sulphate in unfractionated heparin by 1H-NMR” Pharmeuropa Bio 2008-1, 31-
39.
(5) Finney DJ. Statistical Method in Biological Assay. 3rd Edition. London: Charles Griffin
1978.
(6) Kirkwood TBL. Geometric means and measures of dispersion. Biometrics 1979; 35:
908-909.
(7) Grubbs F. Procedures for Detecting Outlying Observations in Samples. Technometrics,
1969; 11: 1-21.
Acknowledgments We would like to thank the participants of the study, the support of the Control of Anticoagulation
Subcommittee of the SSC/ISTH and the following manufacturers for their kind donation of
candidate samples:
Leo Pharmaceutical Products Ltd, 55 Industriparken, DK-2750 Ballerup, Denmark
Scientific Protein Laboratories, 700 E Main Street, Waunakee, 53597-0158 USA
Bioiberica, SA, Plaza Francesc Macià , 7 Barcelona 08029 , Spain
Opocrin SPA, 3, V. Pacinotti 41043 Corlo di Formaigine (MO), Italy
NV Organon (Schering-Plough), P O Box 20 5340 BH Oss, Kloosterstraat 6 5349 AB Oss, The
Netherlands

WHO/BS/09.2124
Page 14
Table 1: Summary of fill characteristics of the candidates. Candidate T was not processed
at NIBSC
Code 08/254
T
07/332
V
07/328
W
07/330
X
07/334
Y
07/324
Z
Presentation Sealed, glass 3 ml DIN ampoules
No of ampoules
available 8000 25000 24000 24500 25000 24000
CV of fill mass (%) 0.24
(n=200)
0.098
(n=857)
0.119
(n=1057)
0.100
(n=888)
0.08
(n= 879)
0.121
(n=970)
Mean dry weight (g,
n = 6) 0.0097 0.007 0.0107 0.0095 0.0104 0.0116
Mean head space
oxygen (%)
3.7
(n =6)
0.329
(n = 12)
0.60
(n = 13)
0.50
(n=12)
0.39
(n=12)
0.72
(n=12)
Residual moisture
(%)
0.70
(n =3)
0.78
(n = 12)
0.76
(n =12)
0.51
(n=12)
0.18
(n=13)
0.60
(n=12)
Storage
Conditions -20°C
Address of
processing facility NIBSC, Potters Bar, EN6 3QG, UK
Address of present
custodian NIBSC, Potters Bar, EN6 3QG, UK
Table 2: Homogeneity of the fill by APTT
NIBSC Code Study Code Geometric Coefficient of
Variation (% GCV)
Analysis of Variance
(ANOVA)
07/332 V 0.97 p = 0.994
07/328 W 1.17 p = 0.252
07/330 X 1.62 p = 0.344
07/334 Y 2.60 p = 0.066
07/324 Z 0.59 p = 0.878

WHO/BS/09.2124
Page 15
Table 3: Summary of molecular weight measurements on the candidates.
Candidates Mp Mn Mw PD
T 14817 11992 15617 1.40
V 19210 18188 24278 1.33
W 15640 12772 16760 1.31
X 15929 13016 15945 1.23
Y 14646 11231 14236 1.27
Z 15708 12385 17595 1.42
Mp=peak molecular weight
Mn=Number average molecular weight
Mw=Weight average molecular weight
PD=Polydispersity (Mw/Mn)
Table 4: Number of Assays Performed for Each Method
No of Assays Method
Submitted Analysed and Assessed
Anti-IIa chromogenic assay, purified AT 126 126
Anti-Xa chromogenic assay, purified AT 196 196
Anti-IIa chromogenic assay, human plasma 4 4
Anti-Xa chromogenic assay, human plasma 12 8
USP sheep plasma anticoagulant assay 36 0
EP sheep plasma APTT 167 167
Japanese Pharmacopoeia assay 4 0
Chinese Pharmacopoeia assay 24 24
Human plasma APTT 109 109
Thrombin Time 8 4
Prothrombinase induced Clotting Time (PiCT) 4 4
Total 690 642
Table 5: Invalid Potency Estimates Due to Non-parallelism (NP) in Parallel Line or
Significantly Different Intercepts (NI) in Slope Ratio Analysis. Methods where all assays were
valid are not shown in the table
Method T V W X Y Z
Anti-Xa chromogenic
assay, purified AT 3NI 4NI 0 0 3NI 1NI
EP sheep plasma APTT 3NP 8NP 0 1NP 4NP 1NP
Human plasma APTT 1NI 1NI 2NI 0 1NI 0
Thrombin Time 2NP 2NP 0 2NP 1NP 1NP
Prothrombinase
induced clotting Time
(PiCT)
1NP 0 0 0 1NP 0
Total 10 15 2 3 10 3

WHO/BS/09.2124
Page 16
Table 6: Individual Assay Potency (IU/ampoule) Estimates by Anti-IIa Chromogenic
Assays with Purified AT
Lab Model Transformation Assay T V W X Y Z
02 Parallel None 1 1528 2859 2117 2138 1731 2151
02 Parallel None 2 1606 2939 2071 2112 1780 2274
02 Parallel None 3 1723 3064 2177 2170 1791 2306
03 Parallel None 1 1676 2102 2098 2146 1796 1725
03 Parallel None 2 1445 2092 1714 2169 1928 1939
03 Parallel None 3 1663 2277 2271 2169 1679 1930
03 Parallel None 4 1677 1690 2116 1598 1859 1710
05 Parallel Log 1 1849 2860 2251 2234 1950 2197
05 Parallel Log 2 1697 2613 2217 2095 1811 2171
05 Parallel Log 3 1976 2894 2542 2363 2064 2370
05 Parallel Log 4 1772 2594 2166 2175 1831 2174
06 Parallel None 1.1 1881 . . 2176 1957 .
06 Parallel None 1.2 . 3033 2337 . . 2544
06 Parallel None 2.1 1665 . . 2329 1949 .
06 Parallel None 2.2 . 2912 2234 . . 2246
06 Parallel None 3.1 1903 . . . 1940 2312
06 Parallel None 3.2 . 2932 2260 2340 . .
06 Parallel None 4.1 1720 . . . 1858 2144
06 Parallel None 4.2 . 2791 2099 2155 . .
08 Parallel None 1 1590 2954 2092 2099 1815 2181
08 Parallel None 2 1686 3046 2161 1978 2065 2248
08 Parallel None 3 1618 3054 2030 2051 1759 2122
08 Parallel None 4 1610 2861 2052 2012 1727 2073
10 Parallel None 1.1 . 2505 2210 . . 2054
10 Parallel None 1.2 1892 . . NL 1997 .
10 Parallel None 2.1 . NL 2182 . . 2021
10 Parallel None 2.2 NL . . 1964 NL .
10 Parallel None 3.1 . NL 2220 . . 2069
10 Parallel None 3.2 1887 . . 2015 1990 .
10 Parallel None 4.1 . NL NL . . NL
10 Parallel None 4.2 NL . . NL NL .
11 Parallel None 1 1739 2508 2090 2115 1819 2058
11 Parallel None 2 1894 2496 2071 2127 1805 2066
11 Parallel None 3 1706 2494 2053 2080 1768 2039
11 Parallel None 4 1724 2517 2071 2094 1776 2070
12 Parallel None 1.1 . 2724 1903 . . 2134
12 Parallel None 1.2 2078 . . 2077 1954 .
12 Parallel None 2.1 . 2821 NL . . 2247
12 Parallel None 2.2 2122 . . 2382 1956 .
12 Parallel None 3.1 . 2707 2096 2192 . .
12 Parallel None 3.2 2072 . . . 1971 NL
12 Parallel None 4.1 . 2764 2155 2274 . .
12 Parallel None 4.2 2136 . . . 2036 2256
13 Parallel None 1 1732 2457 2281 2124 2079 2136
13 Parallel None 2 2060 2837 2228 2261 1826 2108
13 Parallel None 3 2057 2931 2372 2417 2071 2384
13 Parallel None 4 1924 3138 2303 2488 1901 2391
15 Parallel None 1 1924 2209 2263 2264 2002 2126
15 Parallel None 2 1961 2215 2328 2412 2146 2183
15 Parallel None 3 1945 2177 2211 2242 2019 2180
16 Parallel None 1 1636 3618 2637 2320 2148 2593
16 Parallel None 2 1963 3957 2502 2347 1800 2505
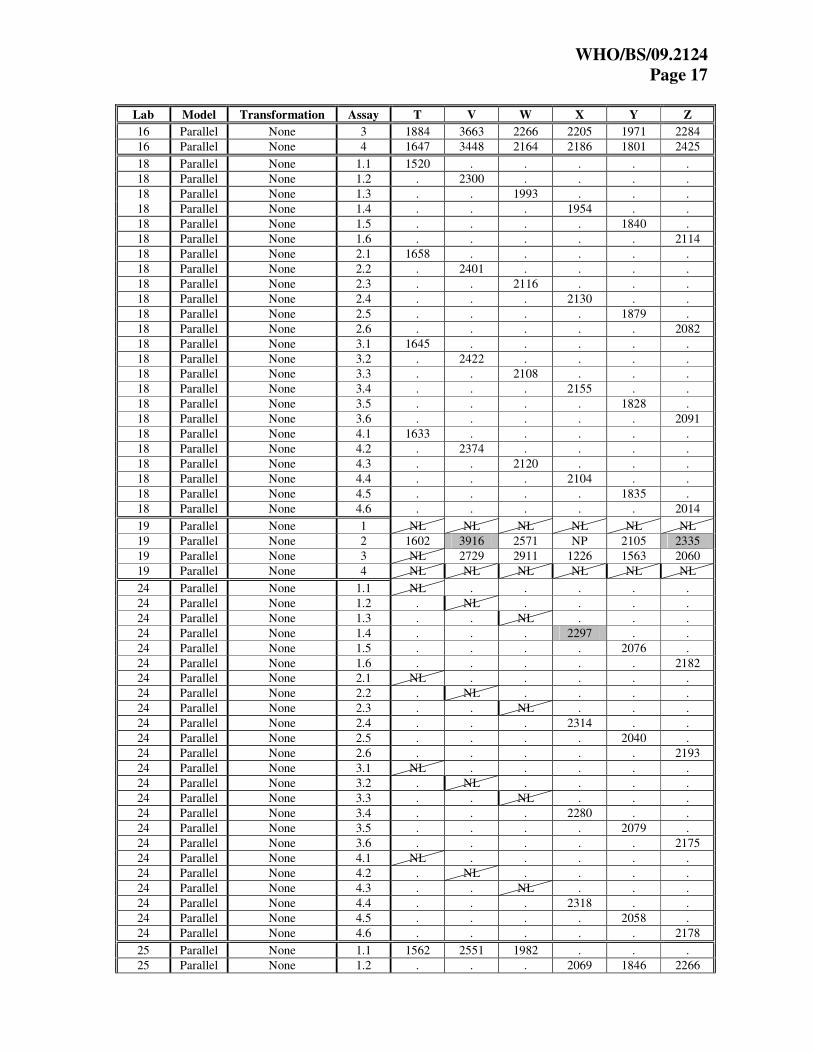
WHO/BS/09.2124
Page 17
Lab Model Transformation Assay T V W X Y Z
16 Parallel None 3 1884 3663 2266 2205 1971 2284
16 Parallel None 4 1647 3448 2164 2186 1801 2425
18 Parallel None 1.1 1520 . . . . .
18 Parallel None 1.2 . 2300 . . . .
18 Parallel None 1.3 . . 1993 . . .
18 Parallel None 1.4 . . . 1954 . .
18 Parallel None 1.5 . . . . 1840 .
18 Parallel None 1.6 . . . . . 2114
18 Parallel None 2.1 1658 . . . . .
18 Parallel None 2.2 . 2401 . . . .
18 Parallel None 2.3 . . 2116 . . .
18 Parallel None 2.4 . . . 2130 . .
18 Parallel None 2.5 . . . . 1879 .
18 Parallel None 2.6 . . . . . 2082
18 Parallel None 3.1 1645 . . . . .
18 Parallel None 3.2 . 2422 . . . .
18 Parallel None 3.3 . . 2108 . . .
18 Parallel None 3.4 . . . 2155 . .
18 Parallel None 3.5 . . . . 1828 .
18 Parallel None 3.6 . . . . . 2091
18 Parallel None 4.1 1633 . . . . .
18 Parallel None 4.2 . 2374 . . . .
18 Parallel None 4.3 . . 2120 . . .
18 Parallel None 4.4 . . . 2104 . .
18 Parallel None 4.5 . . . . 1835 .
18 Parallel None 4.6 . . . . . 2014
19 Parallel None 1 NL NL NL NL NL NL
19 Parallel None 2 1602 3916 2571 NP 2105 2335
19 Parallel None 3 NL 2729 2911 1226 1563 2060
19 Parallel None 4 NL NL NL NL NL NL
24 Parallel None 1.1 NL . . . . .
24 Parallel None 1.2 . NL . . . .
24 Parallel None 1.3 . . NL . . .
24 Parallel None 1.4 . . . 2297 . .
24 Parallel None 1.5 . . . . 2076 .
24 Parallel None 1.6 . . . . . 2182
24 Parallel None 2.1 NL . . . . .
24 Parallel None 2.2 . NL . . . .
24 Parallel None 2.3 . . NL . . .
24 Parallel None 2.4 . . . 2314 . .
24 Parallel None 2.5 . . . . 2040 .
24 Parallel None 2.6 . . . . . 2193
24 Parallel None 3.1 NL . . . . .
24 Parallel None 3.2 . NL . . . .
24 Parallel None 3.3 . . NL . . .
24 Parallel None 3.4 . . . 2280 . .
24 Parallel None 3.5 . . . . 2079 .
24 Parallel None 3.6 . . . . . 2175
24 Parallel None 4.1 NL . . . . .
24 Parallel None 4.2 . NL . . . .
24 Parallel None 4.3 . . NL . . .
24 Parallel None 4.4 . . . 2318 . .
24 Parallel None 4.5 . . . . 2058 .
24 Parallel None 4.6 . . . . . 2178
25 Parallel None 1.1 1562 2551 1982 . . .
25 Parallel None 1.2 . . . 2069 1846 2266

WHO/BS/09.2124
Page 18
Lab Model Transformation Assay T V W X Y Z
25 Parallel None 2.1 1682 2574 2023 . . .
25 Parallel None 2.2 . . . 2142 1732 1978
25 Parallel None 3.1 1710 2651 2011 . . .
25 Parallel None 3.2 . . . 2056 1839 2148
25 Parallel None 4.1 1764 2601 1937 . . .
25 Parallel None 4.2 . . . 1995 1654 1890
27 Parallel None 1 1704 2715 2132 2255 1897 2104
27 Parallel None 2 1812 2355 2180 2065 1980 1968
27 Parallel None 3 1793 2261 2124 2116 1926 1857
27 Parallel None 4 1725 NL 2124 2064 1895 1954
32 Parallel None 1 1624 2233 2055 2139 1951 2167
32 Parallel None 2 1810 2401 2143 2182 2020 2174
32 Parallel None 3 1740 2659 2102 2103 1896 2238
32 Parallel None 4 1743 2581 2117 2096 1910 2300
35 Parallel None 1 1674 2841 2135 2160 1864 2173
35 Parallel None 2 1622 2955 2140 2145 1778 2154
35 Parallel None 3 1847 3038 2132 2121 1986 2353
35 Parallel None 4 1762 2899 1963 2265 1951 2189
Deviations from model
p<0.01, not included in analysis NL = Non-linear
0.01<p<0.05, included in analysis
Table 7: Individual Assay Potency (IU/ampoule) Estimates by Anti-Xa Chromogenic
Assays with Purified AT
Lab Model Transformation Assay T V W X Y Z
02 Slope Log 1 1639 2735 2176 2172 1741 2103
02 Slope Log 2 1785 2709 2165 2065 1792 2085
02 Slope Log 3 1708 2651 2163 2079 1718 2200
03 Slope Log 1 NL NL NL NL NL NL
03 Slope Log 2 NL NL NL NL NL NL
03 Slope Log 3 1604 NL 2026 2068 1681 1917
03 Slope Log 4 1596 NL 1944 1710 NL NL
05 Slope Log 1 1696 3153 2088 2099 1714 2166
05 Slope Log 2 1611 3097 2169 2098 1701 2238
05 Slope Log 3 1626 3144 2111 1941 1721 2206
05 Slope Log 4 1642 3146 2086 2047 1682 2170
06 Slope Log 1.1 1749 . . 2280 1886 .
06 Slope Log 1.2 . 2782 2255 . . 2236
06 Slope Log 2.1 1807 . . . . .
06 Slope Log 2.2 . . . 2229 1869 .
06 Slope Log 2.3 . 2586 2078 . . 2148
06 Slope Log 3.1 1884 . . . 1905 2389
06 Slope Log 3.2 . 2769 . . . .
06 Slope Log 3.3 . . 2234 2334 . .
06 Slope Log 4.1 1982 . . . 2003 2191
06 Slope Log 4.2 . 2538 2229 2155 . .
07 Slope Log 1.1 1565 . . . . .
07 Slope Log 1.2 . NI . . . .
07 Slope Log 1.3 . . 2144 . . .
07 Slope Log 1.4 . . . 1944 . .

WHO/BS/09.2124
Page 19
Lab Model Transformation Assay T V W X Y Z
07 Slope Log 1.5 . . . . 1711 .
07 Slope Log 1.6 . . . . . 2141
07 Slope Log 2.1 1782 . . . . .
07 Slope Log 2.2 . 2211 . . . .
07 Slope Log 2.3 . . 2095 . . .
07 Slope Log 2.4 . . . 2324 . .
07 Slope Log 2.5 . . . . 1746 .
07 Slope Log 2.6 . . . . . 2256
07 Slope Log 3.1 1817 . . . . .
07 Slope Log 3.2 . 2409 . . . .
07 Slope Log 3.3 . . 2043 . . .
07 Slope Log 3.4 . . . 2282 . .
07 Slope Log 3.5 . . . . 1760 .
07 Slope Log 3.6 . . . . . 2300
07 Slope Log 4.1 1692 . . . . .
07 Slope Log 4.2 . 2497 . . . .
07 Slope Log 4.3 . . 2212 . . .
07 Slope Log 4.4 . . . 2060 . .
07 Slope Log 4.5 . . . . 1801 .
07 Slope Log 4.6 . . . . . 2075
08a Slope Log 1 1802 2313 2238 2370 1879 2113
08a Slope Log 2 1789 2341 2105 2190 1870 2095
08a Slope Log 3 1711 2282 2155 2147 1792 2057
08a Slope Log 4 1748 2523 2141 2050 1842 2073
08b Slope Log 1 1830 1804 1983 2094 NL 2027
08b Slope Log 2 1785 2266 2115 2083 1831 1953
08b Slope Log 3.1 1859 . 2029 2140 2012 2065
08b Slope Log 3.2 . 1776 . . . .
08b Slope Log 4 1901 1908 2190 2190 1990 2086
10 Parallel None 1.1 . 2626 2308 . . 2153
10 Parallel None 1.2 NL . . NL 1974 .
10 Parallel None 2.1 . 2553 2210 . . 2134
10 Parallel None 2.2 1869 . . 2034 1964 .
10 Parallel None 3.1 . 2582 2253 . . 2135
10 Parallel None 3.2 1855 . . NL 1992 .
10 Parallel None 4.1 . NL NL . . NL
10 Parallel None 4.2 NL . . NL NL .
11 Slope Log 1 1759 2617 2144 2126 1796 2141
11 Slope Log 2 1836 2680 2113 2109 1766 2098
11 Slope Log 3 1692 2659 2099 2089 1732 2089
11 Slope Log 4 1738 2787 2160 2133 1797 2161
12 Slope Log 1.1 . 2413 2106 . . 2103
12 Slope Log 1.2 2171 . . 2292 2016 .
12 Slope Log 2.1 . 2337 2083 . . 2061
12 Slope Log 2.2 2137 . . 2293 2018 .
12 Slope Log 3.1 . 2488 2153 2311 . .
12 Slope Log 3.2 2161 . . . 2039 2033
12 Slope Log 4.1 . 2449 2191 2269 . .
12 Slope Log 4.2 2114 . . . 2012 2144
13 Slope Log 1 1843 2359 2229 2236 2121 2159
13 Slope Log 2 2070 2217 2011 2087 1834 2035
13 Slope Log 3 1883 2532 2399 2441 2070 2342
13 Slope Log 4 1744 2623 2356 2384 2059 2362
15 Slope Log 1 1987 NI 2276 2242 2023 2152
15 Slope Log 2 2043 2206 2299 2409 2085 2149
15 Slope Log 3 2010 2202 2346 2388 2114 2211

WHO/BS/09.2124
Page 20
Lab Model Transformation Assay T V W X Y Z
15 Slope Log 4 2168 NI 2416 2438 2180 2330
16 Slope Log 1 1793 1746 2046 2073 2000 1912
16 Slope Log 2 2390 2632 2887 2597 2318 2099
16 Slope Log 3 1936 1995 1940 2297 1978 1856
16 Slope Log 4 1913 1779 1922 2106 1864 1846
18 Slope Log 1.1 1857 . . . . .
18 Slope Log 1.2 . 2094 . . . .
18 Slope Log 1.3 . . 2077 . . .
18 Slope Log 1.4 . . . 2152 . .
18 Slope Log 1.5 . . . . 2042 .
18 Slope Log 1.6 . . . . . 2082
18 Slope Log 2.1 1774 . . . . .
18 Slope Log 2.2 . 2021 . . . .
18 Slope Log 2.3 . . 2102 . . .
18 Slope Log 2.4 . . . 2126 . .
18 Slope Log 2.5 . . . . 1886 .
18 Slope Log 2.6 . . . . . 2101
18 Slope Log 3.1 NI . . . . .
18 Slope Log 3.2 . 1856 . . . .
18 Slope Log 3.3 . . 2057 . . .
18 Slope Log 3.4 . . . 2123 . .
18 Slope Log 3.5 . . . . 1843 .
18 Slope Log 3.6 . . . . . 2026
18 Slope Log 4.1 1783 . . . . .
18 Slope Log 4.2 . 2042 . . . .
18 Slope Log 4.3 . . NL . . .
18 Slope Log 4.4 . . . 2142 . .
18 Slope Log 4.5 . . . . 1840 .
18 Slope Log 4.6 . . . . . 2003
19 Slope Log 1 1906 2858 2367 2483 1984 2301
19 Slope Log 2 1838 2756 2182 2133 2250 2139
19 Slope Log 3 1823 2329 2109 2193 1829 2094
19 Slope Log 4 1597 2358 2216 2111 1781 2026
22 Slope Log 1 1782 1883 2030 2163 1922 NL
22 Slope Log 2 1793 1834 2005 2164 1903 1924
22 Slope Log 3 NL 1866 2043 2168 1925 1946
22 Slope Log 4 1798 1856 2008 2142 1899 1900
23 Slope Log 1 1631 3018 2180 2105 NI 2185
23 Slope Log 2 1599 2836 2136 2067 1697 2158
23 Slope Log 3 1742 2991 2208 2112 1807 2181
23 Slope Log 4 1607 2913 2138 2061 NI 2101
25 Slope Log 1.1 1683 . . . . .
25 Slope Log 1.2 . 2597 . . . .
25 Slope Log 1.3 . . 2187 . . .
25 Slope Log 1.4 . . . 2069 . .
25 Slope Log 1.5 . . . . 1793 .
25 Slope Log 1.6 . . . . . 1962
25 Slope Log 2.1 1708 . . . . .
25 Slope Log 2.2 . 2415 . . . .
25 Slope Log 2.3 . . 1867 . . .
25 Slope Log 2.4 . . . 2180 . .
25 Slope Log 2.5 . . . . 1890 .
25 Slope Log 2.6 . . . . . 2114
25 Slope Log 3.1 1707 . . . . .
25 Slope Log 3.2 . 2524 . . . .
25 Slope Log 3.3 . . 2091 . . .

WHO/BS/09.2124
Page 21
Lab Model Transformation Assay T V W X Y Z
25 Slope Log 3.4 . . . 1934 . .
25 Slope Log 3.5 . . . . 1811 .
25 Slope Log 3.6 . . . . . 2142
25 Slope Log 4.1 1734 . . . . .
25 Slope Log 4.2 . 2429 . . . .
25 Slope Log 4.3 . . 2186 . . .
25 Slope Log 4.4 . . . 2093 . .
25 Slope Log 4.5 . . . . 1867 .
25 Slope Log 4.6 . . . . . 2228
25 Slope Log 1.1r 1674 . . . . .
25 Slope Log 1.2r . 2592 . . . .
25 Slope Log 1.3r . . 2145 . . .
25 Slope Log 1.4r . . . 1915 . .
25 Slope Log 1.5r . . . . 1784 .
25 Slope Log 1.6r . . . . . 2199
25 Slope Log 2.1r 1709 . . . . .
25 Slope Log 2.2r . 2470 . . . .
25 Slope Log 2.3r . . 2270 . . .
25 Slope Log 2.4r . . . 2194 . .
25 Slope Log 2.5r . . . . 2261 .
25 Slope Log 2.6r . . . . . 2127
25 Slope Log 3.1r 1719 . . . . .
25 Slope Log 3.2r . 2178 . . . .
25 Slope Log 3.3r . . 2027 . . .
25 Slope Log 3.4r . . . 1963 . .
25 Slope Log 3.5r . . . . 1815 .
25 Slope Log 3.6r . . . . . 2121
25 Slope Log 4.1r 1855 . . . . .
25 Slope Log 4.2r . 2425 . . . .
25 Slope Log 4.3r . . 2204 . . .
25 Slope Log 4.4r . . . 1987 . .
25 Slope Log 4.5r . . . . 1919 .
25 Slope Log 4.6r . . . . . 2195
27 Slope Log 1 1898 2298 2198 2193 2029 NI
27 Slope Log 2 1757 2127 2153 2115 1943 2074
27 Slope Log 3 NL NL NL NL 1911 2038
27 Slope Log 4 1903 2193 NL 2109 NL NL
32 Slope Log 1 1755 2013 2098 2141 1908 2045
32 Slope Log 2 1812 2108 2114 2193 1934 2021
32 Slope Log 3 NL 2217 2161 2218 1952 2173
32 Slope Log 4 1891 2133 2080 2242 2034 NL
33 Slope Log 1 1798 2133 2277 2232 1950 2161
33 Slope Log 2 1711 NL 2033 2130 2011 2070
33 Slope Log 3 1623 NI 2015 2034 NL 1914
33 Slope Log 4 1693 2013 2188 2142 1810 2003
35 Slope Log 1 2000 1924 2207 2194 2055 2304
35 Slope Log 2 2021 2010 2296 2292 2265 2206
35 Slope Log 3 2116 2224 2135 2222 1921 2076
35 Slope Log 4 1854 1982 2112 2194 1826 2048
36 Parallel Sigmoid 1.1 . 1294 2362 . . 2096
36 Parallel Sigmoid 1.2 1929 . . 2149 2272 .
36 Parallel Sigmoid 2.1 . 1650 2822 2632 . .
36 Parallel Sigmoid 2.2 2080 . . . 2024 2168
36 Parallel Sigmoid 3.1 . 2067 3054 2248 . .
36 Parallel Sigmoid 3.2 1997 . . . 2366 2522

WHO/BS/09.2124
Page 22 Deviations from model:
p<0.01, not included in analysis NL = Non-linear
0.01<p<0.05, included in analysis NI = Significant intersection difference

WHO/BS/09.2124
Page 23
Table 8: Individual Assay Potency (IU/ampoule) Estimates by the EP Pharmacopoeial
Assay
Lab Model Transformation Assay T V W X Y Z
01 Parallel Log 1.1 1888 2035 . 2164 1929 .
01 Parallel Log 1.2 . . 2170 . . 2070
01 Parallel Log 2.1 1777 . . 2194 1916 .
01 Parallel Log 2.2 . 2019 2047 . . 2049
01 Parallel Log 3.1 1792 . . . 1961 2043
01 Parallel Log 3.2 . 2109 2108 2223 . .
01 Parallel Log 4.1 1840 . . . 1922 2119
01 Parallel Log 4.2 . NP 2240 2140 . .
06 Parallel Log 1.1 1858 . . . . .
06 Parallel Log 1.1r 1827 . . . . .
06 Parallel Log 1.1r 1896 . . . . .
06 Parallel Log 1.2 . 2455 . . . .
06 Parallel Log 1.2r . 2436 . . . .
06 Parallel Log 1.2r . 2524 . . . .
06 Parallel Log 1.3 . . 2146 . . .
06 Parallel Log 1.3r . . 2166 . . .
06 Parallel Log 1.3r . . 2165 . . .
06 Parallel Log 1.4 . . . 2163 . .
06 Parallel Log 1.4r . . . 2161 . .
06 Parallel Log 1.4r . . . 2243 . .
06 Parallel Log 1.5 . . . . 2077 .
06 Parallel Log 1.5r . . . . 2100 .
06 Parallel Log 1.5r . . . . 2049 .
06 Parallel Log 1.6 . . . . . 2079
06 Parallel Log 1.6r . . . . . 2041
06 Parallel Log 1.6r . . . . . 2109
06 Parallel Log 2.1 1876 . . . . .
06 Parallel Log 2.1r 1925 . . . . .
06 Parallel Log 2.1r 1893 . . . . .
06 Parallel Log 2.2 . 2573 . . . .
06 Parallel Log 2.2r . 2476 . . . .
06 Parallel Log 2.2r . 2610 . . . .
06 Parallel Log 2.3 . . 2202 . . .
06 Parallel Log 2.3r . . 2257 . . .
06 Parallel Log 2.3r . . 2234 . . .
06 Parallel Log 2.4 . . . 2093 . .
06 Parallel Log 2.4r . . . 2044 . .
06 Parallel Log 2.4r . . . 2130 . .
06 Parallel Log 2.5 . . . . 1878 .
06 Parallel Log 2.5r . . . . 1904 .
06 Parallel Log 2.5r . . . . 1932 .
06 Parallel Log 2.6 . . . . . 2103
06 Parallel Log 2.6r . . . . . 2026
06 Parallel Log 2.6r . . . . . 2048
06 Parallel Log 3.1 1898 . . . . .
06 Parallel Log 3.1r 1999 . . . . .
06 Parallel Log 3.1r 1926 . . . . .
06 Parallel Log 3.2 . 2418 . . . .
06 Parallel Log 3.2r . 2540 . . . .
06 Parallel Log 3.2r . 2496 . . . .
06 Parallel Log 3.3 . . 2153 . . .
06 Parallel Log 3.3r . . 2158 . . .
06 Parallel Log 3.3r . . 2222 . . .

WHO/BS/09.2124
Page 24
Lab Model Transformation Assay T V W X Y Z
06 Parallel Log 3.4 . . . 2226 . .
06 Parallel Log 3.4r . . . 2174 . .
06 Parallel Log 3.4r . . . 2254 . .
06 Parallel Log 3.5 . . . . 2018 .
06 Parallel Log 3.5r . . . . 2040 .
06 Parallel Log 3.5r . . . . 2084 .
06 Parallel Log 3.6 . . . . . 1998
06 Parallel Log 3.6r . . . . . 2051
06 Parallel Log 3.6r . . . . . 2083
06 Parallel Log 4.1 1863 . . . . .
06 Parallel Log 4.1r 1890 . . . . .
06 Parallel Log 4.1r 1885 . . . . .
06 Parallel Log 4.2 . 2504 . . . .
06 Parallel Log 4.2r . 2437 . . . .
06 Parallel Log 4.2r . 2526 . . . .
06 Parallel Log 4.3 . . 2229 . . .
06 Parallel Log 4.3r . . 2219 . . .
06 Parallel Log 4.3r . . 2225 . . .
06 Parallel Log 4.4 . . . 2251 . .
06 Parallel Log 4.4r . . . 2159 . .
06 Parallel Log 4.4r . . . 2191 . .
06 Parallel Log 4.5 . . . . 1995 .
06 Parallel Log 4.5r . . . . 2040 .
06 Parallel Log 4.5r . . . . 2024 .
06 Parallel Log 4.6 . . . . . 2057
06 Parallel Log 4.6r . . . . . 2070
06 Parallel Log 4.6r . . . . . 2040
07 Parallel Log 1.1 1931 . . . . .
07 Parallel Log 1.2 . 1869 . . . .
07 Parallel Log 1.3 . . 2195 . . .
07 Parallel Log 1.4 . . . 2201 . .
07 Parallel Log 1.5 . . . . 1968 .
07 Parallel Log 1.6 . . . . . 2042
07 Parallel Log 2.1 1857 . . . . .
07 Parallel Log 2.2 . 1805 . . . .
07 Parallel Log 2.3 . . 2124 . . .
07 Parallel Log 2.4 . . . 2169 . .
07 Parallel Log 2.5 . . . . 1957 .
07 Parallel Log 2.6 . . . . . 2009
07 Parallel Log 3.1 1881 . . . . .
07 Parallel Log 3.2 . 1787 . . . .
07 Parallel Log 3.3 . . 2179 . . .
07 Parallel Log 3.4 . . . 2171 . .
07 Parallel Log 3.5 . . . . 1936 .
07 Parallel Log 3.6 . . . . . 2029
07 Parallel Log 4.1 1867 . . . . .
07 Parallel Log 4.2 . 1817 . . . .
07 Parallel Log 4.3 . . 2211 . . .
07 Parallel Log 4.4 . . . 2185 . .
07 Parallel Log 4.5 . . . . 1957 .
07 Parallel Log 4.6 . . . . . 2038
08 Parallel Log 1.1 . NL 2114 . . NL
08 Parallel Log 1.2 1802 . . 2124 1858 .
08 Parallel Log 2.1 . 1897 2084 . . 1937
08 Parallel Log 2.2 1849 . . 2223 1903 .
08 Parallel Log 3.1 . 1787 2139 2103 . .
08 Parallel Log 3.2 1693 . . . 1724 1931

WHO/BS/09.2124
Page 25
Lab Model Transformation Assay T V W X Y Z
08 Parallel Log 4.1 . 1793 2111 2094 . .
08 Parallel Log 4.2 1872 . . . 1942 2102
09 Parallel Log 1.1 NP . . 2109 . .
09 Parallel Log 1.2 . . 2122 . 2054 .
09 Parallel Log 1.3 . NP . . . 2092
09 Parallel Log 2.1 1918 NP . . . .
09 Parallel Log 2.2 . . 2091 2104 . .
09 Parallel Log 2.3 . . . . NP NP
09 Parallel Log 3.1 1913 . 2125 . . .
09 Parallel Log 3.2 . . . 2111 NP .
09 Parallel Log 3.3 . NP . . . 2059
09 Parallel Log 4.1 NP NP . . . .
09 Parallel Log 4.2 . . . 2168 2076 .
09 Parallel Log 4.3 . . 2144 . . 2092
13 Parallel Log 1 1823 NP 2213 2171 1960 2024
13 Parallel Log 2 1923 2488 2121 2140 2077 2177
13 Parallel Log 3 2079 2526 2176 2105 2095 2119
13 Parallel Log 4 1919 2564 2135 2149 1986 2103
17 Parallel Log 1 1802 2038 2086 2106 1892 1998
17 Parallel Log 2 1772 2000 2100 2105 1825 1998
17 Parallel Log 3 1730 2042 2122 2115 1830 2002
17 Parallel Log 4 1747 2040 2108 2100 1838 2012
18 Parallel Log 1.1 1707 . . . . .
18 Parallel Log 1.2 . 1954 . 2120 1870 .
18 Parallel Log 1.3 . . 2080 . . 1949
18 Parallel Log 2.1 1991 . . . . .
18 Parallel Log 2.2 . 2023 2075 . . 1968
18 Parallel Log 2.3 . . . 2108 1819 .
18 Parallel Log 3.1 1604 . . . . .
18 Parallel Log 3.2 . 1897 2022 . . 1903
18 Parallel Log 3.3 . . . 2111 1813 .
18 Parallel Log 4.1 1703 . . 2111 1821 .
18 Parallel Log 4.2 . NP 2055 . . 1930
21 Parallel Log 1.1 1753 . . 2237 1963 .
21 Parallel Log 1.2 . 1752 2227 . . 2006
21 Parallel Log 2.1 1890 . . 2338 2073 .
21 Parallel Log 2.2 . NP 1993 . . 1878
21 Parallel Log 3.1 1841 . . . 2002 2172
21 Parallel Log 3.2 . 1743 2110 2189 . .
21 Parallel Log 4.1 1999 . . 2253 2085 .
21 Parallel Log 4.2 . 1812 2115 . . 1883
25 Parallel Log 1.1 1825 . . NL NP .
25 Parallel Log 1.2 . NP 2061 . . 1956
25 Parallel Log 2.1 1780 . . 2131 1910 .
25 Parallel Log 2.2 . 1766 2107 . . NL
25 Parallel Log 3.1 NL . . . NL NL
25 Parallel Log 3.2 . NL NL NL . .
25 Parallel Log 4.1 NL . . . NL NL
25 Parallel Log 4.2 . 1751 2087 2024 . .
27 Parallel Log 1 NL 1916 2268 2298 2021 2118
27 Parallel Log 2 NL NL NL NL NL NL
27 Parallel Log 3 1873 1834 2231 NP 1989 2053
27 Parallel Log 4 2014 1996 NL 2295 2140 2184
31 Parallel Log 1 1825 1844 2086 2059 1863 1985
31 Parallel Log 2 NP 1852 2106 2160 1976 2171

WHO/BS/09.2124
Page 26
Lab Model Transformation Assay T V W X Y Z
31 Parallel Log 3 1807 1911 2121 2121 NP 2078
31 Parallel Log 4 1873 1933 2227 2190 1944 2142
Deviations from model
p<0.01, not included in analysis NL = Non-linear
0.01<p<0.05, included in analysis NP = Non-parallel

WHO/BS/09.2124
Page 27
Table 9: Individual Assay Potency Estimates (IU/ampoule) by the USP Pharmacopoeial
Assay. Laboratory’s own potency estimates were used for overall calculation of potency
estimates of the candidates.
Lab Assay T V W X Y Z
06 1 1970 1875 2136 2183 2000 2041
06 2 1967 1779 2136 2136 2000 2017
06 3 1956 1898 2150 2102 2065 2000
06 4 1946 1826 2131 2165 1993 2022
10 1 1976 2088 2031 1976 2120 2031
10 2 1976 2088 2031 2031 2088 2003
10 3 2031 2090 2031 2031 2122 2031
10 4 2031 2088 2088 2031 2088 2031
12 1 1918 1792 2240 2240 2097 2109
12 2 1921 1737 2110 2136 2034 2034
12 3 1903 1758 2198 2185 2070 2070
12 4 1977 1722 2158 2158 2020 2065
18 1 1931 1801 2203 2229 2031 2040
18 2 1895 1789 2153 2265 2031 1999
18 3 1823 1685 2183 2183 2031 2132
18 4 1823 1681 2183 2183 2008 1949
19 1 1923 1742 2250 2261 1965 1965
19 2 1780 1664 2149 2050 2010 1990
19 3 1700 1910 2250 1953 1634 2084
19 4 2044 1783 2356 2285 2085 2084
24 1 1986 1830 2249 2237 2063 2070
24 2 2000 1804 2236 2240 2024 2029
24 3 1981 1804 2244 2232 2006 2030
24 4 2030 1837 2261 2241 2026 2016
25 1 1842 1837 2077 2077 1939 1979
25 2 1871 1754 2135 2234 2019 2060
25 3 1901 1820 2170 2077 2005 2003
25 4 1821 1708 2172 2123 1878 1917
26 1 2000 1905 2210 2210 2000 2000
26 2 2000 1952 2210 2210 2099 2048
26 3 2024 1905 2210 2210 2074 2074
26 4 2000 1905 2210 2100 2000 2050
28 1 1939 1777 2168 2036 2064 2064
28 2 1939 1777 2236 2168 2129 2064
28 3 1939 1777 2202 2170 2097 2131
28 4 1939 1833 2271 2263 2097 2086
WHO/BS/09.2124
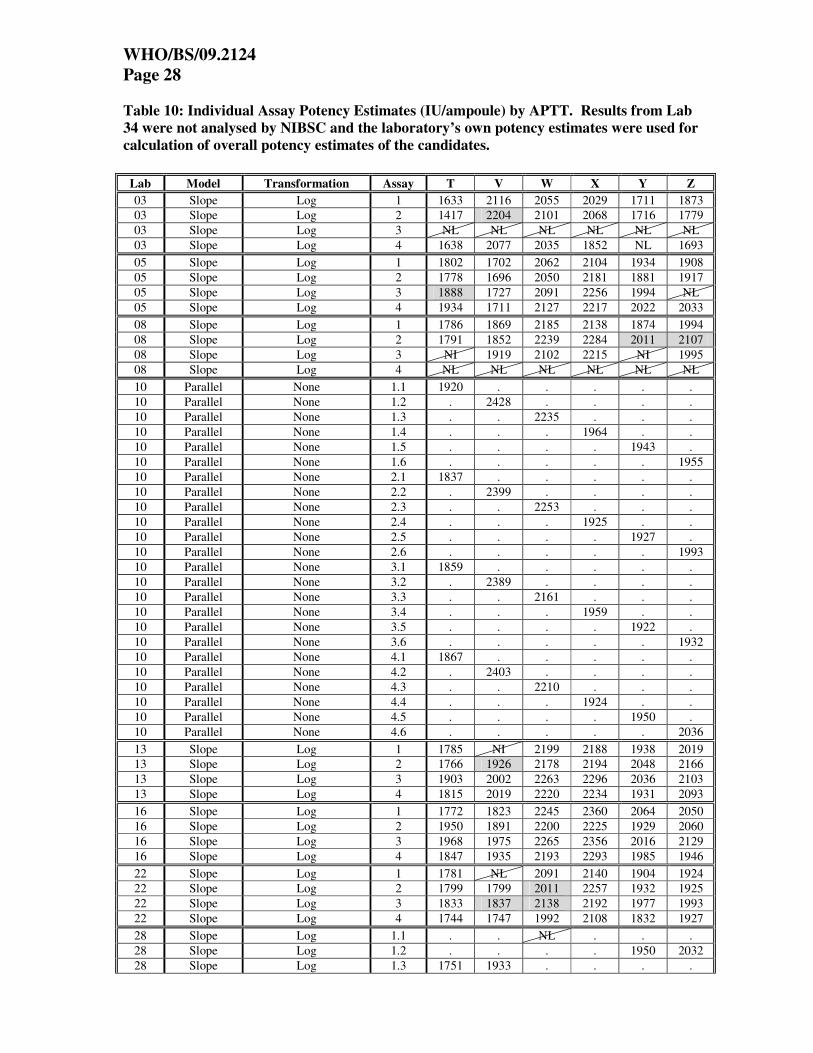
Page 28
Table 10: Individual Assay Potency Estimates (IU/ampoule) by APTT. Results from Lab
34 were not analysed by NIBSC and the laboratory’s own potency estimates were used for
calculation of overall potency estimates of the candidates.
Lab Model Transformation Assay T V W X Y Z
03 Slope Log 1 1633 2116 2055 2029 1711 1873
03 Slope Log 2 1417 2204 2101 2068 1716 1779
03 Slope Log 3 NL NL NL NL NL NL
03 Slope Log 4 1638 2077 2035 1852 NL 1693
05 Slope Log 1 1802 1702 2062 2104 1934 1908
05 Slope Log 2 1778 1696 2050 2181 1881 1917
05 Slope Log 3 1888 1727 2091 2256 1994 NL
05 Slope Log 4 1934 1711 2127 2217 2022 2033
08 Slope Log 1 1786 1869 2185 2138 1874 1994
08 Slope Log 2 1791 1852 2239 2284 2011 2107
08 Slope Log 3 NI 1919 2102 2215 NI 1995
08 Slope Log 4 NL NL NL NL NL NL
10 Parallel None 1.1 1920 . . . . .
10 Parallel None 1.2 . 2428 . . . .
10 Parallel None 1.3 . . 2235 . . .
10 Parallel None 1.4 . . . 1964 . .
10 Parallel None 1.5 . . . . 1943 .
10 Parallel None 1.6 . . . . . 1955
10 Parallel None 2.1 1837 . . . . .
10 Parallel None 2.2 . 2399 . . . .
10 Parallel None 2.3 . . 2253 . . .
10 Parallel None 2.4 . . . 1925 . .
10 Parallel None 2.5 . . . . 1927 .
10 Parallel None 2.6 . . . . . 1993
10 Parallel None 3.1 1859 . . . . .
10 Parallel None 3.2 . 2389 . . . .
10 Parallel None 3.3 . . 2161 . . .
10 Parallel None 3.4 . . . 1959 . .
10 Parallel None 3.5 . . . . 1922 .
10 Parallel None 3.6 . . . . . 1932
10 Parallel None 4.1 1867 . . . . .
10 Parallel None 4.2 . 2403 . . . .
10 Parallel None 4.3 . . 2210 . . .
10 Parallel None 4.4 . . . 1924 . .
10 Parallel None 4.5 . . . . 1950 .
10 Parallel None 4.6 . . . . . 2036
13 Slope Log 1 1785 NI 2199 2188 1938 2019
13 Slope Log 2 1766 1926 2178 2194 2048 2166
13 Slope Log 3 1903 2002 2263 2296 2036 2103
13 Slope Log 4 1815 2019 2220 2234 1931 2093
16 Slope Log 1 1772 1823 2245 2360 2064 2050
16 Slope Log 2 1950 1891 2200 2225 1929 2060
16 Slope Log 3 1968 1975 2265 2356 2016 2129
16 Slope Log 4 1847 1935 2193 2293 1985 1946
22 Slope Log 1 1781 NL 2091 2140 1904 1924
22 Slope Log 2 1799 1799 2011 2257 1932 1925
22 Slope Log 3 1833 1837 2138 2192 1977 1993
22 Slope Log 4 1744 1747 1992 2108 1832 1927
28 Slope Log 1.1 . . NL . . .
28 Slope Log 1.2 . . . . 1950 2032
28 Slope Log 1.3 1751 1933 . . . .

WHO/BS/09.2124
Page 29
Lab Model Transformation Assay T V W X Y Z
28 Slope Log 1.4 . . . 2106 . .
28 Slope Log 2.1 1785 1868 . . . .
28 Slope Log 2.2 . . 2107 2177 . .
28 Slope Log 2.3 . . . . 1914 1993
28 Slope Log 3.1 1833 1904 . . . .
28 Slope Log 3.2 . . NI 2213 . .
28 Slope Log 3.3 . . . . 1956 2027
28 Slope Log 4.1 1850 1916 . . . .
28 Slope Log 4.2 . . 2103 2224 . .
28 Slope Log 4.3 . . . . 1962 2036
29 Slope Log 1.1 1879 1849 2064 . . .
29 Slope Log 1.2 1958 . . 2020 . 1877
29 Slope Log 1.3 . . NL . 1865 1783
29 Slope Log 1.4 . 1635 . 2109 1866 .
29 Slope Log 1.5 . . . 2010 1910 1882
29 Slope Log 1.6 . 1718 2004 . 1803 .
29 Slope Log 1.7 1800 1710 . 1864 . .
29 Slope Log 1.8 1844 . 2167 . . 1886
29 Slope Log 2.1 1873 1588 2156 . . .
29 Slope Log 2.2 1949 . . 2130 . 1908
29 Slope Log 2.3 . . NI . 2010 2178
29 Slope Log 2.4 . 1603 . 2065 1847 .
29 Slope Log 2.5 . . . 2007 1884 1885
29 Slope Log 2.6 . 1529 2157 . 1976 .
29 Slope Log 2.7 1867 1621 . 2032 . .
29 Slope Log 2.8 1847 . 2057 . . 1970
29 Slope Log 3.1 1786 1917 2044 . . .
29 Slope Log 3.2 1805 . . 1908 . 1941
29 Slope Log 3.3 . . 2136 . 1786 1938
29 Slope Log 3.4 . 1751 . 1876 1738 .
29 Slope Log 3.5 . . . 2179 1911 2097
29 Slope Log 3.6 . 1918 2056 . 1860 .
29 Slope Log 3.7 NL 1809 . 1993 . .
29 Slope Log 3.8 1720 . 1996 . . 2038
29 Slope Log 4.1 1939 2052 2220 . . .
29 Slope Log 4.2 2013 . . 2404 . 2218
29 Slope Log 4.3 . . 2334 . 2145 1972
29 Slope Log 4.4 . 2089 . 2393 2214 .
29 Slope Log 4.5 . . . 2278 2043 1907
29 Slope Log 4.6 . 2041 2311 . 2090 .
29 Slope Log 4.7 2067 2076 . 2376 . .
29 Slope Log 4.8 1994 . 2273 . . 2035
34 As reported None 1 1782 2043 2160 2244 1852 2017
34 As reported None 2 1710 2445 2234 2253 1758 2041
34 As reported None 3 1755 2283 2179 2240 1832 2186
34 As reported None 4 1705 2119 2174 2139 1799 2107
34 As reported None 1 1896 1817 2186 2260 1965 2068
34 As reported None 2 1829 2047 2265 2299 1864 2012
34 As reported None 3 1850 1939 2197 2283 2002 2111
34 As reported None 4 1826 1840 2180 2192 1935 2049
36 Slope Log 1.1 . 2194 2181 . . 1872
36 Slope Log 1.2 1809 . . 2003 1888 .
36 Slope Log 2.1 . 1563 2048 . . 2061
36 Slope Log 2.2 1881 . . 2185 1884 .
36 Slope Log 3.1 . 1625 2062 2491 . .
36 Slope Log 3.2 1877 . . . 1993 1893

WHO/BS/09.2124
Page 30
Lab Model Transformation Assay T V W X Y Z
36 Slope Log 4.1 . 1141 2001 1671 . .
36 Slope Log 4.2 1832 . . . 2304 2329
Deviations from model
p<0.01, not included in analysis NL = Non-linear
0.01<p<0.05, included in analysis NI = Significant intersection difference

WHO/BS/09.2124
Page 31
Table 11: Individual Assay Potency Estimates (IU/ampoule) by Anti-Xa chromogenic assay
with plasma (A/Xa P), Anti-IIa chromogenic assay with plasma (A/IIa P), Thrombin Time
(TT), Chinese Pharmacopoeial Assay (CP), Japanese Pharmacopoeial Assay (JP) and
Prothrombinase induced Clotting time (PiCT). Results from Lab 18 (JP assays), Lab 30
(TT) and Lab 34(A/Xa P) could not be analysed by NIBSC and the laboratory’s own
potency estimates were used for calculation of overall potency estimates of the candidates
Lab Method Model Transformation Assay T V W X Y Z
03 A/Xa P Slope Log 1 NL NL 1952 1960 NL NL
03 Slope Log 2 1596 2462 NL NL NL NL
03 Slope Log 3 1697 2314 2054 2123 1829 1879
03 Slope Log 4 1693 2226 2127 1683 1694 1848
03 A/IIa P Parallel None 1 1825 2470 2072 2587 2412 2330
03 Parallel None 2 1535 2493 1962 2514 2021 2481
03 Parallel None 3 2130 2139 2034 1859 1670 1882
03 Parallel None 4 1721 2186 2300 1900 2118 1740
03 TT Parallel Log 1 1792 1539 2036 NP 1746 1954
03 Parallel Log 2 NP NP 2142 NP NP 1969
03 Parallel Log 3 NP NP 2013 NP 1835 NP
03 Parallel Log 4 1834 1663 2159 1657 1883 1869
06 CP Parallel Log 1.1 1789 . . . . .
06 Parallel Log 1.2 . 2392 . . . .
06 Parallel Log 1.3 . . 2016 . . .
06 Parallel Log 1.4 . . . 2009 . .
06 Parallel Log 1.5 . . . . 2011 .
06 Parallel Log 1.6 . . . . . 2021
06 Parallel Log 2.1 1884 . . . . .
06 Parallel Log 2.2 . 2412 . . . .
06 Parallel Log 2.3 . . 2129 . . .
06 Parallel Log 2.4 . . . 1995 . .
06 Parallel Log 2.5 . . . . 1960 .
06 Parallel Log 2.6 . . . . . 1909
06 Parallel Log 3.1 1729 . . . . .
06 Parallel Log 3.2 . 2361 . . . .
06 Parallel Log 3.3 . . 2068 . . .
06 Parallel Log 3.4 . . . 2018 . .
06 Parallel Log 3.5 . . . . 2028 .
06 Parallel Log 3.6 . . . . . 1976
06 Parallel Log 4.1 1924 . . . . .
06 Parallel Log 4.2 . 2381 . . . .
06 Parallel Log 4.3 . . 2084 . . .
06 Parallel Log 4.4 . . . 2073 . .

WHO/BS/09.2124
Page 32
Lab Method Model Transformation Assay T V W X Y Z
06 Parallel Log 4.5 . . . . 1934 .
06 Parallel Log 4.6 . . . . . 2077
18 JP As reported None 1 2835 1980 3011 2971 2937 3036
18 As reported None 2 2658 1887 2848 2835 2823 2851
18 As reported None 3 2495 1750 2797 2784 2725 2916
18 As reported None 4 2583 1772 2759 2721 2739 2797
22 PiCT Parallel None 1 NP 1839 2223 2231 NP 2079
22 Parallel None 2 1763 1813 2106 2009 1775 2003
22 Parallel None 3 1900 1776 2111 2154 1901 2089
22 Parallel None 4 1706 1749 2036 2097 1827 1998
30 A/Xa P © As reported None 1 2148 2029 2177 2858 2095 2422
30 As reported None 2 1577 1811 1886 2229 1777 2013
30 As reported None 3 1836 1990 2414 2084 1974 2803
30 As reported None 4 2039 1721 2018 2259 2081 1962
34 TT As reported None 1 1671 1674 1960 2164 1751 1910
34 As reported None 2 1757 1932 2190 2230 1751 1910
34 As reported None 3 1823 1916 2310 2424 1958 2145
34 As reported None 4 1740 1806 2163 2291 1823 1990
34 A/Xa P CL Slope Log 1 2071 2201 2209 2257 1930 NL
34 Slope Log 2 1937 2135 2176 2105 1803 2105
34 Slope Log 3 1863 NL NL 2099 NL 2145
34 Slope Log 4 1918 2098 1972 1865 1892 1994
34 A/Xa P CH Slope None 1 1904 NL 2126 2200 1992 2101
34 Slope None 2 1961 1712 2172 2239 1978 2028
34 Slope None 3 NI 1747 2185 2217 NI 2158
34 Slope None 4 NI 1809 2162 2217 2026 NI
Deviations from model
p<0.01, not included in analysis NL = Non-linear
0.01<p<0.05, included in analysis NP = Non-parallel; NI = Significant
intersection difference
A/IIa P: Anti-IIa chromogenic assay with plasma
A/Xa P CH: Anti-Xa chromogenic assay with plasma
A/Xa P:CL: Anti-Xa clotting assay with plasma
TT: Thrombin Time
CP: Chinese Pharmacopoeial Assay
JP: Japanese Pharmacopoeial Assay
PiCT: Prothrombinase induced Clotting Time
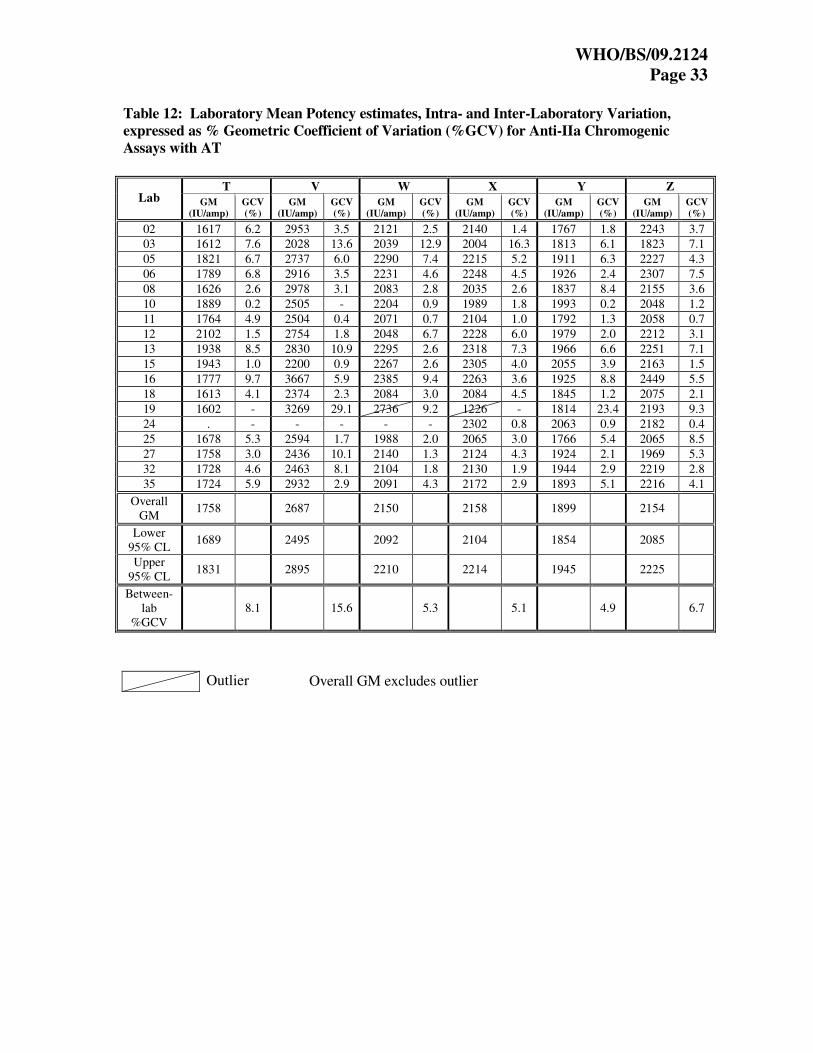
WHO/BS/09.2124
Page 33
Table 12: Laboratory Mean Potency estimates, Intra- and Inter-Laboratory Variation,
expressed as % Geometric Coefficient of Variation (%GCV) for Anti-IIa Chromogenic
Assays with AT
T V W X Y Z Lab GM
(IU/amp)
GCV
(%)
GM
(IU/amp)
GCV
(%)
GM
(IU/amp)
GCV
(%)
GM
(IU/amp)
GCV
(%)
GM
(IU/amp)
GCV
(%)
GM
(IU/amp)
GCV
(%)
02 1617 6.2 2953 3.5 2121 2.5 2140 1.4 1767 1.8 2243 3.7
03 1612 7.6 2028 13.6 2039 12.9 2004 16.3 1813 6.1 1823 7.1
05 1821 6.7 2737 6.0 2290 7.4 2215 5.2 1911 6.3 2227 4.3
06 1789 6.8 2916 3.5 2231 4.6 2248 4.5 1926 2.4 2307 7.5
08 1626 2.6 2978 3.1 2083 2.8 2035 2.6 1837 8.4 2155 3.6
10 1889 0.2 2505 - 2204 0.9 1989 1.8 1993 0.2 2048 1.2
11 1764 4.9 2504 0.4 2071 0.7 2104 1.0 1792 1.3 2058 0.7
12 2102 1.5 2754 1.8 2048 6.7 2228 6.0 1979 2.0 2212 3.1
13 1938 8.5 2830 10.9 2295 2.6 2318 7.3 1966 6.6 2251 7.1
15 1943 1.0 2200 0.9 2267 2.6 2305 4.0 2055 3.9 2163 1.5
16 1777 9.7 3667 5.9 2385 9.4 2263 3.6 1925 8.8 2449 5.5
18 1613 4.1 2374 2.3 2084 3.0 2084 4.5 1845 1.2 2075 2.1
19 1602 - 3269 29.1 2736 9.2 1226 - 1814 23.4 2193 9.3
24 . - - - - - 2302 0.8 2063 0.9 2182 0.4
25 1678 5.3 2594 1.7 1988 2.0 2065 3.0 1766 5.4 2065 8.5
27 1758 3.0 2436 10.1 2140 1.3 2124 4.3 1924 2.1 1969 5.3
32 1728 4.6 2463 8.1 2104 1.8 2130 1.9 1944 2.9 2219 2.8
35 1724 5.9 2932 2.9 2091 4.3 2172 2.9 1893 5.1 2216 4.1
Overall
GM 1758 2687 2150 2158 1899 2154
Lower
95% CL 1689 2495 2092 2104 1854 2085
Upper
95% CL 1831 2895 2210 2214 1945 2225
Between-
lab
%GCV
8.1 15.6 5.3 5.1 4.9 6.7
Overall GM excludes outlier
Outlier

WHO/BS/09.2124
Page 34
Table 13: Laboratory Mean Potency estimates, Intra- and Inter-Laboratory Variation,
expressed as % Geometric Coefficient of Variation (%GCV) for Anti-Xa Chromogenic
Assays with AT
T V W X Y Z
Lab GM
(IU/amp)
GCV
(%)
GM
(IU/amp)
GCV
(%)
GM
(IU/amp)
GCV
(%)
GM
(IU/amp)
GCV
(%)
GM
(IU/amp)
GCV
(%)
GM
(IU/amp)
GCV
(%)
02 1710 4.4 2698 1.6 2168 0.3 2105 2.8 1750 2.2 2129 2.9
03 1600 0.4 - - 1985 3.0 1880 14.4 1681 - 1917 -
05 1643 2.3 3135 0.8 2113 1.8 2045 3.7 1704 1.0 2195 1.5
06 1853 5.6 2667 4.8 2198 3.8 2249 3.5 1915 3.1 2239 4.7
07 1711 6.9 2369 6.4 2123 3.4 2147 8.8 1754 2.1 2191 4.8
08a 1762 2.4 2363 4.6 2159 2.6 2186 6.2 1845 2.2 2084 1.2
08b 1843 2.7 1929 11.8 2078 4.5 2126 2.3 1943 5.3 2032 2.9
10 1862 0.5 2587 1.4 2257 2.2 2034 - 1977 0.7 2141 0.5
11 1755 3.5 2685 2.7 2129 1.3 2114 0.9 1773 1.8 2122 1.6
12 2146 1.2 2421 2.7 2133 2.3 2291 0.8 2021 0.6 2085 2.4
13 1881 7.4 2428 7.8 2244 8.3 2283 7.3 2018 6.7 2220 7.3
15 2051 4.0 2204 0.1 2334 2.7 2368 3.8 2100 3.2 2209 3.9
16 1996 13.3 2010 20.8 2166 21.3 2259 10.9 2033 9.7 1926 6.1
18 1804 2.5 2001 5.4 2079 1.1 2136 0.6 1901 5.0 2053 2.3
19 1787 8.0 2565 11.1 2217 5.0 2225 7.8 1953 11.1 2138 5.5
22 1791 0.5 1860 1.1 2021 0.9 2159 0.5 1912 0.7 1923 1.2
23 1644 4.0 2939 2.8 2165 1.6 2086 1.3 1751 4.5 2156 1.8
25 1723 2.9 2450 4.3 2119 3.4 2039 5.1 1887 6.8 2135 2.6
27 1851 4.6 2205 4.0 2175 1.5 2139 2.2 1960 3.1 2056 1.2
32 1818 3.8 2116 4.1 2113 1.6 2198 2.0 1956 2.8 2079 4.0
33 1705 4.3 2072 4.2 2125 6.1 2133 3.9 1922 5.6 2035 5.3
35 1996 5.6 2032 6.5 2186 3.8 2225 2.1 2010 9.8 2156 5.6
36 2001 3.8 1640 26.4 2730 14.1 2334 11.2 2216 8.4 2255 10.4
Overall GM 1818 2308 2148 2161 1908 2105
Lower 95%
CL 1760 2151 2114 2113 1852 2063
Upper 95%
CL 1879 2476 2182 2210 1966 2148
Between-lab
% GCV 7.8 17.2 3.6 5.3 7.2 4.8
Overall GM excludes outlier Outlier

WHO/BS/09.2124
Page 35
Table 14: Laboratory Mean Potency estimates, Intra- and Inter-Laboratory Variation,
expressed as % Geometric Coefficient of Variation (%GCV) for the European
Pharmacopoeial Assay
T V W X Y Z Lab
GM
(IU/amp)
GCV
(%)
GM
(IU/amp)
GCV
(%)
GM
(IU/amp)
GCV
(%)
GM
(IU/amp)
GCV
(%)
GM
(IU/amp)
GCV
(%)
GM
(IU/amp)
GCV
(%)
01 1824 2.8 2054 2.4 2140 3.9 2180 1.7 1932 1.0 2070 1.7
06 1894 1.8 2499 1.5 2198 1.6 2173 2.7 2011 3.9 2059 0.7
07 1884 1.7 1819 1.9 2177 1.8 2181 0.7 1954 0.7 2029 0.7
08 1803 4.6 1825 3.4 2112 1.1 2135 2.8 1855 5.3 1988 4.9
09 1915 0.2 - - 2120 1.0 2123 1.4 2065 0.8 2081 0.9
13 1934 5.6 2526 1.5 2161 1.9 2141 1.3 2029 3.3 2105 3.1
17 1763 1.8 2030 1.0 2104 0.7 2106 0.3 1846 1.7 2002 0.3
18 1746 9.7 1957 3.3 2058 1.3 2112 0.2 1831 1.4 1937 1.4
21 1869 5.6 1769 2.1 2110 4.6 2254 2.8 2030 2.9 1981 7.1
25 1802 1.8 1758 0.6 2085 1.1 2077 3.7 1910 - 1956 -
27 1942 5.3 1914 4.3 2249 1.2 2296 0.1 2049 3.9 2118 3.1
31 1835 1.9 1885 2.3 2134 3.0 2132 2.7 1927 3.1 2093 4.1
Overall GM
1850 1988 2137 2158 1952 2034
Lower
95% CL 1808 1826 2104 2119 1899 1996
Upper
95% CL 1892 2164 2170 2198 2005 2073
Between-lab
% GCV
3.6 13.5 2.5 2.9 4.4 3.1

WHO/BS/09.2124
Page 36
Table 15: Laboratory Mean Potency estimates, Intra- and Inter-Laboratory Variation,
expressed as % Geometric Coefficient of Variation (%GCV) for the US Pharmacopoeial
Assay
T V W X Y Z
Lab GM
(IU/amp)
GCV
(%)
GM
(IU/amp)
GCV
(%)
GM
(IU/amp)
GCV
(%)
GM
(IU/amp)
GCV
(%)
GM
(IU/amp)
GCV
(%)
GM
(IU/amp)
GCV
(%)
06 1960 0.6 1844 2.9 2138 0.4 2146 1.7 2014 1.7 2020 0.8
10 2003 1.6 2088 0.0 2045 1.4 2017 1.4 2104 0.9 2024 0.7
12 1930 1.7 1752 1.7 2176 2.6 2179 2.1 2055 1.7 2069 1.5
18 1867 2.9 1738 3.8 2180 1.0 2215 1.8 2025 0.6 2029 3.9
19 1857 8.5 1773 5.9 2250 3.8 2133 7.9 1915 11.5 2030 3.1
24 1999 1.1 1819 1.0 2247 0.5 2237 0.2 2030 1.2 2036 1.2
25 1859 1.9 1779 3.4 2138 2.1 2127 3.5 1959 3.4 1989 3.0
26 2006 0.6 1917 1.2 2210 0.0 2182 2.6 2043 2.5 2043 1.5
28 1939 0.0 1791 1.6 2219 2.0 2158 4.5 2097 1.3 2086 1.5
Overall
GM 1935 1831 2177 2154 2026 2036
Lower 95% CL
1887 1751 2128 2105 1980 2015
Upper 95% CL
1983 1913 2228 2204 2073 2058
Between-lab
%GCV
3.3 5.9 3.1 3.0 3.0 1.4

WHO/BS/09.2124
Page 37
Table 16: Laboratory Mean Potency estimates, Intra- and Inter-Laboratory Variation,
expressed as % Geometric Coefficient of Variation (%GCV) for the APTT
T V W X Y Z
Lab GM
(IU/amp)
GCV
(%)
GM
(IU/amp)
GCV
(%)
GM
(IU/amp)
GCV
(%)
GM
(IU/amp)
GCV
(%)
GM
(IU/amp)
GCV
(%)
GM
(IU/amp)
GCV
(%)
03 1559 8.6 2132 3.1 2063 1.6 1981 6.1 1713 0.2 1780 5.2
05 1849 4.0 1709 0.8 2082 1.7 2189 3.0 1957 3.3 1952 3.6
08 1788 0.2 1880 1.9 2175 3.2 2212 3.4 1941 5.1 2031 3.2
10 1871 1.9 2405 0.7 2214 1.8 1943 1.1 1935 0.7 1979 2.3
13 1817 3.4 1982 2.5 2215 1.6 2228 2.2 1988 3.2 2095 2.9
16 1883 5.0 1905 2226 1.6 2308 2.8 1998 2.9 2045 3.8
22 1789 2.1 1794 2.6 2057 3.4 2174 3.0 1911 3.2 1942 1.7
28 1804 2.5 1905 1.5 2105 0.1 2180 2.5 1945 1.1 2022 1.0
29 1880 5.2 1797 11.8 2134 4.8 2096 8.5 1930 7.0 1967 4.0
34a 1738 2.1 2217 8.3 2187 1.5 2219 2.5 1810 2.3 2087 3.7
34b 1850 1.8 1909 5.6 2207 1.8 2258 2.1 1941 3.1 2060 2.0
36 1849 1.9 1588 30.7 2072 3.7 2066 18.2 2010 9.9 2031 10.6
Overall GM
1828 1924 2144 2152 1922 1997
Lower
95% CL 1798 1789 2102 2081 1867 1942
Upper
95% CL 1859 2068 2186 2225 1977 2054
Between-
lab
%GCV
2.5
12.1
3.1
5.4
4.6 4.5
Overall GM excludes outlier
Table 17: Laboratory Mean Potency estimates, Intra- Laboratory Variation, expressed as %
Geometric Coefficient of Variation (%GCV) for Anti-Xa chromogenic assay with plasma
(A/Xa P)
T V W X Y Z
Lab GM
(IU/amp)
GCV
(%)
GM
(IU/amp)
GCV
(%)
GM
(IU/amp)
GCV
(%)
GM
(IU/amp)
GCV
(%)
GM
(IU/amp)
GCV
(%)
GM
(IU/amp)
GCV
(%)
03 1661 3.5 2332 5.2 2043 4.4 1913 12.5 1760 5.6 1863 1.2
30 1887 14.6 1883 8.1 2115 11.2 2340 14.8 1978 7.9 2276 18.3
34e 1932 2.1 1756 2.8 2161 1.2 2218 0.7 1999 1.2 2095 3.2
Overall
GM 1827 2112 2091 2103 1869 2066
Lower
95% CL 1491 1372 1964 1661 1604 1616
Upper
95% CL 2228 2845 2258 2780 2273 2654
Between-
lab
%GCV
8.5 15.9 2.9 11.0 7.3 10.6
Outlier

WHO/BS/09.2124
Page 38
Table 18: Laboratory Mean Potency estimates, Intra- Laboratory Variation, expressed as %
Geometric Coefficient of Variation (%GCV) for Thrombin Time (TT)
T V W X Y Z
Lab GM
(IU/amp)
GCV
(%)
GM
(IU/amp)
GCV
(%)
GM
(IU/amp)
GCV
(%)
GM
(IU/amp)
GCV
(%)
GM
(IU/amp)
GCV
(%)
GM
(IU/amp)
GCV
(%)
03 1813 1.7 1600 5.6 2087 3.6 1657 - 1820 3.9 1930 2.9
34 1747 3.6 1829 6.8 2152 7.1 2275 4.9 1819 5.4 1986 5.6
Overall
GM 1780 1711 2119 2275 1820 1958
Overall GM excludes outlier
Table 19: Laboratory Mean Potency estimates, Intra- Laboratory Variation, expressed as %
Geometric Coefficient of Variation (%GCV) for Anti-IIa chromogenic assay with plasma
(A/IIa P), Chinese Pharmacopoeial Assay (CP), Japanese Pharmacopoeial Assay (JP),
Prothrombinase induced Clotting time (PiCT) and Anti-Xa Clotting assay (A/Xa Cl.
T V W X Y Z Lab
Method
GM
(IU/amp)
GCV
(%)
GM
(IU/amp)
GCV
(%)
GM
(IU/amp)
GCV
(%)
GM
(IU/amp)
GCV
(%)
GM
(IU/amp)
GCV
(%)
GM
(IU/amp)
GCV
(%)
03 A/IIa P 1790 14.6 2316 8.3 2088 7.1 2189 19.3 2038 16.5 2086 18.4
06 CP 1830 5.0 2386 0.9 2074 2.3 2024 1.7 1983 2.2 1995 3.6
18 JP 2640 5.6 1845 5.9 2852 3.9 2826 3.8 2805 3.5 2899 3.6
22 PiCT 1788 5.7 1794 2.2 2118 3.7 2121 4.5 1834 3.5 2042 2.4
34d A/Xa
Cl 1946 4.6 2144 2.5 2116 6.4 2077 8.2 1874 3.6 2080 3.9
Overall GM exclude outlier
Table 20: Summary of Intra-Laboratory Variability by Different Assay Methods, Expressed
as the Number of GCVs Less than 5, 7 and 10%
No of GCV/total number of GCV
Intra-lab
variability
(GCV) Anti-IIa
AT
Anti-Xa
AT EP USP APTT
Anti-Xa
Plasma
Thrombi
n Time
Anti-IIa
Plasma CP PiCT
<5% 63/102 99/139 63/69 50/54 57/71 9/18 6/11 0/6 6/6 5/6
<7% 84/102 117/139 67/69 51/54 63/71 11/18 10/11 0/6 - 6/6
<10% 95/102 128/139 69/69 53/54 67/71 13/18 11/11 2/6 - -
>10% 7/102 11/139 - 1/54 4/71 5/18 - 4/6 - -
Range (% GCV)
0.2 – 29.1 0.1 – 26.4 0.1 – 9.7 0.0 – 11.5 0.1 – 30.7 1.2 – 18.3 1.7 – 7.1 8.3 – 19.3 0.9 – 5.0 2.2 – 5.7
Outlier
Outlier

WHO/BS/09.2124
Page 39
Table 21: Summary of Potency Estimates Relative to the 5th International Standard for
Unfractionated Heparin and Inter-Laboratory Variation expressed as Geometric Coefficient
of Variation (% GCV) by Different Assay Methods
T V W X Y Z Method
GM
(IU/amp)
GCV
(%)
GM
(IU/amp)
GCV
(%)
GM
(IU/amp)
GCV
(%)
GM
(IU/amp)
GCV
(%)
GM
(IU/amp)
GCV
(%)
GM
(IU/amp)
GCV
(%)
Anti-IIa AT
n = 18 1758 8.1 2687 15.6 2150 5.3 2158 5.1 1899 4.9 2154 6.7
Anti-Xa AT
n = 23 1823 7.8 2280 18.0 2149 3.5 2163 5.2 1912 7.1 2105 4.7
EP
n = 12 1850 3.6 1988 13.5 2137 2.5 2158 2.9 1952 4.4 2034 3.1
USP
n = 9 1935 3.3 1831 5.9 2177 3.1 2154 3.0 2026 3.0 2036 1.4
APTT
n = 12 1828 2.5 1924 12.1 2144 3.1 2152 5.4 1922 4.6 1997 4.5
Anti-Xa P
CH
n = 3
1827 8.5 2112 15.9 2091 2.9 2103 11.0 1869 7.3 2066 10.6
Thrombin
Time
n = 2
1780 2.7 1711 9.9 2119 2.2 2275 - 1820 0.1 1958 2.1
CP
n = 1 1830 - 2386 - 2074 - 2024 - 1983 - 1995 -
PiCT
n = 1 1788 - 1794 - 2118 - 2121 - 1834 - 2042 -
JP
n = 1 - - 1845 - - - - - - - - -
A/Xa P Cl
n = 1 1946 4.6 2144 2.5 2116 6.4 2077 8.2 1874 3.6 2080 3.9
A/Xa P CH: anti-Xa plasma chromogenic assay; A/Xa P Cl: anti-Xa clotting assay
Table 22:
Overall Potency Estimates and Inter-laboratory Variation Expressed as % Geometric
Coefficient of Variation (%GCV) Relative to the 5th International Standard for
Unfractionated Heparin
ALL METHODS T V W X Y Z
Overall GM 1824 2172 2145 2156 1926 2074
Lower 95% CL 1799 2084 2128 2134 1903 2050
Upper 95% CL 1850 2265 2161 2178 1949 2099
Between-lab %GCV 6.6 20.7 3.6 4.8 5.7 5.5

WHO/BS/09.2124
Page 40
Table 23: Overall Potency Estimates and Inter-laboratory Variation Expressed as %
Geometric Coefficient of Variation (%GCV) Relative to Candidate T, Assuming an Assigned
Potency of 1824 IU/ampoule
ALL METHODS T V W X Y Z
Overall GM - 2175 2144 2152 1927 2077
Lower 95% CL - 2070 2117 2126 1911 2041
Upper 95% CL - 2285 2172 2179 1942 2113
Between-lab %GCV - 24.8 6.0 5.7 3.8 8.2
Table 24: Overall Potency Estimates and Inter-laboratory Variation Expressed as %
Geometric Coefficient of Variation (%GCV) Relative to Candidate V, Assuming an Assigned
Potency of 2172 IU/ampoule
ALL METHODS T V W X Y Z
Overall GM 1822 - 2146 2156 1921 2070
Lower 95% CL 1734 - 2061 2064 1832 1996
Upper 95% CL 1914 - 2234 2252 2015 2147
Between-lab %GCV 24.8 - 19.6 21.4 23.9 17.8
Table 25: Overall Potency Estimates and Inter-laboratory Variation Expressed as %
Geometric Coefficient of Variation (%GCV) Relative to Candidate W, Assuming an
Assigned Potency of 2145 IU/ampoule
ALL METHODS T V W X Y Z
Overall GM 1825 2171 - 2152 1922 2070
Lower 95% CL 1801 2085 - 2133 1901 2049
Upper 95% CL 1848 2261 - 2171 1944 2091
Between-lab %GCV 6.0 19.6 - 4.0 5.0 4.7

WHO/BS/09.2124
Page 41
Table 26: Overall Potency Estimates and Inter-laboratory Variation Expressed as %
Geometric Coefficient of Variation (%GCV) Relative to Candidate X, Assuming an Assigned
Potency of 2156 IU/ampoule
ALL METHODS T V W X Y Z
Overall GM 1827 2172 2149 - 1929 2075
Lower 95% CL 1804 2079 2131 - 1908 2052
Upper 95% CL 1850 2269 2168 - 1950 2098
Between-lab %GCV 5.7 21.4 4.0 - 5.1 5.2
Table 27: Overall Potency Estimates and Inter-laboratory Variation Expressed as %
Geometric Coefficient of Variation (%GCV) Relative to Candidate Y, Assuming an Assigned
Potency of 1926 IU/ampoule
ALL METHODS T V W X Y Z
Overall GM 1824 2177 2149 2153 - 2075
Lower 95% CL 1809 2076 2126 2130 - 2044
Upper 95% CL 1838 2284 2173 2177 - 2106
Between-lab %GCV 3.8 23.9 5.0 5.1 - 7.2
Table 28: Overall Potency Estimates and Inter-laboratory Variation Expressed as %
Geometric Coefficient of Variation (%GCV) Relative to Candidate Z, Assuming an Assigned
Potencyof 2074 IU/ampoule
ALL METHODS T V W X Y Z
Overall GM 1822 2176 2149 2155 1925 -
Lower 95% CL 1790 2098 2128 2131 1896 -
Upper 95% CL 1854 2256 2171 2179 1955 -
Between-lab %GCV 8.2 17.8 4.7 5.2 7.2 -

WHO/BS/09.2124
Page 42
Table 29: Summary of Overall Potency Estimates Using Each Candidate as the Putative
Standard
Potency Estimates (IU/ampoule) Putative
standard T V W X Y Z
5thIS 1824 2172 2145 2156 1926 2074
T - 2175 2144 2152 1927 2077
V 1822 - 2146 2156 1921 2070
W 1825 2171 - 2152 1922 2070
X 1827 2172 2149 - 1929 2075
Y 1824 2177 2149 2153 - 2075
Z 1822 2176 2149 2155 1925 -
Table 30: Summary of Inter-Laboratory Variation Expressed as % Geometric Coefficient of
Variation (GCV) Using Each Candidate as the Putative Standard
GCV Putative
standard T V W X Y Z
5thIS 6.6% 20.7% 3.6% 4.8% 5.7% 5.5%
T . 24.8% 6.0% 5.7% 3.8% 8.2%
V 24.8% . 19.6% 21.4% 23.9% 17.8%
W 6.0% 19.6% . 4.0% 5.0% 4.7%
X 5.7% 21.4% 4.0% . 5.1% 5.2%
Y 3.8% 23.9% 5.0% 5.1% . 7.2%
Z 8.2% 17.8% 4.7% 5.2% 7.2% .

WHO/BS/09.2124
Page 43
Table 31: USP sheep plasma clot based assays - Intra-laboratory variation (% GCV) based
on laboratories’ own potency estimates
Lab T V W X Y Z
06 0.6 2.9 0.4 1.7 1.7 0.8
10 1.6 0.0 1.4 1.4 0.9 0.7
12 1.7 1.7 2.6 2.1 1.7 1.5
18 2.9 3.8 1.0 1.8 0.6 3.9
19 8.5 5.9 3.8 7.9 11.5 3.1
24 1.1 1.0 0.5 0.2 1.2 1.2
25 1.9 3.4 2.1 3.5 3.4 3.0
26 0.6 1.2 0.0 2.6 2.5 1.5
28 0.0 1.6 2.0 4.5 1.3 1.5
Table 32: USP aIIa:AT Method: Intra-Laboratory Variation (%GCV)
Lab T V W X Y Z
02 6.2 3.5 2.5 1.4 1.8 3.7
03 7.6 13.6 12.9 16.3 6.1 7.1
06 6.8 3.5 4.6 4.5 2.4 7.5
08 2.6 3.1 2.8 2.6 8.4 3.6
12 1.5 1.8 6.7 6.0 2.0 3.1
13 8.5 10.9 2.6 7.3 6.6 7.1
19 . 29.1 9.2 . 23.4 9.3
25 5.3 1.7 2.0 3.0 5.4 8.5
32 4.6 8.1 1.8 1.9 2.9 2.8
Table 33: Other antithrombin dependent anti-IIa chromogenic methods - Intra-Laboratory
Variation (%GCV)
Lab T V W X Y Z
05 6.7 6.0 7.4 5.2 6.3 4.3
10 0.2 . 0.9 1.8 0.2 1.2
11 4.9 0.4 0.7 1.0 1.3 0.7
15 1.0 0.9 2.6 4.0 3.9 1.5
16 9.7 5.9 9.4 3.6 8.8 5.5
18 4.1 2.3 3.0 4.5 1.2 2.1
24 . . . 0.8 0.9 0.4
27 3.0 10.1 1.3 4.3 2.1 5.3
35 5.9 2.9 4.3 2.9 5.1 4.1

WHO/BS/09.2124
Page 44
Table 34: USP aXa:AT Method: Intra-Laboratory Variation (%GCV)
Lab T V W X Y Z
02 4.4 1.6 0.3 2.8 2.2 2.9
03 0.4 - 3.0 14.4 - -
06 5.6 4.8 3.8 3.5 3.1 4.7
08b 2.4 4.6 2.6 6.2 2.2 1.2
12 1.2 2.7 2.3 0.8 0.6 2.4
13 7.4 7.8 8.3 7.3 6.7 7.3
19 8.0 11.1 5.0 7.8 11.1 5.5
25 2.9 4.3 3.4 5.1 6.8 2.6
32 3.8 4.1 1.6 2.0 2.8 4.0
Table 35: Other antithrombin dependent anti-Xa chromogenic methods - Intra-Laboratory
Variation (%GCV)
Lab T V W X Y Z
05 2.3 0.8 1.8 3.7 1.0 1.5
07 6.9 6.4 3.4 8.8 2.1 4.8
08e 2.7 11.8 4.5 2.3 5.3 2.9
10 0.5 1.4 2.2 - 0.7 0.5
11 3.5 2.7 1.3 0.9 1.8 1.6
15 4.0 0.1 2.7 3.8 3.2 3.9
16 13.3 20.8 21.3 10.9 9.7 6.1
18 2.5 5.4 1.1 0.6 5.0 2.3
22 0.5 1.1 0.9 0.5 0.7 1.2
23 4.0 2.8 1.6 1.3 4.5 1.8
27 4.6 4.0 1.5 2.2 3.1 1.2
33 4.3 4.2 6.1 3.9 5.6 5.3
35 5.6 6.5 3.8 2.1 9.8 5.6
36 3.8 26.4 - 11.2 8.4 10.4
Table 36: Intra-Laboratory Variation - Comparison of anti-IIa chromogenic methods.
<5% <7% <10%
USP aIIa:AT
Other
methods USP aIIa:AT
Other
methods USP aIIa:AT
Other
methods
No of GCVs 27/52 36/50 44/52 40/50 46/52 49/50
% of GCVs 52 72 85 80 88 98
For the USP aIIa:AT method: 3 GCVs 10 - 15%; 3 GCVs >15%
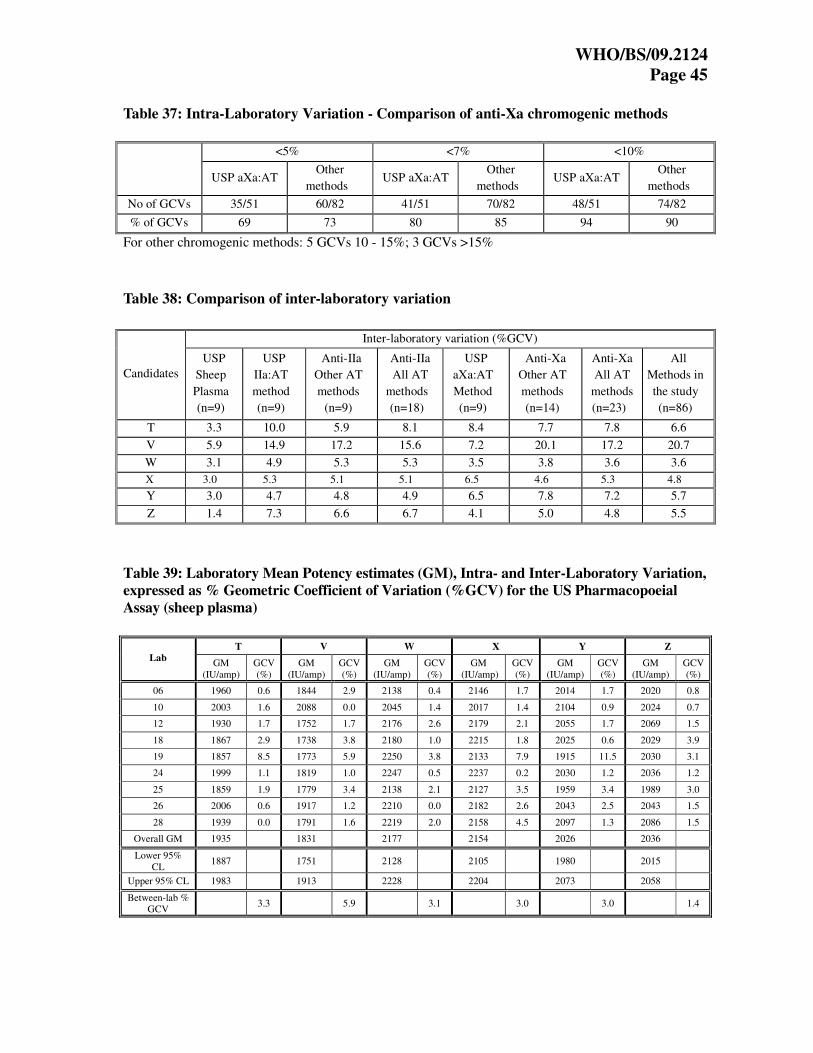
WHO/BS/09.2124
Page 45
Table 37: Intra-Laboratory Variation - Comparison of anti-Xa chromogenic methods
<5% <7% <10%
USP aXa:AT
Other
methods USP aXa:AT
Other
methods USP aXa:AT
Other
methods
No of GCVs 35/51 60/82 41/51 70/82 48/51 74/82
% of GCVs 69 73 80 85 94 90
For other chromogenic methods: 5 GCVs 10 - 15%; 3 GCVs >15%
Table 38: Comparison of inter-laboratory variation
Inter-laboratory variation (%GCV)
Candidates
USP
Sheep
Plasma
(n=9)
USP
IIa:AT
method
(n=9)
Anti-IIa
Other AT
methods
(n=9)
Anti-IIa
All AT
methods
(n=18)
USP
aXa:AT
Method
(n=9)
Anti-Xa
Other AT
methods
(n=14)
Anti-Xa
All AT
methods
(n=23)
All
Methods in
the study
(n=86)
T 3.3 10.0 5.9 8.1 8.4 7.7 7.8 6.6
V 5.9 14.9 17.2 15.6 7.2 20.1 17.2 20.7
W 3.1 4.9 5.3 5.3 3.5 3.8 3.6 3.6
X 3.0 5.3 5.1 5.1 6.5 4.6 5.3 4.8
Y 3.0 4.7 4.8 4.9 6.5 7.8 7.2 5.7
Z 1.4 7.3 6.6 6.7 4.1 5.0 4.8 5.5
Table 39: Laboratory Mean Potency estimates (GM), Intra- and Inter-Laboratory Variation,
expressed as % Geometric Coefficient of Variation (%GCV) for the US Pharmacopoeial
Assay (sheep plasma)
T V W X Y Z
Lab GM
(IU/amp)
GCV
(%)
GM
(IU/amp)
GCV
(%)
GM
(IU/amp)
GCV
(%)
GM
(IU/amp)
GCV
(%)
GM
(IU/amp)
GCV
(%)
GM
(IU/amp)
GCV
(%)
06 1960 0.6 1844 2.9 2138 0.4 2146 1.7 2014 1.7 2020 0.8
10 2003 1.6 2088 0.0 2045 1.4 2017 1.4 2104 0.9 2024 0.7
12 1930 1.7 1752 1.7 2176 2.6 2179 2.1 2055 1.7 2069 1.5
18 1867 2.9 1738 3.8 2180 1.0 2215 1.8 2025 0.6 2029 3.9
19 1857 8.5 1773 5.9 2250 3.8 2133 7.9 1915 11.5 2030 3.1
24 1999 1.1 1819 1.0 2247 0.5 2237 0.2 2030 1.2 2036 1.2
25 1859 1.9 1779 3.4 2138 2.1 2127 3.5 1959 3.4 1989 3.0
26 2006 0.6 1917 1.2 2210 0.0 2182 2.6 2043 2.5 2043 1.5
28 1939 0.0 1791 1.6 2219 2.0 2158 4.5 2097 1.3 2086 1.5
Overall GM 1935 1831 2177 2154 2026 2036
Lower 95%
CL 1887 1751 2128 2105 1980 2015
Upper 95% CL 1983 1913 2228 2204 2073 2058
Between-lab % GCV
3.3 5.9 3.1 3.0 3.0 1.4

WHO/BS/09.2124
Page 46
Table 40: Laboratory Mean Potency estimates (GM), Intra- and Inter-Laboratory
Variation, expressed as % Geometric Coefficient of Variation (%GCV) for USP aIIa:AT
Outlier
Overall GM excludes outlier
Table 41: Laboratory Mean Potency estimates (GM), Intra- and Inter-Laboratory
Variation, expressed as % Geometric Coefficient of Variation (%GCV) for USP aXa:AT
T V W X Y Z
Lab GM
(IU/amp)
GCV
(%)
GM
(IU/amp)
GCV
(%)
GM
(IU/amp)
GCV
(%)
GM
(IU/amp)
GCV
(%)
GM
(IU/amp)
GCV
(%)
GM
(IU/amp)
GCV
(%)
02 1710 4.4 2698 1.6 2168 0.3 2105 2.8 1750 2.2 2129 2.9
03 1600 0.4 - - 1985 3.0 1880 14.4 1681 - 1917 -
06 1853 5.6 2667 4.8 2198 3.8 2249 3.5 1915 3.1 2239 4.7
08b 1762 2.4 2363 4.6 2159 2.6 2186 6.2 1845 2.2 2084 1.2
12 2146 1.2 2421 2.7 2133 2.3 2291 0.8 2021 0.6 2085 2.4
13 1881 7.4 2428 7.8 2244 8.3 2283 7.3 2018 6.7 2220 7.3
19 1787 8.0 2565 11.1 2217 5.0 2225 7.8 1953 11.1 2138 5.5
25 1723 2.9 2450 4.3 2119 3.4 2039 5.1 1887 6.8 2135 2.6
32 1818 3.8 2116 4.1 2113 1.6 2198 2.0 1956 2.8 2079 4.0
Overall GM 1804 2457 2147 2158 1889 2112
Lower 95%
CL 1694 2304 2089 2055 1800 2040
Upper 95%
CL 1920 2620 2207 2267 1982 2186
Between- lab % GCV
8.5 8.0 3.7 6.6 6.5 4.6
T V W X Y Z
Lab GM (IU/amp)
GCV (%)
GM (IU/amp)
GCV (%)
GM (IU/amp)
GCV (%)
GM (IU/amp)
GCV (%)
GM (IU/amp)
GCV (%)
GM (IU/amp)
GCV (%)
02 1617 6.2 2953 3.5 2121 2.5 2140 1.4 1767 1.8 2243 3.7
03 1612 7.6 2028 13.6 2039 12.9 2004 16.3 1813 6.1 1823 7.1
06 1789 6.8 2916 3.5 2231 4.6 2248 4.5 1926 2.4 2307 7.5
08 1626 2.6 2978 3.1 2083 2.8 2035 2.6 1837 8.4 2155 3.6
12 2102 1.5 2754 1.8 2048 6.7 2228 6.0 1979 2.0 2212 3.1
13 1938 8.5 2830 10.9 2295 2.6 2318 7.3 1966 6.6 2251 7.1
19 1602 - 3269 29.1 2736 9.2 1226 - 1814 23.4 2193 9.3
25 1678 5.3 2594 1.7 1988 2.0 2065 3.0 1766 5.4 2065 8.5
32 1728 4.6 2463 8.1 2104 1.8 2130 1.9 1944 2.9 2219 2.8
Overall
GM 1736 2731 2112 2144 1866 2158
Lower 95%
CL 1614 2456 2029 2053 1802 2045
Upper 95%
CL 1868 3038 2198 2238 1933 2279
Between-lab
%GCV 10.0 14.9 4.9 5.3 4.7 7.3

WHO/BS/09.2124
Page 47
Table 42: A summary of estimated potencies of the candidates by USP sheep plasma, USP
aIIa:AT, other antithrombin dependent anti-IIa chromogenic, all antithrombin dependent
anti-IIa chromogenic, USP aXa:AT, other antithrombin dependent anti-Xa chromogenic
and all antithrombin dependent anti-Xa chromogenic assays relative to the 5th
International Standard for Unfractionated Heparin
Estimated Potency: Geometric Mean IU/ampoule Candidate
USP Sheep
Plasma
(n=9)
Anti-IIa
USP method
(n=9)
Anti-IIa
Other
methods
(n=9)
Anti-IIa
All
methods
(n=18)
Anti-Xa
USP Method
(n=9)
Anti-Xa
Other
methods
(n=14)
Anti-Xa
All methods
(n=23)
T 1935 1736 1784 1758 1804 1828 1818
V 1831 2731 2638 2687 2457 2226 2308
W 2177 2112 2189 2150 2147 2149 2148
X 2154 2144 2171 2158 2158 2163 2161
Y 2026 1866 1932 1899 1889 1920 1908
Z 2036 2158 2150 2154 2112 2101 2105
Table 43: Anti-Xa to anti-IIa ratio of the candidates by USP aIIa:AT and aXa:AT methods
Candidate
Anti-Xa USP
Method IU/ampoule
(n=9)
Anti-IIa USP
Method IU/ampoule
(n=9)
Anti-Xa to anti-IIa
ratio
T 1804 1736 1.04
V 2457 2731 0.89
W 2147 2112 1.02
X 2158 2144 1.01
Y 1889 1866 1.01
Z 2112 2158 0.98

WHO/BS/09.2124
Page 48
Figure 1: Molecular weight distributions of the candidates
Figure 2: 1H NMR spectrum at 500 MHz of candidate T

WHO/BS/09.2124
Page 49
Figure 3: 1H NMR spectrum at 500 MHz of candidate V
Figure 4: 1H NMR spectrum at 500 MHz of candidate W

WHO/BS/09.2124
Page 50
Figure 5: 1H NMR spectrum at 500 MHz of candidate X
Figure 6: 1H NMR spectrum at 500 MHz of candidate Y

WHO/BS/09.2124
Page 51
Figure 7: 1H NMR spectrum at 500 MHz of candidate Z
Nu
mb
er o
f la
bs
0
5
10
15
20
25
30
35
40
Potency (IU/ampoule)
10
00
20
00
30
00
40
00
Method: aIIa aXa APTT EP USP Other
Figure 8: Potency Estimates for Candidate T relative to the 5th IS
Geometric mean potency = 1824 IU/ampoule
Inter-lab GCV = 6.6%
Outlier, Lab 18; JP

WHO/BS/09.2124
Page 52
Nu
mb
er o
f la
bs
0
5
10
15
20
25
30
35
40
Potency (IU/ampoule)
100
0
2000
3000
4000
Method: aIIa aXa APTT EP USP Other
Figure 9: Potency Estimates for Candidate V relative to the 5th IS
Geometric mean potency = 2172 IU/ampoule
Inter-lab GCV = 20.7%
Nu
mb
er o
f la
bs
0
5
10
15
20
25
30
35
40
Potency (IU/ampoule)
10
00
20
00
30
00
40
00
Method: aIIa aXa APTT EP USP Other
Figure 10: Potency Estimates for Candidate W relative to the 5th IS
Geometric mean potency = 2145 IU/ampoule
Inter-lab GCV = 3.6%
Outliers, Lab 19: aIIa;
Lab 36: aXa; Lab 18: JP

WHO/BS/09.2124
Page 53
Nu
mb
er o
f la
bs
0
5
10
15
20
25
30
35
40
Potency (IU/ampoule)
10
00
20
00
30
00
40
00
Method: aIIa aXa APTT EP USP Other
Figure 11: Potency Estimates for Candidate X relative to the 5th IS
Geometric mean potency = 2156 IU/ampoule
Inter-lab GCV = 4.8%
Outlier, Lab 18; JP
Outliers, Lab 19: aIIa;
Lab 03: Thrombin Time
Nu
mb
er o
f la
bs
0
5
10
15
20
25
30
35
40
Potency (IU/ampoule)
100
0
20
00
30
00
40
00
Method: aIIa aXa APTT EP USP Other
Figure 12: Potency Estimates for Candidate Y relative to the 5th IS
Geometric mean potency = 1926 IU/ampoule
Inter-lab GCV = 5.7%
Outlier, Lab 18; JP

WHO/BS/09.2124
Page 54
Nu
mb
er o
f la
bs
0
5
10
15
20
25
30
35
40
Potency (IU/ampoule)
1000
2000
3000
4000
Method: aIIa aXa APTT EP USP Other
Figure 13: Potency Estimates for Candidate Z relative to the 5th IS
Geometric mean potency = 2074 IU/ampoule
Inter-lab GCV = 5.5%
Outlier, Lab 18; JP
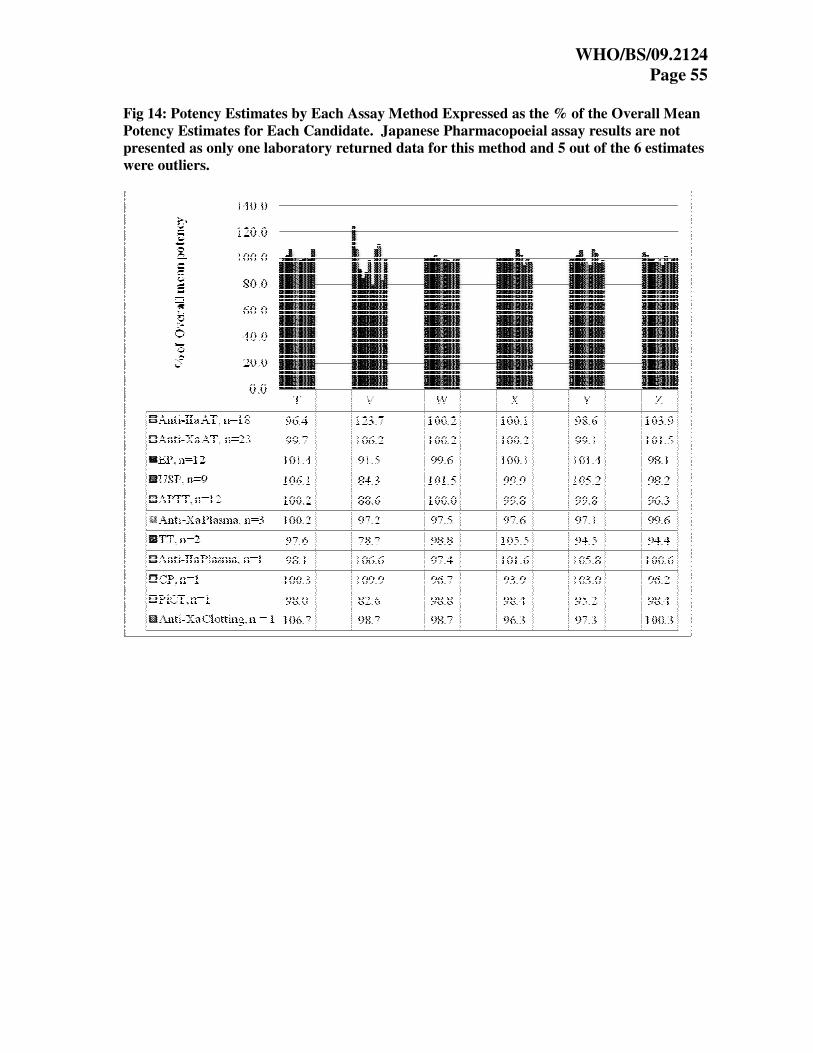
WHO/BS/09.2124
Page 55
Fig 14: Potency Estimates by Each Assay Method Expressed as the % of the Overall Mean
Potency Estimates for Each Candidate. Japanese Pharmacopoeial assay results are not
presented as only one laboratory returned data for this method and 5 out of the 6 estimates
were outliers.

WHO/BS/09.2124
Page 56
Figure 15: Potency estimates by USP current and proposed monograph assay method
expressed as the % of the overall mean potency estimates by all methods in the study for each
candidate

WHO/BS/09.2124
Page 57
Appendix 1: List of Participants
Ginés Diaz and Maria Mercedes Lopez, B Braun Medical S.A., SPAIN
Peter Gärtner, Baxter AG, AUSTRIA
Patrick Shaklee, Biocascade Incorporated, USA
Jesus Cabañas, Bioiberica, S.A, SPAIN
Maik Gehrke and Gerrit Oldekamp, CKW Pharma-Extrakt, GERMANY
Eva Sandberg, Danish Medical Agency, DENMARK
François Nicham and Nathalie Barat, Diagnostic Stago, FRANCE
Guy Rautmann, European Directorate for the Quality of Medicines, FRANCE
C.S. Venkatesan, Gland Pharma Ltd., INDIA
Dean Smith and Hing Chong, Health Canada, CANADA
Luis Soares, Inframed, PORTUGAL
Ljiljana Kudra and Dženita Softić, Institue for Quality Control of Medicines, BOSNIA AND
HERZEGOVINA
Donata Bensi, Laboratori Derivati Organici, ITALY
Pilar Carrasco, Laboratorios Farmacéuticos Povi S.A., SPAIN
Bjørn Fehrmann, LEO Pharma A/S, DENMARK
Oliver Rädler, Merckle GmbH, GERMANY
Fan Huihong and Li Jing, National Institute for the Control of Pharmaceutical & Biological
Products, P.R. CHINA
John Hogwood, National Institute for Biological Standards and Control, UK
Hinrich Nagel, Nordmark Arzeimittel – Quality Control, GERMANY
Peter Bruegger, Novartis Pharma A.G. SWITZERLAND
Bruna Pharma, Opocrin SpA, ITALY
Karin Stoll- Rubin, DSM Nutritional Products Ltd - Branch Pentapharma, SWITZERLAND
Susanne Alban,Pharmazeutisches Institut Alteilung Pharmazeutishce Biologe, GERMANY

WHO/BS/09.2124
Page 58
Thomas Freudemann, Sandoz GmbH, AUSTIA
Cécile Auguste and Céline Houiste, Sanofi-Aventis, FRANCE
Hester Hasper, Schering-Plough, THE NETHERLANDS
Hitendra Mehta and Anisha Akula, Scientific Protein Labs LLC, USA
Wolfgang Klein, Siemens Healthcare Diagnostics Products GmbH, GERMANY
Stephanie Berrier, Stago, FRANCE
Roger Meier, Swissmedic, SWITZERLAND
Barbara Kerbl, Technoclone GmbH, AUSTRIA
Toshimi Murai and Yukari Nakagawa, The Society of Japanese Pharmacopoeia, JAPAN
Chong Loh and Allison Jones, Therapeutic Goods Administration, AUSTRALIA
Sérgio Luiz Dalmora, Universidade Federal de Santa Maria, BRASIL
Michael Ambrose and Jeanne Fringer, US Pharmacopeia, USA

WHO/BS/09.2124
Page 59
Appendix 2a: Methods Used by the Participants
Lab Methods No. Methods
1 EP Assay 1
2 Proposed USP anti-IIa and USP anti-Xa on STA Compact 2
3 NIBSC anti-IIa, Modified NIBSC anti-Xa, in-house anti-IIa and anti-Xa plasma AT, APTT (Pathrombin SL) and Thrombin Time
5
4 EP assay 1
5 LMWH based anti-IIa, LMWH based anti-Xa and APTT 3
6 NIBSC anti-IIa and anti-Xa, EP assay, USP assay and CP assay 5
7 In-house anti-Xa assay on Stago Analyser and EP assay on BCT 2
8 NIBSC anti-IIa and anti-Xa assay on ACL-7000, APTT (APTT-SP) assay, EP assay and Coatest anti-Xa
assay 5
9 EP assay 1
10 In-house anti-IIa and anti-Xa assay, APTT assay and USP assay 4
11 In-house anti-IIa and anti-Xa assay 2
12 NIBSC anti-IIa and anti-Xa assay and USP assay 3
13 NIBSC anti-IIa and anti-Xa assay, APTT (APTT-SP) assay and EP assay using ACL-TOP-500 4
14 APTT Assay 1
15 In-house anti-IIa and anti-Xa assay 2
16 In-house anti-IIa and anti-Xa assay and APTT assay 3
17 EP assay 1
18 EP LMWH anti-IIa and anti-Xa assays, EP assay, USP assay and JP assay 5
19 Proposed USP anti-IIa assay, USP anti-Xa assay and USP assay 3
21 EP assay 1
22 Biophen anti-Xa assay, APTT (Actin-FC) assay and PiCT assay 3
23 Berichrom anti-Xa assay 1
24 Actichrom anti-IIa assay and USP assay 2
25 Proposed USP anti-IIa assay, USP anti-Xa assay, EP assay and USP assay 4
26 USP assay 1
27 Chromogenix’s anti-IIa and anti-Xa kits and EP assay 3
28 APTT (Pathrombin SL) assay and USP assay 2
29 APTT assay 1
30 Comatic plasma AT anti-Xa 1
31 EP assay 1
32 In-house anti-IIa and anti-Xa assays 2
33 Stachrom anti-Xa assay 1
34 Rotachrom anti-Xa assay, Staclot plasma AT anti-Xa, APTT (STA-C.K.Prest and STA-PTTA) assays and thrombin Time
5
35 In-house anti-IIa assay and Coatest anti-Xa 2
36 Coatest anti-Xa assay and APTT (Thrombotest) assay 2
Total 35 Participants returning results 87
NB – Lab 20 withdrew from the study, Lab 4 and 14 not included in analysis due to late return.

WHO/BS/09.2124
Page 60
Appendix 2b: Laboratories using USP Monograph Assay Methods
Assay methods
Lab Anti-IIa
(antithrombin)
Anti-Xa
(antithrombin) Sheep Plasma
Participants
02 USP USP Reagent manufacturer
03 NIBSC NIBSC Clinical Lab
06 NIBSC NIBSC � Pharmacopoeia
08 NIBSC NIBSC Heparin manufacturer
10 � Regulator
12 NIBSC NIBSC � Heparin manufacturer
13 NIBSC NIBSC Regulator
18 � Heparin manufacturer
19 USP USP � Pharmacopoeia
24 � Heparin manufacturer
25 USP USP � Heparin manufacturer
26 � Heparin manufacturer
28 � Heparin manufacturer
32 NIBSC NIBSC Regulator
Appendix 2c: Laboratories using other antithrombin dependent
anti-IIa and anti-Xa assays
Assay methods Lab
Anti-IIa (antithrombin) Anti-Xa (antithrombin)
05 � �
07 �
08 �
10 � �
11 � �
15 � �
16 � �
18 � �
22 �
23 �
24 �
27 � �
33 �
34 �
35 � �
36 �

WHO/BS/09.2124
Page 61
Appendix 3: NIBSC Protocols for Anti-IIa and Anti-Xa
Chromogenic Assay Using Purified Antithrombin
NIBSC Protocol for:
Anti-IIa Antithrombin Dependant Assay for Unfractionated Heparin
Materials:
Buffer - 7.5 mM Na2EDTA, 50 mM Tris(hydroxymethyl)Methylamine, 175 mM NaCl, with either 0.1%
polyethylene glycol 6000 or 2mg/ml albumin (human or bovine). Adjust to pH 8.4 with concentrated hydrochloric
acid
Human Antithrombin – Diluted to 0.125 IU/ml with above buffer
Human Thrombin – Diluted to 5 IU/ml with above buffer
Substrate – Specific for thrombin and diluted to 1.25 mM in water
Method:
Carry out two independent series of 4 dilutions of the standard and the test, within the range 0.005 to 0.05 IU/ml
using the pH 8.4 buffer. The dilutions chosen should give a linear response when the results are analysed as
absorbance against log concentrations. The assay should use a balanced order with 8 tubes for the standard and 8
tubes for the test, and be carried out at 37ºC. Volume (V) can range from 20 to 50µl depending on instrument used.
**Preliminary experiments should be carried out to determine the incubation times that are optimal for the various
stages and the reagents used.
2V Antithrombin (0.125IU/ml)
1V standard/test/buffer
Incubate for at least 1min**
0.5V Thrombin (5IU/ml)
Incubate for at least 1min**
1V substrate (1.25 mM in water)
Kinetic – obtain ∆OD/min at 405nm, no
acetic acid required Endpoint – stop with 2V 50% acetic acid after at
least 1 min** – read at 405nm
Analyse data by parallel line of
slope ratio

WHO/BS/09.2124
Page 62 NIBSC Protocol for:
Anti-Xa Antithrombin Dependant Assay for Unfractionated Heparin
Materials:
Buffer - 7.5 mM Na2EDTA, 50 mM Tris(hydroxymethyl)Methylamine, 175 mM NaCl, with either 0.1%
polyethylene glycol 6000 or 2mg/ml albumin (human or bovine). Adjust to pH 8.4 with concentrated hydrochloric
acid
Human Antithrombin – Diluted to 1 IU/ml with above buffer
Bovine Factor Xa – Diluted with above buffer to a concentration that obtains an OD between 0.65 and 1.25 for a
blank sample
Substrate – Specific for Factor Xa and diluted to 1 mM in water
Method:
Carry out two independent series of 4 dilutions of the standard and the test, within the range 0.007 to 0.07 IU/ml,
using the pH 8.4 buffer. The dilutions chosen should give a linear response when the results are analysed as
absorbance against log concentrations. The assay should use a balanced order with 8 tubes for the standard and 8
tubes for the test, and be carried out at 37ºC. Volume (V) can range from 25 to 50µl depending on instrument used.
1V Antithrombin (1 IU/ml)
1V sample (or buffer)
Incubate for 2min
2V Factor Xa
Incubate for 2min
2V substrate (1 mM in water)
Kinetic – obtain ∆OD/min at
405nm, no acetic acid required Endpoint – stop with 2V 50% acetic
acid after 2 min – read at 405nm
Analyse data by parallel line
or slope ratio

WHO/BS/09.2124
Page 63
Appendix 4: Study Protocol
Collaborative study on the 6th International Standard for Unfractionated Heparin (CS379)
Aims of Study
The aim of the study is to assay 6 candidate unfractionated heparin samples against the 5th International
Standard, 97/578, with a view to establish a new material as the 6th International Standard for
unfractionated heparin.
Unfractionated heparin samples provided (all samples are of porcine origin):
S - the 5th IS for Unfractionated Heparin, 97/578. Potency 2031 IU/ampoule.
T - Potency range 1900 – 2100 IU/ampoule.
V - Potency range 2400 – 2600 IU/ampoule.
W - Potency range 2000 – 2200 IU/ampoule.
X - Potency range 2000 – 2200 IU/ampoule.
Y – Potency range 1900 – 2100 IU/ampoule.
Z - Potency range 1900 – 2100 IU/ampoule.
Using the above figures as a guide for the first assay, adjust the initial dilutions of each heparin so that the
responses for the dilutions of the samples in the assays are in a similar range. Based on the results from
the first assay, if necessary, re-adjust the dilutions of the samples for the subsequent assays to be in the
same range. Note that the dilution range for different assay types (eg EP methods and anti-Xa assays)
may be different.
Storage and Reconstitution
The samples should be handled as follows:
1. Store all unopened ampoules and vials 2 – 8°C.
2. Open ampoule after ensuring all the contents are in the lower half. Reconstitute freeze-dried
ampoules at room temperature with 1.0 ml distilled water. Transfer the entire contents to a
plastic tube.
3. Keep all samples in stoppered plastic tubes at room temperature during period of assay and at
+4°C between assays carried out on different days for different methods.
Assay Methods
Each laboratory is asked to perform their chosen methods.

WHO/BS/09.2124
Page 64 Design and number of Assays
A suitable design should be chosen from the schemes given below; ideally the 14 and 8 place assays are
preferred. Once a scheme has been chosen, it should be adhered to as closely as possible. In these
schemes, each coded letter represents at least 3, but preferably 4 dilutions of that material. For
identification purposes, when reporting the results, the 4 ampoules of standard should be numbered S1,
S2, S3, S4 and the test samples numbered in a similar way. All participants should carry out 4
independent assays for each method, an independent assay being defined as one with completely fresh set
of dilutions.
To allow for day to day variation, the four assays by each method should be carried out on 4 separate days.
For those laboratories performing 2 or more methods, these can be carried out on the same or different
days, using the same reconstituted solutions, but making fresh dilutions for each method.
14 place assays
Assay Order of Testing
1 S1 T1 V1 W1 X1 Y1 Z1 Z1 Y1 X1 W1 V1 T1 S1
2 S2 Z2 Y2 X2 W2 V2 T2 T2 V2 W2 X2 Y2 Z2 S2
3 S3 X3 W3 V3 Z3 T3 Y3 Y3 T3 Z3 V3 W3 X3 S3
4 S4 W4 X4 Y4 T4 Z4 V4 V4 Z4 T4 Y4 X4 W4 S4
8 place assays
Assay Run Order of Testing
1 1 S1 V1 W1 Z1 Z1 W1 V1 S1
2 S1 X1 Y1 T1 T1 Y1 X1 S1
2 1 S2 Z2 V2 W2 W2 V2 Z2 S2
2 S2 T2 X2 Y2 Y2 X2 T2 S2
3 1 S3 W3 X3 V3 V3 X3 W3 S3
2 S3 Y3 Z3 T3 T3 Z3 Y3 S3
4 1 S4 X4 V4 W4 W4 V4 X4 S4
2 S4 Z4 Y4 T4 T4 Y4 Z4 S4

WHO/BS/09.2124
Page 65
6 place assays
Assay Run Order of Testing
1 1 S1 V1 Z1 Z1 V1 S1
2 S1 W1 Y1 Y1 W1 S1
3 S1 X1 T1 T1 X1 S1
2 1 S2 T2 V2 V2 T2 S2
2 S2 W2 X2 X2 W2 S2
3 S2 Z2 Y2 Y2 Z2 S2
3 1 S3 W3 T3 T3 W3 S3
2 S3 Z3 V3 V3 Z3 S3
3 S3 Y3 X3 X3 Y3 S3
4 1 S4 X4 Y4 Y4 X4 S4
2 S4 Z4 W4 W4 Z4 S4
3 S4 T4 V4 V4 T4 S4
For the 8 and 6 place assays, there should be minimal time delay between runs within an assay. Reagents
for each assay should be stored on ice, until all runs are performed.
If your laboratory cannot follow these suggested designs, please do email John Hogwood and we will
send other appropriate schemes for your laboratory.
Report of data
Raw data and estimated potencies should be recorded on the appropriate result sheets. Electronic data
sheets on EXCEL format will be forwarded to participants once the “Acknowledgement of samples
receipt form” is received by John Hogwood at NIBSC. Please email John Hogwood if you do not receive
the electronic results form ([email protected]).

WHO/BS/09.2124
Page 66
Appendix 5 Summary of Results by European Pharmacopoeial Assay returned by Lab 4. Geometric
means for each candidates, as estimated by the laboratory were within the range of
geometric means obtained by other laboratories carrying out the same assay method.
Assay 1 Assay 2 Assay 3 Assay 4 Geometric
Mean GCV
T 1849 1849 1820 1837 1839 0.75%
V 1966 1977 1988 1955 1971 0.72%
W 2093 2161 2143 2092 2122 1.67%
X 2137 2161 2151 2158 2152 0.50%
Y 1895 1895 1906 1930 1906 0.87%
Z 2010 2011 2051 1963 2009 1.81%
Summary of Results by APTT Assay returned by Lab 14. Geometric means for each
candidates, as estimated by NIBSC were within the range of geometric means obtained by
other laboratories carrying out the same assay method.
Assay 1 Assay 2 Assay 3 Assay 4 Geometric
Mean GCV
T 1899 1880 1912 1880 1893 0.83%
V 1773 1786 1781 1765 1776 0.52%
W 2195 2162 2178 2169 2176 0.66%
X 2271 2263 2249 2280 2266 0.58%
Y 2026 2009 2027 2035 2024 0.54%
Z 2033 2009 2051 2049 2035 0.96%

WHO/BS/09.2124
Page 67
Appendix 6: Draft Intruction for Use (IFU) for the Proposed 6th
International Standard for Unfractionated Heparin, 07/328

WHO/BS/09.2124
Page 68
Related Documents