BioMed Central Page 1 of 8 (page number not for citation purposes) Reproductive Health Open Access Research WHO Global Survey on Maternal and Perinatal Health in Latin America: classifying caesarean sections Ana P Betrán* 1 , A Metin Gulmezoglu 1 , Michael Robson 2 , Mario Merialdi 1 , João P Souza 1 , Daniel Wojdyla 3 , Mariana Widmer 1 , Guillermo Carroli 3 , Maria R Torloni 4 , Ana Langer 5 , Alberto Narváez 6 , Alejandro Velasco 7 , Anibal Faúndes 8 , Arnaldo Acosta 9 , Eliette Valladares 10 , Mariana Romero 11 , Nelly Zavaleta 12 , Sofia Reynoso 13 and Vicente Bataglia 14 Address: 1 Department of Reproductive Health and Research, World Health Organization, Geneva, Switzerland, 2 National Maternity Hospital, Dublin, Ireland, 3 Centro Rosarino de Estudios Perinatales, Rosario, Argentina, 4 Department of Obstetric and Gynecology, Federal University of Sao Paulo, Sao Paulo, Brazil, 5 EngenderHealth, New York, USA, 6 Fundación Salud, Ambiente y Desarrollo, Quito, Ecuador, 7 Hospital Docente Ginecobstétrico "America Arias", La Habana, Cuba, 8 Centro de Pesquisas em Saúde Reprodutiva de Campinas (CEMICAMP), Campinas, Brazil, 9 Department of Obstetrics and Gynecology, Universidad Nacional de Asunción, Asunción, Paraguay, 10 Universidad Nacional Autónoma de Nicaragua, León, Nicaragua, 11 Centro de Estudios de Estado y Sociedad, Buenos Aires, Argentina, 12 Instituto de Investigación Nutricional, Lima, Peru, 13 The Population Council, Latin America Office, Mexico City, Mexico and 14 Department of Obstetrics and Gynecology, Hospital Nacional de Itaguá, Asunción, Paraguay Email: Ana P Betrán* - [email protected]; A Metin Gulmezoglu - [email protected]; Michael Robson - [email protected]; Mario Merialdi - [email protected]; João P Souza - [email protected]; Daniel Wojdyla - [email protected]; Mariana Widmer - [email protected]; Guillermo Carroli - [email protected]; Maria R Torloni - [email protected]; Ana Langer - [email protected]; Alberto Narváez - [email protected]; Alejandro Velasco - [email protected]; Anibal Faúndes - [email protected]; Arnaldo Acosta - [email protected]; Eliette Valladares - [email protected]; Mariana Romero - [email protected]; Nelly Zavaleta - [email protected]; Sofia Reynoso - [email protected]; Vicente Bataglia - [email protected] * Corresponding author Abstract Background: Caesarean section rates continue to increase worldwide with uncertain medical consequences. Auditing and analysing caesarean section rates and other perinatal outcomes in a reliable and continuous manner is critical for understanding reasons caesarean section changes over time. Methods: We analyzed data on 97,095 women delivering in 120 facilities in 8 countries, collected as part of the 2004-2005 Global Survey on Maternal and Perinatal Health in Latin America. The objective of this analysis was to test if the "10-group" or "Robson" classification could help identify which groups of women are contributing most to the high caesarean section rates in Latin America, and if it could provide information useful for health care providers in monitoring and planning effective actions to reduce these rates. Results: The overall rate of caesarean section was 35.4%. Women with single cephalic pregnancy at term without previous caesarean section who entered into labour spontaneously (groups 1 and 3) represented 60% of the total obstetric population. Although women with a term singleton cephalic pregnancy with a previous caesarean section (group 5) represented only 11.4% of the Published: 29 October 2009 Reproductive Health 2009, 6:18 doi:10.1186/1742-4755-6-18 Received: 28 August 2009 Accepted: 29 October 2009 This article is available from: http://www.reproductive-health-journal.com/content/6/1/18 © 2009 Betrán et al; licensee BioMed Central Ltd. This is an Open Access article distributed under the terms of the Creative Commons Attribution License (http://creativecommons.org/licenses/by/2.0 ), which permits unrestricted use, distribution, and reproduction in any medium, provided the original work is properly cited.

Welcome message from author
This document is posted to help you gain knowledge. Please leave a comment to let me know what you think about it! Share it to your friends and learn new things together.
Transcript
BioMed CentralReproductive Health
ss
Open AcceResearchWHO Global Survey on Maternal and Perinatal Health in Latin America: classifying caesarean sectionsAna P Betrán*1, A Metin Gulmezoglu1, Michael Robson2, Mario Merialdi1, João P Souza1, Daniel Wojdyla3, Mariana Widmer1, Guillermo Carroli3, Maria R Torloni4, Ana Langer5, Alberto Narváez6, Alejandro Velasco7, Anibal Faúndes8, Arnaldo Acosta9, Eliette Valladares10, Mariana Romero11, Nelly Zavaleta12, Sofia Reynoso13 and Vicente Bataglia14Address: 1Department of Reproductive Health and Research, World Health Organization, Geneva, Switzerland, 2National Maternity Hospital, Dublin, Ireland, 3Centro Rosarino de Estudios Perinatales, Rosario, Argentina, 4Department of Obstetric and Gynecology, Federal University of Sao Paulo, Sao Paulo, Brazil, 5EngenderHealth, New York, USA, 6Fundación Salud, Ambiente y Desarrollo, Quito, Ecuador, 7Hospital Docente Ginecobstétrico "America Arias", La Habana, Cuba, 8Centro de Pesquisas em Saúde Reprodutiva de Campinas (CEMICAMP), Campinas, Brazil, 9Department of Obstetrics and Gynecology, Universidad Nacional de Asunción, Asunción, Paraguay, 10Universidad Nacional Autónoma de Nicaragua, León, Nicaragua, 11Centro de Estudios de Estado y Sociedad, Buenos Aires, Argentina, 12Instituto de Investigación Nutricional, Lima, Peru, 13The Population Council, Latin America Office, Mexico City, Mexico and 14Department of Obstetrics and Gynecology, Hospital Nacional de Itaguá, Asunción, Paraguay
Email: Ana P Betrán* - [email protected]; A Metin Gulmezoglu - [email protected]; Michael Robson - [email protected]; Mario Merialdi - [email protected]; João P Souza - [email protected]; Daniel Wojdyla - [email protected]; Mariana Widmer - [email protected]; Guillermo Carroli - [email protected]; Maria R Torloni - [email protected]; Ana Langer - [email protected]; Alberto Narváez - [email protected]; Alejandro Velasco - [email protected]; Anibal Faúndes - [email protected]; Arnaldo Acosta - [email protected]; Eliette Valladares - [email protected]; Mariana Romero - [email protected]; Nelly Zavaleta - [email protected]; Sofia Reynoso - [email protected]; Vicente Bataglia - [email protected]
* Corresponding author
AbstractBackground: Caesarean section rates continue to increase worldwide with uncertain medicalconsequences. Auditing and analysing caesarean section rates and other perinatal outcomes in areliable and continuous manner is critical for understanding reasons caesarean section changesover time.
Methods: We analyzed data on 97,095 women delivering in 120 facilities in 8 countries, collectedas part of the 2004-2005 Global Survey on Maternal and Perinatal Health in Latin America. Theobjective of this analysis was to test if the "10-group" or "Robson" classification could help identifywhich groups of women are contributing most to the high caesarean section rates in Latin America,and if it could provide information useful for health care providers in monitoring and planningeffective actions to reduce these rates.
Results: The overall rate of caesarean section was 35.4%. Women with single cephalic pregnancyat term without previous caesarean section who entered into labour spontaneously (groups 1 and3) represented 60% of the total obstetric population. Although women with a term singletoncephalic pregnancy with a previous caesarean section (group 5) represented only 11.4% of the
Published: 29 October 2009
Reproductive Health 2009, 6:18 doi:10.1186/1742-4755-6-18
Received: 28 August 2009Accepted: 29 October 2009
This article is available from: http://www.reproductive-health-journal.com/content/6/1/18
© 2009 Betrán et al; licensee BioMed Central Ltd. This is an Open Access article distributed under the terms of the Creative Commons Attribution License (http://creativecommons.org/licenses/by/2.0), which permits unrestricted use, distribution, and reproduction in any medium, provided the original work is properly cited.
Page 1 of 8(page number not for citation purposes)
Reproductive Health 2009, 6:18 http://www.reproductive-health-journal.com/content/6/1/18
obstetric population, this group was the largest contributor to the overall caesarean section rate(26.7% of all the caesarean sections). The second and third largest contributors to the overallcaesarean section rate were nulliparous women with single cephalic pregnancy at term either inspontaneous labour (group 1) or induced or delivered by caesarean section before labour (group2), which were responsible for 18.3% and 15.3% of all caesarean deliveries, respectively.
Conclusion: The 10-group classification could be easily applied to a multicountry dataset withoutproblems of inconsistencies or misclassification. Specific groups of women were clearly identifiedas the main contributors to the overall caesarean section rate. This classification could help healthcare providers to plan practical and effective actions targeting specific groups of women to improvematernal and perinatal care.
BackgroundCaesarean section (CS) rates have increased significantlyworldwide during the last decades but in particular inmiddle and high income countries [1-3]. In several coun-tries of Latin America, the proportion of deliveries by CSis approaching 40% at national level [1,3]. In UnitedStates, the CS rate in 2006 was 31.1% [4], and the latestestimates for several European countries are also above30% [1]. This steady increase has fuelled the debate overacceptable rates of CS and the risk-benefit analysis inensuring optimum maternal and perinatal outcomes indifferent populations with different access to healthresources. The medical consequences of a rising CS rateremain uncertain and the implications in developingcountries may be more significant because of the impact itcould have on limited resources [2,3,5,6].
Auditing of CS rates is carried out in many countries.However there is no standardized, internationallyaccepted method for classifying CS and thereby enablingthe assessment of both maternal and neonatal outcomesin clinically relevant groups of women. Most studies onCS rates have used indications as a method of analysis andwhile this does provide interesting information on why
the CS took place, it does not enable completion of theaudit cycle mainly because the information cannot beused to change care prospectively.
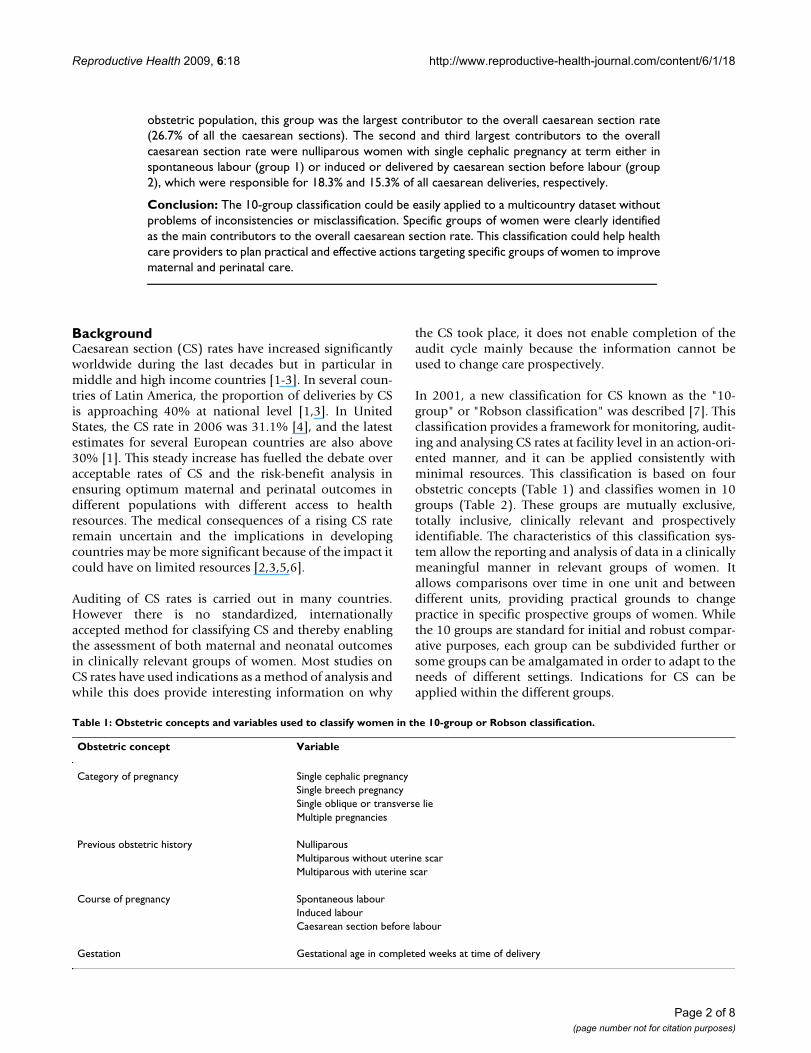
In 2001, a new classification for CS known as the "10-group" or "Robson classification" was described [7]. Thisclassification provides a framework for monitoring, audit-ing and analysing CS rates at facility level in an action-ori-ented manner, and it can be applied consistently withminimal resources. This classification is based on fourobstetric concepts (Table 1) and classifies women in 10groups (Table 2). These groups are mutually exclusive,totally inclusive, clinically relevant and prospectivelyidentifiable. The characteristics of this classification sys-tem allow the reporting and analysis of data in a clinicallymeaningful manner in relevant groups of women. Itallows comparisons over time in one unit and betweendifferent units, providing practical grounds to changepractice in specific prospective groups of women. Whilethe 10 groups are standard for initial and robust compar-ative purposes, each group can be subdivided further orsome groups can be amalgamated in order to adapt to theneeds of different settings. Indications for CS can beapplied within the different groups.
Table 1: Obstetric concepts and variables used to classify women in the 10-group or Robson classification.
Obstetric concept Variable
Category of pregnancy Single cephalic pregnancySingle breech pregnancySingle oblique or transverse lieMultiple pregnancies
Previous obstetric history NulliparousMultiparous without uterine scarMultiparous with uterine scar
Course of pregnancy Spontaneous labourInduced labourCaesarean section before labour
Gestation Gestational age in completed weeks at time of delivery
Page 2 of 8(page number not for citation purposes)
Reproductive Health 2009, 6:18 http://www.reproductive-health-journal.com/content/6/1/18
In 2004, WHO initiated the Global Survey on Maternaland Perinatal Health project. The main objectives of thissurvey were to develop a network of health institutionsworldwide to assess how evidence-based recommenda-tions are implemented in maternal and perinatal healthcare, to identify gaps at the facility and sub-national levels,and to assist in effective planning, implementation andmonitoring [8]. WHO envisions to keep this network ofhealth facilities active, in order to intermittently collectand analyse data on priority research questions, in a real-time framework.
In this context, we set out to perform a secondary analysisof the 2004-2005 WHO Global Survey in Latin America[9,10] using the 10-group classification. Our objectives
were twofold. Firstly, to see if the classification could besuccessfully applied to a large dataset. Secondly, to iden-tify the groups of women that contribute most to the highrates of caesarean deliveries in Latin America and test howthis classification can be used to identify problems andchallenges and subsequently enable actions to be taken.Since the type of facility (tertiary/referral vs. other) andthe educational level of the mother play an important roleon CS rates [10], this analysis includes assessment by typeof facility and level of education of the women.
MethodsThe WHO Global Survey was implemented in Latin Amer-ica in 2004-2005. The focus of this survey was to explorethe relation between rate of caesarean delivery and mater-nal and perinatal outcomes. The detailed methodology ofthe WHO global survey has been described elsewhere [8-10]. Briefly, this was a facility-based study of womendelivering in randomly selected health facilities in 23 geo-graphical areas in eight randomly selected Latin Americancountries (i.e. Argentina, Brazil, Cuba, Ecuador, Mexico,Nicaragua, Paraguay, and Peru). A stratified multistagecluster sampling design was used to obtain a sample ofhealth institutions [11]. Individual informed consent wasnot sought (except for Brazil) as data were collected at theinstitutional level from medical records without identify-ing the individual women. The ethics committee of eachparticipating institution and the Scientific and EthicalReview Group of the UNDP/UNFPA/WHO/World BankSpecial Programme of Research, Development andResearch Training in Human Reproduction, Geneva, Swit-zerland approved the study.
The study population consisted of all women admitted fordelivery over a 3-month period in institutions with up to6,000 deliveries per year, and over a 2-month period forthose institutions with more than 6,000. In each healthinstitution, data pertaining to the characteristics and serv-ices available, and individual-woman data were collected.Information related to each woman was extracted fromthe medical records by trained data collectors within a dayafter delivery and for the period that the women were inthe hospital. Information collected included demo-graphic characteristics, maternal risk indicators, mode ofdelivery, and maternal and newborn outcomes up to hos-pital discharge [8-10].
All necessary information to implement the 10-groupclassification (see Table 1) was collected through the sur-vey without prior knowledge of the 10-group classifica-tion. Data were processed using SAS System (version9.1.3). In this manuscript we present an overall analysis ofthe 10-group classification as well as of the individualcountries. We wanted to test whether the combination ofcertain obstetric characteristics as defined by the 10-group
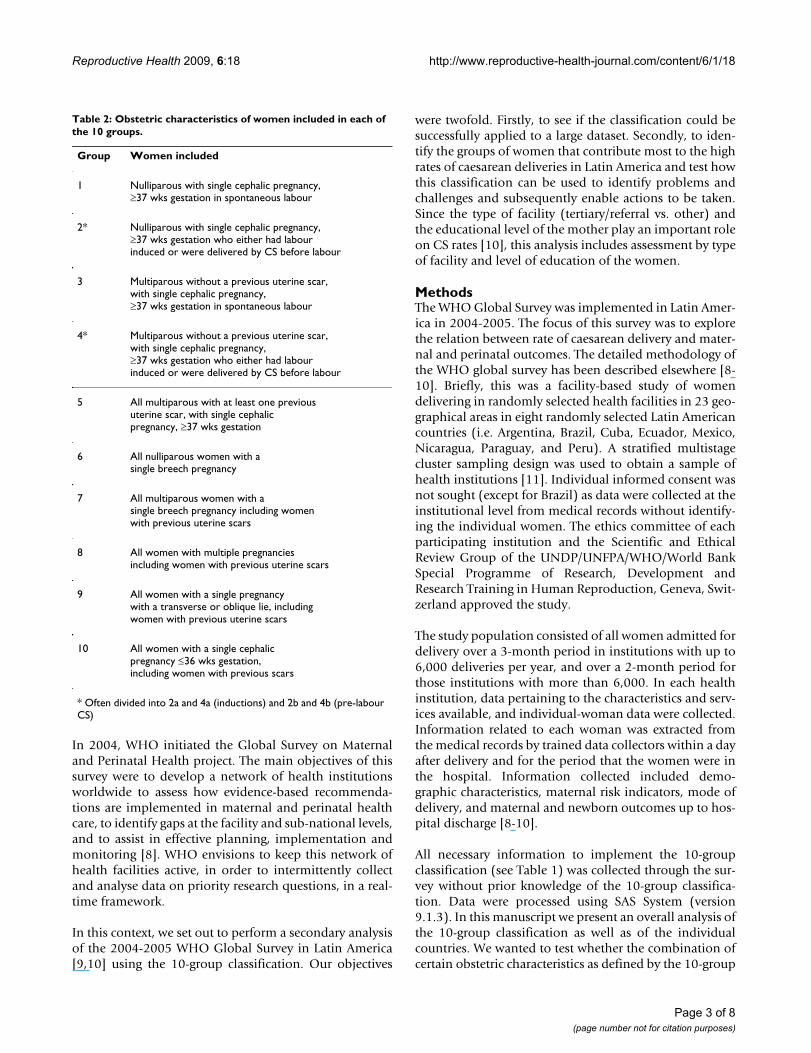
Table 2: Obstetric characteristics of women included in each of the 10 groups.
Group Women included
1 Nulliparous with single cephalic pregnancy,≥37 wks gestation in spontaneous labour
2* Nulliparous with single cephalic pregnancy,≥37 wks gestation who either had labourinduced or were delivered by CS before labour
3 Multiparous without a previous uterine scar,with single cephalic pregnancy,≥37 wks gestation in spontaneous labour
4* Multiparous without a previous uterine scar,with single cephalic pregnancy,≥37 wks gestation who either had labourinduced or were delivered by CS before labour
5 All multiparous with at least one previousuterine scar, with single cephalicpregnancy, ≥37 wks gestation
6 All nulliparous women with asingle breech pregnancy
7 All multiparous women with asingle breech pregnancy including womenwith previous uterine scars
8 All women with multiple pregnanciesincluding women with previous uterine scars
9 All women with a single pregnancywith a transverse or oblique lie, includingwomen with previous uterine scars
10 All women with a single cephalicpregnancy ≤36 wks gestation, including women with previous scars
* Often divided into 2a and 4a (inductions) and 2b and 4b (pre-labour CS)
Page 3 of 8(page number not for citation purposes)
Reproductive Health 2009, 6:18 http://www.reproductive-health-journal.com/content/6/1/18
classification (e.g. parity, presentation, gestational age,type of labour initiation and previous mode of delivery)would be associated with selected social factors (e.g. edu-cational level). We therefore analysed the risk of CS ineach group according to the educational level of themother and the type of facility (tertiary/referral vs. other)as crude and adjusted odds ratio (OR) with 95% confi-dence intervals. The variables considered in the modelswere those used in previous published analysis of this sur-vey [9,10].
ResultsIn Latin America, the 2004-2005 WHO Global Surveyincluded 120 institutions in eight countries. For the stipu-lated period of time and according to hospital records,106,546 deliveries occurred in these institutions. Informa-tion was collected for 97,095 deliveries giving a 91% cov-erage of the survey. The contribution of each institution tothe total number of deliveries ranged from 37 to 4536.Thirty-five out of the 120 institutions contributed withover 1,000 deliveries.
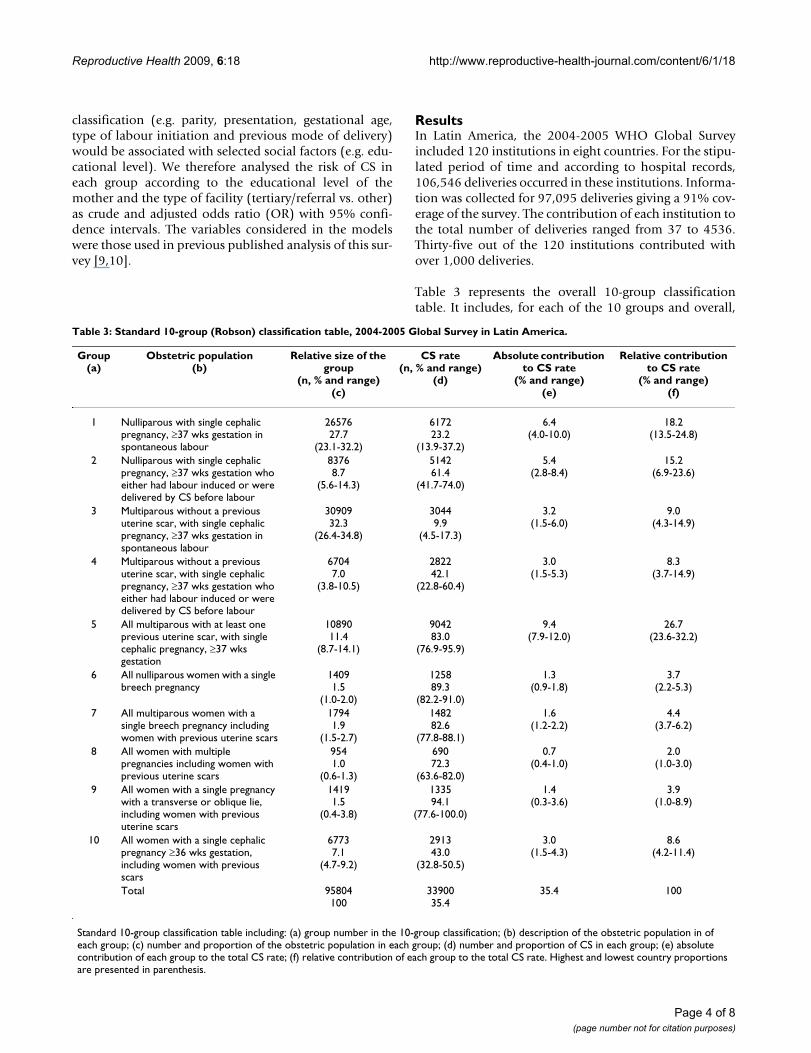
Table 3 represents the overall 10-group classificationtable. It includes, for each of the 10 groups and overall,
Table 3: Standard 10-group (Robson) classification table, 2004-2005 Global Survey in Latin America.
Group(a)
Obstetric population(b)
Relative size of the group
(n, % and range)(c)
CS rate(n, % and range)
(d)
Absolute contribution to CS rate
(% and range)(e)
Relative contribution to CS rate
(% and range)(f)
1 Nulliparous with single cephalic pregnancy, ≥37 wks gestation in spontaneous labour
2657627.7
(23.1-32.2)
617223.2
(13.9-37.2)
6.4(4.0-10.0)
18.2(13.5-24.8)
2 Nulliparous with single cephalic pregnancy, ≥37 wks gestation who either had labour induced or were delivered by CS before labour
83768.7
(5.6-14.3)
514261.4
(41.7-74.0)
5.4(2.8-8.4)
15.2(6.9-23.6)
3 Multiparous without a previous uterine scar, with single cephalic pregnancy, ≥37 wks gestation in spontaneous labour
3090932.3
(26.4-34.8)
30449.9
(4.5-17.3)
3.2(1.5-6.0)
9.0(4.3-14.9)
4 Multiparous without a previous uterine scar, with single cephalic pregnancy, ≥37 wks gestation who either had labour induced or were delivered by CS before labour
67047.0
(3.8-10.5)
282242.1
(22.8-60.4)
3.0(1.5-5.3)
8.3(3.7-14.9)
5 All multiparous with at least one previous uterine scar, with single cephalic pregnancy, ≥37 wks gestation
1089011.4
(8.7-14.1)
904283.0
(76.9-95.9)
9.4(7.9-12.0)
26.7(23.6-32.2)
6 All nulliparous women with a single breech pregnancy
14091.5
(1.0-2.0)
125889.3
(82.2-91.0)
1.3(0.9-1.8)
3.7(2.2-5.3)
7 All multiparous women with a single breech pregnancy including women with previous uterine scars
17941.9
(1.5-2.7)
148282.6
(77.8-88.1)
1.6(1.2-2.2)
4.4(3.7-6.2)
8 All women with multiple pregnancies including women with previous uterine scars
9541.0
(0.6-1.3)
69072.3
(63.6-82.0)
0.7(0.4-1.0)
2.0(1.0-3.0)
9 All women with a single pregnancy with a transverse or oblique lie, including women with previous uterine scars
14191.5
(0.4-3.8)
133594.1
(77.6-100.0)
1.4(0.3-3.6)
3.9(1.0-8.9)
10 All women with a single cephalic pregnancy ≥36 wks gestation, including women with previous scars
67737.1
(4.7-9.2)
291343.0
(32.8-50.5)
3.0(1.5-4.3)
8.6(4.2-11.4)
Total 95804100
3390035.4
35.4 100
Standard 10-group classification table including: (a) group number in the 10-group classification; (b) description of the obstetric population in of each group; (c) number and proportion of the obstetric population in each group; (d) number and proportion of CS in each group; (e) absolute contribution of each group to the total CS rate; (f) relative contribution of each group to the total CS rate. Highest and lowest country proportions are presented in parenthesis.
Page 4 of 8(page number not for citation purposes)
Reproductive Health 2009, 6:18 http://www.reproductive-health-journal.com/content/6/1/18
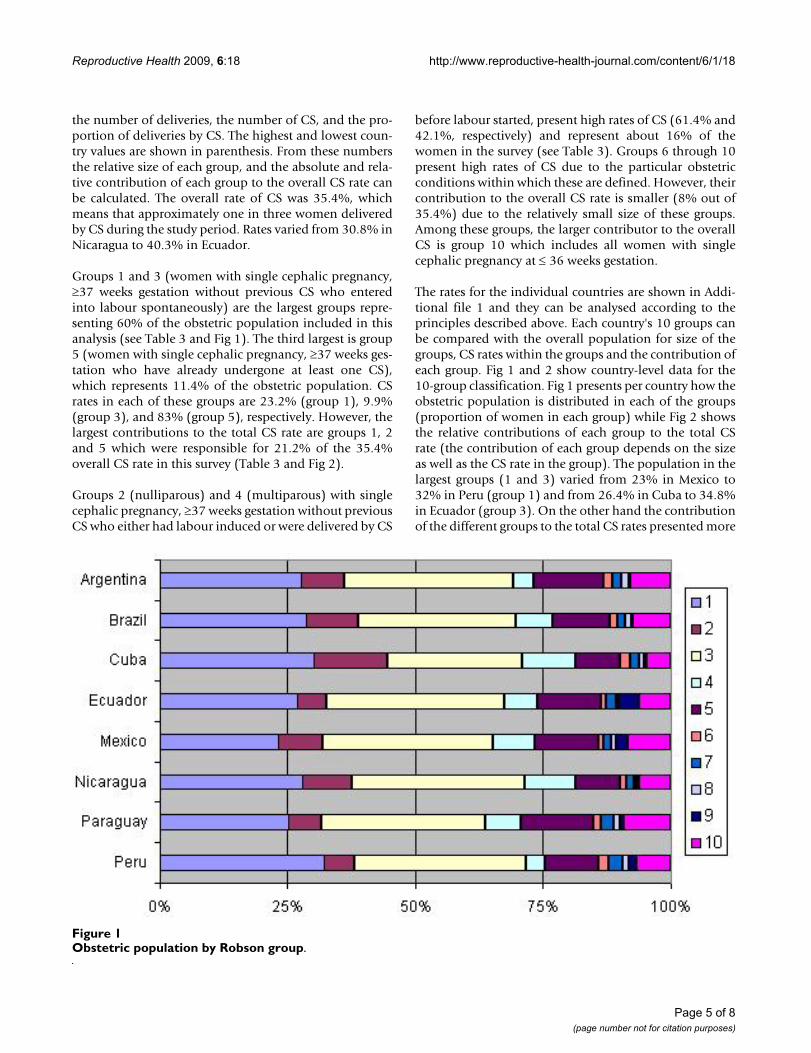
the number of deliveries, the number of CS, and the pro-portion of deliveries by CS. The highest and lowest coun-try values are shown in parenthesis. From these numbersthe relative size of each group, and the absolute and rela-tive contribution of each group to the overall CS rate canbe calculated. The overall rate of CS was 35.4%, whichmeans that approximately one in three women deliveredby CS during the study period. Rates varied from 30.8% inNicaragua to 40.3% in Ecuador.
Groups 1 and 3 (women with single cephalic pregnancy,≥37 weeks gestation without previous CS who enteredinto labour spontaneously) are the largest groups repre-senting 60% of the obstetric population included in thisanalysis (see Table 3 and Fig 1). The third largest is group5 (women with single cephalic pregnancy, ≥37 weeks ges-tation who have already undergone at least one CS),which represents 11.4% of the obstetric population. CSrates in each of these groups are 23.2% (group 1), 9.9%(group 3), and 83% (group 5), respectively. However, thelargest contributions to the total CS rate are groups 1, 2and 5 which were responsible for 21.2% of the 35.4%overall CS rate in this survey (Table 3 and Fig 2).
Groups 2 (nulliparous) and 4 (multiparous) with singlecephalic pregnancy, ≥37 weeks gestation without previousCS who either had labour induced or were delivered by CS
before labour started, present high rates of CS (61.4% and42.1%, respectively) and represent about 16% of thewomen in the survey (see Table 3). Groups 6 through 10present high rates of CS due to the particular obstetricconditions within which these are defined. However, theircontribution to the overall CS rate is smaller (8% out of35.4%) due to the relatively small size of these groups.Among these groups, the larger contributor to the overallCS is group 10 which includes all women with singlecephalic pregnancy at ≤ 36 weeks gestation.
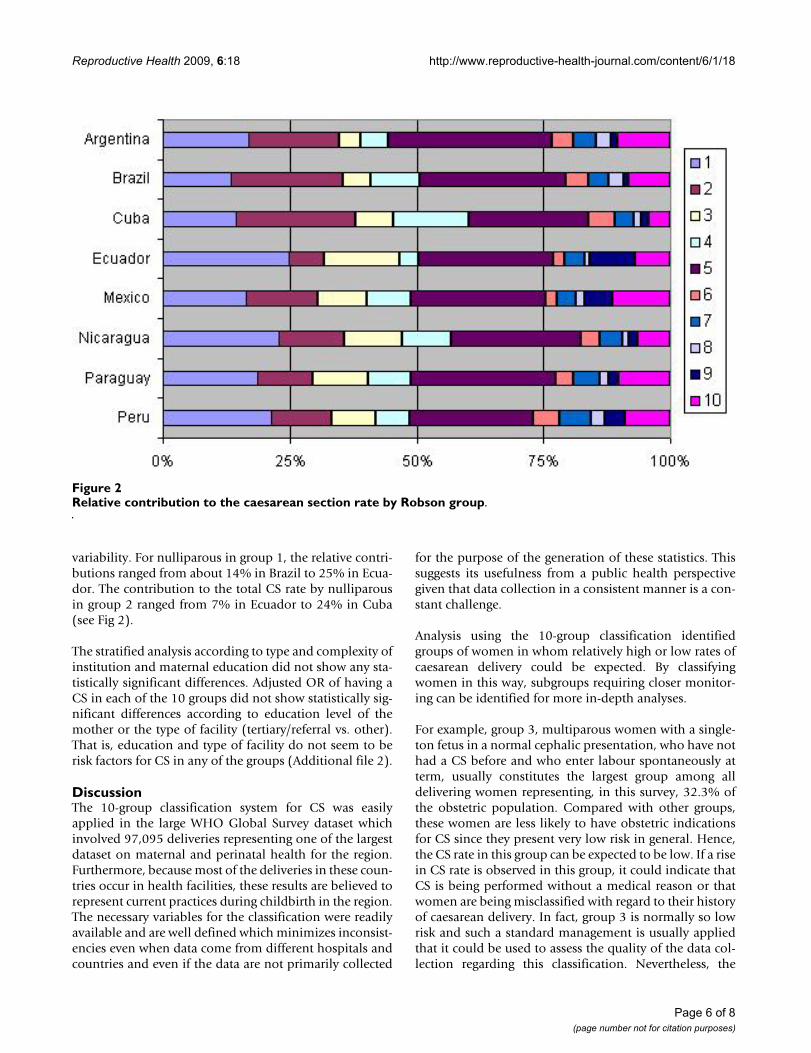
The rates for the individual countries are shown in Addi-tional file 1 and they can be analysed according to theprinciples described above. Each country's 10 groups canbe compared with the overall population for size of thegroups, CS rates within the groups and the contribution ofeach group. Fig 1 and 2 show country-level data for the10-group classification. Fig 1 presents per country how theobstetric population is distributed in each of the groups(proportion of women in each group) while Fig 2 showsthe relative contributions of each group to the total CSrate (the contribution of each group depends on the sizeas well as the CS rate in the group). The population in thelargest groups (1 and 3) varied from 23% in Mexico to32% in Peru (group 1) and from 26.4% in Cuba to 34.8%in Ecuador (group 3). On the other hand the contributionof the different groups to the total CS rates presented more
Obstetric population by Robson groupFigure 1Obstetric population by Robson group.
Page 5 of 8(page number not for citation purposes)
Reproductive Health 2009, 6:18 http://www.reproductive-health-journal.com/content/6/1/18
variability. For nulliparous in group 1, the relative contri-butions ranged from about 14% in Brazil to 25% in Ecua-dor. The contribution to the total CS rate by nulliparousin group 2 ranged from 7% in Ecuador to 24% in Cuba(see Fig 2).
The stratified analysis according to type and complexity ofinstitution and maternal education did not show any sta-tistically significant differences. Adjusted OR of having aCS in each of the 10 groups did not show statistically sig-nificant differences according to education level of themother or the type of facility (tertiary/referral vs. other).That is, education and type of facility do not seem to berisk factors for CS in any of the groups (Additional file 2).
DiscussionThe 10-group classification system for CS was easilyapplied in the large WHO Global Survey dataset whichinvolved 97,095 deliveries representing one of the largestdataset on maternal and perinatal health for the region.Furthermore, because most of the deliveries in these coun-tries occur in health facilities, these results are believed torepresent current practices during childbirth in the region.The necessary variables for the classification were readilyavailable and are well defined which minimizes inconsist-encies even when data come from different hospitals andcountries and even if the data are not primarily collected
for the purpose of the generation of these statistics. Thissuggests its usefulness from a public health perspectivegiven that data collection in a consistent manner is a con-stant challenge.
Analysis using the 10-group classification identifiedgroups of women in whom relatively high or low rates ofcaesarean delivery could be expected. By classifyingwomen in this way, subgroups requiring closer monitor-ing can be identified for more in-depth analyses.
For example, group 3, multiparous women with a single-ton fetus in a normal cephalic presentation, who have nothad a CS before and who enter labour spontaneously atterm, usually constitutes the largest group among alldelivering women representing, in this survey, 32.3% ofthe obstetric population. Compared with other groups,these women are less likely to have obstetric indicationsfor CS since they present very low risk in general. Hence,the CS rate in this group can be expected to be low. If a risein CS rate is observed in this group, it could indicate thatCS is being performed without a medical reason or thatwomen are being misclassified with regard to their historyof caesarean delivery. In fact, group 3 is normally so lowrisk and such a standard management is usually appliedthat it could be used to assess the quality of the data col-lection regarding this classification. Nevertheless, the
Relative contribution to the caesarean section rate by Robson groupFigure 2Relative contribution to the caesarean section rate by Robson group.
Page 6 of 8(page number not for citation purposes)
Reproductive Health 2009, 6:18 http://www.reproductive-health-journal.com/content/6/1/18
almost 10% CS rate in this group is rather high comparedwith 1% in the National Maternity Hospital in Dublin in2006 [12], or 3.7% in the Royal Women's Hospital inMelbourne in 2005 [13].
The second largest group among delivering women wasfound to be nulliparous women with a singleton fetus inthe normal cephalic position entering labour spontane-ously at term; group 1 (27.7% of the women). In thisgroup too, women are less likely to have medical indica-tions for CS, but it may be required for complications oflabour such as dystocia or fetal distress. The CS rate in thisgroup can be expected to be relatively low and it is a keyindicator of the CS rate in the same women in future preg-nancies. However, the 23.2% of CS in group 1, contrastmarkedly with other published rates such as the 6.7% inthe National Maternity Hospital in Dublin in 2006 [12],or 14.8% in New Jersey in 2004 [14].
Group 5, women with a previous CS and a single fetus innormal cephalic presentation at term constituted the nextimportant group in the Latin American dataset (11.4% ofthe delivering women). Additionally, this group made thehighest contribution to the overall CS rate (about 27% ofall CS; see Table 3). In a context of overall increase of CSrates, it is critical to consider this group seriously becauseas CS rates increase in the other groups, group 5 willincrease its size and therefore it will become an even moreimportant contributor to the overall CS rate. However,reducing CS in this group is likely to be most difficultbecause having a previous delivery by CS increases thelikelihood of caesarean delivery in the next pregnancy.The important message must be to try and prevent the firstCS.
Groups 2 and 4 come next in terms of size, 8.7% and 7%,respectively. Nulliparous and multiparous without previ-ous CS, respectively, who have a singleton fetus incephalic presentation at term, who have labour inducedor delivered by CS before labour constituted the next larg-est groups in the Global Survey dataset. Rates were 61.4%and 42.1% in group 2 and 4, respectively. These high CSrates indicate that a considerable proportion of womeneither had a high incidence of conditions that requiredlabour induction (such as pre-eclampsia at term) or hadelective labour inductions and pre-labour CS for the sakeof convenience or other potentially non-medical reason.Clearly, these groups would need to be investigated inmore detail to understand the exact reasons of the highrates and take appropriate action. By reviewing the indica-tions for ending the pregnancy before spontaneous labour(i.e. by CS before labour and labour induction) and howlabour induction was managed in these women, onecould identify gaps in the application of evidence-based
clinical practices and potentially reduce unnecessary CS inthese groups.
Owing to their obstetric factors such as multiple pregnan-cies, breech presentation, transverse or oblique lie,women in the groups 6-10 can be expected to have higherCS rates. However, the contributions of these groups tothe overall CS rate would be low, considering the size ofthis population. One further point in relation to group 9is that by definition this group should have a caesareansection rate of 100% and therefore, it is also a group thatcan be used to assess the quality of data collection.
The present analysis did not include further stratificationof each of the 10 groups of women. However, this wouldbe advisable in countries or institutions attempting tounderstand practices in certain obstetrics groups and theirrelated levels of CS. The classification presents the flexibil-ity to allow for this stratification. Particularly, groups 2, 4,and 5 can benefit from subdivision into those womenwho had labour induced and those who were delivered bypre-labour CS. Another useful subdivision would be ingroup 5, where women with previous uterine scars couldbe subdivided into those with only one previous CS, andwomen with two or more previous CS. Additionally, thestudy of outcomes and characteristics of women withmultiple CS could also provide evidence and assist tounderstand potential adverse effects of CS in thesewomen, a group that could be possibly growing in devel-oping countries. Furthermore, this classification canembed the indications for CS classification in the sensethat indications can be applied within the differentgroups. Other in-depth analysis could also stratify womenin each group by other risk factors or medical conditions,age, race, BMI, case mix, or evening/day shifts, among oth-ers [15,16].
Although the 10-group classification has been used in dif-ferent units in countries worldwide [13,14,17-19], this isthe first time it was tested using data from a large multi-country study providing an auditing framework andgrounds for comparisons between facilities and countriesin the same study. It proved to be a practical and easy wayof identifying the main groups of women who most con-tribute to the overall rate of CS. Since this classification isbased upon well defined parameters (see Tables 1 and 2),inconsistencies in classification are very unlikely. Beingable to compare CS rates in a reliable and consistent man-ner over time and between units and countries is one ofthe persisting challenges at the moment which this classi-fication will be capable to overcome. In this respect and inorder to compare the 10-group classification with otheravailable systems, we would recommend that futureresearch and steps include a systematic review of CS clas-
Page 7 of 8(page number not for citation purposes)
Reproductive Health 2009, 6:18 http://www.reproductive-health-journal.com/content/6/1/18
sification systems published and analyze the advantagesand deficiencies of each system.
ConclusionThis classification identified specific groups of women asthe main contributors to the overall CS rate in Latin Amer-ica; groups that could be targeted for relevant effectiveactions. Result from this analysis should encourage localinvestigators and health authorities to use data on CS ratesin innovative approaches in order to maximize the use ofthe collected information, disseminate the results andthink of strategies to reduce these rates when appropriate.
Authors' contributionsAcquisition of primary data and survey implementation: GC(regional coordinator), AL, AN, AV, AF, AA, EV, MR, NZ,SR, VB (country coordinators).
Secondary analysis idea and design of analysis plan: APB, MG,MR, MM, DW.
Analysis and interpretation of the data: APB, MG, MR, MM,DW.
Drafting of the manuscript: APB, MM, JPS.
Critical revision of the manuscript for important intellectualcontent: APB, MG, MR, MM, JPS, DW, MW, MRT.
All authors read and approved the final manuscript
Additional material
AcknowledgementsFunding/support: None for the secondary analysis. The original 2004-2005 WHO Global Survey on Maternal and Perinatal Health was funded by UNDP/UNFPA/WHO/World Bank Special Programme of Research, Development and Research Training in Human Reproduction (HRP), Department of Reproductive Health and Research (RHR), WHO, and the US Agency for International Development (USAID).
References1. Betrán AP, Merialdi M, Lauer JA, Bing-shun W, Thomas J, Van Look P,
et al.: Rates of caesarean section: analysis of global, regionaland national estimates. Paediatric and perinatal epidemiology 2007,21:98-113.
2. Belizan JM, Althabe F, Barros FC, Alexander S: Rates and implica-tions of caesarean sections in Latin America: ecologicalstudy. BMJ 1999, 319:1397-1400.
3. Belizan JM, Althabe F, Cafferata ML: Health consequences of theincreasing caesarean section rates. Epidemiology 2007,18:485-486.
4. Hamilton BE, Martin JA, Ventura SJ: Births: preliminary data for2006. Natl Vital Stat Rep 2007, 56:1-18.
5. Wagner M: Fish can't see water: the need to humanize birth.Int J Gynaecol Obstet 2001, 75(Suppl 1):S25-37.
6. Sachs BP, Castro MA: The risk of lowering cesarean-deliveryrate. N Engl J Med 1999, 340:54-57.
7. Robson MS: Classification of caesarean section. Fetal and Mater-nal Medicine Review 2001, 12:23-39.
8. Shah A, Faundes A, Machoki M, Bataglia V, Amokrane F, Donner A, etal.: Methodological considerations in implementing theWHO Global Survey for Monitoring Maternal and PerinatalHealth. Bull World Health Organ 2008, 86:126-131.
9. Villar J, Valladares E, Wojdyla D, Zavaleta N, Carroli G, Velazco A, etal.: Caesarean delivery rates and pregnancy outcomes: the2005 WHO global survey on maternal and perinatal healthin Latin America. Lancet 2006, 367:1819-1829.
10. Villar J, Carroli G, Zavaleta N, Donner A, Wojdyla D, Faundes A, etal.: Maternal and neonatal individual risks and benefits asso-ciated with caesarean delivery: multicentre prospectivestudy. BMJ 2007, 335:1025.
11. Taljaard M, Donner A, Villar J, Wojdyla D, Velazco A, Bataglia V, et al.:Intracluster correlation coefficients from the 2005 WHOGlobal Survey on Maternal and Perinatal Health: implica-tions for implementation research. Paediatr Perinat Epidemiol2008, 22:117-125.
12. Robson MS: National Maternity Hospital Dublin. Clinical report for theyear 2006 Dublin: National Maternity Hospital; 2007.
13. McCarthy FP, Rigg L, Cady L, Cullinane F: A new way of looking atCaesarean section births. Aust N Z J Obstet Gynaecol 2007,47:316-320.
14. Denk CE, Kruse LK, Jain NJ: Surveillance of cesarean section deliveries,New Jersey 1999-2004 New Jersey Department of health and SeniorServices; 2005.
15. Flores PL, Gonzalez Perez GJ, Trejo FJ, Vega LG, Cabrera Pivaral CE,Campos A, et al.: Risk factors in cesarean section. Ginecol ObstetMex 2008, 76:392-397.
16. Ecker JL, Chen KT, Cohen AP, Riley LE, Lieberman ES: Increasedrisk of cesarean delivery with advancing maternal age: indi-cations and associated factors in nulliparous women. Am JObstet Gynecol 2001, 185:883-887.
17. Thomas J, Paranjothy S: Royal College of Obstetricians and GynaecologistsClinical Effectiveness Support Unit. The National Sentinel Caesarean Sec-tion Audit Report London, United Kingdom: RCOG Press; 2001.
18. Florica M, Stephansson O, Nordstrom L: Indications associatedwith increased cesarean section rates in a Swedish hospital.Int J Gynaecol Obstet 2006, 92:181-185.
19. Vera C, Correa R, Neira J, Rioseco A, Poblete A: Utilidad de laevaluación de 10 grupos clínicos obstétricos para la reduc-ción de la tasa de cesárea en un hospital docente. Rev ChilObstet Ginecol 2004, 69:219-226.
Additional file 1Data by country. This file presents the tables for the 10-group classifica-tion for each of the 8 countries in this survey.Click here for file[http://www.biomedcentral.com/content/supplementary/1742-4755-6-18-S1.doc]
Additional file 2Stratified analysis. This file presents the results from the stratified anal-ysis by type of institution and education of the mother.Click here for file[http://www.biomedcentral.com/content/supplementary/1742-4755-6-18-S2.doc]
Page 8 of 8(page number not for citation purposes)
http://www.ncbi.nlm.nih.gov/entrez/query.fcgi?cmd=Retrieve&db=PubMed&dopt=Abstract&list_uids=9878648
Related Documents