WHO Expert Meeting on Pharmaceutical Indicators, Monitoring and Assessment 10-12 July 2006 Geneva, Switzerland Department of Technical Cooperation for Essential Drugs and Traditional Medicine Department of Medicines Policy and Standards

Welcome message from author
This document is posted to help you gain knowledge. Please leave a comment to let me know what you think about it! Share it to your friends and learn new things together.
Transcript

WHO Expert Meeting on Pharmaceutical Indicators, Monitoring and Assessment
10-12 July 2006 Geneva, Switzerland
Department of Technical Cooperation for Essential Drugs and Traditional Medicine Department of Medicines Policy and Standards

This document has been produced with the financial assistance of the European Community. The views expressed herein are those of the authors and can therefore in no way be taken to reflect the official opinion of the European Community.
European Community
© World Health Organization 2006 All rights reserved. Publications of the World Health Organization can be obtained from Marketing and Dissemination, World Health Organization, 20 Avenue Appia, 1211 Geneva 27, Switzerland (tel: +41 22 791 2476; fax: +41 22 791 4857; email: [email protected]). Requests for permission to reproduce or translate WHO publications – whether for sale or for noncommercial distribution – should be addressed to Publications, at the above address (fax: +41 22 791 4806; email: [email protected]). The designations employed and the presentation of the material in this publication do not imply the expression of any opinion whatsoever on the part of the World Health Organization concerning the legal status of any country, territory, city or area or of its authorities, or concerning the delimitation of its frontiers or boundaries. Dotted lines on maps represent approximate border lines for which there may not yet be full agreement. The mention of specific companies or of certain manufacturers’ products does not imply that they are endorsed or recommended by the World Health Organization in preference to others of a similar nature that are not mentioned. Errors and omissions excepted, the names of proprietary products are distinguished by initial capital letters. The World Health Organization does not warrant that the information contained in this publication is complete and correct and shall not be liable for any damages incurred as a result of its use.

Table of Contents
Executive Summary 1 Background 4 Meeting Overview 5
Objectives ........................................................................................................................... 5 Structure and Process.......................................................................................................... 6
Session Reports 9
Session 1: Refinement of Level I Questionnaire ................................................................ 9 WHO hierarchical approach to indicator-based monitoring and assessment.................... 10 Level I streamlining and data quality issues ..................................................................... 12 Group work for Level I indicators .................................................................................... 13 Session 2: Development of Level II Household Survey ................................................... 17 Introduction to the household survey................................................................................ 17 Results of household survey in Brazil .............................................................................. 17 Results of household survey in Solomon Islands (SI) ...................................................... 18 Group work for the household survey .............................................................................. 21 Session 3: Level II Facility Survey and Additional Level III Indicators .......................... 25 Paediatric essential medicines: Possible indicators .......................................................... 26 Regulatory assessment ...................................................................................................... 27 Regulatory assessment and the Level I tool...................................................................... 28 Measuring transparency and vulnerability to corruption .................................................. 29 Pricing and availability ..................................................................................................... 31 Study on medicines supply in faith-based organizations in sub-Saharan Africa .............. 32 INRUD Initiative on Adherence Measurement for Antiretroviral Medicine.................... 33 Primary Health Care prescribing indicators in developing countries ............................... 36 Group work for Level II indicators ................................................................................... 38 Special Topics................................................................................................................... 42 HTP Survey and the Global Indicator System.................................................................. 42 Service Availability Mapping (SAM)............................................................................... 43 Proposed medium-term strategic plan 2008 - 2013 (SO12).............................................. 43 Session 4: Feasibility of Composite Indicators................................................................. 46 Next Steps ......................................................................................................................... 48
Annexes 49
Annex 1: Meeting Agenda ................................................................................................ 51 Annex 2: List of Participants ............................................................................................ 55 Annex 3: List of Presentations.......................................................................................... 57 Annex 4: Guide for Group Work (Chairs, Rapporteurs, Members) ................................. 59 Annex 5: Timetable for Future Activities ......................................................................... 61 Annex 6: Flyer for Indicator-based Assessment and Monitoring ..................................... 63


WHO Expert Meeting on Pharmaceutical Monitoring 10-12 July 2006
Executive Summary
WHO has developed a hierarchical approach to monitoring and assessing pharmaceutical situations that consists of three levels of indicators and corresponding data collection tools: Level I structure and process indicators that can be completed by knowledgeable individuals with no ad hoc data collection; Level II access and rational use outcome indicators that are measured using facility and household surveys; Level III indicators that are measured using in-depth surveys of specific aspects of pharmaceutical systems.
The WHO pharmaceutical sector monitoring and assessment methodology has continuously evolved to meet emerging needs, while incorporating improvements based on feedback from countries using the methods. The present approach, developed in 1999 for Level I and in 2000 for Level II indicators, has been applied in many countries. The approach has many advantages: numerous countries measuring indicators using consistent methods; possibility of comparing and disseminating results; and the possibility to assess progress towards defined targets.
A meeting of experts was organized in July 2006 to discuss the current status of WHO indicator-based pharmaceutical assessment and monitoring approaches and to make recommendations for future improvements. The objectives of the meeting were: (1) to review global progress on measuring pharmaceutical indicators; (2) to address perceived limitations in the Level I tools; (3) to review existing Level III tools to determine if key Level III indicators could be incorporated in the current Level II tool; (4) to assess the adequacy of the existing Level II household survey in measuring population-based indicators of access and rational use; and (5) to discuss the feasibility of formulating and validating composite indicators based on Level I data as proxy measures for Level II outcome indicators.
The early part of the meeting was divided into sessions focused on each of the meeting objectives. During each session, participating experts and WHO staff members gave presentations on the existing pharmaceutical sector monitoring and assessment tools, including results of studies conducted using these tools. A panel of experts was assigned for each session to record comments and recommendations made during the presentations and discussion related to refinement of the methodologies. In the later stage of the meeting, three work groups were assigned to separately discuss and deliberate on the Level I indicators, the Level II indicators; and the household survey. In the final plenary session, each group presented its findings and recommendations.
Results and recommendations of the expert meeting:
Level I indicators-The current level I questionnaire will be revised for the 2007 survey in terms of structuring and grouping of items, clear wording and formatting for logical flow. Some questions with lots of missing data from countries and for which data gathered have questionable validity and accuracy will be dropped. Important relevant questions from Level III indicators will be included.
1

WHO Expert Meeting on Pharmaceutical Monitoring 10-12 July 2006
Complimentary to the usual data collection process with regional offices, a web based questionnaire will be designed to improve reliability and to be able to validate data.
The suggestion to drop the question on estimate % of population with access to essential medicines has to be discussed between PSM and TCM.
Household survey (population based Level II survey) -The household survey will be restructured with the objectives of making available community based information on access and use of medicines that can be used and will direct the design of interventions and strategies at facility, district, national, international level and of providing population based evidenced to guide policy making, management, implementation and advocacy strategies on improving access and use of medicines. Guiding principles for household tool development were identified during the meeting such as: relevance to information needs of countries, that it should be resource and time efficient (done with Level II facility survey). It will be tagged as Level II population based survey.
The household survey will be inclusive of acute and chronic diseases and will attempt to come up with relevant socio economic measurement that will describe access and affordability.
A working group will be formed.
Level II health facility/provider survey-Issue on list and number of key medicines in the survey has been agreed- 15 key medicines identified as most important and should be available at all levels of facilities at all time.
The opportunity to gather pricing data will be used with several modifications to be recommended on the survey form. Questions for patients to determine access will be developed and added to the patient exit interview both at public and private outlet. This will supplement the information from the household survey.
Information on safety and regulatory issues can also be added in Level II such as questions on dispensing prescription only medicines without prescriptions, counterfeit, existence of banned drugs, if a qualified dispensing staff present at the public and private pharmacy.
Guidelines on sampling issues such as statistical and practical justification of sampling, valid comparison will be reviewed and addressed.
The manual will also attempt to provide guidelines how countries can use the results, guidelines to set targets and discussion on standard performance. Practical statistical analysis and reporting will also be discussed such as use of medians and percentiles. The manual will also be explaining other Level III tools in relation to over all monitoring and assessment activity.
Others There should be more assistance to countries and practical tool and model/template of country reports developed as well as how countries can use the results. Country teams can frequently conduct field work adequately but lack skills to evaluate the information produced and write reports that support better decision making and planning.
2

WHO Expert Meeting on Pharmaceutical Monitoring 10-12 July 2006
Composite indicators will be explored as an ad-hoc activity to the Level I indicator review and further development unto 2007 survey.
Timely sharing of data and information will be ensured through allowing more people to access the data based, and timely publication and dissemination of results.
To promote advocacy of monitoring, during the post meeting work by the secretariat, meeting chair and rapporteur the idea of developing a flyer (Annex 6- Draft flyer) was suggested. The HTP Information officer will be consulted.
3
WHO Expert Meeting on Pharmaceutical Monitoring 10-12 July 2006
Background
The pharmaceutical sector is a vital component of health systems. Information on pharmaceutical issues, gaps, and needs provides important input into the development of health policies. However, the pharmaceutical sector is complex, involving many systems and stakeholders. Thus, a systematic method is needed to assess the structure and process of pharmaceutical systems, to monitor results, and to assess the impact of country strategies and activities on access to and use of quality medicines.
WHO TCM and PSM have developed three levels of monitoring indicators and corresponding data collection tools (Figure 1). The Level I key informant questionnaire and indicators provide a rapid means of obtaining information on the existing infrastructure and the key processes needed within each component of the pharmaceutical sector. The Level II methodology, involving a rapid sample health facility survey and accompanying household survey, measures systematic indicators to describe the degree of attainment of key national medicine policy objectives related to access to and rational use of quality medicines. The Level III in-depth tools and indicators assess in more detail specific components of the pharmaceutical sector.
Level I Key informant questionnaire Core structure sent to countries & process indicators
Level II
Figure 1
Rational use of medicines
Core outcome/impact indicators Access to essential medicines
Level III
Systematic health facility and household surveys
In-depth assessments of specific components of the pharmaceutical sector ● Pricing ● Traditional medicines ● HIV/AIDS ● Regulatory capacity ● TRIPS
4
WHO Expert Meeting on Pharmaceutical Monitoring 10-12 July 2006
Meeting Overview
An Expert Meeting on Pharmaceutical Indicators, Monitoring, and Assessment was conducted at WHO headquarters in Geneva, Switzerland from 10-12 July 2006, co-organized by the Department of Technical Cooperation for Essential Drugs and Traditional Medicine (TCM) and the Department of Medicines Policies and Standards (PSM). The meeting (see Annex 1 for Meeting Agenda) brought together experts (see Annex 2 for List of Participants) with experience in developing and using indicators to assess and monitor pharmaceutical situations. Others with expertise in related fields such as data gathering, management, and analysis were also invited.
Objectives
The specific objectives of the meeting were to:
1. Review overall progress on pharmaceutical indicators and address limitations noted in the Level I questionnaire
• To shorten the Level I questionnaire by focusing on key items with face validity and high response rates
• To discuss the feasibility of administering the survey electronically using a web-based technology
• To address solutions for the potential errors in the current data that result using a single country informant
2. Plan further development of the Level II household survey
• To present household surveys from some countries • To review the current household survey in order to develop methods and content
to maximize information on access and drug use
3. Refine Level II indicators and methods in light of existing Level III tools
• To determine whether specific indicators from level III tools could be included in a comprehensive Level II survey
• To determine the feasibility of standard computerized data entry and reporting templates that would facilitate data analysis.
• To formulate a guideline on data analysis and reporting
4. Explore the development of composite scores based on Level 1 indicators
• To discuss the feasibility of and identify steps to develop composite indicators from Level 1I questionnaires
5

WHO Expert Meeting on Pharmaceutical Monitoring 10-12 July 2006
• To define the domain that each composite score would measure (e.g., access to medicines, rational use, product quality assurance, etc), as well as specific components of that domain
Structure and Process
The first two days of the meeting were divided into four technical sessions corresponding to each of the meeting objectives described above. In addition, the second afternoon also contained three special presentations describing how the WHO work on pharmaceutical indicator development interfaces with existing data tools, information management systems, and with WHO Strategic Objective 12 for the planning period 2008-2013. At the end of the second day, participants divided into small working groups to formulate specific recommendations in each of these topic areas. In the final plenary session on the third day, participants discussed the recommendations from the small group sessions and next steps.
The meeting agenda described a set of specific objectives for each session to guide the chairs, rapporteurs, presenters, and participants in focusing the discussion. A designated chair moderated each session, while rapporteurs took notes about key points during the presentations, questions raised by participants, and issues discussed. These are summarized in this meeting report.
Presentations by the invited speakers in their areas of expertise (see Annex 3 for List of Presentations) were followed by a time for questions and discussion. Prior to the meeting, each speaker was given a template of talking points to ensure that presentations related well to the session objectives.
A panel of experts was assigned to support each session. Members of the panels were given the floor during the session to make comments and recommendations pertaining to the presentations and to provide insights based on their knowledge and experiences that related to the objectives for each session.
Three working groups were assigned to discuss streamlining of the Level I questionnaire, modifications to the Level II health facility indicators, and development of the Level II household survey. A guide was given to each group to structure discussions (see Annex 4 for Guide for Group Work). Each group was also provided with the minutes of the relevant technical session as input to the group work. Each group was to discuss the following general questions:
• Are there elements from the technical presentations that we should consider including in the Level I or Level II tools?
• Are all of the current indicators reliable and useful? • Which indicators could be cut? • What indicators are missing? (Suggested additions should be very selective)
In the final plenary session, small groups presented their findings and recommendations, which are summarized in this report at the end of each technical session. Key recommendations were noted by rapporteurs as the session progressed. It was agreed that at the conclusion of the meeting, a draft report with all the key points from the presentations, issues raised during discussions, and findings from the small
6
WHO Expert Meeting on Pharmaceutical Monitoring 10-12 July 2006
groups would be circulated for comments and feedback by all participants. The timeframe for this feedback would necessarily be short in order to meet future time frames for collecting the Level I and Level II indicators. After comments were integrated, a meeting report would be published.
Precious Matsoso, the TCM Director, gave the remarks to close the three-day meeting. She congratulated the participants on being able to make such substantial progress towards completing the meeting objectives within the short time available.
7

WHO Expert Meeting on Pharmaceutical Monitoring 10-12 July 2006
8

WHO Expert Meeting on Pharmaceutical Monitoring 10-12 July 2006
Session Reports
Before the formal sessions, the scene was set by an introduction of the WHO hierarchical approach to monitoring and assessment, the associated data collection tools, and history of previous data collection cycles. Results from the publication Using indicators to measure country pharmaceutical situations: Fact Book on WHO Level I and Level II monitoring indicators were presented to set the tone for the meeting and to describe what has been achieved in previous work.
Reports of the technical sessions are presented in the order in which the sessions were conducted. Each section that follows contains a summary of the key points made during the technical presentations, as well as highlights of the questions, comments, and discussion that followed. Recommendations from the small groups are included at the end of the sections on the Level I questionnaire, the Level II Household survey, and the Level II indicators. All presentations on Level III in-depth tools are summarized in the Level II section of the report, even though some indicators derived from Level III studies were recommended to be included in the Level I questionnaire.
Summaries of the special presentations are grouped together as a separate section, including descriptions of the WHO Health Technology Policy (HTP) Survey & Global Indicator System and the WHO Service Availability Mapping (SAM) system. Discussion has also been included in this section about the monitoring needs for WHO Strategic Objective 12 (SO12) for the 2008-2013 planning period.
9
WHO Expert Meeting on Pharmaceutical Monitoring 10-12 July 2006
Session 1: Refinement of Level I Questionnaire
The Level I monitoring indicators are derived from responses to a questionnaire sent to key country informants. Two rounds of Level I indicator surveys have been conducted in 1999 and 2003, with another survey scheduled to be conducted in 2007. This session aimed to improve the current Level I questionnaire based on experience from the previous surveys and on the analysis of data included in the Level I and Level II Fact book.
WHO hierarchical approach to indicator-based monitoring and assessment Daisy Carandang, WHO TCM, Geneva
Presentation key points
WHO pharmaceutical indicator based monitoring and assessment • The pharmaceutical sector is a very important component of the health care
system. Monitoring of the pharmaceutical situation is important to guide decision making and planning to achieve better outcomes in the areas of access, product quality, and rational use of medicines. It is important to spread the culture of monitoring and evaluation at country level.
• The objectives of an evidence-based approach are: to prioritize pharmaceutical policy objectives based on evidence; to determine status of policy implementation and achievement of objectives over time; and to establish situational evidence for advocacy.
• An indicators-based monitoring approach requires a stable and reliable methodology in order to produce high quality longitudinal data for decision making. The aim is to develop a feasible, low cost methodology that can provide reliable and useful data.
• Pharmaceutical indicators were first developed by WHO in the 1980`s. The present approach was implemented in 1999 for Level I indicators and 2000 for Level II indicators.
Publication on Level I & Level II Fact Book • WHO recently published Fact Book reporting results to date for Level I and
Level II pharmaceutical sector indicators. The publication provides an overview of the current status of the implementation of national drug policies and the success of countries in achieving objectives related to access and rational use.
• The Fact Book contains results of the Level I indicator survey conducted globally in 2003, comparisons to results of the 1999 Level I survey, and results of Level II indicator surveys conducted between 2002 and 2004.
10

WHO Expert Meeting on Pharmaceutical Monitoring 10-12 July 2006
• Countries are grouped in low-, middle-, and high-income categories. Median (middle) values are used in the report since they are less sensitive to outliers than mean (average) values.
• Results are presented in the Fact Book for eight pharmaceutical sector components: national medicines policy; legislation and regulation; quality control of pharmaceuticals; medicines financing systems and policies; supply of medicines in the public sector; intellectual property rights, patents, and local production; access to essential medicines; and rational use of medicines.
• Ideal targets for the monitoring indicators vary. For some Level I indicators (% of medicines dispensed, % dispensed with adequate labels, % of medicines prescribed by generic name, % adequate patient knowledge), values are ideally 100%. For others (e.g., % of patients prescribed antibiotics, % prescribed injections, average number of drug prescribed), ideal values depend on country context (e.g., baseline situation, existence of guidelines, epidemiological profile).
• Results presented in the Fact Book demonstrate that some aspects are improving (e.g., more countries with updated National Medicines Policies and Essential Medicines Lists). However, there are still notable gaps in most areas particularly for rational use of medicines.
• The results of this survey have helped WHO to set priorities in its work plan in order to assist countries in strengthening their pharmaceuticals Policies.
Discussion and comments
• Monitoring should lead to better planning and policy implementation with set targets. Countries should move beyond assessment without adequate response.
• The Level II and Level III surveys are challenging. It is uncertain how many countries are capable of conducting these surveys without technical assistance?
• Comprehensive pharmaceutical studies using Level I and Level II indicators are similar to the previous National Medicines Policy (NMP) indicator approach. The current tools were developed to simplify the NMP indicator tools.
• There is a need for a strategic framework for indicator-based studies. Countries should be supported to use the approach and apply the results to practical and relevant country planning, prioritization, budget allocation, target setting, and implementation.
• It is also important to support strategic actions on the global level on the evidence base.
• Country teams can frequently conduct field work adequately but, in general, lack skills to evaluate the information produced and write reports that support better decision making and planning.
11
WHO Expert Meeting on Pharmaceutical Monitoring 10-12 July 2006
Level I streamlining and data quality issues Dennis Ross Degnan, Harvard Medical School, Boston
Presentation content
• The Level I questionnaire is currently organized in 10 topics: NMP; legislation/regulation; quality control of pharmaceuticals; medicines supply system; medicines financing; access to essential medicines; EML; rational use of medicines; and production and trade.
• The current data collection approach is an inexpensive way to gather large volume of data, can be repeated at regular intervals for longitudinal comparisons, and permits automated data collection and encoding.
• However, disadvantages include: varied interpretation of questions by respondents; varied quality of respondents; no validation of data; large numbers of missing responses in many countries.
• The structure of the questionnaire can be improved by restructuring items and skip patterns for a more logical flow, clarifying this with formatting, and shortening the questionnaire.
• Questions should be more clearly worded and as much as possible, kept consistent over time for longitudinal comparisons.
• Items not included in the Fact Book, those with high percentage of missing data, and those with better sources of data (e.g., production, trade, patent protection) should be reviewed for possible deletion; open ended questions should be avoided.
• The data collection process should be redesigned to improve reliability, perhaps with the questionnaire sent to more than one respondent; responses should be submitted to quality control, data checking, and comparison to other sources.
• Data collection should be web-based, with an on-line glossary, automated skip patterns, and forced responses where indicated.
Discussion and comments
• There are many unclear questions in the Level I questionnaire, and respondents may have difficulties in interpreting items or providing accurate responses.
• Putting the questionnaire on the web may facilitate checking and validation • It was agreed that all items should be reviewed. Some were skipped by many
countries, while others were ambiguous or misunderstood, posing problems for validity and accuracy of data.
• The meeting agreed that the Working Group revising the Level I questionnaire should review items that had been flagged as problems and either modify these questions to make them easier to understand or remove them.
• The commitment of governments to use the information is as important as data reliability, and this point should be considered when revising the data collection process.
• The question on percentage of population with access to essential medicines is particularly problematic since there is no basis to provide an accurate response.
12

WHO Expert Meeting on Pharmaceutical Monitoring 10-12 July 2006
Group work for Level I indicators
Overview of group process
The main criteria used by the group to assess each indicator were feasibility, reliability, and usefulness. The proposed dynamic for the discussion was:
1. Go through the questionnaire, item by item to assess which indicators could be cut; and which could be added (considering the material in the technical presentations);
2. Discuss the process of gathering data in order to enhance validity, reliability and legitimacy;
3. Discuss the feasibility of developing composite indicators.
Summary of recommendations
Recommendation Rationale
General Issues
Reorganize the ordering of sections, looking for a more logical flow
Facilitate the flow of answers. In general, to complete the questionnaire, it is necessary to consult many people. Better organization would facilitate this process.
Move to web-based data collection, with access control, on-line glossary, automated skip patterns, required responses. Explore possibility of respondents attaching important documents (NMP, EML) and granting permission to make docs available
Improve reliability and feasibility
Include recommendations on best process for completing the questionnaire, with specific people assigned to complete each section. Countries should constitute a committee of stakeholders to validate information.
Improve quality of data Enhance transparency, reliability, legitimacy
Create new section on Access to Medicines, integrating former sections 4, 5, and 7, with questions ordered as EML, Medicines Financing and Price, Supply
Keep coherence with other WHO documents in which these are the NMP components linked to access
Avoid excessive changes and rephrasing in the questionnaire
Keep consistency for comparisons over time
13

WHO Expert Meeting on Pharmaceutical Monitoring 10-12 July 2006
Recommendation Rationale
Section 1 – National Medicine Policy
1.1 Include in Level II one indicator on whether the NMP is present in the facility. (There was discussion on where the NMP document should really be.)
To assess implementation and transparency
Include an indicator to assess what proportion of the NMP plan is funded (fully/ mostly/ partially funded/ not funded)
Assess sustainability and feasibility of the NMP
Rephrase 1.3; Add a footnote with clarification of this question (replace “integration” with “linked”) The group discussed if it would be better to ask first if there is a Health Policy Plan, since most countries do have a HPP. Some felt that the NMP is more likely to be updated than the HPP.
To make the question more understandable to respondents The intention is to know if the last version of NMP and HPP; this needs an explanatory footnote.
Delete 1.4 TM (other group is working on it) Rephrase 1.5: “Is there a framework for monitoring and evaluation within the implementation plan?” Assess if there is an overall monitoring framework or specific studies (e.g., access, regulation, rational use)
Important to know if there is monitoring on a regular basis Though monitoring is always in the plan, it is not always implemented and thus it is important to track progress
Section 2. Legislation/ Regulation Complete review of the order of the sub-sections in light of “Developing Drug Regulation.” Organize groups of questions concerning laws and groups of questions concerning practice; differentiate between laws that deal with products and laws that cover practice.
The order in this document represents better the way most Drug Regulatory Authorities work; this may make it easier to complete the survey The group considered it important to be consistent with the Level 3 assessment Ideally, Level 1 indicators should permit calculation of level of performance, as proposed in the Level 3 tool
Include indicators on: Is there a formal committee for registration? Are registration guidelines publicly available? (define “public availability” in the glossary) Add a question concerning promotion Add a question concerning marketing authorization
Measure vulnerability to corruption and transparency If the first suggestion in this section is implemented, some other indicators will be included.
14
WHO Expert Meeting on Pharmaceutical Monitoring 10-12 July 2006
Recommendation Rationale
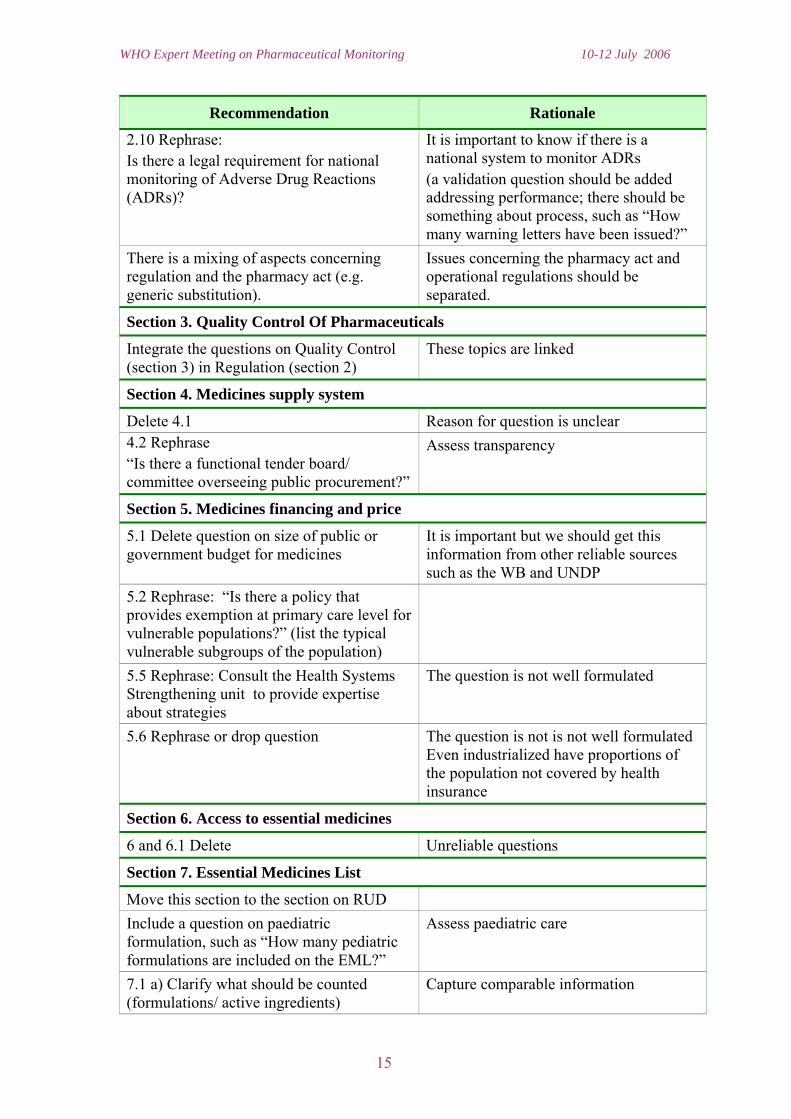
2.10 Rephrase: Is there a legal requirement for national monitoring of Adverse Drug Reactions (ADRs)?
It is important to know if there is a national system to monitor ADRs (a validation question should be added addressing performance; there should be something about process, such as “How many warning letters have been issued?”
There is a mixing of aspects concerning regulation and the pharmacy act (e.g. generic substitution).
Issues concerning the pharmacy act and operational regulations should be separated.
Section 3. Quality Control Of Pharmaceuticals
Integrate the questions on Quality Control (section 3) in Regulation (section 2)
These topics are linked
Section 4. Medicines supply system
Delete 4.1 Reason for question is unclear 4.2 Rephrase “Is there a functional tender board/ committee overseeing public procurement?”
Assess transparency
Section 5. Medicines financing and price
5.1 Delete question on size of public or government budget for medicines
It is important but we should get this information from other reliable sources such as the WB and UNDP
5.2 Rephrase: “Is there a policy that provides exemption at primary care level for vulnerable populations?” (list the typical vulnerable subgroups of the population)
5.5 Rephrase: Consult the Health Systems Strengthening unit to provide expertise about strategies
The question is not well formulated
5.6 Rephrase or drop question The question is not is not well formulated Even industrialized have proportions of the population not covered by health insurance
Section 6. Access to essential medicines
6 and 6.1 Delete Unreliable questions
Section 7. Essential Medicines List
Move this section to the section on RUD Include a question on paediatric formulation, such as “How many pediatric formulations are included on the EML?”
Assess paediatric care
7.1 a) Clarify what should be counted (formulations/ active ingredients)
Capture comparable information
15

WHO Expert Meeting on Pharmaceutical Monitoring 10-12 July 2006
Recommendation Rationale
Section 8. Rational Use of Medicines
8.3 Move to the section on Regulation 8.4 Rephrase: “Are Civil Society organizations and NGOs involved in the surveillance of drug promotion?”
Transparency
8.5 Rephrase: “Are the following elements part of the basic curricula in most health training institutions?”
Some elements, such as EML, are more important to other functions in the pharmaceutical system than prescribing
8.6 Review Philosophy is good but the banks are now into that business
Delete 8.9; 8.10 and 8.15 Not used in the report
Comments on group work presentation
All questions on RDU are important, are being used in WHO and national reports, and therefore should not be deleted.
16

WHO Expert Meeting on Pharmaceutical Monitoring 10-12 July 2006
Session 2: Development of Level II Household Survey
The Level II Household Survey provides population-level data on access to medicines to complement the indicators on access and use produces by the Level II health facility survey. In this session, after an introduction that reviewed the overall objectives of the household survey, two country presentations described recent experience in using the survey and results from Brazil and the Solomon Islands.
Introduction to the household survey D Carandang- TCM/WHO Geneva
The objective of the household survey is to fill the information gap about access to medicines at the population level. Information such as whether people have financial and geographical access to essential medicines as well as how essential medicines are used are among the data collected in the survey. These data provide useful measures of the outcomes of pharmaceutical policies on the functioning and well-being of individuals.
The presentation underscored the challenges of developing an appropriate household survey, which include:
• Complexity of quantitative and qualitative questionnaires • Devising an appropriate and manageable methodology and sample size • Availability of adequate resources and local capacity • Appropriateness of training • Management of the large amount of data produced by the survey • Measuring all of the intended information in a brief (ideally one-page) tool.
Results of household survey in Brazil Vera Lucia Luiza, National School of Public Health, Brazil
Brazil’s study illustrated the use of the household survey in a large country with medium income. Brazil has a population of 176 million, of which 81% live in urban areas, a literacy rate of 86%, life expectancy of 72 years, infant mortality rate of 28.6 per 100,000 births, and 28% of its residents living below poverty level.
Since 1988 services in the public health care system have been provided for free, including the provision of essential medicines. Overall, 65% of hospital care is provided in private institutions, while 76% of ambulatory care is in public institutions. A National Medicines Policy was introduced in 1998. The country has a vibrant pharmaceutical industry (450 manufacturers) which controls 75% of the market. There are 15,831 medicines in the Brazilian market and the country spent US $756 million on medicines in 2003.
The household survey was conducted in 10 municipalities in 5 states, in the geographic area associated with 30 health facilities. Most of the symptoms recorded
17

WHO Expert Meeting on Pharmaceutical Monitoring 10-12 July 2006
were acute respiratory infections, fever, and headaches. Most people (97%) did something about their symptoms. More medicines were obtained from private pharmacies (52%) than public ones (23%). Average expenditure on medicines was 2.7 days’ wages. While more people (67%) preferred using informal health care sources, half of the respondents (48%) sought care from professionals; only 3% went to private pharmacies. Most prescriptions (88%) were from authorized health care sources.
The household survey methodology was feasible and provided useful data. However, there were difficulties in measuring distances in the field, and in small cites the sampling areas overlapped. One problem is that the sampling methodology, which emphasizes the occurrence of any symptoms, resulted in a study of minor ailments that are not included in the national public health priorities. Because of this, affordability was measured in terms of inexpensive OTC medicines. This does not guarantee that more expensive prescription medications are affordable for the populace. The standard training did not build enough capacity and confidence in participants to enable them coordinate the training themselves for future surveys.
It was recommended that the tool be modified so that the sample includes all diseases. In addition, training materials and the training approach should orient coordinators and supervisors in data base management, analysis, and priority setting.
Results of household survey in Solomon Islands (SI) R Skinner, National Pharmacy Services Division, Ministry of Health, Solomon Islands
SI has a population of about half a million people of which 85% live in the rural areas. With a very low population density of 20 persons per square kilometre, a subsistence economy, and virtually a cashless society, SI has been characterized in recent years by political and social unrest. Peace has been restored since 2003. Road conditions are poor, with frequent disruptions due to inclement weather. Most travel is by sea and the rural communication network is weak.
Although health care is free in SI, there is a high cost of physical access as most clinics are located more than 2 hours walk from home and most hospitals are only accessible by boat, usually involving more than a day’s journey. This results in high death rates from medical and surgical emergencies. About 85% of the population depends on rural clinics manned by nurses who are both prescribers and dispensers due to a dearth of doctors and pharmacists. Wages are low and have not significantly changed in many years. There is virtually no private sector medicine provision.
The household survey teams consisted of technical level with excellent familiarity with local situations and adequate problem solving skills. The constraints encountered during the household surveys included:
• Inability to sample 30 persons, even allowing 2 days in each clinic; • Poor weather conditions which made access to some sample facilities
impossible necessitating substitution with adjacent localities with similar characteristics;
• Non-availability of most households during the day and non-availability of transportation after dark.
18

WHO Expert Meeting on Pharmaceutical Monitoring 10-12 July 2006
• Language barrier due to large number of languages spoken in SI • Local Pijin medicine names were quite confusing.
Although, 900 households were targeted, only 536 were able to be sampled. This was due to the sparse population and scattered villages which were often more than 5 km from the health facility.
The results show high use of public health facilities (85%) with virtually no patronage of private facilities which sell medicines at very high prices. Most patients reported fever and most (82%) received medicines. This may be due to several factors:
• Most patients are more seriously ill because of late presentation to the clinic; • Medicines are supplied free of charge; • Prescriber are also dispensers; • There was high medicine availability, as shown by the L2 survey.
Overall, 17% of patients who did not obtain all their medicines because they started to feel better (4%), the medicine was unnecessary (2%), or was unavailable (1%). Self treatment was low and about 15% of patients used leftover medicines. Only about 15% patronized traditional medicine practitioners.
Over a third of medicines recommended and obtained was not taken in full, and were stored for the next illness. This is quite alarming as most diagnoses were for malaria and bacterial infections, indicating rational use of medicine problems. It was very difficult to obtain household expenditure data because trade is mostly by barter.
Weakness of the household survey in SI included:
• Use of symptoms which clash with the local epidemiology of disease; • Focus on affordability based solely on cost of medicines without due
consideration to the cost of physical access to medicines; • Necessity to adapt the instrument’s international criteria which did not take into
consideration the demographic and logistical challenges in SI; • Sampling of small, widely scattered populations; • Multiculturalism, health beliefs, and local understanding of health significance
of symptoms; • Assessment of household expenses in a cashless society; • Self-care and medicine sales assumptions in the instrument; • Effect of language/culture on a symptomatic approach.
It was recommended that a regional training of trainer's workshop would help to create a pool of expertise and facilitate sharing of experiences.
19
WHO Expert Meeting on Pharmaceutical Monitoring 10-12 July 2006
Discussion and comments
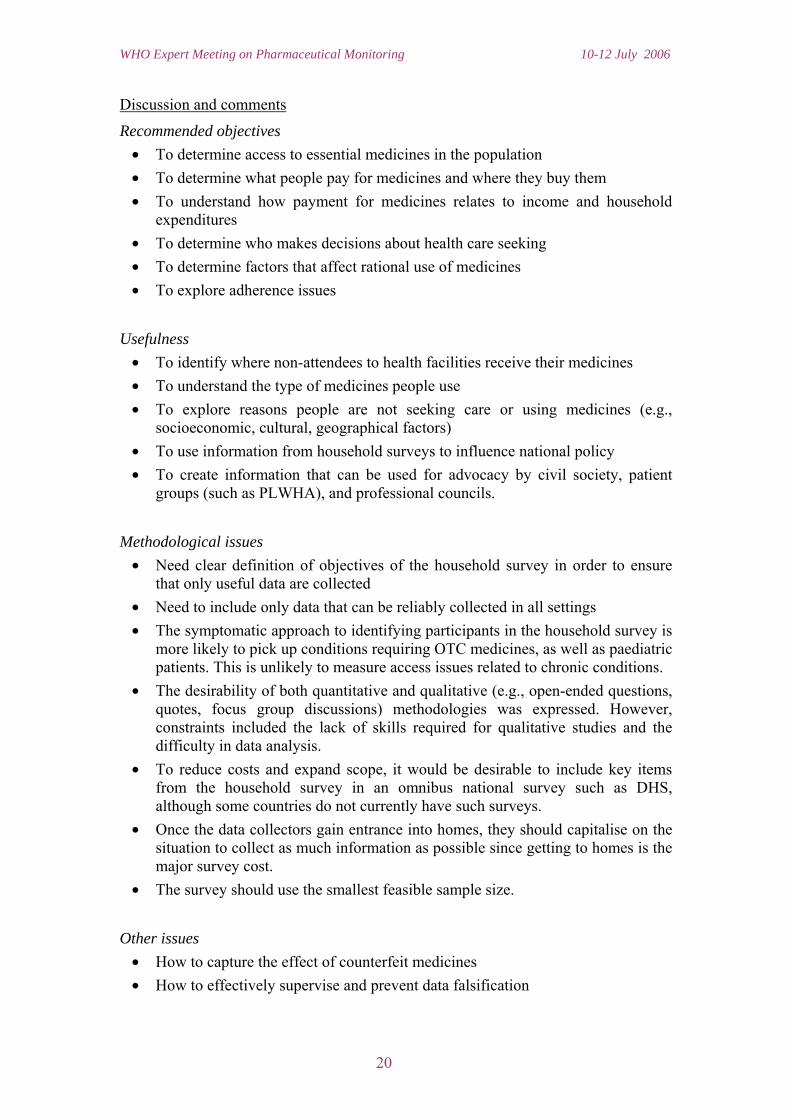
Recommended objectives • To determine access to essential medicines in the population • To determine what people pay for medicines and where they buy them • To understand how payment for medicines relates to income and household
expenditures • To determine who makes decisions about health care seeking • To determine factors that affect rational use of medicines • To explore adherence issues
Usefulness • To identify where non-attendees to health facilities receive their medicines • To understand the type of medicines people use • To explore reasons people are not seeking care or using medicines (e.g.,
socioeconomic, cultural, geographical factors) • To use information from household surveys to influence national policy • To create information that can be used for advocacy by civil society, patient
groups (such as PLWHA), and professional councils.
Methodological issues • Need clear definition of objectives of the household survey in order to ensure
that only useful data are collected • Need to include only data that can be reliably collected in all settings • The symptomatic approach to identifying participants in the household survey is
more likely to pick up conditions requiring OTC medicines, as well as paediatric patients. This is unlikely to measure access issues related to chronic conditions.
• The desirability of both quantitative and qualitative (e.g., open-ended questions, quotes, focus group discussions) methodologies was expressed. However, constraints included the lack of skills required for qualitative studies and the difficulty in data analysis.
• To reduce costs and expand scope, it would be desirable to include key items from the household survey in an omnibus national survey such as DHS, although some countries do not currently have such surveys.
• Once the data collectors gain entrance into homes, they should capitalise on the situation to collect as much information as possible since getting to homes is the major survey cost.
• The survey should use the smallest feasible sample size.
Other issues • How to capture the effect of counterfeit medicines • How to effectively supervise and prevent data falsification
20

WHO Expert Meeting on Pharmaceutical Monitoring 10-12 July 2006
• The need to use computer technology to improve the process of data collection, validation, and analysis
• The constraint of seeking ethical approval, especially when it involves obtaining written consent from illiterate persons
• The difficulty in getting data collectors with relevant pharmacy-related awareness since these skills may be limited in many settings
• The need to incorporate chronic diseases into the survey
Group work for the household survey
The group decided that the tool needed fundamental restructuring and decided on conceptualising an optimal household survey rather than modifying the existing tool. The results of their deliberations are as follows:
Objectives of a household survey
• To provide the necessary complement to the Level II health facility survey, namely, the community aspect
• To measure outcomes related to access to and use of medicines in households • To provide useful information for designing interventions, for national and local
policy makers, for local advocacy groups, and for WHO and other international organizations in their work to support countries to improve access to medicines.
Guiding principles • Focus on the provision of information that would be useful to countries as the
main thrust of the household survey. This was thought to be important to secure the interest of countries and ensure adequate participation and valid information.
• To ensure that the household survey, in conjunction with a Level II health facility survey, can be carried out within a realistic timeframe.
• To develop core and supplementary instruments. The core tool should be completed in not more than 30 minutes and the supplementary tool, which would focus on the care process, could take longer to complete.
• Use primarily quantitative pre-coded questions, but for some items, allow open ended answers which would be analyzed by listing
• To make use of existing validated instruments where possible in the design of the questionnaire.
Tools • The survey should cover the domains of both access and use. • The access domain should address issues about acceptability, affordability,
accessibility, and availability of medicines in the community. These questions should measure the attitudes of the population to medicines, providers and illness; medicines and non-medicine expenditures in relation to socioeconomic
21
WHO Expert Meeting on Pharmaceutical Monitoring 10-12 July 2006
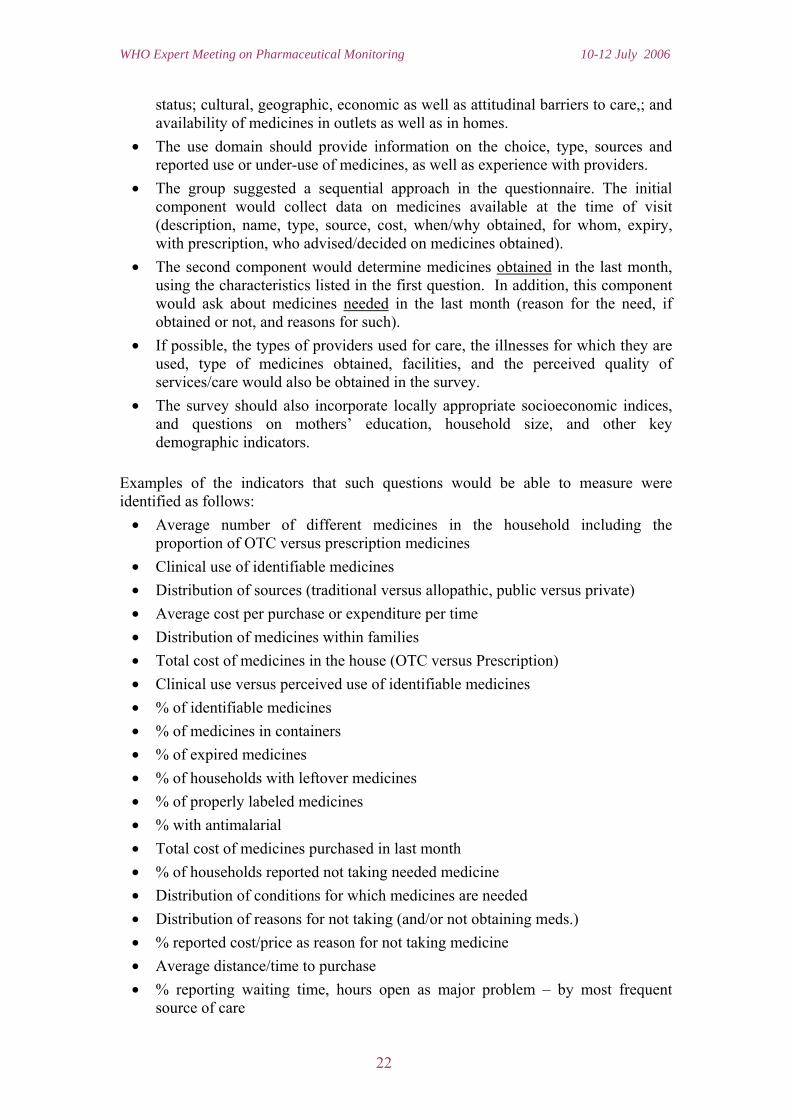
status; cultural, geographic, economic as well as attitudinal barriers to care,; and availability of medicines in outlets as well as in homes.
• The use domain should provide information on the choice, type, sources and reported use or under-use of medicines, as well as experience with providers.
• The group suggested a sequential approach in the questionnaire. The initial component would collect data on medicines available at the time of visit (description, name, type, source, cost, when/why obtained, for whom, expiry, with prescription, who advised/decided on medicines obtained).
• The second component would determine medicines obtained in the last month, using the characteristics listed in the first question. In addition, this component would ask about medicines needed in the last month (reason for the need, if obtained or not, and reasons for such).
• If possible, the types of providers used for care, the illnesses for which they are used, type of medicines obtained, facilities, and the perceived quality of services/care would also be obtained in the survey.
• The survey should also incorporate locally appropriate socioeconomic indices, and questions on mothers’ education, household size, and other key demographic indicators.
Examples of the indicators that such questions would be able to measure were identified as follows:
• Average number of different medicines in the household including the proportion of OTC versus prescription medicines
• Clinical use of identifiable medicines • Distribution of sources (traditional versus allopathic, public versus private) • Average cost per purchase or expenditure per time • Distribution of medicines within families • Total cost of medicines in the house (OTC versus Prescription) • Clinical use versus perceived use of identifiable medicines • % of identifiable medicines • % of medicines in containers • % of expired medicines • % of households with leftover medicines • % of properly labeled medicines • % with antimalarial • Total cost of medicines purchased in last month • % of households reported not taking needed medicine • Distribution of conditions for which medicines are needed • Distribution of reasons for not taking (and/or not obtaining meds.) • % reported cost/price as reason for not taking medicine • Average distance/time to purchase • % reporting waiting time, hours open as major problem – by most frequent
source of care
22
WHO Expert Meeting on Pharmaceutical Monitoring 10-12 July 2006
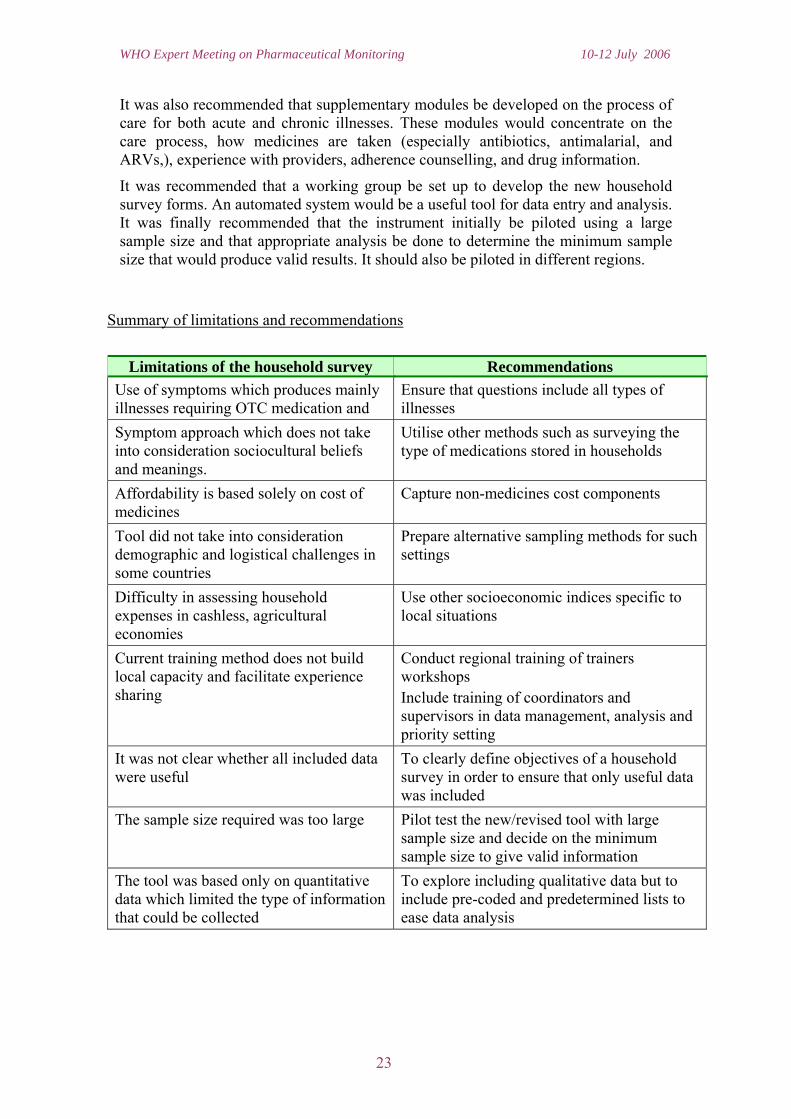
It was also recommended that supplementary modules be developed on the process of care for both acute and chronic illnesses. These modules would concentrate on the care process, how medicines are taken (especially antibiotics, antimalarial, and ARVs,), experience with providers, adherence counselling, and drug information.
It was recommended that a working group be set up to develop the new household survey forms. An automated system would be a useful tool for data entry and analysis. It was finally recommended that the instrument initially be piloted using a large sample size and that appropriate analysis be done to determine the minimum sample size that would produce valid results. It should also be piloted in different regions.
Summary of limitations and recommendations
Limitations of the household survey Recommendations
Use of symptoms which produces mainly illnesses requiring OTC medication and
Ensure that questions include all types of illnesses
Symptom approach which does not take into consideration sociocultural beliefs and meanings.
Utilise other methods such as surveying the type of medications stored in households
Affordability is based solely on cost of medicines
Capture non-medicines cost components
Tool did not take into consideration demographic and logistical challenges in some countries
Prepare alternative sampling methods for such settings
Difficulty in assessing household expenses in cashless, agricultural economies
Use other socioeconomic indices specific to local situations
Current training method does not build local capacity and facilitate experience sharing
Conduct regional training of trainers workshops Include training of coordinators and supervisors in data management, analysis and priority setting
It was not clear whether all included data were useful
To clearly define objectives of a household survey in order to ensure that only useful data was included
The sample size required was too large Pilot test the new/revised tool with large sample size and decide on the minimum sample size to give valid information
The tool was based only on quantitative data which limited the type of information that could be collected
To explore including qualitative data but to include pre-coded and predetermined lists to ease data analysis
23

WHO Expert Meeting on Pharmaceutical Monitoring 10-12 July 2006
Limitations of the household survey Recommendations A very long questionnaire is not desirable To divide the household survey into modules
– a core component to be administered in not more than 30 minutes to address the most important access issues and a longer supplementary module to explore care issues
The tool needs fundamental restructuring and redesigning
To form a working group that will work on incorporating the recommendations in the new tool.
24

WHO Expert Meeting on Pharmaceutical Monitoring 10-12 July 2006
Session 3: Level II Facility Survey and Additional Level III Indicators
The session focused on further development of the Level II indicators. The session began with a series of presentations on existing Level III in-depth surveys, as well as presentations on a set of proposed INRUD ARV adherence indicators and also on issues involved with listing paediatric medicines in EMLs. The session attempted to identify important items mentioned in these presentations that might warrant inclusion as Level II monitoring indicators, that is, data items that could and should be routinely collected in the Level II facility-based survey. Some indicators were also identified that could be included as Level I indicators.
General comment
There were a large number of diverse presentations presented in this single session. However the discussion was very productive in terms of providing information for participants about the Level III tools and achieving the session objectives of identifying additional Level II indicators.
At one point during this session, some participants felt it was necessary to define clearly what constituted II and level III indicators. The following was agreed as a way of differentiating the two levels:
• Level II indicators are collected at health facility and pharmacy level through a systematic survey.
• Level III indicators are more topically focused, and involve an extensive review of one area or one particular system of the pharmaceutical sector; Level III studies are not routinely used since they are quite extensive.
One objective of this session and for the working group considering Level II issues was to identify key indicators currently collected during level III studies that could be integrated in Level II facility surveys for routine monitoring. Examples of such indicators might be:
• Presence of a licensed pharmacist in the pharmacy outlet at the time of the survey
• Number of generic alternatives to an important tracer product available in the outlet at the time of the survey.
For all Level II indicators, it is essential that feedback to government policy makers is built into the study process so that the information collected in the survey can be used for planning and system improvement.
Key points from the technical presentations made as background for the deliberations in this session follow.
25
WHO Expert Meeting on Pharmaceutical Monitoring 10-12 July 2006
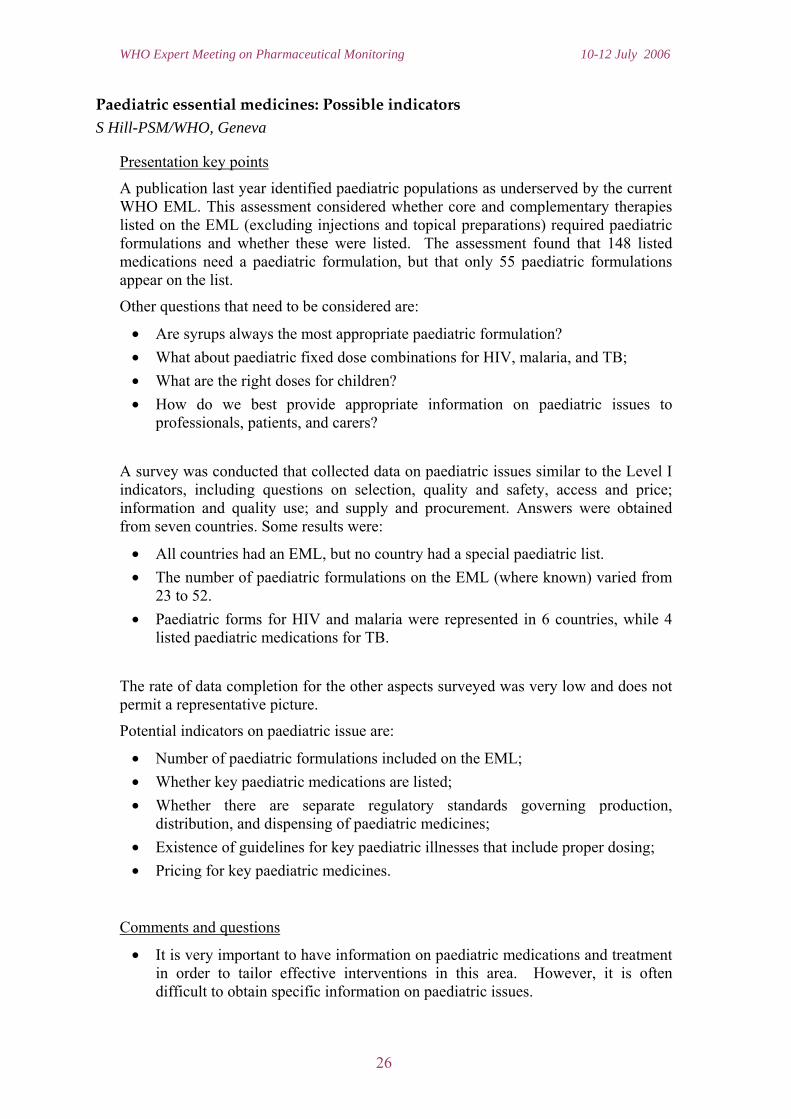
Paediatric essential medicines: Possible indicators S Hill-PSM/WHO, Geneva
Presentation key points
A publication last year identified paediatric populations as underserved by the current WHO EML. This assessment considered whether core and complementary therapies listed on the EML (excluding injections and topical preparations) required paediatric formulations and whether these were listed. The assessment found that 148 listed medications need a paediatric formulation, but that only 55 paediatric formulations appear on the list.
Other questions that need to be considered are:
• Are syrups always the most appropriate paediatric formulation? • What about paediatric fixed dose combinations for HIV, malaria, and TB; • What are the right doses for children? • How do we best provide appropriate information on paediatric issues to
professionals, patients, and carers?
A survey was conducted that collected data on paediatric issues similar to the Level I indicators, including questions on selection, quality and safety, access and price; information and quality use; and supply and procurement. Answers were obtained from seven countries. Some results were:
• All countries had an EML, but no country had a special paediatric list. • The number of paediatric formulations on the EML (where known) varied from
23 to 52. • Paediatric forms for HIV and malaria were represented in 6 countries, while 4
listed paediatric medications for TB.
The rate of data completion for the other aspects surveyed was very low and does not permit a representative picture.
Potential indicators on paediatric issue are:
• Number of paediatric formulations included on the EML; • Whether key paediatric medications are listed; • Whether there are separate regulatory standards governing production,
distribution, and dispensing of paediatric medicines; • Existence of guidelines for key paediatric illnesses that include proper dosing; • Pricing for key paediatric medicines.
Comments and questions
• It is very important to have information on paediatric medications and treatment in order to tailor effective interventions in this area. However, it is often difficult to obtain specific information on paediatric issues.
26

WHO Expert Meeting on Pharmaceutical Monitoring 10-12 July 2006
• It is important to define what is meant by paediatrics to encourage consistency in measurement.
• It is frequently not clear which medicines most need paediatric formulations. • Most indicators mentioned as desirable are already included in the Level I and
Level II surveys. • Including paediatric-specific questions will expand the size of the questionnaire,
and may reduce its feasibility of administration and reduce reliability. • The working group considering Level II indicators should consider which
paediatric indicators should be included, and how to measure them reliably.
Regulatory assessment MP Matsoso, TCM/WHO Geneva
Presentation key points
Several Regulatory Assessment Tools already exist, including the National Drug Regulatory Assessment (NDRA), the Vaccine Tool, the Medical Devices Survey, and the Traditional Medicines Survey. Important concepts from these tools need to be considered for inclusion in the Level II survey. In all, 52 NDRA assessments have been conducted as of December 2003, with 15 assessments conducted as part of vaccine prequalification. Regulatory gaps were identified and countries have been classified according to maturity levels. However, comparing performance of countries based on the data from NDRAs is difficult because of differing philosophies on targets, terminologies, and processes.
The issues that are necessary to promote good regulatory practices nationally and internationally include:
• Optimal regulatory structure and sustainability of resources; • Effective cooperation within the agency and with other agencies; • Transparency and accountability in decision making, with sources of
information made publicly available whenever possible; • Timeliness and competence in evaluating efficacy, safety, and quality; • Independence; • Collaboration as a service provider and degree of information sharing; • Harmonization of standards with other countries and mutual recognition.
In order to assure good review practice we need consistency in approach and quality: accuracy, coherence, completeness, objectivity, and peer review.
Assessment of NDRAs should focus on institutional development to enable progressive realization of defined regulatory goals at all levels. Performance measurement should support setting targets and standards with basic structural, administrative and technical elements. Harmonization should aim at confidence building, joint action, and defining sub-regional performance standards.
27

WHO Expert Meeting on Pharmaceutical Monitoring 10-12 July 2006
Regulatory assessment and the Level I tool Alain Prat, TCM/WHO Geneva
Presentation key points
This session reported on a review of the Level I questionnaire with suggestions for deletions, additions and modifications. The review looked at links, existing and to be established, with the Level II survey. The main criteria in the assessment included pertinence, coherence, integration, and usefulness. The following changes were recommended:
Include sections on: • National Drug Regulatory Authority • Clinical trials • Control of narcotics and psychotropic substances • International cooperation and harmonization
Modify sections: • National Regulatory System, which currently covers medicines and herbal
medicines, should also cover medical devices, blood products, and cosmetics • Information management system within the NDRA • Post-marketing controls, including import and export control, market control,
control of promotion and advertising, and recall procedures • Quality Control Laboratory including legal aspects, quality management system,
and availability of information
Improve upon sections: • Marketing authorization, including legal aspects and availability of information
on registered products • Regulatory inspections, including legal aspects, inspectorate quality
management system (QMS), and availability of information on inspected facilities
• Licensing manufacturers, wholesalers, and retailers, including legal aspects and availability of information on licensed facilities
Discussions and comments
• Most countries begin with Level I and II surveys, which point out broad areas that need further assessment and evaluation.
• Regulatory development is an important area, but we do not have corresponding questions/indicators in the Level II survey.
• Including key questions can indicate to us at this stage that a regulatory area needs further investigation.
28

WHO Expert Meeting on Pharmaceutical Monitoring 10-12 July 2006
• Level II surveys should include supply system and QA indicators, as well as indicators to measure outcomes of key regulatory activity (such as whether there is a pharmacist present in the pharmacy)
• Other areas that could be assess in Level II surveys include: participation in the pharmacovigilance process; types of pharmaceutical personnel in retail outlets, hospitals, clinics dispensaries; involvement in clinical trials in hospitals, and production and compounding in pharmacy, hospitals or clinics.
•
Measuring transparency and vulnerability to corruption Guitelle Baghdadi, PSM/WHO Geneva
Presentation key points
As identified by the World Bank, corruption is the greatest obstacle to economic and social development. A methodology was developed to provide countries a picture of level of transparency and vulnerability to corruption in the field of:
• Registration of medicines • Control of medicine promotion • Inspection of establishments • Selection of essential medicines • Procurement of medicines.
The methodology does not measure the level of corruption per se, but the system’s vulnerability to corruption. Elements from this methodology that could be considered for inclusion in the Level I indicators questionnaire:
Registration • Publicly available list of registered pharmaceutical products • Written procedures for submission of applications • Standard application form for submission of applications • Document describing composition of registration committee • Terms of reference for registration committee • Conflict of interest form • Decision-making process • Appeal process
Control of Drug Promotion • Provisions in the medicine legislation/regulations covering drug promotion • Service or committee responsible for monitoring and enforcing these provisions
29

WHO Expert Meeting on Pharmaceutical Monitoring 10-12 July 2006
Inspection • Provision in the medicines legislation/regulations covering inspection of
medicines manufacturers and distributors • Inspection findings and conclusions subject to an internal review
Selection • Publicly available national essential medicines list • Publicly available criteria for EML selection process • Transparent procedures for EML selection process • Conflict of interest forms • TOR selection committee • Clarity and transparency of the decision-making process
Procurement • Competitive and transparent procedures • Post tender mechanism to monitor suppliers' performance • Appeal process for applicants with rejected bids • Audits of procurement offices • Criteria for tender committee membership (by function or expertise) • Management information system to report products problems
Discussion and comments
• Participants were interested to know if this survey would be extended to other regions outside of the Asia-Pacific. So far, a survey in Bolivia is planned and there are requests from some African countries. The major limitation is funding.
• Missing areas have been identified, including whether all samples and results from the national control laboratory are routinely reported. The team working on this survey intends to include new functions such as licensing of establishments, control of clinical trials, and pharmaceutical distribution.
• There was a question on how to interpret scoring. Qualitative information is very important to crosscheck with quantitative results; narrative reports are requested along with data.
• Information from the Level I survey can be used by countries to measure transparency and vulnerability to corruption. There should be coordination between the teams developing the Level I and Level III tools regarding concepts and methods of analysis that can be recommended to countries as part of assisting them to use the data.
30

WHO Expert Meeting on Pharmaceutical Monitoring 10-12 July 2006
Pricing and availability Klara Tisocki, University of Kuwait
Presentation key points
The presentation focused on the WHO/Health Action International project on Measuring Medicines Prices, including the rationale for monitoring medicine prices and current tools for assessing drug prices and availability. Several comments were presented on the Level II survey forms and possible new Level II indicators.
Comments on Level II Survey Forms
SF1 Availability and Expiry • Check availability and presence of expired drugs for 30 medicines instead of 15
to be consistent with WHO/HAI methodology • Combine SF 1 and SF 2 for availability, price, and expired medicines • Include an additional indicator on proportion of money spent on expired drugs
(value of expired drugs/ value of purchased drugs) in last 12 months
SF2 Medicines Prices • Include specification on package or unit size; the WHO/HAI survey
recommends specific pack sizes, or next largest pack size if not available • Only collect prices of available products • Insert instructions: “Record only the prices of physically available medicines” • Include instructions on how data collectors should deal with package sizes,
strengths, and dosage forms that are different from the specified size (if different package sizes are allowed, there is a need for an additional column)
• Should unit price be calculated on the form (requiring an additional column) or in the accompanying spreadsheet?
SF5 Affordability • SF5 indicator can be calculated from data recorded on SF2 if medicines for
selected standard treatments are included in SF2 list • Affordability can be calculated from individual unit prices (for each facility) or
median unit price (for each sector) in the spreadsheet, in which case there would be no need for SF5
Discussion and comments
• The greatest need for the WHO/HAI project is to develop examples of successful advocacy campaigns to reform pricing policies. There is a challenge in transforming survey managers and MOH personnel into advocates.
• In small countries, the data collection instruments cannot be used as they currently exist; implementation is confronted by multiple problems.
31

WHO Expert Meeting on Pharmaceutical Monitoring 10-12 July 2006
Study on medicines supply in faith-based organizations in sub-Saharan Africa Marthe Everard, PSM/WHO
Presentation key points
The presentation described a multi-country study on medicines supply and distribution in faith-based supply organizations in sub-Saharan Africa, conducted in 2003. The data collection tool contained four structured questionnaires: description of the drug supply organisation (DSO); description of the founding body; nature of customers; and relationships with the Ministry of Health.
The characteristics of medicines supply management that were evaluated in the survey included:
• Selection - nature of the entity charged with drug selection; selection principles) • Procurement - procurement methods used; sources of suppliers (local,
international, DSO manufacturing site) • Distribution - warehousing system; distribution /delivery services • Customer satisfaction (instead of rational use) • Management support - availability of price information; drug management
information system (DMIS); quality assurance; finance; human resources
Discussion and comments
The discussion started with several questions concerning the methods and results of the study:
• Was the cost-efficiency of the store assessed? • Were expenses assessed as a percentage of turnover? • Could the faith-based DSOs performance be used as a benchmark in order to
improve functioning in the public sector? • How do we measure coordination of various supply programs? • It was agreed that donations were a major cause of medicines expiry, and an
indicator is needed to check expiry of medicines in DSOs. Suitcase donations are an important problem in all DSOs, but DSOs have little control since most suitcase donations are done by individuals. Public sector donations should also be controlled, because they disturb normal procurement.
• Procurement networks that run in parallel to the existing pharmaceutical sector supply chain are a major problem. Various partners instruct para-statal structures to procure ARVs with substantial funding; these parallel supply systems are not captured in health information systems. There should be coordination on supply aiming at integrating vertical programs, managing donations, etc.
The working group was reminded that its main task was to identify issues that should be monitored in countries in the Level I or II surveys, such as the existence of existence of a mechanism to coordinate medicines supply systems.
32
WHO Expert Meeting on Pharmaceutical Monitoring 10-12 July 2006
INRUD Initiative on Adherence Measurement for Antiretroviral Medicine John Chalker, INRUD/MSH
Presentation key points
With the large number of antiretroviral therapy programs starting in Africa, the issue of adherence is critical to both the control of the disease and the effective use of resources being devoted to AIDS treatment. Accepted wisdom is that unless a 90-95%
adherence to ART is achieved, there is a high likelihood of both therapeutic failure and the rapid development of resistance. In a review of adherence studies over the last 50 years for any chronic illness, achieving rates over 80% has been shown to be problematic. High levels of adherence being asked of AIDS patients will be very difficult to obtain. Surprisingly, adherence to antiretroviral medicines is not being addressed or routinely evaluated as a central component in many treatment programs.
Results of a survey of current practices for measuring adherence in East Africa funded by USAID through the RPM Plus Program were presented, which concluded that:
• Definitions of Adherence and Defaulters (or Drop outs) are quite variable; • Measurement of adherence at individual or facility level is haphazard with
various data sources and various methods of calculation; • There is much data recorded at both the clinic and pharmacy, but it is not clear
how systematically key data are actually recorded (e.g., pill counts).
The presentation described draft indicators identified for testing at a recent East African Regional Meeting on Antiretroviral (ARV) Adherence held in Entebbe, Uganda from April 27-29, 2006 (funded by USAID through the MSH RPM Plus program and WHO). The next steps to be taken to develop these indicators as a tool to measure individual and facility level adherence are:
• Design data collection forms; • Test the candidate indicators and sampling methods for feasibility, reliability
and validity in random samples in both basic and sophisticated settings in East Africa;
• Modify the indicators and methods based on the field test; • Publish a handbook of methods (perhaps in collaboration with WHO) to make a
standardized measurement possible; • Carry out qualitative research into determinants of adherence in specific groups
of high risk patients; • Design and test trial interventions to improve adherence; • Disseminate and scale up successful interventions
The candidate indicators to measure adherence to antiretroviral medicines are summarized in the following table.
33

WHO Expert Meeting on Pharmaceutical Monitoring 10-12 July 2006
Indicator Definition Patient Adherence to ARV Treatment
1. Full adherence % of patients with perfect recent adherence to ARV treatment
2. Average adherence Average % of recent ARV doses taken as scheduled
Patient Adherence to ARV Treatment (Dispensing Data)
3. Long-term persistence in ARV use
Average % of days covered by supply of ARVs dispensed in a defined period
4. Achievement of persistence target
% of patients achieving a defined target (e.g., 95%) for persistence with ARV therapy in a defined period
5. Discontinuation of ARV treatment
% of patients experiencing a gap in ARV availability of > 30 days during a defined period
Patient Defaulting
6. Missed appointments % of patients who do not appear for appointment on the day scheduled
7. Recapture following missed appointment
% of patients missing appointment who reappear for a visit within 60 days
8. Treatment drop-out % of patients who miss their appointment and do not attend an appointment in the next 60 days
9. Long-term patient continuation
% of ARV patients who remain in active treat mint after one year
Quality of Treatment 10. Adherence to STGs % of patients whose current treatment is consistent
with national Standard Treatment Guidelines Availability of ARVs and Other Key Medicines
11 (12). ARV availability: (Key medicine availability: )
% of ARVs (and % of key medicines for HIV-associated illness) currently in stock
13. Individual medicine stock consistency
% of days in stock in last 90 days for each medicine on list of ARVs or key medicines for HIV-associated illness
14. ARV dispensing rate % of patients who had all prescribed ARVs dispensed at the health facility
15. Non-ARV medicines dispensing rate
% of patients who had all prescribed medicines dispensed at the health facility
Health Facility Accessibility and Infrastructure
16. Extent of clinic hours Number of hours that clinic is open per week for routine AIDS care
17. Convenience of clinic hours
Whether clinic is open at least one evening or weekend day for routine AIDS care
18. Clinician patient load Average number of AIDS patients seen per clinician hour
34

WHO Expert Meeting on Pharmaceutical Monitoring 10-12 July 2006
Indicator Definition 19. Presence of support staff Average number AIDS patients per week per support
staff 20. Presence of laboratory Whether facility has a laboratory that is actively
measuring CD4 counts or viral loads on-site or within 5 minutes walks from the facility
21. Presence of private space for counseling
Whether facility has a private space available for adherence counseling
22. Patient waiting time Average amount of time patients spend in the clinic during a visit
23. Patient travel time to care Average amount of time spent traveling to health facility to receive care
Information and Communication
24. Patient knowledge of ARV regimen
% of patients who know correct ARV regimen
25. Proper medicines labeling % of patients for whom all medicines dispensed are adequately labeled
Clinical Outcomes
26. Adverse drug event % of patients reporting a key symptom indicative of an adverse drug event
27. CD4 testing rate % of patients with documented CD4 test results in last 6 months
28. Achievement of CD4 target % of patients achieving CD4 count > xxx cells per µl on most recent lab test in the last 6 months
29. Viral load testing rate % of patients with documented viral load test in last 6 months
30. Achievement of viral load target
% of patients achieving viral load counts <400 copies per ml on most recent lab test in last 6 months
Alternate Adherence Measures (Using Pill Counts) 31. Full adherence % of patients with perfect recent adherence to ARV
treatment 32. Average adherence Average % of recent ARV doses taken 33. Long-term persistence in ARV use
Average % of days covered by supply of ARVs used in a defined period
34. Achievement of persistence target
% of patients achieving a defined target (e.g., 95%) for persistence with ARV therapy in a defined period
35. Discontinuation of ARV treatment
% of patients experiencing a gap in ARV availability of > 30 days during a defined period
35
WHO Expert Meeting on Pharmaceutical Monitoring 10-12 July 2006
Pediatric Issues
The three relevant age groups of children taking ARV medications are:
• Young children who need a carer to give medicine and for whom self-report cannot be trusted;
• Teenagers who usually look after themselves, take their own medicine, and for whom self-reports are likely to be as accurate as for adults;
• Children in between these two ages, who may or may not be responsible for their own medicine, but for whom self-report may be more questionable.
Suggested methods for including children in ARV adherence surveys • Include children or teenagers who come to the clinic by themselves only if they
report that they usually take their own medicine by themselves. • For a child brought to the clinic by a carer, only include the child in the survey if
that carer originally brought the child to the clinic (and thus received training) and is the one usually responsible for administering the child’s medicines.
After his presentation, Dr. Chalker invited participants to send feedback and suggestions to him on this draft tool while still in development.
Discussion and comments
• The importance of measuring adherence to ART was stressed upon, as HIV/AIDS is likely to be the major public health problem in the coming years.
• The meeting felt strongly that adherence matters must be given far more publicity and attention at all levels.
• A key issue would be whether fixed dose combinations improve adherence in these settings, since they seemed to be associated with improved adherence for other problems.
• Community solidarity is an important factor for improving adherence. There need to be measures of the involvement of families, communities, and patient in improving adherence.
• Industries are now required to report funding patient groups.
Primary Health Care prescribing indicators in developing countries Kathleen Holloway, PSM/WHO
Presentation key points
The WHO primary health care (PHC) Prescribing Indicators Database (PID) contains data from all drug use surveys done in developing countries 1990-2004. It aims at monitoring reported data on drug use in PHC settings over time, identifying effective interventions, and providing evidence for advocacy and planning. The database contains data on health care setting, interventions, methods and defined outcome indicators from more than 700 surveys, about half of which were conducted in association with an intervention. In developing the WHO PHC PID, two key problems have been identified:
36

WHO Expert Meeting on Pharmaceutical Monitoring 10-12 July 2006
• Sample sizes are considered inadequate in >20% of the included surveys • Study design to measure the impact of an intervention was considered
inadequate in > 80% of evaluation studies
The indicators in the database are those most commonly used in research on medicines prescribing, including those developed by WHO/INRUD and the WHO Integrated Management of Childhood Illness (IMCI) programme. The WHO/INRUD core prescribing indicators are the same as those measured in the Level II health facility surveys; patient care indicators are also the same except that the Level II methodology does not collect data on indicators for average consultation time or average dispensing time. The IMCI indicators are similar to those collected in the Level II survey; however, there are difficulties interpreting IMCI indicators since their definitions differ from those used in other survey methodologies.
Other indicators frequently used in database (N > 60 studies) include:
Indicators requiring diagnostic data but minimal medical judgement of "correctness" • % cases of acute diarrhoeal cases treated with antibiotics [n=149] • % pneumonia cases treated with appropriate antibiotics [n=118] • % viral upper respiratory tract infection cases prescribed antibiotics [n=141] • % malaria cases treated with appropriate antimalarials [n=66]
Indicators requiring medical judgement of "correctness" • % patients treated in compliance with standard treatment guidelines [n=233] • % patients prescribed antibiotics inappropriately [n=59] • % antibiotics prescribed in under-dose [n = 24]
Other indicators infrequently used in the database (N < 60 studies) include:
• % pregnant women treated with iron/folic acid [n=10] • % cases treated with vitamins/tonics [n=42] • % patients receiving prescription-only medicine without prescription [n=9] • % facilities with a specific drug available [n=55]
Conclusions/suggestions
• There is a need for indicators for self-medication, health seeking behaviour, adherence to treatment, diagnosis, and hospital medicines use.
• Useful indicators that are commonly missing from reports include: prescriber type, length of prescriber training, last continuing medical education (CME) event, year of survey, and age of patient.
37

WHO Expert Meeting on Pharmaceutical Monitoring 10-12 July 2006
Discussion and comments
• There are useful process indicators in this presentation that could be incorporated in the Level I questionnaire.
• How is it possible to measure the impact of promotional activities on use of medicines?
Group work for Level II indicators
The working group reviewing the Level II indicators and methods faced a challenging task to integrate all of the information from the technical presentations in this session. The group’s method of work involved:
• Reviewing the technical presentations and identify indicators that could be included in the Level II survey
• Reviewing the current survey methodology /operational package document • Discussing updating of survey forms, use of PDAs for data collection, and
development of data entry and analysis software. • Consider the linkage of the Level II survey with SO 12
General comments from participants that were considered during the working group discussions included:
• During exit interviews, patients are only asked one question. This is a missed opportunity for finding out more information about illness, care seeking, and use of medicines. For example, it would be possible to how long it took the patient to get to the health facility.
• Concerning the affordability measure, it would be useful to get information on what % of the population earn less than the lowest paid government worker in order to make better sense out of affordability data.
• The group should benefit from the experience of the WHO/HAI pricing survey to improve related aspects of the Level II survey.
The following table summarizes the issues considered and the recommendations from the Working Group.
Issue Recommendation List of Tracer Medicines
Are 15 medicines sufficient? Yes, keep the list this size Should a predefined list of medicines be printed on the forms?
No, but examples should be added in an annex on most frequently used medicines per continent / group of countries
Selection of medicines Describe more clearly the process of selecting a list
38
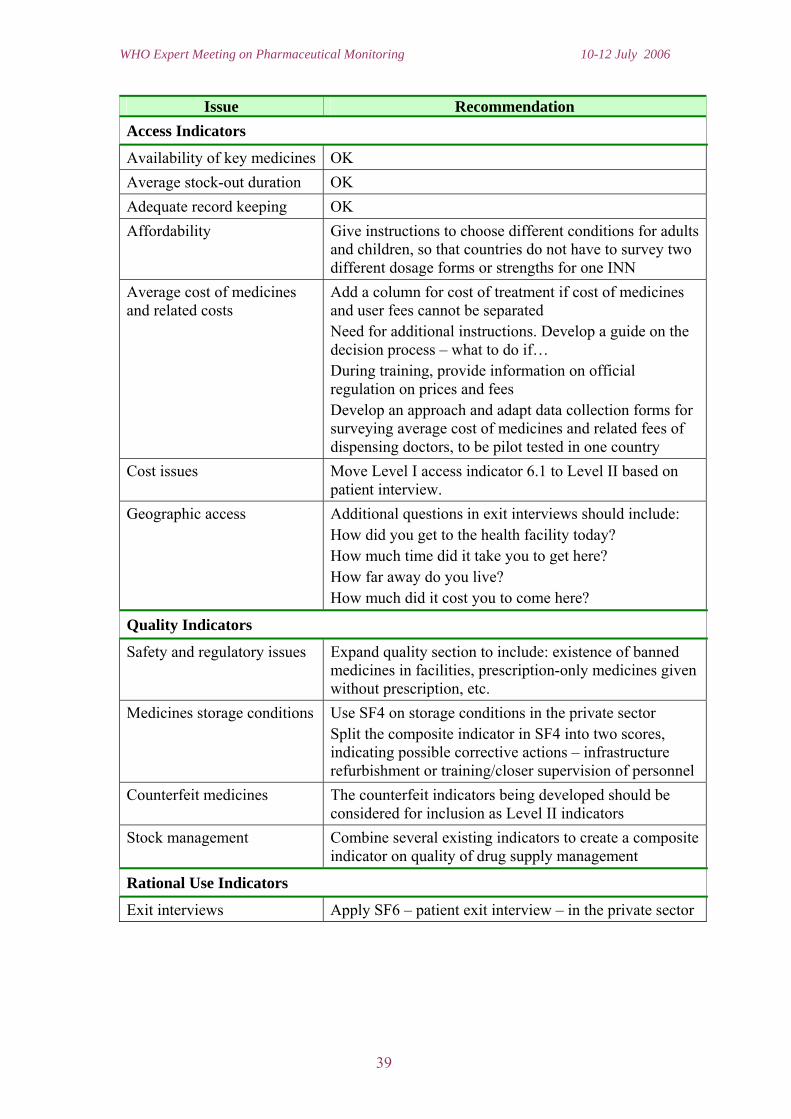
WHO Expert Meeting on Pharmaceutical Monitoring 10-12 July 2006
Issue Recommendation Access Indicators
Availability of key medicines OK Average stock-out duration OK Adequate record keeping OK Affordability Give instructions to choose different conditions for adults
and children, so that countries do not have to survey two different dosage forms or strengths for one INN
Average cost of medicines and related costs
Add a column for cost of treatment if cost of medicines and user fees cannot be separated Need for additional instructions. Develop a guide on the decision process – what to do if… During training, provide information on official regulation on prices and fees Develop an approach and adapt data collection forms for surveying average cost of medicines and related fees of dispensing doctors, to be pilot tested in one country
Cost issues Move Level I access indicator 6.1 to Level II based on patient interview.
Geographic access Additional questions in exit interviews should include: How did you get to the health facility today? How much time did it take you to get here? How far away do you live? How much did it cost you to come here?
Quality Indicators
Safety and regulatory issues Expand quality section to include: existence of banned medicines in facilities, prescription-only medicines given without prescription, etc.
Medicines storage conditions Use SF4 on storage conditions in the private sector Split the composite indicator in SF4 into two scores, indicating possible corrective actions – infrastructure refurbishment or training/closer supervision of personnel
Counterfeit medicines The counterfeit indicators being developed should be considered for inclusion as Level II indicators
Stock management Combine several existing indicators to create a composite indicator on quality of drug supply management
Rational Use Indicators
Exit interviews Apply SF6 – patient exit interview – in the private sector
39

WHO Expert Meeting on Pharmaceutical Monitoring 10-12 July 2006
Issue Recommendation Adequacy of staffing Add questions on presence of qualified dispensing and
prescribing personnel in public health facilities Add question on qualified dispensing personnel in private outlets Check the legal requirements for both sectors before the survey and inform data collectors
Choice of conditions Reduce surveyed conditions from SF9 to only one that countries can properly study; for many conditions, it is too time consuming to find sufficient numbers of cases needed to obtain accurate information
Methodology
Sample size The survey is a challenge in many countries, due to issues of sample size, selection of regions, and access to health facilities; the method should suggest how to modify the methodology in difficult circumstances.
Regional comparisons Countries want to do regional comparisons; guidance should be given on how to make these comparisons sound in terms of required minimum sample size and testing significance of differences.
Additions and Modifications to Manual
General introduction Prepare a common chapter for all assessment manuals explaining the overall WHO strategy of assessment work in the area of medicines
Justification of sample size Needs strong section giving statistical and practical justification
Paaediatric affordability Provide a recommendation on selecting medicines and conditions appropriate for paediatric patients
Indicator targets Add a section on how to set targets, listing indicators for which we already have standards
Data analysis Give better explanation on why medians are preferred to average values, and how to interpret them Create a data analysis workbook in which medicines can be analysed individually
Structure Separate the manual in two parts – one for the survey manager and one for the data collectors
Sections that need strengthening
Guidance on data collector training, data analysis, Reporting and disseminating results
Encouraging Wider Use of the Methodology
Dissemination of methodology
Use lessons learned from the medicines prices survey, and integrate the manual, workbook, and website
Dissemination of findings Prepare also a biennial global report on the pharmaceutical situation
40

WHO Expert Meeting on Pharmaceutical Monitoring 10-12 July 2006
Discussions and comments
• In countries that have with comprehensive STGs, the target condition for indicator SF 9 should be chosen from those
• Include indicators on: good governance, transparency; supply management; pricing (select medicines already used in pricing survey); price composition (taxes, mark-up costs)
• Lift from attitude-oriented questions from the household survey • Do not cut down tracer conditions, leave the choice to countries • Prepare instructions on how to assess compliance with STGs • To use SF6 in the private sector, add two more columns on prescription of
antibiotics and prescription of injections. • How can dispensing of prescription-only medicines without prescription be
surveyed in the different sectors?
The following regulatory issues should be included in Level II surveys in countries where Level I results have indicated the existence of corresponding regulations:
• Participation in the vigilance process and recall • Pharmaceutical personnel in retail outlets, hospitals, clinics dispensaries • Involvement in clinical trials in hospitals • Production, compounding in pharmacy, hospitals or clinics • "Banned" medicines has activist connotation, replace it with a neutral term.
41

WHO Expert Meeting on Pharmaceutical Monitoring 10-12 July 2006
Special Topics
This section describes three presentations on special topics related to the overall objectives of the meeting. The Health Technology and Pharmaceuticals (HTP) Survey and Global Indicator System has been developed as an on-line repository for pharmaceutical sector data, including Level I indicators. Service Availability Mapping (SAM), which is a tool to collect and present basic information on health infrastructure, human resources, and services offered, can be used to get facility-specific data for Level II indicators. The draft WHO Mid-Term Strategic Plan (2008-2013) includes one Strategic Objective (SO 12) to "Ensure improved access, quality and use of medical products and technologies" and a corresponding set of process indicators to assess progress in achieving this objective at country level.
HTP Survey and the Global Indicator System Jörg Hetzke, HTP/WHO
Presentation key points
• A web-based survey data collection system has been under development since 1999.
• As of 2005-2006, the survey system contains more than 200 questions to collect data for PAR (Program on Access and Rational Medicines Use) supply system indicators.
• The survey system permits some reporting of cross tabulated data, by region, by topic, and by country.
• The number of indicators is a system constrain.
Discussions and comments
• Experience in South Africa suggests that people need training to fill in the questionnaire; language and approach may need local adaptation to be understandable.
• Information should be in the public domain. Broad access and use of data can permit a continuous review process and contribute to improved reliability and validity. On the other hand, low reliability of some of the data elements collected up to 2003 is a constraint, and making these data widely available could create embarrassing situations.
• Countries should have more ownership of the data they produce in order to improve the use of monitoring and evaluation to support decision making
• The culture of monitoring and evaluation is poorly developed; many people, including managers, confuse these two concepts and fail to understand the usefulness of information.
42

WHO Expert Meeting on Pharmaceutical Monitoring 10-12 July 2006
• The key issue is how countries can best use the Level I and Level II indicators for practical decisions.
Service Availability Mapping (SAM) Shanti Noriega-Minichiello, IEP/WHO
Presentation key points
• A key goal of health programs is to make essential health services equally accessible to all individuals and communities. For the scaling up of interventions, such as anti-retroviral treatment (ART) programs, it is crucial to assess and monitor the strength of the health system as a whole.
• SAM is rapid, cost effective, and provides an easy and simple way of presenting data that are immediately relevant at national, district and sub-district levels.
• Moreover, SAM provides the necessary link between scale-up and strengthening of health systems. It provides information on current levels of coverage and lays a foundation for future evaluation of progress. It will also provide essential information on scale-up potential.
• SAM is intended to be country owned and driven. To this extent, SAM currently collects information on the presence of key health resources and interventions as determined by a country's health priorities; it also provides estimates of coverage for selected interventions. Information is collected on both the public and private sectors at two levels: the district and the facility level.
• SAM is made up of a survey methodology used in conjunction with public health mapping tools and applications. The questionnaire is administered at the district and health facility levels.
• The results are uploaded into WHO's Health Mapper system for immediate feedback, analysis, and decision-making.
Discussions and comments
• A lot of potential linking exists between SAM and the pharmaceutical monitoring indicators methodology.
• The first countries chosen for SAM were opportunistic, but now there is increasing demand from other potential users. Before initiating the activity, a 3-4 day meeting verifies ongoing activities and focuses the future work.
Proposed medium-term strategic plan 2008 - 2013 (SO12) David John Wood, Department of Immunization, Vaccines and Biologicals
Why and what is the Medium-term Strategic Plan?
• Provides strategic direction for Organization for 6 year period advancing global health agenda and addresses priorities established in proposed 11th GPW
43

WHO Expert Meeting on Pharmaceutical Monitoring 10-12 July 2006
• Establishes a framework to guide preparation of the Programme budget and operational plans across biennia
• Organization around 16 cross-cutting strategic objectives provides a more strategic and flexible programme structure that better reflects the needs of countries and regions
• Facilitates more effective collaboration across all levels of the Organization
Strategic Objective 12 (SO 12)
The draft WHO Mid-Term Strategic Plan (2008-2013) includes one Strategic Objective (SO 12) to "Ensure improved access, quality and use of medical products and technologies". Medical products and technologies basically include vaccines, medicines and essential health technologies.
Strategic Objective 12 is aimed at Member States. WHO will assist them when needed but the fulfilment of the SO is the country responsibility.
The current draft SO-12 indicators and targets are listed below. They are mainly intended as a guide for countries. They are semi-quantitative (yes/no) to encourage continuous self-assessment of country progress:
• Access to essential medical products and technologies as part of the fulfillment of the right to health, recognized in the constitution or national legislation: 50 countries in 2013.
• Availability and median consumer price ratio of a basket of 30 key essential generic medicines in public, private and NGO sectors: (1) 80% availability of medicines in all sectors; and (2) median consumer price ratio of generic medicines less than 4 times the generic world market price
• Development stage of national regulatory capacity: t.b.d. • Proportion of vaccines in use for childhood vaccination programmes that are of
assured quality: 100% by 2013 • Percentage of prescriptions in accordance with current national or institutional
clinical guidelines: 70% by 2013
Discussion and comments
• This paper provides a set of process indicators to guide how we are going to work in the future.
• The group was tasked to identify any indicators that countries can track to ensure higher level of attainment of the mid-term strategic objectives (especially SO 12). Participants wanted to understand why the group was only looking at SO 12 and not the rest of the SOs.
• Pages 2-3 of the report contains indicators that can be included in level I or II
During group work, key presentations on the more recent planning and management modes adopted in WHO were distributed. It was concluded that the work on pharmaceutical monitoring indicators should produce results at both the Regional and Country levels that would mesh favorably with the Organisation’s strategic planning
44

WHO Expert Meeting on Pharmaceutical Monitoring 10-12 July 2006
approach. In particular, the monitoring needs for WHO SO 12, which overarches the work of the medicines-related Units and Programmes, would be well met by the current indicator-based monitoring approach. This was especially relevant, given that the Organisation wishes to produce a regular update of the World Medicines Situation, and to be better able to support, monitor, measure, and report progress among Member States on real improvement in access to essential medicines and in the quality use of medicines.
45
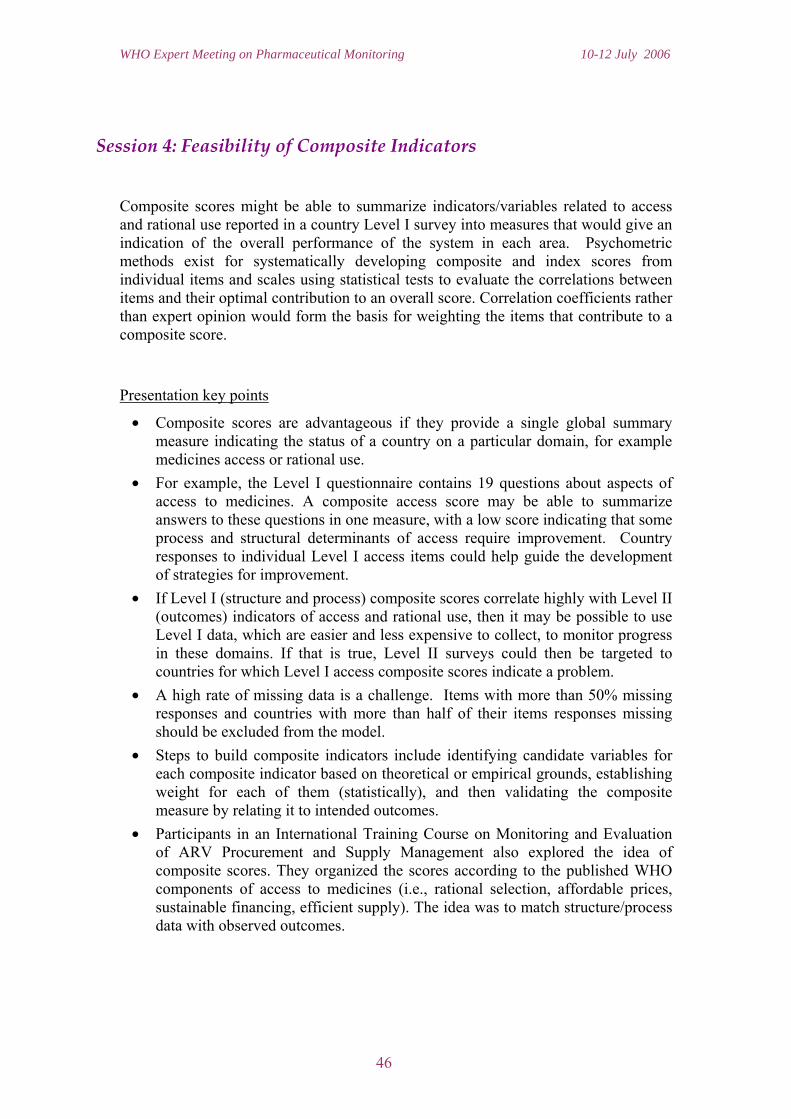
WHO Expert Meeting on Pharmaceutical Monitoring 10-12 July 2006
Session 4: Feasibility of Composite Indicators
Composite scores might be able to summarize indicators/variables related to access and rational use reported in a country Level I survey into measures that would give an indication of the overall performance of the system in each area. Psychometric methods exist for systematically developing composite and index scores from individual items and scales using statistical tests to evaluate the correlations between items and their optimal contribution to an overall score. Correlation coefficients rather than expert opinion would form the basis for weighting the items that contribute to a composite score.
Presentation key points
• Composite scores are advantageous if they provide a single global summary measure indicating the status of a country on a particular domain, for example medicines access or rational use.
• For example, the Level I questionnaire contains 19 questions about aspects of access to medicines. A composite access score may be able to summarize answers to these questions in one measure, with a low score indicating that some process and structural determinants of access require improvement. Country responses to individual Level I access items could help guide the development of strategies for improvement.
• If Level I (structure and process) composite scores correlate highly with Level II (outcomes) indicators of access and rational use, then it may be possible to use Level I data, which are easier and less expensive to collect, to monitor progress in these domains. If that is true, Level II surveys could then be targeted to countries for which Level I access composite scores indicate a problem.
• A high rate of missing data is a challenge. Items with more than 50% missing responses and countries with more than half of their items responses missing should be excluded from the model.
• Steps to build composite indicators include identifying candidate variables for each composite indicator based on theoretical or empirical grounds, establishing weight for each of them (statistically), and then validating the composite measure by relating it to intended outcomes.
• Participants in an International Training Course on Monitoring and Evaluation of ARV Procurement and Supply Management also explored the idea of composite scores. They organized the scores according to the published WHO components of access to medicines (i.e., rational selection, affordable prices, sustainable financing, efficient supply). The idea was to match structure/process data with observed outcomes.
46
WHO Expert Meeting on Pharmaceutical Monitoring 10-12 July 2006
Comments and suggestions
• Countries do not like to be rated using such composite measures with implied good and bad scores.
• How can this approach be useful for decision making in countries? • Some bad reactions to the World Health Report 2000 show that these ideas
should be approached carefully so as not to repeat mistakes and problems. In this report, responsiveness of health systems was assessed as a single figure, and some countries objected strongly to this classification.
• There are many methodological difficulties in creating composite indicators. We need to be very clear about the purpose of these composite indicators and how they can contribute to system development.
• One reason for composite indicators is to simplify presentation, since there are so many Level 1 and Level 2 that policy makers cannot integrate them in their thinking. Composite indicators also have great global advocacy value
• Initially, a few key indicators should be identified in each domain of interest, and presented individually. This will aid understanding by policy makers. With composite measures, there is a risk that some positive indicators will be aggregated with some poor ones, resulting in apparent medium level achievement, when in fact the situation is much more varied.
• There is a need to profile facilities and regions in such a way that they realize they are underperforming. It would motivate policy makers if they perceive that their country is performing more poorly than neighbors.
• Do we have the correct individual items in the Level 1 tool? This is the main question for now. Issues of composite scoring can be considered at a later time.
47

WHO Expert Meeting on Pharmaceutical Monitoring 10-12 July 2006
Next Steps
Feedback loop between participants/ working group & WHO secretariat
Actions points for Level I, Level II & Household survey
Pharmaceutical monitoring and assessment indicators Meeting report from HQ
Review with rapporteurs & chairs
Level I
Level II
Household survey
Participants/working group
•Recommendations•Review of the revised version•Addition, deletion•Process********Parallel work on designing web based data collection & field test
•New key indicators•Revision of new indicators•Review of forms, analysistemplates & guide how countriescan use•Layout
Level I•Specific components presenters•One round all participants
Level II•1st round with Level II presenters for specific area/topic•Development/ improvement of some section to people who can workOn certain portions such as data analysis & guide for countries how to use results.•One round –final darft to participants
•Objective•Process and sampling•New draft
Household surveyRounds to working group
For composite indicators-Delphi method will be used to identify variables
The diagram illustrates the next steps to by undertaken in developing the WHO monitoring indicators, including the specific area of work, activities to be undertaken, and the process for feedback between participants (the Expert Committee) and the WHO secretariat in Geneva. Changes will be adopted from the recommendations and relevant key points noted in this meeting report, particularly the group work reports.
48

WHO Expert Meeting on Pharmaceutical Monitoring 10-12 July 2006
Annexes
Annex 1: Meeting Agenda Annex 2: List of Participants Annex 3: List of Presentations Annex 4: Guide for Group Work (Chairs, Rapporteurs, Members) Annex 5: Timetable for Future Activities Annex 6: Flyer for Indicator-based Assessment and Monitoring
49

WHO Expert Meeting on Pharmaceutical Monitoring 10-12 July 2006
50

WHO Expert Meeting on Pharmaceutical Monitoring 10-12 July 2006
Annex 1: Meeting Agenda
WHO expert meeting on pharmaceutical indicators, monitoring and assessment Date 10-12 July 2006 (Room M 405)
AGENDA
10 July Meeting Chair: Patrick Mubangizi AM- Rapporteur: V Lucia Luiza
9:00 Opening remarks P Matsoso Welcome remarks H Hogerzeil 9: 20 Introduction of participants 9:30 Meeting objectives and expected output P Matsoso 9:45 WHO pharmaceutical indicators + Level I and II Report D Carandang
Objectives and expected output: Level I indicators
To shorten the Level I questionnaire by focusing on key items with face validity and high response rates (important for longitudinal monitoring).
To identify pediatric indicators that can be included in the Level I set.
Explore the process of administering the survey electronically using a web-based questionnaire.
Address subjective errors in the current system of getting data from a country informant-(ex. explore the process in which survey form will be sent to more than one individual to test the reliability of individual items.
10:15 Level I stream lining and data quality issue D Ross Degnan 10:45 BREAK 11:00 Global indicator system and WHO web based data collector J Hetzke 11:20 Paediatrics survey and possible indicators for Level I
questionnaire S Hill/G Forte
11:35 Question and answer on presentations Panel discussion on Level I indicators
Presenters D Ross Degnan, S. Chorliet, M Auton, R Skinner
12:30 LUNCH PM - Rapporteur : Ogori Taylor Objectives and expected output: Review the current 1 page household survey questionnaire, sampling scheme and formulate analysis template-
-The methods and content of the current household surveys need further development.
To review if other questions can be included- (the current questionnaire focuses on: assessing whether and how people access medicines, how they use them, how much they pay for them, and how out-of-pocket payments for medicines impact household finances).
Identify stepwise approach to preserve criteria on feasibility and propriety in specific context, including ethical issues such as informed consent.
2:00 Introduction on the household survey D Carandang 2:10 Country presentation of household survey • Brazil V Luiza • Solomon Islands R Skinner 3:10 Discussion on presentation 3:30 BREAK 3:45 Panel discussion on current format and process
• Do we expand or adapt the current format • What other key component needs to be incorporated (if
expanded) • Identification of working group
R Laing, T Gerrits, D Ross Degnan, R Skinner & V Luiza
51

WHO Expert Meeting on Pharmaceutical Monitoring 10-12 July 2006
11 July Meeting Chair: Ray Skinner
AM Rapporteur: S Chorliet Objectives and expected output: Level II indicators
To finalise the current tool
To determine the feasibility of standard computerized data entry and reporting templates that would facilitate data analysis and formulate guidelines for analysis and report.
Identify core and optional assessment indicators from existing Level III tools. Identify 3-5 monitoring indicators for each.
8:30 Briefing on pre meeting work for Level II D Carandang 8:45 Short presentations (15 minutes each) of level II tools to identify
key indicators that can be incorporated in Level II as core or optional indicators and to identify for each, indicators that can be used in monitoring
• Regulatory assessment P Matsoso, A Prat • Counterfeit V Reggi • Good governance G Baghdadi • Medicines price & availability K Tisoski • Drug supply management S Logez & M Everard • ARV adherence indicators (adult and paediatrics) J Chalker • Rational Use K Holloway
10:30 BREAK
10:45 Question and answer on presentations & Panel discussion for Level III on level II
Presenters; P Matsoso, H Horgezeil, D Ross Degnan, R Laing, M Auton, M Temu
12:10 Background WHO strategic objective (SO-12) Ensure improved access, quality and use of medical products and technologies
C Ondari
12:30 LUNCH
PM Rapporteur: VL Luiza 2:00 Composite indicators- (presentation, discussion and
recommendations ) D Ross Degnan & Clive Ondari
3:00 Result of an exercise on identifying composite indicators Marthe Everard 3:10 Service Availability Mapping Shanti Noriega-Minichiello
3:30 Question and answer on presentation Panel discussion
Presenters
D Ross Degnan & Clive Ondari
4:00 Group Work including break Meeting synthesis and drafting of output by pre assigned groups
Group A- Regional and country activities on assessment and monitoring Group B- Level I Group C- Level II Group D- Household survey
52

WHO Expert Meeting on Pharmaceutical Monitoring 10-12 July 2006
12 July Meeting Chair: Ray Skinner 9:00 Finalise group work
10:30 BREAK
10:45 Presentation with discussion
12:30 LUNCH
2:00 Discussion of follow on activities
3:00 Closing remarks
53

WHO Expert Meeting on Pharmaceutical Monitoring 10-12 July 2006
54

WHO Expert Meeting on Pharmaceutical Monitoring 10-12 July 2006
Annex 2: List of Participants
Participants Country Organization John Chalker UK INRUD-MSH Dennis Degnan USA Harvard Simona Chorliet Mali Trudie Gerrits Netherlands University of Amsterdam Vera Lucia Luiza Brazil NAF/ENSP/Fiocruz Helen Moller Denmark UNICEF Patrick Mubangizi Kenya HAI- Africa Javier Penalvier Herrero Spain Ray Skinner Solomon Islands Div of Pharmacy, MOH Klara Tisocki Saudi Arabia University of Kuwait Mary Justin Temu Tanzania Marsha Macatti-Yamba Tanzania Albert Wertheimer USA Mirza Zafar Egypt EMRO Nelly Marin US AMRO Ogori Taylor Nigeria AFRO Bekele Tefera Jembere Ethiopia AFRO Precious Matsoso Geneva TCM Gilles Forte Geneva TCM Clive Ondari Geneva PSM Valerio Reggi Geneva PSM Richard Laing Geneva PSM Marthe Everard Geneva PSM Sue Hill Geneva PSM Kathy Holloway Geneva PSM Sophie Logez Geneva PSM Jorg Hetzke Geneva HTP Carandang, Edelisa Geneva TCM Tata Helen Geneva TCM Martin Auton Geneva TCM Alain Prat Geneva TCM Dejan Loncar Geneva TCM Shanti Noriega-Minichiello Geneva EIP David Wood Geneva IVB Paul Verboom Geneva EIP
55

WHO Expert Meeting on Pharmaceutical Monitoring 10-12 July 2006
56

WHO Expert Meeting on Pharmaceutical Monitoring 10-12 July 2006
Annex 3: List of Presentations*
1) WHO hierarchical approach to indicator-based monitoring and assessment Daisy Carandang
2) Level I streamlining and data quality issues- Dennis Ross-Degnan
3) Introduction to the household survey Daisy Carandang
4) Results of household survey in Brazil Vera Lucia Luiza
5) Results of household survey in Solomon Islands Ray Skinner
6) Paediatric essential medicines: Possible indicators Sue Hill
7) Regulatory assessment Precious Matsoso
8) Regulatory assessment and the Level I tool Alain Prat
9) Measuring transparency and vulnerability to corruption Guitelle Baghdadi
10) Pricing and availability Klara Tisocki
11) Study on medicines supply in faith-based organizations in sub-Saharan Africa Marthe Everard
12) INRUD Initiative on Adherence Measurement for Antiretroviral Medicine John Chalker
13) Primary Health Care prescribing indicators in developing countries Kathy Holloway
14) HTP Survey and the Global Indicator System Jorg Hetzke
15) Service Availability Mapping (SAM) Shanti Noriega-Minichiello
16) Proposed medium-term strategic plan 2008 - 2013 (SO12) David Wood
17) Feasibility of Composite Indicators Dennis Ross-Degnan
*Copies of presentations can be requested at Medicines Policy and Supply Management (MPM)/TCM
57

WHO Expert Meeting on Pharmaceutical Monitoring 10-12 July 2006
58

WHO Expert Meeting on Pharmaceutical Monitoring 10-12 July 2006
Annex 4: Guide for Group Work (Chairs, Rapporteurs, Members)
WHO expert meeting on pharmaceutical monitoring and assessment indicators
Tasks GroupA-Level I Helen M* Patrick** Vera** Kathy, Guitelle, Helen T, Alain
Based on the previous discussion and review of the previous Level I questionnaire, draft the final (shortened) instrument.
Review for inclusion the monitoring indicators identified in the short presentations of Level III indicators)
Recommendations on questionnaire format, data retrieval and processing including resources needed
Prepare summary of presentation
GroupB -Level II Zafar* Simona**, Marthe, Klara, Mary, Bekele, Javier, Nelly,
Based on the general discussion review the current indicators and survey forms
Identify complementary indicators from level III presentations that can be added to the level II- preferably those that will fit the current level II format or may recommend
Group C-Household survey Richard*, Ogori*, Dennis, Clive, Ray, Trudie, Sophie, Albert, Marsha
Restructure the current household level tool Identify the objectives of the household survey and the information expected
* chair **rapporteur
59

WHO Expert Meeting on Pharmaceutical Monitoring 10-12 July 2006
60

WHO Expert Meeting on Pharmaceutical Monitoring 10-12 July 2006
Annex 5: Timetable for Future Activities
Activities Timeline Focal point/s Resources
Final meeting report Dennis, Daisy, Simona,
Final meeting report sent to participants and other interested party with agreement to adopt the relevant recommendations
28 Sept Daisy
Engage HTP resource mobilization team
3rd week Oct Jac Sawyer
Level I questionnaire For:APW ;Web-based questionnaire; reviewing the data base program
Drafting the questionnaire as per meeting recommendation
3rd week Oct Dennis and Daisy
Decision to drop estimated % of population with access to essential medicines
3rd week Oct Precious and Hans (Gilles, & Clive will initiate)
Draft sent to meeting participants. PSM & RAs will be actively involved
4th week Oct Daisy sending, Zafar, RA`s, PSM,TSM + feedback from meeting participants
Identify other groups who can be drawn in the process
3rd week Oct Clive, Gilles, Daisy
Consolidate comments and finalize questionnaire
Nov- Dec Daisy, intern
Design and implement changes in the global indicator data base (synchronize the new version with 2003 data base)
Nov onward until questionnaire is finalized
Jorg, intern
Drawing the web based data gathering program including
Oct 06 -Jan 07 Dennis, Jorg
Translation to French and Spanish
Jan 07 French- Simona Spanish- Nelly
Final version of questionnaire, including system of sending to countries/getting responses
Jan 07 Daisy, Gilles, Regional Advisers
Send 2007 questionnaire Feb 07 Identify data from other sources
Intern
61

WHO Expert Meeting on Pharmaceutical Monitoring 10-12 July 2006
Activities Timeline Focal point/s Resources
Level II- Household survey For: Institutional visits; developing analysis template (work book); translation; field test to validate sampling
1st draft of questionnaire as per meeting report
3rd week Oct Ogori and Daisy
Identify additional members of working group
3rd week Oct Gilles, Clive, Daisy
1st draft to working group and others. Highlight meeting recommendations not addressed in the 1st draft
4th week Nov Dennis, Richard, Clive, Trudie and others
Comments incorporated Dec 2006 - Jan 07 Field testing with Level II facility survey
Ongoing with Level II facility based survey
RA and technical experts for training
Develop data analysis template together with Level II
As soon as the sit working draft is available
Jorg, Dennis
Final version April 2007 Translation to French and Spanish
After final version as
Level II- Facility based survey For: APW tech review and writing; developing analysis template (work book); translation
1st draft as per meeting report a) Revise the
questionnaire b) Revise the format of
the manual
1st week Nov Last week Nov
Simona, Daisy, Dennis
More detailed review of each section of the manual a) Analysis and use of report
Nov- Dec Patrick, Klara, Zafarand others
1st draft circulated for review Jan 07 Daisy Incorporate comments Feb 07 Daisy, intern Develop the data analysis template and report template
Jan 07 Jorg, Dennis
Final draft circulated March 07 Daisy Incorporating final comments and drafting the final tool
April 07
Simona, Daisy, Intern
Translation to French and Spanish (To be done in stages- survey forms will be priority)
Survey forms- Nov Rest of document upon finalization
62
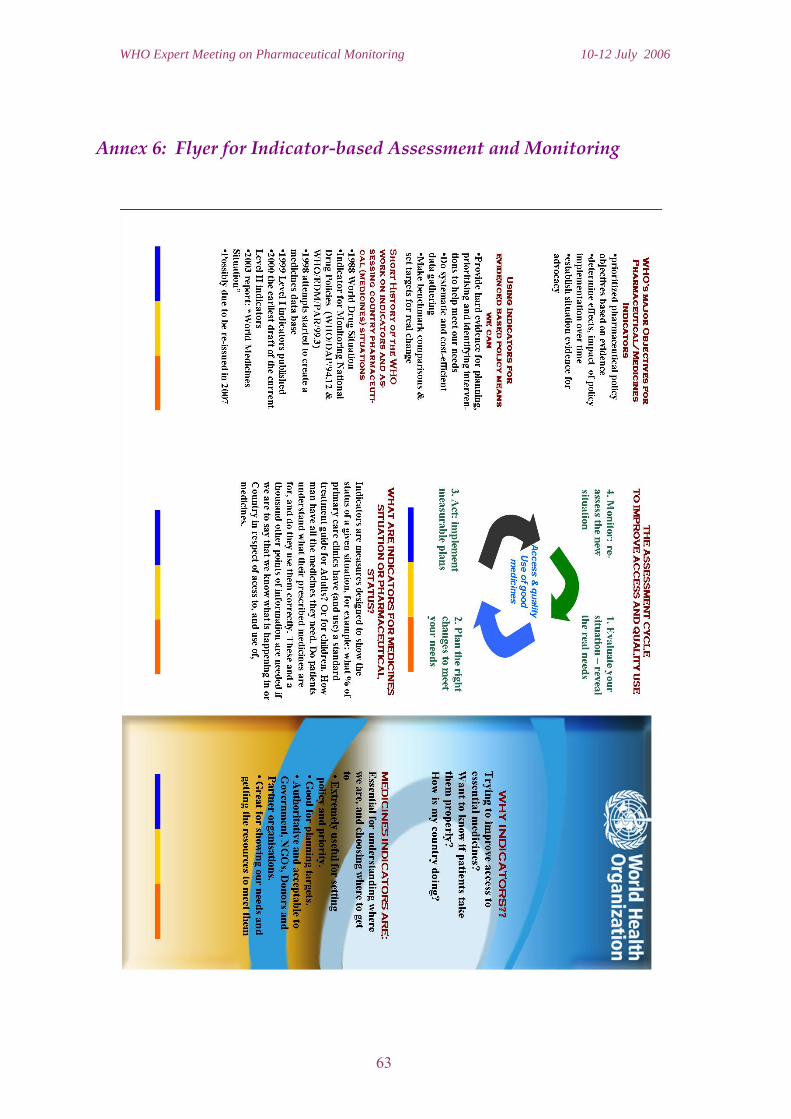
WHO Expert Meeting on Pharmaceutical Monitoring 10-12 July 2006
Annex 6: Flyer for Indicator-based Assessment and Monitoring
63
Related Documents