Who Chooses Teaching and Why? Profiling Characteristics and Motivations Across Three Australian Universities Paul W. Richardson a and Helen M. G. Watt b{ a Monash University, Australia; b University of Michigan, USA { Ordering of names is alphabetical for equal first authors In this large-scale Australian study, we profile the background characteristics and teaching motivations for individuals entering teacher education across three major established urban teacher provider universities in the Australian States of New South Wales and Victoria. Our recently developed and validated ‘‘FIT-Choice’’ (Factors Influencing Teaching Choice) Scale determines the strength of influence for a range of motivations from individuals choosing teaching as a career. Findings build upon and extend previous literature relating to reasons for teaching as a career choice, which have not systematically applied current motivational models to developing explanations. Participants were the entire cohorts (N51,653) of first-year pre-service teacher education candidates at three universities in Sydney and Melbourne. Results provide a profile of a large sample of pre-service teachers whose decision to enrol in a teacher education program has been made at a time when the mass media and the general public have increasingly looked upon teaching as a poor career choice. Our new theoretical approach allows us to recommend strategies for teacher recruitment campaigns, based on a comprehensive understanding of individuals’ motivations for choosing teaching. Introduction It is often taken as self-evident that teachers can and do make a difference by influencing the lives of children and adolescents and their orientation to learning. Equally, it has been acknowledged by Governments around the world that quality teachers and teaching are central to the development and maintenance of an intelligent, informed citizenry. For example, Australian ministers of education Correspondence to: Paul W. Richardson, Faculty of Education, Monash University, Clayton Campus, Melbourne, VIC 3800, Australia. Email: [email protected]; or Helen M. G. Watt, now also located at Monash University. Email: [email protected]. edu.au Asia-Pacific Journal of Teacher Education Vol. 34, No. 1, March 2006, pp. 27–56 ISSN 1359-866X (print)/ISSN 1469-2945 (online)/06/010027-30 ß 2006 Australian Teacher Education Association DOI: 10.1080/13598660500480290

Welcome message from author
This document is posted to help you gain knowledge. Please leave a comment to let me know what you think about it! Share it to your friends and learn new things together.
Transcript

Who Chooses Teaching and Why?
Profiling Characteristics and
Motivations Across Three Australian
Universities
Paul W. Richardsona and Helen M. G. Wattb{aMonash University, Australia; bUniversity of Michigan, USA{Ordering of names is alphabetical for equal first authors
In this large-scale Australian study, we profile the background characteristics and teaching
motivations for individuals entering teacher education across three major established urban teacher
provider universities in the Australian States of New South Wales and Victoria. Our recently
developed and validated ‘‘FIT-Choice’’ (Factors Influencing Teaching Choice) Scale determines
the strength of influence for a range of motivations from individuals choosing teaching as a career.
Findings build upon and extend previous literature relating to reasons for teaching as a career
choice, which have not systematically applied current motivational models to developing
explanations. Participants were the entire cohorts (N51,653) of first-year pre-service teacher
education candidates at three universities in Sydney and Melbourne. Results provide a profile of a
large sample of pre-service teachers whose decision to enrol in a teacher education program has
been made at a time when the mass media and the general public have increasingly looked upon
teaching as a poor career choice. Our new theoretical approach allows us to recommend strategies
for teacher recruitment campaigns, based on a comprehensive understanding of individuals’
motivations for choosing teaching.
Introduction
It is often taken as self-evident that teachers can and do make a difference by
influencing the lives of children and adolescents and their orientation to learning.
Equally, it has been acknowledged by Governments around the world that quality
teachers and teaching are central to the development and maintenance of an
intelligent, informed citizenry. For example, Australian ministers of education
Correspondence to: Paul W. Richardson, Faculty of Education, Monash University, Clayton
Campus, Melbourne, VIC 3800, Australia. Email: [email protected]; or
Helen M. G. Watt, now also located at Monash University. Email: [email protected].
edu.au
Asia-Pacific Journal of Teacher Education
Vol. 34, No. 1, March 2006, pp. 27–56
ISSN 1359-866X (print)/ISSN 1469-2945 (online)/06/010027-30
� 2006 Australian Teacher Education Association
DOI: 10.1080/13598660500480290

affirmed this sentiment in The Adelaide declaration on national goals for schooling in the
twenty-first century (MCEETYA, 1999), by acknowledging the key role that teachers
play in developing future Australian citizens, highlighting their contribution to social
capital and the essential social infrastructure of the country:
Australia’s future depends upon each citizen having the necessary knowledge, under-
standing, skills and values for a productive and rewarding life in an educated, just and
open society. High quality schooling is central to achieving this vision (available online at
http://www.mceetya.edu.au/nationalgoals/natgoals.htm).
Although teaching would therefore appear to be a socially valued occupation,
Australia, the US, the UK and a number of European countries are currently
experiencing difficulties in attracting and maintaining effective teachers (see Liu,
Kardos, Kauffman, Preske, & Johnson, 2000; OECD, 2004; Preston, 2000). This is
so in particular disciplinary areas in secondary schools such as mathematics, science,
computer sciences, technology and foreign languages; and also in early childhood
where salary scales are less than rewarding. Although there is a lack of reliable
empirical evidence from the Australian states and territories, figures from the US and
the UK show that one in five teachers will leave the profession within three years of
entry (Henke, Chen, & Geis, 2000; Johnson & Birkeland, 2003; Ofsted, 2001). Of
all the teachers who participated in the Third International Mathematics and
Science Study (TIMSS) (Lokan, Ford, & Greenwood, 1996), the highest proportion
of teachers indicating that they would ‘‘prefer to change to another career’’ (p. 197)
were from Australia and New Zealand.
Coincident with these developments, the teaching force is ageing in many of these
countries, including Australia where by 1999, 39% of teachers were in the 41–50 age
group (MCEETYA, 2002), and by 2001 the median age of teachers was 43, with
44% older than 45 (DEST, 2003). Similarly, in some European Union countries,
half the teaching force is aged over 40 (European Commission, 2000). As these older
teachers retire, the problem of teacher shortages is projected to escalate and to
critically impact on those areas experiencing the greatest shortages; as well as hard-
to-staff schools in rural and urban areas.
At the same time as teaching must compete with other careers and professions for
new entrants, its appeal as a career is declining (see Ramsay, 2000), with teachers
being asked to do more work for less reward. Relative to other professions, teaching
salaries are falling—despite the increased demands being placed on teachers (Liu
et al., 2000; OECD, 2004; Ramsay, 2000). There is growing concern about whether
there will soon be enough teachers, although the immediate effect of the shortage may
more likely be a lowering of the quality of teachers, as qualification requirements are
relaxed or ignored in order to meet the demand. An alternative or additional scenario
could be a lowered quality of teaching, as workloads and class sizes are increased to
accommodate teacher shortfalls (see Santiago, 2001). Paralleling and perhaps
anticipating these developments, the Australian Government and the State and
Territory Governments have put in place at the local level The National Framework
28 P. W. Richardson and H. M. G. Watt
for Professional Standards for Teaching, a program endorsed by MCEETYA in July
2003. How these competing demands will be played out remains to be seen.
Australian universities offer teacher education in both graduate and undergraduate
modes. The graduate degree or diploma typically involves one year full time
preparation (or equivalent part time), and sometimes two years (see Skilbeck &
Connell, 2003). This therefore produces teachers in a much reduced timeframe,
relative to the four to five years for undergraduate teacher education degrees.
Australian universities are responding to the demand for teachers by ensuring that
they have firm numbers undertaking graduate diplomas and degrees. In the case of
one university we studied, the University of Western Sydney, teacher preparation has
now become only available through the graduate mode. In another, the University of
Sydney, although the postgraduate diploma of education mode was abandoned in
the 1990s, a new model of graduate education in the form of the Master of Teaching
qualification was subsequently introduced. Our third university, Monash University,
has maintained a commitment to both modes of teacher education following the
introduction of undergraduate degrees during the 1990s.
‘‘Career switcher’’ entrants to the graduate mode of teacher education have been
suggested to be more mature and professional, to be more committed to their choice
of teaching as a career, to have developed a well-defined sense of themselves in their
previous careers, and to possess people skills germane to teaching (Freidus, 1992;
Haipt, 1987/1988; Novak & Knowles, 1992; Resta, Huling, & Rainwater, 2001).
Even with these potentially valuable skills, experiences and knowledge, the move into
teaching is not a seamless transfer from previous occupations for career switchers.
They often struggle with their attitudes and beliefs about teaching, preconceived
notions of the nature of teaching and learning, and the need to learn pedagogical
strategies (Bullough Jr. & Knowles, 1990; Crow, Levine, & Nager, 1990; Freidus,
1992; Ludwig, Stapleton, & Goodrich, 1995; Powell, 1996). Research to date
regarding career switchers has focused on small and opportune groups. Further
studies are needed, particularly with large-scale and representative cohorts to
empirically contrast the background characteristics, teaching motivations, percep-
tions about the profession, and career commitment and satisfaction for under-
graduate and graduate teacher education entrants.
Unless teaching can be made an attractive career choice for new graduates as well
as for those who switch to teaching after pursuing other careers (Crow et al., 1990;
Priyadharshini & Robinson-Pant, 2003; Richardson & Watt, 2005; Serow & Forrest,
1994) the shortage of suitably qualified and experienced teachers promises to
worsen. If policy-makers are to effectively attract suitably qualified people into the
profession, they will need to understand whether career change entrants have
complex reasons for seeking to switch careers, and that these motivations may
contrast with the entry motivations of undergraduate school-leavers commencing
teacher education studies.
Teaching has long attracted substantial numbers of women. Comparative figures
show that in the US in 1978, 67.1% of all elementary and secondary teachers were
Who Chooses Teaching and Why? 29

women (Ornstein & Miller, 1980), while in Australia in 1979 the proportion was
56%. Just 20 years later the Australian figure had risen to 65%. The number of men
teaching in primary schools in particular continues to decline, and there has been a
growing debate about the desirability of this trend (DEST, 2003). Government
ministers and members of the Australian Labor Party have reached bipartisan
agreement by asserting the need to bring more males into the teaching profession, to
provide positive role models for young boys, especially in their primary school years.
However, findings from Government commissioned reviews examining the educa-
tional needs of boys (House of Representatives Standing Committee on Education
and Training, 2002; Lingard, Martino, Mills, & Bahr, 2002; Martin, 2002) have
been received amidst the jingle-jangle of charged political debate and opinion pieces
about the presumed educational benefits accruing to boys from male teachers.
If policy-makers and employing authorities wish to redress the current gender
imbalance among teachers, then it is essential to understand that men and women
have different factors motivating them to pursue teaching (Watt & Richardson, in
review). The gender imbalance in the profession has been in part attributed to the
lower salaries of teachers relative to average salaries, especially for men. Existing
recruitment practices are also limited in their scope, focusing overwhelmingly on
teachers’ potential to make a social contribution, and neglecting other important
motivations, which may lead to selective targeting of new entrants to the profession
(see Santiago, 2001). A notable exception has been the recent ‘‘Use your head’’
campaign run by the Teacher Training Agency in the UK in 2004, developed in
parallel with our findings that individuals’ perceived teaching-related abilities were a
prominent factor in influencing their decision to teach (Richardson & Watt, 2003;
Watt & Richardson, 2003). That campaign portrayed teaching as an intellectually
demanding, cognitively stimulating career that enables individuals to realize their
talents and abilities.
In order to improve recruitment efforts, it is critical to target the range of
motivations that attracts people to the teaching profession. From the 1960s through
to the 1990s a number of themes were identified in the predominantly North
American literature: the desire for social mobility, the influence of parents and
extended family, time compatibility, the need for a stimulating absorbing career, an
ability to influence others, the desire to work with young children and adolescents, to
work in a people-oriented profession, and job-related benefits such as security,
pensions and vacations. While we would expect some commonalities with these
motives in the Australian context in the twenty-first century, earlier explanations
may no longer be adequate or entirely relevant.
The multidimensional character of the teacher’s role at this historical point in time
has amplified the complexity of the skills set that teachers now need in order to be
effective across diverse sociocultural contexts in schools and communities. This skills
set now embraces social, behavioural, civic, economic and technological dimensions.
Within the multicultural context of a country like Australia, particularly in the largest
cities of Sydney and Melbourne, the teacher’s role is also likely to require
30 P. W. Richardson and H. M. G. Watt

engagement with families and communities holding values and beliefs from a
diversity of cultures and cultural backgrounds.
The changed role of teachers has not been adequately reflected in the extant
literature, and may well clash with entry motivations based simply on the desire to
work with children for example. At the level of the State, there is also mounting
pressure to regulate the nature and quality of teachers’ work through teacher
certification and re-certification, placing new demands on teachers. Ironically, as
these regulation processes are being put in place, many politically conservative
Governments around the world are insisting that the public sphere be progressively
more subject to market forces and privatization (Beck, 2000). This is especially
evident in relation to essential services such as public transportation, medical and
hospital care, and management of the environment.
The current literature is unclear on why people choose teaching careers and why
many leave the profession in their early years, is predominantly empirically rather
than theoretically driven, and has generally failed to draw on the motivation
literature. Prior research has lacked an integrative theoretical framework to guide the
selection and organization of influential factors, proceeded in a somewhat piecemeal
fashion using poorly defined constructs, and with individual researchers frequently
investigating subsets of possible factors. Our ‘‘FIT-Choice’’ (Factors Influencing
Teaching Choice) framework provides a comprehensive and coherent model to
guide systematic investigation into this problem.
The ‘‘FIT-Choice’’ Framework
The FIT-Choice (‘‘Factors Influencing Teaching Choice’’) framework, founded on
expectancy-value theory, was developed by Watt and Richardson (Watt &
Richardson, in review) to provide a comprehensive and coherent model to guide
systematic investigation into the question of why people choose a teaching career
(see Figure 1). To date, this research has also not been strongly articulated with the
extant motivation literature, nor the career choice literature more generally. Our
model draws together recurring themes from the teacher education literature that
have been identified in relation to teaching career choice, alongside ability-related
beliefs emphasized in the broad career choice literature. We locate these themes
within the Expectancy-Value framework, the most comprehensive motivational
model for explaining academic and career choices (Wigfield & Eccles, 2000).
Although initially developed as a framework for explaining students’ choices for
math participation (Eccles (Parsons), Adler, Fuuterman, et al., 1983), the Eccles
et al. Expectancy-Value model has since been fruitfully applied to other academic
school disciplines, as well as to choices to participate in specific types of careers (for
example, Watt, 2002), and is valuable for guiding investigations into teaching as a
career choice.
Our framework taps both the ‘‘altruistic’’-type motivations which have been
emphasized in the teacher education literature (see Book & Freeman, 1986; Brown,
Who Chooses Teaching and Why? 31
1992; Lortie, 1975; Moran, Kilpatrick, Abbott, Dallatt, & McClune, 2001; Serow &
Forrest, 1994) as well as more personally utilitarian motivations and intrinsic
motivations, together with ability-related beliefs which are the focus of the broader
career choice literature (see Lent, Lopez, & Bieschke, 1993). Our framework also
taps individuals’ perceptions about the demand and reward aspects of the teaching
profession, and contains a measure of career satisfaction and commitment. We have
provided a review elsewhere (Watt & Richardson, in review) of how our FIT-Choice
factors, summarized in Figure 1, map to Expectancy-Value theory, Social Cognitive
Career Theory, and key findings within the teacher education literature.
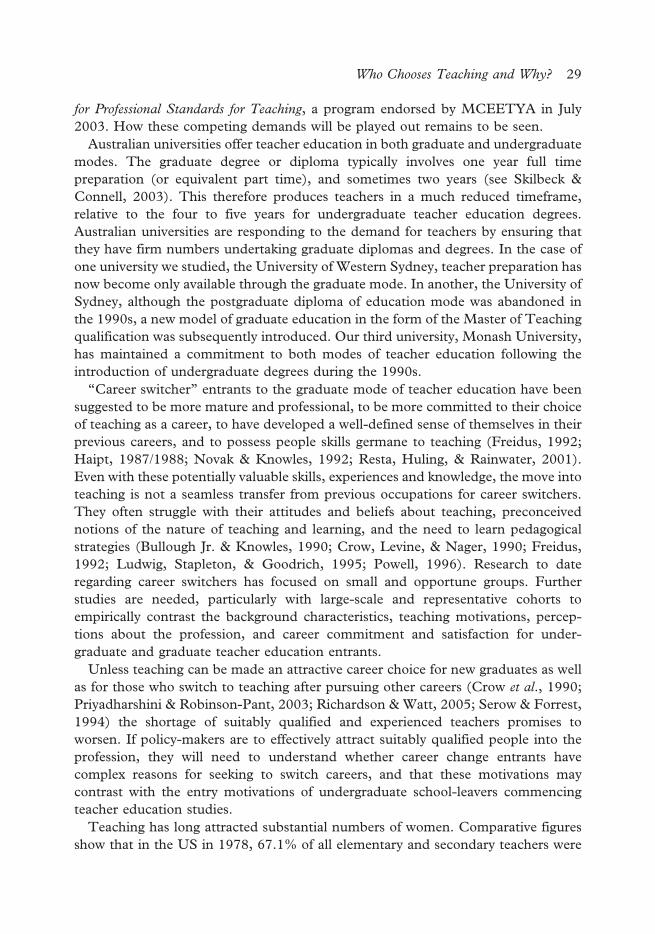
In brief, our model contains antecedent ‘‘socialization influences’’, followed by
more proximal influences of ‘‘task perceptions’’, ‘‘self perceptions’’, ‘‘values’’, and
‘‘fallback career’’. Higher order task demand and return constructs in turn contain
first-order constructs: ‘‘expertise’’ and ‘‘difficulty’’ comprise the higher order ‘‘task
demand’’ construct; and ‘‘social status and teacher morale’’ and ‘‘salary’’ comprise
the higher order ‘‘task return’’ construct. Similarly, higher order ‘‘values’’ constructs
contain first order component constructs. Values constructs in our model are
‘‘intrinsic value’’, ‘‘personal utility value’’ and ‘‘social utility value’’. The last two
values constructs contain component first-order constructs: ‘‘job security’’, ‘‘time for
family’’1, and ‘‘job transferability’’ comprise ‘‘personal utility value’’; and ‘‘shape
future of children/adolescents’’, ‘‘enhance social equity’’, ‘‘make social contribution’’
and ‘‘work with children/adolescents’’ comprise the higher-order ‘‘social utility
Figure 1. The ‘‘FIT-Choice’’ framework: Motivations for choosing a teaching career
32 P. W. Richardson and H. M. G. Watt

value’’ construct. Our FIT-Choice scale items which tap each construct are
presented in Table 1.
The Present Study
The scope of our study goes beyond the provinces of previous smaller-scale studies.
In the present study, we apply our FIT-Choice scale to teacher education entrants
across three Australian universities, each of which is a major teacher education
provider impacting on the supply of teachers in their respective States. In surveying
all consenting entrants to teacher education at these three universities, we represent
both undergraduate and graduate teacher education modes, as well as secondary,
primary and early childhood strands. Our findings provide a profile of intending
teachers for each of the universities, addressing entrants’ demographic character-
istics, teaching motivations, perceptions about the profession, and career commit-
ment and satisfaction. We consider the extent of differences and similarities across
the three universities, and contrast the backgrounds, motivations and career choice
satisfaction for undergraduate and graduate teacher education candidates.
Method
Sample and Setting
Participants (N51,653) were enrolled in teacher education programs at three
Australian universities—selected because they are large teacher education providers
(in the Eastern Australian States of New South Wales, NSW, and Victoria). The
University of Sydney in NSW was Australia’s first university, founded in 1850. It is a
member of the ‘‘Group of Eight’’ of Australia’s major research intensive universities,
and attracts notably high levels of first-preference selections into all courses. Monash
University (in Victoria) was established in 1958 and has grown from a single campus
at Clayton to six campuses in Australia, one in Malaysia and one in South Africa. It
characterizes itself as Australia’s most internationalized university, and is also a
member of the ‘‘Group of Eight’’. As such, it has similarly high levels of first-
preference selections for teacher education. The University of Western Sydney
(UWS) is a newly established multi-campus university. In recent years this
University’s key priorities have included strategies to develop its research capability.
With over 1000 teacher education graduates each year, UWS provides the largest
number of secondary, primary and early childhood teachers in NSW and is one of
the largest providers of beginning teachers in Australia.
All three universities offer teacher education degrees at both the undergraduate
and graduate levels.2 At the undergraduate level, secondary teacher education at the
University of Sydney is a five-year full time ‘‘combined’’ degree, where candidates
graduate with their secondary teaching qualification in combination with a Bachelor
of Arts, Science or Economics, for example. At Monash University, it is a four-year
Who Chooses Teaching and Why? 33

Table 1. Final empirically validated ‘‘FIT-Choice’’ subscales and items
Higher-order factor Factor Item# Anchors
Part B: Influential factors
Item stem: ‘‘I chose to become a teacher because…’’
N/A Ability B5 I have the qualities of a good teacher 1 (not at all important), to 7
(extremely important)B19 I have good teaching skills
B43 Teaching is a career suited to my abilities
N/A Intrinsic career value B1 I am interested in teaching
B7 I’ve always wanted to be a teacher
B12 I like teaching
N/A Fallback career B11 I was unsure of what career I wanted
B35 I was not accepted into my first-choice career
B48 I chose teaching as a last-resort career
Personal utility value Job security B14 Teaching will offer a steady career path
B27 Teaching will provide a reliable income
B38 Teaching will be a secure job
Time for family B2 Part time teaching could allow more family time
B16 Teaching hours will fit with the responsibilities of having a
family
B29 School holidays will fit in with family commitments
B4 As a teacher I will have lengthy holidays
B18 As a teacher I will have a short working day
Job transferability B8 Teaching will be a useful job for me to have when travelling
B22 A teaching qualification is recognised everywhere
B45 A teaching job will allow me to choose where I wish to live
34
P.
W.
Rich
ard
sonand
H.
M.
G.
Watt

Higher-order factor Factor Item# Anchors
Social utility value Shape future of
children/adolescents
B9 Teaching will allow me to shape child/adolescent values
B23 Teaching will allow me to influence the next generation
B53 Teaching will allow me to have an impact on children/
adolescents
Enhance social equity B36 Teaching will allow me to raise the ambitions of under-
privileged youth
B49 Teaching will allow me to benefit the socially disadvantaged
B54 Teaching will allow me to work against social disadvantage
Make social
contribution
B6 Teaching allows me to provide a service to society
B20 Teachers make a worthwhile social contribution
B31 Teaching enables me to ‘give back’ to society
Work with children/
adolescents
B13 I want a job that involves working with children/adolescents
B26 I want to work in a child/adolescent-centred environment
B37 I like working with children/adolescents
N/A Prior teaching and
learning experiences
B17 I have had inspirational teachers
B30 I have had good teachers as role-models
B39 I have had positive learning experiences
N/A Social influences B3 My friends think I should become a teacher
B24 My family think I should become a teacher
B40 People I’ve worked with think I should become a teacher
Table 1. (continued)
Who
Chooses
Tea
chin
gand
Why?
35

Higher-order factor Factor Item# Anchors
Part C: Beliefs about teaching
Task demand Expertise C10 Do you think teaching requires high levels of expert
knowledge?
1 (not at all), to 7 (extremely)
C14 Do you think teachers need high levels of technical
knowledge?
C15 Do you think teachers need highly specialised knowledge?
Difficulty C2 Do you think teachers have a heavy workload?
C7 Do you think teaching is emotionally demanding?
C11 Do you think teaching is hard work?
Task return Social status C4 Do you believe teachers are perceived as professionals?
C8 Do you believe teaching is perceived as a high-status
occupation?
C12 Do you believe teaching is a well-respected career?
C5 Do you think teachers have high morale?
C9 Do you think teachers feel valued by society?
C13 Do you think teachers feel their occupation has high social
status?
Salary C1 Do you think teaching is well paid?
C3 Do you think teachers earn a good salary?
Part D: Your decision to become a teacher
N/A Social dissuasion D2 Were you encouraged to pursue careers other than teaching? 1 (not at all), to 7 (extremely)
D4 Did others tell you teaching was not a good career choice?
D6 Did others influence you to consider careers other than
teaching?
N/A Satisfaction with
choice
D1 How carefully have you thought about becoming a teacher?
D3 How satisfied are you with your choice of becoming a teacher?
D5 How happy are you with your decision to become a teacher?
Table 1. (continued)
36
P.
W.
Rich
ard
sonand
H.
M.
G.
Watt

full time combined degree, while at UWS, it is a four-year full time single degree.
Undergraduate primary teacher education is a four-year full time degree at each of the
three universities, and only at Monash is it a ‘‘combined’’ degree. Undergraduate
early childhood teacher education is offered at Monash and UWS, and is also a
four-year full time degree, which is again a ‘‘combined’’ degree at Monash. The
University of Sydney previously offered an undergraduate early childhood teacher
education degree but this was phased out in the late 1980s.
At the graduate level, the University of Sydney offers a two-year full time Master
of Teaching (MTeach) qualification in both secondary and primary teacher
education strands. It is possible for candidates to exit the degree after 18 months
with a Bachelor of Teaching (BTeach) although few individuals elect to take this
pathway. Monash University offers a one-year full time Graduate Diploma in
Education (Grad. Dip. Ed.) in secondary and primary teacher education strands.
This degree is also available in flexible distance and evening part time modes,
although those candidates were not sampled for the present study. UWS also offers a
one-year full time or 18-month part time Bachelor of Teaching (BTeach) degree,
again in secondary and primary teacher education strands.
All commencing teacher education candidates were invited to participate in the
study from the three universities, excluding secondary education part time distance
education and evening candidates at Monash University, which was the only one of
the three universities having these modes. High response rates, ranging from 75–
89%, imply that our findings represent the population characteristics for each of the
three universities (see Table 2).
Measures
Teacher Education Candidate Characteristics
Participants checked boxes to indicate their gender (male or female), undergraduate
or graduate enrolment, and degree (secondary, primary or early childhood 3 teacher
education). They also indicated their parents’ combined income from when they
were in high school as an indicative measure for background socioeconomic status
(SES). Income categories included were $0–30,000, $30,001–60,000, $60,001–
90,000, $90,001–120,000, $120,001–150,000, $150,001–180,000, $180,001–
210,000, $210,001–240,000, and $240,000 or above. Participants also nominated
their age in years, the language mainly spoken at home, and the countries in which
each of their parents had been born.
Table 2. Undergraduate and graduate participant response rates at each university
Undergraduate Graduate
USyd (N5488) 88% 77%
Monash (N5508) 75% 84%
UWS (N5657) 89% 85%
Who Chooses Teaching and Why? 37
‘‘Career Switcher’’ Backgrounds
Graduate entrants who indicated that they had previously pursued another career were
asked to list details of that career. These prior careers were classified in terms of their
occupational status using O*NET—a comprehensive database of occupational
information provided by the US Department of Labor (US Department of Labor
Employment and Training Administration, 1998). Each occupation in the database is
ranked from 1 through 5 for its occupational status, derived from such factors as
average salary and amount of educational preparation and training required. Teaching
was classified as ‘‘4’’ on the five-point scale, along with careers including academia,
accountancy, banking, clinical psychology, computer programming, engineering,
graphic design, journalism, marketing, nursing, pharmacy and publishing.
Other careers were coded as either ‘‘lower’’, ‘‘same’’ or ‘‘higher’’ status than
teaching, based on O*NET indicators. Example careers that scored the lowest
occupational status of ‘‘1’’ included cafe work, call centre work, childcare and
landscaping. Second lowest with a score of ‘‘2’’ were air host/essing, alternative
therapies, office work, retail sales and secretarial work. The category of ‘‘3’’—one
category below teaching—included actor, animal technician, architectural draftsper-
son, dental technician, electrician, hospitality personnel, performing artist, personal
trainer, photographer, police officer, professional athlete, travel consultant and written
translator. The highest category of ‘‘5’’ included careers such as aeronautical engineer,
biotechnologist, business manager, chemical engineer, classical musician, dentist,
environmental scientist, geologist, lawyer and medical doctor.
Motivations for Teaching
Participants’ motivations for choosing teaching as a career were assessed using our
FIT-Choice scale (for full details about the scale and information on good construct
reliability and validity with this sample see Watt & Richardson, in review). These
motivations are presented as part of Figure 1 and include intrinsic values, personal
utility values (job security, time for family, job transferability), social utility values
(shape future of children/adolescents, enhance social equity, make social contribu-
tion, work with children/adolescents), self perceptions of individuals’ own teaching
abilities, the extent to which teaching had been a ‘‘fallback’’ career choice, social
influences, and prior positive teaching and learning experiences. Each factor was
measured by multiple item indicators with response options ranging from 1 (‘‘not at
all important’’) through 7 (‘‘extremely important’’). A preface to all motivation items in
the scale was ‘‘I chose to become a teacher because …’’, which was typed in large bold-
faced font at the top of each page.
Perceptions about the Profession
Participants also rated the extent of their agreement with a number of propositions
about the teaching profession, with response options ranging from 1 (‘‘not at all’’)
38 P. W. Richardson and H. M. G. Watt

through 7 (‘‘extremely’’). Multiple propositions together comprised factors relating to
the extent to which respondents perceived teaching as high in task demand (expert
career, high demand), and as high in task return (social status, salary).
Career Choice Satisfaction
Participants’ career choice satisfaction was measured by three items with response
options from 1 (‘‘not at all’’) through 7 (‘‘extremely’’). As part of this section,
participants also rated the extent to which they had experienced social dissuasion
from teaching as a career choice.
Procedure
Surveys were conducted early in the academic year—2002 at the University of
Sydney and 2003 at both Monash University and the University of Western Sydney.
They were administered in tutorial class groups to enhance data integrity and allow
for clarification of respondent queries. Administration was by the researchers and
two trained assistants, with University ethics approval, consent of program
coordinators, and informed consent of all participants. It took approximately
20 minutes for participants to complete the survey.
Analyses
Initial background profiles for each university summarized degree enrolments and
proportions of females relative to males within each enrolment strand. Tabulated
frequencies described enrolments within each of undergraduate and graduate
secondary, primary and early childhood teacher education strands, while percentages
summarized the proportion of females within each strand. Age profiles were
developed for undergraduates and graduates within each university, represented
using box plots. Indicative SES profiles were also created, based on participant-
reported combined parental income, again represented using box plots for
undergraduates and graduates within each university. Ethnic background profiles
were described by percentages for undergraduates and graduates within each
university, for each of language mainly spoken at home, and parent countries of
birth.
For the subset of graduate participants who indicated that they had pursued a
previous career, bar charts displayed the percentages of those people who had listed
each career type, separately within each university. To describe the occupational
status of those previously pursued careers relative to teaching, histograms
summarized the percentages of people who had switched careers into teaching from
each of lower, the same, or higher occupational statuses.
Motivations for choosing teaching as a career, perceptions about the teaching
profession, and career choice satisfaction were summarized by mean scores on each
Who Chooses Teaching and Why? 39

factor, for undergraduates and graduates within each university, and displayed using
histograms. Analyses of variance (ANOVAs) subsequently tested for statistically
significant differences between undergraduate and graduate participants across
factors, separately within each university. Alpha was set at 0.01 in view of the sample
size.
Results
Who Chooses Teaching?
University enrolment profiles. All three universities had large enrolments for teacher
education entrants, and high response rates signify that our findings provide reli-
able summaries for each university (see Table 2). The enrolment numbers for
undergraduate and graduate participants within each of the secondary, primary and
early childhood teacher education strands are shown in Table 3 where it can be seen
that there are some differences in the enrolment distributions across the universities.
The University of Sydney had the greatest enrolment in secondary teacher
education, did not offer early childhood teacher education, and had substantially
more undergraduate than graduate enrolments. Monash and UWS had almost three
times as many graduate teacher education students relative to undergraduate
enrolments in secondary teacher education, while the pattern was reversed for
primary teacher education, where there were approximately double the numbers of
undergraduates relative to graduates. For Monash and UWS, who offered early
childhood teacher education through the undergraduate degree mode, Monash had
only a small early childhood cohort, and UWS had a cohort twice that size. Of the
three universities, UWS had the greatest number of total enrolments.
Gender representation. Enrolments within each teacher education strand were largely
female dominated (see Table 4). This was most marked for early childhood teacher
education, where enrolments were almost exclusively female. Primary teacher
education had the next highest concentration of females, both for undergraduate and
graduate candidates. While secondary teacher education contained lower
proportions of females than either primary or early childhood teacher education,
well over half the enrolments were still female at each university.
Table 3. Teacher education strands in the sample
Secondary N’s
UG/Grad
Primary N’s
UG/Grad
E.C. N’s
UG/Grad
Totals N’s
UG/Grad
USyd 195/122 103/68 n/a. 298/190
Monash 72/212 119/68 37/n/a. 228/280
UWS 68/197 218/91 83/n/a. 369/288
Totals 335/531 440/227 120/n/a. 895/758
40 P. W. Richardson and H. M. G. Watt

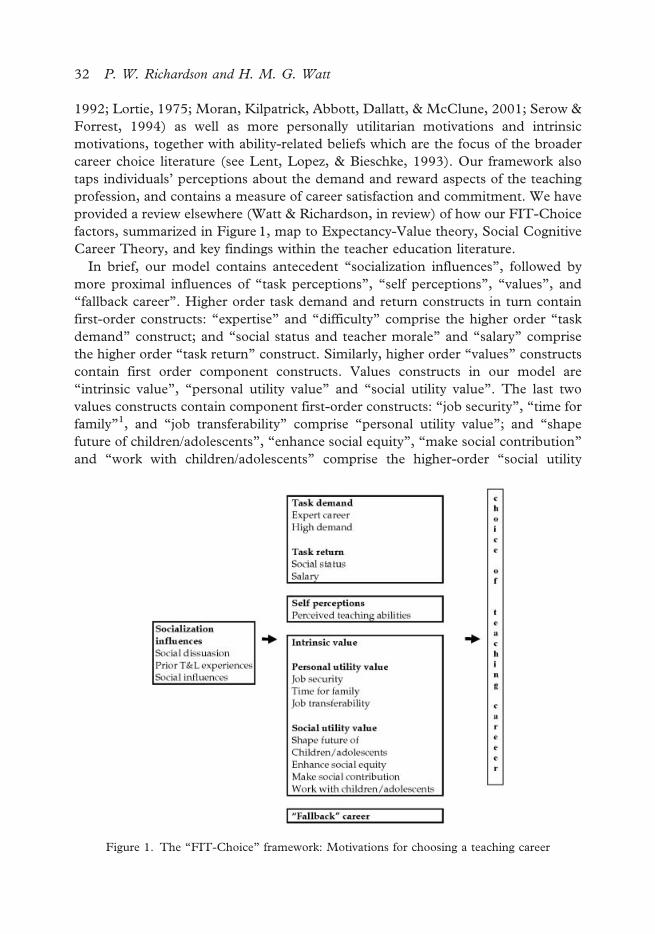
Age profiles. Age profiles differed across undergraduates and graduates and across
the three universities (see Figure 3). Not surprisingly, undergraduates tended to be
younger than graduates. The median undergraduate age in years in the first year of
enrolment was 19 at both the University of Sydney and Monash University, and
20 at UWS. Undergraduates at the University of Sydney had the most clustered
ages (with the interquartile range spanning 18 to 20 years), followed by Monash
(interquartile range from 18 to 22 years), while undergraduates at UWS showed the
greatest diversity in ages (interquartile range from 18 to 24 years). Median graduate
ages appeared similar across the universities—25 years at the University of Sydney,
and 26 years at each of Monash and UWS. Age distributions were more widely
spread than for undergraduates, with the University of Sydney again showing
the least (interquartile range from 23 to 29 years) and UWS the most diversity
Figure 2. Age profiles for beginning teacher education candidates
Note. The box length is the interquartile range and the solid bar represents the median value.
‘‘o’’ denotes outliers with values between 1.5 and three box lengths from the upper or lower edge
of the box, ‘‘*’’ denotes extreme cases with values more than three box lengths from the upper
or lower edge of the box.
Table 4. Proportional female representation within teacher education strands
Secondary % female
UG/Grad
Primary % female
UG/Grad
E.C. % female
UG/Grad
Totals % female
UG/Grad
USyd 71/66 89/82 n/a 77/72
Monash 59/69 73/85 97/n/a 72/73
UWS 57/60 88/83 94/n/a 84/67
Who Chooses Teaching and Why? 41

(interquartile range from 23 to 34 years), with Monash again falling in between
(interquartile range from 24 to 33 years).
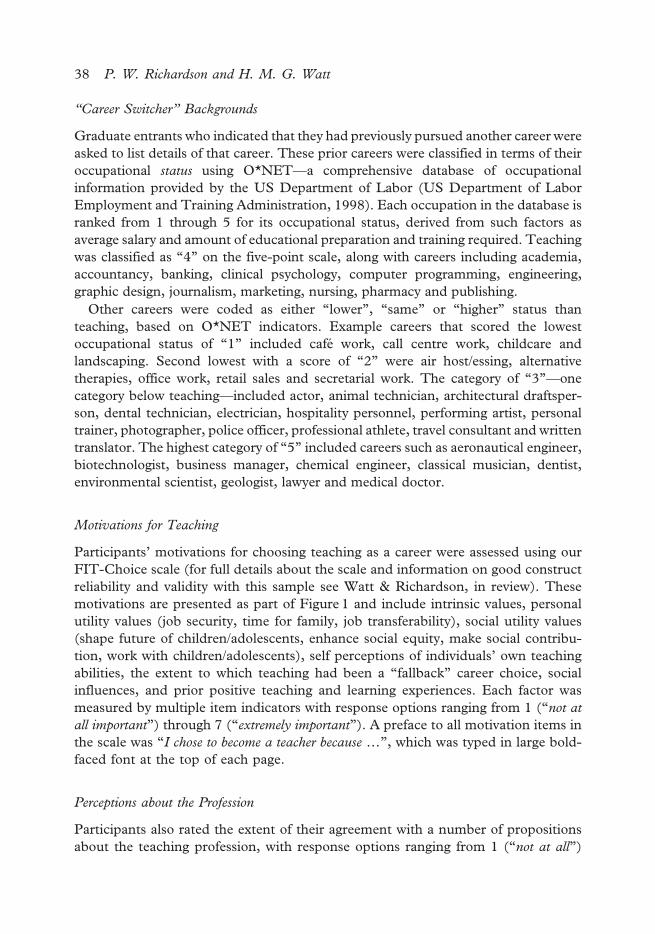
SES income backgrounds. The median and modal participant-reported combined
parent income category was $60,001–90,000. This held for undergraduate and
graduate participants across each of the three universities. All distributions were
positively skewed, indicating that a greater concentration of participants came from
the lower parent income categories provided for on the survey, although there were
differences between graduates and undergraduates in the spread of parent income
profiles. For graduates, the distribution for this SES background indicator was
remarkably similar across universities (see Figure 2). The interquartile range in each
case was from $30,001–60,000 to $90,001–120,000, while the box plot ‘‘whiskers’’
ranged from $0–30,000 to $180,001–210,000, with few outliers in the two highest
income brackets. For undergraduates, the distributions were both different from
graduates, as well as different across universities. At UWS, the distribution for
undergraduate participants’ combined parent income was highly kurtotic and
positively skewed, with 50% of this group reporting between $30,001–60,000 and
Figure 3. Combined parent income for beginning teacher education candidates (indicative SES)
Notes. Income values: 1: $0–30,000, 2: $30,001–60,000, 3: $60,001–90,000, 4: $90,001–120,000,
5: $120,001–150,000, 6: $150,001–180,000, 7: $180,001–210,000, 8: $210,001–240,000,
9: $240,000+.
The box length is the interquartile range and the solid bar represents the median value. ‘‘o’’ denotes
outliers with values between 1.5 and three box lengths from the upper or lower edge of the box,
‘‘*’’ denotes extreme cases with values more than three box lengths from the upper or lower edge
of the box.
42 P. W. Richardson and H. M. G. Watt

$60,001–90,000. The box plot whiskers spanned $0–30,000 to $90,001–120,000,
with few outliers and extreme cases reporting any of the higher parent income
brackets. The middle 50% concentration of UWS undergraduates therefore reported
coming from less diverse and lower SES income backgrounds than the graduates. In
contrast, at both the University of Sydney and Monash University, undergraduate
participants reported greater variation for this SES background indicator than the
graduates. For both the University of Sydney and Monash University, the
undergraduate interquartile range reached from $30,001–60,000 to $120,001–
150,000, while the box plot whiskers spanned from $0–30,000 through to the
highest $240,000+ category. Undergraduate participants from the University of
Sydney and Monash University therefore come from a greater range of SES income
backgrounds—where this increased range reaches upwards into higher parent
income brackets. The reverse is true at UWS, where undergraduates come from a
more compressed range at the lower end of the parent income bracket.
Ethnic Backgrounds
English was overwhelmingly the home language for undergraduates and graduates
within each university. Proportions were similar at the University of Sydney (82%)
and UWS (81%). The proportion was slightly higher at Monash, with 90% of
participants listing English as their home language. Other nominated home
languages were from around the world, and differed across the three universities.
The languages for which representation exceeded one percent were:
N University of Sydney: Korean 2%, Chinese 4%, Greek 2%;
N Monash University: Japanese 2%, Chinese 2%; and
N UWS: Arabic 6%, Chinese 2%, Hindi 2%.
Chinese (Cantonese, Hokkien and Mandarin) was the only language apart from
English which had representation greater than one percent across all three
universities. As shown above, other than Chinese, each university had different
language speakers with representations exceeding 1%. Other home languages had
negligible representations.
Most participants’ parents were born in Australia relative to any other country:
53% of fathers and 59% of mothers at the University of Sydney, 56% of fathers and
60% of mothers at Monash University, and 47% of fathers and 50% of mothers at
UWS. The next most common parent country of birth was the UK. Representations
exceeded one percent for parents’ country of origin for:
N University of Sydney: UK (fathers 9%, mothers 6%), Italy (fathers 4%, mothers
3%), Greece (fathers 3%, mothers 2%), Lebanon (fathers 3%, mothers 2%),
China (fathers 2%, mothers 2%), Hong Kong (fathers 2%, mothers 3%), and
Korea (fathers 2%, mothers 2%).
Who Chooses Teaching and Why? 43
N Monash: UK (fathers 9%, mothers 10%), Italy (fathers 3%), Japan (fathers 3%,
mothers 3%), and Greece (fathers 2%, mothers 2%).
N UWS: UK (fathers 8%, mothers 8%), Lebanon (fathers 6%, mothers 6%),
Canada 4 (fathers 3%, mothers 4%), China (fathers 2%), Egypt (fathers 2%,
mothers 2%), Fiji (fathers 2%, mothers 2%), Greece (mothers 2%), India
(mothers 2%), and Italy (fathers 2%).
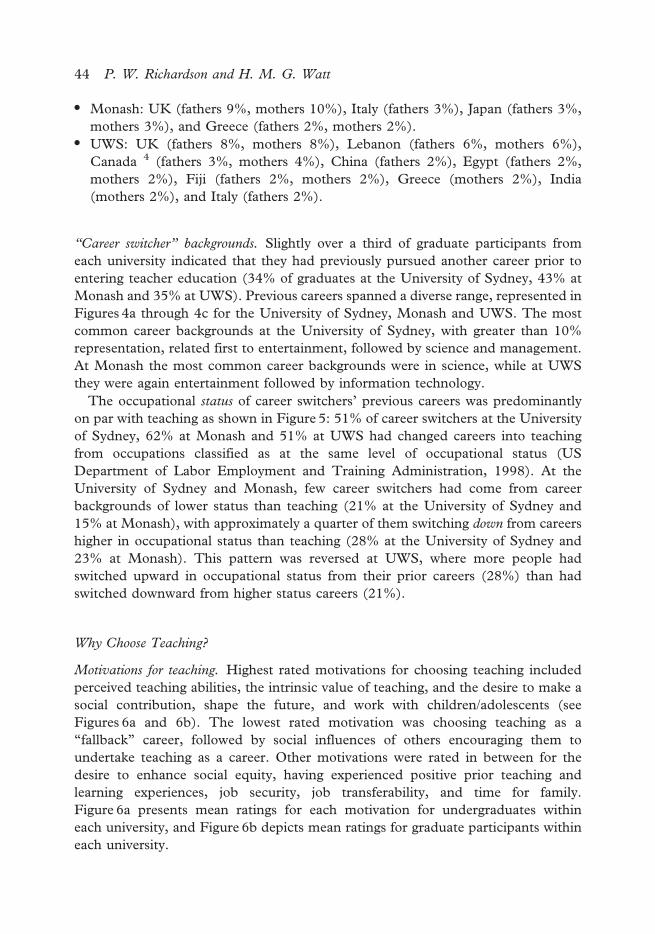
‘‘Career switcher’’ backgrounds. Slightly over a third of graduate participants from
each university indicated that they had previously pursued another career prior to
entering teacher education (34% of graduates at the University of Sydney, 43% at
Monash and 35% at UWS). Previous careers spanned a diverse range, represented in
Figures 4a through 4c for the University of Sydney, Monash and UWS. The most
common career backgrounds at the University of Sydney, with greater than 10%
representation, related first to entertainment, followed by science and management.
At Monash the most common career backgrounds were in science, while at UWS
they were again entertainment followed by information technology.
The occupational status of career switchers’ previous careers was predominantly
on par with teaching as shown in Figure 5: 51% of career switchers at the University
of Sydney, 62% at Monash and 51% at UWS had changed careers into teaching
from occupations classified as at the same level of occupational status (US
Department of Labor Employment and Training Administration, 1998). At the
University of Sydney and Monash, few career switchers had come from career
backgrounds of lower status than teaching (21% at the University of Sydney and
15% at Monash), with approximately a quarter of them switching down from careers
higher in occupational status than teaching (28% at the University of Sydney and
23% at Monash). This pattern was reversed at UWS, where more people had
switched upward in occupational status from their prior careers (28%) than had
switched downward from higher status careers (21%).
Why Choose Teaching?
Motivations for teaching. Highest rated motivations for choosing teaching included
perceived teaching abilities, the intrinsic value of teaching, and the desire to make a
social contribution, shape the future, and work with children/adolescents (see
Figures 6a and 6b). The lowest rated motivation was choosing teaching as a
‘‘fallback’’ career, followed by social influences of others encouraging them to
undertake teaching as a career. Other motivations were rated in between for the
desire to enhance social equity, having experienced positive prior teaching and
learning experiences, job security, job transferability, and time for family.
Figure 6a presents mean ratings for each motivation for undergraduates within
each university, and Figure 6b depicts mean ratings for graduate participants within
each university.
44 P. W. Richardson and H. M. G. Watt

Figure 4a. Graduate entry career switchers: University of Sydney (34%)
4b. Graduate entry career switchers: Monash University (43%)
4c. Graduate entry career switchers: University of Western Sydney (35%)
Who Chooses Teaching and Why? 45

Few systematic differences were evident between the teaching motivations for
undergraduate and graduate participants across the three universities (see Table 5).
At the University of Sydney, statistically significant differences occurred for four
motivations: undergraduates scored higher on job security, time for family, and
positive prior teaching and learning experiences; while graduates had higher ratings
for the desire to make a social contribution. At Monash, undergraduates gave
statistically significantly higher ratings for the intrinsic value of teaching and desire to
work with children/adolescents. At UWS, undergraduates also rated statistically
significantly higher their desire to work with children/adolescents, while—similarly to
the University of Sydney—graduates rated statistically significantly higher their
desire to make a social contribution.
Perceptions about the profession. Participants generally perceived teaching as a career
which is high in demand—and low in return. Figure 7 summarizes the mean
ratings for undergraduates and graduates within each university. Participants rated
teaching as a highly demanding career in terms of having a heavy workload, high
emotional demand and generally requiring hard work. They also rated teaching as
a highly expert career, in terms of requiring high levels of specialized and technical
knowledge. At the same time, participants generally perceived teaching as rela-
tively low in social status, and as paying a low salary. Again there were few
systematic differences between undergraduate and graduate participants’
perceptions when these were assessed within each university (Table 5). At
the University of Sydney, graduates rated teaching statistically significantly higher
for expert career and high demand, while undergraduates gave statistically
significantly higher ratings for social status and salary. At Monash, graduates also
rated teaching as statistically significantly higher in demand, while under-
Figure 5. Graduate entry career changers: previous job status relative to teaching
46 P. W. Richardson and H. M. G. Watt

Figure 6a. Factors influencing teaching choice for undergraduates
6b. Factors influencing teaching choice for graduates
Who Chooses Teaching and Why? 47
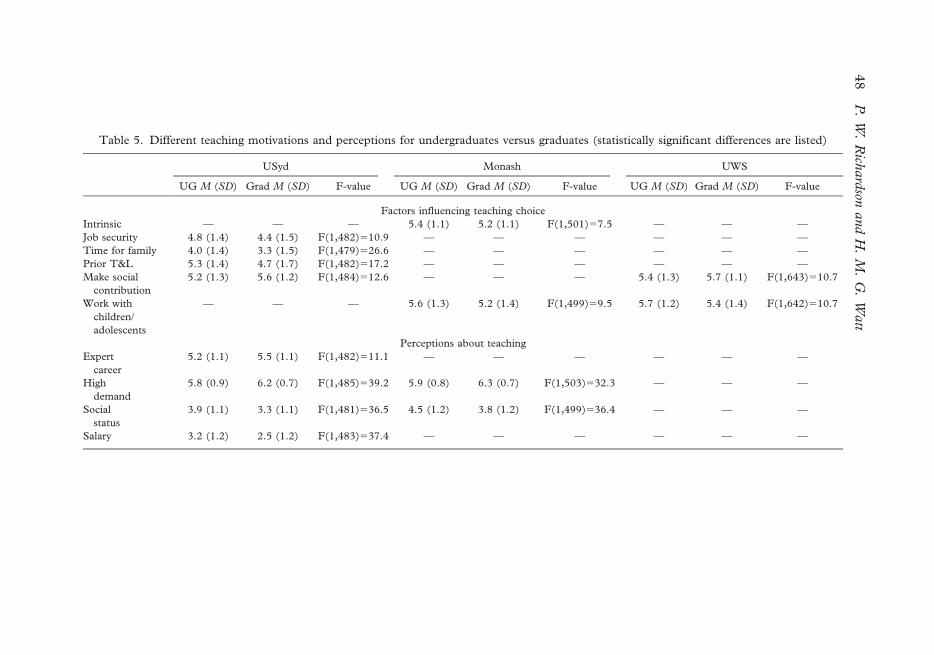
Table 5. Different teaching motivations and perceptions for undergraduates versus graduates (statistically significant differences are listed)
USyd Monash UWS
UG M (SD) Grad M (SD) F-value UG M (SD) Grad M (SD) F-value UG M (SD) Grad M (SD) F-value
Factors influencing teaching choice
Intrinsic — — — 5.4 (1.1) 5.2 (1.1) F(1,501)57.5 — — —
Job security 4.8 (1.4) 4.4 (1.5) F(1,482)510.9 — — — — — —
Time for family 4.0 (1.4) 3.3 (1.5) F(1,479)526.6 — — — — — —
Prior T&L 5.3 (1.4) 4.7 (1.7) F(1,482)517.2 — — — — — —
Make social
contribution
5.2 (1.3) 5.6 (1.2) F(1,484)512.6 — — — 5.4 (1.3) 5.7 (1.1) F(1,643)510.7
Work with
children/
adolescents
— — — 5.6 (1.3) 5.2 (1.4) F(1,499)59.5 5.7 (1.2) 5.4 (1.4) F(1,642)510.7
Perceptions about teaching
Expert
career
5.2 (1.1) 5.5 (1.1) F(1,482)511.1 — — — — — —
High
demand
5.8 (0.9) 6.2 (0.7) F(1,485)539.2 5.9 (0.8) 6.3 (0.7) F(1,503)532.3 — — —
Social
status
3.9 (1.1) 3.3 (1.1) F(1,481)536.5 4.5 (1.2) 3.8 (1.2) F(1,499)536.4 — — —
Salary 3.2 (1.2) 2.5 (1.2) F(1,483)537.4 — — — — — —
48
P.
W.
Rich
ard
sonand
H.
M.
G.
Watt

graduates rated the social status of teaching significantly more highly than graduates.
There were no statistically significant differences at UWS between undergraduate
and graduate participants’ ratings for their perceptions about the teaching
profession.
Career choice satisfaction. Interestingly, teacher education entrants reported relatively
strong experiences of social dissuasion from teaching as a career (mean ratings
around the scale midpoint, see Figure 7). These experiences were similarly strong for
undergraduates and graduates within each university. Despite this, and despite
perceptions of teaching as a career high in demand and low in return, mean
satisfaction ratings for teaching as a career choice were uniformly high (see Figure 7).
There were also no significant differences in satisfaction with teaching as a career
choice between undergraduates and graduates at any of the three universities.
Discussion
Our study has profiled teacher education entrants’ characteristics, motivations for
choosing teaching, perceptions about the profession and career choice satisfaction across
three Australian universities, all of them major teacher education providers. For this
sample of pre-service teachers, their decision to enrol in a teacher education program has
been made at a time when the mass media and the general public have increasingly
Figure 7. Perceptions about teaching
Who Chooses Teaching and Why? 49
looked upon teaching as a poor career choice. Our findings will help direct effective
recruitment efforts through a better understanding of who chooses teaching and why.
Who Chooses Teaching?
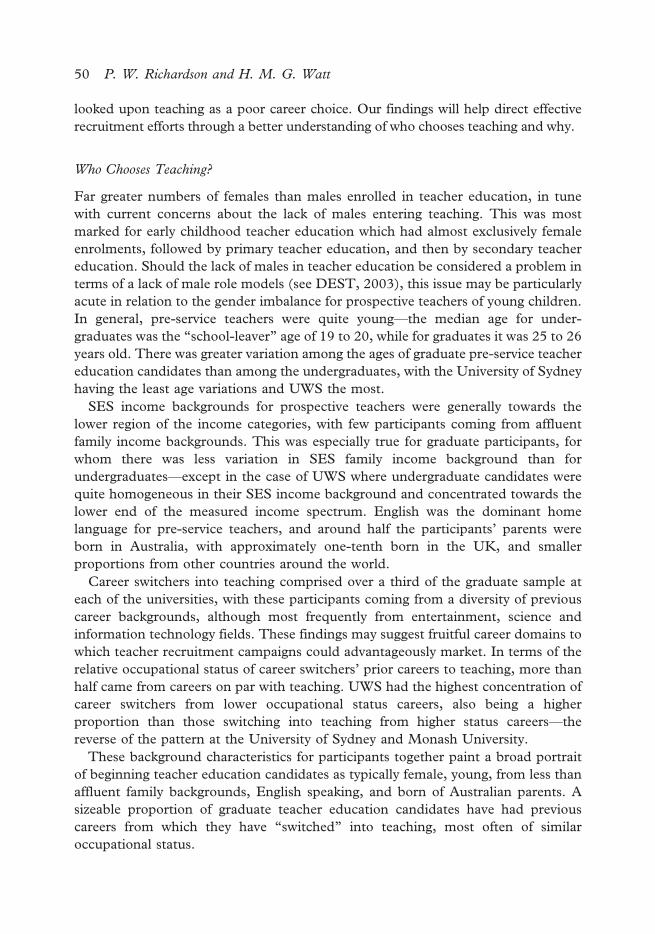
Far greater numbers of females than males enrolled in teacher education, in tune
with current concerns about the lack of males entering teaching. This was most
marked for early childhood teacher education which had almost exclusively female
enrolments, followed by primary teacher education, and then by secondary teacher
education. Should the lack of males in teacher education be considered a problem in
terms of a lack of male role models (see DEST, 2003), this issue may be particularly
acute in relation to the gender imbalance for prospective teachers of young children.
In general, pre-service teachers were quite young—the median age for under-
graduates was the ‘‘school-leaver’’ age of 19 to 20, while for graduates it was 25 to 26
years old. There was greater variation among the ages of graduate pre-service teacher
education candidates than among the undergraduates, with the University of Sydney
having the least age variations and UWS the most.
SES income backgrounds for prospective teachers were generally towards the
lower region of the income categories, with few participants coming from affluent
family income backgrounds. This was especially true for graduate participants, for
whom there was less variation in SES family income background than for
undergraduates—except in the case of UWS where undergraduate candidates were
quite homogeneous in their SES income background and concentrated towards the
lower end of the measured income spectrum. English was the dominant home
language for pre-service teachers, and around half the participants’ parents were
born in Australia, with approximately one-tenth born in the UK, and smaller
proportions from other countries around the world.
Career switchers into teaching comprised over a third of the graduate sample at
each of the universities, with these participants coming from a diversity of previous
career backgrounds, although most frequently from entertainment, science and
information technology fields. These findings may suggest fruitful career domains to
which teacher recruitment campaigns could advantageously market. In terms of the
relative occupational status of career switchers’ prior careers to teaching, more than
half came from careers on par with teaching. UWS had the highest concentration of
career switchers from lower occupational status careers, also being a higher
proportion than those switching into teaching from higher status careers—the
reverse of the pattern at the University of Sydney and Monash University.
These background characteristics for participants together paint a broad portrait
of beginning teacher education candidates as typically female, young, from less than
affluent family backgrounds, English speaking, and born of Australian parents. A
sizeable proportion of graduate teacher education candidates have had previous
careers from which they have ‘‘switched’’ into teaching, most often of similar
occupational status.
50 P. W. Richardson and H. M. G. Watt

Why Choose Teaching?
Counter to much earlier findings (Haubrich, 1960), teaching was not typically
considered a ‘‘fallback’’ career—either for graduate or undergraduate participants.
Regardless of the evidence, these claims continue to circulate in the public media
and in uninformed opinion. Nor was encouragement from others a strong factor in
individuals’ choice of teaching as a career. Participants’ teaching ability-related
beliefs, personal and social utility values and positive prior experiences of teaching and
learning were all important motivations for choosing teaching as a career. Values
included the intrinsic value of teaching, social utility values (including the desire to
shape the future, enhance social equity, make a social contribution and work with
children/adolescents), and then personal utility values (these included job security,
time for family and job transferability).
Participants perceived teaching as a career that is highly demanding, and one that
provides for low return in terms of salary and social status. The fact that these
potential entrants into teaching rated the intrinsic value of teaching highly despite
this, suggests that teaching may afford different types of rewards that are not always
inherent in other occupations, and that participants seek out those rewards that
come from the experience of teaching, and the opportunity structure which teaching
affords to provide for the realization of their personal and social values. This is
reflected through participants simultaneously reporting uniformly high levels of
satisfaction with their choice of teaching as a career. In workplace circumstances
where these kinds of rewards become swamped by other more immediate and
pressing demands, teachers may be less likely to persist in the profession. Knowing
that a career is demanding is quite different to actually ‘‘living’’ the experience of the
lack of comparative rewards such as salary and status, that other equally demanding
careers offer (Liu et al., 2000). Those ‘‘rewards’’ provided by careers other than
teaching may become increasingly attractive during the ‘‘lived’’ experience of
beginning teaching. While Australian entry level salaries for teachers are comparable
with other similarly skilled careers, salary scales significantly plateau after five to ten
years of teaching service (MCEETYA, 2002). Other recent studies have indeed
found that low teaching salaries and the contrasting rewards for comparable jobs do
exert an influence on individuals’ decisions to leave the teaching profession (see Liu
et al., 2000; OECD, 2004; Ramsay, 2000).
Participants reported relatively strong experiences of social dissuasion from
teaching. For whatever reason, others had advised them not to go into teaching.
Whereas earlier research found that previous teachers and family had been
frequently nominated as influences on the choice of teaching as a career (Book &
Freeman, 1986; Fox, 1961; Lortie, 1975; Robertson, Keith, & Page, 1983), our
measurement of the importance of this factor, relative to a range of others, showed
that in this sample significant others were not highly influential in general, with mean
ratings well below the scale midpoint. Importantly, all these perceptions were
assessed near the beginning of participants’ first year of teacher education—
indicating that they have chosen teaching as a career despite their perceptions about
Who Chooses Teaching and Why? 51

the relative demands and returns in the profession, and despite their experiences of
others attempting to dissuade them from teaching as a career.
There were few systematic differences between undergraduate and graduate
participants across the three universities, implying that motivations for choosing
teaching as a career tend to be unrelated to whether participants chose teaching as
their initial career or not. Significantly, undergraduates and graduates had similar
levels of satisfaction with teaching as a career choice within each of the three
universities, implying that graduate entrants are not necessarily more contented with
and committed to their choice of a teaching career, as has been suggested in smaller
scale studies based on more opportune samples (Crow et al., 1990; Freidus, 1992;
Priyadharshini & Robinson-Pant, 2003).
Implications for Policy and Practice
The characteristics of those people choosing to enter teacher education in the
current climate of teacher shortages provide valuable background information for
policy-makers, recruitment bodies, university governance and teacher educators.
Our robust empirical findings regarding those motivations which have attracted
these people to pursue teaching careers will be of particular use to these groups.
Current and recent recruitment campaigns have tended to focus on a limited subset
of these motivations, predominantly relating to the opportunity to make a social
contribution and the opportunity to work with children, likely limiting their audience
and effectiveness. An expanded focus which includes additional social utility values
(opportunities to shape the future and enhance social equity), as well as personal
utility values (job security, time for family, job transferability), intrinsic values and
individuals’ perceptions regarding their teaching-related abilities, promises to yield
more effective results. Results from our study indicate that people are attracted to
teaching as a career mainly because they perceive themselves as having the abilities to
teach well, they believe they will find teaching an intrinsically rewarding and
enjoyable occupation, they have themselves enjoyed positive learning experiences,
they perceive teaching will provide them with a high level of job security, and to be a
worthwhile job that has the potential to influence the quality of life for others,
especially children and adolescents. Additionally, the opportunity to balance career
with quality of life concerns is important. This profile of motivations for people
entering teacher education programs in three Australian universities suggests that we
should not be focused on a limited number of values, such as working with children
and making a social contribution. Instead, it is clear that a range of values are
important. We therefore argue that it is essential to target the multiplicity of factors
that together impact the decision to enter teaching as a career.
Our Ongoing Program of Research
Teacher education has been subjected to a significantly large number of reviews over
the last thirty years (Dyson, 2005) and yet we struggle to understand why people are
52 P. W. Richardson and H. M. G. Watt

attracted into teaching in the first place and why they are either retained or leave the
profession. Such a situation would suggest that we need a different approach to
teacher recruitment, induction and retention. This study has reported on the first
phase of our ongoing longitudinal research program targeting recruitment, induction
and retention issues, across universities in Australia and the US. We are also
currently collaborating with colleagues at the Max Planck Institute for Human
Development (Berlin, Germany) who have implemented our FIT-Choice Scale, to
provide information from the context of a very different schooling system. These
further samples from outside of Australia will allow us to more effectively chart
general trends, and to place local particularities into broader contexts of
development for a career that Governments around the world continue to
acknowledge as central to social and economic well-being. Our three-phase study
tracks the same participants, from their entry into teacher education, again at the
point of graduation from their teacher education program, and then two years
following graduation. Phase 2 of this research program is currently underway, in
which we assess graduands’ teaching self-efficacy and professional commitment prior
to their entry into the teaching profession. Phase 3 will focus on participants in their
early years in the profession (or outside the teaching profession if they have not
entered teaching or decided to leave the profession), with a focus on beginning
teacher mentoring, teaching self-efficacy and professional commitment, levels of
stress and burnout, and contextual school environment features. Relational pathways
across Phases 1 to 3 will provide the first study to track identified individual teacher
developmental pathways within a methodologically sophisticated, large-scale and
international longitudinal design.
Acknowledgements
Preparation of this paper was supported in part by institutional grants from the
University of Western Sydney, the University of Sydney, and Monash University.
We wish to thank Dr Ray Debus from the University of Sydney for his suggestions
and feedback on an earlier version of the paper, and Professor Jacquelynne Eccles
from the University of Michigan for valuable discussions about our ideas.
Notes on Contributors
The authors together with Jacquelynne S. Eccles (University of Michigan) hold an
Australian Research Council Discovery Grant 2006-9 for their ongoing ‘‘FIT-
Choice’’ research program.
Paul W. Richardson is a visiting Research Scientist at the University of Michigan,
working on a National Institute Child Health and Human Development
(NICHD) funded study.
Helen M. G. Watt has previously been Faculty at Macquarie, Sydney, and UWS
universities and is currently a Research Scientist at the University of Michigan.
Who Chooses Teaching and Why? 53

Notes
1. This factor includes items which tap the extent to which teaching provides time for individuals
to pursue other activities (for example, length of vacations, length of working day). Those items
were initially designed to tap a ‘‘bludging’’ factor (an Australianism which refers to expending
the least effort possible), which interestingly was empirically indistinguishable from the items
tapping the extent to which teaching provides for family time (for example, fitting with family
commitments, allowing for more family time). Rather than signaling the pejorative ‘‘bludging’’,
it appears that individuals who rate vacation times and working hours as important to their
choice of teaching as a career are making these judgments in relation to significant quality of life
considerations.
2. From 2005, UWS is now offering teacher education programs solely in graduate mode.
3. Applicable to Monash University and the University of Western Sydney undergraduates only.
4. UWS actively recruits graduate teacher education candidates from the Ontario Institute for
Studies in Education at the University of Toronto.
References
Beck, U. (2000). The brave new world of work. (R.Camiller, Trans.). Cambridge: Polity Press.
Book, C. L., & Freeman, D. J. (1986). Differences in entry characteristics of elementary and
secondary teacher candidates. Journal of Teacher Education, 37(2), 47–51.
Brown, M. M. (1992). Caribbean first-year teachers’ reasons for choosing teaching as a career.
Journal of Education for Teaching, 18(2), 185–195.
Bullough Jr., R. V., & Knowles, J. G. (1990). Becoming a teacher: Struggles of a second
career beginning teacher. International Journal of Qualitative Studies in Education, 3(2),
101–112.
Crow, G. M., Levine, L., & Nager, N. (1990). No more business as usual: Career changers who
become teachers. American Journal of Education, 98, 197–223.
DEST. (2003). Australia’s teachers: Australia’s future. Advancing innovation, science, technology and
mathematics. Canberra: Committee for the review of teaching and teacher education,
Department of Education, Science and Training.
Dyson, M. (2005). Australian teacher education: Although reviewed to the eyeballs is there
evidence of significant change and where to now?. Australian Journal of Teacher Education,
30(1), 37–54.
Eccles (Parsons), J., Adler, T. F., Futterman, R., Goff, S. B., Kaczala, C. M., & Meece, J. L.,
et al. (1983). Expectancies, values, and academic behaviors. In J. T. Spence (Ed.),
Achievement and achievement motivation (pp. 75–146). San Francisco, CA: W.H.
Freeman.
European Commission. (2000). Key data on education in Europe. European Commission: Brussels.
Fox, R. B. (1961). Factors influencing the career choice of prospective teachers. Journal of Teacher
Education, 7(4), 427–432.
Freidus, H. (1992, April). Men in women’s world: A study of male second career teachers in elementary
schools. Paper presented at the annual meeting of the American Educational Research
Association, San Francisco, CA.
Haipt, M. (1987/1988). Choosing teaching as a mid-career change. The Teacher Educator, 23(3),
17–24.
Haubrich, V. F. (1960). The motives of prospective teachers. Journal of Teacher Education, 11(3),
381–386.
Henke, R. R., Chen, X., & Geis, S. (2000). Progress through the teacher pipeline: 1992–93 college
graduates and elementary/secondary school teaching as of 1997. Washington, DC: National
Center for Educational Statistics.
54 P. W. Richardson and H. M. G. Watt

House of Representatives Standing Committee on Education and Training. (2002). Boys: Getting it
right. Canberra, Australia.
Johnson, S. M., & Birkeland, S. E. (2003). Pursuing a ‘‘sense of success’’: New teachers explain
their career decisions. American Educational Research Journal, 40(3), 581–617.
Lent, R. W., Lopez, F. G., & Bieschke, K. J. (1993). Predicting mathematics-related choice and
success behaviors: Test of an expanded social cognitive model. Journal of Vocational Behavior,
42, 223–236.
Lingard, B., Martino, W., Mills, M., & Bahr, M. (2002). Addressing the educational needs of boys.
Canberra, Australia: Report to Department of Education, Science and Training.
Liu, E., Kardos, S. M., Kauffman, D., Preske, H. G., & Johnson, S. M. (2000). Barely breaking
even: Incentives, rewards, and the high costs of choosing to teach. Cambridge: Harvard Graduate
School of Education.
Lokan, J., Ford, P., & Greenwood, L. (1996). Maths & science on the line: Australian junior
secondary students’ performance in the third international mathematics and science study.
Melbourne: Australian Council for Educational Research.
Lortie, D. C. (1975). School-teacher: A sociological study. Chicago: University of Chicago Press.
Ludwig, M., Stapleton, L., & Goodrich, B. (1995). Sustaining the supply of math and science teachers:
Assessing the long-term effects of nontraditional and mid-career teacher preparation programs.
Washington, DC: American Association of State Colleges and Universities.
Martin, A. J. (2002). Improving the educational outcomes of boys. Canberra: Report to ACT
Department of Education, Youth and Family Services.
MCEETYA. (1999). The Adelaide declaration on national goals for schooling in the twenty-first century.
Melbourne: Ministerial Council on Employment, Education, Training and Youth Affairs
(MCEETYA).
MCEETYA. (2002). Demand and supply of primary and secondary school teachers in
Australia. Melbourne: Ministerial Council on Education, Employment, Training and Youth
Affairs.
Moran, A., Kilpatrick, R., Abbott, L., Dallatt, J., & McClune, B. (2001). Training to teach:
Motivating factors and implications for recruitment. Evaluation & Research in Education,
15(1), 17–32.
Novak, D., & Knowles, G. J. (1992, April). Life histories and the transition to teaching as a second
career. Paper presented at the Annual meeting of the American Educational Research
Association, San Francisco, CA.
OECD. (2004). Attracting, developing and retaining effective teachers. Retrieved December 14, 2005
from http://www.oecd.org/document/9/0,2340,en_2649_34521_11969545_1_1_1_1,00.html.
Ofsted. (2001). The annual report of Her Majesty’s Chief Inspector of Schools: Standards and quality in
education 2000/01. London: Office of Standards in Education.
Ornstein, A. C., & Miller, H. L. (1980). Looking into teaching: An introduction to American education.
Chicago: Rand McNally College Publishing Company.
Powell, R. R. (1996). Teaching alike: A cross-case analysis of first career and second career
beginning teachers’ instructional convergence. Teaching and Teacher Education, 13(3),
341–355.
Preston, B. (2000). Teacher supply and demand to 2005: projections and context. Canberra: Australian
Council of Deans.
Priyadharshini, E., & Robinson-Pant, A. (2003). The attraction of teaching: an investigation into
why people change careers to teach. Journal of Education for Teaching: International Research
and Pedagogy, 29(2), 95–112.
Ramsay, G. (2000). Quality matters. Revitalising teaching: Critical times, critical choices. Report of the
review of teacher education. Sydney: NSW Department of Education and Training.
Resta, V., Huling, L., & Rainwater, N. (2001). Preparing second-career teachers. Educational
Leadership, 13(3), 60–63.
Who Chooses Teaching and Why? 55

Richardson, P. W., & Watt, H. M. G. (2003, 17–20 September). Rethinking research into the choice
of teaching as a career: Application of a new theoretical approach. Paper presented at the
European Conference on Educational Research, Hamburg, Germany.
Richardson, P. W., & Watt, H. M. G. (2005). ‘‘I’ve decided to become a teacher’’: Influences on
career change. Teaching & Teacher Education, 21, 475–489.
Robertson, S., Keith, T., & Page, E. (1983). Now who aspires to teach? Educational Researcher,
12(6), 13–21.
Santiago, P. (2001). Teacher shortage. OECD Observer. Retrieved December 14, 2005, from
http://www.oecdobserver.org/news/printpage.php/aid/431/Teacher-shortage.html.
Serow, R. C., & Forrest, K. D. (1994). Motives and circumstances: Occupational-change
experiences of prospective late-entry teachers. Teaching & Teacher Education, 10(5), 555–563.
Skilbeck, M., & Connell, H. (2003). Attracting, developing and retaining effective teachers: Australian
country background report. Canberra, ACT: Department of Education, Science and Training.
US Department of Labor Employment and Training Administration. (1998). O*NET: The
occupational information network. Washington, DC: US Government Printing Office.
Watt, H. M. G. (2002). Gendered achievement-related choices and behaviours in mathematics and
English: The nature and influence of self-, task- and value perceptions. Unpublished PhD thesis,
University of Sydney.
Watt, H. M. G., & Richardson, P. W. (2003, 17–20 September). Teaching as a gendered profession:
The application of expectancy-value theory to understanding gendered motivations for teaching
as a career choice. Paper presented at the European Conference on Educational Research,
Hamburg, Germany.
Watt, H. M. G., & Richardson, P. W. (in review). Motivational factors influencing teaching as a
career choice: Development and validation of the ‘‘FIT-Choice’’ Scale. Journal of Educational
Psychology.
Wigfield, A., & Eccles, J. S. (2000). Expectancy-value theory of achievement motivation.
Contemporary Educational Psychology, 25, 68–81.
56 P. W. Richardson and H. M. G. Watt
Related Documents