Working Paper 222 August 2010 Who Are the MDG Trailblazers? A New MDG Progress Index Abstract In September, world leaders will assemble in New York to review progress towards the Millennium Development Goals (MDGs). Ahead of the ensuing discussions, we examine how individual countries are faring towards achieving the highly ambitious MDG targets. We outline a new MDG Progress Index, which compares country performance against the core MDG targets on poverty, hunger, gender equality, education, child mortality, health, and water. Overall, we find evidence of dramatic achievements by many poor countries such as Honduras, Laos, Ethiopia, Uganda, Burkina Faso, Nepal, Cambodia, and Ghana. In fact, these countries’ performance suggests that they may achieve most of the highly ambitious MDGs. Moreover, sub-Saharan Africa accounts for many of the star MDG performers. Interestingly, poor countries perform nearly on par with middle-income countries. Not surprisingly, the list of laggards largely consists of countries devastated by conflict over the last few decades, such as Afghanistan, Burundi, the DRC, and Guinea-Bissau. Most countries fall somewhere in between, demonstrating solid progress on some indicators and little on others. www.cgdev.org Benjamin Leo and Julia Barmeier

Welcome message from author
This document is posted to help you gain knowledge. Please leave a comment to let me know what you think about it! Share it to your friends and learn new things together.
Transcript
Working Paper 222August 2010
Who Are the MDG Trailblazers? A New MDG Progress Index
Abstract
In September, world leaders will assemble in New York to review progress towards the Millennium Development Goals (MDGs). Ahead of the ensuing discussions, we examine how individual countries are faring towards achieving the highly ambitious MDG targets. We outline a new MDG Progress Index, which compares country performance against the core MDG targets on poverty, hunger, gender equality, education, child mortality, health, and water. Overall, we find evidence of dramatic achievements by many poor countries such as Honduras, Laos, Ethiopia, Uganda, Burkina Faso, Nepal, Cambodia, and Ghana. In fact, these countries’ performance suggests that they may achieve most of the highly ambitious MDGs. Moreover, sub-Saharan Africa accounts for many of the star MDG performers. Interestingly, poor countries perform nearly on par with middle-income countries. Not surprisingly, the list of laggards largely consists of countries devastated by conflict over the last few decades, such as Afghanistan, Burundi, the DRC, and Guinea-Bissau. Most countries fall somewhere in between, demonstrating solid progress on some indicators and little on others.
www.cgdev.org
Benjamin Leo and Julia Barmeier
Who Are the MDG Trailblazers? A New MDG Progress Index
Benjamin LeoCenter for Global Development
Julia Barmeier
Benjamin Leo is a research fellow at the Center for Global Development and former director for African Affairs at the National Security Council and senior staff member of the U.S. Department of Treasury. Julia Barmeier was a research assistant at the Center for Global Development. We thank Alan Gelb, Todd Moss, Shanta Devarajan, Nancy Birdsall, and several anonymous reviewers for input and comments on earlier drafts of this paper. The authors are solely responsible for any errors in fact or judgment.
CGD is grateful for contributions from the Norwegian Ministry of Foreign Affairs and the Swedish Ministry of Foreign Affairs in support of this work.
Benjamin Leo and Julia Barmeier. 2010. “Who Are the MDG Trailblazers? A New MDG Progress Index.” CGD Working Paper 222. Washington, D.C.: Center for Global Development. http://www.cgdev.org/content/publications/detail/1424377
Center for Global Development1800 Massachusetts Ave., NW
Washington, DC 20036
202.416.4000(f ) 202.416.4050
www.cgdev.org
The Center for Global Development is an independent, nonprofit policy research organization dedicated to reducing global poverty and inequality and to making globalization work for the poor. Use and dissemination of this Working Paper is encouraged; however, reproduced copies may not be used for commercial purposes. Further usage is permitted under the terms of the Creative Commons License.
The views expressed in this paper are those of the author and should not be attributed to the board of directors or funders of the Center for Global Development.

1
I declared 2010 to be the year of development. We need to focus
attention and accelerate the process to achieve, to realize, the goals
of the MDGs by the target year, 2015. We have only six years left
before 2015.
—UN Secretary-General Ban Ki-moon, December 2009
Despite improved growth performance, most sub-Saharan African
countries are off track to meet the MDGs.
—World Bank Development Committee Communiqué,
April 2008
I. OVERVIEW
In September, world leaders will assemble in New York to review progress toward the
Millennium Development Goals (MDGs). Ahead of the ensuing discussions, this paper aims to
make a modest contribution to monitoring how individual countries are faring toward achieving
the highly ambitious MDG targets.
Global shepherds of the MDGs, such as the UN and World Bank, generally report progress either
on a global or regional basis. As the MDGs were envisioned as targets for the overall developing
world, global reporting (not regional) is appropriate. The current regionally based reporting has
several notable downsides. Most important, it leads to blanket statements about how some
regions are “on track” to meet the MDG targets (i.e., East Asia) while others are “off track” (i.e.,
sub-Saharan Africa). This tends to mask dramatic intraregional variations in performance. For
example, China‟s impressive achievements and size drive the overall MDG performance picture
for East Asia.1 Other countries with less impressive development outcome track records – such
as Papua New Guinea – are simply too small to affect the regional aggregates. Likewise, large
African laggards – such as Nigeria and the Democratic Republic of the Congo2 – weigh down
regional aggregates. Nonetheless, many African countries have made tremendous strides in
achieving development outcomes. Regionally based reporting does a serious disservice to these
high-performing countries.
Second, data availability and quality varies widely for several MDG indicators. For example,
accurate figures for the percentage of people living on less than a dollar a day is unavailable for
many countries during the early 1990s.3 In more recent years, reporting for this target indicator
has remained spotty with only sporadic data points for most countries. As a result, annual
regional averages can produce significant volatility, inconsistency, and misleading results due to
the inclusion or exclusion of different countries.
1 China accounts for nearly 70 percent of the total population of East Asia and the Pacific.
2 These two countries account for over one-quarter of sub-Saharan Africa‟s total population.
3 The UN subsequently revised this absolute poverty indicator to $1.25 per day to account for inflation over time.
2
When reporting is provided on a country-by-country basis, it normally takes one of two forms.
The first are voluminous progress reports. This may be immensely helpful for a highly selective
group of specialists responsible for designing or managing specific projects. However, it is
simply too exhaustive and dense for the broader stakeholder audience. The second are birds-eye
assessments of whether the respective country is on or off track without any underlying data or
supporting references. A more digestible snapshot that captures countries‟ progress with a
balanced amount of underlying data would be productive for this larger audience of interested
stakeholders and researchers.
This paper attempts both to overcome the aforementioned regional simplification bias and the
need for more user-friendly quantitative performance measures for specific countries. It begins
by providing a very brief overview of the MDGs, their shortcomings and strengths, and how they
are monitored currently. Next, the paper describes our MDG Progress Index methodology,
which measures individual country progress on eight core MDG targets. Finally, we summarize
the key takeaways of how poor countries are doing on these highly ambitious targets.
II. MILLENNIUM DEVELOPMENT GOALS
In September 2000, 189 member states of the United Nations adopted the Millennium
Declaration, which included concrete commitments and targets for poverty eradication,
development, and protecting the environment. Among other things, the signatories established
the following targets:
To halve, by the year 2015, the proportion of the world’s people whose income is less
than one dollar a day and the proportion of people who suffer from hunger and, by the
same date, to halve the proportion of people who are unable to reach or to afford safe
drinking water.
To ensure that, by the same date, children everywhere, boys and girls alike, will be able
to complete a full course of primary schooling and that girls and boys will have equal
access to all levels of education.
By the same date, to have reduced maternal mortality by three-quarters, and under-five
child mortality by two-thirds, of their current rates.
To have, by then, halted, and begun to reverse, the spread of HIV/AIDS, the scourge of
malaria and other major diseases that afflict humanity.
Source: United Nations Millennium Declaration (resolution 55/2), paragraph 19
Since then, the UN has allocated considerable time and resources towards developing and
tracking MDG action plans and results frameworks. Starting in 2001, the UN Secretary-General
unveiled his Road Map for implementing the Millennium Declaration, which included the
original eight goals supported by 21 time bound targets and 60 indicators to measure progress.
These indicators track everything from the proportion of fish stocks within safe biological limits
to the official development assistance received in landlocked developing countries as a
proportion of their gross national incomes. Some indicators are closely linked to the core
3
Millennium Declaration commitments, while others are more loosely or tangentially related.
Notably, this Road Map was not formally endorsed by UN member states. Nonetheless, the UN
continues to utilize a slightly adapted version of this framework to report on MDG progress. The
World Bank‟s Global Monitoring Report also provides annual updates on the MDGs, among
other development issues.
Several important studies have documented how the MDGs are unrealistically ambitious for
some regions or countries. Easterly (2009) argues that the MDGs were poorly and arbitrarily
designed as instruments for defining “success” or “failure” on poverty and other development
targets. Essentially, Easterly contends that the MDG methodology sets up sub-Saharan Africa
for failure – even if countries make significant progress. Clemens, Kenny, and Moss (2004)
contend that the required rates of progress for achieving many of the MDGs exceed even the
most impressive historical achievements. For example, they note that the typical African country
would need to grow at an average rate exceeding 7 percent over a twenty-five year period in
order to halve poverty rates.
Only two African countries (Botswana and Equatorial Guinea),
which account for only 0.3 percent of Africa‟s total population, had achieved that feat
previously. At the time, these authors worried that unrealistic MDG targets may actually turn
dramatic development success into perceptions of failure, which could undermine future
government reform and aid constituencies.
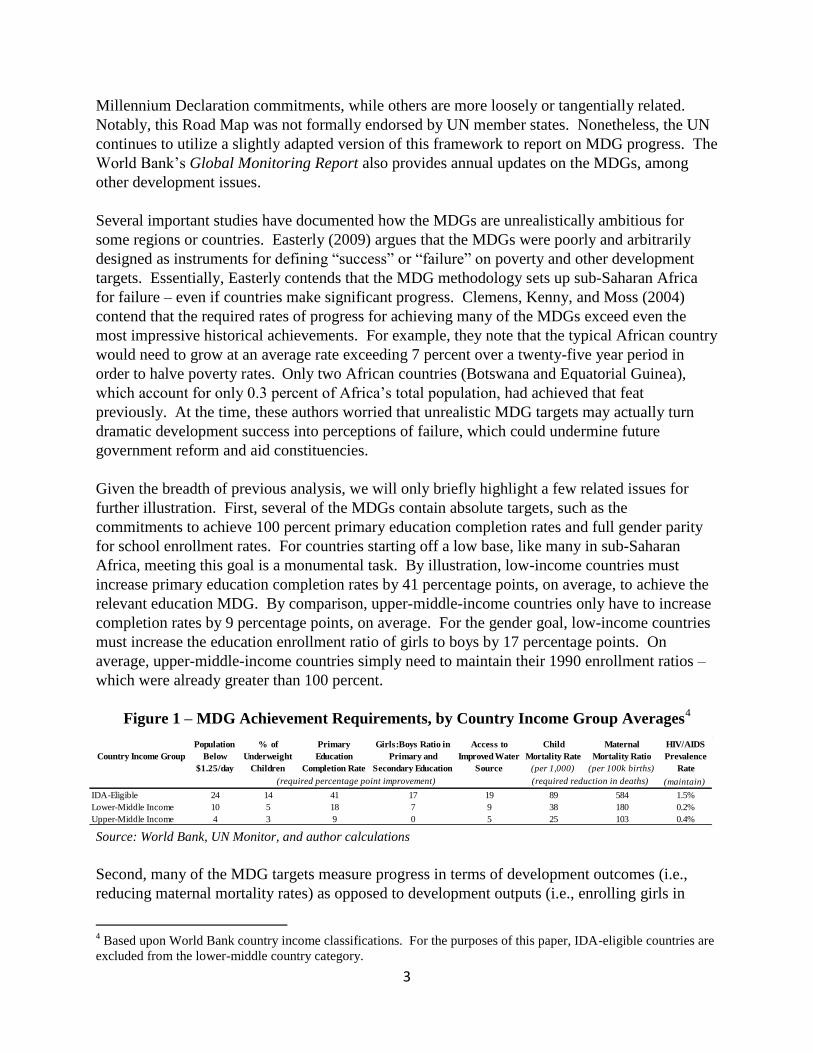
Given the breadth of previous analysis, we will only briefly highlight a few related issues for
further illustration. First, several of the MDGs contain absolute targets, such as the
commitments to achieve 100 percent primary education completion rates and full gender parity
for school enrollment rates. For countries starting off a low base, like many in sub-Saharan
Africa, meeting this goal is a monumental task. By illustration, low-income countries must
increase primary education completion rates by 41 percentage points, on average, to achieve the
relevant education MDG. By comparison, upper-middle-income countries only have to increase
completion rates by 9 percentage points, on average. For the gender goal, low-income countries
must increase the education enrollment ratio of girls to boys by 17 percentage points. On
average, upper-middle-income countries simply need to maintain their 1990 enrollment ratios –
which were already greater than 100 percent.
Figure 1 – MDG Achievement Requirements, by Country Income Group Averages4
Source: World Bank, UN Monitor, and author calculations
Second, many of the MDG targets measure progress in terms of development outcomes (i.e.,
reducing maternal mortality rates) as opposed to development outputs (i.e., enrolling girls in
4 Based upon World Bank country income classifications. For the purposes of this paper, IDA-eligible countries are
excluded from the lower-middle country category.
Country Income Group
Population
Below
$1.25/day
% of
Underweight
Children
Primary
Education
Completion Rate
Girls:Boys Ratio in
Primary and
Secondary Education
Access to
Improved Water
Source
Child
Mortality Rate
(per 1,000)
Maternal
Mortality Ratio
(per 100k births)
HIV/AIDS
Prevalence
Rate
(maintain)
IDA-Eligible 24 14 41 17 19 89 584 1.5%
Lower-Middle Income 10 5 18 7 9 38 180 0.2%
Upper-Middle Income 4 3 9 0 5 25 103 0.4%
(required reduction in deaths)(required percentage point improvement)
4
school). In general terms, achieving outcomes is a longer and more difficult process than
achieving output targets. For example, developing countries can dramatically increase school
enrollment output targets by reducing or eliminating school fees. This is different than achieving
concrete learning outcomes (i.e., increased testing scores). In this example, educational
outcomes depend on a wide range of environmental, social, health, and economic factors. In
fact, the school enrollment target may actually undercut learning outcomes. Class sizes may
increase dramatically, which places a significant burden on teachers‟ ability to provide quality
instruction and monitor student progress. As a result, we would expect to find higher progress
performance on the MDG targets that measure outputs (gender) and lower performance on the
outcome-based measures (poverty, hunger, water, child mortality, health, etc.).
Third, the Millennium Declaration measures development progress against a baseline year of
1990. Therefore, at the time of adoption, countries already had a decade of performance (or lack
thereof) factored into whether they were on track to achieve the MDGs. As a result, the MDGs
have a systemic bias towards countries that performed well during the 1990s. Importantly, this
has the additional effect of penalizing many African countries that experienced conflict or slow
economic growth during this time period.5
Despite their shortcomings, the MDGs continue to play a central role in international
development circles. They have been an important tool for mobilizing billions of dollars in new
development assistance for low-income countries. In this context, they should receive credit for
helping to reverse the declines in aid volumes during the 1990s following the end of the Cold
War. As noted above, the MDGs also have helped to shift donor attention away from
development inputs – such as dollars spent or textbooks purchased – and toward development
outcomes – such as reducing maternal mortality rates. Clearly, this shift remains a work in
progress for many donor agencies. However, the MDGs should receive credit for their role in
stimulating this institutional and programmatic rethinking.
III. MDG PROGRESS INDEX METHODOLOGY
The new MDG Progress Index attempts to provide a digestible, yet analytically robust, measure
of just how individual countries are doing on the ambitious targets. The methodology has been
customized to address several key issues, such as (1) dealing with annual data observation gaps
for most indicators; (2) capturing both absolute and relative progress on MDG indicators; and (3)
accounting for the alleged unrealistic nature of some MDGs. At its core, our methodology
compares country‟s performance against required achievement trajectories for each of the
examined MDG indicators. This trajectory is based on linear, annualized rates of improvement
for each respective MDG indicator. For example, to halve extreme poverty between 1990 and
2015, each country would need to achieve annualized reduction rates of 2 percent (50 percent
divided by 25 years). By calculating country‟s actual rate of improvement (or deterioration)
5 See a related World Bank blog by Shanta Devarajan entitled “Africa and the Millennium Development Goals”
(http://blogs.worldbank.org/africacan/africa-and-the-millennium-development-goals).
5
during the available observation period, we determine whether a country is above or below that
MDG indicator achievement trajectory.
Ideally, we would utilize available baseline data for 1990 and current data for 2008 to measure
country achievements. In some cases, this information is available and reported in the paper. In
other cases, the observation period is shorter due to the lack of available data for 1990 or more
recent years. The absence of baseline data for 1990 creates significant challenges for final
assessments of whether countries ultimately reach their MDG targets in 2015. For this exercise,
we put these methodological limitations aside and focus solely on how countries have performed
according to available data to determine whether a given country is above or below the
achievement trajectory during the shortened observation period.
The Index is calculated by aggregating country performance across the eight core MDG targets
covering poverty, hunger, education, gender equality, child mortality, maternal mortality,
HIV/AIDS prevalence rates, and safe drinking water. If a country‟s rate of improvement is
above the required trajectory, then it receives a score of 1. To address the criticism that the
MDG targets set unrealistic expectations for many developing countries, we also assign a score
of 0.5 to those countries that achieve at least 50 percent of the required trajectory. This
methodological nuance helps to capture significant development achievements that may fall
short of highly ambitious MDG expectations. In addition, we separately report MDG Progress
Index scores adjusted for data availability. Adjusted Index scores are calculated by dividing
countries‟ regular scores by the total number of indicators both with available baseline and recent
data observations. This adjustment prevents countries with missing MDG indicator data –
especially small-island and post-conflict countries – from being needlessly penalized (see section
III for details).
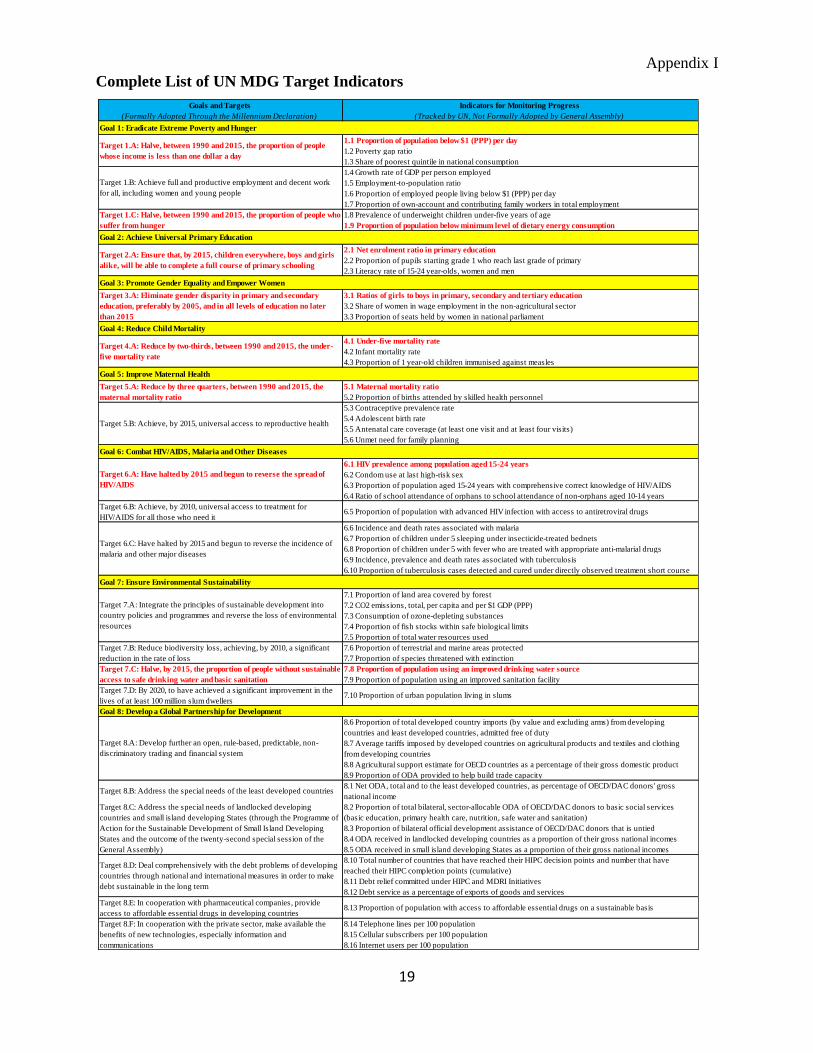
Indicator Selection: The MDG Progress Index includes only 8 of the 60 progress indicators
tracked and reported by the United Nations (see appendix I for complete list). We selected these
8 core indicators due to their (1) accuracy in capturing the original Millennium Declaration
goals; (2) data availability; and (3) usage in the development literature. The Index entirely
excludes MDG #8 (Develop a Global Partnership for Development) since the progress indicators
relate to donor country actions and not developing countries.6 This excludes 16 of the UN-
tracked progress indicators. We also have excluded seven environmental indicators and five
malaria indicators because of the lack of available data – especially for baseline years. For some
indicators, multiple data sources were examined, which produced slightly different results in
select instances. For these cases, we chose reputable sources that include both baseline and more
recent observations to ensure an apples-to-apples comparison of country performance. We
describe our final selections and address the sensitivity to source and measurement in detail
below.
MDG #1: Eradicate Extreme Hunger and Poverty: Two different indicators of progress on
MDG 1 were examined. The first, Target 1A, aims to reduce the proportion of people whose
6 The exception is Target 8F, which calls for countries to make available new technologies to their populations in
partnership with the private sector.
6
income is less than one dollar a day by 50 percent between 1990 and 2015. Later, the UN
adjusted this income threshold upwards to $1.25 a day to reflect inflation over time. We utilize
this revised income cutoff to measure country progress. Figures are from the World Bank‟s 2010
World Development Indicators: “poverty headcount ratio at $1.25 a day (purchasing power
parity, percent of population).” Given the 25-year timeframe, countries would need to achieve a
2 percent reduction every year to achieve their respective target. Therefore, the target
improvement is calculated by multiplying the number of observation years by -2 percent. The
actual improvement is simply the change between the baseline and current data. The
above/below track is the difference (positive or negative) between the actual and required
improvement. Those countries that are on par or above track receive a score of 1 and those
below a score of 0. Countries that achieve at least 50 percent of their target reduction rate
receive a score of 0.5.
Several methodological challenges should be noted for the absolute poverty indicator. First,
annual reporting on poverty headcount ratios is spotty and inconsistent over time – both in terms
of country coverage as well as volatility in observation figures. For example, country data from
the 2007 and 2010 World Development Indicators can differ by up to 100 percent.7 Second,
baseline data observations are unavailable for nearly one-third of the country sample. Third, the
accuracy of several country observations appears to be suspect.8 Fourth, the inconsistent
reporting over time may lead to observation period bias in terms of measuring individual country
progress. Put differently, the lack of recent data may lead to inaccurate reporting of current
country progress. For example, Tanzania has available observations only for 1992 and 2000.
During this period, GDP growth per capita averaged roughly 0.1 percent annually. However,
income growth per capita has averaged nearly 4 percent annually since then. Our MDG Progress
Index fails to capture these important achievements because of the lack of more recent data
observations. Given these methodological challenges, appropriate caution should be taken in
interpreting country progress toward achieving the absolute poverty target.
The second indicator utilized is Target 1C, which aims to reduce the proportion of people who
suffer from hunger by 50 percent between 1990 and 2015. Data on the prevalence of
undernourishment as a percent of the population was gathered from the World Bank‟s 2010
World Development Indicators.9 Given the 25-year timeframe, countries would need to achieve
a 2 percent reduction each year in the prevalence of undernourishment to meet the respective
target. Therefore, the target improvement is calculated by multiplying the number of observation
years by -2 percent. The actual improvement is simply the change between the baseline and
current data. The above/below track is the difference (positive or negative) between the actual
7 Given this, utilization of older data would generate results different than those displayed here.
8 For example, according to the 2010 World Development Indicators, the percentage of Tanzanians living on less
than $1.25 a day was 88.5 percent in 2000. For Rwanda, this figure was 76.6 percent in 2000. While both countries
have very large populations living in absolute poverty, these figures seem uncharacteristically high. 9 This data is collected by the FAO. Its estimates of the prevalence of undernourishment are essentially a measure of
food deprivation based on the calculation of three parameters for each country: (1) the average amount of food
available for human consumption per person; (2) the level of inequality in access to that food; and (3) the minimum
number of calories required for an average person. Therefore, the country estimates are only as reliable and accurate
as the data used to calculate the food balance sheets, levels of inequality, and daily energy requirement cut-off
points.
7
and required improvement. Those countries that are on par or above track receive a score of 1
and those below a score of 0. Countries that achieve at least 50 percent of their target reduction
rate receive a score of 0.5.
MDG #2: Achieve Universal Primary Education: The goal is to ensure that all children, boys
and girls alike, will be able to complete a full course of primary schooling by 2015. In other
words, countries should achieve a 100 percent completion rate for primary schooling. This paper
utilizes “primary completion rate (percentage of relevant age group)” indicator from the World
Bank‟s 2010 World Development Indicators to measure both baseline and progress levels.10
The
required improvement was calculated by subtracting the baseline data point from the 100 percent
goal to determine the total gap, then dividing that respective gap by 25 to produce the year-on-
year change required to meet the target. This year-on-year change is then multiplied by the
number of actual observation years to arrive at the target achievement reduction rate. The actual
improvement is simply the change between the baseline and current data. The above/below track
is the difference (positive or negative) between the actual and the required improvement. Those
countries that are on par or above track receive a score of 1 and those below a score of 0.
Countries that achieve at least 50 percent of their target reduction rate receive a score of 0.5.
MDG #3: Promote Gender Equality and Empower Women: This goal seeks to eliminate gender
disparity in education by 2015. To measure this, we employ the “ratio of girls to boys in primary
and secondary education (percentage)” series from the World Bank‟s 2010 World Development
Indicators. The required improvement is calculated by subtracting the baseline figure from the
100 percent parity goal to gauge the total gap, then dividing by 25 to ascertain the year-on-year
change required to meet the goal over the 1990–2015 period.11
This year-on-year change is then
multiplied by the number of actual observation years to arrive at the target achievement
reduction rate. The actual improvement is simply the change between the baseline and current
data. The above/below track is the difference (positive or negative) between the actual and
required improvement. Those countries that are on par or above track receive a score of 1 and
those below a score of 0. Countries that achieve at least 50 percent of their target reduction rate
receive a score of 0.5.
MDG #4: Reduce Child Mortality: The goal is to reduce the mortality rate for children under the
age of five years old by two-thirds between 1990 and 2015. Data is taken from the World
Bank‟s 2010 World Development Indicators. In order to achieve a two-thirds reduction,
countries would need to make yearly improvements of -2.667 percent over the respective MDG
time period. For the examined period between 1990 and 2008, “on track” countries would
achieve a reduction of 48 percent or greater. The actual improvement is simply the difference
between the baseline and most recent year data. The above/below track is the difference
10
Data is generated using the following formula: Proxy primary completion rate = (the total number of students in
the final year of primary school, minus repeaters) divided by (the total number of children of official graduation age
in the population). Different sources may provide different figures due to variations in the underlying demographic
modeling methodology. We compared WDI data to that from the World Bank report “A Chance for Every Child”
(Bruns, Mingat, and Rakotomalala 2003) and found the two to be highly correlated (0.92). 11
For purposes of this paper, the target ratio is established as 100 percent. However, the typical sex ratio at birth is
105–107 male births for every 100 female births.
8
(positive or negative) between the actual and required improvement. Those countries that are on
par or above track receive a score of 1 and those below a score of 0. Countries that achieve at
least 50 percent of their target reduction rate receive a score of 0.5.
MDG #5: Improve Maternal Health: The goal is to reduce the maternal mortality ratio by three-
quarters between 1990 and 2015. This paper utilizes 1990 and 2008 data from the paper
“Maternal Mortality for 181 Countries, 1980-2008: A Systemic Analysis of Progress Towards
Millennium Development Goal 5” published in The Lancet in May 2010. To achieve a 75
percent reduction over the 1990–2015 time period, countries would need to achieve an average
annualized decline of 3 percent. For the examined observation period between 1990 and 2008,
countries would need to achieve a 54 percent reduction. The actual improvement is simply the
change between the baseline and current year data. The above/below track is the difference
(positive or negative) between the actual and required improvement. Those countries that are on
par or above track receive a score of 1 and those below a score of 0. Countries that achieve at
least 50 percent of their target reduction rate receive a score of 0.5.
In terms of data quality and sources, several methodological issues should be noted. Overall,
most development policymakers and practitioners widely recognize that the quality of maternal
mortality data is poor. Country figures are produced through model simulations (as opposed to
government reporting), which complicate accurate monitoring. While we have selected a data
source different than those traditionally reported by the World Bank and UN, it is the most recent
and methodologically consistent across the examined time period. In addition, it provides the
most comprehensive country coverage.12
This enables us to complete an apples-to-apples
performance comparison for the greatest number of countries over time.
MDG #6: Combat HIV/AIDS, Malaria and Other Diseases: There are several MDG targets for
combating infectious diseases. This paper utilizes the HIV/AIDS target – which calls for halting
and then beginning to reverse the spread of HIV/AIDS by 2015.13
We employ the “prevalence
of HIV (percentage of population aged 15 to 49)” indicator from the World Bank‟s 2010 World
Development Indicators series.14
The UN utilizes HIV-prevalence rates among people aged 15
to 24 years to track progress, which is generally recognized as a better proxy. While countries
are moving toward collecting better data on this demographic – mainly by capturing data on
young pregnant women attending antenatal clinics – comparable data availability is very
limited.15
To achieve above track status, countries needed to maintain their baseline year
prevalence ratio. The actual improvement is calculated by the difference between the baseline
and most current data. The above/below track is the difference (positive or negative) between
12
See WHO and UNICEF (1996), Ronsmans and Graham (2006), and Hill et al (2007) for further discussion. 13
Malaria-related indicators suffer from a significant lack of available data – especially for baseline years. In
addition, the global health literature suggests focusing on HIV/AIDS as opposed to tuberculosis-related indicators. 14
While the UN tracks HIV/AIDS prevalence rates to monitor progress on MDG #6, this approach creates several
perverse incentives. First, countries that do a better job diagnosing HIV cases will likely report higher prevalence
rates. As such, this creates a disincentive to improving diagnosis activities. Second, people that receive anti-
retroviral treatment will live longer – thereby, contributing to higher HIV/AIDS prevalence rates. 15
HIV/AIDS prevalence rate data for ages 15–24 is only available for 2007. This data is reported separately for the
male and female populations. The correlation between these figures and HIV/AIDS prevalence rates for the total
population aged 15–49 is 0.95 and 0.98 respectively.
9
the actual and the required improvement. Those countries that are on par or above track receive
a score of 1 and those below a score of 0. Since the HIV/AIDS target entails a zero percent
increase in prevalence rates, we do not apply partial scores of 0.5 to countries.16
MDG #7: Ensure Environmental Sustainability: The related MDG target indicator entails
reducing the proportion of people without sustainable access to safe drinking water by 50 percent
by 2015. For this paper, we utilize the “improved water source (percentage of population with
access)”, which is taken from the World Bank‟s 2010 World Development Indicators. While the
current UN MDG framework includes specific sanitation targets and progress indicators, only
access to safe drinking water was included in the internationally endorsed Millennium
Declaration.17
Since the MDG target focuses on the population without access to improved
water sources, we subtract the World Development Indicators figures from 100 percent. Given
the 25-year time frame, countries must achieve a 2 percent decrease each year to meet the goal.
Thus, we calculate the required improvement by multiplying the number of observation years by
-2 percent. The actual improvement is the change between the baseline and current data. The
above/below track is the difference (positive or negative) between the actual and required
improvement. Those countries that are on par or above track receive a score of 1 and those
below a score of 0. Countries that achieve at least 50 percent of their target reduction rate
receive a score of 0.5.
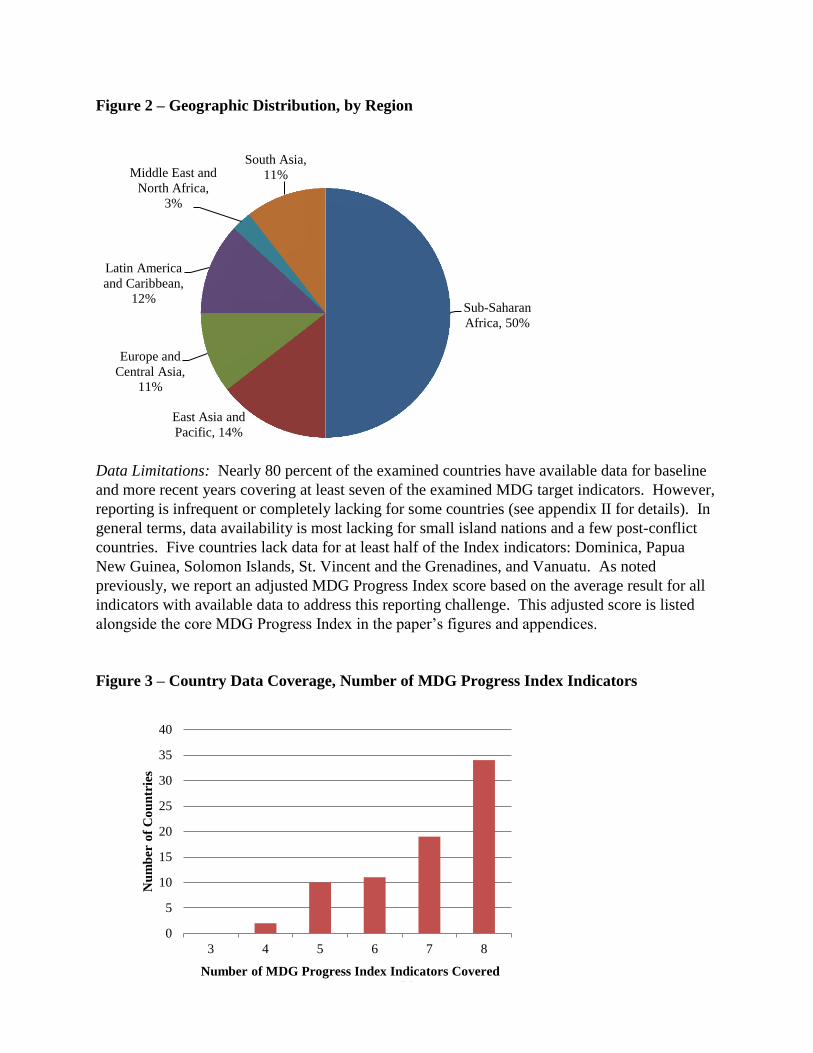
Country Selection: Our analysis focuses on countries that are eligible for International
Development Association (IDA) assistance, which includes 76 countries.18
In terms of
geographic distribution, sub-Saharan Africa accounts for the largest number of countries (38
countries) followed by East Asia (11 countries), Latin America and the Caribbean (9 countries),
Europe and Central Asia (8 countries), South Asia (8 countries), and the Middle East and North
Africa (2 countries). For comparative purposes, we also report performance for middle-income
countries, which includes an additional 63 countries.
16
The authors considered whether to include a partial score for those countries that have slowed the increase in
HIV/AIDS prevalence rates. Besides an inconsistency with the stated MDG target, this option was excluded due to
poor data availability and quality prior to 1990. 17
In addition, some experts contend that the sanitation target produces a bias against poor countries since safe
drinking water typically precedes improved sanitation facilities. To examine this contention, we also calculated
country progress scores on the proposed sanitation target indicator. On average, poor countries scored 0.36 on this
indicator compared to 0.57 on the improved water source indicator, which provides some analytical support to this
contention. 18
Three IDA-eligible countries (Kosovo, Myanmar, and Somalia) are excluded due to lack of data.
10
Figure 2 – Geographic Distribution, by Region
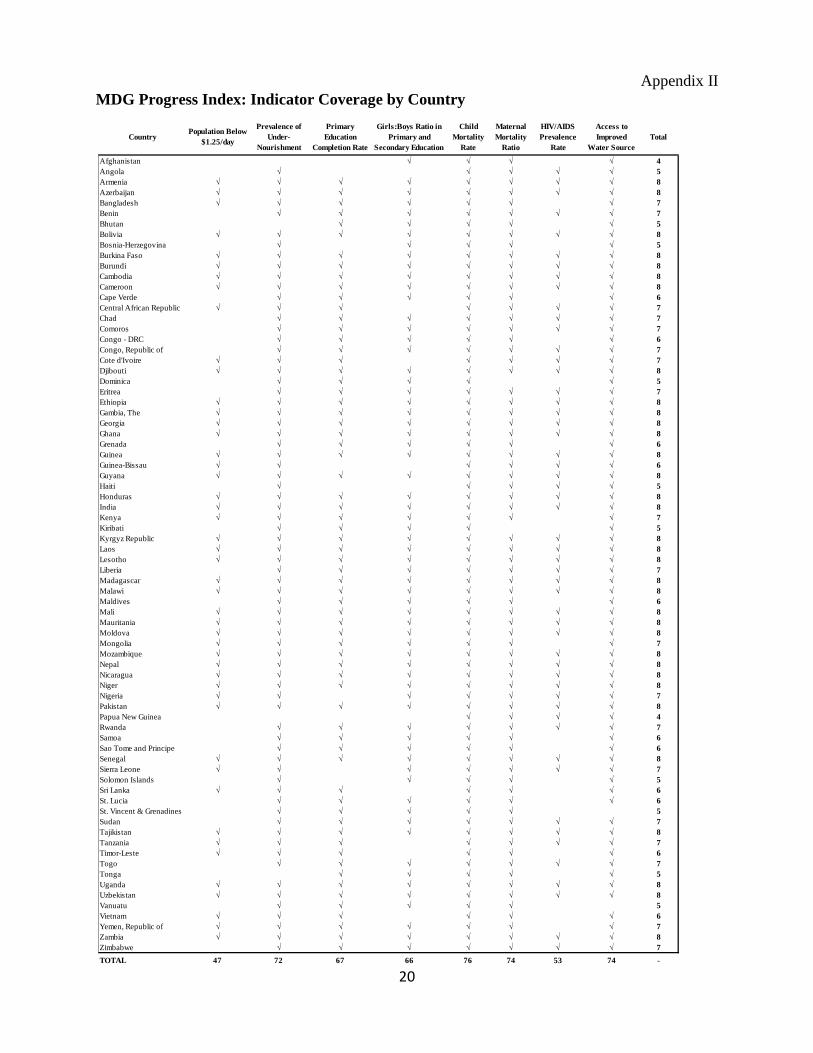
Data Limitations: Nearly 80 percent of the examined countries have available data for baseline
and more recent years covering at least seven of the examined MDG target indicators. However,
reporting is infrequent or completely lacking for some countries (see appendix II for details). In
general terms, data availability is most lacking for small island nations and a few post-conflict
countries. Five countries lack data for at least half of the Index indicators: Dominica, Papua
New Guinea, Solomon Islands, St. Vincent and the Grenadines, and Vanuatu. As noted
previously, we report an adjusted MDG Progress Index score based on the average result for all
indicators with available data to address this reporting challenge. This adjusted score is listed
alongside the core MDG Progress Index in the paper‟s figures and appendices.
Figure 3 – Country Data Coverage, Number of MDG Progress Index Indicators
Sub-Saharan
Africa, 50%
East Asia and
Pacific, 14%
Europe and
Central Asia,
11%
Latin America
and Caribbean,
12%
Middle East and
North Africa,
3%
South Asia,
11%
0
5
10
15
20
25
30
35
40
3 4 5 6 7 8
Nu
mb
er o
f C
ou
ntr
ies
Number of MDG Progress Index Indicators Covered
11
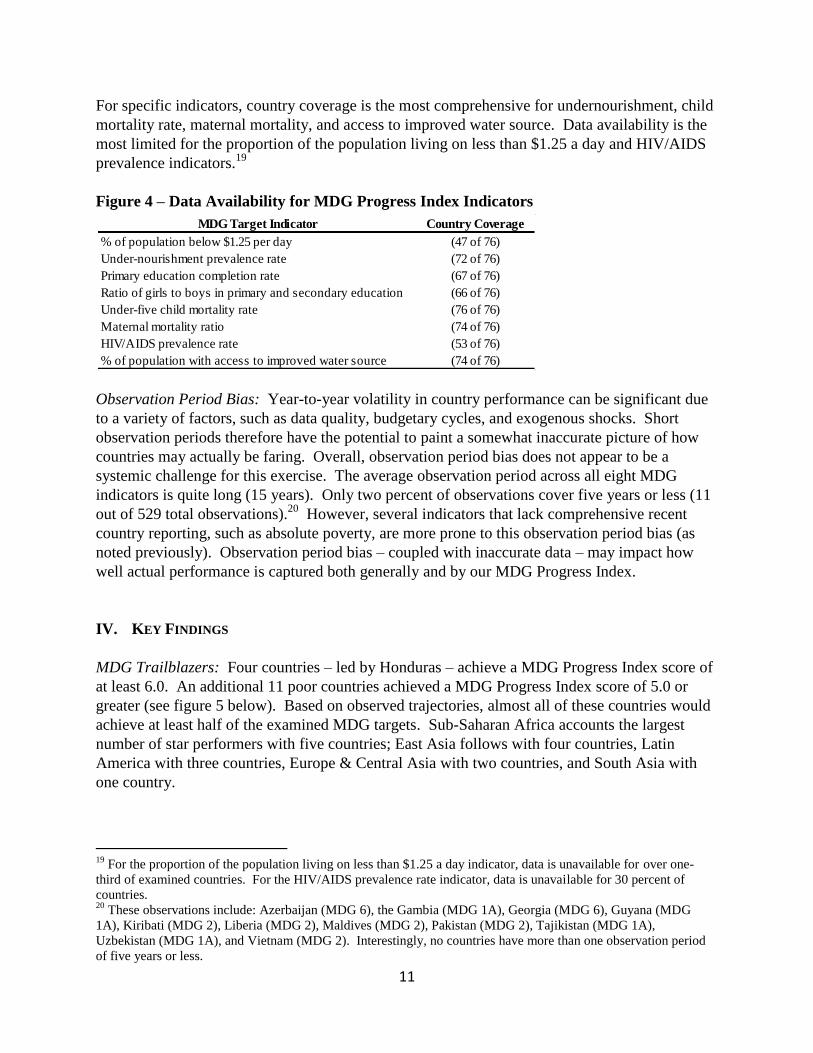
For specific indicators, country coverage is the most comprehensive for undernourishment, child
mortality rate, maternal mortality, and access to improved water source. Data availability is the
most limited for the proportion of the population living on less than $1.25 a day and HIV/AIDS
prevalence indicators.19
Figure 4 – Data Availability for MDG Progress Index Indicators
Observation Period Bias: Year-to-year volatility in country performance can be significant due
to a variety of factors, such as data quality, budgetary cycles, and exogenous shocks. Short
observation periods therefore have the potential to paint a somewhat inaccurate picture of how
countries may actually be faring. Overall, observation period bias does not appear to be a
systemic challenge for this exercise. The average observation period across all eight MDG
indicators is quite long (15 years). Only two percent of observations cover five years or less (11
out of 529 total observations).20
However, several indicators that lack comprehensive recent
country reporting, such as absolute poverty, are more prone to this observation period bias (as
noted previously). Observation period bias – coupled with inaccurate data – may impact how
well actual performance is captured both generally and by our MDG Progress Index.
IV. KEY FINDINGS
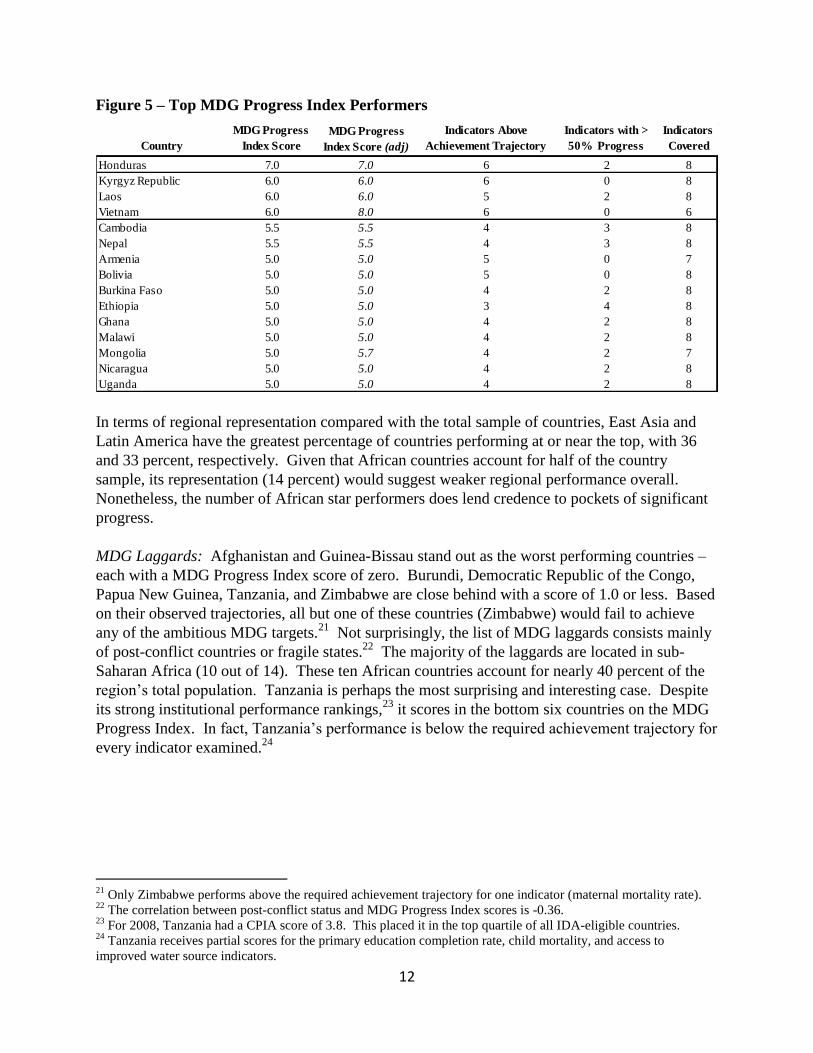
MDG Trailblazers: Four countries – led by Honduras – achieve a MDG Progress Index score of
at least 6.0. An additional 11 poor countries achieved a MDG Progress Index score of 5.0 or
greater (see figure 5 below). Based on observed trajectories, almost all of these countries would
achieve at least half of the examined MDG targets. Sub-Saharan Africa accounts the largest
number of star performers with five countries; East Asia follows with four countries, Latin
America with three countries, Europe & Central Asia with two countries, and South Asia with
one country.
19
For the proportion of the population living on less than $1.25 a day indicator, data is unavailable for over one-
third of examined countries. For the HIV/AIDS prevalence rate indicator, data is unavailable for 30 percent of
countries. 20
These observations include: Azerbaijan (MDG 6), the Gambia (MDG 1A), Georgia (MDG 6), Guyana (MDG
1A), Kiribati (MDG 2), Liberia (MDG 2), Maldives (MDG 2), Pakistan (MDG 2), Tajikistan (MDG 1A),
Uzbekistan (MDG 1A), and Vietnam (MDG 2). Interestingly, no countries have more than one observation period
of five years or less.
MDG Target Indicator Country Coverage
% of population below $1.25 per day (47 of 76)
Under-nourishment prevalence rate (72 of 76)
Primary education completion rate (67 of 76)
Ratio of girls to boys in primary and secondary education (66 of 76)
Under-five child mortality rate (76 of 76)
Maternal mortality ratio (74 of 76)
HIV/AIDS prevalence rate (53 of 76)
% of population with access to improved water source (74 of 76)
12
Figure 5 – Top MDG Progress Index Performers
In terms of regional representation compared with the total sample of countries, East Asia and
Latin America have the greatest percentage of countries performing at or near the top, with 36
and 33 percent, respectively. Given that African countries account for half of the country
sample, its representation (14 percent) would suggest weaker regional performance overall.
Nonetheless, the number of African star performers does lend credence to pockets of significant
progress.
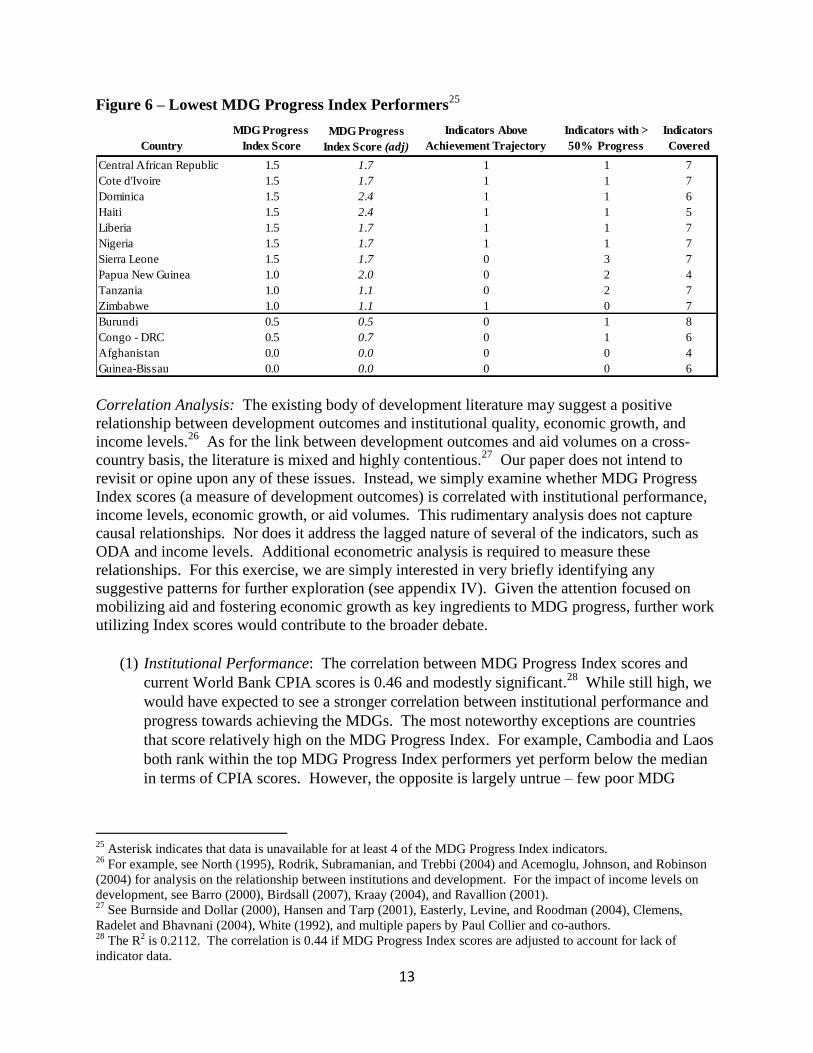
MDG Laggards: Afghanistan and Guinea-Bissau stand out as the worst performing countries –
each with a MDG Progress Index score of zero. Burundi, Democratic Republic of the Congo,
Papua New Guinea, Tanzania, and Zimbabwe are close behind with a score of 1.0 or less. Based
on their observed trajectories, all but one of these countries (Zimbabwe) would fail to achieve
any of the ambitious MDG targets.21
Not surprisingly, the list of MDG laggards consists mainly
of post-conflict countries or fragile states.22
The majority of the laggards are located in sub-
Saharan Africa (10 out of 14). These ten African countries account for nearly 40 percent of the
region‟s total population. Tanzania is perhaps the most surprising and interesting case. Despite
its strong institutional performance rankings,23
it scores in the bottom six countries on the MDG
Progress Index. In fact, Tanzania‟s performance is below the required achievement trajectory for
every indicator examined.24
21
Only Zimbabwe performs above the required achievement trajectory for one indicator (maternal mortality rate). 22
The correlation between post-conflict status and MDG Progress Index scores is -0.36. 23
For 2008, Tanzania had a CPIA score of 3.8. This placed it in the top quartile of all IDA-eligible countries. 24
Tanzania receives partial scores for the primary education completion rate, child mortality, and access to
improved water source indicators.
Country
MDG Progress
Index Score
MDG Progress
Index Score (adj)
Indicators Above
Achievement Trajectory
Indicators with >
50% Progress
Indicators
Covered
Honduras 7.0 7.0 6 2 8
Kyrgyz Republic 6.0 6.0 6 0 8
Laos 6.0 6.0 5 2 8
Vietnam 6.0 8.0 6 0 6
Cambodia 5.5 5.5 4 3 8
Nepal 5.5 5.5 4 3 8
Armenia 5.0 5.0 5 0 7
Bolivia 5.0 5.0 5 0 8
Burkina Faso 5.0 5.0 4 2 8
Ethiopia 5.0 5.0 3 4 8
Ghana 5.0 5.0 4 2 8
Malawi 5.0 5.0 4 2 8
Mongolia 5.0 5.7 4 2 7
Nicaragua 5.0 5.0 4 2 8
Uganda 5.0 5.0 4 2 8
13
Figure 6 – Lowest MDG Progress Index Performers25
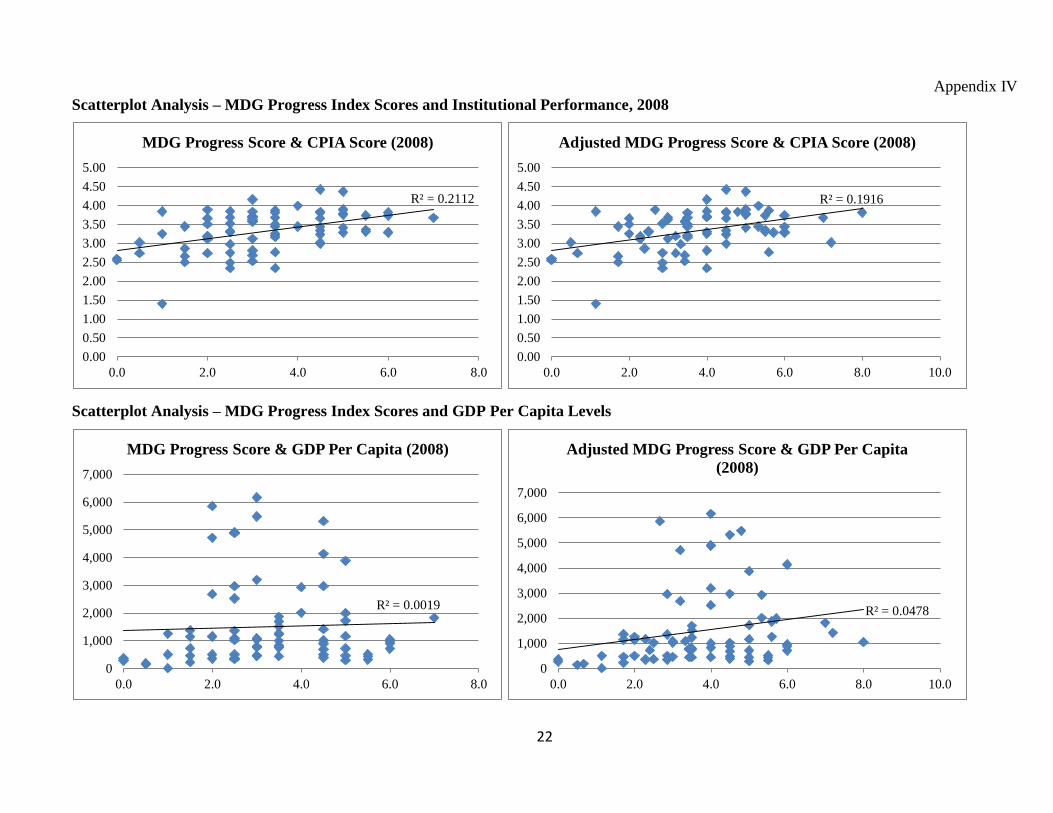
Correlation Analysis: The existing body of development literature may suggest a positive
relationship between development outcomes and institutional quality, economic growth, and
income levels.26
As for the link between development outcomes and aid volumes on a cross-
country basis, the literature is mixed and highly contentious.27
Our paper does not intend to
revisit or opine upon any of these issues. Instead, we simply examine whether MDG Progress
Index scores (a measure of development outcomes) is correlated with institutional performance,
income levels, economic growth, or aid volumes. This rudimentary analysis does not capture
causal relationships. Nor does it address the lagged nature of several of the indicators, such as
ODA and income levels. Additional econometric analysis is required to measure these
relationships. For this exercise, we are simply interested in very briefly identifying any
suggestive patterns for further exploration (see appendix IV). Given the attention focused on
mobilizing aid and fostering economic growth as key ingredients to MDG progress, further work
utilizing Index scores would contribute to the broader debate.
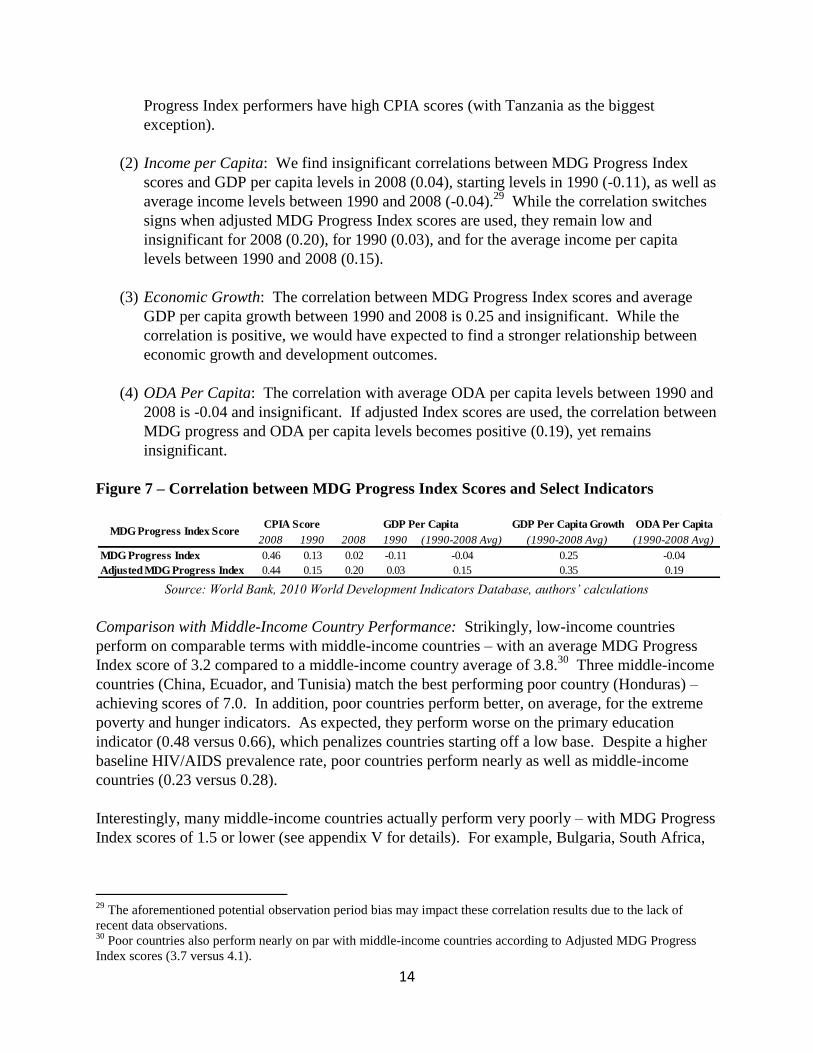
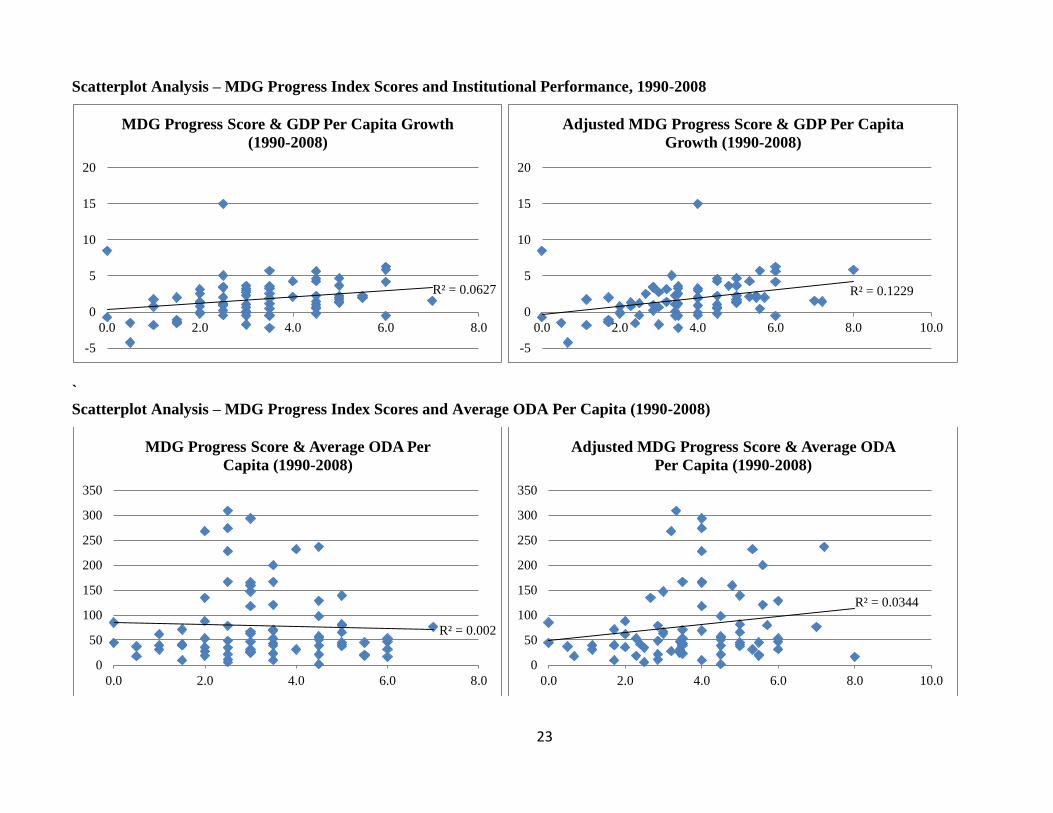
(1) Institutional Performance: The correlation between MDG Progress Index scores and
current World Bank CPIA scores is 0.46 and modestly significant.28
While still high, we
would have expected to see a stronger correlation between institutional performance and
progress towards achieving the MDGs. The most noteworthy exceptions are countries
that score relatively high on the MDG Progress Index. For example, Cambodia and Laos
both rank within the top MDG Progress Index performers yet perform below the median
in terms of CPIA scores. However, the opposite is largely untrue – few poor MDG
25
Asterisk indicates that data is unavailable for at least 4 of the MDG Progress Index indicators. 26
For example, see North (1995), Rodrik, Subramanian, and Trebbi (2004) and Acemoglu, Johnson, and Robinson
(2004) for analysis on the relationship between institutions and development. For the impact of income levels on
development, see Barro (2000), Birdsall (2007), Kraay (2004), and Ravallion (2001). 27
See Burnside and Dollar (2000), Hansen and Tarp (2001), Easterly, Levine, and Roodman (2004), Clemens,
Radelet and Bhavnani (2004), White (1992), and multiple papers by Paul Collier and co-authors. 28
The R2 is 0.2112. The correlation is 0.44 if MDG Progress Index scores are adjusted to account for lack of
indicator data.
Country
MDG Progress
Index Score
MDG Progress
Index Score (adj)
Indicators Above
Achievement Trajectory
Indicators with >
50% Progress
Indicators
Covered
Central African Republic 1.5 1.7 1 1 7
Cote d'Ivoire 1.5 1.7 1 1 7
Dominica 1.5 2.4 1 1 6
Haiti 1.5 2.4 1 1 5
Liberia 1.5 1.7 1 1 7
Nigeria 1.5 1.7 1 1 7
Sierra Leone 1.5 1.7 0 3 7
Papua New Guinea 1.0 2.0 0 2 4
Tanzania 1.0 1.1 0 2 7
Zimbabwe 1.0 1.1 1 0 7
Burundi 0.5 0.5 0 1 8
Congo - DRC 0.5 0.7 0 1 6
Afghanistan 0.0 0.0 0 0 4
Guinea-Bissau 0.0 0.0 0 0 6
14
Progress Index performers have high CPIA scores (with Tanzania as the biggest
exception).
(2) Income per Capita: We find insignificant correlations between MDG Progress Index
scores and GDP per capita levels in 2008 (0.04), starting levels in 1990 (-0.11), as well as
average income levels between 1990 and 2008 (-0.04).29
While the correlation switches
signs when adjusted MDG Progress Index scores are used, they remain low and
insignificant for 2008 (0.20), for 1990 (0.03), and for the average income per capita
levels between 1990 and 2008 (0.15).
(3) Economic Growth: The correlation between MDG Progress Index scores and average
GDP per capita growth between 1990 and 2008 is 0.25 and insignificant. While the
correlation is positive, we would have expected to find a stronger relationship between
economic growth and development outcomes.
(4) ODA Per Capita: The correlation with average ODA per capita levels between 1990 and
2008 is -0.04 and insignificant. If adjusted Index scores are used, the correlation between
MDG progress and ODA per capita levels becomes positive (0.19), yet remains
insignificant.
Figure 7 – Correlation between MDG Progress Index Scores and Select Indicators
Source: World Bank, 2010 World Development Indicators Database, authors’ calculations
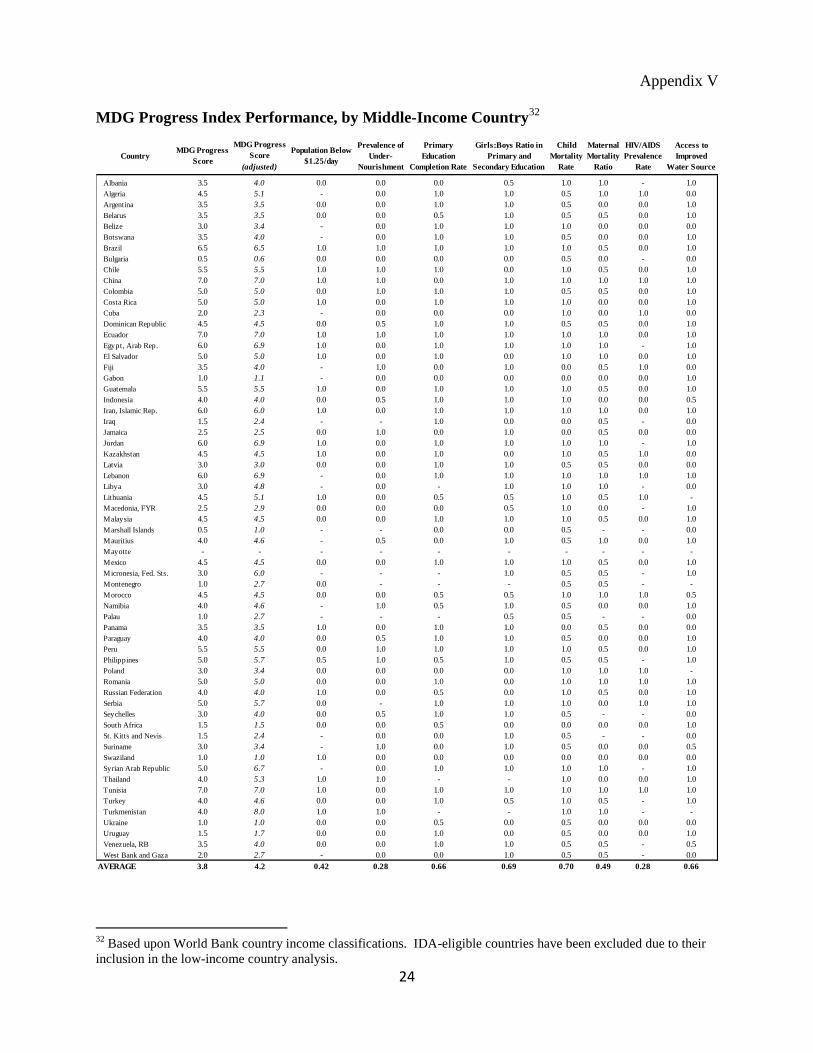
Comparison with Middle-Income Country Performance: Strikingly, low-income countries
perform on comparable terms with middle-income countries – with an average MDG Progress
Index score of 3.2 compared to a middle-income country average of 3.8.30
Three middle-income
countries (China, Ecuador, and Tunisia) match the best performing poor country (Honduras) –
achieving scores of 7.0. In addition, poor countries perform better, on average, for the extreme
poverty and hunger indicators. As expected, they perform worse on the primary education
indicator (0.48 versus 0.66), which penalizes countries starting off a low base. Despite a higher
baseline HIV/AIDS prevalence rate, poor countries perform nearly as well as middle-income
countries (0.23 versus 0.28).
Interestingly, many middle-income countries actually perform very poorly – with MDG Progress
Index scores of 1.5 or lower (see appendix V for details). For example, Bulgaria, South Africa,
29
The aforementioned potential observation period bias may impact these correlation results due to the lack of
recent data observations. 30
Poor countries also perform nearly on par with middle-income countries according to Adjusted MDG Progress
Index scores (3.7 versus 4.1).
GDP Per Capita Growth ODA Per Capita
2008 1990 2008 1990 (1990-2008 Avg) (1990-2008 Avg) (1990-2008 Avg)
MDG Progress Index 0.46 0.13 0.02 -0.11 -0.04 0.25 -0.04
Adjusted MDG Progress Index 0.44 0.15 0.20 0.03 0.15 0.35 0.19
MDG Progress Index ScoreCPIA Score GDP Per Capita
15
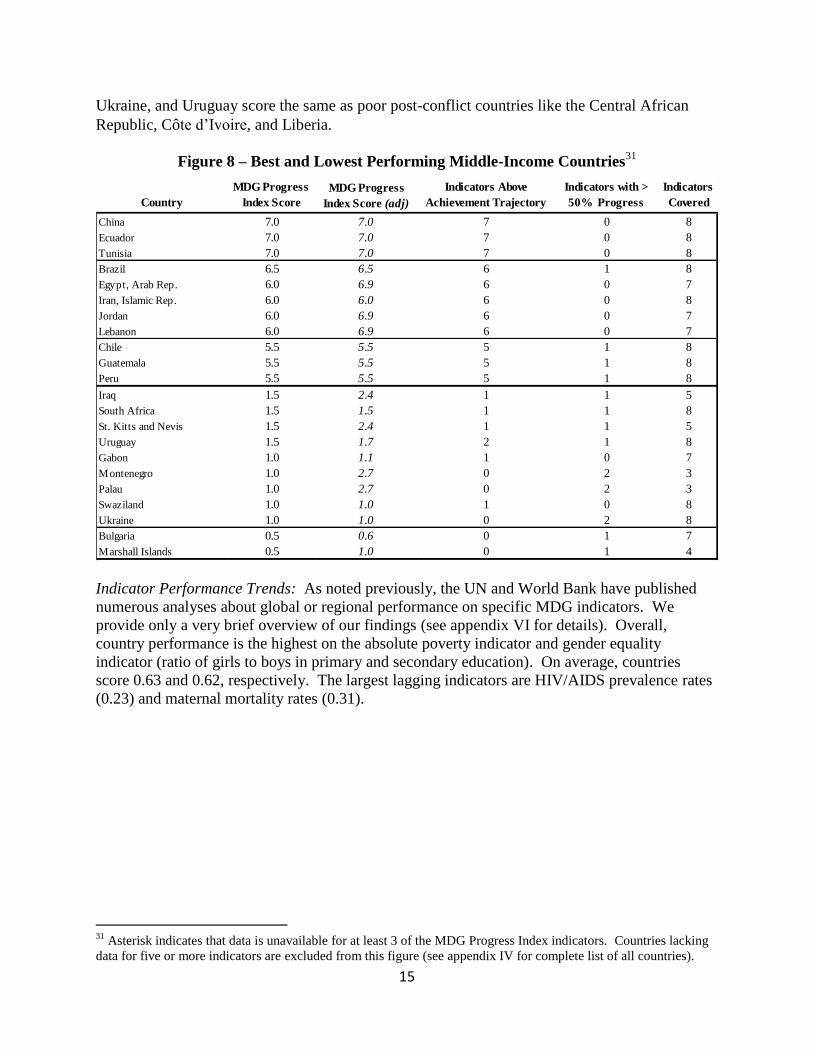
Ukraine, and Uruguay score the same as poor post-conflict countries like the Central African
Republic, Côte d‟Ivoire, and Liberia.
Figure 8 – Best and Lowest Performing Middle-Income Countries31
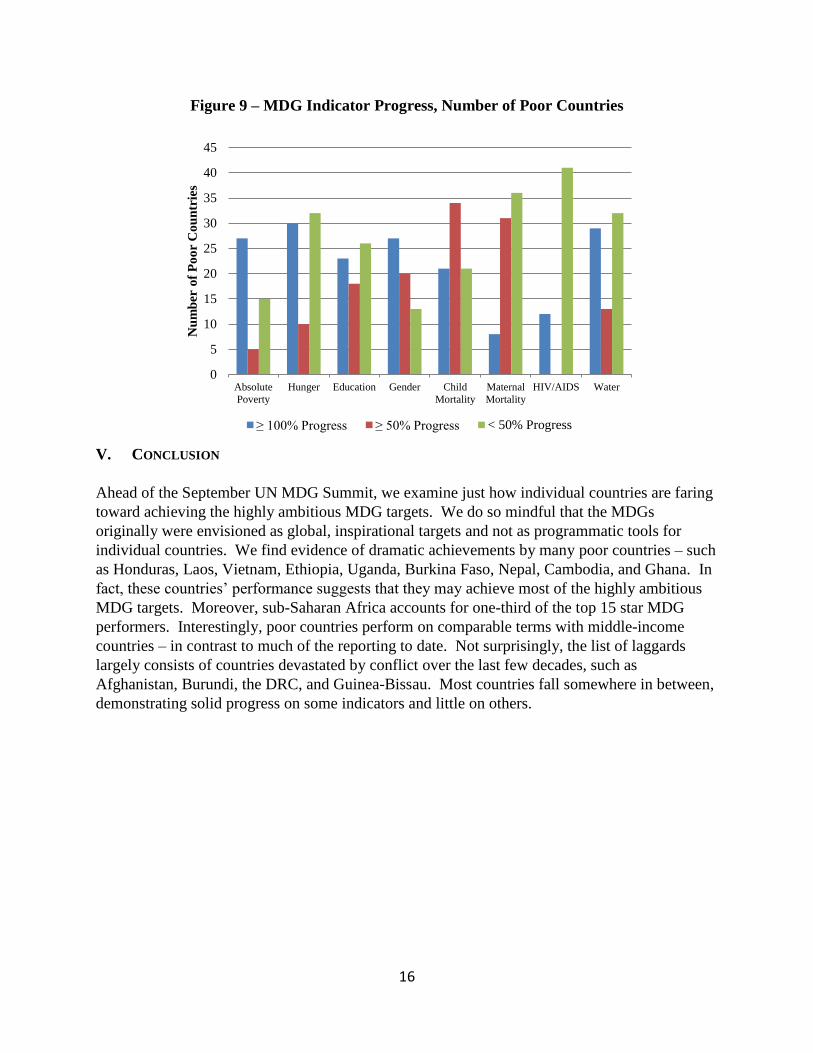
Indicator Performance Trends: As noted previously, the UN and World Bank have published
numerous analyses about global or regional performance on specific MDG indicators. We
provide only a very brief overview of our findings (see appendix VI for details). Overall,
country performance is the highest on the absolute poverty indicator and gender equality
indicator (ratio of girls to boys in primary and secondary education). On average, countries
score 0.63 and 0.62, respectively. The largest lagging indicators are HIV/AIDS prevalence rates
(0.23) and maternal mortality rates (0.31).
31
Asterisk indicates that data is unavailable for at least 3 of the MDG Progress Index indicators. Countries lacking
data for five or more indicators are excluded from this figure (see appendix IV for complete list of all countries).
Country
MDG Progress
Index Score
MDG Progress
Index Score (adj)
Indicators Above
Achievement Trajectory
Indicators with >
50% Progress
Indicators
Covered
China 7.0 7.0 7 0 8
Ecuador 7.0 7.0 7 0 8
Tunisia 7.0 7.0 7 0 8
Brazil 6.5 6.5 6 1 8
Egypt, Arab Rep. 6.0 6.9 6 0 7
Iran, Islamic Rep. 6.0 6.0 6 0 8
Jordan 6.0 6.9 6 0 7
Lebanon 6.0 6.9 6 0 7
Chile 5.5 5.5 5 1 8
Guatemala 5.5 5.5 5 1 8
Peru 5.5 5.5 5 1 8
Iraq 1.5 2.4 1 1 5
South Africa 1.5 1.5 1 1 8
St. Kitts and Nevis 1.5 2.4 1 1 5
Uruguay 1.5 1.7 2 1 8
Gabon 1.0 1.1 1 0 7
Montenegro 1.0 2.7 0 2 3
Palau 1.0 2.7 0 2 3
Swaziland 1.0 1.0 1 0 8
Ukraine 1.0 1.0 0 2 8
Bulgaria 0.5 0.6 0 1 7
Marshall Islands 0.5 1.0 0 1 4
16
Figure 9 – MDG Indicator Progress, Number of Poor Countries
V. CONCLUSION
Ahead of the September UN MDG Summit, we examine just how individual countries are faring
toward achieving the highly ambitious MDG targets. We do so mindful that the MDGs
originally were envisioned as global, inspirational targets and not as programmatic tools for
individual countries. We find evidence of dramatic achievements by many poor countries – such
as Honduras, Laos, Vietnam, Ethiopia, Uganda, Burkina Faso, Nepal, Cambodia, and Ghana. In
fact, these countries‟ performance suggests that they may achieve most of the highly ambitious
MDG targets. Moreover, sub-Saharan Africa accounts for one-third of the top 15 star MDG
performers. Interestingly, poor countries perform on comparable terms with middle-income
countries – in contrast to much of the reporting to date. Not surprisingly, the list of laggards
largely consists of countries devastated by conflict over the last few decades, such as
Afghanistan, Burundi, the DRC, and Guinea-Bissau. Most countries fall somewhere in between,
demonstrating solid progress on some indicators and little on others.
0
5
10
15
20
25
30
35
40
45
Absolute
Poverty
Hunger Education Gender Child
Mortality
Maternal
Mortality
HIV/AIDS Water
Nu
mb
er o
f P
oo
r C
ou
ntr
ies
≥ 100% Progress ≥ 50% Progress < 50% Progress
17
References
Acemoglu, Daron, Simon Johnson, and James A. Robinson. 2001. “The Colonial Origins of
Comparative Development: An Empirical Investigation.” American Economic Review 91:
1369–1401.
-----. 2004. “Institutions as the Fundamental Cause of Long-Run Growth.” NBER Working
Paper 10481. Cambridge, MA: National Bureau of Economic Research.
Barro, Robert, J. (2000). “Inequality and Growth in a Panel of Countries.” Journal of Economic
Growth 5(1): 5-32.
-----. 1991. “Economic Growth in a Cross Section of Countries.” American Economic Review
106(2): 407–43.
Birdsall, Nancy. 2007. “Income Distribution: Effects on Growth and Development.” In
International Handbook of Development Economics, eds. Amitava Krishna Dutt and
Jaime Ros. Also available as CGD Working Paper 118. Washington D.C., Center for
Global Development.
Bruns, Barbara, Alain Mingat, and Ramahatra Rakotomalala. 2003. “Achieving Universal
Primary Education by 2015: A Chance for Every Child.” World Bank, Washington DC.
Burnside, Craig and David Dollar. 2000. “Aid, Policies, and Growth.” American Economic
Review 90(4): 847–68.
Clemens, Michael, Todd Moss, and Charles Kenny. 2004. “The Trouble with the MDGs:
Confronting Expectations of Aid and Development Success.” CGD Working Paper 40.
Washington D.C., Center for Global Development.
Clemens, Michael, Steven Radelet, and Rikhil Bhavnani. 2004. “Counting Chickens When They
Hatch: The Short-Term Effect of Aid on Growth.” CGD Working Paper 44. Washington
D.C., Center for Global Development.
Collier, Paul and Jan Dehn. 2001. “Aid, Shocks, and Growth.” Policy Research Working Paper
2688. World Bank, Washington, DC.
Collier, Paul and David Dollar. 2002. “Aid Allocation and Poverty Reduction.” European
Economic Review 45(1): 1–26.
-----. 2004. “Development Effectiveness: What Have We Learnt?” The Economic Journal
114(496): F244–71.
Easterly, William. 2009. “How the Millennium Development Goals Are Unfair to Africa.” World
Development 37(1): 26-35.
18
Easterly, William, Ross Levine, and David Roodman. 2003. “New Data, New doubts: Revisiting
„Aid, Policies, and Growth.‟” CGD Working Paper 26. Washington D.C., Center for
Global Development.
Hansen, Henrik and Finn Tarp. 2001. “Aid and Growth Regressions.” Journal of Development
Economics 64(2): 547–70.
Hill, Thomas, Abou Zahr, Walker, Say, Inoue, Suzuki. 2007. “Estimates of Maternal Mortality
Worldwide between 1990 and 2005: An Assessment of Available Data.” The Lancet
370(9595): 1311-1319.
Hogan, Foreman, Naghavi, Ahn, Wang, Makela, Lopez, Lozano, Murray. 2010. “Maternal
Mortality for 181 Countries, 1980-2008: A Systemic Analysis of Progress Towards
Millennium Development Goal 5.” The Lancet 375(9726): 1609-1623.
Kraay, Aart. 2006. “When is Growth Pro-Poor? Evidence from a Panel of Countries” Journal of
Development Economics 80(1): 198 – 227.
North, Douglass. 1995. “The New Institutional Economics and Third World Development.” In
The New Institutional Economics and Third World Development, eds. John Harriss, Janet
Hunter, and Colin Lewis. NY: Routledge: 17-26.
Ranis, Gustav and Alejandro Ramirez. 2000. “Economic Growth and Human Development.”
World Development 28(2): 197-219.
Ravallion, Martin. 1997. “Good and Bad Growth: The Human Development Reports.” World
Development 25(5): 631 -638.
-----. 2001. “Growth, Inequality and Poverty: Looking Beyond Averages.” Washington, DC:
World Bank.
Rodrik, Dani, Arvind Subramanian, and Francesco Trebbi. 2004. “Institutions Rule: The Primacy
of Institutions Over Geography and Integration in Economic Development.” Journal of
Economic Growth 9(2): 131-165.
Ronsmans, Carine and Wendy Graham. 2006. “Maternal Mortality: Who, When, Where, and
Why.” The Lancet 368(9542): 1189-200.
White, Howard. 1992. “The Macroeconomic Impact of Development Aid: A Critical Survey.”
Journal of Development Studies 28(2): 163-240.
WHO and UNICEF. 1996. “Revised 1990 Estimates of Maternal Mortality: A New Approach by
WHO and UNICEF.” World Health Organization, Washington DC.
19
Appendix I
Complete List of UN MDG Target Indicators
Goals and Targets
(Formally Adopted Through the Millennium Declaration)
Indicators for Monitoring Progress
(Tracked by UN, Not Formally Adopted by General Assembly)
1.1 Proportion of population below $1 (PPP) per day
1.2 Poverty gap ratio
1.3 Share of poorest quintile in national consumption
1.4 Growth rate of GDP per person employed
1.5 Employment-to-population ratio
1.6 Proportion of employed people living below $1 (PPP) per day
1.7 Proportion of own-account and contributing family workers in total employment
1.8 Prevalence of underweight children under-five years of age
1.9 Proportion of population below minimum level of dietary energy consumption
2.1 Net enrolment ratio in primary education
2.2 Proportion of pupils starting grade 1 who reach last grade of primary
2.3 Literacy rate of 15-24 year-olds, women and men
3.1 Ratios of girls to boys in primary, secondary and tertiary education
3.2 Share of women in wage employment in the non-agricultural sector
3.3 Proportion of seats held by women in national parliament
4.1 Under-five mortality rate
4.2 Infant mortality rate
4.3 Proportion of 1 year-old children immunised against measles
5.1 Maternal mortality ratio
5.2 Proportion of births attended by skilled health personnel
5.3 Contraceptive prevalence rate
5.4 Adolescent birth rate
5.5 Antenatal care coverage (at least one visit and at least four visits)
5.6 Unmet need for family planning
6.1 HIV prevalence among population aged 15-24 years
6.2 Condom use at last high-risk sex
6.3 Proportion of population aged 15-24 years with comprehensive correct knowledge of HIV/AIDS
6.4 Ratio of school attendance of orphans to school attendance of non-orphans aged 10-14 years
Target 6.B: Achieve, by 2010, universal access to treatment for
HIV/AIDS for all those who need it6.5 Proportion of population with advanced HIV infection with access to antiretroviral drugs
6.6 Incidence and death rates associated with malaria
6.7 Proportion of children under 5 sleeping under insecticide-treated bednets
6.8 Proportion of children under 5 with fever who are treated with appropriate anti-malarial drugs
6.9 Incidence, prevalence and death rates associated with tuberculosis
6.10 Proportion of tuberculosis cases detected and cured under directly observed treatment short course
7.1 Proportion of land area covered by forest
7.2 CO2 emissions, total, per capita and per $1 GDP (PPP)
7.3 Consumption of ozone-depleting substances
7.4 Proportion of fish stocks within safe biological limits
7.5 Proportion of total water resources used
7.6 Proportion of terrestrial and marine areas protected
7.7 Proportion of species threatened with extinction
7.8 Proportion of population using an improved drinking water source
7.9 Proportion of population using an improved sanitation facility
Target 7.D: By 2020, to have achieved a significant improvement in the
lives of at least 100 million slum dwellers7.10 Proportion of urban population living in slums
8.6 Proportion of total developed country imports (by value and excluding arms) from developing
countries and least developed countries, admitted free of duty
8.7 Average tariffs imposed by developed countries on agricultural products and textiles and clothing
from developing countries
8.8 Agricultural support estimate for OECD countries as a percentage of their gross domestic product
8.9 Proportion of ODA provided to help build trade capacity
Target 8.B: Address the special needs of the least developed countries8.1 Net ODA, total and to the least developed countries, as percentage of OECD/DAC donors' gross
national income
8.2 Proportion of total bilateral, sector-allocable ODA of OECD/DAC donors to basic social services
(basic education, primary health care, nutrition, safe water and sanitation)
8.3 Proportion of bilateral official development assistance of OECD/DAC donors that is untied
8.4 ODA received in landlocked developing countries as a proportion of their gross national incomes
8.5 ODA received in small island developing States as a proportion of their gross national incomes
8.10 Total number of countries that have reached their HIPC decision points and number that have
reached their HIPC completion points (cumulative)
8.11 Debt relief committed under HIPC and MDRI Initiatives
8.12 Debt service as a percentage of exports of goods and services
Target 8.E: In cooperation with pharmaceutical companies, provide
access to affordable essential drugs in developing countries8.13 Proportion of population with access to affordable essential drugs on a sustainable basis
8.14 Telephone lines per 100 population
8.15 Cellular subscribers per 100 population
8.16 Internet users per 100 population
Goal 5: Improve Maternal Health
Goal 1: Eradicate Extreme Poverty and Hunger
Target 1.A: Halve, between 1990 and 2015, the proportion of people
whose income is less than one dollar a day
Target 1.B: Achieve full and productive employment and decent work
for all, including women and young people
Target 1.C: Halve, between 1990 and 2015, the proportion of people who
suffer from hunger
Goal 2: Achieve Universal Primary Education
Target 2.A: Ensure that, by 2015, children everywhere, boys and girls
alike, will be able to complete a full course of primary schooling
Goal 3: Promote Gender Equality and Empower Women
Target 3.A: Eliminate gender disparity in primary and secondary
education, preferably by 2005, and in all levels of education no later
than 2015
Goal 4: Reduce Child Mortality
Target 4.A: Reduce by two-thirds, between 1990 and 2015, the under-
five mortality rate
Target 8.F: In cooperation with the private sector, make available the
benefits of new technologies, especially information and
communications
Target 8.A: Develop further an open, rule-based, predictable, non-
discriminatory trading and financial system
Target 5.A: Reduce by three quarters, between 1990 and 2015, the
maternal mortality ratio
Target 5.B: Achieve, by 2015, universal access to reproductive health
Goal 6: Combat HIV/AIDS, Malaria and Other Diseases
Target 6.A: Have halted by 2015 and begun to reverse the spread of
HIV/AIDS
Target 6.C: Have halted by 2015 and begun to reverse the incidence of
malaria and other major diseases
Goal 7: Ensure Environmental Sustainability
Target 8.D: Deal comprehensively with the debt problems of developing
countries through national and international measures in order to make
debt sustainable in the long term
Target 8.C: Address the special needs of landlocked developing
countries and small island developing States (through the Programme of
Action for the Sustainable Development of Small Island Developing
States and the outcome of the twenty-second special session of the
General Assembly)
Target 7.A: Integrate the principles of sustainable development into
country policies and programmes and reverse the loss of environmental
resources
Target 7.B: Reduce biodiversity loss, achieving, by 2010, a significant
reduction in the rate of loss
Target 7.C: Halve, by 2015, the proportion of people without sustainable
access to safe drinking water and basic sanitation
Goal 8: Develop a Global Partnership for Development
20
Appendix II
MDG Progress Index: Indicator Coverage by Country
CountryPopulation Below
$1.25/day
Prevalence of
Under-
Nourishment
Primary
Education
Completion Rate
Girls:Boys Ratio in
Primary and
Secondary Education
Child
Mortality
Rate
Maternal
Mortality
Ratio
HIV/AIDS
Prevalence
Rate
Access to
Improved
Water Source
Total
Afghanistan √ √ √ √ 4
Angola √ √ √ √ √ 5
Armenia √ √ √ √ √ √ √ √ 8
Azerbaijan √ √ √ √ √ √ √ √ 8
Bangladesh √ √ √ √ √ √ √ 7
Benin √ √ √ √ √ √ √ 7
Bhutan √ √ √ √ √ 5
Bolivia √ √ √ √ √ √ √ √ 8
Bosnia-Herzegovina √ √ √ √ √ 5
Burkina Faso √ √ √ √ √ √ √ √ 8
Burundi √ √ √ √ √ √ √ √ 8
Cambodia √ √ √ √ √ √ √ √ 8
Cameroon √ √ √ √ √ √ √ √ 8
Cape Verde √ √ √ √ √ √ 6
Central African Republic √ √ √ √ √ √ √ 7
Chad √ √ √ √ √ √ √ 7
Comoros √ √ √ √ √ √ √ 7
Congo - DRC √ √ √ √ √ √ 6
Congo, Republic of √ √ √ √ √ √ √ 7
Cote d'Ivoire √ √ √ √ √ √ √ 7
Djibouti √ √ √ √ √ √ √ √ 8
Dominica √ √ √ √ √ 5
Eritrea √ √ √ √ √ √ √ 7
Ethiopia √ √ √ √ √ √ √ √ 8
Gambia, The √ √ √ √ √ √ √ √ 8
Georgia √ √ √ √ √ √ √ √ 8
Ghana √ √ √ √ √ √ √ √ 8
Grenada √ √ √ √ √ √ 6
Guinea √ √ √ √ √ √ √ √ 8
Guinea-Bissau √ √ √ √ √ √ 6
Guyana √ √ √ √ √ √ √ √ 8
Haiti √ √ √ √ √ 5
Honduras √ √ √ √ √ √ √ √ 8
India √ √ √ √ √ √ √ √ 8
Kenya √ √ √ √ √ √ √ 7
Kiribati √ √ √ √ √ 5
Kyrgyz Republic √ √ √ √ √ √ √ √ 8
Laos √ √ √ √ √ √ √ √ 8
Lesotho √ √ √ √ √ √ √ √ 8
Liberia √ √ √ √ √ √ √ 7
Madagascar √ √ √ √ √ √ √ √ 8
Malawi √ √ √ √ √ √ √ √ 8
Maldives √ √ √ √ √ √ 6
Mali √ √ √ √ √ √ √ √ 8
Mauritania √ √ √ √ √ √ √ √ 8
Moldova √ √ √ √ √ √ √ √ 8
Mongolia √ √ √ √ √ √ √ 7
Mozambique √ √ √ √ √ √ √ √ 8
Nepal √ √ √ √ √ √ √ √ 8
Nicaragua √ √ √ √ √ √ √ √ 8
Niger √ √ √ √ √ √ √ √ 8
Nigeria √ √ √ √ √ √ √ 7
Pakistan √ √ √ √ √ √ √ √ 8
Papua New Guinea √ √ √ √ 4
Rwanda √ √ √ √ √ √ √ 7
Samoa √ √ √ √ √ √ 6
Sao Tome and Principe √ √ √ √ √ √ 6
Senegal √ √ √ √ √ √ √ √ 8
Sierra Leone √ √ √ √ √ √ √ 7
Solomon Islands √ √ √ √ √ 5
Sri Lanka √ √ √ √ √ √ 6
St. Lucia √ √ √ √ √ √ 6
St. Vincent & Grenadines √ √ √ √ √ 5
Sudan √ √ √ √ √ √ √ 7
Tajikistan √ √ √ √ √ √ √ √ 8
Tanzania √ √ √ √ √ √ √ 7
Timor-Leste √ √ √ √ √ √ 6
Togo √ √ √ √ √ √ √ 7
Tonga √ √ √ √ √ 5
Uganda √ √ √ √ √ √ √ √ 8
Uzbekistan √ √ √ √ √ √ √ √ 8
Vanuatu √ √ √ √ √ 5
Vietnam √ √ √ √ √ √ 6
Yemen, Republic of √ √ √ √ √ √ √ 7
Zambia √ √ √ √ √ √ √ √ 8
Zimbabwe √ √ √ √ √ √ √ 7
TOTAL 47 72 67 66 76 74 53 74 -
21
Appendix III
MDG Progress Index Performance, by Low-Income Country
CountryMDG Progress
Score
MDG Progress
Score
(adjusted)
Population Below
$1.25/day
Prevalence of
Under-
Nourishment
Primary
Education
Completion Rate
Girls:Boys Ratio in
Primary and
Secondary Education
Child
Mortality
Rate
Maternal
Mortality
Ratio
HIV/AIDS
Prevalence
Rate
Access to
Improved
Water Source
Afghanistan 0.0 0.0 - - - 0.0 0.0 0.0 - 0.0
Angola 2.0 3.2 - 1.0 - - 0.0 0.5 0.0 0.5
Armenia 5.0 5.0 1.0 1.0 0.0 - 1.0 0.0 1.0 1.0
Azerbaijan 4.5 4.5 1.0 1.0 1.0 0.0 1.0 0.0 0.0 0.5
Bangladesh 2.5 2.9 0.5 0.5 0.0 - 1.0 0.5 - 0.0
Benin 2.5 2.9 - 1.0 0.5 0.5 0.5 0.0 0.0 0.0
Bhutan 3.5 5.6 - - 1.0 1.0 0.5 1.0 - 0.0
Bolivia 5.0 5.0 0.0 0.0 1.0 1.0 1.0 1.0 0.0 1.0
Bosnia-Herzegovina 2.5 4.0 - 0.0 - - 0.5 1.0 - 1.0
Burkina Faso 5.0 5.0 1.0 1.0 0.0 0.5 0.0 0.5 1.0 1.0
Burundi 0.5 0.5 0.0 0.0 0.0 0.5 0.0 0.0 0.0 0.0
Cambodia 5.5 5.5 1.0 1.0 1.0 0.5 0.5 0.5 0.0 1.0
Cameroon 3.5 3.5 1.0 1.0 0.5 0.0 0.0 0.0 0.0 1.0
Cape Verde 3.0 4.0 - 0.0 1.0 - 1.0 1.0 - 0.0
Central African Republic 1.5 1.7 1.0 0.0 0.0 - 0.0 0.0 0.0 0.5
Chad 2.5 2.9 - 1.0 0.0 0.5 0.0 0.0 0.0 1.0
Comoros 3.0 3.4 - 0.0 1.0 0.5 0.0 0.5 1.0 0.0
Congo - DRC 0.5 0.7 - 0.0 0.5 0.0 0.0 0.0 - 0.0
Congo, Republic of 2.5 2.9 - 1.0 0.0 0.5 0.0 0.0 1.0 0.0
Cote d'Ivoire 1.5 1.7 0.0 0.0 0.0 - 0.5 0.0 0.0 1.0
Djibouti 2.5 2.5 0.0 1.0 0.0 0.0 0.5 0.0 0.0 1.0
Dominica 1.5 2.4 - 0.0 0.0 1.0 0.5 0.0 - 0.0
Eritrea 2.5 2.9 - 0.0 0.5 0.0 1.0 0.5 0.0 0.5
Ethiopia 5.0 5.0 1.0 1.0 0.5 0.5 0.5 0.5 0.0 1.0
Gambia, The 4.5 4.5 1.0 0.0 1.0 1.0 0.5 1.0 0.0 0.0
Georgia 4.5 4.5 0.0 1.0 1.0 0.0 0.5 0.0 1.0 1.0
Ghana 5.0 5.0 1.0 1.0 0.5 1.0 0.5 0.0 0.0 1.0
Grenada 3.0 4.0 - 0.0 1.0 0.0 1.0 0.5 - 0.5
Guinea 4.0 4.0 1.0 0.5 0.5 0.5 0.5 0.0 0.0 1.0
Guinea-Bissau 0.0 0.0 0.0 0.0 - - 0.0 0.0 0.0 0.0
Guyana 3.5 3.5 0.0 1.0 1.0 0.0 0.5 0.0 0.0 1.0
Haiti 1.5 2.4 - 0.0 - - 1.0 0.5 0.0 0.0
Honduras 7.0 7.0 1.0 1.0 1.0 1.0 0.5 0.5 1.0 1.0
India 4.5 4.5 0.5 0.0 1.0 1.0 0.5 0.5 0.0 1.0
Kenya 3.0 3.4 1.0 0.0 1.0 0.5 0.0 0.0 - 0.5
Kiribati 4.5 7.2 - 1.0 1.0 1.0 0.5 - - 1.0
Kyrgyz Republic 6.0 6.0 1.0 1.0 0.0 1.0 1.0 0.0 1.0 1.0
Laos 6.0 6.0 1.0 1.0 0.5 0.5 1.0 1.0 0.0 1.0
Lesotho 3.5 3.5 1.0 0.0 0.5 1.0 1.0 0.0 0.0 0.0
Liberia 1.5 1.7 - 0.0 0.0 1.0 0.0 0.0 0.0 0.5
Madagascar 2.0 2.0 0.0 0.0 0.5 0.0 0.5 0.0 1.0 0.0
Malawi 5.0 5.0 0.5 1.0 0.5 1.0 1.0 0.0 0.0 1.0
Maldives 4.5 6.0 - 0.5 1.0 1.0 1.0 1.0 - 0.0
Mali 4.0 4.0 1.0 1.0 0.5 0.5 0.0 0.0 0.0 1.0
Mauritania 4.5 4.5 1.0 0.5 0.5 1.0 0.0 0.5 0.0 1.0
Moldova 3.5 3.5 1.0 0.0 0.0 1.0 1.0 0.5 0.0 0.0
Mongolia 5.0 5.7 1.0 0.0 1.0 1.0 1.0 0.5 - 0.5
Mozambique 3.0 3.0 0.5 1.0 0.5 0.5 0.5 0.0 0.0 0.0
Nepal 5.5 5.5 1.0 0.5 0.5 1.0 1.0 0.5 0.0 1.0
Nicaragua 5.0 5.0 1.0 1.0 0.5 1.0 1.0 0.0 0.0 0.5
Niger 2.0 2.0 0.0 0.5 0.0 0.5 0.5 0.5 0.0 0.0
Nigeria 1.5 1.7 0.0 1.0 - 0.5 0.0 0.0 0.0 0.0
Pakistan 3.5 4.0 1.0 0.0 0.0 - 0.5 0.5 1.0 0.5
Papua New Guinea 1.0 2.0 - - - - 0.5 0.5 0.0 0.0
Rwanda 3.0 3.0 - 0.0 0.0 1.0 0.5 0.5 1.0 0.0
Samoa 4.0 5.3 - 1.0 1.0 1.0 0.5 0.5 - 0.0
Sao Tome and Principe 2.5 3.3 - 1.0 0.0 - 0.0 0.5 - 1.0
Senegal 3.0 3.0 1.0 0.0 0.0 1.0 0.5 0.0 0.0 0.5
Sierra Leone 1.5 1.7 0.5 0.0 - 0.5 0.5 0.0 0.0 0.0
Solomon Islands 3.0 4.8 - 1.0 - 0.5 1.0 0.5 - 0.0
Sri Lanka 4.0 5.3 0.0 0.5 1.0 - 1.0 0.5 - 1.0
St. Lucia 2.0 2.7 - 0.0 0.0 1.0 0.5 0.5 - 0.0
St. Vincent & Grenadines 3.0 4.8 - 1.0 1.0 0.0 0.5 0.5 - -
Sudan 2.5 2.9 - 1.0 0.0 0.5 0.0 0.5 0.0 0.5
Tajikistan 3.5 3.5 1.0 0.5 0.0 0.0 0.5 0.5 0.0 1.0
Tanzania 1.0 1.1 0.0 0.0 0.5 - 0.5 0.0 0.0 0.0
Timor-Leste 3.0 4.0 1.0 0.0 1.0 - 1.0 0.0 - 0.0
Togo 2.5 2.9 - 0.5 0.5 0.5 0.5 0.0 0.0 0.5
Tonga 3.0 4.8 - - 1.0 0.0 0.5 0.5 - 1.0
Uganda 5.0 5.0 1.0 0.5 0.0 1.0 0.0 0.5 1.0 1.0
Uzbekistan 2.5 2.5 0.0 0.0 0.0 1.0 0.5 0.0 1.0 0.0
Vanuatu 2.5 4.0 - 1.0 0.0 0.5 0.5 0.5 - -
Vietnam 6.0 8.0 1.0 1.0 1.0 - 1.0 1.0 - 1.0
Yemen, Republic of 2.0 2.3 0.0 0.0 0.0 1.0 0.5 0.5 - 0.0
Zambia 2.0 2.0 0.0 0.0 1.0 1.0 0.0 0.0 0.0 0.0
Zimbabwe 1.0 1.1 - 0.0 0.0 1.0 0.0 0.0 0.0 0.0
AVERAGE 3.2 3.6 0.63 0.49 0.48 0.62 0.50 0.31 0.23 0.48
22
Appendix IV
Scatterplot Analysis – MDG Progress Index Scores and Institutional Performance, 2008
Scatterplot Analysis – MDG Progress Index Scores and GDP Per Capita Levels
R² = 0.2112
0.00
0.50
1.00
1.50
2.00
2.50
3.00
3.50
4.00
4.50
5.00
0.0 2.0 4.0 6.0 8.0
MDG Progress Score & CPIA Score (2008)
R² = 0.1916
0.00
0.50
1.00
1.50
2.00
2.50
3.00
3.50
4.00
4.50
5.00
0.0 2.0 4.0 6.0 8.0 10.0
Adjusted MDG Progress Score & CPIA Score (2008)
R² = 0.0019
0
1,000
2,000
3,000
4,000
5,000
6,000
7,000
0.0 2.0 4.0 6.0 8.0
MDG Progress Score & GDP Per Capita (2008)
R² = 0.0478
0
1,000
2,000
3,000
4,000
5,000
6,000
7,000
0.0 2.0 4.0 6.0 8.0 10.0
Adjusted MDG Progress Score & GDP Per Capita
(2008)
23
Scatterplot Analysis – MDG Progress Index Scores and Institutional Performance, 1990-2008
`
Scatterplot Analysis – MDG Progress Index Scores and Average ODA Per Capita (1990-2008)
R² = 0.0627
-5
0
5
10
15
20
0.0 2.0 4.0 6.0 8.0
MDG Progress Score & GDP Per Capita Growth
(1990-2008)
R² = 0.1229
-5
0
5
10
15
20
0.0 2.0 4.0 6.0 8.0 10.0
Adjusted MDG Progress Score & GDP Per Capita
Growth (1990-2008)
R² = 0.002
0
50
100
150
200
250
300
350
0.0 2.0 4.0 6.0 8.0
MDG Progress Score & Average ODA Per
Capita (1990-2008)
R² = 0.0344
0
50
100
150
200
250
300
350
0.0 2.0 4.0 6.0 8.0 10.0
Adjusted MDG Progress Score & Average ODA
Per Capita (1990-2008)
24
Appendix V
MDG Progress Index Performance, by Middle-Income Country32
32
Based upon World Bank country income classifications. IDA-eligible countries have been excluded due to their
inclusion in the low-income country analysis.
CountryMDG Progress
Score
MDG Progress
Score
(adjusted)
Population Below
$1.25/day
Prevalence of
Under-
Nourishment
Primary
Education
Completion Rate
Girls:Boys Ratio in
Primary and
Secondary Education
Child
Mortality
Rate
Maternal
Mortality
Ratio
HIV/AIDS
Prevalence
Rate
Access to
Improved
Water Source
Albania 3.5 4.0 0.0 0.0 0.0 0.5 1.0 1.0 - 1.0
Algeria 4.5 5.1 - 0.0 1.0 1.0 0.5 1.0 1.0 0.0
Argentina 3.5 3.5 0.0 0.0 1.0 1.0 0.5 0.0 0.0 1.0
Belarus 3.5 3.5 0.0 0.0 0.5 1.0 0.5 0.5 0.0 1.0
Belize 3.0 3.4 - 0.0 1.0 1.0 1.0 0.0 0.0 0.0
Botswana 3.5 4.0 - 0.0 1.0 1.0 0.5 0.0 0.0 1.0
Brazil 6.5 6.5 1.0 1.0 1.0 1.0 1.0 0.5 0.0 1.0
Bulgaria 0.5 0.6 0.0 0.0 0.0 0.0 0.5 0.0 - 0.0
Chile 5.5 5.5 1.0 1.0 1.0 0.0 1.0 0.5 0.0 1.0
China 7.0 7.0 1.0 1.0 0.0 1.0 1.0 1.0 1.0 1.0
Colombia 5.0 5.0 0.0 1.0 1.0 1.0 0.5 0.5 0.0 1.0
Costa Rica 5.0 5.0 1.0 0.0 1.0 1.0 1.0 0.0 0.0 1.0
Cuba 2.0 2.3 - 0.0 0.0 0.0 1.0 0.0 1.0 0.0
Dominican Republic 4.5 4.5 0.0 0.5 1.0 1.0 0.5 0.5 0.0 1.0
Ecuador 7.0 7.0 1.0 1.0 1.0 1.0 1.0 1.0 0.0 1.0
Egypt, Arab Rep. 6.0 6.9 1.0 0.0 1.0 1.0 1.0 1.0 - 1.0
El Salvador 5.0 5.0 1.0 0.0 1.0 0.0 1.0 1.0 0.0 1.0
Fiji 3.5 4.0 - 1.0 0.0 1.0 0.0 0.5 1.0 0.0
Gabon 1.0 1.1 - 0.0 0.0 0.0 0.0 0.0 0.0 1.0
Guatemala 5.5 5.5 1.0 0.0 1.0 1.0 1.0 0.5 0.0 1.0
Indonesia 4.0 4.0 0.0 0.5 1.0 1.0 1.0 0.0 0.0 0.5
Iran, Islamic Rep. 6.0 6.0 1.0 0.0 1.0 1.0 1.0 1.0 0.0 1.0
Iraq 1.5 2.4 - - 1.0 0.0 0.0 0.5 - 0.0
Jamaica 2.5 2.5 0.0 1.0 0.0 1.0 0.0 0.5 0.0 0.0
Jordan 6.0 6.9 1.0 0.0 1.0 1.0 1.0 1.0 - 1.0
Kazakhstan 4.5 4.5 1.0 0.0 1.0 0.0 1.0 0.5 1.0 0.0
Latvia 3.0 3.0 0.0 0.0 1.0 1.0 0.5 0.5 0.0 0.0
Lebanon 6.0 6.9 - 0.0 1.0 1.0 1.0 1.0 1.0 1.0
Libya 3.0 4.8 - 0.0 - 1.0 1.0 1.0 - 0.0
Lithuania 4.5 5.1 1.0 0.0 0.5 0.5 1.0 0.5 1.0 -
Macedonia, FYR 2.5 2.9 0.0 0.0 0.0 0.5 1.0 0.0 - 1.0
Malaysia 4.5 4.5 0.0 0.0 1.0 1.0 1.0 0.5 0.0 1.0
Marshall Islands 0.5 1.0 - - 0.0 0.0 0.5 - - 0.0
Mauritius 4.0 4.6 - 0.5 0.0 1.0 0.5 1.0 0.0 1.0
Mayotte - - - - - - - - - -
Mexico 4.5 4.5 0.0 0.0 1.0 1.0 1.0 0.5 0.0 1.0
Micronesia, Fed. Sts. 3.0 6.0 - - - 1.0 0.5 0.5 - 1.0
Montenegro 1.0 2.7 0.0 - - - 0.5 0.5 - -
Morocco 4.5 4.5 0.0 0.0 0.5 0.5 1.0 1.0 1.0 0.5
Namibia 4.0 4.6 - 1.0 0.5 1.0 0.5 0.0 0.0 1.0
Palau 1.0 2.7 - - - 0.5 0.5 - - 0.0
Panama 3.5 3.5 1.0 0.0 1.0 1.0 0.0 0.5 0.0 0.0
Paraguay 4.0 4.0 0.0 0.5 1.0 1.0 0.5 0.0 0.0 1.0
Peru 5.5 5.5 0.0 1.0 1.0 1.0 1.0 0.5 0.0 1.0
Philippines 5.0 5.7 0.5 1.0 0.5 1.0 0.5 0.5 - 1.0
Poland 3.0 3.4 0.0 0.0 0.0 0.0 1.0 1.0 1.0 -
Romania 5.0 5.0 0.0 0.0 1.0 0.0 1.0 1.0 1.0 1.0
Russian Federation 4.0 4.0 1.0 0.0 0.5 0.0 1.0 0.5 0.0 1.0
Serbia 5.0 5.7 0.0 - 1.0 1.0 1.0 0.0 1.0 1.0
Seychelles 3.0 4.0 0.0 0.5 1.0 1.0 0.5 - - 0.0
South Africa 1.5 1.5 0.0 0.0 0.5 0.0 0.0 0.0 0.0 1.0
St. Kitts and Nevis 1.5 2.4 - 0.0 0.0 1.0 0.5 - - 0.0
Suriname 3.0 3.4 - 1.0 0.0 1.0 0.5 0.0 0.0 0.5
Swaziland 1.0 1.0 1.0 0.0 0.0 0.0 0.0 0.0 0.0 0.0
Syrian Arab Republic 5.0 6.7 - 0.0 1.0 1.0 1.0 1.0 - 1.0
Thailand 4.0 5.3 1.0 1.0 - - 1.0 0.0 0.0 1.0
Tunisia 7.0 7.0 1.0 0.0 1.0 1.0 1.0 1.0 1.0 1.0
Turkey 4.0 4.6 0.0 0.0 1.0 0.5 1.0 0.5 - 1.0
Turkmenistan 4.0 8.0 1.0 1.0 - - 1.0 1.0 - -
Ukraine 1.0 1.0 0.0 0.0 0.5 0.0 0.5 0.0 0.0 0.0
Uruguay 1.5 1.7 0.0 0.0 1.0 0.0 0.5 0.0 0.0 1.0
Venezuela, RB 3.5 4.0 0.0 0.0 1.0 1.0 0.5 0.5 - 0.5
West Bank and Gaza 2.0 2.7 - 0.0 0.0 1.0 0.5 0.5 - 0.0
AVERAGE 3.8 4.2 0.42 0.28 0.66 0.69 0.70 0.49 0.28 0.66
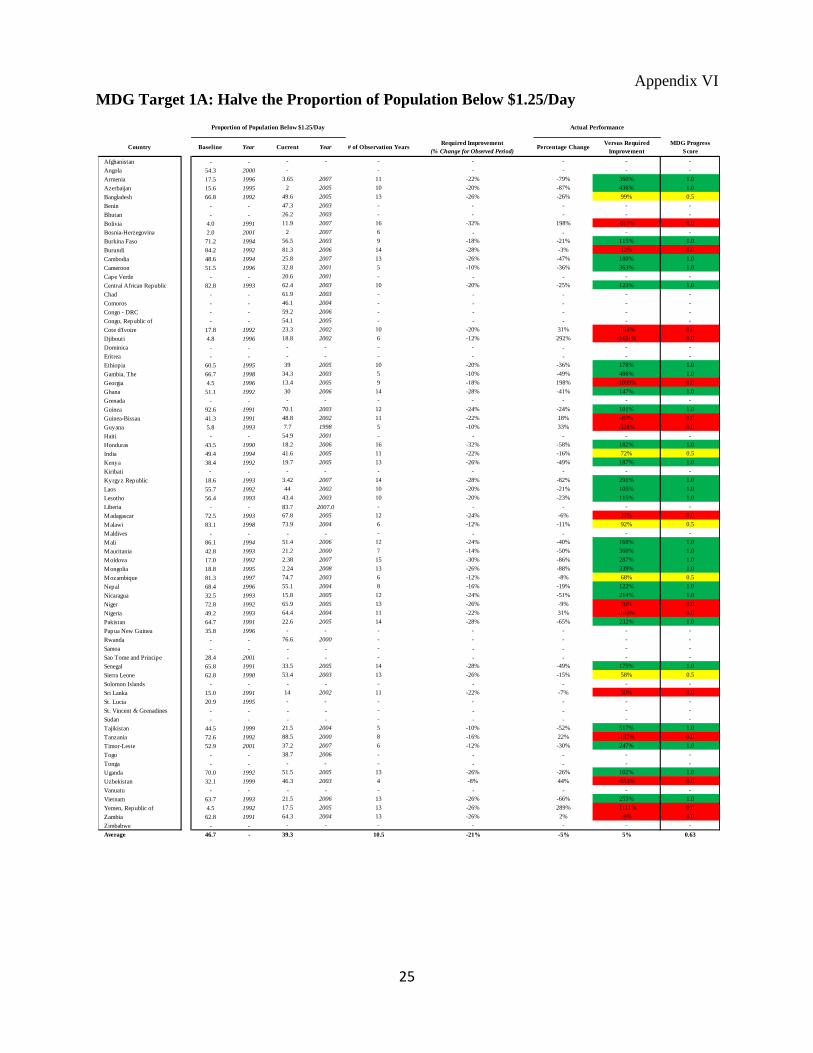
25
Appendix VI
MDG Target 1A: Halve the Proportion of Population Below $1.25/Day
Country Baseline Year Current Year # of Observation Years Required Improvement
(% Change for Observed Period)Percentage Change
Versus Required
Improvement
MDG Progress
Score
Afghanistan - - - - - - - - -
Angola 54.3 2000 - - - - - -
Armenia 17.5 1996 3.65 2007 11 -22% -79% 360% 1.0
Azerbaijan 15.6 1995 2 2005 10 -20% -87% 436% 1.0
Bangladesh 66.8 1992 49.6 2005 13 -26% -26% 99% 0.5
Benin - - 47.3 2003 - - - - -
Bhutan - - 26.2 2003 - - - - -
Bolivia 4.0 1991 11.9 2007 16 -32% 198% -617% 0.0
Bosnia-Herzegovina 2.0 2001 2 2007 6 - - - -
Burkina Faso 71.2 1994 56.5 2003 9 -18% -21% 115% 1.0
Burundi 84.2 1992 81.3 2006 14 -28% -3% 12% 0.0
Cambodia 48.6 1994 25.8 2007 13 -26% -47% 180% 1.0
Cameroon 51.5 1996 32.8 2001 5 -10% -36% 363% 1.0
Cape Verde - - 20.6 2001 - - - - -
Central African Republic 82.8 1993 62.4 2003 10 -20% -25% 123% 1.0
Chad - - 61.9 2003 - - - - -
Comoros - - 46.1 2004 - - - - -
Congo - DRC - - 59.2 2006 - - - - -
Congo, Republic of - - 54.1 2005 - - - - -
Cote d'Ivoire 17.8 1992 23.3 2002 10 -20% 31% -154% 0.0
Djibouti 4.8 1996 18.8 2002 6 -12% 292% -2431% 0.0
Dominica - - - - - - - - -
Eritrea - - - - - - - - -
Ethiopia 60.5 1995 39 2005 10 -20% -36% 178% 1.0
Gambia, The 66.7 1998 34.3 2003 5 -10% -49% 486% 1.0
Georgia 4.5 1996 13.4 2005 9 -18% 198% -1099% 0.0
Ghana 51.1 1992 30 2006 14 -28% -41% 147% 1.0
Grenada - - - - - - - - -
Guinea 92.6 1991 70.1 2003 12 -24% -24% 101% 1.0
Guinea-Bissau 41.3 1991 48.8 2002 11 -22% 18% -83% 0.0
Guyana 5.8 1993 7.7 1998 5 -10% 33% -328% 0.0
Haiti - - 54.9 2001 - - - - -
Honduras 43.5 1990 18.2 2006 16 -32% -58% 182% 1.0
India 49.4 1994 41.6 2005 11 -22% -16% 72% 0.5
Kenya 38.4 1992 19.7 2005 13 -26% -49% 187% 1.0
Kiribati - - - - - - - - -
Kyrgyz Republic 18.6 1993 3.42 2007 14 -28% -82% 291% 1.0
Laos 55.7 1992 44 2002 10 -20% -21% 105% 1.0
Lesotho 56.4 1993 43.4 2003 10 -20% -23% 115% 1.0
Liberia - - 83.7 2007.0 - - - - -
Madagascar 72.5 1993 67.8 2005 12 -24% -6% 27% 0.0
Malawi 83.1 1998 73.9 2004 6 -12% -11% 92% 0.5
Maldives - - - - - - - - -
Mali 86.1 1994 51.4 2006 12 -24% -40% 168% 1.0
Mauritania 42.8 1993 21.2 2000 7 -14% -50% 360% 1.0
Moldova 17.0 1992 2.38 2007 15 -30% -86% 287% 1.0
Mongolia 18.8 1995 2.24 2008 13 -26% -88% 339% 1.0
Mozambique 81.3 1997 74.7 2003 6 -12% -8% 68% 0.5
Nepal 68.4 1996 55.1 2004 8 -16% -19% 122% 1.0
Nicaragua 32.5 1993 15.8 2005 12 -24% -51% 214% 1.0
Niger 72.8 1992 65.9 2005 13 -26% -9% 36% 0.0
Nigeria 49.2 1993 64.4 2004 11 -22% 31% -140% 0.0
Pakistan 64.7 1991 22.6 2005 14 -28% -65% 232% 1.0
Papua New Guinea 35.8 1996 - - - - - - -
Rwanda - - 76.6 2000 - - - - -
Samoa - - - - - - - - -
Sao Tome and Principe 28.4 2001 - - - - - - -
Senegal 65.8 1991 33.5 2005 14 -28% -49% 175% 1.0
Sierra Leone 62.8 1990 53.4 2003 13 -26% -15% 58% 0.5
Solomon Islands - - - - - - - - -
Sri Lanka 15.0 1991 14 2002 11 -22% -7% 30% 0.0
St. Lucia 20.9 1995 - - - - - - -
St. Vincent & Grenadines - - - - - - - - -
Sudan - - - - - - - - -
Tajikistan 44.5 1999 21.5 2004 5 -10% -52% 517% 1.0
Tanzania 72.6 1992 88.5 2000 8 -16% 22% -137% 0.0
Timor-Leste 52.9 2001 37.2 2007 6 -12% -30% 247% 1.0
Togo - - 38.7 2006 - - - - -
Tonga - - - - - - - - -
Uganda 70.0 1992 51.5 2005 13 -26% -26% 102% 1.0
Uzbekistan 32.1 1999 46.3 2003 4 -8% 44% -553% 0.0
Vanuatu - - - - - - - - -
Vietnam 63.7 1993 21.5 2006 13 -26% -66% 255% 1.0
Yemen, Republic of 4.5 1992 17.5 2005 13 -26% 289% -1111% 0.0
Zambia 62.8 1991 64.3 2004 13 -26% 2% -9% 0.0
Zimbabwe - - - - - - - - -
Average 46.7 - 39.3 10.5 -21% -5% 5% 0.63
Proportion of Population Below $1.25/Day Actual Performance

26
MDG Target 1C: Halve the Proportion of Undernourished Population
Country Baseline Year Current Year # of Observation Years Required Improvement
(% Change for Observed Period)
Percentage
Change
Versus Required
Improvement
MDG Progress
Score
Afghanistan - - - - - - - - -
Angola 66 1992 44 2006 14 -28% -33% 119% 1.0
Armenia 46 1992 23 2006 14 -28% -50% 179% 1.0
Azerbaijan 27 1992 11 2006 14 -28% -59% 212% 1.0
Bangladesh 36 1992 26 2006 14 -28% -28% 99% 0.5
Benin 28 1992 19 2006 14 -28% -32% 115% 1.0
Bhutan - - - - - - - - -
Bolivia 24 1992 23 2006 14 -28% -4% 15% 0.0
Bosnia-Herzegovina 5 1992 5 2006 14 -28% 0% 0% 0.0
Burkina Faso 14 1992 9 2006 14 -28% -36% 128% 1.0
Burundi 44 1992 63 2006 14 -28% 43% -154% 0.0
Cambodia 38 1992 25 2006 14 -28% -34% 122% 1.0
Cameroon 34 1992 23 2006 14 -28% -32% 116% 1.0
Cape Verde 12 1992 14 2006 14 -28% 17% -60% 0.0
Central African Republic 47 1992 41 2006 14 -28% -13% 46% 0.0
Chad 59 1992 38 2006 14 -28% -36% 127% 1.0
Comoros 40 1992 51 2006 14 -28% 28% -98% 0.0
Congo - DRC 29 1992 75 2006 14 -28% 159% -567% 0.0
Congo, Republic of 40 1992 21 2006 14 -28% -48% 170% 1.0
Cote d'Ivoire 15 1992 14 2006 14 -28% -7% 24% 0.0
Djibouti 60 1992 31 2006 14 -28% -48% 173% 1.0
Dominica 5 1992 5 2006 14 -28% 0% 0% 0.0
Eritrea 67 1992 66 2006 14 -28% -1% 5% 0.0
Ethiopia 71 1992 44 2006 14 -28% -38% 136% 1.0
Gambia, The 20 1992 29 2006 14 -28% 45% -161% 0.0
Georgia 47 1992 12 2006 14 -28% -74% 266% 1.0
Ghana 34 1992 8 2006 14 -28% -76% 273% 1.0
Grenada 14 1992 23 2006 14 -28% 64% -230% 0.0
Guinea 19 1992 16 2006 14 -28% -16% 56% 0.5
Guinea-Bissau 20 1992 31 2006 14 -28% 55% -196% 0.0
Guyana 18 1992 6 2006 14 -28% -67% 238% 1.0
Haiti 63 1992 58 2006 14 -28% -8% 28% 0.0
Honduras 19 1992 12 2006 14 -28% -37% 132% 1.0
India 24 1992 22 2006 14 -28% -8% 30% 0.0
Kenya 33 1992 30 2006 14 -28% -9% 32% 0.0
Kiribati 8 1992 5 2006 14 -28% -38% 134% 1.0
Kyrgyz Republic 17 1992 5 2006 14 -28% -71% 252% 1.0
Laos 27 1992 19 2006 14 -28% -30% 106% 1.0
Lesotho 15 1992 15 2006 14 -28% 0% 0% 0.0
Liberia 30 1992 38 2006 14 -28% 27% -95% 0.0
Madagascar 32 1992 35 2006 14 -28% 9% -33% 0.0
Malawi 45 1992 29 2006 14 -28% -36% 127% 1.0
Maldives 9 1992 7 2006 14 -28% -22% 79% 0.5
Mali 14 1992 10 2006 14 -28% -29% 102% 1.0
Mauritania 10 1992 8 2006 14 -28% -20% 71% 0.5
Moldova 5 1992 5 2006 14 -28% 0% 0% 0.0
Mongolia 30 1992 29 2006 14 -28% -3% 12% 0.0
Mozambique 59 1992 37 2006 14 -28% -37% 133% 1.0
Nepal 21 1992 16 2006 14 -28% -24% 85% 0.5
Nicaragua 52 1992 21 2006 14 -28% -60% 213% 1.0
Niger 38 1992 28 2006 14 -28% -26% 94% 0.5
Nigeria 15 1992 8 2006 14 -28% -47% 167% 1.0
Pakistan 22 1992 23 2006 14 -28% 5% -16% 0.0
Papua New Guinea - - - - - - - - -
Rwanda 45 1992 40 2006 14 -28% -11% 40% 0.0
Samoa 9 1992 5 2006 14 -28% -44% 159% 1.0
Sao Tome and Principe 15 1992 5 2006 14 -28% -67% 238% 1.0
Senegal 28 1992 25 2006 14 -28% -11% 38% 0.0
Sierra Leone 45 1992 46 2006 14 -28% 2% -8% 0.0
Solomon Islands 25 1992 9 2006 14 -28% -64% 229% 1.0
Sri Lanka 27 1992 21 2006 14 -28% -22% 79% 0.5
St. Lucia 9 1992 8 2006 14 -28% -11% 40% 0.0
St. Vincent & Grenadines 18 1992 6 2006 14 -28% -67% 238% 1.0
Sudan 31 1992 20 2006 14 -28% -35% 127% 1.0
Tajikistan 34 1992 26 2006 14 -28% -24% 84% 0.5
Tanzania 28 1992 35 2006 14 -28% 25% -89% 0.0
Timor-Leste 18 1992 23 2006 14 -28% 28% -99% 0.0
Togo 45 1992 37 2006 14 -28% -18% 63% 0.5
Tonga - - - - - - - - -
Uganda 19 1992 15 2006 14 -28% -21% 75% 0.5
Uzbekistan 5 1992 13 2006 14 -28% 160% -571% 0.0
Vanuatu 10 1992 6 2006 14 -28% -40% 143% 1.0
Vietnam 28 1992 13 2006 14 -28% -54% 191% 1.0
Yemen, Republic of 30 1992 32 2006 14 -28% 7% -24% 0.0
Zambia 40 1992 45 2006 14 -28% 13% -45% 0.0
Zimbabwe 40 1992 39 2006 14 -28% -3% 9% 0.0
Average 29.4 - 24.0 14.0 -28% -14% 52% 0.49
Prevalence of Undernourishment
(% of population)Actual Performance
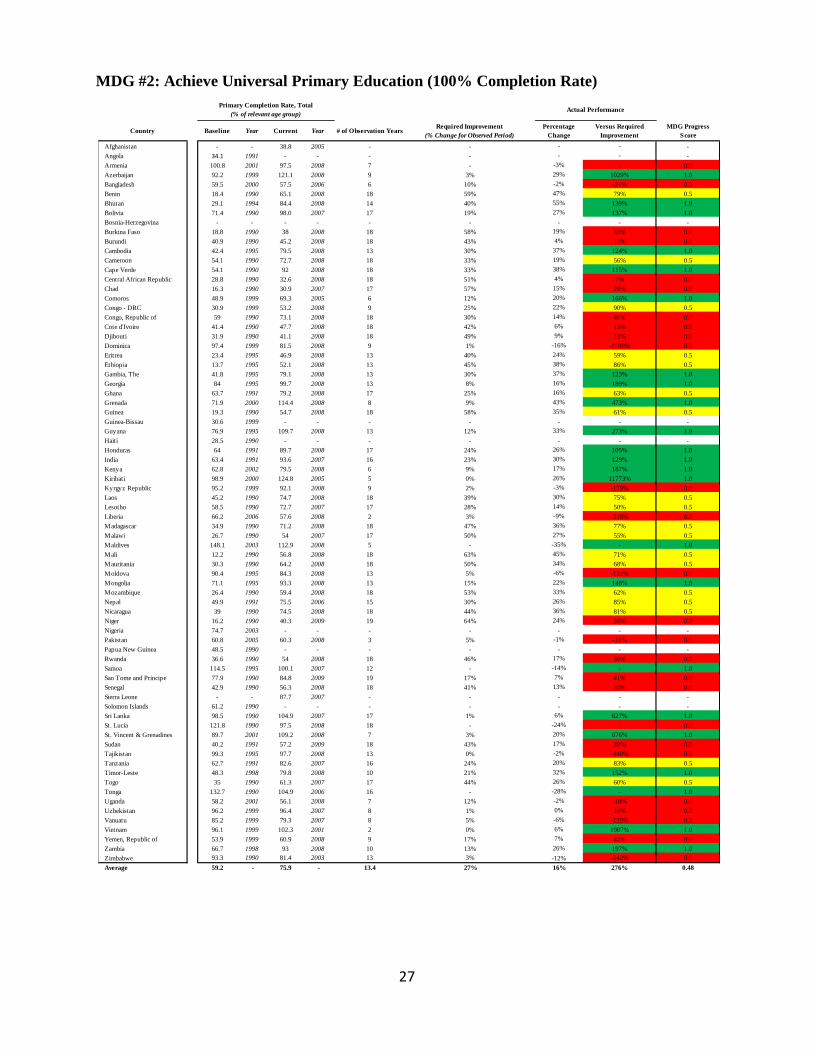
27
MDG #2: Achieve Universal Primary Education (100% Completion Rate)
Country Baseline Year Current Year # of Observation Years Required Improvement
(% Change for Observed Period)
Percentage
Change
Versus Required
Improvement
MDG Progress
Score
Afghanistan - - 38.8 2005 - - - - -
Angola 34.1 1991 - - - - - - -
Armenia 100.8 2001 97.5 2008 7 - -3% - 0.0
Azerbaijan 92.2 1999 121.1 2008 9 3% 29% 1029% 1.0
Bangladesh 59.5 2000 57.5 2006 6 10% -2% -21% 0.0
Benin 18.4 1990 65.1 2008 18 59% 47% 79% 0.5
Bhutan 29.1 1994 84.4 2008 14 40% 55% 139% 1.0
Bolivia 71.4 1990 98.0 2007 17 19% 27% 137% 1.0
Bosnia-Herzegovina - - - - - - - - -
Burkina Faso 18.8 1990 38 2008 18 58% 19% 33% 0.0
Burundi 40.9 1990 45.2 2008 18 43% 4% 10% 0.0
Cambodia 42.4 1995 79.5 2008 13 30% 37% 124% 1.0
Cameroon 54.1 1990 72.7 2008 18 33% 19% 56% 0.5
Cape Verde 54.1 1990 92 2008 18 33% 38% 115% 1.0
Central African Republic 28.8 1990 32.6 2008 18 51% 4% 7% 0.0
Chad 16.3 1990 30.9 2007 17 57% 15% 26% 0.0
Comoros 48.9 1999 69.3 2005 6 12% 20% 166% 1.0
Congo - DRC 30.9 1999 53.2 2008 9 25% 22% 90% 0.5
Congo, Republic of 59 1990 73.1 2008 18 30% 14% 48% 0.0
Cote d'Ivoire 41.4 1990 47.7 2008 18 42% 6% 15% 0.0
Djibouti 31.9 1990 41.1 2008 18 49% 9% 19% 0.0
Dominica 97.4 1999 81.5 2008 9 1% -16% -1699% 0.0
Eritrea 23.4 1995 46.9 2008 13 40% 24% 59% 0.5
Ethiopia 13.7 1995 52.1 2008 13 45% 38% 86% 0.5
Gambia, The 41.8 1995 79.1 2008 13 30% 37% 123% 1.0
Georgia 84 1995 99.7 2008 13 8% 16% 189% 1.0
Ghana 63.7 1991 79.2 2008 17 25% 16% 63% 0.5
Grenada 71.9 2000 114.4 2008 8 9% 43% 473% 1.0
Guinea 19.3 1990 54.7 2008 18 58% 35% 61% 0.5
Guinea-Bissau 30.6 1999 - - - - - - -
Guyana 76.9 1995 109.7 2008 13 12% 33% 273% 1.0
Haiti 28.5 1990 - - - - - - -
Honduras 64 1991 89.7 2008 17 24% 26% 105% 1.0
India 63.4 1991 93.6 2007 16 23% 30% 129% 1.0
Kenya 62.8 2002 79.5 2008 6 9% 17% 187% 1.0
Kiribati 98.9 2000 124.8 2005 5 0% 26% 11773% 1.0
Kyrgyz Republic 95.2 1999 92.1 2008 9 2% -3% -179% 0.0
Laos 45.2 1990 74.7 2008 18 39% 30% 75% 0.5
Lesotho 58.5 1990 72.7 2007 17 28% 14% 50% 0.5
Liberia 66.2 2006 57.6 2008 2 3% -9% -318% 0.0
Madagascar 34.9 1990 71.2 2008 18 47% 36% 77% 0.5
Malawi 26.7 1990 54 2007 17 50% 27% 55% 0.5
Maldives 148.1 2003 112.9 2008 5 - -35% - 1.0
Mali 12.2 1990 56.8 2008 18 63% 45% 71% 0.5
Mauritania 30.3 1990 64.2 2008 18 50% 34% 68% 0.5
Moldova 90.4 1995 84.3 2008 13 5% -6% -122% 0.0
Mongolia 71.1 1995 93.3 2008 13 15% 22% 148% 1.0
Mozambique 26.4 1990 59.4 2008 18 53% 33% 62% 0.5
Nepal 49.9 1991 75.5 2006 15 30% 26% 85% 0.5
Nicaragua 39 1990 74.5 2008 18 44% 36% 81% 0.5
Niger 16.2 1990 40.3 2009 19 64% 24% 38% 0.0
Nigeria 74.7 2003 - - - - - - -
Pakistan 60.8 2005 60.3 2008 3 5% -1% -11% 0.0
Papua New Guinea 48.5 1990 - - - - - - -
Rwanda 36.6 1990 54 2008 18 46% 17% 38% 0.0
Samoa 114.5 1995 100.1 2007 12 - -14% - 1.0
Sao Tome and Principe 77.9 1990 84.8 2009 19 17% 7% 41% 0.0
Senegal 42.9 1990 56.3 2008 18 41% 13% 33% 0.0
Sierra Leone - - 87.7 2007 - - - - -
Solomon Islands 61.2 1990 - - - - - - -
Sri Lanka 98.5 1990 104.9 2007 17 1% 6% 627% 1.0
St. Lucia 121.8 1990 97.5 2008 18 - -24% - 0.0
St. Vincent & Grenadines 89.7 2001 109.2 2008 7 3% 20% 676% 1.0
Sudan 40.2 1991 57.2 2009 18 43% 17% 39% 0.0
Tajikistan 99.3 1995 97.7 2008 13 0% -2% -440% 0.0
Tanzania 62.7 1991 82.6 2007 16 24% 20% 83% 0.5
Timor-Leste 48.3 1998 79.8 2008 10 21% 32% 152% 1.0
Togo 35 1990 61.3 2007 17 44% 26% 60% 0.5
Tonga 132.7 1990 104.9 2006 16 - -28% - 1.0
Uganda 58.2 2001 56.1 2008 7 12% -2% -18% 0.0
Uzbekistan 96.2 1999 96.4 2007 8 1% 0% 16% 0.0
Vanuatu 85.2 1999 79.3 2007 8 5% -6% -125% 0.0
Vietnam 96.1 1999 102.3 2001 2 0% 6% 1987% 1.0
Yemen, Republic of 53.9 1999 60.9 2008 9 17% 7% 42% 0.0
Zambia 66.7 1998 93 2008 10 13% 26% 197% 1.0
Zimbabwe 93.3 1990 81.4 2003 13 3% -12% -342% 0.0
Average 59.2 - 75.9 - 13.4 27% 16% 276% 0.48
Actual PerformancePrimary Completion Rate, Total
(% of relevant age group)
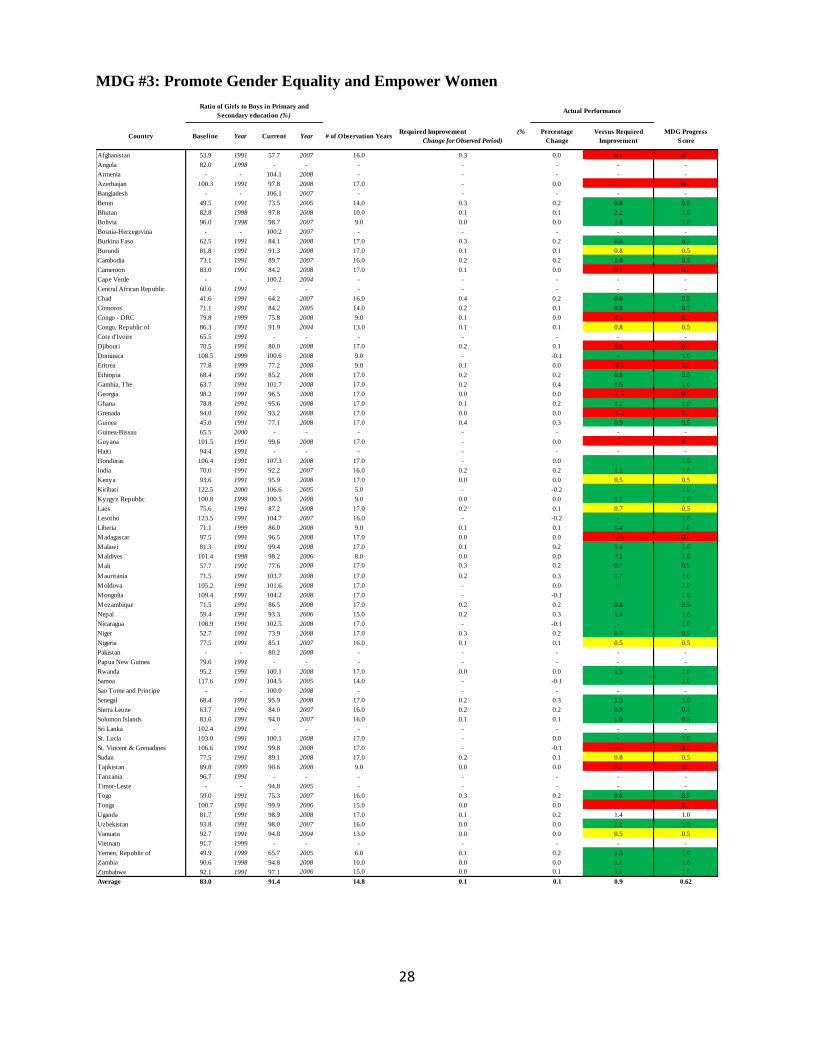
28
MDG #3: Promote Gender Equality and Empower Women
Country Baseline Year Current Year # of Observation Years Required Improvement (%
Change for Observed Period)
Percentage
Change
Versus Required
Improvement
MDG Progress
Score
Afghanistan 53.9 1991 57.7 2007 16.0 0.3 0.0 0.1 0.0
Angola 82.0 1998 - - - - - - -
Armenia - - 104.1 2008 - - - - -
Azerbaijan 100.3 1991 97.8 2008 17.0 - 0.0 - 0.0
Bangladesh - - 106.1 2007 - - - - -
Benin 49.5 1991 73.5 2005 14.0 0.3 0.2 0.8 0.5
Bhutan 82.8 1998 97.8 2008 10.0 0.1 0.1 2.2 1.0
Bolivia 96.0 1998 98.7 2007 9.0 0.0 0.0 1.8 1.0
Bosnia-Herzegovina - - 100.2 2007 - - - - -
Burkina Faso 62.5 1991 84.1 2008 17.0 0.3 0.2 0.8 0.5
Burundi 81.8 1991 91.3 2008 17.0 0.1 0.1 0.8 0.5
Cambodia 73.1 1991 89.7 2007 16.0 0.2 0.2 1.0 0.5
Cameroon 83.0 1991 84.2 2008 17.0 0.1 0.0 0.1 0.0
Cape Verde - - 100.2 2004 - - - - -
Central African Republic 60.6 1991 - - - - - - -
Chad 41.6 1991 64.2 2007 16.0 0.4 0.2 0.6 0.5
Comoros 71.1 1991 84.2 2005 14.0 0.2 0.1 0.8 0.5
Congo - DRC 79.8 1999 75.8 2008 9.0 0.1 0.0 -0.5 0.0
Congo, Republic of 86.3 1991 91.9 2004 13.0 0.1 0.1 0.8 0.5
Cote d'Ivoire 65.5 1991 - - - - - - -
Djibouti 70.5 1991 80.0 2008 17.0 0.2 0.1 0.5 0.0
Dominica 108.5 1999 100.6 2008 9.0 - -0.1 - 1.0
Eritrea 77.8 1999 77.2 2008 9.0 0.1 0.0 -0.1 0.0
Ethiopia 68.4 1991 85.2 2008 17.0 0.2 0.2 0.8 0.5
Gambia, The 63.7 1991 101.7 2008 17.0 0.2 0.4 1.5 1.0
Georgia 98.2 1991 96.5 2008 17.0 0.0 0.0 -1.5 0.0
Ghana 78.8 1991 95.6 2008 17.0 0.1 0.2 1.2 1.0
Grenada 94.0 1991 93.2 2008 17.0 0.0 0.0 -0.2 0.0
Guinea 45.0 1991 77.1 2008 17.0 0.4 0.3 0.9 0.5
Guinea-Bissau 65.5 2000 - - - - - - -
Guyana 101.5 1991 99.6 2008 17.0 - 0.0 - 0.0
Haiti 94.4 1991 - - - - - - -
Honduras 106.4 1991 107.3 2008 17.0 - 0.0 - 1.0
India 70.0 1991 92.2 2007 16.0 0.2 0.2 1.2 1.0
Kenya 93.6 1991 95.9 2008 17.0 0.0 0.0 0.5 0.5
Kiribati 122.5 2000 106.6 2005 5.0 - -0.2 - 1.0
Kyrgyz Republic 100.8 1999 100.5 2008 9.0 0.0 0.0 1.1 1.0
Laos 75.6 1991 87.2 2008 17.0 0.2 0.1 0.7 0.5
Lesotho 123.5 1991 104.7 2007 16.0 - -0.2 - 1.0
Liberia 71.1 1999 86.0 2008 9.0 0.1 0.1 1.4 1.0
Madagascar 97.5 1991 96.5 2008 17.0 0.0 0.0 -0.6 0.0
Malawi 81.3 1991 99.4 2008 17.0 0.1 0.2 1.4 1.0
Maldives 101.4 1998 98.2 2006 8.0 0.0 0.0 7.1 1.0
Mali 57.7 1991 77.6 2008 17.0 0.3 0.2 0.7 0.5
Mauritania 71.5 1991 103.7 2008 17.0 0.2 0.3 1.7 1.0
Moldova 105.2 1991 101.6 2008 17.0 - 0.0 - 1.0
Mongolia 109.4 1991 104.2 2008 17.0 - -0.1 - 1.0
Mozambique 71.5 1991 86.5 2008 17.0 0.2 0.2 0.8 0.5
Nepal 59.4 1991 93.3 2006 15.0 0.2 0.3 1.4 1.0
Nicaragua 108.9 1991 102.5 2008 17.0 - -0.1 - 1.0
Niger 52.7 1991 73.9 2008 17.0 0.3 0.2 0.7 0.5
Nigeria 77.5 1991 85.1 2007 16.0 0.1 0.1 0.5 0.5
Pakistan - - 80.2 2008 - - - - -
Papua New Guinea 79.6 1991 - - - - - - -
Rwanda 95.2 1991 100.1 2008 17.0 0.0 0.0 1.5 1.0
Samoa 117.6 1991 104.5 2005 14.0 - -0.1 - 1.0
Sao Tome and Principe - - 100.0 2008 - - - - -
Senegal 68.4 1991 95.9 2008 17.0 0.2 0.3 1.3 1.0
Sierra Leone 63.7 1991 84.0 2007 16.0 0.2 0.2 0.9 0.5
Solomon Islands 83.6 1991 94.0 2007 16.0 0.1 0.1 1.0 0.5
Sri Lanka 102.4 1991 - - - - - - -
St. Lucia 103.0 1991 100.1 2008 17.0 - 0.0 - 1.0
St. Vincent & Grenadines 106.6 1991 99.8 2008 17.0 - -0.1 - 0.0
Sudan 77.5 1991 89.1 2008 17.0 0.2 0.1 0.8 0.5
Tajikistan 89.8 1999 90.6 2008 9.0 0.0 0.0 0.2 0.0
Tanzania 96.7 1991 - - - - - - -
Timor-Leste - - 94.8 2005 - - - - -
Togo 59.0 1991 75.3 2007 16.0 0.3 0.2 0.6 0.5
Tonga 100.7 1991 99.9 2006 15.0 0.0 0.0 - 0.0
Uganda 81.7 1991 98.9 2008 17.0 0.1 0.2 1.4 1.0
Uzbekistan 93.8 1991 98.0 2007 16.0 0.0 0.0 1.1 1.0
Vanuatu 92.7 1991 94.8 2004 13.0 0.0 0.0 0.5 0.5
Vietnam 91.7 1999 - - - - - - -
Yemen, Republic of 49.9 1999 65.7 2005 6.0 0.1 0.2 1.3 1.0
Zambia 90.6 1998 94.8 2008 10.0 0.0 0.0 1.1 1.0
Zimbabwe 92.1 1991 97.1 2006 15.0 0.0 0.1 1.1 1.0
Average 83.0 91.4 14.8 0.1 0.1 0.9 0.62
Ratio of Girls to Boys in Primary and
Secondary education (%)Actual Performance
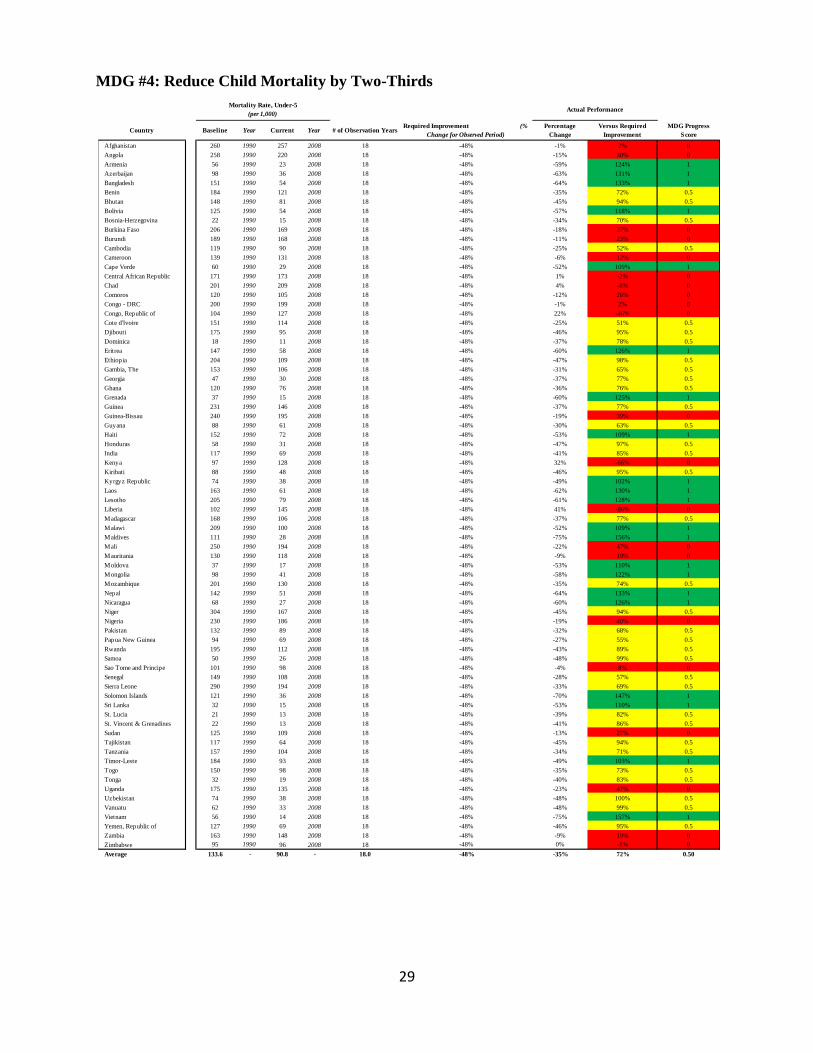
29
MDG #4: Reduce Child Mortality by Two-Thirds
Country Baseline Year Current Year # of Observation Years Required Improvement (%
Change for Observed Period)
Percentage
Change
Versus Required
Improvement
MDG Progress
Score
Afghanistan 260 1990 257 2008 18 -48% -1% 2% 0
Angola 258 1990 220 2008 18 -48% -15% 30% 0
Armenia 56 1990 23 2008 18 -48% -59% 124% 1
Azerbaijan 98 1990 36 2008 18 -48% -63% 131% 1
Bangladesh 151 1990 54 2008 18 -48% -64% 133% 1
Benin 184 1990 121 2008 18 -48% -35% 72% 0.5
Bhutan 148 1990 81 2008 18 -48% -45% 94% 0.5
Bolivia 125 1990 54 2008 18 -48% -57% 118% 1
Bosnia-Herzegovina 22 1990 15 2008 18 -48% -34% 70% 0.5
Burkina Faso 206 1990 169 2008 18 -48% -18% 37% 0
Burundi 189 1990 168 2008 18 -48% -11% 23% 0
Cambodia 119 1990 90 2008 18 -48% -25% 52% 0.5
Cameroon 139 1990 131 2008 18 -48% -6% 12% 0
Cape Verde 60 1990 29 2008 18 -48% -52% 109% 1
Central African Republic 171 1990 173 2008 18 -48% 1% -2% 0
Chad 201 1990 209 2008 18 -48% 4% -8% 0
Comoros 120 1990 105 2008 18 -48% -12% 26% 0
Congo - DRC 200 1990 199 2008 18 -48% -1% 2% 0
Congo, Republic of 104 1990 127 2008 18 -48% 22% -46% 0
Cote d'Ivoire 151 1990 114 2008 18 -48% -25% 51% 0.5
Djibouti 175 1990 95 2008 18 -48% -46% 95% 0.5
Dominica 18 1990 11 2008 18 -48% -37% 78% 0.5
Eritrea 147 1990 58 2008 18 -48% -60% 126% 1
Ethiopia 204 1990 109 2008 18 -48% -47% 98% 0.5
Gambia, The 153 1990 106 2008 18 -48% -31% 65% 0.5
Georgia 47 1990 30 2008 18 -48% -37% 77% 0.5
Ghana 120 1990 76 2008 18 -48% -36% 76% 0.5
Grenada 37 1990 15 2008 18 -48% -60% 125% 1
Guinea 231 1990 146 2008 18 -48% -37% 77% 0.5
Guinea-Bissau 240 1990 195 2008 18 -48% -19% 39% 0
Guyana 88 1990 61 2008 18 -48% -30% 63% 0.5
Haiti 152 1990 72 2008 18 -48% -53% 109% 1
Honduras 58 1990 31 2008 18 -48% -47% 97% 0.5
India 117 1990 69 2008 18 -48% -41% 85% 0.5
Kenya 97 1990 128 2008 18 -48% 32% -66% 0
Kiribati 88 1990 48 2008 18 -48% -46% 95% 0.5
Kyrgyz Republic 74 1990 38 2008 18 -48% -49% 102% 1
Laos 163 1990 61 2008 18 -48% -62% 130% 1
Lesotho 205 1990 79 2008 18 -48% -61% 128% 1
Liberia 102 1990 145 2008 18 -48% 41% -86% 0
Madagascar 168 1990 106 2008 18 -48% -37% 77% 0.5
Malawi 209 1990 100 2008 18 -48% -52% 109% 1
Maldives 111 1990 28 2008 18 -48% -75% 156% 1
Mali 250 1990 194 2008 18 -48% -22% 47% 0
Mauritania 130 1990 118 2008 18 -48% -9% 19% 0
Moldova 37 1990 17 2008 18 -48% -53% 110% 1
Mongolia 98 1990 41 2008 18 -48% -58% 122% 1
Mozambique 201 1990 130 2008 18 -48% -35% 74% 0.5
Nepal 142 1990 51 2008 18 -48% -64% 133% 1
Nicaragua 68 1990 27 2008 18 -48% -60% 126% 1
Niger 304 1990 167 2008 18 -48% -45% 94% 0.5
Nigeria 230 1990 186 2008 18 -48% -19% 40% 0
Pakistan 132 1990 89 2008 18 -48% -32% 68% 0.5
Papua New Guinea 94 1990 69 2008 18 -48% -27% 55% 0.5
Rwanda 195 1990 112 2008 18 -48% -43% 89% 0.5
Samoa 50 1990 26 2008 18 -48% -48% 99% 0.5
Sao Tome and Principe 101 1990 98 2008 18 -48% -4% 8% 0
Senegal 149 1990 108 2008 18 -48% -28% 57% 0.5
Sierra Leone 290 1990 194 2008 18 -48% -33% 69% 0.5
Solomon Islands 121 1990 36 2008 18 -48% -70% 147% 1
Sri Lanka 32 1990 15 2008 18 -48% -53% 110% 1
St. Lucia 21 1990 13 2008 18 -48% -39% 82% 0.5
St. Vincent & Grenadines 22 1990 13 2008 18 -48% -41% 86% 0.5
Sudan 125 1990 109 2008 18 -48% -13% 27% 0
Tajikistan 117 1990 64 2008 18 -48% -45% 94% 0.5
Tanzania 157 1990 104 2008 18 -48% -34% 71% 0.5
Timor-Leste 184 1990 93 2008 18 -48% -49% 103% 1
Togo 150 1990 98 2008 18 -48% -35% 73% 0.5
Tonga 32 1990 19 2008 18 -48% -40% 83% 0.5
Uganda 175 1990 135 2008 18 -48% -23% 47% 0
Uzbekistan 74 1990 38 2008 18 -48% -48% 100% 0.5
Vanuatu 62 1990 33 2008 18 -48% -48% 99% 0.5
Vietnam 56 1990 14 2008 18 -48% -75% 157% 1
Yemen, Republic of 127 1990 69 2008 18 -48% -46% 95% 0.5
Zambia 163 1990 148 2008 18 -48% -9% 19% 0
Zimbabwe 95 1990 96 2008 18 -48% 0% -1% 0
Average 133.6 - 90.8 - 18.0 -48% -35% 72% 0.50
Mortality Rate, Under-5
(per 1,000)Actual Performance
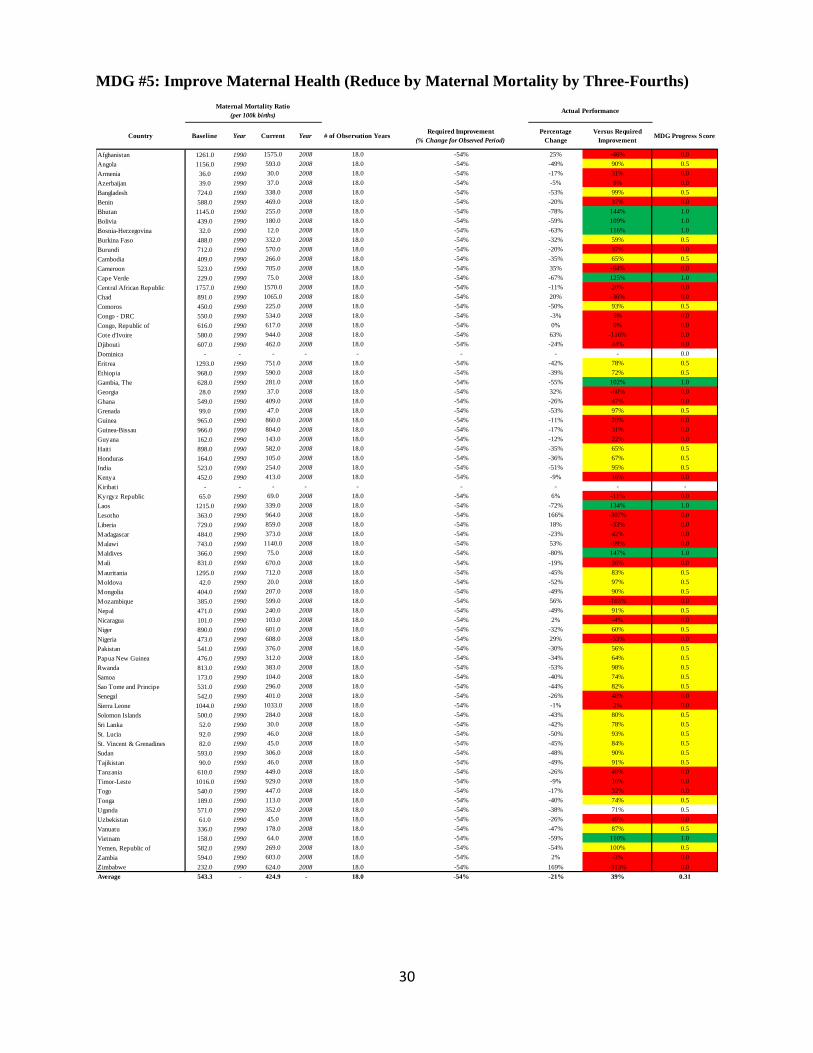
30
MDG #5: Improve Maternal Health (Reduce by Maternal Mortality by Three-Fourths)
Country Baseline Year Current Year # of Observation Years Required Improvement
(% Change for Observed Period)
Percentage
Change
Versus Required
ImprovementMDG Progress Score
Afghanistan 1261.0 1990 1575.0 2008 18.0 -54% 25% -46% 0.0
Angola 1156.0 1990 593.0 2008 18.0 -54% -49% 90% 0.5
Armenia 36.0 1990 30.0 2008 18.0 -54% -17% 31% 0.0
Azerbaijan 39.0 1990 37.0 2008 18.0 -54% -5% 9% 0.0
Bangladesh 724.0 1990 338.0 2008 18.0 -54% -53% 99% 0.5
Benin 588.0 1990 469.0 2008 18.0 -54% -20% 37% 0.0
Bhutan 1145.0 1990 255.0 2008 18.0 -54% -78% 144% 1.0
Bolivia 439.0 1990 180.0 2008 18.0 -54% -59% 109% 1.0
Bosnia-Herzegovina 32.0 1990 12.0 2008 18.0 -54% -63% 116% 1.0
Burkina Faso 488.0 1990 332.0 2008 18.0 -54% -32% 59% 0.5
Burundi 712.0 1990 570.0 2008 18.0 -54% -20% 37% 0.0
Cambodia 409.0 1990 266.0 2008 18.0 -54% -35% 65% 0.5
Cameroon 523.0 1990 705.0 2008 18.0 -54% 35% -64% 0.0
Cape Verde 229.0 1990 75.0 2008 18.0 -54% -67% 125% 1.0
Central African Republic 1757.0 1990 1570.0 2008 18.0 -54% -11% 20% 0.0
Chad 891.0 1990 1065.0 2008 18.0 -54% 20% -36% 0.0
Comoros 450.0 1990 225.0 2008 18.0 -54% -50% 93% 0.5
Congo - DRC 550.0 1990 534.0 2008 18.0 -54% -3% 5% 0.0
Congo, Republic of 616.0 1990 617.0 2008 18.0 -54% 0% 0% 0.0
Cote d'Ivoire 580.0 1990 944.0 2008 18.0 -54% 63% -116% 0.0
Djibouti 607.0 1990 462.0 2008 18.0 -54% -24% 44% 0.0
Dominica - - - - - - - - 0.0
Eritrea 1293.0 1990 751.0 2008 18.0 -54% -42% 78% 0.5
Ethiopia 968.0 1990 590.0 2008 18.0 -54% -39% 72% 0.5
Gambia, The 628.0 1990 281.0 2008 18.0 -54% -55% 102% 1.0
Georgia 28.0 1990 37.0 2008 18.0 -54% 32% -60% 0.0
Ghana 549.0 1990 409.0 2008 18.0 -54% -26% 47% 0.0
Grenada 99.0 1990 47.0 2008 18.0 -54% -53% 97% 0.5
Guinea 965.0 1990 860.0 2008 18.0 -54% -11% 20% 0.0
Guinea-Bissau 966.0 1990 804.0 2008 18.0 -54% -17% 31% 0.0
Guyana 162.0 1990 143.0 2008 18.0 -54% -12% 22% 0.0
Haiti 898.0 1990 582.0 2008 18.0 -54% -35% 65% 0.5
Honduras 164.0 1990 105.0 2008 18.0 -54% -36% 67% 0.5
India 523.0 1990 254.0 2008 18.0 -54% -51% 95% 0.5
Kenya 452.0 1990 413.0 2008 18.0 -54% -9% 16% 0.0
Kiribati - - - - - - - - -
Kyrgyz Republic 65.0 1990 69.0 2008 18.0 -54% 6% -11% 0.0
Laos 1215.0 1990 339.0 2008 18.0 -54% -72% 134% 1.0
Lesotho 363.0 1990 964.0 2008 18.0 -54% 166% -307% 0.0
Liberia 729.0 1990 859.0 2008 18.0 -54% 18% -33% 0.0
Madagascar 484.0 1990 373.0 2008 18.0 -54% -23% 42% 0.0
Malawi 743.0 1990 1140.0 2008 18.0 -54% 53% -99% 0.0
Maldives 366.0 1990 75.0 2008 18.0 -54% -80% 147% 1.0
Mali 831.0 1990 670.0 2008 18.0 -54% -19% 36% 0.0
Mauritania 1295.0 1990 712.0 2008 18.0 -54% -45% 83% 0.5
Moldova 42.0 1990 20.0 2008 18.0 -54% -52% 97% 0.5
Mongolia 404.0 1990 207.0 2008 18.0 -54% -49% 90% 0.5
Mozambique 385.0 1990 599.0 2008 18.0 -54% 56% -103% 0.0
Nepal 471.0 1990 240.0 2008 18.0 -54% -49% 91% 0.5
Nicaragua 101.0 1990 103.0 2008 18.0 -54% 2% -4% 0.0
Niger 890.0 1990 601.0 2008 18.0 -54% -32% 60% 0.5
Nigeria 473.0 1990 608.0 2008 18.0 -54% 29% -53% 0.0
Pakistan 541.0 1990 376.0 2008 18.0 -54% -30% 56% 0.5
Papua New Guinea 476.0 1990 312.0 2008 18.0 -54% -34% 64% 0.5
Rwanda 813.0 1990 383.0 2008 18.0 -54% -53% 98% 0.5
Samoa 173.0 1990 104.0 2008 18.0 -54% -40% 74% 0.5
Sao Tome and Principe 531.0 1990 296.0 2008 18.0 -54% -44% 82% 0.5
Senegal 542.0 1990 401.0 2008 18.0 -54% -26% 48% 0.0
Sierra Leone 1044.0 1990 1033.0 2008 18.0 -54% -1% 2% 0.0
Solomon Islands 500.0 1990 284.0 2008 18.0 -54% -43% 80% 0.5
Sri Lanka 52.0 1990 30.0 2008 18.0 -54% -42% 78% 0.5
St. Lucia 92.0 1990 46.0 2008 18.0 -54% -50% 93% 0.5
St. Vincent & Grenadines 82.0 1990 45.0 2008 18.0 -54% -45% 84% 0.5
Sudan 593.0 1990 306.0 2008 18.0 -54% -48% 90% 0.5
Tajikistan 90.0 1990 46.0 2008 18.0 -54% -49% 91% 0.5
Tanzania 610.0 1990 449.0 2008 18.0 -54% -26% 49% 0.0
Timor-Leste 1016.0 1990 929.0 2008 18.0 -54% -9% 16% 0.0
Togo 540.0 1990 447.0 2008 18.0 -54% -17% 32% 0.0
Tonga 189.0 1990 113.0 2008 18.0 -54% -40% 74% 0.5
Uganda 571.0 1990 352.0 2008 18.0 -54% -38% 71% 0.5
Uzbekistan 61.0 1990 45.0 2008 18.0 -54% -26% 49% 0.0
Vanuatu 336.0 1990 178.0 2008 18.0 -54% -47% 87% 0.5
Vietnam 158.0 1990 64.0 2008 18.0 -54% -59% 110% 1.0
Yemen, Republic of 582.0 1990 269.0 2008 18.0 -54% -54% 100% 0.5
Zambia 594.0 1990 603.0 2008 18.0 -54% 2% -3% 0.0
Zimbabwe 232.0 1990 624.0 2008 18.0 -54% 169% -313% 0.0
Average 543.3 - 424.9 - 18.0 -54% -21% 39% 0.31
Maternal Mortality Ratio
(per 100k births)Actual Performance
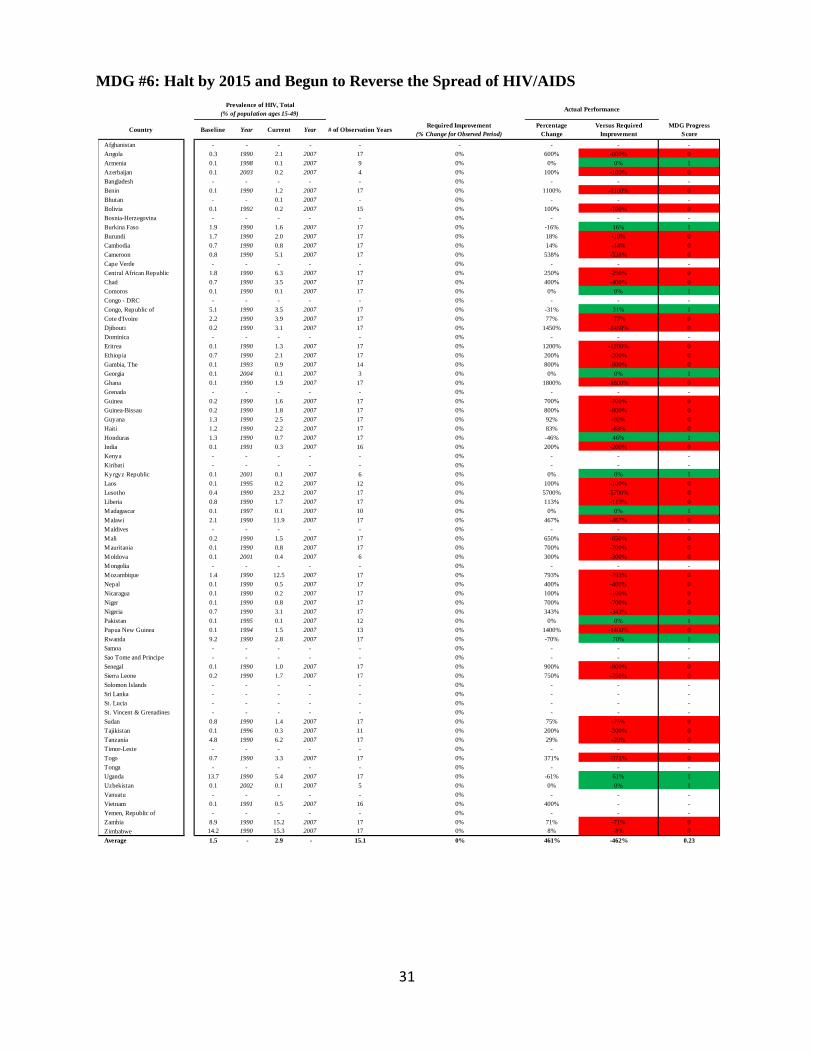
31
MDG #6: Halt by 2015 and Begun to Reverse the Spread of HIV/AIDS
Country Baseline Year Current Year # of Observation Years Required Improvement
(% Change for Observed Period)
Percentage
Change
Versus Required
Improvement
MDG Progress
Score
Afghanistan - - - - - - - - -
Angola 0.3 1990 2.1 2007 17 0% 600% -600% 0
Armenia 0.1 1998 0.1 2007 9 0% 0% 0% 1
Azerbaijan 0.1 2003 0.2 2007 4 0% 100% -100% 0
Bangladesh - - - - - 0% - - -
Benin 0.1 1990 1.2 2007 17 0% 1100% -1100% 0
Bhutan - - 0.1 2007 - 0% - - -
Bolivia 0.1 1992 0.2 2007 15 0% 100% -100% 0
Bosnia-Herzegovina - - - - - 0% - - -
Burkina Faso 1.9 1990 1.6 2007 17 0% -16% 16% 1
Burundi 1.7 1990 2.0 2007 17 0% 18% -18% 0
Cambodia 0.7 1990 0.8 2007 17 0% 14% -14% 0
Cameroon 0.8 1990 5.1 2007 17 0% 538% -538% 0
Cape Verde - - - - - 0% - - -
Central African Republic 1.8 1990 6.3 2007 17 0% 250% -250% 0
Chad 0.7 1990 3.5 2007 17 0% 400% -400% 0
Comoros 0.1 1990 0.1 2007 17 0% 0% 0% 1
Congo - DRC - - - - - 0% - - -
Congo, Republic of 5.1 1990 3.5 2007 17 0% -31% 31% 1
Cote d'Ivoire 2.2 1990 3.9 2007 17 0% 77% -77% 0
Djibouti 0.2 1990 3.1 2007 17 0% 1450% -1450% 0
Dominica - - - - - 0% - - -
Eritrea 0.1 1990 1.3 2007 17 0% 1200% -1200% 0
Ethiopia 0.7 1990 2.1 2007 17 0% 200% -200% 0
Gambia, The 0.1 1993 0.9 2007 14 0% 800% -800% 0
Georgia 0.1 2004 0.1 2007 3 0% 0% 0% 1
Ghana 0.1 1990 1.9 2007 17 0% 1800% -1800% 0
Grenada - - - - - 0% - - -
Guinea 0.2 1990 1.6 2007 17 0% 700% -700% 0
Guinea-Bissau 0.2 1990 1.8 2007 17 0% 800% -800% 0
Guyana 1.3 1990 2.5 2007 17 0% 92% -92% 0
Haiti 1.2 1990 2.2 2007 17 0% 83% -83% 0
Honduras 1.3 1990 0.7 2007 17 0% -46% 46% 1
India 0.1 1991 0.3 2007 16 0% 200% -200% 0
Kenya - - - - - 0% - - -
Kiribati - - - - - 0% - - -
Kyrgyz Republic 0.1 2001 0.1 2007 6 0% 0% 0% 1
Laos 0.1 1995 0.2 2007 12 0% 100% -100% 0
Lesotho 0.4 1990 23.2 2007 17 0% 5700% -5700% 0
Liberia 0.8 1990 1.7 2007 17 0% 113% -113% 0
Madagascar 0.1 1997 0.1 2007 10 0% 0% 0% 1
Malawi 2.1 1990 11.9 2007 17 0% 467% -467% 0
Maldives - - - - - 0% - - -
Mali 0.2 1990 1.5 2007 17 0% 650% -650% 0
Mauritania 0.1 1990 0.8 2007 17 0% 700% -700% 0
Moldova 0.1 2001 0.4 2007 6 0% 300% -300% 0
Mongolia - - - - - 0% - - -
Mozambique 1.4 1990 12.5 2007 17 0% 793% -793% 0
Nepal 0.1 1990 0.5 2007 17 0% 400% -400% 0
Nicaragua 0.1 1990 0.2 2007 17 0% 100% -100% 0
Niger 0.1 1990 0.8 2007 17 0% 700% -700% 0
Nigeria 0.7 1990 3.1 2007 17 0% 343% -343% 0
Pakistan 0.1 1995 0.1 2007 12 0% 0% 0% 1
Papua New Guinea 0.1 1994 1.5 2007 13 0% 1400% -1400% 0
Rwanda 9.2 1990 2.8 2007 17 0% -70% 70% 1
Samoa - - - - - 0% - - -
Sao Tome and Principe - - - - - 0% - - -
Senegal 0.1 1990 1.0 2007 17 0% 900% -900% 0
Sierra Leone 0.2 1990 1.7 2007 17 0% 750% -750% 0
Solomon Islands - - - - - 0% - - -
Sri Lanka - - - - - 0% - - -
St. Lucia - - - - - 0% - - -
St. Vincent & Grenadines - - - - - 0% - - -
Sudan 0.8 1990 1.4 2007 17 0% 75% -75% 0
Tajikistan 0.1 1996 0.3 2007 11 0% 200% -200% 0
Tanzania 4.8 1990 6.2 2007 17 0% 29% -29% 0
Timor-Leste - - - - - 0% - - -
Togo 0.7 1990 3.3 2007 17 0% 371% -371% 0
Tonga - - - - - 0% - - -
Uganda 13.7 1990 5.4 2007 17 0% -61% 61% 1
Uzbekistan 0.1 2002 0.1 2007 5 0% 0% 0% 1
Vanuatu - - - - - 0% - - -
Vietnam 0.1 1991 0.5 2007 16 0% 400% - -
Yemen, Republic of - - - - - 0% - - -
Zambia 8.9 1990 15.2 2007 17 0% 71% -71% 0
Zimbabwe 14.2 1990 15.3 2007 17 0% 8% -8% 0
Average 1.5 - 2.9 - 15.1 0% 461% -462% 0.23
Actual PerformancePrevalence of HIV, Total
(% of population ages 15-49)

32
MDG #7: Halve, by 2015, the Proportion of People without Sustainable Access to Safe
Drinking Water
Country Baseline Year Current Year # of Observation Years Required Improvement
(% Change for Observed Period)Percentage Change
Versus Required
ImprovementMDG Progress Score
Afghanistan 79.0 1995 78.0 2006 11.0 -22% -1% 6% 0.0
Angola 61.0 1990 49.0 2006 16.0 -32% -20% 61% 0.5
Armenia 9.0 1995 2.0 2006 11.0 -22% -78% 354% 1.0
Azerbaijan 32.0 1990 22.0 2006 16.0 -32% -31% 98% 0.5
Bangladesh 22.0 1990 20.0 2006 16.0 -32% -9% 28% 0.0
Benin 37.0 1990 35.0 2006 16.0 -32% -5% 17% 0.0
Bhutan 19.0 2000 19.0 2006 6.0 -12% 0% 0% 0.0
Bolivia 28.0 1990 14.0 2006 16.0 -32% -50% 156% 1.0
Bosnia-Herzegovina 3.0 1990 1.0 2006 16.0 -32% -67% 208% 1.0
Burkina Faso 66.0 1990 28.0 2006 16.0 -32% -58% 180% 1.0
Burundi 30.0 1990 29.0 2006 16.0 -32% -3% 10% 0.0
Cambodia 81.0 1990 35.0 2006 16.0 -32% -57% 177% 1.0
Cameroon 51.0 1990 30.0 2006 16.0 -32% -41% 129% 1.0
Cape Verde 21.0 1995 20.0 2000 5.0 -10% -5% 48% 0.0
Central African Republic 42.0 1990 34.0 2006 16.0 -32% -19% 60% 0.5
Chad 76.0 1995 52.0 2006 11.0 -22% -32% 144% 1.0
Comoros 7.0 1990 15.0 2006 16.0 -32% 114% -357% 0.0
Congo - DRC 57.0 1990 54.0 2006 16.0 -32% -5% 16% 0.0
Congo, Republic of 30.0 2000 29.0 2006 6.0 -12% -3% 28% 0.0
Cote d'Ivoire 33.0 1990 19.0 2006 16.0 -32% -42% 133% 1.0
Djibouti 24.0 1990 8.0 2006 16.0 -32% -67% 208% 1.0
Dominica 3.0 1995 3.0 2004 9.0 -18% 0% 0% 0.0
Eritrea 57.0 1990 40.0 2006 16.0 -32% -30% 93% 0.5
Ethiopia 87.0 1990 58.0 2006 16.0 -32% -33% 104% 1.0
Gambia, The 15.0 1995 14.0 2006 11.0 -22% -7% 30% 0.0
Georgia 24.0 1990 1.0 2006 16.0 -32% -96% 299% 1.0
Ghana 44.0 1990 20.0 2006 16.0 -32% -55% 170% 1.0
Grenada 6.0 1995 5.0 2004 9.0 -18% -17% 93% 0.5
Guinea 55.0 1990 30.0 2006 16.0 -32% -45% 142% 1.0
Guinea-Bissau 42.0 1995 43.0 2006 11.0 -22% 2% -11% 0.0
Guyana 12.0 1995 7.0 2006 11.0 -22% -42% 189% 1.0
Haiti 48.0 1990 42.0 2006 16.0 -32% -13% 39% 0.0
Honduras 28.0 1990 16.0 2006 16.0 -32% -43% 134% 1.0
India 29.0 1990 11.0 2006 16.0 -32% -62% 194% 1.0
Kenya 59.0 1990 43.0 2006 16.0 -32% -27% 85% 0.5
Kiribati 52.0 1990 35.0 2006 16.0 -32% -33% 102% 1.0
Kyrgyz Republic 23.0 1995 11.0 2006 11.0 -22% -52% 237% 1.0
Laos 59.0 1995 40.0 2006 11.0 -22% -32% 146% 1.0
Lesotho 23.0 1995 22.0 2006 11.0 -22% -4% 20% 0.0
Liberia 43.0 1990 36.0 2006 16.0 -32% -16% 51% 0.5
Madagascar 61.0 1990 53.0 2006 16.0 -32% -13% 41% 0.0
Malawi 59.0 1990 24.0 2006 16.0 -32% -59% 185% 1.0
Maldives 4.0 1990 17.0 2006 16.0 -32% 325% -1016% 0.0
Mali 67.0 1990 40.0 2006 16.0 -32% -40% 126% 1.0
Mauritania 63.0 1990 40.0 2006 16.0 -32% -37% 114% 1.0
Moldova 7.0 1995 10.0 2006 11.0 -22% 43% -195% 0.0
Mongolia 36.0 1990 28.0 2006 16.0 -32% -22% 69% 0.5
Mozambique 64.0 1990 58.0 2006 16.0 -32% -9% 29% 0.0
Nepal 28.0 1990 11.0 2006 16.0 -32% -61% 190% 1.0
Nicaragua 30.0 1990 21.0 2006 16.0 -32% -30% 94% 0.5
Niger 59.0 1990 58.0 2006 16.0 -32% -2% 5% 0.0
Nigeria 50.0 1990 53.0 2006 16.0 -32% 6% -19% 0.0
Pakistan 14.0 1990 10.0 2006 16.0 -32% -29% 89% 0.5
Papua New Guinea 61.0 1990 60.0 2006 16.0 -32% -2% 5% 0.0
Rwanda 35.0 1990 35.0 2006 16.0 -32% 0% 0% 0.0
Samoa 9.0 1990 12.0 2006 16.0 -32% 33% -104% 0.0
Sao Tome and Principe 21.0 1995 14.0 2006 11.0 -22% -33% 152% 1.0
Senegal 33.0 1990 23.0 2006 16.0 -32% -30% 95% 0.5
Sierra Leone 43.0 1995 47.0 2006 11.0 -22% 9% -42% 0.0
Solomon Islands 31.0 1990 30.0 2006 16.0 -32% -3% 10% 0.0
Sri Lanka 33.0 1990 18.0 2006 16.0 -32% -45% 142% 1.0
St. Lucia 2.0 1990 2.0 2006 16.0 -32% 0% 0% 0.0
St. Vincent & Grenadines - - - - - - - - -
Sudan 36.0 1990 30.0 2006 16.0 -32% -17% 52% 0.5
Tajikistan 44.0 1995 33.0 2006 11.0 -22% -25% 114% 1.0
Tanzania 51.0 1990 45.0 2006 16.0 -32% -12% 37% 0.0
Timor-Leste 39.0 2000 38.0 2006 6.0 -12% -3% 21% 0.0
Togo 51.0 1990 41.0 2006 16.0 -32% -20% 61% 0.5
Tonga 0.0 1990 0.0 2006 16.0 -32% - - 1.0
Uganda 57.0 1990 36.0 2006 16.0 -32% -37% 115% 1.0
Uzbekistan 10.0 1990 12.0 2006 16.0 -32% 20% -63% 0.0
Vanuatu 39.0 1990 - 2006 16.0 -32% - - -
Vietnam 48.0 1990 8.0 2006 16.0 -32% -83% 260% 1.0
Yemen, Republic of 28.0 1995 34.0 2006 11.0 -22% 21% -97% 0.0
Zambia 50.0 1990 42.0 2006 16.0 -32% -16% 50% 0.0
Zimbabwe 22.0 1990 19.0 2006 16.0 -32% -14% 43% 0.0
Average 37.4 28.0 14.3 -29% -17% 60% 0.48
Actual PerformanceImproved Water Source
(% of population without access)
Related Documents