Whither Linguistic Interpretation of Acoustic Pronunciation Variation Annika Hämäläinen, Yan Han, Lou Boves & Louis ten Bosch

Whither Linguistic Interpretation of Acoustic Pronunciation Variation Annika Hämäläinen, Yan Han, Lou Boves & Louis ten Bosch.
Dec 28, 2015
Welcome message from author
This document is posted to help you gain knowledge. Please leave a comment to let me know what you think about it! Share it to your friends and learn new things together.
Transcript

Whither Linguistic Interpretation of Acoustic Pronunciation Variation
Annika Hämäläinen, Yan Han, Lou Boves & Louis ten Bosch

Contents
• Introduction
• Objectives
• Trajectory clustering: short introduction
• Speech material
• Evaluation of trajectory clustering: ASR
• Phonetic and linguistic analysis
– Relationship between trajectory clusters and transcription variants
– Relationship between trajectory clusters and linguistic properties
• Summary

• Syllable-length acoustic models are expected to be better suited for modelling long-term spectral and temporal dependencies in speech– No need for precise segmental modelling
• A large number of factors affect the way syllables are pronounced:– Phonetic context
– Position in a multisyllabic word and in a sentence
– Lexical stress and accent
– Speaking rate
– etc.
Introduction (1/2)

Introduction (2/2)
• Because of the diverse sources of pronunciation variation, it may be
necessary to create multi-path syllable models to capture variation that
makes a difference for ASR performance.
• Methods to alleviate the data sparsity problem (Sethy & Narayanan, 2003):
– Combining syllable models for frequent syllables with triphones covering the less
frequent syllables
– Bootstrapping the topologies and observation densities of the syllable models
using triphones

• To study trajectory clustering as a method of building
multi-path syllable models.
• To investigate whether there is a relationship between
phonetic/linguistic properties and the results of
trajectory clustering.
– Such a relationship could be utilised in building or adapting
multi-path syllable models.
Objectives

• Deriving homogeneous clusters of longer-length models
directly from the speech signal:
– Sound intervals regarded as continuous trajectories along time
in observation space
– Sound intervals clustered based on the similarity of the
trajectories
– An individual path created for each cluster
– Parallel paths used during recognition
Trajectory Clustering (Han et al., 2005)

• Female read speech from the Spoken Dutch Corpus
Speech Material
Statistic Training Test Development
Word Tokens 215,810 12,327 11,822
Speakers 166 166 166
Duration 20:15:44 01:08:54 01:06:21
Evaluation of Trajectory Clustering: ASR

Speech Recognition / Method
• Baseline: Triphone recogniser
• Experimental recognisers:
– Syllable models for 94 most frequent syllables; triphones used to cover the
rest of the syllables
– The path topologies and observation densities of syllable models
bootstrapped using triphones corresponding to canonical syllable
transcriptions and trained further using Baum-Welch re-estimation
– 1-path mixed-model recogniser
•All tokens of a given syllable used for training the single path
– 2-path & 3-path mixed-model recognisers
•Trajectory clustering used to divide the syllable tokens for training the
parallel paths
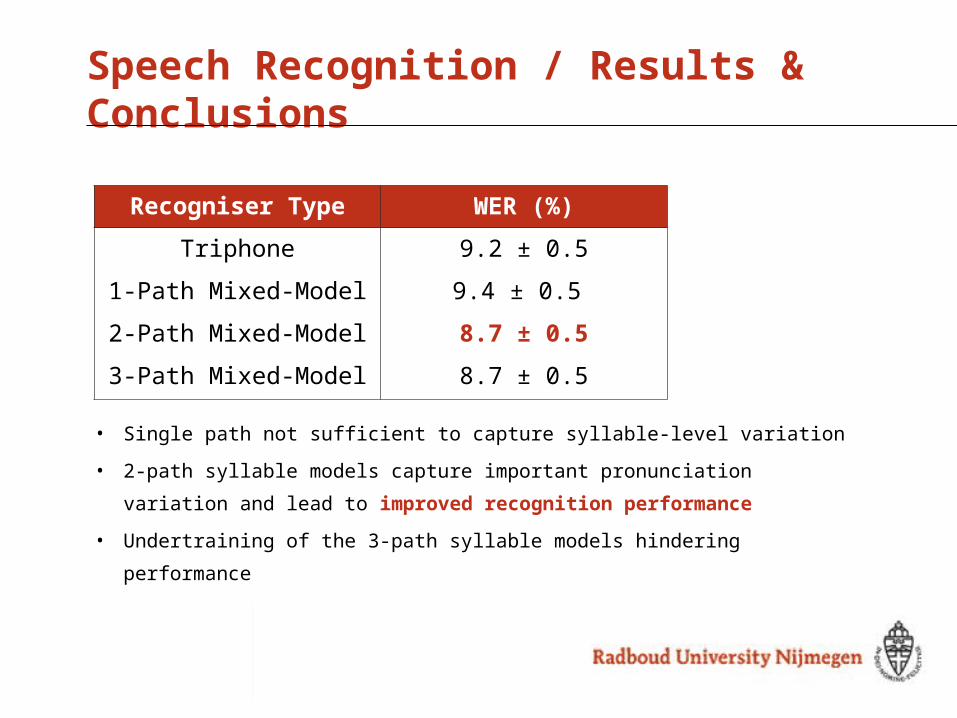
Speech Recognition / Results & Conclusions
Recogniser Type WER (%)
Triphone 9.2 ± 0.5
1-Path Mixed-Model 9.4 ± 0.5
2-Path Mixed-Model 8.7 ± 0.5
3-Path Mixed-Model 8.7 ± 0.5
• Single path not sufficient to capture syllable-level variation
• 2-path syllable models capture important pronunciation variation
and lead to improved recognition performance
• Undertraining of the 3-path syllable models hindering performance

Phonetic Analysis

• To check whether syllable tokens with different phonetic
transcriptions go into different clusters:
1. Phonetic distances between the pronunciation variants of each syllable
were computed on the basis of articulatory features
2. A multidimensional scaling (MDS) analysis was carried out for 1- or 2-
dimensional representations of the phonetic distances between the
pronunciation variants
3. The MDS distance representations were compared with the clusters
produced by trajectory clustering
Phonetic Analysis / Method

Phonetic Analysis / Results
Variant Count Cluster 1 Cluster 2O 7 57% 43%
O_v 135 51% 49%O_f 655 52% 48%
@_v 28 82% 18%@_f 23 83% 17%
w_O_f 33 82% 18%j_O_f 7 100% 0%
• Example: syllable /O_f/
2-dimensional MDS distance representation
Proportions of pronunciation variant tokens assigned to clusters
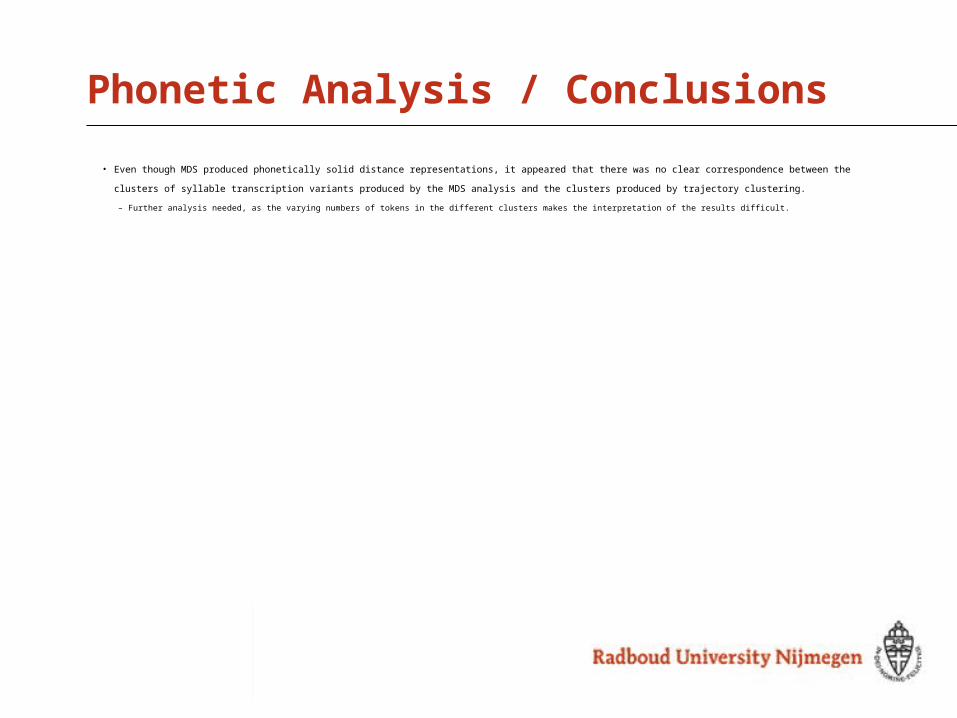
Phonetic Analysis / Conclusions
• Even though MDS produced phonetically solid distance representations, it appeared that there was no clear correspondence between the clusters of syllable
transcription variants produced by the MDS analysis and the clusters produced by trajectory clustering.
– Further analysis needed, as the varying numbers of tokens in the different clusters makes the interpretation of the results difficult.

Linguistic Analysis

• To check whether syllable tokens with certain linguistic
properties go into different clusters, a graphical representation
was used to compare the 2-way clusters produced by trajectory
clustering with 2-way clusters based on the following linguistic
properties:
– Duration (long vs. short syllable)
– POS (function vs. content word)
– Lexical stress (stressed vs. unstressed syllable)
– Monosyllabicity (mono-syllabic vs. multisyllabic word)
Linguistic Analysis / Method
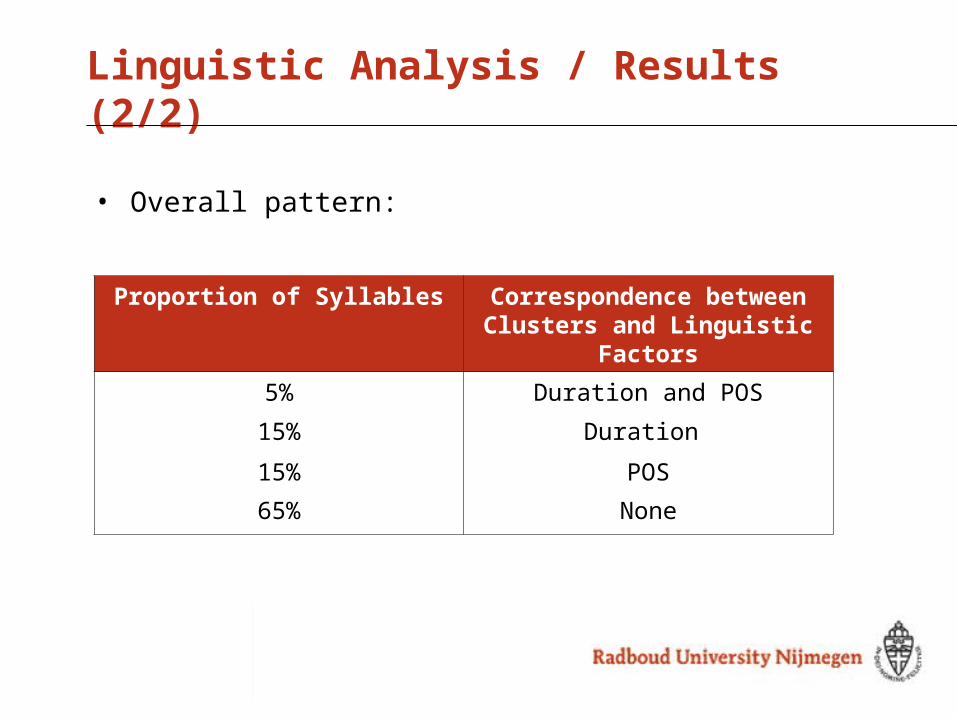
Linguistic Analysis / Results (2/2)
Proportion of Syllables Correspondence between Clusters and Linguistic
Factors
5% Duration and POS
15% Duration
15% POS
65% None
• Overall pattern:
Linguistic Analysis / Conclusions
• There were hardly any syllables showing a systematic connection between the linguistic properties tested and the results of trajectory
clustering.

Summary
• Improved ASR performance suggests that trajectory clustering is an attractive way of building multi-path syllable models
• There is no straightforward relationship between the acoustically defined clusters and the phonetic/linguistic factors tested in this study.
Designing or adapting multi-path syllable models based on such properties seems very difficult.
Questions?
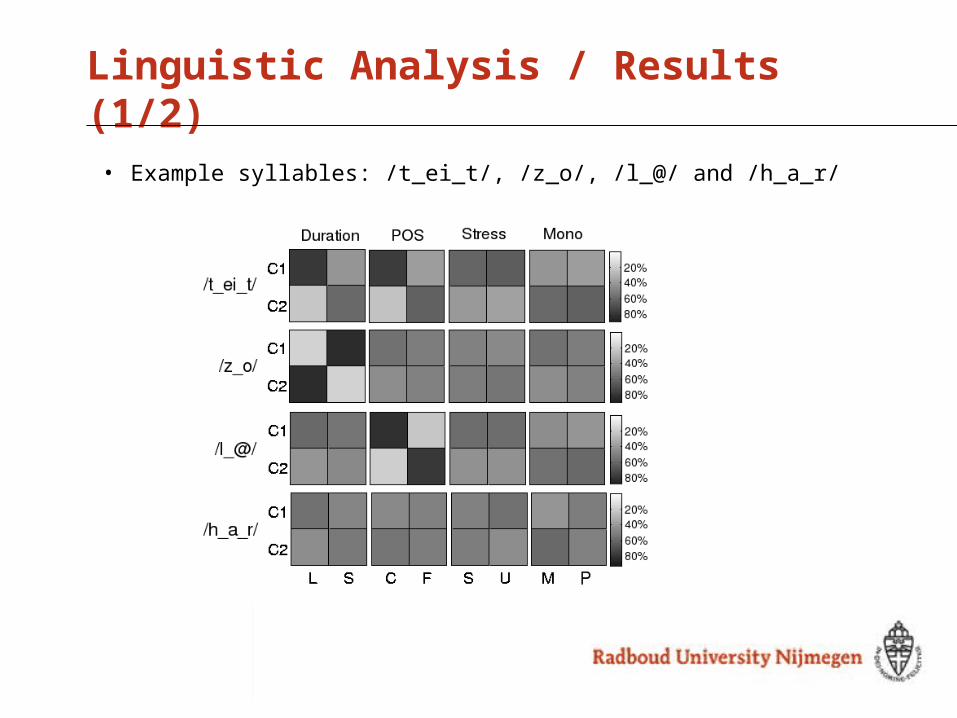
Linguistic Analysis / Results (1/2)
• Example syllables: /t_ei_t/, /z_o/, /l_@/ and /h_a_r/
Related Documents