Whither Australia: Will Availability of Water Constrain the Growth of Australia’s Population?IAN RUTHERFURD* and BRIAN FINLAYSON Department of Resource Management and Geography, University of Melbourne, Melbourne, Vic. 3130, Australia. *Corresponding author. Email: [email protected] Received 30 April 2011; Revised 5 June 2011; Accepted 15 June 2011 Abstract Supply of water for cities and for food production will not be a major factor limiting the growth of Australia’s population in coming decades. The water needed to sustain the population of Australia can be divided into two kinds. Direct water requirements are those that meet the immediate needs of the people – potable water supply and waste removal. Indirect water requirements refer to the water needed to sustain the economy and the standard of living – food production, manufacturing, mining, etc. Agriculture is the largest indirect user, using between 50% and 70%, while household use, including sewerage and drainage, uses less than 30%. Industry uses the remaining 20%. In this paper, we do not deal with the issue of water quality but note its significance, especially as regards the salinisa- tion of water resources in rural Australia. Australia has abundant water when expressed on a per capita basis, although this is unevenly distributed around the continent. Per capita, the densely populated south-eastern and south-western parts of the continent have low to average run-off available when compared with other populated regions of the world. What is more important is the extreme inter- annual variability of that run-off. Previous attempts to measure the size of the population that could be supported in Australia, based on the availability of water, have produced estimates up to 280 million. Outside of the well-watered edges of the continent, water has always been seen as a factor that limits Australia’s population. However, water supply is a necessary but not sufficient basis for population growth, as can be seen from examples (such as the Ord Irrigation Scheme) where providing abundant water has failed to trigger major population growth. The largest increases in population in coming decades are predicted to occur in the capital cities where there has been a substantial reduction in water use through demand management in recent years. Urban water demand has proven to be extremely elastic. New sources of urban water, including desalination, ground- water, recycled sewage, and increased run-off in urban stormwater, will easily provide sufficient water for a growing urban population over coming decades. Water used in irrigated agriculture at present supplies the needs of Australia’s 20 million people and an estimated 40 million in other countries. With increased efficiency in the delivery and use of water for irrigation combined with export substitution, water for food production is not likely to limit population. In this paper, we have not dealt with the issue of environmental flows in rivers or with the provision of water to wetlands, although we acknowledge that they are both significant issues for policy development. We conclude that the size of the popu- lation of Australia is less important than how that population behaves in regard to the management of water resources. 301 Geographical Research • August 2011 • 49(3):301–316 doi: 10.1111/j.1745-5871.2011.00707.x

Welcome message from author
This document is posted to help you gain knowledge. Please leave a comment to let me know what you think about it! Share it to your friends and learn new things together.
Transcript
Whither Australia: Will Availability of WaterConstrain the Growth of Australia’s Population?geor_707 301..316
IAN RUTHERFURD* and BRIAN FINLAYSONDepartment of Resource Management and Geography, University of Melbourne, Melbourne, Vic.3130, Australia.*Corresponding author. Email: [email protected]
Received 30 April 2011; Revised 5 June 2011; Accepted 15 June 2011
AbstractSupply of water for cities and for food production will not be a major factorlimiting the growth of Australia’s population in coming decades. The waterneeded to sustain the population of Australia can be divided into two kinds. Directwater requirements are those that meet the immediate needs of the people –potable water supply and waste removal. Indirect water requirements refer to thewater needed to sustain the economy and the standard of living – food production,manufacturing, mining, etc. Agriculture is the largest indirect user, using between50% and 70%, while household use, including sewerage and drainage, uses lessthan 30%. Industry uses the remaining 20%. In this paper, we do not deal with theissue of water quality but note its significance, especially as regards the salinisa-tion of water resources in rural Australia. Australia has abundant water whenexpressed on a per capita basis, although this is unevenly distributed around thecontinent. Per capita, the densely populated south-eastern and south-western partsof the continent have low to average run-off available when compared with otherpopulated regions of the world. What is more important is the extreme inter-annual variability of that run-off. Previous attempts to measure the size of thepopulation that could be supported in Australia, based on the availability of water,have produced estimates up to 280 million. Outside of the well-watered edges ofthe continent, water has always been seen as a factor that limits Australia’spopulation. However, water supply is a necessary but not sufficient basis forpopulation growth, as can be seen from examples (such as the Ord IrrigationScheme) where providing abundant water has failed to trigger major populationgrowth. The largest increases in population in coming decades are predicted tooccur in the capital cities where there has been a substantial reduction in water usethrough demand management in recent years. Urban water demand has proven tobe extremely elastic. New sources of urban water, including desalination, ground-water, recycled sewage, and increased run-off in urban stormwater, will easilyprovide sufficient water for a growing urban population over coming decades.Water used in irrigated agriculture at present supplies the needs of Australia’s 20million people and an estimated 40 million in other countries. With increasedefficiency in the delivery and use of water for irrigation combined with exportsubstitution, water for food production is not likely to limit population. In thispaper, we have not dealt with the issue of environmental flows in rivers or with theprovision of water to wetlands, although we acknowledge that they are bothsignificant issues for policy development. We conclude that the size of the popu-lation of Australia is less important than how that population behaves in regard tothe management of water resources.
301Geographical Research • August 2011 • 49(3):301–316doi: 10.1111/j.1745-5871.2011.00707.x
KEY WORDS water; water supply; population; Australia; urban; food security
IntroductionAll Australian school children are taught thatAustralia is the driest inhabited continent. Thispoint is usually made just before exhorting thechild to save water. The implication is that Aus-tralia is somehow running out of water, and thaturban consumption is responsible. In fact, urbanAustralians are not running out of water, andwater availability is not a constraint on thegrowth of Australia’s population. There may bemany good reasons to limit Australia’s popula-tion growth, but insufficient water is not amongthem. Neither is the corollary true. Providingmore water to parts of Australia that do not haveit will not immediately lead to populationgrowth, as has been demonstrated in develop-ment schemes in northern Australia. Many otherfactors limit Australia’s population and popula-tion distribution.
In 1991, then Prime Minister Bob Hawkecommissioned a review of the implications of alarger Australian population (Jones, 1994). Sincethat time there has been vigorous debate aboutAustralia’s ideal population, and about the factthat, thanks to high immigration levels, ourpopulation is now (2008–2009) growing at afaster rate than the Organisation for EconomicCo-operation and Development average (Austra-lian Bureau of Statistics [ABS], 2010a).
For those groups arguing for a lower popula-tion, a common refrain is that Australia is thedriest inhabited continent, and that water scarcitymust limit population growth. John Crawford,from the Institute for Sustainable Solutions atSydney University, said on the Australian Broad-casting Corporation’s 7:30 Report that: ‘Austra-lia’s probably the leading [developed] countryfacing the challenge of not enough water, toomany people . . . and increasing demand forfood. Globally, we call this the perfect storm’.Dick Smith has commented that Australia’spopulation has to be limited because of watershortages (Alexander, 2010). Even Tony Burke,Australia’s first Minister of Population, stated in2010 that ‘recent water shortages in parts of Aus-tralia are a key reason why the country needs anational population policy’ (Australian Broad-casting Corporation News, 6 April 2010).
Other analyses conclude that water supplypresents no constraint on population growth.For example, an independent advisory reportto the Commonwealth Government’s Sustainable
Population Strategy for Australia (DSEWPC,2010), concluded that:
Australia’s sizeable water resources will notbe significantly depleted by populationgrowth. Water use in Australia is primarilyfocused on our export-focused agriculturalsector (and on particular commodities).. . . For all the effort we might go to inrestricting domestic water consumption intimes of drought, the biggest reductionsin water will be in the more efficient deliveryand use of water in the environment and in theagricultural sector. Between 2004–05 and2008–09 the agricultural sector reduced itsconsumption of water by over 40 per cent,more than double the percentage reduction inconsumption by households’ (p. 226).
While we do not disagree with this contention,the evidence for it in the Commonwealth govern-ment’s Population Strategy (DSEWPC, 2010) isscant, and is based on a questionable analysis ofrainfall patterns. Gill (2011) presents a usefulcritique of the water and population arguments,concluding that water supply should not be aconstraint on a larger population.
The argument about water and population isnot a new one. It has been a theme of nationaldevelopment arguments since first Europeansettlement. In general, the view has been that,away from the well-watered edges of the conti-nent, water is a basic limiting factor in populationgrowth. In this paper we will explore the distri-bution and supply of the run-off that underpinswater supply, in relation to population. We willthen consider where future population growth isgoing to take place, and what water supplyoptions are available in those areas. Finally, weexplore whether population growth will belimited, not by direct water availability, but byreduced water supply to agriculture, leading toreduced food security.
We will frame the argument in terms of whatcould be called ‘direct’ water requirements(which are the direct water requirements ofhouseholds, including potable water and wasteremoval); and ‘indirect’ water requirements,which is the water needed to sustain the economyand the life style of Australians (including foodproduction, manufacturing, mining, etc.). Notethat direct consumption by Australians (whichincludes sewage, drainage, and household
302 Geographical Research • August 2011 • 49(3):301–316
© 2011 The AuthorsGeographical Research © 2011 Institute of Australian Geographers
consumption) represents about 20% of total con-sumption in a normal year (2001–2002), but30% in a very dry year. This proportion varieswith the larger volume used for agriculture,which varies between 50% and 70% of wateruse, depending on drought (Table 1). To put thisin context, it has been noted (Smith, 1998) thatthe use of water for pasture irrigation alone inthe Murray-Darling Basin exceeds the total useof water for domestic, commercial, and indus-trial purposes in Australia. In this article, weconcentrate on the issue of water quantity, butdo not cover the related, and important, issue ofwater quality, especially the salinisation of waterresources in rural Australia.
Water and carrying capacity in AustraliaWe have already referred to the oft-repeatedclaim that Australia is the driest inhabited con-tinent. On strictly technical grounds it is prob-ably true but it blinds the outlook of Australiansto things that are much more relevant. There is asense in which Australians revel in the fact thatthey have succeeded in developing this countrydespite the hardships imposed by this perceivedlack of water. The reality is that the continenthas been occupied selectively in the moisterregions by both the original inhabitants and theEuropean colonisers.
Taken in context, Australia’s water resourcesare rather different to this popular perception.Bruce Davidson (1969), in his brilliant butunfortunately now little-read book Australia Wetor Dry?, demonstrated that per capita, Australiahas more annual rainfall than any other conti-nent, but the more pertinent issue is the propor-
tion of that rainfall that becomes run-off. Run-off represents the water that can be diverted forbeneficial use. Groundwater is an additionalsource of water. Australia as a whole has paltryrun-off. For the Murray-Darling Basin, forexample, only 4% of precipitation becomes run-off. This compares with over 50% for NorthAmerica. Despite this, if the water resource isscaled by the population size, then, for the sixcontinents and the world as a whole, Australia isthe wettest inhabited continent (Table 2). Mostof this rainfall occurs in the sparsely populatednorth (Nix, 1988).
However, the arguments about run-off andpopulation are distorted by the distribution ofrun-off in Australia. The tropical areas, such asthe drainage divisions of the Gulf of Carpentariaand the Timor Sea, have run-off rates per capitathat are orders of magnitude higher than worldaverages (Figure 1). Southern Australia has 82%of the population but only 27% of the annual
Table 1 Australian water consumption by sector 2001–2002, and 2008–2009 (Source: ABS, 2010c).
Sector Volume Consumed2001–2002 (GL)(Normal Year)
Percentage ofTotal 2001–2002
Volume Consumed2008–2009 (GL)(Dry Year)
Percentage ofTotal 2008–2009
Agriculture 15 000 69 6 996 502
Water supply1 2 165 10 2 396 17Household 2 278 10 1 768 12Other industries 1 106 5 1 327 9Manufacturing: 549 3 677 5Mining: 321 1 508 4Electricity and gas 255 1 328 2Forestry and fishing 40 <1 101 1Totals 21 703 14 101
1 ‘Water supply’ includes volumes required for sewage and drainage in towns and cities.2 In 2001–2002, agriculture accounted for 70% of the total water use, but this declined to just 50% in 2008–2009 because of thedrought.
Table 2 Per capita run-off for the continents (based on datain McMahon et al., 1992).
Continent Run-off per Capita(ML year-1)
Asia 4.6North America 15.8South America 46.3Europe 4.1Africa 7.2Australia 132.5World 8.0
I. Rutherfurd and B. Finlayson: Water as a Constraint on Australia’s Population 303
© 2011 The AuthorsGeographical Research © 2011 Institute of Australian Geographers
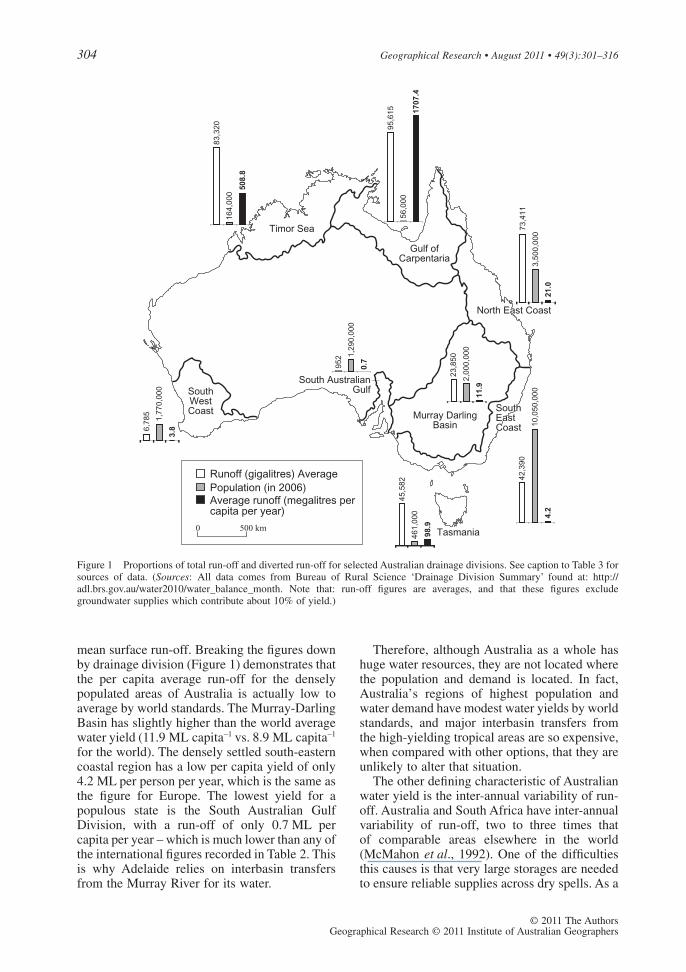
mean surface run-off. Breaking the figures downby drainage division (Figure 1) demonstrates thatthe per capita average run-off for the denselypopulated areas of Australia is actually low toaverage by world standards. The Murray-DarlingBasin has slightly higher than the world averagewater yield (11.9 ML capita-1 vs. 8.9 ML capita-1
for the world). The densely settled south-easterncoastal region has a low per capita yield of only4.2 ML per person per year, which is the same asthe figure for Europe. The lowest yield for apopulous state is the South Australian GulfDivision, with a run-off of only 0.7 ML percapita per year – which is much lower than any ofthe international figures recorded in Table 2. Thisis why Adelaide relies on interbasin transfersfrom the Murray River for its water.
Therefore, although Australia as a whole hashuge water resources, they are not located wherethe population and demand is located. In fact,Australia’s regions of highest population andwater demand have modest water yields by worldstandards, and major interbasin transfers fromthe high-yielding tropical areas are so expensive,when compared with other options, that they areunlikely to alter that situation.
The other defining characteristic of Australianwater yield is the inter-annual variability of run-off. Australia and South Africa have inter-annualvariability of run-off, two to three times thatof comparable areas elsewhere in the world(McMahon et al., 1992). One of the difficultiesthis causes is that very large storages are neededto ensure reliable supplies across dry spells. As a
Murray DarlingBasin
South AustralianGulf
Tasmania
Gulf ofCarpentaria
Timor Sea
North East Coast
SouthWestCoast South
EastCoast
42
,39
0
4.2
10
,05
0,0
00
73
,41
1
3,5
00
,00
0
21.0
23
,85
0
2,0
00
,00
0
11.9
6,7
85
1,7
70
,00
0
3.8
95
2
0.7
1,2
90
,00
0
45
,58
2
46
1,0
00
98.9
95
,61
5
56
,00
0
1707
.4
83
,32
0
16
4,0
00
508.
8
Runoff (gigalitres) Average
Population (in 2006)Average runoff (megalitres percapita per year)
0 500 km
Figure 1 Proportions of total run-off and diverted run-off for selected Australian drainage divisions. See caption to Table 3 forsources of data. (Sources: All data comes from Bureau of Rural Science ‘Drainage Division Summary’ found at: http://adl.brs.gov.au/water2010/water_balance_month. Note that: run-off figures are averages, and that these figures excludegroundwater supplies which contribute about 10% of yield.)
304 Geographical Research • August 2011 • 49(3):301–316
© 2011 The AuthorsGeographical Research © 2011 Institute of Australian Geographers
general rule, Australian dams need to store about1.65 times the average annual flow of the river inorder to provide reliable water supply during dryyears (Table 3). By contrast, stream flow intodams in North America is so reliable that damsthere need to store just 0.44 of the annual flow toensure equivalent supply security. Europe is evenmore reliable with a ratio of just 0.28. BecauseAustralian dams have to be relatively larger forthe same reliability, it means that our dams arerelatively more expensive, and also that there arefewer suitable sites for such dams in our subduedlandscape.
Thus, Australia may be the driest inhabitedcontinent, but run-off, rather than precipitation,is the important hydrological measure. In termsof run-off per capita, it is actually the wettestcontinent, but this water is found in areas awayfrom the locus of population and development.The populated areas of Australia, in an averageyear, actually have low to average run-off percapita when compared with the rest of the world.The problem with this analysis is that averagerun-off is an unhelpful measure when the vari-ability of Australia’s run-off is much higher thanthe rest of the world. The result of this variabilityis that Australian cities, and agriculture, rely onlarge dams that can carry storage over from wetyears (or floods) to supply dry periods.
Historical views of water and populationFor a brief period, at first European settlement,water availability clearly limited population sizeand distribution. For example, the British gov-ernment was concerned that the French wouldbeat them in the race to settle Port Phillip (Cotter,
2001). So they dispatched Lieutenant ColonelDavid Collins on 27 April 1803, with two shipsand a party of over 400. They arrived in Octoberand established the bay’s first white settlement atSullivan Bay, near what is now Sorrento. Thesettlement was short lived. The narrow bayentrance was treacherous, timber was in shortsupply and they were vulnerable to attack. Criti-cal to the failure of the colony was the shortageof water. Collins abandoned the camp and wentto Van Diemen’s Land to establish Hobart. Acentury later, 10 oak casks were found buried inthe sand. These were buried to collect freshwaterseeping through the sand. This shortage of waterwas a local problem, however. When Melbournewas founded 32 years later, across the bay, therewas abundant water from the Yarra River and itstributaries.
From the time the first European settlementswere established, water and population was apreoccupation for the colonists. There was a pre-vailing view that water was the limiting ingredi-ent in population growth, and in prosperity. ‘Ihave a strange idea that there is a central sea andI should go fully prepared for a voyage’, saidCharles Sturt as he dragged a whale boat intocentral Australia in 1844 (Cumpston, 1951). Thenotion of the inland sea, and the preoccupation ofthe early colonists with water as a limit to popu-lation, is explored eloquently by Michael Cath-cart (2009).
The issue of what population Australia couldsupport has often been debated. Griffith Taylor(1940) calculated the carrying capacity of Aus-tralia on the basis of the size of agricultural popu-lation that the various regions of Australia couldsupport. This was not based just on water avail-ability but on the quality of farming land in termsof both temperature and precipitation. Taylor’sanalyses were carried out in the context of thepotential of Australia to accommodate closersettlement, defined as the farming population.His attempt to forecast the optimum populationfor Australia was based on the population ofEurope and assumed a comparable standard ofliving. On this basis, he estimated that Australiacould support a population of 60 million. Taylorrecognised that the standard of living of thepopulation was a significant and controlling vari-able, and having directly compared the popula-tion densities of Algeria and South Australia inrelation to mean annual rainfall, showed thatAlgeria supports about 20 times the populationdensity of comparable areas in South Australia.He drily observed: ‘This is an eloquent commen-
Table 3 Intercontinental comparisons of hypothetical reser-voir storage sizes that would be needed to supply a draft of80% of the mean annual flow with 95% reliability (adaptedfrom McMahon et al., 1992).
Continental Region Storage Size(Ratio of MeanAnnual Flow)
South Africa 2.07Australia 1.65Asia 0.62North America 0.44South America 0.44North Africa 0.35Europe 0.28World average 0.7
I. Rutherfurd and B. Finlayson: Water as a Constraint on Australia’s Population 305
© 2011 The AuthorsGeographical Research © 2011 Institute of Australian Geographers
tary on the ability of the poverty stricken Arab tolive where an Australian could not’ (p. 443).
As indicated in Tables 2 and 3, Europe is prob-ably not a good comparator for Australia’s popu-lation potential. Taylor’s estimates of Australia’spopulation carrying capacity are not solely basedon water availability. However, by 1970, as thepost World War II baby boom subsided, the fer-tility rate began to decline to below the replace-ment rate and caused the government of theday to institute the National Population Enquiry(1975). A series of research reports were com-missioned for the enquiry and J.W. Holmes pro-duced a report that dealt with population andwater resources (Holmes, 1976). Even at the timeTaylor was writing about Australia’s population,the tendency to urban concentration was alreadyclear, and was then close to 50%. By the 1970s,there was an apparently irreversible concentra-tion of population in urban areas and this ledHolmes to focus his analysis on the ability of theavailable water resources to support urban popu-lations. He first took three ‘growth’ regions andassessed their potential population based onwater availability.
The three regions he chose were Albury-Wodonga, Monarto, and Dampier as they repre-sented a range of climate types typical ofAustralia. His analysis was based on the assump-tion that half the water supplied to the city wouldbecome flow into the sewerage system and the
other half would ‘escape collection’, mainly bybeing used for garden watering and industrialcleaning and processing. He also factored inwater quality limits that would allow down-stream users (where the waste was dischargedinto a river) to access water of drinkable quality.He assumed that the per capita requirementswere 0.2 ML per year for Albury-Wodonga andMonarto and 0.3 ML per year for Dampier. Onthis basis, he calculated that Albury-Wodongacould potentially support a population of 2.2million, Monarto in excess of 20 million, andDampier 0.27 million. It is interesting to note thatthese three sites alone were estimated to be ableto support what is the present total population ofAustralia.
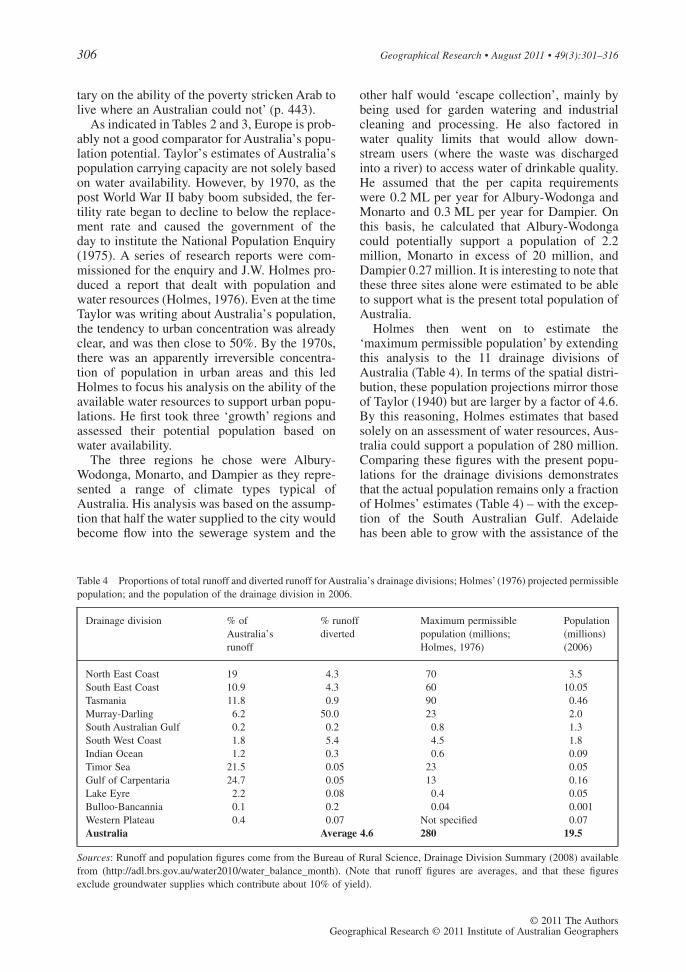
Holmes then went on to estimate the‘maximum permissible population’ by extendingthis analysis to the 11 drainage divisions ofAustralia (Table 4). In terms of the spatial distri-bution, these population projections mirror thoseof Taylor (1940) but are larger by a factor of 4.6.By this reasoning, Holmes estimates that basedsolely on an assessment of water resources, Aus-tralia could support a population of 280 million.Comparing these figures with the present popu-lations for the drainage divisions demonstratesthat the actual population remains only a fractionof Holmes’ estimates (Table 4) – with the excep-tion of the South Australian Gulf. Adelaidehas been able to grow with the assistance of the
Table 4 Proportions of total runoff and diverted runoff for Australia’s drainage divisions; Holmes’ (1976) projected permissiblepopulation; and the population of the drainage division in 2006.
Drainage division % ofAustralia’srunoff
% runoffdiverted
Maximum permissiblepopulation (millions;Holmes, 1976)
Population(millions)(2006)
North East Coast 19 4.3 70 3.5South East Coast 10.9 4.3 60 10.05Tasmania 11.8 0.9 90 0.46Murray-Darling 6.2 50.0 23 2.0South Australian Gulf 0.2 0.2 0.8 1.3South West Coast 1.8 5.4 4.5 1.8Indian Ocean 1.2 0.3 0.6 0.09Timor Sea 21.5 0.05 23 0.05Gulf of Carpentaria 24.7 0.05 13 0.16Lake Eyre 2.2 0.08 0.4 0.05Bulloo-Bancannia 0.1 0.2 0.04 0.001Western Plateau 0.4 0.07 Not specified 0.07Australia Average 4.6 280 19.5
Sources: Runoff and population figures come from the Bureau of Rural Science, Drainage Division Summary (2008) availablefrom (http://adl.brs.gov.au/water2010/water_balance_month). (Note that runoff figures are averages, and that these figuresexclude groundwater supplies which contribute about 10% of yield).
306 Geographical Research • August 2011 • 49(3):301–316
© 2011 The AuthorsGeographical Research © 2011 Institute of Australian Geographers
interbasin transfer from the Murray, itself aug-mented by the additional transfer from theSnowy River system.
There is good reason to argue that Holmes’estimates are pessimistic. He assumes that theurban population needs 0.2 ML per person peryear of water supplied from the catchment. In2009, actual water use in Australian capital citiesaveraged just 0.124 ML per person (Water Ser-vices Association of Australia [WSAA], 2010),only 62% of the figure used by Holmes (1976).Average residential consumption in the sameyear was 0.075 ML per person, about 60% of thetotal. Neither Holmes nor the WSAA consideredthe potential to supply residential water needswith domestic rainwater storage, grey waterrecycling and conversion to certain activities thatused less water – such as native gardens and drycomposting toilets. As most rural residents inAustralia well know, most households can bewater self-sufficient (this point is discussedfurther below).
Does providing water lead toincreased population?Let us return to the historical notion of water aspanacea. A consistent argument of Australianhistory has been that water is the missing,magical ingredient to a growing population util-ising the wasted majority of Australia’s lands.Griffith Taylor was famously pilloried for sug-gesting that there were limits to the settlementof Australia (Figure 1), and that ‘visionary’schemes to move water to central Australia weredoomed to failure. Not many geographers havethe distinction of having their book banned, butTaylor’s (1914) A Geography of Australasia wasbanned by the Western Australian governmentfrom the state’s schools and university (Cathcart,2009) and this book of Taylor’s is still not held inthe library of the University of Western Australiaor any other major library in that state.
If water is a limit on population size andgrowth rates in Australia, then provision of addi-tional water should lead to increased population.Like sea-monkeys, does adding water to theAustralian landscape allow it to spring to life,with populations streaming to the font? A testfor the role of water is to see what has happenedwhere abundant water is provided. Does popu-lation automatically follow? History shows thatwater is necessary for population growth, butnot sufficient.
There is no doubt that there are exampleswhere water was a critical constraint on popula-
tion. Perhaps the most famous example is theGoldfields Water Supply Scheme, completed in1903, that brought water some 560 km to theEastern Goldfields of Western Australia, andbrought immense wealth to the towns of Cool-gardie and Kalgoorlie (Hartley, 2007). Abundantwater became available at a cost of three shillingsand sixpence per thousand gallons to Coolgardie,compared with £3 per thousand gallons for watercarted by rail. The pipeline continues to operatetoday, supplying water to over 100 000 people,as well as mines, farms, and other enterprises(Hartley, 2007). The irrigation schemes of theMurray-Darling Basin are another examplewhere provision of water for irrigation hasalmost certainly supported a larger populationthan without water. But there are also exampleswhere supplying water has failed to be thepanacea for regional economies. The bestexample is the Ord Scheme in the north ofWestern Australia.
The Ord Dam, in north-western Australia,was completed in 1972, producing Lake Argyle,Australia’s second largest impoundment. Thepurpose of the dam was to encourage populationgrowth in northern Australia (for a range of geo-political reasons), by developing a major irriga-tion industry (Head, 1999). Thirty-nine yearslater, irrigated agriculture (annual value of $87million) is a smaller industry than pearling(annual value $92 million) in the Kimberleyregion (KDC, 2009). The population of the OrdStatistical Division is just 34 000 (ABS, 2010d),of which only a small proportion is engaged inirrigated agriculture. Overall, the scheme is gen-erally considered a failure for multiple, complexreasons (Davidson, 1982; Symanski, 1996), butof interest here is the question of whether theabsence of water of itself provides a major brakeon population growth. The Ord Scheme is anexample of where providing abundant waterclearly is not sufficient to trigger substantialpopulation growth.
Another example is the major dam buildingprogramme of Tasmania, where the intent was toprovide abundant hydroelectric power to supportpopulation growth. Despite Tasmania havingmore water stored per capita than any other Aus-tralian state, and an aggressive programme ofdamming streams for production of hydroelec-tricity, Tasmania has the slowest populationgrowth rate of any state. Between 1954 and 1991,through the peak of the hydroelectric era, Tasma-nia’s population only rose by 46%, comparedwith the Australian average of 92% (Beer, 1998).
I. Rutherfurd and B. Finlayson: Water as a Constraint on Australia’s Population 307
© 2011 The AuthorsGeographical Research © 2011 Institute of Australian Geographers
In relation to urban water supply, it was onlyafter a decade of drought that water meters arenow being introduced in Hobart. Before thatthere was no volumetric charge for water con-sumption. Provision of water is clearly not amajor issue constraining population growth inHobart. Providing abundant water, whether forirrigation, for urban supply, or for hydroelectricpower, does not translate into correspondingpopulation growth. Water supply is a necessarybut not sufficient basis for population growth.
Matching Australia’s population growth towater supplyWe have established that, in general, there isabundant water in Australia to sustain a muchlarger population, but that this potential isrestricted to the better watered coastal areas. Thehigh variability of precipitation means that weneed relatively larger dams than in other coun-tries to ensure the same security of supply. It isalso clear that providing water to remote parts ofAustralia is not sufficient of itself to trigger sus-tainable regional population growth.
We now turn to the more specific issues ofproviding water for a growing population.Despite the fact that water is available, it is alsotrue that the easy and cheap sources of that waterare already utilised. The reality is that Australiain general, and major Australian cities in particu-lar, have exploited the great majority of cheapwater options, which are essentially large dams.Recall that Australian dams have to be muchlarger than comparable dams in Europe or NorthAmerica to produce the same reliability ofsupply. This means that the few appropriate sitesfor dams, in Australia’s subdued terrain, havegenerally all been used (Australian WaterResources Council, 1987). No urban watersupply dams have been built in the last decade,and proposals for new dam sites tend to be madein the heat of political opportunism, and aban-doned in the light of engineering and economicreality, as well as vigorous opposition from theenvironmental lobby.
We will explore three specific questions:
1. Where will Australia’s population growthtake place?
2. Are there options for supplying that growingpopulation with water?
3. Are there other limits to population growthfrom ‘indirect’ uses of water, particularly foodsecurity?
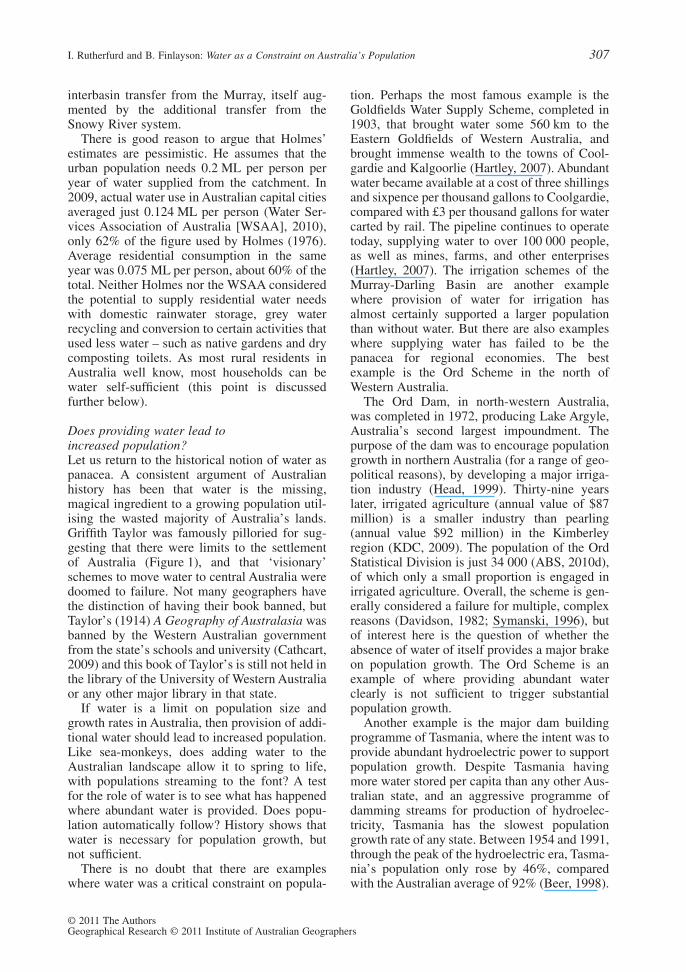
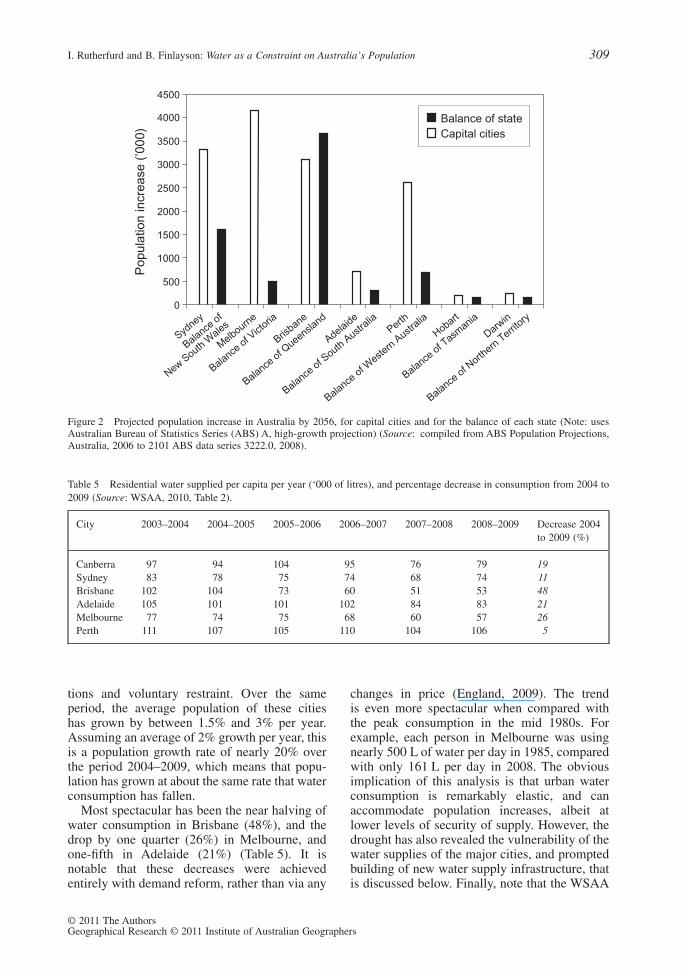
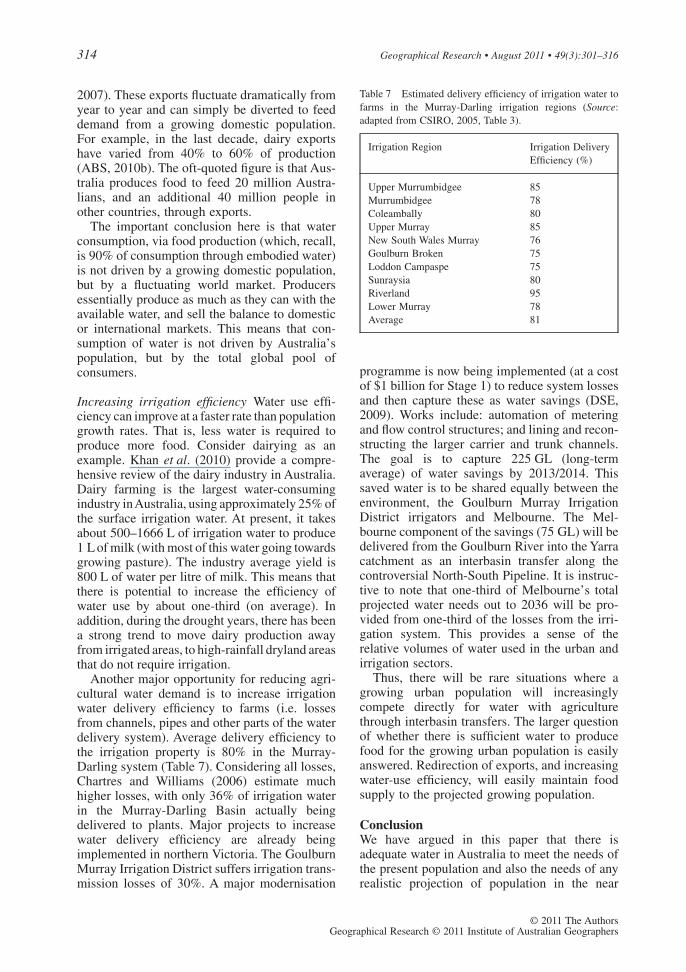
Where is additional water required?Australia’s population growth will predomi-nantly take place in the major capital cities. In2008–2009, Australia’s total population grew by456 700 persons, of which 65% were the result ofnet overseas migration. The ABS has estimatedfuture population growth for Australia by usingthree scenarios entitled projections A to C (ABS,2008). Under all scenarios, two-thirds of popu-lation growth takes place in capital cities(Figure 2). Under the high growth projection A,the capital city population grows by 14.3 million,while the areas outside of the capitals grow byjust 6.9 million. Sixty-two per cent of Australia’spopulation growth up to 2056 is predicted to takeplace in the four cities of Sydney, Melbourne,Brisbane, and Perth. Note that under these pro-jections, Adelaide is not predicted to grow at thesame rates as the other capitals. Therefore, interms of provision of water for growing popula-tions, the critical issue is providing water to thekey capital cities.
Water demand in citiesThe WSAA has predicted water demand in thecapital cities out to 2026 and to 2056 using thethree growth scenarios developed by the ABS.The medium projection (B) extrapolates presenttrends, while the low-growth projection (C) pre-dicts declining rates of population growth. Theseprojections see the total capital city populationgrowing from 13.4 million in 2008, to 18.4million for the present (medium) growth rate,and to just under 16.9 million for the low growthprojection, by 2026.
The analysis by the WSAA suggests that from2009 to 2026, total urban water consumed isprojected to increase by 49% (high growth,Series A), 42% (medium growth, Series B), and39% (low growth, Series C). The projected gapbetween the volume of water supplied in 2008/2009 and the increased volume of water neededis 735 GL (Series A), 631 GL (Series B), and581 GL (Series C).
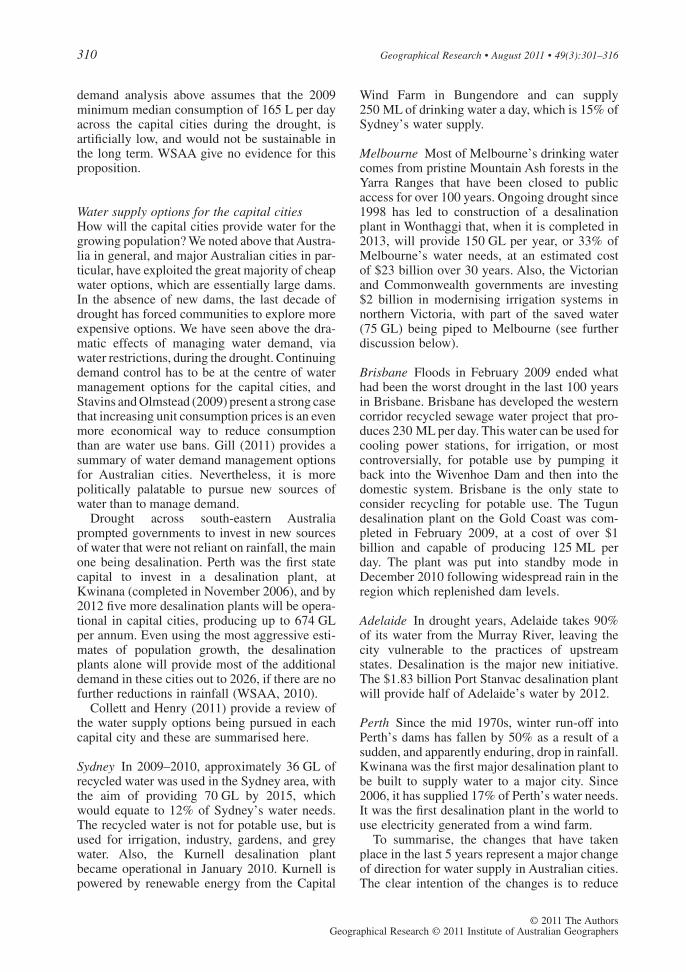
These projections have to be seen in thecontext of the dramatic decrease in water con-sumption that has occurred in Australian citiesduring the drought of the last decade. Per capitawater consumption, as measured by use frompublic water supply systems, has fallen by anaverage of 21% across the capital cities between2004 and 2009 (Table 5) and in the case ofSydney this followed a reduction of 25%between 1981 and 2001 (Smith, 1998). This isbecause of a combination of major water restric-
308 Geographical Research • August 2011 • 49(3):301–316
© 2011 The AuthorsGeographical Research © 2011 Institute of Australian Geographers
tions and voluntary restraint. Over the sameperiod, the average population of these citieshas grown by between 1.5% and 3% per year.Assuming an average of 2% growth per year, thisis a population growth rate of nearly 20% overthe period 2004–2009, which means that popu-lation has grown at about the same rate that waterconsumption has fallen.
Most spectacular has been the near halving ofwater consumption in Brisbane (48%), and thedrop by one quarter (26%) in Melbourne, andone-fifth in Adelaide (21%) (Table 5). It isnotable that these decreases were achievedentirely with demand reform, rather than via any
changes in price (England, 2009). The trendis even more spectacular when compared withthe peak consumption in the mid 1980s. Forexample, each person in Melbourne was usingnearly 500 L of water per day in 1985, comparedwith only 161 L per day in 2008. The obviousimplication of this analysis is that urban waterconsumption is remarkably elastic, and canaccommodate population increases, albeit atlower levels of security of supply. However, thedrought has also revealed the vulnerability of thewater supplies of the major cities, and promptedbuilding of new water supply infrastructure, thatis discussed below. Finally, note that the WSAA
0
500
Sydney
Balance
of
New South
Wale
s
Balance
of V
ictoria
Melb
ourne
Brisbane
Balance
of Q
ueensland
Adelaid
e
Balance
of S
outh A
ustra
liaPerth
Balance
of W
estern
Aust
ralia
Hobart
Balance
of T
asmania
Darwin
Balance
of N
orthern
Terri
tory
1000
1500
2000
2500
3000
3500
4000
4500
Po
pu
latio
n in
cre
ase
(’0
00
)
Balance of state
Capital cities
Figure 2 Projected population increase in Australia by 2056, for capital cities and for the balance of each state (Note: usesAustralian Bureau of Statistics Series (ABS) A, high-growth projection) (Source: compiled from ABS Population Projections,Australia, 2006 to 2101 ABS data series 3222.0, 2008).
Table 5 Residential water supplied per capita per year (‘000 of litres), and percentage decrease in consumption from 2004 to2009 (Source: WSAA, 2010, Table 2).
City 2003–2004 2004–2005 2005–2006 2006–2007 2007–2008 2008–2009 Decrease 2004to 2009 (%)
Canberra 97 94 104 95 76 79 19Sydney 83 78 75 74 68 74 11Brisbane 102 104 73 60 51 53 48Adelaide 105 101 101 102 84 83 21Melbourne 77 74 75 68 60 57 26Perth 111 107 105 110 104 106 5
I. Rutherfurd and B. Finlayson: Water as a Constraint on Australia’s Population 309
© 2011 The AuthorsGeographical Research © 2011 Institute of Australian Geographers
demand analysis above assumes that the 2009minimum median consumption of 165 L per dayacross the capital cities during the drought, isartificially low, and would not be sustainable inthe long term. WSAA give no evidence for thisproposition.
Water supply options for the capital citiesHow will the capital cities provide water for thegrowing population? We noted above that Austra-lia in general, and major Australian cities in par-ticular, have exploited the great majority of cheapwater options, which are essentially large dams.In the absence of new dams, the last decade ofdrought has forced communities to explore moreexpensive options. We have seen above the dra-matic effects of managing water demand, viawater restrictions, during the drought. Continuingdemand control has to be at the centre of watermanagement options for the capital cities, andStavins and Olmstead (2009) present a strong casethat increasing unit consumption prices is an evenmore economical way to reduce consumptionthan are water use bans. Gill (2011) provides asummary of water demand management optionsfor Australian cities. Nevertheless, it is morepolitically palatable to pursue new sources ofwater than to manage demand.
Drought across south-eastern Australiaprompted governments to invest in new sourcesof water that were not reliant on rainfall, the mainone being desalination. Perth was the first statecapital to invest in a desalination plant, atKwinana (completed in November 2006), and by2012 five more desalination plants will be opera-tional in capital cities, producing up to 674 GLper annum. Even using the most aggressive esti-mates of population growth, the desalinationplants alone will provide most of the additionaldemand in these cities out to 2026, if there are nofurther reductions in rainfall (WSAA, 2010).
Collett and Henry (2011) provide a review ofthe water supply options being pursued in eachcapital city and these are summarised here.
Sydney In 2009–2010, approximately 36 GL ofrecycled water was used in the Sydney area, withthe aim of providing 70 GL by 2015, whichwould equate to 12% of Sydney’s water needs.The recycled water is not for potable use, but isused for irrigation, industry, gardens, and greywater. Also, the Kurnell desalination plantbecame operational in January 2010. Kurnell ispowered by renewable energy from the Capital
Wind Farm in Bungendore and can supply250 ML of drinking water a day, which is 15% ofSydney’s water supply.
Melbourne Most of Melbourne’s drinking watercomes from pristine Mountain Ash forests in theYarra Ranges that have been closed to publicaccess for over 100 years. Ongoing drought since1998 has led to construction of a desalinationplant in Wonthaggi that, when it is completed in2013, will provide 150 GL per year, or 33% ofMelbourne’s water needs, at an estimated costof $23 billion over 30 years. Also, the Victorianand Commonwealth governments are investing$2 billion in modernising irrigation systems innorthern Victoria, with part of the saved water(75 GL) being piped to Melbourne (see furtherdiscussion below).
Brisbane Floods in February 2009 ended whathad been the worst drought in the last 100 yearsin Brisbane. Brisbane has developed the westerncorridor recycled sewage water project that pro-duces 230 ML per day. This water can be used forcooling power stations, for irrigation, or mostcontroversially, for potable use by pumping itback into the Wivenhoe Dam and then into thedomestic system. Brisbane is the only state toconsider recycling for potable use. The Tugundesalination plant on the Gold Coast was com-pleted in February 2009, at a cost of over $1billion and capable of producing 125 ML perday. The plant was put into standby mode inDecember 2010 following widespread rain in theregion which replenished dam levels.
Adelaide In drought years, Adelaide takes 90%of its water from the Murray River, leaving thecity vulnerable to the practices of upstreamstates. Desalination is the major new initiative.The $1.83 billion Port Stanvac desalination plantwill provide half of Adelaide’s water by 2012.
Perth Since the mid 1970s, winter run-off intoPerth’s dams has fallen by 50% as a result of asudden, and apparently enduring, drop in rainfall.Kwinana was the first major desalination plant tobe built to supply water to a major city. Since2006, it has supplied 17% of Perth’s water needs.It was the first desalination plant in the world touse electricity generated from a wind farm.
To summarise, the changes that have takenplace in the last 5 years represent a major changeof direction for water supply in Australian cities.The clear intention of the changes is to reduce
310 Geographical Research • August 2011 • 49(3):301–316
© 2011 The AuthorsGeographical Research © 2011 Institute of Australian Geographers
reliance on rain fed water supplies that are vul-nerable to drought and climate change, particu-larly though desalination. However, there arealso major programmes in recycling, and eventhe first forays into those two controversial areas:recycling sewage water back into the potablesupply; and direct competition between rural andurban water uses (WSAA, 2006). What has notyet been adequately utilised in any Australiancity is the water that the city creates for itself –stormwater.
A growing population creates its own waterIt is not often appreciated that a growing Austra-lian population, in a very real sense, creates itsown water – by increasing run-off, known asstormwater, and in the production of waste water.As already discussed, the great majority of popu-lation growth in Australia will take place incities, particularly the large capital cities. Most ofthat increasing population will eventually lead tothe construction of new dwellings and urbaninfrastructure. Thus:
In general, the pattern of new housingcompletions in each state and territory reflectsthe relative share of population growth overthe same period. States with the highest popu-lation growth recorded the highest number ofhousing completions, including an average of43 000 per year in New South Wales and36 100 in Queensland (ABS, 2005).
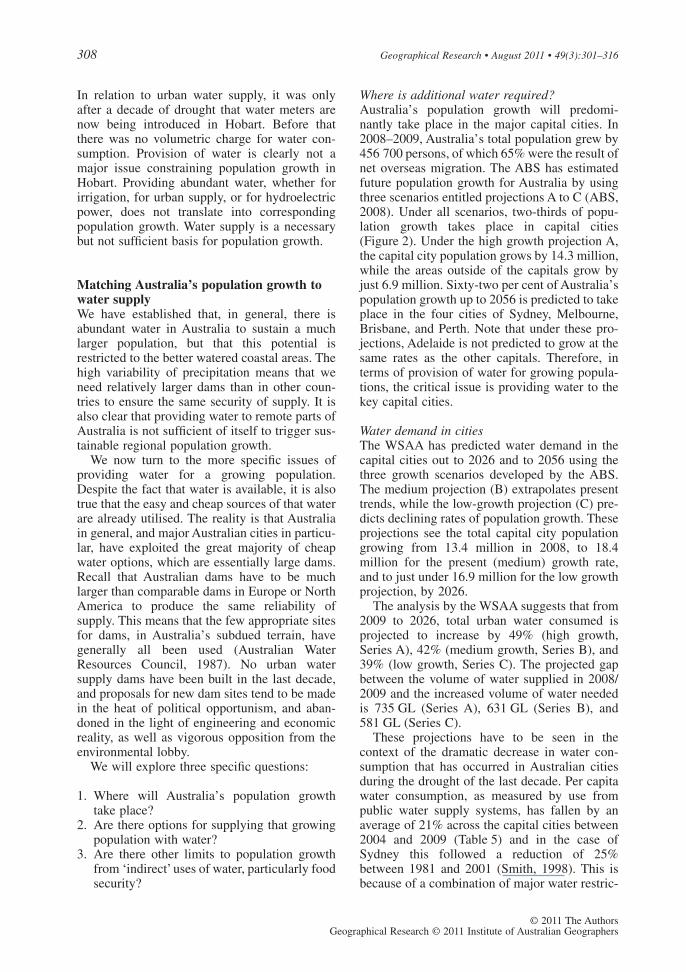
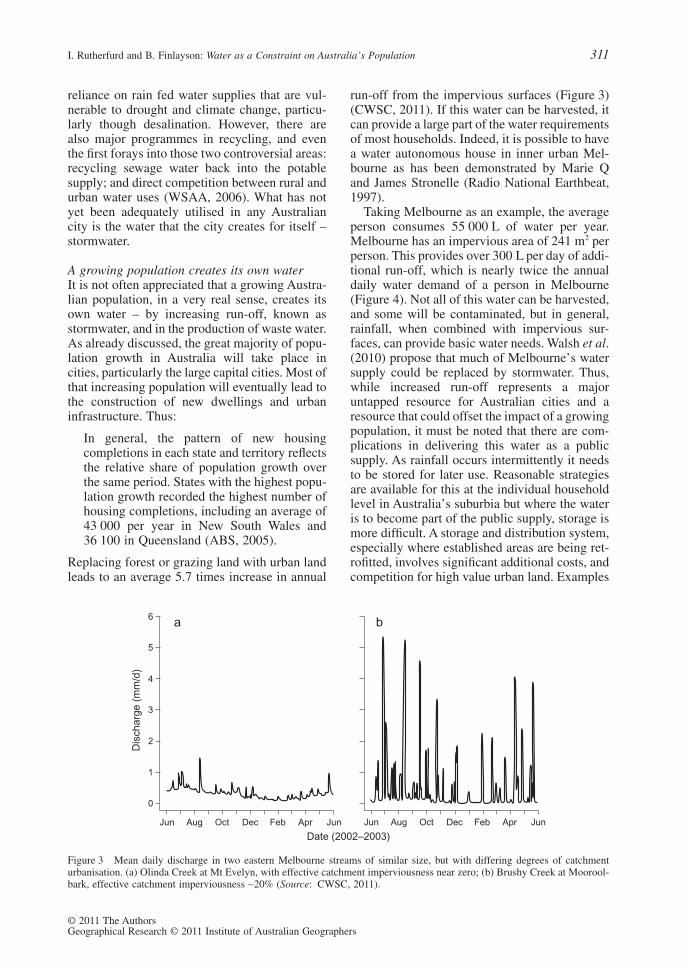
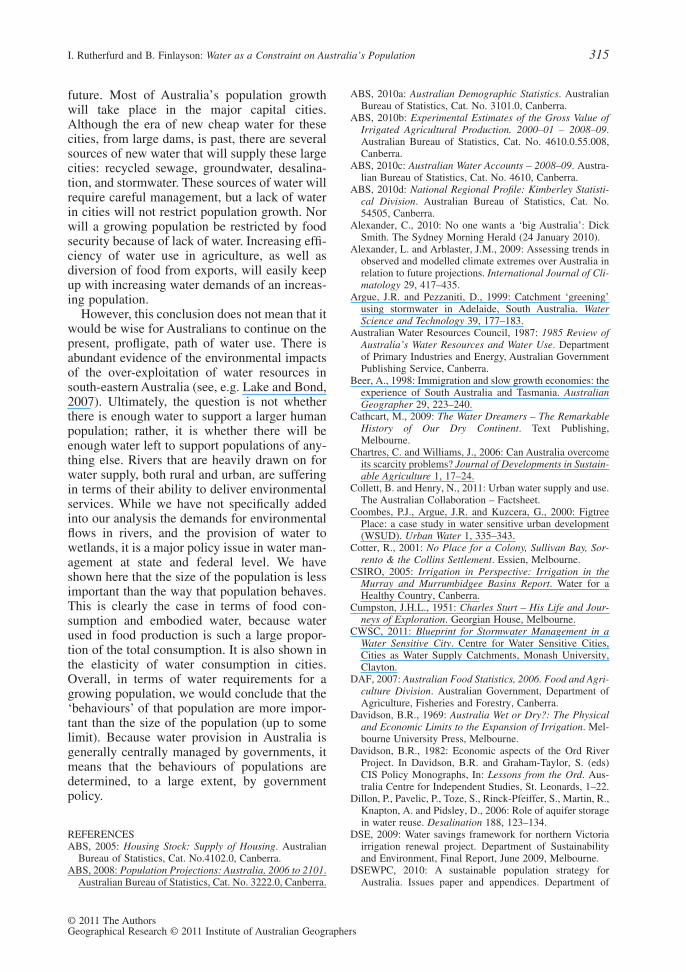
Replacing forest or grazing land with urban landleads to an average 5.7 times increase in annual
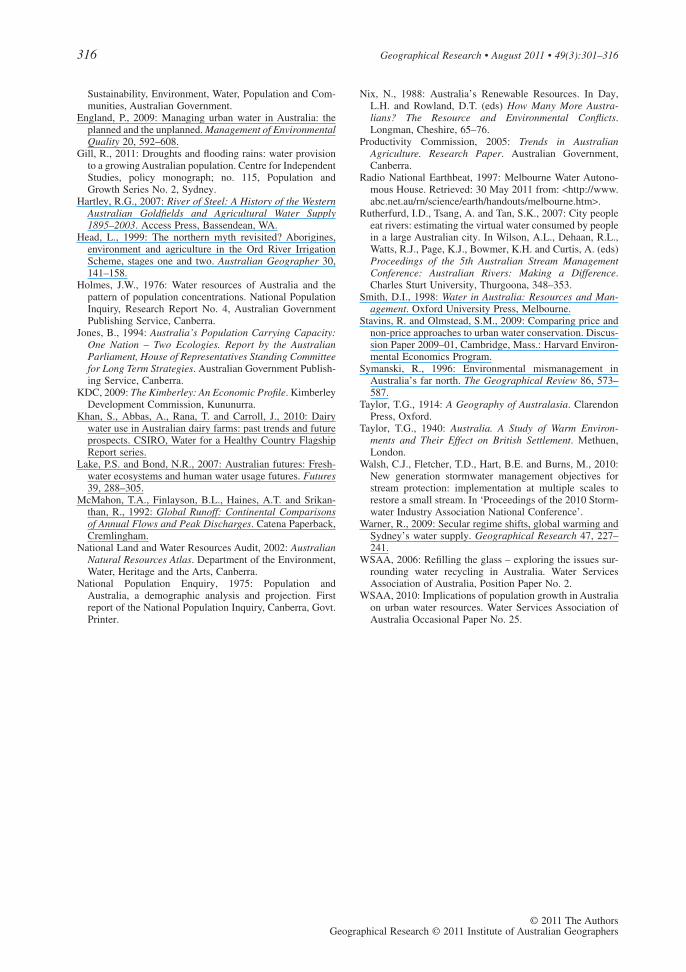
run-off from the impervious surfaces (Figure 3)(CWSC, 2011). If this water can be harvested, itcan provide a large part of the water requirementsof most households. Indeed, it is possible to havea water autonomous house in inner urban Mel-bourne as has been demonstrated by Marie Qand James Stronelle (Radio National Earthbeat,1997).
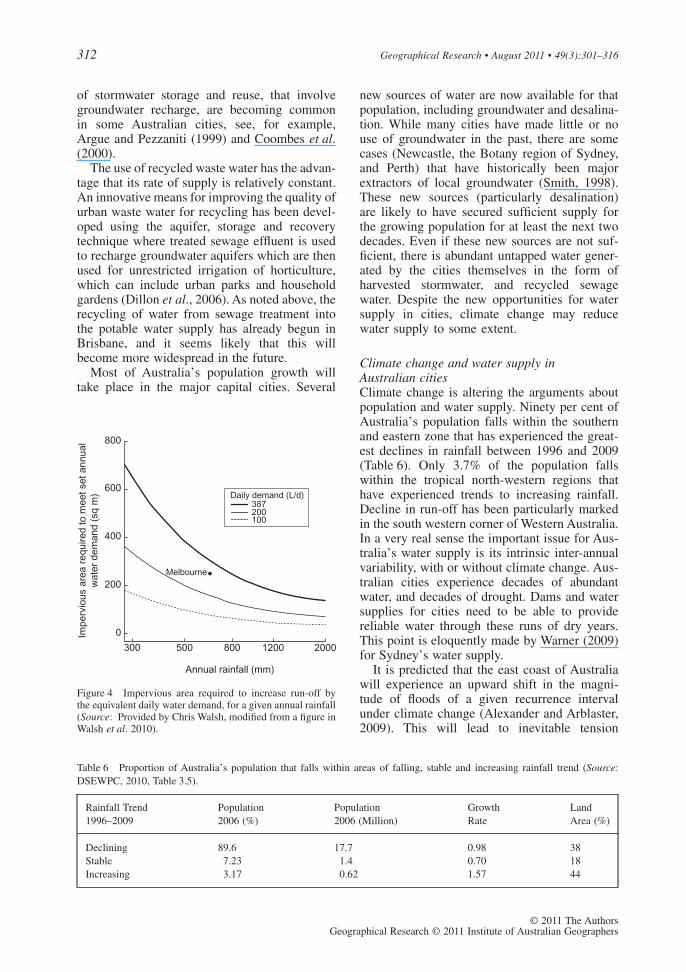
Taking Melbourne as an example, the averageperson consumes 55 000 L of water per year.Melbourne has an impervious area of 241 m2 perperson. This provides over 300 L per day of addi-tional run-off, which is nearly twice the annualdaily water demand of a person in Melbourne(Figure 4). Not all of this water can be harvested,and some will be contaminated, but in general,rainfall, when combined with impervious sur-faces, can provide basic water needs. Walsh et al.(2010) propose that much of Melbourne’s watersupply could be replaced by stormwater. Thus,while increased run-off represents a majoruntapped resource for Australian cities and aresource that could offset the impact of a growingpopulation, it must be noted that there are com-plications in delivering this water as a publicsupply. As rainfall occurs intermittently it needsto be stored for later use. Reasonable strategiesare available for this at the individual householdlevel in Australia’s suburbia but where the wateris to become part of the public supply, storage ismore difficult. A storage and distribution system,especially where established areas are being ret-rofitted, involves significant additional costs, andcompetition for high value urban land. Examples
Jun
0
1
2
3
4
5
6
Aug Oct Dec Feb Apr Jun Jun Aug Oct Dec Feb Apr Jun
Date (2002–2003)
Dis
ch
arg
e (
mm
/d)
a b
Figure 3 Mean daily discharge in two eastern Melbourne streams of similar size, but with differing degrees of catchmenturbanisation. (a) Olinda Creek at Mt Evelyn, with effective catchment imperviousness near zero; (b) Brushy Creek at Moorool-bark, effective catchment imperviousness ~20% (Source: CWSC, 2011).
I. Rutherfurd and B. Finlayson: Water as a Constraint on Australia’s Population 311
© 2011 The AuthorsGeographical Research © 2011 Institute of Australian Geographers
of stormwater storage and reuse, that involvegroundwater recharge, are becoming commonin some Australian cities, see, for example,Argue and Pezzaniti (1999) and Coombes et al.(2000).
The use of recycled waste water has the advan-tage that its rate of supply is relatively constant.An innovative means for improving the quality ofurban waste water for recycling has been devel-oped using the aquifer, storage and recoverytechnique where treated sewage effluent is usedto recharge groundwater aquifers which are thenused for unrestricted irrigation of horticulture,which can include urban parks and householdgardens (Dillon et al., 2006). As noted above, therecycling of water from sewage treatment intothe potable water supply has already begun inBrisbane, and it seems likely that this willbecome more widespread in the future.
Most of Australia’s population growth willtake place in the major capital cities. Several
new sources of water are now available for thatpopulation, including groundwater and desalina-tion. While many cities have made little or nouse of groundwater in the past, there are somecases (Newcastle, the Botany region of Sydney,and Perth) that have historically been majorextractors of local groundwater (Smith, 1998).These new sources (particularly desalination)are likely to have secured sufficient supply forthe growing population for at least the next twodecades. Even if these new sources are not suf-ficient, there is abundant untapped water gener-ated by the cities themselves in the form ofharvested stormwater, and recycled sewagewater. Despite the new opportunities for watersupply in cities, climate change may reducewater supply to some extent.
Climate change and water supply inAustralian citiesClimate change is altering the arguments aboutpopulation and water supply. Ninety per cent ofAustralia’s population falls within the southernand eastern zone that has experienced the great-est declines in rainfall between 1996 and 2009(Table 6). Only 3.7% of the population fallswithin the tropical north-western regions thathave experienced trends to increasing rainfall.Decline in run-off has been particularly markedin the south western corner of Western Australia.In a very real sense the important issue for Aus-tralia’s water supply is its intrinsic inter-annualvariability, with or without climate change. Aus-tralian cities experience decades of abundantwater, and decades of drought. Dams and watersupplies for cities need to be able to providereliable water through these runs of dry years.This point is eloquently made by Warner (2009)for Sydney’s water supply.
It is predicted that the east coast of Australiawill experience an upward shift in the magni-tude of floods of a given recurrence intervalunder climate change (Alexander and Arblaster,2009). This will lead to inevitable tension
300
0
200
400
600
800
500 800 1200 2000
Annual rainfall (mm)
Imperv
ious a
rea r
equired to m
eet set annual
wate
r dem
and (
sq m
)
Melbourne
100
387Daily demand (L/d)
200
Figure 4 Impervious area required to increase run-off bythe equivalent daily water demand, for a given annual rainfall(Source: Provided by Chris Walsh, modified from a figure inWalsh et al. 2010).
Table 6 Proportion of Australia’s population that falls within areas of falling, stable and increasing rainfall trend (Source:DSEWPC, 2010, Table 3.5).
Rainfall Trend1996–2009
Population2006 (%)
Population2006 (Million)
GrowthRate
LandArea (%)
Declining 89.6 17.7 0.98 38Stable 7.23 1.4 0.70 18Increasing 3.17 0.62 1.57 44
312 Geographical Research • August 2011 • 49(3):301–316
© 2011 The AuthorsGeographical Research © 2011 Institute of Australian Geographers
between storing water for use by cities, andleaving ‘air-space’ in dams for flood protection.The 2011 floods in Brisbane demonstrated thetension between water supply security and floodsecurity with the controversy over the operatorsnot releasing water from the Wivenhoe Damearly enough in the flood event. The result ofthis tension could be reduced storage permittedin dams, and reduced reliability of supply tocities.
Secondary water requirements fora growing populationSo far we have concentrated on the ‘primary’consumption of water by a growing population.A key issue here is the ‘water multiplier’. This isthe ‘full economy’ water use required to supporta citizen. How much water each new Australianrequires depends on the economic process thatsupports that person, which includes water forfood production, mining, industry and serviceindustries. Overall, the sort of economy that sup-ports each new Australian is a more importantfactor in our water future than is the efficiency ofwater use by individuals.
Many of these water requirements in theeconomy will accrue incrementally as new citi-zens appear. As soon as an immigrant arrivesthey will begin using water, although it willtake them several years to build their consump-tion to average Australian levels (they need tobuy a house with a garden to achieve theaverage!). Other water requirements will repre-sent threshold steps, as new infrastructure isrequired. Examples of thresholds would beadditional coal-fired power stations, whichrequire large volumes of water for cooling. Weknow that industry uses only a small proportionof water (Table 1), so here we will concentrateon agriculture, the major user of water in theeconomy.
Even if we have enough water for the primarywater requirements of growing populations incities (i.e. potable water and household water),will there be enough water to sustain the foodproduction that supports that population? Thereare some situations where there is direct com-petition between water for irrigation and waterfor potable consumption. These usually involveinterbasin transfers. The most notorious exampleis the competition between Adelaide’s watertransfer from the Murray River, and the irrigationneeds of the up-river states. The Thomson Damin Victoria is another example. That reservoirsupplies irrigation water to the Macalister Irriga-
tion District, but also stores nearly two-thirds ofMelbourne’s water supply, provided throughan interbasin transfer. In both of these cases,increasing urban populations will compete forwater with irrigators. It is likely that urban popu-lations will win most such arguments on groundsof capacity to pay and political leverage.Although there will be direct competitionbetween urban and irrigation water requirements,the larger question is whether there will be suf-ficient water to produce the food required by agrowing population.
We should not think of the ‘urban’ or ‘foodproduction’ questions as separate issues. Afterall, the main domestic consumers of food in Aus-tralia are the capital cities. It is well known thatmuch more water is consumed by urban residents‘embodied’ in their food than directly from theirtaps. For example, for every litre of water con-sumed directly in the average Melbourne house-hold, nine more litres are consumed indirectlythrough the water used to produce food (Ruther-furd et al., 2007). This is not surprising giventhat, in Victoria, 77% of water use is for irriga-tion, and only 17% is for urban and industrialuses (National Land and Water Resources Audit,2002). Therefore, it is reasonable to explorewhether a growing domestic population couldreduce food security.
Food security and waterAustralia’s population is growing by 1.7% peryear (ABS, 2010a). The question is whether foodproduction can keep pace with that populationgrowth given water supply options? There isgood evidence that the productivity of food pro-duction (i.e. the efficiency with which inputs areused to produce output) is more than keeping upwith population growth. Over the period 1974–1975 to 2003–2004 total agricultural outputincreased at an annual average rate of around2.4% (Productivity Commission, 2005). Thegross value of irrigated agricultural productionrepresents around a quarter (23%) of the grossvalue of agricultural commodities produced inAustralia in 2004–2005, on less than 1% of agri-cultural land (ABS, 2010b). Having enoughwater to supply food, for a population that isgrowing at the rate of 1–2% per year, is unlikelyto be a problem for two reasons: export substitu-tion and increasing irrigation efficiency.
Export substitution A large proportion of Aus-tralian food is exported (e.g. 50% of dairyproduction, 28% of grape production) (DAF,
I. Rutherfurd and B. Finlayson: Water as a Constraint on Australia’s Population 313
© 2011 The AuthorsGeographical Research © 2011 Institute of Australian Geographers
2007). These exports fluctuate dramatically fromyear to year and can simply be diverted to feeddemand from a growing domestic population.For example, in the last decade, dairy exportshave varied from 40% to 60% of production(ABS, 2010b). The oft-quoted figure is that Aus-tralia produces food to feed 20 million Austra-lians, and an additional 40 million people inother countries, through exports.
The important conclusion here is that waterconsumption, via food production (which, recall,is 90% of consumption through embodied water)is not driven by a growing domestic population,but by a fluctuating world market. Producersessentially produce as much as they can with theavailable water, and sell the balance to domesticor international markets. This means that con-sumption of water is not driven by Australia’spopulation, but by the total global pool ofconsumers.
Increasing irrigation efficiency Water use effi-ciency can improve at a faster rate than populationgrowth rates. That is, less water is required toproduce more food. Consider dairying as anexample. Khan et al. (2010) provide a compre-hensive review of the dairy industry in Australia.Dairy farming is the largest water-consumingindustry inAustralia, using approximately 25% ofthe surface irrigation water. At present, it takesabout 500–1666 L of irrigation water to produce1 L of milk (with most of this water going towardsgrowing pasture). The industry average yield is800 L of water per litre of milk. This means thatthere is potential to increase the efficiency ofwater use by about one-third (on average). Inaddition, during the drought years, there has beena strong trend to move dairy production awayfrom irrigated areas, to high-rainfall dryland areasthat do not require irrigation.
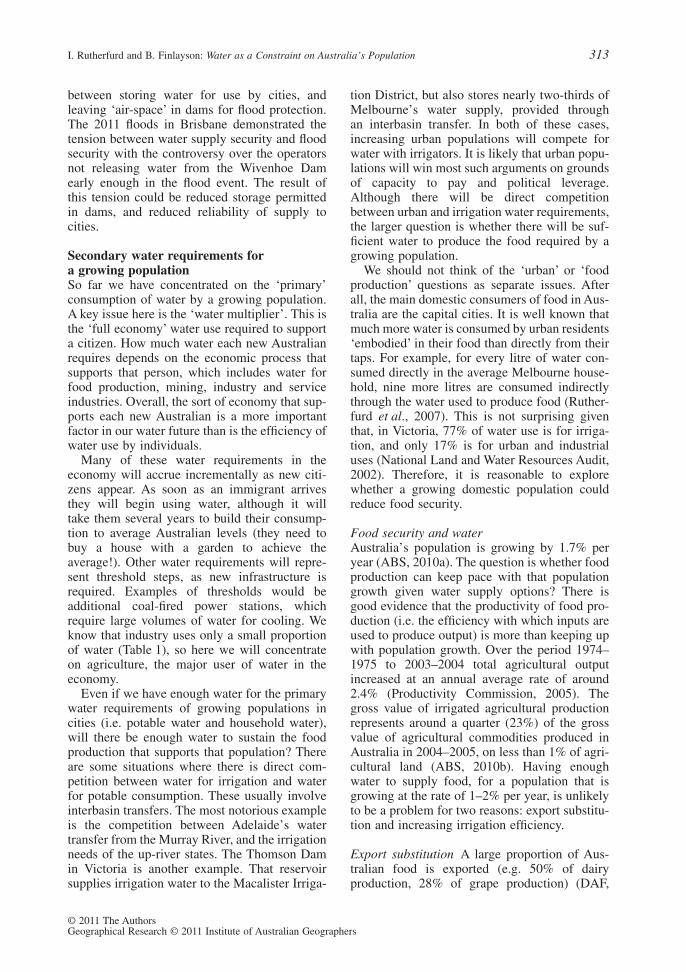
Another major opportunity for reducing agri-cultural water demand is to increase irrigationwater delivery efficiency to farms (i.e. lossesfrom channels, pipes and other parts of the waterdelivery system). Average delivery efficiency tothe irrigation property is 80% in the Murray-Darling system (Table 7). Considering all losses,Chartres and Williams (2006) estimate muchhigher losses, with only 36% of irrigation waterin the Murray-Darling Basin actually beingdelivered to plants. Major projects to increasewater delivery efficiency are already beingimplemented in northern Victoria. The GoulburnMurray Irrigation District suffers irrigation trans-mission losses of 30%. A major modernisation
programme is now being implemented (at a costof $1 billion for Stage 1) to reduce system lossesand then capture these as water savings (DSE,2009). Works include: automation of meteringand flow control structures; and lining and recon-structing the larger carrier and trunk channels.The goal is to capture 225 GL (long-termaverage) of water savings by 2013/2014. Thissaved water is to be shared equally between theenvironment, the Goulburn Murray IrrigationDistrict irrigators and Melbourne. The Mel-bourne component of the savings (75 GL) will bedelivered from the Goulburn River into the Yarracatchment as an interbasin transfer along thecontroversial North-South Pipeline. It is instruc-tive to note that one-third of Melbourne’s totalprojected water needs out to 2036 will be pro-vided from one-third of the losses from the irri-gation system. This provides a sense of therelative volumes of water used in the urban andirrigation sectors.
Thus, there will be rare situations where agrowing urban population will increasinglycompete directly for water with agriculturethrough interbasin transfers. The larger questionof whether there is sufficient water to producefood for the growing urban population is easilyanswered. Redirection of exports, and increasingwater-use efficiency, will easily maintain foodsupply to the projected growing population.
ConclusionWe have argued in this paper that there isadequate water in Australia to meet the needs ofthe present population and also the needs of anyrealistic projection of population in the near
Table 7 Estimated delivery efficiency of irrigation water tofarms in the Murray-Darling irrigation regions (Source:adapted from CSIRO, 2005, Table 3).
Irrigation Region Irrigation DeliveryEfficiency (%)
Upper Murrumbidgee 85Murrumbidgee 78Coleambally 80Upper Murray 85New South Wales Murray 76Goulburn Broken 75Loddon Campaspe 75Sunraysia 80Riverland 95Lower Murray 78Average 81
314 Geographical Research • August 2011 • 49(3):301–316
© 2011 The AuthorsGeographical Research © 2011 Institute of Australian Geographers
future. Most of Australia’s population growthwill take place in the major capital cities.Although the era of new cheap water for thesecities, from large dams, is past, there are severalsources of new water that will supply these largecities: recycled sewage, groundwater, desalina-tion, and stormwater. These sources of water willrequire careful management, but a lack of waterin cities will not restrict population growth. Norwill a growing population be restricted by foodsecurity because of lack of water. Increasing effi-ciency of water use in agriculture, as well asdiversion of food from exports, will easily keepup with increasing water demands of an increas-ing population.
However, this conclusion does not mean that itwould be wise for Australians to continue on thepresent, profligate, path of water use. There isabundant evidence of the environmental impactsof the over-exploitation of water resources insouth-eastern Australia (see, e.g. Lake and Bond,2007). Ultimately, the question is not whetherthere is enough water to support a larger humanpopulation; rather, it is whether there will beenough water left to support populations of any-thing else. Rivers that are heavily drawn on forwater supply, both rural and urban, are sufferingin terms of their ability to deliver environmentalservices. While we have not specifically addedinto our analysis the demands for environmentalflows in rivers, and the provision of water towetlands, it is a major policy issue in water man-agement at state and federal level. We haveshown here that the size of the population is lessimportant than the way that population behaves.This is clearly the case in terms of food con-sumption and embodied water, because waterused in food production is such a large propor-tion of the total consumption. It is also shown inthe elasticity of water consumption in cities.Overall, in terms of water requirements for agrowing population, we would conclude that the‘behaviours’ of that population are more impor-tant than the size of the population (up to somelimit). Because water provision in Australia isgenerally centrally managed by governments, itmeans that the behaviours of populations aredetermined, to a large extent, by governmentpolicy.
REFERENCESABS, 2005: Housing Stock: Supply of Housing. Australian
Bureau of Statistics, Cat. No.4102.0, Canberra.ABS, 2008: Population Projections: Australia, 2006 to 2101.
Australian Bureau of Statistics, Cat. No. 3222.0, Canberra.
ABS, 2010a: Australian Demographic Statistics. AustralianBureau of Statistics, Cat. No. 3101.0, Canberra.
ABS, 2010b: Experimental Estimates of the Gross Value ofIrrigated Agricultural Production. 2000–01 – 2008–09.Australian Bureau of Statistics, Cat. No. 4610.0.55.008,Canberra.
ABS, 2010c: Australian Water Accounts – 2008–09. Austra-lian Bureau of Statistics, Cat. No. 4610, Canberra.
ABS, 2010d: National Regional Profile: Kimberley Statisti-cal Division. Australian Bureau of Statistics, Cat. No.54505, Canberra.
Alexander, C., 2010: No one wants a ‘big Australia’: DickSmith. The Sydney Morning Herald (24 January 2010).
Alexander, L. and Arblaster, J.M., 2009: Assessing trends inobserved and modelled climate extremes over Australia inrelation to future projections. International Journal of Cli-matology 29, 417–435.
Argue, J.R. and Pezzaniti, D., 1999: Catchment ‘greening’using stormwater in Adelaide, South Australia. WaterScience and Technology 39, 177–183.
Australian Water Resources Council, 1987: 1985 Review ofAustralia’s Water Resources and Water Use. Departmentof Primary Industries and Energy, Australian GovernmentPublishing Service, Canberra.
Beer, A., 1998: Immigration and slow growth economies: theexperience of South Australia and Tasmania. AustralianGeographer 29, 223–240.
Cathcart, M., 2009: The Water Dreamers – The RemarkableHistory of Our Dry Continent. Text Publishing,Melbourne.
Chartres, C. and Williams, J., 2006: Can Australia overcomeits scarcity problems? Journal of Developments in Sustain-able Agriculture 1, 17–24.
Collett, B. and Henry, N., 2011: Urban water supply and use.The Australian Collaboration – Factsheet.
Coombes, P.J., Argue, J.R. and Kuzcera, G., 2000: FigtreePlace: a case study in water sensitive urban development(WSUD). Urban Water 1, 335–343.
Cotter, R., 2001: No Place for a Colony, Sullivan Bay, Sor-rento & the Collins Settlement. Essien, Melbourne.
CSIRO, 2005: Irrigation in Perspective: Irrigation in theMurray and Murrumbidgee Basins Report. Water for aHealthy Country, Canberra.
Cumpston, J.H.L., 1951: Charles Sturt – His Life and Jour-neys of Exploration. Georgian House, Melbourne.
CWSC, 2011: Blueprint for Stormwater Management in aWater Sensitive City. Centre for Water Sensitive Cities,Cities as Water Supply Catchments, Monash University,Clayton.
DAF, 2007: Australian Food Statistics, 2006. Food and Agri-culture Division. Australian Government, Department ofAgriculture, Fisheries and Forestry, Canberra.
Davidson, B.R., 1969: Australia Wet or Dry?: The Physicaland Economic Limits to the Expansion of Irrigation. Mel-bourne University Press, Melbourne.
Davidson, B.R., 1982: Economic aspects of the Ord RiverProject. In Davidson, B.R. and Graham-Taylor, S. (eds)CIS Policy Monographs, In: Lessons from the Ord. Aus-tralia Centre for Independent Studies, St. Leonards, 1–22.
Dillon, P., Pavelic, P., Toze, S., Rinck-Pfeiffer, S., Martin, R.,Knapton, A. and Pidsley, D., 2006: Role of aquifer storagein water reuse. Desalination 188, 123–134.
DSE, 2009: Water savings framework for northern Victoriairrigation renewal project. Department of Sustainabilityand Environment, Final Report, June 2009, Melbourne.
DSEWPC, 2010: A sustainable population strategy forAustralia. Issues paper and appendices. Department of
I. Rutherfurd and B. Finlayson: Water as a Constraint on Australia’s Population 315
© 2011 The AuthorsGeographical Research © 2011 Institute of Australian Geographers
Sustainability, Environment, Water, Population and Com-munities, Australian Government.
England, P., 2009: Managing urban water in Australia: theplanned and the unplanned. Management of EnvironmentalQuality 20, 592–608.
Gill, R., 2011: Droughts and flooding rains: water provisionto a growing Australian population. Centre for IndependentStudies, policy monograph; no. 115, Population andGrowth Series No. 2, Sydney.
Hartley, R.G., 2007: River of Steel: A History of the WesternAustralian Goldfields and Agricultural Water Supply1895–2003. Access Press, Bassendean, WA.
Head, L., 1999: The northern myth revisited? Aborigines,environment and agriculture in the Ord River IrrigationScheme, stages one and two. Australian Geographer 30,141–158.
Holmes, J.W., 1976: Water resources of Australia and thepattern of population concentrations. National PopulationInquiry, Research Report No. 4, Australian GovernmentPublishing Service, Canberra.
Jones, B., 1994: Australia’s Population Carrying Capacity:One Nation – Two Ecologies. Report by the AustralianParliament, House of Representatives Standing Committeefor Long Term Strategies. Australian Government Publish-ing Service, Canberra.
KDC, 2009: The Kimberley: An Economic Profile. KimberleyDevelopment Commission, Kununurra.
Khan, S., Abbas, A., Rana, T. and Carroll, J., 2010: Dairywater use in Australian dairy farms: past trends and futureprospects. CSIRO, Water for a Healthy Country FlagshipReport series.
Lake, P.S. and Bond, N.R., 2007: Australian futures: Fresh-water ecosystems and human water usage futures. Futures39, 288–305.
McMahon, T.A., Finlayson, B.L., Haines, A.T. and Srikan-than, R., 1992: Global Runoff: Continental Comparisonsof Annual Flows and Peak Discharges. Catena Paperback,Cremlingham.
National Land and Water Resources Audit, 2002: AustralianNatural Resources Atlas. Department of the Environment,Water, Heritage and the Arts, Canberra.
National Population Enquiry, 1975: Population andAustralia, a demographic analysis and projection. Firstreport of the National Population Inquiry, Canberra, Govt.Printer.
Nix, N., 1988: Australia’s Renewable Resources. In Day,L.H. and Rowland, D.T. (eds) How Many More Austra-lians? The Resource and Environmental Conflicts.Longman, Cheshire, 65–76.
Productivity Commission, 2005: Trends in AustralianAgriculture. Research Paper. Australian Government,Canberra.
Radio National Earthbeat, 1997: Melbourne Water Autono-mous House. Retrieved: 30 May 2011 from: <http://www.abc.net.au/rn/science/earth/handouts/melbourne.htm>.
Rutherfurd, I.D., Tsang, A. and Tan, S.K., 2007: City peopleeat rivers: estimating the virtual water consumed by peoplein a large Australian city. In Wilson, A.L., Dehaan, R.L.,Watts, R.J., Page, K.J., Bowmer, K.H. and Curtis, A. (eds)Proceedings of the 5th Australian Stream ManagementConference: Australian Rivers: Making a Difference.Charles Sturt University, Thurgoona, 348–353.
Smith, D.I., 1998: Water in Australia: Resources and Man-agement. Oxford University Press, Melbourne.
Stavins, R. and Olmstead, S.M., 2009: Comparing price andnon-price approaches to urban water conservation. Discus-sion Paper 2009–01, Cambridge, Mass.: Harvard Environ-mental Economics Program.
Symanski, R., 1996: Environmental mismanagement inAustralia’s far north. The Geographical Review 86, 573–587.
Taylor, T.G., 1914: A Geography of Australasia. ClarendonPress, Oxford.
Taylor, T.G., 1940: Australia. A Study of Warm Environ-ments and Their Effect on British Settlement. Methuen,London.
Walsh, C.J., Fletcher, T.D., Hart, B.E. and Burns, M., 2010:New generation stormwater management objectives forstream protection: implementation at multiple scales torestore a small stream. In ‘Proceedings of the 2010 Storm-water Industry Association National Conference’.
Warner, R., 2009: Secular regime shifts, global warming andSydney’s water supply. Geographical Research 47, 227–241.
WSAA, 2006: Refilling the glass – exploring the issues sur-rounding water recycling in Australia. Water ServicesAssociation of Australia, Position Paper No. 2.
WSAA, 2010: Implications of population growth in Australiaon urban water resources. Water Services Association ofAustralia Occasional Paper No. 25.
316 Geographical Research • August 2011 • 49(3):301–316
© 2011 The AuthorsGeographical Research © 2011 Institute of Australian Geographers
Related Documents