White-Matter Lesions Along the Cholinergic Tracts are Related to Cortical Sources of EEG Rhythms in Amnesic Mild Cognitive Impairment Claudio Babiloni, 1,2 Michela Pievani, 3 Fabrizio Vecchio, 3,4 Cristina Geroldi, 3 Fabrizio Eusebi, 5,6 Claudia Fracassi, 3 Evan Fletcher, 7 Charles De Carli, 7 Marina Boccardi, 3 Paolo Maria Rossini, 2,4,8 * and Giovanni B. Frisoni 3,4 1 Department of Biomedical Sciences, University of Foggia, Foggia, Italy 2 Casa di Cura San Raffaele Cassino and IRCCS San Raffaele Pisana, Rome, Italy 3 IRCCS ‘‘S. Giovanni di Dio-F.B.F.’’, Brescia, Italy 4 A.Fa.R., Dip. Neurosci. Osp. FBF; Isola Tiberina, Rome, Italy 5 Department of Physiology and Pharmacology, University of Roma Sapienza, Rome, Italy 6 IRCCS ‘‘Neuromed’’, Pozzilli (IS), Italy 7 Department of Neurology and Imaging of Dementia and Aging Laboratory, Center for Neuroscience, University of California at Davis, Sacramento, California 8 Clinical Neurology, University Campus Biomedico, Rome, Italy Abstract: Does impairment of cholinergic systems represent an important factor in the development of amnesic mild cognitive impairment (aMCI), as a preclinical stage of Alzheimer’s disease (AD)? Here we tested the hypothesis that electroencephalographic (EEG) rhythms, known to be modulated by the cholinergic system, may be particularly affected in aMCI patients with lesions along the cholinergic white-matter tracts. Eyes-closed resting EEG data were recorded in 28 healthy elderly (Nold) and 57 aMCI patients. Lesions along the cholinergic white-matter tracts were detected with fluid-attenuated inversion recovery sequences on magnetic resonance imaging. The estimation of the cholinergic lesion was performed with a validated semi-automatic algorithm pipeline after registration to a stereotactic template, image integration with stereotactic masks of the cholinergic tracts, and normalization to intra- cranial volume. The aMCI patients were divided into two groups of high (MCI Ch1; N 5 29; MMSE 5 26.2) and low cholinergic damage (MCI Ch2; N 5 28; MMSE 5 26.6). EEG rhythms of interest were delta (2–4 Hz), theta (4–8 Hz), alpha 1 (8–10.5 Hz), alpha 2 (10.5–13 Hz), beta 1 (13–20 Hz), and beta 2 (20–30 Hz). Cortical EEG generators were estimated by LORETA software. As main results, (i) power of occipital, parietal, temporal, and limbic alpha 1 sources was maximum in Nold, intermediate in MCI Ch2, and low in MCI Ch1 patients; (ii) the same trend was true in theta sources. These results are consistent with the hypothesis that damage to the cholinergic system is associated with alterations of EEG sources in aMCI subjects. Hum Brain Mapp 30:1431–1443, 2009. V V C 2008 Wiley-Liss, Inc. Key words: amnesic mild cognitive impairment (aMCI); Alzheimer’s disease (AD); electroencephalography (EEG); magnetic resonance imaging (MRI); white-matter vascular lesion; cholinergic system Contract grant sponsor: Fatebenefratelli Association for Biomedical Research (AFaR). *Correspondence to: Paolo Maria Rossini, IRCCS ‘‘S. Giovanni di Dio-F.B.F.’’, Brescia, Italy. E-mail: [email protected] Received for publication 30 November 2007; Revised 18 April 2008; Accepted 22 April 2008 DOI: 10.1002/hbm.20612 Published online 18 December 2008 in Wiley InterScience (www. interscience.wiley.com). V V C 2008 Wiley-Liss, Inc. r Human Brain Mapping 30:1431–1443 (2009) r

Welcome message from author
This document is posted to help you gain knowledge. Please leave a comment to let me know what you think about it! Share it to your friends and learn new things together.
Transcript
White-Matter Lesions Along the CholinergicTracts are Related to Cortical Sources of EEG
Rhythms in Amnesic Mild Cognitive Impairment
Claudio Babiloni,1,2 Michela Pievani,3 Fabrizio Vecchio,3,4 Cristina Geroldi,3
Fabrizio Eusebi,5,6 Claudia Fracassi,3 Evan Fletcher,7 Charles De Carli,7
Marina Boccardi,3 Paolo Maria Rossini,2,4,8* and Giovanni B. Frisoni3,4
1Department of Biomedical Sciences, University of Foggia, Foggia, Italy2Casa di Cura San Raffaele Cassino and IRCCS San Raffaele Pisana, Rome, Italy
3IRCCS ‘‘S. Giovanni di Dio-F.B.F.’’, Brescia, Italy4A.Fa.R., Dip. Neurosci. Osp. FBF; Isola Tiberina, Rome, Italy
5Department of Physiology and Pharmacology, University of Roma Sapienza, Rome, Italy6IRCCS ‘‘Neuromed’’, Pozzilli (IS), Italy
7Department of Neurology and Imaging of Dementia and Aging Laboratory, Center for Neuroscience,University of California at Davis, Sacramento, California
8Clinical Neurology, University Campus Biomedico, Rome, Italy
Abstract: Does impairment of cholinergic systems represent an important factor in the development ofamnesic mild cognitive impairment (aMCI), as a preclinical stage of Alzheimer’s disease (AD)? Herewe tested the hypothesis that electroencephalographic (EEG) rhythms, known to be modulated by thecholinergic system, may be particularly affected in aMCI patients with lesions along the cholinergicwhite-matter tracts. Eyes-closed resting EEG data were recorded in 28 healthy elderly (Nold) and 57aMCI patients. Lesions along the cholinergic white-matter tracts were detected with fluid-attenuatedinversion recovery sequences on magnetic resonance imaging. The estimation of the cholinergic lesionwas performed with a validated semi-automatic algorithm pipeline after registration to a stereotactictemplate, image integration with stereotactic masks of the cholinergic tracts, and normalization to intra-cranial volume. The aMCI patients were divided into two groups of high (MCI Ch1; N 5 29; MMSE5 26.2) and low cholinergic damage (MCI Ch2; N 5 28; MMSE 5 26.6). EEG rhythms of interest weredelta (2–4 Hz), theta (4–8 Hz), alpha 1 (8–10.5 Hz), alpha 2 (10.5–13 Hz), beta 1 (13–20 Hz), and beta 2(20–30 Hz). Cortical EEG generators were estimated by LORETA software. As main results, (i) powerof occipital, parietal, temporal, and limbic alpha 1 sources was maximum in Nold, intermediate in MCICh2, and low in MCI Ch1 patients; (ii) the same trend was true in theta sources. These results areconsistent with the hypothesis that damage to the cholinergic system is associated with alterations ofEEG sources in aMCI subjects. Hum Brain Mapp 30:1431–1443, 2009. VVC 2008 Wiley-Liss, Inc.
Key words: amnesic mild cognitive impairment (aMCI); Alzheimer’s disease (AD); electroencephalography(EEG); magnetic resonance imaging (MRI); white-matter vascular lesion; cholinergic system
Contract grant sponsor: Fatebenefratelli Association for BiomedicalResearch (AFaR).
*Correspondence to: Paolo Maria Rossini, IRCCS ‘‘S. Giovanni diDio-F.B.F.’’, Brescia, Italy. E-mail: [email protected]
Received for publication 30 November 2007; Revised 18 April2008; Accepted 22 April 2008
DOI: 10.1002/hbm.20612
Published online 18 December 2008 in Wiley InterScience (www.interscience.wiley.com).
VVC 2008 Wiley-Liss, Inc.
r Human Brain Mapping 30:1431–1443 (2009) r

INTRODUCTION
It has been shown that modifications of resting electro-encephalogram (EEG) across physiological aging inhumans points to gradual changes in EEG spectral poweras mainly represented by a pronounced amplitudedecrease of dominant EEG oscillations, namely rhythms inthe alpha range from 8 to 13 Hz [Hartikainen et al., 1992;Klass and Brenner, 1995; Klimesch, 1999; Markand, 1990;Pollock et al., 1990]. A recent study in a large sample ofhealthy subjects (N 5 185; 18–85 years) has confirmed anage-dependent power decrement of low-frequency alpharhythms (8–10.5 Hz) in parietal, occipital, and temporalregions [Babiloni et al., 2006a].Modifications of resting EEG can be observed not only
during physiological but also pathological aging. Whencompared to healthy elderly (Nold) subjects, Alzheimer’sdisease (AD) patients have been characterized by highpower of delta (0–4 Hz) and theta (4–7 Hz) rhythms, andlow power of posterior alpha (8–12 Hz) and/or beta (13–30 Hz) rhythms [Babiloni et al., 2004; Dierks et al., 2000;Jeong, 2004; Ponomareva et al., 2003; Koenig et al., 2005].These EEG abnormalities were associated with altered re-gional cerebral blood flow/metabolism and with impairedglobal cognitive function as evaluated by mini mental stateexamination [MMSE Jeong, 2004; Rodriguez et al., 1998,1999a,b; Sloan et al., 1995]. Furthermore, posterior alpharhythms showed a power decrement even in subjects withamnesic mild cognitive impairment (MCI), a clinical statebetween elderly normal cognition and AD in which sub-jects present objective evidence of memory decline in somecases together with other cognitive impairment [Babiloniet al., 2006b; Jelic et al., 2000; Koenig et al., 2005; Zappoliet al., 1995].With these data in mind, a logical question is ‘‘Which is
the physiological mechanism at the basis of alpha rhythmsdecrement in amnesic MCI and AD subjects?’’ It has beenreported that in AD patients, early pathological processesinclude loss of cholinergic basal forebrain neurons projec-ting to hippocampal and fronto-parietal areas, and thatalpha and slower EEG rhythms can be modulated by theseneurons [Helkala et al., 1996; Holschneider et al., 1999;Mesulam et al., 2004]. In contrast, brainstem cholinergicinnervation of the thalamus would be relatively spared inAD [Geula and Mesulam, 1989, 1996, 1999; Mesulam et al.,2004]. Furthermore, it has been reported the effect of acholinergic antagonist (i.e., scopolamine) on resting magne-toencephalograpic rhythms in normal subjects [Osipovaet al., 2003]. The cholinergic antagonist modulated thepower of alpha and theta rhythms and the coherence oftheta rhythms, mimicking the typical effects of AD onbrain rhythms of healthy subjects [Osipova et al., 2003].In our study, we tested the hypothesis that cortical sour-
ces of resting EEG alpha rhythms, which are affected byAD processes [Babiloni et al., 2004, 2006b], are related towhite-matter lesions of cholinergic routs in amnesic MCIsubjects.
METHODS
Subjects and Diagnostic Criteria
In this study, 57 amnesic MCI patients were enrolled.Furthermore, 28 cognitively normal elderly (Nold) subjectswere recruited as a control group. Part of the individualdata sets was used for previous EEG studies [Babiloni et al.,2004, 2006a,b,c,d,e,f] that did not deal with the evaluationof the relationships between cortical sources of EEG andwhite-matter vascular load (i.e., the present study issue).Local institutional ethics committees approved the
study. All experiments were performed with the informedand overt consent of each participant or caregiver, in linewith the Code of Ethics of the World Medical Association(Declaration of Helsinki) and the standards established bythe Author’s Institutional Review Board.The present inclusion and exclusion criteria for amnesic
MCI were based on previous seminal studies [Albert et al.,1991; Devanand et al., 1997; Flicker et al., 1991; Petersenet al., 1995, 1997, 2001; Portet et al., 2006; Rubin et al.,1989; Zaudig, 1992] defining elderly persons with objectivecognitive deficits, especially in the memory domain, whodid not meet criteria for a diagnosis of dementia. Theinclusion criteria were as follows: (i) objective memoryimpairment on neuropsychological evaluation, as definedby performances �1.5 standard deviation below the meanvalue of age and education-matched controls for a test bat-tery including Busckhe–Fuld and Memory Rey tests; (ii)normal activities of daily living as documented by the his-tory and evidence of independent living; and (iii) clinicaldementia rating score of 0.5. The exclusion criteriaincluded: (i) mild AD, as diagnosed by standard protocolsincluding NINCDS-ADRDA [McKhann et al., 1984];(ii) evidence of concomitant dementia such as frontotem-poral, vascular dementia, reversible dementias (includingpseudo-depressive dementia), fluctuations in cognitive per-formance, and/or features of mixed dementias; (iii) evi-dence of concomitant extra-pyramidal symptoms; (iv) clini-cal and indirect evidence of depression as revealed byGeriatric Depression Scale scores higher than 13; (v) otherpsychiatric diseases, epilepsy, drug addiction, alcohol de-pendence, and use of psychoactive drugs including acetyl-cholinesterase inhibitors or other drugs enhancing braincognitive functions; and (vi) current or previous uncon-trolled or complicated systemic diseases (including diabe-tes mellitus) or traumatic brain injuries. Of note, benzodia-zepines, antidepressant and/or antihypertensive drugswhen present, were withdrawn for about 24 h before theEEG recordings.The Nold subjects were recruited mostly among noncon-
sanguineous patients’ relatives. All Nold subjects under-went physical and neurological examinations as well ascognitive screening. Subjects affected by chronic systemicillnesses, those receiving psychoactive drugs, or with a his-tory of neurological or psychiatric disease were excluded.All Nold subjects had a GDS score lower than 14 (nodepression).
r Babiloni et al. r
r 1432 r

Magnetic Resonance Imaging
MRI scans were acquired with a 1.0 T Philips Gyroscan
at the Neuroradioloy Unit of the Citta di Brescia hospital,
Brescia. The following sequences were used to measure
white matter hyperintensity (WMH) volumes within the
cholinergic pathways: a high-resolution gradient echo T1-
weighted sagittal 3D sequence (TR 5 20 ms, TE 5 5 ms,flip angle 5 308, field of view 5 220 mm, acquisition ma-
trix 5 256 3 256, slice thickness 5 1.3 mm), and a fluid-
attenuated inversion recovery (FLAIR) sequence (TR 55,000 ms, TE 5 100 ms, flip angle 5 908, field of view 5230 mm, acquisition matrix 5 256 3 256, slice thickness
5 5 mm). The FLAIR images were used to segment
WMHs and the high-resolution sequences to register the
segmented WMHs to a stereotactic template.WMHs segmentation was performed using previously
described algorithms [De Carli et al., 2005]. Briefly, theprocedure includes (i) filtering of FLAIR images to excluderadiofrequency inhomogeneities, (ii) segmentation of braintissue from cerebrospinal fluid, (iii) modelling of brain in-tensity histogram as a Gaussian distribution, and (iv) clas-sification of the voxels whose intensities were >3.5 stand-ard deviations (SDs) above the mean as WMHs [DeCarliet al., 1995]. To place each subject’s WMHs map onto acommon template, a set of linear and nonlinear transfor-mations were applied with the protocol described in thefollowing. The FLAIR images were coregistered to thehigh-resolution T1 image using a nine-parameters affinetransformation [i.e., including rotation, translation, andscaling; Maes et al., 1997], and the same alignment param-eters were applied to the WMHs mask image created atthe previous step. T1 images were intensity corrected inorder to reduce adverse impact of the WMH voxel valueson the accuracy of the nonlinear warping algorithm. This
step involved estimating the normal white matter meanintensities surrounding the voxels classified as WMHs andreplacing voxels in the T1 image corresponding to WMHsby the estimated values. T1 intensity-corrected imageswere normalized onto a standard template by mean ofhigh-dimensional cubic B-spline warp [Otte, 2001]. Thetemplate image used in this study was created from theMRI scans of a population of 88 elderly subjects with amix of diagnoses distributed homogeneously (26 AD, 29MCI, and 33 normal), and was therefore the one minimiz-ing the amount of distortion necessary to nonlinearly alignindividual MRIs [Yoshita et al., 2005]. The parameterscomputed from nonlinear warping were then used towarp each subject’s FLAIR image and WMHs mask ontothe template [DeCarli et al., 2005]. At the end of the pro-cess, anatomical regions are accurately matched betweensubjects, and WMH voxels are in locations analogous totheir original locations in the subjects’ image.Regions of interest (ROIs) located along the corticopetal
cholinergic tracts were manually traced on the templatebased on published immunohistochemical tracings of themedial and lateral cholinergic pathways in human brains[Selden et al., 1998]. The medial pathway originates from thenucleus basalis of Meynert, supplies the orbitofrontal cortex,courses along the cingulate gyri, and enters the retrosplenialcortices. The lateral pathway branches were subdivided intoa perisylvian component, traveling within the claustrum tosupply the opercular and insular cortices, and a capsularcomponent traveling adjacent to the putamen and within theexternal capsule to supply the remaining cortical areas[Selden et al., 1998]. Figure 1 illustrates these pathways.The volume of WMHs within the cholinergic pathways
was computed by counting the number of voxels segmentedas WMHs in the defined ROIs, and multiplying that num-ber by voxel size (1.44 mm3). Group differences within the
Figure 1.
The trajectories of the cholinergic pathways superimposed onto
the MRI scan of the template. (a) Midsagittal, (b) axial and (c)
coronal views of the tracing of the pathways. The medial path-
way, shown in green, originates from the nucleus basalis of Mey-
nert and travels within the cingulum to supply the orbitofrontal,
subcallosal, cingulate and retrosplenial cortices (a). The perisyl-
vian lateral pathway courses within the claustrum to supply the
opercular and insular cortices (b,c) and is represented in yellow.
The capsular lateral pathway, shown in red, travels into the exter-
nale capsule and uncinate fasciculus (b,c) to supply the frontopari-
etal cortex, the middle and inferior temporal gyri, the inferotem-
poral cortex and the parahippocampal gyrus [Selden et al., 1998].
[Color figure can be viewed in the online issue, which is available
at www.interscience.wiley.com.]
r White-Matter Vascular Lesion and EEG in MCI r
r 1433 r
cholinergic pathways were compared as a percentage of thesize of each ROI. Voxels segmented as WMHs and outsidethe ROIs were classified as noncholinergic.
Composition of MCI Patient Groups
The amnesic MCI patients were divided into two sub-groups of high and low cholinergic lesion load, based onthe 50th percentile of the distribution of WMH volumewithin the cholinergic tracts: namely, 29 subjects with lowand 28 subjects with high degree of cholinergic lesion load(MCI Ch2 and MCI Ch1); the lesion threshold separatingthe two groups was set to 6.5 mm3. Noteworthy, the twosub-groups of amnesic MCI patients were comparable fordemographic and clinical features. Table I summarizes therelevant demographic and clinical data of Nold, MCI Ch2and MCI Ch1 participants. The subjects’ age, education,and gender were used as covariates in the statistical evalu-ation of the cortical sources of EEG rhythms, to removepossible confounding effects.
EEG Recordings
The EEG data were recorded by specialized clinical unitsin the Nold, MCI Ch2 and MCI Ch1 subjects at resting state(eyes-closed). The EEG recordings were performed (0.3–70Hz bandpass; cephalic reference) from 19 electrodes posi-tioned according to the International 10–20 System (i.e. Fp1,Fp2, F7, F3, Fz, F4, F8, T3, C3, Cz, C4, T4, T5, P3, Pz, P4, T6,O1, O2). To monitor eye movements, the horizontal and ver-tical electrooculogram (0.3–70 Hz bandpass) was also col-lected. All data were digitized in continuous recording mode(5 min of EEG; 128–256 Hz sampling rate). The recordingswere performed in the late morning. To keep constant thelevel of vigilance, an experimenter controlled on-line the sub-ject and the EEG traces. He verbally alerted the subject anytime there were signs of behavioral (i.e., neck muscle relaxa-tion) and/or EEG (i.e., slowing) drowsiness and/or sleeping.Of note, the duration of the EEG recording (5 min)
allowed the comparison of the present results with severalprevious AD studies using either EEG recording periodsshorter than 5 min [Babiloni et al. 2004, 2006a,b,c,d; Pucciet al., 1999; Rodriguez et al., 2002; Szelies et al., 1999] or
about 1 min [Dierks et al., 2000]; longer epochs wouldhave reduced data variability but increased risks for drop-ping vigilance and arousal.The recorded EEG data were analyzed and fragmented
off-line in consecutive epochs of 2 s. The EEG epochs withocular, muscular, and other types of artifact were prelimi-narily identified by a computerized automatic procedure.The EEG epochs with sporadic blinking artifacts (less than10% of the total) were corrected by an autoregressivemethod [Moretti et al., 2003]. Two independent experi-menters blind to the diagnosis manually confirmed theEEG segments accepted for further analysis.
Spectral Analysis of the EEG Data
The digital FFT-based power spectrum analysis (Welchtechnique, Hanning windowing function, no phase shift)was evaluated in order to calculate the individual alphafrequency (IAF) peak, defined as the frequency associatedwith the strongest EEG power at the extended alpha range[Klimesch, 1999]. Mean IAF peak was 9.3 Hz (60.2 stand-ard error, SE) in the Nold subjects, 9.1 Hz (60.2 SE) in theMCI Ch2 subjects, and 9.0 Hz (60.2 SE) in the MCI Ch1subjects. To control for the effect of IAF on the EEG com-parisons between these three groups, the IAF peak wasused as a covariate (together with age, education and gen-der) for further statistics.The standard frequency bands of interest were delta (2–
4 Hz), theta (4–8 Hz), alpha 1 (8–10.5 Hz), alpha 2 (10.5–13Hz), beta 1 (13–20 Hz), beta 2 (20–30 Hz), and gamma (30–40 Hz). Choice of the fixed EEG bands did not account forIAF peak. However, this should not affect the results, sincemore than 90% of the subjects had IAF peaks within thealpha 1 band (8–10.5 Hz), and IAF peak was used as acovariate in the statistical analysis.
Cortical Source Analysis of the EEG
Rhythms by LORETA
Low resolution electromagnetic source tomography(LORETA) was used for the estimation of cortical sourcesof resting EEG power [version available at http://www.unizh.ch/keyinst/NewLORETA/LORETA01.htm; Pascual-
TABLE I. Demographic and neuropsychological data of healthy elderly (Nold) and amnesic mild cognitive
impairment (MCI) subjects
MCI C1 MCI C2 Nold
N 28 29 28Age (years) 77 (6 1.0 SE) 73 (6 1.5 SE) 73.2 (61.2 SE)Education (years) 8 (6 0.6 SE) 8 (6 0.8 SE) 8.2 (6 0.8 SE)Gender (M/F) 12/16 14/15 12/16MMSE 26.6 (6 0.3 SE) 26.2 (6 0.3 SE) 28.4 (6 0.2 SE)ApoE4 (%) 28 38 —Lesion of cholinergic white matter (cm3) 0.933 (6 0.180 SE) 0.027 (6 0.005 SE) —
Of note, the MCI group was divided in two sub-groups: the MCI subjects with low degree of cholinergic lesion (MCI Ch2, cholinergiclesional load <0.0065) and MCI subjects with high degree of cholinergic lesion (MCI Ch1, cholinergic lesional load >0.0065).
r Babiloni et al. r
r 1434 r
Marqui and Michel, 1994, Pascual-Marqui et al., 1999,2002]. LORETA is a functional imaging technique belong-ing to a family of linear inverse solution procedures[Valdes et al., 1998] modeling 3D distributions of EEGcortical sources [Pascual-Marqui et al., 2002]. With respectto the moving equivalent current dipole modeling of EEGcortical sources, no a priori decision on dipole startingposition and number is required by the investigators usingLORETA. In a previous review paper, it has been shownthat LORETA is quite efficient when compared to otherlinear inverse algorithms like minimum norm solution,weighted minimum norm solution or weighted resolutionoptimization [Pascual-Marqui et al., 1999; Phillips et al.,2002; Yao and He, 2001]. Finally, LORETA has been suc-cessfully used in recent EEG studies on pathological brainaging [Babiloni et al., 2004, 2006a,b,c,d,e; Dierks et al.,2000].LORETA computes 3D linear solutions (LORETA solu-
tions) for the EEG inverse problem within a three-shellspherical head model including scalp, skull, and braincompartments. The brain compartment is restricted to thecortical gray matter/hippocampus of a head model core-gistered to the Talairach probability brain atlas and digi-tized at the Brain Imaging Center of the Montreal Neuro-logical Institute [Talairach and Tournoux, 1988]. This com-partment includes 2,394 voxels (7 mm resolution), eachvoxel containing an equivalent current dipole.LORETA can be used from EEG data collected by low
spatial sampling of 10–20 system (19 electrodes) whencortical sources are estimated from resting EEG rhythms,since these rhythms are generated by largely distributedcortical sources that can be accurately investigated by thisway [Anderer et al., 2000, 2003, 2004; Babiloni et al., 2004,2006a,b,c,d,e; Laufer and Pratt, 2003a,b; Mulert et al., 2001;Veiga et al., 2003; Winterer et al., 2001]. LORETA solutionsconsisted of voxel current density values able to predictEEG spectral power density at scalp electrodes; notewor-thy, these solutions are reference-free, in that one obtainsthe same LORETA source distribution for EEG data refer-enced to any reference electrode including common aver-age. A normalization of the data was obtained by normal-izing the LORETA current density at each voxel with thepower density averaged across all frequencies (0.5–45 Hz)and across all 2,394 voxels of the brain volume. After thenormalization, the solutions lost the original physicaldimension and were represented by an arbitrary unit scale.This has been successfully used in previous EEG studies.The general procedure fitted the LORETA solutions in aGaussian distribution and reduced inter-subject variability[Babiloni et al., 2004, 2006a,b,c,d,e; Leuchter et al., 1993;Nuwer, 1988]. Other methods of normalization using theprincipal component analysis are effective for estimatingthe subjective global factor scale of the EEG data [Her-nandez et al., 1994]. These methods are not available in theLORETA package, so they were not used in our study.Solutions of the EEG inverse problem are under-deter-
mined and ill conditioned when the number of spatial
samples (electrodes) is lower than that of the unknownsamples (current density at each voxel). To properlyaddress this problem, the cortical LORETA solutions pre-dicting scalp EEG spectral power density were regularizedto estimate distributed rather than punctual EEG sourcepatterns [Pascual-Marqui and Michel, 1994, Pascual-Mar-qui et al., 1999, 2002]. In line with the low spatial resolu-tion of the adopted technique, we used customized MAT-LAB software to collapse the voxels of LORETA solutionsat frontal, central, parietal, occipital, temporal, and limbicregions of the brain model coded into Talairach space. TheBrodmann areas listed in Table II formed each of theseROIs.Finally, the main advantage of the regional analysis of
LORETA solutions-using an explicit source model coregis-tered into Talairach space-was that our modeling coulddisentangle rhythms of contiguous cortical areas (namelyEEG rhythms from the occipital source were disentangledwith respect to those of the contiguous parietal and tempo-ral sources, etc).
Statistical Analysis of the LORETA Solutions
The main statistical analysis aimed at evaluating theworking hypothesis that cortical sources of alpha rhythmsshow difference in amplitude among Nold, MCI Ch2, andMCI Ch1 subjects, because of their dependence by thefunctional integrity of cholinergic tracts. To this aim, theregional normalized LORETA solutions from Nold, MCICh2, and MCI Ch1 subjects were used as an input forANOVA analysis. Subjects’ age, education, gender andIAF peak served as covariates. Mauchly’s test evaluatedthe sphericity assumption. Correction of the degrees offreedom was made with the Greenhouse-Geisser proce-dure. The ANOVA analysis used the factors Group (Nold,MCI Ch2, MCI Ch1; independent variable), Band (delta,theta, alpha 1, alpha 2, beta 1, beta 2, gamma), and ROI(central, frontal, parietal, occipital, temporal, limbic). Thehypothesis would be confirmed by the following two sta-tistical results: (i) a statistical ANOVA effect including thefactor Group (P < 0.05) and (ii) a post hoc test indicatingstatistically significant differences of the (LORETA) alphasources with the pattern Nold = MCI Ch2 = MCI Ch1(Duncan test, P < 0.05).
TABLE II. Brodmann areas included in the cortical
regions of interest (ROIs) of the present study
Frontal 8, 9, 10, 11, 44, 45, 46, 47Central 1, 2, 3, 4, 6Parietal 5, 7, 30, 39, 40, 43Temporal 20, 21, 22, 37, 38, 41, 42Occipital 17, 18, 19Limbic 31, 32, 33, 34, 35, 36
LORETA solutions were collapsed in frontal, central, parietal, occi-pital, temporal, and limbic ROIs.
r White-Matter Vascular Lesion and EEG in MCI r
r 1435 r
To avoid that the statistical results were emphasize bythe presence of the Nold group, we also performed a sta-tistical control analysis restricted to the two MCI sub-groups.
RESULTS
Topography of the EEG Cortical Sources as
Estimated by LORETA
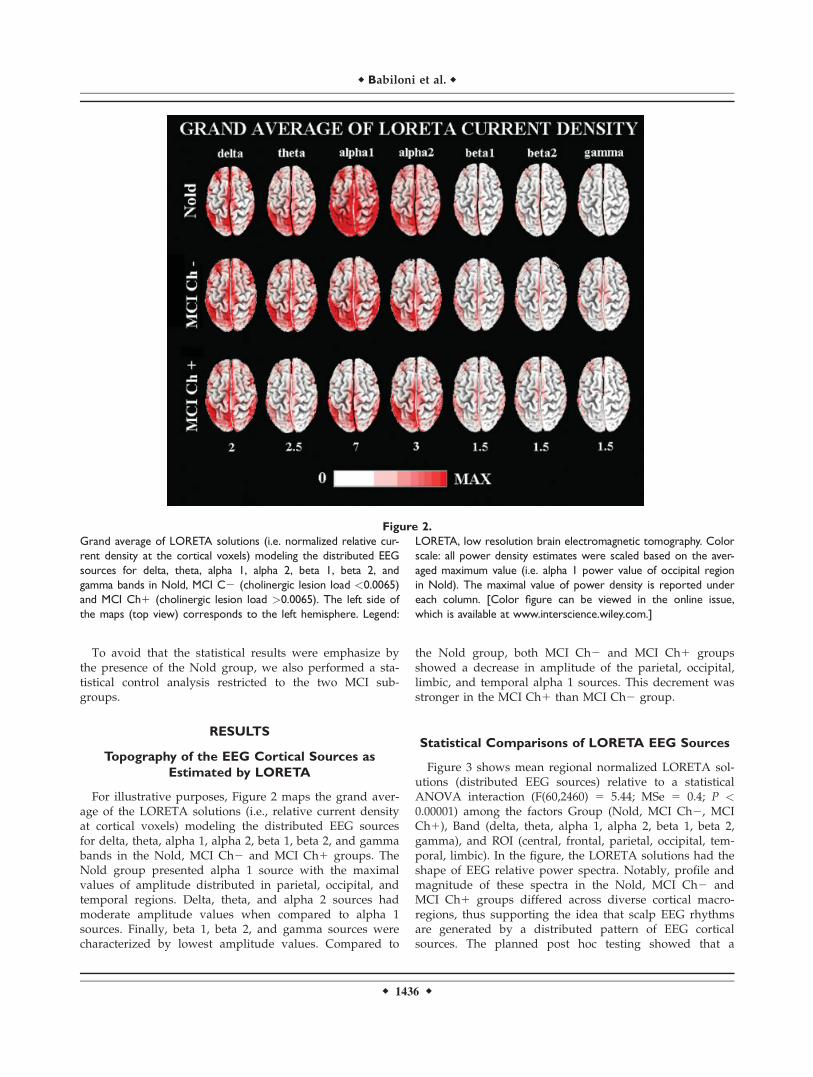
For illustrative purposes, Figure 2 maps the grand aver-age of the LORETA solutions (i.e., relative current densityat cortical voxels) modeling the distributed EEG sourcesfor delta, theta, alpha 1, alpha 2, beta 1, beta 2, and gammabands in the Nold, MCI Ch2 and MCI Ch1 groups. TheNold group presented alpha 1 source with the maximalvalues of amplitude distributed in parietal, occipital, andtemporal regions. Delta, theta, and alpha 2 sources hadmoderate amplitude values when compared to alpha 1sources. Finally, beta 1, beta 2, and gamma sources werecharacterized by lowest amplitude values. Compared to
the Nold group, both MCI Ch2 and MCI Ch1 groupsshowed a decrease in amplitude of the parietal, occipital,limbic, and temporal alpha 1 sources. This decrement wasstronger in the MCI Ch1 than MCI Ch2 group.
Statistical Comparisons of LORETA EEG Sources
Figure 3 shows mean regional normalized LORETA sol-utions (distributed EEG sources) relative to a statisticalANOVA interaction (F(60,2460) 5 5.44; MSe 5 0.4; P <0.00001) among the factors Group (Nold, MCI Ch2, MCICh1), Band (delta, theta, alpha 1, alpha 2, beta 1, beta 2,gamma), and ROI (central, frontal, parietal, occipital, tem-poral, limbic). In the figure, the LORETA solutions had theshape of EEG relative power spectra. Notably, profile andmagnitude of these spectra in the Nold, MCI Ch2 andMCI Ch1 groups differed across diverse cortical macro-regions, thus supporting the idea that scalp EEG rhythmsare generated by a distributed pattern of EEG corticalsources. The planned post hoc testing showed that a
Figure 2.
Grand average of LORETA solutions (i.e. normalized relative cur-
rent density at the cortical voxels) modeling the distributed EEG
sources for delta, theta, alpha 1, alpha 2, beta 1, beta 2, and
gamma bands in Nold, MCI C2 (cholinergic lesion load <0.0065)
and MCI Ch1 (cholinergic lesion load >0.0065). The left side of
the maps (top view) corresponds to the left hemisphere. Legend:
LORETA, low resolution brain electromagnetic tomography. Color
scale: all power density estimates were scaled based on the aver-
aged maximum value (i.e. alpha 1 power value of occipital region
in Nold). The maximal value of power density is reported under
each column. [Color figure can be viewed in the online issue,
which is available at www.interscience.wiley.com.]
r Babiloni et al. r
r 1436 r
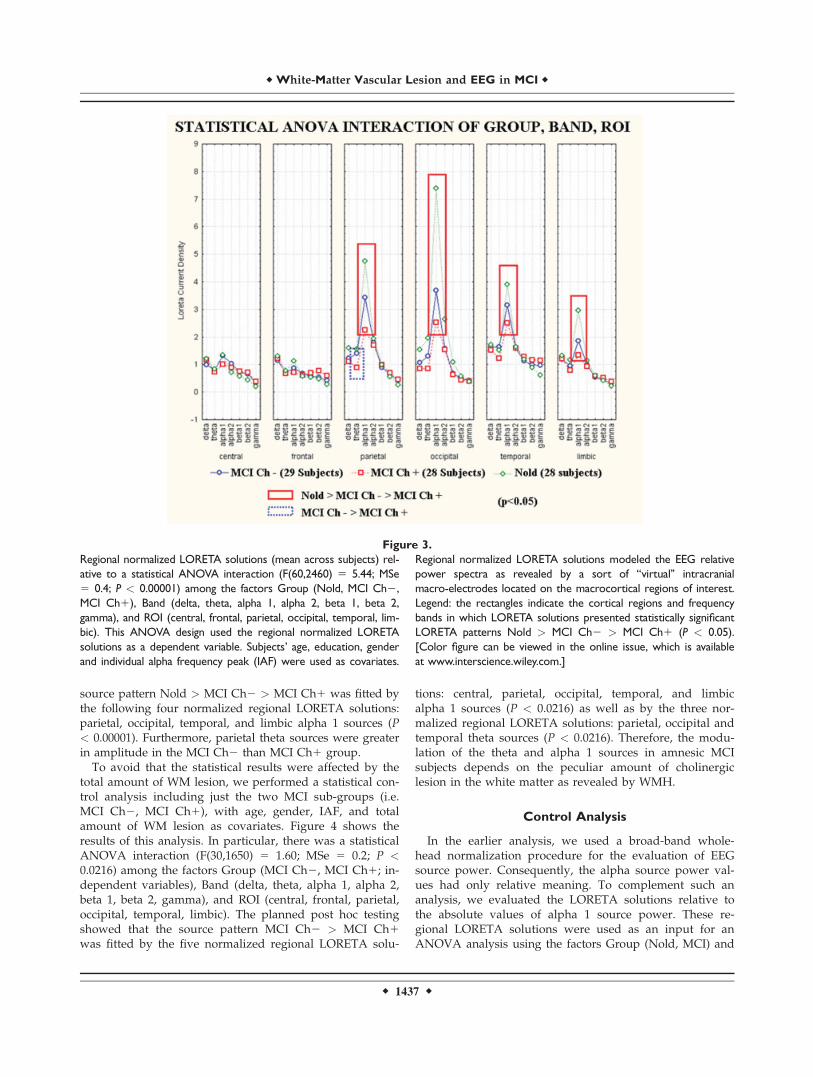
source pattern Nold > MCI Ch2 > MCI Ch1 was fitted bythe following four normalized regional LORETA solutions:parietal, occipital, temporal, and limbic alpha 1 sources (P< 0.00001). Furthermore, parietal theta sources were greaterin amplitude in the MCI Ch2 than MCI Ch1 group.To avoid that the statistical results were affected by the
total amount of WM lesion, we performed a statistical con-trol analysis including just the two MCI sub-groups (i.e.MCI Ch2, MCI Ch1), with age, gender, IAF, and totalamount of WM lesion as covariates. Figure 4 shows theresults of this analysis. In particular, there was a statisticalANOVA interaction (F(30,1650) 5 1.60; MSe 5 0.2; P <0.0216) among the factors Group (MCI Ch2, MCI Ch1; in-dependent variables), Band (delta, theta, alpha 1, alpha 2,beta 1, beta 2, gamma), and ROI (central, frontal, parietal,occipital, temporal, limbic). The planned post hoc testingshowed that the source pattern MCI Ch2 > MCI Ch1was fitted by the five normalized regional LORETA solu-
tions: central, parietal, occipital, temporal, and limbicalpha 1 sources (P < 0.0216) as well as by the three nor-malized regional LORETA solutions: parietal, occipital andtemporal theta sources (P < 0.0216). Therefore, the modu-lation of the theta and alpha 1 sources in amnesic MCIsubjects depends on the peculiar amount of cholinergiclesion in the white matter as revealed by WMH.
Control Analysis
In the earlier analysis, we used a broad-band whole-head normalization procedure for the evaluation of EEGsource power. Consequently, the alpha source power val-ues had only relative meaning. To complement such ananalysis, we evaluated the LORETA solutions relative tothe absolute values of alpha 1 source power. These re-gional LORETA solutions were used as an input for anANOVA analysis using the factors Group (Nold, MCI) and
Figure 3.
Regional normalized LORETA solutions (mean across subjects) rel-
ative to a statistical ANOVA interaction (F(60,2460) 5 5.44; MSe
5 0.4; P < 0.00001) among the factors Group (Nold, MCI Ch2,
MCI Ch1), Band (delta, theta, alpha 1, alpha 2, beta 1, beta 2,
gamma), and ROI (central, frontal, parietal, occipital, temporal, lim-
bic). This ANOVA design used the regional normalized LORETA
solutions as a dependent variable. Subjects’ age, education, gender
and individual alpha frequency peak (IAF) were used as covariates.
Regional normalized LORETA solutions modeled the EEG relative
power spectra as revealed by a sort of ‘‘virtual’’ intracranial
macro-electrodes located on the macrocortical regions of interest.
Legend: the rectangles indicate the cortical regions and frequency
bands in which LORETA solutions presented statistically significant
LORETA patterns Nold > MCI Ch2 > MCI Ch1 (P < 0.05).
[Color figure can be viewed in the online issue, which is available
at www.interscience.wiley.com.]
r White-Matter Vascular Lesion and EEG in MCI r
r 1437 r

ROI (central, frontal, parietal, occipital, temporal, limbic).We found a statistical interaction (F(5,400) 5 2.23, P < 0.05)between the two factors. Furthermore, the post hoc testingindicated that the absolute LORETA power values of occipi-tal alpha 1 sources were higher in the Nold than in theMCI subjects (P < 0.01), in line with the main results.
DISCUSSION
This EEG study was performed in amnesic MCI patientsto evaluate the relationships between cortical sources ofresting EEG power and functional integrity of cholinergictracts to cortex, as revealed by white-matter hyperinten-sities. The topographic location of the hyperintensities wasdefined based on the seminal study by Selden et al. [1998],where they located the projections of cholinergic basalforebrain to cingulate and neighbors (medial cholinergicpathway) as well as to frontal, temporal, parietal, and occi-
pital cortices (lateral capsular and lateral perisylvian). Spe-cifically, we considered the total amount of cholinergiclesion in these medial and lateral pathways, because of theintrinsic limitation of spatial resolution of the present EEGtechniques. Based on the measurement of this lesion, therecruited amnesic MCI patients were classified as havinglow or high white-matter cholinergic vascular lesion (MCICh2 or MCI Ch1, respectively). Independently of the totalamount of white-matter vascular lesion (i.e., summing upwhite-matter lesion in the cholinergic and noncholinergiccompartments), the power of parietal, temporal, occipital,and limbic low-frequency alpha sources (8–12.5 Hz) washigher in the MCI Ch2 than MCI Ch1 group; the sametrend was true for parietal, temporal, and occipital thetasources. In the evaluation of the results, at least threemethodological remarks should be taken into account.Firstly, the present ‘‘cholinergic’’ bundles [Selden et al.,1998] may include a minority of dopaminergic and norad-
Figure 4.
Regional normalized LORETA solutions (mean across subjects)
relative to a statistical ANOVA interaction (F(30,1650) 5 1.60;
MSe 5 0.2; P < 0.0216) among the factors Group (MCI Ch, MCI
Ch1), Band (delta, theta, alpha 1, alpha 2, beta 1, beta 2, gamma),
and ROI (central, frontal, parietal, occipital, temporal, limbic). This
ANOVA design used the regional normalized LORETA solutions
as a dependent variable. Subjects’ age, education, gender and indi-
vidual alpha frequency peak (IAF) were used as covariates. Re-
gional normalized LORETA solutions modeled the EEG relative
power spectra as revealed by a sort of ‘‘virtual’’ intracranial
macro-electrodes located on the macrocortical regions of inter-
est. Legend: the rectangles indicate the cortical regions and fre-
quency bands in which LORETA solutions presented statistically
significant LORETA patterns MCI Ch2 > MCI Ch1 (P < 0.05).
[Color figure can be viewed in the online issue, which is available
at www.interscience.wiley.com.]
r Babiloni et al. r
r 1438 r

renergic projections as previously suggested [Gritti et al.,1993]. Secondly, the spatial resolution of the method waslimited by the voxel matrix and slice thickness (i.e., around1 mm in the coronal plane and 1.5 mm along the rostro-caudal axis), and by the deformations of the digitalizedbrain images; to minimize these deformations, the presentwarping technique stretched the brain images using bothouter boundary and ventricular wall of the high-resolutionT1 MRIs as reference points [Yoshita et al., 2005]. Thirdly,the EEG electrode positions were not coregistered to indi-vidual brain source models; unlikely, the official LORETApackage (see Methods section) did not include software todo so and we could not obtain the digitalization of theelectrode position from our clinical units.The earlier results confirmed the hypothesis that cortical
sources of posterior alpha rhythms are more preserved inamnesic MCI patients in whom the global cognitive statusis challenged by, at least in part, processes outside the cho-linergic basal forebrain pathways conveying arousing sig-nals to cerebral cortex. In this sense, these rhythmsappeared to be considered as a marker sensitive to effi-ciency of basal cholinergic systems in amnesic MCI sub-jects, in agreement with previous evidence showing thatposterior alpha rhythms are more affected in AD patientsthan in subjects with sub-cortical vascular dementia [Babi-loni et al., 2004], and in AD than in amnesic MCI subjects[Babiloni et al., 2006c]. Keeping in mind these data andconsiderations, it can be speculated that posterior alpharhythms are generally more abnormal in AD subjects thanin sub-cortical vascular dementia subjects, since these EEGrhythms are sensitive to cholinergic systems, AD neurode-generation is deeply developed into cholinergic systems,and cerebrovascular lesions are generally not focused oncholinergic systems. Furthermore, posterior alpha rhythmsare generally more abnormal in MCI subjects havingmarked vascular lesions in the cholinergic white mattertracts than in MCI subjects having slight vascular lesionsin the cholinergic white matter tracts.Sensitivity of brain rhythms to cholinergic systems is
emphasized by the fact that our MCI groups differed interms of cholinergic white matter lesions but not in terms ofglobal cognitive functioning. This suggests a non-linear rela-tionship between the functional impairment of cholinergicsystems and global cognitive status along pathologicalaging, as a possible effect of concomitant factors includingnon-cholinergic systems, cognitive reserve, and neuroprotec-tive agents [Mortimer et al., 2005]. In this framework, EEGrhythms and their magnetoencephalographic counterpartmight probe efficiency of cholinergic systems in pathologicalaging better than standard clinical and neuropsycholologicalassessment. Indeed, previous magnetoencephalographic evi-dence has shown that cholinergic antagonist modulated thepower of alpha and theta rhythms and the coherence oftheta rhythms in healthy subjects, mimicking the typicaleffects of AD on brain rhythms [Osipova et al., 2003].A crucial question is then: ‘‘What are the functional rela-
tionships among basal cholinergic systems, low-band alpha
rhythms, and amnesic MCI subjects?’’ At this early stageof research, the present results allow just an initial view onthese relationships. In the condition of wakening rest, low-band (8–10.5 Hz) alpha rhythms might mainly reflect time-varying inputs of forebrain cholinergic pathways to cortex[Ricceri et al., 2004]. Therefore, it can be speculated thatresting low-band alpha rhythms in amnesic MCI subjectsmight reflect the efficiency by which cholinergic basal fore-brain neurons convey signals trough white-matter to cere-bral cortex, in order to modulate the transmission andprocessing of cortical information [Manshanden et al.,2002; Nunez et al., 2001]. Several lines of evidence haveshown that experimental lesions of cholinergic basal fore-brain affected the amplitude of EEG rhythms includingalpha frequencies [Buzsaki et al., 1988; Ray and Jackson,1991]. The same was true in AD patients supposed to havean impairment of cholinergic basal forebrain [Babiloniet al., 2004; Dierks et al., 2000; Mesulam et al., 2004; Mor-etti et al., 2004; Rodriguez et al., 1999a,b], but a relativelyspared thalamic cholinergic innervation from the brain-stem [Geula and Mesulam 1989, 1996, 1999; Mesulamet al., 2004]. Furthermore, it has been reported that cholin-ergic basal forebrain was more structurally impaired inAD [Teipel et al., 2005], especially in non responders tocholinergic therapy [Tanaka et al., 2003]. Finally, posterioralpha rhythms other than delta rhythms were found to bemodulated by long-term cholinergic therapy in AD sub-jects [Babiloni et al., 2006f]. However, it should beremarked that the above data do not mean that clinicaland cognitive deficits in amnesic MCI and AD subjects justdepend on an impairment of cholinergic systems. Previousfindings have shown higher values of choline acetyl trans-ferase as a marker of enhanced cholinergic tone in the hip-pocampus of MCI subjects DeKosky et al., 2002]. In thesame vein, it has been demonstrated that neocortical cho-linergic deficits characterize severe but not mild ADpatients [Davis et al., 1999], and that monoaminergic[Dringenberg, 2000] and non-NMDA vs. NMDA glutama-tergic unbalance [Di Lazzaro et al., 2004] might affect corti-cal excitability and EEG rhythms in amnesic MCI and ADsubjects. To reconcile the above findings, a reasonable ex-planation is that clinical and cognitive deficits in amnesicMCI and AD subjects may be explained by complex non-linear relationships among different neuromodulatory sys-tems rather than a major impairment of cholinergic sys-tems. In this theoretical framework, posterior cortical EEGrhythms may reflect the functional integrity of cholinergicpathways.Another important question is ‘‘Why is white-matter
cholinergic vascular lesion related to posterior theta otherthan alpha rhythms in amnesic MCI subjects?’’ A tentativeexplanation is that posterior theta rhythms are affected bysome interaction involving the cholinergic basal forebrainpathways projecting to hippocampus/amygdala (mainlymodulating theta rhythms), the cholinergic basal forebrainpathways directly projecting to cerebral cortex (mainlymodulating alpha rhythms), and modulatory GABAergic
r White-Matter Vascular Lesion and EEG in MCI r
r 1439 r
systems. Such an explanation is grounded on the followingwell-known statements on theta rhythms: (i) theta rhythmsfunctionally connect the activity of hippocampal/amygdalasystems and cortical mantle [Buzsaki and Draguhn, 2004];(ii) they are supposed to sub-serve focused attention,working memory, encoding processes of episodic memory,and the control of action [Gevins and Smith, 2000, Kli-mesch et al., 2001, 2006; Klimesch, 1999]; (iii) hippocampaltheta rhythms depend on cholinergic and GABAergicinteractions [Andersen et al., 2007; Kimura, 2000; Vertes,2005]; (iv) pathological brain oscillations including thetarhythms are related to the atrophy of hippocampus, rhinalpaleocortex, and temporo-parietal neocortex in MCI andAD subjects [Fernandez et al., 2003; Killiany et al., 1993].A final question is ‘‘What is the relationship between
the integrity of cholinergic basal forebrain projections andcerebrovascular function in amnesic MCI subjects? Arecent view called ’’cholinergic-vascular hypothesis‘‘ positsthat human cholinergic systems not only arouse cerebralcortex but also contribute to event-related enhancement ofcerebral blood flow at the basis of cognitive functions[Claassen and Jansen, 2006]. Such a relationship may benon-linear, depending on vasomotor reactivity of cerebralcirculation to cognitive demands [Claassen and Jansen,2006; Silvestrini et al., 2006], severity of AD [Davis et al.,1999], and early compensatory responses within choliner-gic system [DeKosky et al., 2002]. An alternative view pro-poses that cerebrovascular and AD lesions represent addi-tive or synergistic factors in the development of cognitiveimpairment across AD [Nagy et al., 1997; Snowdon et al.,1997; van Oijen M et al., 2007; Zekry et al., 2002]. Unlikely,the results of the present study cannot unveil the relation-ship between the integrity of cholinergic basal forebrainprojections and cerebrovascular function in amnesic MCIsubjects. The contribution of the present study is to sup-port the view that the vascular lesions of cholinergic whitematter tracts especially affect the neural synchronizationmechanisms at the basis of the generation of cortical alpharhythms in MCI subjects.
CONCLUSIONS
The involvement of cholinergic systems in the develop-ment of amnesic MCI, as a preclinical stage of AD atgroup level, is currently debated. In our study, we testedthe hypothesis that cortical sources of EEG rhythms, whichare affected by AD processes, are especially affected inamnesic MCI subjects in whom the cognitive decline ismainly explained by cholinergic lesions in white-matterdue to vascular factors. As main results, power of occipi-tal, parietal, temporal, and limbic parietal alpha 1 sourceswas maximum in Nold, intermediate in MCI Ch2 (lowcholinergic lesion in white matter), and low in MCI Ch1group (high cholinergic lesion in white matter). Further-more, the same trend was true in theta sources. Theseresults are in line with the hypothesis that an impairment(white matter) of cholinergic systems is associated with
marked alterations of cortical sources of EEG rhythms inthe amnesic MCI status as a pre-clinical stage of AD.Future studies should correlate posterior theta and alpharhythms with fine structural features of basal forebrain,cholinergic pathways, and mesial-temporal cortex in amne-sic MCI subjects.
ACKNOWLEDGMENTS
The authors thank Drs. Michele Bonetti, Orazio Zanetti,Carlo Miniussi, Mario Ortega, Stefania Tilgher, and Giu-liano Binetti for their precious help in the development ofthe present study.
REFERENCES
Albert M, Smith LA, Scherr PA, Taylor JO, Evans DA, FunkensteinHH (1991): Use of brief cognitive tests to identify individualsin the community with clinically diagnosed Alzheimer’s dis-ease. Int J Neurosci 57:167–178.
Anderer P, Saletu B, Pascual-Marqui RD (2000): Effect of the 5-HT(1A) partial agonist buspirone on regional brain electricalactivity in man: a functional neuroimaging study using low-re-solution electromagnetic tomography (LORETA). PsychiatryRes 100:81–96.
Anderer P, Saletu B, Semlitsch HV, Pascual-Marqui RD (2003):Non-invasive localization of P300 sources in normal aging andage-associated memory impairment. Neurobiol Aging 24:463–479.
Anderer P, Saletu B, Saletu-Zyhlarz G, Gruber D, Metka M, HuberJ, Pascual-Marqui RD (2004): Brain regions activated during anauditory discrimination task in insomniac postmenopausalpatients before and after hormone replacement therapy: Low-resolution brain electromagnetic tomography applied to event-related potentials. Neuropsychobiology 49:134–153.
Andersen P, Morris R, Amaral D, Bliss T, O’Keefe J (2007): TheHippocampus Book. New York: Oxford University Press.
Babiloni C, Binetti G, Cassetta E, Cerboneschi D, Dal Forno G, DelPercio C, Ferreri F, Ferri R, Lanuzza B, Miniussi C, MorettiDV, Nobili F, Pascual-Marqui RD, Rodriguez G, Romani GL,Salinari S, Tecchio F, Vitali P, Zanetti O, Zappasodi F, RossiniPM (2004): Mapping distributed sources of cortical rhythms inmild Alzheimers disease. A multi-centric EEG study. Neuro-image 22:57–67.
Babiloni C, Binetti G, Cassarino A, Dal Forno G, Del Percio C, Fer-reri F, Ferri R, Frisoni G, Galderisi S, Hirata K, Lanuzza B,Miniussi C, Mucci A, Nobili F, Rodriguez G, Romani GL, Ros-sini PM (2006a): Sources of cortical rhythms in adults duringphysiological aging: A multi-centric EEG study. Hum BrainMapp 27:162–172.
Babiloni C, Binetti G, Cassetta E, Dal Forno G, Del Percio C, Fer-reri F, Ferri R, Frisoni G, Hirata K, Lanuzza B, Miniussi C,Moretti DV, Nobili F, Rodriguez G, Romani GL, Salinari S,Rossini PM (2006b): Sources of cortical rhythms change as afunction of cognitive impairment in pathological aging: Amulti-centric study. Clin Neurophysiol 117:252–268.
Babiloni C, Benussi L, Binetti G, Bosco P, Busonero G, Cesaretti S,Dal Forno G, Del Percio C, Ferri R, Frisoni G, Ghidoni R,Rodriguez G, Squitti R, Rossini PM (2006c): Genotype (cystatinC) and EEG phenotype in Alzheimer disease and mild cogni-tive impairment: A multicentric study. Neuroimage 29:948–964.
r Babiloni et al. r
r 1440 r
Babiloni C, Benussi L, Binetti G, Cassetta E, Dal Forno G, Del Per-cio C, Ferreri F, Ferri R, Frisoni G, Ghidoni R, Miniussi C,Rodriguez G, Romani GL, Squitti R, Ventriglia MC, Rossini PM(2006d): Apolipoprotein E and a brain rhythms in mild cogni-tive impairment: A multicentric EEG study. Ann Neurol59:323–334.
Babiloni C, Frisoni G, Steriade M, Bresciani L, Binetti G, Del PercioC, Geroldi C, Miniussi C, Nobili F, Rodriguez G, Zappasodi F,Carfagna T, Rossini PM (2006e): Frontal white matter volumeand delta EEG sources negatively correlate in awake subjectswith mild cognitive impairment and Alzheimer’s disease. ClinNeurophysiol 117:1113–1129.
Babiloni C, Cassetta E, Dal Forno G, Del Percio C, Ferreri F, FerriR, Lanuzza B, Miniussi C, Moretti DV, Flavio Nobili F, Pasc-ual-Marqui RD, Rodriguez G, Romani GL, Salinari S, ZanettiO, Rossini PM (2006f): Donepezil effects on sources of corticalrhythms in mild Alzheimer’s disease: Responders vs. non-res-ponders. Neuroimage 31:1650–1665.
Buzsaki G, Draguhn A (2004): Neuronal oscillations in cortical net-works. Science 304:1926–1929. (Review).
Buzsaki G, Bickford RG, Ponomareff G, Thal LJ, Mandel R, GageFH (1988): Nucleus basalis and thalamic control of neocorticalactivity in the freely moving rat. J Neurosci 8:4007–4026.
Claassen JA, Jansen RW (2006): Cholinergically mediated augmen-tation of cerebral perfusion in Alzheimer’s disease and relatedcognitive disorders: The cholinergic-vascular hypothesis. J Ger-ontol A Biol Sci Med Sci 61:267–271.
Davis Davis KL, Mohs RC, Marin D, Purohit DP, Perl DP, LantzM, Austin G, Haroutunian V (1999): Cholinergic markers in el-derly patients with early signs of Alzheimer disease. JAMA281:1401–1406.
DeCarli C, Murphy DG, Tranh M, Grady CL, Haxby JV, GilletteJA, Salerno JA, Gonzales-Aviles A, Horwitz B, Rapoport SI,et al. (1995): The effect of white matter hyperintensity volumeon brain structure, cognitive performance, and cerebral metab-olism of glucose in 51 healthy adults. Neurology 45:2077–2084.
DeCarli C, Fletcher E, Ramey V, Harvey D, Jagust WJ (2005): Ana-tomical mapping of white matter hyperintensities (WMH):Exploring the relationships between periventricular WMH,deep WMH, and total WMH burden. Stroke 36:50–55.
DeKosky ST, Ikonomovic MD, Styren SD, Beckett L, Wisniewski S,Bennett DA, Cochran EJ, Kordower JH, Mufson EJ (2002):Upregulation of choline acetyltransferase activity in hippocam-pus and frontal cortex of elderly subjects with mild cognitiveimpairment. Ann Neurol 51:145–155.
Devanand DP, Folz M, Gorlyn M, Moeller JR, Stem J (1997): Ques-tionable dementia: Clinical course and predictors of outcome. JAm Geriatr Soc 45:321–328.
Dierks T, Jelic V, Pascual-Marqui RD, Wahlund LO, Julin P, Lin-den DEJ, Maurer K, Winblad B, Nordberg A (2000): Spatialpattern of cerebral glucose metabolism (PET) correlates withlocalization of intracerebral EEG-generators in Alzheimer’s dis-ease. Clin Neurophysiol 111:1817–1824.
Di Lazzaro V, Oliviero A, Pilato F, Saturno E, Dileone M, Marra C,Daniele A, Ghirlanda S, Gainotti G, Tonali PA (2004): Motor cor-tex hyperexcitability to transcranial magnetic stimulation in Alz-heimer’s disease. J Neurol Neurosurg Psychiatry 75:555–559.
Dringenberg HC (2000): Alzheimer’s disease: More than a ‘cholin-ergic disorder’—Evidence that cholinergic-monoaminergicinteractions contribute to EEG slowing and dementia. BehavBrain Res 115:235–249.
Fernandez A, Arrazola J, Maestu F, Amo C, Gil-Gregorio P, Wien-bruch C, Ortiz T (2003): Correlations of hippocampal atrophy
and focal low-frequency magnetic activity in Alzheimer dis-ease: Volumetric MR imaging-magnetoencephalographic study.AJNR Am J Neuroradiol 24:481–487.
Flicker CS, Ferris H, Reisberg B (1991): Mild cognitive impairmentin the elderly: Predictors of dementia. Neurology 41:1006–1009.
Geula C, Mesulam MM (1989): Cortical cholinerigc fibers in agingand Alzheimer’s disease: A morphometirc study. Neuroscience33:469–481.
Geula C, Mesulam MM (1996): Systematic regional variations inthe loss of cortical cholinergic fibers in Alzheimer’s disease.Cereb Cortex 6:165–177.
Geula C, Mesulam MM (1999): Cholinergic system in Alzheimer’sdisease. In Terry RD, Katzman R, Bick KL, editors. AlzheimerDisease, 2nd ed. Philadelphia, PA: Lippincott, Williams andWilkins. pp 69–292.
Gevins A, Smith ME (2000): Neurophysiological measures ofworking memory and individual differences in cognitive abilityand cognitive style. Cereb Cortex 10:829–839.
Gritti I, Mainville L, Jones BE (1993): Codistribution of GABA-with acetylcholine-synthesizing neurons in the basal forebrainof the rat. J Comp Neurol 329:438–457.
Hartikainen P, Soininen H, Partanen J, Helkala EL, Riekkinen P(1992): Aging and spectral analysis of EEG in normal subjects: alink to memory and CSF AChE. Acta Neurol Scand 86:148–150.
Helkala EL, Hanninen T, Hallikainen M, Kononen M, Laakso MP,Hartikainen P, Soininen H, Partanen J, Partanen K, Vainio P,Riekkinen P Sr (1996): Slow-wave activity in the spectral analy-sis of the electroencephalogram and volumes of hippocampusin subgroups of Alzheimer’s disease patients. Behav Neurosci110:1235–1243.
Hernandez JL, Valdes P, Biscay R, Virues T, Szava S, Bosch J,Riquenes A, Clark I (1994): A global scale factor in brain topog-raphy. Int J Neurosci 76:267–278.
Holschneider DP, Waite JJ, Leuchter AF, Walton NY, Scremin OU(1999): Changes in electrocortical power and coherence inresponse to the selective cholinergic immunotoxin 192 IgG-sap-orin. Exp Brain Res 126:270–280.
Jelic V, Johansson SE, Almkvist O, Shigeta M, Julin P, NordbergA, Winblad B, Wahlund LO (2000): Quantitative electroence-phalography in mild cognitive impairment: Longitudinalchanges and possible prediction of Alzheimer’s disease. Neuro-biol Aging 21:533–540.
Jeong J (2004): EEG dynamics in patients with Alzheimer’s dis-ease. Clin Neurophysiol 115:1490–1505.
Killiany RJ, Moss MB, Albert MS, Sandor T, Tieman J, Jolesz F(1993): Temporal lobe regions on magnetic resonance imagingidentify patients with early Alzheimer’s disease. Arch Neurol50:949–954.
Kimura F (2000): Cholinergic modulation of cortical function: Ahypothetical role in shifting the dynamics in cortical network.Neurosci Res 38:19–26.
Klass DW, Brenner RP (1995): Electroencephalography of the el-derly. J Clin Neurophysiol 12:116–131.
Klimesch W (1999): EEG a and theta oscillations reflect cognitiveand memory performance: A review and analysis. Brain ResRev 29:169–195.
Klimesch W, Doppelmayr M, Stadler W, Pollhuber D, Sauseng P,Rohm D (2001): Episodic retrieval is reflected by a process spe-cific increase in human electroencephalographic theta activity.Neurosci Lett 302:49–52.
Klimesch W, Doppelmayr M, Hanslmayr S (2006): Upper a ERDand absolute power: Their meaning for memory performance.Prog Brain Res 159:151–165. (Review).
r White-Matter Vascular Lesion and EEG in MCI r
r 1441 r

Koenig T, Prichep L, Dierks T, Hubl D, Wahlund LO, John ER, JelicV (2005): Decreased EEG synchronization in Alzheimer’s diseaseand mild cognitive impairment. Neurobiol Aging 26:165–171.
Laufer I, Pratt H (2003a): Evoked potentials to auditory movementsensation in duplex perception. Clin Neurophysiol 114:1316–1331.
Laufer I, Pratt H (2003b): The electrophysiological net response(‘F-complex’) to spatial fusion of speech elements forming anauditory object. Clin Neurophysiol 114:818–834.
Leuchter AF, Cook IA, Newton TF, Dunkin J, Walter DO, Rosen-berg-Tompson S, Lachenbruch PA, Weiner H (1993): Regionaldifferences in brain electrical activity in dementia: use of spec-tral power and spectral ratio measures. Electroenceph clinNeurophysiol 87:385–393.
Maes F, Collignon A, Vandermeulen D, Marchal G, Suetens P(1997): Multimodality image registration by maximization ofmutual information. IEEE Trans Med Imaging 16:187–198.
Manshanden I, De Munck JC, Simon NR, Lopes da Silva FH(2002): Source localization of MEG sleep spindles and the rela-tion to sources of a band rhythms. Clin Neurophysiol113:1937–1947.
Markand ON (1990): Alpha rhythms. J Clin Neurophysiol 7:163–189. (Review).
McKhann G, Drachman D, Folstein M, Katzman R, Price D,Stadlan EM (1984): Clinical diagnosis of Alzheimer’s disease:report of the NINCDS-ADRDA Work Group under the aus-pices of Department of Health and Human Services Task Forceon Alzheimer’s Disease. Neurology 34:939–944.
Mesulam M, Shaw P, Mash D, Weintraub S (2004): Cholinergic nu-cleus basalis tauopathy emerges early in the aging-MCI-ADcontinuum. Ann Neurol 55:815–828.
Moretti DV, Babiloni F, Carducci F, Cincotti F, Remondini E, Ros-sini PM, Salinari S, Babiloni C (2003): Computerized processingof EEG-EOG-EMG artifacts for multicentirc studies in EEGoscillations and event-related potentials. Int J Pshycophysiol47:199–216.
Moretti DV, Babiloni C, Binetti G, Cassetta E, Dal Forno G, FerreriF, Ferri R, Lanuzza Bartolo , Miniussi C, Nobili F, RodriguezG, Salinari S, Rossini PM (2004): Individual analysis of EEGfrequency and band power in mild Alzheimer’s Disease. ClinNeurophysiol 115:299–308.
Mortimer JA, Borenstein AR, Gosche KM, Snowdon DA (2005):Very early detection of Alzheimer neuropathology and the roleof brain reserve in modifying its clinical expression. J GeriatrPsychiatry Neurol 18:218–223. (Review).
Mulert C, Gallinat J, Pascual-Marqui R, Dorn H, Frick K, Schlatt-mann P, Mientus S, Herrmann WM, Winterer G (2001):Reduced event-related current density in the anterior cingulatecortex in schizophrenia. Neuroimage 13:589–600.
Nagy Z, Esiri MM, Jobst KA, Morris JH, King EM-F, McDonald B,Joachim C, Litchfield S, Barnetson L, Smith AD (1997): Theeffects of additional pathology on the cognitive deficit in Alz-heimer disease. J Neuropathol Exp Neurol 56:165–170.
Nunez PL, Wingeier BM, Silberstein RB (2001): Spatial-temporalstructures of human alpha rhythms: Theory, microcurrent sour-ces, multiscale measurements, and global binding of local net-works. Hum Brain Mapp 13:125–164.
Nuwer MR (1988): Quantitative EEG. I. Tecniques and problemsof frequency analysis and topographic mapping. J Clin Neuro-physiol 5:1–43.
Osipova D, Ahveninen J, Kaakkola S, Jaaskelainen IP, Huttunen J,Pekkonen E (2003): Effects of scopolamine on MEG spectralpower and coherence in elderly subjects. Clin Neurophysiol114:1902–1907.
Otte M (2001): Elastic registration of fMRI data using Bezier-spline transformations. IEEE Trans Med Imaging 20:193–206.
Pascual-Marqui RD, Michel CM (1994): LORETA (low resolutionbrain electromagnetic tomography): New authentic 3D func-tional images of the brain. ISBET Newslett ISSN 5:4–8.
Pascual-Marqui RD, Lehmann D, Koenig T, Kochi K, Merlo MC,Hell D, Koukkou M (1999): Low resolution brain electromag-netic tomography (LORETA) functional imaging in acute, neu-roleptic-naive, first-episode, productive schizophrenia. Psychia-try Res 90:169–179.
Pascual-Marqui RD, Esslen M, Kochi K, Lehmann D (2002): Func-tional imaging with low resolution brain electromagnetic to-mography (LORETA): A review. Methods Find Exp Clin Phar-macol 24:91–95.
Petersen RC, Smith GE, Ivnik RJ, Tangalos EG, Schaid SN, Thibo-deau SN, Kokmen E, Waring SC, Kurland LT (1995): Apolipo-protein E status as a predictor of the development of Alzhei-mer’s disease in memory-impaired individuals. JAMA 273:1274–1278.
Petersen RC, Smith GE, Waring SC, Ivnik RJ, Kokmen E, TangelosEG (1997): Aging, memory, and mild cognitive impairment. IntPsychogeriatr 9 (Suppl 1):65–69.
Petersen RC, Doody R, Kurz A, Mohs RC, Morris JC, Rabins PV,Ritchie K, Rossor M, Thal L, Winblad B (2001): Current con-cepts in mild cognitive impairment. Arch Neurol 58:1985–1992.
Phillips C, Rugg MD, Friston KJ (2002): Systemic regularization oflinear inverse solutions of the EEG source localization problem.Neuroimage 17:287–301.
Pollock VE, Schneider LS, Lyness SA (1990): EEG amplitudes inhealthy, late-middle-aged and elderly adults: Normality of thedistributions and correlations with age. ElectroencephalogrClin Neurophysiol 75:276–288.
Ponomareva NV, Selesneva ND, Jarikov GA (2003): EEG altera-tions in subjects at high familial risk for Alzheimer’s disease.Neuropsychobiology 48:152–159.
Portet F, Ousset PJ, Visser PJ, Frisoni GB, Nobili F, Scheltens P,Vellas B, Touchon J; MCI Working Group of the EuropeanConsortium on Alzheimer’s Disease(2006): Mild cognitiveimpairment (MCI) in medical practice: a critical review of theconcept and new diagnostic procedure. Report of the MCIWorking Group of the European Consortium on Alzheimer’sDisease. J Neurol Neurosurg Psychiatry 77:714–718. (Review).
Pucci E, Belardinelli N, Cacchio G, Signorino M, Angeleri F (1999):EEG power spectrum differences in early and late onset formsof Alzheimer’s disease. Clin Neurophysiol 110:621–631.
Ray PG, Jackson WJ (1991): Lesions of nucleus basalis alter ChATactivity and EEG in rat frontal neocortex. ElectroencephalogrClin Neurophysiol 79:62–68.
Ricceri L, Minghetti L, Moles A, Popoli P, Confaloni A, De SimoneR, Piscopo P, Scattoni ML, di Luca M, Calamandrei G (2004):Cognitive and neurological deficits induced by early and pro-longed basal forebrain cholinergic hypofunction in rats. ExpNeurol 189:162–172.
Rodriguez G, Nobili F, Rocca G, DeCarli F, Gianelli MV, RosadiniG (1998): Quantitative electroencephalography and regionalcerebral blood flow: Discriminant analysis between Alzhei-mer’s patients and healthy controls. Dement Geriatr CognDisord 9:238–274.
Rodriguez G, Copello F, Nobili F, Vitali P, Perego G, Nobili F(1999a): EEG spectral profile to stage Alzheimer’s disease. ClinNeurophysiol 110:1831–1837.
r Babiloni et al. r
r 1442 r
Rodriguez G, Nobili F, Copello F, Vitali P, Gianelli MV, Taddei G,Catsafados E, Mariani G (1999b): 99mTc-HMPAO regional cer-ebral blood flow and quantitative electroencephalography inAlzheimer’s disease: A correlative study. J Nucl Med 40:522–529.
Rodriguez G, Vitali P, De Leo C, De Carli F, Girtler N, Nobili F(2002): Quantitative EEG changes in Alzheimer patients duringlong-term donepezil therapy. Neuropsychobiology 46:49–56.
Rubin EH, Morris JC, Grant EA, Vendegna T (1989): Very mild se-nile dementia of the Alzheimer type. I. Clinical assessment.Arch Neurol 46:379–382.
Selden NR, Gitelman DR, Salamon-Murayama N, Parrish TB,Mesulam MM (1998): Trajectories of cholinergic pathwayswithin the cerebral hemispheres of the human brain. Brain 121(Part 12):2249–2257.
Silvestrini M, Pasqualetti P, Baruffaldi R, Bartolini M, Handouk Y,Matteis M, Moffa F, Provinciali L, Vernieri F (2006): Cerebro-vascular reactivity and cognitive decline in patients with Alz-heimer disease. Stroke 37:1010–1015.
Sloan EP, Fenton GW, Kennedy NSJ, MacLennan JM (1995): Elec-troencephalography and single photon emission computed to-mography in dementia: A comparative study. Psychol Med25,631–638.
Snowdon DA, Greiner LH, Markesbery WR (2000): Linguistic abil-ity in early life and the neuropathology of Alzheimer’s diseaseand cerebrovascular disease. Findings from the Nun Study.Ann N Y Acad Sci 903:34–38.
Szelies B, Mielke R, Kessler J, Heiss WD (1999): EEG powerchanges are related to regional cerebral glucose metabolism invascular dementia. Clin Neurophysiol 110:615–620.
Talairach J, Tournoux P (1988): Co-Planar Stereotaxic Atlas of theHuman Brain. Stuttgart: Thieme.
Tanaka Y, Hanyu H, Sakurai H, Takasaki M, Abe K (2003): Atro-phy of the substantia innominata on magnetic resonanceimaging predicts response to donepezil treatment in Alzhei-mer’s disease patients. Dement Geriatr Cogn Disord 16:119–125.
Teipel SJ, Flatz WH, Heinsen H, Bokde AL, Schoenberg SO,Stockel S, Dietrich O, Reiser MF, Moller HJ, Hampel H (2005):
Measurement of basal forebrain atrophy in Alzheimer’s diseaseusing MRI. Brain 128 (Part 11):2626–2644.
Valdes P, Picton TW, Trujillo N, Bosch J, Aubert E, Riera J (1998):Constraining EEG-MEG source imaging with statistical neuro-anatomy. Neuroimage 4:635.
van Oijen M, de Jong FJ, Witteman JC, Hofman A, Koudstaal PJ,Breteler MM (2007): Atherosclerosis and risk for dementia.Ann Neurol 61:403–410.
Veiga H, Deslandes A, Cagy M, Fiszman A, Piedade RA, RibeiroP (2003): Neurocortical electrical activity tomography inchronic schizophrenics. Arq Neuropsiquiatr 61:712–717.
Vertes RP (2005): Hippocampal theta rhythm: A tag for short-termmemory. Hippocampus 15:923–935.
Winterer G, Mulert C, Mientus S, Gallinat J, Schlattmann P, Dorn H,Herrmann WM (2001): P300 and LORETA: Comparison of nor-mal subjects and schizophrenic patients. Brain Topogr 13:299–313.
Yao D, He B (2001): A self-coherence enhancement algorithm andits application to enhancing three-dimensional source estima-tion from EEGs. Ann Biomed Eng 29:1019–1027.
Yoshita M, Fletcher E, DeCarli C (2005): Current concepts ofanalysis of cerebral white matter hyperintensities on magneticresonance imaging. Top Magn Reson Imaging 16:399–407(Review).
Zappoli R, Versari A, Paganini M, Arnetoli G, Muscas GC, Gang-emi PF, Arneodo MG, Poggiolini D, Zappoli F, Battaglia A(1995): Brain electrical activity (quantitative EEG and bit-map-ping neurocognitive CNV components), psychometrics andclinical findings in presenile subjects with initial mild cognitivedecline or probable Alzheimer-type dementia. Ital J Neurol Sci16:341–376. (Review).
Zaudig M (1992): A new systematic method of measurement anddiagnosis of ‘‘mild cognitive impairment’’ and dementiaaccording to ICD-10 and DSM-III-R criteria. Int Psychogeriatr 4(Suppl 2):203–219.
Zekry D, Duyckaerts C, Moulias R, Belmin J, Geoffre C, HerrmannF, Hauw JJ (2002): Degenerative and vascular lesions of thebrain have synergistic effects in dementia of the elderly. ActaNeuropathol (Berl) 103:481–487.
r White-Matter Vascular Lesion and EEG in MCI r
r 1443 r
Related Documents