White Matter Atlas Generation using HARDI based Automated Parcellation Luke Bloy a , Madhura Ingalhalikar a , Harini Eavani a,b , Robert T. Schultz b , Timothy P.L. Roberts c , and Ragini Verma a a Section of Biomedical Image Analysis, Department of Radiology, University of Pennsylvania, Philadelphia, PA 19104 b Center for Autism Research, Children’s Hospital of Philadelphia, Philadelphia, PA, 19104 c Lurie Family Foundations MEG Imaging Center, Department of Radiology, Children’s Hospital of Philadelphia, Philadelphia, PA, 19104 Abstract Most diffusion imaging studies have used subject registration to an atlas space for enhanced quantification of anatomy. However, standard diffusion tensor atlases lack information in regions of fiber crossing and are based on adult anatomy. The degree of error associated with applying these atlases to studies of children for example has not yet been estimated but may lead to suboptimal results. This paper describes a novel technique for generating population-specific high angular resolution diffusion imaging (HARDI)-based atlases consisting of labeled regions of homogenous white matter. Our approach uses a fiber orientation distribution (FOD) diffusion model and a data driven clustering algorithm. White matter regional labeling is achieved by our automated data driven clustering algorithm that has the potential to delineate white matter regions based on fiber complexity and orientation. The advantage of such an atlas is that it is study specific and more comprehensive in describing regions of white matter homogeneity as compared to standard anatomical atlases. We have applied this state of the art technique to a dataset consisting of adolescent and preadolescent children, creating one of the first examples of a HARDI-based atlas, thereby establishing the feasibility of the atlas creation framework. The white matter regions generated by our automated clustering algorithm have lower FOD variance than when compared to the regions created from a standard anatomical atlas. Keywords Diffusion; Atlas Generation; HARDI Template; White Matter Parcellation 1. Introduction The use of brain atlases in neuroimaging studies allows researchers to register, identify and perform measurements on individual subjects within a common spatial coordinate system © 2011 Elsevier Inc. All rights reserved. Corresponding Author: Luke Bloy, Section of Biomedical Image Analysis, 3600 Market St, Suite 380, Philadelphia PA 19104., [email protected]. Publisher's Disclaimer: This is a PDF file of an unedited manuscript that has been accepted for publication. As a service to our customers we are providing this early version of the manuscript. The manuscript will undergo copyediting, typesetting, and review of the resulting proof before it is published in its final citable form. Please note that during the production process errors may be discovered which could affect the content, and all legal disclaimers that apply to the journal pertain. NIH Public Access Author Manuscript Neuroimage. Author manuscript; available in PMC 2013 February 15. Published in final edited form as: Neuroimage. 2012 February 15; 59(4): 4055–4063. doi:10.1016/j.neuroimage.2011.08.053. NIH-PA Author Manuscript NIH-PA Author Manuscript NIH-PA Author Manuscript

Welcome message from author
This document is posted to help you gain knowledge. Please leave a comment to let me know what you think about it! Share it to your friends and learn new things together.
Transcript

White Matter Atlas Generation using HARDI based AutomatedParcellation
Luke Bloya, Madhura Ingalhalikara, Harini Eavania,b, Robert T. Schultzb, Timothy P.L.Robertsc, and Ragini Vermaa
aSection of Biomedical Image Analysis, Department of Radiology, University of Pennsylvania,Philadelphia, PA 19104bCenter for Autism Research, Children’s Hospital of Philadelphia, Philadelphia, PA, 19104cLurie Family Foundations MEG Imaging Center, Department of Radiology, Children’s Hospital ofPhiladelphia, Philadelphia, PA, 19104
AbstractMost diffusion imaging studies have used subject registration to an atlas space for enhancedquantification of anatomy. However, standard diffusion tensor atlases lack information in regionsof fiber crossing and are based on adult anatomy. The degree of error associated with applyingthese atlases to studies of children for example has not yet been estimated but may lead tosuboptimal results. This paper describes a novel technique for generating population-specific highangular resolution diffusion imaging (HARDI)-based atlases consisting of labeled regions ofhomogenous white matter. Our approach uses a fiber orientation distribution (FOD) diffusionmodel and a data driven clustering algorithm. White matter regional labeling is achieved by ourautomated data driven clustering algorithm that has the potential to delineate white matter regionsbased on fiber complexity and orientation. The advantage of such an atlas is that it is studyspecific and more comprehensive in describing regions of white matter homogeneity as comparedto standard anatomical atlases. We have applied this state of the art technique to a datasetconsisting of adolescent and preadolescent children, creating one of the first examples of aHARDI-based atlas, thereby establishing the feasibility of the atlas creation framework. The whitematter regions generated by our automated clustering algorithm have lower FOD variance thanwhen compared to the regions created from a standard anatomical atlas.
KeywordsDiffusion; Atlas Generation; HARDI Template; White Matter Parcellation
1. IntroductionThe use of brain atlases in neuroimaging studies allows researchers to register, identify andperform measurements on individual subjects within a common spatial coordinate system
© 2011 Elsevier Inc. All rights reserved.Corresponding Author: Luke Bloy, Section of Biomedical Image Analysis, 3600 Market St, Suite 380, Philadelphia PA 19104.,[email protected]'s Disclaimer: This is a PDF file of an unedited manuscript that has been accepted for publication. As a service to ourcustomers we are providing this early version of the manuscript. The manuscript will undergo copyediting, typesetting, and review ofthe resulting proof before it is published in its final citable form. Please note that during the production process errors may bediscovered which could affect the content, and all legal disclaimers that apply to the journal pertain.
NIH Public AccessAuthor ManuscriptNeuroimage. Author manuscript; available in PMC 2013 February 15.
Published in final edited form as:Neuroimage. 2012 February 15; 59(4): 4055–4063. doi:10.1016/j.neuroimage.2011.08.053.
NIH
-PA Author Manuscript
NIH
-PA Author Manuscript
NIH
-PA Author Manuscript

enabling large scale group studies with greater statistical power to elucidate smaller or moresubtle anatomical differences that exist in specific diseases. Since the introduction of theTalairach (Talairach 1988) human cortical atlas, a number of MRI atlases have beenintroduced to assist with these measurement issues. T1-weighted MR atlases (Collins,Holmes et al. 1995; Mazziotta, Toga et al. 1995; Lancaster, Woldorff et al. 2000; Mazziotta,Toga et al. 2001; Lancaster, Tordesillas-Gutierrez et al. 2007; Ashburner 2009) from theMontreal Neurological Institute (MNI) and the International Consortium of Brain Mapping(ICBM) have been used extensively to illustrate differences in gray matter anatomy as wellas to localize functional signals within these structures. While T1-weighted MRI providesdetailed information concerning cortical anatomy it provides considerably less informationconcerning white matter anatomy (Toga, Thompson et al. 2006), thus these atlases havefocused primarily on the identification of GM regions, possessing limited informationconcerning WM regions.
By providing an in-vivo WM contrast mechanism, built on the recognition of the imagingconsequences of diffusion anisotropy (Moseley, Cohen et al. 1990), diffusion tensor imaging(DTI) (Basser, Mattiello et al. 1994) has reinvigorated the study of WM pathologies andmore recently DTI based WM atlases (Wakana, Jiang et al. 2004; Mori, Oishi et al. 2008;Oishi, Faria et al. 2009) have been introduced to address the relative lack of informationprovided by the existing cortical atlases. While DTI is able to model WM regions possessinga single fiber population, it is ill suited to model areas of more complex WM, such as fibercrossing. This limitation makes delineating boundaries within these regions difficult and thelabeling within them suspect. More complex high angular resolution diffusion imaging(HARDI) data models (Frank 2002; Tournier, Calamante et al. 2004; Tuch 2004; Anderson2005; Descoteaux, Angelino et al. 2007) have been developed to improve modeling in areasof complex WM. These new models provide contrast in areas of fiber crossing andorientation change that is unavailable from conventional DTI and better reflects theunderlying structure of the WM tissue. This paper presents a novel methodology forbuilding WM atlases by utilizing the HARDI contrast to identify and automatically labelregions of homogenous WM. The utilization of an automated data driven clusteringalgorithm for region labeling permits the generation of population/study specific atlaseswithout the need for manual delineation of anatomical regions.
In general, the utility of atlases are two-fold. First, an atlas provides a template image, eithera population average or a single subject image, to serve as a spatial normalization target andthus defines a common spatial coordinate system. Secondly, each atlas identifies regionsconsisting of voxels that meet some conceptual criterion of sameness. The majority ofimaging atlases attempt to label regions based on named neuroanatomical constructs, such asthe prefrontal cortex or the internal capsule. This requires a neuroanatomist/neuroradiologistto manually label the template image to identify each region and is inherently variable, ashuman neuroanatomical boundaries are quite variable. Recent work within the registrationcommunity (Zhang, Avants et al. 2007; Hecke, Sijbers et al. 2008; Hamm, Ye et al. 2010;Hecke, Leemans et al. 2011) suggest that choosing a registration template from thepopulation under study improves the accuracy of spatial normalization. However the laborintensive labeling process makes the accurate transfer of atlas defined regions to apopulation specific atlas difficult, a particularly acute issue when the population has uniquecharacteristics (such as being of a younger age than the anatomical atlas) or when the newimaging modalities, such as HARDI, are being used.
It is also important to consider if labeling based on anatomical boundaries provide sufficientdemarcation, particularly in areas of complex WM, for applications such as region ofinterest (ROI) based WM analysis. For instance, most large anatomical fiber bundles areknown to traverse a variety of WM architectures and thus may not be well suited for region
Bloy et al. Page 2
Neuroimage. Author manuscript; available in PMC 2013 February 15.
NIH
-PA Author Manuscript
NIH
-PA Author Manuscript
NIH
-PA Author Manuscript

of interest studies where they are represented by a single diffusion model or a single scalarfeature, such as diffusion fractional anisotropy.
In this work we address these limitations of existing white matter atlases by presenting aframework to generate a population-specific HARDI atlas based on one of the prominentHARDI data models, the fiber orientation distribution (FOD) (Tournier, Calamante et al.2004; Anderson 2005) function. The framework uses a non-linear spatial normalizationalgorithm to spatially transform the population into a common coordinate system and tocreate a population average FOD image. While we adopt a suitable registration algorithm,similar HARDI based registration techniques (Geng, Ross et al. 2011; Raffelt, Tournier et al.2011; Yap, Chen et al. 2011) could be used in its place, without compromising the atlasframework and parcellation capability. The advantageous of algorithms of this type (i.e.based on HARDI) have been shown in registering areas of complex white matter whencompared with state of the art DTI registration methods (Yap, Chen et al. 2011).
An automated data driven clustering routine is then applied to create a large number ofspatial regions, each consisting of homogeneous WM architecture as measured by the FODimage. As regional homogeneity is the driving force behind the cluster process, each regionis able to be confidently represented by its average, making these regions ideal for region ofinterest (ROI) statistical studies or for the extraction of spatial WM features for use in aclassification framework. While neuroanatomical labeling may not provide suitabledelineation of boundaries needed to identify homogeneous WM regions, it does aid ininterpretability by providing researchers and clinicians with a means of investigating thestructure/function of these regions as well as a comparative basis to other published studies.For this reason, in addition to determining homogeneous WM regions, we assign to eachneuroanatomical labels based on its spatial overlap with an existing WM atlas. While notdesigned merely to identify these named anatomical constructs, the neuroanatomicalrelabeling of the data-based atlas, allows for describing the ROI as belonging to theanatomical region, thereby instilling it with joint information of the underlying fiberorientation as well as the global anatomy and function, facilitating interpretability.
We illustrate the application of our framework by generating a HARDI atlas from a datasetconsisting of typically developing pediatric and young adolescent subjects, although themethod is generalizable to any population under study. By comparing regional FOD spatialvariances in anatomical labels to the variances computed from the regions determined by ourclustering method, we demonstrate the ability our algorithms to generate atlases consistingof homogeneous WM regions well beyond what is achievable using the neuroanatomicallabeling available in existing WM atlases. Average measures in these homogenous regionscan then be used for subsequent statistical analysis and as the basis for between group andlongitudinal within-group investigations. Anatomical interpretability of these study specificatlases generated by our method is imparted by establishing a correspondence with anexisting atlas such as the EVE-DTI (Oishi, Faria et al. 2009) atlas in the presented case, butthis could, in principle, be replaced by any anatomical atlas deemed of importance by thehypotheses of the study for which the atlas is being created.
2. Methods and MaterialsThis paper presents an automated method for creating a HARDI-based WM atlas for a givenclinical population which will establish a common spatial reference frame to facilitatefurther investigation of WM differences. The generation of the WM atlas consists of anumber of steps. First, an image of fiber orientation distribution (FOD) functions iscomputed for each subject’s diffusion-weighted (DW)-MRI dataset. A non-linear spatialnormalization process (Bloy and Verma 2010; Geng, Ross et al. 2011) is applied to deform
Bloy et al. Page 3
Neuroimage. Author manuscript; available in PMC 2013 February 15.
NIH
-PA Author Manuscript
NIH
-PA Author Manuscript
NIH
-PA Author Manuscript

each subject’s FOD image into the spatial domain defined by a single individual, chosen toact as the population template. Following registration, a population averaged FOD image iscomputed and a data driven clustering algorithm is applied (Bloy, Ingalhalikar et al. 2011) todivide the white matter into regions of homogenous WM architecture. This parcellationalgorithm is designed to determine spatially compact regions that have a low spatial variancein the normalized FOD space and thus are comprised of voxels possessing both a similarorientation as well as a similar level of complexity (as imaging surrogates of low biological/tissue variance). These traits make these regions ideal candidates for regional statisticalanalysis (Kubicki, Westin et al. 2002; Alexander, Lee et al. 2007; Lee, Bigler et al. 2007;Fletcher, Whitaker et al. 2010) or as input features to a pattern classification method (Bloy,Ingalhalikar et al. 2011; Ingalhalikar, Parker et al. 2011). These regions are not necessarilyintended to correspond directly to named anatomical structures provided by conventionallabels such as the internal capsule, corpus callosum etc., but might for example expose sub-parcellation within such structures. To impart this additional anatomical information alabeling procedure is applied to assign WM labels derived from the EVE-DTI atlas ( (Oishi,Faria et al. 2009) http://cmrm.med.jhmi.edu/cmrm/atlas/human_data/) to each region.
2.1. Fiber orientation distribution functionThe fiber orientation distribution function (FOD) is the HARDI data model used in thiswork to quantify the WM architecture at each voxel. The FOD model (Tournier, Calamanteet al. 2004; Anderson 2005) represents each voxel’s DW-MRI signal as the sphericalconvolution of the FOD and the DW-MRI signal that would be measured for a single fiberbundle aligned along the z-axis. We utilized the constrained spherical deconvolution method(Tournier, Calamante et al. 2007) to compute the real spherical harmonic (RSH)representation of FOD, which is then normalized to have unit integral. Under this
formulation the normalized FOD f is represented as , where Rl,m(θ φ) are the RSH basis functions and f̃l,m are the corresponding RSH coefficients. Thisrepresentation allows for the efficient computation of the difference between two FODsusing the L2 norm of the RSH coefficients as well as a means to rotate the FOD by the useof the Wigner D rotation matrices (Wigner 1931; Edmonds 1960). The FOD model is ofparticular interest in this work, as it contains information concerning both the orientationand partial volume fraction of any fiber bundles present within a voxel, making it well suitedto model WM architecture in complex regions as well as those constituting a single fiberpopulation.
2.2. Creating a population average FOD imageOnce the FOD model has been fitted to each subject’s DW-MRI dataset, a single subject ischosen to act as a template image for spatial normalization. Although any subject can beused to define the template spatial coordinate frame, it is generally best to choose theindividual most representative of the population under study to act as the template subject.For instance, in generating the adolescent atlas in section 3, a twelve year old male subjectserved as the registration template.
With the template defined, the normalized FOD image of each subject is registered to thetemplate FOD image via a two phase registration method (Figure 1), each phase utilizing adifferent similarity measure. The core of both registration phases is the multichanneldiffeomorphic demons framework (Thirion 1998; Vercauteren, Pennec et al. 2009),discussed in the appendix A. The demons framework is designed to minimize an energyfunctional based on the difference metric between the fixed (template) and moving (subject)FOD images, F and M. By representing F and M in different feature spaces, the contribution
Bloy et al. Page 4
Neuroimage. Author manuscript; available in PMC 2013 February 15.
NIH
-PA Author Manuscript
NIH
-PA Author Manuscript
NIH
-PA Author Manuscript

of orientation information to the demons algorithm can be managed in each registrationphase, controlling the sensitivity of the registration method to the orientations of the FODs.
In the first phase, the demon’s registration framework is used to minimize an orientationinvariant metric between the FODs of the fixed and moving images (F and M), at each
voxel, . As the basis functions of each RSH order (llevel) span a subspace which is closed under rotations (Edmonds 1960; Frank 2002; Green
2003; Bloy and Verma 2010), the spectral power in the lth order, is arotationally invariant feature of f. Therefore using the above metric in the spectral powerspace yields a registration process that is insensitive to rotations of the FODs of each image,allowing the computationally expensive reorientation process to be removed from thisregistration phase increasing its computational efficiency.
The second, orientation sensitive, registration phase uses the full vector of RSH coefficientsto representation the FOD at each voxel, minimizing the L2 metric in the full RSH space,
. This metric measures the totalamplitude difference between the two spherical functions, f and g, and is inherently sensitiveto the orientations of both. Because of this sensitivity, during the demons optimizationprocess, we reorient the moving image, using the finite strain reorientation scheme(Alexander, Pierpaoli et al. 2001), when applying the transformation at the current iteration.It may be noted that our registration algorithm can be replaced by similar HARDI basedregistration techniques (Geng, Ross et al. 2011; Raffelt, Tournier et al. 2011; Yap, Chen etal. 2011).
Following spatial normalization, each subject’s FOD image has been registered into thesame spatial coordinate system allowing the computation of the average FOD image for thepopulation as well as the covariance matrix computation for the FOD coefficients. Thisaverage is obtained by averaging each RSH coefficient independently, which equates to thegeometric mean performed in the RSH space. These mean and covariance images can serveboth as a registration target for newly acquired subjects, as well as a simple first levelanalysis for identifying strong acute WM abnormalities such as lesions.
2.3. White Matter ParcellationThe process of parcellating the WM volume into spatially homogenous regions begins withthe population average FOD image, as well as a binary image mask indicating which voxelsconsist of white matter tissue. Regions are then determined by using a spatially coherentnormalized cuts algorithm (Bloy, Ingalhalikar et al. 2011) to cluster the WM volume. Thealgorithm, based on the superpixel (Mori 2005) methodology, works by iteratively dividingthe most heterogeneous region into spatially connected parts until each of the resultantregions meet a homogeneity criterion. A region’s heterogeneity (Φ(R)) is represented by theaverage squared distance between the mean FOD ( μ) and the FOD (fi) of every voxel in theregion.
Bloy et al. Page 5
Neuroimage. Author manuscript; available in PMC 2013 February 15.
NIH
-PA Author Manuscript
NIH
-PA Author Manuscript
NIH
-PA Author Manuscript

This measure is related to the normalized trace of the FOD covariance matrix, and cantherefore be interpreted similar to a variance.
The white matter volume is initially divided into a collection of regions, C, using a seedgrowing algorithm (appendix C) to identify any spatially disconnected components. From Cwe choose the region of the highest heterogeneity (Φ(R)), which is then bipartitioned usingthe normalized cuts (N-Cut) algorithm, discussed in appendix B. The N-cut algorithm ismediated by the chosen form of the similarity function (k(xi,xj)). In this work we measurethe similarity between two white matter voxels, with FODs and spatial locations given by fiand pi, using a product of a Gaussian kernel over the normalized FOD domain (standarddeviation σf) and a Gaussian kernel (standard deviation σs) over the voxels’ spatial locations.
The seed growing algorithm is then applied to each of the resultant regions, dividing anyregion that contains spatially disconnected components. Thus at each iteration, the regionwith the highest degree of non uniformity is replaced by spatially compact sub-regions. Thisprocess is repeated until every region has heterogeneity below a predefined threshold (ε). Inorder to control the generation of exceedingly small regions (< 5 voxels) that may beoccasionally created, we apply a post processing step that identifies small regions andcombines them with the neighboring region with the most similar mean FOD.
At the completion of automated clustering routine, the WM volume is divided into regionsthat have a degree of heterogeneity, as measured via the FODs, below the prescribedthreshold. The boundaries of these regions are determined by the HARDI FOD contrast thatis available within the data itself and thus takes full advantage of the contrast available fromthe HARDI.
2.4. Anatomical LabelingIt is advantageous, for instance when interpreting the location of abnormalities, to know theanatomical label of a specific region. This requires the additional step of labeling each ofthese data defined ROIs with anatomical labels provided by a co-registered anatomical atlas.We accomplish this by using an existing WM anatomical atlas, for instance the ICBM-DTI-81 (Mori, Oishi et al. 2008) or EVE-DTI atlases, to provide anatomical labels to eachof the homogeneous WM regions that we determine. This is accomplished by using non-linear registration to spatially normalize the atlas’ structural image to the population averagestructural image. The percent overlap between each WM region and the existing anatomicalatlas regions are computed. For each WM region any anatomical label with greater than a10% overlap is assigned to that WM region allowing for the possibility of multipleanatomical labels being assigned to regions that span the boundaries of anatomically definedregions.
The final result of the entire parcellation algorithm is a hierarchical two level white matteratlas. Each white matter voxel is first assigned a label representing which data driven ROI itbelongs to. Secondly each of these ROIs is assigned a combination of anatomical labelsbased on the regional overlap to an existing anatomical atlas. The finer data driven ROIs aredesigned to consist of homogenous WM, as measured by a low FOD variance and may beuseful for statistical analysis or to extract regional features to comprehensively represent asubject’s WM architecture. The anatomical labels provide a more global anatomical context
Bloy et al. Page 6
Neuroimage. Author manuscript; available in PMC 2013 February 15.
NIH
-PA Author Manuscript
NIH
-PA Author Manuscript
NIH
-PA Author Manuscript

to each ROI allowing both the location and in some cases function of each ROI to beascertained and communicated to other researchers.
3. Results: Development of a population atlas (an illustrative example)The problem of atlas generation or region of interest (ROI) delineation occurs in anypopulation study where regional imaging measures serve for the basis of group comparison,such as ROI statistical analysis or subject based classification. The problem is however mostacute when new imaging modalities, such as HARDI, are being utilized (for which noanatomical atlases exist) or when the population under study has not been used forgenerating atlases previously (such as in a younger population). For this reason, we illustratethe application of our WM atlas generation framework by creating a population atlas from adataset of typically developing adolescent and preadolescent healthy subjects (6–18years).This specific population is of interest to many WM researchers involved in studies ofyounger populations at varying developmental stages, specifically those studying autismspectrum disorder and schizophrenia, which are believed to effect WM architecture anddevelopment (Kubicki, McCarley et al. 2007; Verhoeven, De Cock et al. 2010). This is anillustrative atlas, and may need to be regenerated with a larger sample size, or to suit specificclinical purposes.
3.1. Imaging datasetThe dataset consisted of 23 typically developing children (TDC) between the ages of 6 and18 years (mean 11.2 ± 2.7 years). All participants were carefully screened, using parentreport questionnaires and a telephone interview, to insure that they did not have a history ofcurrent or prior neuropsychiatric symptomatology. Moreover, T1 weighted brain imageswere evaluated clinically by a board certified neuroradiologist and all participants in thisstudy were found to completely anomaly free. For each subject a whole brain HARDIdataset was acquired using a Siemens 3T Verio™ MRI scanner using a monopolar Stejskal-Tanner diffusion weighted spin-echo, echo-planar imaging sequence (TR/TE=14.7s/110ms,2mm isotropic voxels, b=3000 s/mm2, number of diffusion directions=64, 2 b0 images, scantime 18 minutes). In order to facilitate tissue segmentation as well the coregistration with anexisting atlas lacking a HARDI component, such as the EVE-DTI or the ICBM-152, astructural image was acquired, using an MP-RAGE imaging sequence (TR/TE/TI = 19s/2.54ms/.9s, 0.8mm in plane resolution, 0.9mm slice thickness ).
3.2. DW-MRI and Structural preprocessingPrior to computing the FOD image from each subject’s DW-MRI image a number ofpreprocessing steps were performed in order to reduce imaging artifacts and improve signalto noise. First, the DW-MRI images were filtered using a joint linear minimum meansquared error filter to remove Rician noise (Tristán-Vega and Aja-Fernández 2010). Thiswas followed by eddy current and motion correction performed via the affine registration ofeach DW-MRI volume to the non diffusion-weighted (b0) image (Jezzard, Barnett et al.1998). The normalized FOD image for each subject was then computed using theconstrained spherical deconvolution method (Tournier, Calamante et al. 2007) andnormalized to have unit integral.
Using each subject’s structural MP-RAGE image, their white matter segmentation wasdetermined by the following procedure. Skull-stripping and bias field correction wereperformed using the BET (Smith 2002) tool and N3 bias correction (Sled, Zijdenbos et al.1998). Tissue segmentation was then performed, to identify cerebrospinal fluid, gray andwhite matter voxels, using an adaptive K-means clustering (Pham and Prince 1999). A rigidbody registration, between the b0 image and the bias corrected structural image was
Bloy et al. Page 7
Neuroimage. Author manuscript; available in PMC 2013 February 15.
NIH
-PA Author Manuscript
NIH
-PA Author Manuscript
NIH
-PA Author Manuscript

performed. Using this deformation field, the white matter segmentation mask was thenresampled into the diffusion space yielding a white matter segmentation mask for eachsubject.
3.3. RegistrationThe FOD image of each subject was then non-linearly registered to that of a 12 year oldmale, who was chosen to serve as the template subject. An affine registration between the b0images, was performed using the FLIRT (Jenkinson and Smith 2001) software tool. Thistransformation was then used to initialize the two phase registration method described insection 2.2. Once this process was completed for each of the 23 subjects, a populationaverage FOD image was computed by averaging each RSH component of the registeredsubject FOD images individually. Using the computed deformation fields, each subject’sWM segmentation mask was deformed into the template coordinate frame and thenaveraged and thresholded to yield a binary mask describing the voxels that were consideredWM in over 40% of the subjects. These 2 images, the population average FOD image andthe population WM mask are then used to determine the atlas regions.
The benefits of using nonlinear spatial registration to determine the population templateimage, as opposed to affine registration used in several of the existing population atlases(Mazziotta, Toga et al. 1995; Mori, Oishi et al. 2008), are illustrated through a markeddecrease in the voxelwise FOD variance across the sample. The FOD variance at a voxel, x,
is determined by .
Variance maps computed following the affine registration (Panel A) and our registrationmethod (Panel B) are shown in Figure 2. These results show a global decrease in the FODvariance while drastically reducing the variance in key central WM regions, indicating aclear benefit from using the non-linear registration algorithm.
3.4. Region DelineationThe key aspect of our atlas generation framework is the method described in section 2.3used to delineate regions of spatially homogeneous WM. Our automated WM parcellationmethod was applied using the population average FOD image to model the WM architectureand using the population WM mask to identify WM voxels.
An investigation of the parameters used to define the WM similarity kernel, σf and σs, aswell as the stopping variance threshold, ε, was performed. Adjusting the σf and σsparameters had the expected behavior of controlling the spatial smoothness of thedetermined regions. Similar results, in terms of both the number of regions, average regionsize, and average regional FOD variance were found when varying σf in the 0.1 – 0.3 rangeand σs in the 6mm – 10mm range. Adjusting ε has the most direct effect on the resultingparcellations as it determines at what point the subdivision process is halted. Figure 3 showsthe results of our method as ε is changed between 0.06 and 0.1. As ε is decreased there is aclear decrease in the regional variance as well as an increase in the number of regionsdetermined, resulting in a coarser regional delineation. This relationship, between theachieved regional variance and the number of regions, suggests that in practice thisparameter must be tailored to the population under study as well as to the intended use of thederived atlas regions.
Based on these results, two atlases were generated. A coarse atlas was generated using theparameters σs = 6mm, σf = 0.3 and ε = 0.15 while the finer atlases used a lower haltingthreshold of ε = 0.08. The iterative nature of the parcellation algorithm yields a hierarchical
Bloy et al. Page 8
Neuroimage. Author manuscript; available in PMC 2013 February 15.
NIH
-PA Author Manuscript
NIH
-PA Author Manuscript
NIH
-PA Author Manuscript

relationship between these atlases, with the ε = 0.15 regions being supersets of the ε = 0.08regions. The finer atlas consists of 379 spatially compact regions with an average regionalsize of 105 2mm3 voxels and a mean regional FOD variance of 0.06, while the coarse atlasconsists of 94 regions with an average regional size of 423 2 mm3 voxels and mean regionalFOD variance of 0.10. Representative coronal slices of the coarse and fine atlases are shownin Figure 4. The rough bilateral symmetry of the regions is clearly visible in the coarse atlas,while at the finer scale the bilaterality is less apparent particularly in complex WM regions.Figure 5 shows representative slices of the finer atlas and corresponding regional FODvariance maps. The orientation sensitive aspect of the similarity kernel groups voxels withsimilar orientation, as seen in the genu and splenium of the corpus callosum, whilesensitivity to the WM complexity aids in parcellating the cortical WM.
3.5. Comparison with anatomical atlas defined regionsWe utilized the EVE-DTI atlas to create an anatomical WM parcellation that would be usedboth as a comparison as well as to provide our data defined regions with anatomical contextas described in section 2.4. This was achieved by using a nonlinear spatial normalizationalgorithm to transform the structural, T1 weighted image provided as part of the EVE-DTIatlas into the space defined by the group average T1-weighed image (T1-weighted imageswere used for registration as this was the common modality between the HARDI populationand the DTI anatomical atlas). Using this deformation field, the anatomical labels providedby the EVE-DTI atlas were then transformed into the template space yielding an alternativeparcellation. Figure 6 shows a comparison between the population atlases, generated using ε= 0.15 and ε = 0.08, and the anatomical regions inherited from the EVE-DTI atlas. A clearimprovement in regional FOD variance is achieved using the ε = 0.15 data driven atlasregions, with a further improvement at the expense of generating a moderately largernumber of regions when using the finer atlas (ε = 0.08).
4. DiscussionWe have proposed an automated atlas building method that utilizes HARDI data and theFOD diffusion model to provide improved contrast in complex WM regions using a non-linear spatial normalization to more accurately determine spatial correspondence and a noveldata-driven WM parcellation algorithm that allows automated regional labeling based onmodels of the local WM architecture as opposed to the traditional time consuminganatomical labeling. The automatic nature of these methods permits researchers to generatetheir own atlas based on the datasets of their specific study. This overcomes many issuesthat occur when attempting to use published atlases, such as different clinical populations(ages) or imaging protocols being utilized to generate the atlas.
Similar to the cytoarchitectural mapping of the brain (Brodmann 1909), where localvariations in cell type are used to delineate cortical regions, our method uses the FOD as anon-invasive imaging measure of local tissue architecture to delineate WM regions. Throughthe application of this methodology to the problem of generating an age specific populationatlas, adolescent and preadolescent healthy subjects in our case, we show that these regionsare more homogenous, with respect to WM orientation and complexity, than the regionsinherited from an existing DTI based anatomical atlas. This suggests that these regions arebetter suited for regional statistical analysis or the extraction of regional features of WMarchitecture to be used in subsequent applications such as pattern classification and are thusperhaps more faithful to the overall goal of identifying regions of biological homogeneity.
The generation of the illustrative WM atlas shows that both the spatial normalization andWM parcellation methods outperform the typical processing methods that are generallyutilized for determining WM atlases. A comparison of voxel wise population variance maps,
Bloy et al. Page 9
Neuroimage. Author manuscript; available in PMC 2013 February 15.
NIH
-PA Author Manuscript
NIH
-PA Author Manuscript
NIH
-PA Author Manuscript

figure 2, generated from the non-linear and affine registration shows the clear improvementin both global and focal variances when using the non-linear registration technique. Thisdecrease in FOD variance is critical for the accurate computation of the population averageFOD image and the stability of the final atlas regions. Similarly, a comparison between theanatomical regions of the EVE-DTI atlas and those determined by our method, shown infigure 5, indicate the benefit of using data-driven regions to represent local WMarchitecture, through the marked decrease in regional FOD variance. This decrease suggeststhat the data determined regions are more tightly related to the local WM anatomy, whichmay have significant benefits when examining clinical populations (e.g., schizophrenia,autism spectrum disorder). While bilateral symmetry is not considered in the regiondelineation process, the roughly bilateral nature of WM anatomy is still clearly apparent inthe data defined regions, shown in figure 4, particularly at the coarser spatial scalars.
The proposed framework provides three parameters which affect the regions that aredetermined. Of these three, the stopping criterion, ε, has the most pronounced affect, seen infigure 3, on both the number of regions determined and, more significantly, the regionalFOD variances of these regions. The other 2 parameters, σs and σf, determine the kernelsused in the similarity functions, affecting the smoothness of the ROIs, in the spatial andfeature domain and in turn, the number and size of the resulting regions but had little effecton the regional FOD variance of the regions. In practice, selection of ε should be based onthe desired degree of uniformity required for the regions while the other parameters are bestset based on qualitative assessment of the resulting atlas. This process need only be doneonce for a new population and requires little effort particularly when compared with theprocess of manually correcting anatomical regions.
The stability of the clustering, in terms of specific boundary locations, is mainly governedby the robustness of the population average. For this reason it is important to ensure that asufficient number of subjects are used to make up the population average. If this number issuitably large the effect of additional subjects on the population average and thus on theparcellation results will be negligible. In practice, the study specific atlas is generated whenthe study is ready for a statistical analysis. The atlas is created once, using the sample sizedetermined by the study’s power calculations, and reflects the local variation in the specificdataset.
While the focus of this work has been on the delineating homogenous WM regions, theability to include global anatomical information into the regions is also important. Thisanatomical information not only improves the interpretation of any subsequent results byproviding anatomical context to the regions, aiding in hypothesis formulation, but alsofacilitates meta-analytic studies by utilizing existing anatomical terminology. In our case wehave used the EVE-DTI WM atlas to impart this global information; however, anyanatomical atlas can, in principle, be used in the method. For instance, as developmentalstudies progress, the inclusion of pediatric anatomical and functional atlases can beincorporated for various ages. The ability to assign domain specific labels, either functionalor otherwise, to the WM regions determined by our method yields a multi-faceted approachto atlas creation, giving researchers tremendous flexibility concerning the informationcontent available in the atlas, which will prove extremely useful as research protocols movetowards utilizing multiple modalities.
The fact that this paper describes an atlas generation methodology as opposed to simply thedescription of a single population HARDI atlas, like the ICBM-DTI-81 (Mori, Oishi et al.2008), is indicative of our belief that optimal results from a group study are obtained whenthe specific traits of the population and data are utilized. While we have focused on WM,developing novel clustering methods based on the state of the art modeling of WM
Bloy et al. Page 10
Neuroimage. Author manuscript; available in PMC 2013 February 15.
NIH
-PA Author Manuscript
NIH
-PA Author Manuscript
NIH
-PA Author Manuscript

architecture, the central theme of his work is applicable to many other atlas buildingproblems. For instance gray matter regions could be parcellated based on their structural andfunctional connectivity profiles, ostensibly generating regions that more closely respect thestructure/function relationship within the population understudy.
It is important to note that while the method presented in this paper makes use of high b-value (3000 s/mm2) HARDI data, the principles of the clustering algorithm can be extendedto other diffusion models and other b-values. A method that makes use of the diffusiontensor model acquired on lower b-value data is currently under development. While such amethod will prove useful to many researchers, as DTI is now routinely acquired, it is stillunclear how parcellations generated from DTI will compare with those generated usingHARDI. It is similarly unclear exactly how large a role the improved angular resolvingpower garnered from high b-value HARDI data plays in the WM parcellation. Based on theimprovements of modeling complex WM regions using HARDI data models at higher b-values one might expect better delineation in regions of fiber crossing etc. However thedefinitive comparison will have to wait until a technically-suitable dataset consisting of bothHARDI and DTI data has been acquired on the same subjects.
In conclusion this paper presents a methodology for creating HARDI white matter atlasesusing the fiber orientation distribution (FOD) diffusion model. The automated nature of themethods allows for their efficient application to any population without relying on the timeconsuming task of manual anatomical delineation. The resulting atlas consists of regionsdesigned to be homogenous with respect to the local architecture of the WM and are thusideally suited for either statistical analysis or to be used as features within a patternclassification framework.
AcknowledgmentsThis research was supported by the NIH grants T32-EB000814(LB), R01-MH079938 (RV), R01-MH092862 (RV),R01-DC008871 (TR), a grant from the Nancy Lurie Marks Family Foundation (TR) and the Center grantSAP#4100047863 (RS). Dr Roberts would like to thank the Oberkircher Family for the Oberkircher Family Chairin Pediatric Radiology.
ReferencesAlexander AL, Lee JE, et al. Diffusion tensor imaging of the corpus callosum in Autism. Neuroimage.
2007; 34(1):61–73. [PubMed: 17023185]Alexander DC, Pierpaoli C, et al. Spatial transformations of diffusion tensor magnetic resonance
images. Medical Imaging, IEEE Transactions on. 2001; 20(11):1131–1139.Anderson AW. Measurement of fiber orientation distributions using high angular resolution diffusion
imaging. Magnetic Resonance in Medicine. 2005; 54(5):1194–1206. [PubMed: 16161109]Ashburner J. Computational anatomy with the SPM software. Magn Reson Imaging. 2009; 27(8):
1163–1174. [PubMed: 19249168]Basser PJ, Mattiello J, et al. Estimation of the effective self-diffusion tensor from the NMR spin echo.
J Magn Reson B. 1994; 103(3):247–254. [PubMed: 8019776]Bloy L, Ingalhalikar M, et al. HARDI based Pattern Classifiers for the Identification of White Matter
Pathologies. Med Image Comput Comput Assist Interv Int Conf Med Image Comput Comput AssistInterv. 2011
Bloy L, Ingalhalikar M, et al. Neuronal white matter parcellation using spatially coherent normalizedcuts. Proc IEEE Int Biomedical Imaging: From Nano to Macro Symp. 2011
Bloy L, Verma R. Demons registration of high angular resolution diffusion images. Proc IEEE IntBiomedical Imaging: From Nano to Macro Symp. 2010
Brodmann, K. Vergleichende Lokalisationslehre der Grosshirnrinde in ihren Prinzipien dargestellt aufGrund des Zellenbaues. Leipzig: Johann Ambrosius Barth Verlag; 1909.
Bloy et al. Page 11
Neuroimage. Author manuscript; available in PMC 2013 February 15.
NIH
-PA Author Manuscript
NIH
-PA Author Manuscript
NIH
-PA Author Manuscript

Collins DL, Holmes CJ, et al. Automatic 3-D model-based neuroanatomical segmentation. HumanBrain Mapping. 1995; 3(3):190–208.
Descoteaux M, Angelino E, et al. Regularized, fast, and robust analytical Q-ball imaging. MagneticResonance in Medicine. 2007; 58(3):497–510. [PubMed: 17763358]
Edmonds, AR. Angular Momentum in Quantum Mechanics. Princeton University Press; 1960.Fletcher PT, Whitaker RT, et al. Microstructural connectivity of the arcuate fasciculus in adolescents
with high-functioning autism. Neuroimage. 2010; 51(3):1117–1125. [PubMed: 20132894]Frank LR. Characterization of anisotropy in high angular resolution diffusion-weighted MRI.
Magnetic Resonance in Medicine. 2002; 47(6):1083–1099. [PubMed: 12111955]Geng X, Ross TJ, et al. Diffeomorphic image registration of diffusion MRI using spherical harmonics.
IEEE Trans Med Imaging. 2011; 30(3):747–758. [PubMed: 21134814]Green, R. Spherical Harmonic Lighting: The Gritty Details. Archives of the Game Developers
Conference; 2003.Hamm J, Ye DH, et al. GRAM: A framework for geodesic registration on anatomical manifolds. Med
Image Anal. 2010; 14(5):633–642. [PubMed: 20580597]Hecke WV, Leemans A, et al. The effect of template selection on diffusion tensor voxel-based analysis
results. NeuroImage. 2011; 55(2):566–573. [PubMed: 21146617]Hecke WV, Sijbers J, et al. On the construction of an inter-subject diffusion tensor magnetic resonance
atlas of the healthy human brain. NeuroImage. 2008; 43(1):69–80. [PubMed: 18678261]Hernandez V, Roman JE, et al. SLEPc: A Scalable and Flexible Toolkit for the Solution of Eigenvalue
Problems. ACM Transactions on Mathematical Software. 2005; 31(3):351–362.Ingalhalikar M, Parker D, et al. Diffusion based abnormality markers of pathology: Toward learned
diagnostic prediction of ASD. NeuroImage. 2011Jenkinson M, Smith S. A global optimisation method for robust affine registration of brain images.
Med Image Anal. 2001; 5(2):143–156. [PubMed: 11516708]Jezzard P, Barnett AS, et al. Characterization of and correction for eddy current artifacts in echo planar
diffusion imaging. Magn Reson Med. 1998; 39(5):801–812. [PubMed: 9581612]Kubicki M, McCarley R, et al. A review of diffusion tensor imaging studies in schizophrenia. J
Psychiatr Res. 2007; 41(1–2):15–30. [PubMed: 16023676]Kubicki M, Westin CF, et al. Uncinate fasciculus findings in schizophrenia: a magnetic resonance
diffusion tensor imaging study. Am J Psychiatry. 2002; 159(5):813–820. [PubMed: 11986136]Lancaster JL, Tordesillas-Gutierrez D, et al. Bias between MNI and Talairach coordinates analyzed
using the ICBM-152 brain template. Hum Brain Mapp. 2007; 28(11):1194–1205. [PubMed:17266101]
Lancaster JL, Woldorff MG, et al. Automated Talairach atlas labels for functional brain mapping. HumBrain Mapp. 2000; 10(3):120–131. [PubMed: 10912591]
Lee JE, Bigler ED, et al. Diffusion tensor imaging of white matter in the superior temporal gyrus andtemporal stem in autism. Neuroscience letters. 2007; 424(2):127–132. [PubMed: 17714869]
Mazziotta J, Toga A, et al. A probabilistic atlas and reference system for the human brain:International Consortium for Brain Mapping (ICBM). Philos Trans R Soc Lond B Biol Sci. 2001;356(1412):1293–1322. [PubMed: 11545704]
Mazziotta JC, Toga AW, et al. A probabilistic atlas of the human brain: theory and rationale for itsdevelopment. The International Consortium for Brain Mapping (ICBM). NeuroImage. 1995; 2(2):89–101. [PubMed: 9343592]
Mori G. Guiding Model Search Using Segmentation. IEEE International Conference on ComputerVision. 2005; 2:1417–1423.
Mori S, Oishi K, et al. Stereotaxic white matter atlas based on diffusion tensor imaging in an ICBMtemplate. Neuroimage. 2008; 40(2):570–582. [PubMed: 18255316]
Mori S, Oishi K, et al. Stereotaxic white matter atlas based on diffusion tensor imaging in an ICBMtemplate. Neuroimage. 2008; 40(2):570–582. [PubMed: 18255316]
Moseley ME, Cohen Y, et al. Diffusion-weighted MR imaging of anisotropic water diffusion in catcentral nervous system. Radiology. 1990; 176(2):439–445. [PubMed: 2367658]
Bloy et al. Page 12
Neuroimage. Author manuscript; available in PMC 2013 February 15.
NIH
-PA Author Manuscript
NIH
-PA Author Manuscript
NIH
-PA Author Manuscript
Oishi K, Faria A, et al. Atlas-based whole brain white matter analysis using large deformationdiffeomorphic metric mapping: application to normal elderly and Alzheimer’s disease participants.NeuroImage. 2009; 46(2):486–499. [PubMed: 19385016]
Pham DL, Prince JL. Adaptive fuzzy segmentation of magnetic resonance images. IEEE Trans MedImaging. 1999; 18(9):737–752. [PubMed: 10571379]
Raffelt D, Tournier JD, et al. Symmetric diffeomorphic registration of fibre orientation distributions.NeuroImage. 2011; 56(3):1171–1180. [PubMed: 21316463]
Rahimi A, Recht B. Clustering with Normalized Cuts is Clustering with a Hyperplane. StatisticalLearning in Computer Vision. 2004
Shi JB, Malik J. Normalized cuts and image segmentation. Ieee Transactions on Pattern Analysis andMachine Intelligence. 2000; 22(8):888–905.
Sled JG, Zijdenbos AP, et al. A nonparametric method for automatic correction of intensitynonuniformity in MRI data. IEEE Trans Med Imaging. 1998; 17(1):87–97. [PubMed: 9617910]
Smith SM. Fast robust automated brain extraction. Hum Brain Mapp. 2002; 17(3):143–155. [PubMed:12391568]
Talairach, J. Co-Planar Stereotaxic Atlas of the Human Brain: 3-D Proportional System: An Approachto Cerebral Imaging. New York: Thieme; 1988.
Thirion JP. Image matching as a diffusion process: an analogy with Maxwell’s demons. Med ImageAnal. 1998; 2(3):243–260. [PubMed: 9873902]
Toga AW, Thompson PM, et al. Towards multimodal atlases of the human brain. Nat Rev Neurosci.2006; 7(12):952–966. [PubMed: 17115077]
Tournier JD, Calamante F, et al. Robust determination of the fibre orientation distribution in diffusionMRI: Non-negativity constrained super-resolved spherical deconvolution. NeuroImage. 2007;35(4):1459–1472. [PubMed: 17379540]
Tournier JD, Calamante F, et al. Direct estimation of the fiber orientation density function fromdiffusion-weighted MRI data using spherical deconvolution. NeuroImage. 2004; 23(3):1176–1185.[PubMed: 15528117]
Tristán-Vega A, Aja-Fernández S. DWI filtering using joint information for DTI and HARDI. MedImage Anal. 2010; 14(2):205–218. [PubMed: 20005152]
Tuch DS. Q-ball imaging. Magnetic Resonance in Medicine. 2004; 52(6):1358–1372. [PubMed:15562495]
Vercauteren T, Pennec X, et al. Diffeomorphic demons: efficient non-parametric image registration.Neuroimage. 2009; 45(1 Suppl):S61–S72. [PubMed: 19041946]
Verhoeven JS, De Cock P, et al. Neuroimaging of autism. Neuroradiology. 2010; 52(1):3–14.[PubMed: 20033797]
Wakana S, Jiang H, et al. Fiber Tract-based Atlas of Human White Matter Anatomy. Radiology. 2004;230(1):77–87. [PubMed: 14645885]
Wigner, EP. Gruppentheorie und ihre Anwendungen auf die Quantenmechanik der Atomspektren.Vieweg Verlag; Braunschweig: 1931.
Yap PT, Chen Y, et al. SPHERE: SPherical Harmonic Elastic REgistration of HARDI data.NeuroImage. 2011; 55(2):545–556. [PubMed: 21147231]
Zhang H, Avants BB, et al. High-dimensional spatial normalization of diffusion tensor imagesimproves the detection of white matter differences: an example study using amyotrophic lateralsclerosis. IEEE Trans Med Imaging. 2007; 26(11):1585–1597. [PubMed: 18041273]
Appendix A. Multichannel Diffeomorphic DemonsGiven a fixed and moving image, F and M, the diffeomorphic demons algorithm seeks todetermine a correction to the current transformation, s, of the form exp(u). This update
minimizes a global energy functional, ,
Bloy et al. Page 13
Neuroimage. Author manuscript; available in PMC 2013 February 15.
NIH
-PA Author Manuscript
NIH
-PA Author Manuscript
NIH
-PA Author Manuscript

where p are points in Ω, the domain of the fixed image, F. The term accounts for imagenoise and interpolation error and acts as a regularizer for determining the update field. Wecan linearize the image similarity term in the region of u = 0 as F(p) − M∘s∘exp(u(p)) = F(p)−M∘s(p)+Jpu and in the case where F and M are images of vectors, Jp is the Jacobian matrix.With this linearization the energy functional simplifies to
If we make the assumption that the voxels are independent, which is not strictly true whenperforming reorientations, the optimization of Es(u) can be broken up in to individualequations for each point p.
yielding update step
We use the symmetric computation of the Jacobian, where Jp (F )and Jp (M ∘ s) are the Jacobians of the fixed and deformed moving images at the point p.Each iteration of the diffeomorphic demons method can summarized as follows
1. compute an update step u
2. smooth u with a Gaussian filter
3. s ← s ∘ u
4. Deform the moving image using s
5. Apply reorientation if needed
This process is repeated until the update steps no longer substantially reduce the imagedifference. The deformation field s is then applied to the moving image resulting in the finaldeformed subject image.
Appendix B. Spatially Coherent Normalized CutsThe normalized cuts (N-Cut) algorithm (Shi and Malik 2000; Rahimi and Recht 2004) is ameans of partitioning a set of data points x, in our case a set of white matter voxels, based ona provided similarity measure k(x, y). Using the similarity measure we build an affinitymatrix such that Ki,j = k(xi, xj ). The affinity matrix describes the weights of a fullyconnected undirected graph using x as the nodes. The N-cut algorithm labels each nodedividing the vertices into 2 sets A and B. The cost Cut(A, B) is the sum of all connectionsbetween elements of A and elements of B. The goal is to find the labeling that minimizes the
Bloy et al. Page 14
Neuroimage. Author manuscript; available in PMC 2013 February 15.
NIH
-PA Author Manuscript
NIH
-PA Author Manuscript
NIH
-PA Author Manuscript

normalized cut, Cut(A, B)/(Vol(A) + Vol(B)) where Vol() is the sum of the weights within aset.
The labeling is found via a relaxation to the above problem by finding the second largesteigenvector, v, of the matrix . Where D is a diagonal matrix whose iith element isthe sum of all elements in the ith row of K. The labels are determined by examining the signof v. For a more complete discussion please see (Rahimi and Recht 2004).
Our application of the N-Cut algorithm concerns the ability to label WM voxels based ontheir FOD. As discussed above we use a product of two Gaussian kernels with standarddeviations of σf and σs as the basis of our similarity measure yielding the followingsimilarity measure:
where xi and xj are WM voxels with fi, fj, pi, and pj being the corresponding FODs andspatial locations.
Given a collection of WM voxels we compute the affinity matrix K using the abovesimilarity function. The matrix D is then compute and the second largest eigenvector, v, of
is determined using the SLEPc (Hernandez, Roman et al. 2005) softwarepackage. Two new regions are then determined based on the sign of v.
These two regions are then input into a simple seed growing algorithm (described inAppendix C) which divides them into their spatially disconnected subregions yielding a setof spatially connected regions from the single region with high variance.
Appendix C. Seed Growing AlgorithmA seed growing algorithm is used to divide a supplied region into spatially disconnectedsubcomponents. This insures that each of the final resulting regions is fully spatiallyconnected. The algorithm is supplied with a list of voxels, X, comprising the region to bedivided and returns a list of labels, L, which identify which connected subcomponent eachvoxel is a member of. The mechanics of the algorithm are shown below:
Input: list of voxels, XOutput: list of labels, Llabel Value = 1label Members = Øfor all x in X doif x is not labeled thenadd x label Membersrepeaty = next element of label MembersL[y] = label ValueAdd all unlabeled neighbors to label MembersUntil all members of label Members have been visitedlabel Value = label Value +1label Members = Ø
Bloy et al. Page 15
Neuroimage. Author manuscript; available in PMC 2013 February 15.
NIH
-PA Author Manuscript
NIH
-PA Author Manuscript
NIH
-PA Author Manuscript
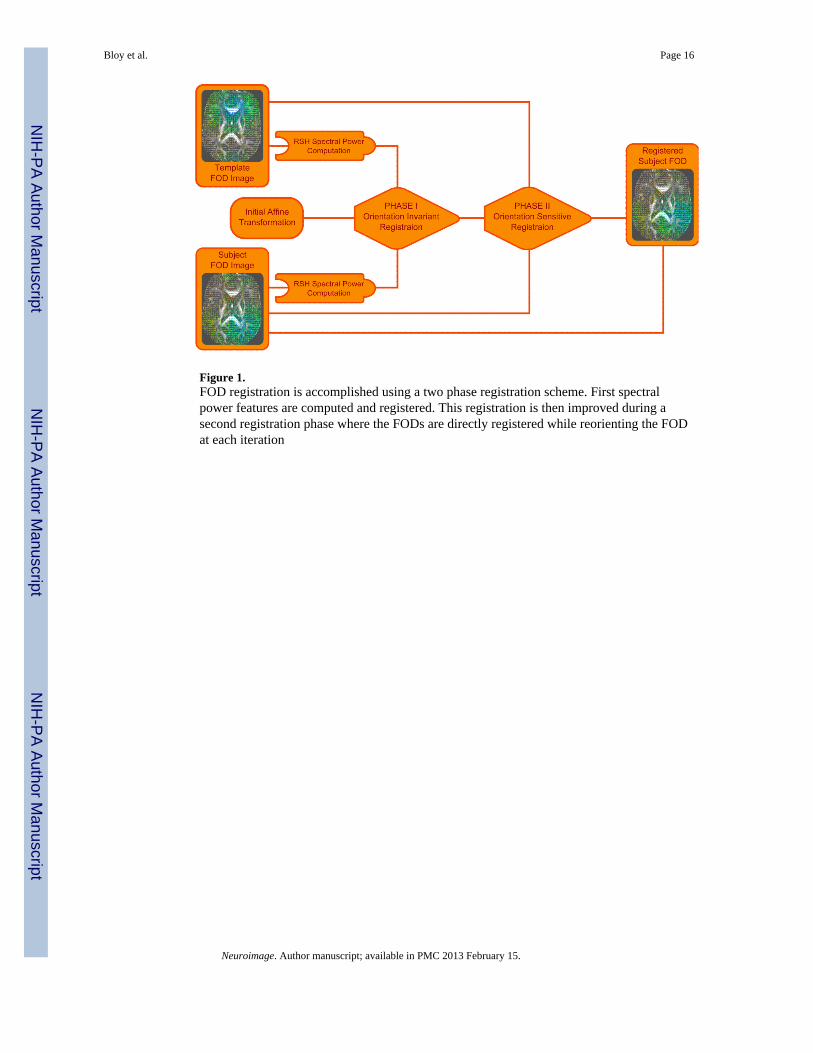
Figure 1.FOD registration is accomplished using a two phase registration scheme. First spectralpower features are computed and registered. This registration is then improved during asecond registration phase where the FODs are directly registered while reorienting the FODat each iteration
Bloy et al. Page 16
Neuroimage. Author manuscript; available in PMC 2013 February 15.
NIH
-PA Author Manuscript
NIH
-PA Author Manuscript
NIH
-PA Author Manuscript

Figure 2.Effect of Registration on lowering voxelwise population FOD variance. FOD variance mapsare shown for affine (A) and non-linear registration (B) methods. The global and focaldecrease in population variance clearly demonstrates the importance of using the non-linearregistration algorithm for atlas generation.
Bloy et al. Page 17
Neuroimage. Author manuscript; available in PMC 2013 February 15.
NIH
-PA Author Manuscript
NIH
-PA Author Manuscript
NIH
-PA Author Manuscript

Figure 3.As the stopping variance threshold, ε is decreased, the expected decrease in the regionalFOD variance is seen. This decrease coincides with an increase in the number of regions aswell as an increase in the coarseness of the parcellation results.
Bloy et al. Page 18
Neuroimage. Author manuscript; available in PMC 2013 February 15.
NIH
-PA Author Manuscript
NIH
-PA Author Manuscript
NIH
-PA Author Manuscript

Figure 4.The general anatomical bilateral symmetry is apparent in the atlas regions. At a higherstopping variance of ε=0.15 (A), this symmetry is more apparent than in the finer regionsobtained using a lower stopping variance of ε=0.08 (B) where the division of complexregions is more heavily influence by the local characteristics of the data. For instance thetwo regions circled in panel B correspond to a single contralateral region.
Bloy et al. Page 19
Neuroimage. Author manuscript; available in PMC 2013 February 15.
NIH
-PA Author Manuscript
NIH
-PA Author Manuscript
NIH
-PA Author Manuscript

Figure 5.Population Atlas generated from 23 young adolescents generated using the parameters σs=6mm, σf = 0.3 and ε = 0.08. Representative slices are shown of the label map indentifinghomogenous WM regions (A) and the corresponding FOD variance (B) images.
Bloy et al. Page 20
Neuroimage. Author manuscript; available in PMC 2013 February 15.
NIH
-PA Author Manuscript
NIH
-PA Author Manuscript
NIH
-PA Author Manuscript

Figure 6.Representative slices of the EVE-DTI atlas’ anatomically defined regions and theircorresponding regional FOD variances are shown in panel A, compared with the datadefined WM regions generated using two stopping variances ε= 0.15 and 0.08. The EVE-DTI anatomical regions are conspicuously more heterogeneous, indicated by high regionalvariance, even in central WM areas. A table listing characteristics of each parcellation isshown in panel B.
Bloy et al. Page 21
Neuroimage. Author manuscript; available in PMC 2013 February 15.
NIH
-PA Author Manuscript
NIH
-PA Author Manuscript
NIH
-PA Author Manuscript
Related Documents