Which process metrics can significantly improve defect prediction models? An empirical study Lech Madeyski • Marian Jureczko Published online: 17 June 2014 Ó The Author(s) 2014. This article is published with open access at Springerlink.com Abstract The knowledge about the software metrics which serve as defect indicators is vital for the efficient allocation of resources for quality assurance. It is the process metrics, although sometimes difficult to collect, which have recently become popular with regard to defect prediction. However, in order to identify rightly the process metrics which are actually worth collecting, we need the evidence validating their ability to improve the product metric-based defect prediction models. This paper presents an empirical evaluation in which several process metrics were investigated in order to identify the ones which significantly improve the defect prediction models based on product metrics. Data from a wide range of software projects (both, industrial and open source) were collected. The predictions of the models that use only product metrics (simple models) were compared with the predictions of the models which used product metrics, as well as one of the process metrics under scrutiny (advanced models). To decide whether the improvements were significant or not, statistical tests were performed and effect sizes were calculated. The advanced defect prediction models trained on a data set containing product metrics and additionally Number of Distinct Committers (NDC) were significantly better than the simple models without NDC, while the effect size was medium and the probability of superiority (PS) of the advanced models over simple ones was high (p ¼ :016, r ¼:29, PS ¼ :76), which is a substantial finding useful in defect prediction. A similar result with slightly smaller PS was achieved by the advanced models trained on a data set containing product metrics and additionally all of the investigated process metrics (p ¼ :038, r ¼:29, PS ¼ :68). The advanced models trained on a data set containing product metrics and additionally Number of Modified Lines (NML) were significantly better than the simple models without NML, but the effect size was small (p ¼ :038, r ¼ :06). Hence, L. Madeyski (&) M. Jureczko Wroclaw University of Technology, Wyb.Wyspianskiego 27, 50370 Wroclaw, Poland e-mail: [email protected] URL: http://madeyski.e-informatyka.pl/ M. Jureczko e-mail: [email protected] 123 Software Qual J (2015) 23:393–422 DOI 10.1007/s11219-014-9241-7

Welcome message from author
This document is posted to help you gain knowledge. Please leave a comment to let me know what you think about it! Share it to your friends and learn new things together.
Transcript
Which process metrics can significantly improve defectprediction models? An empirical study
Lech Madeyski • Marian Jureczko
Published online: 17 June 2014� The Author(s) 2014. This article is published with open access at Springerlink.com
Abstract The knowledge about the software metrics which serve as defect indicators is
vital for the efficient allocation of resources for quality assurance. It is the process metrics,
although sometimes difficult to collect, which have recently become popular with regard to
defect prediction. However, in order to identify rightly the process metrics which are
actually worth collecting, we need the evidence validating their ability to improve the
product metric-based defect prediction models. This paper presents an empirical evaluation
in which several process metrics were investigated in order to identify the ones which
significantly improve the defect prediction models based on product metrics. Data from a
wide range of software projects (both, industrial and open source) were collected. The
predictions of the models that use only product metrics (simple models) were compared
with the predictions of the models which used product metrics, as well as one of the
process metrics under scrutiny (advanced models). To decide whether the improvements
were significant or not, statistical tests were performed and effect sizes were calculated.
The advanced defect prediction models trained on a data set containing product metrics and
additionally Number of Distinct Committers (NDC) were significantly better than the
simple models without NDC, while the effect size was medium and the probability of
superiority (PS) of the advanced models over simple ones was high (p ¼ :016, r ¼ �:29,
PS ¼ :76), which is a substantial finding useful in defect prediction. A similar result with
slightly smaller PS was achieved by the advanced models trained on a data set containing
product metrics and additionally all of the investigated process metrics (p ¼ :038,
r ¼ �:29, PS ¼ :68). The advanced models trained on a data set containing product
metrics and additionally Number of Modified Lines (NML) were significantly better than
the simple models without NML, but the effect size was small (p ¼ :038, r ¼ :06). Hence,
L. Madeyski (&) � M. JureczkoWroclaw University of Technology, Wyb.Wyspianskiego 27, 50370 Wrocław, Polande-mail: [email protected]: http://madeyski.e-informatyka.pl/
M. Jureczkoe-mail: [email protected]
123
Software Qual J (2015) 23:393–422DOI 10.1007/s11219-014-9241-7

it is reasonable to recommend the NDC process metric in building the defect prediction
models.
Keywords Software metrics � Product metrics � Process metrics � Defect prediction
models � Software defect prediction
1 Introduction
Software development companies are seeking for ways to improve the quality of software
systems without allocating too many resources in the quality assurance activities such as
testing. Applying the same testing effort to all modules of a software system is not an
optimal approach, since the distribution of defects among individual parts of a system is
not uniform. According to Pareto-Zipf-type law (Boehm and Papaccio 1988; Denaro and
Pezze 2002; Endres and Rombach 2003), the 80:20 empirical rule is operating here, i.e., a
small amount of code (often quantified as 20 % of the code) is responsible for the majority
of software faults (often quantified as 80 % of the faults). Therefore, it is possible to test
only a small part of a software system and find most of the defects. Defect prediction
models, in turn, may be used to find the defect-prone classes. Hence, the quality assurance
efforts should be focused (unless for critical projects) on the most defect-prone classes in
order to save valuable time and financial resources, and, at the same time, to increase the
quality of delivered software products.
The defect prediction models built on the basis of product metrics are already well
known (Basili et al. 1996; Denaro and Pezze 2002; Gyimothy et al. 2005; Tang et al.
1999); however, also the process metrics have recently become popular1. Fenton was not
only among the first who have criticized the product metric-based approach (Fenton and
Ohlsson 2000), but also the one who suggested a model based only on the project and the
process metrics (Fenton et al. 2007). There are also other studies in which the process
metrics are investigated (Illes-Seifert and Paech 2010; Schroter et al. 2006), as well as used
in the model (Graves et al. 2000; Weyuker et al. 2008, 2010). Nevertheless, there are no
conclusive results. Usually, only the correlations between some process metrics and the
defect count are investigated, e.g. (Illes-Seifert and Paech 2010; Schroter et al. 2006).
When defect prediction models are built, they are either not compared with a product-
based approach (e.g., Bell et al. 2006; Hassan 2009; Ostrand et al. 2005; Weyuker et al.
2006, 2007), they are built on a small sample (e.g., Graves et al. 2000; Moser et al. 2008)
or do not perform statistical tests and effect size calculations to conclude whether the
improvements obtained through adding the process metrics were of both, statistical and
practical significance even when improvements were impressive (e.g., Nagappan et al.
2008). Effect size is an index that quantifies the degree of practical significance of study
results, i.e., the degree to which the study results should be considered important, or
negligible, regardless of the size of the study sample. Further discussion of related work is
given in detail in Sect. 3.
1 In discerning between the two metric types, we follow the Henderson-Sellers’ (1996) definitions ofproduct and process metrics (product metric refers to software ‘‘snapshot’’ at a particular point of time, whileprocess metrics reflects the changes over time, e.g., the number of code changes). Even though recently theterm ‘‘historical metrics’’ has been used with growing frequency to replace the ‘‘process metrics,’’ e.g. (Illes-Seifert and Paech 2010), we decided to use the traditional nomenclature.
394 Software Qual J (2015) 23:393–422
123
This paper presents the results of an empirical study exploring the relationship between
the process metrics and the number of defects. For that purpose, the correlations between
particular process metrics and the number of defects were calculated. Subsequently, the
simple defect prediction models were built on the basis of the product metrics. With those
simple models, we were able to build advanced defect prediction models by introducing,
additionally, one of the process metrics at a time. As a result, we were able to compare the
simple and the advanced models and answer the question whether or not the introduction of
the selected process metric improved the adequacy of the predictions. Statistical methods
were used to evaluate the significance of that improvement. The approach used in this
study can be easily put into practice, which is its distinct advantage. Moreover, no
sophisticated methods were used to build the prediction models, but the ordinary stepwise
linear regression. Even though they are probably neither best nor the most effective for this
purpose, stepwise linear regression methods are widely known and, therefore, reduce the
learning effort.
The derivation of the baseline model, as well as the experiments presented in this paper,
intend to reflect the industrial reality. Since the product metrics have a very long history
(e.g., McCabe 1976), they enjoy a good tool support (e.g., the Ckjm tool used in this study)
and are well understood by practitioners. We may assume that there are companies
interested in defect prediction which have already launched a metric program and collect
the product metrics. The assumption is plausible, as such companies are already known to
the authors of this paper. A hypothetical company as described above is using product
metrics for the aforementioned reasons (mainly tool support). Unfortunately, the prediction
results are often unsatisfactory; therefore, new metrics may be employed in order to
improve the prediction. The process metrics can be particularly useful, since they reflect
the attributes different from those associated with the product metrics, namely the product
history, which is (hopefully) an extra source of information. Nevertheless, it is still not
obvious what the company should do, as there are a number of process metrics which are
being investigated with regard to defect prediction. Furthermore, the results are sometimes
contradictory (see Sect. 3 for details). Moreover, the tool support for the process metrics is
far from being perfect, e.g., for the sake of this study, the authors had to develop their own
solution to calculate these metrics. Bearing in mind that hypothetical situation in an
industrial environment and relying on their direct and indirect experience, the authors of
this study chose as its main objective to provide assistance in making key decisions
regarding which metric (or metrics) should be chosen and added to the metric program in
order to improve the predictions and not to waste financial resources on checking all the
possibilities. Therefore, we have analyzed which of the frequently used process metrics can
significantly improve defect prediction—on the basis of a wide range of software projects
from different environments. The construction of the models made use solely of the data
which were historically older than the ones used in prediction (model evaluation). For
example, the model built on the data from the release i was used to make predictions in
release iþ 1. The data from ith release are usually (or at least can be) available during the
development of ðiþ 1Þth release. Hopefully, on the basis of the empirical evaluations
presented in this paper, development teams may take informed decisions (at least to some
extent, as the number of analyzed projects, although large, is not infinite) about the process
metrics which may be worth collecting in order to improve the defect prediction models
based on product metrics. Additionally, the framework of the empirical evaluation of the
models presented in this paper can be reused in different environments to evaluate new
kinds of metrics and to improve the defect prediction models even further.
Software Qual J (2015) 23:393–422 395
123

This paper is organized as follows: The descriptions of all the investigated product and
process metrics, as well as the tools employed for data collection and the investigated
software projects are described in Sect. 2. Related empirical studies concerning the process
metrics are presented in Sect. 3. Section 4 contains the detailed description of our
empirical investigation aimed at identifying the process metrics which may significantly
improve the defect prediction models based on the product metrics. The obtained results
are reported in Sect. 5, while threats to validity are discussed in Sect. 6. The discussion of
results in Sect. 7 is followed by the conclusions and contributions in Sect. 8.
2 Data collection
This section presents the descriptions of all the investigated product and process metrics in
Sect. 2.1, the tools used to compute the aforementioned metrics are described in Sect. 2.2,
while the investigated software projects are presented in Sect. 2.3.
2.1 Studied metrics
The investigation entailed two types of metrics: the product metrics, which describe the
size and design complexity of software, served as the basis and the point of departure,
whereas the process metrics were treated as the primary object of this study. The product
metrics were used to build simple defect prediction models, while the product metrics,
together with the selected process metrics (one at a time), were used to build the advanced
models. Subsequently, both models were compared in order to determine whether the
selected process metrics improve the prediction efficiency. The classification of the product
and the process metrics was thoroughly discussed in (Henderson-Sellers 1996).
2.1.1 Product metrics
The following metrics have been used in this study:
• The metrics suite suggested by Chidamber and Kemerer (1994).
• Lack of Cohesion in Methods (LCOM3) suggested by Henderson-Sellers (1996).
• The QMOOD metrics suite suggested by Bansiya and Davis (2002).
• The quality oriented extension to Chidamber and Kemerer metrics suite suggested by
Tang et al. (1999).
• Coupling metrics suggested by Martin (1994).
• Class level metrics built on the basis of McCabe’s (1976) complexity metric.
• Lines of Code (LOC).
A separate report by Jureczko and Madeyski (2011c), available online, presents definitions
of the aforementioned metrics.
2.1.2 Process metrics
A considerable research has been performed on identifying the process metrics which
influence the efficiency of defect prediction. Among them, the most widely used are the
metrics similar to NR, NDC, NML and NDPV (cf. Sect. 3):
396 Software Qual J (2015) 23:393–422
123

• Number of Revisions (NR). The NR metric constitutes the number of revisions
(retrieved from a main line of development in a version control system, e.g., trunk in
SVN) of a given Java class during development of the investigated release of a software
system. The metric (although using different names) has already been used by several
researchers (Graves et al. 2000; Illes-Seifert and Paech 2010; Moser et al. 2008;
Nagappan and Ball 2007; Nagappan et al. 2010; Ostrand and Weyuker 2002; Ostrand
et al. 2004; Ratzinger et al. 2007; Schroter et al. 2006; Shihab et al. 2010; Weyuker
et al. 2006, 2007, 2008).
• Number of Distinct Committers (NDC). The NDC metric returns the number of distinct
authors who committed their changes in a given Java class during the development of
the investigated release of a software system. The metric has already been used or
analyzed by researchers (Bell et al. 2006; Weyuker et al. 2007, 2008, 2010; Graves
et al. 2000; Illes-Seifert and Paech 2010; Matsumoto et al. 2010; Moser et al. 2008;
Nagappan et al. 2008, 2010; Ratzinger et al. 2007; Schroter et al. 2006; Zimmermann
et al. 2009).
• Number of Modified Lines (NML). The NML metric calculates the sum of all lines of
source code which were added or removed in a given Java class. Each of the committed
revisions during the development of the investigated release of a software system is
taken into account. According to the CVS version–control system, a modification in a
given line of source code is equivalent to removing the old version and subsequently
adding a new version of the line. Similar metrics have already been used or analyzed by
various researchers (Graves et al. 2000; Hassan 2009; Purushothaman and Perry 2005;
Layman et al. 2008; Moser et al. 2008; Nagappan and Ball 2005, 2007; Nagappan et al.
2008, 2010; Ratzinger et al. 2007; Sliwerski et al. 2005; Zimmermann et al. 2009).
• Number of Defects in Previous Version (NDPV). The NDPV metric returns the number
of defects repaired in a given class during the development of the previous release of a
software system. Similar metrics have already been investigated by a number of
researchers (Arisholm and Briand 2006; Hassan 2009; Ostrand et al. 2005; Weyuker
et al. 2006, 2008; Graves et al. 2000; Gyimothy et al. 2005; Illes-Seifert and Paech
2010; Kim et al. 2007; Khoshgoftaar et al. 1998; Moser et al. 2008; Nagappan et al.
2008, 2010; Ostrand and Weyuker 2002; Ratzinger et al. 2007; Schroter et al. 2006;
Shihab et al. 2010; Sliwerski et al. 2005; Wahyudin et al. 2008).
2.2 Tools
All product metrics were calculated with the Ckjm tool2. The tool calculates all the
aforementioned product metrics by processing the byte code of the compiled Java files.
The fact that the metrics are collected from byte code is not considered here as threat to
the experiment, since—as it was explained in the case of LOC by Fenton and Neil
(1999)—a metric calculated directly from the source code and the same metric calculated
from the byte code are the alternative measures of the same attribute. The Ckjm version
reported by Jureczko and Spinellis (2010) was used in this study.
The process metrics and the defect count were collected with a tool called BugInfo3.
The BugInfo analyzes the logs from the source code repository (SVN or CVS) and,
according to the log content, decides whether a commit is a bugfix. A commit is considered
2 http://gromit.iiar.pwr.wroc.pl/p_inf/ckjm/.3 http://kenai.com/projects/buginfo.
Software Qual J (2015) 23:393–422 397
123
to be a bugfix when it solves an issue reported in a bug tracking system. Each of the
projects was investigated in order to identify bugfixes commenting guidelines which had
been used in the source code repository. The guidelines were formalized into regular
expressions. Buginfo compares the regular expressions with the comments of the commits.
When a comment matches the regular expression, BugInfo increments the defect count for
all the classes which have been modified in the commit. The tool has been recently
incorporated into a more complex one, i.e., QualitySpy (Jureczko and Magott 2012), which
is under development. The QualitySpy tool was used to collect the NML metric from
projects that use SVN repositories as such feature is not supported by BugInfo. Unfortu-
nately, some time passed before the QualitySpy was ready to use, and hence, we faced
obstacles (mostly significant changes in project structure that make impossible to match the
newly collected data with the new ones) that prevented us from collecting the NML metric
in some of the investigated projects.
Even though there is no formal evaluation of BugInfo regarding the efficiency in
mapping defects yet, comprehensive tests have already been conducted. Most of them are
available online as JUnit’s tests in the BugInfo source code package.
2.3 Analyzed projects
Forty-three releases of 12 open source and 27 releases of 6 industrial software projects
were investigated in this study.
In order to ensure consistent measurement of product metrics, all of the analyzed
projects were written in Java. It is worth mentioning that we were not able to collect all of
the process metrics for all of the projects. Therefore, some of the analyses were conducted
on a subset of the projects mentioned below, hence each project has references to those
experiments in which it was used, e.g., NR denotes that the project was analyzed in the
experiment that investigated the NR metric. The experiment where all four metrics were
investigated was executed on those projects that have references to all four metrics. The
following projects were examined:
• POI version 1.5, 2.0, 2.5.1 and 3.0 (http://poi.apache.org, NR, NDC, NDPV).
• Synapse version 1.0, 1.1 and 1.2 (http://synapse.apache.org, NR, NDC, NML, NDPV).
• Xalan-Java version 2.4, 2.5, 2.6 and 2.7 (http://xml.apache.org/xalan-j, NR, NDC,
NML, NDPV).
• Xerces version 1.1, 1.2, 1.3 and 1.4.4 (http://xerces.apache.org/xerces-j, NR, NDC,
NML, NDPV).
• Ant version 1.3, 1.4, 1.5, 1.6 and 1.7 (http://ant.apache.org, NR, NDC, NML, NDPV).
• PBeans version 1.0 and 2.0 (http://pbeans.sourceforge.net, only descriptive statistics).
• Ivy version 1.1, 1.2 and 2.0 (http://ant.apache.org/ivy, NR, NDC).
• Camel version 1.0, 1.2, 1.4 and 1.6 (http://camel.apache.org, NR, NDC, NML, NDPV).
• Log4j version 1.0, 1.1 and 1.2 (http://logging.apache.org/log4j, NR, NDC, NDPV).
• Lucene version 2.0, 2.2 and 2.4 (http://lucene.apache.org, NR, NDC, NML, NDPV).
• Velocity version 1.4, 1.5 and 1.6.1 (http://velocity.apache.org, NR, NDC, NDPV).
• JEdit version 3.2.1, 4.0, 4.1, 4.2 and 4.3 (http://www.jedit.org, NR, NDC, NML,
NDPV).
• Five industrial projects belonging to the insurance domain (NR, NDC, NML, NDPV).
• One industrial project that is a tool that supports quality assurance in software
development (NR, NDC). All six projects are developed by the same software
development company, by international teams in a plan driven manner. However, only
398 Software Qual J (2015) 23:393–422
123
the insurance projects has fixed scope and deadline (for each release, respectively),
whereas the sixth one has much more flexible plans. The five projects from the
insurance domain are custom built solutions with more than five years of development
history. They implement different feature sets according to the individual customer
requirements. All of them are developed using Java enterprise technologies and
frameworks, as well as already installed in customer environments.
Aseparate reportby JureczkoandMadeyski (2011b), availableonline,presents thedescriptionsof the
open-source projects for which the authorshave built software defect prediction models. The collected
data are available online in our Metric Repository4. Moreover, the repository contains also some
metadata, e.g., the regular expressions used to identify defects. In order to obtain exactly the same data
asused in this study, the followingURL shouldbe used:http://purl.org/MarianJureczko/MetricsRepo/
WhichMetricsImprovePrediction.Furthermore, thearchivecontaining thesamecollectionofdata sets
(called MJ12A) is available online5. It is worth mentioning that a number of analyses had already been
conducted previously (Jureczko and Madeyski 2010; Jureczko and Spinellis 2010), but they were
neither focused on process metrics nor did they use all of the data which we were able to collect and
analyze in this paper (not to mention loosely related earlier study (Madeyski 2006) focused on
external code quality instead of defects).
3 Related work and background
Comprehensive surveys on defect prediction were presented by Purao and Vaishnavi
(2003), Catal and Diri (2009), Kitchenham (2010), and Hall et al. (2012). Hall et al. (2012)
investigated how the context of prediction models (the modeling techniques applied and
the independent variables used) affect the performance of fault prediction models. They
synthesised the results of 36 studies and concluded that the methodology used to build
models seems to be influential to predictive performance. For example, the models that
perform comparatively well tend to be based on relatively simple modeling techniques
(e.g., Naive Bayes, Logistic Regression), combinations of independent variables have been
used by prediction models that perform well, while feature selection has been applied to
these combinations when models are performing particularly well (Hall et al. 2012).
Moreover, considerable research has been performed on identifying the process metrics
(similar to NR, NDC, NML and NDPV) which influence the efficiency of defect predic-
tion. The research papers in which the aforementioned process metrics were employed or
analyzed have been already mentioned in Sect. 2.1.2. This section describes a subset of
these works which not only use but also are focused on analyses of the aforementioned
process metrics. More comprehensive description is available in (Jureczko and Madeyski
2011a).
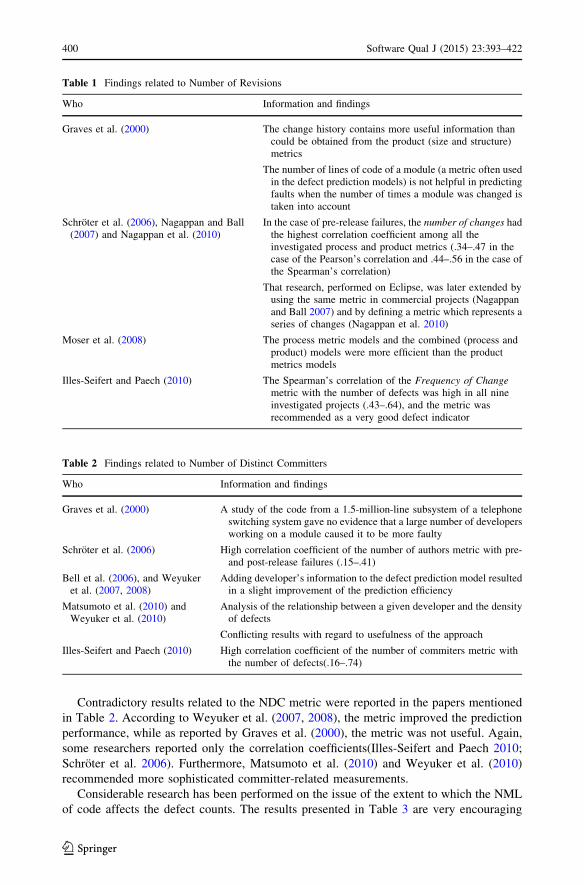
The NR metric (or a similar one) was recommended in all of the works presented in
Table 1. However, it is worth mentioning that some of them reported only correlation
coefficients with the number of defects (e.g., Illes-Seifert and Paech 2010; Schroter et al.
2006), while the other studies were carried out on limited data sets (i.e., single project):
(Graves et al. 2000)—a telephone switching system, (Moser et al. 2008)—Eclipse, (Na-
gappan and Ball 2007)—Windows 2003 and (Nagappan et al. 2010)—Windows Vista.
4 http://purl.org/MarianJureczko/MetricsRepo.5 http://madeyski.e-informatyka.pl/tools/software-defect-prediction/.
Software Qual J (2015) 23:393–422 399
123
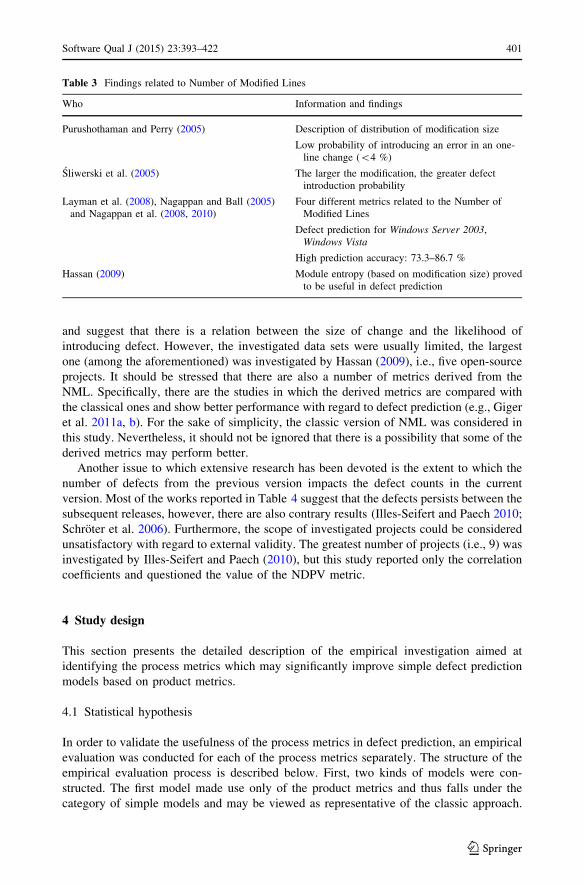
Contradictory results related to the NDC metric were reported in the papers mentioned
in Table 2. According to Weyuker et al. (2007, 2008), the metric improved the prediction
performance, while as reported by Graves et al. (2000), the metric was not useful. Again,
some researchers reported only the correlation coefficients(Illes-Seifert and Paech 2010;
Schroter et al. 2006). Furthermore, Matsumoto et al. (2010) and Weyuker et al. (2010)
recommended more sophisticated committer-related measurements.
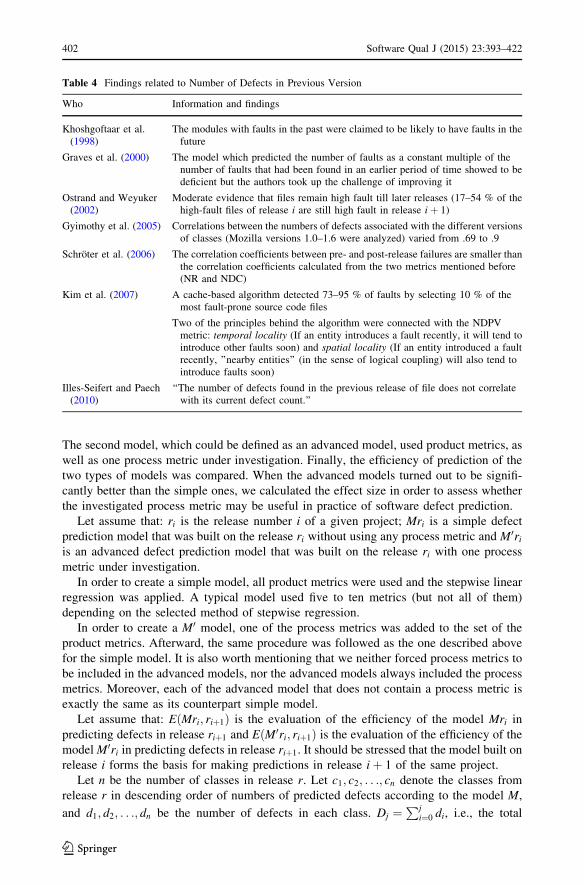
Considerable research has been performed on the issue of the extent to which the NML
of code affects the defect counts. The results presented in Table 3 are very encouraging
Table 1 Findings related to Number of Revisions
Who Information and findings
Graves et al. (2000) The change history contains more useful information thancould be obtained from the product (size and structure)metrics
The number of lines of code of a module (a metric often usedin the defect prediction models) is not helpful in predictingfaults when the number of times a module was changed istaken into account
Schroter et al. (2006), Nagappan and Ball(2007) and Nagappan et al. (2010)
In the case of pre-release failures, the number of changes hadthe highest correlation coefficient among all theinvestigated process and product metrics (.34–.47 in thecase of the Pearson’s correlation and .44–.56 in the case ofthe Spearman’s correlation)
That research, performed on Eclipse, was later extended byusing the same metric in commercial projects (Nagappanand Ball 2007) and by defining a metric which represents aseries of changes (Nagappan et al. 2010)
Moser et al. (2008) The process metric models and the combined (process andproduct) models were more efficient than the productmetrics models
Illes-Seifert and Paech (2010) The Spearman’s correlation of the Frequency of Changemetric with the number of defects was high in all nineinvestigated projects (.43–.64), and the metric wasrecommended as a very good defect indicator
Table 2 Findings related to Number of Distinct Committers
Who Information and findings
Graves et al. (2000) A study of the code from a 1.5-million-line subsystem of a telephoneswitching system gave no evidence that a large number of developersworking on a module caused it to be more faulty
Schroter et al. (2006) High correlation coefficient of the number of authors metric with pre-and post-release failures (.15–.41)
Bell et al. (2006), and Weyukeret al. (2007, 2008)
Adding developer’s information to the defect prediction model resultedin a slight improvement of the prediction efficiency
Matsumoto et al. (2010) andWeyuker et al. (2010)
Analysis of the relationship between a given developer and the densityof defects
Conflicting results with regard to usefulness of the approach
Illes-Seifert and Paech (2010) High correlation coefficient of the number of commiters metric withthe number of defects(.16–.74)
400 Software Qual J (2015) 23:393–422
123
and suggest that there is a relation between the size of change and the likelihood of
introducing defect. However, the investigated data sets were usually limited, the largest
one (among the aforementioned) was investigated by Hassan (2009), i.e., five open-source
projects. It should be stressed that there are also a number of metrics derived from the
NML. Specifically, there are the studies in which the derived metrics are compared with
the classical ones and show better performance with regard to defect prediction (e.g., Giger
et al. 2011a, b). For the sake of simplicity, the classic version of NML was considered in
this study. Nevertheless, it should not be ignored that there is a possibility that some of the
derived metrics may perform better.
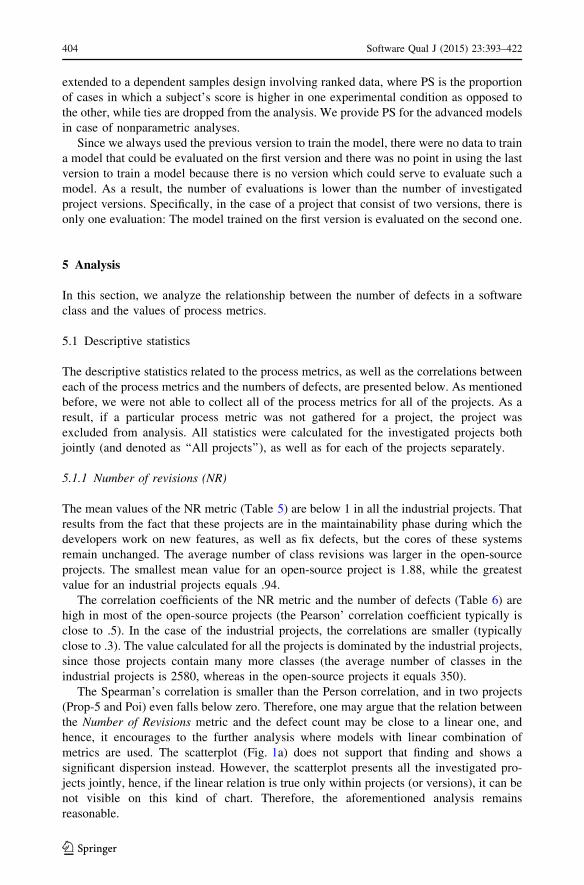
Another issue to which extensive research has been devoted is the extent to which the
number of defects from the previous version impacts the defect counts in the current
version. Most of the works reported in Table 4 suggest that the defects persists between the
subsequent releases, however, there are also contrary results (Illes-Seifert and Paech 2010;
Schroter et al. 2006). Furthermore, the scope of investigated projects could be considered
unsatisfactory with regard to external validity. The greatest number of projects (i.e., 9) was
investigated by Illes-Seifert and Paech (2010), but this study reported only the correlation
coefficients and questioned the value of the NDPV metric.
4 Study design
This section presents the detailed description of the empirical investigation aimed at
identifying the process metrics which may significantly improve simple defect prediction
models based on product metrics.
4.1 Statistical hypothesis
In order to validate the usefulness of the process metrics in defect prediction, an empirical
evaluation was conducted for each of the process metrics separately. The structure of the
empirical evaluation process is described below. First, two kinds of models were con-
structed. The first model made use only of the product metrics and thus falls under the
category of simple models and may be viewed as representative of the classic approach.
Table 3 Findings related to Number of Modified Lines
Who Information and findings
Purushothaman and Perry (2005) Description of distribution of modification size
Low probability of introducing an error in an one-line change (\4 %)
Sliwerski et al. (2005) The larger the modification, the greater defectintroduction probability
Layman et al. (2008), Nagappan and Ball (2005)and Nagappan et al. (2008, 2010)
Four different metrics related to the Number ofModified Lines
Defect prediction for Windows Server 2003,Windows Vista
High prediction accuracy: 73.3–86.7 %
Hassan (2009) Module entropy (based on modification size) provedto be useful in defect prediction
Software Qual J (2015) 23:393–422 401
123
The second model, which could be defined as an advanced model, used product metrics, as
well as one process metric under investigation. Finally, the efficiency of prediction of the
two types of models was compared. When the advanced models turned out to be signifi-
cantly better than the simple ones, we calculated the effect size in order to assess whether
the investigated process metric may be useful in practice of software defect prediction.
Let assume that: ri is the release number i of a given project; Mri is a simple defect
prediction model that was built on the release ri without using any process metric and M0riis an advanced defect prediction model that was built on the release ri with one process
metric under investigation.
In order to create a simple model, all product metrics were used and the stepwise linear
regression was applied. A typical model used five to ten metrics (but not all of them)
depending on the selected method of stepwise regression.
In order to create a M0 model, one of the process metrics was added to the set of the
product metrics. Afterward, the same procedure was followed as the one described above
for the simple model. It is also worth mentioning that we neither forced process metrics to
be included in the advanced models, nor the advanced models always included the process
metrics. Moreover, each of the advanced model that does not contain a process metric is
exactly the same as its counterpart simple model.
Let assume that: EðMri; riþ1Þ is the evaluation of the efficiency of the model Mri in
predicting defects in release riþ1 and EðM0ri; riþ1Þ is the evaluation of the efficiency of the
model M0ri in predicting defects in release riþ1. It should be stressed that the model built on
release i forms the basis for making predictions in release iþ 1 of the same project.
Let n be the number of classes in release r. Let c1; c2; . . .; cn denote the classes from
release r in descending order of numbers of predicted defects according to the model M,
and d1; d2; . . .; dn be the number of defects in each class. Dj ¼Pj
i¼0 di, i.e., the total
Table 4 Findings related to Number of Defects in Previous Version
Who Information and findings
Khoshgoftaar et al.(1998)
The modules with faults in the past were claimed to be likely to have faults in thefuture
Graves et al. (2000) The model which predicted the number of faults as a constant multiple of thenumber of faults that had been found in an earlier period of time showed to bedeficient but the authors took up the challenge of improving it
Ostrand and Weyuker(2002)
Moderate evidence that files remain high fault till later releases (17–54 % of thehigh-fault files of release i are still high fault in release iþ 1)
Gyimothy et al. (2005) Correlations between the numbers of defects associated with the different versionsof classes (Mozilla versions 1.0–1.6 were analyzed) varied from .69 to .9
Schroter et al. (2006) The correlation coefficients between pre- and post-release failures are smaller thanthe correlation coefficients calculated from the two metrics mentioned before(NR and NDC)
Kim et al. (2007) A cache-based algorithm detected 73–95 % of faults by selecting 10 % of themost fault-prone source code files
Two of the principles behind the algorithm were connected with the NDPVmetric: temporal locality (If an entity introduces a fault recently, it will tend tointroduce other faults soon) and spatial locality (If an entity introduced a faultrecently, ’’nearby entities’’ (in the sense of logical coupling) will also tend tointroduce faults soon)
Illes-Seifert and Paech(2010)
‘‘The number of defects found in the previous release of file does not correlatewith its current defect count.’’
402 Software Qual J (2015) 23:393–422
123

defects in the first j classes. Let k be the smallest index so that Dk [ :8 � Dn, then
EðM; rÞ ¼ k=n� 100%. The procedure has been expressed in a Visual Basic script which
is available online http://purl.org/MarianJureczko/ProcessMetricsExperiments.
In order to decide whether the process metrics are useful in defect prediction, a sta-
tistical hypothesis was tested for each of the process metric separately:
• H0;EðM0Þ—There is no difference in the efficiency of defect prediction between the
simple model (M) and the advanced model (M0).
Alternative hypothesis:
• H1;EðM0Þ—There is a difference in the efficiency of defect prediction between the simple
model (M) and the advanced model (M0).
The hypotheses were evaluated by the parametric t test for dependent samples. The
homogeneity of variance was checked using Levene’s test, while the assumption that the
sample came from a normally distributed population was tested by way of the Shapiro–Wilk
test (Madeyski 2010). If the aforementioned assumptions were violated, the nonparametric
Wilcoxon matched pair test was used instead of its parametric counterpart, i.e., the dependent
t test. The investigated hypotheses were tested at the a ¼ :05 significance level.
4.2 Effect size
When the advanced models gave much better predictions, the effect size was calculated.
Calculating the effect size estimations in the case of the dependent t test was thoroughly
discussed by Madeyski (2010). The crucial issue is that if an effect size is computed from
the test statistics without taking into account the correlation between the repeated mea-
sures, the effect size will be overestimated (Dunlap et al. 1996; Madeyski 2010). The effect
size calculation is based on the following procedure (Madeyski 2010):
d ¼ tr �ffiffiffiffiffiffiffiffiffiffiffiffiffiffiffiffiffiffiffiffiffiffiffiffi2 � ð1 � rrÞ
n
r
ð1Þ
where rr is the value of Pearson’s correlation coefficient between the experimental and the
control scores, tr is the repeated measures t statistic, while n is the sample size per group.
Furthermore, the effect size r can be calculated as follows (Madeyski 2010):
r ¼ dffiffiffiffiffiffiffiffiffiffiffiffiffiffiffiffiffiðd2 þ 4Þ
p ð2Þ
This effect size estimation indicates the difference between the models according to the
benchmark by Kampenes et al. (2007).
When nonparametric tests have been employed, an estimate of effect size r has been
obtained from the standard normal deviate Z as suggested by Rosenthal (1991).
r ¼ ZffiffiffiffiN
p ð3Þ
where N is the number of sampling units on which Z is based. However, in our opinion, the
Rosenthal’s approach could be called into question as it ignores the pairing effect. Hence,
we also provide a nonparametric effect size measure referred to as probability of superi-
ority (PS) recommended by Grissom and Kim (2012). They note that this measure can be
Software Qual J (2015) 23:393–422 403
123
extended to a dependent samples design involving ranked data, where PS is the proportion
of cases in which a subject’s score is higher in one experimental condition as opposed to
the other, while ties are dropped from the analysis. We provide PS for the advanced models
in case of nonparametric analyses.
Since we always used the previous version to train the model, there were no data to train
a model that could be evaluated on the first version and there was no point in using the last
version to train a model because there is no version which could serve to evaluate such a
model. As a result, the number of evaluations is lower than the number of investigated
project versions. Specifically, in the case of a project that consist of two versions, there is
only one evaluation: The model trained on the first version is evaluated on the second one.
5 Analysis
In this section, we analyze the relationship between the number of defects in a software
class and the values of process metrics.
5.1 Descriptive statistics
The descriptive statistics related to the process metrics, as well as the correlations between
each of the process metrics and the numbers of defects, are presented below. As mentioned
before, we were not able to collect all of the process metrics for all of the projects. As a
result, if a particular process metric was not gathered for a project, the project was
excluded from analysis. All statistics were calculated for the investigated projects both
jointly (and denoted as ‘‘All projects’’), as well as for each of the projects separately.
5.1.1 Number of revisions (NR)
The mean values of the NR metric (Table 5) are below 1 in all the industrial projects. That
results from the fact that these projects are in the maintainability phase during which the
developers work on new features, as well as fix defects, but the cores of these systems
remain unchanged. The average number of class revisions was larger in the open-source
projects. The smallest mean value for an open-source project is 1.88, while the greatest
value for an industrial projects equals .94.
The correlation coefficients of the NR metric and the number of defects (Table 6) are
high in most of the open-source projects (the Pearson’ correlation coefficient typically is
close to .5). In the case of the industrial projects, the correlations are smaller (typically
close to .3). The value calculated for all the projects is dominated by the industrial projects,
since those projects contain many more classes (the average number of classes in the
industrial projects is 2580, whereas in the open-source projects it equals 350).
The Spearman’s correlation is smaller than the Person correlation, and in two projects
(Prop-5 and Poi) even falls below zero. Therefore, one may argue that the relation between
the Number of Revisions metric and the defect count may be close to a linear one, and
hence, it encourages to the further analysis where models with linear combination of
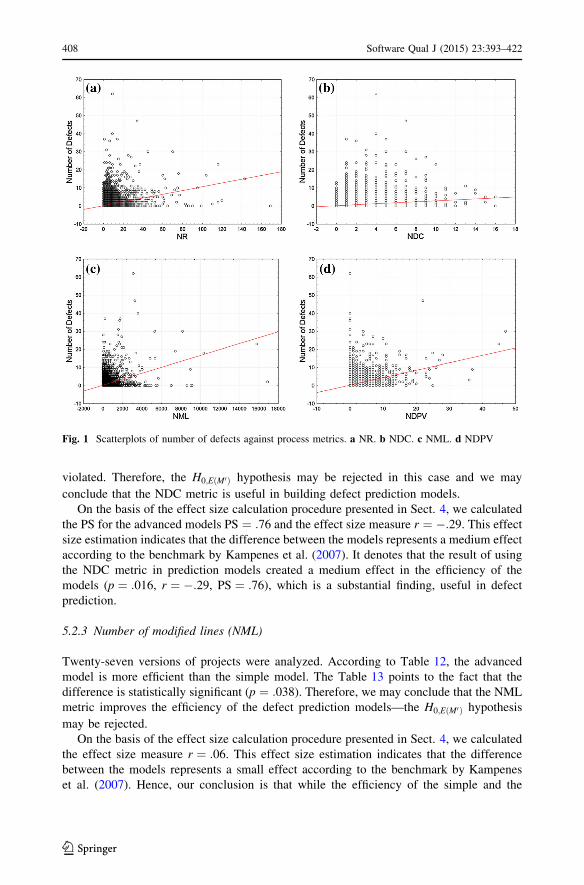
metrics are used. The scatterplot (Fig. 1a) does not support that finding and shows a
significant dispersion instead. However, the scatterplot presents all the investigated pro-
jects jointly, hence, if the linear relation is true only within projects (or versions), it can be
not visible on this kind of chart. Therefore, the aforementioned analysis remains
reasonable.
404 Software Qual J (2015) 23:393–422
123

5.1.2 Number of distinct committers (NDC)
The mean values of the NDC metric (Table 5) reflect the maintainability phase of the
industrial projects. The mean value of the NDC metric is smaller in the case of the
industrial projects. The Pearson’s and Spearman’s correlations between the number of
defects and the metrics (given in Table 6) show a noticeable difference between open-
source and industrial projects. The correlation coefficients are slightly smaller than in the
case of the NR metric. The relation between the number of defects and the NDC metric is
detailed in Fig. 1b. It supports the aforementioned conclusions about smaller correlation by
showing large dispersion.
5.1.3 Number of modified lines (NML)
Number of Modified Lines metric values were collected from the five industrial projects
using the BugInfo tool, as those projects used CVS as version control system. Later on the
QualitySpy tool was used to mine the metric from the SubVersion repositories of 7 open-
source projects.
Most of the Pearson’s and Spearman’s correlations between the process metrics and the
number of defects (Table 6) are close to .3. The correlation between NML and the number
of defects is similar as in the case of the NDC metrics. Nevertheless, the relation between
the number of defects and the NML metric presented in Fig. 1c does not indicate linear
relation.
Table 5 NR, NDC, NML and NDPV—descriptive statistics
Project Mean(NR)
SD(NR)
Mean(NDC)
SD(NDC)
Mean(NML)
SD(NML)
Mean(NDPV)
SD(NDPV)
All projects 1.27 3.54 .68 1.19 19.77 113.65 .26 1.02
Prop-1 .78 2.28 .52 1.19 26.01 151.46 .32 1.20
Prop-2 .94 2.22 .59 1.11 20.63 104.33 .19 .80
Prop-3 .51 1.40 .39 .82 14.73 90.53 .14 .47
Prop-4 .41 1.37 .31 .83 10.95 80.27 .11 .53
Prop-5 .47 1.17 .37 .75 18.07 83.75 .27 .76
Prop-6 .56 .99 .41 .61
Xalan 1.98 1.86 1.25 .87 104.03 337.58 .49 .88
Xerces 1.88 3.89 1.00 .98 179.56 640.59 .24 .81
Ant 7.82 7.14 3.40 1.72 141.98 265.82 .19 .67
Ivy 6.70 9.30 1.41 .72 .95 3.25
Camel 1.95 3.46 1.03 1.24 27.42 93.51 .35 1.25
Log4j 3.22 5.10 1.14 .87 .44 1.17
Lucene 2.73 4.72 1.52 1.18 85.73 443.79 1.16 2.92
Poi 2.90 2.98 1.90 1.10 .76 1.51
Synapse 3.17 3.15 1.57 1.05 95.16 155.96 .25 .73
Velocity 5.12 9.74 1.47 1.21 .97 1.90
JEdit 6.51 12.46 1.54 1.55 126.63 583.98 .63 2.34
Pbeans .57 1.06
Software Qual J (2015) 23:393–422 405
123

5.1.4 Number of defects in previous version (NDPV)
The great diversity in the correlations with the number of defects (Table 6) among projects
may be illustrated by the fact that there is a project with the correlation equal :74—but also
another one, with the correlation value close to zero.
That suggests that the Number of Defects in Previous Version may be very useful in
defect prediction in some projects, but not in all of them. Fortunately, Fig. 1d shows large
dispersion between the NDPV metric and the number of defects when all the projects are
analyzed jointly.
5.1.5 Relationships between metrics
The process metrics are expected to improve the prediction performance. The improvement
is possible when the metrics constitute an extra source of information, the information that
is not available in the product metrics. The aforementioned condition is not satisfied when
the process metrics are strongly correlated with the product metrics. Moreover, there are
several different process metrics taken into consideration. Correlations between these
metrics are relevant as well, since there is no point in adding two different metrics highly
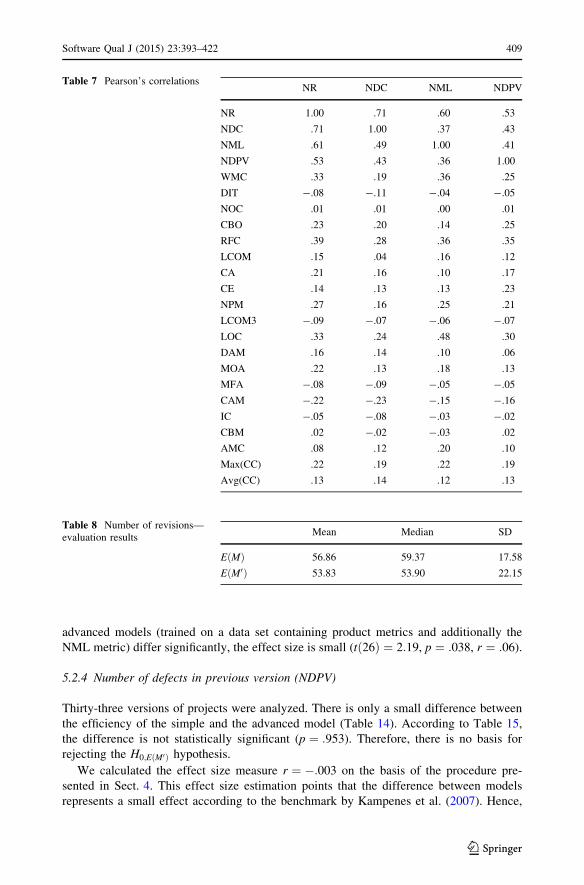
correlated with each other. The correlation analysis is presented in Table 7.
Table 6 NR, NDC, NML and NDPV—correlations with the number of defects
Project Pear.cor.(NR)
Spear.cor.(NR)
Pear.cor.(NDC)
Spear.cor.(NDC)
Pear. cor.(NML)
Spear.cor.(NML)
Pear.cor. (NDPV)
Spear. cor.(NDPV)
All projects .31* .28* .27* .27* .27* .20* .36* .24*
Prop-1 .32* .31* .33* .31* .25* .31* .35* .32*
Prop-2 .30* .16* .25* .16* .26* .17* .35* .22*
Prop-3 .38* .12* .28* .12* .32* .13* .11* .03*
Prop-4 .49* .40* .34* .40* .36* .38* .30* .15*
Prop-5 .27* -.02 .13* -.03 .24* -.01 .24* -.05*
Prop-6 .16* .14* .12* .13*
Xalan .35* .10* .20* .12* .14 .18 .40* .31*
Xerces .24* .09* .29* .11* .36 .29 .11* .10*
Ant .54* .37* .36* .30* .46 .42 .43* .29*
Ivy .50* .35* .32* .26* .55* .19*
Camel .54* .52* .41* .49* .52 .57 .41* .32*
Log4j .49* .51* .50* .50* .38* .23*
Lucene .67* .34* .45* .31* .53 .54 .67* .34*
Poi .19* -.03 .22* .02 .26* .09*
Synapse .40* .27* .26* .23* .26 .26 .37* .24*
Velocity .42* .27* .26* .15* .52* .46*
JEdit .56* .36* -.08* -.10* .57 .41 .74* .45*
Pbeans .63* .39*
* Correlations significant at .05 level
406 Software Qual J (2015) 23:393–422
123

The Pearson’s correlations suggest that the process metrics constitute a different source
of information. The greatest correlation coefficient between process and product metric
was obtained in the case of the NR and RFC metrics and was equal to .39. Nevertheless,
most of the coefficients are below .2 and hence can be considered as low. There is a
different situation in the case of the correlations between process metrics, since the
coefficients vary from .41 to .71. In consequence, it is questionable whether these metrics
describe different attributes and whether adding more than one of them will significantly
improve prediction performance.
5.2 Hypotheses testing
The analysis of each of the aforementioned process metrics is presented in the subsequent
subsections. However, it is worth mentioning that it was not possible to collect all of the
process metrics for all of the projects and versions. The simple models were always
constructed using only the versions of the projects for which the process metrics investi-
gated at that time were available. Therefore, different assessment results were obtained for
the simple models in different experiments. The advanced models were constructed sep-
arately for each version of each project and each process metric (see Sect. 4 for details).
Additional details about the experiments (in particular all the simple and advanced models)
are available online: http://purl.org/MarianJureczko/ProcessMetricsExperiments.
5.2.1 Number of revisions (NR)
Thirty-four versions of projects were analyzed. According to Table 8, on average 56.86 %
of classes must be tested in order to find 80 % of defects when the simple model is used,
and only 53.83 % of classes when the advanced model is used. However, according to
Table 9, the difference is not statistically significant at the a ¼ :05 significance level.
Therefore, the H0;EðM0Þ hypothesis may not be rejected in this case. Even though the NR
metric did not prove to be radically useful in building defect prediction models, the
advanced models gave slightly better predictions. That suggests that the metric perhaps
should not be entirely left out in the process of defect prediction model construction.
On the basis of the effect size calculation procedure presented in Sect. 4 and collected
data (rr ¼ :846 is the value of Pearson’s correlation coefficient between the experimental
and the control scores, tr ¼ 1:485 is the repeated measures t statistic, and n ¼ 34 is the
sample size per group), we calculated the effect size measure r ¼ :07. This effect size
estimation indicates that the difference between the models represents a small effect
according to the benchmark by Kampenes et al. (2007).
Our conclusion is that the H0;EðM0Þ hypothesis may not be rejected in this case, as the
efficiency of the simple and the advanced models (trained on a data set containing product
metrics and additionally the NR metric) did not significantly differ (tð33Þ ¼ 1:48,
p ¼ :147, r ¼ :07).
5.2.2 Number of distinct committers (NDC)
Thirty-four versions of projects were analyzed. According to Table 10, the advanced
models outperform the simple ones. Moreover, according to Table 11, the difference in
prediction efficiency is statistically significant (p ¼ :015). Wilcoxon Matched Pair Test
was employed since according to the Shapiro–Wilk test the normality assumption was
Software Qual J (2015) 23:393–422 407
123
violated. Therefore, the H0;EðM0Þ hypothesis may be rejected in this case and we may
conclude that the NDC metric is useful in building defect prediction models.
On the basis of the effect size calculation procedure presented in Sect. 4, we calculated
the PS for the advanced models PS ¼ :76 and the effect size measure r ¼ �:29. This effect
size estimation indicates that the difference between the models represents a medium effect
according to the benchmark by Kampenes et al. (2007). It denotes that the result of using
the NDC metric in prediction models created a medium effect in the efficiency of the
models (p ¼ :016, r ¼ �:29, PS ¼ :76), which is a substantial finding, useful in defect
prediction.
5.2.3 Number of modified lines (NML)
Twenty-seven versions of projects were analyzed. According to Table 12, the advanced
model is more efficient than the simple model. The Table 13 points to the fact that the
difference is statistically significant (p ¼ :038). Therefore, we may conclude that the NML
metric improves the efficiency of the defect prediction models—the H0;EðM0Þ hypothesis
may be rejected.
On the basis of the effect size calculation procedure presented in Sect. 4, we calculated
the effect size measure r ¼ :06. This effect size estimation indicates that the difference
between the models represents a small effect according to the benchmark by Kampenes
et al. (2007). Hence, our conclusion is that while the efficiency of the simple and the
Fig. 1 Scatterplots of number of defects against process metrics. a NR. b NDC. c NML. d NDPV
408 Software Qual J (2015) 23:393–422
123
advanced models (trained on a data set containing product metrics and additionally the
NML metric) differ significantly, the effect size is small (tð26Þ ¼ 2:19, p ¼ :038, r ¼ :06).
5.2.4 Number of defects in previous version (NDPV)
Thirty-three versions of projects were analyzed. There is only a small difference between
the efficiency of the simple and the advanced model (Table 14). According to Table 15,
the difference is not statistically significant (p ¼ :953). Therefore, there is no basis for
rejecting the H0;EðM0Þ hypothesis.
We calculated the effect size measure r ¼ �:003 on the basis of the procedure pre-
sented in Sect. 4. This effect size estimation points that the difference between models
represents a small effect according to the benchmark by Kampenes et al. (2007). Hence,
Table 7 Pearson’s correlationsNR NDC NML NDPV
NR 1.00 .71 .60 .53
NDC .71 1.00 .37 .43
NML .61 .49 1.00 .41
NDPV .53 .43 .36 1.00
WMC .33 .19 .36 .25
DIT -.08 -.11 -.04 -.05
NOC .01 .01 .00 .01
CBO .23 .20 .14 .25
RFC .39 .28 .36 .35
LCOM .15 .04 .16 .12
CA .21 .16 .10 .17
CE .14 .13 .13 .23
NPM .27 .16 .25 .21
LCOM3 -.09 -.07 -.06 -.07
LOC .33 .24 .48 .30
DAM .16 .14 .10 .06
MOA .22 .13 .18 .13
MFA -.08 -.09 -.05 -.05
CAM -.22 -.23 -.15 -.16
IC -.05 -.08 -.03 -.02
CBM .02 -.02 -.03 .02
AMC .08 .12 .20 .10
Max(CC) .22 .19 .22 .19
Avg(CC) .13 .14 .12 .13
Table 8 Number of revisions—evaluation results
Mean Median SD
EðMÞ 56.86 59.37 17.58
EðM0Þ 53.83 53.90 22.15
Software Qual J (2015) 23:393–422 409
123

the efficiency of the simple and the advanced models (trained on a data set containing
product metrics and additionally the NDPV metric) did not significantly differ and the
effect size is tiny (tð33Þ ¼ �:06, p ¼ :953, r ¼ �:003).
5.2.5 Combination of process metrics
Four different process metrics were introduced at the same time to the defect prediction
models in the last experiment. The models were built using all the product metrics and four
process metrics: NR, NDC, NML and NDPV.
Table 16 shows that the advanced models give slightly better predictions. The mean
values and medians of the efficiency of the simple and the advanced models do not lead to
clear conclusions. That is not surprising, as—according to Table 17—the difference was
not statistically significant.
On the basis of the effect size calculation procedure presented in Sect. 4, we derived the
PS for the advanced models PS ¼ :68 and the effect size measure r ¼ �:29. This effect
size estimation indicates that the difference between models represents a medium effect
according to the benchmark by Kampenes et al. (2007). In conclusion, the efficiency of the
simple model (including only the product metrics) and the models trained on a data set
containing both product and process metrics differ significantly (p ¼ :038, r ¼ �:29,
PS ¼ :68). It is worth mentioning that similar or even slightly better results (taking into
account the PS of the advanced models) were obtained in the case of advanced models that
employed only the NDC metric and it is not questionable that collecting one process metric
requires less effort than collecting four of them.
Table 9 Number of revisions—hypothesis test
EðMÞ EðM0Þ
Shapiro–Wilk test W .97 .94
p .39 .07
t test t 1.48
df 33
p .147
Table 10 Number of DistinctCommitters—evaluation results
Mean Median SD
EðMÞ 56.86 59.37 17.58
EðM0Þ 52.88 56.98 20.08
Table 11 Number of DistinctCommitters—hypothesis test
Bold value is statisticallysignificant
EðMÞ EðM0Þ
Shapiro–Wilk test W .97 .93
p .39 .04
Wilcoxon matched Z 2.44
Pair test (2-tailed) p .016
410 Software Qual J (2015) 23:393–422
123
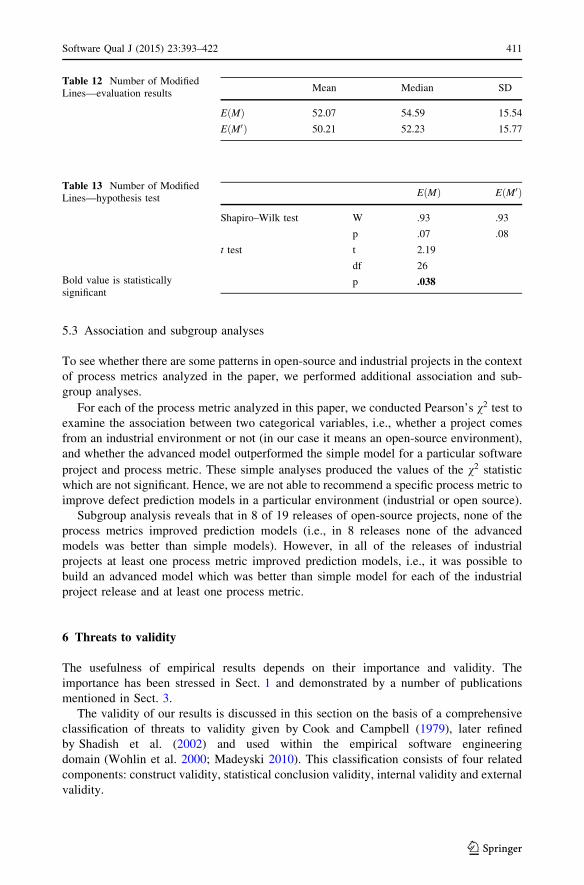
5.3 Association and subgroup analyses
To see whether there are some patterns in open-source and industrial projects in the context
of process metrics analyzed in the paper, we performed additional association and sub-
group analyses.
For each of the process metric analyzed in this paper, we conducted Pearson’s v2 test to
examine the association between two categorical variables, i.e., whether a project comes
from an industrial environment or not (in our case it means an open-source environment),
and whether the advanced model outperformed the simple model for a particular software
project and process metric. These simple analyses produced the values of the v2 statistic
which are not significant. Hence, we are not able to recommend a specific process metric to
improve defect prediction models in a particular environment (industrial or open source).
Subgroup analysis reveals that in 8 of 19 releases of open-source projects, none of the
process metrics improved prediction models (i.e., in 8 releases none of the advanced
models was better than simple models). However, in all of the releases of industrial
projects at least one process metric improved prediction models, i.e., it was possible to
build an advanced model which was better than simple model for each of the industrial
project release and at least one process metric.
6 Threats to validity
The usefulness of empirical results depends on their importance and validity. The
importance has been stressed in Sect. 1 and demonstrated by a number of publications
mentioned in Sect. 3.
The validity of our results is discussed in this section on the basis of a comprehensive
classification of threats to validity given by Cook and Campbell (1979), later refined
by Shadish et al. (2002) and used within the empirical software engineering
domain (Wohlin et al. 2000; Madeyski 2010). This classification consists of four related
components: construct validity, statistical conclusion validity, internal validity and external
validity.
Table 12 Number of ModifiedLines—evaluation results
Mean Median SD
EðMÞ 52.07 54.59 15.54
EðM0Þ 50.21 52.23 15.77
Table 13 Number of ModifiedLines—hypothesis test
Bold value is statisticallysignificant
EðMÞ EðM0Þ
Shapiro–Wilk test W .93 .93
p .07 .08
t test t 2.19
df 26
p .038
Software Qual J (2015) 23:393–422 411
123

6.1 Construct validity
Threats to construct validity concern the extent to which inferences can legitimately be
made from the operationalizations in our study to the theoretical constructs on which those
operationalizations were based. The mono-method bias regards a single means of recording
measures. When all operationalizations use the same method, the method becomes a part of
the construct. Hence, an important construct validity threat is that it was not possible to
assure that all the links between bugs and versioning system files (i.e., classes) are retrieved
(e.g., when the bug reference identifier is missing in the commit comment, as bugs are
identified according to the content of the comments). This problem is common and so far
unresolved in the area of linking bugs to versioning system files and classes, and the
method we implemented in this study is both widely used and state of the art in addressing
the issue (Bacchelli et al. 2010; D’Ambros et al. 2010a, b; Fischer et al. 2003; Zim-
mermann et al. 2007). However, if a more reliable linking method became available, it
would help to reduce that threat.
Inner classes are connected with another threat to the construct validity. It is not pos-
sible to decide whether a bug is related to inner classes or their containing class since the
source code version control systems have a file-based nature. Java inner classes are defined
Table 14 Number of Defects inPrevious Version—evaluationresults
Mean Median SD
EðMÞ 55.77 58.27 17.35
EðM0Þ 55.87 61.82 19.12
Table 15 Number of Defects inPrevious Version—hypothesistest
EðMÞ EðM0Þ
Shapiro–Wilk test W .97 .95
p .55 .14
t test t -.06
df 32
p .953
Table 16 Combination of pro-cess metrics—evaluation results
Mean Median SD
EðMÞ 52.69 56.44 15.52
EðM0Þ 49.06 52.54 20.26
Table 17 Combination of pro-cess metrics—hypothesis test
Bold value is statisticallysignificant
EðMÞ EðM0Þ
Shapiro–Wilk test W .92 .06
p .92 .04
Wilcoxon T 62
Matched Z -2.08
Pair test p .038
412 Software Qual J (2015) 23:393–422
123

in the same file as their containing class. Therefore, not taking inner classes into consid-
eration has become a common practice (Bacchelli et al. 2010; D’Ambros et al. 2010a, b).
What seems to be the advantage is that the proportion of inner classes in all classes is very
small (in our experiment it is 8.84 %).
Different bugfix commenting guidelines are used in different software projects. Fur-
thermore, the definition of a bug is not uniform among projects. According to Antoniol
et al. (2008), a fraction of issues marked as bugs are problems unrelated to corrective
maintenance. Such occurrences were removed manually.
We were not able to track the changes in a class name or moving a class between the
packages. Unfortunately, usually after such a change the class had to be interpreted as a
new one.
6.2 Statistical conclusion validity
Threats to statistical conclusion validity are related to the issues that affect the validity of
inferences. Our study adopted robust statistical tools SPSS and Statistica as a double check.
However, it is worth mentioning that calculation of effect size estimation for nonpara-
metric tests, although suggested by Rosenthal (1991), ignores the pairing effect which
could be called into question. Hence, nonparametric effect size estimations were calculated
as well.
The process metrics were evaluated in this study, using a particular method of building
the defect prediction model, namely stepwise linear regression. However, it would be
interesting to replicate the study using different methods, e.g., neural networks.
6.3 Internal validity
The threats to internal validity refer to the misinterpretation of the true causes which affect
the experiment result. According to D’Ambros et al. (2010a), human factor should be
considered as an external factor which may affect the internal validity. The relevant human
factor in defect prediction studies is bug severity. Since, according to Ostrand et al. (2004),
the severity ratings are highly subjective and inaccurate, we decided to exclude them from
the study.
It should be mentioned that the NR metric, if not precisely defined, can be misleading
based on the way of working or commit habits of developers in version control systems.
For instance, developers may not commit as frequent as they should due to concerns about
breaking builds or incomplete work. Developers may also work in branches which may not
be tracked by the measurement infrastructure. This might also explain the low numbers in
the NR metric. However, we decided to use the metric for several reasons. First, we have
emphasized that the NR metric we use should be understood as the number of revisions
(retrieved from a main line of development in a version control system, e.g., trunk in SVN)
of a given Java class during development of the investigated release of a software system.
Second, in case of industrial projects, we only had access to specific main lines of
development in a limited time frame. Third, this metric (although using different names)
has also been used by other researchers without mentioning issues related to commit habits
of developers, e.g. (Graves et al. 2000; Illes-Seifert and Paech 2010; Moser et al. 2008;
Nagappan and Ball 2007; Nagappan et al. 2010; Ostrand and Weyuker 2002; Ostrand et al.
2004; Ratzinger et al. 2007; Schroter et al. 2006; Shihab et al. 2010; Weyuker et al. 2006,
2007, 2008), so we decided not to exclude the metric up front. The more so that the metric
is relatively easy (cheap) to collect which is important in industrial environments.
Software Qual J (2015) 23:393–422 413
123
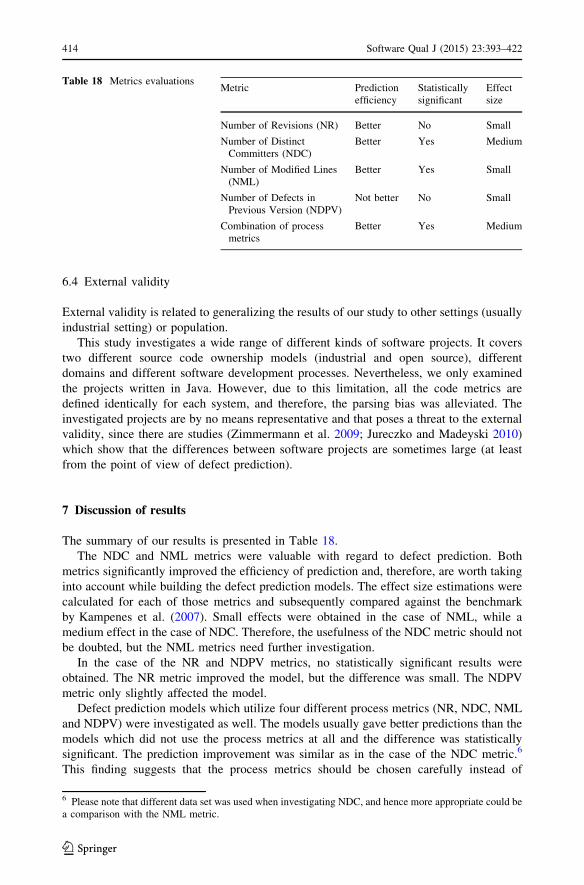
6.4 External validity
External validity is related to generalizing the results of our study to other settings (usually
industrial setting) or population.
This study investigates a wide range of different kinds of software projects. It covers
two different source code ownership models (industrial and open source), different
domains and different software development processes. Nevertheless, we only examined
the projects written in Java. However, due to this limitation, all the code metrics are
defined identically for each system, and therefore, the parsing bias was alleviated. The
investigated projects are by no means representative and that poses a threat to the external
validity, since there are studies (Zimmermann et al. 2009; Jureczko and Madeyski 2010)
which show that the differences between software projects are sometimes large (at least
from the point of view of defect prediction).
7 Discussion of results
The summary of our results is presented in Table 18.
The NDC and NML metrics were valuable with regard to defect prediction. Both
metrics significantly improved the efficiency of prediction and, therefore, are worth taking
into account while building the defect prediction models. The effect size estimations were
calculated for each of those metrics and subsequently compared against the benchmark
by Kampenes et al. (2007). Small effects were obtained in the case of NML, while a
medium effect in the case of NDC. Therefore, the usefulness of the NDC metric should not
be doubted, but the NML metrics need further investigation.
In the case of the NR and NDPV metrics, no statistically significant results were
obtained. The NR metric improved the model, but the difference was small. The NDPV
metric only slightly affected the model.
Defect prediction models which utilize four different process metrics (NR, NDC, NML
and NDPV) were investigated as well. The models usually gave better predictions than the
models which did not use the process metrics at all and the difference was statistically
significant. The prediction improvement was similar as in the case of the NDC metric.6
This finding suggests that the process metrics should be chosen carefully instead of
Table 18 Metrics evaluationsMetric Prediction
efficiencyStatisticallysignificant
Effectsize
Number of Revisions (NR) Better No Small
Number of DistinctCommitters (NDC)
Better Yes Medium
Number of Modified Lines(NML)
Better Yes Small
Number of Defects inPrevious Version (NDPV)
Not better No Small
Combination of processmetrics
Better Yes Medium
6 Please note that different data set was used when investigating NDC, and hence more appropriate could bea comparison with the NML metric.
414 Software Qual J (2015) 23:393–422
123
applying all the available ones. In the investigated cases, introducing only one process
metric (i.e., NDC) at a time resulted in similar or even slightly better models than the
introduction of four process metrics simultaneously. The result can be explained to some
extent by the correlation analysis, which showed that the process metrics are correlated
with each other.
Association analyses described in Sect. 5.3 do not allow us to recommend a specific
process metric to improve defect prediction models in a particular environment (industrial
or open source). However, simple subgroup analysis revealed that in the industrial envi-
ronment process metrics helped to improve simple prediction models for each of the
industrial project release and at least one process metric, while in some of releases of open-
source projects none of the process metrics improved prediction models. A possible
explanation would be inherent differences between industrial and open-source
environments.
8 Conclusions and contributions
Four different process metrics were analyzed in order to evaluate their usefulness in the
defect prediction models. Moreover, the number of the investigated projects was large
enough to obtain statistically significant results.
There is an interesting relation between the correlation of a metric with the number of
defects and the usefulness of a metric in defect prediction models. The highest correlations
were obtained in the case of the NR and NDPV metrics, while the most useful metrics with
regard to the defect prediction models were NDC and NML. It can be seen as an example
which confirms standard knowledge in Machine Learning that it is not enough to inves-
tigate a correlation exclusively. A high correlation coefficient with the number of defects
does not necessary indicate that the metric will be useful in a defect prediction model. For
the purpose of providing a better explanation of that relation, it would be necessary to
perform the multicollinearity analysis.
The obtained results lead to the conclusion that the process metrics constitute a different
source of information than the product metrics. Especially interesting are the NDC and
NML metrics. The NDC metric regards the number of different developers who have
changed a given class. When several people are involved in the process of development, it
is always probable that they will misunderstand one another’s intentions and overwrite the
modifications made by their colleagues, which may, in turn, result in defects. It does not
correspond with the shared code rule, popularized by the agile software development, by
showing that such code ownership model is not optimal with regard to defects. Never-
theless, the shared code rule has also other consequences, e.g., impact on the learning curve
or productivity. The NML metric reflects the size of change and according to the obtained
results, the more lines of code are affected, the greater number of defects to be expected.
The early approaches to defect prediction (from ’70) postulated a linear relation between
the lines of code (LOC) and the number of defects. The result obtained in the case of the
NML metric partly moves this rule to the world of process metrics. There is a relation
between the size of code and defectiveness, but it turns out that taking into account only the
recently changed code gives better results.
Owing to a large number of the investigated project versions, the results provide a solid
empirical evidence regarding the extent of usefulness of the process metrics and they
reveal a significant improvement in defect prediction due to some process metrics. In
particular, the effect size indicated that the effect of the NDC process metric is substantial
Software Qual J (2015) 23:393–422 415
123

to achieve better defect prediction which is, in turn, an important contribution of the
conducted research. It is worth mentioning that most, if not all, of the related research
works do not provide empirical evidence in terms of effect sizes. Effect size proved much
more robust empirical evidence than statistical significance alone. This is because sig-
nificance based on a statistical test does not imply that the result is of practical importance,
since even very small differences will be significant if sample sizes are large
enough Rosenthal and DiMatteo (2001). Therefore, studies that rely on significance levels
may be misleading and it is important to use effect sizes. As a result, our important
contribution is that the NDC process metric is of practical importance to achieve better
defect prediction.
Furthermore, the paper includes detailed guidelines how to estimate practical impor-
tance via effect size measures in case of both parametric and nonparametric analyses which
is unique in software defect prediction literature.
We may also conclude that process metrics constitute a different source of information
than the product metrics and that employing process metrics in the defect prediction can
lead to better results than working only with the product metrics which is another sub-
stantial contribution.
There were differences in the values of most of the process metrics between the open-
source and the industrial projects (see Sect. 5.1). That confirms to some extent the findings
of Jureczko and Madeyski (2010) who investigated the cross-project defect prediction and
found that there are some significant differences between the open-source and the indus-
trial projects. The aforementioned study (Jureczko and Madeyski 2010) examined only the
product (size and structure) metrics (i.e., the process metrics were not analyzed). That
shows an interesting path for the further research toward clustering software projects with
regard to defect prediction, where the process metrics will be used as clustering basis.
We argue that there are important differences between the open-source and the
industrial projects which can affect our results. But what are those differences? First
obvious difference is related to different development processes which are usually more
formal, centralized and defined in detail in industrial environments, while less formal and
more decentralized in open-source communities. Second difference comes from the ways
to organize development teams (e.g., co-located, outsourced, or global). Co-located teams
(a group of people working together in an office) are usually not possible in open-source
projects, while widely used in industrial projects. An outsourcing arrangement involves
two or more separate teams, with responsibilities divided explicitly between the teams. For
example, one team in a company headquarters might be focused on specification, while the
other team might be located in ‘‘low cost’’ location and do implementation and testing.
This kind of arrangement is also common for industrial projects but not open source ones.
Open-source projects are usually developed as global projects everybody with enough
skills can join. As a result, we may expect more diverse behavior of developers in the open-
source projects than in the industrial ones.
It is also interesting to see how the differences between the open-source and the
industrial projects affect our results or their interpretation. An interesting observation is
that in all of the releases of industrial projects at least one process metric improved
prediction models, which is not the case in almost half of the analyzed releases of open-
source projects. It seems to corroborate the aforementioned finding about differences
between the open-source and the industrial projects. It also suggests the extent of use-
fulness of process metrics in both industrial and open source environments which can be
seen as another contribution of the conducted research. Our interpretation of the results is
that the effectiveness of the process metrics in the industrial projects may be higher than in
416 Software Qual J (2015) 23:393–422
123
the open-source projects due to the aforementioned differences between the open-source
and the industrial projects, which influence the behavior of developers. However, further
empirical studies are needed to confirm it.
It would be a great finding to identify process improvement opportunities on a basis of
the studied relations of process metrics with defects. The more so that to fail and to learn
from failure are essential parts of the engineering discipline (Petroski 1985; Kalinowski
et al. 2012). However, causal investigations are not easy in practice because we have to
carefully recognize what truly constitutes a ‘‘cause.’’ Three conditions must be established
in order to demonstrate a causal relationship: (1) there must be a correlation or association
between the hypothesized cause and effect, (2) the cause must precede the effect in time,
(3) the mechanism linking the cause to the effect must be identified. The first condition
implies that when the cause occurs, the effect is also likely to be observed. In fact, we
demonstrated that condition through statistical correlation analyses in Sect. 5.1. Hence, it
can be seen as a partial contribution of the conducted research also to defect causal analysis
(defect prevention), since the studied relations of process metrics with defects may also
show process improvement opportunities to prevent defects from occurring in the future.
In order to establish evidence, further studies should be conducted, as the investigation
of a greater number of software projects would increase the diversity of investigated data
and thus improve the external validity of the research results. Although different tech-
niques (e.g., logistic regression, Naive Bayes, neural networks) are used in the field of
defect prediction, it is not obvious whether the factors that work well in one technique will
also be useful in other methods. Therefore, the experiments should be replicated using
other model creation techniques. The results obtained in this study may be applied in the
models which were created using linear regression. In order to decide whether they are
applicable in other conditions, further research is necessary.
A number of online resources has been published. Each of them is mentioned in the part
of paper to which it refers to. However, to provide the reader with a good overview about
them, we list them all here:
• Ckjm, a product metrics calculator developed by Spinellis and Jureczko—http://gromit.
iiar.pwr.wroc.pl/p_inf/ckjm/
• BugInfo, a process metrics calculator developed by Jureczko—http://kenai.com/
projects/buginfo
• QualitySpy, tool used to calculate the NML metric, developed by Jureczko, Magott and
others—http://java.net/QualitySpy
• Metric Repository—http://purl.org/MarianJureczko/MetricsRepo
• Data set used in this study—http://purl.org/MarianJureczko/MetricsRepo/
WhichMetricsImprovePrediction, http://madeyski.e-informatyka.pl/tools/software-
defect-prediction/
• Additional details about the experiments—http://purl.org/MarianJureczko/
ProcessMetricsExperiments
• Metrics definitions—http://madeyski.e-informatyka.pl/download/
JureczkoMadeyskiSoftwareProductMetrics
• Projects descriptions—http://madeyski.e-informatyka.pl/download/
JureczkoMadeyskiOpenSourceProjects
Acknowledgments The authors are very grateful to the open-source communities and to the CapgeminiPolska, which allowed the analysis of their industrial software projects. As a result, we were able tominimize threats to external validity of our research results.
Software Qual J (2015) 23:393–422 417
123
Open Access This article is distributed under the terms of the Creative Commons Attribution Licensewhich permits any use, distribution, and reproduction in any medium, provided the original author(s) and thesource are credited.
References
Antoniol, G., Ayari, K., Di Penta, M., Khomh, F., & Gueheneuc, Y. G. (2008). Is it a bug or anenhancement? A text-based approach to classify change requests. In CASCON’08: Proceedings of the2008 conference of the center for advanced studies on collaborative research (pp. 304–318) NewYork, NY: ACM. doi10.1145/1463788.1463819.
Arisholm, E., & Briand, L. C. (2006). Predicting fault-prone components in a java legacy system. InISESE’06: Proceedings of the 2006 ACM/IEEE international symposium on empirical softwareengineering (pp. 8–17). New York, NY: ACM. doi10.1145/1159733.1159738.
Bacchelli, A., D’Ambros, M., & Lanza, M. (2010). Are popular classes more defect prone? In Rosenblum D,Taentzer G (eds) Fundamental approaches to software engineering, Lecture Notes in Computer Sci-ence, (Vol. 6013, pp. 59–73). Berlin/Heidelberg: Springer. doi:10.1007/978-3-642-12029-9_5.
Bansiya, J., & Davis, C. G. (2002). A hierarchical model for object-oriented design quality assessment.IEEE Transactions on Software Engineering, 28(1), 4–17. doi:10.1109/32.979986.
Basili, V. R., Briand, L. C., & Melo, W. L. (1996). A validation of object-oriented design metrics as qualityindicators. IEEE Transactions on Software Engineering, 22(10), 751–761. doi:10.1109/32.544352.
Bell, R. M., Ostrand, T. J., & Weyuker, E. J. (2006). Looking for bugs in all the right places. In ISSTA’06:Proceedings of the 2006 international symposium on Software testing and analysis (pp. 61–72). NewYork, NY: ACM. doi:10.1145/1146238.1146246.
Boehm, B. W., & Papaccio, P. N. (1988). Understanding and controlling software costs. IEEE Transactionson Software Engineering, 14, 1462–1477. doi:10.1109/32.6191.
Catal, C., & Diri, B. (2009). A systematic review of software fault prediction studies. Expert Systems withApplications, 36(4), 7346–7354. doi:10.1016/j.eswa.2008.10.027.
Chidamber, S. R., & Kemerer, C. F. (1994). A metrics suite for object oriented design. IEEE Transactionson Software Engineering, 20(6), 476–493. doi:10.1109/32.295895.
Cook, T. D., & Campbell, D. T. (1979). Quasi-experimentation: Design and analysis issues. Boston, MA:Houghton Mifflin Company.
D’Ambros, M., Bacchelli, A., & Lanza, M. (2010a). On the Impact of Design Flaws on Software Defects. InQSIC’10: Proceedings of the 2010 10th international conference on quality software, IEEE computersociety (pp. 23–31). Washington, DC. doi:10.1109/QSIC.2010.58.
D’Ambros, M., Lanza, M., & Robbes, R. (2010b). An extensive comparison of bug prediction approaches.In MSR’10: Proceedings of the 2010 7th IEEE working conference on mining software repositories(pp. 31–41). doi:10.1109/MSR.2010.5463279.
Denaro, G., & Pezze, M. (2002). An empirical evaluation of fault-proneness models. In Proceedings of the24th international conference on software engineering, ICSE’02 (pp. 241–251). New York, NY: ACM.doi:10.1145/581339.581371.
Dunlap, W. P., Cortina, J. M., Vaslow, J. B., & Burke, M. J. (1996). Meta-analysis of experiments withmatched groups or repeated measures designs. Psychological Methods, 1(2), 170–177.
Endres, A., & Rombach, D. (2003). A handbook of software and systems engineering. Reading: Addison-Wesley.
Fenton, N., Neil, M., Marsh, W., Hearty, P., Radlinski, L., & Krause, P. (2007). Project data incorporatingqualitative factors for improved software defect prediction. In ICSEW’07: Proceedings of the 29thinternational conference on software engineering workshops, IEEE Computer Society, Washington,DC. doi:10.1109/ICSEW.2007.171.
Fenton, N. E., & Neil, M. (1999). A critique of software defect prediction models. IEEE Transactions onSoftware Engineering, 25, 675–689, doi10.1109/32.815326, http://dl.acm.org/citation.cfm?id=325392.325401.
Fenton, N. E., & Ohlsson, N. (2000). Quantitative analysis of faults and failures in a complex softwaresystem. IEEE Transactions on Software Engineering, 26(8), 797–814. doi:10.1109/32.879815.
Fischer, M., Pinzger, M., & Gall, H. (2003). Populating a release history database from version control andbug tracking systems. In ICSM’03: Proceedings of the international conference on software mainte-nance (p. 23). Washington, DC: IEEE Computer Society. doi:10.1109/ICSM.2003.1235403.
Giger, E., Pinzger, M., & Gall, H. (2011a). Using the gini coefficient for bug prediction in eclipse. InProceedings of the 12th international workshop on principles of software evolution and the 7th annual
418 Software Qual J (2015) 23:393–422
123

ERCIM workshop on software evolution, IWPSE-EVOL’11 (pp. 51–55). New York, NY: ACM. doi:10.1145/2024445.2024455.
Giger, E., Pinzger, M., & Gall, H. C. (2011b). Comparing fine-grained source code changes and code churnfor bug prediction. In Proceedings of the 8th working conference on mining software repositories,MSR’11 (pp. 83–92). New York, NY: ACM. doi:10.1145/1985441.1985456.
Graves, T. L., Karr, A. F., Marron, J. S., & Siy, H. (2000). Predicting fault incidence using software changehistory. IEEE Transactions on Software Engineering, 26(7), 653–661. doi:10.1109/32.859533.
Grissom, R. J., & Kim, J. J. (2012). Effect sizes for research: Univariate and multivariate applications.Taylor and Francis: Routledge.
Gyimothy, T., Ferenc, R., & Siket, I. (2005). Empirical validation of object-oriented metrics on open sourcesoftware for fault prediction. IEEE Transactions on Software Engineering, 31(10), 897–910. doi:10.1109/TSE.2005.112.
Hall, T., Beecham, S., Bowes, D., Gray, D., & Counsell, S. (2012). A systematic literature review on faultprediction performance in software engineering. IEEE Transactions on Software Engineering, 38(6),1276–1304. doi:10.1109/TSE.2011.103.
Hassan, A. E. (2009). Predicting faults using the complexity of code changes. In ICSE’09: Proceedings ofthe 31st international conference on software engineering (pp. 78–88). Washington, DC: IEEEComputer Society. doi:10.1109/ICSE.2009.5070510.
Henderson-Sellers, B. (1996). Object-oriented metrics: Measures of complexity. Upper Saddle River, NJ:Prentice-Hall.
Illes-Seifert, T., & Paech, B. (2010). Exploring the relationship of a file’s history and its fault-proneness: Anempirical method and its application to open source programs. Information and Software Technology,52(5), 539–558. doi:10.1016/j.infsof.2009.11.010.
Jureczko, M., & Madeyski, L. (2010). Towards identifying software project clusters with regard to defectprediction. In PROMISE’2010: Proceedings of the 6th international conference on predictor models insoftware engineering (pp. 9:1–9:10). ACM doi:10.1145/1868328.1868342, http://madeyski.e-informatyka.pl/download/JureczkoMadeyski10f.pdf.
Jureczko, M., & Madeyski, L. (2011a). A review of process metrics in defect prediction studies. MetodyInformatyki Stosowanej 30(5), 133–145, http://madeyski.e-informatyka.pl/download/Madeyski11.pdf.
Jureczko, M., & Madeyski, L. (2011b). Open source project descriptions. Report SPR 1/2014, Faculty ofComputer Science and Management, Wroclaw University of Technology, http://madeyski.e-informatyka.pl/download/JureczkoMadeyskiOpenSourceProjects.pdf.
Jureczko, M., & Madeyski, L. (2011c). Software product metrics used to build defect prediction models.Report SPR 2/2014, Faculty of Computer Science and Management, Wroclaw University of Tech-nology, http://madeyski.e-informatyka.pl/download/JureczkoMadeyskiSoftwareProductMetrics.pdf.
Jureczko, M., & Magott, J. (2012), QualitySpy: A framework for monitoring software development pro-cesses. Journal of Theoretical and Applied Computer, Science, 6(1), 35–45. www.jtacs.org/archive/2012/1/4/JTACS_2012_01_04.
Jureczko, M., & Spinellis, D. (2010). Using object-oriented design metrics to predict software defects,monographs of system dependability, models and methodology of system dependability (pp. 69–81).Wroclaw, Poland: Wroclaw University of Technology Press. http://www.dmst.aueb.gr/dds/pubs/conf/2010-DepCoS-RELCOMEX-ckjm-defects/html/JS10.
Kalinowski, M., Card, D. N., & Travassos, G. H. (2012). Evidence-based guidelines to defect causalanalysis. IEEE Software, 29(4), 16–18, doi:10.1109/MS.2012.72.
Kampenes, V. B., Dyba, T., Hannay, J. E., & Sjøberg D. I. K. (2007). Systematic review: A systematicreview of effect size in software engineering experiments. Information and Software Technology,49(11–12), 1073–1086. doi:10.1016/j.infsof.2007.02.015.
Khoshgoftaar, T. M., Allen, E. B., Halstead, R., Trio, G. P., & Flass, R. M. (1998). Using process history topredict software quality. Computer, 31(4), 66–72. doi:10.1109/2.666844.
Kim, S., Zimmermann, T., Whitehead, Jr. E. J., & Zeller, A. (2007). Predicting Faults from Cached History.In ICSE’07: Proceedings of the 29th international conference on software engineering (pp. 489–498).Washington, DC: IEEE Computer Society. doi:10.1109/ICSE.2007.66.
Kitchenham, B. (2010). What’s up with software metrics? A preliminary mapping study. Journal of Systemsand Software, 83(1), 37–51. doi:10.1016/j.jss.2009.06.041.
Layman, L., Kudrjavets, G., & Nagappan, N. (2008). Iterative identification of fault-prone binaries using in-process metrics. In ESEM’08: Proceedings of the second ACM-IEEE international symposium onempirical software engineering and Measurement (pp. 206–212), New York, NY: ACM. doi:10.1145/1414004.1414038.
Software Qual J (2015) 23:393–422 419
123

Madeyski, L. (2006). Is external code quality correlated with programming experience or feelgood factor?Lecture Notes in Computer Science (Vol. 4044, pp. 65–74). doi:10.1007/11774129_7 Draft: http://madeyski.e-informatyka.pl/download/Madeyski06b.pdf.
Madeyski, L. (2010). Test-driven development: An empirical evaluation of agile practice. Heidelberg,Dordrecht, London, New York: Springer, doi:10.1007/978-3-642-04288-1, http://www.springer.com/978-3-642-04287-4.
Martin, R. (1994). OO design quality metrics—an analysis of dependencies. In OOPSLA’94: Proceedings ofworkshop pragmatic and theoretical directions in object-oriented software metrics (pp. 1–8), http://www.objectmentor.com/resources/articles/oodmetrc.
Matsumoto, S., Kamei, Y., Monden, A., ichi Matsumoto, K., & Nakamura, M. (2010). An analysis ofdeveloper metrics for fault prediction. In PROMISE’10: Proceedings of the sixth international con-ference on predictor models in software engineering (pp. 18:1–18:9). ACM. doi:10.1145/1868328.1868356.
McCabe, T. (1976). A complexity measure. IEEE Transactions on Software Engineering, 2, 308–320.doi:10.1109/TSE.1976.233837.
Moser, R., Pedrycz, W., & Succi, G. (2008). A comparative analysis of the efficiency of change metrics andstatic code attributes for defect prediction. In ICSE’08: Proceedings of the 30th international con-ference on software engineering (pp. 181–190). New York, NY: ACM. doi:10.1145/1368088.1368114.
Nagappan, N., & Ball, T. (2005). Use of relative code churn measures to predict system defect density. InICSE’05: Proceedings of the 27th international conference on software engineering (pp. 284–292).New York, NY: ACM. doi:10.1145/1062455.1062514
Nagappan, N., & Ball, T. (2007). Using software dependencies and churn metrics to predict field failures:An empirical case study. In ESEM’07: Proceedings of the first international symposium on empiricalsoftware engineering and measurement (pp. 364–373). Washington, DC: IEEE Computer Society.doi:10.1109/ESEM.2007.13.
Nagappan, N., Murphy, B., & Basili, V. (2008). The influence of organizational structure on softwarequality: an empirical case study. In ICSE’08: Proceedings of the 30th international conference onsoftware engineering (pp. 521–530). New York, NY: ACM. doi10.1145/1368088.1368160.
Nagappan, N., Zeller, A., Zimmermann, T., Herzig, K., & Murphy, B. (2010). Change bursts as defectpredictors. Technical report, Microsoft Research, http://research.microsoft.com/pubs/137315/bursts.
Ostrand, T. J., & Weyuker, E. J. (2002). The distribution of faults in a large industrial software system. InISSTA’02: Proceedings of the 2002 ACM SIGSOFT international symposium on software testing andanalysis (pp. 55–64). New York, NY: ACM. doi:10.1145/566172.566181.
Ostrand, T. J., Weyuker, E. J., & Bell, R. M. (2004). Where the bugs are. In ISSTA’04: Proceedings of the2004 ACM SIGSOFT international symposium on software testing and analysis (pp. 86–96). NewYork, NY: ACM. doi:10.1145/1007512.1007524.
Ostrand, T. J., Weyuker, E. J., & Bell, R. M. (2005). Predicting the location and number of faults in largesoftware systems. IEEE Transactions on Software Engineering, 31(4), 340–355. doi:10.1109/TSE.2005.49.
Petroski, H. (1985). To engineer is human: The role of failure in successful design. New York: St. Martin’sPress.
Purao, S., & Vaishnavi, V. (2003). Product metrics for object-oriented systems. ACM Computing Surveys,35(2), 191–221. doi:10.1145/857076.857090.
Purushothaman, R., & Perry, D. E. (2005). Toward understanding the rhetoric of small source code changes.IEEE Transactions on Software Engineering, 31, 511–526. doi:10.1109/TSE.2005.74.
Ratzinger, J., Pinzger, M., & Gall, H. (2007). EQ-Mine: Predicting short-term defects for software evolu-tion. In M. Dwyer & A. Lopes (Eds.), Fundamental approaches to software engineering, Lecture Notesin Computer Science, (Vol. 4422, pp. 12–26) Berlin/Heidelberg: Springer. doi:10.1007/978-3-540-71289-3_3.
Rosenthal, R. (1991). Meta-analytic procedures for social research (2nd ed.). Newbury Park, CA: SAGE.Rosenthal, R., & DiMatteo, M. R. (2001). Meta-analysis: Recent developments in quantitative methods for
literature reviews. Annual Review of Psychology, 52, 59–82. doi:10.1146/annurev.psych.52.1.59.Schroter, A., Zimmermann, T., Premraj, R., & Zeller, A. (2006). If your bug database could talk. In
Proceedings of the 5th international symposium on empirical software engineering, volume II: Shortpapers and posters (pp. 18–20).
Shadish, W. R., Cook, T. D., & Campbell, D. T. (2002). Experimental and quasi-experimental designs forgeneralized causal inference. Boston, MA: Houghton Mifflin.
Shihab, E., Jiang, Z. M., Ibrahim, W. M., Adams, B., & Hassan, A. E. (2010). Understanding the impact ofcode and process metrics on post-release defects: A case study on the Eclipse project. In ESEM’10:
420 Software Qual J (2015) 23:393–422
123
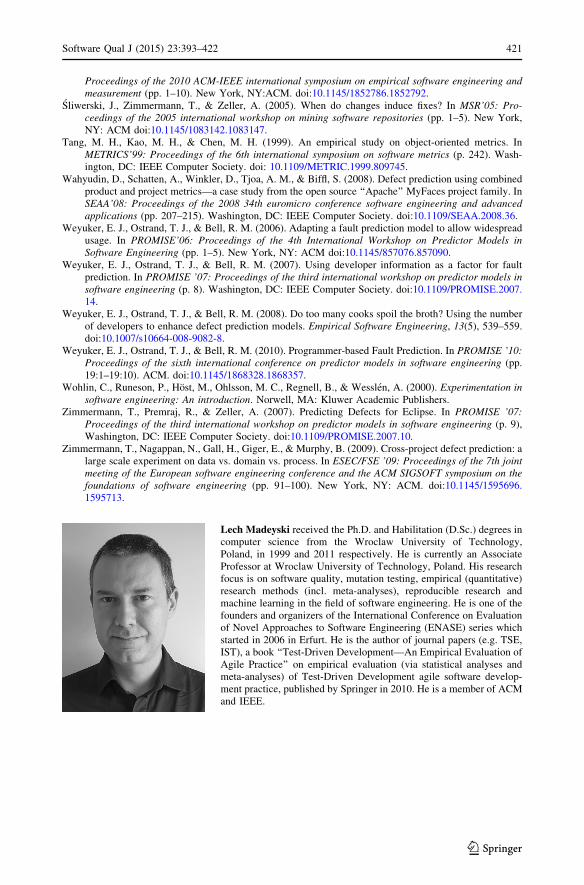
Proceedings of the 2010 ACM-IEEE international symposium on empirical software engineering andmeasurement (pp. 1–10). New York, NY:ACM. doi:10.1145/1852786.1852792.
Sliwerski, J., Zimmermann, T., & Zeller, A. (2005). When do changes induce fixes? In MSR’05: Pro-ceedings of the 2005 international workshop on mining software repositories (pp. 1–5). New York,NY: ACM doi:10.1145/1083142.1083147.
Tang, M. H., Kao, M. H., & Chen, M. H. (1999). An empirical study on object-oriented metrics. InMETRICS’99: Proceedings of the 6th international symposium on software metrics (p. 242). Wash-ington, DC: IEEE Computer Society. doi: 10.1109/METRIC.1999.809745.
Wahyudin, D., Schatten, A., Winkler, D., Tjoa, A. M., & Biffl, S. (2008). Defect prediction using combinedproduct and project metrics—a case study from the open source ‘‘Apache’’ MyFaces project family. InSEAA’08: Proceedings of the 2008 34th euromicro conference software engineering and advancedapplications (pp. 207–215). Washington, DC: IEEE Computer Society. doi:10.1109/SEAA.2008.36.
Weyuker, E. J., Ostrand, T. J., & Bell, R. M. (2006). Adapting a fault prediction model to allow widespreadusage. In PROMISE’06: Proceedings of the 4th International Workshop on Predictor Models inSoftware Engineering (pp. 1–5). New York, NY: ACM doi:10.1145/857076.857090.
Weyuker, E. J., Ostrand, T. J., & Bell, R. M. (2007). Using developer information as a factor for faultprediction. In PROMISE ’07: Proceedings of the third international workshop on predictor models insoftware engineering (p. 8). Washington, DC: IEEE Computer Society. doi:10.1109/PROMISE.2007.14.
Weyuker, E. J., Ostrand, T. J., & Bell, R. M. (2008). Do too many cooks spoil the broth? Using the numberof developers to enhance defect prediction models. Empirical Software Engineering, 13(5), 539–559.doi:10.1007/s10664-008-9082-8.
Weyuker, E. J., Ostrand, T. J., & Bell, R. M. (2010). Programmer-based Fault Prediction. In PROMISE ’10:Proceedings of the sixth international conference on predictor models in software engineering (pp.19:1–19:10). ACM. doi:10.1145/1868328.1868357.
Wohlin, C., Runeson, P., Host, M., Ohlsson, M. C., Regnell, B., & Wesslen, A. (2000). Experimentation insoftware engineering: An introduction. Norwell, MA: Kluwer Academic Publishers.
Zimmermann, T., Premraj, R., & Zeller, A. (2007). Predicting Defects for Eclipse. In PROMISE ’07:Proceedings of the third international workshop on predictor models in software engineering (p. 9),Washington, DC: IEEE Computer Society. doi:10.1109/PROMISE.2007.10.
Zimmermann, T., Nagappan, N., Gall, H., Giger, E., & Murphy, B. (2009). Cross-project defect prediction: alarge scale experiment on data vs. domain vs. process. In ESEC/FSE ’09: Proceedings of the 7th jointmeeting of the European software engineering conference and the ACM SIGSOFT symposium on thefoundations of software engineering (pp. 91–100). New York, NY: ACM. doi:10.1145/1595696.1595713.
Lech Madeyski received the Ph.D. and Habilitation (D.Sc.) degrees incomputer science from the Wroclaw University of Technology,Poland, in 1999 and 2011 respectively. He is currently an AssociateProfessor at Wroclaw University of Technology, Poland. His researchfocus is on software quality, mutation testing, empirical (quantitative)research methods (incl. meta-analyses), reproducible research andmachine learning in the field of software engineering. He is one of thefounders and organizers of the International Conference on Evaluationof Novel Approaches to Software Engineering (ENASE) series whichstarted in 2006 in Erfurt. He is the author of journal papers (e.g. TSE,IST), a book ‘‘Test-Driven Development—An Empirical Evaluation ofAgile Practice’’ on empirical evaluation (via statistical analyses andmeta-analyses) of Test-Driven Development agile software develop-ment practice, published by Springer in 2010. He is a member of ACMand IEEE.
Software Qual J (2015) 23:393–422 421
123

Marian Jureczko received his M.Sc. and Ph.D. degrees in computerscience from Wroclaw University of Technology. His main researchinterests include software quality, software metrics, defect predictionand software testing. He is currently collaborating closely withindustry, he is working as a software engineering for Sii Poland.
422 Software Qual J (2015) 23:393–422
123
Related Documents